
Detection, diagnosis, and prognosis
380
-
Upload
khangminh22 -
Category
Documents
-
view
2 -
download
0
Transcript of Detection, diagnosis, and prognosis


A11103 Dfi77bfi
NATL INST OF STANDARDS & |ECH R.I.C
A1 11 03087768Mechanical FaHures/Detection. dlaan^^^^^
QC100 .U57 N0.436, 1975 C.I NBS-PUb o is
NBS SPECIAL PUBLICATION 436
U.S. DEPARTMENT OF COMMERCE/ National Bureau of Standards
National Bureau of Standards
Library, E-01 Admia. Bldg,
OCT 1 I98I
19103^^^

NATIONA!^ BURPAU OF STANDARDS
The National Bureau of Standards' was established by an act of Congress March 3, 1901.
The Bureau's overall goal is to strengthen and advance the Nation's science and technology
and facilitate their effective application for public benefit. To this end, the Bureau conducts
research and provides: (1) a basis for the Nation's physical measurement system, (2) scientific
and technological services for industry and government, (3) a technical basis for equity in trade,
and (4) technical services to promote public safety. The Bureau consists of the Institute for
Basic Standards, the Institute for Materials Research, the Institute for Applied Technology,
the Institute for Computer Sciences and Technology, and the Office for Information Programs.
THE INSTITUTE FOR BASIC STANDARDS provides the central basis within the United
States of a complete and consistent system of physical measurement; coordinates that system
with measurement systems of other nations; and furnishes essential services leading to accurate
and uniform physical measurements throughout the Nation's scientific community, industry,
and commerce. The Institute consists of the Office of Measurement Services, the Office of
Radiation Measurement and the following Center and divisions:
Applied Mathematics — Electricity — Mechanics — Heat — Optical Physics — Center
for Radiation Research: Nuclear Sciences; Applied Radiation — Laboratory Astrophysics
— Cryogenics " — Electromagnetics ° — Time and Frequency
THE INSTITUTE FOR MATERIALS RESEARCH conducts materials research leading to
improved methods of measurement, standards, and data on the properties of well-characterized
materials needed by industry, commerce, educational institutions, and Government; provides
advisory and research services to other Government agencies; and develops, produces, and
distributes standard reference materials. The Institute consists of the Office of Standard
Reference Materials, the Office of Air and Water Measurement, and the following divisions:
Analytical Chemistry — Polymers — Metallurgy — Inorganic Materials — Reactor
Radiation — Physical Chemistry.
THE INSTITUTE FOR APPLIED TECHNOLOGY provides technical services to promote
the use of available technology and to facilitate technological innovation in industry and
Government; cooperates with public and private organizations leading to the development of
technological standards (including mandatory safety standards), codes and methods of test;
and provides technical advice and services to Government agencies upon request. The Insti-
tute consists of the following divisions and Centers:
Standards Application and Analysis — Electronic Technology — Center for Consumer
Product Technology: Product Systems Analysis; Product Engineering — Center for Building
Technology: Structures, Materials, and Life Safety; Building Environment; Technical Evalua-
tion and Application — Center for Fire Research: Fire Science; Fire Safety Engineering.
THE INSTITUTE FOR COMPUTER SCIENCES AND TECHNOLOGY conducts research
and provides technical services designed to aid Government agencies in improving cost effec-
tiveness in the conduct of their programs through the selection, acquisition, and effective
utilization of automatic data processing equipment; and serves as the principal focus within
the executive branch for the development of Federal standards for automatic data processing
equipment, techniques, and computer languages. The Institute consists of the following
divisions:
Computer Services — Systems and Software — Computer Systems Engineering — Informa-
tion Technology.
THE OFFICE FOR INFORMATION PROGRAMS promotes optimum dissemination and
accessibility of scientific information generated within NBS and other agencies of the Federal
Government; promotes the development of the National Standard Reference Data System and
a system of information analysis centers dealing with the broader aspects of - the National
Measurement System; provides appropriate services to ensure that the NBS staff has optimum
accessibility to the scientific information of the world. The Office consists of the following
organizational units:
Office of Standard Reference Data — Office of Information Activities — Office of Technical
Publications — Library — Office of International Relations — Office of International
Standards.
1 Headquarters and Laboratories at Gaithersburg, Maryland, unless otherwise noted; mailing address
Washington, D.C. 20234.
= Located at Boulder, Colorado 80302.
MFPG
Detection, Diagnosis, and Prognosis
JAN 1 4 1976
Proceedings of the 22nd Meeting of the ^ '^
Mechanical Failures Prevention Group,
held at Anaheim, California 92802
April 23-25, 1975
Edited by
T. R. Shives and W. A. Willard
Metallurgy Division
Institute for Materials Research
National Bureau of Standards
Washington, D.C. 20234
The 22nd meeting of MFPG and these proceedings were sponsored by theOffice of Naval Research, Department of the Navy, Arlington, Va. 22217;the National Aeronautics & Space Administration, Goddard Space FlightCenter, Greenbelt, Md. 20771 ; the Frankford Arsenal, U.S. Army,Philadelphia, Pa. 19137; the Federal Aviation Administration, Departmentof Transportation, Washington, D.C. 20591 ; and the Institute for MaterialsResearch of the National Bureau of Standards, Washington, D.C. 20234
U.S. DEPARTMENT OF COMMERCE, Rogers C. B. Morton, Secretary
James A. Baker, III, Under Secretary
Dr. Betsy Ancker-Johnson, Assisianf Secretary for Science and Technology
M,6NATIONAL BUREAU OF STANDARDS, Ernest Ambler, Acting Director
y\\
Issued December 1975

Library of Congress Cataloging in Publication Data
Mechanical Failures Prevention Group.
MFPG—Detection, Diagnosis, and Prognosis.
(NBS Special Publ; 436)
"Organized by the Detection, Diagnosis, and Prognosis Committeeof MFPG."
Supt. of Docs No.: C 13.10:346.
1. Metals—Fracture—Congresses. 2. Metals—Testing—Congresses.
I. Shives, T. R. II. Willard, William A. III. United States. Office of
Naval Research. IV. Title. V. Series: United States. National Bureau of
Standards. Special Publication ; 436. QC100.U57 No. 436 [TA460]
602'. Is 620.r6'3 75-619365
National Bureau of Standards Special Publication 436
Nat. Bur. Stand. (U.S.), Spec. Publ. 436, 366 pages (Dec. 1975)
CODEN: XNBSAV
U.S. GOVERNMENT PRINTING OFFICEWASHINGTON: 1975
For sale by the Superintendent of Documents, U.S. Government Printing Office, Washington, D.C. 20402
(Order by SD Catalog No. CI 3.10:436). Price $4.25 (Add 25 percent additional for other than U.S. mailing).

FOREWORD
The 22nd meeting of the Mechanical Failures Prevention Group was heldi\pril 23-25, 1975, at the Grand Hotel in Anaheim, California. Theprogram was organized by the Detection, Diagnosis, and Prognosiscommittee of MFPG under the chairmanship of Mr. Raymond Misialek. TheDD^P committee, the session chairmen, and especially the speaJcers are
to be commended for the fine program.
The papers are presented in these Proceedings as submitted by the authoron camera ready copy, except for some minor editorial changes. In
addition to the papers, the Proceedings include the discussions of thetalks. The discussions were recorded at the meeting and have beenedited to improve readability.
Special appreciation is accorded the Endevco Corporation, and in parti-cular to Robert M. IVhittier of Endevco, for hosting the meeting.They were responsible for the excellent meeting arrangements.
Appreciation should be extended to Mr. T. R. Shives and Mr. W. A. Willardof the NBS Metallurgy Division for their editing, organization, andpreparation of the Proceedings, to Mr. H. C. Burnett of the MetallurgyDivision for general coordination and registration, to Mr. P. Flemingof the Metallurgy Division for handling financial matters, and to theentire staffs of the Metallurgy Division and the Institute for MaterialsResearch for their assistance in many ways. Special thanks are accordedMrs. Marian L. Slusser of the Metallurgy Division for her diligentefforts in transcribing the recorded discussions.
ELIO PASSAGLIAExecutive Secretary, MFPG
Chief, Metallurgy DivisionNational Bureau of Standards
III

TABLE OF CONTENTS
FOREWORD . -..
SESSION I: IECHNOLOGY/IECHNIQUES
1. Signal Analysis Techniques for Vibration Diagnostics.
Donald R . Houser "
2. A New Technology for Bearing Performance Monitoring.
Gerald J. Philips
5. Bearing Contact Resistance as a Diagnostic Aid.
Richard L. Smith
k. Nondestructive Tire Inspection. Manuel J. Lourenco
and Lloyd H. Emfery*
5. Measurement of Spectra in Internal Combustion Engine
Cylinders. Jere M. Marrs
Panel Discussion: Planning and Executing Experi-
mental Verification
SESSION II: CASE HISTORIES
1. Sonic Analyzer - Case History. John L. Frarey
2. Oil Analysis in Perspective. Richard S. Miller
(Presented by Mike Hoobchaak)
5. Instrumentation for Predictive Maintenance Monitoring.
Ralph James*; Bill Reber, Bruce Baird^ and Wayne
Neal
Panel Discussion: Case Histories Applications
SESSION III: ON GOING PROGRAMS
1. Gas Turbine Engine Diagnostic Test Results Utilizing
a Thermodynamic Analysis Technique.
Robert L. Stenberg
2. Problem Areas Encountered in Establishing a Data Base-
line and Evaluating the A-7E Inflight Engine Con-
dition Monitoring System. Andrew J. Hess
3. Tri Service Oil Analysis Research and Development
Program. Peter B. Senholzl
IV

• k. Development of Inspection and Diagnostic Equipment
for Motor Vehicle Equipment for Motor Vehicle
Inspection. George L. Parker (presented by
Lloyd H. Emery)
5. On Vehicle Mobility Measurement and Recording
System. F. K. Chin* and R. Watts
6. VIDEC Ship Propulsion System Performance Monitor.
Richard P. Wallace and William L. McCarthy^
SESSION IV: COMING REQUIREMENTS
1. An Overview of Current Efforts to Detect and Prevent
Steel Wheel Failures. Gary L. Leadley
2. Diagnostics for Refrigerator Car Diesel Generating
Sets. Robert F. McKee
3. Using Acoustic Emission Technology to Predict
Structural Failure. Harold L. Dunegan
h. Applications of the Shock Pulse Technique to
Helicopter Diagnostics. John A. George*
^
Timothy C. Mayer, and Edward F. Covill
5. LST 1179 Diesel Diagnostic System Feasibility
Study. M. B. Peterson*, J. Frarey, D. Dominy,
H. Hegner, and H. C. Burnett
* Indicates speaker when a paper had more than one author.
LIST OF REGISTRANTS FOR THE 22nd MFPG MEETING
V

ABSTRACT
These Proceedings consist of a group of nineteen submitted papersand discussions from the 22nd meeting of the Mechanical FailuresPrevention Group which was held at the Grand Hotel in Anaheim,California on April 23-25, 1975. Failure detection, diagnosis andprognosis represent the central theme of the Proceedings. Technologyand techniques, ongoing diagnostic programs, and coming requirements inthe field of DD&P are discussed. In addition, several case historiesare presented.
Key Words : Diagnostic case histories; diagnostic systems; failuredetection; failure diagnosis; failure prevention; failure prognosis
UNITS AND SYMBOLS
Customary United States units and symbols appear in many of thepapers in these Proceedings. The participants in the 22nd Meeting ofthe Mechanical Failures Prevention Group have used the established unitsand symbols commonly employed in their professional fields. However,as an aid to the reader in increasing familiarity with and usage of themetric system of units (SI), the following references are given:
NBS Special Publication, SP330, 1974 Edition, "The International Systemof Units."
ISO International Standard 1000 (1973 Edition), "SI Units and Recommen-dations for Use of Their Multiples."
E380-72 ASTM Metric Practice Guide (American National Standard Z210.1).
Disclaimer:
Certain trade names and company products are identified in order to
adequately specify the experimental procedure. In no case does such
identification imply recommendation or endorsement by the National
Bureau of Standards, nor does it imply that the products are necessar-
ily the best availalDle for the purpose.
VI

SESSION I
TECHNOLOGY
AND
TECHNIQUES
Chairman: R. Hohenberg
Mechanical Technology Inc


SIGNAL ANALYSIS TECHNIQUES FOR VIBRATION DIAGNOSTICS
Dr. Donald R. Houser, Associate Professor
Ohio State University, Columbus, Ohio 43 210
Vibration and sound measurements have been used for the detection of
faults in rotating machinery for many years. The classic picture of a
mechanic listening to an engine bearing via a stethoscope or screwdriveris a prime example of the basic technique. Because of the apparentlylarge amount of information contained in the vibration signal, investi-gators hav.e strived to use this signal to automatically determine thecondition of mechanical devices. Further still, the ability to isolatespecific faults on components in a mechanical system has also beendeemed highly desirable.
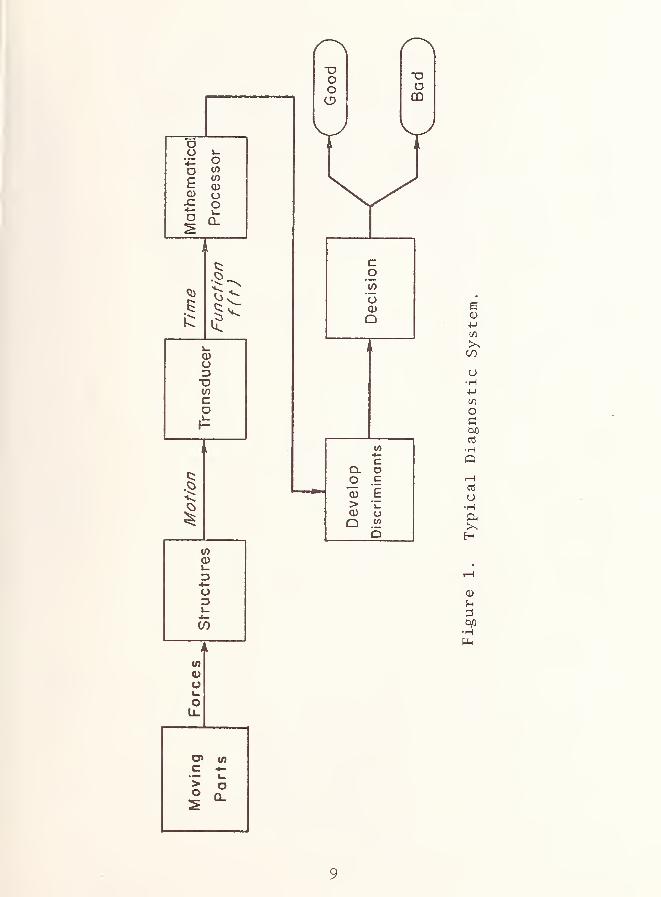
A schematic of a typical vibration diagnostic system is shown in
Figure 1. Here, forces from moving parts such as gears, bearings, or
shafts excite their surrounding structures and cause structural vibration.This vibration is then converted to a voltage via a vibration transducer,most often an accelerometer in present day applications. The location of
the transducer may be very important since the structural dynamicsbetween the input forces and the transducer may greatly modify the signal.I^Hien a single transducer is used to monitor several machine components,the problem of the proper transducer location may become very complex.The transducer signal is then conditioned and further analyzed via a
mathematical processor. This processor, which may analyze the dataeither statistically or deterministically in the time domain or transformthe data into the frequency domain, is used to generate discriminants (a
statistic or set of statistics) upon which a decision regarding the con-dition of a system or component within the system is based.
Figure 2 gives a much broader picture of many of the combinations of
transducers, signal conditioning, signal processing, and discriminantsavailable for vibration diagnostics. Many of the processing and con-ditioning techniques such as time summation, Fourier analysis, cepstrum,cross correlation, cross spectral density, and coherence function requirerelatively complex data processors; whereas special purpose hardware is
much more feasible where simple discriminants are ascertained using bandpass filtering, peak detection, and rms meters.
By far the most common signal processing technique has been Fourieranalysis via either analog hardware or via the fast Fourier transformalgorithm on digital processors. The frequency domain presentation ofFourier frequency spectra allows one to relate specific periodic occur-rences in a machine member to specific frequencies in the data. Of the
time domain processing techniques, time summation and various relativelysimple time signal analyses such as crest factors and impact index havebeen used. Time summation enhances data of a periodic nature and
5

eliminates the effects of random noise and periodic components which areriot common to the summation period. However, a very accurate triggerpulse is necessary to perform time summation successfully. Discriminantsare commonly selected through one of the following methods:
1. Pattern recognition2. Mechanical model analysis3. A combination of modeling and pattern recognition.
The pattern recognition methods of selecting discriminants andtheir utilization in the detection of faulty components are usuallyheavily statistics oriented. Often, very little physical insight is
used in the selection of discriminants by this method. Because of thepurely statistical means of data analysis, these techniques requiremany samples of data for each failure mode which might be encountered.Also, discriminants selected for one system component may not neces-sarily be the correct discriminant for a similar component located in
another device due to the different dynamic environment. Patternrecognition techniques based on frequency spectra data have been usedfor the detection of faulty gears and bearings by Butcher et al. [1]*and Kukel et al. [2]
.
The second approach for the development of vibration diagnosticdiscriminants is through the use of mechanical modeling to predictchanges which will occur in the vibration signal due to typical faults.This approach is quite versatile and allows results for one specificcomponent, a gear for instance, to be applied to many different gearsituations. Most of the successful modeling techniques have beenapplied to rolling element bearing faults, where the ball, cage, and racefrequencies may be easily predicted [3]. Methods for predicting highfrequency resonances of bearing races have also been developed [4]
.
In Figure 3 the frequency spectrum from an analog simulation of a
discrete bearing fault is shown. Each of the frequency peaks corre-sponds to a resonance in the system. The smaller peaks are spaced in
increments equal to the shaft rotational speed. The vibration frequencyspectrum of Figure 4 for an operating bearing having an outer race pitshows the similarity between the model and the actual data. Figure 5
compares time traces for the model and the actual bearing.
Figures 5 and 6 show both model and running data for a gear havinga single pitch line pit. The model, which is discussed in reference [5],
provides both time domain and frequency domain responses for gearsrunning both with and without faults. Interesting results from the
figures are that the gear mesh frequency sidebands were found to be the
result of a torque oscillation in the system which was due to couplingmisalignment. The fault appears to give a very predominate periodicity
at multiples of the shaft frequency. A second less noticeable period-icity occurs at the first torsional natural frequency of the system.
"Numbers in brackets indicate references cited at the end of this
paper.
k

One possible means of developing a single discriminant for this type of
failure mode would be to obtain the cepstrum [6] of the spectra, sincethe cepstrum Is very sensitive to periodicities In the frequency spectrum.
The third and perhaps most logical means of determining discrimi-nants Is to combine modeling and pattern recognition, since statisticalconfidence Is still required, even for discriminants determined fromphysical models. However, this approach Is likely to reduce the totalamount of data necessary In developing the diagnostic technique.
Through the use of the above-mentioned approaches, many techniqueshave been developed to detect failures In rotating components, with mostof the emphasis being placed on gears and bearings. Listed In Table 1
are techniques which have been attempted or utilized by other Investi-gators. Detailed discussions of these techniques may be found In
references [7] and [8]. Many of the techniques listed In Table 1
utilize discriminants and processing methods appearing In Figure 2.
Techniques of several different Investigators may often be includedunder one technique class in the table. An example of this Is thebearing high frequency "ring" technique which has been employed in
various forms by several investigators. The general narrowband techniqueencompasses a large number of schemes V7hich utilize simple observationsof the frequency spectrum. Of the bearing techniques, the high fre-quency vibration techniques including the shock pulse method have beeninvestigated by many individuals and are presently being employed in
operating systems. At this time gear fault detection systems have notshown as much promise as the bearing diagnostic schemes, primarilybecause transducers can be located closer to the bearings, and bearingmechanics are better defined.
In summary, this paper has presented an overview of the primarymethods of utilizing vibration data for diagnostic purposes includingsignal processing and discriminant determination. A listing of manyof the diagnostic schemes which have been investigated or proposed hasalso been presented.
References
1. Butcher, Robert R. , Russel Klrby, Jr., John Nakahihara, and T. C.
Watkins, UH-1 Test Bed Program Final Report,Northrop Corporation,
Electronics Division, USAAVSCOM Technical Report 72-19, U. S. ArmyAviation Systems Command, St. Louis, Missouri, September 1972.
2. Kukel, J., H. K. Zlebarth, J. D. Chang, J. E. Minnear , and J. L. Lau,
Turbine Engine Diagnostic Checkout System , Alresearch ManufacturingCompany, The Garrett Corporation, Technical Report AFAPL-TR-33,Air Force Aero Propulsion Lab, Wright Patterson Air Force Base, Ohio,
June 1971.
5

3. Babkin, A. S., and J. J. Anderson, "Mechanical Signature Analysis ofBall Bearings by Real Time Spectrum Analysis," J . Env . Scl
.
, Vol. 16,No. 1, p. 9 (1973).
.
4. Darlow, M. S., R. H. Badgley, and G. W. Hogg, Application of High-Frequency Resonance Techniques for Bearing Diagnostics in HelicopterGearboxes , USAAMRDL Technical Report 74-77, October 1974"^
5. Drosjack, M. J., D. R. Houser, and A. C. Tinney, Investigation of
Gear Dynamic Signal Analysis , USAAMRDL Technical Report, 1975.
6. Kemerait and Childers, "Signal Detection and Extraction by CepstrumTechniques," IEEE Transactions on Information Theory , Vol. IT-18W06, pp. 745-759 (November 1972).
7. Houser, D. R. and M. J. Drosjack, Vibration Signal Analysis Tech-niques , The Ohio State University, USAAMRDL Technical Report No.
73-101, U. S. Army Aviation Materiel Research and Development Lab,
Fort Eustis, Virginia, December 1973.
8. Drosjack, M. J. and D. R. Houser, "An Analysis of VibrationDiagnostics for Helicopter Power Trains," Proceedings 20th Inter-national Instrumentation Symposium , Instrumentation Society of
America, May 1974.
9. Dawson, W. H. , Refinement of Rej ect Criteria for UH-1 Sonic Analyzer ,
USAAVLABS Technical Report 69-89.
10. Hogg, G. W. , Evaluation of the Effectiveness of Using Sonic Data to
Diagnose the Mechanical Condition of Army Helicopter Power • TrainComponents , USAAMRDL Technical Report 72-30, May 1972, AD 745-089.
11. Ziebarth, H. K. , J. D. Chang, and J. Kukel, Mechanical Component
Failure Prognosis Study , Garrett Airesearch Corporation, USAAMRDLTechnical Report 73-26, Eustis Directorate, U. S. Army Air MobilityResearch and Development Lab, Fort Eustis, Virginia, June 1973.
12. Smith, K. A., "Crest Factor Analysis for Rolling Element Bearings,"MFPG Detection ,
Diagnosis , and Prognosis ,Proceedings of the 18th
Meeting of the Mechanical Failures Prevention Group, September 1973,
NBSIR 75-252.
13. Sollecito, William E. , Binary Word Analysis, presented at Signature
Analysis and Diagnostics Conference, General Electric, June, 1968.
14. Kirschmann, A. E,, TF-34 Engine Vibration Analyzer , Final Report,
General Electric Company, Contract 62269-70-C00315 , NASC,
Washington, D. C, June 19, 1971.
6

15. Thompson, R, A., B. Weichbrodt, Gear Diagnostics and Wear Detection,
ASME Paper No. 69-VIBR-lO.
Frarey, J. L., "Development of Gear Failure Detection Methods,"
Office of Naval Research, December 31, 1970, AD-720 735.
17. Provenzano, James, John Games, A. Wyrostek, A. Ostheimer, and J.
Young, UH-IH AIDAPS Test Bed Program Final Technical Report,Hamilton Standard Division of United Aircraft Corporation, USAAVSCOMTechnical Report 72-18, U. S. Army Aviation Systems Command, St.
Louis, Missouri, August 1972.
18. Howard, P. L., "Application of Shock Pulse Technology and VibrationAnalysis to Rolling Bearing Condition Monitoring," Proceedings of
20th International Instrumentation Symposium, Instrument Society of
America, May 1974.
7
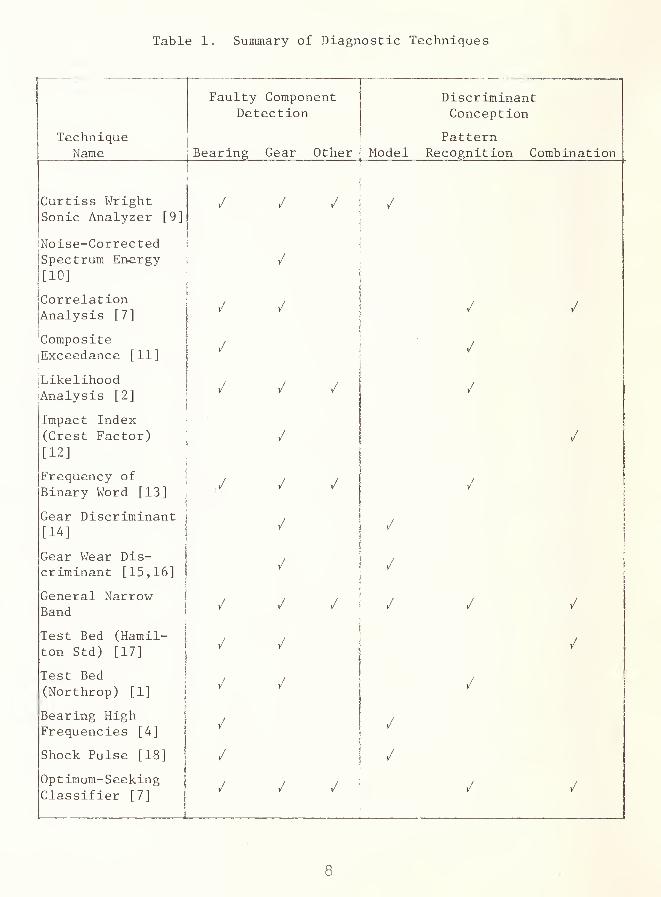
Table 1. Sunimary of Diagnostic Techniques
Faulty ComponentDetection
DiscriminantConception
TechniqueName Bearing Gear Other Modsl
PatternRecognition Combination
Curtiss WrightSonic Analyzer [9]
/ / / /
'Noise-Correctedi Spectrum Energy
|[10]
CorrelationAnalysis [7]
/ / / /
'CompositejExceedance [11]
/ /
SLikelihoodlAnalysis [2]
/ / // / / /
Impact Index(Crest Factor)
[12]
/
Frequency of
Binary Word [13]/ / / /
V
Gear Discriminant[14]
' / /
Gear Wear Dis- i
criminant [15,16] i
/ /j
General Narrowj
Bandj
/ / / / / /
Test Bed (Hamil- i
ton Std) [17] 1
/ / /
Test Bed\
(Northrop) [1]|
/ / /
Bearing High\
Frequencies [4]/ /
Shock Pulse [18] 1
1
/ /
Optimum-Seekingj
Classifier [7] [
/ / / / /
8
Time
ansducer
1
Structures
OOCD
OCD
e0)
Mt/5
CO
o•HPV5
Oc
aJ
•HQ
u•H
H
•HPL.
uo
0» (/)
C 4-
9

in
u•H•Mtfl
O
bOnS
•HQ
O<+-!
•H
>^rHnJ
•H
O•H-MnJ
fi
•H>
GO•HPh
10

Pi
•H
HpOCJ
bX)
H
PQ
nS
mo
O
OI—
t
cti
o
ep •
+-< -—I
u p
CO
U CD
cu u
Cr-H0) Q
to
5-1
•H
(ap) 3anind^v ooi
11


15

Ik

FREQUENCY (kHz)
Figure 6. Frequency Spectra for Running Gears.
a) good gear
b) gear with pitch line pit on a
single tooth
15

DISCUSSION
G. deLong, Naval Air Systems Command (Pacific) : I wonder whether yourbearing analysis has been used for quality control on new bearings?
D. R. Houser : I have not discussed quality control specifically withbearing manufacturers in enough detail to really answer that question.There may be some people here who can answer it.
P. L. Howard, SKF Industries : We at SKF use two basic kinds of tests to
check the quality of our bearings. One is three-band vibration, theobject of which is to give the customer as quiet a bearing as he is
paying for. The second is crest detection, described at earlier MFPGmeetings by Kemp Smith and me. In crest detection, the ratio ofvibration peaks to the RMS of the vibration is determined. The objectis to find assembly damage in the bearing. These techniques can beequally well applied to incoming inspection, in fact, Du Pont in
Delaware is doing just that. They are examining incoming bearings usingboth three-band vibration and crest detection. Another^ technique calledshock pulse was listed on one of Don Houser' s charts. That technique is
probably better suited for machine or assemble bearing checking than it
is for individual incoming bearing inspection because it picks out thebearing source damage in the machine generated noise. So shock pulsedoesn't show as strongly as a bearing quality control tool as it does as
a machine diagnostic tool
.
0. E. Compton, Northrop Corporation, Aircraft Division : Have youemployed any analytical models on crossover loading effects in thrustbeari ngs?
D. R. Houser : I have not personally. Most of the bearing loading in
bearing models has been quite simple in nature as far as diagnostic typeappl ications are concerned.
D. B. Board, Boeing Vertol Company : I was interested in your model oftooth damage because we have been doing some work in the high frequencyregime - a modulated carrier type analysis. On a test stand we damageda spurgear tooth and we did indeed see the exact type of one perrevolution trace that you showed when that tooth comes through the meshonce each time. We got a very large signal change. But ourexperimental data disagree with your model since we could see nothingchanging in gear mesh at all.
D. R. Houser : I didn't say that the gear mesh changed significantly; in
fact, our model only shows that through the 3 db increase in amplitudewith the gear mesh.
D. B. Board : I thought you said there were side band changes.
16

D. R. Houser : The only time we got side band changes was when we put a
torque oscillation in the system. There was a torque fluctuation, but
this was not due to the pit in the tooth.
D. B. Board : We did another test where there was a small crack in the
gear starting at the tooth and propagating through the web down to thebolt hole where it is mounted. We again got very large one perrevolution signal changes. I believe that there was a torsionalstiffness change. We didn't see any change in the gear mesh.
D. R. Houser : The gear mesh frequency stiffness is so great relative to
the rest of the system that I would doubt very much if you affected theoverall stiffness changes in a once per revolution fashion enough to
produce the effect that we are talking about. We are talking about a
fluctuation of 20 to 30/^ of mean torque.
W. R. McWhirter, Jr., Naval Ship Research and Development Center : Wh^rewere you placing the sensor in your experimental analysis?
D. R. Houser : For our bearing work, we normally placed the sensorreasonably close to the bearing. On our rig, there were two ,shafts
driving a gear, and there were two sets of small bearings about a footapart. We tried moving the sensor to various positions on the rig.
W. R. McWhirter : To get an idea of the mechanical impedance?
D. R. Houser : To see how the signal travels. There was definitely a
reduction in the high frequency oscillations as the sensor was movedfarther away from the bearing; however, we still did pick it up.
W. R. McWhirter : In one of the reports you did for Fort Eustis on thegear trains for helicopters, didn't you place sensors on the bearinghousings or on the gear housings?
D. R. Houser : We didn't really place sensors there. Most of the dataanalyzed for helicopter transmissions was obtained from AVSCOM. Theychose the transducer locations. In our gear work, we locatedtransducers as close as we could to the bearings. The gear box we usedwas an offset gear box from a UH-1 main transmission. We did trymounting transducers right on the flexible parts of the housing, but wedefinitely got a reduction in usable information.
E. DuBack, General Dynamics, Electric Boat : The bulk of yourpresentation dealt with frequency domain results. What about otherdomains?
D. R. Houser : For gears, we did only frequency domain work. We havedone some correlation work on some of our bearing rigs, but you justdon't get that much information relative to that from the frequencydomain.
17

A NEW TECHNOLOGY FOR BEARING PERFORMANCE MONITORING
G. J. PhilipsNaval Ship Research and Development Center
Annapolis, Maryland 2140 2
Ball bearing rings are of relatively thin cross section.These rings deform when the bearing is loaded. Under a purethrust load the rings expand equally at each ball positionas indicated in figure 1. As shown in figure 2, the con-touring of these expansions are seen with the aid of holo-graphic interferometry . In this case a 3h" diameter bear-ing is shown which has been loaded with 600 lb thrust. Thepeak displacement was measured as 80 microinches. Duringbearing operation, the ball complement rotates. Thiscauses the surface expansions to travel about the peripheryof the bearing rings. There is, then, a traveling wave ofsizable magnitude on the bearing rings.
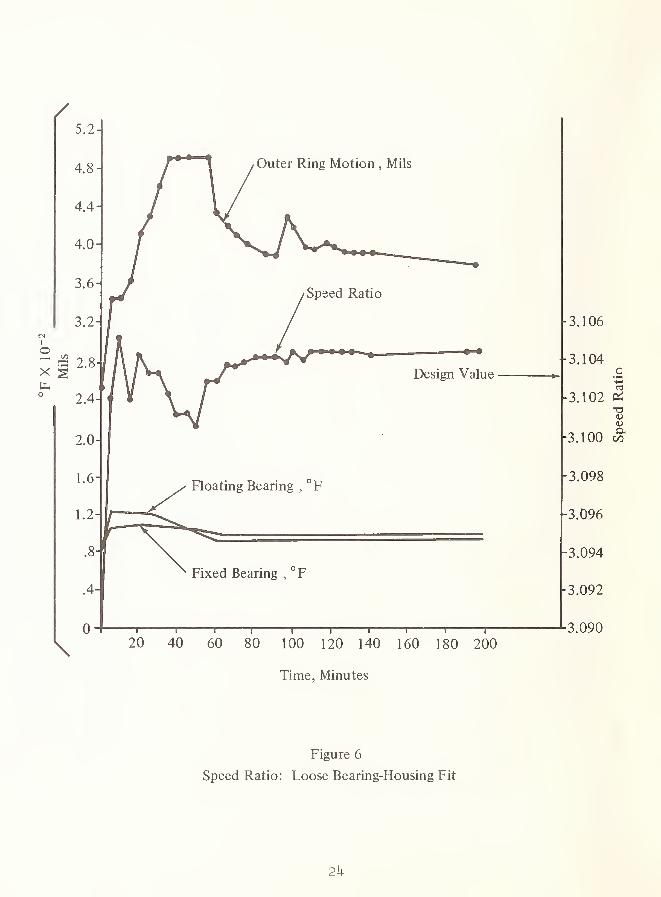
A new approach towards monitoring bearing performance hasevolved since the first observation of these waves. Animportant element of this new technology is the fiber opticsprobe, shown in figure 3, which is used to monitor thebearing ring displacements. This probe can be insertedinto a bearing housing perpendicular to the bearing outerring (see figure 4). The output of the probe, when dis-played on an oscilloscope, generally produces a charac-teristic pattern very similar to a half-sine wave, figure5. Since this wave is generated by the passage of ballspast the probe, it provides an exact measure of the ball-passage frequency. By additionally measuring the shaftrotational frequency, and taking the speed ratio of shaftrevolutions to ball train revolutions, the measurement canbe converted to an operating contact angle. If the initialgeometries and clearances of the bearing are known, bearingloads can be calculated. This capability to monitor the
speed ratio can be useful in several ways: checks forimproper machinery assemblies can be made since bearingsstuck or misaligned in their housings and fits which are tootight are detectable; bearing performance during thermaltransients can be observed and thermal lockup prevented.
«
18

For example, figure 6 shows speed ratio measurements ofthe "floating" bearing in a vertically mounted 75 hp motorwhose bearings were properly installed. After passingthrough a brief thermal transient, the speed ratio settledto a value very close to the calculated or design valuewhich was based on a 780 lb bearing thrust load. When thesame motor was assembled with bearings which were too tightin their housings, the speed ratio varied as seen in figure7, and did not settle close to the design value. Bearingloads varied from 120 to 950 lb in this case as the motorpassed through the thermal transient following a startup.The final load value corresponding to the equilibri-um speed
ratio was 250 lb as opposed to the desired design valueof 780 lb.
The fiber optics instrumentation system described abovecan not only be used as a tool for correct bearing in-stallation monitoring but also as ' a tool for the detectionof bearing faults. In this capacity, it is extremelysensitive for it has been observed that bearing defectscan be positively identified from their inception withthis system. This is so because the probe is sensing bear-ing vibrations directly. Therefore, the signal is notconfounded by extraneous frequencies and resonances inthe machine structure. As explained earlier, a good bear-ing generates a smooth waveform. If a bearing has defectsthey will first appear as discontinuities in that otherwisesmooth waveform. If a bearing has a flaw on its outerrace, discontinuities will be created as shown in figure8a; i.e., one per wave as each ball impacts the flaw. Aninner race defect would produce the disruptions shown infigure 8b; i.e., discontinuities on every wave but spacedcloser than the main wave. Figure 8c illustrates thesignal when a single ball has a defect; i.e., the dis-continuities are centered about one wave only and thespacing is equal to the ball spin frequency.
A case study of a bearing with a defect illustrates thehigh sensitivity of the fiber optics system. Photographs,figure 9, of bearing displacement waves indicated thepresence of a defect on one ball of a brand new bearing.This defect was observed after 15 hours of operation inan electric motor. After 381 hours, the bearing failed.(Failure mode was extremely high audible and structure-borne
19

noise,) Concurrent vibration spectra recorded using anaccelerometer stud-mounted to the motor, figure 10, gaveno forewarning of the failure. Subsequent disassembly andinspection confirmed predictions of the fiber optics probe.A single ball, figure 11, was found which had a set ofring shaped grooves cut into it. The figure shows a
photograph of the intersection of a 100-microinch deepgroove with the wear track of that ball.
The accumulation of experience with this new applicationof fiber optics is continuing.
20

21

Figure 3
Fiber Optics Probe
22
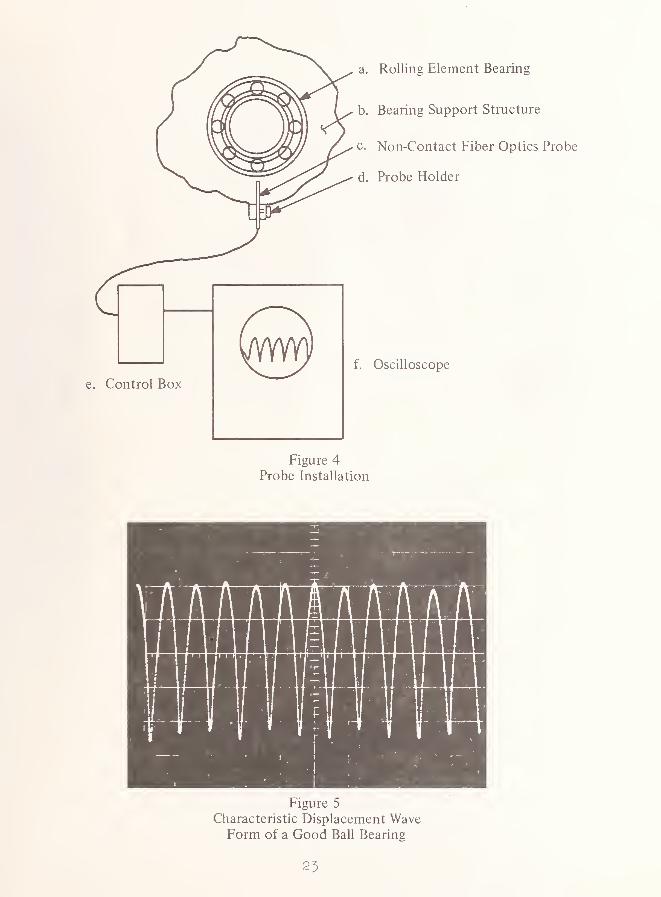
e. Control Box
a. Rolling Element Bearing
b. Bearing Support Structure
c. Non-Contact Fiber Optics Probe
d. Probe Holder
f. Oscilloscope
Figure 4Probe Installation
Figure 5
Characteristic Displacement WaveForm of a Good Ball Bearing
23
T -I 1 r
100 120 140 160 180 200
Time, Minutes
Figure 6
Speed Ratio: Loose Bearing-Housing Fit
2h

°F, Floating Bearing
,°F, Fixed Bearing
0 20 40 60 80 100 120 140 160 180
Time, Minutes
I I I Li.200 220 240 260^24^
3.106
3.104
.2^-^^^
c2 3.100•o
I 3.098
3.096
3.094
3.092
3.090
Design
^ Value
0 20 40 60 80 100 120 140 160 180 200 220 240 260' 24 M8Time, Minutes Hours
Figure 7
Speed Ratio:
Tight Bearing — Housing Fit
25

a. Outer Raceway Fault — One Discontinuity Per Wave
b. Inner Raceway Fault — Discontinuities on Every Wave, Spacing (x)
Uniform but Less Than Main Waveform (y).
c. Ball Defect — Discontinuities Clustered About
1 Wave Only and Spaced (z)
at Ball Spin Frequency
Figure 8
Bearing Fault Analysis
Figure 9
Bearing Wave FormShowing Presence of
One Defective Ball

-.) is/w s-01 m 80V
27


DISCUSSION
J. L. Frarey, Shaker Research Corporation : You showed the vibration
spectra going into the high frequency region. Did you filter or
demodulate any of the high frequencies as Dr. Houser mentioned?
G. J. Philips : No.
J. L. Frarey : I can see how you could get little spikes from bad balls
in ball bearings by looking at the outer race at one point, but how can
you see outer race defects 180° away from the location of the probe?
G. J. Philips : That's one of the development areas that I want to look
at. Hopefully, the rigid body mocion of the ring itself will be
sufficient to enable us to pick up the signal. It may turn out we will
need more than one sensor.
D. N. Schuh, Beta Machinery Analysis, Limited : What are the amplitudes
of the motion that you are observing?
G. J. Philips : In one particular case that I mentioned earlier, 80 yin
was the peak-to-valley displacement for that size bearing with 600 lbs.
load. Generally, the amplitudes are less than 100 yin. Some bearing
defects produced spikes corresponding to a displacement of 10 yin.
D. N. Schuh : And this occurs even though the bearing might be tight in
the housing?
G. J. Philips : Yes.
D. N. Schuh : Do you feel this is going to be a practical technique for
field type measurements? It seems that very high accuracy is required.
G. J. Philips : Yes, that is what we are shooting for. The big thing wehave going for us here is that the signal itself is so simple. We areplanning this year to look at a large quantity of bearings to try to
develop some statistical confidence in what we are doing. As I
mentioned we are going to be inspecting brand new bearings and lookingat failures that have been returned to us from the fleet. We will alsobe looking at the assembly of electric motors. We are trying to' get as
much experience with this technique as we can.
D. M. O'Dea, Exxon Research and Engineering Company : Why did you usefiber optics in preference to strain gauges to monitor the outer race?
G. J. Philips : We started this work about four or five years ago and I
don't remember what governed my selection of the transducer. I'm notsaying this can be done only with fiber optics, but since I have beenusing that transducer I found it very convenient. It is very easy to
work with. You need only a hole about one-eighth inch in diameter to
29

provide access to the bearing. A strain gauge must be wired to thebearing, which is very awkward. Fiber optics is non-contact, it doesnot interfere with the operation of the bearing.
R. M. Whittier, Endevco Corporation : Errors might be due to two things.One would be the irechanical effects of the oil in the gap between the
outer race and the casing. The second would be the reflectivity of theoptic gauge on the race because of the presence of oil.
G. J. Philips : The displacement wave is a purely mechanical function.It depends on the geometries involved and the applied load. Thereflectivity of the probe itself is affected by any kind of fluidsbetween the surfaces. I haven't done any correlation with exactamplitudes. Right now, it's a go, no go type of gauge. Either the waveform is smooth and has no spikes or it contains spikes.
C. E. Horten, Naval Ship Engineering Center : We are presentlymonitoring some 50 pieces of rotating machinery at deployed sites with
^real-time analyzer. We have been doing it for about five years and werecommend bearing removal and replacement based on the sound cuts. Wesend these bearings back to Annapolis for analysis. Very often theacceptance tests that are run on bearings using an andarometer ^show thebearings to be OK because a laboratory test stand is used. Are yougoing to tie in your work on this new technique with the signatures ofbearings installed in the fleet?
G. J. Philips : When I checked the bearing that I showed with the ball
defect on our andarometer it ran smooth and quiet, like a noise-testedbearing. When I mounted the probe on the andarometer head and looked at
the bearing vibration, I could again see spikes. The andarometer is a
three-band vibration measuring instrument. It measures an RMS averageof vibration over a very broad frequency range. It's a rough qualitycontrol instrument. This fiber optics probe goes beyond that. It
discriminates bearing faults whereas the andarometer can't. AtAnnapolis this year, we will be looking at thousands of bearings fromcurrent Navy stocks with this technique.
D. W. Long, Pacific Fruit Express Company : Have you done any work on
cylindrical or tapered roller bearings and would you expect this
technique to be useful in the diagnosis of these bearings?
G. J. Philips : I haven't done much work myself with the roller bearingsbecause ball bearings are used to such a wide extent in the fleet, butthe theory of defects is the same for both roller bearings and ball
bearings; it is just a matter of the magnitudes. There is so much morecontact area in a roller bearing that it might be possible to straddle a
fault and not detect it.
30

BEARING CONTACT RESISTANCE AS A DIAGNOSTIC AID
Richard L. SmithShaker Research CorporationNorthway 10 Executive ParkBallston Lake, N.Y. 12019
The technique described below can be used to determine the relative"health" of an operating bearing by measuring its contact . resistance.
The approach described is not presented as a "beat--all" bearing moni-
toring system but rather an alternative for certain bearing applications.
Use of the technique described, requires a small D,C. voltage (normallyless than 100 millivolts) to be placed across the bearing during the
time of fault detection. Most of the data shown on the figures beloware taken from an analysis of several freight car roller bearings usedin the railroad industry.
When two solid surfaces are put together, "asperity contact" occurs.
The degree of metallic interaction or asperity contact between bearingcomponents is determined by the lubricant film thickness within the
bearing. Lubricants used to minimize asperity contact in bearingsattempt to maximize this film through boundary or hydrodynamic means.
Variations in electrical resistivity as a result of asperity interactionwere for many years (1)'' observed with the oscilloscope. Photographssimilar to that shown in Figure 1 revealed the degree of asperity inter-
action within an operating bearing. A time varying contact signal canbe obtained from a rolling element bearing with the aid of the circuitryand test arrangement shown in Figures 2 and 3.
Properly-lubricated bearings operate with a minimum of metal contact be-
tween rolling elements. Best designs operate with fluid films which areat least four times the average component surface finish. Since mostlubricants are organic hydrocarbons, a high average resistance is main-tained between the inner and outer race of a well-lubricated bearing.Experience has shown that average bearing operating resistances mayrange from one ohm in the case of the freight car bearing, to over a
million ohms in a fully flooded instrument bearing.
Bearing average operating resistance is a function of operating filmthickness. Typical film thicknesses (2) calculated for a railcarroller bearing are shown in Figure 4. This type of bearing has a sur-face roughness normally greater than four micro-inches. The analyticalfilm thickness shown assumes fully flooded oil lubricated conditions (3).
The railcar bearing operates on a grease film and is likely to have a
* Numbers in parentheses indicate references listed at the end of thepaper.
51

true operating film which is reduced (4) from the values shown. Freighttrain bearings operate for most of their lives in the boundary lubricat-ed regime as a result of their low average speed, which is reportedly 20MPH (5) . Boundary lubrication implies a high percentage of asperitycontact.
Figure 5 is a qualitative functional display of contact resistance andthe nominal film thickness generated between the rolling elements ofa bearing.
Although functional dependence of resistance and films on unlubricatedsolids with oxide layers is understood (6) for some metals; the dynamicconditions of lubricated contacts present an extremely difficult anal-ytical problem. Thus, prediction of the exact level of the mean re-sistance for a given operating bearing, to date, has not been attemptedto the author's knowledge.
An experimental display of how the "average" resistance changes when theamount of oil in the bearing is altered and when the viscosity of thelubricant is lowered is shown in Figure 6. The average here is basedelectronically upon the percentage of time the contact resistance sig-nal is below the selected center-scale-resistance. An effective bear-ing monitor would make use of this simple resistance level change.Once a nominal operating range has been established, a level sensingcircuit could be used to automatically indicate when operation has gone"bad".
Another experimental display of resistance level change is shown inFigure 7. Displayed is the common variation in percent contact for a
202 size bearing while increasing load and keeping the speed fixed.Three constant speeds of 280, 395, and 725 RPM are shown in the samefigure. As is well knovm, the average film thickness of a hydro-dynamically lubricated bearing is relatively insensitive to load (inverse
1/11 power dependence). The average electrical contact resistancein the same bearing, however, can change over several decade levels.
Asperity count rate level can also vary with improperly operating bear-ing components. Figure 8 shows a bearing with a cage which affectedthe electrical contact rate during each rotational cycle. Bearing com-ponents which were forced into sliding as a result of the out-of-round-cage could be one explanation for the observed data.
A.C. as well as D.C. level changes in the asperity contact signal canalso be used to establish bearing "component health". A look at thetime varying asperity signal on the oscilloscope reveals what appearsat first glance to be a random signal filled with "white noise". Thereal time spectral analyzer, however, reveals singular spikes in thosebearings which have inherent defects.
52

A comparison reference spectrum of a "new" bearing of the same size as
four defective bearings whose spectra follow is shown in Figure 9. For
ease in comparing each of the following spectra shown, all electroniccontrols of the spectrum and electronic contact analyzer, except one
were held fixed during the experiment. The center scale resistance
(see Figure 2) was adjusted in order that the A.C. signal variation of
the asperity contacts were not suppressed by high or low level clipping.
Figures 10 through 13 display the spectra along with a photo of the in-
herent defect in each bearing used during the tests. The defects shownwere
1. Figure 10, a roller with a split seam line,
2. Figure 11, a bearing with surface corrosion,3. Figure 12, a dented roller, and
4. Figure 13, a slightly spalled roller.
Sharp edged defects such as that displayed in Figure 10 result in manyharmonic "spikes" being present in the electrical contact spectra. Anextreme example of this is shown in Figure 14 from a ball bearing. Har-
monics to 10,000 hertz at multiples of twice the ball passing frequencyare displayed. A ball with a "flat spot" causes this.
A comparison of two bearing diagnostic techniques is displayed in
Table I. A ranking of twelve bearings which had inherent defects is
shown. Some bearings screened by each technique were found to havesignals indiscernable from that of the "good" reference bearing. It
should be noted that each of the bearings had previously been found"faulty" for at least one or more of nine reasons without electronicmeans
.
Bearing "L" is found to be "good" with the high frequency diagnosticsscheme and ranks as third to the worst with the electrical contacttechnique.
An opposite ranking for bearing "H" appears to hold. The point here is
that neither detection scheme appears to catch "all defects" and thosebearings found to be "good" comprised a mutually exclusive set from eachtechnique. It is reasonable that some critical bearing applicationscould use the complementary aspects of electrical contact analysis.
REFERENCES
1. Furey, J.M. , "Metallic Contact and Friction Between Sliding Sur-faces," ASLE Transactions 4, 1961.
2. Cameron, A,, Basic Lubrication Theory , Longman, London, 1971.
3. McGrew, J.M., Gu, A,, Cheng, H.S., Murray, S.F., Elastohydro -
dynam.ic Lubrication - Preliminary Design Manual , Technical ReportAFAPL-TR-70-27, Wright-Patterson Air Force Base, 1970.
35

4. Chlu, Y.P. , "An Analysis and Prediction of Lubricant Film Starva-tion in Rolling Contact Systems", ASLE Preprint Number 73AM-3B-4,April 1973.
5. "Yearbook of Railroad Facts", AAR Publication, 1974.
6. Gupta, P.K, and Cook, N.H. , "Statistical Analysis of MechanicalInteraction of Rough Surfaces", J. Lub. Tech., ASME Trans. Vol.
94F, 19-25, Jan. 1972.
3^+

HIGHresistance'
i
BEARINGCONTACTRESISTANCE
tLOW
RESISTANCE
INFINITY
CENTERSCALERESISTANCE
-0
TIME
Figure 1. Typical Bearing Contact Resistance Signal,
ASPERITY SIGNAL
BEARINGCONTACTRESISTANCE
FIXED
RESISTOR
Hlilili-
BATTERY
Figure 2. Electrical Contact Diagram.
rELECTRON IC
CONTACTANALYZER
o 0
SCOPE
REALTIME
SPECTRUfyi
ANALYZER
x-.y-T
PLOTTER
Figure 5- Typical Test Instrumentation Set-up.
55

ROLLING SPEED IN/SEC
Figure h. Cplculated Railcpr Roller Bearing Operating FilmThicknesses.
10"^ 10° 10^ 10'*
FILM THICKNESS, Microinch
Figure 5. Contact Resistance and Nominal Operating FluidFilm Thickness.
36

FILM THICKNESS, MIcroinch
301% OIL
TIME, 50S/INCH
Figiire 6. Percent Contact and Fluid Viscosity.
FIGURE 7 ASPERITY CONTACT LOAD/LEVEL SENSITIVITY
0 LOAD, LBS. 200
Figure 7- Asperity Contact Load/Level Sensitivity.
57

O
CAGE DEfECT SIGNAL
I PERIOD OF^ CAGE REVOLUTION
TIME
Figure 8. Cage Defect Signal.
FREQUENCY, Hz 200
Figure 9- Reference Spectrum From New Bearing.
58

SPLIT SEAM LINE
BEARING "C
FREQUENCY, Hz
Figure 10. Split Seamed Roller with Spectrum.
200
CORROSION
FREQUENCY, Hz 200
Figure 11. Corroded Roller Bearing with Spectrum.
39

I,
FREQUENCY, Hz
Figure 1^. Spalled Roller Bearing with Spectrum.
1^0

u
TWICE BALL PASSFREQUENCY
lUAJ
FREQUENCY Hz lOK
Figure ik . Spectrum of Faulty Ball Bearing,
HIGH FREQUENCY VIBRATION SCREENING TECHNIQUE
-BAD
GBIEAHKFDF
GH
DK
E
IJ
CONTACT RESISTANCE SPECTRAL SCREENING TECHNIQUE
Figure 15 . Comparison of Tabulated Bearing Fault Results.

DISCUSSION
P. L. Howard, SKF Industries : How do you control the effect oftunneling through the lubricant and what effect does dirt in thelubricant have on your measurements? I noticed you were changingresistance scales which changes the potential across the bearing quitedrastical ly.
R. L. Smith : I don't really control the tunneling. It occurs when thelubricant film thins to one yin. When it occurs, the resistance must bechanged. I am not really controlling tunneling but I do use it. Theapplied voltage, though, is small enough so that the percent contact is
not changed significantly, at least in the regions where I have beenlooking. In other words, during an experiment the voltage can bechanged either by changing the center scale resistance or changing thevoltage in the system. If th,e applied voltage and applied current arelimited, then there really isn't a change in percent contact until youhave reached a certain specific voltage. In one case I found thevoltage to be 0.86 volt applied across the bearing. Other people havefound it to be as high as 3 volts. Tunneling or discharge will occuracross the lubricant film when the film gets thin enough. When a
particle goes through the contact zone, the film gets very thin and, ofcourse, there is a large change in resistance.
P. L. Howard : This is one reason people use capacitance variation.
R. L. Smith : Yes, my experience indicates that capacitance change can
be used but it doesn't have that decade level change that resistanceoffers. The percentage variation due to capacitance changes is alwaysmasked by the large capacitance due to the geometry of the bearingitself - the inner and outer races provide a large capacitance and the
small variations due to film thickness changes are a small percentage ofthat large variation.
P. L. Howard : It becomes very valuable at low film level.
k2

NONDESTRUCTIVE TIR E INSPECTION
Manuel J. Lourenco and Lloyd H. Emery, National Highway TrafficSafety Administration, Office of Vehicle Safety Research, Crash
Avoidance Research Division, Washington D. C. 20590
NHTSA in 1971 initiated a research effort in the area of nondestruc-tive testing which would apply to inspection and test of motor vehicletires. This research task was assigned to the Transportation SystemsCenter (TSC), Cambridge, Massachusetts which had previously been a
research arm of NASA and was known as the Electronics Research Center.
The prime objective of this program was to determine the feasibility andpracticality of utilizing NDT techniques to inspect and predict dynamictire performance. The techniques that were investigated were:
X-Ray - (FIGURE 1)
Utilized by the industry in the tire development phase. It coulddetect broken cords, ply overlap and belt doglegs.
Infrared Imagery - (FIGURE 2)
Not true NDT because the technique required some exercising,although minor, of the tire to obtain its thermal profile.Signal interpretation was very difficult.
Hoi ographic Imagery - (FIGURE 3)
Through double exposure holograms and the resulting fringepatterns, anomaly (separation) detection was fairly precise.
Ultrasonics - (FIGURES 4a and hh)
Both the reflection and transmission techniques were investigated.This technique proved to be the most cost-effective for newand recycled tires respectively.
Resonance - (FIGURE 5)
This technique relies on exciting the tire to its resonantfrequency at the tread center and utilizing symmetrically placedreceiving transducers on the sidewalls to detect imbalances in
the output signals.
The latter NDT technique, because of its simplicity, ease of operationand maintenance, direct application to mounted tires, short test time,and low equipment cost was selected for motor vehicle inspection (MVI)
use. The MVI of tires is the principal theme of this paper and thefollowing will outline the effort that has carried the system to theprototype validation phase.

The first known active use of resonant vibration as a technique fordetermining mounted tire integrity was published in Mr. James Weigl 's
masters thesis (Ref. 1) in 1967 at M.I.T. The equipment used by Weigl
in his research and the laboratory system evaluated by Dr. D. Wilsonand S. Loebl also from M.I.T. did not validate the technique foridentifying defects or anomalies within tires. The TransportationSystems Center in 1973, convinced that the resonance technique could,with modifications, be utilized to sense and position abnormalitieswithin tires, undertook an in-house research effort to advance the
S. A. Loebl and D. G. Wilson system (Ref. 2). FIGURE 6 depicts a blockdiagram of the M.I.T. developed system and its function and figure 7
is a photograph of the developed system.
The TSC developed system also utilized the vibrating resonanceproperties of the tire but differs from the M.I.T system in that thesensing technique for abnormalities is somewhat different. The systemdifference can be seen in the TSC block diagram shown in figure 8 wherethe vibration source is placed at the center of the tire tread areaand the receiver transducers are positioned in the same radial planeequidistant from the source (Ref. 3). The TSC advanced prototype(Ref. 4) system is shown in FIGURE 9 (Mechanical Design)and FIGURES 10
and M (Photographs).
To comprehend how the resonance technique senses anomalies or flaws in
the tire it will be necessary to understand and interpret the mannerin how a tire vibrates when excited sinusoidal ly.
The type of resonant mode pattern that is obtained in a tire is
dependent on the direction of the applied force and the position atwhich it is applied. In the TSC developmental system the forcetransducer was positioned at the center of the tread area. Thevibrating force transducer when in contact with the tire tread willinduce within the cross section a circumferential response (see FIGURE12a) and simultaneously a tangential mode along the entire circum-ference (see FIGURE 12b). The combination of these two modes generatesa two dimensional mode pattern within the tire carcass. The resultantmode patterns have been observed in tires by G. Potts (Ref. 5) throughtime-average holography. Pictorial representation of resonantvibration patterns from the Potts investigation are shown in FIGURES 15and 14.
With an oscillating transducer applied to the tire tread center line,the tire can be made to oscillate in a manner shown by the displace-ment envelope of the cross section indicated by the dotted lines in
FIGURE 15. The beads and the "X" marked points are the nodal points.By placing receiver transducers in the same radial plane, at equal
distances from the source transducer (FIGURE 15), the vibratingproperties of the tire and the vibrating symmetry of the radial crosssection can be measured. Rotating the tire about its axis and holding
1+1+

the oscillating and receiver transducers stationary, the vibratingproperties and radial symmetry for the entire tire carcass can be
measured. The oscillating transducer, through electronic control, will
maintain its resonance condition even if the properties of the vibratingtire carcass change.
The tire defects of greatest interest to motor vehicle safety are thosewhich may lead to or result in the tire failure; these include cuts,
tread chunking, uneven wear, broken cords and separations. In all
cases, these defects will, in general, upset the symmetry of the tire
and therefore affect the resonant vibration properties of the tire.
The tire symmetry under inspection is that obtained in comparing the
two halves separated by a plane perpendicular to and through the
center of the tread area. The TSC system configuration for inducingoscillations in the tire tread area and obtaining wave-forms off thesidewalls will produce the comparative symmetry needed to determinetire integrity. The system requires simultaneous circumferencereadings of the two individual sensing transducers (designated A & B)
and the algebraic sum of the A + B readings to determine defect contentand placement. Full tire inspection is accomplished by rotating the
tire at a rate that will give a good signal to noise ratio.
Mechanical or electronic expertise will be required for maintenance ortrouble shooting, but system operation can be accomplished by personnelwithout prior technical training. In fact, the tire inspection processis fairly effortless except for the selection of the applicable resonantfrequency at which to perform the inspection. The operator must be
indoctrinated in the basic understanding of the whys and how a tirecarcass vibrates when excited sinusoidal ly. The selected resonancefrequency depends primarily on the tire size and construction. Forinstance, FIGURES 16 and 17 holographical ly show that the second modeof vibration is the most applicable for use with the TSC technique.The resonant frequency for an H78-1 5 bias ply tire and for an HR78-15radial ply tire turned out to be 168 Hz and 80 Hz respectively. Thelower mode would be less sensitive and the higher modes tend to"break-up" and become unresolvable.
During laboratory evaluation the tires to be inspected were mounted onstandard automotive wheels, inflated to normal operating pressure, andplaced on the tire tester hub. The exciting transducer input rollerwas mechanically placed in contact with the tire at the center of thetread. Using the exciter armature bias control, the input roller totire contact force was adjusted to approximately 3 pounds. Thereceiver transducers were then positioned perpendicular to the tiresidewall surface at equal distances from the input roller contact point.The optimum position was determined to be between 70° and 90° from theroller input point (See FIGURE 18). The receiver transducer to tiresurface contact force was readjusted to approximately 2 pounds.
^5

Having performed the mechanical requisites the electrical system is
then energized. The oscillator and the exciter amplifier are adjustedto produce an energy level input that vn'll give desired signal outputs.The oscilloscope presentation of the receiver transducer response is
then used to tune the exciter to the desired resonant tire mode and theexciter is readjusted, if necessary, to the desired input energy level.
The operator now has the option of operating the system at a constantfrequency or using the automatic frequency tracking system.
The tire is rotated at about 1 rev/mi n. so as to minimize accel erometerresponse from sidewall lettering or other tire surface anomalies, by
means of the wheel shaft drive or the roller drum. The sensingtransducer signals are viewed visually in real-time with an oscillo-scope and/or are recorded on an X-Y recorder (See FIGURE 19). Whenusing the X-Y recorder, a shaft encoder insures a point to pointcorrelation between the tire circumference position and the datarecording. Hard copy recordings (X-Y) were made of each transducerresponse (A & B) and of the algebraic sum (A + B) of the two outputsignals which is accomplished electronically.
System evaluation was based on numerous tests for which data recordingssimilar to those of FIGURES 20, 21, and 22 were obtained and the tirewas destructively analyzed to confirm the system's detection capability.Excellent detection capability was obtained for the flaw types listedin Table A.
The location of the tire flaws is determined by the signal amplitudevariance corresponding to a receiver transducer and its placementalong the developed circumference for the tire. A defect located in the
center of the tread area will be detected by both receivers but will
cancel out on the A + B trace. FIGURES 20, 21, and 22 are receiveramplitude responses taken of tires containing known defects. The
system's response to the defects are obvious and are labeled as to
type, location and size on the recordings.
The resonance vibration technique is a valid process by which in-
service automobile tires may be inspected quickly and inexpensively.The tires can be inspected while mounted on the vehicle because the
weight of the automobile on the tire has no effect on systemperformance. Based on the research and development effort conducted atthe Transportation Systems Center, NHTSA concluded that the techniquewas valid and an automatic prototype system should be developed to
confirm its practicality and usefulness. To this end NHTSA awardedSouthwest Research Institute (SWRI) a contract (DOT-HS-5-01 066"Passenger Vehicle Tire Inspection Equipment Development") which hasas its primary objective the design, construction and validation of a
prototype system which will be less complex than the TSC system,eventhough it will have a triple inspection function, and will
incorporate a go, no-go indicator to eliminate inspector subjectivity.The three function system (FIGURE 23) will include the automaticcapability of simultaneously evaluating tire structural soundness,
hG

measuring tread depth and inflation pressure. The contractual effortwas 'initiated in January 1975, and the progress to date has not gonebeyond basic system layout as shown in FIGURES 24, 25, and 25 andpreparation of appropriate specifications. This research and
development effort is scheduled for completion in June 1977.
REFERENCES
1. Weigl, J., Investigation of an Advanced Vehicle Inspection System,M.S. Thesis, M.E., M.I.T. Cambridge, Mass., 1967.
2. Loebl , S., and Wilson D., Fabrication and Evaluation of a ResonantNondestructive Tire-Testing System, DOT-TSC-NHTSA-73-4 , April 1973.
3. Lavery, A. L., Resonance Tire Inspection Unit, U.S. PatentApplication, Serial #325,292 Transportation Systems Center,Cambridge, Mass., 1973.
4. H. Ceccon, A. L. Lavery, F. Coults, Nondestructive Tire TestingUsing Resonant Vibration Techniques - Report No. PM-T-16 ofApril 1974.
5. Prototype Tire Testing Apparatus, Contract DOT-TSC-55-3 , SouthwestResearch Institute, San Antonio, Texas.
6. Potts, G., Tire Vibration Studies - The State-of -the-Art
,
Akron Rubber Group Winter Meeting, January 1974.
7. J.E. Johnson, "Passenger Vehicle Tire Inspection EquipmentDevelopment" (Briefing) February 19, 1975.
k7

>
CD<OLUt-UJ
Q
o
03
>
o
o © oo o
oo.
ooa
o o o
oc
0)
are0) 0)
<oo
CO
<^ CO (0 (0
i ^o o o TD
COm c/5 C/3 CO CO
CO
CO
o(O0)
0$
(O
oCO9>
LUNCO
C3
15E
CCO
cCO
"co
E(/)
a> a>loE(/» JO JO JO JO
TJ ID D T3C c C C cCO CO CO CO CO
CN CM CM CM
u1 1
1
LLLUQ
S "5.
© o o o— ^c
CO ce CO
CO CO COa a a t:03 OS Q) 3CO CO CO o
0)
>CO
3UCO
_3
o «
u 0.
o
uc0) ^k> —
E
^ CO^ a>
5^
J! SCO 0)o ^
^ E
11> o«^ CO
CO
IIIE 0)
^ s
Q T3
-p•HH•r-i
c5-po0)
-pOJ
O-Po(U
(U
O
pq
U8

^9

FIGURE 2 - Infrared Inspection System
50

51

52

55


POWERSOURCE
I
X YRECORDER
FIGURE 6 - MIT Resonance System Block Diagram
55

56

SCHEME FOR MEASUREMENT
POWERSOURCE
DETECTOR
MOTOR
VIBRATIONSOURCE
DETECTOR
MIXER
OSCILLOSCOPE
RECTIFIER
FIGURE 8 - TSC Resonance System Block Diagram
57

58

59

60

A) CIRCUMFERENTIAL
61

FIGURE 13 - RESONANT VIBRATION PATTERNS
62

63


140 Hz
FIGURE 16 - First, Second and Third ModeRadial Vibration Resonances forH78-15 Bias Ply Tire; 140, 168and 278 Hz, Respectively
65

80 Hz
FIGURE 17 - First, Second, and Third Mode Radial
Vibration Resonances for HR78-15 Radial• Ply Tire; 59, 80 and 96 Hz, Respectively
66

67


69

70

71

RIGHT TIRETRACK
MAX. TRACK& TIRE WIDTH
MIN. TRACKWIDTH
ENTRANCEGUIDEROLLERS
PARALLELGUIDE ROLLERS
LEFT TIRETRACK
MAX. TIREWIDTH
pick-upZ.HEADS
MOVABLEDRIVEROLLERS FIXED
FIGUEE 23 - Automatic Centering System
72

75

REMOVABLE PEDESTAL FOR
DRIVE ON TESTS
FIGURE 25 - Laboratory Resonance Inspection Apparatus
7k_

75

DISCUSSION
J. M. Chudobiak, University of Saskatchewan : Why do you have to useresonance? That seems quite a drawback. I think that your method is
very much the same as Mr. Philips' procedure and you are just measuringchanges in symmetry.
L. H. Emery : The TSC results show that the resonance technique wouldprobably be the most practical from an MVI standpoint. At inspectionstations out in the states, tires come in dirty and wet - you want to
have low cost equipment and maintenance, you want it to be fairlyunsophisticated. The decision was made on the basis that resonance hadthe least drawbacks.
J. M. Chudobiak : Can't you just drive at any frequency? You are tyingit down to specific frequencies which increases the sophistication.
L. H. Emery : The second resonance mode seemed to give us the mostinformation in detecting these tire flaws.
J. M. Chudobiak : Did you try to drive it at various frequencies or didyou specifically select natural frequencies?
L. H. Emery : We tried to look at just the natural frequencies.
0. E. Compton, Northrop Corporation, Aircraft Division : What would rimeffects such as out-of-roundness, dents, etc., have on the side wall
when using a resonance type frequency?
L. H. Emery : I don't really know. I think we are going to see thatthis year.
W. K. Mathison, Puget Sound Naval Shipyard : How do you determine the
resonance for a particular tire? Do you use the same resonancefrequency for a given type of tire or does it vary with the tire as it
is brought into the inspection station?
L. H. Emery : It varies.
W. K. Mathison : How do you determine it, then?
L. H. Emery : The operator goes through the procedure and looks for it.
W. K. Mathison : He doesn't take any holographs?
L. H. Emery : We just use signal analysis.
R. Lenich, Caterpillar Tractor Company : There have been problems withtires because of varying stiffness due to the manner in which the plieswere laid. Does this affect the weight pattern or influence yourreadings?
76

L. H. Emery : We expect some problems with this. We hope that we will
be able to inspect for and find the major causes of tire failure.
E. DuBack, General Dynamics Electric Boat : In your test setup, youmentioned a three-pound load due to the rollers. It seems that in
actual conditions you are going to have quite a bit more load when youconsider a car.
L. H. Emery : When the car is sitting on the two rollers, the load will
be set automatically so that the test head will come up between the tworollers.
J. M. Chudobiak : Are you also trying to get tire pressures from thesevibrations?
L. H. Emery : No
.
77

MEASUREMENT OF SPECTRA IN INTERNAL COMBUSTION ENGINE CYLINDERS
Jere M. Marrs, Ph.D., Tektronix, Inc.
Beaverton, Oregon 97077
The emission of light from chemical reactions is a very general phenome-non. New molecules are being formed with excess electronic energy andwhen that energy can be given off radiatively, the emissions can be ob-served. If one knows the exact molecular mechanism of the reaction, theemissions during the reaction can in some cases be interpreted. Obser-vation of such emissions can be of use in two separate and distinct ways:1 ) interpreted spectra can lead to models of the reaction mechanism, ifnot previously known, and identify the emitting species, and 2 ) empiri-cal relationships can be determined from spectral observations as theyrelate to known variations in the reacting mixture.
In internal combustion engines, a fuel is mixed with oxygen (from air),
compressed, and ignited. The very complex chemical reactions that thentake place are quite energetic, take place under high temperatures and
^
pressures, all of which ensure the vigorous emission of light. Spectralmeasurements of light emitted during combustion processes in the pasthave been of two types: measurement of temperature through opticalpyrometry, and observation of emission of light at single wavelengths.Pyrometric measurements measure an equivalent temperature based upon a
black body radiation law (Planckian radiator) . Measurements at singlewavelengths can be quite useful, but obtaining spectra using this tech-nique would be quite difficult. It would be necessary to sample the
spectrum at a known time in the firing sequence of the engine at as manywavelengths (in successive experiments) as is necessary to adequatelydescribe the spectrum. Unfortunately, the intensities vary considerablyfrom firing to firing making a statistical sampling necessary. Needlessto say, transient phenomena which could lead to or be the result of a
failure would not be seen under such conditions.
It should then be considered: what sort of transient phenomena could be
observed and how could they be related to potential engine failures? To
illustrate a point, consider some hypothetical failure modes or abnormaloperations of internal-combustion engines and what spectral events mightoccur. Consider four possible abnormal conditions: 1 ) oil burning, 2 )
rust or metal shavings in combustion chamber, 3 ) hostile ambient con-
ditions such as salt mist, 4 ) abnormal fuel components. The effectivetemperatures in a combustion plasma can be in the neighborhood of 4000 °f}
or so. Under such conditions, any small metal fragments, dissolved ele-
ments, will be vaporized and atomized in exactly the same manner as in the
graphite furnace in an atomic absorption instrument. The atoms thus pro-
duced will become electronically excited and emit light at their
characteristic wavelengths modified some by the environment. It is then
78

possible to identify them. If condition 1 occurs, then all of the dis-
solved elements in oil are vaporized and excited. Suppose the oil
contained an additive with calcium in it. Then one might expect to see
the characteristic calcium emission line at 423nm. In condition 2 whichmight be an engine that has not been used for a while or one in whichthere is a catastrophic failure of some sort, the iron emission lineswould appear transiently upon starting the engine or at the onset of the
failure. Condition 3 might obtain if an engine is operating in a saltymist created by salt-treated roads. One might then expect to see the
characteristic emission lines of sodium or calcium if any of the mistpenetrates the air filter and into the intake manifold. Similar obser-vations are possible with fuel components in condition '4. The emissionspectra in the near infrared measured on a CFR (Cooperative Fuel Re-seatch) engine appear to be molecular in origin. It is possible that theaddition of fuel components such as methanol, ethanol, or water couldchange the appearance of that spectrum in a repeatable fashion. Thus, an
empirical relationship between the particular fuel component and thatspectral observation could be made. Should the origin of the spectrumever be determined in terms of molecular processes during combustion, theobserved effect could be interpreted in terms of the molecular inter-action with the fuel component studied. Considerable work is under wayto interpret these molecular-type spectra^ s ^ > and we feel that real-timespectral observation will give new impetus to their study.
The instrument that was used to make spectral observations from internal-combustion engines is made by Tektronix, Inc. and is called a rapid-scanspectrometer. Figure 1 shows a skeleton diagram of how the instrumentworks
.
HORIZONTALDRIVE
TRIGGERSOURCES
Figure 1. Basic block diagram of the rapid-scanning spectrometer system.
79

The light to be measured enters the instrument slit and passes through a
Czerny-Turner type polychromator in which the light is broken spatiallyinto its component colors or wavelengths. This spectrum is then imagedon the target of a silicon-vidicon image tube. The target is an array ofmicroscopic photodiodes each of which detect light and store the signalin the form of an electrical charge. An electron beam then scans the
thousands of photodiodes to read their charge, thereby measuring theintensity of the total light that fell on them. lAThen the beam scans in
the wavelength direction, the intensity versus wavelength is read. Thesignals thus obtained are sent to a cathode ray tube for display as in-tensity versus wavelength. Since all of the diodes can receive lightinformation all of the time, it is possible to record spectral events at
different wavelengths simultaneously. This detector capability is calledthe multiplex advantage. If a transient event takes place very quicklywith respect to the scan time, its spectral distribution will still berecorded. The polychromator and the vidicon detector are all housed in a
single small box allowing measurement in some difficult locations.Further, fiber optics can be used to pipe light from the source to theinstrument slit.
Spectral observations have been made using a CFR engine through the
courtesy of Professor John Mingle at Oregon State University, Departmentof Mechanical Engineering. An insert was used in one of the many test
ports which contained a borosilicate window which allowed observation of
the visible light emitted during the combustion stroke. A fiber-opticprobe was affixed to this window cooled by forced air. The spectra ob-
tained consisted of two very distinct types: sharp spectra and broadstructured spectra. By wavelength position, two of the transient sharplines were tentatively assigned as due to sodium (589nm) and potassium(768nm) . This is reasonable since sodium and potassium occur due to dust
particles and dirt. The transient lines could be generated by strikingthe intake manifold largely confirming this interpretation. Many of the
remaining spectral features appear to be characteristic of the combustionprocess and appear to be molecular in nature. Some work has been done in
interpreting these spectra^ > > ^ , but with the capability of observing the
entire spectrum in real time, perturbation experiments may be possible to
confirm assignments or make new ones. Figures 2 and 3 are representativeof some of the spectra recorded. The sharp lines are most probablyatomic and the broader spectra are more likely to be molecular.
In looking toward future work, the observations could be made with more
efficient optical coupling to enhance the weak spectral features and to
use window materials that will allow wider spectral observations. It
appears that spectral observations can add effectively to the measurement
arsenal for the diagnostics of failures in both internal and external
combustion engines.
80

t t591 767
Figiire 2. Combustion spectriJin showing sharp lines due probably to sodiiom
and potassium. (wavelengths in nanometers)
f f t i f f
Figure 3. Combustion spectrum in the near infrared produced by the
combustion reaction. (wavelengths in nanometers)
81

1. Edwards, John B., "Combustion: Formation and Emission of TraceSpecies", Ann Arbor Science Publishers Inc., Ann Arbor, Mich.,
240pp., 1974.
2. Ehigo, R. , Nishiwaki, N., and Hirata, M. , "A Study on the Radiationof Luminous Flames", Proc . Eleventh Symp . (International) on Combus -
tion ,Berkeley, Cal. (Pittsburgh, Pa.: Combustion Institute, 1967)
p. 381.
3. Liebert, C.H. and Hibbard, R.R. "Spectral Emittance of Soot", NASATDN-5637 (February 1970).
4. Smith, D.S. and Starkman, E.S., "A Spectroscopic Study of the Hy-droxyl Radical in an Internal Combustion Engine", Proc . Thirteen thSymp . (International) on Combustion , Salt Lake City, Utah (PittsburghPa.: Combustion Institute, 1971) p. 403.
82

DISCUSSION
R. Lenich, Caterpillar Tractor Company : Do you foresee picking up dirt
or silicon in an engine because of an air intake or air cleaner system?
J. M. Marrs : I'm not sure about silicon, but certainly sodium and
potassium are picked up. If there is dirt in an engine, there is going
to be sodium in copious amounts and that is probably the most sensitiveprobe for dirt.
H. 0. Northern, Detroit Diesel, Allison Division : Do compounds like
carbon monoxide and nitrogen compounds produce a recognizable signature?
J. M. Marrs : Carbon monoxide provides a recognizable signature in
absorption in the 2 to 14 micron infrared region. We are not operatingin that region. Our detector isn't sensitive in the infrared. However,most carbon monoxide analyzers work by looking at the approximately 1900wave number absorption spectrum of that species. There is a possibilityof measuring emission spectra of nitrogen ions and nitrogen oxides in
the combustion process, and this is one of the things we want to look at
in further research.
R. Hohenberg, Mechanical Technology, Inc. : Does the quartz fiber giveyou limitations in the spectra that you observe?
J. M. Marrs : It doesn't limit us in the spectral region so much as it
does in the absolute level that we can see. There are losses in thefiber optics at all wavelengths uniformly over the range of theinstrument. It would be best, of course, if you could use direct opticsrather than fiber optics. It would be very desirable to try to
determine the emissions from combustion reactions. The emissions arequite weak and would probably require a very efficient coupling into thechamber. Fiber optics would probably lessen the possibility of seeingthe emissions.
C. R. Garbett, Shell Development Company : The width of the spectrum is
very limited with your instrument. Can you spread this out so that youmight be able to observe' various molecular species, the free radicals,and things that would be of great interest to the people working oncombustion? Could you in effect take a small range of the spectrum andspread it out across the whole of your scale and look at it in detail?
J. M. Marrs : You can optically disperse the spectrum to a greaterdegree. The videcon will have about 100 resolution elements across itregardless of how much spectrum is displayed across it.
C. R. Garbett : Not 100,000?
83

J. M. Marrs : No, not 100,000, but lOO". If there are 4 nanometersacross the videcon, there will be 0.04 nanometer resolution. My feelingis that under the conditions of combustion in which there are manyatmospheres of pressure, you have pressure broadened spectra. It is
virtually impossible to resolve such things as vibrational androtational lines because the molecules are under such pressure. Theyare virtually continuous from the start with the exception of the singleatomic elements which are also pressure broadened. The molecularspectrum would be broadened to the point where it couldn't be resolvedeven if the instrument had the resolution.
0. E. Compton, Northrop Corporation, Aircraft Division : Does thespectrum change quite radically as a function of the air/fuel flowratio; that is, the burning mixture itself?
J. M. Marrs : Where we have observed this near infrared spectrum, thereis no radical change in the spectrum as the mixture is changed. On theCFR engine you can change these things while you are observing. Therewas no radical change that I could observe other than a change ofoverall intensity. When we went to a very rich mixture, the nearinfrared portion virtually disappeared, although the visible light couldstill be seen. When we went to a very lean mixture, the same thingoccurred. But in the middle region and in the area that is consideredoptimally tuned, the intensity seems to be at its maximum.
0. E. Compton : How about the oxides of nitrogen? Do they vary as a
function of the combustion ratio itself?
J. M. Marrs : Yes, they do. The higher the temperature of thecombustion the greater will be the fraction of the oxides of nitrogen.You can get that information without looking at the spectra butironically it turns out that when the engine is optimally tuned forperformance, the output of the oxides of nitrogen is maximized.
J. W. Forest, Ontario Hydro : What is the physical size of the 2500square array?
J. M. Marrs : It's about an inch and a half round. The diodes are about25 micrometers apart, so the electron beam actually addresses about 3
diodes at a time. As far as practicality is concerned, it is continuousbut if you look in the microscope you can see the individual diodes.
D. B. Board, Boeing Vertol Company : Do you plan to evaluate this
technique on a gas turbine engine?
J. M. Marrs : Well, that draws an interesting comparison betweeninternal and external combustion engines. The reactions that go on in
internal combustion engines are free radical reactions and many of thespectra that are expected will probably be there. In externalcombustion engines the reaction is largely an ionic one which might give
8i+•
,. -

rise to very different kinds of spectra. We haven't looked at a turbine
engine, but we plan to.
D. B. Board : Would this be a suitable device for measuring temperature?
J. M. Marrs : That is a possibility. I have done some very brief
reading about temperature measurement using sodium as an internal
standard, and it sounds possible.
D. B. Board : If burning is taking place in combustor liners or turbine
blades, can spectral lines be obtained from the burning elements as they
are ionized?
J. M. Marrs : If the metal gets into the plasma and is excited, I would
expect a characteristic emission. Spectral lines will be obtained if
the emission is intense enough and is within the spectral range of the
instrument.
D. B. Board : Have you to date encountered any problems in the
attenuation because the window gets blackened after a period of use?
J. M. Marrs : Yes, it does attenuate it as it runs. In the internalcombustion engine, we found that for some of the super fuels the windowdoesn't get very dirty, but when you switch over to a pure iso-octanemixture, the window blackens very quickly. So in an internal combustionengine, it is a problem. We still see spectra; they are justattenuated.
R. Hohenberg : I just wanted to say a gas turbine is an internal
combustion engine with continuous combustion rather than intermittantcombustion
.
J. M. Marrs : But if it indeed does have an ionic mechanism, there is a
very distinct difference.
R. Hohenberg : That's right, but the question really is, is the ionicmechanism associated with continuous versus intermittant combustionrather than internal versus external combustion.
M. Dow, Eastern Airlines : Did you get some feel for how long this high
excited state would exist, for instance, in a jet engine?
J. M. Marrs : Molecules which fluoresce typically fluoresce within a fewnanoseconds after they are excited. In an engine, however, the plasmalifetime is quite long compared to that. A sort of steady state ofemitters is generated even though each one will have an average lifetimeof a few nanoseconds. The results are the average of a large number ofexcited molecules and not of a single decay.
85

M. Dow : I was thinking about the physical position along the length ofthe engine. You want to look right at the hottest point, not ten feetback, right?
J. M. Marrs : Yes, it would occur only in the combustion chamber andwould disappear long before it would ever exit.
86

PANEL DISCUSSION : Planning and Executing Experimental Verification
F^anel Moderator : R. Hohenberg, Mechanical Technology, Inc.
Panel Members : D. R. Houser, The Ohio State UniversityG. J. Philips, Naval Ship Research & Development CenterR. L. Smith, Shaker Research CorporationL. H. Emery, National Highway Traffic Safety Admin.J. M. Marrs, Tektronix, Inc.
R. Hohenberg : This panel discussion will revolve around a problem that
we all face. We are looking for detection, diagnosis, and prognosistechnology, and a consistent stumbling block is the demonstration ofpayoff. Well, that is kind of blunt and crass but really that's thepurpose of the technology, to pay benefits back for the doing of the
work. This payoff has to be demonstrated and it has to be demonstratedby an experiment which is hopefully planned. I say hopefully because wehave seen so often that the statistical problem, the probabilisticcomparisons which are necessary, and the human element which is
introduced into these experiments tend to upset them. Most of the timemany of the experiments that have taken place to demonstrate the payoffof DD&P have resulted in reports that invariably say: 1) the experimentis a success - we have got to call it a success, otherwise why bother to
write it up; 2) unfortunately some very necessary data are not availableat the time of the conclusion of the experiment; and 3) let's do it
over again. Well, I think it's worthwhile to discuss what we can do to
plan experiments so that when they are concluded and the reports are
written, we don't have to do them over again.
R. L. Smith : DD&P experiments sometimes do lead to meaningful results.The problem then is to convince management to implement your system andsometimes they are not willing to put out the money. The dollar levelshown to them is not convincing enough, so you have to sell thediagnostic system more than just telling them of the numbers.
R. Hohenberg : How do you design an experiment that overcomes an
inherent problem such as avoiding failures in a population which is
usually very large? There is no sense going into diagnostics ofmachinery unless there is some substantial population. You want to showthat if you didn't have the diagnostic equipment, more money would havebeen put out "co maintain the machinery. And you somehow also have to
figure in the problems that are incurred due to the false alarms thatmay be created. How does one set up the experiment? The laboratoryexperiment is probably the easiest part in demonstrating that a
particular mechanism has some benefit. It is more difficult to go to
the next step of boxing it up neatly and putting it into service. Howdo you plan for that?
87

L. H. Emery : In any project that I have ever been associated with, youalways, without exception, would have done it slightly differently ifyou could do it over again. It's probably impossible to anticipate all
of the problems that are going to occur and it's also very difficult to
get all the answers when you need them as you progress. It happensquite frequently that you make some decisions along the way based oninsufficient or unavailable information.
G. J. Philips : Rudy, if I understand what you are saying, an engineerhas to be a reactionary all during the course of his experiment. No
amount of super planning is ever going to make every experiment a total
success. There are always going to be failures and unknown factorscropping up during the test. These factors must be evaluated and theymay change the course of the experiment. You have to maintain a certainflexibil i ty.
D. R. Houser : In the diagnostic avenues, a lot depends on the cost of
the test equipment. If you want to determine all the failures in a
whole helicopter, the experiments are much more expensive than forexamining one bearing. And the statistics become qui te *different. Astatistic of one is not very valid. There are means of analyzing orbuilding experiments statistically which can reduce the total number of
tests you have to conduct.
J. M. Marrs : Many times a diagnosis seems like the horse-out-of-the-barn type detection. The failure has taken place. In many cases duringfailure analysis, you get information about the cause of failure and
will be able to change some procedure which will then eliminate thesefailures. Therefore failures may be prevented rather than justincreasing the efficiency with which they may be detected.
R. Hohenberg : There is a school of thought that says that if you spendall the effort that is now spent on failure avoidance and failuredetection in improving the basic design, you just won't have anyfailures at all. And then there is the opposing school of thought whichsays there is no way of avoiding all failures and that it becomesdesirable to make an effort to detect a defect at a time when the burdenof the failure is not yet fully realized. You can detect a failure in,
say a gear, while the gear is still functioning. A crack is there, butthe gear is performing its useful function before the catastrophicfailure has occurred and the damage causes loss of life or terminationof function of the whole machine.
A. J. Hess, Naval Air Test Center : We are using a diagnostic systemthat the Navy has developed for its A7-E aircraft that is statisticallyand cost effective. We have reached a point in the development of oursystem where we are about ready to implement it in a fleetproduction-type program. We have gone through a very extensive,sometimes careful, sometimes not too careful, data base expansion and
preproduction evaluation program. As we are developing the system wetry to collect the statistical data necessary to prove that the system

is cost effective in an actual fleet operational environment. We have
ten A7-E aircraft with this in-flight engine condition monitoring system
on board the Enterprise right now. It has been deployed since last
November and it had been operating in naval squadrons for about eightmonths previous to last November. We have over 5,000 actual operational
hours in a fleet environment and we have big lists of finds that the
diagnostic system has discovered - engine discrepancies which normal
maintenance did not find. We have tracked these finds throughmaintenance actions and verified a list that was valid and a list thatwas invalid. Right now we are in the process of putting dollar figureson where we saved in two different areas. One is a possible savings ofaircraft since this is a single engine airplane. The second is the area
of maintenance and logistics. You can put dollar figures on maintenanceman-hours saved at the line level and at the depot level. You can also
put dollar figures on secondary damage saved and on the logisticsproblem. Hopefully, within two or three months we will have datapublished to be used to verify that this system is cost effective. We
ran into problems in setting up the program, and some of the things welearned are unique in the development of a condition monitoring systemwhich don't have to be rel earned for the next one when it goes into its
preproduction evaluation.
D. B. Board, Boeing Vertol Company : In the past year, one of the
mistakes that has been made in our programs was not determining beforewe started a test whether we were trying to demonstrate diagnosis orprognosis. Far too many reports come out with conclusions that makeimplications about prognostic capability when the only real testing thathas been done that is valid statistically is diagnostic. We seem to saythe real measure of a diagnostic system is whether it detects defects.When we find an indication of a defect, we never ask ourselves what its
meaning is. It is only meaningful if we know the probability of
obtaining a false indication from a part without a defect. Of evengreater importance is determining the probability that the defect couldnot be found. We always go around measuring the probability of findinga defect of a known size. Very infrequently do we really plan theexperiment so that we get information that tells us how likely it is
that we would have indicated that something was wrong if it was not.
That is a statistical problem and it requires a lot of testing. Youcan't afford to do a lot of testing on expensive machines, so you haveto find cheaper ways to do it. First of all you have to realize whetheryou are doing diagnosis or prognosis. Then you have to design yourexperiment so that it has enough of a statistical basis so that you aregetting both of those reliability or accuracy probabi 1 i ties - not onlythe probability of finding the defect when it's there, but theprobability of saying it's there when it is not.
89
p. L. Howard, SKF Industries : One major problem is going after a
symptom that was thought to have caused a failure. In a diagnosticapproach, it is necessary to define what is being looked for. A verynice diagnostic technique can be developed to look for a defect thatdoesn't mean anything in the overall running of the system.
D. B. Board : I concur completely. That is one of the toughest nuts weare eventually going to have to crack. Tied to the problem of what'simportant to detect is the problem of what are the failure progressionrates. We can pretty much say what the consequences are going to be if
a gear breaks in half or a bearing starts to seize, but we really knownext to nothing about failure progression rates in all of the thousandsof different applications that machines run under.
R. Lenich, Caterpillar Tractor Company : I agree with Mr. Board. Themanufacturer talks about' diagnosis and the customer really isn'tinterested in diagnosis unless he has to be. What he is interested in
is prognosis. You can only have prognosis if you have some kind of a
deterioration rate. Things that break you can't prognose. The customerknows it, he has detected it, the machine has stopped, and he reallyisn't interested in spending money on diagnosis. He is interested in
having a machine that will run until some overhaul period. At thatpoint he doesn't mind seeing cracks or pits in gears and cracks in
weldments provided they haven't broken or damaged the machine. He
considers this a good prognosis because he can correct the problem atthat point. There must be a certain percentage of problems beforepeople will use diagnostic equipment. The customer really wants productreliability and he expects the manufacturer to do the testing before it
is put on the market. What the customer is interested in is prognosis,and he would rather have it on vehicle. It rings a bell and tells theoperator to stop the machine, and at no cost increase except maybe $3.00for a transducer that will last 10,000 hours.
R. Hohenberg : I think you've pointed up something which is verysignificant; that is, we are talking about two different things. One is
verifying that the condition of a new part is acceptable, which is an
inspection procedure. The second is a prognostic procedure whichdetermines if a part has a reasonable amount of useful life left.
0. E. Compton, Northrop Corporation, Aircraft Division : One of the
weaknesses of our industry is that we too frequently do not issue the
proper software, or make an adequate study of the software, that goes
along with the testing device. The problem is - how well does the
software support the individual doing preventative maintenance?
U. Sela, Exxon Company, USA : I would like to talk as somebody that has
been involved with three phases: (1) sitting in a lab and looking at
phenomena which could be used to find out something, (2) having been
associated with- one who tried to develop a system such as signatureanalysis, and (3) trying to use some of those systems or some of those
phenomena. The real question is: (a) what is going to fail, and (b) so
90

what? I tell them that I found all these wonderful things with my
wonderful technique. Those gears are seeing 10, 15, 20, 25 g's, the
side band ratio is such and such. The question is, can it run, for how
many months will it run? Who knows. Then they ask me what happens when
it breaks? What position will we be in? What will the damage be? Howlong will it take to repair? What is still needed is to be able to
translate the signal into an actual stress so that we can make a
calculation of what the safety factor of the part is and maybe later
determine when failure may occur. I feel frankly that with all that weare learning I am no better off today than I was ten years ago.
J. A. George, Parks College of St. Louis University : I disagree with
the chairman's comment that we are interested in finding such things as
spalls, pitting, corrosion, etc. The component may last many operatinghours with these defects. We are right back to what Mr. Sela said -
when is it going to fail? In spite of a lot of the work that has beendone in many systems, we still don't know how to design a properexperiment for prognosis. One method could be to run to failure.
That's kind of difficult if you put a bad gear or a bad bearing in a
helicopter and tell the pilot to run this to failure. So you do it in a
laboratory. Unfortunately, the mechanisms that we are interested in are
more complicated than simple gears meshing together. There is a
difference between laboratory experiments and those involved in an
actual operating condition. You have got to collect the data in a real
1 ife environment.
R. Hohenberg : John, I just want to defend myself a little. I did saythat it is desirable to detect spalls, but that is at the inspectionlevel when you are trying to make a part as good as it should be whennew. There is a different level of detection in the field when themachine is already running, when you are trying to decide when to stopit. There is a time when you want to detect minute defects and there is
a time when you want to detect precursors of catastrophic defects.
J. A. George : My point is, maybe the quality control is too rigorous.Maybe we can stand some of these minor pittings and spalls and yetfulfill some reasonable operational lifetime. Maybe we are trying to
make it too perfect.
H. U. Burri , RCA Corporation : What we have been talking about is
providing some sort of a magic black box which, when attached to someexpensive piece of equipment, will act as a nurse and take thetemperature of the patient constantly. Who checks the nurse? I do knowthat electronic equipment has a tendency to fail. There is a real
problem there to make sure that we do not get false alarms or misseddetections or fails just because the test equipment has failed.
91

R. Hohenberg : I think it's a very good thing that you brought that up
because it leads us directly to the human interface which does warrant a
lot of attention. Any diagnostic equipment must operate to thesatisfaction of people, and these people are not scientists, they're notengineers, they're not the owners of enterprises, they are mechanics.To make them satisfied that the equipment is doing the job that it is
supposed to do, ideally you want three lights - a green light that says,"Yes, this equipment is fine, leave it alone," a red light that says,"No, stop the equipment, there is a malfunction impending," and a yellowlight that says, "The monitor is sick, the nurse is sick."
J. S. Bendat, Independent Consultant : I think there are many aspects to
this problem that are being raised simultaneously which is causing someconfusion. If you are trying merely to monitor some simple component -
bearing, gear, etc. - you're collecting data at one point and looking ateither its spectrum, or some other time history, by visual or some othersimple method determining whether a change has occurred. On the otherhand, if you are trying to analyze more complicated subsystems such as
diesel engines, or motors in general, or if you want to analyze largersystems such as automobiles and airplanes, etc., you need to look at the
problem from a much broader viewpoint as a multiple input-output typeanalysis where there are many excitations occurring at many pointsproducing many responses at other points. In all of this work, there is
a requirement for practical experience in addition to any mathematicalmodeling or statistical techniques. However, I would like to note thatthere are many techniques available for analyzing periodic and randomdata which are not being utilized as fully as they should. Any resultsthat are obtained should always be qualified to indicate that they arefrom a particular experiment and were collected under certain conditionswhich are not likely to be duplicated. If anybody is to usefullyinterpret these results, there should be some confidence bands insertedstating that the results could be significantly different at some futurepoint in time. If either single point or multiple input-output typeanalysis is conducted, you can get results which not only will be betterfor diagnostic purposes, but which also will be a lot more useful for
prognosis. I would like to find out if anyone here has worked on someof these larger problems where they are collecting a lot of datasimultaneously and trying to unravel all the various interactions and
effects that are taking place.
D. N. Fry, Oak Ridge National Laboratory : This is exactly the problemthat we are tackling right now in connection with detecting failures in
nuclear power plants. Our primary work is not necessarily with rotatingmachinery, but with failures of structures connected with core
components in the nuclear reactor itself. We are presently trying to
apply pattern recognition and signature analysis techniques to multiplesignal inputs. Part of the problem is to include in the total analysisthe error associated with each measurement, so that the algorithm that
makes the decision on whether the particular data you have just taken is
either normal or abnormal. This takes into account how much data
92

you already have and what the confidence is on the base line signature
that you presently have. We are probably not the first ones to do this.
I think it's in common use, but we really haven't heard much about it
here today.
J. W. Forest, Ontario Hydro : It seems that there is a conflict in the
goals which we are trying to establish. There is emphasis placed on
diagnosing a defect and there is also emphasis placed on saying how long
.a component will function (prognosis). The conflict comes from not
being able to tell how long something will run until it fails. I have
some experience with a vibration monitoring system in a nuclear powerplant and on rotating equipment. One of our problems is of a
statistical nature because no two failures are going to be the same even
if they are the same component. It's quite a task. I think the people
that are asking for the quick answer of prognosis are going to have to
wait a long time before it's resolved.
A. J. Hess : I'd like to comment on two of the points that were broughtup. First is the system/human operator interface. When we firstintroduced the lECMS system to a fleet type environment, the pilots andthe maintenance operators didn't like it much. From a maintenancestandpoint, it was an additional engine subsystem which they had to
maintain and caused them to perform extra maintenance on the engine.What they found out later was that by using the lECMS system they werebetter able to maintain their engines. The statistical data that wegenerated showed that more maintenance was performed on lECMS equippedengines than on engines not so equipped in about the same number ofmanhours. From that you can deduce that the engines were perhaps bettermaintained in the same amount of time. Initially the pilots did notlike this diagnostic system flying along and recording data and actingas a tattletale on how they operate the engines. But as they used thesystem, they experienced situations where the lECMS system verifiedengine gripes and it enabled the pilot, the operator of the aircraft, to
interface better with the maintenance department to prove that he wasright in situations where the maintenance department said he was wrong.And conversely, we have had situations where the system verified a pilotgripe as being wrong, but saved lots of unnecessary maintenance on thatengine. The initial interface between the human and the system becomesa question of confidence level. The only way that you can build up thisconfidence level is to let them have the system and use it in an
operational environment. That's what we did and that's what weexperienced. The chairman made an interesting point when he mentionedthe three lights. We have three lights in the cockpit; one is toindicate that the system is not operating and to ignore it, the othertwo indicate that something is wrong with the engine. The other pointthat was brought up that I would like to comment on is how to handle a
multitude of inputs from different types of diagnostics. The lECMSsystem does several different types of diagnostics such as vibrationanalysis, gas path analysis, exceedance limits, and oil quality. The
95

only way you can realistically handle all those inputs is by some typeof computer software diagnostic logic routine. That's the way we triedto do it. We expended our greatest effort in developing softwareroutines, not in developing the hardware.
P. L. Howard : In summary, the diagnostic manufacturers, as they have in
the past will now and probably forever, say that the success of theirsystem is based upon the detection of some fault. Not even the
diagnosis but the detection of some fault. The user will say thesuccess of the system is in saving some catastrophic failure, and I
think they will stay apart until the significance of the fault and its
relation to a catastrophic failure can be demonstrated.
9h

SESSION II
CASE
HISTORIES
Chairman: P. L. Howard
SKF Industries


SONIC ANALYZER - CASE HISTORY
John L, FrareyShaker Research CorporationNorthway 10 Executive ParkBallston Lake, N.Y. 12019
Introduction
The sonic analyzer was a diagnostic system aimed at detecting mal-
functions in gas turbine engines and helicopter transmissions prior to
catastrophic failure. The program was active under several sponsorsduring the 1960 's and early 1970' s. For a part of the time the overall
program was active, two parallel, competitive programs were conductedby Curtiss -Wright and the General Electric Company. At the first MFPGMeeting in April, 1967, both companies described their approach to
sonic analysis of gas turbine engines.
The purpose of this paper is to examine what can be learned from the
program experience, particularly in those areas that are common to to-
day's diagnostic programs. In order to do this, the Curtiss-Wrightapproach will be briefly described, its success analyzed and threespecific program areas that emerge as significant when the program is
reviewed with perfect 20-20 hindsight.
Sonic Analyzer Concept
Sonic analysis as employed is the same as today's vibration signatureanalysis except that microphones were used rather than accelerometers
.
The discrete character of the frequency domain spectrum is analyzedand characterized. Most discrete frequencies can be associated withrotating components in the machine. Three types of signal characterchanges were considered significant. They were changes in:
AmplitudeHarmonic ContentModulation Character
The kind of changes that were looked for are illustrated in Figure 1
which compares the spectra of two hypothetical engines, one healthyand the other side with the above three symptoms. The oil pump sig-nal at approximately 1500 Hz illustrates the increase in amplitudesymptom. The appearance of the thrust harmonic of the fuel pump at
approximately 3000 Hz illustrates the harmonic control symptom and the
appearance of side bands on the compressor blade passing signal at ap-proximately 1200 Hz illustrates the modulation symptom. This type ofanalysis is still valid today and was considered quite advanced in the
early 1960's.
97

Figure 2 is a block diagram of the hardware built to implement the con-cept. It is a standard heterodyne analyzer with two exceptions, thephase lock loop and the frequency ratio synthesizer. These two circuitsallowed the analysis of the signals as a ratio of engine speed and thusindependent of RPM. Again these two circuit developments as related tovibration analysis were significant advances at the time. Figure 3 is
a photo of the sonic analyzer as used in the field. The unit shown in-cluded a paper tape reader that allowed full automatic operation of theanalyzer, another advance. The unit was portable, however, it obviouslycould benefit from today's integrated circuit technology. Also, today,a laboratory receiver of the analyzer with superior characteristics canbe constructed from off the shelf instruments.
Over the period of its use, the analyzer was applied to the followingengines and helicopter transmissions.
Engines Helicopter Transmissions
J-65 UHl
J-57 CH46J-79 , . CH47J-52
JT-30Jt-80
Results
Probably no two people associated with the program would agree on a
rating of the success of the sonic analyzer. The safest thing thatcould be said is that it would detect some of the defects claimed for
it on many of the engines and transmissions listed above. The purposeof this paper is not to rate the success of the program but rather to
review what can be learned from it and applied to other diagnosticprograms. The following three characteristics of the sonic analyzerprogram are common to every diagnostic program.
1. Laboratory Vs. Field Testing2. Human Operation Skill and Bias3. Assessing the Batting Average
These three characteristics are briefly discussed below and will be ex-
panded upon in the presentation.
1. There probably is some optimum mix for a given program between lab
and field tests. The sonic analyzer program would have benefited bymore laboratory testing. For example, mechanical impedence tests to
determine signal transmission characteristics and coupling coefficientsto the air may have clearly identified the detection of some defects as
impossible. Almost all diagnostic programs that have advanced too
quickly toward field condition have failed or had to return to more con-
trolled conditions.
98

2. If an analyzer operator who has a very good understanding of the en-
gine under test and the analyzer, consistently gets better results than
one who simply follows directions; then this is an indication that the
programmed limits alone are not sufficient.
3. Specific ground rules on how to grade the diagnostic system must be
implemented. Comparison with the parts replaced at overhaul is a veryunsatisfactory way of grading a diagnostic system. A significant pro-
portion of the cost of any diagnostic system evaluation lies in this
area.
99

LIN
1.0
0.8
Ob
0.4
O.Z
750 1000 1250 1560 1750 2000 2250 2500 27J0 30C0 3250
FREQUENCY Hz
SPECTROGRAM OF HYPOTHETICAL ENGINE OPERATING NORMALLY
LiN
1.0
0.8
0^
0.4
0.2
150 1000 1250 1500 1750 2CdO 2250 2500 2750 3C00 3250
FREQUENCY Mr
SPECTROGRAM OF HYPOTHETICAL ENGINEOPERATING WITH FOUR MALFUNCTIONS
FIGURE 1
100

INDICATOR
oHOuHWQ
+oo
FREQUENCY PJ^TIO GENERATOR
BALA MODUI
CM
WPi
BM
O
ACH. ICAT
H
101
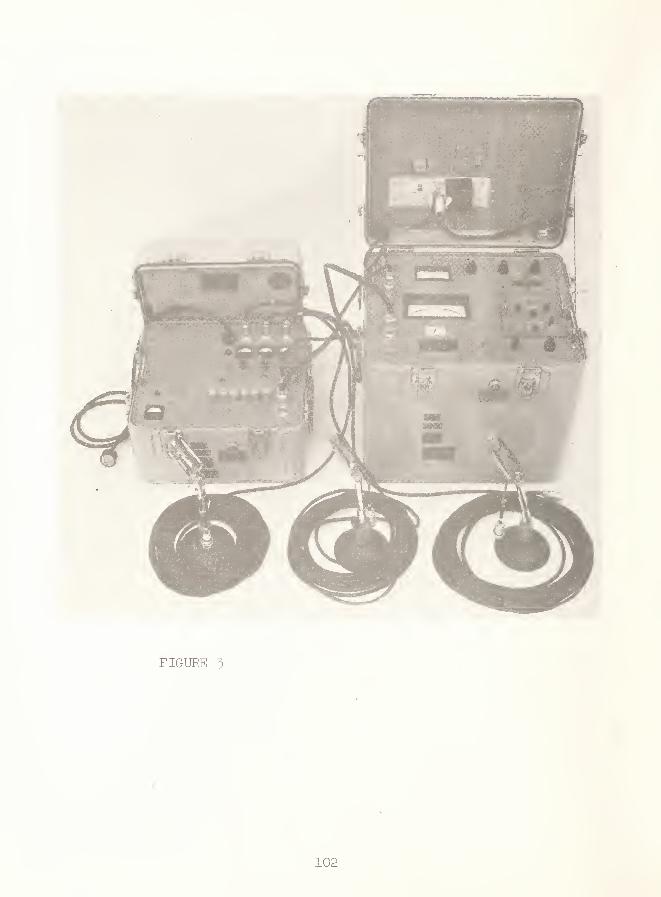
FIGURE 5
102

DISCUSSION
W. K. Mathison, Puget Sound Naval Shipyard : If you had the chance to
start again today with gas turbine engines, would you use the sonicanalysis again, or a vibration analysis, or something else?
J. L. Frarey : I would use anything I could lay my hands on that mightgive me a hint as to what was going on inside the engine. The problemwith the sonic analyzer has been that very early in the game, we trappedourselves into exclusive use of the microphone because it was very easyto use. It was very easy to put a microphone next to an engine comparedto screwing on an accelerometer or trying to bury something, or open a
port, or this type of thing. Sonic analysis would work in some places.I think that it should have been implemented all along with additionalaccelerometers.
105

OIL ANALYSIS IN PERSPECTIVE
Richard S. Miller; Lt, USN
Arlington, Virginia 22217
Detection of component malfunction in lubrication and hydraulic sys-
tems, prognosis of the course and remaining system life and possiblediagnosis of the type(s) of failing component(s) have been the primaryobjectives of most oil analysis activities. Several previous MFPG papers
and one entire meeting were aimed at describing the transfer of spectro-metric oil analysis methodology in the 50 's from industrial internal com-bustion engines to rotating machinery, the success of this methodology,and a description of non-spectrometric oil analysis techniques (1, 2,
3, 4). My objective is not to overview these papers but to review the
methodology of current oil analysis activities to indicate its weaknesseswith respect to future lubrication system design and reliability and to
indicate changes that appear to be desirable to provide meaningful "oil
analysis" services to future high performance equipments.
Oil Analysis MethodologyPresent "oil analysis" methodology may be subdivided into three
parts. The first phase is sampling which assumes, sometimes mistakenly,that the oil and the particulates in it are representative of those in
the system. The second part, composition determination, is accomplishedin a calibrated commercially available instrument; this wear metal con-centration data, along with available information such as operatinghours since the last sample, and oil change or addition data, is thenused by the "oil analyst" to infer that the rate of production of metalin the system is increasing, decreasing, or remaining the same. The oil
analyst effectively makes periodically updated estimates of the wearmetal production rate based on this data. Ideal ly, concentration , con-centration change with time, and possibly oil consumption/addition data,are inputted by the oil analyst into the equation in Figure 1 to obtain
the metal production rate. If the filter in the system is removing but
a small fraction of the particulates that are formed, (i.e. the filtra-tion rate is small), the rate at which particulates are settling to
sumps and the rate at which dissolved metal is depositing on the system'ssurfaces are low, then the "oil analyst" can make a fine prediction ofthe wear metal production rate, its change with time, and a reliableassessment of any change in machinery condition.
The original success of the analyst in predicting problems in diesel
and other systems engines which are generally equipped with coarse fil-
ters (40 + micron) therefore is understandable. However, others such as
the hydraulic systems, which are installed in Naval aircraft and whichare equipped with relatively fine (5) micrometer filters, are not as
responsive to conventional oil analysis methodology. As a consequence,the spectrometers are not sensitive to the small concentrations of parti-cles present in the system and the comparatively slow rate of change ofmetal concentration with time, even when the system is wearing at abnor-mal rates. Unfortunately for the "oil analyst", this trend is continuing

because machine designers are beginning to recognize the benefits to be
obtained by specifying filters that remove a high fraction of particu-lates which can be deleterious to the life and reliability of the equip-
ment. For example, the T-700 engine developed for the UTTAS helicopteris to be equipped with 3 micron filters originally tested on the T-53engine (5, 6).
Particle Size/Concentration and Machine Reliability/Life RelationshipsExamination of the relationship between particle size, concentration
and machinery reliability and life is best begun by comparing particlesize and lubricant film thickness as a function of application for naval
equipments. I have chosen aircraft derivative bearings and gears, hy-
draulic system components and journal bearings typical of those support-ing steam turbines as extremes. As may be seen in Figure 2, the filmthicknesses in these equipments range from 0 - 0.1 micrometers to 25
micrometers and installed filtration capability begins to compare favor-ably with film thickness only in the hydraulic and steam turbine journalbearing application. Only in the case of the steam turbine journal appli-cation can sufficient particulate matter be expected to be in suspensionto be truly susceptible to spectrometric analysis and at the same timenot be deleterious to the mechanical system. These conservatively de-signed systems are inherently very reliable and are not a priority itemfor oil analysis. The aircraft hydraulic system, because its slidingcomponents are very susceptible to deterioration by particulates and
therefore is much less reliable, is equipped with efficient filters and
renders spectrometric analysis almost ineffectual. Only in the case of
the aircraft bearings and gear systems is the lubrication system suscep-tible to spectrometric oil analysis because they are not now equippedwith efficient filters. The extent of the application of spectrometricoil analysis will decrease as finer filters are installed in these sys-tems to increase life. Preliminary evidence indicates bearing lives and
presumably the lives of these film gears can be increased many times byusing effective filtration techniques (7).
To illustrate the relationship between wear particle size, concen-tration detection limits, wear particle-surface interaction rate and sur-face damage, consider the following (Figure 3). A part per million ofiron as iron oxide particles with a one cubic micrometer volume in oil
results in a particle number density of approximately 400,000 particlesper cubic centimeter. A part per million represents 1 gram in approxi-mately 275 gallons of lubricant or, in other more familiar volumetricterms, 1 drop of vermouth in 16 gallons of gin (Figure 4). A part permillion of iron in oil is below the sensitivity of Navy emission spectro-meters which actually are not sensitive to concentrations below 2 partsper million (2000 parts per billion). In an el astohydrodynamic contactof a ball bearing with a micrometer film operating a surface velocity of1000 in/sec, the particle interaction rate with ball is approximately 1
per second. At a film thickness of 0.1 micrometer, the passage of a
boulder 1 micrometer in size would occur on the average of every 10 sec-onds. Experimental evidence indicates these presently unfiltered parti
-
105

culates slowly but surely interact with the surface and initiate surfacefatigue cracks, a fraction of which propagate into the interior of thebearing surface and thereby limit life. In addition, skidding damage to
future high DN aircraft turbine bearings during thrust reversals willprobably be aggravated by particulates.
Oil analysis using today's methodology and tomorrow's spectrometrictechniques, such as atomic fluorescence in well filtered systems will notimprove the situation appreciably because most of the wear debris will bein the filter. However, the detection limits for iron of atomic fluores-cence spectrometers equipped with flame atomizers and pulsed hollow cath-ode lamps is 6 X 10"^ parts per million, which is a significant improve-ment over emission spectrometers in use today (8).
Oil Wetted Surface Condition Monitoring/Options for Future LubricationSystems
The application of filters efficient in the 0.1 to 1 micron rangein hydraulic and lubrication systems will require that current oil anal-ysis methodology and instrumentation be abandoned or changed. An oil
analysis system using today's methodology and spectrometric instrumen-tation sensitive in the low parts per billion range will only rely onthe presence of newly created wear metal particles, the small number of
statistically available particles that have previously oassed thrnuah thefilter, and changes in soluble metal compound content to detect abnor-malities in the lubrication system. Abandonment of these oil samplingand analysis procedures and introduction of inline detectors, althoughpresently unavailable, to detect the concentration of the available weardebris or wear debris and dissolved metal and to provide time averagedconcentrations and approximate wear metal production rate data, is a
second alternative. However, attempts to use light scattering, highenergy fluorescence, capacitive, and neutron activation detectors whichhave been developed or proposed, or even inline Ferrographic devices forthese purposes, would be probably frustrated by the low wear metal con-centrations. As a third alternative, design into and installation ofcentrifugal particle separation devices in hydraulic and lubricationsystems would provide wear debris for microscopic and spectrometric anal-ysis, and would be desirable in some equipments. In other equipments,where redesign is not practically or economically feasible, new types offilters may provide the particle separation capability needed to improveequipment performance and life, and provide wear particulates for diag-nostic and prognostic analyses of machinery condition. High gradientmagnetic separators, which separate ferro or paramagnetic materials bymagnetic forces, may provide a measure of the desirable characteristicslisted in Figure 6 and are being evaluated for these applications.
To conclude, it is appropriate to mention the report of Alan Beer-bower's study of mechanical failure prognosis through oil debris moni-toring (5). Although the study was restricted to assessment of currentoil analysis methodology and suggestion for the improvement of oil anal-ysis techniques for helicopter transmissions, his recommendations are
106

generally applicable. Beerbower finds that nearly 100% of transmissionfailures could be detected rf spectrometric analysis is augmented by par-
ticle analysis of the larger particles which are collected by chip de-
tectors or the presently installed filters. Mr. Senholzi will indicatein a later paper how complementary techniques are being evaluated for
these purposes. Beerbower's report, in addition to providing the dataupon which to base his recommendations, provides a description of wearmechanisms, wear particle size distributions, and description of non-spectrometric oil analysis tools available today.
107

FIGURE 1
DEFINITION OF WEAR METAL PRODUCTION RATE
Y^ Y" + r
PRODUCTION = ACCUMULATION REMOVAL
dc + cdm-. + r
'dt dt filter
r + r
settling deposition
r r r
PRODUCTION, ACCUMULATION, REMOVAL - RATES OF METAL PRODUCTION IN,
ACCUMULATION IN, AND REMOVAL FROM THE SYSTEM (GRAMS/SEC)
m-i- MASS OF LUBRICANT IN SYSTEM, (GRAMS)
c - CONCENTRATION OF WEAR METAL IN LUBRICANT (GRAMS METAL/GRAM OF
LUBRICANT)
r r r - RATES OF WEAR METAL REMOVAL BY FILTRA-filter, settling, deposition
TION, SETTLING AND DEPOSITION MECHANISMS (GRAMS/SEC)
108

FIGURE 2
MOVING SURFACE SEPARATIONS
FILM THICKNESS FILTER CAPABILITYMICROMETERS MICROMETERS
GAS TURBINE BEARINGS, GEARS 0.1-1 10-40
HYDRAULIC COMPONENTS, AIRCRAFT 0.5-3 5
SHIP JOURNALS 25 25*
* ANTICIPATED
FIGURE 3
WEAR PARTICLE CONCENTRATIONS - 1 PPM IRON
1 GRAM IN 1,000,000 GRAMS FLUID
1 GRAM IN 275 GALLONS FLUID
500 BILLION PARTICLES IN 275 GALLONS
1.8 BILLION PARTICLES IN 1 GALLON
400,000 PARTICLES IN 1 CUBIC CENTIMETER
PARTICLES - 1 CUBIC MICROMETER OXIDE PARTICLES
109

FIGURE 4
i
, EMISSION SPECTROMETER SENSITIVITY
CONCENTRATION OF
IRON (PPM) READING (PPM) RANGE (PPM)
0 0 or 1 0-1
0.5 0 or 1 0-1
1 +1.
" 0-2
10 10 +2.2 8-12
100 100 +10.2 90-110
1 PPM = 1 DROP IN 16 GALLONS; 80 "FIFTHS"
1 CENT IN $10,000
1 INCH IN 16 MILES
1 MINUTE IN 2 YEARS
FIGURE 5
PARTICLE - SURFACE INTERACTION RATE
BASIS:
GAS TURBINE BALL BEARING CONTACT
25 METERS/SEC SURFACE VELOCITY
1 MICROMETER FILM THICKNESS
1 PPM IRON - 1 CUBIC MICROMETER OXIDE PARTICLES
RATE: 1 PARTICLE PER SECOND
110

FIGURE 6
IDEAL FILTER CHARACTERISTICS
0.1 - 1 .0 MICROMETER
HIGH DEBRIS CAPACITY
LOW PRESSURE DROP
PERMANENT FILTER ELEMENTS
WEAR PARTICLE RETRIEVAL FOR ANALYSES
NO EXTERNAL POWER
111

REFERENCES
1. Ward, J, M,, "Spectrometric Oil Analysis", Proc. of Mech. FailuresWorking Group 2nd Meeting, pp, 15-21, 1967, AD 721359.
2. McGowan, J. A., "Diesel Engine Maintenance Control by Oil Analysis",Proc. of Mech. Failures Working Group, 4th Meeting, pp. 10 - 12, 1968AD 721359.
3. Rumbarger, J. H., "Rolling Element Bearing Life Margin Testing ofFIRL and Correlation of Spectrometric Oil Analysis Results with LifeResults", Proc. of Mech. Failures Working Group 5th Meeting, pp. 14 -
15, 1968, AD 721359.
4. Sawyer, W. T. , "Proc. of the 16th Meeting of the Mechanical FailuresPrevention Group", pp. 1-68, 1972, AD 738855.
5. Beerbower, A., "Mechanical Failure Prognosis Through Oil Debris Mon-itoring", Contract Final Report Number DAAJ02-73-C-0094, USAAMRDL-TR-74-100.
6. Lynch, C. W. and Cooper, R. B., "The Development of a Three-MicronAbsolute Main Filter for the T-53 Main Engine", ASME Jour, of Lubr.Tech. 93F, 430-436 (1971).
7. Dalai, H.; et.al., "Final Report on Progression of Surface Damage in
Rolling Contact Fatigue", ONR Contract N00014-73-C-0464, Feb. 74,AD 780453.
8. V'inefordner, James D., "Atomic Fluorescence - Past, Present, Future",Chem. Tech, 123-128, Feb. 1975.
112

DISCUSSION
L. Enochson, Time/Data Corporation : You indicated that the methods
would have to be abandoned with improved filters. Why can't you justexamine what's in the filter after you tear it down for inspection? .
iM. Hoobchaak : It should be examined periodically and not just at filter
teardown because then you have to go into the system and possiblydisturb the system itself.
R. Hohenberg, Mechanical Technology, Inc. : You referred to a report byBeerbower. Could you give us more information on that?
M. Hoobchaak : The title of the report is "Mechanical Failure PrognosisThrough Oil Debris Monitoring." Beerbower has torn apart filters andlooked at the chips. He has also examined the debris in magnetic debriscollectors. He was able to detect almost all the failures whichoccurred because large particles were found which were indicative ofvery imminent failure in the transmissions.
P. L. Howard, SKF Industries : That paper points out one of the problemsthat diagnostics people continually face. When a diagnostic systemindicates a problem, corrective action is usually taken. The correctiveaction quite often reduces the effectiveness of the diagnostic system.
115

INSTRUMENTATION FOR PREDICTIVE MAINTENANCE MONITORING
Ralph James, Exxon Chemical Co.,Baytown, Texas 775Z0
BACKGROUND
Plant tests conducted by Exxon Chemical Company U.S.A. and The BoeingCompany in 1972 and 1973 at Baytown, Texas demonstrated the applicabilityof onstream acoustic measurements to diagnose the condition of processequipment. The basic high-frequency acoustic techniques for predictivemaintenance was reported at the 28th Annual ASME Petroleum MechanicalEngineering Conference, September 17-20, 1973 at Los Angeles, California.^In general, the mechanical "electrocardiagrams" studied during thesetests were shown to be effective for early detection of small defects in
bearings and gears, growing cracks in shafts and weld joints, looseparts, and operating deficiencies such as pump cavitation. However, themonitoring and interpretation of the data was manpower intensive and
could not be economically justified on a plant wide basis. Therefore,to utilize this technology it would be necessary to automate most ofthe data comparison; indicating service caused flaws and detrimentalchanges in rotating machinery.
SYSTEM DESIGN PHILOSOPHY
(1) Ultimate Goal - Provide meaningful early indication of impendingi^ailure of critical process equipment so that: (a) corrective actionscan be taken, or (b) provide enough lead time so that the majority of re-quired maintenance can be performed during planned, scheduled shutdown,or (c) for the case where there are no scheduled shutdowns, productioncan be continued until the "final hour" with minimum probability of a
catastrophic failure.
(2) Payout - Provide a minimum calculated benefit to cost ratio of 1.5
to 1. Estimated benefits were based on a statistical analysis of plantfailure data-assuming a cost differential credit for predictive mainte-nance planning, increased mechanical availability, material and laborsavings from a reduction in "wrecks" and manpower released from routinevibration readings and associated checkouts.
(3) Rel iabi 1 i ty - (a) Design mean time between failures of monitoringinstrumentation to be significantly greater than that of the machinebeing monitored -- say a minimum of 10 to 1. (b) All sensing elementsmust be self-checking; i.e., loss of signal would alarm, etc. (c) All
primary sensing elements maintainable with equipment in operation.(d) False alarms due to transients should be minimized.
1 See article in Oil and Gas Journal for December 17, 1973.
111+

(4) Safety - Monitoring system must me-et all required safety codes --
intrinsic safety preferred.
(5) F1 exi bi 1 i ty - Initial system to be primarily set up to read acous-tic signals via accel erometer , but must be: (a) readily and economi-
cally expandable; (b) capable of monitoring existing machinery alarms
such as non-contact probes, temperature and delta temperature alarms,and system or cycle efficiency calculations. However, in the initial
phases the emphasis was placed on the more nearly universal or funda-mental monitoring sensors such as high frequency acoustic signatureanalysis. Another promising on-line analytic technique to be pursuedis the use of the principle of X-ray fluorescence to detect impendingfailure by detecting wear and/or degradation particles in liquid or gas
streams. These two monitoring techniques are the only ones we know of
that show promise of onstream detection of fatigue cracking of turbo-machinery rotors and shafting.
(5) Alarm vs. Shutdown - Since the emphasis is on early detection ofimpending failure the shutdown decision is retained by operating person-nel. However, conventional minimum automatic shutdowns are locallycontrolled on critical items such as low oil pressure, thrust bearingtemperature and high level in suction drums, etc. Also, a few machinessuch as high-speed-air compressors have vibration shutdown switches.
PREDICTIVE MAINTENANCE MONITORING SYSTEM
Using the above stated criteria a plant system consisting of three mini-computer controlled surveillance systems was developed. The number ofsensing channels totaled about 800. Total plant area monitored wasabout 230 acres.
In order to obtain the specified benefit to cost ratio it was necessaryto make a number of trade-offs between cost and technical wants. For
example, we had to limit the computer controlled system to processequipment considered essential to production. A portable acousticemissions analyzer was made a part of the plan to permit periodic moni-toring of about an equal number of less critical machines. This analyzercan be used for shop tests. Also, the number of sub-multiplexers had to
be optimized at the expense of additional sample time intervals. A finalexample is that the co-ax cables within the unit limits were placed in
existing cable trays or strapped to existing piping instead of beingencased in conduit.
Exxon Chemical Company approved the installation of the proposed systemin August, 1973. By December, 1974 one of the three minicomputers wasin operation under engineering control (not yet released to operations).The other two systems are scheduled for completion in mid 1975.
The first minicomputer covered four operating units and associated cool-ing tower and pump slabs. The sensor channels are divided as follows:
115

Crack detectors 63Sleeve bearings 35Gear interface 12
Gear interface plus
1 or 2 anti -frictionbearings 52
Anti -friction bearings 207
Total 369 Channels
Process equipment monitored includes pumps, motors, compressors, turbines,extruders, gear boxes, turbochargers, and compressor header and lateralpiping. . .
-
INSTRUMENT DESCRIPTION
A. General
A single link through this system would consist of a high frequencyacoustic transducer, a preamplifier, and associated cabling and electro-nic processing circuitry for detecting those characteristics of theacoustic signal which are representative of the incipient failure in
the device under consideration. The transducers, which use a PZT-5Acrystal, are mounted as close as possible to the machine part for whichincipient failure data is desired using an appropriate cement. Theparticular type of cement is dependent on the application. For example,we have had sensors cemented in place for over 1% years in a severevibration and weather environment in the Baytown facility. Dental cementwas utilized and proved highly satisfactory in this application.
Short coaxial cables carry the signals from the transducers to preampli-fiers located close to the transducers. Preamplifiers are requiredbecause of the long cable runs from the instrumented machinery back to
a field sub-multiplexer or to the Control Room where the processing equip-
ment is located and because of the high electrical noise activity commonin many petrochemical plants. Low voltage D.C. power to the preampli-fiers comes from the same unit that it is feeding its high frequency datato over the same coaxial cable. Thus a small coaxial cable, such as.
RG 174/U (0.1 inch diameter), can be used.
The transducers, preamplifiers, and associated cabling are capable ofoperating in Class I, Division II hazard areas, as defined by the
National Fire Protection Association (NFPA) Bulletin No. 493, withoutany special provisions. For equipment operating in Class I, Division I
hazard areas, barriers must be used in the cabling feeding the DC powerto the preamplifiers which makes the cabling and preamplifiers intrinsi-cally safe. Thus, protective conduit does not have to be used in theseareas
.
116

B. Antifriction Bearings and Gears
Antifriction bearings and gears are monitored sequentially. A maximumof two bearings and one gear, all in close proximity to each other, maybe monitored by the same transducer at the same time. The monitoringsample time ranges from 10-seconds to 2-minutes, 40-seconds. The vari-able sample duration is computer controlled and depends on the statisti-cal randomness of the acoustic signal. The sequential sampling is
sufficient for antifriction bearings and gears since even if the maximumtime of 2-minutes, 40-seconds were required for each bearing and geargroup, a minimum of 540 groups could be covered in one day. Since highfrequency acoustic data usually provide at least a week's warningbefore catastrophic failure of an antifriction bearing or gear, this is
generally a sufficient sampling frequency.
The bearing and gear frequencies for all constant speed machine (± 1%
variation in RPM) bearings and gears being monitored are stored in thecomputer, and used by the antifriction bearing and gear processor in
generating the spectral line data. For variable speed machines, tacho-meter inputs to the computer adjust these frequencies to their correctvalues.
Figure 1 is a block diagram of a typical antifriction bearing and gearsystem.
Tach
CableRuns
HighFreq
Preamps
\
/Q-
RemoteLocation
1
Transducers '
Submux1
Class 1
Div. 2
Area
RemoteLocation
2 Submux2
To RemoteAlarm Unit
A
Mai n
Commu-|—Ib'rtator
Process-
Timi na
HIPrinter
ControlInterface
Data Mini-Inter- computerface
Figure 1 Anti-friction Bearing and Gear IFD System
117

Since the antifriction bearings and gears are sequentially sampled, theycan be sampled in the field by a set of sub-multiplexers since this willreduce the cost of cable plus installation. Thus, instead of hundreds'of cables, (as in Remote Location 1 in Figure 1), going from the pre-amplifiers to the Control Room, they terminate at a sub-multiplexer, andonly two cables are required from the sub-multiplexer back to the ControlRoom.
The sub-multiplexers are all under the control of a main commutator whichis in turn under the control of the mini -computer thi^ough the controlinterface. The sequence of events which allows the main commutator to
command a sub-multiplexer to switch from one transducer to the next is
as follows. Assume that we have just switched to a transducer monitoringtwo antifriction bearings and a gear. After 10 seconds of monitoring,the antifriction bearing and gear processor has generated nine outputswhich are representative of the following amplitude characteristics ofthe high frequency signal from the transducer.
These nine outputs are compared by the computer with the nine values it
obtained the last time it looked at this bearing. If the values are thesame within some pre-set limits, (there are ten pre-set limits for eachvariable), the computer commands the system to switch to the next trans-ducer. If the values are different, they may be different for one ofthree reasons.
1. A failing mechanism is occurring in the antifriction bearingor gear.
2. The machines operating condition is changing, such as a
changing load will cause the RMS Signal Level to change.
3. The ten second sampling time was not long enough to obtain a
good statistical average for the random data being processed.
In order to eliminate item 3, the computer doubles the sample time, and
continues processing the data. Comparisons are again made at the end
of 20 seconds. The process continues up to a maximum of 160 seconds or
until all nine values are in agreement with the previously measuredvalues, after which the computer commands the system to switch to the
next transducer.
Any time a measurement from any of the processors does not agree with
its previous measurement within some pre-set limits, the change is
recorded on a digital printer along with a channel identification and
(a)
(b)
(c)
RMS Signal Level
Spike Energy
7 envelope detected spectral lines forthe three frequencies associated witheach bearing and the gear frequency.
118
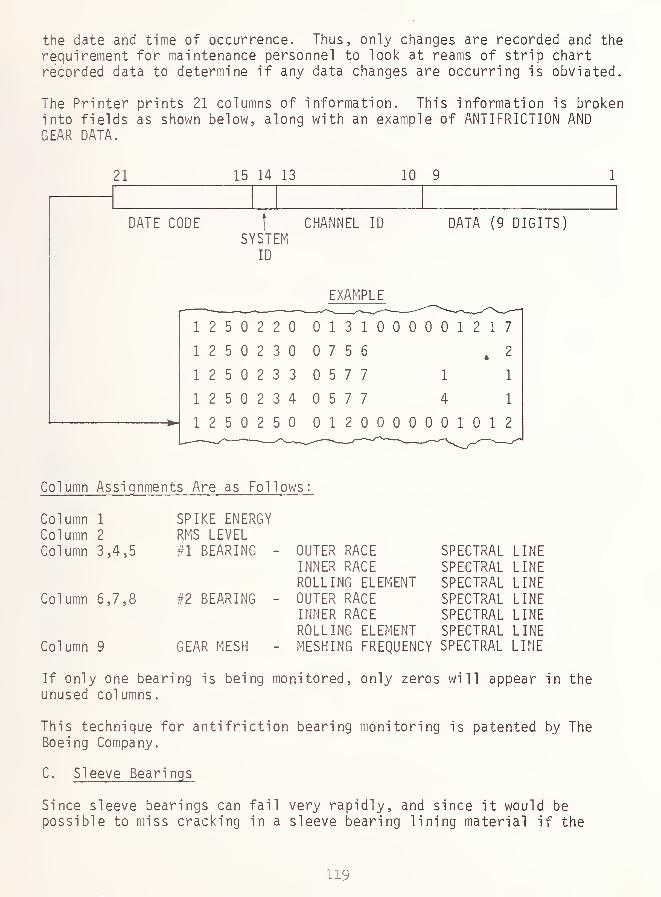
the date and time of occurrence. Thus, only changes are recorded and the
requirement for maintenance personnel to look at reams of strip chartrecorded data to determine if any data changes are occurring is obviated.
The Printer prints 21 columns of information. This information is brokeninto fields as shown below, along with an example of ANTIFRICTION ANDGEAR DATA.
21 15 14 13 10 9
DATE CODE f CHANNEL ID
SYSTEMID
EXAMPLE
DATA (9 DIGITS)
1 2 5 0 2 2 0 0 1 3 1 0 0 0 0 0 1 2 1 7
1 2 5 0 2 3 0 0 7 5 6*
2
1 2 5 0 2 3 3 0 5 7 7 1 1
1 2 5 0 2 3 4 0 5 7 7 4 1
1 2 5 0 2 5 0 0 1 2 0 0 0 0 0 0 1 0 1 2
Column Assignments Are as Follows
Column 1
Column 2
Column 3,4,5
Column 6,7,8
Column 9
SPIKE ENERGYRMS LEVEL#1 BEARING -
#2 BEARING -
GEAR MESH -
OUTER RACE ^ SPECTRAL LINEINNER RACE SPECTRAL LINEROLLING ELEMENT SPECTRAL LINEOUTER RACE SPECTRAL LINEINNER RACE SPECTRAL LINEROLLING ELEMENT SPECTRAL LINEMESHING FREQUENCY SPECTRAL LINE
If only one bearing is being monitored, only zeros will appear in theunused columns.
This technique for antifriction bearing monitoring is patented by TheBoeing Company.
C, Sleeve Bearings
Since sleeve bearings can fail very rapidly, and since it would bepossible to miss cracking in a sleeve bearing lining material if the
119

bearing was sequentially sampled, all sleeve bearings are continuouslymonitored.
SLEEVE BEARING DATA (COLUMNS 1 & 5)
Only two columns are employed for sleeve bearing data (1 ^ 5).
Column 1 is a measure of SPIKE ENERGYColumn 5 is a measure of RMS LEVEL
Figure 2 is a block diagram of the sleeve bearing circuit. Computercomparison with the previously measured data is done every ten seconds
HighFreqiiency
Preamos
Trans-ducer
{>
Cabl e
Runs
Cal
Processor DataInterface
w
ToMinicomputer
figure 2 Sleeve Bearing Acoustic Monitor
21 15 14 13 10 9 6 5 4 2 1
DATE CODE SYSTEM CHANNEL ID
ID
EXAMPLE
BLANKSRMS
1 2 5 0 2 2 0 0 1 3 1 0 0 0 0 0 1 2 1 7
1 2 5 0 2 3 0 0 7 5 6 2
1 2 5 0 2 3 3 0 5 7 7 1 1
1 2 5 0 2 3 4 0 5 7 7 4 1
1 2 5 0 2 5 0 0 1 2 0 0 0 0 0 0 1 0 1 2
BLANKS,f„wA
120

D. Crack Propagation
Again, since it would be possible to miss any crack propagation if the
suspected structures were sequentially sampled, all crack detectors are
continuously monitored. Comparison with previous data is made every10 seconds - any acoustic emission pulses from a propagating crack arecounted.
CRACK DETECTOR DATA
21 15 14 13 10 9 2 1
DATE CODE SYSTEMID
CHANNEL ID
EXAMPLE
BLANKS
1 2 5 0 2 2 0 0 1 3 1 0 0 0 0 0 1 2 1 7
1 2 5 0 2 3 0 0 7 5 6 2
1 2 5 0 2 3 3 0 5 7 7 1 1
1 2 5 0 2 3 4 0 5 7 7 4 1
1 2 5 0 2 5 0 0 1 2 0 0 0 0 0 0 1 0 1 2
DATA
CRACK DETECTOR DATA (COLUMN 1)
A single column is used for crack detector data (Column 1)
measure of crack growth in pressure piping.It is a
DATA CODING
The data in each column is independent of any other column and can havea value from 0 to 9 . This is trend data and only indicates the magni-tude of change from a previous data sample. Large changes will be
printed in RED and are indicative of serious problems with the unitbeing monitored. It should be checked immediately and MechanicalTechnical Service notified to further analyze the problem. Small changesare printed in BLACK and indicate less serious problems with a unit.
Figure 3 is a block diagram of an acoustic emission crack detectorsystem.
121

HighFrenuencyPreamps
Remote Location 3
I CI ass 1
Div. 1
Trans-ducers
CableRuns
Barri er
Stri ns
Processor
Interface
Cal i brat ionand
Checkout
ToMinicomputer
Figure 3 Acoustic Emission Crack Detector System
122

DISCUSSION
J. L. Frarey, Shaker Research Corporation : Do you plan to incorporate
the low frequency vibration, the proximity probe outputs, and the
startup-shutdown critical speed analysis into the same minicomputer?
R. James : We do plan to incorporate all the failure detecting devicesin the same mini -computer.
B. C. Baird, Sr. : The system has a TI 960 computer in it. It's using
about 8K of memory right now. It's expandable to about 32K and the
racks are large enough to include a lot of equipment so that a lot of
processing can be done on the same mini-computer.
W. R. McWhirter, Jr., Naval Ship Research and Development Center : Can
you explain some of the problems you had with the mi ni -computer?
B. C. Baird, Sr. : IC's were the major problem. A lot of this wascaused during our checkout phase by switching the computer off at nightand switching it on the next morning. I think we were thermally cyclingthe computer and it was causing failure every fourteen days, or so.
W. R. McWhi rter , Jr. : Do you feel that this failure was peculiar to thecomputer you used?
B. C. Baird, Sr. : It might have been because the computer componentsare not thermally cycled before being shipped. Now we just leave thecomputer on. Since it's been left on, it's been running for four orfive months and the first failure has just occurred.
U. Sela, Exxon Company, USA : Are you looking at the acoustic emissionor are you using proximity probes as sensors for spectrum analysis?
B. C. Baird , Sr. : Several parameters from each bearing were measured,but the proximity probes apparently just measure displacement. Wehaven't done any spectrum analysis on the sleeve bearings. We justmeasure an overall RMS signal and a spike distribution signal.
R. James : The proximity probes do measure displacement on each one ofthe four rotors and these are the only vibration probes in the wholeplant that trigger automatic shutdowns. Due to the unreliability of theproximity hardware, most of our proximity probes are only on alarm.
B. C. Baird, Sr. : We use high frequency (about 120 KHz) acousticemission for taking most of the data in the plant. We found this to bea good frequency for defect detectabil i ty and for minimizing thebackground noises and noise from other sources.
123

J
R. Lenich, Caterpillar Tractor Company : Have you had to do workbecause of false alarms in the system?
B. C. Baird, Sr. : We haven't had any false alarms, as far as I know.
R. Lenich : What kind of experience have you had with the wiring ofconnectors in the system?
B. C. Baird, Sr. : Wiring transducers and printouts is a problem. We
develop and build our own transducers very inexpensively. The wire we
use is RG174/U coaxial cable. There are about 600,000 feet of thiscable in the plant. The RG174 was selected because it costs 2 1/2
cents a foot. In certain vulnerable places, the cable is sometimesinadvertently cut and has to be spliced. We are trying to protect the
cable in these places by putting casing and conduit around it.
0. E. Compton, Northrop Corporation, Aircraft Division : Have youtrended any of the data from the results you obtained to define plannedperiodic maintenance intervals? Is the computer cost effective?
R. James : We don't feel like we have enough data yet to tell whetherit is cost effective. We are looking at at least a year's run in orderto get some information that would enable us to make a prediction.
C. R. Garbett, Shell Development Company : Do you have any experiencedetecting flaws or incipient failures in pressure vessel equipment?
R. James : We have used this in the field to check for cracks in
compressor piping. We glued transducers to a pipe that we knewcontained cracks and discovered that we could find a running crack.Because of this favorable experience, we have put 63 crack detectors on
this particular system. We do not have them on reactors at the presenttime, but the next step is to put them on some low temperature reactorswhich are subject to brittle fracture.
J. W. Forest, Ontario Hydro : Could you give us some examples of
computer readouts? Do you take into account flow variations, processchanges, etc.?
B. C. Baird, Sr. : We do not consider those variables. We measure theoverall RMS signal level with a high frequency (120 KHz) acousticsignal. We measure the signal level that exists above the 5 sigmathreshhold, which is a spike type signal. We do an envelope detectionof this signal and we look for the spectral lines that are associatedwith the bearings in the machine. We have a little 21 line printer.Included in the information on the printout is the date, time of theday to the minute, and the transducer number. We have 10 quantizedlevels for each variable. Initially we trend data for a good bearingday run and quantize it in 6db increments. We are looking for grosschanges in this high frequency signal. Typically, from the inceptionto the end, the signal will grow 100 to 1 . We have an alarm level set
12h

so that if some threshhold level is reached, we look at it. Built into
the system is the trend that is built up to this alarm level. The
reason for this is to get trend data to more fully understand the
failure mechanism that is taking place. Hov; long can a man go before
he must shut down? Can he wait until a planned shutdown or should he
shut down right now? The only way we are going to determine this is
through a lot of operating experiences, a lot of failures, a lot of
collected data.
D. M. O'Dea, Exxon Research and Engineering Company : You have one
process variable that you are measuring, that is machine speed. I am a
little unclear as to why you are measuring it for variable speed
machines. Is it only because you measure the bearing frequencies as
well as the acoustic energy?
B. C. Baird, -Sr. : Most machines vary only one percent. The band widthof ihe analyzer can be set wide enough to still give good sensitivityand good defect detectibil i ty and still stay within that band width.If the machine varies one percent or so you can still pick out thatspectral line. For a machine that varies over fifty percent because of
an operated change (one day it's operating at 100 RPMs, the next day at
200 RPMs), we set up a tachometer to measure that machine speed. Thisinformation is fed into the computer which then calculates the actualbearing frequencies of the spectral lines that it wants to look at. It
sets up the spectrum analyzer inside the system to look at just thosespectral lines associated with the ball pass frequencies. We feel thisis the earliest indication of a bearing defect. In all of our tests,the earliest indication of any defect in that bearing, like a small
spall, starts with a spectral line starting to grow. The high
frequency envelope detects a spectral line perhaps months before thebearing actually fails. ^ The second indication is an increase in
spikes. The third and final indication is that the RMS starts to grow.Bearings of different manufacturers may have different frequencies dueto design. You may not be avjare of whose bearings are being monitored.Therefore, you have to rely on spike information or RMS information.There isn't as early a warning as we would like.
D. M. O'Dea : Are you saying that you may simplify the system in thefuture if you find you really don't need to know the spectral line?
B. C. Baird, Sr. : You get the earliest warning from spectral lines.On some curves that were shown there was an 8-day warning from pureRMS. You introduce spikes and you get an earlier warning than that.You introduce the spectral line and you get a still earlier warning.
P. L. Howard, SKF Industries : What is the logic for determining whento change a bearing or gear?
125

R. James : Right now, we use either high frequency analysis or regularRMS or, in some cases, a metric vibration meter. We will change a
bearing if the meter reads 0.5 to 0.6 inch per second. That is thelimit on most of our process equipment. If it's up to 0.9 inch persecond, we shut down immediately.
P. L. Howard : How do you correlate between damage level and thoselimits?
R. James : Those fires tell us.'
C. Dean, Solar, International Harvester : You mentioned that youmonitor the anti -friction bearings periodically. At what intervals doyou monitor them?
B. C. Baird, Sr. : The computer is set up to look at a bearing for 10
seconds. It continuously moves from bearing to bearing every tenseconds, so if there are 260 bearings, it will take 2600 seconds to
look at all of them. There is a statistical probabil ity that you will
obtain the correct data if you look at a bearing for 10 seconds. Fromthe first 10 second look, we set up our base line data and quantize thebase line measurements. If the second 10 second look agrees with the
first look, we go on to the next bearing. If it doesn't agree, we keepon looking and quantizing and normalizing the data until we have lookedfor up to 2 minutes- and 40 seconds, which we found is about as far as
you have to go to get good statistical data. If there still is no
agreement, we feel that the bearing condition has changed and this is
printed up. Typically for one unit with 370 points, you may get aroundto the bearings every two or three hours. Sleeve bearings and cracksare monitored continuously.
D. L. Dennis, Naval Weapons Center : How does management view fundingyour effort at the present time and in the future?
R. James : Our management is extremely interested in predictivemaintenance. We consider the program that we are engaged in to be a 5-
year research and development program. We are in the second year now.
The Baytown plant is the experimental guinea pig for the rest of thecircuit. We expect to know how good this approach is by the end of the5-year program. We actually had two years of field tests before we gotinto the computerized version. So we were able to convince ourmanagement, through problems they saw in the operation of the plant,that predictive maintenance needed to be worked on.
D. R. Houser, The Ohio State University : Can you say anything aboutyour gear detection work?
126

/
R. James : This is one of the big values of acoustic emission testing.Consider a one-to-one gear box on a rubber plant extruder. If we get a
high signal, we don't know whether it is a gear, a shaft, or a bearingunless we make a detailed analysis. We have been able to detect cracksin shafting on this large one-to-one gear box as well as pick up
incipient bearing failures. We can actually tell by looking at theacoustic signal whether the extruder is being operated correctly. It
is an operating guide.
127
PANEL DISCUSSION : Case Histories Applications
Panel Moderator : P. L. Howard, SKF Industries
Panel Members : D. B. Board, Boeing Vertol Company*R. Eisenman, Endevco*R. Hohenberg, Mechanical Technology, Inc.*J. L. Frarey, Shaker Research CorporationM. Hoobchaak, Naval Sea Systems CommandR. James, Exxon Chemical Company
*Panel members so identified delivered short presentations prior to thepanel discussion. These presentations are not included in theProceedings.
R. Eisenman : I think that any diagnostic program lends itself to
answering some very basic questions and I think there are three areasthat should be considered. First, the user should determine what typeof problem he has - is he worried about gear contact problems, bearingstability problems, plain old misalignment, flow problems. The secondpoint is to select a transducer that will provide the necessaryinformation for evaluation of the problems. The third logical pointwould be to determine whether the user wants to develop his own inhousecapabilities, or whether he just wants to monitor the signal for trenddiagnosis and call in somebody more specialized in diagnostics when he
sees increasing trends.
P. L. Howard : Jack, would you like to lay out a nice hypotheticalprogram?
J. L. Frarey : I have to say the same thing I said earlier; that is, ifyou want to rate a diagnostic system, the system has to tell you whatis wrong, what failure mode is involved, and the severity of theproblem. You have to tear the machine down as rapidly as possible andimmediately look at the component and determine whether the system told
the truth. We can't take a part out of an engine and let it sit aroundfor a month getting rusty and then try to make a decision as to whatthe diagnostic system said. It's got to be done quickly, it's got to
identify the failure mode, and it's got to tell you the severity of the
problem, and I suspect anything other than that should be graded as a
failure of the diagnostic system.
P. L. Howard : This points out one of the problems in trying to do
diagnostic work. There is an indication of a potential problem, butyou find that you are not the most important part of an evaluationprogram. There are 17 other tests that have to be run and it won't be
possible to tear down the machine for three weeks. At that time, theywill tell you whether you were right. One other thing is that quiteoften a diagnostic technique is preceded by a large marching band ofmarketeers. Two points that marketeers always make, are (a) it's
128

simple, and (b) it can be evaluated by almost anyone who has a high
school education and no previous criminal record. The first job of the
diagnostician is to come through and say, "Well, yes that is almostright, but we still have to take your machine apart." One of the mostintelligent approaches to finding out whether a diagnostic technique is
,going to pay off is the approach that Ralph James is taking. He has
already set aside a block of time. He is not bowing to what I am sure
were initial marketing pressures to fully evaluate the system in two
weeks and write a final report in 48 hours thereafter. He is going to
take a long term look at it. What is the feeling of the panel on the
problem faced in diagnostic evaluation - that is, the diagnosticianwould like to gather data forever so that his conclusion is firm and
final, the user quite often can't wait forever?
R. Hohenberg : The problems of the moment always seem to be the mostimportant ones and the most significant ones because they exact the
greatest limitations on our actions. However, they can be minimizedand we were all taught when we went to school that there was a way to
conduct an experiment. When an experiment is to be run, you mustdefine what it is you want to do, what the objective is, whatmethodology is to be employed, how the physical laws that areunderstood and known will be invoked and played off against each otherto achieve the result, and also the kind of result that is to beexpected. Now that's simpleminded in the very complex situations thatwe have, but in many cases none of this is done. People rush into the
test area, they rush to slap the equipment on and they wait to see the
results. Then they wonder how it can be explained. The explanation in
the classical experiment is a selection of which of the anticipatedresults were achieved rather than a searching of what really did happenand I think that is one of the fundamental problems that we face today.The experiment must be limited and focused on the population to whichyou want it to apply.
P. L. Howard : Would any of the users like to comment on how youovercome the impatience in your own management in order to give a
diagnostic technique a fair evaluation.
R. James : Our present program is quite similar to what we had to go
through on gas engine diagnosis techniques. We had to convincemanagement that the maintenance costs on all of our gas engines weretoo high. We had to ask for a period of time to prove that we couldbring the maintenance costs down. We did demonstrate that and got themaintenance costs down in about a year and a half. It takes that longto train the people and the people that use the equipment are the keyfactors. We did prove it, and when we cut back on the monitoring work,the maintenance costs went up. But it is a statistical type thing.That's the only way you can prove it.
129

M. Hoobchaak : Our problem has been failures in hydraulic systems ofgun mounts. Down time has been 30 percent or higher in some cases. Weare going to analyze the oil over a two year period. We are 8 monthsinto the program. We have been given the luxury of some time rightnow.
P. L. Howard : I'm glad to hear that you really recognize that, withthe diagnostic manufacturers, time is a luxury. I would like Joe Kukel
to give us the benefit of his experience on AIDAPS and how he has triedto overcome some of the diagnostic evaluation pitfalls that thesepeople have faced.
J. Kukel, Garrett Corporation : We are trying to follow the procedurethat Rudy Hohenberg mentioned. We are running experiments anddeveloping our technology level. I haven't come to the point ofapplication yet, that's the next step. You want to make sure thetechnology level is firm.
P. L. Howard : Mr. Hess, would you like to tell us what pitfalls youhave encountered in the A7 program and how you have tried to avoidpitfalls in determining whether the A7 diagnostics are successful andhow successful they are?
A. J. Hess, Naval Air Test Center : We had lots of pitfalls, of course,and I. think there is a lot to be learned by some of the things that wewent through. As our evaluation program progressed, it seemed like ourbasic definitions of what a valid and invalid diagnostic was, changed.We had a Navy evaluation team on site gathering statistical data onmaintenance lines, safety flight lines. It seems like they had one setof definitions, program management people who were trying to market it
within the Navy had another set of definitions, all the contractors had
their own definitions. To really prove a system cost effective, youhave to develop the statistical data, and if you are using a bunch ofdifferent definitions, the statistical data may not mean much. In anydiagnostic program, one of the first things that should be done is to
agree on a basic set of definitions.
We are trying to prove our system effective from the safetyapplied standpoint. Since we are operating in a fleet environment, wehad a big problem with recordkeeping. The fleet had its own missionsto fly everyday - the pilots weren't very concerned about keepingaccurate records on our system, yet we needed their inputs. You havethe problem of a sophisticated condition monitoring system. During the
development phase the software is continually changing. It is a big
problem to document these changes so that you know at any point in time
exactly what software is being evaluated. We had to convince ourprogram people that, while there were some major problems with thesystem, software development was such that we were close to solving the
problems. To do that type of convincing, you really have to have a
handle on the documentation of software.
150

Another major problem was deciding when the development effortactually stops and the evaluation begins. Eventually you run out of
time and you have to stop the development - the evaluation starts then
and you ignore the statistical data that was generated during the
development effort and just pay attention to the evaluation.
P. L. Howard : Do you find that that is best done arbitrarily? Justsay, OK it's done?
A. J. Hess : You have to make an intelligent judgment.
D. M. O'Dea, Exxon Research and Engineering Company : I think all of us
have fallen into pitfalls in setting up programs - starting out too
early in many cases or starting out with the wrong equipment. We all
have been called on to evaluate our equipment to see what we can do to
improve reliability and availability. We have to make theseevaluations and usually we have to decide just what is the basis for
determining whether a system is good or bad. Different techniques are
applied. One famous technique is to pick something simple likecounting the number of pumps going into a shop before a program is
started. Then start the program and keep track of the number of pumpsgoing into the shop, and see how much of an improvement there is. Thathas been very successful. One other approach has been to look at thenumber of times there has been a failure and count how much down-timehas been spent on equipment in terms of days or lost product, thenstart a program, see how many times you have either avoided down-timeor avoided the failure, or see how much faster you can come back online with the new program. These are basically the evaluation tools weuse. What we find is that we have to stay simple. Ralph, you didn'tmention it, but I'm sure you are counting the fires.
R. James : Sure do.
P. L. Howard : One of the things diagnostic suppliers are continuallyfaced with is proving that there is a benefit from using the diagnostictechnique. It is usually in the form of a cost benefit. How do you goabout showing the cost effectiveness of a technique? I don't thinkthere is a diagnostic manufacturer here who wouldn't agree thatserendipity is one of the better ways of proving the cost effectivenessof a system. Are there any other people who have planned costeffectiveness tests for diagnostic equipment?
C. Dean, Solar, International Harvester : I can cite an example of howit shouldn't be done. I entered into strictly a verbal agreement witha manufacturer of diagnostic equipment to conduct some tests on some ofour equipment. The first phase was going to cost our company say X
number of dollars. The second phase, which was outlined at the time webegan the program, was going to cost about lOX dollars which we wereprepared to spend at the time. However, at the end of the first phase,we really didn't get a report or any assurance that we had accomplishedwhat we had set out to do. I had no confidence that we could gain
131

anything from the second phase, so I terminated the program. I havehad many second thoughts since that time, because maybe I prematurelyshut off a program that was worthwhile to the company. However, I hadto make a judgment, and from the information that I had at that time, I
just could not take the second step. My recommendation would be thatbefore a program is undertaken, the goals and pitfalls should be
clearly defined. The progress of the program should be thoroughlyreviewed from time to time to see if these goals are being met.
D. M. O'Dea : We have spent many hours and many thousands of dollarstrying to identify failures, and we have found two basic causes forthis loss of dollars. One of these is what could be considered infantmortality, which is the failure of new machinery that's just beeninstalled. The other is the problems associated with a machine overits lifetime - wear-out problems, or problems that come up as time goeson. We have found that we can't separate the two causes completely.We have been able to significantly reduce the infant mortality rate.
Lifetime problems on the whole are not that serious except where theycause safety hazards or really influence production. Everything wehave started to do is based on a failure analysis. What we would liketo accomplish is to run our machines for the longest periods of time
without any internal inspections, without any overhauls. Before westart a program, we have to identify what type of failure we are tryingto avoid. If there are existing engines that have been running, youcan look at the history of failure in those engines and then start a
program of evaluation on the basis of that history. If there is a newproduct or a totally new design, what you have to do is a failureanalysis on the basis of the histories of components you are puttinginto that new design before you really begin to set up a diagnosticprogram.
R. James : I should have mentioned the importance of failure analysis.Until we began to do a detailed failure analysis of every failure, weweren't making much headway. At that time everything was a maintenanceproblem. But since we have been doing failure analysis, we have foundthat maintenance is only one leg of a tripod. There are operatorproblems and we have been able to correct many failures by training theoperators to operate the equipment properly. The third leg of the
tripod is design. Some of the failures are due to faulty design. We
try to indicate the basic cause of failure in our failure analyses.
A. Jaudet, Electricite de France : What Dennis O^Dea said is exactly the
kind of procedure we have followed in Electricite de France. We triedto determine what kind of mechanical failures could occur in turbines.From 10 years experience in running 250 megawatt machines, we haveestablished that most failures come from blade fractures or from high
pressure inlet valves. So we have established a way to diagnose such
152

failures. Now personnel that work on such power plants ask me not onlyfor diagnosis but for prognosis. They want to know because they have
only a certain period of time each year to do maintenance of theirturbines.
P. L. Howard : Would each panelist give us a short summary?
D. B. Board : First, before you start a program, you should clearlyestablish what your objectives are - are you trying to diagnose or are
you trying to prognose? Secondly, you should establish ahead of time
whether you are going to test the hypothesis, or if you are going to
demonstrate the feasibility of application for whatever you are goingto do. Thirdly, whatever you do, the person who plans the experimentor the program and is responsible for carrying it out should not be the
same person who evaluates the results and draws the conclusions. Andfinally, I think it is most important that any program should involvenot just one perspective. For instance, in the aircraft diagnosticsfield, you have got to have equal involvement of the airframe or enginemanufacturer, the diagnostic hardware manufacturer, and the usingorganization. You absolutely must have those different perspectives or
your program really isn't a program.
R. Eisenman : It is extremely important in any diagnostic program thatthere be adequate feedback from the user. This is a very difficultchannel of communication, because often the problem that you havediagnosed is discovered by a millwright on a graveyard shift and he
never tells anybody about it. So again I can't overstate theimportance of feedback.
P. L. Howard : It is a two way street. If they want a good evaluationin the user house, they have to do some work.
J. L. Frarey : I liked what Bob Eisenman said during his talk - thatyou have got to combine diagnostic systems to get the total result. I
happen to be an advocate of high frequency vibration. Frankly in ourday-to-day troubleshooting in the petro-chemical and utilityindustries, we probably make about 80 percent of our decisions based onlow frequency data from proximity probes-low frequency vibrations.
R. Hohenberg : My goals are to find desirable applications for peoplewho have a significant problem where the failure mechanisms areunderstood. An approach can then be found with a simple methodologywhich looks at the failure mechanism rather than at the traditionaloperating parameters to, in a simple manner, define and prognosticatethe situation. And the approach I firmly believe in is at the sensingend. It should be kept firmly in mind that the voltage coming out of a
transducer is an observable which consists of useful signal and noise.
155

If you can find or develop a transducer that has a highersignal-to-noise ratio, the extent of analysis that is made subsequentlyis much reduced.
M. Hoobchaak : I agree with Rudy on keeping it simple. The simpler youcan make your system, the more likely it is that something will be doneif there is a failure.
R. James : That reminds me of our "KISS" program. It means "keep itsimple stupid," and we have had good results from trying to do that.Our problem is that we don't start necessarily with the best equipment.We start with initial cost considerations. I think we should look atthe long range cost of this equipment and look at the minor detailssuch as the bearings. If we did that, we wouldn't waste our time on
things that should have been prevented in the design stage. Now in
order to do that you have got to take the system approach and have an
early input from the maintenance engineer, from the design engineer,the process engineer, who sometimes goes his merry way without anyconsideration for the equipment.

SESSION III
ON GOING
PROGRAMS
Chairman: H. R. Hegner
General American
Transportation Corporation


GAS TURBINE ENGINE DIAGNOSTIC TEST RESULTSUTILIZING A THERMODYNAMIC ANALYSIS TECHNIQUE
BY .
ROBERT L. STENBERG'
U. S. Army Aviation System s Command, St. Louis, Missouri 63166
1.0 Introduction :
The US Army has a requirement to evaluate automatic Inspectiondiagnostic and prognostic systems (AIDAPS) for use on future aircraft.An effective engine health monitoring technique will be an importantpart of the total aircraft diagnostic system. The T53 engine approachcurrently being taken on the UH-IH prototype AIDAPS program is to collectdata on pertinent measurable parameters while the engine is operatingnominally and while known degraded parts have been Implanted. The abovetwo groups of data are then compared and differences noted for the properfault Isolation message. By Implanting known degraded parts, much morepertinent data can be generated and fault isolation software accomplishedduring a given period of time. The purpose of this paper is to reviewand analyze the results of the thermodynamic analysis on selected AVCO-Lycoming test cell data.
2.0 Thermodynamic Analysis Concept :^
A flow chart showing the various steps in the thermodynamic processis given in figure 1. Gas path logic is based on the principle thatparameter measurements are uniquely related to component physical condi-tion (i.e. deterioration) since parameter and performance measurementsare uniquely related and performance measurements and physical deteriora-tion are uniquely related.
Engine performance monitoring for the purpose of tracking enginehealth normally consists of three basic steps: (1) establishment of
baseline performance, (2) comparison of current performance with base-line performance, and (3) Interpretation of performance deviations.However, particular techniques can differ from one another in terms of
measured parameters, method of computation of performance indices and
method of interpretation of performance deviations.
In the AIDAPS approach variations in the performance indices are
obtained by the influence coefficient method^. In implementation form,
engine-installed sensors measure certain gas path parameters (tempera-tures, pressures, etc). A test of the data is then made to determinethat it satisfies thermodynamic stability criteria.
Extensive background in the development of turbine engine controls
157

has demonstrated that the transient operation of an engine can signifi-cantly affect the diagnostic results. For instance, the occurrencehigh steady-state temperature would be indicative of a potential enginedegradation but that same vibration which occurs during a transientwould only be indicative of the energy available to accelerate the engine.A method of minimizing the effect of transient performance was needed.The conditions that have been set up for steady-state involve basicallytwo requirements; sufficient high power and sufficiently steady engineoperation. Power is tested in terms of Nj^ , and a minimum N of 85% is
required. It turns out that in terms of the relative magnitudes of thechanges, sequence of occurrence, duration, and settling rates, SHP andEGT are the best transient indications. The rate limits on these para-meters are 0.2HP/sec and 0.2°F/sec, respectively 2, The rate-of-changecalculation and limits provide a settling typically between 10 secondsand 30 seconds, depending on the magnitude of the transient.
During steady-state, uncorrected parameter data are suiraned in 10-
second segments. If steady-state criteria are met throughout a steady-state segment, the segment sums are added to interval sums. At the endof a steady-state interval, the interval sums are averaged, producingaveraged values of the uncorrected parameters. If the steady-state in-
tervals persist for more than 18 segments, the summing is terminated,averages calculated, and steady-state criteria reset to ignore the restof that steady-state interval. Thus, a steady-state interval sampleconsists of uncorrected parameters averaged over 10 to 180 observations.
Following calculation of the averages, corrected parameterdeviations from baseline are computed and these are compared to sensorcredibility limits and engine degradation limits. Exceedance of a limittriggers an appropriate indication to signal the need (to maintenance)for diagnostic processing. These operations are performed for each
steady-state interval data set.
Each steady-state interval data set (parameter averages) is stored.The process of looking for steady-state, forming steady-state interval
data sets, testing the data set parameters, and storing the data sets
is continuous. The philosophy is to accept as much good data as possi-ble, since it has been estimated that this will amount to only 5 to 20
steady-state interval data sets per flight. Present storage allocationis such that at least 5 flights worth of data can be collected beforeroutine processing for refined health checks and prognosis will be
required.
Additionally, if no steady-state segments are encountered within a
10-minute period during engine operations, an unaveraged set of data
together with steady-state counter data are recorded to determine the
cause of the lack of steady-state. Ground logic will isolate the cause
to either a particular instrumentation fault or to an engine instabi-
lity.
158

Having satisfied the above mentioned steady-state conditions thedeviation of the measured parameters from that of the normal engine ,
condition are calculated. (In corrected form)
.
The primary measurable parameters are:
Tl Compressor Inlet Temperature
Pi Compressor Inlet Pressure
T3 Compressor Discharge Temperature
Compressor Discharge Pressure
Nl Gas Producer Spool Speed
N2 Power Turbine Spool Speed
Wf Fuel Flow~
Q Torque Pressure
Exhaust Gas Temperature
A second calculation, using the engine thermodynamic relationshipis then used to determine performance changes of the engine from normaby means of influence coefficients. The AIDAPS coefficients are basedon a differential equation model of the engine as shown in figure 2.
Model sets are stored for P3 = 70, 80, 90 and 100 psi.
In applying the model, a coefficient set is formed for the parti-cular measured value of P-^ by interpolation between model sets. Thefollowing independent parameters are then calculated:
T5 Turbine Inlet Temperature
W2 Airflow
Compressor Efficiency
Gas Producer Turbine Nozzle Area
Vg Gas Producer Turbine Efficiency
Power Turbine Efficiency
The above parameters have direct diagnostic meaning. T^ is a
general health parameter, but also reflects on hot section conditionand degradation prone operation. W2 and Vc reflect compressor condi-tion.
159

A5, and77pt reflect the conditions of the 1st stage turbine nozzlearea, gas producer turbine efficiency and power turbine efficiency, re-spectively. The tests on T5 and W2 will also consider VIGV operation.A3 will be used as an indicator only with removal threshold significanceplaced on the effect of A3 variations on T3 and "^g.
Limits on the performance changes as established from implant testsusing physically deteriorated parts (implants) or maladjustments are useein a comparison manner to determine if the engine has exceeded accepta-ble limits. Prognosis is to be established by time-trending and projec-tion to the removal limit. Current diagnostic limits are shown infigure 3.
3.0 Results :
Major test results that will be discussed are compressor foulingand erosion, fuel nozzle clogging and gas turbine temperature erosion ^^5.
These problems are considered as major problems of the T53 engine.
COMPRESSOR FOULING TEST
The results of a compressor fouling test are shown in figure 4; thecompressor was progressively fouled by spraying oil-wood ash and oilwater into the compressor inlet. The top graph tracks the drop incompressor efficiency and airflow (a three-point moving average wasused). The bottom bar graph shows the average of the computed perfor-mance parameter changes (model results). At that low point, AVCO-Lycoming test engineers believe that it was representative of the degreeof fouling that can be encountered in an operational environment.Following the calibration runs, the engine was given a double cleaningthat appeared to restore its former performance level.
COMPRESSOR EROSION TEST
The results of an eroded compressor test are shown in figure 5.This test was a combination compressor rotor (implant //AID 132) and com-pressor housing (implant //AID 133) .
All of the components were obtained from an engine which had beenreturned to depot because of a surge condition. In the case of thecompressor rotor, erosion wears away the blade airfoil resulting in re-duced pumping efficiency. AID 132 has minimum erosion damage that is
within overhaullimits . AID 133 also has minimum, erosion damage that is
within overhaul limits. In the case of the axial compressor housing,erosion wears away the vane airfoil (axial compressor stator vanes)
and increases tip clearance resulting in reduced pumping efficiency.In the case of the impeller housing, erosion wears away material result-
ing in increased clearance between the housing and the impeller with a
resulting loss in pumping efficiency.

The housing impeller clearance is considered critical because themajority of compressor work is performed in the centrifugal stage. ForAID 133 the impeller housing shows severe wear at the entrance and exit.
In this test the drop in compressor efficiency tended toward largermagnitudes with engine power level (the minimum change was about -2 per-cent; the maximum -3 percent (shown)). The results indicate that the
change in efficiency can be attributed almost entirely to the compressorrotor, while the compressor housing erosion is responsible for about 1/2of the change in pumping capacity.
FUEL NOZZLE TEST
Fuel nozzle clogging and erosion and consequent hot spots have beenidentified as the only significant combustion section problems for theT53 engine.
Figure 6 shows the results of successively clogging three nozzles;No. 11; Nos. 11 and 10; and Nos . 11, 10, 9. All of these results wereclearly detectable.
The unshaded bars show the normal temperature distribution while theshaded bars show the deviations for the test case. In each case the
temperature distribution rotates before reaching the thermocouples so
that the minimum temperatures are detected by thermocouples 1 and 2
rather than 11 and 12. These results show that a clogged nozzle, orcold spot can definitely be identified by EGT spread measurement on the
T53 engine. However, it appears doubtful whether hot spots due to
eroded, high flow fuel nozzles can be identified. The problem is com-pounded by helicopter operation (power turbine rpm is held essentiallyconstant). The result is that exhaust gas in the tailpipe, has a vary-ing degree of swirl dependent on power level. Since there is a certaindegree of natural temperature distribution in the exhaust gas, the swirlcauses a variation in the temperature profile measured by the EGTthermocouples
.
BURNED 1ST STAGE GAS PRODUCER ROTOR TEST
Deterioration of the 1st stage gas producer rotor begins with a
general deterioration of the 701 coating along the leading and trailingedge of the blades. The rate of progression is slow until the combinedeffects of the coating and sulfidatlon of the parent material progressesat a rapid rate, resulting in material loss. The change in geometry of
the blades (e.g. increased tip clearances) results in decreased turbine
efficiency and an accompanying general increase in turbine inlet
temperature. The increased temperature level can be expected to increase
the degradation rate and initiate or promote the deterioration of other
turbine section components. The temperature increase also raises the
operating line of the compressor, thereby reducing surge margin.
1^1

Implant AID 153 is in the final stages of sulfidation. The vanecontour shows loss of material due to erosion and burning. The vane tipsstill have some of the original contour remaining. Both the leading andtrailing edge tips have been lost.
Analysis results are shown in figure 7. The implant has caused asevere loss in efficiency and a corresponding, essentially one to one,increase in turbine inlet temperature. The decrease in airflow and in-crease in compressor efficiency are so-called cycle rebalancing effects;that is, the increase in turbine inlet temperature has caused the opera-ting point of the compressor to move towards decreased airflow and in-creased efficiency. While these latter changes are substantial, they aresmall in comparison to the change in turbine efficiency.
This implant is considered representative of degradation significantly above the threshold that AIDAPS is intended to detect.
4.0 Conclusions :
The last year of test cell work has conclusively shown thatthermodynamic analysis can pinpoint major gas turbine engine degradationmodes. Flight testing has also indicated that similar defects can bedetected by an on-board prototype system. Hov/ever, further areas of
work have been identified.
The variability of the measured gas-path parameters has to be keptwithin an acceptable band (+ 1/2 percent). This has resulted in someinstrumentation changes (new compressor inlet pressure (CIP) and torquesensor transducers, and a relocated compressor discharge pressure (CDP)
sensor installation)
.
Two prognostic tests, temperature erosion (burning) and sand and
dust erosion were conducted in the test cell. These tests both demonstrated the relatively slow rate of degradation, especially of the GP section.
Realizing that in practical day-to-day engine monitoring, sensormalfunctions can occur that do not go off the scale, a sensor malfunc-tion and quality assessment of the diagnostic results must be fully
developed and tested.
The development of a bleed/leakage model to provide an auxiliarycapability for identifying increased bleed usage (associated with a
malfunction of a bleed using device or significant external leakage flow
occuring prior to the turbine section. Use of the bleed model, however,
is complicated by its high sensitivity. If this problem can be solved
this model would supplement the basic model in the proper interpretation
of turbine section deterioration.
li+2

REFERENCES
1. UH-IH Automatic Inspection Diagnostic and Prognostic System (AIDAPS)Test Bed Program, Hamilton Standard Division of United AircraftCorporation, USAAVSCOM Technical Report 72-18 August 1972
2. Second Interim Technical Report, AiResearch Manufacturing Company of
California, United States Army Aviation Systems Command, ContractNo. DAAJ01-73-C-0874(P3L) November 8, 1974.
3. Third Interim Technical Report, AiResearch Manufacturing Company ofCalifornia, United States Army Aviation Systems Command, ContractNo. DAAJ01-73-C-0874(P6C) April 1, 1975
li+5
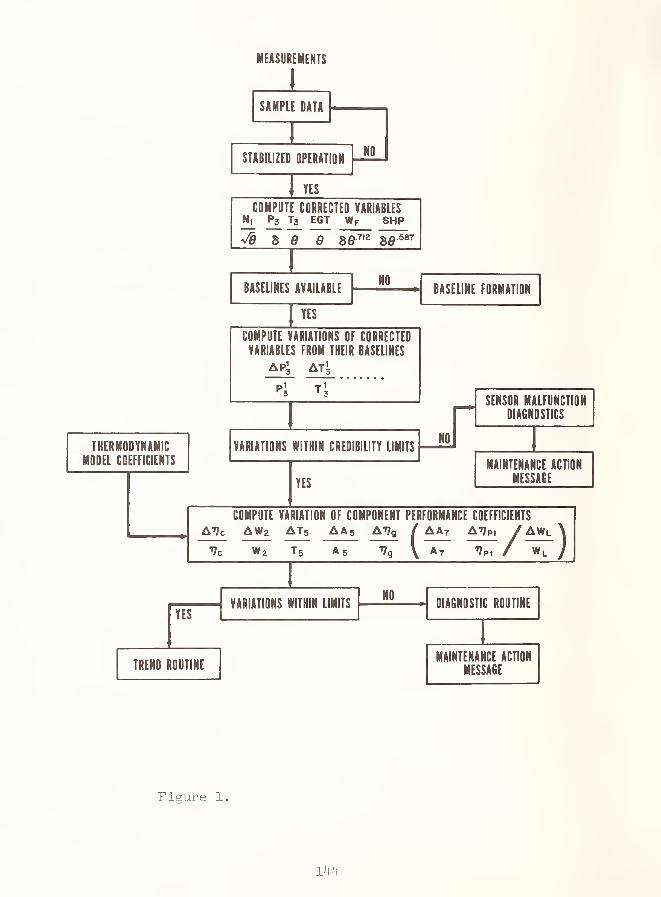
MEASUREMENTS
i
SAMPLE DATA
znSTABILIZED OPERATION
I YES
NO
COMPUTE CORRECTED VARIABLESN, P3 T3 EGT Wf SHP
THERMODYNAMIC
MODEL COEFFICIENTS
BASELINES AVAILABLENO
BASELINE FORMATION
YES
COMPUTE VARIATIONS OF CORRECTED
VARIABLES FROM THEIR BASELINES
apI, atI.
VARIATIONS WITHIN CREDIBILITY LIMITSNO
SENSOR MALFUNCTION
DIAGNOSTICS
YES
MAINTENANCE ACTION
MESSAGE
COMPUTE VARIATION OF COMPONENT PERFORMANCE COEFFICIENTS
A'»?c AW2 AT5 AA5 A'^g
Vc W2 T5 A 5 Vq (
AA7 A^p, / AWl \
A7 Vp, / Wl /
YESVARIATIONS WITHIN LIMITS
NODIAGNOSTIC ROUTINE
TREND ROUTINEMAINTENANCE ACTION
MESSAGE
Figure 1.
Ikk

Ap, At^/^ Aw^/,, Ashp/shp Aegt/egt^/P^ ^/T^ f/W^
.000 .ho8 -.129 .126 .886
^^2/^^ .000 .1^0 1.25^ -.2U2 -1.705
A'^c/^ .7^^ -2.278 .000 ^ .000 .000
-1.090 .576 1.290 -.196 -1.^77
^^8^ --936 1.900 .252 .175 -1.171
A^pt/^, + .000 -.128 -i.iUo .5535 .9^5
Example: AT AT A'J^.^^_2 = .408 - .129 -jj- * .126 + .o36 ^
5 5 f
Figure 2. Coefficient Matrix Set, N.^ model (P^= 80)
T5, Turbine inlet temp: + 5/0
W2 , Airflow (or comp pumping capacity): - 5^
17 c, Compressor efficiency: - 3'^
A5, Gas producer turbine nozzle area: + h'^o
"qg, Gas producer turbine eff.: - 5^"
T7pt, Power turbine eff.: - 5^
VIGV full open pt: 9^+ + 1.5fo N
Figure 3. Diagnostic Limits
1^5

1^6

9>
•o E
S °-Q.
<O.
I-oLU
Q.ICO
5
ro
I-
5> 1
If)
<
]
tooco»o
0)
or
a>XJo
ocsi
o o o O00
Od
ocsi
q o oCD
7o N0llVIA3a 7o N0llVIA3a
-pS3
cd-p
oo
o
w(U
oo
o
0)
M•H


ollJ
Q.X
(0
a>
0)
T3 E<D ow3 Oin
oa>
o. a.
3
<ux>o
ID
< C
<M
]
oCM
% N0llVIA3a
O lO ID
7o N0llVIA3a
oI
+3aCO
w
oo
o-poK
CD
MCO
-PCO
+^mu•H
-ci
(U
tjo^1
•H

DISCUSSION
C. R. GarbeLt, Shell Development Company : What kind of meter did youuse to measure torque?
R. L. Stenberg : It was a torque pressure sensor. What we identifiedwas that the current torque pressure sensor that is on the UH-IHaircraft may not have the repeatability we need for this system, so wedo have an alternate sensor on the aircraft. We are evaluating bothsensors in paral lei . /
0. E, Compton, Northrop Corporation, Aircraft Division : What type ofcorrelation did you obtain between the air/ fuel flow ratio and themeasured temperature analysis?
R. L. Stenberg : We had a very close correlation between the air/fuelresults and the model results that we obtained.
0. E. Compton : Is that how you define the clogging of your nozzles? ;
R. L. Stenberg : Yes, "chat was one of the indications.
150
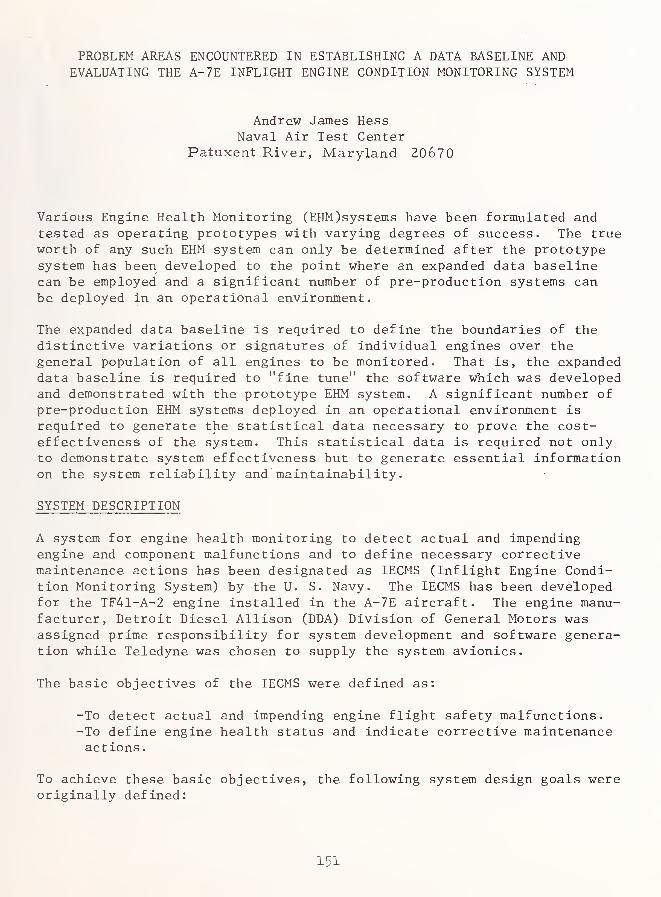
PROBLEM AREAS ENCOUNTERED IN ESTABLISHING A DATA BASELINE ANDEVALUATING THE A-7E INFLIGHT ENGINE CONDITION MONITORING SYSTEM
Andrew James HessNaval Air Test Center
Patuxent River, Maryland 20670
Various Engine Health Monitoring (EHM )systems have been formulated andtested as operating prototypes with varying degrees of success. The trueworth of any such EHM system can only be determined after the prototypesystem has been developed to the point where an expanded data baselinecan be employed and a significant number of pre-production systems can
be deployed in an operational environment.
The expanded data baseline is required to define the boundaries of thedistinctive variations or signatures of individual engines over the
general population of all engines to be monitored. That is, the expandeddata baseline is required to "fine tune" the software which was developedand demonstrated with the prototype EHM system. A significant number of
pre-production EHM systems deployed in an operational environment is
required to generate the statistical data necessary to prove the cost-effectiveness of the system. This statistical data is required not onlyto demonstrate system effectiveness but to generate essential informationon the system reliability and maintainability.
SYSTEM DESCRIPTION
A system for engine health monitoring to detect actual and impendingengine and component malfunctions and to define necessary correctivemaintenance actions has been designated as lECMS (Inflight Engine Condi-tion Monitoring System) by the U. S. Navy. The lECMS has been developedfor the TF41-A-2 engine installed in the A-7E aircraft. The engine manu-facturer, Detroit Diesel Allison (DDA) Division of General Motors wasassigned prime responsibility for system development and software genera-tion while Teledyne was chosen to supply the system avionics.
The basic objectives of the lECMS were defined as:
-To detect actual and impending engine flight safety malfunctions.-To define engine health status and Indicate corrective maintenanceactions.
To achieve these basic objectives, the following system design goals wereoriginally defined:
151

-To reduce engine caused aircraft losses by 50%.
-To achieve a minimum of 90% data recoverability
.
-To achieve a minimum level of 90% valid engine diagnostics.-To handle current and anticipated engine problems.
The lECMS consists of four major elements as follows:
-Engine mounted sensors, transducers and subsidiary hardware formeasurement of 51 engine and airframe parameters.-Aircraft mounted Engine Analyzer Unit (EAU) for data acquisition,signal conditioning, data management (logic) and data output of theengine and airframe parameters.
-Aircraft mounted Tape Magazine Unit (TMU) for mass storage of per-tinent airborne data.
-Ground based Ground Station (GS) for complete analysis, presenta-tion and storage of airborne collected data.
The lECMS sensor package consists of a total of twenty-one transducersthat have been installed on the engine for the measurement of tempera-tures, pressures and flows necessary for diagnosing engine operation.Twenty-four additional sensors relating to switch positions, amperage,voltage, etc. are monitored by way of modifications made to existingengine components and/or wiring. Eleven sensors are extracted from air-frame associated components. Appendix 1 gives a listing o f lEOls para-meters .
The EAU continuously receives and monitors signals from engine and air-frame parameters. These signals are conditioned, multiplexed and con-
verted to digital format within a signal acquisition section of the EAU.
A data management section contains the airborne logic program in anaddressable 8K core memory, advanced digital computer which receivesdigital data inputs at a specified sampling rate. A special signalconditioner is provided to convert certain unusual signals (vibration,fuel flow, etc.) to a type that can be easily accommodated by conversioncircuits. Self test capability is incorporated via software programmingto continuously monitor memory and input/output functioning. Data is
outputted to the TMU as directed by the program logic flow. The EAUmeasures 7.5" x 6.25" x 20.6" long and weighs 32 pounds. The front face
of the unit contains twenty engine limit exceedance status flag indica-tors, thumbwheels for entering documentary data, "self test" pushbuttonand lamp indicator and an electrical test/input connector for externalreadout/entry functions.
The TMU is designed to store two parallel channels of digital informa-
tion, with a data capacity of 2.8 x 10 bits on an endless loop magnetictape. A minimum of four flights can normally be stored on this 2.7
pound unit. If required a minimum of 44 minutes of continuous recordingcan be accomplished before overlap occurs.
The GS accomplishes the final processing and evaluation of the airborne
152

data recorded on the TMU. The central processing facility of the GS is a
Digital Equipment Corporation Model PDF 11/15 computer unit featuring 32K
of addressable core memory. All programs required for data analysis, pre-sentation or storage are located on a 1.2 M word mass storage disc driveunit. A reel type magnetic tape drive system is used for flight history,data transfer and program update purposes. The additional elements thatmake up the GS include a computer command console, line printer unit,high speed reader /punch and tape interface unit.
The lECMS operational functions commence with the airborne EAU. The EAUcotitinuously monitors all sensor parameters, determines the present modeof operation (start, take-off, etc.) and decides on the need for record-ing data on the TMU. Recorded data is directed if any of the followingconditions exist:
-Start/Take-off.-Engine exceedance. -
-Engine transients.-Engine power loss or fluctuation.-Pre-defined conditional modes (ground idle, stable, flight idle,end-of-f light)
.
After every flight, visual inspection of the Flag Display section deter-mines if immediate analysis of the data is required. If no exceedanceflags were tripped and no pilot "gripes" registered, the engine is con-sidered in a "go" status for the next flight. After a series of no ex-ceedance flag flights, data is generally analyzed at the end of dailyoperations
.
Whenever data analysis is required, the TMU is removed from the aircraftand played back by the GS . Data analysis is performed within the GS bya serial investigation of the airborne collected data. Logic flow is
determined by record mode identification and/or "reason for record"indicators appropriately tasked by the EAU. Abnormal operation engineproblems or discrepancies found by the GS logic are documented by "hardcopy" message on the line printer. This engine health diagnostic messagewill be accompanied by the assciciated corrective maintenance action re-quirements. Presently, 230 diagnostic messages are available in thesoftware program. Preceding data analysis, the GS is programmed to auto-matically search and output the engineering data relating to the diagnos-tic message to be used for further documentation and/or to aid the opera-tor in verification of the message.
The following additional programs are available to the GS operator forvarious types of data presentations:
-Flight profile.-Engineering calculation trace.
-Detailed vibration program.
155

-Plot routine (9 parameters vs. time).-Engineering data presentation.
BACKGROUND 5' .
Interest in an EHM system for the A-7 aircraft began in 1971 when an in-flight oil quality indicator called the Environment One (EV-1) unit wasflight tested at the Naval Air Test Center (NATC) . The need for a morecomprehensive engine health monitoring system was recognized as the EV-1unit showed potential as a useful indicator of inflight oil quality.The EV-1 engine health monitoring program expanded in scope first be-coming NADS (Naval Airborne Data System) and then lECMS. A combinationA-7 lECMS feasibility study and prototype "fly off" was accomplished atNATC with 'two teams of manufacturers. Pratt and Whitney Aircraft andHamilton Standard developed a prototype lECMS for the A-7B aircraftwhile DDA and Teledyne developed the A-7E prototype lECMS . Late in 1972,the A-7E lECMS was chosen to continue development during a ten aircraftbaseline/pre-production evaluation in two operation squadrons based atNAS Lemoore. This evaluation culminated with the lECMS equipped aircraftdeploying on the USS Enterprise in the fall of 1974.
To date the A-7E lECMS has demonstrated operational capability in both a
shore and aircraft carrier based environment with approximately 5000flight hours in over 3000 sorties. Evaluation reports indicate that thelECMS hardware has demonstrated good reliability for a pre-productionsystem. The associated diagnostic software routines have been developedto the point where they have demonstrated considerable potential as a
maintenance tool which can automatically define actual and impendingengine discrepancies.
A significant number of lECMS diagnostic "finds" have been recorded andvalidated. The majority of these have been engine maintenance actionindications but a few could be construed as safety-of-flight items.lECMS hardware has passed all military specification bench testing. ThelECMS software has demonstrated the ability to recognize individualengine vibration and performance baseline signatures. lECMS generatedflight history data has been used by the DDA engine Component ImprovementProgram (CIP) for mission analysis investigations and to develop longrange trending capabilities.
THE EXPANDED DATA BASELINE
An expanded data baseline program is a necessary step in developing anEHM system from a single prototype system to a system capable of accu-rately diagnosing the health of any engine within the general populationof all engines. The main reason for conducting the expanded data base-line program is that every engine within the general engine populationis an individual and operates slightly different than the next engine.
Any single sample prototype development effort would, by necessity, tend
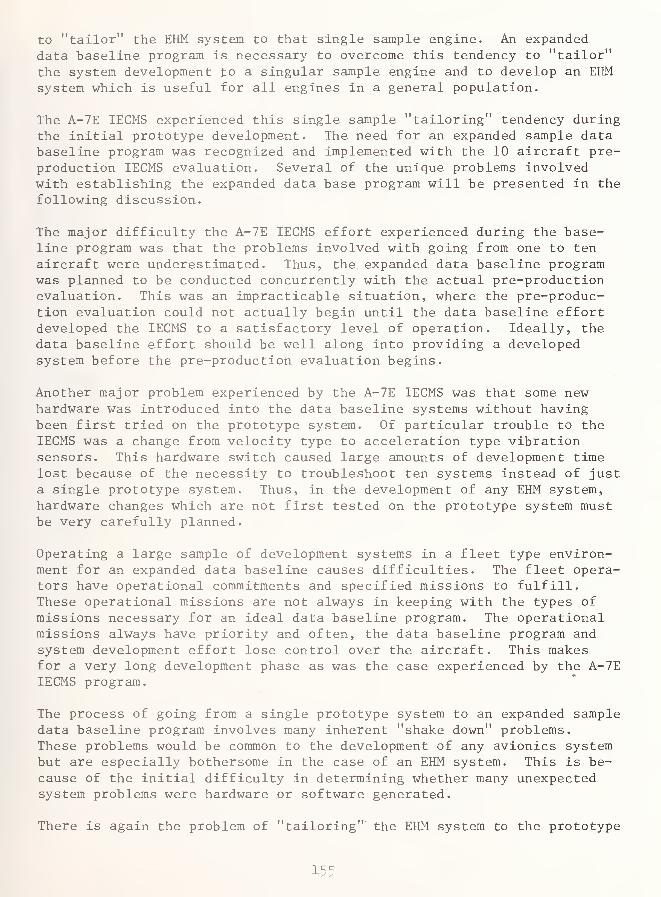
to "tailor" the EHM system to that single sample engine. An expandeddata baseline program is necessary to overcome this tendency to "tailor"
the system development to a singular sample engine and to develop an EHMsystem which is useful for all engines in a general population.
The A-7E lECMS experienced this single sample "tailoring" tendency duringthe initial prototype development. The need for an expanded sample databaseline program was recognized and implemented with the 10 aircraft pre-production lECMS evaluation. Several of the unique problems involvedwith establishing the expanded data base program will be presented in thefollowing discussion.
The major difficulty the A-7E lECMS effort experienced during the base-line program was that the problems involved with going from one to tenaircraft were underestimated. Thus, the expanded data baseline programwas planned to be conducted concurrently with the actual pre-productionevaluation. This was an impracticable situation, where the pre-produc-tion evaluation could not actually begin until the data baseline effortdeveloped the lECMS to a satisfactory level of operation. Ideally, thedata baseline effort should be well along into providing a developedsystem before the pre-production evaluation begins.
Another major problem experienced by the A-7E lECMS was that some newhardware was introduced into the data baseline systems without havingbeen first tried on the prototype system. Of particular trouble to thelECMS was a change from velocity type to acceleration type vibrationsensors. This hardware switch caused large amounts of development timelost because of the necessity to troubleshoot ten systems instead of justa single prototype system. Thus, in the development of any EHM system,hardware changes which are not first tested on the prototype system mustbe very carefully planned.
Operating a large sample of development systems in a fleet type environ-ment for an expanded data baseline causes difficulties. The fleet opera-tors have operational commitments and specified missions to fulfill.These operational missions are not always in keeping with the types of
missions necessary for an ideal data baseline program. The operationalmissions always have priority and often, the data baseline program andsystem development effort lose control over the aircraft. This makesfor a very long development phase as was the case experienced by the A-7ElECMS program.
The process of going from a single prototype system to an expanded sampledata baseline program involves many inherent "shake down" problems.These problems would be common to the development of any avionics systembut are especially bothersome in the case of an EHM system. This is be-cause of the initial difficulty in determining whether many unexpectedsystem problems were hardware or software generated.
There is again the problem of "tailoring" the EHM system to the prototype
155

situation. Operational pilots in a fleet environment, operated the air-craft and engines very differently than the test pilots who flew the p'ro-
totype system. The limLts of these operational differences had to be de-fined at the beginning of the data baseline evaluation. This was thefirst problem the A-7E lECMS experienced when initially introduced intoa fleet type environment.
The development or "fine tuning" of the EHM system software is the majorpurpose of the expanded data baseline program. This in itself, is a
major problem area of a continuing duration. Along with this major con-cern is the sheer logistics of continuously changing and updating thesoftware programs for a large number of aircraft. During software de-velopment, decisions have to be made as to which engines and aircraftare most representative of the general population. Additionally, alldevelopment efforts must be faithfully recorded for both evaluation anddocumentation purposes. Similarly, the problem of documenting all soft-ware changes during this development phase is a large task.
The Pre-Production Evaluation
The whole process of justifying the effectiveness of an EHM system be-comes a statistical data gathering exercise. All diagnostic indicationshave to be tracked, documented, and verified as either valid or invalid.This becomes a very tedious but necessary bookkeeping task. Any safety-of-flight diagnostic "finds" have to be well substantiated and publicizedfor these "finds" will give the greatest credence to the general accep-tance of an EHM system. Maintenance man-hours saved is one of the hard-est items to accurately document but must be carefully recorded. Anattempt should also be made to show savings in the overall engine logis-tics support effort and to define possible impacts on any engine de-velopment or component improvement program. A successfully implementedEHM system should influence all of the above-mentioned areas.
A well planned and thoroughly executed pre-production evaluation can
generate the statistical data necessary to prove the EHM system effectivein all areas of concern. The uncertainity of the conclusions about the
particular EHM system decreases as the accumulation of accurate statis-
tical data on its performance increases. The A-7E pre-production lECMS
evaluation tried to generate the statistical data necessary to decreaseany inherent uncertainties and prove the lECMS effective in the opera-
tional environment.
In April 1973, the Naval Aviation Integrated Logistic Support Center
(NAILSC) was tasked to monitor and evaluate the application of the lECMS
for the maintenance of the A-7E aircraft. The NAILSC effort, in con-
junction with the monitoring of the technical development of the lECMS
by the NATC, encompassed the pre-production evaluation.
While generating statistical data on the lECMS performance during the
course of the evaluation, NAILSC was tasked to monitor and evaluate fleet
156 I

usage of these systems with particular attention to the following:
-Identification of those lECMS required maintenance actions whichwould have resulted in safety-of-f light situations if not detected.-The validity of maintenance actions indicated by lECMS
.
-The in-service reliability of lECMS
.
-The comparison of maintenance performed on lECMS equipped and non-lECMS equipped engines.
-Operation availability of lECMS equipped engines and aircraft.
-The logistics support requirements for lECMS and lECMS equippedengines
.
In order to perform the pre-production evaluation, a detailed test planwas written. The test plan stipulated the precise requirements of allactivities and persons involved in the evaluation. This test plan hadto be agreed to and approved by all concerned persons involved with thelECMS program before the evaluation could commence.
In spite of the meticulous preparation and planning, certain problemareas emerged during the course of the A-7E pre-production lECMS evalua-tion. These problem areas seem to be unique to the evaluations of anyinflight EHM system. These unique problem areas are presented and com-mented upon in the subsequent discussion.
Probably the most difficult milestone to determine in any pre-productionevaluation is that point in time when the system development effort stopsand the actual evaluation begins. Statistical data, gathered during thesystem development phase, could show poor system performance because of
major unsolved development problems. Unpredicted hardware and softwareproblems inherently occur during any system development effort and wouldnecessarily bias the results of a premature evaluation. The A-7E lECMSprogram experienced exactly this phenomenon.
The pre-production evaluation took several "false starts" which were"called back" because of yet unsolved hardware and software problems.These hardware and software problems were causing too great a negativebias on the statistical results to perform an accurate evaluation. Thisproblem is magnified by the fact that for a sophisticated EHM system,the software development is an ever continuing effort.
A problem which must be faced at the commencement of the evaluation is
the definition of a valid diagnostic "find". This definition of a valid"find" must be agreed to from the program onset by all persons concernedwith not only the evaluation but the whole program. The inherent ten-dency to change the basic definition of a valid diagnostic during the
course of the evaluation could cause great inaccuracies in the statisti-cal data. This confusion occurred during the A-7E lECMS program. Thesituation developed where every evaluator plus the system manufacturerand fleet operators seemed to have a different definition of a valid
157

diagnostic "find" by half way through" the evaluation. The same rule for
a single and continuous definition of the valid diagnostic "find" holdstrue for the definition of an Invalid diagnostic.
As with the valid diagnostic "find", an exact definition of what is a
safety-of-f light item should be stated from the beginning of the evalua-tion. Again, all persons involved should concur with this definitionand a working list of safety-of-f light items should be developed. Thisproblem also occurred with the A-7E lECMS evaluation. As engine discre-pancies were discovered by the lECMS , there was great disagreement onwhich "finds" could be considered as safety-of-f light items.
The subject of safety-of-f light brings up the topic of operator confi-dence level. A pre-production EHM system will not and should not havea total operator confidence level. As the system develops and provesitself, the confidence level will increase. A major problem area de-velops when the EHM system has a cockpit warning indicator. The questionarises, should the pilot heed a system cockpit warning of a safety-of-flight problem and abort an assigned mission or should the pilot considerthe warning just a false indication of a yet to be completely developedsystem? This dilemma of operator confidence level is most prevalent to
a lesser degree when involving inflight indications but also is presentto a lesser degree when involving ground maintenance diagnostic indica-
.
tions. The A-7E lECMS evaluation addressed this problem of Operatorconfidence level by following the doctrine of always believing the systemunless there are obvious contradictions to the system indicationspresent.
Validating diagnostic finds create another major problem area. Every
system diagnostic indication must be verified and validated by the per-
formance of a resulting maintenance action. This becomes a significant
bookkeeping exercise for both the evaluation personnel and the opera-
tional maintenance department. Special records must be kept on every
engine discrepancy indicated by the system until the diagnostic is veri-
fied either valid or invalid. This problem becomes especially large
when the diagnosed engine component must be sent to a distant overhaul
facility for verification. A detailed documentation plan that addresses
diagnostic verification should be implemented well before the actual
evaluation begins.
The documentation problem also extends to the EHM system software de-
velopment. The software programs will continually change as the EHM
system is developed. Updated documentation of the total system soft-
ware programs should be supplied to the evaluating activity throughout
the evaluation. The current software documentation will greatly aid in
determining the total system integrity as development problems are ad-
dressed and solved.
The EHM system development effort and data baseline expansion program
158
must necessarily be conducted by the manufacturer's engineering person-
nel. This was the case with the A-7E lECMS program. The system manu-facturer personnel also operated and maintained the lECMS during thepre-production evaluation. This situation caused the A-7E lECMS pre-
production evaluation to generate incomplete statistical data on systemmaintainability and reliability as well as on required operator skill
level necessary to effectively use the system.
The evaluation should be conducted with user personnel operating and
maintaining the total EHM system so that a positive determination can be
made of system performance under actual operational conditions. Afterthe evaluation begins, the manufacturer personnel should be on site onlyfor diagnostic assistance or operator consultation. All contractor as-
sistance must be documented so that additional personnel training can
be initiated to eliminate deficient areas.
The user personnel involved in the evaluation should receive a thoroughtraining course on system software operation and hardware maintenancewell before the evaluation begins. To obtain the most accurate statisti-cal data from the pre-production evaluation, the user personnel mustoperate and maintain the total system. If this situation occurs a re-sponsive training plan can be developed and system maintainability andreliability deficiencies can be defined early enough to allow correctionsto be made before the production EHM system is implemented.
CONCLUSION
It has been previously stated that the whole process of justifying theeffectiveness of an EHM system becomes a statistical data gatheringexercise. The A-7E lECMS experience has proven this true and shown that
the processes of setting up and conducting the required data baselineand pre-production evaluation programs are far from easy. Much carefulplanning and coordination must go into structuring these programs to
give the most informative and accurate results. Nevertheless, unexpectedproblem areas will arise, causing the data baseline and pre-productionprograms to be less than 100% effective. Some of these problem areasunique to the development and evaluation of an EHM system can be reducedby the thoughtful observation of the mistakes made during previous pro-grams as the A-7E lECMS experience.
159

lECMS MASTER PARAMETER LIST
ITEM NO. PARAMETER
1 HYDROMECHANICAL GOVERNOR PRESS.2 HP PUMP INLET PRESSURE3 HP PUMP OUTLET PRESSURE4 LOW PRESSURE GOV. DELTA P
5 MAIN MANIFOLD FUEL PRESSURE6 PILOT' MANIFOLD FUEL PRESSURE7 , BY-PASS STATIC PRESSURE8 BY-PASS TOTAL PRESSURE «r
9 HP COMPRESSOR OUT PRESSURE10 OIL PRESSURE (DELTA P)
11 TURBINE OUT PRESSURE12 LP COMPRESSOR INLET TEMPERATURE13 HP COMPRESSOR OUT TEMPERATURE14 TURBINE OUT TEMPERATURE15 PMG L.H. SHORTING LOOP CURRENT16 IGNITION EXCITER L.H. PRIMARY CUR17 PMG A.C. VOLTS (L.H. COIL)18 PMG R.H. SHORTING LOOP CURRENT19 IGNITION EXCITER R.H. PRIMARY CUR20 PMG A.C. VOLTS (R.H. COIL)
21 PMG D.C. VOLTS22 AUTO RELIGHT ACTUATOR23 COLD START SOL. VOLTS24 . DOUBLE DATUM ARMED
,
25 OVER DATUM RELAY26 LPC SOLENOID CURRENT27 LPC SOLENOID VOLTS28 LP ROTOR SPEED29 OIL SCATTER30 OIL ATTENUATION31 OIL FLOW32 OIL MONITOR FAIL
33 FILTER (OIL) DELTA PRESSURE34 INLET GUIDE VANE POSITION35 POWER LEVER ANGLE36 OIL TEMPERATURE37 LP COOLING AIR
'
38 OUTSIDE AIR TEMPERATURE39 TURBINE VIBRATION40 COMPRESSOR VIBRATION41 ACCESSORY VIBRATION42 AIRCRAFT G. LOADING
,^ APPENDIX 1
l6o

ITEM NO. PARAMETER
43 IH SPARK RATE44 R.H. SPARK RATE
45 HP ROTOR SPEED
46 FUEL FLOW47 OIL LEVEL NORM48 ' OIL LEVEL (1/2 FULL)
49 - - A/C IGNITION
50 ^ A/C MAIN/MANUAL FUEL CONTROL SW.
51 - A/C MANUAL FUEL VALVE POSITION52 STARTER AIR53 A/C WEAPON FIRING SWITCH54 OIL COOLER DELTA P
55 LANDING GEAR SQUAT SWITCH56 ALTITUDE57 MACH NUMBER5859 HP PUMP FAILED60 STALL DETECTOR61 H.P. COMPRESSOR OUT PRESSURE62 RUMBLE FILTER 1
63
64 TIME
65 FUEL TEMPERATURE66' L.P. FUEL PUMP OUT PRESSURE
NOTE: Recently several of these parameters have been dropped due to
cost-effectiveness considerations
.
APPENDIX 1
l6l

DISCUSSION
0. E. Compton, Northrop Corporation, Aircraft Division : Did youIdentify the signature of a given engine on the test cell on the
ground?
A. J. Hess : The procedure followed when installing lECMS for the firsttime is, in the process of normally trimming the engine, to establish a
base line by stabilizing at 4 or 5 RPM points. The systemautomatically records the engine data. This establishes the base linesignature information for each individual engine. The only time youhave to redo it is when you change airborne units or change somethingwithin the gas path of the engine.
0. E. Compton : What if you were to place that engine in anotherairplane?
A. J. Hess : If you place the engine in another airplane, you wouldhave to obtain another base line signature, but placing the engine in
another airplane requires another trim procedure anyhow, so you couldget that data with 20 minutes additional ground work.
0. E. Compton : So basically, the identification of a signature is an
engine that is installed in the vehicle, and not on the test cell?
A. J. Hess : That's right.
0. E. Compton : What type of induction system variances, environmentalcontrol variances, and shaft horsepower variances do you find amongdifferent vehicles in trying to identify the specific signatures?
A. J. Hess : In a turbo-fan engine, you don't worry about shafthorsepower. But, each engine does operate differently. We establishnominal curves representing the general population of all the engines.Then rejection tolerance bands or limits are established around eachcurve. The tolerance band has to be large enough to take into accountthe variances within all engines in the general population, but it
can't be too large or engine discrepancies will be missed. A largepart of the data base expansion program is trying to find where to put
the tolerance bands.
J. S. Bendat, Independent Consultant : In regard to the vibrationanalysis, did you do any narrow band analysis, any transfer functionanalysis, or any of the more advanced analyses that would really definewhat was going on?
162

A. J. Hess : Allison may have used these techniques, but they didn't.
recommend them to be used in lECMS. Essentially, the vibration team
looks at these things: (1) the overall engine vibration level for each
of the three transducers, and (2) each of the 21 discrete one-third
octave frequency bands for a change either up or down above a certain
established "colerance limit. If either of these two things occur, we
get an exceedance flag. That tells you that there has been a change in
the vibration signature. This new signature is compared with
signatures for specific component failures. Those signatures were
generated from actual test cell failures that Allison experienced.
R. Hohenberg, Mechanical Technology, Inc. : What are the requirements
of transducers in order to achieve your goals?
A. J. Hess : The vendor, Allison, picked the transducers. We do have a
requirement for very good accuracy. And we do have a requirement for
the transducers to live in a hostile environment, namely, the enginebay where there are extreme changes in temperature and pressure. With
these requirements, the transducers are costly. The pressuretransducers are costing us about $1,000 a piece.
R. Lenich, Caterpillar Tractor Company : In what ways do the prototypepilots differ from operational pilots in the way they handle airplanesand which is more severe on the airplane?
A. J. Hess : The fleet pilot is much more severe. At Patuxent Riverthere are very experienced pilots who have been through the testpilot's school. In developing the prototype system, these pilots flyprofiles to aid the contractor in developing the software. Theyusually do what is asked of them. They are very smooth in the way theyhandle the throttle and stick. In a fleet environment there are bothexperienced and brand new pilots. Naturally, there are differences in
how they fly and in how they handle the engine. Also the missions theyfly are entirely different. Also the way the engine is handled differsaccording to whether the pilot is flying lead or wing. The wing manmoves around quite a bit more than the lead man. As fallout from thelECMS program, we're learning very much about how that engine is
actually being operated. In the fleet envihonment, one of the thingswe are using that information for is to develop some type of low cyclefatigue counter for certain critical engine problems.
T. Tauber, Tedeco : I have two questions: (1) did you attempt tocorrelate your data with SOAP results and (2) what other oil analysestechniques were considered and were evaluated and ultimately rejected?
A. J. Hess : This whole program started with the environment-one oil
quality transducer. We haven't had an airborne oil problem to date(5,000 hours). We had a bearing failure on the lECMS equipped enginethat was run on a test cell at Allison. The environment-one unit
165

picked it up before the test cell vibration equipment picked it up..
The Navy is looking at new types of magnetic flux chip detectors.Those could easily be integrated into an lECMS program. SOAP is a
normal program in the Navy. We had false indications for theenvironment-one unit early in the program. These were caused by theunit failing. We did correlate them with SOAP.
M. Dow, Eastern Airlines : Can you give me some idea of how many manhours have gone into the program development so far?
A. J. Hess : I don't know how many man hours were involved, but thedevelopment phase cost several million dollars. It took us the firstcouple years to develop the hardware and it took us another year and a
half or two years to develop the software. I don't think thefeasibility study has to ,be done again for the next system. Usingstate-of-the-art-hardware, you could rely on our precedence and just go
into the development effort of software.
lA. Dow : Are there a large number of people engaged in this work?
A. J. Hess: Fifteen.
161+

TRT RKT^VTCK OTT, ANALYSTST^FISKAPHH ATJTl nKVET.OPN^NT PROCTAM
Peter B. Senholzi
Naval Air Engineering Center, Lakehurst, N. J. 08733
Oil analysis can be described as a preventive maintenance conceptutilized to predict impending mechanical failure through the examinationof used oil sam.ples . This concept, although varying in technique, has
been apolied for many decades. Initially, physical properties of oil"were considered indicators of equipment wear. However, consistentresults were not obtained until examination emphasis shifted to theanalysis of oil carried wear particulates. The term oil analysis hasthus become synonymous with oil particulate analysis.
Spectrometric oil analysis has developed as the foremost analyticaltechnique utilized at the present time. This technique involves theconcentration measurement of various elements contained in a used oilsample. Spectrometric analysis has demonstrated that the analysis ofwear metal particulate matter that accumulates in a closed cycle oil
wetted system can, with varying degrees of success, be used as a meansof gauging wear and thus predicting mechanical component failure. Thetechnical basis for the effectiveness variations exhibited by this tech-nique, as well as related techniques, has not as yet been factuallydefined
.
The optimal development process of an oil analysis technique can bebroken down into four distinct phases as shown in Figure I.
:DISPONENT
WEARMODES
PARTICULATECHARACTERISTIC
CORRELATION
ANALYSISTECHNIQUE
FIELDAPPLICATION
OIL PARTICUIATE ANALYSISFigure I
The first element in any such development program is the definitionand categorization of all pertinent mechanical system wear modes. Thiscategorization would list wear modes that contribute to lubricant par-ticulate content. All oil wetted components would be considered in sucha study.
The second element of the development program would be to experi-mentally determine wear particulate characteristics and parameters andrelate these factors to the wear state of a component. This correlation
16^
effort would be instituted for each wear mode and serve to highlightcritical parameters. The monitoring of these critical parameters couldbe directly related to the wear state of a component.
Based on the determination of critical particulate parameters, ananalytical technique or combination of techniques can be developed. Thistechnique definition comprises the third element of the respective pro-gram.
The fourth and last element of this program would be the fieldapplication of developed techniques. This application would serve toprovide effectiveness data as well as serve to dictate modifications if
required
,
Based on research performed under the Tri Service Oil Analysiseffort, the following determinations were formulated with respect topast oil analysis technique development:
Numerous wear mode classification efforts have been performed.
Many analytical techniques have been developed.
Many techniques have been field tested.
An insignificant amount of effort has been performed correlatingwear modes with wear particulate characteristics and parameters.
These determinations reveal that a major element of the oil analy-sis technique development program has been neglected , Very little workhas been performed which serves to clarify which particle characteris-tics should be monitored. Analytical techniques developed to date arebased on critical particulate characteristic assumptions and have beenapplied by trial and error.
The Tri Service Oil Analysis Research and Development Program wasconceived by the Naval Air Engineering Center (NAEC) to bridge the tech-nological gap that now exists with respect to oil analysis techniques as
described above. Its goal is to place oil analysis on a more securebasis. Briefly the program can be summarized as follows:
Laboratory testing to determine the feasibility of pre-dicting the wear state of oil wetted components through theutilization of critical wear mode parameter monitoring.
In order to achieve this program goal, a three phase effort has
been instituted by NAEC. These phases consist of data base formulation,laboratory study, and system application as depicted in Figure II.
166

DATABASE
LABORATORYSTUDY
SYSTEMAPPLICATION
OIL ANALYSIS PROGRAMFigure II
Each program phase shall be discussed separately as follows:
(l) Data Base
The data "base phase of the program serves to provide informa-
tion necessaiy to initiate meaningful laboratory testing as well as
effectively evaluate test results. The initial thrust of this effortwas the derivation of wear mode matrices for each prime oil wettedwearing component. Matrices were derived for ball bearings, rollerbearings, gears, and sliding contacts. These four components were deter-mined to be prime components of oil wetted systems. Each matrix relatescomponent operational parameters to particular wear modes. Wear condi-tions encountered under laboratory test are cataloged through utiliza-tion of these matrices. Matrices are enclosed as Appendix I.
A secondary effort under the data base phase is the categori-zation of oil carried wear particle morphology. Under this effort, a
number of distinctive particle types have been identified. The particletypes are as follows:
Rubbing Wear Particles
Rubbing wear particles are generated whenever two pieces ofmetal rub together in the presence of a lubricant. It has been foundthat they originate in a shear mixed layer which, in the case of steel,is in the order of 1 ;jm thick and exhibits only short range crystallineorder. This layer, the significance of which has only recently beenappreciated, has unique properties different from those of the underly-ing metal. Most wear of rubbing metal surfaces is the result of flakingoff of pieces of the shear mixed layer as the result of a network ofcracks that gradually develop with repeated passes of the opposing sur-face. This type of wear is relatively benign and is fundamental toboundary layer lubrication.
Oxide Particles
Some wearing systems show large quantities of the red oxideof iron, hematite, Fe203. Such oxide particles are easily recognizedin the microscope using transmitted white light and are even morestriking using transmitted polarized light with crossed polars . Theyare the result of rusting in the machine and generally indicate thepresence of moisture or moist conditions which permit the rusting to
16?

at the vearing surface, but is
insides of pines, and many
The oxides of other metals may be white, blue, green, orye I Low, depending on the metal.
Dark Metallo-Oxide Particles
Another category consists of dark metallo-oxide particles"Which are thought to be principally FeqOij. (magnetite). These particlesare non-stoichiometric oxides and may be thought of as oxides with irondissolved in them. They are surprisingly more opaque than would beexpected from pure Fe^Oj^. These particles appear as black or very darkchunk-like oarticles, similar to pieces of hard coal. It is postulatedthat they are sufficiently hard to cause surface denting and subsequentmicro-cracking of the surfaces of rubbing elements in bearings.
A second type of dark chunk-like particle has been foundrecently, usually accompanied by dark flat platelets witlf straight sidesThey appear to be the wear product from carbon seals or separators. Thechunk-like particles do not have the sharp edges characteristic of mag-netite; the fracture surfaces are concoidal, sim.ilar to that of glass.
Cutting Wear Particles
Cutting wear particles have the appearance of tiny lathe chipsor coils of fine wire. Such particles are the result of the failure ofthe boundary layer lubrication and are usually associated with high sur-face contact forces. They may also be generated by the presence ofabrasives. An independent investigator has proposed that these abra-sives can be synthesized on wearing surfaces.
Fatigue Chunks
Another type of particle is the fatigue chunk or grain. Theyare composed of free metal, usually ferrous and show crystalline facescontaining considerable detail. They are approximately as long as theyare wide and are often several microns thick. Such particles are generated by certain types of gear wear and are seen in other situations wherecracking perpendicular to the surface can develop.
Laminar Particles
Laminar particles are found in connection with gear and roll-ing bearing wear. They are exceedingly bright free metal particles mostfrequently seen in connection with rolling bearing wear. The particlesare thin, typically 3/^ pi^ thick, and generally have holes in their sur-
face. They appear to be the result of rolling out of the metal as couldoccur in the shear mixed layer on the ball bearing track or near the
occur. The rust is usually not generatedsimply material flaked off of shafts, theother places
,
168

pitch line of gears.
Spherical Particles (Free Metal Spheres)
Spherical particles are generated by the thousands in caseswhere micro-cracks are present in rolling bearings, such as ball bear-ings and roller bearings, lubricated by either oil or grease. Theyrange in size from less than 1 pm to more than 10 jam. The smaller sizes
are much more numerous. Up to several million spheres can be g^-nerated
in the course of a bearing fatigue failure.
These spherical particles are not to be confused with pol}/rner
spheres or oxide spheres. The pol;;y7ner spheres are thought to be theresult of polymerization of oil around wear particles which serve as a
nucleating catalyst.
Oxide spheres are produced in a variety of ways, but probablythe most common is fretting of steel surfaces. The non-free metalspheres are easily distinguished from free metal spheres by virtue ofthe reflectivity and opacity of the free metal. In bichromatic illumi-
ination, free metal spheres appear red and the non-metallic or oxidespheres appear green
.
Corrosive Wear Particles
Corrosive wear particles are those particles which have beendigested by the lubricant. They are distinguished from red and blackoxides of iron because they are generally colorless and much more trans-parent. They may be chlorides of the wearing material.
Non-ferrous Metallic Particles
These particles may belong to any of the first five classes.
Hybrid Particles
Hybrid particles are composed of non-ferrous material whichalso contain some iron. They result from the wearing of some non-ferrous alloy, such as bronze, against steel.
Non-metallic Crystalline Particles
Non-metallic crystalline particles are common, the mostfamiliar example being sand. However, other oxides and carbides, suchas silicon carbide, are also frequently seen. The significance of suchparticles depends on local conditions. The presence of sand, for ex-ample, can indicate an air filter failure or a bearing seal that is
leaking
.
169
Amorrihous Material
Amorphous material usually consists of deposits of material"Which does not have a specific shape. The material is usually translu-cent but often contains thousands of metal particles. Various con-taminant polymers such as gasket material and plasticizers are the majorsources of this material.
The above two efforts constituted the bulk of the work per-formed under the data base program phase. Except for revisions, thisphase has been completed
,
(2) Laboratory Study
The laboratory study phase of the program, involves the benchtesting of nrime oil wetted components. The objective of this phase is
to monitor both the component surface wear condition and the respectivegenerated wear particle characteristics and parameters. Correlationscan then be drawn between surface wear progression and particle charac-teristic/parameter trends. Trend analysis will serve to identifycritical particle characteristics which reflect' the wear state of oilwetted components
.
Under this phase, bench testing has been instituted for ballbearings, roller bearings, gears and sliding contacts. These compon-ents have previously been identified as prime wear components in oilwetted systems. Component test parameters reflect field operating con-ditions to the greatest extent possible. Examples of these parametersare presented in Figure III. Each component is operated in an individ-ual closed-loop lubrication system. Oil specimens are periodicallysampled from the lubricant system and subjected to a battery of particu-late analysis techniques. These techniques include the following:
- Ferrographic Analysis- Millipore Patch Analysis
SEM MicroscopyOptical MicroscopyDensitometer AnalysisParticulate Counts
- Acidity MeasurementsViscosity MeasurementsColorimeter AnalysisSpectrometric AnalysisTEM Microscopy .
-
The above techniques serve to classify wear particle, size,
size distribution, shape, color, density, and concentration among others
In addition to oil specimen sampling, the component wear sur*-
face is monitored at predetermined intervals during testing. Both
170

6309 Deep -GrooveBall Bearing
LM1029U9/LM102910Tapered-Roller
Bearing
1. Bore diameter (D, mm) ^5.2
2
.
Speed (N, rpm) 9,700 2,900
3. D X N X 10"^ oM 0.13
h. Lube MiL-L-23699 MIL-L-23699
5. Lube viscosity at 38/lOO°C 25/5.1 25/5.1
6. Radial Load (kN) 18.7 18.
U
7. Axial Load (kN) 0
8. Bearing Capacity (kN) 39.63 i+7.62
9. Theoretical Lio Life:
10^ TPvnT 1](" i nn
10^ stress cycles10
50
10
130
10. Theoretical L50 Life:
10^ revolutions10^ stress cycles
50250
50
650
BEARING TEST PARAr-ffiTERS
Figure III
optical and scanning electron microscopy are utilized in this surfacemonitoring effort.
Particulate analysis trend results are then compared and cor-
related "with respective wear surface monitoring results. This correla-tion effort serves to identify critical particulate characteristics and/or parameters
.
Component bench testing has been initiated for ball and rollerbearings, as well as sliding contact. Gear bench testing is imminent.As a result of this early test stage, it would be premature at this timeto draw any conclusions from the above described correlation efforts.
Although correlation results have not been firmly established,several significant findings have evolved from this laboratory study
171

program phase. The first area of findings involves oil sample storage.In order to insure viable test results, representative oil specimensmust be taken from test systems. These samples when subjected to analytical techniques, after various storage periods, must remain representative of the test system lubricant. Under the oil analysis program, astudy was initiated to investigate the storage characteristics of oilsamples. The following findings, some still not fully explained, wereuncovered.
Different lubricants exhibit significantly differentabilities to retain particles in suspension.
The particle agglomeration characteristics of differentlubricants exhibit much variance.
- The longer an oil specimen is stored, the more difficultit is to redisperse the contained particles.
Mild heating {"J2°C) followed by manual shaking has beendetermined to be the most effective method to thoroughlyredisperse stored oil samples.
- Analysis of heated oil samples in contact with tygonexhibits deposits of plastic gels. This plastic materialtends to coalesce near or around wear particles.
- Accelerated heat aging of oil samples in polypropylenebottles results in the migration of components of theplastic into the oil.
The most significant finding to result from this program hasbeen the full realization of what a truly clean lubrication system canmean in extending the life of operating components. Ultra clean lubri-cation systems, utilized in ball bearing bench testing, have consis-tently resulted in the extension of bearing operational life in excessof ho times their calculated expected life. This life extension dra-matically illustrates the major influence oil particulate contaminantsexert on the wear rate of a lubricated comnonent.
The above efforts and resulting initial findings constitute a
brief overview of the work performed under the laboratory study programphase. This phase is expected to be completed within the next sixmonths
.
(3) System Application
The third and final phase of the oil analysis program involvethe application of laboratory findings to field operating systems. Theobjective of this phase is to verify laboratory component test resultsand conclusions.
172

Under this phase various field control groups have been organ-ized , Oil samples are collected from respective equipment that fallwithin these groups. Each time a sampled piece of equipment experiences.an oil wetted component replacement, the worn or broken part, as well as
any pertinent reports, are collected. This process creates a repositoryof failed parts and respective series of preceding oil samples. Arespository of this type serves as an excellent system application testfor laboratory developed results and conclusions. The application oflaboratory monitoring methodologies to repository oil sample failureseries will serve to verify the applied methodologies.
Control groups that have been organized under this phase con-
sist of landbase, shipboard, and airborne equipment. Oil wetted systemsof the aircraft, UH-1 helicopter, m60 tank, and nuclear submarinesare presently being monitored . At the conclusion of the laboratorystudy program phase, results will be verified by application to thesefield control groups. This phase will be completed within the nexteighteen months.
The above described three phase program approach will serve tobridge the technological gap that exists with respeict to oil analysistechnique development. Expected results to be derived from this pro-gram can be summarized as follows:
Definition of Wear Components.
- Identification of Critical Wear Modes.
- Feasibility of Identifying Critical Wear Mode Parameters.
Feasibility of Correlating Critical Wear Mode ParameterMonitoring to VJear Component Failure.
Definition of Monitoring Criteria.
These results will serve to explain the variations in effectivenessof existing oil analysis techniques as well as serve as a firm technicalbasis for the development of a more sophisticated technique.
175

WEAR MODE MATRICES
APPEiroiX I
\
17^+

(16)
Cavitation
gouging
of
sui'faces
Below
atmos
.
pressures
will
cause
oil
bubble
collapse
and
impingement
System
should
be
designed
to
prevent
cavitation
conditions
(15)
Nicks,
Dents
and
Score
Marks
Abuse
and
mis-
handling
can
cause
damage
(11)
Fretting
Corrosion
Welding,
shearing
and
subsequent
oxidation
can
occur;
ex.
splines
May
allow
metal
-to-metal
contact
Can
contribute
to
fretting
corrosion
in
splines
(9)
Pitted,
Stained
Surfaces,
CorrosionCorrosive
agents
and
oxidized
products
can
attack
surfaces
Can
allow
corrosion
from
contaminants
including
water
Combustion
products
will
form
acids
which
attack
surfaces
Will
increase
chemical
activity
of
products
in
lubricant
and
from
combustion
(8)
Roughened
Mlcrodented
Surfaces, Abrasion,
Erosion
Metal
contamination
can
cause
abrasive
wear;
also
erosion
of
surfaces
from
flow
of
lubricant
Products
of
internal
combustion
such
as
carbon,
sulfides
will
damage
surfaces
(1)
Spalllng
of
a
Bearing
Surface, Fatigue
Can
cause
fatigue
damage
to
a
surface
subjected
to
repeated
loading
Material
may
have
inadequate
strength
to
resist
fatigue
crackingSystem
may
not
have
sufficient
strength
to
withstand
Shock
load
(15)
Smearing
and
Scuffing
in
the
Sliding
Direction,
Adhesion
Inadequate
film
strength
may
result
in
metal
-to
-metal
sliding
contact
May
prevent
localized
film
separation
May
prevent
adequate
film
strength
and
cause
oil
breakdown
Improper
surface
finish
may
prevent
film
separation
Surface
geometry
may
prevent
adequate
lube,
film
development
B)
Shock
load
D)
Vibration
F)
Deficient
lubrication
c)
Misalignment
H)
Incomplete
sealing
P)
Destructive
operating
environment
M)
High
environmental
temperatures
I)
Manufacturing
and
material
deficiencies
J)
Incorrect
design
L)
Improper
175

(7)
Heavy
Cage
Wear
and
Breakage
Can
Impose
damaging
loads
on
cage
May
not
have
film
separation
on
land
riding
surface
Land
guided
cage
required
to
with-
stand
centrifugal
(6)
Pattern
of
Oblong
Scuff
and
Fret
Marks
on
Raceways
False
Brlnnelllng
May
occur
with
int.
clr.
and
poor
film
damping
(5)
Oblong
Dents
and
Flat
Spots
on
Rollers
and
Raceways
Brlnnelllng
Load
exceeds
static
capacity
May
cause
permanent
denting
Inadequate
capacity
tc
resist
brlnnelllng
(M
Heavy
Smear
Tracks
and
Discoloration
on
Raceways
and
Rollers
Can
cause
sliding
and
skewing
of
rollers
Insufficient
traction
can
cause
roller
skidding Boilers
may
not
slide
on
film
of
oil Increases
the
tendency
to
skid
with
light
loadToo
much
Internal
play
can
contribute
to
skidding
(3)
Extensive
Glazing,
Frosting
Mlcrospalllng
of
Stressed
Surfaces
May
cause
a
break
through
of
a
thin
filmCan
cause
film
breakdown
at
edges
Can
cause
a
loss
of
film
strength
with
raetal-to-
mttal
contact
Poor
surface
finish
can
cause
surface
distrees
May
cause
lube
breakdown
with
loss
of
film
strength
(2)
Spalling
at
Roller
and
Raceway
Edge
of
Contact
Heavy
edge
load-
ing
will
greatly
increase
contact
stresses
May
result
from
an
Inadequate
crown
on
rollers
and
raceways
(1)
Boiler
and
Raceway
Spalling
May
greatly
accelerate
fatigue
damage
Increase
in
stress
cycles
which
accelerates
fatiguing
of
surfaces
Soft
metal,
bad
grain
flow
and
size
can
increase
fatigue
likelihood
Insufficient
load
carrying
capacity
can
cause
fatigue
damage
A)
Heavy,
prolonged
load
,
B)
Shock
load
c)
Misalignment
D)
VlbratlOD
E)
Very
light
load
F)
Inadequate
or
poor
quality
lubricant
G)
Excessive
speed
H)
Incomplete
sealing
1}
Manufacturing
or
material
deficien-
cies
J)
Incorrect
bearing
design
K)
Improper
mounting
L)
Improper
handling
M)
High
environmental
temperatures
N)
Presence
of
electric currents
176

(15)
Nicks,
Deats
and
ecore
Marks
on
BearingsAbuse
and
rough
handling
may
result
in
damage
Crock
Formation
on
Rings
and
Rollers
Can
occur
with
thru-hardened
steels
Improper
heat
treat
can
cauae
cracking
Too
tight
a
fit
1
may
cause
ring
cracking
i
3 41iilil A
loose
fit
may
cause
creep
and
fretting
corro-
sion
(10)
ITiermal
Growth,
Discoloration
and
Seizure
of
Bearing
Burnout
Inadequate
heat
removal
capability
Can
increase
heat
generation
Prevents adequate
heat
removal
from
bearing
(9)
Pits,
Stains
on
Raceways
and
Rollers,
Corrosion
Damage
may
be
caused
by
cor-
rosive
agents
and
oxidized
products
in
oil Corrosive
agents
such
as
water
may
destroy
surfaces Electric
current
may
cause
exten-
sive
pitting
of
(8)
Roughened,
Mlcrodented
Surraces
with
Increased
Ipternal
Play,
Abrasion
Metal
contami-
nation
may
cause
abrasive
damage
to
surfaces
(IM
Excessive
'Papered
Roller
End
Wear
at
the
Cone
Rib
Can
cause
metal
-
to-raetal
sliding
contact
An
incorrectly
specified
fitup
to
control
end
play
or
preload
Incorrect
fitup
can
increase
roller
end
load
A)
Heavy,
prolonged
load
B)
Shock
load
D)
Vibration
E)
Very
light
load
Inadequate
or
poor
quality
lubricant
G)
Excessive
speed
H)
Incomplete
sealing
I)
Manufacturing
or
material
deficien-
cies
J)
Incorrect
bearing
design
K)
Improper
L)
Improper
handling jl2: N)
Presence
of
electric
177

19)and
Dn
Inward
ge
case
e ue
to
1
a
case
soft
a
!|
case
ybe
lent
Crushing
Distorti(
of
"the
Ci
May
dama,
if
sever
enough Damage
d
too
thin
and
too
core
Required
depth
ma
insuffic
(18)
Crack
Formation
on
Gear
Can
result
from
bad
heat
treat-
ment
(17)
Fracture
of
Corner
Tip
of
Tooth
Can
cause
very
heavy
localized
bending
stress
Can
result
in
a
misaligned
gear
(16)
Fatigue
Fracture
of
Tooth
with
Focal
Ft.
and
Contour
Lines
May
exceed
bending
stress
limitBending
stress
may
be
insuffi-
cient
for
oper-
ating
conditions
(15)
Scoring
Lines
in
Direction
of
Sliding
Inadequate
film
strength
may
result
in
metal-
metal
sliding
contact
A
rough
surface
finish
may
result
in
lack
of
film
separation
Inadequate
j
backlash
can
cause
gears
to
run
hot
May
result
in
lubricant
film
breakdown
(1)
Spelling
of
Tooth
Surface
Increased
contact
stress
promotes
fatigue
Can
increase
probability
of
fatigue
damage
Soft
metal,
bad
grain
flow
and
size
can
cause
spalllng
out
of
the
surfaces
Poor
gear
geometry
may
result
in
high
stress
levels
A)
Heavy,
prolonged
load
B)
Shock
load
c)
Misalignment
F)
Deficient
lubrication
H)
Incomplete
sealing
I)
Manufacturing
and
material
deficiencies
J)
Incorrect
gear
design
L)
Improper
handling
K)
Improper
mounting
M)
High
environmental
temperatures
178

(15)
Nicks,
Dents,
Score
Marks
Abuse
and
mishandling
may
cause
damage
(10)
Thermal
Growth
Discoloration
and
Softening
of
the
Gear
May
have
inadequate
heat
removal
capability
May
prevent
sufficient
heat
removal
(9)
Pits,
Stains
on
Tooth
Surface
Corrosion Corrosive
agents
and
oxidized
products
in
can
attack
surfaces
Corrosion
due
to
contaminants
such
as
water
can
destroy
surfaces
(8)
Roughened,
Micro-
dented
Surface
with
Increased
Backlash Abrasion
Metal
contami-
nants
can
cause
abrasive
wear
of
teeth
(20)
Rolling,
Peening
with
Rippling
and
Ridging
Lines
on
the
Teeth
May
produce
plastic
flow
Possible
localized
plastic
flow
A)
Heavy,
prolonged
load
B)
Shock
load
c)
Misalignment
F)
Deficient
lubrication
H)
Incomplete
sealing
I)
Manufacturing
and
material
deficiencies
J)
Incorrect
gear
design
L)
Improper
handling
K)
Improper
mounting
M)
High
environmental
temperatures
179

(7)
Heavy
Cage
Wear
and
Breakage
Can
impose
heavy
loads
on
cage
pockets
and
land
riding
surfaces
May
prevent
film
separation
of
land
riding
surfaces
Cage
must
be
bal-
anced
and
land
guided
to
with-
stand
centrifugal
forces
Cage
may
have
in-
adequate
strength
for
operating
conditions
(6)
Pattern
of
Oblong
Scuff
and
Fret
Marks
on
Raceways
False
Brinnelllng
May
cause
damage
when
there
is
a
lot
of
play
and
poor
film
damping
MilIii!
Permanent
defor-
mations
may
occur
if
load
exceeds
static
capacity
Can
cause
perma-
nent
denting
Inadequate
static
load
capacity
Heavy
Smear
Tracks
and
Uls-
coloration
on
Raceways
and
Balls
Insufficient
tractive
force
can
cause
ball
skidding
When
balls
skid
they
may
not
slide
on
a
film
of
oil Increases
the
tendency
to
skid
with
light
load
Too
much
Internal
play
can
contri-
bute
to
skidding
Extensive
Glazing.
Frosting,
Mlcro-
spalllng
of
Stressed
Surfaces
A
heavy
load
may
cause
a
break
through
of
a
thin
film
May
result
In
lack
of
film
sep-
aration
of
con-
tacting
surfaces
A
rough
surface
finish
may
prevent
film
separation
of
the
surfaces
May
cause
lubricant breakdown
(2)
Peening
+
Spalllng
at
Race
Shoulder
Very
heavy
thrust
load
can
cause
ball
to
ride
over
shoulder
Wear
track
may
run
close
to
shoulder Shoulder
height
may
be
inadequate
for
load
condi-
tions
(1)
Ball
+
Raceway
Spalllng
Heavy
load
can
increase
inci-
dence
of
fatigue
damage
May
impose
heavier
loads
Will
Increase
stress
cycles
which
accelerates
fatiguing
of
surfaces
Soft
metal,
bad
grain
flow
or
size
can
cause
spalllng
out
of
the
surfaces
Inadequate
load
carrying
capacity
can
increase
fatigue
damage
A)
Heavy,
prolonged
load
1
J C)
Misalignment
D)
Vibration
E)
Very
light
load
F)
Inadequate
lubri-
cation
or
poor
quality
lubricant
G)
Excessive
speed
H)
Incomplete
eeallog
I)
Manufacturing
or
rrsterlal
inadequacies
J)
Incorrect
design
K)
Improper
mounting
Improper
|
handling MN)
Presence
of
electric
currents
180

Score
Marks
on
Bearing
Abuse
and
rough
handling
may
result
in
damage
which
shortens
life
Crack
Formation
on
HlngB
and
BallB
Can
cause
crack-
ing
with
thru-
hardened
steels
Improper
heat
treat
can
cause
cracking
Too
tight
a
fit
may
cause
crack-
ing
(11)
Bands
of
Rust,
Discoloration
+
Some
Glazing
on
Fitted
Surfaces
Fretting
Too
loose
a
fit
can
cause
creep
and
fretting
corrosion
(10)
Thermal
Growth,
Discoloration
and
:
Seizure
of
Bearing
Burnout
ill
lit Can
greatly
Increase
heat
generation
Prevents adequate
heat
removal
from
bearing
Pits
and
Stains
on
Raceways
and
Balls
Corrosion
Can
result
in
corrosive
and
oxidized
products
attacking
surfaces
Corrosive
agents
such
as
water
can
destroy
surfaces Electric
current
may
cause
exten-
sive
pitting
of
surface
(8)
Roughened,
Micro-
dented
Surfaces
with
Increased
Internal
Play
Abrasion
Metal
contami-
nation
may
cause
abrasive
damage
to
contacting
surfaces
A)
Heavy,
prolonged
load
B)
Shock
load
c)
Misalignment
D)
Vlbrotlon
E)
Very
light
load
F)
Inadequate
lubri-
cation
or
poor
quality
lubricant
G)
Excessive
speed
H)
Incomplete
sealing
I)
Manufacturing
or
material
inadeqxiacles
J)
Incorrect
design
K)
Improper
mounting
L)
Improper
handling
M)
High
environmental
temperatures
N)
Presence
of
electric currents
I8i

DISCUSSION
C. R. Garbeti, Shell Development Company : Did you carry out any studiesin relation to journal-type bearings? I should think that would be ofinterest in nuclear submarines. It is certainly of interest to us in a
lot of our industrial turbine compressor equipment.
P. B. Senholzi : All we consider right now are ball bearings and rollerbearings.
T. Tauber, Tedeco : In addition to oil samples, do you look at sedimentin the test rigs, transmissions, or gear boxes?
P. B. Senholzi : Our test rigs are built to have "no sediment." The oil
sumps were funnel shaped. The pump was located at the bottom of the
funnel. So supposedly, there was nowhere that particles could gettrapped. Even so, there were a lot of particles in the beginning but
they seemed to peter out and go somewhere. We do have all the oil that
we saved from machines and that which was washed out from the sumps. We/
have two gallons of oil from each of 28 systems, and we are going to
look at what is left.
T. Tauber : Can you also describe your sampling technique?
P. B. Senholzi : The technique for the bearings utilized a syringe-
type sampler that was injected in the top of the funnel. We withdrewoil samples just before it went into the pump.
T. Tauber : Was this after shutoff?
P. B. Senholzi : No, this is while the machine is on. It had a port in
the top of the cylinder.
T. Tauber : You mentioned the formation of gels due to the use ofplastics in the sampling bottles. What kinds of materials were subjectto that in addition to Tygon?
P. B. Senholzi : Polypropylene was the other one we tested, because thatwas what the bottles were made of, and a lot of the seals on the caps ofoil sampling bottles were made of the same polypropylene or Tygon.
T. Tauber : Basically it does not interfere with SOAP analysis. That is
probably why nobody has picked it up.
P. B. Senholzi : The particles agglomerate in this plastic gel and actas one big particle and fall to the bottom. They wouldn't be picked upin SOAP analysis if they were laying on the bottom of the bottle.Because SOAP does not agitate the particles to any great extent, themixture is not homogeneous.
182

S. Pinel, Industrial Tectonics, Inc. : Would you describe the
filtration process for your test rig?
P. B. Senholzi : There was no filter.
S. Pinel : You mentioned that the low number of particles contributed
to the long life of your system. Could you expand on that a minute?
P. B. Senholzi : Well, before we ran any bearing we kept flushing the
system and making ferrograms of the flushing solution to see how many
particles were there. We didn't start until the system was thoroughlyclean. There weren't any particles in the system, above and beyond
those generated by the ball bearings themselves. Since there were
Teflon impellers in the pumps, anything the pump would generate we
would be able to see as a Teflon particle as opposed to a metal
particle. There wasn't anything initially to dent the races, and this
is what contributed to the long life.
R. J. Salvinski, TRW Systems Group : There are some theories thatsuggest that surface energy of the medium may have an effect on wearparticle size. Does wetability have any significance in your work?
P. B. Senholzi : We didn't consider that effect at all.
G. J. Philips, Naval Ship Research and Development Center : Youmentioned you put two defects on the inner race of the bearing. One
ended as a fatigue spall. What happened to the other?
P. B. Senholzi : We did this on 14 bearings and a good percentage ofthe 14 spalled at one of the indents. The other defects ended with theleading end normal and the lagging end extruded.
G. J. Philips : At what point did you dent the bearings? How long didthe bearings last with the dents in them?
P. B. Senholzi : They lasted about 200 million revolutions on theaverage. We ran bearings without dents up to 250-300 millionrevolutions without failure. We put dents in them and they failedwithin a matter of maybe 30 million revolutions. Some of the new onesthat we put dents in lasted over 200 million revolutions, so it seems a
new bearing is less vulnerable to a dent in the race than a bearingthat has already been run.
T. Tauber : Did you have a full design load on these bearings?
P. B. Senholzi : They were overloaded to the extent that we couldn'tget them to fail to begin with so we kept raising the load and theRPMs. We got these 6309 bearings up to 9700 RPMs and we still couldn'tget them to fail even in a high speed condition. We had started themat 2700 RPMs.
185

J. W. Forest, Ontario Hydro : It looks like your program has got a
terrific byproduct - you keep the oil clean and go on forever.
P. B, Senholzi : If the oil is kept clean, one wear mode may beeliminated, but you still have other wear modes that may cause the
bearing to fail
.
U. Sela, Exxon Company, USA : We find much reluctance to get the systemclean. Normally, operations people are happy having it 50 percent•clean. Data to show that a clean system improves bearing life are veryimportant.
P. B. Senholzi : We are looking at a whole program initiated by thatresult - the effect of the contaminants on the wear life of the
component.
0. E. Compton, Northrop Corporation, Aircraft Division : Did you varythe temperature of the oil?
P. B. Senholzi : No, all constant temperature, constant load, constantspeed.
iQk

DEVELOPMENT OF INSPECTION AND DIAGNOSTIC EQUIPMENT FORMOTOR VEHICLE EQUIPMENT FOR MOTOR VEHICLE INSPECTION
George L. ParkerHead, Vehicles-in-Use Group
Crash Avoidance Eesearch DivisionOffice of Vehicle Safety Research
Research and DevelopmentNational Highway Traffic Safety Administration
Washington, D.C 20590
I. Program Overview and Philosophy
Motor Vehicle Inspection (MVI) , as practiced in 34 of our States andterritories, is primarily limited to those items which are easy to
Inspect and is a cursory examination of the most critical safety systems
and degradation modes. Inspection equipment used in most inspectionsis not automated, is not necessarily suited for its intended use, and
does not reduce defects on vehicles-in-use to the desired degree. To
improve MVI, it is necessary to develop new equipment, which in addition
to addressing the most safety critical defects, is thorough, comprehen-sive, objective, and has a high throughput. Automated equipment mustinclude the essentials of control of the test sequence and automaticcomparison of inspection equipment output to inspection criteria.
While automated inspection equipment can overcome most of the problemsof existing inspection relative to items inspected and objectivity, moststates will rely on private garage/gas station/dealership inspectionsfor the foreseeable future. For this reason, there is a need to improvethis basically manual form of inspection. The first step in thisprocess is to recommend to the states only the most safety criticaldefects as the basis for MVI programs. The second step is to developtechniques, simple equipment and hand tools, and procedures to improvemanual inspection.
Regardless of whether it is automated equipment or manual techniquesand procedures, a deliberate development process must be followed. MVIhas been pursued in the U. S. since 1926 in a variety of ways with asmany different objectives. Thus, a review of past accomplishments mustbe made before proceeding to a solution. It is first necessary toidentify and justify any existing MVI deficiencies and current needs tothose, who through years of experience, have developed a reliance onexisting techniques and equipment. This is not an easy task, but isnecessary to either justify further research and development or toidentify, evaluate, and verify the satisfactory existing approaches.The last twenty-five years have resulted in a large and variedgeneration of inspection equipment and techniques, and even a slightchange in the area could neither be accomplished in a short time nor be
185
accepted by the total following, regardless of the justification.Therefore, all conclusions and recoininendat ions must be carefullysupported and verified.
Once the current climate has been evaluated, development of inspectiontechniques and equipment may systematically proceed. Primary objectiveswill relate to suitability, accuracy, objectivity, etc. This willinsure that the final product, if it can be developed, will not have thedeficiencies of existing techniques and procedures. New techniques andequipment must be subjected to the rigorous evaluation that bore theirneed. Although this is not the final proof or justification, it standsas a major milestone to be satisfactorily completed. Perhaps the majorevaluation measurement will be the practicality of the techniques orequipment in an MVI environment. Then the evaluation results will notonly verify that a correctly identified problem is solved, but that thesolution is not an "overkill" .
Another constraint on the development of improved MVI techniques andequipment is the consumer related aspect of motor vehicle safety andMVI. The growth of engine diagnostic facilities has shown that con-sumers are interested in the performance condition of their vehicles.On the other hand, they are unsatisfied with the attempts to repair them.
A goal of the program to develop MVI techniques and equipment is theproper identification of specific safety-critical vehicle subsystemdegradation and vehicle repair needs in a rigorous manner that resultsin consumer satisfaction. It is in their interest that the identifica-tion of vehicle repair needs not only be correctly identified, butlimited to only those subsystems or components specifically needingrepair, replacement, or adjustment.
A final goal of MVI technique and equipment development is the overallstreamlining and efficiency of the total MVI environment. Probably themost important considerations are equipment integration, inspectiontime, equipment cost, and operator skill level requirements. In the
long run, the overall effectiveness of new techniques and equipmentwill have to be weighed against possible negative factors caused by the
development of new inspection techniques and equipment for specificvehicle subsystems in separate development projects.
Research results in the areas of (1) the role of vehicle defects in
accident causation and (2) the relationship of vehicle defects and
degradation to vehicle performance degradation have determined the
following vehicle systems as being safety critical in the prioritylisted
:
a) Braking systemsb) Tires '
c) Steering and suspension systems
Research to evaluate existing inspection techniques and equipment and to
develop new techniques and equipment have been conducted in each of the
three areas. Carrent and future research will also concentrate on
these three systems.
186

II. Past and Current Research Activities
A. Automated Brake Inspection
The first effort to evaluate and develop inspection techniques and
equipment began in June 1972, with a research project whose primary
objective was to operationally demonstrate a cost-effective (in relation
to other systems) brake inspection system that is capable of detectingand measuring safety critical defects and degradation of brake systems.
The work performed in this project consisted of the following:
1) determination of present brake inspection m.ethods,
2) development of a methodology for evaluating available brakeinspection equipment,
3) evaluation of available brake system inspection methods and
equipment
,
4) design and construction of single-station inspection systems,and
5) physical verification of inspection system performance.*
The developed brake inspection procedures had to be able to determinecurrent brake system performance capabilities and to determine anydefects or degradation existing in a particular brake system that wouldlead to near-future catastrophic failures or sub-level performance. Theprimary measures of brake performance considered to be important areeffectiveness and stability. Vehicle brake system design and perform-ance characteristics that greatly influence the vehicle brakingperformance are:
1) brake system gain,
2) brake system response,
3) brake force proportioning, front to rear,
4) brake force uniformity from side-to-side, and
5) friction material characteristics .
The above discussion concerns primarily brake defects and degradationleading to immediate changes in vehicle performance. Degradationleading to eventual catastrophic failures cannot always be detected in
performance tests, therefore, inspection techniques complementary to
performance tests must be utilized. Brake components which are subjectto this type of degradation or deterioration are:
1) friction materials,2) drum or rotors,
3) hydraulic system (leakage)
,
4) brake fluid (water contamination) , and
5) actuation system (pedal reserve).
Project results have included the following:
1) Current brake inspection, as conducted in various states, involvesthe use of various combinations of three inspection techniques. Thesetechniques are visual inspection, low speed road stopping test (20 mph)
,
and low speed (5 mph) r.i.atform tester.
187

2) Visual inspection is the only state-of-the-art technique for
detecting such items as worn friction materials, oversize drums, brokenor missing parts, etc. However, these inspections tend to be verysubjective.
3) The low speed road and platform tester stopping tests serve to
show that the inspected brake system has the ability to stop the vehicleat low speeds and nothing more. These tests are manually controlled and
the results are visually observed. This type of test and inspectioncontrol has inherent repeatability problems from test to test and fromoperator to operator.
4) The brake analyzer and brake dynamometer are also used in brakeinspections. These machines use either electric motors or inertiaweights to supply energy to the test vehicle brakes through a set of
wheel rollers. All of these machines test either the front or rearaxle set of brakes at a time, although one costly machine using inertiaweights has the ability to test all four vehicle brakes at one time.
5) Test data analysis indicated the d3mamic brake analyzer to be farsuperior to the platform tester in capability, repeatability, andsensitivity to vehicle brake performance levels. Also, higher energylevels to the vehicle brakes and continuous performance readouts areavailable. Platform brake testers give only an instantaneous low-speedreadout of brake proportioning which is not usually repeatable. Theplatform test cannot indicate brake system gain and possesses a highbrake force threshold.
6) The dynamic brake analyzer has proven itself capable of accurateljdetecting outages in vehicle brake system performance with good repeat-ability.
A visual inspection of the brake system for component condition combinedwith a dynamic brake test now appears to represent the most practicalapproach to brake inspection where high throughput is desired.
The above results, when combined with the results of other research to
develop inspection items and criteria, resulted in the development of
a specification for a dynamic brake tester. The brake tester has beenbuilt, evaluated, and will shortly be available for further, long-termevaluation. The most significant features of the machine are:
a) low speed - high force capabilities,b) automated input control, and
c) automated printout and defect decision making in the dynamic mode.
B. Shock Absorber Inspection
A research project was initiated in June 1973, whose objectives were:
1) Through analysis, an extensive literature review, and a shockabsorber survey, determine the important shock absorber parameters withrespect to safety and the range of these parameters in the passengervehicle shock absorber population.
188

2) Physically test each type of shock absorber test machine that is
available and determine its effectiveness with respect to the above
safety critical shock absorber parameters.
3) Recommend an approach and equipment for shock absorber inspectionthat- includes the appropriate features of the evaluated equipment.
The contract has been completed with the basic finding that no existing
shock absorber inspection equipment is suitable for state MVI use. The
deficiencies range from inappropriate tests to lack of capacity. Acommon deficiency is that vehicle performance with original equipmentshock absorbers must be known.
A recommendation for new equipment development was made which is basedon the fact that the primary shock absorber failure mode is loss of
fluid and that shock absorbers with low fluid levels result in aeratedfluid when exercised. The inspection philosophy then, would be to
design a machine which would exercise the wheel, spring, shock absorber,and suspension system at various frequencies (or a frequency sweep) at
a fixed amplitude and would compare system damping at the start of thetest to later in the test. If the fluid level is low, it will aerateand the damping will change. What is particularly desirable about thisapproach is that no new-vehicle information is needed.
C. Tire Inspection
A research effort is currently underway to develop a means of inspectingtires for inflation pressure, tread depth, and carcass integrity on anautomated basis. The basis for the carcass integrity inspection is thatcarcass flaws (separations, chunking, delaminations
,voids, etc.)
disrupt one of the symmetric modes of tire vibration. An exciter is
placed at the center of the tread with one pick-up on each sidewall.The system is tuned to a symmetric resonance mode about 400 Hz and thetire rotated and examined for defects by observations of the change in
resonance amplitude and frequency. This research is covered extensivelyin the paper "Resonance Tire Inspection for Motor Vehicle Inspection"given at this symposium and will not be covered further here.
B. Brake Component Inspection
In the previous section on brake dynamometer development it was statedthat a visual inspection of brake condition is required as a supplementto the performance test of a brake dynamometer. However, a visualinspection of brake condition is time consuming and inappropriate in a
high throughput, automated inspection. Therefore, a research effortwas begun in June 1974, to develop a "static" brake inspection technique,equipment, and procedures to perform an inspection of brake componentswithout wheel removal. The objectives of the project are:
1) Conduct a systematic state-of-the-art survey into existing staticbrake inspection systems, proposed designs, inspection criteria.
189

techniques, and related literature.
2) Determine basic performance objectives of static brake inspection
systems, alternatives, evaluation criteria/weighting requirements, test
methodology for evaluation of alternatives, and preliminary analysis of
potential approaches.
3) Analyze and evaluate the more promising approaches and determinethe optimum static brake inspection system.
A) Construct and evaluate two prototype static brake inspectionsystems based on related useable portions of the evaluated equipment
and/or new design requirements as needed, and develop the relatedinspection criteria and techniques.
5) Demonstrate and verify both the operational capabilities of the
equipment and the validity of the inspection criteria and techniques to
detect arid assess the condition of automotive braking systems in the
static state.
This project is still in process but some results are available. It washoped that a technique such as ultrasonics could be used to determinebrake lining thickness in drum brakes by placing a transducer on thedrum directed radially inward toward the lining. It was also hoped thatsimilar advanced techniques could be used for the inspection of otherbrake components. It appears, however, that the most promising approachis a modification of the braking system to facilitate the use of mirrors,fiberoptics, etc., in viewing the components; and component modifica-tions which indicate when wear limits are reached. An example of thelatter area would be a blind hole drilled in the friction surface of a
brake disc that would be worn away when the disc wear limit is reached.The only state-of-the-art technique which appears to have applicationis the use of gas chromotography for detecting brake fluid leakage.
III. Future Research Activities
Since most state MVI programs will use low throughput private garages,gas stations, and dealerships for the inspecting authority, it is
appropriate and essential that techniques, procedures, and equipmentfor this type of program be developed. In some cases the equipmentdeveloped for automated inspection can be simplified for such use.
During the second quarter of calendar year 1975, two research projectswill be initiated to respectively develop manual brake inspectiontechniques and to determine the requirements and state-of-the-art of
on-board vehicle sensors. The latter effort is being conducted to
indicate to vehicle manufacturers our interests in this area. On-boardsensors are viewed as a complement to MVI in terms of both easing theinspection task and providing real-time safety critical outage informa-tion to the driver.
The objectives of the manual brake inspection research are to system-atically investigate, develop, and verify objective, manual inspectioncriteria (replacement) techniques, procedures, and equipment aids to
190

replace 1) dynamic brake testing and 2) existing subjective brake
inspection procedures. Results from this project are expected by the
end of 1976.
The objectives of the on-board sensor research are to assess the state-
of-the-art and potential areas of future development of on-board vehicle
sensors and to derive the applicability of on-board vehicle sensors to
brakes, steering, suspension, tire, lighting, and signaling systems.
Results from this project are expected in mid-1976.
In the near future (FY 1976-77) , research will focus on developing or
improving manual inspection techniques for the remaining vehicle systems
requiring inspection. This effort will be keyed at increasing the
effectiveness of MVI when implemented by licensed private garages, gas
stations, and dealerships. A minimum amount of low-cost equipment aids
will be developed and combined with refined and objective inspection
criteria. This will improve test accuracy and acceptance at both the
inspector and consumer levels.
In the years FY 1977-80, research will focus on developing automated,
high throughput inspection equipment for passenger car steering and
suspension systems. Work on identifying or developing inspectiontechniques for trucks, buses, and motorcycles v/ill begin in the sametime period. It is difficult at this time to envision the results of
this effort since an WJl program for these vehicles has not beendeveloped. One possible approach might be self inspection by fleetscombined with sampling or random inspection by state authorities.
IV. Diagnostic Equipment Development
A philosophy of the research to date is that diagnostic capabilitiesare included in inspection techniques and equipment if their inclusiondoes not significantly increase the time/cost of inspection. In otherwords, the primary determination of these techniques are go-no go
decisions. Of course, many inspections are basically diagnostic innature, such as the inspection of brake components. However, performancetests tend not to be diagnostic. For example, steering system lashinspection is not diagnostic.
The 1974 amendments to Title III of the "Motor Vehicle Information andCost Savings Act," P.L. 92-513, require the Department of Transportationto conduct demonstration projects that will aid in the development andevaluation of advanced inspection, analysis, and diagnostic equipment.An assessment of the capabilities of small repair garages is also in-cluded in the requirements. In order to satisfy the provisions of theact, as amended, a research program should be conducted to develop theadvanced equipment. The primary reason for this is that existingequipment is not compatible with the high throughput, mass diagnosisintent of the demonstrations and the Act. Existing equipment is designed
191

for use by garages, dealerships, and diagnostic centers with low or, at
most, medium throughput. Medium throughput can only be obtained with a
labor intensive operation which increases the cost of inspection anddiagnosis radically. As an example, using today's equipment for massinspection results in an estim.ated 82 percent of total costs for laborand labor overhead and 7 percent of total costs for equipment.
It is also known that existing equipment is not objective, complete, noraccurate. Certain types of equipm.ent provide a measurement means butinterpretation is left to the diagnostician. Other types of equipmentmake inappropriate tests or tests limited in range. Furthermore, thelack of automation means that vehicle specifications applicable to
specific tests must be listed in reference books or sheets and usedfor each test or diagnosis.
Research is needed, therefore, to develop advanced inspection, analysis,and diagnostics equipm.ent. This equipment must be thorough, accurate,complete, objective, reliable, and allow for high throughput, non-laborintensive vehicle inspection and diagnosis. In this way the spirit andletter of P.L. 92-513 will be met, and the basis will exist foreffective demonstrations of an advanced approach to the diagnosis andrepair problem.
192

DISCUSSION
R. W. Adamson, California Polytechnic State University : We started out
our meeting this morning in connection with determining the
effectiveness of any test program. Are studies being made to come up
with the data that would permit you to know where the problem areas
are?
L. H. Emery : Yes, there are 10 to 15 extensive accident investigation
programs under way throughout the United States where trained accident
investigation teams try to determine the causes of accidents; i.e.,
whether they were due to a component failure, driver error, or
environment. Also there have been extensive research programs to
determine the safety status of the nation's vehicles. The results of
these programs indicate that approximately 5 to 7 percent of the
accidents are either caused by or influenced by component degradationand catastrophic failure.
J. K. O'Connor, Consumer Product Safety Commission : You said that the
shock absorber test was not going to depend on new vehicle performance,but simply on a change of performance between the beginning of the testand the end of the test. Then I thought you said that's predicated on
partially filled shock absorbers and the oil aerated. Suppose you had
no shock absorbers and just had the mass damping of the system, thenwould you get a change?
L. H. Emery : No. We conducted a research program to look at the majormodes of shock absorber degradation and to look at the existing shockabsorber inspection equipment, the majority of which is produced andused in Europe. It was determined that 99 percent of the shockabsorber failures are due to loss of fluid. We discovered that the
technique used by one of the existing inspection machines in Europe is
able to detect a loss of fluid due to a change in dampening as theshock absorber is exercised. The loss of fluid encourages a quickaeration of the fluid and dampening is lost. We think that loss offluid in shock absorbers is the thing to look for in a shock absorberinspection machine, and there is an existing technique. However, thereare no existing machines suitable for MVI use.
J. K. O'Connor : If you lost all the fluid you wouldn't get the change.
L. H. Emery : That's true but, it would be obvious that the car didn'thave any dampening.
0. E. Compton, Northrop Corporation, Aircraft Division : Is a loss offluid recognizable by a visual means - by looking at a shock absorberitself - or do you need a piece of diagnostic equipment?
193

L. H. Emery : I don't know that it is always recognizable. In anycase, for a high through-put type of inspection it is desirable to
minimize the labor involved. I am not recommending my machine over a
visual inspection. Our objective was to look at the problem anddevelop some technology.
19k
ON VEHICLE MOBILITY MEASUREMENT & RECORDING SYSTEM
F. K. Chin R. WattsMVCT-Mai ntenance
U. S. Army Tank Automotive Com.
Warren, Michigan 48090
General American Transportation Corp.
General American Research Div.
7449 N. Natchez Ave.Niles, Illinois 60648
ABSTRACT
A prime long term goal of the U. S. Army is to field maintenance-orienteddiagnostic equipment which will improve the reliability and reduce the
cost associated with keeping vehicles operational. An important part of
making diagnostic equipment viable is the establishment of base-linelevels on a well operating vehicle so an adequate automatic judgement of
the operational status of a vehicle under test can be made. This paperdescribes an on-going U. S. Army Tank Automotive Command, Maintenance/Product Assurance Directorate program directed at establishing such levelsfor the M35 (Figure 1). The program uses technology previously developedfor the Ml 51 vehicle. The current work involves instrumenting an M35A2,2-1/2 Ton Truck with on-board transducers, signal processing, and taperecording equipment, and running the vehicle 20,000 miles with various"seeded" and "unseeded" components in both idle and running modes. The
data will be computer analyzed to establish "good" and "bad" levels fordiagnostic reference purposes. In addition to the actual measurementsmade and the test program outline, the needs and objectives of the user--the Maintenance Directorate of TACOM--will be discussed in terms of howthe current program relates to the general diagnostic goals of the Army.
INTRODUCTION
Modern maintenance procedures make use of sophisticated instrumentationin order to analyze vehicle performance for indications of componentfailure, imminent failure, or need for adjustment. Often this analysisis conducted with the vehicle idling in a maintenance facility. Sinceit is desirable to minimize repair time, analysis time requirements areminimized. The resulting situation is one of sometimes performing a
brief, indoor idle test in order to assess the integrity of a heavy dutyvehicle designed for extended use in severe environment. In order to
define or refine appropriate maintenance analysis procedures and failureindicating threshold levels, supportive operational base-line data is re-quired to correlate the brief idle test data with mobility data obtainedover a wide variety of operating situations representative of the vehi-
cle's full design environment.
The mobility testing a vehicle undergoes during the preproduction and pro-
duction phases of its life-cycle is used to validate the vehicle's
195

performance capability. It is important to know during this testing,whether a particular vehicle was subject to under-testing, over-testing,or the testing desired because the ability of a vehicle to pass its per-formance tests depends on how well the stresses generated during testingcorrelate with the stresses estimated during the vehicle design phase.
The above types of information, if available, can help maintenance peoplewho are responsible for keeping vehicles operational, lual ity assurancepersonnel responsible for vehicle test implementation, and engineeringpersonnel responsible for vehicle design. Ultimately quantized mobilityinformation from vehicle performance tests will help insure optimal ve-hicle cost, life, and service.
A system (MO/MARS) has been developed for a data gathering and reductionsystem which -will allow efficient generation and analysis of data for theabove applications. This MO/MARS is centered around a small, rugged in-
strumentation and recording system mounted on-board the vehicle undertest (Figure 2). The system operates unattended for prolonged periods oftime in the vehicle operational environment. The data acquired is storedon tape in the vehicle until it can be carried to an off-board playbackand reduction station. In order to reduce data storage requirements as
well as data reduction time, data is not stored continuously. As an in-
tegral element of the on-board system, a data processor analyzes criticaldata for deviations from normal conditions or changes of state. When a
deviation or change occurs, a recording trigger is generated which causesa complete scan or sample of each channel to be recorded in a digital for-mat on magnetic tape. In the event that one of these triggers does notoccur in five minutes, a trigger is generated so that "normal" perfor-mance is recorded. After tape completion, it is removed and taken to a
data reduction center for detailed analysis and correlation on a commer-cial computer.
TECHNICAL DISCUSSION
The MO/MARS concept was implemented with a composite of off-the-shelf andcustom hardware constructed as a network of subsystems. Individual sub-
systems must operate under varying constraints depending on their func-tion, their physical location, and their relationship to other subsystems.One of the more varied requirements is that imposed by the local environ-ment. Transducers are fully exposed to rain, mud, snow, and ice as pro-vided by nature as well as vehicle dynamics (e.g., splashing and submer-sion). The remainder of the on-board equipment is protected from directeffects by an environmental case shown in Figure 3 with the front coverremoved. Mild shock and vibration as well as temperature extremes muststill be accommodated. Off-board systems are housed in the usual temper-
ature and humidity-controlled computer environment. Details of the trans-duction scheme and processing electronics are presented in the following
sections
.
196

Transducers
The various transducers used to monitor the parameters, listed in Table
1, are subjected to the most severe environment. In general, transducers
are exposed to local shock, water, electrical noise, temperature, and
solid impediments encountered on the test course. As a result, all trans-
ducers operate over wide temperature ranges with minimal error. Trans-
ducers mounted beneath the vehicle body are waterproof, while those abovethe body are splashproof. In order to reduce the effects of electricalnoise, all outputs are high level (±1 V, typical) and low impedancetypical). Modest shock/vibration tolerance as well as physical rugged-ness are included as well. The following subsections discuss individual
transducer groups.
Pressure Transduction
The Robinson-Halpern pressure transducers selected use LVDT's. They wereselected for their good record of transduction for TACOM and railroad lo-
comotive pressure monitoring. They also have a military prescribed cal-culated failure rate of 0.34 failures per million hours. Their ruggedconstruction has been qualified to specifications MIL-S-901 for high im-
pact shock and MIL-STD-167 for vibration. The housing meets weather-proof and water-proof Class IV NEMA standards and is designed for ClassI, Division 1, Group D explosion-proof service. Operating temperaturerange is: -65°F to > +165°F. These pressure transducers have quotedaccuracy capability to 0.15%.
MO/MARS recordable accuracy is dependent on the pressure monitoringpoints. For example, differential pressure across an oil filter is mea-sured as close to the inlet and outlet ports of the filter as is practi-cable to eliminate the influence of pressure drops or turbulence in
associated components such as hoses. The selection of sensing points wasbased on these considerations as well as those of accessibility, ease ofcalibration, and protection from damage. Specific locations of the var-ious pressure monitoring points are given in Table 1.
All five transducers are mounted on a contoured plate, shown in Figure 4,
which in turn is mounted on the left engine compartment, side cover. In
this location, the transducers are protected from physical damage and ex-treme temperature as well as being accessible for bleeding and calibra-tion. Transducers are connected to pressure monitoring points by variousadapters, fittings, and hoses. The hoses used on the project have a
working pressure rating of 500 psi , a temperature rating of 300°F and arecompounded of oil and fuel resistant synthetic rubber. Wherever possible,suitable commercial fittings are used. Specially designed fittings areas simple as possible and made to interface commercial fittings.
Temperature Transduction
The selection of temperature monitoring points is of utmost importance.
197

Temperature sensors are located so they are always submerged or surround-ed by fluid which is not stagnant, and monitor the fluid at a known, cri-tical point. This can be illustrated by considering the measurement ofcoolant and oil temperatures. Coolers are used in both circuits, andmaximum or minimum temperatures of the circulating fluid could be measuredand related to normal operating temperatures. However, an analysis ofthe relationship between the measured variable and the overall system re-sults in the best choice of sensing points. The main purpose of the en-gine coolant is to maintain cylinder wall temperatures well below 500°Fto prevent overheating and breakdown of the piston-cylinder lubricationfilm. The system sensitivity to overheating is greater at the inlet port.For the oil circuit, the same reasoning applies. In addition, the tem-perature of the oil is critical. Below 200°F, a properly refined oil
will not oxidize excessively, but oxidation becomes appreciable above250°F. Therefore, knowing the maximum oil temperature is of value, andthe sensor is located at the inlet to the cooler.
All temperature measurement was accomplished with a GARD-developed trans-ducer. It is an operational amplifier-augmented resistive bridge with oneactive element. The active element is a platinum resistance bulb.
A precision reference voltage is derived from a temperature-compensatedzener diode. The circuit output is approximately ±1 V @ O.lfi for 0°F to
300°F. The circuit itself is also designed to operate over the full tem-perature range. Typically, outgut voltage error due to circuit tempera-ture was found to be within 0.3 F over the range 0°F to 300°F. The cir-cuit is constructed on a 1.0" x 1.2" printed circuit board and housed in
a cylindrical, stainless steel case. Typical of this transducer installa-tion is that for transmission oil temperature shown in Figure 5.
Speed. Transduction, Clutch Slip, Odometer Transduction Consideration
The speed transduction design has evolved from a sequence of theoreticalconsiderations and on-board experimental tests. It was decided thatspeed would be measured by counting gear teeth per unit time. Some of
the initial design considerations were tachometers, encoders, electronicgear tooth counters, or electro-mechanical counters possibly driven by
adaptive gearing or pulley systems. Electronic gear tooth counters werefound to be satisfactory in the M151A2 MO/MARS. Gears on the truck werefound for indicating the respective speeds with minimal retrofitting.
On-board examinations of axle and gear structures corroborated by TACOM-
supplied vehicle drawings showed that the electronic gear tooth counterscould be satisfactorily applied for all required speed transduction. Ve-
hicle speed is monitored by counting teeth of the rear axle ring gear.
Engine rpm is measured by counting fly wheel ring gear teeth. Clutchslippage is a measurement that compares shaft speed at the input of the
clutch to that at the clutch output. Since shaft speed at the clutch in-
put is already derived by the engine rpm transducer, it is only necessaryto monitor clutch output speed for the comparative measurement. A
198

transmission gear was selected whose speed relative to the engine is in-
variant with transmission gear selection including neutral.
Experience with the M151A2 MO/MARS indicated that a time varying magnetic
flux density change (dB/dt) sensitive transducer works well with magneti-cally permeable material, such as steel, which is used for all gears mon-
itored. Experience and specifications indicated that gapping and align-
ment problems would be minimal with this transducer.
An Electro, 5/8" diameter, digital magnetic transducer was selected forspeed transduction. The probe is modified mechanically to facilitatemounting and adjustment, and a standard JT connector was added. Mountingand adjustment is accomplished by screwing the transducer body into an
appropriately tapped hole and securing it with a locking nut. For en-
gine speed, a probe monitors gear teeth through a modified inspectionport on the flywheel housing (Figure 6). The transmission gear is moni-tored from an accessory plate on the side of the transmission housing.The rear axle ring gear is monitored from a top inspection plate on the
rear axle housing.
Battery Voltage Transduction
The magnitude of the battery voltage is indicative of the condition orwell-being of the electrical system. Further, the condition or identi-fication of electrical equipment or accessories may be determined from a
monitor's indication of their effect on battery voltage.
The transduction accuracy or reliability could be affected by the choiceof sensing point. Transient or steady state currents from electricalequipment, if allowed to flow through the measurement circuit, couldgrossly affect the monitor's reliability. Thus, the transducer is elec-trically tied directly to the battery posts with twisted pair wires to
eliminate electromagnetic interference, thereby obtaining the most min-imal path possible for interfering currents in the measurement circuit.
Battery voltage is monitored by a GARD-designed instrumentation type in-
put circuit. Tests of the characteristics of the voltage have shown thatspikes due to inductive switching and ripple due to generator chargingwill be present and must be contended with. A combination of low passfilters and surge protectors protect monitoring electronics from trans-ient destruction while accurately measuring battery voltage.
Time/Date Transduction
To facilitate a time correlation of data, a precision reference oscillatoris used to generate time of day and date information in digital accumula-tors. The accumulators are kept in the self-powered monitor, thus timeis kept continually beginning with time zero at the start of the testprogram. The time accumulator is quite similar to an electronic wrist-watch. Low power, CMOS family of digital logic is implemented in the
199

monitor. Time of day is recorded as elapsed time since midnight in hours,minutes, and seconds. Date is recorded- in a Julian-like calendar form as
day of year.
Elapsed time is also sensed for recorder triggers. That is, if 5 min-utes, ±1/2 minute, has elapsed since a recorder trigger, the recorderaccumulates a data record.
Tape Status
MO/MARS is designed to be a self-initializing and sustaining system re-quiring minimal interaction from operator or test supervisor. However,because of the finite data capacity of the magnetic tape and the desireto accumulate all meaningful data, the tape supply will require periodicrefreshing . .
An aid for evaluating tape supply is the tape status indicator. The tapestatus indicator signals the driver when the tape has reached a prede-termined data capacity short of full. The capacity level for signallingrefresh is internally programmable from 75% to 90%, with a final valuebest determined empirically.
Data Handling
All on-board data processing and recording is handled by a network of
processing elements shown in Figures 7, 8. The processor assembly is theprincip-al control operating the recorder and accessing the monitor as
required. It contains analog signal processing, digital signal process-ing, monitor interfacing, and recorder control. The monitor is uniquein MO/MARS since it has a self-contained source of power, i.e., its
battery. In combination with low-power CMOS logic, extended operationis possible independent of the vehicle electrical system. Thus, the mon-itor is capable of generating and/or storing long term data, typicallydate, time-of-day, distance (odometer), and recorder tape supply status.It also uses the vehicle accessory switch to sequence MO/MARS on when the
vehicle is running. The recorder is charged with recording data on mag-netic tape which will eventually be removed from the vehicle for data
reduction. Analog data channels interface directly with the recorderwhich contains a signal multiplexer and an analog-to-digital converterboth under program control. The recorder also contains a wide varietyof operational clocks ranging in frequency from 1 MHz to 0.028 MHz which
are brought out for use in the processor. A controller within the re-
corder coordinates all functions (internal and external) including the
actual writing of magnetic tape and electro-mechanical control of the
tape transport. Also contained in the processor, is the clutch slippage
detection and analysis circuitry. It operates in a separate mode inde-
pendently of the other subsystems, although it is integrated with exist-
ing logic where compatible. Clutch slippage requirements are so de-
manding that the processor incorporates electronic FIFO memory to buffer
data for recording and then record data in a unique, variable word-length
200

pattern
Trigger Detection
The triggering events which initiate recording are presented in Table 2.
Most triggers are derived by comparing a signal with some preset thres-
hold level. The level is bounded by a hysteresis band to minimize re-
peated triggering when the signal level is relatively stable and atapproximately the threshold value. Both analog and digital thresholdplus hysteresis circuits are used. Analog circuits are implemented on
the input/output (I/O) cards with integrated circuit comparators on ana-
log voltage levels. Triggers derived in this manner include all differ-ential pressures and temperature. Digital circuits are implemented withintegrated circuit digital comparators and digital levels extended viaDIP switches. Digital triggers are derived for speed, time, and clutchslippage. Each circuit (analog and digital), results in a trigger sig-nal which is sent to a trigger handler. The trigger handler alerts the
controller to initiate a recording cycle, then formats the trigger in-
formation for entry as data. The format includes identification of thetriggering event as well as the status of all triggers. Since wheelspeed can trigger multiple levels, the level -to-level transition re-
sulting in a trigger is uniquely identified and recorded. Instantaneousclutch slippage data is recorded in a separate, distinct mode of operation.
Time/Date Processing
Both of these data are derived from a low-power oscillator operated as
part of the monitor from the monitor battery. The oscillator will becounted down to 1 Hz with standard CMOS logic. The 1 Hz signal drives a
"seconds" counter which presets at 59 seconds. The seconds counter resetalso drives a minutes counter which resets at 59 minutes driving an hourscounter limited to 23 hours. The hours reset drives the day or datecounter which is programmably reset at 365 or 366 days. A higher fre-quency can be injected at any stage for the purpose of initializing theclocks under manual control
.
Tape Status and Odometer Storage
The total number of records recorded on a tape will be used as a measureof tape available or tape used. Since it is anticipated that multipleoperational periods will be stored on a given tape, it is necessary to
keep track of tape status even when MO/MARS power is off. Since the mon-itor is always powered, it is appropriate to include some form of low-power memory within the monitor for maintaining the total -records countbetween MO/MARS operations. The odometer or distance record has similardata maintenance requirements and is also stored in the monitor.
201

Wheel Speed/Engi'ne Speed
These speeds are measured by counting pulses in the pulse trains derivedfrom sensing teeth on appropriate gears. These pulse trains enterthrough I/O modules which serve to filter noise, isolate the transducerlines from the processor network, and shift the signal to TTL logiclevels. The logic level pulses are then counted for a programmable count-ing period. The number remaining in the counter at the end of a countingperiod is proportional to the average speed over the counting period.The number is recorded as a count and converted to engineering units dur-ing data reduction
.
Clutch Slippage
The method of measuring clutch slippage involves detecting relative dis-placement of the two sides of the clutch. A nonrotating tooth sensor is
mounted to sense the passing of teeth on each gear. Tooth counters areconnecte-d to each sensor. When the clutch is engaged and rotated, the
gears are synchronized and the two counters count exactly together.When there is some form of partial disengagement present, the two gearsdo not rotate precisely together. They are said to slip. As a matter of
convention, the transmission-side of the clutch is the reference. Theprocedure for measuring slippage consists of counting a fixed number ofteeth on the transmission side and comparing the number of teeth countedon the engine side in the same time interval to that fixed number. Forexample, start both counters initially cleared at the same instant. Whenthe transmission-side counter reaches 100, read the engine-side counter.If it too reads 100, there was no slip. If it reads 110, then the en-
gine-side rotated 10 teeth more than the transmission side.
In studying clutch slippage, it seems desirable to detect not only the
presence or absence of slippage, but nature of the slippage. Is it a
smooth phenomena uniformly distributed over several revolutions? Or is
it irregular, occurring in some non-uniform, perhaps discontinuous manner?To answer these questions, the data required must project high magnitudesensitivity, coupled with precise location. The only readily-varied par-
ameter available is the number of teeth included in the reference. As
the reference increases in size, sensitivity increases, but locational
accuracy decreases. Decreasing the reference leads to better location,but less sensitivity.
The method chosen was to simultaneously measure slip with several differ-ent references.
The actual numbers of teeth available for counting are not as easilyhandled as those in the above discussion. The engine-side gear has 138
while the transmission side must be observed through a compound gearwhich appears to have 16.57 teeth. However, four distinct levels of ref-
erence equal approximately to 1/16 rev, 1 rev, 8 rev, and 64 rev are used.
Triggers are based on bands about the no-slip reference for each level.
202

Four similar circuits for each level are implemented. The interaction ofthe four simultaneously operating circuits is quite complex and is notpresented within this report. The four-level network forms a string of
data which includes trigger level and trigger location with respect to
the previous trigger. At no slip intervals, engine vehicle speeds are re-
corded as well as all the other normally measured parameters.
This amounts to a large amount of data relative to the recording rate of
the recorder. Thus, it is necessary to use a buffer memory within the
processor to permit data compaction and data speed averaging. A variableword length, self-identifying data stream is used to make the system com-patible with the recorder.
'Data Buffers
The data buffers are used to format data prior to entry into the recorder.All of the required digital data is shifted into the buffer from the var-ious processing elements. After data is assembled in an appropriate formfor recording, the recorder control is notified that the data is readyfor transfer to the recorder. Then the recorder control transmits appro-priate strobes to load the data through the recorder onto magnetic tape.
Control
s
Each major group of elements has some control all under command of the
main processor control. The monitor has adequate control to accomplishtiming, clock up-dating, and vehicle status sensing. The recorder con- ,
trol sequences the tape transport on, sequences the signal multiplexer,generates appropriate control characters and coordinates the writing ofdigital and analog data on magnetic tape. The master controller withinthe processor coordinates the monitor and recorder through their respec-tive controls in order to respond to triggers and process data.
Power System
All power used in the on-board system is taken from the vehicle's 24 VDC
electrical system. Isolation from vehicle ground is achieved by convert-ing the 24 VDC to standard 120 VAC which is easily transformer isolated.This DC to AC conversion was accomplished with a Topaz Model 250-GWstatic inverter. The AC voltage was used to power the recorder directly.Various precision DC voltages for transducers and the processor were pro-duced in the Power Module shown in Figure 3. All DC voltages were pro-
duced with commercially available power supplies.
Data Recorder
The recorder used is a Metrodata Model 620A shown in Figure 3. The unit
has been modified to record in both the digital and analog data inputmodes on all of its twenty channels. In the normal data mode, elevenchannels from transducers are analog, and the remaining nine are direct
205

digital from digital type transducers. The digital channels are formattedso that actually twenty-eight channels of unique data are available. Therecorder also records all channels in direct digital in the instantaneousclutch slip and the compression balance modes. All recording is in a four-track binary coded decimal (BCD) format on 1/4 inch magnetic tape housedin an endless loop cartridge. Analog signals in the range of ±1 volt arefed to the recorder where they are internally analog to digital converted.The unit was chosen for its ruggedness and performs well. Recording timeis dependent on the event oriented parameters measured. Nominally overfourteen thousand records are recordable which provides a capacity ofweeks without requiring a fresh tape supply.
Data Reduction
The data was reduced at GARD on the GA 1830 computer. A metrodata model622 tape reader was interfaced to the 1830 through the computer's I/Ochannel. It was controlled with an interrupt driver assembly languagesubroutine. The data reduction program was implemented with the GA 1830Fortran IV subset. Magnetic tape cartridges recorded with the on-boardsystem are read with the tape reader under computer control. As the rawdata enters the computer for processing, it is stored on dtsk files foranalysis. All data from tape is thereby directly accessible with normal
Fortran mainline programs and subroutines. Raw data is converted to
engineering units through the calibration data entered initially as casedata. Conversion is done before processing to eliminate errors due to
transduction non-linearity. Converted data is stored on a disk file foreventual use in tables. The maximum and minimum values of each parameterare determined in a straightforward manner. The averages, standard de-
viations and the maximum/minimum values for each parameter are printed as
a lata summary as shown in Figures 9, 10, & 11. Idle and operatingsummaries are illustrated. A listing in engineering units of all dataacquired comprises the data listing shown in Figure 12.
Summary and Conclusions
A total system comprised of hardware and software has been designed, de-
veloped, and installed on an M35A2 cargo truck. Hardware consists of on-
board transduction elements and associated processing and recording sys-
tems. Software consists of all Fortran and assembler level routines re-
quired to read and analyze the data that is recorded on magnetic tape.
All measurement points are calibrated by traceable standards from thepoint of transduction through the recorder. A continuing calibrationprogram shall be implemented. Data is provided for hot and cold idle and
motive vehicle operation. Data is also provided for clutch slip, com-
pression balance, and engine power measurements. The vehicle, with the
MO/MARS system installed, is presently undergoing road testing over high-
way, secondary and cross country terrain. All measured parameters shall
be uniquely observable over the entire length of the test.
20h

Acknowledgment
The results presented are based on work sponsored by the United StatesArmy Tank Automotive Command, Warren, Michigan. The authors wish to
acknowledge the contribution of Messrs. N. F. Muelleman of CARD and B.
Emerson and D. L. Gamache of TACOM to the design and development of the
MO/MARS system.
Key Word Index
Mobile Vehicle Testing -
TransductionRecorderMagnetic TapeOn-Board
205
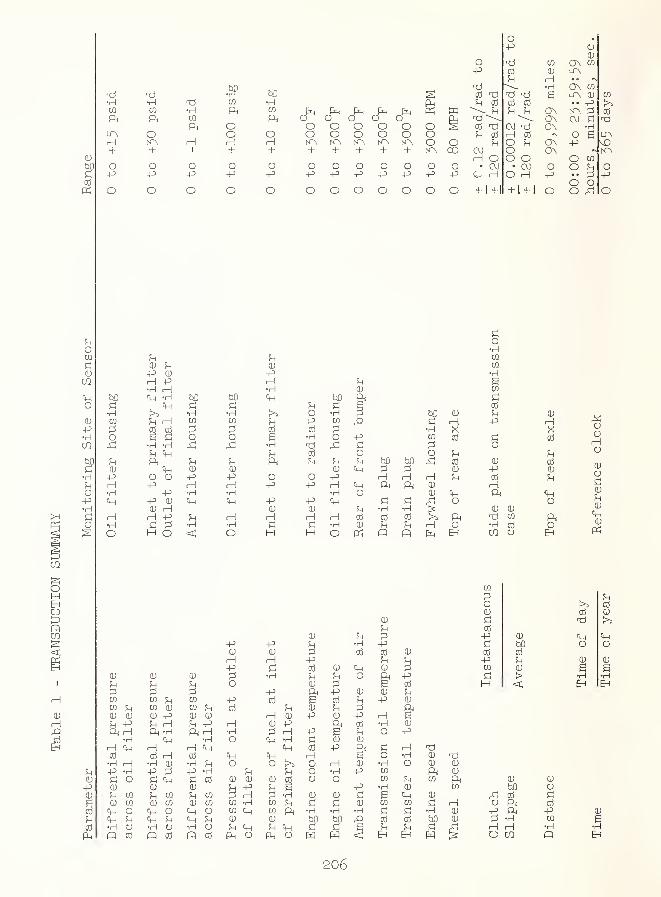
Opi
ec
o CTn CO-p
ra leLTN
w Ti •rH CTnTi Ti cd "Ti LiA CO•H •H CO •H p_l ?H cd Cu cd >30} •H ft CO fx. Pr, Ft , r-r. fx, ON KA I.U
pL, w ft o o o o On CVl
ft o o o o o o o cd TiJ cvj C7\ •rH
LPx o o o o o o o o o H cd o s LP\,—1 H H H o o O f7\ VO+ + 1 + + + + + + + KA CO O ON KA
(U H O O ow o o o O O o o O o o o o • CM CVJ o 0d -p -p -p -P -P -p -p -P -p -p -p p> C H d rH -p +>cd
+ 1+16 0
K o o o o O o o o o o o o + l + l O 0 -d 0
o
d0)
o
+>•HCD
d•Huo-p•Hdo
d•HCO
o
-pr-\
•Hcp
•Ho
u0) ^-P 0)
H -P•H rHCh -H
Ch>5fn HCO CO
S d•H -H?H Chft
ChO OP'
P>-P OJ
cu HrH P>d 1:5M O
d•HCO
13
o
U0)p>rH•HCh
•H
<
d•HCO
o
OJ
-PH•HCh
•HO
CD
-PrH•HCh
cd
E•H
ft
o+>
-pOJ
HdH
o+>Cd
•H
CO
o-p
-pcu
Hd
d•HCD
:3
o
(U
P"H•HCh
•HO
(U
ft
-pdo
Ch
ChO
cd
cu
0 d-P 4^ •H0) (U CdH rH HJ-P d Cd 0 Ch
(U cu d •H d d 0U 0 0 dd d 42 H^ 0
CO CO !H CO H-> Cd cd dCO ?H CO CU CO Cd ^1 0 d d(U (U OJ (U (U rH 0 4J 0 4^^ -p rH ^1 4^ H (U 43 Cd
ft H ft •H ft rH •H d H 4^ d•rH Ch •H 0 Ch •H d 0 0
rH Ch H H Ch Ch cd 4^cd cd H cd Ch Ch H•H H •rH 0 •H ^ 0 0 0 H 0P' •H :3 HJ •H d 0 •Hd 0 d Ch d Cd QJ (U (U CJ 0(U (U (U 4^ -p^ CO ^ CO ^ CO d rH d •H 0 0 d(U CO (U CO 0) CO CO •H CO d d d 0Ch 0 Ch 0 Ch 0 CO Ch CO ft •H •H •HCh U Ch ^ Ch ^ (U 0•H 0 •H 0 •H Ch Ch d dQ cd fi cd 0 cd 0 0 <
fciD
dHft
d•HCd
dO
0ddH^Cd
d0
04^
•HO
do•HCO
CO
•HsCO
dCO
dEh
sd0•HCQ
02
•HSwdCd
0 d 0d H 4^ H•H X XCO cd d cd
d 00 d d41: CO 0 cd
d 0 4^ 0H H d CO dft 0 H
0 Ch ft Chd 0 0•H 0 0Cd ft Ti CO ftd H 0 •H cd 0P EH CO 0 EH
0
4JCd
d0
04^
H•HO
d0ChCO
dCO
dEh
0 t30 0ft 0CO ft 0 0
CO 00 cO dd rH 0 ft CO
•H 0 -p ft 4^0 d •H CO
d H H •H
IS 0 CD 0
ooHO
0od0d0Ch0
02
d d0 cd
0 cd 0dcd4J 0 Ch Chd bD 0 0cd cd4^ d 0 0
0 e Bd > •H •HH < EH
•HEH
206

Table 2 - TRIGGERING EVENTS
Parameter
1) Differential Pressure
a) Oil filterb) Fuel filterc) Air filter
2) Temperatiore; coolant, engine
•3) Speed
a) Engineb) Wheel ( four speed ranges with
transitions identified) rangelimits
k) Time
5) Instantaneous Clutch Slippage
Triggering Condition
over 12 psid + 2 psidover 15 psid + 2 psidunder 27 in H^O + l^<fo
over 225°F + 5°F
over 2500 RPM + 100 RPM
0, 2, 15, 30, 50 MPH
over 5 minutes sinceprevious trigger
over E rad/T rad, E and Tprogrammable
207

208

FIGURE 2 MO/mass CABINET IN PLACEAND REAR CO'JmS ATTACHED
209
- FRONT
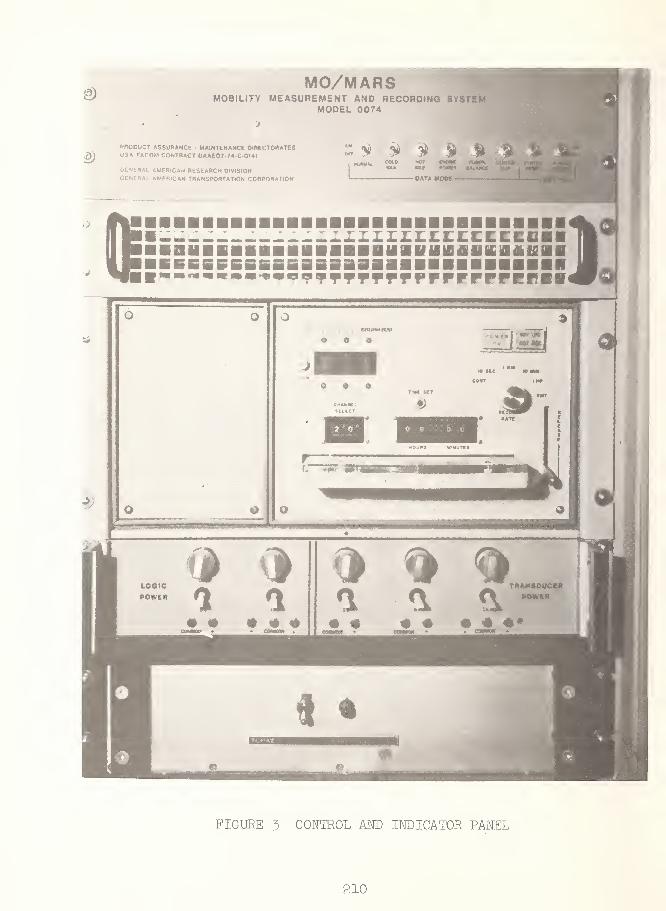
MO/MARSMOBILITY MEASUREMENT AND RECORUtNG SiSTE
MODEL 0074
PROCUCT ASSUB/SNCE - MAINTENANCE OISECTORATESUSA TACOM CONTRACT OAAgO?-?4-C 014)
GENSRAl AMERICAN RESEARCH DIVISIONGfMHAl AMERICAN TRANSPORTATION COnPOHATION
FIGURE 3 CON'IROL AND INDICATOR PAKEL
210
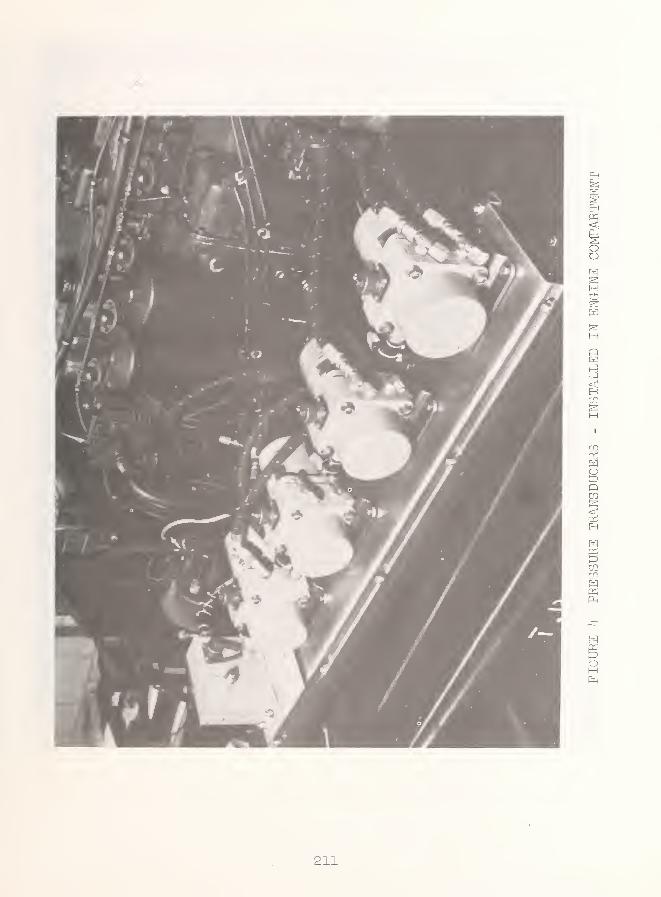
211

212

215

21k

r"
Battery
Oscillitor
Vehicle
Distance
Tape
Status
Cleck
DividersCiitroiler 1
1 _1 1
\'
Time Tape States
Set Up indicator
MONITOR
Rear Trans Engine Pressures &
Diff Tooth Tooth Tooth Temperature Battery
Transducer Transducer Transducer Transducers Voltage
r"
r- I/O I/O I/O —
1
Vehicle
Speed
Engine
Speed
l» It I. It
Vehicle
DistanceClitch Slip
|D|0|D
T7Tillli
I/O I/O
17
Data BufferTriiier
HaRiler
i ^c^cic
Master
Controller
Clock
BufferPROCESSOR
1
1
Operational
ClocksController
1 1
Mag Tape
Transport
MUX/
A to D
RECORDER
FIGURE 8 NETWORK SUBSYSTEMS BLOCK DIAGRAM
215

r r in— -J-
H <S. <i
LiJ jj —
C J. 2. 2.
a: I2. o c. c
_J 3.
c oX O ^a. w I- o
U on
U o> _J ^
X <1 :/> -I.
3- «->
or o •-
O E i5(T 3 U- Ua UJ »- C
j: rv.
A. LJ
n -I
O .'" -L
a:
»- Co o
OM
M
o
* J W5 3
q: -I:»^ ir
. < CL a.
Z Q^ u c
: z 0- tL. UJ V) (£
>- U Uoc e o
CJ UJ <^ »- H- *- sO
CO u.z
I «3 OK O
O \ IQC o a»- rO £
X I »-
u UJ an r<i < X
o ccI— t- UjU I- 'jJ UJ 0.t/; UJ to 3
Q <I C Zc o
U. U. •-' XO O UJo <: o
Uj uj O3 UJ 3 >-I 3 _l UJ X< _l < O t-> <3 =>> Q _1
y: UJ X <i
3 sr o «a I-
i: 3 «i o oi: X z »-
X uJ ^ •
< Z > *- I
f: -I ^ 7) -I E t I OI I I I X— I — —T — • > •
0 3 UJ Q t-»-« o > • o1 _J < t/) t-
I I I I I
.H eg fO * rO
CO
OA
H(in
z z zL. UJ 3L*> LO (E
2l6

*i —ca:
C 3_l
^ u o3- LJ U^ XOI 3 OU I
r" ujI <
C jj I
< —
— c: 3-(_)£««r Z «a
i: yi
«a <
3 nL, c •
c i o
t) _i y) J
oreX o ui UiCL W t- O
-« 3U. V)
i </i a
CO <.H Q. ^
UJ ^ or > _t «d. « t/", X
^ cc •
>- <a >- Xa: < u «=
1 o »- 3
* h- CO *M C LJ *oo -I ^
(TO ^ r-l
C IP cX oy o*- c\;
z cO -• U-
O V IX O Q.I- (T a:
(3 i: oX z w UJ0. ui I- a
woH
I—
I
OO
I- zX OC (_»
a.X CO
2: o V.o u c-4 Xc/) zr oo v.
:><—>Mt »- XO <T <
»- QT X ^LJ O OX a. u< to -JuJ 2(/) < X.U X >*
z z< < 2u u oX X »-
Ul LJ 0.C E ^«Z < X
* -J (/) 3 -H
-I X»-> 3li. CO
to 3X U •-•
X '-' X '/>
a- < Q. i
z o(>J Jo u cX z a. 0.a uj CO X
> u t->
(TOO(VJ UJ <«-» »- *-
»- _) «jX < o oQ. ca =» >
Q. Xc u
f4 h- to li-
^ z^ < LO
X ^ X UJQ. O Q
^ < OX X UQ- O Q
tD \ XX O Q.»- K> t
O Xt- h- UJUJ f- Ul UJ Q.CO LJ (O 3
CO _l ucr «a <i 3I- < t- > -J<i *- < <i
o <r o z >o o
u. u. -• XO O t- LJO < OD
UJ LJ «-• O3 Ui 3 > -tJ 3 -1 X< _J «I O •-
> <l >> O -I
i: Ul X <i
3 »: o ^ t-
i: 3 < o o<-• i: X zX J «3 I
< ^ > I- I
E «t y)
I z: I I oI I I I X
CD :x jj o t--« o :> • oT -t « CO t-
I I I I 1
•H ry to * in
CO
o
M
z zu u; 3LB L5 ?r
Q ^ « 1
Oi Xq: \ a*- o »
217

J -c *:
•c A -J"
1_) o •
<f s ct- a.
X r ID
UJ LiJ
r D T^
J U —I =-
Q- o :l i
X ^ cc y c
X O ui uJt- £L
I (/I o
c :^ T
>- < >-
(£ < U <X 3 >- 3
Kl O U-
o s: o(T Z UJ Ula u ^ o
O uj ^o c <
->If) c
q: 7U o^ CV! u
:i 3 -I
O —O V) Ll
3 X -1
U O £a: tn c
(>j a.
c o
oH
HEhO
* -1 to O f-»
Z O t/}
o u oz o
P-H O N.:>»-<>-
T or zu o oX X <->
<t W) J^ Z (AVI < XLj cr >-
i »- 3I
z z< <I z(J u c
r XmJ ui 0.i: c< 4 X
fO I/) os u
a: (T I/)
a. < Q. a
z ofNJ J
Id LJ cz z a a.a. uj (A oe
>- u ua: o o
(M u <
J < oX ^ X ua. o r- o
-J « Ida: M tr uQ. o t~ a
o x rtr o CLt- fO i;
(_l olO
o V Iz tn 0.
O CE»- *- U-LJ »- UJ UJ ^V} U to 3
tn -J uj«r « < 3t- < t- > J< »- 4 <o <: o z >
3 Ul 3 >-I 3 J LJ X< _i <I O t-> «t >> O -I
z; uj cr «3 i: o < ^-
C 3 < Q Oi: a. z
M m 4 I
«1 2 > t- I
C <S ^I C I I oI I I I eX — • > •
O 3 jJ Q t-
^ o • o^ _J <J C/" t-
^ ry K> * in
CO
2 2 ZU UJ 3t<» 13 fr
218
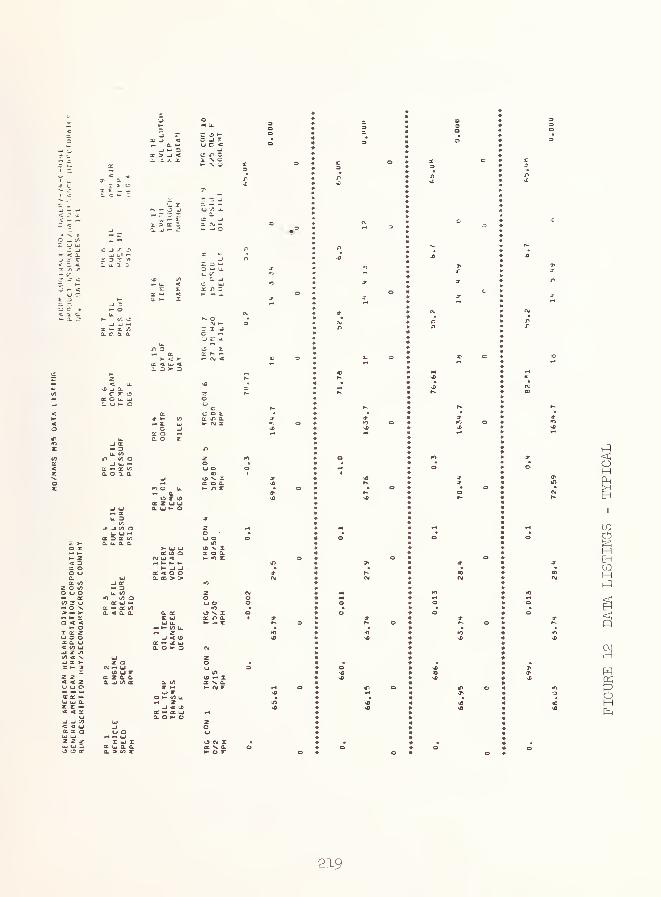
o ^Z Ui
-J- X
1 7)— (/
2 «
:j C •<. a. c
3. r'
c T oCC C L. uJC l_» »- o
< 3s oo ucOC (/)
z o v>O tJ oMi OCto 3 OMOV^ M >« XO « 4
»- oX (T ZU O OX a. u< (/) u^ z« < N.
^ tr V
z z< 4 ZiJ o O
UJ kJ o.c c< «a X
z z zu< UJ wo or
z o« u
(A u rK z a. 0.a. ^ tn K
X ui Za uj a aa. > tfl c
- - ci > a: 33- *J I- ^
I v; J.
•HE. ujC U
X O «-i
CO i:
c: o L(T in a.H- N Z
> u u(E tfl O
OJ UJ «
-J 4 Ifl
o: -4 X ujQ. O »- 3
^ < IfS S UJ0. o ^ o
o
<o
02
HEH
H
CMH
H
219

DISCUSSION
D. N. Fry, Oak Ridge National Laboratory : Are you going to use thisdata for design purposes or for maintenance purposes?
F, K. Chin : We see it right now as being for both.
D. N. Fry : Are you going to have an active program of evaluating thisdata and scheduling maintenance?
F. K. Chin : We are going to perform normal maintenance for 10,000 ^
miles, and then nothing - just drive the truck into the ground.
R. Lenich, Caterpillar Tractor Company : Is there an indicator for thedriver to stop the truck in case there is a malfunction or is thisstrictly for data acquisition?
F. K. Chin : Basically, it is for data acquisition.
R. Lenich : If a truck component was not operating properly, the driverwould not know it at that point.
F. K. Chin: No, he wouldn't.
220

VIDEC SfflP PROPULSION SYSTEM PERFORMANCE MONITOR*
Richard P. Wallace
Raytheon Company, Portsmouth, Rhode Island 02871
V^lliam L. McCarthy
McCarthy Marine & Ocean Engineering Associates
Great Neck, New York 11023
INTRODUCTION
The Vibration Analysis and Deviation Concept (VIDEC) is an effort directed
and sponsored by the US Maritime Administration (MARAD) to develop an effec-
tive performance monitoring system for main and auxiliary marine machinery
plants. The project encompasses, within three phases, concept development,
performance specification, design and fabrication, installation, . operation
and evaluation. It spans nearly five years and involves six major participants
from the maritime community.
Historically, the Deviation Concept was conceived by J.K. Salisbury under
contract to the Bailey Meter Company for applications in heat cycle analysis in
large shoreside power generating plants-'-. The VIDEC Phase I contract was a
program sponsored by the US Maritime Administration's Office of Commercial
Development (MARAD-OCD) and performed by a multidisciplined team at the
State University of New York Maritime College (SUNYMC) with the purpose of
applying this concept to the maritime industry. This work was performed during
1971 and 1972 and resulted in the formulation of a set of mathematical, thermo-
dynamic and vibration processing expressions which were designed for a com-puter-based realtime shipboard monitoring system^. A set of performance
specifications was also developed during Phase I for such a computer-based
system.
The Phase n effort was initiated in early 1972 with separate contract awards
to Raytheon Company and Ingalls Shipbuilding Division of Litton Industries for
the respective tasks of system integration and shipboard installation aboard a
*Original version of this paper presented at meeting of Society of Naval Architects
and Marine Engineers, New England Section, at Portsmouth, R. I. , 24 January 1975.
1 Dickinson, C. E. , "A Method for Propulsion Plant Performance Evaluation for
Marine Application," IEEE Transactions on Industry Applications , Volume
IA-10, No. 2, March/April 1974.
2 Gleicher, N. , Kramer, A. R. , Mathieson, J. , and Pergament, S. ," The
Deviation Concept: A Tool for Preventive Maintenance of Marine Power
Plants," Marine Technology , October 1972.
221

newly constructed American President Lines' (APL) vessel. MARAD wasassisted in technical liaison and coordination by the National Maritime ResearchCenter in Kings Point, NY (NMRC-KP). Consultation was provided by SUNYMCduring the transition from Phase I through the Phase II effort. The culmination
of Phase II was the computerized real-time machinery monitoring and display
system installed on board the SS PRESIDENT JOHNSON in January 1974.
Finally, the Phase III portion of the VIDEO project includes those constitu-
ents which are required to fully evaluate the effectiveness of a system of this
magnitude and potential. The major participants under MARAD direction include
Raytheon, NMRC and APL. The objectives of Phase III include technical and
economic feasibility analysis of the VIDEO system in a two-year operational
evaluation.
This paper discusses the Phase II and Phase in program evolution with
interim findings one year after ship delivery.
SYSTEM DESCRIPTION
The Deviation Concept is simply a method of performance analysis of the
propulsion plant whereby representative parameters are closely watched for
departure from a reference figure of merit (Baseline). Continued observation of
these variances should lead to certain deductions beneficial in effecting mainten-
ance scheduling, efficiency regulation, manning improvements and increase in
overall ship availability. A properly chosen set of measurement parameters can
provide performance analysis to determine:
Machinery deterioration trends v
The contribution of performance degradation of an individual machine to
the overall plant efficiency
Predicted time to failure estimates.
The VIDEO system contains the essential ingredients to put into practice
this Deviation Concept on board the American President Lines' containership
SS PRESIDENT JOHNSON. The key to successfully implementing this concept is
determining just what a "deviation" is. The characteristics of the marine steam
propulsion plant vary considerably depending on sea state and other operating
conditions. The resulting variations of these normal operating ranges and con-
ditions are numerous and as many different modes of variation exist as there are
parameters to be monitored. Therefore, a major requirement of the VIDECsystem was to provide the ability to ensure highly repeatable measurements with
comparison to precise reference operating conditions. In order to facilitate
control of such an intricate task, as well as to execute realtime thermodynamic
222

and vibration processing algorithms, VIDEC was developed as an automated
digital computer-based system.
This process of establishing the reference values for all monitored param-eters and providing the means for normalizing this data for operating conditions
has been designated "Baseline Mode" . With a propulsion plant running at an
optimum performance level (presumably during the maiden voyage) a complete
data set is acquired, processed and stored for several (five) operating load
points of shaft horsepower spanning approximately 80 percent SHP through 100
percent SHP where the heat cycle remains relatively constant. When the five
load points have been stored, further processing takes place to produce coeffi-
cients of an equation which represents abestfit curve for each parameter. It is
to this curve that subsequent data will be referenced.
The system analysis is partitioned into two distinct categories: Vibration
Analysis and Thermal Analysis.
Vibration Anal3^sis—Vibration analysis consists of maintaining surveillance
over 25 pieces of rotating machinery plus the line shaft bearing for deviations in
vibration levels measured by 104 fixed accelerometer sensors. Each vibration
"channel" is examined over a broad spectral range of frequencies with 1/3
octave resolution totalling 30 bands. In addition, combinations of these bands
are assembled together to form regions (four regions per channel). Regions are
tailored to the specific natural vibration forces of each channel; i. e. , RPM,blade count, electrical frequency. Thus for each of the 104 channels, there are
30 bands plus four regions which are processed for amplitude deviation from a
reference containing over 3500 separate baseline curves. During the baseline
procedure several RMS samples are measured for each point and, based on a
statistical computation, the baseline level arrived at includes the sample
variance and allows for a 99 percent probability factor.
The 30 bands have assigned upper "alarm" limits which if exceeded actually
initiate an audible/visual alarm with a printed description of the deviation. The
four re^ons have assigned upper limits also but for another reason. The
regions, being representative of the specific machinery excitation forces, are
maintained for trending purposes. The upper limits for the regions are used for
a reference to wiiich a time to alarm prediction is computed based on a least
squares curve fit of a collection of past and current measurements. This infor-
mation can facilitate maintenance scheduling by making maximum use of
machinery history.
Thermal Analysis—Thermal analysis involves a determination of perform-
ance deviation for the main and auxiliary machines within the steam cycle. The
performance measurement is based on a set of 73 calculations called "macro"
225

parameters which are indicators of the condition of 17 different components with-
in the propulsion plant. These calculations are based on the measured "micro"
values of 99 discrete parameters and 22 on/off monitors including eight different
types of measurements:
1) Temperature ' 5) RPM2) Pressure - 6) Valve position
3) Flow rate 7) Kilowatts
4) Torque 8) On/Off
The reference or baseline for the thermal analysis is established in a
manner similar to vibration and at the same time. There are 99 "micro" and 73
"macro" baseline curves produced to which subsequent data are compared and
the deviation recorded. Alarm limits (upper and lower) are assigned to each
macro parameter and, if exceeded, cause an audible and visual alarm and
printed description of all measured and calculated values for the respective plant
component (Figure 1). All thermal values (micro and macro) are retained for
trending whereby the data history is presented in graphic form.
In addition to the micro and macro values processed in the Thermal Analysis
portion of the system, a set of 25 special computations called "Dollar Devia-
tions" are made to estimate the respective penalty associated with a degradation
FEED PUMP 2
PARAMETER DEVIATION
***54 TURB STEAMRATE 28.5 20.18294
***55 PUMP EPF .502 .26077
***56 WATER HP 264. 74.07727
57 RPM 4472. 115.97852
90 MN FD PUMP FD WTR FLOW RATE2 LBS/HR 179386. 120906.90625
91 PORT MIM FD PUMP SUCTI DIM PRESS PSIG 53.6 7.33070
92 PORT MN FD PUMP SUCTION TEMP DEC F 296. 27.28949
93 PORT MN FD PUMP DISCHARGE PRESS PSIG 1132. 80.60327
94 PORT MN FD PUMP DISCHARGE TEMP DEG F 301. 28.26068
95 MN FD PUMP TURB STM FLOW RATE LBS/HR 15000. 14335.70703
96 PORT MN FD PUMP RPM RPM 4472. 1665.66602
Thermal alarm deviations are presented on the line printer with all associated parameter values and
deviations from baseline. For each report all macro and micro parameters for the affected machine
are presented.
Figure 1. Typical Thermal Deviation Report
22h

of efficiency. The calculation appraises the total additional fuel consumption
effect contributed by each machine and the "dollar" deviation refers to a unit
value per barrel of fuel oil.
Once the Baseline Mode has been completed, the VIDEC system functions-
automatically hy completely scanning all data once per hour in an Operate Mode,
logging and alarming any deviation which exceeds set alarm limits. At the end of
the day a complete report of all parameters is printed for hard copy history.
Prior to each Operate Mode, the system exercises a thorough equipment calibra-
tion and self-test routine reporting any errors along with a fault isolation code.
This code represents the result of a systematic troubleshooting analysis per-
formed by the computer, and when used with the technical manual describes the
most logical problem area with identification of the failed module (s).
Several additional modes of operation are available to an operator via the
console control panel to retrieve data over and above that which is printed
regularly.
These operator modes Include the following:
1) Calibrate Mode 4) Baseline Mode
2) Demand Mode 5) Self-Test Mode
3) Standby Mode 6) In-Port Mode.
Calibrate Mode—provides a repetitive readout, via cathode ray tube (CRT)
display, of a selected thermal channel in engineering units for the pur-
pose of span adjustment and calibration of sensor signal conditioners.
Demand Mode—allows the operator to select, via keyboard, 10 special
request operations from a CRT-displayed menu. These requests Include
the following:
• Vibration trend graphic display of a four-region history over the past
24 hours or past 30 days on a selected channel (Figure 2).
• Thermal trend graphic display of any micro or macro parameter
history over the past 24 hours or past 30 days (Figure 3).
• An up-to-date elapsed running time count (hours) for each of 22
pieces of machinery .
• Automatic initiation of an analog tape recording of 13 preselected
vibration channels for use in off-line narrowband analysis.
• Graphic vibration display, 1/3 octave, frequency vs amplitude spec-
trum for a selected channel (Figure 4).
225

CHANNEL I LINE SHAFT BRG NO.l (FWDEND)DAY I
REGION TIME TO ALARMHOURS
NSC > 900.0
NSC > 900.0
NSC > 900.0
HOUR 0
331.1
The vibration trending function uses a graphic representation of time versus vibration vwitbin each of four
regions for a specified sensor address. The regions displayed are those bounds preselected for each particu-
lar channel and include the total signal summation of all bands (groups) within the defined bounds. The
deviation presented is a ratio of the measured data to the baseline data. A time-to-alarm estimate is printed
to the right of each region plot and is based on a linear least-squares curve fit.
The operator options available include:
1) Trend by hour for 24 hours
a) Previous day
b) Present day
2) Trend by day for up to the last 30 days.
Figure 2. Typical Vibration Trends Presentation
226

THERMAL MICROPARAMETERSDAY I
r 120
-96
-72
-48
-24
•-0
rl30
-104
-78
-52
-26
>20
-16
-12
-8
•-0s
•-0
HOUR 0
\ I I I Ti I
I
\ rI34567890 23
1
- CONDENSER WATER INLET TEMP DEG F
2 1 CONDENSER WATER OUTLET TEMP DEC F3 \ CONDENSER CONDENSER PRESSURE PSIA4 ^ CONDENSER TEMP MAIN COND DEG F
Thermal trends of multiple microparameters are available on a graphic representation of time versus thermal
values for four channels simultaneously. Included in the display are the legends with engineering units with
respective measured values taken at the indicated times.
The operator options available include:
1) Trend by hour for 24 hours
a) Previous day
b) Present day
2) Trend by day for the last 30 days. ^
Figure 3. Typical Thermal Trends (Multiple Microparameter) Presentations
227

60DB
50 -
40 -
CHANNEL 99PREPROCESSED DATA
AFT STEER PUMP MTR FHD BRGRHT HD57 9
30 -
20 -
10 -
0 -
BAND 2 3 4 5 6 7 90 I 2345678 2
9 0 I 2 3 4 5 6 7 83
9 0
CNTR B L 6 7 9 1 1 1 2 3 3 4 6 7 9 1 1 1 2 3 3 4 6 7 9 1112 3FREQ B P 0 5 6 2 5 9 4 0 8 7 0 5 6 2 5 9 4 0 8 7 0 5 6 2 5 9 4 0CPM XIO XlOO XIOOO XIOOOO
An on-line graphic plot of vibration level versus frequency for any selected vibration channel is available.
The amplitude level axis (vertical) is scaled in dB reference 1 millivolt RMS. The frequency axis (horizontal)
is segmented in 1/3 octave bands with the exception of the first two. These two bands represent broadband
and low pass (1.25 to 9 Hz) respectively. The frequency axis is labeled in unit of cycles-per-minute for direct
RPM correlation. The assigned regions are shown at the top of the graph in tick marks.
Figure 4. Typical Vibration Channel Preprocessor Presentation
228

• Graphic vibration display, broadband amplitude vs time over a 10-
minute period for a selected channel.
• A printout of past 30-day record for all daily averages at end of the
current day.
Also available via the Demand Mode is another menu which can be
accessed for the purpose of changing thermal and vibration constants
stored in the computer memory; e.g. , alarm limits, region allocation,
thermodynamic constants, etc.
Standby Mode—when initiated, places the VIDEC system in an idle condi-
tion whereby no processing takes place.
Baseline Mode—allows entry to stored data at any time to reestablish a
new reference if major overhaul or replacement of a machine takes place.
Self-Test Mode—allows initiation of the system diagnostics at any time in
addition to that which automatically takes place once per hour.
In-Port Mode—extends vibration surveillance to include the period whenrotating machinery remains in operation while the propulsion plant is
either running below 80 percent SHP or secured.
The system configuration consists of 13 Signal Acquisition Stations, 203
sensors, an engineroom console, two signal processing cabinets, ASR-35 tele-
type, and an analog tape recorder (Figures 5, 6 and 7).
The purpose of the Acquisition Stations is to consolidate those sensor cables
within a local area and route them via a single (multiple pair) cable to the signal
processing units. No processing takes place in the stations with the exception of
signal conditioning needed to convert some sensor output signals to a form suit-
able for reliable transmission over long distances.
A complete list of system sensors is included in the appendix. All of the 104
vibration sensors are of the accelerometer type. The thermal sensors include
various types, each chosen for a specific application. A description of these
sensors follows:
Temperature : All channels—platinum Resistance Temperature Detectors
(RTD)
Pressure : All channels—capacitance element
Flowmeters ;
• Condensate, steam— A pressure (orifice/nozzle)
• Fuel oil, saltwater—turbine
• Distillate—variable area
229

250

1Ti
Figure 6. VIDEC Console
251

Figure 7. VIDEC Analog and Digital Processors
252

RPM:
• Feed pump—Magnetic pulse pickup
• Main shaft—Torductor
Valve Position ; All channels—Linear Variable Differential Transformer
(LVDT)
Kilowatt : All channels—Hall effect transducer (current transformer pick-
up).
The Signal Processing Units contain all of the analog scanning and prepro-
cessing hardware, system control hardware, computer, disc memory unit,
digital cassette recorder and power supplies. This portion of the system func-
tions under complete software control via a Raytheon 707 digital computer and
every hardware processing function is dependent on a computer program instruc-
tion. All of these programs reside on the disc memory and are "called up" to
core memory when needed. The disc also serves to retain all historical and
baseline data. A cassette unit provides a means to load new program changes
and also record historical data from the disc for permanent retention.
The Console, located in the engineroom, contains the following equipments:
High speed line printer for logging of daily reports, alarm descriptions
and 30 day reports
CRT display and keyboard for presentation of graphic trends, parameter
values, demand request menus and operator communications
Hard copier to reproduce CRT presentation
Time of day clock which acts to control the system time-dependent func-
tions
Control panel to allow selection of system modes.
Other units include an ASR-35 teletype used for baseline operation only, and
an analog tape recorder to make recordings of unfiltered vibration data for off-
line narrowband analysis.
SYSTEM IMPLEMENTATION •
VIDEO implementation. Phase II, called for hardware and software design,
fabrication and installation of a fully integrated system applying the system equa-
tions and performance specifications developed during Phase I. The primary
objective of Phase H was to produce a system which would evaluate the VIDEOconcept using present day technology with minimum operator intervention.
255

The principal considerations included:
Instrumentation data integrity
Maximum use of proven, off-the-shelf hardware
Equipment reliability
Ease of accessibility and repair
Ease in operator-system interface
Flexibility of operation, expansion, etc.
Rapid installation at minimum costs
System simulation test
Training. :
During the initial system definition period several modifications were madeto the VIDEC sensor specifications involving deletions and reassignments of
sensors, for reasons of optimization. The final system sensor list wiiich was
implemented is shown in the appendix. Other modifications to the system speci-
fication were made throughout the project development to improve operator
interface and increase data collection. During these periods of redefinition which
affected all participating parties, the technical coordination of NMRC was sub-
stantial and quite beneficial.
A proper selection of sensor and transmission techniques is paramount in
achieving accurate, stable, and reliable measurement data over an extended time
period. To this end the following actions were taken:
Numerous sensor manufacturers were surveyed in order to acquire
sensors of proven reliability
Susceptibility to EMi/RFI was minimized by using integral signal condi-
tioners on each sensor wherever possible
For those sensors requiring non-integral electronics, the cable distance
between primary element and signal conditioner was minimized by use of
the local acquisition stations
An all-encompassing grounding and shielding design standard was devel-
oped for the entire system to suppress external signals generated by ship-
board machinery
A special software-controlled treatment of sampled data was employed to
eliminate noise transients.
23h

The application of commercial off-the-shelf hardware was a major goal for
the VIDEC program. This presented no significant problems. Equipment trade-
off studies had shown that for each function required, there were several candi-
dates which, with only minor ruggedization, could perform satisfactorily within
the shipboard environment specified. The fact that the processing equipment was
to be installed in an air-conditioned space allowed usage of the ASR-35 teletype,
analog tape recorder and commercial vibration analyzer directly with only shock
and vibration isolation added. Both the 707 computer and disc bulk storage unit,
crucial to the system operation, were chosen specifically because they were
designed for a harsh shipboard environment. The engineroom console required
considerable attention with respect to temperature, humidity, dirt, vibration,
etc. The commercial equipments (i.e., line printer, CRT terminal, realtime
clock and hard copier) were repackaged to withstand the vibration and shock; oil
and moisture seals were placed on exposed switches and indicators; air circula-
tion was provided around all heat dissipating equipment; cooling air was provided
at the filterA)lower inlet from a ventilation duct; and quick access to all elec-
tronics was made via slide-mounted pull-out drawers with latching handles.
The system was designed to provide complete "hands-off" operation for
normal watchkeeping functions, the basis being that, to be consistent with the
Deviation Concept, only degradation from baseline should require attention.
However, when a deviation causes an alarm, and a closer look at data is neces-
sary, a simple operator interface is provided using a concise conversational
mode. The subject of operator interface was of concern from the outset.
Because of the prototype nature of the VIDEC system, there are numerous dis-
play types, system variables, and data printouts intended primarily for system
performance analysis and not necessarily useful to the engineroom operator.
The conversational type operator interface via CRT terminal was chosen as the
best means to implement system flexibility and at the same time provide access
to operator demand modes. Through a displayed menu, the operator may choose
one of the graphic trend displays, a vibration signature, or alter system param-
eters; e.g. , alarm limits, sensor range, higher heating value for fuel oil, etc.
System flexibility is inherent to the software-controlled nature of the VIDECwhich makes use of a powerful minicomputer software system.
A major concern associated with a system like VIDEC is how to thoroughly
test it before delivery. With the many modes, calculations, displays and param-eter interrelations, the only practical method suitable was to develop a simulator
to provide a programmable representation of every system parameter. The
simulator hardware was developed and a test program prepared to test the sys-
tem at the factory and again on board the ship as an installation checkout prior to
connecting actual sensors.
235

The simulator proved itself invaluable during factory test and also in the
training course which was held to familiarize the ship's engineering personnelwith the system. The training course included a mixture of theory, operation,
and hands-on working sessions. The attendees and lecturers included the ship's
Chief Engineer, First Assistant Engineer, Operations personnel and representa-tives from all of the participating agencies and firms.
INSTALLATION
As part of their contribution to the program, American President Lines
(APL) made the machinery plant of the SS PRESIDENT JOHNSON available for
integration with the VIDEO system. The vessel is the last of four PACESETTERclass container ships built for APL by Ingalls Shipbuilding Division of Litton
Industries, Pascagoula, Mississippi. She was delivered on 4 January 1974. She
is 680 feet long overall, displaces 22, 000 tons dwt, and has a maximum service
speed of 25 loiots. Her power plant consists of a cross-compounded single plane
steam turbine main engine and reduction gear set, two boilers and four stages of
feed heating. She is equipped with a GE Central Operating System (COS) for
propulsion control. The vessel is presently employed in APL's US East Coast-
West Coast- Far East run.
PROGRAM MANAGEMENT
In view of the great physical distances separating the parties involved in this
project and their varying operational philosophies, the coordination and manage-
ment became a formidable task. The responsibility therefore was shared
between MARAD-OCD in Washington DC and the NMRC-KP. The CCD ProgramOfficer was responsible for the overall management of the project while NMRC-KP was assigned certain technical review and coordination aspects. As the pro-
gram moved into the fabrication and shipboard installation phase, the programmanagement function became critical and more demanding. The occurrence of
changes in design, delivery of critical items to the yard, and other last minute
events that seem to accompany a project of this nature became paramount as the
vessel neared completion. In many instances solutions were worked out with a
verbal agreement. The cooperati_pn and involvement which was instilled in all
parties proved to be indispensable in achieving the system completion without any
major deviations in program schedule.
VESSEL DELIVERY SCHEDULES
The original schedule called for equipment delivery by January 1973 and
installation completion by June. Many long lead delivery items were involved
and procurement could not be initiated until ship piping design was completed and
256

these sensor specifications defined. However, the VIDEC installation contract
negotiations between MARAD and the shipbuilder were not complete until July
1972 and a specific hull was not defined until January 1973. The immediate
effects of these delays prevented the timely commencement of:
Specifying sensors for procurement
Development of interface specifications for shaft RPM and torque (supplied
via COS unit)
Defining sensor cable lengths for procurement
Defining cable lengths for cabinet interconnections
Finalization of software equations as affected by sensor specifications
Flowmeter orifice plate design and procurement.
A work-around schedule was implemented that minimized the effect of these
items on equipment delivery.
The system was designed for rapid installation so that equipment delivery
could take place at the last possible moment and not interfere with normal ship-
yard tasks. The installation plan called for: a) Early delivery of the acquisition
stations requiring shipyard wiring to terminals; b) connectorized cabinets with
the cables being made up in advance by the yard; and c) a parallel effort of
sensor installation. System checkout was to consist of mounting of the cabinets,
plugging in the prefabricated cables, and repeating the simulator test previously
run in the factory. In this manner the equipment checkout could proceed without
the need for all sensors to be installed or the steam plant to be fired up. All
went well with the exception that the simulation could not be accomplished. The
feverish activity in the engineroom prohibited the complete assembly of the con-
sole for an extended period of time. There were two 12-hour shifts working due
to the tight delivery schedule. The CRT terminal and control panel turret, if
left assembled, would have been damaged. Also, the disc unit was damaged
during installation handling and the full program loading could not be imple-
mented.
During the fabrication and installation phase, there were other activities of
interest taking place. To better define the signal levels anticipated and assist in
choosing exact placements for vibration sensors on typical machines, early in
the program a portable instrumentation package was taken on a sister ship, the
Farrell Lines' SSAUSTRAL ENVOY. The equipment included accelerometers,
the necessary amplifiers, and a tape recorder. Vibration data vere recorded
from several machines in various locations and the tape played back through the
in-house VIDEC system for analysis and verification.
257

All equipments underwent a 40-day (24 hour/day) burn-in period in order to
minimize failures due to infant mortality. This burn-in applied to the entire
system including those electronic signal conditioners which were delivered to the
ship directly from the vendors. The VIDEC system was subject to US Coast
Guard and American Bureau of Shipping approval. Special Coast Guard approval
was extended for the use of a connectorized installation and unarmored low noise
vibration Triax cable.
The installation experience identified several considerations applicable to
future systems of this nature. The most severe conditions encountered by the
VIDEC system occurred during handling in the shipyard installation phase. It is
felt that shipboard simulation is the ideal method for installation checkout. Wereit not for the various difficulties described earlier, a very rapid and effective
system checkout would have been accomplished. The placement of the console in
an open area on the main engineroom deck probably subjected it to more potential
damage than if it were an integral part of the engineroom console complement.
Temporary protection during this installation phase should be provided for all
equipment subject to physical damage. The disc unit, as an operational device,
running at its normal speed, is capable of withstanding large shock and vibration
conditions. However, during installation and handling it becomes more vulner-
able as the sensitive pickup heads are resting on the disc platter. Special equip-
ment such as this should be shipped separately from the main cabinets and
handled with special care.
EARLY DESIGN CONSIDERATIONS AND RESTRICTIONS
It has been the general policy of MARAD-OCD during early negotiations with
ship operators, for the shipboard installation and operation of a prototype sys-
tem, to ensure that a given system would in no way impact design, development,
construction, or operation of the vessel. Each system must incorporate the
ability to be quickly isolated from the particular subsystem being monitored or
controlled or must be designed so that its function is totally independent of actual
vessel operation. There was also an agreement with the ship owner which called
for equipment removal if the system proved unsatisfactory. It is within this
basic framework that Raytheon's application of Phase I results to the propulsion
plant of the SS PRESIDENT JOHNSON was undertaken. All of the VIDEO'S
instrumentation and therefore, all of its signal inputs were completely independ-
ent of existing sensors except for torque and RPM signals which were supplied
via COS.
These ground rules naturally created a situation where redundant instru-
mentation was required. VIDEC instrumentation duplicates and supplements the
COS sensor configuration for major engineroom machinery components. Other
258

aspects of VIDEC's design and installation were also impacted by these consid-
erations. Orifice design and installation is a good example. Proper operation
of an orifice or flow nozzle for mass flow determination requires that sufficient
straight pipe be available both upstream and downstream. These lengths gener-
ally are based on the expected pressure drop across the orifice, steam line
pressure, pipe diameter, and other factors. Those familiar with marine power
plant design know that relatively long straight runs of high pressure steam piping
are at best uncommon on ships due to space, expansion, and other considera-
tions. Therefore, situations arose where the unavailability of straigjit pipe runs
and significant pressure drops across an orifice plate made flow measurement
unacceptable. Superheated steam flow rates from the port and starboard boilers
and steam flow to the main engine are examples. These signals are critical to
the thermal analysis of the boilers and turbine set. By relocating certain flow
transmitters and making use of VIDEC's computer software flexibility to insert
a mass flow summation to derive these critical values, the resulting elimination
of these orifice plates had little impact on the thermal analysis portion of the
system.
Another critical area for design consideration was cable length between
various system components. Integrity of signal transmission from sensors to
data processing components to display console was a major concern in determin-
ing maximum cable lengths. Excessive runs could cause signal degradation
and/or excessive noise pickup. Although certain system components were
located outside the engine spaces their location was limited due to cable length.
Generally, the course taken throughout system design and installation was one of
altering VIDEC to fit the ship rather than attempting to alter the ship to fit.
VIDEC, with minimum effect on the resulting data.
Integration of a complex electronic system with a newly built vessel is
certain to impact the contractual guarantee of the ship's construction. VIDECwas no exception. The 104 vibration sensors, for best results, should have been
attached directly to the various machinery by drilling and tapping holes in the
casings and attaching the accelerometers directly with cap screws. However,
this technique was found to be unacceptable as the drilling and tapping of
machinery casings constitute an alteration to the equipment and therefore, would
negate the warranty on these machines. The initial solution consisted of attach-
ing drilled and tapped stainless steel mounting pads to the machinery with high
strength and high temperature epoxy. The vibration sensors were then secured
to these pads with cap screws. With the end of the six-month warranty period,
these sensors are now being attached directly to the machinery.
Inclusion of the VIDEC installation on board the new construction vessel
brought to view a unique situation. The VIDEC system, being an additional and
259
highly sensitive fault detection instrument, could significantly increase the num-ber of initial machinery faults not normally detected within the ship's warranty
period. If utilized in this manner, the VIDEC system could affect warranty
liability. A settlement was reached in which the owner agreed not to use VIDECdata for warranty purposes during the guarantee period.
SYSTEM OPERATION, VOYAGES 1-4. ,
A series of management decisions made late in the vessel's construction
schedule affected the initial checkout and operation of VIDEC. In mid-December1973 the ship owner requested delivery of the vessel as soon as practicable. In
an effort to meet this request the shipbuilder assigned every available worker in
all trades to this vessel. In keeping with the ground rules discussed earlier for
the implementation of prototype shipboard hardware systems, virtually all work
on the VIDEC installation was stopped as all personnel working on VIDEC were
reassigned to other ship systems. VIDEC was not critical to vessel operation
and in no way could impact delivery schedules or schedule changes. Thus plans
for initial system lightoff, sensor checks, etc. , planned for s^a trials had to be
modified. When the ship departed Pascagoula on 5 January 1974, VIDECinstallation was partially completed with system startup, checkout, and calibra-
tion still remaining to be performed. ;
Voyages 1 and 2 saw the completion of the system installation and initial
operation at sea. Items completed consisted of the sensor and signal conditioner
installation, pressure and differential pressure sensor taps into the piping, weld-
ing of various high pressure sensor flange adapters, and correction of installa-
tion faults. Fortunately, support personnel on board during this period, through
jury rigging and part swapping, were able to bring the system to an operational
status. Data processing, equipment installation hookup, and checkout went
smoothly except for two instances. As previously mentioned, the rotating disc
storage device was damaged during shipment or installation. When the data pro-
cessing equipment sub-loop was energized, the disc would not function and had to
be removed and shipped back to the manufacturer for repairs. By loading a
temporary program into core memory, checkout of signal continuity from sensor
to CPU could continue until the disc was reinstalled. The second hardware fail-
ure in the data processing sub-loop was the programmable gain amplifier located
before the 1/3 octave spectrum analyzer. This component was taken back to the
plant, repaired and reinstalled in a matter of a few days. Additionally, although
not a hardware failure, the late arrival of the cassette tape unit presented somedifficulty in system debugging. The flexibility that this device provides for
troubleshooting, system modification and data collection is invaluable.
2^+0

Prior to loading the data base or "Baseline", a thorough check of all 203
vibration and thermal channels was made. Calibration was performed on those
sensors that required it. The majority of sensors had been factory calibrated
prior to delivery to the yard. Thermal sensor readings were cross-referenced
with local instrument and COS remote readings whenever possible as a check for
accuracy and repeatability. The following is a description of the actual pro-
cedure for baseline loading performed on 7-8 March 1974. It is typical of the
baselines loaded prior to and after this date.
The procedure for loading baseline is a simple one. However, complete
baseline involves a considerable amount of time. The three baselines loaded
during voyage 1 averaged 27 to 30 hours in length. An initial baseline is taken
for all sensors whether the components they monitor are on line or not. Data is
gathered at five operating points (100, 95, 90, 85 and 80 percent SHP). At the
end of the final run a curve fit is performed. During this curve fit, the redun-
dant main and machinery components are transferred. At the end of the first
curve fit, a baseline of the redundant equipment is performed as above. The
curve fit is repeated and at the end of this curve fit the system is ready for
normal operation. Each run, with all components included, required four hours
to complete. Of this time, vibration data gathering and processing took about 3
hours and 45 minutes. Thermal data processing required only 15 minutes.
Initially it was felt that one hour between runs was required to let the plant
stabilize at each new power level. This was especially important for thermal
data. However, this hour was not needed. Since vibration data was gathered
first, the plant had already run at a steady load for 3-3/4 hours. Ten hours
were cut from the time required for a full baseline by eliminating this one hour
warmup at each power level. Table 1 describes the baseline format followed for
the baseline taken on 7-8 March 1974.
From Table 1 it can be seen that a considerable amount of time must be
allotted for baseline operations. Although baseline could have been performed by
2 February 1974, vessel schedule and operational considerations took priority.
Loss of data due to main power frequency and voltage fluctuations caused by a
turbogenerator governor malfunction in one instance and by VIDEO operator
error in another instance made it necessary to acquire two additional baseline
runs. Although neither of these difficulties has recurred, an investigation into
the need for an uninterruptable power source (UPS) is underway and modifications
to the software have been implemented to prevent similar operator error.
OPERATION, VOYAGES 2-4
A major factor which affected both the vibration and thermal subsystem was
that, due to the energy shortage, the ship's operating speed was reduced to 20
2kl

Table 1. Baseline Loading Procedure 7-8 March 1974
All Channels
Run No.SHP
(Meter)
1st STG Press.
(HP Turbine)Start Complete
5 28, 500 370 psig 1510 (3/7) 1915
4 27, 100 350 psig 1920 2320
3 25,600 330 psig 2330 0435 (3/8)
2 24, 200 310 psig 0445 0830
1 22,800 290 psig 0840 1230
. Curve Fit 1 1230-1330
Redundant Component
Update
1 22, 800 290 psig 1335 142Q
2 24,200 310 psig 1425 1510
3 25,600 330 psig 1515 1600
4 27,100 360 psig 1700 1745
5 28, 500 370 psig 1755 1840
Curve Fit 2 1840-1940
knots which corresponds to approximately 75 percent SHP load. This meant that
the VIDEC system would seldom function in a normal operating mode (auto-
matically cutting out below 80 percent SHP). Therefore, the system was placed
in In- Port mode, collecting vibration data only.
It was not until the second voyage (19 March to 9 June) that data of any con-
sequence was obtained. A preliminary review of this first data set showed that
there were several questionable areas requiring investigation. The vibration
analysis data revealed a high number of false alarms and the thermxal data was
sparse.
Prior to voyage 3 the ship*s engineering officers were occupied with the
problems associated with new vessel adjustment. During this period there was
little confidence inspired due to the high false alarm rate and minimal thermal
2h2
data available for use. Following consultation, a decision was made to extend
the lower limit for the Operate mode to 70 percent SHP where it was felt that the
plant operating conditions would still be fairly stable.
Prior to voyage 4, both software and hardware modifications were incorpor-
ated. The 70 percent SHP mode change proved to be instrumental not only in
permitting collection of thermal data but also in drastically reducing vibration
false alarms. There was no baseline taken below 80 percent SHP due to data
storage limitations and it was decided to use the 80 percent load data as a refer-
ence for all In- Port mode conditions. This proved to be erroneous for variable
speed machinery where the vibration signature changes with speed and contrib-
uted greatly to the false alarms observed. Efforts are under way at this time to
investigate the possible addition of a separate In- Port baseline reference below
70 percent SHP. During voyage number 4 (22 August to 1 November), the Chief
Engineer was able to become more involved with the system and contributed
valuable criticism defining potential benefits as well as system weak points.
During these first voyages, the VIDEC system has been supported with one
and two engineers full time. This effort has been necessary due to the manyproblems involved with incomplete installation, debugging, improvements and
unavailability of ship's engineering force due to their involvement in new vessel
operation. There was a contractual arrangement with APL during this period
for MARAD and Raytheon to supply support until operating personnel were in a
position to assume responsibility for the system. VIDEC has reached a point in
its development where this full-time support should no longer be needed and the
intent at this time is to turn over operation to the ship's engineering officers
during voyage 6, scheduled to begin 5 February.
FINDINGS TO DATE
It is premature to report on overall system performance analysis. How-ever, several findings have been identified at this point in the program. These
findings have been determined from the data collected, system reports, and
discussions with shipboard personnel.
The ability to make system revisions, modifications, etc. , has been facili-
tated through the inherent flexibility of this modular system being completely
software-controlled. The modifications incorporated would not have been
possible in a hard-wired system without major rework. The advantages for having
a software-controlled design for a first of a kind program are rather obvious.
However, other benefits of this flexibility have become apparent with the ease
with which operational changes may be made, such as sensor re scaling, demanddisplay requests, thermal parameter changes, rescheduling of events and the
addition of channels.
2.1+3

There is a definite impact on the data collected from the engineroom due to
shipboard operating conditions such as displacement, trim, sea state and shallow
water squat. These conditions affect both vibration and thermal measurements.
Frequent monitoring of such data has revealed periodic variances in vibration
levels and pressures related to the rolling of the ship and impact during heavy
seas.
Sensor relocations, rescaling and equation modifications became necessary
as a result of last-minute ship design changes and evaluation of the first data set.
Owing to the flexibility within VIDEC, this trimming of the measurement systemto the ship was made possible.
System maintenance has not posed significant problems thus far and appears
to be well within the capability of the ship's engineering officers. This charac-
teristic is very important and is facilitated by the automatic system self-test,
modular design, software-controlled hardware functions, hardware accessibility,
available diagnostics and realtime sensor display features such as calibrate modeand vibration preprocessor display. *
The VIDEC system configuration is not the optimum from an operator's
standpoint. Much of the data displayed is intended for further analysis and does
not provide immediate answers as to what the machinery problems are. In order
to better serve as a performance monitoring system, improvements will have to
be made in this area to display more useful information for the machinery
problems which occur.
The continuous operation of a computer-based monitoring system is proving
to be a highly practical concept with respect to reliability. The most sophisti-
cated components of the system (i.e. , computer, disc, digital processing and
display equipment) have been the most reliable elements of the system. Figure 8
shows the distribution of system failures. To further qualify the chart, 20 per-
cent of the failures were caused during the shipyard installation phase as a
result of miswires or handling, including the single disc failure. All of the
failures indicated under the "digital processing "/'clock and control" and "display
subsystem" were caused by loss of cooling air at the engineroom console. The
air duct installed for the purpose of directing outside air to the console blower
intake was inadvertently cut off.
Investigation into the cause of the failures which were experienced resulted
in several determinations.
Five of the sensor failures indicated constitute the same component, a
turbine flow meter magnetic pickup probe. Vendor analysis of the failed parts
revealed a discrepancy in the manufacturing process which was subsequently
corrected. . x
2kh

COLU
D
Oz
10
9
8
7
6
5
4
3
2
1
0
a. SENSORSb. SIG CONDc. ANALOG PROCd. DIGITAL PROCe. COMPUTERf. DISK
g. PERIPHERALSh. DISPLAY SUBSYSTEMi. CLOCK & CONTROL
If:
FAILURE OCCURRENCES SHADED REPRESENT INSTALLATION,INFANT MORTALITY AND OPERATOR ERROR PROBLEMS.
Figure 8. VIDEC Failure Distribution
The turbine type flow meter used for measuring the mass flow rate of
circulating water outlet of the main condenser was found to be susceptible to
being jammed with foreign matter. This type of sensor seems to be unsuitable
for the application.
Two of the signal conditioner failures which occurred were traced directly
to the operating temperature environment. The actual ambient temperature
experienced was greater than that expected. Once relocated, these units never
failed again.
VIDEC YEAR II
The continuing effort with the VIDEC program for the next year is concen-
trated on evaluation with the objective being a qualitative determination of both
technical feasibility and economic value. The basis for this evaluation is an
objective analysis of data. The data includes system outputs, machinery logs,
deck logs, operations cost data (from the PRESIDENT JOHNSON as well as
sister ships) and evaluations by shipboard personnel. A common failing usually
associated with programs of this nature is that the large volumes of data
collected surpass the ability to analyze it. The VIDEC Phase III program wasdesigned to handle vast quantities of data. The entire set of system parameters
needed for evaluation is recorded on digital cassettes as part of the normalVIDEC functions. Each cassette contains a complete set of data for two days of
operation. Machinery log information (repairs, preventive maintenance,
chemical water analysis, fuel oil characteristics, etc.) and deck log information
(sea state, draft, speed, etc. ) are recorded daily on prefermatted forms.
Retrieved once per voyage, the tapes and forms are merged in a chronological
format on computer tape reels via a sorting process. Hard copy reports and
printouts serve only as reference material if needed. Cost information including
operating, manning, repairs, etc. , will also be entered in a similar mannerwhere recall and analysis are accomplished under the control of a large data
processing system.
The evaluation process includes correlation of data to determine:
comparison of short term vs long term trends
validity of system failure prediction
effect of VIDEC-induced plant adjustments on overall fuel consumption
effect of ship operating conditions on plant efficiency
thermal/vibration deviation correlation
most cost effective plant performance indicators
accuracy of steam plant performance calculations
vibration failure modes for various machines.
The Phase III program is a well-coordinated effort under the direction of
MARAD with direct involvement by NMRC, Raytheon, and APL. In addition,
several notable specialists are assisting in the areas of thermodynamics,
machinery vibration, and economic analysis.
SYSTEM FUTURE
VIDEC is an integral part of MARAD-OCD's Unmanned Machinery Space
Development Program. It is a steppingstone in the development of an automated
closed loop monitoring and control system for engineroom applications suitable
for adaption to all types of vessels and power plants. At the end of FY '76 an
optimum condition and performance monitoring system will be defined incorpo-
rating all of the desirable concepts in VIDEC. Once the optimum monitoring
system has been configured from the evaluation along with other inputs, develop-
ment of a closed loop control system can be continued. Additionally, during this
period, data generated by VIDEC is made available to other related ongoing
MARAD-OCD R&D programs, such as the Integrated Ship System (ESS),
2k6

specifically as it applies to condition and performance monitoring areas. This is
done in accordance with MARAD's policy of cross-fertilization between related
R&D programs and to prevent duplication of effort. Finally, VIDEC will be
evaluated in a stand-alone aspect as a condition and performance monitoring
system from which a standard specification for such systems can be developed
for inclusion in specifications for future MAHAD-subsidized vessel construction.
Based on discussions with a number of ship operators to date, we believe
that there is a definite and increasing need aboard modern ships for a system
capable of reliable, automatic continuous monitoring of machinery status and
condition. The primary interest of these ship operators, at this time, is the
reduction of vessel downtime. The capability to detect imminent failures, to
accurately diagnose the cause of machinery degradation and to predict future
deterioration and failures through trend analysis of monitored data will all con-
tribute to reducing vessel downtime. Therefore, Raytheon is committed to the
design of software-oriented, modular monitoring systems employing the methods
and techniques utilized in the implementation of VIDEC.
By using digital microprocessor technology and modular architecture the
scope of such systems can be configured to the particular needs of the vessel's
machinery plant and the owner's budget, and readily modified or expanded as the
need arises. It is fully expected that the ultimate results of the VIDEC opera-
tional evaluation will demonstrate the usefulness of such monitoring and diag-
nostic systems.
CONCLUSIONS AND RECOMMENDATIONS
During the first year of operation, problems with the data processing and
display hardware were very minor. Sensor heat failures made up most
of the component failures.
The system software functioned very reliably; only minor changes were
required.
The operation and maintenance of this system is not beyond the capability
of responsible operating marine engineers.
From the experience to date, it would appear that the shipboard installa-
tion and operation of a high powered process control minicomputer and a
sophisticated software package are feasible.
From initial inspection of the vibration levels taken from the three base-
lines loaded during the first three months of operation, vibration appears
to be closely related to draft, displacement, sea state, and wind as well
as shaft horsepower. Other operating phenomena, such as squat that
2^7

occurs in shallow water passages, also appear to have an influence on
vibration levels.
Judicious equipment selection and location of key components in environ-
mentally controlled spaces has significantly reduced casualties caused by
the harsh seagoing environment.
The 40-day burn-in period for all system data processing and display
components, a detailed system simulation to debug VIDEC software, and
the inclusion of a sophisticated self-test routine contributed greatly in
minimizing failures and problems encountered during operation.
Vibration failure detection is capable of detecting failures that occur from
actual physical changes within a component; e.g., when a balance weight
in a forced draft fan impeller flew off and when a feed pump packing
retainer ring backed out of its housing.
Improved system displays are required to present machinery diagnostic
data in a more suitable form for immediate operator evaluation.
BIBLIOGRAPHY
1) Lundgard, B. , "The Relationship Between Machinery Vibratipn Levels
and Machinery Deterioration and Failures, " Marine Technology,January
1973.
2) McCarthy, W. L. , "VIDEC, the First Six Months," NMRC-KP-132, July
1974.
3) VIDEC Training Course Manual, Raytheon Company, Submarine Signal
Division, Portsmouth, Rhode Island, September 1973.
APPENDIX
Vibration Sensor List
Thermal Micro and Macro List
Operator Demand Requests
Operator Parameter Update List
Adjustable Thermal Constants.
21+8
/

VIBRATION SENSOR LIST
LHAiN.Nh L
,\ UMrsh KSENSORLOCATION
ohlNoi i iVi 1 1
1 • Line Shaft Brg No. 1 (FWD End) Radial2 Line Shaft Brg No. 1 (AFT End) Radial3 Line Shaft Brg No. 2 (Top End) Radial4 Line Shaft Brg No. 2 (Side End) Radial5 Line Shaft Brg No. 3 (Top End) Radial6 Line Shaft Brg No . 3 (Side End) Radial7 Port L.O. Serv Pump Radial
Motor Upper Brg8 Port L.O. Serv Pump Radial
Motor Lower Brg9 HP Turbine 1st Red Pin FWD Brg Radial
10 HP Turbine 1st Red Pin AFT Brg Radial11 HP Turbine 1st Red Gear FWD Brg Radial12 HP Turbine 1st Red Gear AFT Brg Radial13 HP Turbine 2nd Red Pin AFT Brg Radial14 LP Turbine 1st Red Pin FWD Brg Radial15 LP Turbine 1st Red Pin AFT Brg Radial16 LP Turbine 1st Red Gear FWD Brg Rad ia
1
17 LP Turbine 1st Red Gear AFT Brg Radial18 LP Turbine 2nd Red Pin AFT Brg Radial19 Line Shaft Thrust Brg Radial20 HP Turbine FWD Brg Radial21 HP Turbine AFT Brg Radial22 LP Turbine FWD Brg Radial23 LP Turbine Aft Brg Radial24 Stbd L.O. Serv Pump Radial
Motor Upper Brg25 Stbd L.O. Serv Pump Radial
Motor Lower Brg26 Stbd L.O. Serv Pump Brgs Radial27 Ma i n C ir c Pump Motor Upper Brg Radial28 Ma in Circ Pump Motor Lower Brg Radial29 Main Circ Pump Brg Upper Radial30 Main Circ Pump Brg Lower Axial31 STBD Cond Pump Motor Upper Brg Radial32 STBD Cond Pump Motor Lower Brg Radial33 STBD Cond Pump Brgs Radial34 STBD Cond Pump Brgs Axial3 5 Port Cond Pump Motor Upper Brg Radial36 Port Cond Pump Motor Lower Brg Radial37 Port Cond Pump Brgs Radial38 Port Cond Pump Brgs Axia 1
39 SSTG Turbine FWD Brg Radial40 SSTG Turbine AFT Brg Rad ia 1
2k9

VIBRATION SENSOR LIST (Cont)
CHANNEL SENSOR SENSITIVITYNUMBER LOCATION
A 1 SS 1 b Pinion AFT Brg RadialA 1 D DD . D . 5 S. W. Scrv Pump Radial
Mot 01 Upper BrgA 1 SS 1 b Gear AFT Brg RadialA A4 4 SSTG AFT Brg
: ., RadialA C4 b Engine FWD Brg
Engine AFT BrgRadial
/I A4 0 c D r\ Radia
1
/I 74 /C "D T"\ AFT Brg Radial
/I Q4 o B . B . Q S. W. Serv Pump RadialMotor Lower Brg
A Q4 y B . B . ^ S. W. Serv Pump Brgs Radialo U o r> 1^S 1 BD Main Feed Pump FRD Brg Radialb i STBD Ma in Feed Pump AFT Brg Radialb Z STBD Ma in Feed Pump Tlirust Brg Radia
1
b o B . B . 5 S. W. Feed Pump Brgs Ax i a 1
b 4 Port Ma in Feed Pump FWD Brg Radial55 Port Ma in Feed Pump AFT Brg Radial56 Port Ma in Feed Pump Thrust Brg Radial57 Port Feed Pump Motor FWD Brg Radial58 Port Feed Pump Motor AFT Brg Radial59 Port Feed Pump FWD Brg Radial60 Port Feed Pump AFT Brg Radial61 STBD F. D . Blower Motor STBD Brg Radial62 STBD F. D . Blower Motor Port Brg Radial63 STBD F. D . Blower STBD Shaft Brg Radial64 STBD F. D . Blower Port Shaft Brg Radial65 Port F. D . Blower Motor Port Brg Radial66 Port F. D . Blower Motor STBD Brg Radial6 7 Port F. D . Blower Port Shaft Brg RadialO68 Port F. D . Blower STBD Shaft Brg Radial
69 STBD F. 0 . Serv Pump Rad ialMo tor Upper Brg
7 n QTR n F. 0 . Serv Pump Racl 1 alMotor Lower Brg
71 STBD F. 0 . Serv Pump Brgs Radial72 Port Atmos Drain Pump Brg Radial73 Port F. 0 . Scrv Pump Radial
Mo tor Upper Brg74 Port F. 0 . Serv Pump Radia
1
Motor Lower Brg75 Port F. 0 . Serv Pump Brgs Radial76 STBD Atmos Drain Pump Brg Radial77 Port Cond Exli Vac Pump Radial
Motor STBD Brg
250

VIBRATION SENSOR LIST (Cont)
CHANNEL SENSOR •- SENSITIVITYNUMBER LOCATION
78 Port Coiid Exli Vac Pump RadialMotor Port Brg
79 Port Cond Exh Vac Pump STBD Brg Radial80 Port Cond Exh Vac Pump Port Brg Radia
1
81 Salt Wa t p r Sptv Pniim Motor Radial1 vex \x -X ex J.
82 Salt Water Scrv Pump Motor RadialLowerBrg
83 Salt Water Serv Pump Brgs Upper Radial84 Sal t Water Serv Pumn Rrps T ower Ax i a 1
8 5 STBD Air Comp Motor STBD Brg Radial86 STBD Air Comp Motor Port Brg Radial87 STBD Air Comp STBD Brg Radial88 STBD Air Comp Port Brg Radial89 Port L.O, Serv Pump Brgs Radia
1
90 Control Air Comp Motor FWD Brg Radial91 Control Air Comp Motor AFT Brg Radial92 Control Air Comp Brg Radial93 FWD Steer Pump Motor FWD Brg Radial94 FWD Steer Pump Motor AFT Brg Radial95 FWD Steer Pump FWD Brg Radial96 FWD Steer Pump AFT Brg Radial97 AFT Steer Pump FWD Brg Radial98 AFT Steer Pumn A.FT BreJ \ X X 1 ' V-' W X X LA 1 I L LJ 1 V X X X^ 1 Cil Radial99 AFT Steer Pump Motor FWD Brg Radial
100 AFT Steer Pump Motor AFT Brg Radial101 STBD Cond Exli Vac Pump Radial
Motor STBD Brg102 STBD Cond Exh Vac Pump Radial
Motor Port Brg103 STBD Cond Exh Vac Pump STBD Brg Radial104 STBD Cond Exli Vac Pump Port Brg Radial
251

THERMAL MICRO AND MACRO LIST
SEN- ADD-SOR RESS MlCROPARAMIiTERS OP . MACROPARAMETERSNO. NO.
-1 Condenser- -1 Condenser-10 5 1 Temp Seawater 1 Condenser Sat Temp106 2 Temp Circ Water Outlet 2 Temp Circ Wtr Outlet107 3 Condenser Sat Temp 3 Condenser Film Coeff108 4 Temp Main Condensate 4 Pet Ht Rej10 9 5 Flowrate Circ Water
-2 11. P. Turbine- -2 H.P. Turbine-110 6 Flowrate H.P. Turbine Inlet* 5 Cor 1st Stg Press111 7 Flowrate H.P. Bid 6 H.P. Turb Eff112 8 Flowr ate I . P . Bid113 9 Temp H.P. Turb Inlet114 1 0 Press H.P. Turb Inlet115 11 Temp H.P. Bid116 1 2 Press H.P. Bid117 13 Temp I. P. Bid118 14 Press I. P. Bid119 15 Temp Crossover Bid120 16 Press Crossover Bid121 17 First Stg Press
- 3 L . P . Turbine - -3 L.P. Turbine-12 2 18 Flowrate Crossover Bid 7 L.P. Turb Eff12 3 1
9
Flowrate Drns L.P. Htr 8 Exhaust Loss124 20 Press L.P. Bid125 21 Temp L.P. Bid •
-4 H . P . 5L . P . Turbine
-
-4 H. P. 5L. P. Turbine-12 6 2 2 Shaft Horsepower* 9 Pet Pwr in H.P. Turb127 23 Line Sliaft RPM 1 0 Mech ^^ Ext Efficiency128 24 Line Shaft Torque
- 5 H . P . q L . P . Heater - -5 ll.P.^L.P. Heater-12 9 2 5 Sliell Press H.P. Htr 1
1
Pump 1 Flowrate130 2 6 Temp Drns H.P. Clr 1 2 Pump 2 Flowrate131 2 7 Temp Fd Wtr Outlet H.P. Htr 1 3 4tli Stg Coeff132 28 Temp Fd Wtr Inlet I. P. Clr 14 Effectiveness133 29 Press Fd Wtr Inlet I. P. Clr 15 Steam Flo/Feed Flo134 30 Shell Press I. P. Htr 16 3rd Stg Coeff13 5 31 Temp Fd Wtr Outlet I. P. Htr 1 7 Ef f ect iveness13 6 3 2 1 emp Drns I . P . Clr 1
8
Steam Flo/Feed Flo1 9 3rd Stg Inlet Temp2 0 3rd Stg Outlet lemp21 4th Stg Outlet Temp
-6 D.F.T. Heater- -6 D.F.T. Heater-137 33 Temp Outlet DFT 2 2 Effectiveness138 34 Temp Condensate Inlet DFT 23 Diff Saturation Temp139 35 Temp Outlet Primary Sect DFT140 36 Shell Press DFT
252

THERMAL MICRO AND MACRO LIST (Cont)
SEN-SOR-N'O.
ADD-RESSXO.
MICROPAR.AMETERS OP. MACROPARi\METERS
-7 L.P. Heater- -7 L.P. Heater-141 37 Temp Condensate Outlet L.P.ilt 24 Steam Flo/Cond Flo142 38 Temp Condensate Inlet Drn Clr 25 Eff ec t i venes s
145 39 Sliell Press E.P. Heater144 40 Flowrate Mn Condensate
-8 Boiler 1- -8 Boiler 1-
145 41 Temp Fd Wtr Inlet Stm Drm 26 Ef f iciency146 42 Press Suphtd Stm 27 Feedwater Temp147 43 Tot Temp Suplitd Stm 28 Slag Formation148 44 Press Desuphtd Stm 30 Soot Formation149 45 Temp Desuphtd Stm 31 Flowrate DifferenceJ. o u 4 i eiiip uab uuuiet mil dcLiik Tot Steam Flowrate1S5 49 Pet Open Control Desuphtr154 50 Flowrate Desuplitd Stm155 51 Flowrate Suplitd Stm*156 52 Flowrate Fuel Oil Burners157 53 Temp Fuel Oil Burners
-9 Boiler 2- -9 Boiler 2-159 55 Temp Fd Wtr Inlet Stm Drm 33 Ef f ic i ency160 56 Press Suplitd Stm 34 Feedwater Temp161 5 7 Tot Temp Suplitd Stm 35 Slag Formation162 58 Press Desuphtd Stm 3 7 Soot Formation163 59 Temp Desuplitd Stm 38 Flowrate Difference164 60 icilip Vjdi vJU.LJ.cL 1^1 Jl JjclIlK X 0 Tot Steam Flowrate167 63 Pet Open Control Desuphtr168 64 Flowrate Desuphtd Stm169 65 Flowrate Suphtd Stm*1"(J 66 Flowrate Fuel Oil Burners1 " i 6 7 '|"prnY-\ Pjipl Oil RllTnf^'TQ
-10 Regenerative Air Htr 1- -10 Regen Air lltr 1-173 69 Temp Air Inlet Regen Htr 40 Ef f ectiveness1"4 70 Temp Air Outlet Regen Htr17 5 71 ICJIip Odo VJUL-LCL ixct^cJl IlLI
-11 Regenerative Air Htr 2- -11 Regen Air lltr 2-176 72 Temp Air Inlet Regen Htr 43 E f f ec t i venes s
177 73 Temp Air Outlet Regen lltr178 74 Temp Gas Outlet Regen lltr
-12 Feed Pump- -12 Feed Pump-187 83 Flowrate Fd Pump* 50 Turb Steamrate188 84 Press Fd Pump Suet 51 Pump Eff189 85 Temp Fd Pump Suet 52 Water Hp190 86 Press Fd Pump Discli 53 RPM191 87 Temp Fd Pump Disch192 88 Flowrate Stm Fd Pump*195 89 RPM Fd Pump
253

THERMAL MICRO AND MACRO LIST (Cont)
SEN- ADD-SOR RESS MICROPARAMETERS OP. MACROPARAMETERSNO. WO.
-15 Feed. Pump- -13 Feed Pump-194 90 Flowrate Fd Pump* 54 Turb Steamrate19 5 91 Press Fd Pump Suet 55 Pump Eff196 92 Temp Fd Pump Suet . ^ 56 Water Hp197 93 Press Fd Pump Disch 57 RPM198 94 Temp Fd Pump Disch199 95 Flowrate Stm Fd Pump200 96 RPM Fd Pump
-14 Turbo - Generator
-
-14 Turbo - Generator
-
201 97 Flowrate Steam Turbo-Gen 58 Turb Steamrate202 98 Kilowatt Output Turbo-Gen. 59 Kw Load
-15 Distilling Plant- -15 Distilling Plant-203 99 Flowrate Stm Distiller 60 Lb Stm/Lb Water2 04 10 0 Temp Dist S.W. Utr Outlet 61 Temp Rise S.W. Htr205 101 Temp Dist S.IV. Htr Inlet 62 S.W. Htr U206 102 Temp S.W. Inlet Dist AE Condr207 103 Shell Press Dist S.W. Htr208 104 Flowrate Distillate
-16 Main Condensate Pump 1- -16 Main Cond. Pump 1-10b Kilowatt Input Cond Pump 63 Water Hp
210 106 Flowrate Mi; Condensate* 64 Pump Eff211 107 Disch Press Mn Cond Pump 65 Cond Flowrate212 108 Suet Press Mn Cond Pump213 109 Barometric Press*
-17 Main Condensate Pump 2- -17 Main Cond. Pump 2-'1/11. i 4 i i U Kilowatt Input Cond Pump 66 IVater Hp215 111 Flowrate Mn Condensate* 67 Pump Eff216 112 Disch Press ^hl Cond Pump* 68 Cond Flowrate217 115 Suet Press Mn Cond Pump*218 114 Barometric Press*
-18 Miscellaneous- -18 Miscellaneous
-
226 122 Xstem Gld Stm Supply 72 Sliaft Horsepower227 123 Xstm Mn Condr 73 Ov'l Sp Fuel Rate228 124 Stm to Stack
251+

DEMAND REQUEST MENU
01 VIBRATION TRENDS02 THERMAL TRENDS03 ELAPSED TIME COUNTERS04 TAPE RELOAD05 PARAMETER UPDATE06 NRT DATASTORAGE07 BROADBAND POINT DISPLAY08 PREPROCESSOR DISPLAY09 RAW DATA10 TRIP PRINT AT DAY END11 ENTER OR EXIT INPORT MODE
TYPE NUMBER OF DESIRED SELECTION
PARAMETER UPDATE LIST
01 NO. OF BASELINE RUNS02 NO. OF STANDARD DEVIATIONS03 THERMAL RANGES FOR SCALING04 NO. OF VIBR CHANNELS + SET ENDPTS05 NO. OF BASELINE LOAD POINTS06 NO. OF REGIONS07 NO. OF BANDS/REGION + ID VECTORS08 NO. OF GROUPS09 NO. OF BANDS/GROUP + ID VECTORS10 GROUP ALARM LEVELS11 REGION TREND LIMITS12 THERMAL LIMITS13 DURATION OF MULTIDAY DISPLAY14 MINIMUM TIME TO ALARM15 NRT ID VECTOR16 THERMAL CONSTANTS17 NEW TRIP INITIALIZATION18 MAXIMUM MACROPARAMETER DEVIATIONS19 EXIT PARAMETER UPDATE
TYPE NUMBER OF DESIRED PARAMETER
255

ADJUSTABLE THERMAL CONSTANTS
1 AFLO Total flow area (condenser)
2 DV Design average velocity of circulating water in each tube (condenser)
3 DTO Design circulating water temperature out of condenser
4 DTI Design circulating water temperature into condenser
5 DDT (DTO-DTI)
6 RHOSW Used to calculate mass flowrate (condenser)
7 PSTD Reference throttle pressure (H. P. Turbine)
8 VSTD Reference throttle specific volume (H. P, Turbine)
9 SURFH Total heat transfer surface (High Pressure Heater)
10 SURFI Total heat transfer surface (Intermediate Pressure Heater)
11 ELNE Non-extraction exhaust loss (L. P. Turbine)
12 SHPNE Non-extraction shaft horsepower (L. P. Turbine)
13 SRNE Non-extraction exhaust loss (L. P. Turbine)
14 ZEGNE Non-extraction exhaust specific volume (L. P. Turbine)
15 HHVl Higher heating value of F;0. (Boiler 1)
16 HHV2 Higher heating value of F. O. (Boiler 2)
17 CPFOl Specific heat for I. 0. (Boiler 1)
18 CPF02 Specific heat for I. O. (Boiler 2) .
19 CI Constant for Feed Pumps
20 C2 Constant for Feed Pumps
21 PTEST RPM threshold (Feed Pumps)
22 AKTEST Kilowatt threshold (Condensate Pumps)
23 C Constant based on tube size and material (condenser)
24 FB Constant based on tube size and material (condenser)
25 SMC Total tube heat transfer area in main condenser
26 CPSW Specific heat of seawater (condenser)
27 DQ Design heat rejection (condenser)
28 SBTU BTU for dollar deviations
256

DISCUSSION
E, DuBack, General Dynamics, Electric Boat : Since you have very highpropulsion noise, how are you going to make your vibration readingsworthwhile?
W. L. McCarthy : This is one of the things that we are attempting to
tackle. As we pointed out, right now we don't have a lot of data, so
although, according to the program managers, we are supposed to be in an
evaluation phase, we just don't have enough data for evaluation. To theoperating people, it is a very obvious problem. With redundantmachinery, an off-line pump could be monitored for background noise to
establish a data base.
E. DuBack : Do you know how the threshholds were established?
W. L. McCarthy : The threshhold is three times the base line. This wasestablished from our computer program. Perhaps we should have made useof data that are available from other industry applications, but wewanted to try to get some hard facts on a shipboard application.
M. B. Peterson, Wear Sciences, Inc. : You mentioned as one of yourobjectives reducing manpower in the engine room. Now that you have seenthe system, do you think you can reduce the manpower?
W. L. McCarthy : Obviously, I think that if you can prove the concept,you can reduce manpower. Right now on the Johnson , during a normalwatch period, there are two men - a licensed engineer and an unlicensedjunior engineer. During maneuvering and other situations, more menhelp. I think that you could eliminate the junior engineer. There aresystems now in Europe where there isn't any watch on board during steadystate conditions. There is just the normal 8 to 5 workday. Again, thisis strictly a monitoring system. If we can prove reliability in a
computer in terms of data gathering, etc., we could apply similartechniques to control and automate the control portion.
257


SESSION IV
COMING
REQUIREMENTS
Chairman: B. K. Genetti
General Electric Company


AN OVERVIEW OF CURRENT EFFORTS TO DETECTAND PREVENT STEEL WHEEL FAILURES
Gary L. Leadley
Association of American Railroads, Chicago, Illinois 6O616
INTRODUCTIONAccording to annual statistics compiled by the Office of Safety in the
Federal Railroad Administration^"'") there were a total of 324 reportable derail-
ments* attributed to wheel defects or failure during 1973. While this numberrepresents only 4.4% of all such accidents during the year, it amounts to 18.4%of equipment related derailments and continues the trend of increasing fre-
quency that has been established in recent years. The impetous behind this
trend is primarily the parallel rise in both car loads and train speeds^^) which
have placed many critical components, particularly wheels, in a severe stress
environment. This situation will continue to be a driving force for railroads
and their suppliers to improve wheel designs and material properties. However,
until such efforts succeed in effectively eliminating wheel related accidents
there must be an energetic parallel program to investigate the use of non-
destructive diagnostic techniques to identify defective components prior to a
damaging failure.
This paper will review the nature of railroad wheels, including their
more detrimental defects and conditions, and then delve into several of the non-
destructive detection and evaluation techniques currently being considered for
use in their assessment.
RAILROAD WHEELSWhile all railroad wheels have a similar basic design (Figure 1) and
conform to certain dimensional requirements established by the Association of
American Railroads, there is actually a wide variety of cross sections in use
today. The exact contour of any given wheel is dictated by several factors;
such as the manufacturing process, the intended application and the desired
service life.
The first of these factors establishes a basic division in the character of
the wheel population. Presently, there are two basic methods used in making
*Those derailments which caused railroad property damage in excess of $750. 00.
261

wheels - forging and casting. According to procurement figures compiled by the
Association of American Railroads for the period 1970-1972 there were approxi-
mately twice as many cast wheels sold as forged (wrought) wheels. This sales
ratio is about the same today and has resulted in a population that is nearly
equally divided between the two types due to the more recent appearance of cast
wheels. '•
The second influencing factor is the intended application, that is, the
type and severity of service. As one would expect, higher car loads require the
use of larger diameter wheels in order to maintain rail contact stresses at
acceptable levels. Nominal diameters range from 28 in. to 42 in. (.71 m to
1.06 m) with corresponding recommended load limits of 21,600 lb. and
34,900 lb. (96,081 N and 155, 235 N). In addition to the load dictated design
requirements there are those associated with special types of service. Examplesof such special applications would be mass transit cars, industrial transfer cars
and mine train locomotives.
A third factor that is considered in the design of a wheel is the desired
wear life. The vast majority of wheels( 85%) in service are designed for a
single tread life. This design is appropriately called a one-wear wheel.
Effective wheel life can be extended by making the rim sufficiently thick to allow
remachining of the tread to restore the original contour. Wheels with this cap-
ability are designated as either two-wear or multiple-wear depending on the rim
thickness. The Association of American Railroads' specifications for the one-
wear, two-wear, and multiple-wear rims are minimums of 1.25, 2.0, and
2.5 in. (3.17, 5.08, and 6.35 cm), respectively. ':
Nondesign variables that can be adjusted to meet the various service
requirements wheels encounter are material properties. Properties such as
hardness, yield strength, fatigue resistance, and thermal cracking sensitivity
are controlled principally by material chemistry and heat treatment. Since manyproperties are optimized by opposite adjustments of these factors it has been
necessary to establish five classes of wheels tailored to meet different service
requirements. The Association of American Railroads' chemical and hardness
specifications^^) for these classes are listed in Table I along with their intended
service.
There are two classes that receive no special heat treatment after fabri-
cation - U and Ul. The three heat treated classes increase in carbon content,
hardness and severity of service with ascending alphabetical order. A, B, and
C. Heat treatment generally consists of quenching and tempering the wheel rim
only, leaving the plate and hub in a softer normalized condition. Entire wheel
quenching is permitted for wrought wheels, however, undesirable tensile stresses
are introduced into the rim- by such processing. In comparison, rim quenching
262

produces compressive residual stresses there that impede the formation and
growth of cracks.
This basic review of railroad wheels illustrates the design and material
variables that tend to complicate the development of NDE systems capable of
inspecting all wheels with equal reliability and speed.
WHEEL DEFECTSThe types of wheel defects that are considered unacceptable for inter-
.change service are described and illustrated in the Association of AmericanRailroads' Wheel and Axle Manual (Sec. 3C) and the Association of AmericanRailroads' Interchange Rules (Rule 41). Since the detection of the more commonvarieties of these defects should be the primary goal of any NDE system or com-bination of systems, it is appropriate to review typical examples.
One of the most common wheel defects is the fatigue breakdown of the
tread surface known as shelling. Figure 2 shows deep-etched cross and tread
sections of a rim from such a wheel. In this case the shelled band was 1.25 in.
(3.17 cm) wide and extended to a depth of 0.094 in (.239 cm). There are manycontributing factors to shell development including poor track conditions,
excessive loads and speeds, insufficient wheel hardness and undersized wheels
for the load. Such factors tend to increase the rail contract stresses above the
endurance strength of the material.
A mode of wheel failure that commonly results in the loss of rim and
flange sections is known as rim shattering. This type of defect usually initiates
at internal inclusions located under the high contact stress areas of the tread.
As shown in Figure 3, a fatigue plane, roughly parallel to the tread, extends out
from these sites (arrows), under continued cyclic loading, until the front and/or
the back rim face is penetrated to form a circumferential crack. At this point
the wheel becomes condemnable by the Association of American Railroads'
standards. Continued wheel operation usually causes cracking normal to the
fatigue plane along its periphery and the eventual loss of entire rim sections.
Another cause of wheel failure, that is particularly important from a
frequency standpoint, is thermal cracking. The occurrence of these defects is
directly related to the fact that wheels function as brakedrums, as well as being
supporting members for the vehicle. Thermal cracks can initiate by fatigue as
the result of thermal cycling in repeated brakings or by a cleavage mechanismwhere the tensile stresses developed in a few severe brakings are sufficient to
cause a brittle crack to form. Once initiation occurs by either mechanism the
crack will extend under the continuing action of residual tensile stresses until
the critical crack size for brittle fracture is achieved. At that point unrestrained
crack growth will occur, which can result in explosive wheel fracture.
263

Examples of various thermally cracked wheels are shown in Figures 4-7.
The first specimen is characterized by numerous transverse cracks that
originated in the excessively heated outer tread and extended into the front rim.
Apparently stresses in this wheel did not build to a sufficient level to cause
brittle fracture. That condition was satisfied, however, in the wheel shown in
Figure 5. This 33 in.,wrought wheel developed a single thermal crack at the
front rim edge (arrow). Subsequent stressing resulted in the rapid propagation
of the crack through the rim and into the plate where it split to form two
circumferential cracks that encircled the hub causing the total separation of the
rim. Misalignment of the brake shoe over the rim edge was indicated by the
thermal crack location and local discoloration. Another example of misaligned
brakes causing excessive localized heat and resultant thermal cracks is seen in
Figure 6. In this case, shoe contact was at the upper portion of the flange and
the initial crack extended into the plate and almost 180° around the hub.
There is another railroad operation, not involving brake shoe application,
which may generate the necessary wheel heat to cause thermal cracking. Wheelretarders, which physically rub against the back wheel rim, are used in
classification yards to control car speed during switching. In cases where the
car is allowed to reach excessive speed, the retarder action might produce
detrimental heating on the back rim. Figure 7 shows a 33 in. cast wheel that
developed a thermal crack (arrow) in that location from heavy retarder use.
The next form of wheel failure to be considered is plate cracking.
Failures of this type commonly occur in either the back rim fillet (Figure 8) or
the front hub fillet (Figure 9), Crack development is associated with the high
radial tensile stresses that are generated in those fillet areas following prolonged
braking and under the action of heavy cyclic vertical and lateral wheel loads.
Initiation is usually by fatigue at surface defects such as imbedded mill scale,
machining tears or decarburization. Crack growth can proceed around the wheel
until arrest occurs, as in the two illustrations, or until the ends surface on the
tread and result in the loss of a rim section.
An important category of condemnable wheels not discussed so far are
those severely overheated in service from stuck or dragging brakes, but not
exhibiting thermal or plate cracks. Such wheels are potentially dangerous
because the high tensile stresses developed in the rim can lead to an instanta-
neous fracture in the presence of even small thermal cracks. At the present
time detection of this hazardous wheel condition depends on the interpretation of
visual evidence of overheating, such as charring of surface oil and the presence
of heat discoloration. Such evidence is unreliable at best considering that not
all wheels are oil covered and that discoloration is dependent on ambient condi-
tions during heating, particularly humidity, and tends to disappear with further
weathering. ..
26k

In addition to those wheel conditions that are considered to be actual fail-
ures, there are many removal categories that deal with condemnable rim and
flange geometry changes caused by normal and abnormal wear. Excessive
flange wear causes particular concern because of its adverse effect on wheel
gage and truck stability through track switches. This concern is justified con-
sidering that 135 derailments^"^) in 1973 were caused by this type of wear
problem.
The preceding review of wheel defects is by no means complete, however,
those conditions that pose significant danger to the safe movement of freight and
passengers are included.
CURRENT WHEEL INSPECTIONWheel inspection begins in the manufacturer's shop with procedures
defined in Association of American Railroads' specifications M107 and M208^'^)
for wrought and cast wheels, respectively. Both outline the same requirements
for ultrasonic inspection of rims and wet magnetic particle inspection of plate
surfaces for discontinuities , such as inclusions and voids. Adherence to these
specifications effectively sets a minimum quality limit for all new wheels enter-
ing service.
The techniques and frequency of in-service inspection are not specified
in the Association of American Railroads' rules, but are determined by the
experience of each performing railroad. All railroads rely principally on visual
inspection, with a modest use of magnetic particle or penetrant methods by somein certain questionable cases. The frequency of inspection appears to be flexible
at best, depending heavily on the operating schedule of the vehicle and the repair
needs of other components. This lack of explicit inspection intervals, which is
almost inherent in the mobile nature of railroading, places an increased burden
on the inspection that does take place to find defects in their earliest stages.
Experience has shown that the vast majority of defective wheels are
detected visually before an accident can occur. Given this basic effectiveness,
visual inspection is characterized by several factors that tend to limit its
sensitivity and reliability. Primary among these is its inherent subjectivity.
Any system that relies solely on people for critical decisions is subject to the
inconsistencies generated by differences in individual motivation, skills, know-
ledge and health. Reliable wheel inspection depends heavily on such variables as
inspector job satisfaction and visual acuity.
Another important factor to be considered is the variability of the inspec-
tion environment. Wheel inspection usually takes place in the yard wherevariables such as the ambient temperature, humidity and sun light will change
throughout the year; influencing the comfort and, therefore, concentration of the
265
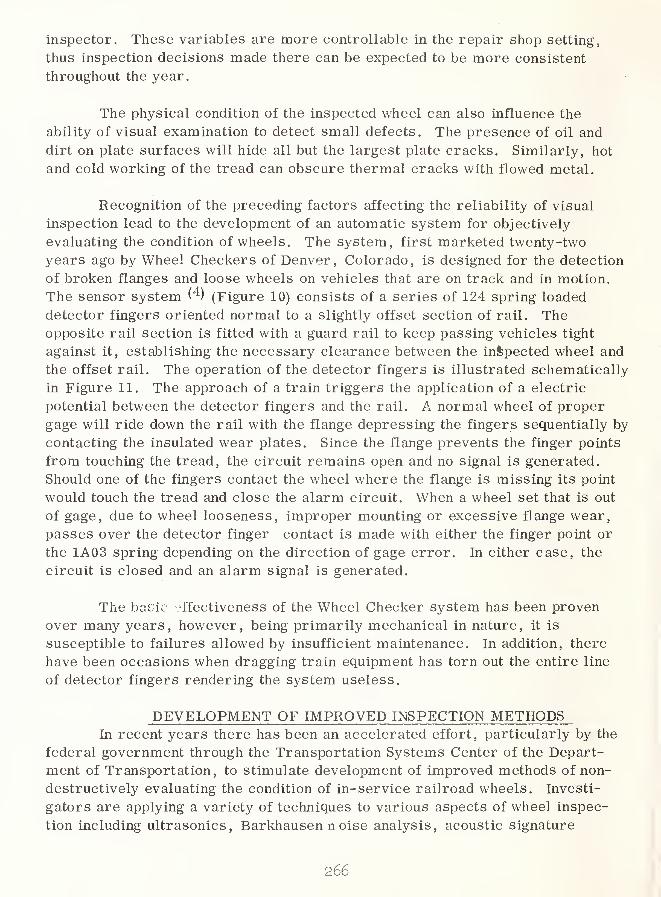
inspector. These variables are more controllable in the repair shop setting,
thus inspection decisions made there can be expected to be more consistent
throughout the year.
The physical condition of the inspected wheel can also influence the
ability of visual examination to detect small defects. The presence of oil and
dirt on plate surfaces will hide all but the largest plate cracks. Similarly, hot
and cold working of the tread can obscure thermal cracks with flowed metal.
Recognition of the preceding factors affecting the reliability of visual
inspection lead to the development of an automatic system for objectively
evaluating the condition of wheels. The system, first marketed twenty-two
years ago by Wheel Checkers of Denver, Colorado, is designed for the detection
of broken flanges and loose wheels on vehicles that are on track and in motion.
The sensor system ('^) (Figure 10) consists of a series of 124 spring loaded
detector fingers oriented normal to a slightly offset section of rail. Theopposite rail section is fitted with a guard rail to keep passing vehicles tight
against it, establishing the necessary clearance between the inspected wheel and
the offset rail. The operation of the detector fingers is illustrated schematically
in Figure 11. The approach of a train triggers the application of a electric
potential between the detector fingers and the rail. A normal wheel of proper
gage will ride down the rail with the flange depressing the fingers sequentially by
contacting the insulated wear plates. Since the flange prevents the finger points
from touching the tread, the circuit remains open and no signal is generated.
Should one of the fingers contact the wheel where the flange is missing its point
would touch the tread and close the alarm circuit. When a wheel set that is out
of gage, due to wheel looseness, improper mounting or excessive flange wear,
passes over the detector finger contact is made with either the finger point or
the 1A03 spring depending on the direction of gage error. In either case, the
circuit is closed and an alarm signal is generated.
The baLio ffectiveness of the Wheel Checker system has been proven
over many years, however, being primarily mechanical in nature, it is
susceptible to failures allowed by insufficient maintenance. In addition, there
have been occasions when dragging train equipment has torn out the entire line
of detector fingers rendering the system useless.
DEVELOPMENT OF IMPROVED INSPECTION METHODSIn recent years there has been an accelerated effort, particularly by the
federal government through the Transportation Systems Center of the Depart-
ment of Transportation, to stimulate development of improved methods of non-
destructively evaluating the condition of in-service railroad wheels. Investi-
gators are applying a variety of techniques to various aspects of wheel inspec-
tion including ultrasonics, Barkhausen noise analysis, acoustic signature
266

analysis and magnetic perturbation.
Before discussing the specifics of these techniques, it will be useful to
consider the values obtained by Carter and Caton^^^ for the critical crack sizes
that can be associated with the various wheel classes under maximum probable
stress conditions. At the stress level of 55 ksi (Table 2) the critical length of
corner thermal cracks is only 0.10 in. (.254 cm) in high carbon class C and Uwheels. Cracks into flat surfaces, such as the tread or back rim, can grow to
0.26 in. (.660 cm) in the same wheels before becoming critical. Plate cracks
that develop in the rim fillet of class C and U wheels become critical if their
length exceeds 0.16 in. (.406 cm). Finally, the presence of sharp bottom
surface defects, such as machining tears, in the rim fillet of a high carbon
wheel can initiate brittle fracture if its depth exceeds .028 in. (.071 cm).
While these critical crack values were calculated assuming the severest
probable stress condition, one that most wheels will never see, they do indicate
the level of crack sensitivity that any NDE system should approach to achieve
the highest reliability. The actual crack detection levels required by railroads
will depend on the cost and physical requirements for maximum detection.
Ultrasonics - The science of ultrasonics is being applied to the problem of
wheel evaluation in many forms. The first commercially viable system is the
Wheelfax system developed by Scanning Systems , Inc. ofDanbury, Connecticut. (^)
The search unit of this system fits into a special section of rail that is designed
to guide the outer tread of passing wheels over a fluid filled transducer boot.
Figures 12 and 13. Inside the boot are two oppositely directed transducers set
in a gimbaled support that allows them to maintain a constant entry angle to the
wheel tread. On contact with a wheel, couplent is sprayed on the boot and an
ultrasound pulse is directed circumferentially around the tread as a surface
wave by one of the transducers. Initial and multiple order reflections are sub-
sequently received by this transducer from any crack that has developed on the
rim faces, tread or flange. It is claimed that reliable detection of cracks 0.5 in.
(1.27 cm) long and 0.050 in. (.127 cm) deep can be achieved. After full
attenuation of this initial signal has occurred, in about five milliseconds, a
second pulse is directed around the wheel in the opposite direction by the second
transducer. This dual pulse-echo technique enhances the chances of detecting
cracks that are inclined to the surface since they are anisotropic in their ability
to reflect sound. The use of dual transducers also allows the analysis of the
through transmitted signal for additional information on the wheels' condition.
Attenuation rate of this signal is indicative of the general wheel surface condition
and is believed related to the near surface stress level. This relationship to
stress level could be used to detect uncracked, overheated wheels. The time
interval between multiple receptions of the through transmitted pulse is used to
classify wheels by diameters and details of the pulse shape can reveal a high
flange condition.
267

The Wheelfax system has several operational advantages in addition to its
versatility. Primary among them is the ability of each search unit to inspect all
the wheels on one side of a train moving at up to 30 mph (48. 3 km/h). Reliable
inspection at this speed results in minimum interference with train operation andmaximum system utilization. Another operational advantage is the system's
totally automatic nature. The initiation and termination of testing, the data pro-
cessing and recording, and the defect alarm system are all controlled electroni-
cally from a trackside control center.
A recent investigation by Becker at Battelle Northwest has confirmedthe feasibility of detecting wheel plate cracks by introducing ultrasound radially
into the tread. During the study two similar test procedures were considered;
one based on the generation of Lamb waves in the plate and the other on a moreconventional pulse- echo technique. -
Results of several tests conducted under optimum conditions for each
method indicate that the conventional pulse-echo technique is more suited to the
task of detecting plate cracks than is the Lamb wave method. One of the mainliabilities of the latter is its low signal to noise ratio. At the relatively low
frequencies required for generation of optimum Lamb waves (640 KHz) the
divergence angle of the sound beam is large compared to that found <at higher
frequencies in the more conventional pulse-echo method (1 MHz) . As a con-
sequence, a portion of the energy fails to enter the plate and is reflected by the
adjacent rim surfaces. Such spurious reflections tend to reverberate in the rim,
yielding a multitude of false indications.
Another undesirable feature of the Lamb wave method is its inlierent
sensitivity to plate thickness variation. Since the allowable modes of wave pro-
pagation are governed by the frequency - plate thickness product (F x d) , it is
evident that the operating modes will change with thickness variations within a
plate and with plates of different designs. The associated variability in propa-
gation velocity negates the use of fixed time acceptance gates on the return
signal to isolate responses from the fillet areas for better resolution. This
problem is not found in the higher frequency pulse-echo technique because of its
constant propagation velocity across the wheel.
A third factor that limited the effectiveness of the Lamb wave method is
its relatively long near surface dead time that seriously restricted the detection
of rim fillet defects. The testing of one wheel at 640 KHz, with the transducer
driven by a 20 \\ sec. sine wave burst, resulted in a dead time of 30 sec.,
which is equivalent to about 4.5 in. (11.4 cm) of steel.
Becker estimated that the minimum detectable flaw sizes for an auto-mated, pulse-echo inspection system would be approximately 0.0225 in.
268

(.145 cm2) and 0.045 in. 2 (.290 cm2) for rim and hub fillet flaws, respectively.
Examples would be defects 0.09 in. (.23 cm) deep and .25 in, (.63 cm) long in
the rim fillet and 0. 125 in. (.32 cm) deep and 0. 36 in. (.91 cm) long in the hub
fillet.
One of the conceptual systems outlined by Becker for the automatic
inspection of wheel plates under moving cars involves a series of transducers
mounted in a special length of rail. Each transducer inspects a discrete radial
plane as the wheel passes over. An illustration of the proposed transducer
arrangement is shown in Figure 14. The transducers are held by a gimbaled
support structure encased in a fluid filled boot. The approaching wheel triggers
a couplent spray that keeps the outer boot surface wet. As the test wheel passes
along the series of probes a guard rail arrangement on the mate wheel controls
its lateral position while a spring loaded guide shoe positions the transducers
opposite the plate. The probability of defect detection will be directly propor-
tional to the number of probes used to inspect a given wheel.
This system appears to offer a simple, nonmechanical, low maintenance
way of continuously inspecting wheels traveling at moderate speeds. These
advantages are countered, somewhat, by the reduced defect detection probability
that accompanies discrete radial inspection. In addition, the development of an
adequate electronics system to operate the large number of transducers
required will be one of the primary implementation problems.
Another aspect of wheel inspection, where an ultrasonic technique is
being applied, is the detection of adverse stress conditions in the rim caused by
overheating. The principle behind this technique is that the state of stress in a
metal influences the propagation velocity of ultrasound. Therefore, the precise
measurement of transit times through a known thickness of stressed material
can give an indication of the average stress level. The key to obtaining reliable
results is the accurate assessment of the effect material variables, such as
chemistry, preferred orientation and microstructure, have on the sound velocity
and the mitigation of these influences through adequate calibration.
Clotfelter and Risch^^^ have applied this ultrasonic stress measurementtechnique to railroad wheels. The basic procedure was to measure the transit
time differential of simultaneously generated 2 MHz pulses through an un-
stressed reference block and the stressed specimen. This was accomplished
using a dual trace oscilloscope to display the two signals and by expanding the
time base until individual pulse cycles could be seen. Since a difference in
transit time appears as a phase shift in the two signals, the delay - time
multiplier on the oscilloscope could be used to determine the differential by
making the pulses coincident.
269

The actual determination of stress in steel is complicated by its aniso-
tropic nature with respect to sound propagation. Under compression shear wavespolarized parallel to the principal stress axis will travel faster than wavespolarized perpendicular to it. The difference between the transit time
differentials of the two wave orientations is, thus, a better measure of the aver-
age stress than either orientation alone. As applied to the evaluation of wheel
rims, the parallel and perpendicular orientations correspond to the circumfer-
ential and radial directions, respectively.
The first step in utilizing this technique was the establishment of an
acoustic stress constant for wheel material that relates ultrasonic velocity
changes to applied stress. This was accomplished by incrementally loading a
block of j"im steel to simulate the circumferential compressive stresses found in
wheels and measuring the transit time differential of pulses traveling in this
block and an identical reference block. At each load level measurements weretaken with wave polarization both parallel and perpendicular to the principal
stress axis. The difference in transit time differentials of these two polariza-
tions was used, in conjunction with the path length and the value of each load
level change, to establish an acoustic stress constant of 0. 405 nsec. /in. /ksi
(2.31 X 10 nsec./m/N/m ) for a typical wheel material.
Once the acoustic stress constant is determined the average stress across
a wheel rim can be calculated by measuring the difference in the radial and cir-
cumferential transit time differentials and by knowing the sound path length. In
a similar manner, stress changes can be detected by making measurementsbefore and after the event of interest. The results of such an investigation by
Clotfelter and Risch^^) involving wheel braking tests are shown in Table 3.
These values reveal that a significant change has taken place in the sound pro-
pagation velocity as a result of wheel heating. This change is equivalent to an
average compressive stress reduction of 13.9 ksi (9.6 x lo''' N/m^).
It has been demonstrated that accurate measurement of ultrasound propa-
gation velocity in stressed wheels can be used to evaluate that stress condition.
However, the material variability found in wheels of different classes and manu-facture would require the use of some independent technique to establish material
characteristics prior to any stress measurements. The technique also requires
an accurate value for the sound path length, which may necessitate the actual
measurement of the rim width of each wheel tested.
Lodding Engineering Corp. of Auburn, Massachusetts,^^) is presently
marketing a device to measure ultrasound transit times to an accuracy of 0.
1
nanosecond.
Barkhausen Noise Analysis - Another technique recently applied to the task of
270

assessing the stress state of railroad wheels is that of Barkhausen noise
analysis.
The phenomenon which is the basis of this technique is the abrupt, dis-
continuous movement of microscopic magnetic domain boundaries that often
occurs in ferromagnetic materials under the influence of an external magnetic
field. These nonuniform movements are reflected in the magnetization
hysteresis loop of the material as small, discontinuous increments in the curve
known as Barkhausen jumps or noise, after their discoverer. It has been
established that the dynamics of domain boundary movement, and hence the level
of Barkhausen noise, is strongly influenced by the state of material stress. In
the specific case of steel, noise intensity increases under the application of
tensile stress and decreases in a compressive stress environment.
An illustration of the basic elements needed for the excitation and
detection of the Barkhausen effect is shown in Figure 15. ^^^^ The excitation
field is developed by a variable electromagnet in contact with the specimen. Aninduction coil between the magnet poles senses changes in specimen magneti-
zation and translates this into a output voltage that is displayed on an oscillo-
scope. Cycling the external field polarity results in the output amplitude
achieving a maxima that is indicative of the material stress state. To develop
quantitative stress values from such information it is necessary to construct a
calibration curve of stress versus Barkhausen noise intensity for the material
of interest. Figure 16(10) shows a curve of this type for a wheel steel. It is
evident that, in this case, maximum stress sensitivity occurs between -40 and
+50 ksi (-215 and +344 MPa) and that more extreme values would not be definable.
A Southwest Research Institute study(lO) recently established that the
Barkhausen phenomenon generated in railroad wheels is sufficiently stress
sensitive to be used as a stress indicator. However, there were significant
variations and soine inconsistencies in the data from wheel to wheel and at
similar locations on the same wheel. This situation was attributed to, in part,
the lack of a "magnetic feedback" system to detect variations in the effective
magnetic flux near the specimen surface due to local differences in magnetic
permeability. Such a system would sense the magnetic field and adjust the
electromagnet strength to maintain the predetermined magnetization cycle in-
dependent of material condition.
Another factor contributing to data variability in the Barkhausen
technique is the small volume of material from which the stress indication is
obtained. The near surface nature of the Barkhausen effect, when combined
with a coil pickup covering an area of only 0.01 in.^ (.064 cm^), causes the
technique to be more sensitive to short range stress gradients and shallow sur-
face conditions than a conventional stress relaxation technique using strain gages.
271

Despite such characteristics, reasonable qualitative agreement was established
between the two methods. ('"^)
As a step toward utilizing the Barkhausen noise technique to classify
wheels according to the severity of overheating, the SwRI study tentatively
identified the area on the back rim surface nearest the tread as that most likely
to yield consistent linear results.
Acoustic Signature Analysis - One of the earliest methods of nondestructively
evaluating railroad wheels was to have car inspectors strike them with a hammerand listen to the resulting sound. In this way it was possible to detect manydefective wheels because they rang differently than good wheels. A moresophisticated version of this technique, known as acoustic signature analysis, is
being investigated by Finch, et al,^^"*-) at the University of Houston as a possible
basis for an automatic, in motion, wheel inspection system.
In the acoustic signature method a wheel is excited, by either natural or
artificial means, into vibrating and the radiant sound is analyzed for its
characteristic spectral content or signature. The introduction of discontinuities,
such as cracks, into the wheel will affect the modes of vibration and, conse-
quently, the signature. Early results (11) have shown that artificial impact
excitation is the most suitable means of generating sound of sufficient intensity
and spectral content in the frequency range (1-5 KHz) found to be most sensitive
to wheel integrity. In addition, this form of excitation allows the use of dampingrate measurements as a supplemental indicator of wheel condition. It has been
also established that the best detection system is one using a trackside micro-
phone, near the impactor, to pick up airborne radiation. The alternative
approach was to use a rail mounted accelerometer to monitor the impact induced
vibrations, however, rail resonances were found that conflicted with those of the
wheel, making this method undesirable.
An experimental impactor - microphone arrangement that was used in
initial field trials^"*-^) at the Union Pacific's Omaha East yard is shown in Figure
17. The impactor was designed to be wheel activated and adjustable in regards
to the impact point on the rim. During the trials tape recordings were made of
the sound emitted by a number of good and defective wheels under various
conditions of train operation and hammer impact location. The signature of each
wheel was processed by first converting it to a 1/3 octave band spectrum from1-8 kHz. The spectrum was then normalized with regards to the overall
intensity level to negate differences in sound amplitude. The normalized
spectrum was compared to a- good wheel standard spectrum and the difference
found in each band was squared and summed. This summed value of deviation
from the good standard was then compared to a predetermined limit to establish
the presence of a defect. Additional defect confirmation could be obtained by
272

comparing the sound decay time with a standard or by comparing both spectra
and decay time of sound from two wheels on the same axle.
The initial field trials were successful in that the impactor survived
repeated wheel contact at various train speeds and was able to produce sounds
clearly distinguishable from the background noise. In addition, the spectrum
analysis program was able to call out all the defective wheels used, including
one with a plate crack and three with only thermal cracks. Areas needing hard-
ware improvements were also defined. The impactor design needs refinement
to insure that uniform excitation is imparted reliably to each passing wheel. It
was also determined that the spectrum analyzer with a scanning time constant of
0.2 m sec was too slow to allow more than one spectrum reading on each wheel
at the train speeds used. A faster unit would average several spectra in the
allotted time, increasing the reproducibility of a given wheel evaluation.
Magnetic Perturbation - A unique method of detecting thermal cracks in moving
wheels was recently patented by Gieskieng of Wheel Checkers, Denver,
Colorado. ^^^^ The technique consists of moving a magnetic tapa, carrying an
alternating magnetic signal, across the magnetized tread of a wheel. In those
areas where the wheel material is continuous little or no change will occur in the
tape signal, however, where a flaw or crack contacts the tape the external
magnetic flux at those discontinuities will effectively erase the signal. The de-
tection of such perturbations in the tape signal will, thus, indicate the presence
of defects. A illustration of this phenomenon is shown in Figure 18.
A field installation of the Gieskieng system would involve a special
length of rail with the wheel magnetizing equipment at one end and the magnetic
tape arrangement at the other. The magnetization is accomplished using a long
narrow plate, wound as an electromagnet, attached parallel to one side of the
rail. As a wheel passes the plate the rim alone is transversely magnetized.
The detector portion of the system includes a continuous loop of magnetic steel
tape attached parallel to the rail so that the outer portion of the wheel tread will
contact it on passage. A schematic of the detector elements is shown in Figure
19. The tape, which rotates in a direction opposite to that of the wheel, is
erased of prior information by head 80 and an alternating magnetic carrier
signal of approximately 200 Hz is applied by head 81. After contact with the
wheel, the tape passes the pickup head (85) where any anomalies in the applied
signal will trigger a defect alarm. A contact switch located at point 86 is used
as an axle counter to correlate recorded defect indications with wheel position in
the train.
Modification of the basic tape loop location enables the Gieskieng system
to detect defects near the flange - tread fillet and on the top of the flange.
275

A prototype system has been constructed and tested with success in the
laboratory, however, there have been no field trials to establish its crack
sensitivity and mechanical durability in a railroad environment.
CONCLUSIONThis paper has taken an overview of several detection and evaluation
techniques that have shown promise in the area of improved railroad wheel
inspection. The intent of these discussions was to stimulate interest in the
application of other techniques to the problem and the development of practical
methods of utilizing techniques already investigated.
When commercially viable NDE systems are developed for the railroad
wheel application, the nation as a whole will benefit from the improved transit
safety and the reduced railroad accident costs.
EXCLUSIONThe Association of American Railroads does not necessarily endorse nor
approve the equipment described herein. Statements made in this paper are not
to be used in any advertising or promotion implying Association of American
Railroads' approval.
REFERENCES1. Accident Bulletin, No. 142, 1973 Edition, Office of Safety , Federal
Railroad Administration.
2. Yearbook of Railroad Facts, 1974 Edition, Association of American
Railroads.
3. Manual of Standard and Recommended Practices, Section A, M-107 and
M-208, Association of American Railroads.
4. Literature supplied by Wheel Checkers, Denver, Colorado plus private
communications.
5. C. S. Cater and R. G. Caton, "Fracture Resistance of Railroad Wheels",
September, 1974, Report No. FRA-ORD & D-75-12.
6. Literature supplied by Scanning Systems, Inc., Danbury, Connecticut,
plus private communications.
7. F. L. Becker, "Ultrasonic Detection of Plate Cracks in Railway Wheels"
,
DOT-FRA-726, via private communications with R. Steele, Transporta-
tion Systems Center, Department of Transportation, Cambridge,
Massachusetts. v
27!^ ' '
' '
'

8. W. N. Clotfelter and E. R. Risch, "Ultrasonic Measurement of Stress in
Long Lengths of Welded Rail", NASA TMX-64863, July, 1974.
9. Literature supplied by Lodding Engineering Corp.,Auburn,
Massachusetts.
10. R. King, J. Barton, and W. Perry, "Stress Measurement in Railroad
Wheels via the Barkhausen Effect", DOT-TSC-713, December, 1974.
11. K. Nagy and R. D. Finch, "Feasibility of Flaw Detection in Railroad
Wheels Using Acoustic Signatures", DOT-FR-30002,September, 1974.
12. K. Nagy, "Report on a Preliminary Yard Test of the Acoustic Signature
Method for Railroad Wheel Inspection", University of Houston,
unpublished report, 1974.
13. M. W. Gieskieng, "Method and Apparatus for the Detection of Cracks
and Flaws in Rail Wheels, Rails and the Like by Sliding a Prerecorded
Magnetic Medium Over the Test Piece", U. S. Patent 3,820, 016, June,
1974.
275

do -l-i
o
o00
oI
CO
o1
OI
CO
o
CI
CO
X03
lOo
COwuI—
I
>WCO
QW CO
Q
<
COwCOCO
<CO OI—( I—
I
PI ww
O
PI—
I
I—
I
omft
o
CD
O•r-l
>oCO
0)
CO
cn
U
CDCD
Si
T3CD-bJ
C3
d
C3
<D
U(U
CD
O
0 OS
d cc
CD
O .2
CO
LO
03
OS
O
0) X-d
>CD
-d <D
•r* 03
CD ^>
CD
CO
T3
CD
CO
d^ -2CO -u
•1-1
-dfaxj d
CO
hX)
d-(—I
03
CD
?HCD
>CO
,d CO
> O0)^
> CO
?H rdCD >CO
^
-a ^CO >a 03
CO <D
ffi oS
pq
COCDCO
CO
CO
do
doo
MiaU CO^ ^3
d•1-1
OS
0)
XI
CO
CD
-id03
UX2
OS0)
f-ij->
I
>OS
^ CD
(1) rd0) 5 ^
(X)
?H
CD
O
Q) CO
O CJ
X! r'> >
(D d CD
T3do
g0)
CD
uCO 03 CO O 03
d•1-1
CD
t3
O
r—
ft
03
LOo
LO00
oI
oCD
bJD
d
o
CO
si
<D
U•1—)
g<
uCO
CD
CO
CO
oi
CD
rd
C/2
d•r-l
LO
>5I—
c
do
CO
OS
U
276

FRONT BACK
FIGURE 1
TYPICAL RAILROAD FREIGHT CAR WHEEL
FIGURE 2
PORTION OF A SHELLED WHEEL AFTER DEEP ACID ETCH
277

FIGURE 3
A WHEEL WITH A SHATTERED RIM

FIGURE 6
THERMAL CRACK DEVELOPED ON THE FLANGE FROMBRAKE SHOE CONTACT
279

i
FIGURE 7
WHEEL WITH THERMAL CRACK ON BACK RIM FACEINDUCED BY RETARDER ACTION
FIGURE 8
PLATE CRACKING FOUND IN THE BACK RIM-PLATE FILLET

FIGURE 9
PLATE CRACK THAT DEVELOPED IN THE FRONT HUB-PLATE FILLET
FIGURE 10FIELD INSTALLATION OF THE WHEEL CHECKERS BROKEN
FLANGE AND LOOSE WHEEL DETECTOR (REF. 4)
281

RAIL GAUGE 4' 9- 1/2"
GAUGE TO FINGER TIP A' 9"
NORMAL WHEELGAUGE POINT
,A03 SPRING
DETECTORFINGER
INSULATEDWEAR PLATE
NORMAL WHEELNORMAL GAUGENO DEFECT
CONTACT
IA03 SPRINGFLANGE HEIGHT DEFECT
1. BROKEN(FOR 100^% DETECTABILITYMUST BE BROKEN CONTINUOUSLYFOR 3- 1/2" WITHIN I /2^' OF TREAD)
2. BUILT UP TREAD3. FLANGE CAST LOW OR ECCENTRicj
CONTACTA03 SPRING
CONTACT
A03 SPRING
DEFECT-DID NOT TRACK CORRECTLYTHROUGH DETECTOR
(MAY BE ON SIDE OPPOSITE DETECTION)(WHEELS MUST BE TRAMMED)
1. LOOSE-MOVED IN OR OUT ON AXLE2. MOUNTED OUT OF GAUGE3. BENT AXLEA. SHARP OR THIN FLANGE5. SKEWED TRUCK
FIGURE 11
OPERATION OF THE WHEEL CHECKER WHEELINSPECTION SYSTEM (REF. 4) •
282

TABLE II
CRITICAL CRACK SIZES AT AN APPLIED STRESSOF 55 Ksi (After Carter and Caton, Ref 5)
Class
THERMAL CRACKSCorner Crack^ Surface Crack^
PLATE CRACKSa h
Surface Crack Surface Defect
A 0.25 0. 65 0.50 0.084
B 0.14 0. 36 0.25 0. 043
C 0.10 0.26 0.16 0.028
U 0.10 0.26 0.16 0. 028
^ Crack length in inches
^ Defect denth in inches
FIGURE 12
FIELD INSTALLATION OF THE WHEELFAX ULTRASONICWHEEL INSPECTION SYSTEM (REF. 6)
285

FIGURE 13
CLOSEUP OF WHEELFAX TRANSDUCER BOOT (B^F. 6)
FLUID FILLEDCOUPLING BOOT
— 6 I N . —
FIGURE 14
A CONCEPTUAL IN-RAIL TRANSDUCER ARRANGEMENTFOR THE INSPECTION OF WHEEL PLATES (REF. 7)
28^

Wheel Position Time Beloro, nsee 'in
( nsec /in. )
Time After, n^^(;c/m ( nsec/in. )
1 ( 1 8. 00) 46b ( 11. 90)
2 536 ( 1:5. 60) 279 (7.10)
3 507 ( 1 2. 90) 276 (7.00)
4 4 92 ( 1 2. 50) 205 (5.20)
5 575 (14. 60) 330 (8.40)
6 575 ( 14. 60) 386 (9. 80)
7 Dl b / 1 '?Cl\\ 1 O. £i\J
)4 57 (11. 60)
8 614 (15. 60) 350 (8.90)
Average 565 (14.37) 344 (8. 73)
TABLE III
ULTRASOUND TRANSIT TIME CHANGES ASSOCIATEDWITH A BRAKING TEST (REF. 8)
Biasing Macrnet
ProgrammedPower Supply
FIGURE 15THE ESSENTIAL ELEMENTS OF A BARKHAUSEN NOISEANALYSIS SYSTEM FOR MEASURING STRESS (REF. 10)
285
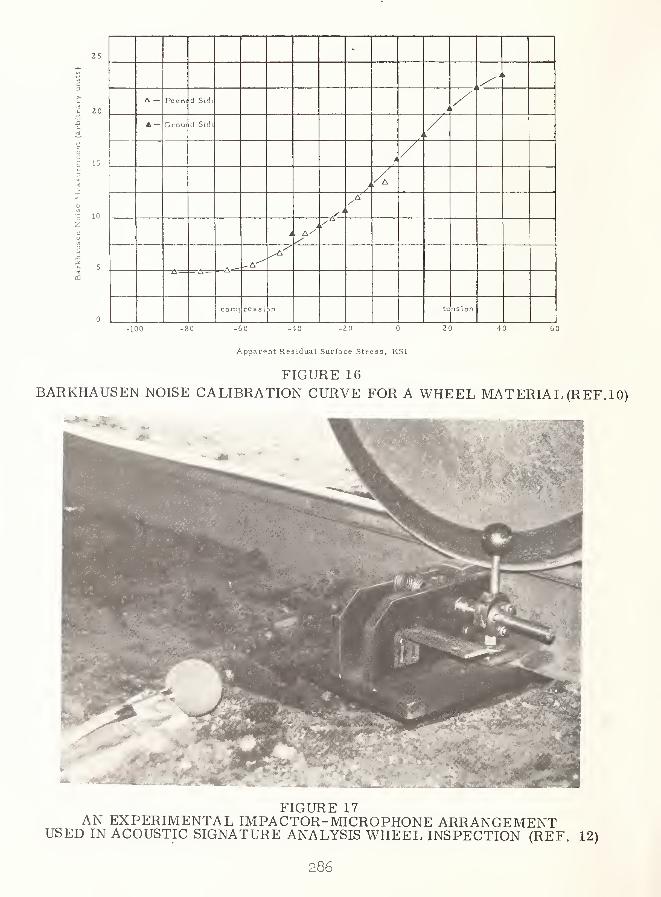
25
0
, i
1^-
I
A — Pcent d Sidi
i
A — Groui d SicU
i
/>
i
/ A
A'/
A'^
A—
comr rc 9 s i in tu n s i 0 n
-100 -SO -GO -40 -ZO 0 20 -10 GO
Apparent Residual Surface Stress, KSI
FIGURE 16
BARKHAUSEN NOISE CALIBRATION CURVE FOR A WHEEL MATERIAL (REF. 10)
FIGURE 17AN EXPERIMENTAL IMPACTOR-MICROPHONE ARRANGEMENT
USED IN ACOUSTIC SIGNATURE ANALYSIS WHEEL INSPECTION (REF. 12)
286
/
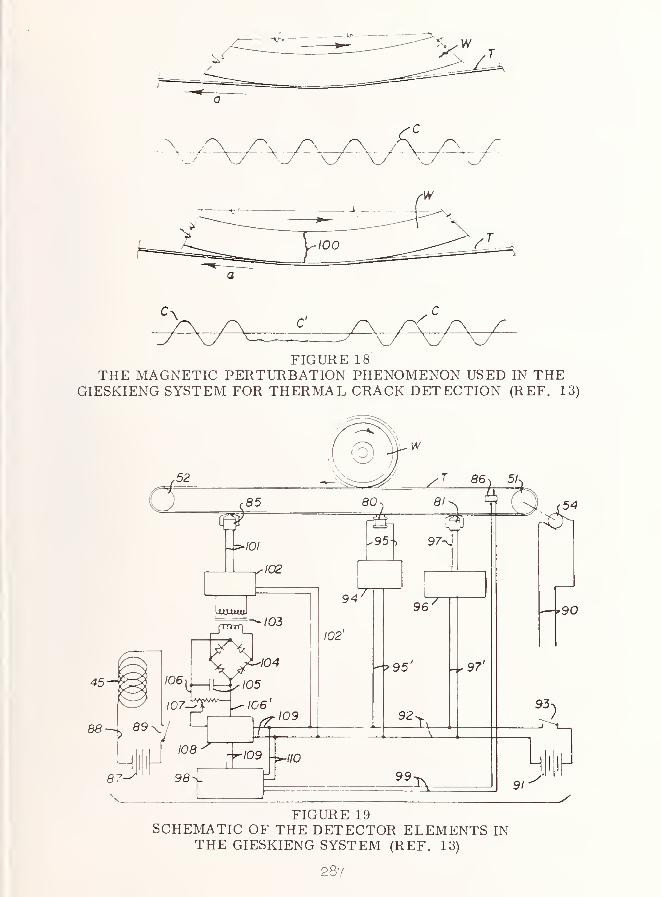
FIGURE 19SCHEMATIC OF THE DETECTOR ELEMENTS IN
THE GIESKIENG SYSTEM (REF. 13)
287

DISCUSSION,
H. E. Dunegan, Dunegan-Endevco Corporation : Has there been anyconsideration about using acoustic emission for this problem?
G. L. Leadley : There are proposals for using acoustic emission.
288
DIAGNOSTICS FOR REFRIGERATOR CARDIESEL GENERATING SETS
Robert F. McKee
,
Pacific Fruit Express CompanySan Francisco, California 94105
BACKGROUND: For over 100 years the ice bunker railroad re-frigerator car was the standard transportation vehicle forperishable foodstuffs between the fruit and vegetable grow-ing areas in the south and west to the major populationcenters in the east and middle west. The growth of the fro-zen food industry in the late 1930' s and during World War II,however, led to the necessary development of refrigerationsystems capable of providing the 0°F holding temperature re-quired by that industry, and which could not be obtained byice refrigeration.
The result was adaptation of commercial compressor -
condensing refrigeration equipment to the railroad environ-ment, and the early to middle 1950' s saw a fleet of frozenfood mechanically refrigerated cars grow into several thou-sand cars to serve the frozen food industry. Fresh perish-able shippers also became interested in the advantages ofcontrolled temperatures as their shipping practices becamemore sophisticated, so that by 1957 the last ice bunker re-frigerator car was built in the United States and from thenthrough the 1960's the fleets of railroad refrigerator carswere replaced by mechanical cars. In 1973, railroad icingoperations were terminated and all perishable movements arenow protected by mechanical refrigeration,
THE MECHANICAL CAR: There are now about 28,000 mechanicalrefrigerator cars in the United States, of a general stan-dard configuration as shown in Figure 1. The cars are gen-erally configured with a 50 foot inside length and a machin-ery compartment at one end, which contains a diesel enginedriven generator set and the high temperature components ofthe refrigeration system. The air circulation blower andcooling coil are located within the insulated compartment atthe wall adjacent to the engine compartment.
The refrigeration system operates on 3 phase 60 Hertz220 volt AC power supplied by the generator set, using stan-dard commercial electrical controls and motors. Provisionsare made for connection to an outside source of power foroperation of the system within enclosed areas during loadingand unloading operations. On board fuel capacity is
289

provided for from 2 0 to 25 days continuous operation, and allsystems are designed with sufficient capacities of oil andcoolant to operate for this period without further servicing.
The systems are fully automatic. When the engine start-er button is pushed and the engine starts, the control systemactuates the various ccxnponents to supply cooling or heatingas required to maintain thermostat settings from O^F to 70°F.Heating is provided by electrical heating elements in thecooling coil, which are also employed to defrost the coilwhen the control system detects the need for defrost, whichis also fully automatic.
A multi-stage thermostat senses the car interior airtemperature returning to the cooling coil as shown in Figure2. The thermostat provides stages of cooling by varying thecompressor capacity and/or diesel -generator speed to alter-nate the output to the actual refrigeration demand as thethermostat setting is approached. At the thermostat settingthe refrigeration compressor stops and starts As required,while the diesel engine runs constantly to provide power todrive the air circulation system and the temperature andelectrical controls.
Should the temperature continue to fall the systemautomatically switches to the heating mode, and continues tomaintain interior temperatures at any outside temperatureencountered. All controls are in the engine compartment,visible and accessible through the side access door.
THE PROBLEM: The environment in which the railroad mechani-cal refrigerator car operates is inherently hostile tooperating machinery. In addition to ambient conditions whichcan vary from -30°F to +150°F in the engine compartment, andelevations of below sea level to over 8,000 feet, there arethe conditions imposed by movement over land and sea (byrailroad barges). These include coupling shocks to 20 g,vibrations, dirt, dust, salt atmosphere and long periods ofunattended operation.
In the early stages of development of mechanical systemsthe objective was to survive any given trip which might varyfrom 5 to 15 days depending upon intermediate stops for load-ing and unloading. A process of survival of the fittest overthe early years developed tight specifications not only forequipment operating characteristics to survive the environ-ment, but eventually to individual designs of certain manu-facturers which proved to be inherently superior.
This process applied to major components such as engines
290

and compressors, as well as to motors, valves, electricalcontractors, relays, wiring, and controls, gauges and indi-cators. As a result the industry has standardized the majorcomponents and accessories, so the operating problems havealso become somewhat standardized. This is an industry-wideproblem, as mechanical refrigerator cars are interchangedbetween owning railroads and others throughout the UnitedStates, Canada and Mexico.
Experience has established that mean time between fail-ures ranks as follows in ascending order:
Diesel Engine -GeneratorElectrical SystemRefrigeration SystemThermostatic Controls
Therefore, when the refrigerator car owners determinedto form a combined task force to determine means of improv-ing dependability and reducing intransit failures the dieselengine -generator was selected as the most applicable commonground for a joint effort to develop diagnostic analysis sys-tems. It was also the area of greatest standardization sincepractically all diesel engines in current use are DetroitDiesel Allison 2 cycle blower scavenged type in Model 2-71and Model 3-53
.
Figure 3 shows a typical DDAD Model 2-71 generator setof the most prevalent type in service. It operates at 1200RR4 to produce 17-20 KW of 220 volt 3 phase 60 Hertz power,with a dual range governor to operate at 800 RPM to provide11-13 KW at 150 volts and 40 Hertz. (It is possible tooperate standard 60 Hertz equipment at 40 Hertz as long asthe voltage /frequency relationship remains constant, sincethe impedance of inductive devices varies directly with thefrequency,
)
A SGLUIION: Upon the decision to concentrate on the diesel-generator set, a contract for a feasibility study was let toa firm who had previous experience not only with diagnosticsystems and their hardware, but who had also done studiesof the DDAD 2 cycle engine for military automotive applica-tions .
The engine generator was divided into sub-systems forindividual analysis consisting of:
CoolantLubricationFuel
291

Combust-ionMechanicalElectricalStarting
Each sub-system was analyzed with a view toward selec-tion of parameters for study, followed by sensing means forcollecting the necessary data for each system consideringthe physical configuration.
Early in the study it was decided that sensing devicesmust be applied at each engine test since the environmentwas too severe for any practical service life of the neces-sary transducers. Therefore non-intrusive applications werepreferred, and rapidity of set-up prior to test was of highpriority. Sensing points selected were as shown in Figure4.
Truth tables were developed based upon test of theactual engine under all conceivable failure modes as previ-ously experienced from analysis of available intransit pei^-
formance data from the various equipment owners. From thesewere constructed the logical diagnostic sequences for eachsub-system, and for all sub-systems taken together.
The feasibility study indicated strong potential for adiagnostic system which could provide advantages as follows:
1. In-car analysis of any or all sub-systems to ascertainpresence of incipient failure conditions prior to eachtrip.
2. Status of sub-system at each subsequent inspection toinclude trend analysis.
3. Provide data for improvement of components, servicingpractices and preventive maintenance procedures cur-rently in effect.
4. Pre-overhaul analysis to enable more effective overhaulprocedures based on true needs of each sub-system.
5. Reduction of unneeded repairs.
6. Quality control improvement on engines tested afteroverhaul
.
7. Receiving inspection of new engines to reduce infantmortality during first few trips.
292

8. Develop information useful to the manufacturer forproduct improvement
.
9. Provide data base for overall fleet analysis and actu-arial projections.
10, Improve intransit performance by restriction of neces-sary maintenance and repairs to the repair shop,
STATUS: Upon completion of the feasibility study actualhardware was acquired through request for proposals fromqualified suppliers having systems capability, with respectto both the diesel engine generator and the diagnostic hard-ware and software. Again we were able to obtain service ofa firm already working with the manufacturer of the enginein other applications
.
By applying our railroad experience and the approachessuggested by the feasibility study, a diagnostic analyzerdesign was developed to meet our needs as an exploratorytool. This included the capability of revising programs andprocedures as actual usage and experience dictated for opti-mum results.
The design for the analyzer chosen is shown in theblock diagram in Figure 5. It enables storage of parametricdata for the particular engine under test, and is program-mable for the different kinds of tests to be conducted. Thepresent equipment is being used with narrow band inputs, butprovisions are incorporated for wide band inputs which areunder consideration for the future with respect to signatureanalysis for the mechanical and combustion systems.
The field test phase of the analyzer development isjust getting under way, and it has become obvious that themost immediate problem is selection and application of trans-ducers which lend themselves to use as part of a field toolwhere they must be applied and removed, suffering the rigorsof the field mechanics' practices yet maintaining theirability to supply useful data with a high degree of depend-ability and respectability. We are also finding that wiringharnesses and connectors will require much development workbefore they will be wholly acceptable.
Another side benefit from the field study of the ana-lyzer has been its use as a tool to acquire and print outtransient information in further study of the operatingcharacteristics of each of the sub-systems. For example,the behavior of the fuel system during changes in speed andload is found to be somewhat different from what we were led
293

to expect from steady state data taken as individual readingsunder differing levels of operation. This is enabling us torevise procedures having to do with test of primary andsecondary fuel filters for preventive maintenance in a mosttroublesome area v^ich is the greatest single cause of in-transit engine shutdov/n,
THE FUTURE: As the diagnostic analyzer is developed for thediesel engine -generator set it will also be considered forapplication to the other components of the refrigerator car.Next for consideration are certain troublesome areas in therefrigeration system, to be followed by the electrical con-trol system.
Another area for independent investigation is that ofthe many bearings of all types on board the mechanical re-frigerator car. There are at least a minimum of 50 bearingsin each car, of which many are in relatively inaccessiblelocations for service, but which may be subject to success-ful signature analysis.
One peculiarity of the mechanical car environment isthe period of operation of the car when the various coolingand heating systems are turned off. Experience indicatesmuch bearing degradation takes place during non-operatingtime due to the shock and vibration from the car structure,and from the temperature changes which occur within the sys-tem causing entrance of moisture vapor.
Much work remains to be done in the diagnosis, analysisand prognosis of the various systems, and the state of theart appears to offer much opportunity for application to therailroad mechanical refrigerator car.
Another area for consideration is intransit monitoringof the performance of the car during its unattended opera-tion. As part of the attention being given to the dieselengine, a correlative program is under way to develop an in-transit monitor which will stay aboard the car and whichwill indicate cause of engine shutdown. Such a device nowunder development is shown in Figure 7.
It will indicate to an inspector investigating a deadcar the diesel sub -system which apparently led to shutdown,since the time lapse between the cause of shutdown and thefirst inspection capability upon arrival at a terminal maybe several hours and the symptoms long since gone. Manyengines will start and run normally during the short terminaltime within which to observe them, so a means must be

provided to signal the cause, such signal to remain availablefrom battery supplied power for as much as 24 hours to beuseful
.
Such a device becomes an on-board diagnostic tool forintransit repairs, and data gathered from it will also beavailable to the diagnostic system to point out areas re-quiring further attention on that particular engine.
A subsequent development now being considered is to pro-vide a communication link between the car and wayside inter-rogators to enable all cars passing such points to reporttheir condition and cause of malfunctions which may bepresent. This will permit repair forces to be waiting whenthose cars requiring attention arrive, avoiding time lostinspecting long trains to discover any such cars, when thattime could be used to effect repairs without delaying thetrain
.
With the emphasis on use of rail transportation to han-dle the large volumes of perishable foodstuffs for an in-creasing population at the lowest cost in terras of preciousfuel, means of further improving the effectiveness of therail mode of transportation will be increasingly cost effec-tive, enabling the state of the art in the industry to beapplied at an increased level of activity.
295

N
296

297


LIST OF SENSORS
SENSORNUMBER FUNCTION
AlA. Exhaust Manifold Surface Temperature (Cylinder
AlB Exhaust Manifold Surface Temperature (Cylinder
AlC Exhaust Manifold Surface Temperature (Cylinder
A2 Exhaust Manifold Riser Temperature
A5 Exhaust Manifold Pressure
Bl Engine Side Temperature (Air)
B2 Lower Radiator Temperature
B5 Upper Radiator Temperature
Bh Engine Block Coolant Temperature
B5 Radiator Pressure
B6 Block Coolant Pressure
CI Sump Oil Temperature
C2 Oil Cooler Return Temperature
03 Air Out Temperature
Ck Lube Pump Pressure
C5 Gallery Oil Pressure
Dl Fuel Pump Suction Pressure
D2 Fuel Pump Pressure
D5 Common Rail Pressure
D^i Fuel Line Suction
D5 Intake Manifold Pressure
D6 Air Box Pressure
Gl Crankcase Pressure
HI Cranking Current
llOH, llOL Alternator Frequency
23OH, 25OL Two-Speed Solenoid
SSV Starter Solenoid Voltage
BATTV Battery Voltage
STARTV Starter Voltage
Figure h. Model 7^+9 diesel diagnostic analyzer.
299

t—
O 03
L_
cs
_J
n n
W•H
oo
o•H-pod
(D
•H
500

301

- LOW OIL FHESSURE
LOW FUEL PRESSURE
LOW ENGINE SPEED -j
V MANUAL SHUTDOWN
Figure 7.
502

DISCUSSION
J. W. Forest, Ontario Hydro : What provisions, if any, are there forisolating ihe systems from the shock and vibration of the railroadenvironment?
R. F. McKee : For many years we didn't know what the environment reallyconsisted of. We knew that it was bad but we really didn't have anygood measurements. Our specifications call for a capability of 20 G'slongitudinal to the rail, 10 G's lateral to the rail, 5 G's verticallyas far as original manufacture is concerned. Through shake table andimpact experiments on equipment, we developed ways to either isolateshock loads from the system or have a system capable of riding throughthe spikes, by mounting equipment more solidly. In the beginning wedid a lot of isolating work. Now we are bolting things down prettysolidly because we have found that we were getting secondaryrelationships that were unmeasurable. Some things still have to beisolated. The thermostat, for instance, has microswi tches in it whichare very sensitive and we still isolate that. We are getting insiduousresults on long-term service life of various components through thevibration spectrum, and we are going to study this as our next phase.
K. R. Thomas, Deere and Company : Are you going to have a problemgetting mechanics to install all those transducers?
R. F. McKee : In our company we have a separate lab where the mechanicscome by and see what we are doing. They are always suspicious of usanyway so we think the best approach is to treat this as just one moresophisticated step in giving mechanics tools so that they are workingon the thing that needs to be worked on and not searching for theproblem.
505

USING ACOUSTIC EMISSION TECHNOLOGYTO PREDICT STRUCTURAL FAILURE"
H. L. DuneganDunegan/Endevco
San Juan Capistrano, California 92675
The problems associated with assuring structural Integrity of largecomplicated structures, such as bridges and power plant pressure vessels,have been the cause of much concern to the prime contractors manufac-turing these structures, and to the licensing agencies and code writerswhose responsibility it is to assure public safety. This concern is
rightly justified since we are continually striving for greater effi-ciencies in the use of materials which call for higher strength-to-weight ratios, higher operating temperatures and pressures, and economicsin manufacturing. Each of these factors requires that better inspectiontechniques and more quantitative information be available for making a
judgment of operating efficiency as well as safety.
One approach that has been taken to help solve some of the problemsis sponsored research in linear fracture mechanics and nondestructivetesting technology. Much progress has been made in both areas over the
last decade such that the combination of design based on linear fracturemechanics coupled with a thorough NDT inspection is sufficient precautionin most cases to prevent structural failures. Problems that can arise in
applying this technique come about by the inability, in some instances,to accurately determine the stresses under operating environments and thesize and shape of the flaw. Both pieces of information are needed to de-termine the stress intensity factor at a flaw site, and therefore predictstructural failure.
The purpose of this report is to show how acoustic emission tech-niques can be used to estimate the stress intensity factor of a growingcrack, and therefore provide predictive ability for determining failure.
In acoustic emission, the energy input is in the form of strainenergy due to mechanical, thermal, or intrinsic stresses. Interactionand redistribution of stresses within the vicinity of a defect on a locallevel gives rise to the acoustic emission signal. This comes about due to
sudden irreversible phenomena (such as plastic deformation, cleavage, or
phase transformation) which releases minute quantities of strain energy,
This paper is an excerpt from anarticle that appeared in METALSENGINEERING QUARTERLY February 1975
30h
/

part of which is emitted as an elastic wave - sometimes called a stresswave
.
The step of displacement which generates this stress pulse can occur
on the order of 10~ s. Thus, the stress pulse has very broad band fre-quency components. Most engineering structures are two-dimensional in
nature. Therefore, the stress pulse will normally be dispersive innature, taking on the characteristics of a guided wave. Since the acous-tic emission transducer is normally attached to the surface of a struc-ture, the primary modes of interest for detection are the shear and sur-
face wave components of the stress pulse.
Both Lamb waves and Rayleigh waves can be detected at the surface.With thin plates and detection frequencies between 0.1 and 1 MHz, Lambwaves are the most important consideration, for thick-plates Rayleighwaves become the more dominant. Both of these wave propagation modeshave the advantage that geometrical losses go as R""*", as opposed to R~^for infinite medium waves where R is the distance of the wave packet from
the source. Thus, a piezoelectric transducer placed on the surface of a
part subjected to stress will detect the stress pulses emanating from a
localized deformation, even though it is physically removed from thesource by some distance (tens of ft. in some cases). By measuring the
time of arrival of the stress pulse at several transducers located on a
structure, one can accurately locate the source of the signal. (This is
analogous to locating the epicenter of an earthquake, which emits anacoustic signal on an immense scale.)
FRACTURE CONSIDERATIONS
Most structural failures occur by the initiation and growth of a
crack. The crack may already be present, or cracks may initiate due to
nonmetallic inclusions, hydrogen embrittlement , stress relief heat treat-ment, stress corrosion cracking, or fatigue at a stress concentration. Inother instances, a structure may simply fail due to accidental overload,or become overloaded at working stresses due to thinning of material fromthe working environment. Acoustic emission techniques appear to be moresuited to the first case where failures occur due to the growth of cracksat gross stresses well within the design limits of the structure. Afailure of this type is usually caused by the slow growth of a crack to a
critical size, such that catastrophic crack propagation occurs and thestructure fails.
A whole new methodology, called Linear Elastic Fracture Mechanics, hasdeveloped over the past decade specifically directed toward determiningthe stresses in the vicinity of cracks. These stresses are controlled by
a single parameter, K, known as the stress intensity factor. Thisparameter depends on the body geometry, the shape, size and location of
the flaw, and the type of loading that is present. Since the acousticemission in a specimen containing a crack stressed below general yield is
305

dependent on the plastic strains in the vicinity of the crack tip, andthese strains in turn depend on the stress intensity factor, it was ex-
pected, and found to be true,^ that the acoustic emission characteristicsshould be closely related to the stress intensity factor for the crackspresent . ,
The importance of the relationship between acoustic emission and thestress intensity should not be overlooked. Since the stress intensityfactor, K, is the controlling parameter for the stresses in the vicinityof a crack, and the critical value of K (called K^,, or the fracturetoughness) is where failure will occur, failure of a structure can easilybe predicted if one can estimate, from acoustic emission monitoring of a
structure, the value of K for the defects in the structure and the frac-ture toughness K^^ for the material is known. Therefore, one need notknow the 'flaw size, stress or any other parameter in order to make failureprediction - it is the local stresses in the vicinity of the defect andnot the defect size or gross stresses alone that are important. Fromthis, one would expect a small defect in a highly stressed region or onecontaining tensile residual stresses to be a more important considerationthan a larger defect in a relatively lower stressed region, because the
stress intensity could be higher for the smaller defect (since it dependson both the flaw size and gross stresses)
.
Estimating Stress Intensity Factors
The fact that a defect is or is not present in a structure should not
be the most important consideration. It is the defect that will grow inservice that will lead to problems, and it is the detection of the growingdefect and the estimate of the stress intensity in the vicinity of the de-fect that will allow a technical judgment to be made for keeping a struc-
ture in service. The remainder of this report will show how acousticemission techniques can be used for estimating the stress intensity fac-tor, K, near a growing crack for three types of service conditions: 1)
subcritical growth due to hydrogen embrittlement or stress corrosion;
2) subcritical growth due to fatigue; and, 3) subcritical growth due to
rising load tests that would be encountered for instance during prooftesting of pressure vessels.
FATIGUE CRACKING
Basically, two acoustic emission methods can be used to detectfatigue crack growth. In one, the acoustic emission is recorded on a
periodic basis from a structure that is loaded in a single cycle to a
stress higher than the working stress (periodic overload). Second, the
structure can be continuously monitored during service.
306

Periodic Overload
This technique will work as well on subcritical growth due to hydro-gen embrittlement or stress corrosion cracking, but has usually been used
in fatigue crack growth studies. The technique utilizes the "Kaiser"effect, an irreversible nature of acoustic emission, in the followingway. Assume a structure containing a defect is initially proof loaded to
a value such that the stress intensity factor present at the proof load
is
Kp = Oio/a [1]
where
Kp = stress intensity at proof load
a = geometry functionQ = stress at proof loada = initial crack size
The structure is subjected to its working environment for some period, andis again loaded to the same maximum proof stress while monitoring acousticemission. It has been determined^ that the acoustic emission, N, as a
function of the stress intensity, K, could be expressed as
N = AK^ [2]
If no crack growth has occurred during the working environment, Kp at theproof stress will be identical to what it was during the initial proofload. Because of irreversibility (that is, no new plastic deformation),there will be no acoustic emission present during the second loading to
the proof load. On the other hand, if crack growth has occurred such that
a in Eq . [1] is larger and the structure is loaded to the same maximumstress, the stress intensity factor, Kp, will be greater due to the in-crease in the crack length. Therefore, new deformation will occur, andacoustic emission will be present between the working stress and proofstress. Thus, the presence of acoustic emission between the workingstress and proof stress during a periodic overload of a structure is a
,
qualitative measure that defect growth has occurred at the working stresssince the last proof test.
Recovery effects of materials especially under high temperature en-vironments may affect the irreversible nature of the acoustic emissionresults. Palmer^ has conducted extensive experiments on pressure vesselsteels in the U.K., and reported that for temperatures encountered inmost power plant pressure vessels, recovery effects are minimal.
To get more quantitative results on a periodic overload test, oneneeds to obtain fatigue crack growth data on the materials used in a
507
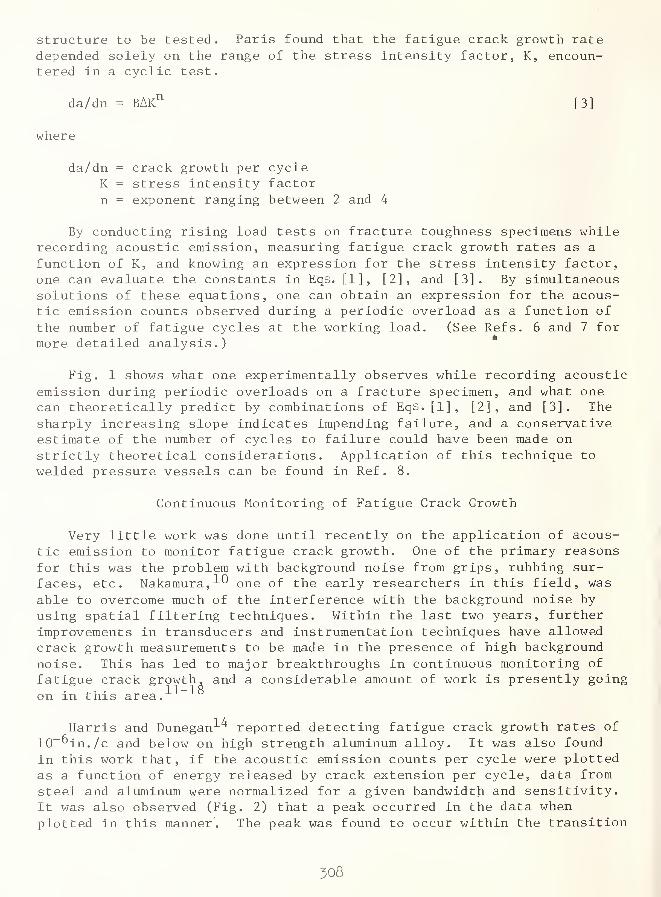
structure to be tested. Paris found that the fatigue crack growth ratedepended solely on the range of the stress intensity factor, K, encoun-tered in a cyclic test.
da/dn = BAk'^ [3]
where
da/dn = crack growth per cycleK = stress intensity factorn = exponent ranging between 2 and 4
By conducting rising load tests on fracture toughness specimens whilerecording acoustic emission, measuring fatigue crack growth rates as a
function of K, and knowing an expression for the stress intensity factor,one can evaluate the constants in Eqs. [1], [2], and [3]. By simultaneoussolutions of these equations, one can obtain an expression for the acous-tic emission counts observed during a periodic overload as a function of
the number of fatigue cycles at the working load. (See Refs. 6 and 7 formore detailed analysis.) *
Fig. 1 shows what one experimentally observes while recording acoustic
emission during periodic overloads on a fracture specimen, and what onecan theoretically predict by combinations of EqS. [1], [2], and [3]. Thesharply increasing slope indicates impending failure, and a conservativeestimate of the number of cycles to failure could have been made on
strictly theoretical considerations. Application of this technique to
welded pressure vessels can be found in Ref . 8.
Continuous Monitoring of Fatigue Crack Growth
Very little work was done until recently on the application of acous-tic emission to monitor fatigue crack growth. One of the primary reasons
for this was the problem with background noise from grips, rubbing sur-
faces, etc. Nakamura, -'-^ one of the early researchers in this field, was
able to overcome much of the interference with the background noise by
using spatial filtering techniques. Within the last two years, further
improvements in transducers and instrumentation techniques have allowedcrack growth measurements to be made in the presence of high background
noise. This has led to major breakthroughs in continuous monitoring of
fatigue crack growth, and a considerable amount of work is presently going
on in this area
.
Harris and Dunegan-'-'^ reported detecting fatigue crack growth rates of
10~^in./c and below on high strength aluminum alloy. It was also found
in this work that, if the acoustic emission counts per cycle were plottedas a function of energy released by crack extension per cycle, data from
steel and aluminum were normalized for a given bandwidth and sensitivity.It was also observed (Fig. 2) that a peak occurred in the data whenplotted in this manner. The peak was found to occur within the transition
308

region from plane strain to plane stress along the crack front,
phenomenon has important implications for possible quantitative
acoustic emission data for predicting fatigue lifetime.
Thisuse of
RISING LOAD TESTS
Large pressure vessels and many other types of structures are normallytested to a proof stress higher than the working stresses prior to beingput into service. It was stated previously that the stress intensity
factor, K, controls the magnitude of the stresses at the crack tip.
Therefore, if one can measure the stress intensity factor during a proofstress cycle using acoustic emission techniques, a judgment can be madeconcerning the integrity of the structure. For example. Fig. 3 is a plotof the acoustic emission from several specimens"'-^ containing differentcrack lengths. We see that all the data is normalized when plotted as a
function of the stress intensity factor.
20Corle has extended this concept to improve the reliability of rocketmotor cases. He demonstrated the flaw detection improvement achieved by
the use of acoustic emission during proof testing of motor cases over thereliability achieved by the proof test alone. From the acoustic emissionstandpoint, the improvement was greater in air melted and welded struc-tures than in unwelded,. vacuum melted structures.
Thus we see for small structures without a great deal of complexityone can use acoustic emission to accurately evaluate integrity once the
material characteristics are established. For complex structures con-taining riveted joints and other types of mechanical fasteners, one mustlocate the source of the acoustic emission signal to more accurately takeinto account signals from several sources.
FLAW LOCATION
For some types of geometries (linear welds and tubes, for .example)
,
a one-dimensional location scheme is adequate. Bailey^ et al^\ used thisconcept to good effect for locating fatigue cracks growing from rivetfastener holes during fatigue testing of an aircraft structural section.Fig. 4 shows the type of specimen and the acoustic emission display usedto locate the cracks. All cracks when first detected were under nuts,bolt heads, or in faying surfaces - locations which are difficult to re-liably inspect by conventional nondestructive techniques. Bailey, et al,
also stated that the fatigue tests were only monitored 10 pet of the totaltest time, and that 15 of the 18 potential cracks identified were con-firmed by visual means at 50 times magnification.
Thus we see that, under certain situations, economical and fairlysimple hardware can be used to identify that a crack is present, and theextent of cracking, once located, can be checked by other methods. As
309
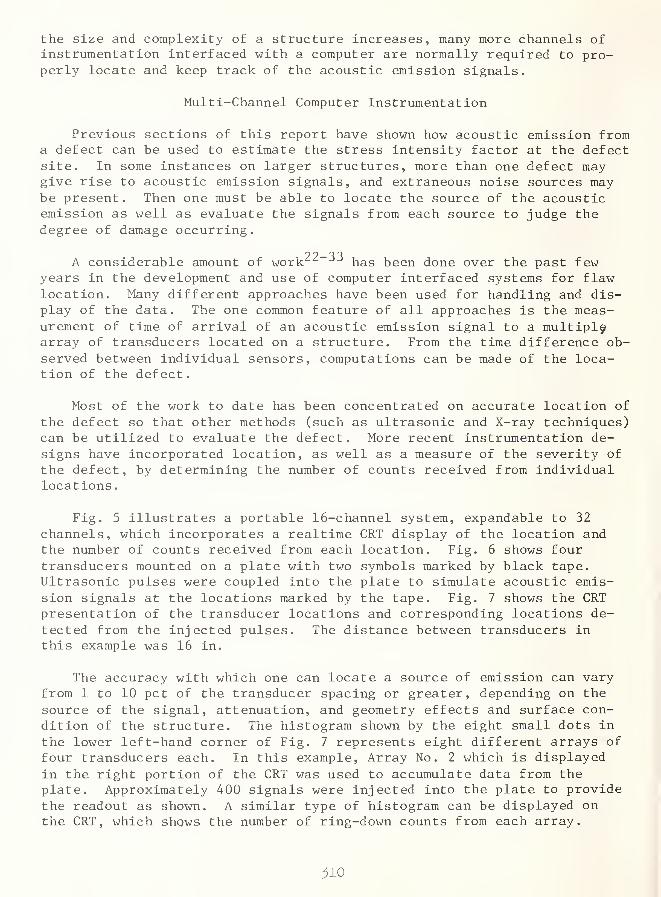
the size and complexity of a structure increases, many more channels ofinstrumentation interfaced with a computer are normally required to pro-perly locate and keep track of the acoustic emission signals.
Multi-Channel Computer Instrumentation
Previous sections of this report have shown how acoustic emission froma defect can be used to estimate the stress intensity factor at the defectsite. In some instances on larger structures, more than one defect maygive rise to acoustic emission signals, and extraneous noise sources maybe present. Then one must be able to locate the source of the acousticemission as well as evaluate the signals from each source to judge thedegree of damage occurring.
A considerable amount of work has been done over the past fewyears in the development and use of computer interfaced systems for flawlocation. Many different approaches have been used for handling and dis-play of the data. The one common feature of all approaches is the meas-urement of time of arrival of an acoustic emission signal to a multiplyarray of transducers located on a structure. From the time difference ob-served between individual sensors, computations can be made of the loca-tion of the defect.
Most of the work to date has been concentrated on accurate location of
the defect so that other methods (such as ultrasonic and X-ray techniques)can be utilized to evaluate the defect. More recent instrumentation de-
signs have incorporated location, as well as a measure of the severity of
the defect, by determining the number of counts received from individuallocations.
Fig. 5 illustrates a portable 16-channel system, expandable to 32
channels, which incorporates a realtime CRT display of the location andthe number of counts received from each location. Fig. 6 shows four
transducers mounted on a plate with two symbols marked by black tape.Ultrasonic pulses were coupled into the plate to simulate acoustic emis-sion signals at the locations marked by the tape. Fig. 7 shows the CRTpresentation of the transducer locations and corresponding locations de-
tected from the injected pulses. The distance between transducers inthis example was 16 in.
The accuracy with which one can locate a source of emission can varyfrom 1 to 10 pet of the transducer spacing or greater, depending on the
source of the signal, attenuation, and geometry effects and surface con-dition of the structure. The histogram shown by the eight small dots in
the lower left-hand corner of Fig. 7 represents eight different arrays of
four transducers each. In this example. Array No. 2 which is displayed
in the right portion of the CRT was used to accumulate data from theplate. Approximately 400 signals were injected into the plate to providethe readout as shown. A similar type of histogram can be displayed onthe CRT, which shows the number of ring-down counts from each array.
310
This gives a measure of the amount of deformation or crack growth occurringat specific locations covered by each array.
The type of printout one can obtain from this system provides the
time difference information between transducers, the X-Y coordinates of
the source, the number of ring-down counts from the signal (which is a
measure of the severity or the amount of crack growth) , and a parametricinput such as pressure, force, etc.
Thus we see that the ability to locate a source of acoustic emission,coupled with the ability to evaluate individual signals from each loca-tion, allows us to treat the large complex structure as a composite of
many localized small scale components. We can apply the ability to esti-mate stress intensity factors at these local levels to determine struc-tural integrity.
CONCLUSIONS
The combination of acoustic emission and linear fracture mechanicscan provide quantitative information regarding structural failure. Thisreport has shown that, for certain situations, acoustic emission tech-niques can be used to accurately estimate the stress intensity factor, K,
at a growing crack, and therefore provide predictive information regardingstructural failure. The importance of locating defects in large struc-tures was also stressed, and a multiple-channel computer system was des-cribed for accomplishing this function. The ability to locate a growingdefect, coupled with the ability to quantify the growth rates with fixedsensors (no scanning required) places acoustic emission in the forefrontof new techniques for the prevention of structural failure.
311

REFERENCES
1. P.C. Paris and G. Sih: Fracture Toughness Testing and Its Applica-
tions , ASTM Special Technical Publication No. 381, pp. 30-81.
2. G.R. Irwin: Structural Mechanics, pp. 567-91, Pergamon Press, Oxford,
1960.
3. M.L. Williams: Journal of Applied Mechanics , 1957, no. 24, pp. 109-14.
4. G.R. Irwin: Journal of Applied Mechanics , 1975, no. 24, pp. 361-64.
5. H.L. Dunegan, D.O. Harris, and C.A. Tatro: Engineering FractureMechanics Journal , 1968, vol. 1, pp. 105-12.
6. H.L. Dunegan and D.O. Harris: Materials Evaluation , October 1970,vol. -28, no. 10, pp. 221-27.
7. D.O. Harris, H.L. Dunegan, and A.S. Tetelman: Proceedings of the Air
Force Conference on Fatigue and Fracture of Aircraft Structures andMaterials
, pp. 459-71, Air Force Flight Dynamics Laboratory ReportAFFDL TR70-184, 1970.
8. D.O. Harris and H.L. Dunegan: Testing for Prediction of MaterialPerformance in Structures and Components
, pp. 158-170, ASTM SpecialTechnical Publication No. 515, American Society of Testing andMaterials, Philadelphia, Pa., 1972.
9., I.e. Palmer: Material Scientific Engineering , 1973, vol. II, p. 227.
10. Yoslo Nakamura: Materials Evaluation , 1971, vol. 29, pp. 8-12.
11. T.M. Morton, R.M. Harrington, and J.G. Bjeletlch: to be published inEngineering Fracture Mechanics .
12. S. Smith and T.M. Morton, Experimental Mechanics ,May 1973, vol. 13,
no . 5
.
13. T.M. Morton, S. Smith, and R.M. Harrington: to be published in
Experimental Mechanics .
14. D.O. Harris and H.L. Dunegan: Experimental Mechanics,February 1974,
vol. 14, no. 2, pp. 71-81.
15. R.M. Wallace, M.C. Van Wanderham, and H.S. Pearson: "Investigation of
Fatigue Crack Propagation in Ti 6Al-2Sn-4Zr-6Mo and IN-100 UsingAcoustic Emission Techniques," Pratt and Whitney Aircraft, West Palm
Beach, presented at Autumn 1973 meeting of the American Society for
Nondestructive Testing, Chicago, Illinois, October 1973.
16. J.R. Mitchell, D.M. Egle and J.F. Appl, : Proceedings of the OklahomaAcademy of Sciences
, 1972, vol. 53, pp. 121-26.
17. A. Vary and J. Klima: "A Potential Means of Using Acoustic Emissionfor Crack Detection under Cyclic Load Conditions," National Aeronautics
and Space Administration Technical Memorandum NASA TM X-68228, 1973.
18. D.O. Harris: "Effect of Gain and Frequency on Acoustic Emission
Observed from Growing Fatigue Cracks," Dunegan/Endevco Report DE-74-4.
19. H.L. Dunegan and D.O. Harris: Ultrasonics , 1969, vol. 7, no. 3.
20. R.R. Corle: "The Use of Acoustic Emission to Improve Motor Case Relia-
bility," presented at AIAA/SAE 9th Propulsion Conference , Las Vegas,
Nevada, 1973, AIAA Reprint No. 73-1258.
512
/

21. CD. Bailey and W.M. Pless: "Acoustic Emission Used to Nondestruc-tively Determine Crack Locations in Aircraft Structure FatigueSpecimens," 9th Symposium on Nondestructive Testing , San Antonio,
Texas, April 1973.22. ' A.T. Green: "Testing of Glass Hemispheres Using Aerojet General's
Stress Wave Analysis Technique," Report AD 825542, Aerojet GeneralCorporation, September 1967.
23. D.L. Parry and D.L. Robinson: USAEC Technical Report IN-1398, ReactorTechnology TID-4500, July 1970, pp. 97-99.
24. N.O. Cross: "Status of AE as a Nondestructive Testing Technique forPressure Vessels," Exxon Research & Engineering Company, 27th ASMEPetroleum Mechanical Engineering Conference, New Orleans, Louisiana,September, 1972.
25. W.D. Jolly, T.J. Davis, and M.R. Compton: "Evaluation of the AESystem," EEI-TVA Rp79 Report No. 6, January 7, 1972 (NTIS No.PB207-591) .
26. M.P. Kelly and R.L. Bell: "Detection and Location of Flaw Growth in
the EBOR Nuclear Reactor Vessel," Dunegan/Endevco Report No. 73-4,February 1973.
27. P.H. Hutton: Nondestructive Testing,May 1969, pp. 111-14.
28. N.O. Cross, L.L. Loushin, and J.L. Thompson: Acoustic Emission , ASTM-STP-505, December 1971, pp. 270-296.
29. R. Gopal: EEI-TVA Rp79 Addendum Report, May 1973, pp. 49-88.
30. W.D. Jolly, E.R. Reinhart, and S.P. Ying: EEI-TVA Rp79 AddendumReport, May 1973, pp. 120-123.
31. P.G. Bentley, E.J. Burton, A. Cowan, D.G. Dawson, and T. Ingham:Proceedings of the ASME Second International Conference on PressureVessel Technology, Part II , pp. 643-54, San Antonio, Texas, October1973.
32. N. Cretien, P. Bernard, and B. Barrachin: Proceedings of ASMESecond International Conference on Pressure Vessel Technology
,
Part II, pp. 655-67, San Antonio, Texas, October 1973.
33. D. Birchon, R. Dukes, and J. Taylor: Proceedings of ASME SecondInternational Conference on Pressure Vessel Technology, Part II
,
pp. 669-84, San Antonio, Texas, October 1973.
315

roIO
10"' n
Fig. 1 - Experimental and theoretical resultsof total counts observed during theproof cycle versus the number offatigue cycles at the working stress
51^
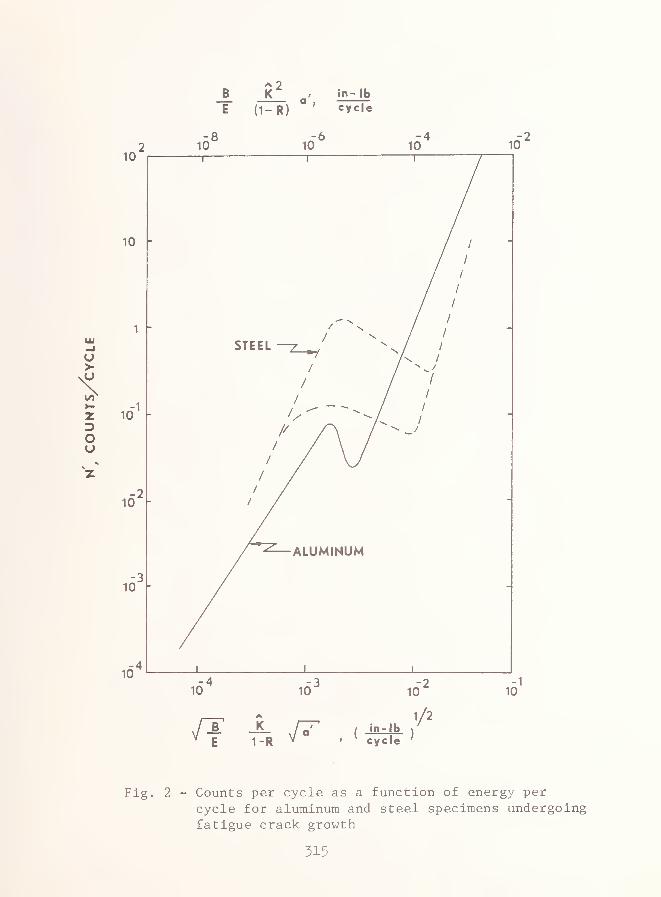
315

Fig. 3 - Summation of acoustic emission as a
function of stress intensity factor forSEN fracture specimens of 7075-T6 Alwith different initial crack sizes
316

LO f— nuo on I c\jcC et CM • •
CD (X <
—
CO
o OJ
H r-1-
o: CC\Jcr. 4^ -P•H a
-P0) 0)
> oCJ •H ft•H 5-. ^-P ocr. -P o
CC
OoCD
•H -prH -P oCO CO
c ao •H -p•HH
a -po Cm
CO•H
CJ
1 o(U CD •H
CO
o oX
Cm Cm (U
O O rH
v.
-P o olo ti
a
ftca
CD
>H oX o
517

Fig. s - Multiplesystem
channel acoustic emission
Fig. 6 - Transducer placement on a metal plateand symbols used for illustrating flawlocation by acoustic emission multiplechannel system
518
/

Fig. 7 - CRT presentation obtained byinjecting simulated acousticemission signals at locationshown by symbols in Fig. 6

DISCUSSION
J. W, Forest, Ontario Hydro : How do you go about establishing thethreshholds and how does that level affect the results?
H. E. Dunegan : You have to determine the signal level expected from a
given increment and the background noise in a particular frequencyrange. So it may involve using either changing sensitivities orchanging frequencies depending on the conditions.
J. L. Frarey, Shaker Research Corporation : When a reactor is understeady state loading, wouldn't the signal-to-noise ratio be a real
probl em?
H. E. Dunegan : We were pleasantly surprised. We have sensors on fourboiling water reactors now. We find that when the reactor comes up
under cold start-up, there is a lot of noise. Once temperature andfull operating load are reached, things quiet down drastically. So wewere pleasantly surprised that under operating conditions the reactoris actually quieter than it is when it is being started i4p,
J. L. Frarey : But also the crack isn't progressing as fast.
H. E. Dunegan : You may want to look at the ratio of activity from an
area over the last 24 hours compared lo the activity over the last 30
days. Then you can construct a curve of the ratio of activity as a
function of time. If there is a change in slope, that would be an
indicator that there is something very active there. It's somewhatdifficult at this point to make quantitative measurements.
\
320
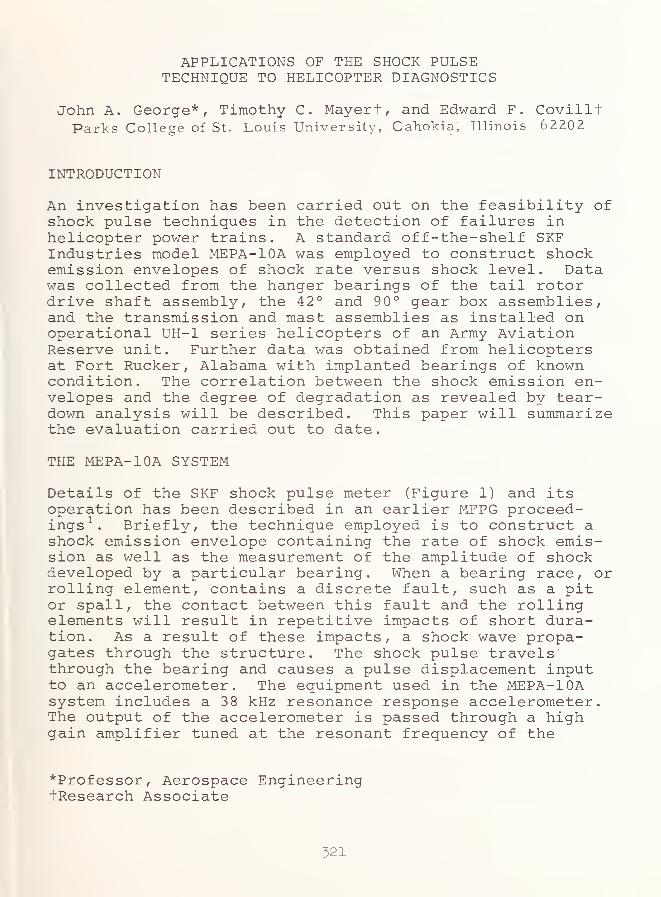
APPLICATIONS OF THE SHOCK PULSETECHNIQUE TO HELICOPTER DIAGNOSTICS
John A. George*, Timothy C. Mayert, and Edward F. CovilltParks College of St. Louis University, Cahokia, Illinois 62202
INTRODUCTION
An investigation has been carried out on the feasibility ofshock pulse techniques in the detection of failures inhelicopter power trains. A standard off-the-shelf SKFIndustries model MEPA-lOA was employed to construct shockemission envelopes of shock rate versus shock level. Datawas collected from the hanger bearings of the tail rotordrive shaft assembly, the 42° and 90° gear box assem.blies,and the transmission and mast assemblies as installed onoperational UH-1 series helicopters of an Army AviationReserve unit. Further data was obtained from helicoptersat Fort Rucker, Alabama with implanted bearings of knowncondition. The correlation between the shock emission en-velopes and the degree of degradation as revealed by tear-down analysis will be described. This paper will summarizethe evaluation carried out to date
.
THE MEPA-lOA SYSTEM
Details of the SKF shock pulse meter (Figure 1) and itsoperation has been described in an earlier MFPG proceed-ings^. Briefly, the technique employed is to construct ashock emission envelope containing the rate of shock emis-sion as well as the measurement of the amplitude of shockdeveloped by a particular bearing. When a bearing race, orrolling element, contains a discrete fault, such as a pitor spall, the contact between this fault and the rollingelements will result in repetitive impacts of short dura-tion. As a result of these impacts, a shock wave propa-gates through the structure. The shock pulse travelsthrough the bearing and causes a pulse displacement inputto an accelerometer . The equipment used in the MEPA-lOAsystem includes a 38 kHz resonance response accelerometer.The output of the accelerometer is passed through a highgain amplifier tuned at the resonant frequency of the
*Professor, Aerospace EngineeringtResearch Associate
321

accelerometer . This amplifier acts as a very sharp bandpass filter. After the signal is suitably processed, theoutput is displayed on a counter which provides the fre-quency of peaks above any desired peak amplitude. No otherprocessing is required for analysis.
A graph is made of the shock emissions (Figure 2) and fromthis data a determination of condition is made. With theaccelerometer attached, an initial rate and value evaluationis made. The rate found becomes the first point plotted onthe ordinate at a shock level of one. A threshold varyingdial, on the instrument housing, ranges from a level of oneto ten thousand on a logarithmic scale. As the threshold isincreased, successive rates are plotted until a curvecrosses the abscissa. This value at the intercept becomesthe highest potentiometer level at which at least one shockpulse per second can be measured. Rate values are in pulsesper second and the shock level obtained is a function of theaccelerometer used. The curves are evaluated by their gen-eral curve form as well as the magnitude of rates and/orlevels obtained. Approximately three minutes is required toobtain shock emission curve.
SKF Industries indicates in the operators manual of theMEPA-lOA that all curve forms are a variation of three
,gen-
eral forms (Figure 2) : 1) one with high rates and rela-tively low levels--an apparent indication of foreign matterin the lubricant of the bearing; 2) a curve shape of lowrates and relatively high shock levels--indicative of abearing with insufficient lubricant or possible element dam-age; 3) a curve with both significantly high rates and lev-els, with the amount of "filling out" of the curve propor-tional to the extent of damage. However, in the helicopterapplications to date, the relationship between curve shapeand degradation was found to be more complex.
LABORATORY FINDINGS
A laboratory study was undertaken to provide experience andto develop the methodology to be utilized on the actualUH-1 aircraft. A bearing test rig was set up utilizing thesame type, make, and size as those employed as hanger bear-ings on the UH-1 series aircraft. The hanger bearing fix-ture was identical to that of an operational helicopter.The major results:
1. The SKF-provided vice-grip to which the accelerometeris attached proved unsatisfactory. Significant differ-ences were found in readings dependent on placement and
522

security of the vice-grip attachment. A pressure clamphas been fabricated which can be fitted to the lands ofthe bolts which hold the bearing fixture in place. Theaccelerometer , in turn, is attached to the pressureclamp. Shock rates and levels are easily reproducible'for a given bearing assembly. Figure 3 shows theattachment on some assemblies investigated.
2. Differences between samples of new bearings and thosedetermined as unserviceable and rejected for aircraftuse could be seen (Figure 4)
.
3. The general shape of the shock emission curve varieswith type and extent of damage. Figure 5 shows arti-ficially degraded bearings in comparison to data ob-tained from samples of new bearings. Although thecurves do not follow the SKF representation of Figure2, the increase in level over the new bearing data isevident
.
4. The rates and levels are speed dependent (Figure 6)
.
5. Although a damaged bearing could be discerned, it wasnot possible to localize the damage as to inner orouter race, rolling element, etc.
6. Laboratory readings of rate versus level differedfrom those of the same bearing assembly installed ona UH-IH helicopter. Thus, generalized damage assess-ment curves must be generated with the bearing in theactual operating environment (Figure 7).
In addition to the hanger bearing tests, SKF Industries,under subcontract to the College, investigated the abilityof the MEPA-lOA to detect gear-sourced shocks. The Collegeprovided technical assistance and monitored the performanceof the task. Three UH-1 42° gearboxes with several differ-ent types of gear damage were subjected to shock pulse moni-toring during runs at different loads and speeds. It wasdetemined that the MEPA lOA can supply warnings as to theonset of damage in a gearbox. If the damage originates inthe bearings, an indication directly correlated with damageis received. If the damage originates in the gears, theindication is obtained indirectly through the sensing ofparticulate contaminant passing through the bearings(Figure 8 )
.
525

UH-1 DATA
Hanger Bearings
Seventy-two hanger bearings as installed on UH-1 helicopterswere tested. The helicopters were made available on a non-interference basis by an Army Aviation unit stationed nearthe College. All tests were at N2 = 6600 rpm. Selectedhanger bearings were removed for teardown analysis. Theseinclude bearings with potentiometer levels from moderate tohigh. The teardown analysis was performed either by BellHelicopter Company or by the College. Defects, if they ex-isted, consisted primarily of pitting and corrosion varyingfrom slight to severe. Figure 9 shows the shock emissioncurve of a bearing with marginal level of damage. Figure 10illustrates the level of pitting and corrosion. Wherever ahanger bearing was removed for teardown analysis, readingswere taken on the new, or replacement, bearing. In eachcase, a marked reduction in rates and levels was noted.
The extensive hanger bearing data has been summarized in asingle damage-assessment shock emission curve (Figure 11)
.
Additional data was collected on hanger bearings installedon helicopters in the AIDAPS program at Fort Rucker. Thesehanger bearings were inspected and found acceptable prior totheir use in that program. In particular, the effect of en-gine rpm variation and anti-torque pedal (tail rotor) inputswere investigated. Although shock emission curves variedwith rpm as previously noted, pedal deflection gave an in-significant increase in potentiometer level.
42° Gear Box
Readings were taken on forty-two 42° gearbox drive quills.Nine gearboxes were removed for teardown analysis, eitherdue to high rates (rather than high levels) or due to exces-sive needle swing. Typical of the latter is given inFigure 12 wherein the rate would not stabilize at a fixedvalue but would vary between the limits shown. This swingcould be due to the multiple bearing and gear assembliespresent in the input and output quills. Teardown analysisdid indicate corrosion and pitting throughout the outputinner and outer ball, radial scratches in the output rollerbearing (Figure 13), as well as an output gear pattern toohigh and too far toward the toe, and pits on the input ball
and roller bearings.
Further data was collected on the AIDAPS helicopters atFort Rucker, Alabama, from gearboxes of known condition.
32h

Each gearbox was completely disassembled, inspected, andany necessary component replacement accomplished prior toreassembly and use in the program. This data included thatfrom an implanted input quill duplex bearing with knowndefects.
In one case, the outboard half of the duplex bearing had asingle spall in the outer race, 0.14" x 0.14", with a defi-nite depth; the inboard half had some corrosion-caused pit-ting with one pit in the ball's path. The increase in rateand level when compared to a damage-free gearbox is evidentfrom Figure 14
.
A second case, a duplex ball bearing with a single shallowspall approximately 0.08" x 0.08" in the outer race, gaveevidence of progressive damage while the test was in pro-gress. The shape of the shock emission curve changed con-tinually over a period of minutes in both rate and shocklevel. Figure 15 shows two curves developed on a singlerun. A change in slope takes place (A) , a sharp increase inrate (B-C) , a continual change in slope (C-D) . Withoutshutting down the engine, the second curve (E-F-G) was de-veloped. After engine shutdown, an oil sample analysis re-vealed traces of metal, although not beyond that consideredacceptable. The dotted line is an extrapolation of theinitial slope and gives an indication of the shock levelstabilizing at a factor of ten higher. Two more runs weremade which essentially repeated curve E-F-G. Teardownanalysis showed that the original degradation had notnoticeably changed but the new spalls were found on theouter race and on one ball bearing.
90^ Gearbox
Twelve 90° gearboxes were tested. Figure 16 is a scatterdiagram of shock emissions. Two assemblies indicate eithera higher rate or higher level than the average of thosetested. These are continuing to be monitored until replace-ment gearboxes are available. The curve labeled "damage-free" is taken from a gearbox of known condition installedon an AIDAPS helicopter. Figure 17 shows the shock emissionenvelope of a gearbox removed for teardown analysis. Thereason this particular one was chosen was because of thecontinually changing curve shape during the test run. Thisslope change could be indicative of progressive damage ormetal contaminants in the oil. Figure 18 shows the sharpburred edge spall in the outer race and spalling in theinner race of the small duplex bearing, as well as pittingand corrosion in the outer race of the duplex bearing.
525

Mast Bearing and Transmission
Figure 19 is a scatter diagram of nine different mastassemblies. The solid line, again, is from an AIDAPS heli-copter. The assembly chosen for teardown was the one ex-hibiting the high rate and level . The outer race hadscratches one centimeter in length, scuffs, false brinnel-ling, heat discoloration and corrosion. Several balls hadscratches and nicks and the inner race ring also hadscratches (Figure 20) .
After the new mast bearing was installed, the shock andrate levels of the replacement bearing were markedlyreduced . v
.
,
No transmission assemblies indicated any abnormal rates orlevels on readings taken from the input drive quill andtherefore, none were removed for teardown analysis.
Flight Tests
All the previous data was collected on ground runs. Aseries of tests were conducted to compare ground runs,hover-in-ground effect, low and high speed flight andautorotation conditions. All data collected was from theinput drive quill of the transmission. This component wasselected because of ease of accelerometer mounting and lackof necessity of any aircraft modifications. The variousflight conditions, and hence loadings, had negligibleeffect on the shape of the shock emission envelope.
SUMMARY
The SKF MEPA-lOA has shown its effectiveness and reliabilityas a bearing health analyzer in helicopter applications.The shock pulse technique has proven its value as a quickand accurate means to determine the general health of se-lected components on operational helicopters through themeans of the shock emission profile. When components weretested and reviewed in comparison with others of the sametype, it becomes apparent that the shock pulse technique canseparate assemblies by degrees of degradation and damage.However, it was not possible to localize the damage as tothe rolling elements, inner or outer race, gear teeth, etc.All of the damage as revealed by teardown analysis wascorrelatable to the data of the shock emission curves, thatis, moderate rates and/or levels indicated moderate de-gradation and high rates and/or levels indicated severedegradation
.
526

Although an off-the-shelf piece of commercial equipment, theMEPA-lOA did not have any malfunctions operating in fieldconditions. Ambient temperatures ranged from -30OC to 40°C.Accelerometers were exposed to exhaust gas temperatures inexcess of 200°C. Hov/ever, the present system of plottingthe shock emission data by hand and the necessary judgmentrequired to determine bearing health does not lend itselffor use by Army Aviation maintenance personnel . When afully automated system is available, the shock pulsetechnique will prove itself to be an effective tool inreducing aircraft maintenance costs.
ACKNOWLEDGEMENTS
The study was performed under contract to the United StatesArmy Aviation Systems Command (USAAVSCOF^. Parks Collegegratefully acknowledges the support and assistance of theUSAAVSCOM Flight Operations Division, Saint Louis, Missouri;Hawthorn Aviation, Fort Rucker, Alabama; Bell HelicopterCompany, Fort Worth, Texas; United States Army Flight TestBoard, Fort Rucker, Alabama; and the 102d USARFFAC
,
Cahokia, Illinois.
REFERENCES
^P.L. Howard, "Shock Pulse Instrumentation", Proceedings ofthe 14th Mechanical Failures Prevention Group Meeting, LosAngeles, California, Jan. 1971; MFPG Technical Report 2,Feb. 1971.
^T.C. Mayer, E.F. Covill, J. A. George, J.T. Harrington"Applications of the Shock Pulse Technique to HelicopterDiagnostics", USAAVSCOM Technical Report 75-18A,B, 1975.
527

528
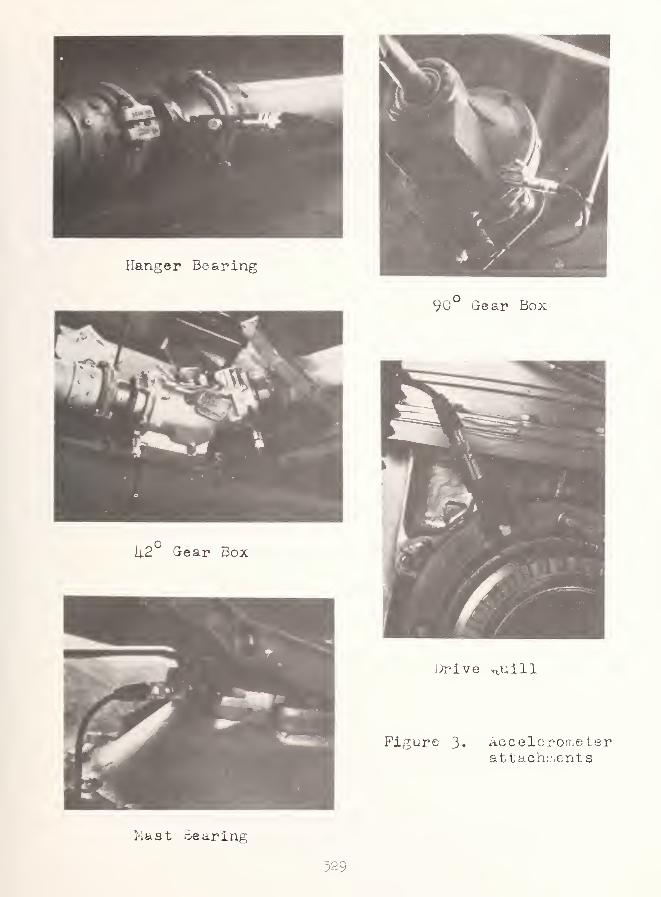
529

rate
10° 10' lo' lO' 10*"
level
Figure Comparison of new and daraaged bearingsin a laboratory environment,
1000 -1
rate
Figure 5« Scatter diagrara of new bearings versusartificially degraded bearings.
330

1000
1000 -
rato
100 -
10 -
10"
aircraft
laboratory
10' 10^
level
10- 10
Figure 7. Oomparison of hanger bearing shock emissionenvelope from aircraft and laboratory,
551

luuO
rate
luo
10
l\.2 Groarbox Test
10
Basel ineat lo,l\. hp,jt^GO rpm
10'
—TT10'
level
Daraaf^ed gearsat 13.25 hp,
^351-1-0 rprri
I
10 10"
Figure 8. Baseline versus damaged gears with parti-culate contaminant in the oil.
1000
rate
100
10 -
damaged bearing
level
Figure 9. Comparison of damaged and replacementhanger bearing.
552
/

Figure 10. Damaged hanger bearing removed fromUH -IH helicopter.
553

rate
1000 -
100 -
10 -
10° 10*I ,10"^
level
10*
Figure 11. UH -1 hanger bearing damage assessmentshock emission curve.
1000
rate
100 -
10 -
output quill
input quill
Figure 12, ;Shock pulse curve of 14.2 gearbox romovedfor teardown analysis. Lined areas indicatevariation in ouput readings.
33^

l\.2^ gearbox, output^ inner ball bearing with corrosiondamage on outer race.
i\.2^ gearbox, output, outer ball bearing with corrosionand pitting damage on outor race.
Figure 13. Damage seen in I4.2 gearbox removed fromo])erational helicopter.
355
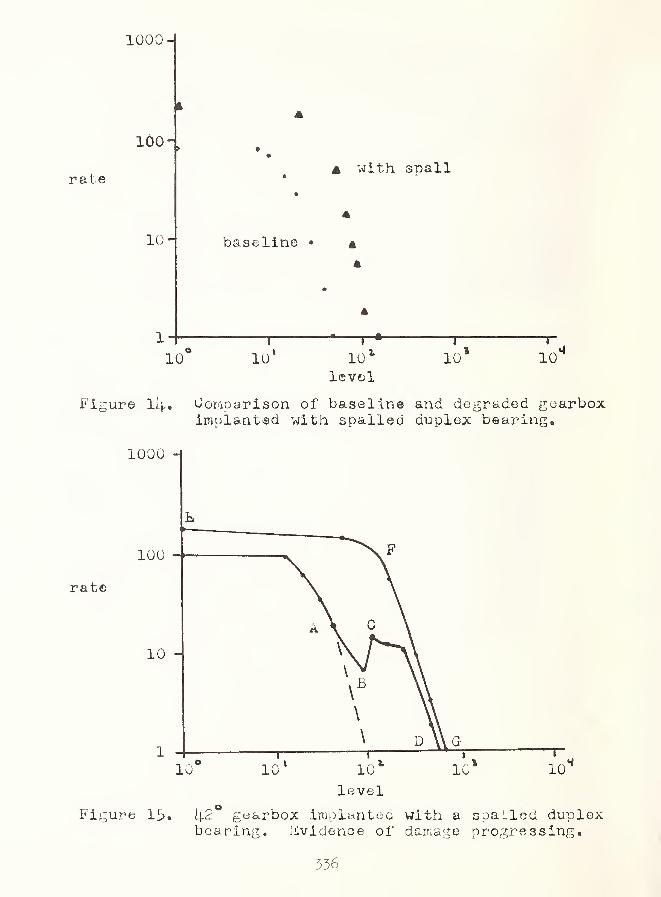
1000-1
ico-
rate
10-
A with ST)all
baseline •
10 10' 10^
level10 10
Figure OoMparison of baseline and degraded gearboximplant®d with spalled duplex bearing.
1000 H
100
rate
10 -
Figure 13. Ii2 gearbox init^iantea with a spailcd duplexbearing. iiividence of damage progressing.
536

1000 1
rate
level
Figure 17. Shock Ginission curve of 90** gearboxremoviid for teardown analysis.
537

small duplex bear-ing, outer raceivith. burred edgesoall
small duplex bear-ing, inner racewith spalls
duplex bearing,outer race withpitting andcorrosion
Figure l8. Damage seen in 90° gearbox rtiirioved fromoperational helicopter.
558'
- r
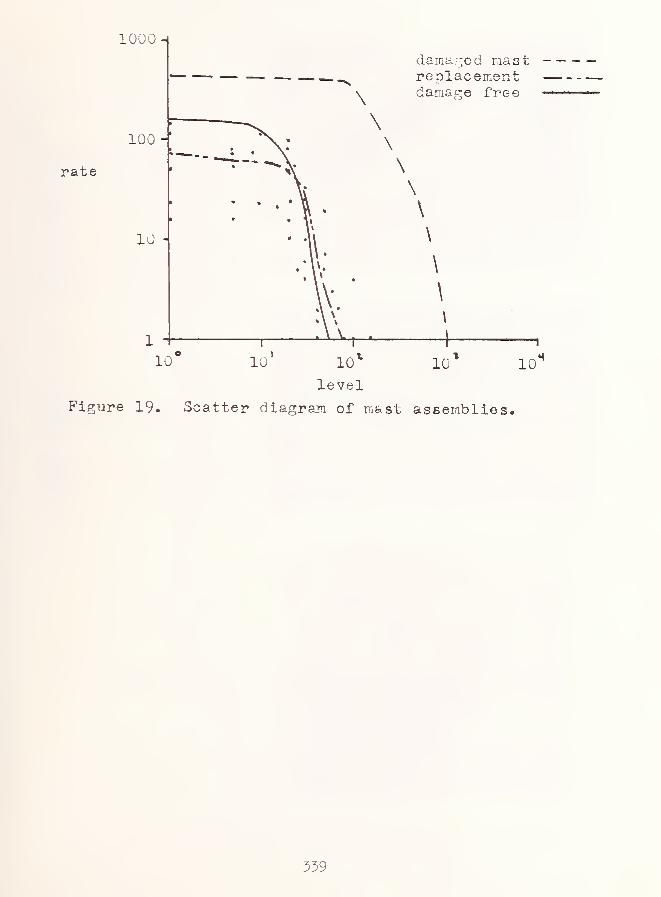
1000 H
rate
dama-:-cd nastreplacementdamai-^e free
100
10 -
10 lu' 10'
level
Figure 19. Scatter diagram of mast assemblies.
539

false brinellinc' onouter race of mastbearing
pitting on outerrace of mast bearing
scoring on balls ofmast bearing
I
20, Damage as seen on raast. bearing removedfrom operational helicopter,
5^0

criscussiON
R. Leni'ch, Caterpillar Tracior Company : Would the mechanic have
replaced all of the bearings that the shock pulse method indicated werebad if the shock pulse method had not been used?
J. A. George : All of these were good operational bearings as far as
the present inspection procedures indicate. But if these bearings weresent to overhaul, there would be components replaced. In other words,those that we said were good were indeed good, those that we said weremoderate would be replaced because the bearing was out, and those that
were severely damaged very definitely would be replaced.
J. L. Frarey, Shaker Research Corporation : Did you do enough work withthe speed dependence to determine if it is a linear or a squarerelationship. In other words, do you think you could build this in as
a correction factor for a variable speed machine?
J. A. George : We did not look at it directly. Offhand, I would saythey are not directly linear.
J. L. Frarey : How far away from the bearing could you get. In otherwords, could you do the 42 and the 90 in one central position if youdidn't care whether it was the input or the output?
J. A. George : If you are riding on the input side you could probablydetect eventual degradation on the output, but we have been riding asclose to the bearing as we can. On the 90 there is only one place wecan go - we are detecting both input and output.
5^1

LST 1179 DIESEL DIAGNOSTIC SYSTEM FEASIBILITY STUDY
*M.B. PetersonJ . FrareyD. DominyH. Hegner
H.C. Burnett
*Wear Sciences,, Inc. ,Scotia, New York 12302
Introduction
The Mechanical Failures Prevention Group has been requested by Mr. RayCoulombe of the Engineering Branch of NAVSEC to undertake a study todetermine the advantages to be gained by the Navy in the developmentand use of a propulsion condition monitoring system. In response tothis request a task force was formed by MFPG which is currently con-ducting such a study. This paper is a progress report on the resultsto date.
Task Force
The task force shown in Table I was selected by the Executive Committeeof MFPG to conduct the study. The selection was based upon the indivi-dual's background to perform the functions as shown in Table II. Inaddition, a committee of approximately 20 members of MFPG has beenselected to review the work of the task force so that the conclusionscan be said to represent the collected view of the MFPG.
Method of Operation
The advantages of a diagnostic system are quite well known to mostengineers who work in this field. However, one cannot assume thatthese advantages will necessarily result in a real cost saving wheninstalled. In fact, one could imagine that with a reliable, troublefree, well maintained engine there might be a cost penalty when onerequires a better "read out" on its condition. For this reason thetask force proposed to compare the relative costs involved of ships'
maintenance with and without a diagnostic system. The 1179 classLST was chosen by the Navy to use as an example.
To conduct this study, two areas of investigation were necessary.First, one must propose a diagnostic system and then determine the
accumulated costs of development, manufacture, installation andcheckout. This requires a knowledge of the engine parameters andmalfunctioning components to be measured. These, of course, mustlend themselves to practical realities of shipboard conditions andcompetence. Secondly, one must accumulate as accurately as possible

the total maintenance costs on the ship and the variety of malfunc-tions which make up these costs. The question of course to beanswered is which of these malfunctions and maintenance costs wouldhave been avoided if the proposed diagnostic system would have beeninstalled.
The work scope to accumulate the desired information is given inTable 2. The task force is now in its fourth month of operation.The purpose of this paper is to present the results on each of thetask items listed in Table 2 along with the conclusions to date.
Program
As a first step in the program, Mr. Dominy, who has had considerableexperience with this particular engine, made a list of all the enginecomponents and what in his experience generally go wrong with them.
He then proposed a list of measurements which would have to be takento diagnose malfunctions with these components. At this time thepracticality of the measurements was not given detailed considerationThe purpose of a diagnostic system is not only to diagnose componentmalfunctions but also to determine if the engine parameters arewithin the prescribed limits. This was also included in the list ofmeasurements which are shown in Table 3.
The information provided by Mr. Dominy was supplemented by data fromthe ship. First of all, a list of the measurements now taken on theship was made. These are the underlined quantities of Table 3.
It is immediately apparent that most of the measurements proposed arealready taken on the ship in one way or another. Thus, we are notreally proposing anything new, only a better way of collecting andpresenting the information.
In reality, only three new types of measures are needed:
ContaminationPositionVibration
As it turns out, these measurements are extremely important and willdiagnose the most troublesome malfunctions actually found on the LST1179s. Of course, one could look at this from another point ofview. Maybe these are the most troublesome components because suchmeasurements are not now commonly taken.
This list of proposed measures was supplied to Mr. Hegner who is
determining their feasibility and practicality for shipboard use.His main concern is with means of measuring the new parameters andthe cylinder pressures. Many of the diesel inspectors rely quiteheavily on this quantity.

A considerable amount of time was also devoted to accumulating ship-board maintenance experience that is used in determining what pro-pulsion system problems have been encountered in service and whatthese problems have cost the Navy. Information on the most commonproblems were accumulated from the following sources:
(1) Interviews with shipboard personnel(2) Diesel inspectors' reports
(3) Gibbs and Cocks Causality Report Review'
(4) Class maintenance problems
(5) 3M LST maintenance history
The 3M maintenance history was particularly valuable since it notonly allowed an independent problem review to be made but alsoprovided a means to determine the cost of each problem encountered.For exanple, an injector change- out costs $7,250 plus 7 labor hours.
Based upon the 3M system the total repair costs per ship for the pastfour years are shown in Table 4. This works out to an average of1000 hours and $14,000 materials costs per year. These numbers,although not excessive, seem rather high considering that these arebrand new engines only 2 to 4 years old which are not used veiy often.Furthermore, these are minimum costs since many of the materialcharges may not appear, being charged to another account.
In the 3M system, charges are allocated by system categories.Exanples are diesel engine, reduction gear, clutches and brakes,exhaust, fuel oil, water, etc. Each system is then broken down byequipment. Thus a complete review of the 3M system will yield thehigh cost systems and the high cost malfunctions. These are listedin Table 5. If the repair costs are to be reduced, the diagnosticsystem must be able to detect these faults.
The repair costs are only one item of the total maintenance costs.
Others include the planned or scheduled maintenance costs, shipyardcosts, overhaul costs, engineering costs associated with shipboardmaintenance and personnel costs as represented by the type commander,NAVSEC personnel, and NAVSEA. A review of these costs was alsomade. Unfortunately, this information is only available for the lasttwo years; however, it does give a rough estimate of the level.These data are given in Table 6.
Also shown in Table 6 is the hours devoted to engine watch apportionedto sea and shore. This is representative of the fact that there arefour men per engine room, three engine rooms, and three shifts ofeight hours each for a total of thirty- six men along with severalothers. This is based upon the actual "underway" watch bill of a
given ship.

The scheduled maintenance costs were acquired by collecting all themaintenance cards for the propulsion system and adding up the totalnumber of hours in the 3-year cycle. This number is also low sincemany of the maintenance cards say "as required". These hours werenot included.
The planning costs have not been estimated; however, these willprobably be small since only a few people are directly involved. Al-though a diagnostic system will greatly assist such people in planningshipyard maintenance it will probably not reduce their costs.
The overhaul costs are somewhat uncertain since only two ships havebeen overhauled to date. However, we may use the figure of $70,000per engine once every five years as a representative figure. Thisamounts to approximately $100,000 per year.
Evaluation
It is now necessary to ascertain what reduction in these costs wouldresult if a diagnostic system was available. Sufficient informationis now on hand to make a reasonable estimate; however, this willdepend upon the diagnostic system. Thus, final conclusions are notas yet available. Some conclusions, however, can be made.
First, it is obvious that if substantial savings are to be made, theywill have to come from "watch", scheduled maintenance, shipyard oroverhaul costs. So the following questions may be asked:
(1) Can the use of the proposed diagnostic system sub-stantially reduce the "watch" man hours?
(2) Can the use of the proposed diagnostic system eliminatea substantial number of scheduled maintenance items?
(3) Can early diagnosis of failures reduce the need for drydocking or reduce repair costs?
(4) Might it be possible to postpone overhaul with theproposed diagnostic system?
Of these questions the first appears to be the greatest source ofsaving. The diagnostic system is intended to do exactly the sametime as "watch". During "watch" the enginemen perform the followingtype tasks:
Watch engineTake readingsRun subsystems (purifier)Oil analysis samplesChange filtersSet controls
3^^
It can be seen that no repair or scheduled maintenance is performed.If it is only possible to reduce those hours by 1/2 and using thedirect labor rate of $3/hour, a saving of $87,000/ship or $1,740,000for the LSTs will result. A diagnostic system almost seems justifiedon this basis alone.
It should also be noted that the total man hours add up to 13 manhours/hour. The only way this can be accomplished is to have 39 menon board. These, of course, are not available and the scheduledmaintenance must be neglected. Thus, the diagnostic system wouldrelease men for more productive activities.
The advantages of a diagnostic system are not limited only to theabove cost savings. Other more intangible benefits relate to theadvantages of greater awareness of the ship's condition.
These are as follows:
(1) Type Commanders (LST maintenance) have been involvedwith the "day to day" ship repairs. With the re-
organization recently completed the type Commanders willonly be involved in shipyard work. This will requirethe ship's force to assume greater responsibility forthe planning and execution of repair work.
(2) In the past, repairs (RAV s/TAV s) were accomplishedwhen needed. A new system is now being instituted in
which ship repairs will be accumulated and accomplishedduring a prescribed period of time (once per year) .
•
With this system, greater planning will be necessary.
(3) Lead times on parts required for repair are becoming ex-
cessively long (for example, gears require 18 to 24
months for LST)
.
(4) The maintenance cycle has been increased from three yearsto five years.
(5) Engineers required to understand engine problems and to
prepare ship alterations rarely have sufficient infor-
mation as to the background of the problem. In addition,
it often is difficult to determine if a solution has beenobtained.
The task force has tried to remain objective in its study and has
also considered the disadvantages of introducing a diagnostic system.
These are listed as follows:
(1) Cost -
(2) Over reliance
As far as the costs are concerned it is not only the diagnosticsystem which must be considered but the costs to make it fully'operational.
The second disadvantage is that the ships force may become too re-
liant on the system. That is, no maintenance will be performed andlittle attention paid to the propulsion system unless the lights
flash. The ship must be capable of operating as an independent unitand close identification with the engine and its performance is
encouraged. To answer this criticism, experience ivith otherdiagnostic systems is being ascertained.
Diagnostic Systems Initial Consideration
Figure 1 is the initial simplified block diagram of a possiblediagnostic system for the propulsion system of a LST 1179 class vessel.
The system employs one minicomputer along with peripheral input/outputdevices. This portion of the system would be located in a central or
convenient location on the ship. Each engine room is considered an
independent entity and each is instrumented with the required trans-
ducers, signal conditioning equipment, multiplexing and data trans-
mitting equipment. It is presently proposed that this portion of the
system contain an A/D converter so that all data transmission is
accomplished digitally.
Several modes of system operation are to be considered. Certainmodes- -for exanple, alarm indication- -take priority over others. Atime- sharing software package is envisioned that will allow differentoperation modes to proceed seemingly simultaneously.
The requirements on the system are as follows:
(1) Continuously cycle through propulsion system measurementsand compare each measurement against engine limits. In the
event an out -of-limit condition exists, an alarm will be
sounded and backup details typed out on the typewriter.
(2) All parameters measured in 1 above associated with the
alarm will be continuously stored on the magnetic disc or
tape for analysis after shutdown.
(3) Once a day at preselected propulsion system power settings,
data will be converted to engineering units and compared
with the last previous stored data at this power setting.
The data will be stored if different. If not different,
the data will be discarded. Since the ship will not go
through all preselected power settings each day, different
amounts of data will be recorded, depending on operations.
5^7

(4) Data trends will be analyzed and degrading componentsidentified. Once the degraded component has been iden-tified, appropriate maintenance action will be typed outon the typewriter.
(5) Periodically, the system will provide the engineeringofficer a status report including data tabulations andplots.
(6) Periodically while in port, system provisions will allowthe copying of data for transmittal to the classmaintenance officer.
(7) Periodically, data will be inputted to the system such as
SOAP readings. These data will be stored and trendedalong with measured data.
(8) The system will allow the engineering officer to use thesystem as a preprogrammed or easily programmed micro-computer or programmable calculator.
The above system description is being used as a basis of review withsystem manufacturers to obtain initial hardware/software costs,
lliese costs will be evaluated against the benefits derived fromsystem installation.

Table I
Task Force
M. Peterson
H. C. BurnettD. DominyJ . FrareyH. Hegner
National Bureau of StandardsMechanical Technology, Inc.
Shaker Research Corp,General American Corp.
Wear Sciences, Inc.
Table II
Work Scope
Diagnostic Feasibility Program
Drive System ParametersCommon MalfunctionsMaintenance ExperienceSensor Measurem.entsDiagnostic System DesignSystem EffectivenessReport and Review
3U9

Table III
Propulsion System Measures
Ambient PressureAmbient TempRPMExhaust TempFiring PressureCylinder PressureTorsional VibrationFO Pump PressureFO HeaderTFQ Rack PositionFuel AnalysisShaft Run OutCoupling DisplacementPedestal TempClutch TempGOV Load PositionPropeller PitchGOV HO Pressure
Manifold TempManifold PressureTurbo Exhaust T"
Turbo VibrationTurbo LO PressureExhaust Smoke MeterWater in TWater Out TLO Pump P
LO Header PLO LevelLO Oil AnalysisGB Bearing TempGB LO Pressur*e
~
GB LO TempGB Bearing PositionGland TempContamination
550

Table IV
LST 1179 Ship Repair Costs
3M System
I^n Hoursbnip Commissioned Repair Material Costs
ll/y 9/69 52,913lloU 4109 T M A 1 A39,4141181 8/70 O P 7 "7
2533 63, 682
118Z iz/oy 3936 51 , /zl
llo3 0/ /U 6919 /9 , 139
1184 3450 154, 236118b 0/ /U 714Q 106, 26
/
118o 4167 r £Z All56 , 417
1 1 R7 1 r\/ir\-LU/ / u 18/11 Ql 81
1188 2/71 2994 56,7721189 4/71 5217 108,6421190 6/71 4601 48,4021191 7/71 3252 45,3641192 9/71 1625 35,6871193 11/71 1668 34,0471194 1/72 2847 24,7661195 3/72 2189 44,7881196 5/72 1715 10,2521197 5/72 1791 12,5961198 9/72 5467 18,042
551

Table V
LST 1179
Common Malfunctions
Operational LimitsHead, ValvesInjectors, Pumps, etc.
Salt Water PumpsTurbochargerAir Start MotorGovernorPistonsFluid Contamination
Clutch and BrakeCPP PumpsGland SealsAccessory Drive GearsFuel Oil PumpCPP GearsLinear CorrosionExhaust LeaksGear LO Pumps
552
- /

Table VI
Costs Per Year Per Ship
Man Hours Materials
Watch Sea 42,000Shore 16,430
Repair 1,000 $ 14,000Scheduled Maintenance 50,448 —Shipyard 32 , 380Overhaul --- 100,000Engineering 5 4,000Planning Ty Com — —
NAVSEA
353

c,o
ooo
3Q.
Eoo
EooQ:
5»c
(U
-p
ooo-p
o•H-POOJ
a<=!
oo
oo
0)
sd
•H
(D
o
O
03
M03
•HO
oo
m
H(U
•H
35^

DISCUSSION
R. A. Coulombe, U.S. Naval Ship Engineering Center : The second phaseof this work will be a pilot program on a selected ship and theprogress report indicates to me that this is going to be justified.
355

MECHANICAL FAILURES PREVENTION GROUP
22nd MEETING
Detection, Diagnosis and Prp-gnosis
List of Registrants
Robert W. AdamsonCal . Polytechnic State UniversityM, E. DepartmentSan Luis Obispo, California 93407
H. C. BurnettNational Bureau of StandardsMetallurgy DivisionWashington, DC 20234
Leslie H. AdkinsTMDE Product Management OfficeUSAMMC, Attn: AMXMD-TRLexington, Kentucky 40503
Roger D. BaggenstossTRW Systems Group1 Spruce Park, M2-2175Redondo Beach, California 90277
Bruce C. Baird, Sr.
BoeingP. 0. Box 58747Houston, Texas 77058
R. H. BarberSolar, Div. of InternationalHarvester Company
2200 Pacific HighwayP. 0. Box 80966San Diego, California 92138
Dr. J. S. BendatIndependent Consultant833 Moraga DriveLos Angeles, California 90049
David B. BoardBoeing Vertol Company716 Peachtree RoadClaymont, Delaware 19703
J. E. BorhaugPretech, Inc.
3305 Vincent RoadPleasant Hill, California 94523
Hans U. Burri
RCA Corporation, Non-ElectronicTest Engineering
M. S. 8-3
Box 588Burlington, Massachusetts 01803
Colby E. BuzzellGeneral Electric Company50 Fordham RoadWilmington, Massachusetts 01887
Bruce E. CarverPacific Fruit Express Company116 New Montgomery Street, Rm. 529
San Francisco, California 94105
F. K. ChinGeneral American Research Div./GATX7449 N. Natchez AvenueNiles, Illinois 60648
Dr. J. M. ChudobiakUniversity of SasketchewanSasketoon, SaskatchewanS7N OWO Canada
Henry A. Cole, Jr.
Randomdec Computers84 Alvarado AvenueLos Altos, California 94022
Kenneth CollingeAvco Lycoming550 Main StreetStratford, Connecticut 06497
356
0. E. ComptonORGN 3423/32Northrop Corp., Aircraft Division3901 W. BroadwayHawthorne, California 90250
D. CostabileGfficer-In-Charge (Code 862)
FMSAEG/NWS, Seal Beach
Attn: GIDEP Operations CenterSETE/ Library
Corona, California 91720
Raymond A. CoulombeU. S. Navy Department1430 Ruatan StreetAdelphi, Maryland 20783
Edward F. CovillParks College of St. Louis Univ.
Cahokia, Illinois 62206
Frank CrapottaOfficer-In-Charge (Code 862)FMSAEG/NWS, Seal BeachAttn: GIDEP Operations Center
SETE/ProjectCorona, California 91720
V. F. CremoneseHughes HelicoptersCentinella & TealeCulver City, California 90230
C. L. DeanSolar, Div. of International
Harvester Company2200 Pacific HighwayP. 0. Box 80966San Diego, California 92138
George E. deLongNaval Air Systems CommandRepresentative Pacific, N.A.S.NISan Diego, California 92135
Dwight L. DennisU. S. Navy (Naval Weapons Center)
531 Q NimitzChina Lake, California 93555
Don D' IntinoNaval Air Engineering CenterLakehurst, New Jersey 08733
D. DominyMechanical Technology, Inc.
Latham, New York 12110
Max DowEastern AirlinesMiami, Florida 33159
Earl DuBackGeneral Dynamics, Electric BoatEastern Point RoadGroton, Connecticut 06340
^ B. E. Duff' Fruit Growers Express & Western
Fruit Express Company16 Roth StreetAlexandria, Virginia 22314
Harold DuneganEndevco CorporationRancho Viejo RoadSan Juan Capistrano, Calif. 92675
John H. DunmoreTechnical MarketingTurbo Research, Inc.
1440 Phoenixville Pike
West Chester, Pennsylvania 19380
John DziubaEastern AirlinesMIA International AirportMiami, Florida 33159
Bob EisenmannEndevco5625 FM 1960 West-Suite 513
Houston, Texas 77068
L. H. EmeryDepartment of TransportationNational Highway Traffic SafetyAdministration
Washington, DC 20590
557

Loren EnochsonTime/Data Corporation1050 E. Meadow CirclePalo Alto, California 94303
Howard E. FinemanRCA Corporation, Non-Electronic
Test EngineeringM. S. 8-3
Box 588Burlington, Massachusetts 01803
Paul FlemingNational Bureau of StandardsMetallurgy DivisionWashington, DC 20234
R. E. FordPratt & Whitney AircraftP. 0. Box 2691
West Palm Beach, Florida 33402
Jerry W. ForestOntario Hydro800 Kipling AvenueToronto, OntarioM8Z 5S4 Canada
J. L. FrareyShaker Research CorporationNorthway 10 Executive ParkBallston Lake, New York 12019
Dwayne N. FryOak Ridge National LaboratoryP. 0. Box X, Bldg. 3500Oak Ridge, Tennessee 37830
Charles R. GarbettShell Development CompanyP. 0. Box 481
Houston, Texas 77001
B. K. GenettiGeneral Electric175 Curtner AvenueSan Jose, California 95125
John A. GeorgeParks College of St. Louis Univ.Cahokia, Illinois 62202
Louis GrecoU. S. NavyNaval Air Engineering CenterLakehurst, New Jersey 08733
George B. GrimCaterpillar Tractor CompanyTechnical Center, Bldg. A,
Research DepartmentPeoria, Illinois 61629
A. HalfacreUnited Aircraft of CanadaP. 0. Box 10
Longueui 1 , QuebecCanada
R. L. HammExperimental Project EngineerMechanical Technology, Inc.
Latham, New York 12110
Tom HarringtonThe Franklin Institute Research
Laboratory20th & ParkwayPhiladelphia, Pennsylvania 19103
Henry R. HegnerGeneral American Transportation
CorporationResearch Division7449 North Natchez Avenue
Niles, Illinois 60648
Charles L. HeizmanTime/Data Corporation1050 E. Meadow CirclePalo Alto, California 94303
Andrew J. Hess
Naval Air Test CenterPatuxent River, Maryland 20670
558

James L. HigginsEndevco30700 Rancho ViejoSan Juan Capistrano, Calif. 92672
G. William HoggU. S. Army Air Mobility Research &
Development LaboratoryFt. Eustis, Virginia 23604
R. HohenbergMechanical Technology, Inc.
968 Albany Shaker RoadLatham, New York 12110
Mike HoobchaakNaval Sea Systems Command6312 Alamo StreetSpringfield, Virginia 22150
Chris E. HortenNaval Ship Engineering Center
(Sec. 6107C6)Center Bldg., Prince Georges CenterHyattsville, Maryland 20782
J. R. HoughtonTennessee State University1808 Ashwood AvenueNashville, Tennessee 37212
Dr. Donald R. HouserOhio State University206 West 18th AvenueColumbus, Ohio 43210
Paul L. HowardSKF Industries, Inc.
1100 First AvenueKing of Prussia, Pennsylvania19380
Ralph JamesExxon Chemical CompanyBaytown, Texas 77520
Marvin JasperTeledyne Controls200 N. Aviation BoulevardEl Segundo, California 90245
Andre JaudetElectricite de France - Service Map17 Avenue du General de Gaulle92 Clamart, France
James D. JohnsonPRD Electronics6801 Jericho TurnpikeSyosset, New York 11791 .
Frank C. JonesHTL K West9371 Kramer AvenueWestminster, California 92683
William J. Kelly
Hughes HelicoptersCentinela Avenue at Teale StreetCulver City, California 90230
H. M. KieferShell Oil CompanyP. 0. Box 3105
1100 Milam BuildingHouston, Texas 77058
Jerry Koons, MechanicFederated Department StoresHangar 28, 422 Wilmer AvenueLunken AirportCincinnati, Ohio 45226
Joseph Kukel
Garrett Corporation30605 Rue LangloisRancho Palos Verdes, California90274
R. S. Kulp
Pratt & Whitney AircraftP. 0. Box 2691
West Palm Beach, Florida 33402
Robert W. LancasterBradford Computers and Systems,
Inc.
Rockville, Maryland 20850
359

G. L. LeadleyResearch MetallurgistAssociation of American Railroads3140 S. Federal StreetChicago, Illinois 60616 >
R. LemchCaterpillar Tractor Company100 N. E. Adams StreetPeoria, Illinois 61734
Frederick- F. LingMechanics DivisionRensselaer Polytechnic InstituteTroy, New York 12181
D. W. LongPacific Fruit Express Company116 New Montgomery StreetSan Francisco, California 94105
M. LourencoNational Highway Traffic SafetyAdministration
Department of TransportationWashington, DC 20590
Dominick P, LubranoU. S. Army, Commander,
Eustis DirectorateSAVDL-EU-MORFt. Eustis, Virginia 23604
Jaroslaw B. LuciwBaird Atomic, Inc.
125 Middlesex TPKBedford, Massachusetts 01730
Dr. J. MarrsTektronix, IncorporatedP. 0. Box 500
Beaverton, Oregon 97077
Marvin P. MarshVibration Instruments Company1614 Orangethorpe WayAnaheim, California 92801
William K. MathisonPuget Sound Naval ShipyardRoute 1 , Box 396
Port Orchard, Washington 98366
T. C, MayerParks CollegeCahokia, Illinois 62206
Wil 1 iam L. McCarthyM.M.O.E.S.731 Middleneck RoadGreat Neck, New York 11023
R. F. McKeePacific Fruit Express Company116 New Montgomery StreetSan Francisco, California 94105
Harry McNeillNuclear Regulatory CommissionWashington, DC 20555
William R. McWhirter, Jr.
Naval Ship Research and DevelopmentCenter
Code 2762, 3B, Fluid Systems BranchAnnapolis, Maryland 21402
L. D. MeyerGeneral Electric CompanyP. 0. Box 43Building 37, Room 680Schenectady, New York 12301
Richard S. MillerOffice of Naval ResearchArlington, Virginia 22217
John MinerPratt & Whitney Aircraft400 Main StreetE. Hartford, Connecticut 06108
Ray MisialekNAVSEC, Philadelphia DivisionPhiladelphia, Pennsylvania 19112
360

Douglas J, MurrayPacific Fruit Express Company116 New Montgomery StreetSan Francisco, California 94105
Prof. Douglas MusterUniversity of HoustonDepartment of Mechanical
EngineeringHouston, Texas 77004
Allen NaipoTeledyne Controls200 N. Aviation BoulevardEl Segundo, California 90245
W. Neal
Boeing CompanyP. 0. Box 58747Houston, Texas 77058
H. 0. Northern, Dept. 5876 S6
Detroit Diesel Allison Div., GMCP. 0. Box 894Indianapolis, Indiana 46206
John K. O'ConnorConsumer Product Safety CommissionOffice of Product Defe-ct
Identification5401 Westbard Avenue, Room 200Washington, DC 20207
Dennis M. O'DeaExxon Research & Engineering Co.
P. 0. Box 101
Florham Park, New Jersey 07932
Charles C. OlsefskyHughes HelicoptersCulver City, California 90230
David H. PageCP Rail
Room 1000, Windsor StationMontreal, QuebecCanada
G. L. ParkerNational High Traffic SafetyAdministration
Office of Vehicle Safety ResearchWashington, DC 20590
E. PassagliaNational Bureau of StandardsChief, Metallurgy DivisionWashington, DC 20234
Marshall B. PetersonWear Sciences, Inc.
32 Sutherland DriveScotia, New York 12302
Gerald J. PhilipsNaval Ship Research and Development
CenterAnnapolis, Maryland 21402
Glen A. PhillipsRORCC Mechanics Subcommittee,
Santa Fe Railway CompanyMotive Power BuildingCrane and Branner StreetsTopeka, Kansas 66616
Stan Pinel
Industrial Tectonics, Inc.
18301 Santa Fe
Compton, California 90221
James F. Primm, II
Atchison, Topeka & Santa Fe
Rai Iway1001 E. Crane StreetTopeka, Kansas 66616
W. P. QuinnMcDonnell Douglas Aircraft Co.
3855 Lakewood Boulevard41-55, Department Cl-270Flight & Laboratory DepartmentLong Beach, California 90846
Wi n iam ReberExxon Chemical Company, Inc.
Baytown, Texas 77520
561

Alfred C. RenzPRD Electronics, Inc.
1200 Prospect AvenueWestbury, New York 11590
Stanton W. RossFluor Engineers & Const.
3320 East La PalmaAnaheim, California 92806
Richard J. Salvinski 01/1261TRW Systems GroupOne Space ParkRedondo Beach, California 90277
Maurice V. ScherbConsultantBox 1055Beverly Hills, ^California 90213
F. H. SchlerethElectronics LaboratoryGeneral Electric CompanySyracuse, New York 13201
Donald B. SchneiderVibro-Meter Corporation22109 South Vermo?ft AvenueTorrance, California 90502
David N. SchuhBeta Machinery Analysis, Ltd.
R. R. 4
Calgary, AlbertaT2M 4L4 Canada
Uri SelaExxon Company, U.S.A.
3400 East 2nd StreetBenicia, California 94510
P. B. SenholziDepartment of the NavyNaval Air Engineering CenterGround Support Equipment Dept.
Lakehurst, New Jersey 08733
T. R. ShivesNational Bureau of StandardsMetallurgy DivisionWashington, DC 20234
Norman L. ShuteAnalysts, Inc.
P. 0. Box 2206Rolling Hills, California 90274
Herbert B. SingerCharles S. Draper Laboratory68 Albany StreetCambridge, Massachusetts 02139
Henry G. SmithConsultant for Hughes Helicopter^201 S. Francisca #1
Redondo Beach, California 90277
K. A. SmithGeneral Electric CompanyP. 0. Box 43Building 37, Room 680Schenectady, New York 12301
R. L. SmithShaker Research CorporationNorthway 10 Executive ParkBallston Lake, New York 12019
Cdr. M. E. SouthgateBritish Defence Staff WashingtonBritish Embassy3100 Massachusetts Avenue, NW
Washington, DC 20008
Robert Stenberg
U. S. Army, AVSCOM12th & Spruce StreetSt. Louis, Missouri 63166
James W. StrosniderVibro-Meter Corporation22109 South Vermont AvenueTorrance, California 90502
562

T. Suzuki
Nippon Steel, U.S.A., Inc.
611 W. 6th Street, Suite 1320
Los Angeles, California 90017
William H. TaitDom. FoundriesP. 0. Box 460Hamilton, OntarioCanada
Paul M. TanimotoFAA-Western15000 Aviation BoulevardHawthorne, California 90250
Dr. Thomas TauberTedeco24 E. Glenolden AvenueGlenolden, Pennsylvania 19050
Kenneth R. ThomasDeere & Company Technical Center3300 River DriveMoline, Illinois 61265
R. P. WallaceRaytheon CompanyP. 0. Box 360
Portsmouth, Rhode Island 02871
Robert J. WattsUSA Tank Automotive CommandAttn: AMSTA-MVCWarren, Michigan 48090
Lyle WellsVibration Instruments Company1614 Orangethorpe WayAnaheim, California 92801
Dr. R. L. WessonU. S. Geological SurveyMenlo Park, California 94025
Robert M. WhittierEndevcoRancho Viejo RoadSan Juan Capistrano, Calif. 92675
M. WildmanAmpex Corporation401 BroadwayRedwood City, California 94063
Robert E. WilsonSacramento City CollegeAeronautics Department3835 Freeport BoulevardSacramento, California 95822
Dan WoodwardTime/Data Corporation1050 E. Meadow CirclePalo Alto, California 94303
James WrightHughes Aircraft CompanyBuilding 117, Stop 5
P. 0. Box 90515Los Angeles, California 90009
D. E. WulfhorstCummins Engine Company1000 5th StreetColumbus, Indiana 47201
363


TimeWasWhenBieigyWasCheaper
...but that's all changed now.Today, increased energy costs—caused by in-
creasing demand—boost the price of consumergoods, fuel inflation, and hurt our balance of
payments.
That's why conserving energy Is a must today,
especially for you in the business and industry
community which uses two thirds of our nation's
energy.
Now . . . there's a book to tell you how to do
it. It's called EPIC—the Energy Conservation
Program Guide for Industry and Comnnerce. Pre-
pared for you by the Commerce Department's
National Bureau of Standards in cooperation
with the Federal Energy Administration.
EPIC is a comprehensive handbook that can
help you establish or improve an energy con-
servation program in your organization.
Not only industry and commerce but also hos-
pitals, universities, research institutes, ANY or-
ganization that uses energy—and has to pay
the bills—will want a copy of EPIC.
EPIC outlines in detail the steps in setting upan energy conservation program.
It contains a checklist of more than 200 Energy
Conservation Opportunities—suggestions to save
U.S. DEPARTMENT OF COMMERCE / National Bureau of Standards
FEDERAL ENERGY ADMINISTRATION / Conservation and Environment
energy in a dozen different areas.
EPIC'S actual case histories of energy saving
actions help you estimate your potential for
saving energy—and reducing costs.
And EPIC contains much more—financial analy-
sis procedures to evaluate projects, sources of
information on energy conservation, engineering
data and factors, an energy conservation bib-
liography.
Make EPIC part of your plan to control energy
use and costs. Make EPIC part of your contri-
bution to using energy resources wisely ... so
we can keep America working and growing.
To order your copy of EPIC, send $2.90 per
copy (check, money order or Superintendent of
Documents Coupons) to Super-
intendent of Documents, U.S.
Government Printing Office,
Washington, D.C. 20402.
Ask for NBS Handbook
115, EPIC, 013.11:115.
Discount of 25% on
orders of 100 copies or more.
UERGT CDMSERVATION

U.S. DEPT. OF COMM.BIBLIOGRAPHIC DATA
SH E FT
1. PUBLICATION OR REPORT NO. 2. Gov't AccessionNo.
3. Recipient's Accession No.
4. TITLE AND SUBTITLE
Detection, Diagnosis and Prognosis--Proceedings of the22nd Meeting of the Mechanical Failures Prevention Group
5. Publication Date
December 19756. Performing Organization Code
i.mxmm editors .
T. Robert Shives and William A. Willard8. Performing Organ. Report No.
9. PERFORMING ORGANIZATION NAME AND ADDRESS
nAIIUnALDUrvCAUUrolAiNUAKUjDEPARTMENT OF COMMERCEWASHINGTON, D.C. 20234
10. Project/Task/Work Unit No.
11. Contract/Grant No.
12. Sponsoring Organization Name and Complete Address (Street, City. State, ZIP)
Office of Naval Research, Dept. of the Navy, Arlington, VA 222NASA, Goddard Space Flight Center, Greenbelt, MD 20771Frankford Arsenal, U.S. Army, Philadelphia, PA 19137FAA, Dept. of Transportation, Washington, D. C. 20591
13. Type of Report & Period
1^.-,Covered
14. Sponsoring Agency Code
15. SUPPLEMENTARY NOTES
Library of Congress Catalog Card. Number: 75- 61936516. ABSTRACT (A 200-word or less [actual summary of most si^ilicant information. If document includes a significant
bibliography or literature survey, mention it here.)
These Proceedings consist of a group of nineteen submitted papers and discussionsfrom the 22nd meeting of the Mechanical Failures Prevention Group which was held
at the Grand Hotel in Anaheim, California on April 23-25, 1975. Failure detection,diagnosis, and prognosis represent the central theme of the Proceedings.Technology and techniques, ongoing diagnostic programs, and coming requirementsin the field of DD&P are discussed. In addition, several case histories arepresented.
17. KEY WORDS (six to twelve entries; alphabetical order; capital! ze only the first letter of the first key word unless a proper
name; separated by semicolons
)
Diagnostic case histories; diagnostic systems; failure detection; failurediagnosis; failure prevention; failure prognosis
18. AVAILABILITY [xZ Unlimited 19. SECURITY CLASS(THIS REPORT)
21. NO. OF PAGES
1For Official Distribution. Do Not Release to NTIS
UNCLASSIFIED 366
1
X Order From Sup. of Doc, U.S. Government Printing OfficeWashington, D.C. 20402. SD Cat. No. C13 . 10:436
20. SECURITY CLASS(THIS PAGE)
22. Price
1Order From National Technical Information Service (NTIS)Springfield, Virginia 22151 UNCLASSIFIED
^4 . 2 5
USCOMM-DC 29042-P74

NBS TECHNICAL PUBLICATIONS
PERIODICALS
JOURNAL OF RESEARCH reports National Bureau
of Standards research and development in physics,
mathematics, and chemistry. It is published in two sec-
tions, available separately:
• Physics and Chemistry (Section A)
Papers of interest primarily to scientists working in
these fields. This section covers a broad range of physi-
cal and chemical research, with major emphasis on
standards of physical measurement, fundamental con-
stants, and properties of matter. Issued six times a
year. Annual subscription: Domestic, $17.00; Foreign,
$21.25.
• Mathematical Sciences (Section B)
Studies and compilations designed mainly for the math-
ematician and theoretical physicist. Topics in mathe-
matical statistics, theory of experiment design, numeri-
cal analysis, theoretical physics and chemistry, logical
design and programming of computers and computer
systems. Short numerical tables. Issued quarterly. An-
nual subscription: Domestic, $9.00; Foreign, $11.25.
DIMENSIONS/NBS (formerly Technical News Bul-
letin)—This monthly magazine is published to inform
scientists, engineers, businessmen, industry, teachers,
students, and consumers of the latest advances in
science and technology, with, primary emphasis on the
work at NBS. The magazine highlights and reviews such
issues as energy research, fire protection, building tech-
nology, metric conversion, pollution abatement, health
and safety, and consumer product performance. In addi-
tion, it reports the results of Bureau programs in
measurement standards and techniques, properties of
matter and materials, engineering standards and serv-
ices, instrumentation, and automatic data processing.
Annual subscription: Domestic, $9.45; Foreign, $11.85.
NONPERIODICALS
Monographs—Major contributions to the technical liter-
ature on various subjects related to the Bureau's scien-
tific and technical activities.
Handbooks—Recommended codes of engineering and
industrial practice (including safety codes) developed
in cooperation with interested industries, professional
organizations, and regulatory bodies.
Special Publications—Include proceedings of confer-
ences sponsored by NBS, NBS annual reports, and other
special publications appropriate to this grouping such
as wall charts, pocket cards, and bibliographies.
Applied Mathematics Series—Mathematical tables,
manuals, and studies of special interest to physicists,
engineers, chemists, biologists, mathematicians, com-
puter programmers, and others engaged in scientific
and technical work.
National Standard Reference Data Series—Provides
quantitative data on the physical and chemical proper-
ties of materials, compiled from the world's literature
and critically evaluated. Developed under a world-wide
program coordinated by NBS. Progralin under authority
of National Standard Data Act (Public Law 90-396).
NOTE: At present the principal publication outlet for
these data is the Journal of Physical and Chemical
Reference Data (JPCRD) published quarterly for NBSby the American Chemical Society (ACS) and the Amer-
ican Institute of Physics (AIP). Subscriptions, reprints,
and supplements available from ACS, 1155 Sixteenth
St. N. W., Wash. D. C. 20056.
Building Science Series—Disseminates technical infor-
mation developed at the Bureau on building materials,
components, systems, and whole structures. The series
presents research results, test methods, and perform-
ance criteria related to the structural and environmen-
tal functions and the durability and safety character-
istics of building elem.ents and systems.
Technical Notes—Studies or reports which are complete
in themselves but restrictive in their treatment of a
subject. Analogous to monographs but not so compre-
hensive in scope or definitive in treatment of the sub-
ject area. Often serve as a vehicle for final reports of
work performed at NBS under the sponsorship of other
government agencies.
Voluntary Product Standards—Developed under pro-
cedures published by the Department of Commerce in
Part 10, Title 15, of the Code of Federal Regulations.
The purpose of the standards is to establish nationally
recognized requirements for products, and to provide
all concerned interests with a basis for common under-
standing of the characteristics of the products. NBSadministers this program as a supplement to the activi-
ties of the private sector standardizing organizations.
Federal Information Processing Standards Publications
(FIPS PUBS)—Publications in this series collectively
constitute the Federal Information Processing Stand-
ards Register. Register serves as the official source of
information in the Federal Government regarding stand-
ards issued by NBS pursuant to the Federal Property
and Administrative Services Act of 1949 as amended.
Public Law 89-306 (79 Stat. 1127), and as implemented
by Executive Order 11717 (38 FR 12315, dated May 11,
1973) and Part 6 of Title 15 CFR (Code of Federal
Regulations).
Consumer Information Series—Practical information,
based on NBS research and experience, covering areas
of interest to the consumer. Easily understandable
language and illustrations provide useful background
knowledge for shopping in today's technological
marketplace.
NBS Interagency Reports (NBSIR)—A special series of
interim or final reports on work performed by NBS for
outside sponsors (both government and non-govern-
ment). In general, initial distribution is handled by the
sponsor; public distribution is by the National Technical
Information Service (Springfield, Va. 22161) in paper
copy or microfiche form.
Order NBS publications (except NBSIR's and Biblio-
graphic Subscription Services) from: Superintendent of
Documents, Government Printing Office, Washington,
D.C. 20402.
BIBLIOGRAPHIC SUBSCRIPTION SERVICES
The following current-awareness and literature-survey
bibliographies are issued periodically by the Bureau:
Cryogenic Data Center Current Awareness Service
A literature survey issued biweekly. Annual sub-
scription: Domestic, $20.00; foreign, $25.00.
Liquefied Natural Gas. A literature survey issued quar-
terly. Annual subscription: $20.00.
Supercondncting Devices and Materials. A literature
survey issued quarterly. Annual subscription: $20.00.
Send subscription orders and remittances for the pre-
ceding bibliographic services to National Technical
Information Service, Springfield, Va. 22161.
Electromagnetic Metrology Current Awareness Service
Issued monthly. Annual subscription: $24.00. Send
subscription order and remittance to Electromagnetics
Division, National Bureau of Standards, Boulder,
Colo. 80302.

U.S. DEPARTMENT OF COMMERCElUationai Bureau of StandardsWashington. D.C. 20234
OFFICIAL BUSINESS
Penalty for Private Use. S30Q
POSTAGE AND FEES PAIDU.S. DEPARTMENT OF COMMERCE
COM-215
SPECIAL FOURTH-CLASS RATEBOOK