Incidence and prognosis of liver metastasis at diagnosis
41
Am J Cancer Res 2020;10(5):1477-1517 www.ajcr.us /ISSN:2156-6976/ajcr0111777 Original Article Incidence and prognosis of liver metastasis at diagnosis: a pan-cancer population-based study Shuncong Wang 1 , Yuanbo Feng 1 , Johan Swinnen 1 , Raymond Oyen 1 , Yue Li 2 , Yicheng Ni 1 1 KU Leuven, Campus Gasthuisberg, Faculty of Medicine, Leuven 3000, Belgium; 2 Shanghai Key Laboratory of Molecular Imaging, Shanghai University of Medicine and Health Sciences, Shanghai 201318, China Received April 1, 2020; Accepted April 9, 2020; Epub May 1, 2020; Published May 15, 2020 Abstract: Metastasis is a major cause of cancer-related death and liver metastasis (LM) is a distinct type for its relatively good prognosis after timely treatment for selected patients. However, a generalizable estimation of inci- dence and prognosis of LM is lacking. Cancer patients with known LM status in the Surveillance, Epidemiology and End Results database were enrolled in the present study. The incidence and prognosis of LM were calculated by primary cancer type and clinicopathological factors. Among 1,630,725 cases, 105,329 (6.46%) cases present LM at diagnosis, with a median survival of 4 months. LM presents at diagnosis in 39.96% of pancreatic cancer, 16.00% of colorectal cancer (CRC) and 12.68% of lung cancer. Of all LM cases, 25.58% originated from lung cancer, with 24.76% from CRC and 17.55% from pancreatic cancer. LM originated from small intestine cancer shows the best prognosis (median survival: 30 months), followed by testis cancer (25 months) and breast cancer (15 months). Subgroup analyses demonstrated disparities in incidence and prognosis of LM, with higher incidence and poorer prognosis in the older population, African American, male, and patients with inferior socioeconomic status. The current study provides a generalizable data resource for the epidemiology of LM, which may help tailor screening protocol, design clinical trials and estimate disease burden. Keywords: Metastasis, liver, SEER, epidemiology Introduction Cancer represents a major cause of death, with estimated 1,762,450 new cases and 606,880 cancer-related death in the USA in 2019 [1]. Metastasis is one of the hallmarks of malignant tumor, and it can be accountable for approximately 90% of cancer-related death [2]. It is generally associated with dismal prog- nosis due to high tumor burden, treatment resistance and impaired organ function. Brain, lung, liver and bone are the most frequent met- astatic sites, with different types of cancer showing different propensities to spread to par- ticular organs or tissues at a rate that is higher than purely statistical chance, namely organot- ropism [3]. Liver, which receives dual blood supplies from hepatic artery and portal vein, is the most commonly metastasized organ for gastrointes- tinal cancer, based on the “mechanical or hemodynamic hypothesis” [4]. Besides the symptoms caused by primary cancer, patients with liver metastasis (LM) may present with hepatomegaly, jaundice and ascites [5]. The presence of LM significantly affects the clin- ical decision-making and patients’ prognosis. Unlike brain metastasis towards which treat- ment response is generally poor, the prognosis for patients with solely LM may be significan- tly improved after timely and sufficient treat- ments, especially for carefully selected patients with colorectal cancer (CRC), neuroendocrine cancer and gastric cancer [6-8]. Thus, early identification of LM is essential to improve patients’ survival. Despite the profound impact that LM has on patients’ prognosis, an epide- miological study on the incidence of LM based on a large sample size that might provide generalizable estimation is lacking. Most of the contemporary studies mainly focus on the LM from a specific primary organ, mainly CRC- derived LM, rather than from a wide spectrum of malignancies [9-11]. Moreover, these studies failed to accurately reflect current landscape due to small sample size, shifting spectrum of
-
Upload
khangminh22 -
Category
Documents
-
view
0 -
download
0
Transcript of Incidence and prognosis of liver metastasis at diagnosis

Am J Cancer Res 2020;10(5):1477-1517www.ajcr.us /ISSN:2156-6976/ajcr0111777
Original ArticleIncidence and prognosis of liver metastasis at diagnosis: a pan-cancer population-based study
Shuncong Wang1, Yuanbo Feng1, Johan Swinnen1, Raymond Oyen1, Yue Li2, Yicheng Ni1
1KU Leuven, Campus Gasthuisberg, Faculty of Medicine, Leuven 3000, Belgium; 2Shanghai Key Laboratory of Molecular Imaging, Shanghai University of Medicine and Health Sciences, Shanghai 201318, China
Received April 1, 2020; Accepted April 9, 2020; Epub May 1, 2020; Published May 15, 2020
Abstract: Metastasis is a major cause of cancer-related death and liver metastasis (LM) is a distinct type for its relatively good prognosis after timely treatment for selected patients. However, a generalizable estimation of inci-dence and prognosis of LM is lacking. Cancer patients with known LM status in the Surveillance, Epidemiology and End Results database were enrolled in the present study. The incidence and prognosis of LM were calculated by primary cancer type and clinicopathological factors. Among 1,630,725 cases, 105,329 (6.46%) cases present LM at diagnosis, with a median survival of 4 months. LM presents at diagnosis in 39.96% of pancreatic cancer, 16.00% of colorectal cancer (CRC) and 12.68% of lung cancer. Of all LM cases, 25.58% originated from lung cancer, with 24.76% from CRC and 17.55% from pancreatic cancer. LM originated from small intestine cancer shows the best prognosis (median survival: 30 months), followed by testis cancer (25 months) and breast cancer (15 months). Subgroup analyses demonstrated disparities in incidence and prognosis of LM, with higher incidence and poorer prognosis in the older population, African American, male, and patients with inferior socioeconomic status. The current study provides a generalizable data resource for the epidemiology of LM, which may help tailor screening protocol, design clinical trials and estimate disease burden.
Keywords: Metastasis, liver, SEER, epidemiology
Introduction
Cancer represents a major cause of death, with estimated 1,762,450 new cases and 606,880 cancer-related death in the USA in 2019 [1]. Metastasis is one of the hallmarks of malignant tumor, and it can be accountable for approximately 90% of cancer-related death [2]. It is generally associated with dismal prog-nosis due to high tumor burden, treatment resistance and impaired organ function. Brain, lung, liver and bone are the most frequent met-astatic sites, with different types of cancer showing different propensities to spread to par-ticular organs or tissues at a rate that is higher than purely statistical chance, namely organot-ropism [3].
Liver, which receives dual blood supplies from hepatic artery and portal vein, is the most commonly metastasized organ for gastrointes-tinal cancer, based on the “mechanical or hemodynamic hypothesis” [4]. Besides the symptoms caused by primary cancer, patients
with liver metastasis (LM) may present with hepatomegaly, jaundice and ascites [5]. The presence of LM significantly affects the clin- ical decision-making and patients’ prognosis. Unlike brain metastasis towards which treat-ment response is generally poor, the prognosis for patients with solely LM may be significan- tly improved after timely and sufficient treat-ments, especially for carefully selected patients with colorectal cancer (CRC), neuroendocrine cancer and gastric cancer [6-8]. Thus, early identification of LM is essential to improve patients’ survival. Despite the profound impact that LM has on patients’ prognosis, an epide-miological study on the incidence of LM based on a large sample size that might provide generalizable estimation is lacking. Most of the contemporary studies mainly focus on the LM from a specific primary organ, mainly CRC-derived LM, rather than from a wide spectrum of malignancies [9-11]. Moreover, these studies failed to accurately reflect current landscape due to small sample size, shifting spectrum of

Epidemiology of liver metastasis
1478 Am J Cancer Res 2020;10(5):1477-1517
primary cancer over time and ever-decreasing risk of LM over time due to the improvement in screening, early diagnosis and treatment of pri-mary cancer [10, 12, 13]. An autopsy study addressed this issue in pan-cancer manner, based on cases between 1914 and 1943 [14]. However, this study is limited by 1) all enroll- ed cases dated back to more than half of cen-tury ago, during which the cancer aetiology, pri-mary cancer spectrum, cancer screening and surveillance protocol, pathology diagnosis cri-teria had been changed dramatically; 2) post-mortem analyses, showing the ultimate re- sults of metastasis progression, fail to reflect the pattern of synchronous LM, which may contribute to timely liver-direct treatment. In addition, a generalizable estimation of pro- gnosis of patients with LM is also lacking. Moreover, disparities in cancer incidence and survival among patients from different socio-economic statuses (SES) are increasingly evi-dent and these socioeconomic factors includ-ing income level, education level, insurance status and so on, seem to contribute more than biological factors [15]. For instance, metastasis is prevalent in patients with de- layed clinic consultation and underuse of screening methods, which are largely affected by socioeconomic factors [16-18]. Thus, sub-group analyses by socioeconomic factors on LM epidemiology are pressingly warranted.
The current study aims to provide a gene- ralizable estimation of the incidence and prognosis of LM across various cancer types, based on the records from the population-based Surveillance, Epidemiology and End Results (SEER) database. We also explored the epidemiological trends by clinicopathologi-cal factors to clarify the possible disparities among patients, including biological factors (age, race, sex, T stage and N stage) and so- cioeconomic factors (insurance, marriage, resi-dence, income, education and unemployment). These data may aid in clinical decision-making concerning liver-specific surveillance and pro-vide epidemiological evidence for estimation of disease burden for both policymakers and healthcare service providers.
Materials and methods
Eligible patients
The SEER database is a population-based database founded by the National Cancer
Institute in 1973. Currently it records the can-cer cases from 18 registry sites, covering approximately 28% of general population in the USA [19]. Adult patients diagnosed be- tween January 01, 2010 and December 31, 2015, were enrolled since the information regarding LM became firstly available in 2010. Cases originated in the liver, with unknown LM status or with any prior cancer history were ineligible for the current study. Cases with T0 or Tis stage based on the AJCC 7th TNM staging system and cases with in situ diseases based on the SEER historic stage were excluded. Leukemia and lymphoma cases were also excluded due to their diffuse nature. The ethical approval of the current study by our institution is unnecessary, as the study did not perform any intervention and the cases here are publicly available and de-identified.
Statistical analyses
Sarcoma and melanoma cases were firstly defined by the histology rather than anato- mical site and the remaining cases were cl- assified by the original organs and, if any, pathological or anatomical features. Subgroup analyses were performed in breast cancer, lung cancer, pancreatic cancer, and CRC, due to their heterogeneities in epidemiology, pa- thology and treatment response. Right-sided colon cancer includes cecum, ascending colon, hepatic flexure and transverse colon, whereas left-sided colon cancer includes splenic flexure, descending colon, sigmoid colon and rectosigmoid. Age at diagnosis was stratified into four groups (18-40, 41-60, 61-80 and 81+ years). To demonstrate si- multaneously systemic metastasis pattern in patients with LM, these patients were classi-fied into no other metastasis, brain meta- stasis, bone metastasis, lung metastasis, dual metastasis (brain + bone, brain + lung and bone + lung), triple metastasis (brain, bone and lung) and unknown (missing metastasis information). The number of all cases, meta-static cases and cases with LM were summa-rized by primary cancer, with median survival and interquartile range for LM cases, estimat-ed by Kaplan-Meier method [20]. Additionally, the crude incidences of LM, and incidence of LM over all metastases were calculated. Subgroup analyses by age, sex, race, T stage, N stage, insurance, marriage, residence type,

Epidemiology of liver metastasis
1479 Am J Cancer Res 2020;10(5):1477-1517
income level, education level and unemploy-ment level were also performed. Here, resi-dence type was classified into metro, urban, rural, and unknown by linking the FIPS code of county where patients resided to the 2013 Rural-Urban Continuum Codes from United States Department of Agriculture (USDA) [21]. Cases with FIPS codes of 34999 and 35999 were categorized as unknown residence type due to missing detailed location of resided county and cases resided in Alaska whose residence type is missing in the Rural-Urban Continuum Codes were re-classified as rural based on its economic status [22]. Due to the missing individual-level information con-cerning socioeconomic status, county-level in- formation of income (estimate of median household income 2017), education (percent-age of adults with a bachelor’s degree or hig- her between 2013 and 2017), employment status (unemployment rate, 2010), provided by USDA, were utilized as surrogates, after being categorized into four groups by 25% quantile, median and 75% quantile. Multivariate logistic regression, adjusting for cancer type, was per-
formed to identify factors associated with LM formation, with stepwise method, and educa-tion level was excluded due to its strong cor- relation with income level (r2 = 0.71, P < 0.01, Spearman’s rank correlation). Statistical an- alyses were performed on R 3.6.0 (https://www.R-project.org/), with survminer package [23].
Data availability
All the data that support the results of the cur-rent study are publicly available in the SEER database (https://seer.cancer.gov/).
Results
Incidence of liver metastasis
Exploiting the SEER database, 1,630,725 cases were eligible for the current study, with 277,420 total metastatic cases and 105,329 LM cases, which accounts for 6.46% of all cases and 37.96% of metastatic cases, respec-tively. The incidence of LM varies greatly ac- ross different cancer types (Figure 1; Table 1).
Figure 1. Prevalence and prognosis of liver metastasis cases by primary cancer type. A. Incidence of synchronous liver metastasis in different cancer types in all cancer patients (including metastatic and non-metastatic cancer patients); B. Incidence of synchronous liver metastasis in different cancer types in patients with metastatic lesions; C. Distribution of primary cancer types in patients with liver metastasis; D. Median survival of cancer patients with liver metastasis. Abbreviations: GI: gastrointestinal cancer.

Epidemiology of liver metastasis
1480 Am J Cancer Res 2020;10(5):1477-1517
Liver represents the most popular metastatic site for cancer in organs within portal
vein drainage and the top fifth highest inci- dences of LM were observed in pancreatic
Table 1. Number of all cases, metastatic cases and cases with liver metastasis and incidence, distri-bution and prognosis of liver metastasis by cancer type
Categories Number of cases Incidence Distribution Median survival with IQR
Site Subsite All Metastasis LM LM LM/ metastasisa
Distribution of LM casesb LM
Brain Brain 22991 180 11 0.05% 6.11% 0.01% 13 (4-20)
Head and neck Head and neck 67219 2728 489 0.73% 17.93% 0.46% 7 (2-17)
Thyroid Thyroid 65892 1316 130 0.20% 9.88% 0.12% 6 (2-31)
Breast All breast 307512 16714 4527 1.47% 27.09% 4.30% 15 (2-40)
Her2-/HR+ 208447 8466 1684 0.81% 19.89% 1.60% 19 (5-39)
Her2+/HR- 13506 1330 624 4.62% 46.92% 0.59% 27 (4-62)
Her2+/HR+ 31230 2445 904 2.89% 36.97% 0.86% 30 (6-NA)
Triple negative 32244 1980 569 1.76% 28.74% 0.54% 8 (2-16)
Unknown status 22085 2493 746 3.38% 29.92% 0.71% 2 (0-17)
Lung All lung 212433 110216 26939 12.68% 24.44% 25.58% 2 (0-8)
Adenocarcinoma 80255 46202 7848 9.78% 16.99% 7.45% 3 (1-9)
Squamous cancer 41861 14893 2741 6.55% 18.40% 2.60% 3 (1-7)
SCLC 26792 18611 8688 32.43% 46.68% 8.25% 3 (0-9)
Other 63525 30510 7662 12.06% 25.11% 7.27% 1 (0-5)
GI Oesophagus 17475 5785 2884 16.50% 49.85% 2.74% 4 (1-10)
Stomach 27799 10179 4577 16.46% 44.97% 4.35% 4 (1-11)
Biliary tract 17157 5921 3911 22.80% 66.05% 3.71% 3 (1-9)
All pancreas 46276 23724 18490 39.96% 77.94% 17.55% 2 (1-7)
Head of pancreas 24975 9242 7151 28.63% 77.38% 6.79% 3 (1-8)
Body of pancreas 6894 4139 3165 45.91% 76.47% 3.00% 3 (1-8)
Tail of pancreas 7792 5591 4524 58.06% 80.92% 4.30% 2 (1-7)
Unspecified pancreas 6615 4752 3650 55.18% 76.81% 3.47% 1 (0-5)
Small intestine 8288 2237 1449 17.48% 64.77% 1.38% 30 (4-NA)
Colon & rectum 163055 34703 26083 16.00% 75.16% 24.76% 12 (3-29)
Right colon 67014 13608 10017 14.95% 73.61% 9.51% 10 (2-23)
Left colon 53756 12055 9355 17.40% 77.60% 8.88% 16 (4-35)
Unspecified colon 3265 2341 1774 54.33% 75.78% 1.68% 2 (0-8)
Rectum 39020 6699 4937 12.65% 73.70% 4.69% 17 (6-33)
Anus 6692 441 198 2.96% 44.90% 0.19% 15 (6-27)
Other GI 13400 6101 3982 29.72% 65.27% 3.78% 2 (1-9)
GU Kidney 66654 9807 2274 3.41% 23.19% 2.16% 3 (1-10)
Bladder 35200 2880 705 2.00% 24.48% 0.67% 2 (1-7)
Prostate 270500 15520 741 0.27% 4.77% 0.70% 10 (4-22)
Testis 13359 1492 252 1.89% 16.89% 0.24% 25 (6-NA)
Other GU 5324 509 173 3.25% 33.99% 0.16% 2 (0-9)
GYN Ovary 27023 7288 1957 7.24% 26.85% 1.86% 12 (2-40)
Endometrium 61478 3593 551 0.90% 15.34% 0.52% 5 (1-16)
Cervix 3651 335 40 1.10% 11.94% 0.04% 10.0 (2.5-15.0)
Uterus 16720 2638 476 2.85% 18.04% 0.45% 4 (1-11)
Other GYN 8678 961 186 2.14% 19.35% 0.18% 10 (2-49)
Melanoma Melanoma 94544 2023 593 0.63% 29.31% 0.56% 4 (2-10)
Sarcoma Sarcoma 29780 4930 1373 4.61% 27.85% 1.30% 9 (2-33)
All other All other 21625 5199 2338 10.81% 44.97% 2.22% 1 (0-7)
All All 1630725 277420 105329 6.46% 37.96% 100% 4 (1-14)aThe ratios here represent the percentage of liver metastasis cases over metastatic cases. bThese data represent the percentage of liver metastasis from a specific original site over all liver metastasis cases. For instance, 0.01% of liver metastasis are originated from brain. Abbreviations: IQR: interquartile range; LM: liver metastasis; HER-2: Human epidermal growth factor receptor-2; HR: hormone receptor; SCLC: small cell lung cancer; GI: gastrointestinal cancer; GU: genitourinary cancer; GYN: gynaecologic cancer.

Epidemiology of liver metastasis
1481 Am J Cancer Res 2020;10(5):1477-1517
cancer (39.96%), other gastrointestinal cancer (29.72%), biliary tract cancer (22.80%), small intestine cancer (17.48%) and oesophagus cancer (16.50%) (Figure 1A; Table 1). LM is the major type of metastasis for metastatic pancreatic cancer (77.94%) and CRC (75.16%) (Figure 1B; Table 1). In terms of distribution of primary cancers, 25.57% of LM cases are originated from lung cancer, with 24.76% from CRC and 17.55% from pancreatic cancer (Figure 1C; Table 1). Subgroup analyses show- ed incidence disparities among different age groups, sexes, races, patients with different T or N stages, and patients with different so- cioeconomic statuses (insurance, marriage, income, residence type, education and unem-ployment) (Figures 2, 3; Tables 2-5). Of note, a counterintuitively higher LM incidence was observed in T1 or N1 stage oesophagus can- cer, gastric cancer, and CRC, compared with T2/T3 or N2 cases (Figure 2G, 2I; Table 4). Based on multivariate logistics regression, fac-tors associated with LM formation include age, sex, race, marital status, insurance status, T stage, N stage, income, unemployment, bone metastasis, brain metastasis and lung metas-tasis (Table 6).
Survival analysis
The median survival and corresponding inter-quartile range for LM cases by primary cancer are presented (Figure 1D; Table 1). The me- dian survival for general LM cases is 4 mon- ths, with the best survival in small intestine cancer (30 months), followed by testis cancer (25 months), rectal cancer (17 months), breast cancer (15 months) and anus cancer (15 months) (Figure 1D; Table 1). In terms of sys-tematic metastases in patients with LM, the best prognosis was observed in patients with solely LM (6 months), followed by cases with either simultaneous bone or lung metastasis (4 months) and cases with simultaneous brain metastasis (3 months) and cases with more than two metastases (3 months) (Table 7). Similarly, survival disparities can be observed in patients with LM among different age groups, sexes, races, different T or N stages, patients with different socioeconomic statuses (insur-ance, marriage, income, residence type, educa-tion and unemployment) (Figures 2, 3; Tables 2-5).
Discussion
In the current population-based study, we have presented, for the first time, the incidence of LM by cancer types, along with the correspond-ing median survival. In addition, we have also presented these data by age, race, sex, T sta- ge, N stage and socioeconomic factors. Be- cause the SEER 18 registries cover approxi-mately 28% of the general population in the USA, the demonstrated trends are of great representativeness and generalizability. These data may aid in tailoring liver surveillance and clinical decision making. As non-metastatic patients are frequently enrolled, the current study may help better design clinical trials and estimate the number of patients needed for initial enrolment, for a pre-set p value. Reporting the incidence of LM and its corre-sponding survival by cancer types also helps estimate the disease burden of LM in popula-tion and associated necessary healthcare resources.
Liver, following lymph nodes, is the most common metastasized size for cancer, on the basis of a study involving 3827 autopsies [14]. LM occurred in 11.1% of cancer cases, with the most common primary cancer as breast cancer, followed by pancreatic cancer and lung cancer [14]. This discrepancy with our observation can be explained by 1) the higher incidence of breast cancer in Cauca- sian population; 2) the longer exposure time for establishing metastasis in liver that was ensured by relatively good prognosis of bre- ast cancer and the autopsy nature of the study. The high prevalence of synchronous LM in gastrointestinal cancer, observed in our study, justifies the currently adopted clinical screening protocol [24-27]. The organotropism was conventionally thought to be accounted by portal vein drainage, however it is mainly deter-mined by exosomes from primary cancer cells, which facilitate preparing the “soil” in the liver [28]. Of note, the screening of LM in ovarian cancer patients, of whom 7.24% present with synchronous LM, is not recommended in cur-rent NCCN guideline [29]. Interestingly, albeit with the higher incidence of LM from left-sided colon cancer, its prognosis is much superior to that in right-sided colon cancer (median surviv-al: 16 vs. 10 months). This may be explained by the fact that right-sided colon cancer gener-
Epidemiology of liver metastasis
1482 Am J Cancer Res 2020;10(5):1477-1517

Epidemiology of liver metastasis
1483 Am J Cancer Res 2020;10(5):1477-1517
Figure 2. Incidence and prognosis for cases with synchronous liver metastasis in subgroup analyses. Incidence of synchronous liver metastasis and median survival for liver metastasis cases in subgroup analyses by age (A, B), race (C, D), sex (E, F), T stage (G, H) and N stage (I, J). Abbreviations: AA: African American; AI: American Indian; API: Asian and Pacific islanders.

Epidemiology of liver metastasis
1484 Am J Cancer Res 2020;10(5):1477-1517
ally presents a more extensive metastasis pat-tern, poorer differentiation and a higher per-centage of KRAS and/or BRAF mutation, which are associated with poorer survival [30, 31]. In terms of cancer stage, the incidences of LM are positively associated with advanced T st- age and N stage in general. However, the inci-dences of LM in SCLC remain relatively si- milar across different T stage and N stages (including N0 stage), challenging the conven-tional notion that metastasis develops se- quentially from primary cancer to regionally draining lymph nodes (if any), to blood vessels, and to metastatic sites [32]. Moreover, this unexpected pattern can also be observed in brain metastasis of SCLC, suggesting that metastasis initiates at the early phase, and routine screening for metastasis at diagnosis and early systemic treatment may be beneficial [33]. Additionally, the higher incidence of LM in T1 stage than in T2 or even T3 stage observed in oesophagus cancer, gastric cancer, and CRC challenges the traditional notion that the big-
ger the primary tumor, the more the circulating tumor cells and ultimately the higher the risk of distant metastasis. Consistently, the unexpect-edly higher incidence of brain metastasis at early stage was also observed in these cancer types [33]. This phenomenon may be explained by their great heterogeneities of metastasis potential: cancer cases with high metastasis potential may develop metastasis when the primary cancer is too small to cause any symptom or be detected (T1 stage) and the metastasis is the chief complaint for consulta-tion during which the “early” detection of pri-mary lesion can be made. This hypothesis is supported by previous publications. A distinct subgroup of CRC with shared genetic muta- tions can develop metastasis in years before the formation of clinically detectable lesion, indicating inherent genetic heterogeneity in metastasis [34]. Cancer with robust intravasa-tion, proliferation, and angiogenesis may colo-nize in distant sites without ever demonstrating a large primary mass [35]. In contrast, other
Figure 3. Incidence and prognosis for cases with synchronous liver metastasis in subgroup analyses. Incidence of synchronous liver metastasis and median survival for liver metastasis cases in subgroup analyses by insurance (A, B), marital status (C, D), residence type (E, F), income (G, H), education (I, J) and unemployment (K, L).

Epidemiology of liver metastasis
1485 Am J Cancer Res 2020;10(5):1477-1517
Table 2. Number of cases with LM and all cases, incidence of LM and median survival with IQR by cancer type and age, residence type or sex
Site Subsite Age Number of LM(All) Incidence
Median survival
(IQR)Residence Number of LM
(All) IncidenceMedian survival
(IQR)Sex Number of LM
(All) IncidenceMedian survival
(IQR)All All 18-40 3282 (101317) 3.24% 18 (6-44) Metro 91934 (1442673) 6.37% 4 (1-15) Male 55098 (783028) 7.04% 4 (1-13)
41-60 32478 (556975) 5.83% 8 (2-23) Urban 11435 (163150) 7.01% 4 (1-12) Female 50231 (847697) 5.93% 5 (1-16)
61-80 54528 (800112) 6.82% 4 (1-12) Rural 1957 (24690) 7.93% 4 (1-11)
>80 15041 (172321) 8.73% 1 (0-4) Unk 3 (212) 1.42% NA (8-NA)
Brain Brain 18-40 2 (4093) 0.05% 18 (16-20) Metro 10 (20453) 0.05% 15 (4-20) Male 7 (12980) 0.05% 7 (2-20)
41-60 4 (8226) 0.05% 29.5 (9.5-44.0) Urban 1 (2218) 0.05% 7 (7-7) Female 4 (10011) 0.04% 16 (15-44)
61-80 5 (8900) 0.06% 4.5 (1.5-9.0) Rural 0 (302) 0.00% NA
>80 0 (1772) 0.00% NA Unk 0 (1) 0.00% NA
Head and neck
Head and neck
18-40 22 (2881) 0.76% 20 (13-30) Metro 420 (58000) 0.72% 7 (2-18) Male 378 (48894) 0.77% 7 (2-17)
41-60 206 (27634) 0.75% 8 (3-18) Urban 55 (7981) 0.69% 5 (2-12) Female 111 (18325) 0.61% 7 (2-16)
61-80 224 (30546) 0.73% 6 (2-14) Rural 14 (1212) 1.16% 4 (1-10)
>80 37 (6158) 0.60% 5 (1-13) Unk 0 (3) 0.00% NA
Thyroid Thyroid 18-40 13 (19551) 0.07% 13 (6-31) Metro 111 (59960) 0.19% 6 (2-31) Male 60 (15205) 0.39% 8 (3-42)
41-60 39 (30501) 0.13% 6 (2-42) Urban 16 (5090) 0.31% 5.5 (1-20) Female 70 (50687) 0.14% 5 (1-15)
61-80 60 (14474) 0.41% 8 (3-NA) Rural 1 (743) 0.13% 5 (5-5)
>80 18 (1366) 1.32% 1.5 (0.0-3.0) Unk 0 (10) 0.00% NA
Breast All breast 18-40 461 (19544) 2.36% 33 (14-NA) Metro 4023 (277150) 1.45% 15 (3-41) Male 25 (2214) 1.13% 14 (2-34)
41-60 2050 (133541) 1.54% 21 (5-45) Urban 437 (26505) 1.65% 14 (2-33) Female 4502 (305298) 1.47% 15 (3-40)
61-80 1635 (129565) 1.26% 9 (1-31) Rural 67 (3787) 1.77% 6 (1-29)
>80 381 (24862) 1.53% 3 (0-12) Unk 0 (70) 0.00% NA
Her2-/HR+ 18-40 158 (10168) 1.55% 32 (16-62) Metro 1509 (188368) 0.80% 19 (5-39) Male 7 (1699) 0.41% 14 (4-29)
41-60 761 (86901) 0.88% 24 (8-44) Urban 151 (17544) 0.86% 18 (5-33) Female 1677 (206748) 0.81% 19 (5-39)
61-80 623 (93894) 0.66% 14 (3-34) Rural 24 (2497) 0.96% 14 (3-NA)
>80 142 (17484) 0.81% 6 (2-18) Unk 0 (38) 0.00% NA
Her2+/HR- 18-40 88 (1311) 6.71% 46 (19-NA) Metro 566 (12193) 4.64% 27 (4-NA) Male 2 (20) 10.00% NA
41-60 306 (7013) 4.36% 32 (8-NA) Urban 50 (1140) 4.39% 22 (5-37) Female 622 (13486) 4.61% 26 (4-62)
61-80 200 (4492) 4.45% 12 (2-45) Rural 8 (172) 4.65% NA (2-NA)
>80 30 (690) 4.35% 4 (2-9) Unk 0 (1) 0.00% NA
Her2+/HR+ 18-40 129 (3442) 3.75% NA (27-NA) Metro 814 (28216) 2.88% 31 (7-NA) Male 6 (239) 2.51% 34 (34-NA)
41-60 444 (15580) 2.85% 34 (11-NA) Urban 81 (2601) 3.11% 27 (5-53) Female 898 (30991) 2.90% 30 (6-NA)
61-80 275 (10520) 2.61% 20 (3-NA) Rural 9 (409) 2.20% 18 (1-29)
>80 56 (1688) 3.32% 4 (1-16) Unk 0 (4) 0.00% NA
Triple nega-tive
18-40 59 (3424) 1.72% 12 (7-16) Metro 499 (28841) 1.73% 7 (2-15) Male 2 (40) 5.00% 2 (2-2)
41-60 267 (15188) 1.76% 9 (3-18) Urban 60 (2977) 2.02% 11 (5-20) Female 567 (32204) 1.76% 8 (2-16)
61-80 208 (11481) 1.81% 6 (2-14) Rural 10 (422) 2.37% 6 (3-11)
>80 35 (2151) 1.63% 2 (1-5) Unk 0 (4) 0.00% NA
Unk status 18-40 27 (1199) 2.25% 16 (7-49) Metro 628 (19506) 3.22% 2 (0-18) Male 8 (216) 3.70% 3.0 (0.5-16.5)
Epidemiology of liver metastasis
1486 Am J Cancer Res 2020;10(5):1477-1517
41-60 272 (8859) 3.07% 6 (0-24) Urban 95 (2240) 4.24% 2 (0-14) Female 738 (21869) 3.37% 2 (0-17)
61-80 329 (9178) 3.58% 2 (0-16) Rural 16 (285) 5.61% 1 (0-4.5)
>80 118 (2849) 4.14% 1 (0-4) Unk 0 (23) 0.00% NA
Lung All lung 18-40 207 (1721) 12.03% 8 (2-18) Metro 22658 (180217) 12.57% 2 (0-8) Male 14730 (109968) 13.39% 2 (0-7)
41-60 6824 (48947) 13.94% 4 (1-10) Urban 3608 (27430) 13.15% 2 (0-7) Female 12209 (102465) 11.92% 3 (1-9)
61-80 16266 (129535) 12.56% 2 (0-8) Rural 671 (4773) 14.06% 2 (1-7)
>80 3642 (32230) 11.30% 1 (0-3) Unk 2 (13) 15.38% 24.5 (8-NA)
Adenocarci-noma
18-40 116 (692) 16.76% 9 (3-17) Metro 6871 (69981) 9.82% 3 (1-9) Male 4052 (38716) 10.47% 3 (1-7)
41-60 2292 (21155) 10.83% 4 (1-12) Urban 819 (8785) 9.32% 3 (1-7) Female 3796 (41539) 9.14% 4 (1-11)
61-80 4545 (47503) 9.57% 3 (1-8) Rural 140 (1410) 9.93% 3 (1-8)
>80 895 (10905) 8.21% 2 (1-5) Unk 1 (9) 11.11% 8 (8-8)
Squamous cancer
18-40 12 (98) 12.24% 7.0 (2.5-15.0) Metro 2293 (34262) 6.69% 3 (1-7) Male 1869 (26039) 7.18% 3 (1-7)
41-60 620 (7489) 8.28% 3 (1-8) Urban 381 (6392) 5.96% 2 (1-6) Female 872 (15822) 5.51% 2 (1-6)
61-80 1747 (28149) 6.21% 3 (1-7) Rural 62 (1167) 5.31% 3 (1-7)
>80 362 (6125) 5.91% 2 (0-5) Unk 1 (2) 50.00% NA
SCLC 18-40 21 (91) 23.08% 8 (3-13) Metro 7073 (21743) 32.53% 4 (0-9) Male 4570 (13219) 34.57% 3 (0-8)
41-60 2266 (7055) 32.12% 6 (1-10) Urban 1335 (4192) 31.85% 3 (0-8) Female 4118 (13573) 30.34% 4 (1-9)
61-80 5553 (17073) 32.53% 3 (0-9) Rural 266 (835) 31.86% 4 (1-9)
>80 848 (2573) 32.96% 1 (0-4) Unk 0 (0) NA NA
Other 18-40 58 (840) 6.90% 6 (1-20) Metro 6378 (54027) 11.81% 1 (0-5) Male 4239 (31994) 13.25% 1 (0-4)
41-60 1646 (13248) 12.42% 2 (0-8) Urban 1067 (8036) 13.28% 1 (0-4) Female 3423 (31531) 10.86% 1 (0-5)
61-80 4421 (36810) 12.01% 1 (0-5) Rural 202 (1358) 14.87% 1 (0-3)
>80 1537 (12627) 12.17% 1 (0-2) Unk 0 (2) 0.00% NA
GI Oesophagus 18-40 61 (220) 27.73% 9 (4-15) Metro 2494 (15035) 16.59% 4 (1-10) Male 2475 (13876) 17.84% 4 (1-10)
41-60 1051 (5291) 19.86% 5 (2-12) Urban 341 (2105) 16.20% 4 (1-10) Female 409 (3599) 11.36% 4 (1-11)
61-80 1527 (9830) 15.53% 4 (1-10) Rural 46 (325) 14.15% 3 (1-6)
>80 245 (2134) 11.48% 2 (0-4) Unk 0 (4) 0.00% NA
Stomach 18-40 155 (1222) 12.68% 5 (2-12) Metro 4108 (25104) 16.36% 4 (1-11) Male 3230 (17267) 18.71% 4 (1-11)
41-60 1397 (8198) 17.04% 6 (2-13) Urban 381 (2275) 16.75% 2 (1-8) Female 1347 (10532) 12.79% 3 (1-10)
61-80 2355 (13620) 17.29% 4 (1-11) Rural 81 (396) 20.45% 4 (1-10)
>80 670 (4759) 14.08% 2 (0-4) Unk 0 (1) 0.00% NA
Biliary tract 18-40 93 (368) 25.27% 9 (4-17) Metro 3560 (15434) 23.07% 3 (1-9) Male 1681 (7924) 21.21% 3 (1-8)
41-60 1061 (4307) 24.63% 5 (2-11) Urban 290 (1460) 19.86% 419 Female 2230 (9233) 24.15% 3 (1-9)
61-80 2131 (9218) 23.12% 3 (1-9) Rural 56 (243) 23.05% 2 (0-6.5)
>80 626 (3264) 19.18% 1 (0-4) Unk 0 (0) NA NA
All pancreas 18-40 266 (766) 34.73% 13 (4-29) Metro 16449 (41120) 40.00% 2 (1-7) Male 9986 (23517) 42.46% 2 (1-7)
41-60 4975 (11651) 42.70% 4 (1-11) Urban 1755 (4464) 39.31% 2 (1-6) Female 8504 (22759) 37.37% 2 (1-7)
61-80 10234 (25495) 40.14% 2 (1-7) Rural 286 (691) 41.39% 2 (0-5)
>80 3015 (8364) 36.05% 1 (0-2) Unk 0 (1) 0.00% NA

Epidemiology of liver metastasis
1487 Am J Cancer Res 2020;10(5):1477-1517
Head of pancreas
18-40 103 (331) 31.12% 12 (3-22) Metro 6349 (22089) 28.74% 3 (1-8) Male 3725 (12435) 29.96% 3 (1-8)
41-60 1903 (6117) 31.11% 5 (2-12) Urban 671 (2471) 27.15% 3 (1-8) Female 3426 (12540) 27.32% 3 (1-8)
61-80 3947 (13898) 28.40% 3 (1-8) Rural 115 (387) 29.72% 215
>80 1198 (4629) 25.88% 1 (0-3) Unk 0 (1) 0.00% NA
Body of pancreas
18-40 31 (110) 28.18% 15 (5-27) Metro 2817 (6150) 45.80% 3 (1-8) Male 1663 (3390) 49.06% 3 (1-8)
41-60 858 (1808) 47.46% 5 (1-11) Urban 291 (635) 45.83% 2 (1-6) Female 1502 (3504) 42.87% 2 (1-8)
61-80 1783 (3851) 46.30% 2 (1-7) Rural 57 (107) 53.27% 1 (0-5)
>80 493 (1125) 43.82% 1 (0-3) Unk 0 (0) NA NA
Tail of pancreas
18-40 77 (214) 35.98% 23 (4-NA) Metro 4011 (6934) 57.85% 2 (1-8) Male 2628 (4310) 60.97% 2 (1-7)
41-60 1333 (2221) 60.02% 4 (1-11) Urban 436 (732) 59.56% 2 (1-6) Female 1896 (3482) 54.45% 2 (1-7)
61-80 2501 (4280) 58.43% 2 (1-7) Rural 74 (121) 61.16% 2 (1-6)
>80 613 (1077) 56.92% 1 (0-2) Unk 0 (0) NA NA
Unspecified pancreas
18-40 55 (111) 49.55% 8 (3-18) Metro 3241 (5891) 55.02% 1 (0-5) Male 1970 (3382) 58.25% 1 (0-5)
41-60 881 (1505) 58.54% 2 (1-8) Urban 356 (622) 57.23% 1 (0-5) Female 1680 (3233) 51.96% 2 (0-5)
61-80 2003 (3466) 57.79% 2 (0-5) Rural 40 (76) 52.63% 2 (0.5-4)
>80 711 (1533) 46.38% 1 (0-2) Unk 0 (0) NA NA
Small intestine
18-40 66 (358) 18.44% NA (10-NA) Metro 1289 (7265) 17.74% 32 (4-NA) Male 754 (4230) 17.83% 25 (4-NA)
41-60 519 (2914) 17.81% NA (12-NA) Urban 141 (889) 15.86% 27 (4-NA) Female 695 (4058) 17.13% 36 (4-NA)
61-80 724 (4053) 17.86% 19 (3-66) Rural 19 (110) 17.27% 20 (3-43)
>80 140 (963) 14.54% 3 (1-17) Unk 0 (0) NA NA
Colon & rectum
18-40 1150 (6055) 18.99% 22 (10-40) Metro 22678 (142205) 15.95% 12 (3-29) Male 14487 (84867) 17.07% 13 (3-30)
41-60 9661 (54764) 17.64% 19 (7-37) Urban 2904 (17853) 16.27% 11 (2-27) Female 11596 (78188) 14.83% 11 (2-27)
61-80 11484 (75079) 15.30% 11 (2-26) Rural 501 (2988) 16.77% 11 (2-25)
>80 3788 (27157) 13.95% 2 (0-8) Unk 0 (9) 0.00% NA
Right colon 18-40 282 (1575) 17.90% 17 (8-30) Metro 8665 (58126) 14.91% 10 (2-23) Male 5016 (31173) 16.09% 10 (2-25)
41-60 3094 (15787) 19.60% 15 (5-31) Urban 1147 (7583) 15.13% 10 (2-22) Female 5001 (35841) 13.95% 9 (2-22)
61-80 4759 (33758) 14.10% 10 (2-23) Rural 198 (1262) 15.69% 10 (2-25)
>80 1882 (15894) 11.84% 2 (0-9) Unk 0 (2) 0.00% NA
Left colon 18-40 527 (2300) 22.91% 25 (13-42) Metro 8197 (47102) 17.40% 17 (4-35) Male 5505 (29504) 18.66% 17 (4-35)
41-60 3946 (20849) 18.93% 23 (9-43) Urban 969 (5674) 17.08% 15 (4-31) Female 3850 (24252) 15.87% 16 (4-35)
61-80 3920 (23958) 16.36% 13 (3-31) Rural 176 (944) 18.64% 13 (3-26)
>80 962 (6649) 14.47% 3 (1-9) Unk 0 (4) 0.00% NA
Unspecified colon
18-40 56 (109) 51.38% 7 (1-26) Metro 1538 (2833) 54.29% 2 (0-8) Male 856 (1614) 53.04% 2 (0-8)
41-60 402 (769) 52.28% 4 (1-13) Urban 200 (366) 54.64% 2 (0-7) Female 918 (1651) 55.60% 2 (0-8)
61-80 799 (1469) 54.39% 2 (0-8) Rural 32 (49) 65.31% 1 (0-5)
>80 517 (918) 56.32% 1 (0-3) Unk 0 (1) 0.00% NA
Rectum 18-40 285 (2071) 13.76% 24 (10-52) Metro 4250 (34051) 12.48% 17 (6-34) Male 3110 (22576) 13.78% 17 (6-33)
41-60 2219 (17359) 12.78% 21 (9-40) Urban 586 (4224) 13.87% 14 (5-31) Female 1827 (16444) 11.11% 15 (4-34)
61-80 2006 (15894) 12.62% 13 (4-29) Rural 94 (732) 12.84% 14 (6-28)
>80 427 (3696) 11.55% 5 (1-12) Unk 0 (2) 0.00% NA
Anus 18-40 8 (237) 3.38% 15 (15-17) Metro 168 (5930) 2.83% 15 (6-27) Male 71 (2406) 2.95% 12 (4-21)

Epidemiology of liver metastasis
1488 Am J Cancer Res 2020;10(5):1477-1517
41-60 94 (3276) 2.87% 15 (8-32) Urban 24 (673) 3.57% 17 (5.5-22) Female 127 (4286) 2.96% 15 (7-36)
61-80 85 (2661) 3.19% 15 (4-27) Rural 6 (87) 6.90% 26 (3-26)
>80 11 (518) 2.12% 5 (3-37) Unk 0 (2) 0.00% NA
Other GI 18-40 85 (1146) 7.42% 13 (4-32) Metro 3601 (11978) 30.06% 2 (1-9) Male 2093 (6278) 33.34% 2 (1-8)
41-60 1151 (4638) 24.82% 5 (1-14) Urban 337 (1222) 27.58% 2 (1-8) Female 1889 (7122) 26.52% 3 (1-9)
61-80 2124 (6009) 35.35% 2 (1-8) Rural 37 (183) 20.22% 2 (0-6)
>80 622 (1607) 38.71% 1 (0-2) Unk 1 (1) 100.00% NA
GU Kidney 18-40 60 (3826) 1.57% 9 (3-35) Metro 1968 (58285) 3.38% 3 (1-10) Male 1416 (41770) 3.39% 3 (1-10)
41-60 753 (25784) 2.92% 4 (2-11) Urban 261 (7102) 3.68% 3 (1-9) Female 858 (24884) 3.45% 3 (1-9)
61-80 1150 (31517) 3.65% 3 (1-10) Rural 40 (1123) 3.56% 4 (2-10)
>80 311 (5527) 5.63% 1 (0-4) Unk 0 (4) 0.00% NA
Bladder 18-40 8 (270) 2.96% 3 (0-8) Metro 605 (30908) 1.96% 2 (1-7) Male 511 (26425) 1.93% 2 (1-7)
41-60 142 (6272) 2.26% 5 (1-10) Urban 86 (3754) 2.29% 2 (0-6) Female 194 (8775) 2.21% 2 (1-6)
61-80 391 (19854) 1.97% 2 (1-7) Rural 14 (525) 2.67% 2.5 (0-5)
>80 164 (8804) 1.86% 2 (0-4) Unk 0 (1) 0.00% NA
Prostate 18-40 1 (278) 0.36% 7 (7-7) Metro 646 (240956) 0.27% 10 (4-23) Male 741 (270500) 0.27% 10 (4-22)
41-60 136 (76866) 0.18% 12 (5-26) Urban 82 (25877) 0.32% 12 (5-21)
61-80 440 (176955) 0.25% 11 (5-25) Rural 9 (3490) 0.26% 10 (8-13)
>80 164 (16401) 1.00% 6 (1-15) Unk 0 (60) 0.00% NA
Testis 18-40 196 (9669) 2.03% NA (7-NA) Metro 232 (12161) 1.91% 28 (6-NA) Male 252 (13359) 1.89% 25 (6-NA)
41-60 47 (3262) 1.44% 9 (3-NA) Urban 18 (1052) 1.71% 14 (8-NA)
61-80 8 (398) 2.01% 2.0 (1.5-22.5) Rural 2 (142) 1.41% 6 (6-6)
>80 1 (30) 3.33% 3 (3-3) Unk 0 (3) 0.00% NA
Other GU 18-40 0 (130) 0.00% NA Metro 150 (4622) 3.25% 2 (0-9) Male 94 (4047) 2.32% 2 (0-9)
41-60 29 (1231) 2.36% 9 (2-12) Urban 17 (609) 2.79% 5 (0-13) Female 79 (1277) 6.19% 3 (1-9)
61-80 94 (2822) 3.33% 5 (1-10) Rural 6 (91) 6.59% 1 (0-2)
>80 50 (1141) 4.38% 1 (0-2) Unk 0 (1) 0.00% NA
GYN Ovary 18-40 82 (2246) 3.65% 11 (4-NA) Metro 1748 (24262) 7.20% 13 (2-42) Female 1957 (27023) 7.24% 12 (2-40)
41-60 622 (10716) 5.80% 21 (4-56) Urban 171 (2409) 7.10% 5 (1-27)
61-80 977 (11191) 8.73% 13 (2-39) Rural 30 (326) 9.20% 12 (3-33)
>80 276 (2870) 9.62% 2 (0-8) Unk 0 (2) 0.00% NA
Endome-trium
18-40 15 (2665) 0.56% 8 (1-18) Metro 496 (54941) 0.90% 5 (1-15) Female 551 (61478) 0.90% 5 (1-16)
41-60 191 (25448) 0.75% 6 (1-15) Urban 47 (5688) 0.83% 8 (1-20)
61-80 302 (29812) 1.01% 5 (1-18) Rural 6 (831) 0.72% 21 (0-42)
>80 43 (3553) 1.21% 2 (0-8) Unk 0 (6) 0.00% NA
Cervix 18-40 4 (1085) 0.37% 14.5 (5.0-32.0) Metro 38 (3310) 1.15% 10 (3-15) Female 40 (3651) 1.10% 10.0 (2.5-15.0)
41-60 18 (1779) 1.01% 10 (8-24) Urban 2 (303) 0.66% 6.5 (2-11)
61-80 17 (708) 2.40% 7 (2-11) Rural 0 (38) 0.00% NA
>80 1 (79) 1.27% 0 (0-0) Unk 0 (0) NA NA
Uterus 18-40 53 (4271) 1.24% 9 (3-13) Metro 423 (14861) 2.85% 4 (1-11) Female 476 (16720) 2.85% 4 (1-11)
41-60 198 (7488) 2.64% 4 (1-10) Urban 45 (1607) 2.80% 5 (1-9)
61-80 177 (4186) 4.23% 4 (1-15) Rural 4 (237) 1.69% 3 (1-4)

Epidemiology of liver metastasis
1489 Am J Cancer Res 2020;10(5):1477-1517
>80 48 (775) 6.19% 2 (0-6) Unk 0 (0) NA NA
Other GYN 18-40 16 (509) 3.14% NA (16-NA) Metro 163 (7530) 2.16% 10 (2-49) Female 186 (8678) 2.14% 10 (2-49)
41-60 57 (2822) 2.02% 15 (2-NA) Urban 20 (1007) 1.99% 10 (3-NA)
61-80 88 (3839) 2.29% 14 (2-36) Rural 3 (138) 2.17% 19 (5-27)
>80 25 (1508) 1.66% 2 (1-6) Unk 0 (0) NA NA
Melanoma Melanoma 18-40 36 (11361) 0.32% 7 (3-12) Metro 522 (84078) 0.62% 4 (2-10) Male 388 (52862) 0.73% 5 (1-10)
41-60 202 (34603) 0.58% 5 (2-11) Urban 65 (9119) 0.71% 4 (1-9) Female 205 (41682) 0.49% 4 (2-10)
61-80 277 (38511) 0.72% 4 (2-11) Rural 5 (1327) 0.38% 6 (4-6)
>80 78 (10069) 0.77% 3 (1-9) Unk 0 (16) 0.00% NA
Sarcoma Sarcoma 18-40 89 (4553) 1.95% 21 (9-NA) Metro 1254 (26849) 4.67% 10 (2-34) Male 629 (12958) 4.85% 11 (2-40)
41-60 512 (10967) 4.67% 15 (3-42) Urban 103 (2572) 4.00% 9 (2-26) Female 744 (16822) 4.42% 9 (2-28)
61-80 638 (11537) 5.53% 6 (1-26) Rural 14 (337) 4.15% 5.5 (2-11)
>80 134 (2723) 4.92% 3 (1-15) Unk 0 (3) 0.00% NA
All other All other 18-40 133 (2292) 5.80% 8 (2-25) Metro 2072 (19545) 10.60% 1 (0-8) Male 1090 (11481) 9.49% 1 (0-7)
41-60 539 (5849) 9.22% 3 (1-14) Urban 222 (1818) 12.21% 1 (0-5) Female 1248 (10144) 12.30% 1 (0-8)
61-80 1115 (9797) 11.38% 1 (0-7) Rural 39 (243) 16.05% 2 (0-4)
>80 551 (3687) 14.94% 0 (0-2) Unk 0 (1) 0.00% NAAbbreviations: LM: liver metastasis; IQR: interquartile range; Unk: unknown; HER-2: Human epidermal growth factor receptor-2; HR: hormone receptor; SCLC: small cell lung cancer; GI: gastrointestinal cancer; GU: genitourinary cancer; GYN: gynecologic cancer; NA: non-applicable.
Table 3. Number of cases with LM and all cases, incidence of LM and median survival with IQR by cancer type and race, county-level education level or county-level unemployment level
Site Subsite Race Number of LM(All) Incidence Median survival
(IQR)Educa-tiona
Number of LM(All)
Inci-dence
Median sur-vival (IQR)
Unem-ploymenta
Number of LM(All) Incidence Median sur-
vival (IQR)All All Caucasian 82437 (1298448) 6.35% 4 (1-14) 1 29282 (419364) 6.98% 4 (1-12) 1 25747 (407484) 6.32% 5 (1-15)
AA 14285 (183386) 7.79% 4 (1-15) 2 29800 (450999) 6.61% 4 (1-14) 2 26369 (412169) 6.40% 5 (1-15)
AI 756 (9915) 7.62% 4 (1-14) 3 23176 (380846) 6.09% 5 (1-15) 3 31959 (500597) 6.38% 4 (1-14)
API 7593 (114323) 6.64% 5 (1-18) 4 22877 (378333) 6.05% 5 (1-17) 4 21054 (308389) 6.83% 4 (1-12)
Unk 258 (24653) 1.05% 7 (1-53) Unk 200 (2088) 9.58% 4 (1-13) Unk 200 (2086) 9.59% 4 (1-13)
Brain Brain Caucasian 8 (19979) 0.04% 15 (7-20) 1 0 (5624) 0.00% NA 1 1 (5759) 0.02% 11 (11-11)
AA 2 (1417) 0.14% 18.5 (4.0-NA) 2 2 (6344) 0.03% 4 (1-7) 2 4 (5731) 0.07% 4 (2-16)
AI 1 (1336) 0.07% NA 3 7 (5506) 0.13% 15.5 (4-20) 3 6 (7165) 0.08% 17.5 (7-44)
API 0 (115) 0.00% 1 (1-1) 4 2 (5502) 0.04% 27.5 (11-44) 4 0 (4321) 0.00% NA
Unk 0 (144) 0.00% NA Unk 0 (15) 0.00% NA Unk 0 (15) 0.00% NA
Head and neck
Head and neck
Caucasian 319 (54916) 0.58% 6 (2-16) 1 161 (19321) 0.83% 5 (2-13) 1 126 (16874) 0.75% 7 (4-20)
AA 98 (6766) 1.45% 8 (2-14) 2 115 (18332) 0.63% 7 (2-18) 2 118 (16918) 0.70% 7 (2-15)
AI 64 (4295) 1.49% 17 (4-29) 3 102 (15113) 0.67% 8 (3-17) 3 138 (20270) 0.68% 8 (3-17)
API 7 (424) 1.65% 15 (6-26) 4 109 (14345) 0.76% 9 (3-20) 4 105 (13049) 0.80% 6 (2-16)
Unk 1 (818) 0.12% NA Unk 2 (108) 1.85% 2 (0-4) Unk 2 (108) 1.85% 2 (0-4)
Thyroid Thyroid Caucasian 104 (52583) 0.20% 6 (2-24) 1 31 (14460) 0.21% 7 (1-15) 1 27 (17841) 0.15% 4 (1-NA)

Epidemiology of liver metastasis
1490 Am J Cancer Res 2020;10(5):1477-1517
AA 14 (4693) 0.30% 6 (2-15) 2 34 (18393) 0.18% 6 (2-53) 2 37 (17072) 0.22% 9 (2-42)
AI 12 (7083) 0.17% NA 3 38 (16538) 0.23% 4 (2-42) 3 37 (19737) 0.19% 6 (2-12)
API 0 (441) 0.00% 8 (3-42) 4 27 (16415) 0.16% 5 (2-15) 4 29 (11156) 0.26% 5 (1-12)
Unk 0 (1092) 0.00% NA Unk 0 (86) 0.00% NA Unk 0 (86) 0.00% NA
Breast All breast Caucasian 3299 (241222) 1.37% 16 (2-41) 1 1111 (70379) 1.58% 12 (2-31) 1 1087 (76448) 1,42% 17 (2-40)
AA 841 (34915) 2.41% 13 (2-31) 2 1267 (85598) 1.48% 14 (2-40) 2 1169 (78379) 1,49% 15 (2-41)
AI 28 (1824) 1.54% 13 (5-48) 3 1052 (75243) 1.40% 18 (3-45) 3 1400 (97015) 1,44% 16 (3-45)
API 345 (27055) 1.28% 18 (4-43) 4 1089 (75857) 1.44% 18 (3-45) 4 863 (55235) 1,56% 12 (2-32)
Unk 14 (2496) 0.56% 53 (9-53) Unk 8 (435) 1.84% 27.5 (1.5-48) Unk 8 (435) 1,84% 27.5 (1.5-48)
Her2-/HR+
Caucasian 1238 (167946) 0.74% 20 (5-40) 1 374 (45139) 0.83% 17 (4-34) 1 435 (52637) 0.83% 21 (5-39)
AA 296 (19802) 1.49% 15 (5-31) 2 481 (57952) 0.83% 18 (4-43) 2 426 (54307) 0.78% 18 (5-38)
AI 130 (18018) 0.72% 15 (12-30) 3 405 (52359) 0.77% 20 (5-40) 3 515 (65385) 0.79% 20 (5-41)
API 13 (1185) 1.10% 21 (5-41) 4 419 (52714) 0.79% 22 (6-39) 4 303 (35835) 0.85% 16 (4-36)
Unk 7 (1496) 0.47% 53 (9-53) Unk 5 (283) 1.77% 48 (48-48) Unk 5 (283) 1.77% 48 (48-48)
Her2+/HR-
Caucasian 449 (9698) 4.63% 27 (4-62) 1 129 (3156) 4.09% 19 (3-45) 1 141 (3369) 4.19% 20 (4-43)
AA 113 (1931) 5.85% 22 (3-NA) 2 190 (3934) 4.83% 22 (5-57) 2 179 (3330) 5.38% 45 (9-NA)
AI 56 (1685) 3.32% 15.5 (13.0-NA) 3 169 (3146) 5.37% 34 (10-NA) 3 194 (4280) 4.53% 28 (3-57)
API 3 (96) 3.13% 19 (5-NA) 4 136 (3250) 4.18% 31 (3-NA) 4 110 (2507) 4.39% 17 (3-45)
Unk 3 (96) 3.13% NA (0-NA) Unk 0 (20) 0.00% NA Unk 0 (20) 0.00% NA
Her2+/HR+
Caucasian 663 (23771) 2.79% 34 (7-NA) 1 209 (7326) 2.85% 23 (5-NA) 1 212 (7581) 2.80% 35 (6-NA)
AA 160 (3821) 4.19% 27 (6-NA) 2 244 (8676) 2.81% 27 (3-66) 2 239 (7851) 3.04% 30 (7-NA)
AI 73 (3178) 2.30% NA (1-NA) 3 216 (7449) 2.90% 37 (9-NA) 3 295 (10220) 2.89% 35 (7-NA)
API 7 (232) 3.02% 21 (4-NA) 4 234 (7718) 3.03% 38 (9-NA) 4 157 (5517) 2.85% 24 (7-NA)
Unk 1 (228) 0.44% 9 (9-9) Unk 1 (61) 1.64% 1 (1-1) Unk 1 (61) 1.64% 1 (1-1)
Triple negative
Caucasian 392 (22946) 1.71% 8 (2-17) 1 181 (8507) 2.13% 8 (3-13) 1 141 (7791) 1.81% 6 (2-17)
AA 142 (6663) 2.13% 7 (2-15) 2 151 (9145) 1.65% 8 (2-18) 2 128 (7823) 1.64% 9 (2-17)
AI 34 (2254) 1.51% 10 (10-10) 3 102 (7265) 1.40% 5 (2-14) 3 168 (10109) 1.66% 7 (2-18)
API 1 (188) 0.53% 7 (2-11) 4 135 (7293) 1.85% 9 (2-23) 4 132 (6487) 2.03% 7 (3-13)
Unk 0 (193) 0.00% NA Unk 0 (34) 0.00% NA Unk 0 (34) 0.00% NA
Unk status
Caucasian 557 (16861) 3.30% 2 (0-17) 1 218 (6251) 3.49% 2 (0-14) 1 158 (5070) 3.12% 4 (0-25)
AA 130 (2698) 4.82% 1 (0-12) 2 201 (5891) 3.41% 3 (0-17) 2 197 (5068) 3.89% 2 (0-14)
AI 52 (1920) 2.71% 1.5 (0.5-4.5) 3 160 (5024) 3.18% 2 (0-19) 3 228 (7021) 3.25% 2 (0-18)
API 4 (123) 3.25% 11 (0-NA) 4 165 (4882) 3.38% 2 (0-21) 4 161 (4889) 3.29% 2 (0-15)
Unk 3 (483) 0.62% 0 (0-NA) Unk 2 (37) 5.41% 3.5 (0-7) Unk 2 (37) 5.41% 3.5 (0-7)
Lung All lung Caucasian 22295 (171523) 13.00% 2 (0-8) 1 8596 (66217) 12.98% 2 (0-7) 1 6763 (52541) 12,87% 3 (0-8)
AA 2874 (25108) 11.45% 2 (1-7) 2 7718 (59275) 13.02% 2 (0-8) 2 6937 (54643) 12,70% 3 (0-8)
AI 149 (1161) 12.83% 2 (0-7) 3 5379 (44555) 12.07% 3 (1-8) 3 7527 (61325) 12,27% 2 (0-8)
API 1583 (14125) 11.21% 4 (1-12) 4 5200 (42077) 12.36% 3 (1-9) 4 5666 (43615) 12,99% 2 (0-7)
Unk 38 (516) 7.36% 2 (1-9) Unk 46 (309) 14.89% 2 (0-7) Unk 46 (309) 14,89% 2 (0-7)

Epidemiology of liver metastasis
1491 Am J Cancer Res 2020;10(5):1477-1517
Adeno-carcino-ma
Caucasian 6058 (62008) 9.77% 3 (1-9) 1 2075 (22198) 9.35% 3 (1-7) 1 1963 (19923) 9.85% 3 (1-10)
AA 945 (10199) 9.27% 3 (1-8) 2 2294 (22735) 10.09% 3 (1-9) 2 2022 (20623) 9.80% 3 (1-9)
AI 796 (7460) 10.67% 2 (1-3) 3 1731 (17771) 9.74% 3 (1-9) 3 2296 (23607) 9.73% 3 (1-10)
API 38 (376) 10.11% 6 (1-17) 4 1735 (17464) 9.93% 4 (1-11) 4 1554 (16015) 9.70% 2 (1-8)
Unk 11 (212) 5.19% 7 (2-NA) Unk 13 (87) 14.94% 2 (0-8) Unk 13 (87) 14.94% 2 (0-8)
Squa-mous cancer
Caucasian 6058 (62008) 9.77% 3 (1-7) 1 928 (15081) 6.15% 2 (1-6) 1 695 (10587) 6.56% 3 (1-6)
AA 945 (10199) 9.27% 3 (1-7) 2 774 (11550) 6.70% 3 (1-7) 2 702 (10612) 6.62% 3 (1-7)
AI 796 (7460) 10.67% 4 (1-7) 3 562 (8031) 7.00% 3 (1-7) 3 753 (11586) 6.50% 2 (1-7)
API 38 (376) 10.11% 3 (1-7) 4 474 (7116) 6.66% 3 (1-8) 4 588 (8993) 6.54% 3 (1-6)
Unk 11 (212) 5.19% 1 (0-NA) Unk 3 (83) 3.61% 7 (1-NA) Unk 3 (83) 3.61% 7 (1-NA)
SCLC Caucasian 7729 (23184) 33.34% 3 (0-9) 1 3086 (9811) 31.45% 3 (0-9) 1 2221 (6829) 32.52% 4 (1-9)
AA 673 (2460) 27.36% 4 (1-9) 2 2508 (7427) 33.77% 3 (0-8) 2 2303 (6961) 33.08% 4 (1-9)
AI 228 (946) 24.10% 7 (2-11) 3 1579 (5000) 31.58% 4 (1-9) 3 2282 (7191) 31.73% 3 (0-8)
API 49 (166) 29.52% 5 (1-9) 4 1500 (4503) 33.31% 4 (0-9) 4 1867 (5760) 32.41% 3 (0-9)
Unk 9 (36) 25.00% 2 (1-5) Unk 15 (51) 29.41% 7 (2-12) Unk 15 (51) 29.41% 7 (2-12)
Other Caucasian 6329 (51752) 12.23% 1 (0-4) 1 2507 (19127) 13.11% 1 (0-4) 1 1884 (15202) 12.39% 1 (0-5)
AA 861 (7414) 11.61% 1 (0-5) 2 2142 (17563) 12.20% 1 (0-5) 2 1910 (16447) 11.61% 1 (0-5)
AI 412 (3820) 10.79% 1 (0-2) 3 1507 (13753) 10.96% 1 (0-5) 3 2196 (18941) 11.59% 105
API 47 (346) 13.58% 2 (0-7) 4 1491 (12994) 11.47% 1 (0-6) 4 1657 (12847) 12.90% 1 (0-4)
Unk 13 (193) 6.74% 1 (0-7) Unk 15 (88) 17.05% 1 (0-2) Unk 15 (88) 17.05% 102
GI Oesopha-gus
Caucasian 2542 (14714) 17.28% 4 (1-10) 1 799 (5037) 15.86% 4 (1-10) 1 739 (4456) 16.58% 5 (1-11)
AA 226 (1750) 12.91% 3 (1-8) 2 828 (4775) 17.34% 4 (1-10) 2 741 (4410) 16.80% 5 (1-10)
AI 94 (820) 11.46% 7 (3-9) 3 656 (3988) 16.45% 4 (1-10) 3 836 (5035) 16.60% 4110
API 17 (122) 13.93% 6 (2-12) 4 600 (3634) 16.51% 5 (1-11) 4 567 (3533) 16.05% 3 (1-8)
Unk 5 (69) 7.25% 1 (0-17) Unk 1 (41) 2.44% 6 (6-6) Unk 1 (41) 2.44% 666
Stomach Caucasian 3297 (19562) 16.85% 4 (1-11) 1 1129 (6537) 17.27% 3 (1-9) 1 1001 (6233) 16.06% 4 (1-11)
AA 704 (3649) 19.29% 3 (1-11) 2 1406 (8594) 16.36% 4 (1-11) 2 1123 (6730) 16.69% 4112
AI 500 (4093) 12.22% 5 (1-17) 3 976 (6428) 15.18% 4 (1-12) 3 1548 (9569) 16.18% 4 (1-10)
API 55 (285) 19.30% 4 (1-11) 4 1045 (6146) 17.00% 5 (1-11) 4 884 (5173) 17.09% 3110
Unk 21 (210) 10.00% 5 (1-NA) Unk 21 (94) 22.34% 5 (3-17) Unk 21 (94) 22.34% 5 (3-17)
Biliary tract
Caucasian 2997 (13092) 22.89% 3 (1-9) 1 907 (4046) 22.42% 3 (1-8) 1 929 (4071) 22.82% 319
AA 457 (1741) 26.25% 3 (1-8) 2 1104 (4983) 22.16% 3 (1-9) 2 1029 (4389) 23.44% 3 (1-10)
AI 424 (2098) 20.21% 3 (1-8) 3 962 (4024) 23.91% 4 (1-9) 3 1201 (5590) 21.48% 3 (1-9)
API 25 (168) 14.88% 4 (1-9) 4 930 (4082) 22.78% 3 (1-10) 4 744 (3085) 24.12% 3 (1-8)
Unk 8 (58) 13.79% 6 (5-6) Unk 8 (22) 36.36% 2.5 (1-33) Unk 8 (22) 36.36% 2.5 (1-33)
All pan-creas
Caucasian 14534 (36444) 39.88% 2 (1-7) 1 4753 (11775) 40.37% 2 (0-6) 1 4643 (11682) 39,74% 2 (1-7)
AA 2488 (5851) 42.52% 2 (1-6) 2 5099 (12907) 39.51% 2 (1-7) 2 4608 (11546) 39,91% 2 (1-8)
AI 114 (276) 41.30% 2 (1-6) 3 4339 (10800) 40.18% 2 (1-8) 3 5642 (14171) 39,81% 2 (1-7)
API 1300 (3555) 36.57% 2 (1-7) 4 4276 (10745) 39.80% 3 (1-9) 4 3574 (8828) 40,48% 2 (1-6)
Unk 54 (150) 36.00% 2 (1-9) Unk 23 (49) 46.94% 1 (0-4) Unk 23 (49) 46,94% 1 (0-4)

Epidemiology of liver metastasis
1492 Am J Cancer Res 2020;10(5):1477-1517
Head of pancreas
Caucasian 5651 (19838) 28.49% 3 (1-8) 1 1859 (6519) 28.52% 2 (1-7) 1 1745 (6228) 28.02% 3 (1-8)
AA 951 (3062) 31.06% 2 (1-7) 2 2017 (7054) 28.59% 3 (1-8) 2 1791 (6218) 28.80% 3 (1-8)
AI 479 (1843) 25.99% 3 (1-7) 3 1676 (5783) 28.98% 3 (1-8) 3 2150 (7563) 28.43% 3 (1-8)
API 50 (161) 31.06% 3 (1-7) 4 1589 (5590) 28.43% 3 (1-9) 4 1455 (4937) 29.47% 3 (1-8)
Unk 20 (71) 28.17% 5 (1-9) Unk 10 (29) 34.48% 2 (0-4) Unk 10 (29) 34.48% 2 (0-4)
Body of pancreas
Caucasian 2516 (5398) 46.61% 3 (1-8) 1 820 (1688) 48.58% 2 (0-6) 1 788 (1768) 44.57% 3 (1-8)
AA 405 (896) 45.20% 2 (1-8) 2 850 (1902) 44.69% 2 (1-7) 2 789 (1674) 47.13% 3 (1-9)
AI 212 (528) 40.15% 2 (1-25) 3 722 (1598) 45.18% 3 (1-9) 3 960 (2174) 44.16% 3 (1-7)
API 18 (37) 48.65% 3 (1-9) 4 771 (1700) 45.35% 4 (1-10) 4 626 (1272) 49.21% 2 (0-6)
Unk 14 (35) 40.00% 2 (0-8) Unk 2 (6) 33.33% 0 (0-0) Unk 2 (6) 33.33% 0 (0-0)
Tail of pancreas
Caucasian 3511 (6059) 57.95% 2 (1-8) 1 1136 (1892) 60.04% 2 (0-6) 1 1156 (1990) 58.09% 2 (1-8)
AA 640 (1023) 62.56% 2 (1-6) 2 1195 (2094) 57.07% 2 (1-7) 2 1137 (2013) 56.48% 2 (1-8)
AI 336 (645) 52.09% 1 (0-6) 3 1094 (1856) 58.94% 2 (1-8) 3 1422 (2415) 58.88% 2 (1-7)
API 25 (41) 60.98% 2 (1-7) 4 1090 (1939) 56.21% 2 (1-9) 4 800 (1363) 58.69% 2 (0-6)
Unk 12 (24) 50.00% 1 (1-3) Unk 9 (11) 81.82% 1 (0-6) Unk 9 (11) 81.82% 1 (0-6)
Unspeci-fied pan-creas
Caucasian 2856 (5149) 55.47% 2 (0-5) 1 938 (1676) 55.97% 1 (0-4) 1 954 (1696) 56.25% 2 (0-6)
AA 492 (870) 56.55% 1 (0-5) 2 1037 (1857) 55.84% 2 (0-5) 2 891 (1641) 54.30% 1 (0-5)
AI 273 (539) 50.65% 2 (1-4) 3 847 (1563) 54.19% 1 (0-5) 3 1110 (2019) 54.98% 2 (0-5)
API 21 (37) 56.76% 2 (1-5) 4 826 (1516) 54.49% 2 (0-6) 4 693 (1256) 55.18% 1 (0-4)
Unk 8 (20) 40.00% 1.0 (0.5-NA) Unk 2 (3) 66.67% 1 (1-1) Unk 2 (3) 66.67% 1 (1-1)
Small intestine
Caucasian 1138 (6339) 17.95% 35 (4-NA) 1 354 (2164) 16.36% 25 (3-NA) 1 406 (2223) 18.26% 35 (6-NA)
AA 247 (1495) 16.52% 19 (4-NA) 2 393 (2272) 17.30% 22 (3-NA) 2 363 (2189) 16.58% 38 (5-NA)
AI 57 (328) 17.38% NA (2-NA) 3 358 (1946) 18.40% 38 (6-NA) 3 417 (2414) 17.27% 25 (3-NA)
API 5 (38) 13.16% 14 (2-NA) 4 344 (1902) 18.09% 35 (6-NA) 4 263 (1458) 18.04% 22 (3-NA)
Unk 2 (88) 2.27% NA Unk 0 (4) 0.00% NA Unk 0 (4) 0.00% NA
Colon & rectum
Caucasian 19602 (125426) 15.63% 12 (3-29) 1 7328 (45303) 16.18% 11 (2-27) 1 6320 (40101) 15,76% 13 (3-30)
AA 4084 (20419) 20.00% 11 (2-25) 2 7295 (46068) 15.84% 11 (2-27) 2 6458 (40244) 16,05% 13 (3-30)
AI 214 (1357) 15.77% 11 (2-31) 3 5727 (36422) 15.72% 13 (3-30) 3 8124 (50541) 16,07% 12 (2-28)
API 2126 (14429) 14.73% 14 (4-31) 4 5671 (34896) 16.25% 14 (3-32) 4 5119 (31803) 16,10% 11 (2-26)
Unk 57 (1424) 4.00% 22 (3-NA) Unk 62 (366) 16.94% 7 (2-21) Unk 62 (366) 16,94% 7 (2-21)
Right colon
Caucasian 7420 (52600) 14.11% 9 (2-23) 1 2849 (18581) 15.33% 9 (2-23) 1 2481 (16576) 14.97% 10 (2-24)
AA 1913 (9177) 20.85% 11 (2-23) 2 2746 (19078) 14.39% 10 (2-23) 2 2442 (16566) 14.74% 10 (2-25)
AI 601 (4436) 13.55% 5 (1-16) 3 2187 (14943) 14.64% 10 (2-23) 3 3076 (20821) 14.77% 9 (2-23)
API 67 (481) 13.93% 11 (3-25) 4 2211 (14263) 15.50% 11 (2-25) 4 1994 (12902) 15.45% 9 (2-23)
Unk 16 (320) 5.00% 31 (1-NA) Unk 24 (149) 16.11% 5 (1-20) Unk 24 (149) 16.11% 5 (1-20)
Left colon
Caucasian 6982 (40580) 17.21% 17 (4-36) 1 2610 (14785) 17.65% 15 (3-33) 1 2300 (13162) 17.47% 19 (5-38)
AA 1292 (6330) 20.41% 13 (3-29) 2 2558 (15149) 16.89% 15 (3-32) 2 2293 (13229) 17.33% 17 (4-36)
AI 979 (5860) 16.71% 17 (4-43) 3 2082 (12067) 17.25% 18 (5-37) 3 2915 (16762) 17.39% 15 (3-32)
API 77 (463) 16.63% 19 (5-37) 4 2085 (11627) 17.93% 19 (5-39) 4 1827 (10475) 17.44% 14 (3-30)
Unk 25 (523) 4.78% 22 (12-NA) Unk 20 (128) 15.63% 11 (2-36) Unk 20 (128) 15.63% 11 (2-36)

Epidemiology of liver metastasis
1493 Am J Cancer Res 2020;10(5):1477-1517
Un-specified colon
Caucasian 1335 (2432) 54.89% 2 (0-7) 1 496 (967) 51.29% 1 (0-6) 1 399 (738) 54.07% 2 (0-8)
AA 309 (553) 55.88% 2 (0-9) 2 534 (917) 58.23% 2 (0-9) 2 469 (795) 58.99% 2 (0-9)
AI 108 (215) 50.23% 7 (0-15) 3 383 (721) 53.12% 2 (0-9) 3 553 (1025) 53.95% 2 (0-8)
API 15 (26) 57.69% 2 (1-7) 4 359 (657) 54.64% 2 (0-8) 4 351 (704) 49.86% 2 (0-6)
Unk 7 (39) 17.95% NA Unk 2 (3) 66.67% 3.5 (0-7) Unk 2 (3) 66.67% 3.5 (0-7)
Rectum Caucasian 3865 (29814) 12.96% 17 (6-35) 1 1373 (10970) 12.52% 14 (5-31) 1 1140 (9625) 11.84% 18 (6-35)
AA 570 (4359) 13.08% 12 (4-26) 2 1457 (10924) 13.34% 17 (5-32) 2 1254 (9654) 12.99% 17 (6-37)
AI 438 (3918) 11.18% 15 (5-37) 3 1075 (8691) 12.37% 17 (6-34) 3 1580 (11933) 13.24% 16 (6-31)
API 55 (387) 14.21% 18 (6-33) 4 1016 (8349) 12.17% 20 (7-38) 4 947 (7722) 12.26% 14 (5-32)
Unk 9 (542) 1.66% 18 (2-NA) Unk 16 (86) 18.60% 14 (3.5-25) Unk 16 (86) 18.60% 14 (3.5-25)
Anus Caucasian 168 (5653) 2.97% 15 (6-32) 1 46 (1674) 2.75% 14 (5-27) 1 47 (1654) 2.84% 18 (7-NA)
AA 24 (800) 3.00% 15 (8-18) 2 63 (1816) 3.47% 13 (8-24) 2 45 (1590) 2.83% 12 (4-36)
AI 2 (148) 1.35% 2.5 (1.0-4.0) 3 51 (1578) 3.23% 13 (5-21) 3 71 (2170) 3.27% 15 (8-22)
API 2 (35) 5.71% NA 4 38 (1616) 2.35% 22 (6-40) 4 35 (1270) 2.76% 14 (6-19)
Unk 2 (56) 3.57% 3 (0-NA) Unk 0 (8) 0.00% NA Unk 0 (8) 0.00% NA
Other GI Caucasian 3055 (10655) 28.67% 2 (1-9) 1 1006 (3262) 30.84% 2 (0-8) 1 871 (3208) 27.15% 2 (1-9)
AA 537 (1542) 34.82% 3 (1-9) 2 1165 (3860) 30.18% 3 (1-9) 2 991 (3446) 28.76% 2 (1-9)
AI 329 (1004) 32.77% 2 (0-4) 3 914 (3117) 29.32% 3 (1-10) 3 1271 (4185) 30.37% 3 (1-10)
API 43 (109) 39.45% 2 (0-7) 4 889 (3137) 28.34% 3 (1-10) 4 841 (2537) 33.15% 2 (0-8)
Unk 18 (90) 20.00% 8 (1-19) Unk 8 (24) 33.33% 1.5 (0-31.5) Unk 8 (24) 33.33% 1.5 (0-31.5)
GU Kidney Caucasian 1783 (53860) 3.31% 3 (1-10) 1 646 (19276) 3.35% 3 (1-9) 1 588 (16618) 3.54% 3 (1-10)
AA 312 (7794) 4.00% 3 (1-8) 2 686 (18866) 3.64% 3 (1-10) 2 523 (16382) 3.19% 3 (1-11)
AI 151 (3740) 4.04% 6 (1-12) 3 471 (14801) 3.18% 3 (1-9) 3 708 (19964) 3.55% 3 (1-9)
API 22 (664) 3.31% 3 (1-9) 4 469 (13603) 3.45% 4 (1-11) 4 453 (13582) 3.34% 3 (1-8)
Unk 6 (596) 1.01% 5.0 (4.5-10.0) Unk 2 (108) 1.85% 10.5 (9-12) Unk 2 (108) 1.85% 10.5 (9-12)
Bladder Caucasian 605 (30572) 1.98% 2 (1-7) 1 186 (9210) 2.02% 2 (0-7) 1 163 (8493) 1.92% 3 (1-7)
AA 68 (2499) 2.72% 3.0 (0.5-6.0) 2 186 (9846) 1.89% 2 (1-6) 2 188 (9043) 2.08% 2 (1-7)
AI 29 (1667) 1.74% 5.5 (0.0-11.0) 3 167 (8444) 1.98% 2 (1-7) 3 221 (10723) 2.06% 3 (1-6)
API 2 (136) 1.47% 3 (1-6) 4 166 (7678) 2.16% 3 (1-8) 4 133 (6919) 1.92% 2 (1-5)
Unk 1 (326) 0.31% 6 (6-6) Unk 0 (22) 0.00% NA Unk 0 (22) 0.00% NA
Prostate Caucasian 534 (204226) 0.26% 9 (3-22) 1 189 (69040) 0.27% 9 (4-20) 1 175 (68958) 0.25% 11 (3-26)
AA 164 (43242) 0.38% 12 (5-26) 2 188 (71265) 0.26% 10 (4-22) 2 186 (67339) 0.28% 13 (5-21)
AI 33 (12956) 0.25% 12 (8-17) 3 174 (62850) 0.28% 11 (4-25) 3 243 (82166) 0.30% 10 (4-22)
API 8 (1092) 0.73% 12 (2-34) 4 189 (67184) 0.28% 11 (3-25) 4 136 (51876) 0.26% 8 (3-23)
Unk 2 (8984) 0.02% 13.5 (1.0-26.0) Unk 1 (161) 0.62% 8 (8-8) Unk 1 (161) 0.62% 8 (8-8)
Testis Caucasian 224 (11864) 1.89% 28 (6-NA) 1 75 (3125) 2.40% 11 (2-NA) 1 51 (3281) 1.55% NA (7-NA)
AA 11 (413) 2.66% NA (7-NA) 2 70 (3707) 1.89% NA (9-NA) 2 63 (3383) 1.86% 22 (4-NA)
AI 13 (576) 2.26% 9 (4-NA) 3 61 (3259) 1.87% NA (11-NA) 3 83 (4151) 2.00% NA (11-NA)
API 3 (164) 1.83% 14 (6-26) 4 46 (3238) 1.42% 25 (3-NA) 4 55 (2514) 2.19% 9 (2-NA)
Unk 1 (342) 0.29% NA Unk 0 (30) 0.00% NA Unk 0 (30) 0.00% NA

Epidemiology of liver metastasis
1494 Am J Cancer Res 2020;10(5):1477-1517
Other GU Caucasian 149 (4378) 3.40% 2 (0-9) 1 54 (1510) 3.58% 2 (0-9) 1 39 (1284) 3.04% 5 (1-9)
AA 9 (461) 1.95% 1 (0-7) 2 36 (1448) 2.49% 7 (2-12) 2 45 (1352) 3.33% 2 (1-7)
AI 14 (393) 3.56% 7 (7-7) 3 37 (1245) 2.97% 1 (0-5) 3 49 (1654) 2.96% 2 (0-10)
API 1 (28) 3.57% 2 (0-9) 4 45 (1112) 4.05% 3 (1-9) 4 39 (1025) 3.80% 2 (0-9)
Unk 0 (64) 0.00% NA Unk 1 (9) 11.11% 7 (7-7) Unk 1 (9) 11.11% 7 (7-7)
GYN Ovary Caucasian 1563 (21941) 7.12% 13 (2-42) 1 510 (6284) 8.12% 6 (1-28) 1 453 (6421) 7.05% 12 (2-44)
AA 243 (2364) 10.28% 5 (1-21) 2 543 (7675) 7.07% 12 (2-40) 2 415 (6699) 6.19% 15 (1-50)
AI 130 (2395) 5.43% 12 (0-27) 3 434 (6427) 6.75% 14 (2-47) 3 648 (8882) 7.30% 13 (2-40)
API 15 (176) 8.52% 11 (1-56) 4 464 (6615) 7.01% 17 (3-61) 4 435 (4999) 8.70% 8 (1-29)
Unk 6 (147) 4.08% 14 (2-NA) Unk 6 (22) 27.27% 12.5 (6-35) Unk 6 (22) 27.27% 12.5 (6-35)
Endome-trium
Caucasian 372 (49418) 0.75% 5 (1-17) 1 126 (14231) 0.89% 5 (1-18) 1 135 (15559) 0.87% 5 (1-14)
AA 122 (5811) 2.10% 5 (2-14) 2 157 (17619) 0.89% 5 (1-13) 2 130 (14989) 0.87% 6 (1-18)
AI 50 (5226) 0.96% 9 (6-20) 3 114 (14578) 0.78% 4 (1-11) 3 184 (19426) 0.95% 5 (1-14)
API 5 (460) 1.09% 6 (1-12) 4 153 (15001) 1.02% 8 (2-19) 4 101 (11455) 0.88% 5 (1-19)
Unk 2 (563) 0.36% NA Unk 1 (49) 2.04% NA Unk 1 (49) 2.04% NA (NA-NA)
Cervix Caucasian 27 (2876) 0.94% 10 (2-11) 1 14 (884) 1.58% 50 (25-75) 1 1 (791) 0.13% 28 (28-28)
AA 7 (348) 2.01% 15 (7-24) 2 8 (1110) 0.72% 9 (2-11) 2 12 (880) 1.36% 11 (5-15)
AI 6 (344) 1.74% NA 3 7 (846) 0.83% 11 (8-14) 3 13 (1248) 1.04% 7 (2-10)
API 0 (37) 0.00% 8 (3-14) 4 11 (806) 1.36% 6 (0-21.5) 4 14 (727) 1.93% 9 (2-11)
Unk 0 (46) 0.00% NA Unk 0 (5) 0.00% 7 (7-15) Unk 0 (5) 0.00% NA
Uterus Caucasian 327 (12372) 2.64% 5 (1-11) 1 136 (4800) 2.83% 4 (1-10) 1 96 (3602) 2.67% 4 (1-11)
AA 103 (2470) 4.17% 4 (1-9) 2 149 (5071) 2.94% 4 (1-11) 2 122 (3962) 3.08% 6 (2-12)
AI 39 (1543) 2.53% 1 (1-4) 3 105 (3681) 2.85% 4 (1-11) 3 145 (5566) 2.61% 4 (1-10)
API 6 (168) 3.57% 4 (2-17) 4 86 (3149) 2.73% 5 (1-15) 4 113 (3571) 3.16% 3 (1-11)
Unk 1 (167) 0.60% NA Unk 0 (19) 0.00% NA Unk 0 (19) 0.00% NA
Other GYN
Caucasian 148 (7241) 2.04% 14 (2-52) 1 44 (2320) 1.90% 7 (2-32) 1 56 (2318) 2.42% 15 (3-52)
AA 19 (798) 2.38% 7 (2-NA) 2 53 (2509) 2.11% 6 (2-NA) 2 40 (2197) 1.82% 10 (2-NA)
AI 16 (472) 3.39% 12 (5-19) 3 25 (1911) 1.31% 20 (5-NA) 3 41 (2526) 1.62% 9 (2-30)
API 2 (61) 3.28% 29.5 (3.5-55.0) 4 62 (1924) 3.22% 14 (2-49) 4 47 (1623) 2.90% 6 (1-27)
Unk 1 (106) 0.94% 1 (1-1) Unk 2 (14) 14.29% 12 (5-19) Unk 2 (14) 14.29% 12 (5-19)
Mela-noma
Mela-noma
Caucasian 560 (87809) 0.64% 4 (1-10) 1 141 (20739) 0.68% 4 (2-8) 1 151 (24828) 0.61% 4 (2-11)
AA 12 (483) 2.48% 4 (3-8) 2 180 (23746) 0.76% 4 (1-11) 2 132 (25787) 0.51% 5 (2-11)
AI 18 (675) 2.67% NA 3 151 (25166) 0.60% 5 (2-11) 3 204 (28392) 0.72% 4 (2-11)
API 0 (231) 0.00% 6 (3-10) 4 121 (24855) 0.49% 5 (2-13) 4 106 (15499) 0.68% 4 (1-9)
Unk 3 (5346) 0.06% NA Unk 0 (38) 0.00% NA Unk 0 (38) 0.00% NA
Sarcoma Sarcoma Caucasian 976 (22421) 4.35% 8 (1-30) 1 332 (6971) 4.76% 8 (1-26) 1 328 (6997) 4.69% 12 (2-39)
AA 256 (4276) 5.99% 11 (2-30) 2 382 (8596) 4.44% 8 (2-33) 2 315 (7423) 4.24% 12 (2-37)
AI 124 (2474) 5.01% 4 (2-19) 3 335 (6946) 4.82% 11 (2-31) 3 450 (9714) 4.63% 8 (2-29)
API 14 (214) 6.54% 22 (3-54) 4 321 (7237) 4.44% 12 (2-47) 4 277 (5616) 4.93% 7 (2-26)
Unk 3 (395) 0.76% 17 (17-17) Unk 3 (30) 10.00% 4 (0-6) Unk 3 (30) 10.00% 4 (0-6)

Epidemiology of liver metastasis
1495 Am J Cancer Res 2020;10(5):1477-1517
All other All other Caucasian 1811 (17362) 10.43% 1 (0-7) 1 607 (4998) 12.14% 1 (0-7) 1 551 (5243) 10.51% 1 (0-6)
AA 363 (2281) 15.91% 1 (0-7) 2 671 (6074) 11.05% 1 (0-7) 2 575 (5446) 10.56% 2 (0-9)
AI 133 (1493) 8.91% 1 (0-17) 3 532 (5215) 10.20% 2 (0-8) 3 752 (6998) 10.75% 1 (0-9)
API 19 (129) 14.73% 2 (0-8) 4 523 (5320) 9.83% 1 (0-8) 4 455 (3920) 11.61% 1 (0-6)
Unk 12 (360) 3.33% 6 (0-11) Unk 5 (18) 27.78% 1 (0-2) Unk 5 (18) 27.78% 1 (0-2)Abbreviations: LM: liver metastasis; IQR: interquartile range; AA: African American; AI: American Indian; API: Asian and Pacific islanders; Unk: unknown; HER-2: Human epidermal growth factor receptor-2; HR: hormone receptor; SCLC: small cell lung cancer; GI: gastrointestinal cancer; GU: genitourinary cancer; GYN: gynecologic cancer; NA: non-applicable. aboth the county-level education and unemployment are presented as quantiles here.
Table 4. Number of cases with LM and all cases, incidence of LM and median survival with IQR by cancer type and T stage, N stage or county-level income level
Site Subsite T stage Number of LM(All)
Inci-dence
Median survival(IQR) N stage Number of LM
(All) Incidence Median sur-vival (IQR)
Inco-mea
Number of LM(All) Incidence Median sur-
vival (IQR)All All T1 8895 (649562) 1.37% 5 (1-15) N0 32244
(1096806)2.94% 4 (1-15) 1 29682 (415537) 7.14% 4 (1-12)
T2 15658 (402878) 3.89% 4 (1-11) N1 26825 (236665) 11.33% 7 (2-22) 2 29297 (456118) 6.42% 4 (1-14)
T3 25299 (281594) 8.98% 8 (2-24) N2 20615 (148613) 13.87% 5 (1-13) 3 22190 (352684) 6.29% 5 (1-15)
T4 22923 (140412) 16.33% 5 (1-14) N3 6408 (46796) 13.69% 4 (1-10) 4 23960 (404300) 5.93% 5 (1-17)
Unk 32554 (156279) 20.83% 3 (0-10) Unk 19237 (101845) 18.89% 2 (0-9) Unk 200 (2086) 9.59% 4 (1-13)
Brain Brain T1 0 (0) NA NA N0 0 (0) NA NA 1 1 (5242) 0.02% 7 (7-7)
T2 0 (0) NA NA N1 0 (0) NA NA 2 3 (6552) 0.05% 17 (1-NA)
T3 0 (0) NA NA N2 0 (0) NA NA 3 4 (5240) 0.08% 15.5 (8.5-18)
T4 0 (0) NA NA N3 0 (0) NA NA 4 3 (5942) 0.05% 11 (4-44)
Unk 11 (22991) 0.05% 13 (4-20) Unk 11 (22991) 0.05% 13 (4-20) Unk 0 (15) 0.00% NA
Head and neck
Head and neck
T1 61 (20319) 0.30% 12 (4-25) N0 66 (32838) 0.20% 6.5 (2.0-14.0) 1 156 (19536) 0.80% 6 (1-13)
T2 85 (16547) 0.51% 8 (3-16) N1 99 (9279) 1.07% 8 (3-22) 2 134 (18171) 0.74% 8 (2-17)
T3 72 (10184) 0.71% 6 (2-15) N2 198 (20007) 0.99% 7 (2-15) 3 79 (13967) 0.57% 7 (3-18)
T4 152 (11329) 1.34% 7 (2-14) N3 61 (2040) 2.99% 7 (2-23) 4 118 (15437) 0.76% 10 (4-22)
Unk 119 (8840) 1.35% 7 (2-18) Unk 65 (3055) 2.13% 7 (1-18) Unk 2 (108) 1.85% 2 (0-4)
Thyroid Thyroid T1 8 (37543) 0.02% 20.0 (8.5-31.0) N0 32 (49559) 0.06% 7.0 (1.5-20.0) 1 29 (13814) 0.21% 6 (1-15)
T2 10 (10931) 0.09% 10 (6-42) N1 84 (15367) 0.55% 6 (2-31) 2 35 (18788) 0.19% 7 (2-53)
T3 27 (13117) 0.21% NA (5-NA) N2 0 (0) NA NA 3 32 (15338) 0.21% 6 (2-31)
T4 54 (2569) 2.10% 3 (1-8) N3 0 (0) NA NA 4 34 (17866) 0.19% 5 (1-42)
Unk 31 (1732) 1.79% 5 (1-11) Unk 14 (966) 1.45% 5 (0-8) Unk 0 (86) 0.00% NA
Breast All breast T1 412 (174202) 0.24% 24 (5-46) N0 975 (204593) 0.48% 12 (1-34) 1 1186 (70588) 1.68% 12 (2-31)
T2 1172 (91913) 1.28% 22 (5-56) N1 2019 (72596) 2.78% 18 (4-44) 2 1215 (87480) 1.39% 14 (2-41)
T3 655 (19505) 3.36% 20 (5-48) N2 438 (16143) 2.71% 22 (6-45) 3 1046 (67845) 1.54% 18 (3-45)
T4 1422 (13201) 10.77% 13 (2-34) N3 517 (10213) 5.06% 19 (6-43) 4 1072 (81164) 1.32% 18 (3-45)
Unk 865 (8659) 9.99% 5 (1-24) Unk 577 (3935) 14.66% 4 (1-22) Unk 8 (435) 1.84% 27.5 (1.5-48)
Her2-/HR+
T1 170 (129715) 0.13% 25 (7-44) N0 379 (144340) 0.26% 16 (2-37) 1 422 (45779) 0.92% 17 (4-35)
T2 467 (57471) 0.81% 27 (9-56) N1 763 (46695) 1.63% 21 (6-40) 2 443 (57894) 0.77% 19 (5-44)
T3 253 (11446) 2.21% 24 (10-41) N2 187 (10113) 1.85% 23 (8-41) 3 406 (47339) 0.86% 19 (5-39)

Epidemiology of liver metastasis
1496 Am J Cancer Res 2020;10(5):1477-1517
T4 509 (6292) 8.09% 15 (5-33) N3 182 (5740) 3.17% 20 (10-40) 4 408 (57152) 0.71% 23 (6-39)
Unk 285 (3523) 8.09% 8 (1-27) Unk 173 (1559) 11.10% 9 (1-32) Unk 5 (283) 1.77% 48 (48-48)
Her2+/HR-
T1 54 (5537) 0.98% 36 (17-43) N0 107 (7096) 1.51% 16 (1-50) 1 145 (3244) 4.47% 19 (3-41)
T2 153 (4833) 3.17% 34 (9-NA) N1 318 (4311) 7.38% 34 (7-NA) 2 174 (3896) 4.47% 22 (4-57)
T3 110 (1342) 8.20% 62 (8-62) N2 62 (1045) 5.93% 22 (4-46) 3 158 (2911) 5.43% 43 (4-NA)
T4 229 (1364) 16.79% 22 (5-48) N3 81 (904) 8.96% 31 (10-NA) 4 147 (3435) 4.28% 28 (6-NA)
Unk 78 (430) 18.14% 5 (1-33) Unk 56 (150) 37.33% 5 (1-24) Unk 0 (20) 0.00% NA
Her2+/HR+
T1 95 (14556) 0.65% 33 (12-NA) N0 183 (17968) 1.02% 20 (2-66) 1 225 (7373) 3.05% 22 (5-43)
T2 284 (11447) 2.48% 33 (9-NA) N1 439 (9332) 4.70% 34 (9-NA) 2 226 (8855) 2.55% 28 (4-NA)
T3 133 (2459) 5.41% 35 (7-NA) N2 97 (2186) 4.44% 41 (17-NA) 3 212 (6818) 3.11% 34 (7-NA)
T4 282 (1989) 14.18% 27 (5-53) N3 112 (1426) 7.85% 36 (9-NA) 4 240 (8123) 2.95% 40 (12-NA)
Unk 110 (779) 14.12% 21 (1-66) Unk 73 (318) 22.96% 17 (1-42) Unk 1 (61) 1.64% 1 (1-1)
Triple negative
T1 51 (13229) 0.39% 6 (2-20) N0 113 (20269) 0.56% 7 (1-15) 1 193 (8853) 2.18% 8 (3-15)
T2 149 (13191) 1.13% 11 (3-19) N1 264 (8073) 3.27% 9 (3-16) 2 147 (9280) 1.58% 7 (2-15)
T3 103 (2879) 3.58% 11 (3-23) N2 58 (1980) 2.93% 11 (4-18) 3 129 (6775) 1.90% 8 (2-23)
T4 210 (2243) 9.36% 6 (2-12) N3 97 (1623) 5.98% 8 (3-14) 4 100 (7302) 1.37% 8 (2-14)
Unk 56 (702) 7.98% 7 (2-12) Unk 37 (299) 12.37% 2 (0-9) Unk 0 (34) 0.00% NA
Unk status T1 42 (11165) 0.38% 14 (1-39) N0 193 (14920) 1.29% 2 (0-17) 1 201 (5339) 3.76% 2 (0-10)
T2 119 (4971) 2.39% 4 (0-35) N1 235 (4185) 5.62% 3 (0-18) 2 225 (7555) 2.98% 4 (0-20)
T3 56 (1379) 4.06% 2 (0-17) N2 34 (819) 4.15% 3 (0-14) 3 141 (4002) 3.52% 2 (0-17)
T4 192 (1313) 14.62% 1 (0-15) N3 45 (520) 8.65% 4 (0-25) 4 177 (5152) 3.44% 1.5 (0-20)
Unk 337 (3257) 10.35% 2 (0-15) Unk 239 (1641) 14.56% 2 (0-15) Unk 2 (37) 5.41% 3.5 (0-7)
Lung All lung T1 2172 (41700) 5.21% 4 (1-10) N0 4151 (80586) 5.15% 2 (0-7) 1 9041 (68720) 13.16% 2 (0-7)
T2 5817 (58125) 10.01% 3 (1-8) N1 1930 (17461) 11.05% 2 (1-8) 2 6854 (54764) 12.52% 2 (0-8)
T3 5893 (41907) 14.06% 2 (0-7) N2 13418 (76036) 17.65% 2 (0-8) 3 5647 (44002) 12.83% 3 (1-8)
T4 8433 (48418) 17.42% 2 (0-8) N3 5316 (28298) 18.79% 3 (1-9) 4 5351 (44638) 11.99% 3 (1-9)
Unk 4605 (22085) 20.85% 2 (0-7) Unk 2105 (9854) 21.36% 1 (0-6) Unk 46 (309) 14.89% 2 (0-7)
Adenocar-cinoma
T1 732 (17631) 4.15% 4 (1-11) N0 1355 (30843) 4.39% 3 (1-9) 1 2148 (22829) 9.41% 3 (1-7)
T2 1661 (22050) 7.53% 3 (1-10) N1 557 (6437) 8.65% 3 (1-10) 2 2146 (21483) 9.99% 3 (1-9)
T3 1857 (15208) 12.21% 3 (1-9) N2 3603 (27614) 13.05% 3 (1-9) 3 1663 (16967) 9.80% 3 (1-9)
T4 2397 (17238) 13.91% 3 (1-8) N3 1733 (11746) 14.75% 3 (1-10) 4 1878 (18889) 9.94% 4 (1-12)
Unk 1201 (8128) 14.78% 2 (1-7) Unk 600 (3615) 16.60% 2 (1-6) Unk 13 (87) 14.94% 2 (0-8)
Squamous cancer
T1 143 (6971) 2.05% 4 (1-9) N0 494 (17569) 2.81% 3 (1-8) 1 993 (15794) 6.29% 3 (1-7)
T2 656 (13237) 4.96% 4 (1-8) N1 231 (4088) 5.65% 3 (1-7) 2 650 (10312) 6.30% 2 (1-6)
T3 711 (9522) 7.47% 2 (1-6) N2 1345 (14419) 9.33% 2 (1-6) 3 593 (8342) 7.11% 3 (1-7)
T4 908 (9561) 9.50% 2 (1-7) N3 492 (4570) 10.77% 4 (1-7) 4 502 (7330) 6.85% 3 (1-7)
Unk 323 (2570) 12.57% 2 (0-6) Unk 179 (1215) 14.73% 1 (1-4) Unk 3 (83) 3.61% 7 (1-NA)
SCLC T1 655 (2770) 23.65% 4 (1-10) N0 880 (3833) 22.96% 2 (0-8) 1 3281 (10402) 31.54% 3 (0-8)
T2 1891 (6136) 30.82% 3 (0-9) N1 526 (1879) 27.99% 3 (1-9) 2 2112 (6468) 32.65% 3 (0-9)
T3 1638 (5092) 32.17% 3 (1-8) N2 4860 (14305) 33.97% 4 (0-9) 3 1827 (5399) 33.84% 4 (1-9)
T4 2915 (9007) 32.36% 4 (1-9) N3 1859 (5596) 33.22% 5 (1-9) 4 1453 (4472) 32.49% 4 (0-9)

Epidemiology of liver metastasis
1497 Am J Cancer Res 2020;10(5):1477-1517
Unk 1589 (3787) 41.96% 2 (0-8) Unk 563 (1179) 47.75% 2 (0-7) Unk 15 (51) 29.41% 7 (2-12)
Other T1 642 (14328) 4.48% 3 (0-8) N0 1422 (28341) 5.02% 1 (0-5) 1 2619 (19695) 13.30% 1 (0-4)
T2 1609 (16702) 9.63% 1 (0-5) N1 616 (5057) 12.18% 2 (0-6) 2 1946 (16501) 11.79% 1 (0-5)
T3 1687 (12085) 13.96% 1 (0-4) N2 3610 (19698) 18.33% 104 3 1564 (13294) 11.76% 1 (0-5)
T4 2213 (12612) 17.55% 1 (0-4) N3 1232 (6386) 19.29% 2 (0-5) 4 1518 (13947) 10.88% 1 (0-6)
Unk 1511 (7798) 19.38% 1 (0-4) Unk 782 (4043) 19.34% 1 (0-3) Unk 15 (88) 17.05% 1 (0-2)
GI Oesopha-gus
T1 643 (4526) 14.21% 4 (1-10) N0 723 (6897) 10.48% 3 (1-10) 1 802 (5049) 15.88% 3 (1-9)
T2 104 (1619) 6.42% 7 (3-18) N1 1391 (7075) 19.66% 5 (1-11) 2 756 (4689) 16.12% 4 (1-10)
T3 373 (5543) 6.73% 7 (3-12) N2 193 (1621) 11.91% 6 (2-11) 3 655 (3726) 17.58% 6 (1-11)
T4 455 (2073) 21.95% 4 (1-10) N3 124 (623) 19.90% 4 (1-9) 4 670 (3970) 16.88% 5 (1-11)
Unk 1309 (3714) 35.25% 3 (1-10) Unk 453 (1259) 35.98% 3 (1-9) Unk 1 (41) 2.44% 6 (6-6)
Stomach T1 909 (7054) 12.89% 4 (1-11) N0 1553 (13108) 11.85% 3 (1-10) 1 1083 (6403) 16.91% 3 (1-9)
T2 151 (2603) 5.80% 7 (2-15) N1 1743 (7262) 24.00% 5 (1-12) 2 1425 (8775) 16.24% 4 (1-10)
T3 515 (6563) 7.85% 7 (3-16) N2 216 (2381) 9.07% 7 (3-15) 3 904 (5486) 16.48% 5 (1-12)
T4 814 (4925) 16.53% 4 (1-10) N3 185 (2376) 7.79% 6 (2-13) 4 1144 (7041) 16.25% 5 (1-12)
Unk 2188 (6654) 32.88% 3 (1-10) Unk 880 (2672) 32.93% 2 (1-8) Unk 21 (94) 22.34% 5 (3-17)
Biliary tract
T1 392 (3110) 12.60% 4 (1-8) N0 1410 (9038) 15.60% 4 (1-9) 1 858 (3868) 22.18% 3 (1-8)
T2 470 (4191) 11.21% 5 (2-12) N1 917 (4438) 20.66% 4 (1-10) 2 1165 (5211) 22.36% 3 (1-9)
T3 824 (3933) 20.95% 4 (1-9) N2 189 (443) 42.66% 4 (1-7) 3 866 (3511) 24.67% 3 (1-9)
T4 258 (1468) 17.57% 4 (1-9) N3 0 (0) NA NA 4 1014 (4545) 22.31% 4 (1-10)
Unk 1967 (4455) 44.15% 3 (1-8) Unk 1395 (3238) 43.08% 3 (1-8) Unk 8 (22) 36.36% 2.5 (1-33)
All pan-creas
T1 462 (2331) 19.82% 5 (1-15) N0 8996 (24643) 36.51% 2 (1-7) 1 4800 (11797) 40.69% 2 (1-6)
T2 4962 (9994) 49.65% 4 (1-11) N1 5673 (15663) 36.22% 3 (1-8) 2 5112 (12977) 39.39% 2 (1-7)
T3 4618 (17207) 26.84% 8 (2-24) N2 0 (0) NA NA 3 4013 (9849) 40.75% 2 (1-8)
T4 2861 (7749) 36.92% 5 (1-14) N3 0 (0) NA NA 4 4542 (11604) 39.14% 3 (1-8)
Unk 5581 (8978) 62.16% 3 (0-10) Unk 3815 (5953) 64.09% 2 (0-5) Unk 23 (49) 46.94% 1 (0-4)
Head of pancreas
T1 240 (1156) 20.76% 3 (1-8) N0 3557 (13278) 26.79% 3 (1-8) 1 1902 (6525) 29.15% 3 (1-7)
T2 1938 (5034) 38.50% 3 (1-8) N1 2453 (9673) 25.36% 3 (1-9) 2 1998 (7024) 28.45% 3 (1-8)
T3 2352 (12019) 19.57% 3 (1-9) N2 0 (0) NA NA 3 1568 (5357) 29.27% 3 (1-9)
T4 1092 (3831) 28.50% 3 (1-9) N3 0 (0) NA NA 4 1673 (6040) 27.70% 3 (1-9)
Unk 1529 (2935) 52.10% 2 (0-6) Unk 1141 (2024) 56.37% 2 (0-6) Unk 10 (29) 34.48% 2 (0-4)
Body of pancreas
T1 103 (458) 22.49% 2 (1-9) N0 1657 (3906) 42.42% 3 (1-8) 1 808 (1694) 47.70% 2 (0-6)
T2 1021 (1760) 58.01% 2 (0-6) N1 1053 (2276) 46.27% 3 (1-8) 2 850 (1943) 43.75% 2 (1-7)
T3 722 (1885) 38.30% 4 (1-11) N2 0 (0) NA NA 3 709 (1455) 48.73% 3 (1-10)
T4 688 (1868) 36.83% 4 (1-9) N3 0 (0) NA NA 4 796 (1796) 44.32% 3 (1-8)
Unk 631 (923) 68.36% 1 (0-6) Unk 455 (712) 63.90% 2 (0-6) Unk 2 (6) 33.33% 0 (0-0)
Tail of pancreas
T1 76 (515) 14.76% 3 (0-8) N0 2447 (4570) 53.54% 2 (1-7) 1 1183 (1972) 59.99% 2 (0-6)
T2 1612 (2479) 65.03% 2 (1-7) N1 1255 (2156) 58.21% 2 (1-9) 2 1202 (2063) 58.26% 2 (1-7)
T3 1143 (2304) 49.61% 3 (1-10) N2 0 (0) NA NA 3 975 (1694) 57.56% 2 (0-8)
T4 637 (1140) 55.88% 2 (1-7) N3 0 (0) NA NA 4 1155 (2052) 56.29% 2 (1-8)

Epidemiology of liver metastasis
1498 Am J Cancer Res 2020;10(5):1477-1517
Unk 1056 (1354) 77.99% 1 (0-5) Unk 822 (1066) 77.11% 2 (0-5) Unk 9 (11) 81.82% 1 (0-6)
Unspeci-fied pan-creas
T1 43 (202) 21.29% 3 (1-9) N0 1335 (2889) 46.21% 2 (0-5) 1 907 (1606) 56.48% 1 (0-4)
T2 391 (721) 54.23% 2 (0-6) N1 912 (1558) 58.54% 2 (0-6) 2 1062 (1947) 54.55% 2 (0-5)
T3 401 (999) 40.14% 2 (1-6) N2 0 (0) NA NA 3 761 (1343) 56.66% 1 (0-5)
T4 444 (910) 48.79% 2 (0-6) N3 0 (0) NA NA 4 918 (1716) 53.50% 2 (0-6)
Unk 2371 (3783) 62.68% 1 (0-5) Unk 1403 (2168) 64.71% 1 (0-5) Unk 2 (3) 66.67% 1 (1-1)
Small intestine
T1 88 (1390) 6.33% 4 (1-11) N0 481 (4025) 11.95% 14 (2-NA) 1 386 (2326) 16.60% 29 (4-NA)
T2 101 (1091) 9.26% NA (35-NA) N1 742 (3488) 21.27% 61 (13-NA) 2 386 (2214) 17.43% 18 (3-NA)
T3 410 (2498) 16.41% NA (25-NA) N2 54 (361) 14.96% 7 (3-19) 3 325 (1855) 17.52% 42 (4-NA)
T4 422 (2012) 20.97% 27 (5-NA) N3 0 (0) NA NA 4 352 (1889) 18.63% 39 (6-NA)
Unk 428 (1297) 33.00% 9 (2-50) Unk 172 (414) 41.55% 6 (2-27) Unk 0 (4) 0.00% NA
Colon & rectum
T1 2724 (30750) 8.86% 9 (2-23) N0 8300 (93213) 8.90% 10 (2-27) 1 7310 (44332) 16.49% 11 (2-27)
T2 556 (19122) 2.91% 22 (8-53) N1 8491 (41830) 20.30% 16 (4-34) 2 7468 (47291) 15.79% 11 (2-27)
T3 8354 (72009) 11.60% 22 (8-42) N2 5413 (21050) 25.71% 17 (6-32) 3 5274 (32748) 16.10% 13 (3-30)
T4 5962 (24742) 24.10% 13 (3-28) N3 0 (0) NA NA 4 5969 (38318) 15.58% 14 (3-32)
Unk 8481 (16415) 51.67% 5 (1-17) Unk 3873 (6945) 55.77% 4 (1-14) Unk 62 (366) 16.94% 7 (2-21)
Right colon
T1 945 (9067) 10.42% 4 (1-16) N0 2705 (37936) 7.13% 7 (1-20) 1 2977 (18741) 15.88% 9 (2-23)
T2 188 (8560) 2.20% 17 (5-39) N1 3359 (16792) 20.00% 12 (3-29) 2 2765 (19297) 14.33% 9 (2-22)
T3 3360 (32634) 10.30% 17 (5-35) N2 2800 (10418) 26.88% 13 (4-25) 3 2028 (13511) 15.01% 10 (2-23)
T4 2815 (12270) 22.94% 10 (3-23) N3 0 (0) NA NA 4 2223 (15316) 14.51% 11 (2-27)
Unk 2709 (4483) 60.43% 4 (1-13) Unk 1153 (1868) 61.72% 3 (0-11) Unk 24 (149) 16.11% 5 (1-20)
Left colon T1 997 (11314) 8.81% 11 (2-26) N0 3185 (30470) 10.45% 14 (3-32) 1 2488 (14170) 17.56% 15 (4-32)
T2 180 (5930) 3.04% 32 (11-NA) N1 3010 (13958) 21.56% 20 (7-40) 2 2690 (15704) 17.13% 15 (3-33)
T3 3147 (23134) 13.60% 26 (10-49) N2 1992 (7363) 27.05% 22 (9-40) 3 1917 (10752) 17.83% 18 (4-37)
T4 2325 (8860) 26.24% 17 (5-33) N3 0 (0) NA NA 4 2240 (13002) 17.23% 19 (5-38)
Unk 2706 (4518) 59.89% 7 (1-21) Unk 1168 (1965) 59.44% 6 (1-18) Unk 20 (128) 15.63% 11 (2-36)
Unspeci-fied colon
T1 82 (268) 30.60% 3 (0-10) N0 662 (1412) 46.88% 2 (0-7) 1 488 (894) 54.59% 2 (0-8)
T2 4 (51) 7.84% 3.5 (2.5-21.0) N1 214 (379) 56.46% 3 (1-10) 2 549 (1043) 52.64% 2 (0-8)
T3 71 (272) 26.10% 9 (1-29) N2 48 (140) 34.29% 6 (2-18) 3 346 (619) 55.90% 2 (0-8)
T4 141 (368) 38.32% 2 (1-10) N3 0 (0) NA NA 4 389 (706) 55.10% 2 (0-8)
Unk 1476 (2306) 64.01% 1 (0-7) Unk 850 (1334) 63.72% 1 (0-7) Unk 2 (3) 66.67% 3.5 (0-7)
Rectum T1 700 (10101) 6.93% 14 (4-29) N0 1748 (23395) 7.47% 15 (5-31) 1 1357 (10527) 12.89% 15 (5-33)
T2 184 (4581) 4.02% 21 (9-56) N1 1908 (10701) 17.83% 19 (7-38) 2 1464 (11247) 13.02% 15 (5-29)
T3 1776 (15969) 11.12% 24 (11-46) N2 573 (3129) 18.31% 24 (11-43) 3 983 (7866) 12.50% 18 (7-36)
T4 681 (3244) 20.99% 14 (5-27) N3 0 (0) NA NA 4 1117 (9294) 12.02% 19 (7-37)
Unk 1596 (5125) 31.14% 11 (3-24) Unk 708 (1795) 39.44% 11 (3-22) Unk 16 (86) 18.60% 14 (3.5-25)
Anus T1 14 (1384) 1.01% 15 (2-35) N0 62 (4458) 1.39% 13 (5-29) 1 53 (1731) 3.06% 10 (4-26)
T2 44 (2420) 1.82% 27 (9-38) N1 41 (575) 7.13% 13 (5-27) 2 65 (1931) 3.37% 14 (8-24)
T3 37 (977) 3.79% 15 (8-25) N2 37 (821) 4.51% 19 (10-36) 3 35 (1420) 2.46% 14 (4-23)
T4 28 (529) 5.29% 13 (4-26) N3 29 (587) 4.94% 26 (10-38) 4 45 (1602) 2.81% 21 (11-38)
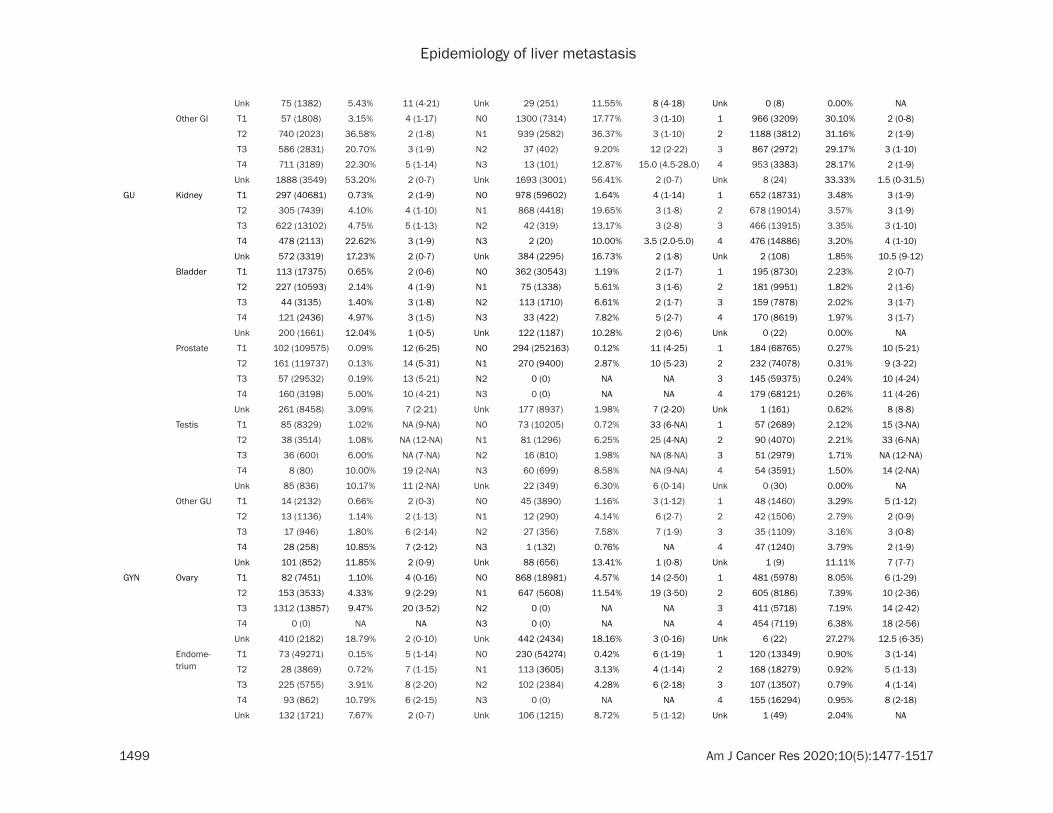
Epidemiology of liver metastasis
1499 Am J Cancer Res 2020;10(5):1477-1517
Unk 75 (1382) 5.43% 11 (4-21) Unk 29 (251) 11.55% 8 (4-18) Unk 0 (8) 0.00% NA
Other GI T1 57 (1808) 3.15% 4 (1-17) N0 1300 (7314) 17.77% 3 (1-10) 1 966 (3209) 30.10% 2 (0-8)
T2 740 (2023) 36.58% 2 (1-8) N1 939 (2582) 36.37% 3 (1-10) 2 1188 (3812) 31.16% 2 (1-9)
T3 586 (2831) 20.70% 3 (1-9) N2 37 (402) 9.20% 12 (2-22) 3 867 (2972) 29.17% 3 (1-10)
T4 711 (3189) 22.30% 5 (1-14) N3 13 (101) 12.87% 15.0 (4.5-28.0) 4 953 (3383) 28.17% 2 (1-9)
Unk 1888 (3549) 53.20% 2 (0-7) Unk 1693 (3001) 56.41% 2 (0-7) Unk 8 (24) 33.33% 1.5 (0-31.5)
GU Kidney T1 297 (40681) 0.73% 2 (1-9) N0 978 (59602) 1.64% 4 (1-14) 1 652 (18731) 3.48% 3 (1-9)
T2 305 (7439) 4.10% 4 (1-10) N1 868 (4418) 19.65% 3 (1-8) 2 678 (19014) 3.57% 3 (1-9)
T3 622 (13102) 4.75% 5 (1-13) N2 42 (319) 13.17% 3 (2-8) 3 466 (13915) 3.35% 3 (1-10)
T4 478 (2113) 22.62% 3 (1-9) N3 2 (20) 10.00% 3.5 (2.0-5.0) 4 476 (14886) 3.20% 4 (1-10)
Unk 572 (3319) 17.23% 2 (0-7) Unk 384 (2295) 16.73% 2 (1-8) Unk 2 (108) 1.85% 10.5 (9-12)
Bladder T1 113 (17375) 0.65% 2 (0-6) N0 362 (30543) 1.19% 2 (1-7) 1 195 (8730) 2.23% 2 (0-7)
T2 227 (10593) 2.14% 4 (1-9) N1 75 (1338) 5.61% 3 (1-6) 2 181 (9951) 1.82% 2 (1-6)
T3 44 (3135) 1.40% 3 (1-8) N2 113 (1710) 6.61% 2 (1-7) 3 159 (7878) 2.02% 3 (1-7)
T4 121 (2436) 4.97% 3 (1-5) N3 33 (422) 7.82% 5 (2-7) 4 170 (8619) 1.97% 3 (1-7)
Unk 200 (1661) 12.04% 1 (0-5) Unk 122 (1187) 10.28% 2 (0-6) Unk 0 (22) 0.00% NA
Prostate T1 102 (109575) 0.09% 12 (6-25) N0 294 (252163) 0.12% 11 (4-25) 1 184 (68765) 0.27% 10 (5-21)
T2 161 (119737) 0.13% 14 (5-31) N1 270 (9400) 2.87% 10 (5-23) 2 232 (74078) 0.31% 9 (3-22)
T3 57 (29532) 0.19% 13 (5-21) N2 0 (0) NA NA 3 145 (59375) 0.24% 10 (4-24)
T4 160 (3198) 5.00% 10 (4-21) N3 0 (0) NA NA 4 179 (68121) 0.26% 11 (4-26)
Unk 261 (8458) 3.09% 7 (2-21) Unk 177 (8937) 1.98% 7 (2-20) Unk 1 (161) 0.62% 8 (8-8)
Testis T1 85 (8329) 1.02% NA (9-NA) N0 73 (10205) 0.72% 33 (6-NA) 1 57 (2689) 2.12% 15 (3-NA)
T2 38 (3514) 1.08% NA (12-NA) N1 81 (1296) 6.25% 25 (4-NA) 2 90 (4070) 2.21% 33 (6-NA)
T3 36 (600) 6.00% NA (7-NA) N2 16 (810) 1.98% NA (8-NA) 3 51 (2979) 1.71% NA (12-NA)
T4 8 (80) 10.00% 19 (2-NA) N3 60 (699) 8.58% NA (9-NA) 4 54 (3591) 1.50% 14 (2-NA)
Unk 85 (836) 10.17% 11 (2-NA) Unk 22 (349) 6.30% 6 (0-14) Unk 0 (30) 0.00% NA
Other GU T1 14 (2132) 0.66% 2 (0-3) N0 45 (3890) 1.16% 3 (1-12) 1 48 (1460) 3.29% 5 (1-12)
T2 13 (1136) 1.14% 2 (1-13) N1 12 (290) 4.14% 6 (2-7) 2 42 (1506) 2.79% 2 (0-9)
T3 17 (946) 1.80% 6 (2-14) N2 27 (356) 7.58% 7 (1-9) 3 35 (1109) 3.16% 3 (0-8)
T4 28 (258) 10.85% 7 (2-12) N3 1 (132) 0.76% NA 4 47 (1240) 3.79% 2 (1-9)
Unk 101 (852) 11.85% 2 (0-9) Unk 88 (656) 13.41% 1 (0-8) Unk 1 (9) 11.11% 7 (7-7)
GYN Ovary T1 82 (7451) 1.10% 4 (0-16) N0 868 (18981) 4.57% 14 (2-50) 1 481 (5978) 8.05% 6 (1-29)
T2 153 (3533) 4.33% 9 (2-29) N1 647 (5608) 11.54% 19 (3-50) 2 605 (8186) 7.39% 10 (2-36)
T3 1312 (13857) 9.47% 20 (3-52) N2 0 (0) NA NA 3 411 (5718) 7.19% 14 (2-42)
T4 0 (0) NA NA N3 0 (0) NA NA 4 454 (7119) 6.38% 18 (2-56)
Unk 410 (2182) 18.79% 2 (0-10) Unk 442 (2434) 18.16% 3 (0-16) Unk 6 (22) 27.27% 12.5 (6-35)
Endome-trium
T1 73 (49271) 0.15% 5 (1-14) N0 230 (54274) 0.42% 6 (1-19) 1 120 (13349) 0.90% 3 (1-14)
T2 28 (3869) 0.72% 7 (1-15) N1 113 (3605) 3.13% 4 (1-14) 2 168 (18279) 0.92% 5 (1-13)
T3 225 (5755) 3.91% 8 (2-20) N2 102 (2384) 4.28% 6 (2-18) 3 107 (13507) 0.79% 4 (1-14)
T4 93 (862) 10.79% 6 (2-15) N3 0 (0) NA NA 4 155 (16294) 0.95% 8 (2-18)
Unk 132 (1721) 7.67% 2 (0-7) Unk 106 (1215) 8.72% 5 (1-12) Unk 1 (49) 2.04% NA

Epidemiology of liver metastasis
1500 Am J Cancer Res 2020;10(5):1477-1517
Cervix T1 12 (2517) 0.48% 8.5 (1.5-11.0) N0 18 (2864) 0.63% 8 (2-11) 1 10 (809) 1.24% 10.5 (8-21)
T2 9 (634) 1.42% 11 (8-25) N1 20 (692) 2.89% 10 (5-15) 2 15 (1159) 1.29% 8 (2-11)
T3 5 (316) 1.58% 28 (1-33) N2 0 (0) NA NA 3 9 (820) 1.10% 10 (0-28)
T4 6 (71) 8.45% 10.0 (9.5-12.5) N3 0 (0) NA NA 4 6 (858) 0.70% 7 (3-12.5)
Unk 8 (113) 7.08% 7 (2-8) Unk 2 (95) 2.11% 6 (2-10) Unk 0 (5) 0.00% NA
Uterus T1 47 (8549) 0.55% 6 (1-12) N0 131 (11536) 1.14% 5 (1-12) 1 142 (4704) 3.02% 4 (1-10)
T2 64 (3483) 1.84% 7 (1-14) N1 209 (4119) 5.07% 5 (2-11) 2 145 (5345) 2.71% 3 (1-9)
T3 164 (2999) 5.47% 5 (2-12) N2 23 (192) 11.98% 1 (0-7) 3 99 (3215) 3.08% 6 (2-12)
T4 75 (732) 10.25% 4 (2-10) N3 0 (0) NA NA 4 90 (3437) 2.62% 4 (1-15)
Unk 126 (957) 13.17% 2 (0-7) Unk 113 (873) 12.94% 3 (1-11) Unk 0 (19) 0.00% NA
Other GYN T1 13 (4889) 0.27% 15 (3-NA) N0 40 (5876) 0.68% 32 (8-NA) 1 49 (2381) 2.06% 10 (1-27)
T2 11 (1225) 0.90% NA (8-NA) N1 44 (1261) 3.49% 15 (3-49) 2 50 (2434) 2.05% 8 (2-52)
T3 58 (1525) 3.80% 32 (14-52) N2 4 (435) 0.92% 10.0 (5.5-NA) 3 30 (1817) 1.65% 15 (1-NA)
T4 8 (125) 6.40% 6 (2-14) N3 2 (81) 2.47% 21 (21-21) 4 55 (2032) 2.71% 15 (2-49)
Unk 96 (914) 10.50% 3 (1-18) Unk 96 (1025) 9.37% 4 (1-19) Unk 2 (14) 14.29% 12 (5-19)
Melanoma Melanoma T1 31 (61151) 0.05% 6 (2-21) N0 172 (84955) 0.20% 5 (2-13) 1 135 (19529) 0.69% 4 (2-10)
T2 23 (13506) 0.17% 5 (1-9) N1 102 (3989) 2.56% 4 (2-14) 2 192 (24327) 0.79% 4 (1-10)
T3 45 (8128) 0.55% 8 (3-14) N2 31 (1868) 1.66% 8 (3-NA) 3 116 (23405) 0.50% 4 (1-11)
T4 131 (5953) 2.20% 6 (3-15) N3 53 (1053) 5.03% 5 (3-9) 4 150 (27245) 0.55% 5 (2-12)
Unk 363 (5806) 6.25% 4 (1-9) Unk 235 (2679) 8.77% 3 (1-8) Unk 0 (38) 0.00% NA
Sarcoma Sarcoma T1 66 (7603) 0.87% 11 (3-24) N0 745 (21855) 3.41% 15 (4-47) 1 338 (6914) 4.89% 8 (1-30)
T2 311 (10539) 2.95% 11 (3-31) N1 204 (1677) 12.16% 6 (1-26) 2 424 (8929) 4.75% 8 (2-27)
T3 215 (2783) 7.73% 12 (2-65) N2 37 (502) 7.37% 2 (0-7) 3 266 (6285) 4.23% 12 (2-38)
T4 168 (1343) 12.51% 18 (3-NA) N3 8 (59) 13.56% 1.0 (0.0-2.5) 4 342 (7622) 4.49% 13 (2-40)
Unk 613 (7512) 8.16% 6 (1-26) Unk 379 (5687) 6.66% 5 (1-19) Unk 3 (30) 10.00% 4 (0-6)
All other All other T1 18 (3922) 0.46% 4 (2-8) N0 239 (9790) 2.44% 7 (3-23) 1 600 (4883) 12.29% 1 (0-7)
T2 103 (3091) 3.33% 10 (3-24) N1 111 (1356) 8.19% 13 (3-35) 2 669 (6185) 10.82% 1 (0-7)
T3 135 (2642) 5.11% 13 (4-35) N2 27 (772) 3.50% 4 (1-7) 3 549 (4702) 11.68% 2 (0-9)
T4 75 (1037) 7.23% 3 (1-8) N3 4 (92) 4.35% 1 (0-2) 4 515 (5837) 8.82% 1 (0-7)
Unk 2007 (10933) 18.36% 1 (0-5) Unk 1957 (9615) 20.35% 1 (0-5) Unk 5 (18) 27.78% 1 (0-2)Abbreviations: LM: liver metastasis; IQR: interquartile range; Unk: unknown; HER-2: Human epidermal growth factor receptor-2; HR: hormone receptor; SCLC: small cell lung cancer; GI: gastrointestinal cancer; NOS: not otherwise specified; GU: genitourinary cancer; GYN: gynecologic cancer; NA: non-applicable. aboth the county-level education and unemployment are presented as quantiles here.
Table 5. Number of cases with LM and all cases, incidence of LM and median survival with IQR by cancer type and insurance status or marital status
Site Subsite Insurance Number of LM (All) Incidence Median survival (IQR) Marriage Number of LM
(All) Incidence Median survival (IQR)
All All Insured 98159 (1506256) 6.52% 4 (1-14) Married 52139 (879631) 5.93% 6 (1-17)Uninsured 4669 (44919) 10.39% 4 (1-14) Unmarried 48052 (611941) 7.85% 3 (1-12)
Unk 2501 (79550) 3.14% 2 (0-10) Unk 5138 (139153) 3.69% 4 (1-15)

Epidemiology of liver metastasis
1501 Am J Cancer Res 2020;10(5):1477-1517
Brain Brain Insured 9 (21556) 0.04% 13.0 (4.5-32.0) Married 5 (13377) 0.04% 11 (7-15)Uninsured 1 (993) 0.10% 16 (16-16) Unmarried 5 (8523) 0.06% 10 (2.5-18)
Unk 1 (425) 0.24% 4 (4-4) Unk 1 (1074) 0.09% NAHead and neck Head and neck Insured 446 (61646) 0.72% 7 (2-18) Married 209 (34134) 0.61% 10 (3-20)
Uninsured 35 (2912) 1.20% 6 (2-13) Unmarried 251 (27483) 0.91% 6 (2-14)Unk 8 (2638) 0.30% 8.5 (5.0-11.0) Unk 29 (5579) 0.52% 5 (1-10)
Thyroid Thyroid Insured 125 (62535) 0.20% 6 (2-31) Married 64 (39698) 0.16% 10 (2-42)Uninsured 3 (1831) 0.16% 5 (3-NA) Unmarried 58 (21938) 0.26% 4 (1-10)
Unk 0 (1437) 0.00% NA Unk 6 (4167) 0.14% 9 (5-13)Breast All breast Insured 4184 (295949) 1.41% 16 (3-41) Married 1920 (167763) 1.14% 21 (5-48)
Uninsured 239 (5541) 4.31% 6 (0-23) Unmarried 2332 (122764) 1.90% 12 (2-33)Unk 104 (6022) 1.73% 8 (1-31) Unk 275 (16985) 1.62% 13 (1-35)
Her2-/HR+ Insured 1584 (201795) 0.78% 20 (5-40) Married 731 (115157) 0.63% 24 (8-46)Uninsured 72 (3153) 2.28% 8 (1-17) Unmarried 851 (82447) 1.03% 15 (3-32)
Unk 28 (3499) 0.80% 16 (4-31) Unk 102 (10843) 0.94% 14 (3-50)Her2+/HR- Insured 595 (12982) 4.58% 27 (5-62) Married 290 (7517) 3.86% 34 (10-62)
Uninsured 22 (323) 6.81% NA (0-NA) Unmarried 301 (5297) 5.68% 18 (3-49)Unk 7 (201) 3.48% 8.5 (3.0-14.0) Unk 33 (692) 4.77% 13 (2-22)
Her2+/HR+ Insured 840 (30017) 2.80% 30 (6-NA) Married 395 (17565) 2.25% 34 (8-NA)Uninsured 48 (719) 6.68% 24 (5-49) Unmarried 455 (12119) 3.75% 27 (5-NA)
Unk 16 (494) 3.24% 35 (17-45) Unk 54 (1546) 3.49% 27 (4-NA)Triple negative Insured 525 (30989) 1.69% 8 (2-17) Married 239 (17103) 1.40% 11 (3-18)
Uninsured 34 (773) 4.40% 2 (1-8) Unmarried 298 (13435) 2.22% 6 (2-13)Unk 10 (482) 2.07% 5 (2-11) Unk 32 (1706) 1.88% 7 (1-17)
Unk status Insured 636 (20156) 3.16% 2 (0-18) Married 264 (10413) 2.54% 3 (0-22)Uninsured 63 (573) 10.99% 1 (0-10) Unmarried 422 (9451) 4.47% 2 (0-15)
Unk 40 (1325) 3.02% 2 (0-18) Unk 53 (2190) 2.42% 3 (0-14)Lung All lung Insured 25242 (201530) 12.53% 2 (0-8) Married 13095 (103114) 12.70% 3 (1-9)
Uninsured 1090 (6669) 16.34% 2 (0-6) Unmarried 12615 (99339) 12.70% 2 (0-7)Unk 607 (4234) 14.34% 1 (0-5) Unk 1229 (9980) 12.31% 2 (0-7)
Adenocarcinoma Insured 7384 (76300) 9.68% 3 (1-9) Married 4048 (40485) 10.00% 4 (1-10)Uninsured 325 (2605) 12.48% 2 (1-6) Unmarried 3419 (35960) 9.51% 2 (1-8)
Unk 122 (1280) 9.53% 2 (0-8) Unk 364 (3740) 9.73% 3 (1-9)Squamous cancer Insured 2563 (40099) 6.39% 3 (1-7) Married 1313 (20125) 6.52% 3 (1-8)
Uninsured 126 (1133) 11.12% 3 (1-7) Unmarried 1283 (19775) 6.49% 2 (1-6)Unk 48 (591) 8.12% 1 (0-4) Unk 141 (1923) 7.33% 2 (1-5)

Epidemiology of liver metastasis
1502 Am J Cancer Res 2020;10(5):1477-1517
SCLC Insured 8196 (25348) 32.33% 4 (0-9) Married 4298 (12824) 33.52% 4 (1-9)Uninsured 333 (999) 33.33% 2 (0-8) Unmarried 4047 (12827) 31.55% 3 (0-8)
Unk 145 (423) 34.28% 2 (0-8) Unk 329 (1119) 29.40% 3 (0-9)Other Insured 7074 (59682) 11.85% 1 (0-5) Married 3417 (29603) 11.54% 2 (0-6)
Uninsured 305 (1927) 15.83% 1 (0-3) Unmarried 3838 (30642) 12.53% 1 (0-3)Unk 268 (1814) 14.77% 1 (0-3) Unk 392 (3178) 12.33% 1 (0-4)
GI Oesophagus Insured 2662 (16389) 16.24% 4 (1-10) Married 1546 (9291) 16.64% 5 (1-12)Uninsured 140 (641) 21.84% 3 (1-5) Unmarried 1201 (7195) 16.69% 3 (1-8)
Unk 79 (439) 18.00% 3 (1-7) Unk 134 (983) 13.63% 4 (1-11)Stomach Insured 4232 (25891) 16.35% 4 (1-11) Married 2588 (15347) 16.86% 5 (1-12)
Uninsured 237 (1152) 20.57% 3 (1-7) Unmarried 1781 (10873) 16.38% 3 (1-9)Unk 101 (733) 13.78% 4 (1-14) Unk 201 (1556) 12.92% 5 (1-14)
Biliary tract Insured 3688 (16299) 22.63% 3 (1-9) Married 2029 (9074) 22.36% 4 (1-10)Uninsured 137 (542) 25.28% 3 (1-8) Unmarried 1708 (7307) 23.37% 2 (1-7)
Unk 81 (296) 27.36% 2 (0-6) Unk 169 (756) 22.35% 4 (1-13)All pancreas Insured 17404 (43795) 39.74% 2 (1-7) Married 9666 (24551) 39.37% 3 (1-9)
Uninsured 616 (1394) 44.19% 2 (1-7) Unmarried 7930 (19572) 40.52% 2 (0-5)Unk 470 (1087) 43.24% 1 (0-4) Unk 894 (2153) 41.52% 2 (1-6)
Head of pancreas Insured 6770 (23835) 28.40% 3 (1-8) Married 3741 (13219) 28.30% 4 (1-9)Uninsured 248 (730) 33.97% 3 (1-8) Unmarried 3093 (10602) 29.17% 2 (1-6)
Unk 117 (383) 30.55% 2 (0-4) Unk 301 (1127) 26.71% 2 (1-7)Body of pancreas Insured 3017 (6575) 45.89% 3 (1-8) Married 1686 (3788) 44.51% 3 (1-9)
Uninsured 98 (199) 49.25% 2 (1-7) Unmarried 1329 (2795) 47.55% 2 (0-6)Unk 50 (118) 42.37% 2 (0-6) Unk 150 (309) 48.54% 2 (1-7)
Tail of pancreas Insured 4277 (7408) 57.73% 2 (1-7) Married 2477 (4383) 56.51% 3 (1-9)Uninsured 158 (249) 63.45% 1 (1-5) Unmarried 1830 (3055) 59.90% 1 (0-5)
Unk 86 (130) 66.15% 2 (0-6) Unk 214 (349) 61.32% 2 (1-7)Unspecified pancreas Insured 3322 (5942) 55.91% 2 (0-5) Married 1750 (3139) 55.75% 2 (0-6)
Uninsured 112 (214) 52.34% 2 (1-6) Unmarried 1665 (3093) 53.83% 1 (0-4)Unk 203 (433) 46.88% 1 (0-3) Unk 222 (357) 0.62 2 (0-5)
Small intestine Insured 1381 (7845) 17.60% 32 (4-NA) Married 842 (4695) 17.93% 41 (6-NA)Uninsured 47 (230) 20.43% 26 (4-NA) Unmarried 536 (3067) 17.48% 17 (2-NA)
Unk 21 (189) 11.11% 16 (2-33) Unk 71 (502) 14.14% 36 (5-NA)Colon & rectum Insured 24080 (152768) 15.76% 12 (3-29) Married 12692 (83522) 15.20% 16 (4-33)
Uninsured 1369 (5759) 23.77% 11 (2-27) Unmarried 12046 (69255) 17.39% 9 (2-24)Unk 634 (4528) 14.00% 5 (1-22) Unk 1345 (10278) 13.09% 13 (2-29)

Epidemiology of liver metastasis
1503 Am J Cancer Res 2020;10(5):1477-1517
Right colon Insured 9396 (63806) 14.73% 10 (2-23) Married 4899 (33493) 14.63% 12 (3-28)Uninsured 431 (1919) 22.46% 10 (2-24) Unmarried 4619 (29843) 15.48% 7 (1-20)
Unk 183 (1248) 14.66% 5 (1-18) Unk 492 (3637) 13.53% 8 (2-21)Left colon Insured 8592 (50039) 17.17% 17 (4-35) Married 4729 (28051) 16.86% 20 (6-40)
Uninsured 547 (2192) 24.95% 14 (3-30) Unmarried 4110 (22186) 18.53% 12 (3-29)Unk 203 (1493) 13.60% 10 (1-31) Unk 503 (3487) 14.43% 17 (3-40)
Unspecified colon Insured 1551 (2780) 55.79% 2 (0-8) Married 699 (1316) 53.12% 2 (0-9)Uninsured 99 (163) 60.74% 2 (0-9) Unmarried 966 (1695) 56.99% 2 (0-7)
Unk 120 (306) 39.22% 2 (0-8) Unk 105 (238) 44.12% 3 (0-17)Rectum Insured 4537 (36106) 12.57% 17 (6-33) Married 2361 (20643) 11.44% 21 (8-38)
Uninsured 292 (1484) 19.68% 15 (4-30) Unmarried 2326 (15463) 15.04% 12 (4-27)Unk 101 (1419) 7.12% 13 (3-33) Unk 243 (2903) 8.37% 20 (6-37)
Anus Insured 187 (6237) 3.00% 15 (7-29) Married 62 (2575) 2.41% 16 (8-23)Uninsured 9 (294) 3.06% 6 (2-8) Unmarried 127 (3675) 3.46% 13 (4-32)
Unk 2 (161) 1.24% 4 (1-7) Unk 9 (442) 2.04% 20 (11-25)Other GI Insured 3760 (12598) 29.85% 2 (1-9) Married 2056 (7088) 29.01% 3 (1-11)
Uninsured 144 (490) 29.39% 2 (1-6) Unmarried 1727 (5631) 30.67% 2 (0-7)Unk 72 (296) 24.32% 1.5 (0.5-5.0) Unk 193 (665) 29.02% 3 (1-9)
GU Kidney Insured 2115 (63268) 3.34% 3 (1-10) Married 1184 (38696) 3.06% 4 (1-11)Uninsured 106 (2047) 5.18% 3 (1-10) Unmarried 979 (24147) 4.05% 2 (1-7)
Unk 48 (1199) 4.00% 1.0 (0.0-4.5) Unk 106 (3671) 2.89% 4 (1-12)Bladder Insured 664 (33238) 2.00% 2 (1-7) Married 325 (19290) 1.68% 3 (1-8)
Uninsured 26 (784) 3.32% 2 (0-6) Unmarried 344 (13574) 2.53% 2 (1-6)Unk 15 (1166) 1.29% 2 (1-4) Unk 36 (2324) 1.55% 2 (0-7)
Prostate Insured 664 (33238) 2.00% 10 (4-23) Married 325 (19290) 1.68% 10 (4-22)Uninsured 26 (784) 3.32% 13 (5-30) Unmarried 344 (13574) 2.53% 10 (3-26)
Unk 15 (1166) 1.29% 8 (1-18) Unk 36 (2324) 1.55% 9 (4-17)Testis Insured 217 (11689) 1.86% 33 (7-NA) Married 59 (5391) 1.09% 15 (3-NA)
Uninsured 30 (1142) 2.63% 15 (2-NA) Unmarried 182 (7051) 2.58% NA (7-NA)Unk 5 (527) 0.95% 9 (2-NA) Unk 11 (916) 1.20% 10 (4-NA)
Other GU Insured 167 (4942) 3.38% 2 (1-9) Married 91 (2900) 3.14% 3 (1-9)Uninsured 3 (170) 1.76% 0 (0-0) Unmarried 70 (2008) 3.49% 2 (0-10)
Unk 3 (211) 1.42% 0 (0-3) Unk 12 (415) 2.89% 0 (0-7)GYN Ovary Insured 1822 (25537) 7.13% 12 (2-41) Married 842 (13035) 6.46% 19 (3-56)
Uninsured 92 (1054) 8.73% 13 (1-37) Unmarried 1017 (12713) 8.00% 7 (1-32)Unk 35 (408) 8.58% 3 (1-34) Unk 90 (1251) 7.19% 10 (1-33)

Epidemiology of liver metastasis
1504 Am J Cancer Res 2020;10(5):1477-1517
Endometrium Insured 515 (58446) 0.88% 5 (1-16) Married 215 (30870) 0.70% 6 (1-20)Uninsured 24 (1956) 1.23% 3 (1-15) Unmarried 300 (26976) 1.11% 5 (1-15)
Unk 10 (1064) 0.94% 1.5 (0.0-7.0) Unk 34 (3620) 0.94% 6 (1-14)Cervix Insured 35 (3392) 1.03% 9 (3-14) Married 21 (1772) 1.19% 8 (2-11)
Uninsured 3 (163) 1.84% 0 (0-NA) Unmarried 18 (1652) 1.09% 11 (4-25)Unk 2 (96) 2.08% 21.5 (15.0-28.0) Unk 1 (227) 0.44% 15 (15-15)
Uterus Insured 419 (15143) 2.77% 4 (1-11) Married 147 (6665) 2.21% 4 (1-11)Uninsured 39 (1101) 3.54% 4 (1-11) Unmarried 293 (9044) 3.24% 4 (1-11)
Unk 14 (461) 3.04% 3 (2-15) Unk 32 (996) 3.21% 3 (1-22)Other GYN Insured 177 (8124) 2.18% 13 (2-49) Married 85 (3580) 2.37% 27 (3-NA)
Uninsured 8 (266) 3.01% 21 (1-40) Unmarried 94 (4463) 2.11% 6 (1-21)Unk 1 (285) 0.35% 1 (1-1) Unk 7 (632) 1.11% 4 (0-7)
Melanoma Melanoma Insured 533 (72023) 0.74% 4 (2-11) Married 301 (46526) 0.65% 5 (2-11)Uninsured 43 (1614) 2.66% 4 (1-6) Unmarried 264 (22216) 1.19% 4 (1-9)
Unk 16 (20903) 0.08% 5 (1-8) Unk 27 (25798) 0.10% 4 (1-10)Sarcoma Sarcoma Insured 1275 (27592) 4.62% 9 (2-34) Married 689 (15378) 4.48% 11 (2-40)
Uninsured 64 (1221) 5.24% 15 (2-31) Unmarried 613 (12299) 4.98% 8 (2-28)Unk 32 (948) 3.38% 1.5 (0.0-16.0) Unk 69 (2084) 3.31% 6 (1-32)
All other All other Insured 2119 (19801) 10.70% 1 (0-8) Married 1002 (10923) 9.17% 2 (0-10)Uninsured 122 (735) 16.60% 2 (0-5) Unmarried 1213 (8733) 13.89% 1 (0-6)
Unk 92 (1071) 8.59% 1 (0-4) Unk 118 (1951) 6.05% 1 (0-5)Abbreviations: LM: liver metastasis; IQR: interquartile range; Unk: unknown; HER-2: Human epidermal growth factor receptor-2; HR: hormone receptor; SCLC: small cell lung cancer; GI: gastrointestinal cancer; CRC: colorectal cancer; GU: genitourinary cancer; GYN: gynecologic cancer; NA: non-applicable.

Epidemiology of liver metastasis
1505 Am J Cancer Res 2020;10(5):1477-1517
Table 6. Multivariable logistic regression for the pres-ence of liver metastases at diagnosis by cancer typeCategories OR (95% CI) PAge at diagnosis (years) 18-40 Ref 41-60 1.137 (1.088-1.188) < 0.001 61-80 1.099 (1.052-1.148) < 0.001 >80 0.955 (0.911-1.001) = 0.05Sex Male Ref Female 0.877 (0.862-0.891) < 0.001Race White Ref African American 1.133 (1.107-1.159) < 0.001 American Indian 0.889 (0.800-0.987) < 0.001 API 0.876 (0.850-0.902) < 0.05 Unknown 0.405 (0.352-0.466) < 0.001Marital status Married Ref Unmarried 1.059 (1.042-1.076) < 0.001 Unknown 0.927 (0.894-0.962) < 0.001Insurance Status Insured Ref Uninsured 1.186 (1.141-1.233) < 0.001 Unknown 0.721 (0.683-0.760) < 0.001Tumor Stage 1 Ref 2 1.565 (1.520-1.612) < 0.001 3 1.395 (1.356-1.435) < 0.001 4 2.002 (1.943-2.062) < 0.001 Unknown 4.427 (4.296-4.561) < 0.001Nodal Stage 0 Ref 1 1.953 (1.914-1.993) < 0.001 2 2.354 (2.296-2.413) < 0.001 3 1.906 (1.836-1.978) < 0.001 Unknown 2.368 (2.299-2.438) < 0.001Income 1st quantile Ref 2nd quantile 0.925 (0.906-0.945) < 0.001 3rd quantile 0.996 (0.973-1.019) = 0.744 4th quantile 0.948 (0.926-0.970) < 0.001 Unknown 1.235 (1.005-1.517) < 0.05Unemployment 1st quantile Ref 2nd quantile 0.986 (0.965-1.008) = 0.199 3rd quantile 0.955 (0.934-0.975) < 0.001 4th quantile 0.991 (0.967-1.016) = 0.477 Unknown NA NA
cancers with low metastasis potential tend to develop metastasis mainly at advanced stage. Concerning the distribu-tion of originated sites, CRC and appendix cancer together, reportedly, contributed to 46.1% of LM cases, with 10.1% for pancre-atic cancer and 8.2% for breast cancer respectively, compared with 25.58% for lung cancer and 24.76% for CRC observed by us [36]. However, the previous study only enrolled cases that received liver resection or biopsy, thus it fails to fully reflect the general landscape of origin for LM by limiting eligibility. The survival dis-parities for LM among different primary cancer types imply the impact of the “seed”, which can also be seen in brain metastasis [33].
The formation of LM can be explained by the “seed and soil” principle: interaction between cancer cells and liver microenvi-ronment which consists of resident cells (including hepatocytes and Kuffer cells), and recruited inflammatory cells (inclu- ding macrophages, neutrophils, lympho-cytes and so on) [37-41]. The impact of pre-existing liver diseases on LM forma-tion continues to be debated. A meta- analysis of 10,349 CRC cases shows a lower incidence of LM (both synchronous and metachronous metastasis) in patien- ts with chronically ill liver (OR = 0.32; 95% CI: 0.26-0.38) [42]. However, the study adopted diverse notions for liver dis-ease, including fatty liver, viral infection, cirrhosis, and any combination of these diseases. Studies that specifically evalu-ated the impact of chronic hepatitis also show divergent results. A retrospective study of 4033 CRC cases, with 244 of HBsAg positive and 3789 of HBsAg nega-tive cases, shows a higher incidence of synchronous LM in patients with HBsAg positivity (15.57% vs. 8.60%, P < 0.001). HBsAg positivity is the strongest factor associated with LM, as shown by mul- tivariate logistic regression analysis (OR: 2.317, P = 0.001) [43]. Similarly, a study of 63 HBsAg positive and 397 HBsAg neg-ative pancreatic cancer patients, demon-strates a significantly higher incidence of synchronous LM in patients with positive HBsAg (46.0% vs. 32.0%, P < 0.05) [44].

Epidemiology of liver metastasis
1506 Am J Cancer Res 2020;10(5):1477-1517
However, a study of 1,367 nasopharyngeal car-cinoma patients, including 492 of negative infection, 175 of inactive HBV carrier, and 577 of resolved HBV infection shows that both inactive carrier (HR = 0. 392, P = 0.020) and resolved infection (HR = 0.621, P = 0.032) are associated with a significantly lower risk of metachronous LM, compared with negative infection patients [45]. Additionally, another study of 37 infected (3 for HBV and 34 for HCV) and 401 non-infected CRC patients shows a lower incidence of LM (both synchro-nous and metachronous metastasis) in virally infected patients (3 vs. 85 cases; 8.1% vs. 21.2%) [46]. However, this study may be biased by the possible underestimation of LM inci-dence due to few observations. Similarly, the relation between cirrhosis and LM formation remained controversy. A study of 2,973 cirrhot-ic patients and 11,892 normal control subjects showed a higher risk of metachronous LM in cirrhotic patients than normal subjects (10-year cumulative risk of LM: 27.1% vs. 23.6%) [47]. Another study also confirmed the higher incidence of metachronous LM in fibrotic liver (10.4% vs. 5.3%) [48]. An animal study demon-strated that the higher LM incidence (more than 4-fold) is induced by increased retention of cancer cells in terminal portal vein in cirrhot-ic liver [49]. Mechanically, recruited metasta-sis-associated macrophages help hepatic stel-late cells transform into myofibroblasts that secrete periostin, ultimately resulting in a fibrotic microenvironment that sustains meta-static tumour growth, and inhibition of hepatic fibrosis reduces the risk of developing LM [50, 51]. However, a meta-analysis of 1,738 cirrhot-
LM in HER2 positive breast cancer than HER2 negative counterparts, in accordance with pre-vious studies [54, 55]. SCLC harbours the greatest metastatic potential in lung cancer, followed by adenocarcinoma and squamous cancer. In stage IV non-squamous NSCLC, EGFR+ cases are more likely metastasized to bone or pleura, and less likely metastasized to brain or adrenal glands, compared with wild type NSCLC [56]. In EGFR mutated lung can- cer, exon 21 mutation subtype shows a hig- her incidence of LM than exon 19 deletion subtype (23% vs. 7%, P < 0.01) [57]. Gastric cancer patients harbouring LM show a signifi-cantly higher HER2 positivity in both primary and metastatic lesions (70.6% and 80.0%) than those harbouring peritoneal metastasis (22.4% and 16.4%). However, the latter pa- tients show significantly higher EGFR positivity in the metastatic lesion than that in patients with LM (70.1% vs. 37.5%) [58]. Sidedness of CRC also affects the formation of LM, with the higher incidence of LM from left-sided colon cancer. The role of RAS mutation on development of LM in CRC remains disputed. A study of 477 RAS wild-type cases and 441 RAS mutated cases shows that RAS mutant CRC exhibited a significantly higher cumulative synchronous metastasis incidence in the lung, bone, and brain, but not in the liver and two-year cumulative incidence of LM remains simi-lar between two groups (12% vs. 14.3%, P = 0.78) [59]. However, another study of 68 KRAS wild type cases and 75 KRAS mutated cases shows a lower incidence of LM in RAS mutated CRC (37.3% vs. 70.6%; P < 0.001) [60]. Interestingly, the survival inferiority in
Bone metastasis Yes Ref No 0.210 (0.205-0.215) < 0.001 Unknown 0.638 (0.584-0.697) < 0.001Brain metastasis Yes Ref No 0.718 (0.694-0.743) < 0.001 Unknown 1.950 (1.790-2.124) < 0.001Lung metastasis Yes Ref No 0.233 (0.228-0.238) < 0.001 Unknown 0.866 (0.814-0.921) < 0.001Abbreviations: OR: odd ratio; CI: confidence interval; Ref: reference; API: Asian/pacific islander.
ic patients and 37,306 normal controls, shows a lower incidence of LM (both syn-chronous and metachronous metastasis) in patients with cirrhosis from both organs within portal vein drainage (RR = 0.70, 95% CI = 0.55-0.88) and all extrahepatic organs (RR = 0.53, 95% CI = 0.42-0.66) [52]. In addition, chronic alcohol intake may increase the risk of LM of CRC by pro-moting inflammatory microenvironment in the liver [53].
Beside the “soil”, the formation of LM is also affected by the biological charac-teristics of the seeds-primary cancer ce- lls. Here, we demonstrate the higher inci-dence of synchronous metastasis and

Epidemiology of liver metastasis
1507 Am J Cancer Res 2020;10(5):1477-1517
Table 7. Systematic metastatic pattern in patients with liver metastasis at diagnosisSite Subsite Type of systematic metastasis Number Median survival with IQRBrain Brain Bone 1 NA
Lung 2 13.5 (11.0-16.0)Brain 1 4 (4-4)2 of 3 0 NA
All three 0 NANone 7 15 (2-44)Other 0 NA
Head and neck Head and neck Bone 113 8 (2-19)Lung 91 6 (2-13)Brain 6 1.5 (1.0-NA)2 of 3 79 4 (1-13)
All three 6 3.5 (1.0-5.0)None 168 11 (4-18)Other 26 4 (2-8)
Thyroid Thyroid Bone 19 7 (1-13)Lung 28 4 (1-12)Brain 0 NA2 of 3 31 5 (2-11)
All three 3 2 (0-6)None 42 15 (5-NA)Other 7 4 (0-5)
Breast All breast Bone 1366 20 (5-41)Lung 417 10 (1-30)Brain 41 6 (1-23)2 of 3 1029 10 (2-29)
All three 205 4 (1-17)None 1139 27 (6-NA)Other 330 5 (1-22)
Her2-/HR+ Bone 580 22 (7-40)Lung 114 14 (3-33)Brain 13 7 (3-27)2 of 3 435 14 (4-32)
All three 72 7 (1-28)None 363 29 (11-56)Other 107 12 (3-29)
Her2+/HR- Bone 156 31 (8-62)Lung 58 25 (4-NA)Brain 8 6 (4-9)2 of 3 113 13 (2-36)
All three 35 4 (1-16)None 213 46 (11-NA)Other 41 10 (2-33)
Her2+/HR+ Bone 297 34 (9-NA)Lung 69 18 (3-45)Brain 7 NA (1-NA)2 of 3 193 20 (4-36)
All three 33 9 (4-31)

Epidemiology of liver metastasis
1508 Am J Cancer Res 2020;10(5):1477-1517
None 254 57 (17-NA)Other 51 18 (1-43)
Triple negative Bone 134 7 (3-14)Lung 96 10 (3-18)Brain 6 8.5 (3.0-18.0)2 of 3 104 4 (2-10)
All three 35 3 (1-9)None 165 13 (4-23)Other 29 5 (1-11)
Unknown status Bone 199 5 (0-22)Lung 80 1 (0-21)Brain 7 0 (0-1)2 of 3 184 1 (0-14)
All three 30 1 (0-4)None 144 5 (0-27)Other 102 1 (0-10)
Lung All lung Bone 5897 3 (1-8)Lung 2509 2 (0-8)Brain 1588 3 (1-7)2 of 3 5247 2 (1-7)
All three 1328 3 (1-7)None 8198 2 (0-9)Other 2172 1 (0-5)
Adenocarcinoma Bone 1804 3 (1-8)Lung 673 3 (1-10)Brain 441 3 (1-8)2 of 3 2082 3 (1-9)
All three 684 3 (1-10)None 1573 4 (1-11)Other 591 2 (0-6)
Squamous cancer Bone 620 3 (1-6)Lung 291 3 (1-8)Brain 144 2 (1-5)2 of 3 480 2 (1-4)
All three 106 1 (1-3)None 898 4 (1-10)Other 202 2 (1-7)
SCLC Bone 2020 5 (1-9)Lung 688 2 (0-9)Brain 532 3 (1-8)2 of 3 1257 4 (1-8)
All three 216 3 (1-7)None 3337 3 (0-9)Other 638 2 (0-7)
Other Bone 1453 2 (0-5)Lung 857 1 (0-4)Brain 471 2 (1-5)2 of 3 1428 1 (0-4)
All three 322 2 (0-4)
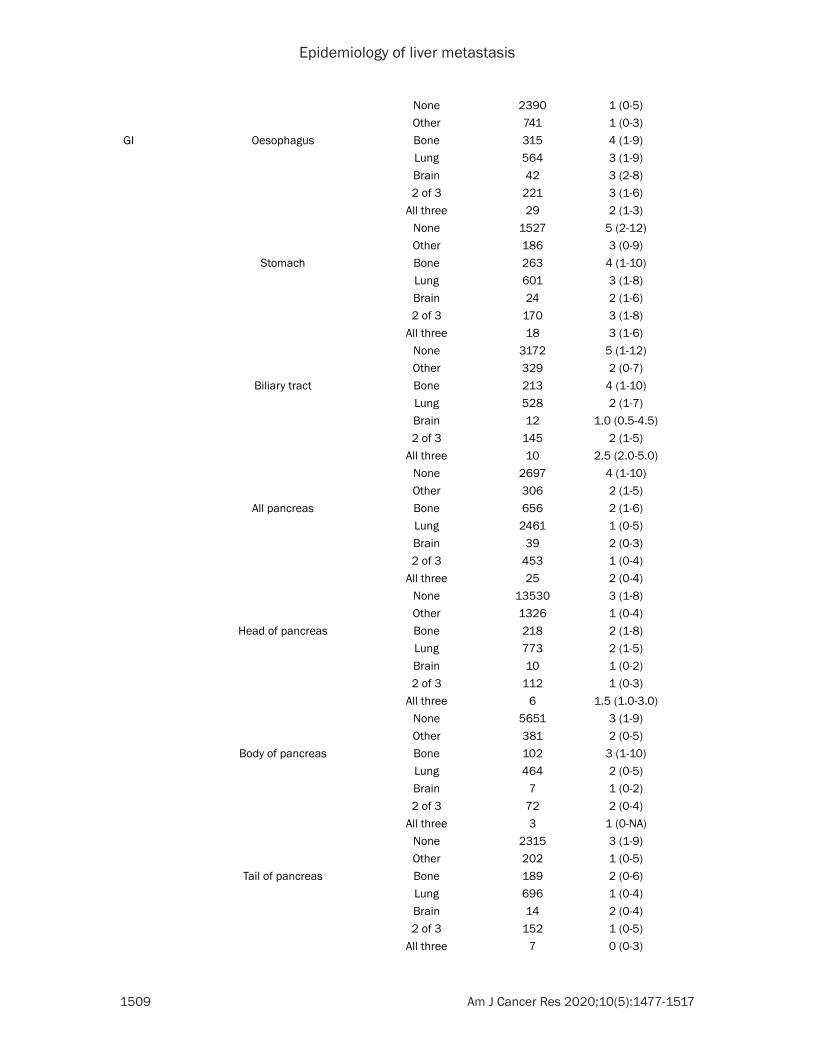
Epidemiology of liver metastasis
1509 Am J Cancer Res 2020;10(5):1477-1517
None 2390 1 (0-5)Other 741 1 (0-3)
GI Oesophagus Bone 315 4 (1-9)Lung 564 3 (1-9)Brain 42 3 (2-8)2 of 3 221 3 (1-6)
All three 29 2 (1-3)None 1527 5 (2-12)Other 186 3 (0-9)
Stomach Bone 263 4 (1-10)Lung 601 3 (1-8)Brain 24 2 (1-6)2 of 3 170 3 (1-8)
All three 18 3 (1-6)None 3172 5 (1-12)Other 329 2 (0-7)
Biliary tract Bone 213 4 (1-10)Lung 528 2 (1-7)Brain 12 1.0 (0.5-4.5)2 of 3 145 2 (1-5)
All three 10 2.5 (2.0-5.0)None 2697 4 (1-10)Other 306 2 (1-5)
All pancreas Bone 656 2 (1-6)Lung 2461 1 (0-5)Brain 39 2 (0-3)2 of 3 453 1 (0-4)
All three 25 2 (0-4)None 13530 3 (1-8)Other 1326 1 (0-4)
Head of pancreas Bone 218 2 (1-8)Lung 773 2 (1-5)Brain 10 1 (0-2)2 of 3 112 1 (0-3)
All three 6 1.5 (1.0-3.0)None 5651 3 (1-9)Other 381 2 (0-5)
Body of pancreas Bone 102 3 (1-10)Lung 464 2 (0-5)Brain 7 1 (0-2)2 of 3 72 2 (0-4)
All three 3 1 (0-NA)None 2315 3 (1-9)Other 202 1 (0-5)
Tail of pancreas Bone 189 2 (0-6)Lung 696 1 (0-4)Brain 14 2 (0-4)2 of 3 152 1 (0-5)
All three 7 0 (0-3)

Epidemiology of liver metastasis
1510 Am J Cancer Res 2020;10(5):1477-1517
None 3161 3 (1-9)Other 305 1 (0-5)
Unspecified pancreas Bone 147 2 (1-4)Lung 528 1 (0-4)Brain 8 2 (1-5)2 of 3 117 1 (0-2)
All three 9 2 (2-6)None 2403 2 (0-6)Other 438 1 (0-4)
Small intestine Bone 50 3 (1-15)Lung 94 5 (1-20)Brain 3 6 (5-NA)2 of 3 11 6 (3-NA)
All three 1 1 (1-1)None 1233 40 (6-NA)Other 57 8 (1-39)
Colon & rectum Bone 697 5 (1-14)Lung 5221 9 (2-22)Brain 68 4 (1-17)2 of 3 740 4 (1-14)
All three 44 2 (1-8)None 17899 15 (4-33)Other 1414 4 (1-18)
Right colon Bone 241 4 (1-11)Lung 1719 7 (1-18)Brain 34 3 (1-14)2 of 3 221 3 (1-12)
All three 11 3 (1-11)None 7284 12 (3-27)Other 507 4 (1-15)
Left colon Bone 230 8 (1-20)Lung 1833 11 (2-24)Brain 16 3.5 (1.0-7.0)2 of 3 251 5 (2-14)
All three 18 2 (1-8)None 6598 20 (6-40)Other 409 8 (1-22)
Unspecified colon Bone 64 1.0 (0.5-4.0)Lung 384 2 (0-8)Brain 6 31 (7-31)2 of 3 82 1 (0-4)
All three 6 1.5 (0.0-2.0)None 994 2 (0-9)Other 238 1 (0-6)
Rectum Bone 162 8 (3-18)Lung 1285 13 (4-25)Brain 12 5 (2-21)2 of 3 186 8 (2-19)
All three 9 5.0 (2.0-16.5)

Epidemiology of liver metastasis
1511 Am J Cancer Res 2020;10(5):1477-1517
None 3023 21 (8-40)Other 260 8 (2-24)
Anus Bone 13 14 (9-27)Lung 37 15 (6-34)Brain 0 NA2 of 3 8 4 (2-8)
All three 0 NANone 132 16 (7-27)Other 8 7.0 (3.5-25.0)
Other GI Bone 171 2 (0-7)Lung 604 2 (0-6)Brain 11 1 (0-5)2 of 3 172 1 (0-4)
All three 15 2 (0-4)None 2621 3 (1-11)Other 388 1 (0-6)
GU Kidney Bone 238 3 (1-11)Lung 694 4 (1-10)Brain 18 3.5 (1.0-9.0)2 of 3 533 3 (1-8)
All three 89 3 (1-7)None 555 4 (1-13)Other 147 2 (0-5)
Bladder Bone 118 2 (1-7)Lung 142 2 (1-6)Brain 4 5.5 (3.5-8.5)2 of 3 107 2 (1-5)
All three 11 1 (0-2)None 275 3 (1-8)Other 48 2 (0-5)
Prostate Bone 319 11 (5-23)Lung 45 7 (2-22)Brain 2 8 (5-11)2 of 3 178 9 (4-21)
All three 15 14 (4-NA)None 119 11 (3-21)Other 63 9 (4-22)
Testis Bone 6 14 (7-27)Lung 122 25 (6-NA)Brain 0 NA2 of 3 53 13 (2-NA)
All three 6 34.5 (2.0-NA)None 54 NA (14-NA)Other 11 12 (0-19)
Other GU Bone 25 2 (0-9)Lung 45 2 (1-9)Brain 2 3 (0-NA)2 of 3 25 1 (1-12)
All three 0 NA

Epidemiology of liver metastasis
1512 Am J Cancer Res 2020;10(5):1477-1517
None 64 4 (0-10)Other 12 2 (0-3)
GYN Ovary Bone 42 3 (0-10)Lung 392 8 (1-30)Brain 3 1 (1-1)2 of 3 59 4 (1-9)
All three 5 3 (0-17)None 1302 16 (2-51)Other 154 2 (0-21)
Endometrium Bone 26 5 (1-19)Lung 144 3 (0-9)Brain 3 4 (2-13)2 of 3 69 3 (1-8)
All three 9 3 (1-3)None 262 8 (2-23)Other 38 3 (1-10)
Cervix Bone 2 17.5 (14.0-21.0)Lung 8 9.5 (7.5-13.0)Brain 0 NA2 of 3 4 1.5 (0.5-6.0)
All three 1 10 (10-10)None 20 11 (4-24)Other 5 1 (0-10)
Uterus Bone 50 5 (2-9)Lung 145 3 (1-7)Brain 2 9 (1-17)2 of 3 79 3 (1-9)
All three 5 1 (0-NA)None 166 7 (3-17)Other 29 4 (2-6)
Other GYN Bone 9 6 (2-NA)Lung 57 5 (1-49)Brain 1 1 (1-1)2 of 3 10 16 (8-NA)
All three 2 0.5 (0.0-1.0)None 94 19 (5-NA)Other 13 3 (0-10)
Melanoma Melanoma Bone 50 5 (2-10)Lung 118 5 (2-9)Brain 17 4 (2-7)2 of 3 145 4 (2-9)
All three 51 3 (1-6)None 162 6 (3-18)Other 50 3 (1-7)
Sarcoma Sarcoma Bone 82 4 (1-12)Lung 290 6 (1-18)Brain 12 1.5 (0.0-4.0)2 of 3 153 3 (1-10)
All three 18 2 (1-7)None 743 19 (4-56)Other 75 4 (1-18)

Epidemiology of liver metastasis
1513 Am J Cancer Res 2020;10(5):1477-1517
patients with LM originated from right sided colon cancer seems to present solely on KRAS wild-type CRC (55.5% vs. 43.7%, P = 0.02), rather than KRAS mutated CRC (32.8% vs. 34.0%, P = 0.38) [61]. Additionally, microsatel-lite instable CRC is associated with a lower rate of LM than microsatellite stable CRC (20 out of 40 vs. 219 out of 310) [62].
Apart from cancer biology, SES is another contributor to disparities in cancer diagnosis, treatment and prognosis [63, 64]. Here, we found that the inferior socioeconomic status is generally associated with higher incidence of LM (probably due to delayed diagnosis) and poorer survival. These can be accounted by their limited accessibility to healthcare reso- urces, weaker awareness for a timely diagno-sis, and the unevenly distributed healthcare resources [65-68]. Lower income is asso- ciated with delayed detection of cancer me- tastasis, and less intensive and timely treat-ment [68-71]. In contrast, insured patients are prone to receive early diagnosis, thus lower rates of metastasis and LM, and timely treat-ment [18, 72-74]. Furthermore, the impact of insurance status on LM incidence is more pro-nounced than that of marital status. Unmarried status is associated with poorer prognosis in cancer patients due to a lower rate of recei- ving surgery or radiotherapy [15]. More impor-tantly, this de-intensified treatment was mainly accountable by the first impression of lacking social support towards unmarried patients from the oncologists who trend to recommend less intensified regimens [15, 75].
Despite novel findings in the current study, it should be interpreted in the context of limita-tions. First, the SEER database solely provides a qualitative information regarding LM status rather than quantitative information for LM lesions, including the number and size of LM. Second, the information regarding detecting methods for LM is missing, which may affect the incidence due to the sensitivity disparities among them. Third, the information regarding co-existing liver diseases, whose role in LM for-mation remains controversy, is missing. Forth, the detailed genetic mutation information of the primary cancer, which may permit more pre-cise risk stratification and more translational interpretation, is also missing. Fifth, underesti-mation of incidence may occur in cancer types in which routine LM screening is not adopted.
Conclusion
The current study provides a generalizable and representative epidemiology data source of LM by primary cancer type and clinicopatho-logical factors. These data not only help medi-cal practitioners tailor screening protocols and design clinical trials but also give an approximation of the public disease burden for policymakers.
Acknowledgements
This work was partially supported by the National Natural Science Foundation of China (81771870 and 81603142).
Disclosure of conflict of interest
None.
All Other All Other Bone 213 2 (0-6)Lung 366 1 (0-6)Brain 21 1 (0-3)2 of 3 246 1 (0-5)
All three 49 2 (0-4)None 891 2 (0-14)Other 552 1 (0-3)
All All Bone 10954 4 (1-11)Lung 15725 4 (1-13)Brain 1920 3 (1-7)2 of 3 9967 3 (1-9)
All three 1945 3 (1-8)None 57072 6 (1-19)Other 7746 2 (0-8)
Abbreviations: IQR: interquartile range; NA: non-applicable; HER-2: Human epidermal growth factor receptor-2; HR: hormone receptor; SCLC: small cell lung cancer; GI: gastrointestinal cancer; GU: genitourinary cancer; GYN: gynecologic cancer.

Epidemiology of liver metastasis
1514 Am J Cancer Res 2020;10(5):1477-1517
Abbreviations
AA, African American; AI, American Indian; API, Asian and Pacific islanders; CI, confidence interval; CRC, colorectal cancer; GI, gastroin-testinal cancer; GU, genitourinary cancer; GYN, gynecologic cancer; HER-2, Human epidermal growth factor receptor-2; HR, hormone recep-tor; IQR, interquartile range; LM, liver metasta-sis; NA, non-applicable; NCI, National Cancer Institute; OR, odd ratio; SCLC, small cell lung cancer; SEER, Surveillance, Epidemiology and End Results; Unk, unknown; USDA, United States Department of Agriculture.
Address correspondence to: Dr. Yicheng Ni, KU Leuven, Campus Gasthuisberg, Faculty of Me- dicine, 3000 Leuven, Belgium. Tel: +3216343765; E-mail: [email protected]; Dr. Yue Li, Shang- hai Key Laboratory of Molecular Imaging, Shanghai University of Medicine and Health Sciences, Shanghai 201318, China. Tel: +86-21-33759000; E-mail: [email protected]
References
[1] Siegel RL, Miller KD and Jemal A. Cancer sta-tistics, 2019. CA Cancer J Clin 2019; 69: 7-34.
[2] Chaffer CL and Weinberg RA. A perspective on cancer cell metastasis. Science 2011; 331: 1559-1564.
[3] Nguyen DX, Bos PD and Massagué J. Metasta-sis: from dissemination to organ-specific colo-nization. Nat Rev Cancer 2009; 9: 274-284.
[4] Weiss L. Comments on hematogenous meta-static patterns in humans as revealed by au-topsy. Clin Exp Metastasis 1992; 10: 191-199.
[5] Valderrama-Treviño AI, Barrera-Mera B, Cebal-los-Villalva JC and Montalvo-Javé EE. Hepatic metastasis from colorectal cancer. Euroasian J Hepatogastroenterol 2017; 7: 166-175.
[6] Touzios JG, Kiely JM, Pitt SC, Rilling WS, Quebbeman EJ, Wilson SD and Pitt HA. Neuro-endocrine hepatic metastases: does aggres-sive management improve survival? Ann Surg 2005; 241: 776-783.
[7] Markar SR, Mikhail S, Malietzis G, Athanasiou T, Mariette C, Sasako M and Hanna GB. Influ-ence of surgical resection of hepatic metasta-ses from gastric adenocarcinoma on long-term survival: systematic review and pooled analy-sis. Ann Surg 2016; 263: 1092-1101.
[8] Mise Y, Aloia TA, Brudvik KW, Schwarz L, Vau-they JN and Conrad C. Parenchymal-sparing hepatectomy in colorectal liver metastasis im-proves salvageability and survival. Ann Surg 2016; 263: 146-152.
[9] Engstrand J, Nilsson H, Stromberg C, Jonas E and Freedman J. Colorectal cancer liver metas-
tases - a population-based study on incidence, management and survival. BMC Cancer 2018; 18: 78.
[10] Manfredi S, Lepage C, Hatem C, Coatmeur O, Faivre J and Bouvier AM. Epidemiology and management of liver metastases from colorec-tal cancer. Ann Surg 2006; 244: 254-259.
[11] Wyld L, Gutteridge E, Pinder SE, James JJ, Chan SY, Cheung KL, Robertson JF and Evans AJ. Prognostic factors for patients with hepatic metastases from breast cancer. Br J Cancer 2003; 89: 284-290.
[12] Torre LA, Siegel RL, Ward EM and Jemal A. Global cancer incidence and mortality rates and trends--an update. Cancer Epidemiol Bio-markers Prev 2016; 25: 16-27.
[13] Steliarova-Foucher E, Fidler MM, Colombet M, Lacour B, Kaatsch P, Piñeros M, Soerjomata- ram I, Bray F, Coebergh JW, Peris-Bonet R and Stiller CA; ACCIS contributors. Changing geo-graphical patterns and trends in cancer inci-dence in children and adolescents in Europe, 1991-2010 (Automated Childhood Cancer In-formation System): a population-based study. Lancet Oncol 2018; 19: 1159-1169.
[14] Disibio G and French SW. Metastatic patterns of cancers: results from a large autopsy study. Arch Pathol Lab Med 2008; 132: 931-939.
[15] Aizer AA, Chen MH, McCarthy EP, Mendu ML, Koo S, Wilhite TJ, Graham PL, Choueiri TK, Hoffman KE, Martin NE, Hu JC and Nguyen PL. Marital status and survival in patients with cancer. J Clin Oncol 2013; 31: 3869-3876.
[16] Ward E, Jemal A, Cokkinides V, Singh GK, Car-dinez C, Ghafoor A and Thun M. Cancer dis-parities by race/ethnicity and socioeconomic status. CA Cancer J Clin 2004; 54: 78-93.
[17] Taheri M, Tavakol M, Esmaeil Akbari M, Almasi-Hashiani A and Abbasi M. Associations of de-mographic, socioeconomic, self-rated health, and metastasis in colorectal cancer in Iran. Med J Islam Repub Iran 2019; 33: 17.
[18] Wharam JF, Zhang F, Lu CY, Wagner AK, Nekh-lyudov L, Earle CC, Soumerai SB and Ross-De-gnan D. Breast cancer diagnosis and treat-ment after high-deductible insurance enroll- ment. J Clin Oncol 2018; 36: 1121-1127.
[19] Surveillance, Epidemiology, and End Re- sults (SEER) Program (www.seer.cancer.gov) Research Data (1975-2016), National Cancer Institute, DCCPS, Surveillance Research Pro-gram, released April 2019, based on the No-vember 2018 submission.
[20] Goel MK, Khanna P and Kishore J. Un- derstanding survival analysis: kaplan-meier estimate. Int J Ayurveda Res 2010; 1: 274-278.
[21] April 07 2019. United States Department of Agriculture 2013 Rural-Urban Continuum Codes [online]. <https://www.ers.usda.gov/data-products/rural-urban-continuum-codes.aspx>. April 07 2019.

Epidemiology of liver metastasis
1515 Am J Cancer Res 2020;10(5):1477-1517
[22] July 23, 2019. United States Department of Agriculture Economic Research Service. <https://www.ers.usda.gov/webdocs/Data-Files/53180/25556_AK.pdf?v=0>. July 23, 2019.
[23] Kosinski AKaM. survminer: Drawing Survival Curves using ‘ggplot2’. R package version 0.4.4. 2019.
[24] Network NCCN. 2019 July 03, 2019. Small Bowel Adenocarcinoma (Version 1.2020). <https://www.nccn.org/professionals/physici- an_gls/pdf/small_bowel.pdf>. July 03, 2019.
[25] Network NCCN. 2019 July 03, 2019. Gastric Cancer (Version 2.2019). <https://www.nccn.org/professionals/physician_gls/pdf/gastric.pdf>. July 03, 2019.
[26] Network NCCN. 2019 July 03, 2019. Esopha-geal and Esophagogastric Junction Cancers (Version 2.2019). <https://www.nccn.org/pro-fessionals/physician_gls/pdf/esophageal.pdf>. July 03, 2019.
[27] Network NCCN. 2019 Aug. 09. Colon Cancer (Version 2.2019). <https://www.nccn.org/pro-fessionals/physician_gls/pdf/colon.pdf>. July 03, 2019.
[28] Hoshino A, Costa-Silva B, Shen TL, Rodrigues G, Hashimoto A, Tesic Mark M, Molina H, Koh-saka S, Di Giannatale A, Ceder S, Singh S, Wil-liams C, Soplop N, Uryu K, Pharmer L, King T, Bojmar L, Davies AE, Ararso Y, Zhang T, Zhang H, Hernandez J, Weiss JM, Dumont-Cole VD, Kramer K, Wexler LH, Narendran A, Schwartz GK, Healey JH, Sandstrom P, Labori KJ, Kure EH, Grandgenett PM, Hollingsworth MA, de Sousa M, Kaur S, Jain M, Mallya K, Batra SK, Jarnagin WR, Brady MS, Fodstad O, Muller V, Pantel K, Minn AJ, Bissell MJ, Garcia BA, Kang Y, Rajasekhar VK, Ghajar CM, Matei I, Peinado H, Bromberg J and Lyden D. Tumour exosome integrins determine organotropic metastasis. Nature 2015; 527: 329-335.
[29] Network NCCN. 2019 July 03, 2019. Epithelial Ovarian Cancer (including Fallopian Tube Can-cer and Primary Peritoneal Cancer) (Version 1.2019). <https://www.nccn.org/profession-als/physician_gls/pdf/ovarian.pdf>. July 03, 2019.
[30] Nitsche U, Stogbauer F, Spath C, Haller B, Wil-helm D, Friess H and Bader FG. Right sided colon cancer as a distinct histopathological subtype with reduced prognosis. Dig Surg 2016; 33: 157-163.
[31] Engstrand J, Nilsson H, Strömberg C, Jonas E and Freedman J. Colorectal cancer liver metas-tases - a population-based study on incidence, management and survival. BMC Cancer 2018; 18: 78.
[32] Tjan-Heijnen V and Viale G. The lymph node and the metastasis. N Engl J Med 2018; 378: 2045-2046.
[33] Cagney DN, Martin AM, Catalano PJ, Redig AJ, Lin NU, Lee EQ, Wen PY, Dunn IF, Bi WL, Weiss SE, Haas-Kogan DA, Alexander BM and Aizer AA. Incidence and prognosis of patients with brain metastases at diagnosis of systemic malignancy: a population-based study. Neuro Oncol 2017; 19: 1511-1521.
[34] Hu Z, Ding J, Ma Z, Sun R, Seoane JA, Scott Shaffer J, Suarez CJ, Berghoff AS, Cremolini C, Falcone A, Loupakis F, Birner P, Preusser M, Lenz HJ and Curtis C. Quantitative evidence for early metastatic seeding in colorectal cancer. Nat Genet 2019; 51: 1113-1122.
[35] Norton L and Massague J. Is cancer a disease of self-seeding? Nat Med 2006; 12: 875-878.
[36] de Ridder J, de Wilt JH, Simmer F, Overbeek L, Lemmens V and Nagtegaal I. Incidence and origin of histologically confirmed liver metasta-ses: an explorative case-study of 23,154 pa-tients. Oncotarget 2016; 7: 55368-55376.
[37] Thomas H. Pancreatic cancer: infiltrating mac-rophages support liver metastasis. Nat Rev Gastroenterol Hepatol 2016; 13: 313.
[38] Brodt P. Role of the microenvironment in liver metastasis: from pre- to prometastatic niches. Clin Cancer Res 2016; 22: 5971-5982.
[39] Lee JW, Stone ML, Porrett PM, Thomas SK, Ko-mar CA, Li JH, Delman D, Graham K, Gladney WL, Hua X, Black TA, Chien AL, Majmundar KS, Thompson JC, Yee SS, O’Hara MH, Aggarwal C, Xin D, Shaked A, Gao M, Liu D, Borad MJ, Ram-anathan RK, Carpenter EL, Ji A, de Beer MC, de Beer FC, Webb NR and Beatty GL. Hepatocytes direct the formation of a pro-metastatic niche in the liver. Nature 2019; 567: 249-252.
[40] Shipman L. Microenvironment: astrocytes si-lence PTEN to promote brain metastasis. Nat Rev Cancer 2015; 15: 695.
[41] Altorki NK, Markowitz GJ, Gao D, Port JL, Saxe-na A, Stiles B, McGraw T and Mittal V. The lung microenvironment: an important regulator of tumour growth and metastasis. Nat Rev Can-cer 2019; 19: 9-31.
[42] Cai B, Liao K, Song XQ, Wei WY, Zhuang Y and Zhang S. Patients with chronically diseased liv-ers have lower incidence of colorectal liver me-tastases: a meta-analysis. PLoS One 2014; 9: e108618.
[43] Huo T, Cao J, Tian Y, Shi X, Wu L, Zhang M, Wong LL and Zhao L. Effect of concomitant positive hepatitis b surface antigen on the risk of liver metastasis: a retrospective clinical study of 4033 consecutive cases of newly di-agnosed colorectal cancer. Clin Infect Dis 2017; 66: 1948-1952.
[44] Wei XL, Qiu MZ, Chen WW, Jin Y, Ren C, Wang F, Luo HY, Wang ZQ, Zhang DS, Wang FH, Li YH and Xu RH. The status of HBV infection influ-ences metastatic pattern and survival in Chi-nese patients with pancreatic cancer. J Transl Med 2013; 11: 249-249.

Epidemiology of liver metastasis
1516 Am J Cancer Res 2020;10(5):1477-1517
[45] Li X, Wu W, Chen J, Ye W, Zhang J and Wei TJT-CR. Effect of hepatitis B virus infection status on liver metastasis of nasopharyngeal carci-noma: a cohort study. 2019; 8: 262-272.
[46] Utsunomiya T, Saitsu H, Saku M, Yoshida K, Matsumata T, Shimada M and Sugimachi K. Rare occurrence of colorectal cancer metasta-sis in livers infected with Hepatitis B or C virus. Am J Surg 1999; 177: 279-81.
[47] Chiou WY, Chang CM, Tseng KC, Hung SK, Lin HY, Chen YC, Su YC, Tseng CW, Tsai SJ, Lee MS and Li CY. Effect of liver cirrhosis on metasta-sis in colorectal cancer patients: a nationwide population-based cohort study. Jpn J Clin On-col 2014; 45: 160-168.
[48] Kondo T, Okabayashi K, Hasegawa H, Tsuruta M, Shigeta K and Kitagawa Y. The impact of hepatic fibrosis on the incidence of liver me-tastasis from colorectal cancer. Br J Cancer 2016; 115: 34-39.
[49] Qi K, Qiu H, Sun D, Minuk GY, Lizardo M, Ruth-erford J and Orr FW. Impact of cirrhosis on the development of experimental hepatic metastases by B16F1 melanoma cells in C57BL/6 mice. Hepatology 2004; 40: 1144-1150.
[50] Nielsen SR, Quaranta V, Linford A, Emeagi P, Rainer C, Santos A, Ireland L, Sakai T, Sakai K, Kim YS, Engle D, Campbell F, Palmer D, Ko JH, Tuveson DA, Hirsch E, Mielgo A and Schmid MC. Macrophage-secreted granulin supports pancreatic cancer metastasis by inducing liver fibrosis. Nat Cell Biol 2016; 18: 549-560.
[51] Matsusue R, Kubo H, Hisamori S, Okoshi K, Takagi H, Hida K, Nakano K, Itami A, Kawada K, Nagayama S and Sakai Y. Hepatic stellate cells promote liver metastasis of colon cancer cells by the action of SDF-1/CXCR4 axis. Ann Surg Oncol 2009; 16: 2645-2653.
[52] Dahl E, Rumessen J and Gluud LL. Systematic review with meta-analyses of studies on the association between cirrhosis and liver metas-tases. Hepatol Res 2011; 41: 618-625.
[53] Im HJ, Kim HG, Lee JS, Kim HS, Cho JH, Jo IJ, Park SJ and Son CG. A preclinical model of chronic alcohol consumption reveals increased metastatic seeding of colon cancer cells in the liver. Cancer Res 2016; 76: 1698-1704.
[54] Kennecke H, Yerushalmi R, Woods R, Cheang MC, Voduc D, Speers CH, Nielsen TO and Gel-mon K. Metastatic behavior of breast cancer subtypes. J Clin Oncol 2010; 28: 3271-3277.
[55] Hess KR and Esteva FJ. Effect of HER2 status on distant recurrence in early stage breast cancer. Breast Cancer Res Treat 2013; 137: 449-455.
[56] Kuijpers CCHJ, Hendriks LEL, Derks JL, Dinge-mans AC, van Lindert ASR, van den Heuvel MM, Damhuis RA and Willems SM. Association of molecular status and metastatic organs at
diagnosis in patients with stage IV non-squa-mous non-small cell lung cancer. Lung Cancer 2018; 121: 76-81.
[57] Hsu F, De Caluwe A, Anderson D, Nichol A, Tori-umi T and Ho C. Patterns of spread and prog-nostic implications of lung cancer metastasis in an era of driver mutations. Curr Oncol 2017; 24: 228-233.
[58] Saito T, Nakanishi H, Mochizuki Y, Ito S, Ito Y, Misawa K, Yatabe Y, Yamamichi K and Kondo E. Preferential HER2 expression in liver metas-tases and EGFR expression in peritoneal me-tastases in patients with advanced gastric cancer. Gastric Cancer 2015; 18: 711-719.
[59] Yaeger R, Cowell E, Chou JF, Gewirtz AN, Borsu L, Vakiani E, Solit DB, Rosen N, Capanu M, Ladanyi M and Kemeny N. RAS mutations af-fect pattern of metastatic spread and increase propensity for brain metastasis in colorectal cancer. Cancer 2015; 121: 1195-1203.
[60] Kim MJ, Lee HS, Kim JH, Kim YJ, Kwon JH, Lee JO, Bang SM, Park KU, Kim DW, Kang SB, Kim JS, Lee JS and Lee KW. Different metastatic pattern according to the KRAS mutational sta-tus and site-specific discordance of KRAS sta-tus in patients with colorectal cancer. BMC Cancer 2012; 12: 347.
[61] Margonis GA, Amini N, Buettner S, Kim Y, Wang J, Andreatos N, Wagner D, Sasaki K, Beer A, Kamphues C, Morioka D, Loes IM, Imai K, He J, Pawlik TM, Kaczirek K, Poultsides G, Lonning PE, Burkhart R, Endo I, Baba H, Mischinger HJ, Aucejo FN, Kreis ME, Wolfgang CL and Weiss MJ. The prognostic impact of primary tumor site differs according to the KRAS mutational status: a study by the international genetic consortium for colorectal liver metastasis. Ann Surg 2019; [Epub ahead of print].
[62] Tran B, Kopetz S, Tie J, Gibbs P, Jiang ZQ, Lieu CH, Agarwal A, Maru DM, Sieber O and Desai J. Impact of BRAF mutation and micro-satellite instability on the pattern of metastatic spread and prognosis in metastatic colorectal cancer. Cancer 2011; 117: 4623-4632.
[63] Alcaraz KI, Wiedt TL, Daniels EC, Yabroff KR, Guerra CE and Wender RC. Understanding and addressing social determinants to ad-vance cancer health equity in the United States: a blueprint for practice, research, and policy. CA Cancer J Clin 2020; 70: 31-46.
[64] Mackillop WJ, Zhang-Salomons J, Groome PA, Paszat L and Holowaty E. Socioeconomic sta-tus and cancer survival in Ontario. J Clin Oncol 1997; 15: 1680-1689.
[65] Jemal A, Lin CC, Davidoff AJ and Han X. Chang-es in insurance coverage and stage at diagno-sis among nonelderly patients with cancer af-ter the affordable care act. J Clin Oncol 2017; 35: 3906-3915.

Epidemiology of liver metastasis
1517 Am J Cancer Res 2020;10(5):1477-1517
[66] Barton MK. Inferior cancer outcomes more common for uninsured and Medicaid patients. CA Cancer J Clin 2015; 65: 165-166.
[67] Berglund A, Garmo H, Robinson D, Tishelman C, Holmberg L, Bratt O, Adolfsson J, Stattin P and Lambe M. Differences according to socio-economic status in the management and mor-tality in men with high risk prostate cancer. Eur J Cancer 2012; 48: 75-84.
[68] Mahase SS, D’Angelo D, Kang J, Hu JC, Barb-ieri CE and Nagar H. Trends in the use of ste-reotactic body radiotherapy for treatment of prostate cancer in the united states. JAMA Netw Open 2020; 3: e1920471.
[69] Vallance AE, van der Meulen J, Kuryba A, Braun M, Jayne DG, Hill J, Cameron IC and Walker K. Socioeconomic differences in selec-tion for liver resection in metastatic colorectal cancer and the impact on survival. Eur J Surg Oncol 2018; 44: 1588-1594.
[70] Alphonse-Sullivan N, Taksler GB, Lycan T, Weaver KE, McTyre ER, Shenker RF, Page BR, Isom S, Johnson A, Munley MT, Laxton AW, Tat-ter SB, Watabe K, Chan MD and Ruiz J. So-ciodemographic predictors of patients with brain metastases treated with stereotactic ra-diosurgery. Oncotarget 2017; 8: 101005-101011.
[71] Palazzo LL, Sheehan DF, Tramontano AC and Kong CY. Disparities and trends in gen- etic testing and erlotinib treatment among metastatic non-small cell lung cancer patients. Cancer Epidemiol Biomarkers Prev 2019; 28: 926-934.
[72] Taheri M, Tavakol M, Akbari ME, Anoshirvani AA, Aghabozorgi R, Almasi-Hashiani A and Ab-basi M. Socioeconomic inequalities in metas-tasis, recurrence, stage and grade of breast cancer: a hospital-based retrospective cohort study. J Prev Med Hyg 2019; 60: E262-E269.
[73] Jain V, Venigalla S, Reddy VK, Lukens JN, Mitchell TC and Shabason JE. Association of insurance status with presentation, treatment, and survival in melanoma in the era of im-mune checkpoint inhibitors. J Immunother 2020; 43: 8-15.
[74] Loehrer AP, Song Z, Haynes AB, Chang DC, Hut-ter MM and Mullen JT. Impact of health insur-ance expansion on the treatment of colorectal cancer. J Clin Oncol 2016; 34: 4110-4115.
[75] DelFattore J. Death by stereotype? Cancer treatment in unmarried patients. N Engl J Med 2019; 381: 982-985.