Is statin use associated with a reduced incidence, a reduced Breslow thickness or delayed metastasis...
10
Is statin use associated with a reduced incidence, a reduced Breslow thickness or delayed metastasis of melanoma of the skin? E.R. Koomen a, *, A. Joosse a , R.M.C. Herings b , M.K. Casparie c , W. Bergman d , T. Nijsten e , H.J. Guchelaar a, * a Department of Clinical Pharmacy & Toxicology, Leiden University Medical Centre, P.O. Box 9600, 2300 RC Leiden, The Netherlands b PHARMO, Institute for Drug Outcome Research, Utrecht, The Netherlands c Foundation PALGA, Utrecht, The Netherlands d Department of Dermatology, Leiden University Medical Centre, Leiden, The Netherlands e Department of Dermatology, Erasmus Medical Centre Rotterdam, Rotterdam, The Netherlands ARTICLE INFO Article history: Received 27 July 2007 Received in revised form 3 September 2007 Accepted 5 September 2007 Available online 22 October 2007 Keywords: Melanoma Metastasis Chemoprevention HMG-CoA reductase inhibitors ABSTRACT Background: Statins show anticancer activity in melanoma cells. We investigated the asso- ciation between statins and incidence and Breslow thickness of cutaneous melanoma (CM). Methods: Data were used from PHARMO, a pharmacy database, and PALGA, a pathological database, in the Netherlands. Cases had a primary CM diagnosis between January 1st 1991 and December 14th 2004, were P18 years and had P3 years of follow up in PHARMO before CM diagnosis. Controls were matched for gender, date of birth and geographic region. Anal- yses were adjusted for age, gender, year of diagnosis, number of medical diagnoses and the use of NSAIDs and oestrogens. Findings: Finally, 1318 cases and 6786 controls were selected. CM risk was not associated with statin use (P0.5 years) (adjusted odds ratio (OR) = 0.98, 95% confidence interval (CI) = 0.78–1.2). However, statin use was associated with a reduced Breslow thickness ()19%, 95% CI = )33, )2.3, p = 0.03). Conclusion: Our study suggests protective effects of statins on melanoma progression. Ó 2007 Elsevier Ltd. All rights reserved. 1. Introduction Cutaneous melanoma (CM) accounts for 77% of all deaths due to skin cancer. The incidence of CM is increasing consider- ably, about 3% each year. 1 Until now, treatment of advanced CM has been disappoint- ing. 2 Preventive public health measures aiming at early diagnosis have therefore received much attention. Chemopre- vention would be another approach to inhibit the develop- ment or progression of CM. In vitro studies have shown that several agents including 3-hydroxy-3-methylglutaryl-coen- zyme A reductase inhibitors (statins) have the potential to al- ter CM behaviour. 3 Statins are interesting candidates for chemoprevention because they are widely used and have an excellent long term safety. 4 Statins inhibit the cholesterol biosynthesis through inhibi- tion of the enzyme HMG-Co-A reductase and subsequently cause depletion of mevalonate, a precursor of cholesterol and farnesyl- and geranylgeranyl-moieties essential for post- translational activation of several intracellular proteins 0959-8049/$ - see front matter Ó 2007 Elsevier Ltd. All rights reserved. doi:10.1016/j.ejca.2007.09.004 * Corresponding authors: Tel.: +31 71 526 2790; fax: +31 71 526 6980. E-mail addresses: [email protected] (E.R. Koomen), [email protected] (H.J. Guchelaar). EUROPEAN JOURNAL OF CANCER 43 (2007) 2580 – 2589 available at www.sciencedirect.com journal homepage: www.ejconline.com
Transcript of Is statin use associated with a reduced incidence, a reduced Breslow thickness or delayed metastasis...
E U R O P E A N J O U R N A L O F C A N C E R 4 3 ( 2 0 0 7 ) 2 5 8 0 – 2 5 8 9
. sc iencedi rec t .com
ava i lab le at wwwjournal homepage: www.ejconl ine.com
Is statin use associated with a reduced incidence, a reducedBreslow thickness or delayed metastasis of melanoma of theskin?
E.R. Koomena,*, A. Joossea, R.M.C. Heringsb, M.K. Caspariec, W. Bergmand, T. Nijstene,H.J. Guchelaara,*aDepartment of Clinical Pharmacy & Toxicology, Leiden University Medical Centre, P.O. Box 9600, 2300 RC Leiden, The NetherlandsbPHARMO, Institute for Drug Outcome Research, Utrecht, The NetherlandscFoundation PALGA, Utrecht, The NetherlandsdDepartment of Dermatology, Leiden University Medical Centre, Leiden, The NetherlandseDepartment of Dermatology, Erasmus Medical Centre Rotterdam, Rotterdam, The Netherlands
A R T I C L E I N F O
Article history:
Received 27 July 2007
Received in revised form 3
September 2007
Accepted 5 September 2007
Available online 22 October 2007
Keywords:
Melanoma
Metastasis
Chemoprevention
HMG-CoA reductase inhibitors
0959-8049/$ - see front matter � 2007 Elsevidoi:10.1016/j.ejca.2007.09.004
* Corresponding authors: Tel.: +31 71 526 279E-mail addresses: [email protected] (E
A B S T R A C T
Background: Statins show anticancer activity in melanoma cells. We investigated the asso-
ciation between statins and incidence and Breslow thickness of cutaneous melanoma (CM).
Methods: Data were used from PHARMO, a pharmacy database, and PALGA, a pathological
database, in the Netherlands. Cases had a primary CM diagnosis between January 1st 1991
and December 14th 2004, were P18 years and had P3 years of follow up in PHARMO before
CM diagnosis. Controls were matched for gender, date of birth and geographic region. Anal-
yses were adjusted for age, gender, year of diagnosis, number of medical diagnoses and the
use of NSAIDs and oestrogens.
Findings: Finally, 1318 cases and 6786 controls were selected. CM risk was not associated
with statin use (P0.5 years) (adjusted odds ratio (OR) = 0.98, 95% confidence interval
(CI) = 0.78–1.2). However, statin use was associated with a reduced Breslow thickness
()19%, 95% CI = )33, )2.3, p = 0.03).
Conclusion: Our study suggests protective effects of statins on melanoma progression.
� 2007 Elsevier Ltd. All rights reserved.
1. Introduction
Cutaneous melanoma (CM) accounts for 77% of all deaths due
to skin cancer. The incidence of CM is increasing consider-
ably, about 3% each year.1
Until now, treatment of advanced CM has been disappoint-
ing.2 Preventive public health measures aiming at early
diagnosis have therefore received much attention. Chemopre-
vention would be another approach to inhibit the develop-
ment or progression of CM. In vitro studies have shown that
er Ltd. All rights reserved
0; fax: +31 71 526 6980..R. Koomen), h.j.guchelaa
several agents including 3-hydroxy-3-methylglutaryl-coen-
zyme A reductase inhibitors (statins) have the potential to al-
ter CM behaviour.3 Statins are interesting candidates for
chemoprevention because they are widely used and have an
excellent long term safety.4
Statins inhibit the cholesterol biosynthesis through inhibi-
tion of the enzyme HMG-Co-A reductase and subsequently
cause depletion of mevalonate, a precursor of cholesterol
and farnesyl- and geranylgeranyl-moieties essential for post-
translational activation of several intracellular proteins
[email protected] (H.J. Guchelaar).
E U R O P E A N J O U R N A L O F C A N C E R 4 3 ( 2 0 0 7 ) 2 5 8 0 – 2 5 8 9 2581
through prenylation. By inhibiting prenylation, statins may
affect several proteins such as the Rho family involved in sig-
nalling and regulation of cell differentiation and prolifera-
tion.5,6 High-throughput screens for transcriptionally
regulated targets in the metastatic process have shown that
RhoC overexpression dramatically increases the metastatic
potential of inoculated melanoma in mice.7
Therefore, statins may potentially affect incidence and
metastasic spreading of CM. Indeed, in severely combined
immunodeficient (SCID) mice atorvastatin prevented RhoC
isoprenylation, invasion and metastasis of A375M
melanocytes.8
Epidemiological studies and meta-analyses have sug-
gested that use of statins is associated with a lower risk of
developing cancer in general .9–14 However, most studies do
not have sufficient sample size to study site-specific can-
cers.11 For colorectal cancer, a case-control study with 1809
cases and 1809 controls was published by Coogan and col-
leagues,15 but for CM no studies with sufficient sample size
have been published.
In an earlier nested case-control observational study we
confirmed a significant risk reduction of cancer of 20% in sta-
tin users compared to non-users. For incident skin cancers,
the risk reduction was 36% but statistically not significant (ad-
justed odds ration (OR) = 0.63; 95% confidence interval (CI),
0.22 to 1.8).9 Although a Cochrane Review demonstrated no
significant association between statin use and CM incidence
(OR = 0.90, 95% CI 0.56–1.4), the authors concluded further
exploration of the use of statins in melanoma prevention is
warranted.16,17
The primary objective of this study is to investigate the ef-
fect of statins on the incidence and the Breslow thickness of
CM. Also, a pilot study was performed to study the effects
of statins on the time to metastasis.
2. Methods
2.1. Setting
Data were used from the PHARMO database, containing drug
dispensing records of a defined population of over 2 million
Dutch residents, thus representing more than 12% of the
Dutch population. Residents are included regardless of type
of insurance.18
Participants of PHARMO enter the database with the first
prescription filled in a PHARMO pharmacy and are observed
until the last prescription. Since, in the Netherlands, most
individuals visit a single pharmacy, dispensing histories are
virtually complete.19 The computerised drug dispensing his-
tories contain all dispensed prescriptions and include infor-
mation on type, quantity, dosage form, strength, dispensing
date and prescribed daily dose of the dispensed drug. PHAR-
MO was linked to PALGA, the Dutch nationwide registry of
histopathology and cytopathology, using a variation of a reli-
able probabilistic algorithm.20 PALGA contains abstracts of all
pathology reports with encrypted patient identification and
diagnostic terms which are in scope with SNOMED classifica-
tion. Since 1990 the registration reached 100% participation
and, in 2004, data on over 9 million patients had been
archived.21 Therefore PALGA represents all Dutch patients
and is the basis for the Dutch Cancer Registry.
2.2. Study population
Cases had a primary CM diagnosis in PALGA between January
1st 1991 and December 14th 2004 and were also registered in
PHARMO in this period. End of follow up was defined as the
date of CM diagnosis (index date). For the pilot study, 90 days
(i.e. the usual prescription duration) after the last date in
PHARMO or date of metastasis, whichever occurred first,
was used as end of follow up.
For each case, all records in PALGA were interpreted by one
of the two investigators (AJ, ERK). From these records the
researchers extracted and recorded diagnosis and date of pri-
mary CM, Breslow depth (mm), CM subtype according to WHO
classification22 and body location (head-neck, trunk or
extremities) as well as occurrence and date of pathologically
confirmed metastasis of the lymph node (LN), skin and/or
internal organs between Jan 1st 1991 and March 14th 2005
(90 days after end of study period). To assess inter-observer
variation, 300 cases were randomly selected and scored by
both researchers.
Potential cases were excluded if, in PHARMO, the date of
entry was unknown, gender was unknown, follow up in the
3 years before CM diagnosis was incomplete, or, in PALGA, if
the date of CM diagnosis was before the age of 18 or before
January 1, 1991, the melanoma was not pathologically con-
firmed, or if the primary melanoma was not on the skin
(e.g. in the eye) or if the melanoma was in situ (Fig. 1).
For every eligible case, an average of five controls was sam-
pled from the population available in PHARMO, matched for
gender, date of birth (+/) 2 years) and geographic region. Po-
tential cases could not be selected as controls. To calculate
follow up for controls, controls were assigned the index date
of the matched case.
Controls were excluded if, in PHARMO, the date of entry
was unknown, if they were younger than 18 years at the index
date, if the follow up in the 3 years before index date was
incomplete, or if they were diagnosed in PHARMO with previ-
ous melanoma according to the International Classification of
Disease (Fig. 1).
2.3. Drug exposure
Statin exposure was defined as the use of one or more statins
for at least 6 months of cumulative prescription duration in
the 3 years before CM (i.e. we assumed this minimal exposure
to be required for the hypothesised biological mechanism).
All statins commercially available in the Netherlands within
the study period were included: pravastatin, simvastatin,
cerivastatin (since withdrawn), atorvastatin, rosuvastatin
and fluvastatin (ATC codes: C10AAXX).
To further detail statin use, several variables related to sta-
tin exposure were created (Fig. 2), all with the 6 month thresh-
old. The cumulative number of dispenses, cumulative
dispensed dose and the cumulative prescribed duration were
calculated. The average day dose was defined as the cumula-
tive dose divided by the cumulative duration. Lag time was
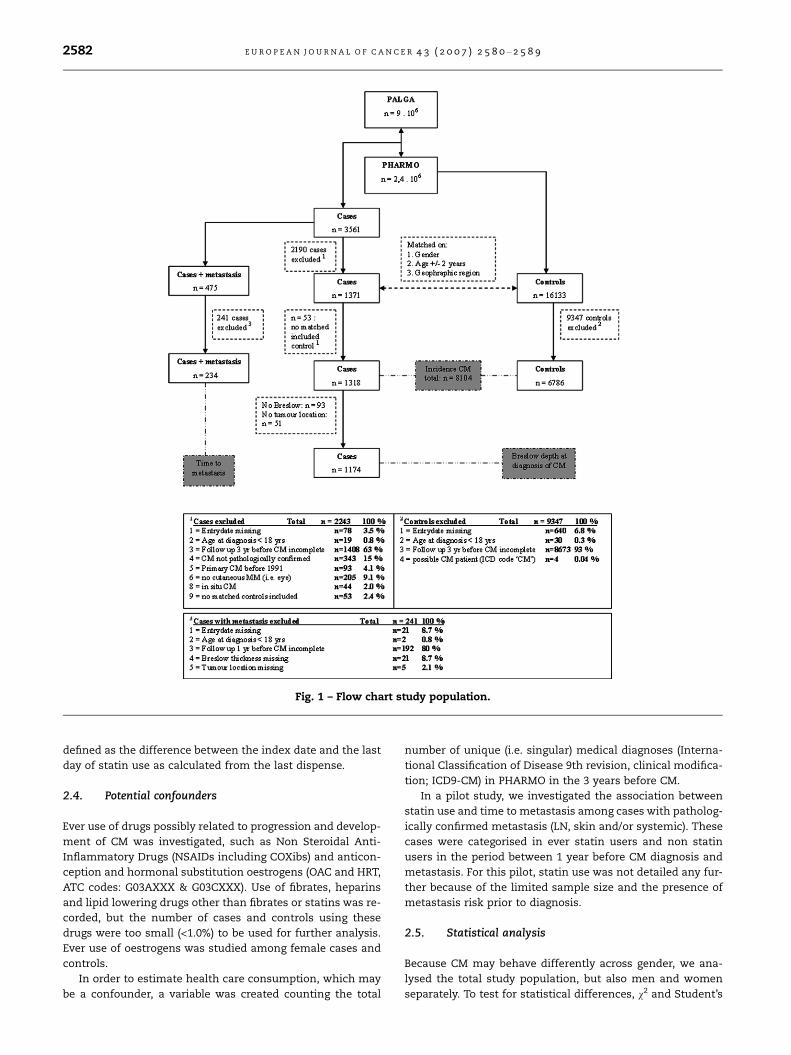
Fig. 1 – Flow chart study population.
2582 E U R O P E A N J O U R N A L O F C A N C E R 4 3 ( 2 0 0 7 ) 2 5 8 0 – 2 5 8 9
defined as the difference between the index date and the last
day of statin use as calculated from the last dispense.
2.4. Potential confounders
Ever use of drugs possibly related to progression and develop-
ment of CM was investigated, such as Non Steroidal Anti-
Inflammatory Drugs (NSAIDs including COXibs) and anticon-
ception and hormonal substitution oestrogens (OAC and HRT,
ATC codes: G03AXXX & G03CXXX). Use of fibrates, heparins
and lipid lowering drugs other than fibrates or statins was re-
corded, but the number of cases and controls using these
drugs were too small (<1.0%) to be used for further analysis.
Ever use of oestrogens was studied among female cases and
controls.
In order to estimate health care consumption, which may
be a confounder, a variable was created counting the total
number of unique (i.e. singular) medical diagnoses (Interna-
tional Classification of Disease 9th revision, clinical modifica-
tion; ICD9-CM) in PHARMO in the 3 years before CM.
In a pilot study, we investigated the association between
statin use and time to metastasis among cases with patholog-
ically confirmed metastasis (LN, skin and/or systemic). These
cases were categorised in ever statin users and non statin
users in the period between 1 year before CM diagnosis and
metastasis. For this pilot, statin use was not detailed any fur-
ther because of the limited sample size and the presence of
metastasis risk prior to diagnosis.
2.5. Statistical analysis
Because CM may behave differently across gender, we ana-
lysed the total study population, but also men and women
separately. To test for statistical differences, v2 and Student’s

Fig. 2 – Schematic representation of follow up and statin use.
E U R O P E A N J O U R N A L O F C A N C E R 4 3 ( 2 0 0 7 ) 2 5 8 0 – 2 5 8 9 2583
t-tests were used for categorical and continuous variables
respectively. Non-normal distributions (tested using the Kolo-
mogorov–Smirnov test) were log-transformed. All statistical
tests were two sided, with a rejection of the null hypothesis
at p < 0.05.
A multivariate logistic regression model was used to calcu-
late adjusted OR and 95% CI for the association between CM
incidence and statin use. The different statin variables were
categorised based on quartiles among all users. Multiple lin-
ear regression, which used log transformed Breslow thickness
as a dependent variable, was used to estimate the effect of
statin use on local CM progression (adjusted coefficients
and 95% CI). In this analysis, the statin variables were divided
in categories of equal distances to facilitate the interpretation
of the findings.
In the pilot study, a Kaplan–Meier curve and Cox propor-
tional hazard model were used to estimate the hazard ratio
between statin use and time to metastasis among cases with
pathologically confirmed metastasis.
All statistical analyses were performed using SPSS 14.0 (.2)
(SPSS Inc., Chicago, IL).
3. Results
3.1. Study population
Figure 1 demonstrates the ascertainment of cases and con-
trols. In total 3561 subjects who were registered in PHARMO
had a SNOMED code ‘Melanoma’ in PALGA. Of these cases,
1318 (37.0%) met the inclusion criteria. The main reason for
not meeting inclusion criteria was registration in different
time periods in PALGA and PHARMO or an incomplete follow
up in PHARMO in the 3 years before CM diagnosis. Accor-
dance between the two authors in a random sample of 300
cases was high (Kappa values >0.85), suggesting small inter-
observer variation. Of the 16,133 controls matched on gender,
age (+/) 2 years) and geographical region, 6786 (42.1%) could
be included in the study (Fig. 1).
3.2. Risk of CM development and statin use
Mean age of cases and controls was 55.3 and 55.9 years
(p > 0.05; Table 1A). Fifty-nine of the cases versus 60% of con-
trols were female (p > 0.05). Male cases had significantly more
unique diagnoses than male controls (0.84 versus 0.66,
p = 0.02; Table 1B). Among females there was no significant
difference. Statins were used for more than half a year in
the study period by 7.3% of the cases and 7.4% of the controls
(p > 0.05). Of the statins used, 62.4% was simvastatin, 14.2%
pravastatin, 4.7% fluvastatin, 16.9% atorvastatin, 1.3% rosu-
vastatin and 0.5% cerivastatin. None of the statin related vari-
ables were significantly different between cases and controls.
Women with CM were less likely to have used statins for more
than 3 years (1.2% versus 2.4%, p = 0.04) and to have a cumu-
lative dose between 1001–1500 DDD (0.6% versus 1.8%,
p = 0.02). In men, cases using statins were more likely to have
a lag time of 0.5 years or longer than controls who used stat-
ins (p = 0.03).
The average statin day dose prescribed to patients was 1.4
DDD per day (SD 0.82 DDD per day). Comparing prior drug use
demonstrated significantly more use of NSAIDs and oestro-
gens in the 3 years prior to diagnosis among CM patients (Ta-
bles 1A and 1B).
After adjusting for confounding factors in a multivariate
model, none of the statin related variables were significantly
associated with CM incidence in the total study population
(Table 2A). Although not statistically significant, a higher
average daily statin dose was associated with a lower relative
risk of CM, especially among women and to a lesser extent in
men (Table 2B). The differences in the distribution of several
characteristics of statin use observed in Tables 1A and 1B re-
mained significant after adjusting for confounding variables.
Compared to female non statin users, women who had 3 or
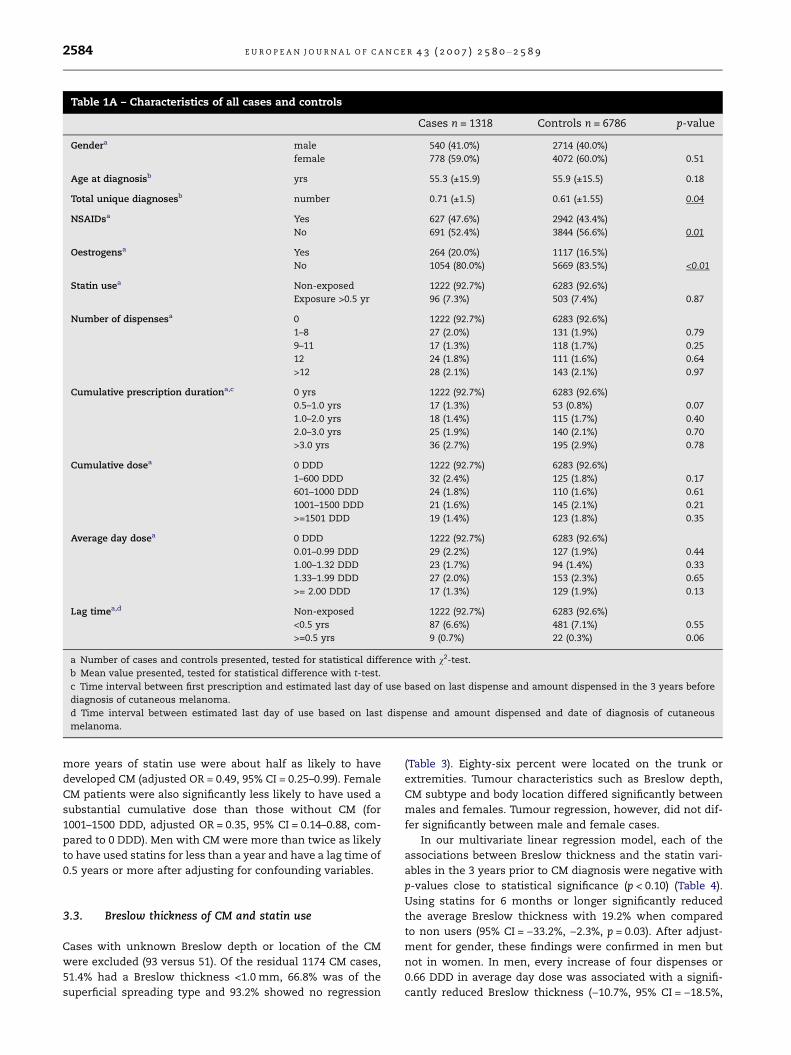
Table 1A – Characteristics of all cases and controls
Cases n = 1318 Controls n = 6786 p-value
Gendera male 540 (41.0%) 2714 (40.0%)
female 778 (59.0%) 4072 (60.0%) 0.51
Age at diagnosisb yrs 55.3 (±15.9) 55.9 (±15.5) 0.18
Total unique diagnosesb number 0.71 (±1.5) 0.61 (±1.55) 0.04
NSAIDsa Yes 627 (47.6%) 2942 (43.4%)
No 691 (52.4%) 3844 (56.6%) 0.01
Oestrogensa Yes 264 (20.0%) 1117 (16.5%)
No 1054 (80.0%) 5669 (83.5%) <0.01
Statin usea Non-exposed 1222 (92.7%) 6283 (92.6%)
Exposure >0.5 yr 96 (7.3%) 503 (7.4%) 0.87
Number of dispensesa 0 1222 (92.7%) 6283 (92.6%)
1–8 27 (2.0%) 131 (1.9%) 0.79
9–11 17 (1.3%) 118 (1.7%) 0.25
12 24 (1.8%) 111 (1.6%) 0.64
>12 28 (2.1%) 143 (2.1%) 0.97
Cumulative prescription durationa,c 0 yrs 1222 (92.7%) 6283 (92.6%)
0.5–1.0 yrs 17 (1.3%) 53 (0.8%) 0.07
1.0–2.0 yrs 18 (1.4%) 115 (1.7%) 0.40
2.0–3.0 yrs 25 (1.9%) 140 (2.1%) 0.70
>3.0 yrs 36 (2.7%) 195 (2.9%) 0.78
Cumulative dosea 0 DDD 1222 (92.7%) 6283 (92.6%)
1–600 DDD 32 (2.4%) 125 (1.8%) 0.17
601–1000 DDD 24 (1.8%) 110 (1.6%) 0.61
1001–1500 DDD 21 (1.6%) 145 (2.1%) 0.21
>=1501 DDD 19 (1.4%) 123 (1.8%) 0.35
Average day dosea 0 DDD 1222 (92.7%) 6283 (92.6%)
0.01–0.99 DDD 29 (2.2%) 127 (1.9%) 0.44
1.00–1.32 DDD 23 (1.7%) 94 (1.4%) 0.33
1.33–1.99 DDD 27 (2.0%) 153 (2.3%) 0.65
>= 2.00 DDD 17 (1.3%) 129 (1.9%) 0.13
Lag timea,d Non-exposed 1222 (92.7%) 6283 (92.6%)
<0.5 yrs 87 (6.6%) 481 (7.1%) 0.55
>=0.5 yrs 9 (0.7%) 22 (0.3%) 0.06
a Number of cases and controls presented, tested for statistical difference with v2-test.
b Mean value presented, tested for statistical difference with t-test.
c Time interval between first prescription and estimated last day of use based on last dispense and amount dispensed in the 3 years before
diagnosis of cutaneous melanoma.
d Time interval between estimated last day of use based on last dispense and amount dispensed and date of diagnosis of cutaneous
melanoma.
2584 E U R O P E A N J O U R N A L O F C A N C E R 4 3 ( 2 0 0 7 ) 2 5 8 0 – 2 5 8 9
more years of statin use were about half as likely to have
developed CM (adjusted OR = 0.49, 95% CI = 0.25–0.99). Female
CM patients were also significantly less likely to have used a
substantial cumulative dose than those without CM (for
1001–1500 DDD, adjusted OR = 0.35, 95% CI = 0.14–0.88, com-
pared to 0 DDD). Men with CM were more than twice as likely
to have used statins for less than a year and have a lag time of
0.5 years or more after adjusting for confounding variables.
3.3. Breslow thickness of CM and statin use
Cases with unknown Breslow depth or location of the CM
were excluded (93 versus 51). Of the residual 1174 CM cases,
51.4% had a Breslow thickness <1.0 mm, 66.8% was of the
superficial spreading type and 93.2% showed no regression
(Table 3). Eighty-six percent were located on the trunk or
extremities. Tumour characteristics such as Breslow depth,
CM subtype and body location differed significantly between
males and females. Tumour regression, however, did not dif-
fer significantly between male and female cases.
In our multivariate linear regression model, each of the
associations between Breslow thickness and the statin vari-
ables in the 3 years prior to CM diagnosis were negative with
p-values close to statistical significance (p < 0.10) (Table 4).
Using statins for 6 months or longer significantly reduced
the average Breslow thickness with 19.2% when compared
to non users (95% CI = )33.2%, )2.3%, p = 0.03). After adjust-
ment for gender, these findings were confirmed in men but
not in women. In men, every increase of four dispenses or
0.66 DDD in average day dose was associated with a signifi-
cantly reduced Breslow thickness ()10.7%, 95% CI = )18.5%,

Table 1B – Characteristics of male and female cases and controls
Males Females
Cases n = 540 Controls n = 2714) p-value Cases = 778 Controls n = 4072 p-value
Age at diagnosisa yrs 57.7 (±14.6) 58.0 (±14.2) 0.72 53.6 ( 6.5) 54.6 (±16.1) 0.14
Total unique diagnosesa number 0.84 (±1.76) 0.66 (±1.61) 0.02 0.62 ( .33) 0.59 (±1.50) 0.55
NSAIDsb Yes 239 (44.3%) 1125 (41.5%) 388 (5 .1%) 1817 (44.6%)
No 301 (55.7%) 1589 (58.5%) 0.23 390 (4 .9%) 2255 (55.4%) 0.01
Oestrogensb Yes – – 264 (3 .9%) 1117 (27.4%)
No – – – 514 (6 .1%) 2955 (72.6%) <0.001
Statin useb Non-exposed 477 (88.3%) 2446 (90.1%) 745 (9 .8%) 3837 (94.2%)
Exposure >0.5 yr 63 (11.7%) 268 (9.9%) 0.21 33 (4. ) 235 (5.8%) 0.72
Number of Dispensesb 0 477 (88.3%) 2446 (90.1%) 745 (9 .8%) 3837 (94.2%)
1–8 17 (3.1%) 68 (2.5%) 0.37 10 (1. ) 63 (1.5%) 0.56
9–11 11 (2.0%) 66 (2.4%) 0.63 6 (0.8 ) 52 (1.3%) 0.23
12 15 (2.8%) 61 (2.2%) 0.43 9 (1.2 ) 50 (1.2%) 0.84
>12 20 (3.7%) 73 (2.7%) 0.19 8 (1.0 ) 70 (1.7%) 0.16
Cumulative prescription durationb,c 0 yrs 477 (88.3%) 2446 (90.1%) 745 (9 .8%) 3837 (94.2%)
0.5–1.0 yrs 12 (2.2%) 28 (1.0%) 0.02 5 (0.6 ) 25 (0.6%) 0.95
1.0–2.0 yrs 11 (2.0%) 61 (2.2%) 0.81 7 (0.9 ) 54 (1.3%) 0.32
2.0–3.0 yrs 13 (2.4%) 80 (2.9%) 0.55 12 (1. ) 60 (1.5%) 0.93
>3.0 yrs 27 (5.0%) 99 (3.6%) 0.13 9 (1.2 ) 96 (2.4%) 0.04
Cumulative doseb 0 DDD 477 (88.3%) 2446 (90.1%) 745 (9 .8%) 3837 (94.2%)
1–600 DDD 21 (3.9%) 66 (2.4%) 0.06 11 (1. ) 59 (1.4%) 0.90
601–1000 DDD 14 (2.6%) 60 (2.2%) 0.55 10 (1. ) 50 (1.2%) 0.93
1001–1500 DDD 16 (3.0%) 71 (2.6%) 0.61 5 (0.6 ) 74 (1.8%) 0.02
>= 1501 DDD 12 (2.2%) 71 (2.6%) 0.65 7 (0.9 ) 52 (1.3%) 0.37
Average day doseb 0 DDD 477 (88.3%) 2446 (90.1%) 745 (9 .8%) 3837 (94.2%)
0.01–0.99 DDD 17 (3.1%) 63 (2.3%) 0.24 12 (1. ) 64 (1.6%) 0.91
1.00–1.32 DDD 17 (3.1%) 56 (2.1%) 0.12 6 (0.8 ) 38 (0.9%) 0.64
1.33–1.99 DDD 17 (3.1%) 71 (2.6%) 0.46 10 (1. ) 82 (2.0%) 0.17
>= 2.00 DDD 12 (2.2%) 78 (2.9%) 0.45 5 (0.6 ) 51 (1.3%) 0.15
Lag timeb,d Non-exposed 477 (88.3%) 2446 (90.1%) 745 (9 .8%) 3837 (94.2%)
<0.5 yrs 57 (10.6%) 258 (9.5%) 0.42 30 (3. ) 223 (5.5%) 0.07
>=0.5 yrs 6 (1.1%) 10 (0.4%) 0.03 3 (0.4 ) 12 (0.3%) 0.70
a Mean value presented, tested for statistical difference with t-test.
b Number of cases and controls presented, tested for statistical difference with v2-test.
c Time interval between first prescription and estimated last day of use based on last dispense and amount dispensed in the three years before iagnosis of cutaneous melanoma.
d Time interval between estimated last day of use based on last dispense and amount dispensed and date of diagnosis of cutaneous melanoma
EU
RO
PE
AN
JO
UR
NA
LO
FC
AN
CE
R4
3(2
00
7)
25
80
–2
58
92
58
5
n
±1
±1
0
9
3
6
5
2%
5
3%
%
%
%
5
%
%
5%
%
5
4%
3%
%
%
5
5%
%
3%
%
5
9%
%
d
.

Table 2A – Multivariate analysis of risk factors 3 years before diagnosis of CM
Adjusted ORa 95% CI
Statin use Non-exposed 1.0 Referent
>0.5 yr 0.98 0.78–1.2
No. of dispenses 0 1.0 Referent
1–8 1.1 0.70–1.6
9–11 0.73 0.44–1.2
12 1.1 0.71–1.7
>12 1.0 0.67–1.5
Cumulative prescription duration 0 yrs 1.00 Referent
0.5–1.0 yrs 1.7 0.97–2.9
1.0–2.0 yrs 0.80 0.48–1.3
2.0–3.0 yrs 0.91 0.59–1.4
>3.0 yrs 0.96 0.66–1.3
Cumulative dose 0 DDD 1.00 Referent
1–600 DDD 1.3 0.89–2.0
601–1000 DDD 1.1 0.72–1.8
1001–1500 DDD 0.74 0.47–1.2
>= 1501 DDD 0.78 0.48–1.3
Average day dose 0 DDD 1.0 Referent
0.01–0.99 DDD 1.2 0.79–1.8
1.00–1.32 DDD 1.3 0.79–2.0
1.33–1.99 DDD 0.91 0.60–1.4
>= 2.00 DDD 0.67 0.40–1.1
Lag timeb Non-exposed 1.0 Referent
<0.5 yrs 0.94 0.73–1.2
>= 0.5 yrs 2.0 0.92–4.4
a Adjusted for age, gender, year of diagnosis, total number of unique ICD diagnoses, the use of NSAIDs and oestrogens.
b Time interval between estimated last day of use (based on last dispense and amount dispensed) and date of diagnosis of CM.
2586 E U R O P E A N J O U R N A L O F C A N C E R 4 3 ( 2 0 0 7 ) 2 5 8 0 – 2 5 8 9
)2.2%, p = 0.02 and )11.0%, 95% CI = )19.7%, )1.2%, p = 0.03,
respectively).
3.4. Time to CM metastasis and statin use - pilot study
Of all 3561 CM cases, 475 (13.3%) had pathologically confirmed
metastasis (Fig. 1). Of these 475 cases with metastasis, 234
(49.3%) could be included in the analysis (average age was
54.7 years and 46.2% were females). The average number of
months to metastasis was significantly higher for statin users
than for non users (28.4 [SD 26.9] versus 16.5 [SD 22.7],
p = 0.03) (Fig. 3).
After adjustment for gender, age, year of CM diagnosis,
body site, Breslow thickness, histological subtype, presence
of regression, use of NSAID and oestrogens in a Cox propor-
tional hazard model, ever statin use between the year prior
to CM diagnosis and date of metastasis reduced the likelihood
of metastasis but was no longer significant (HR 0.69, 95%
CI = 0.42–1.1). A survival analysis model that excluded Bre-
slow thickness was performed as well. This model showed a
significant effect of statin use on time to metastasis
(HR = 0.58, 95% CI = 0.36–0.94).
4. Discussion
4.1. Incidence cutaneous melanoma
None of the statin related independent variables in our
study consistently supports a risk reduction of statin use
on the incidence of CM (Tables 2A and 2B). Possibly, the
average daily doses in our population (median: 1.3 to 2.0
DDD) are not high enough to prove a chemopreventive ef-
fect. The follow up may be too short and persistence (i.e.
compliance with statin intake) may be poor, a problem of
statin therapy as described by Johnson and colleagues.23
However, our findings are in concordance with the Cochrane
Review.16,17
4.2. Breslow thickness at diagnosis
To our knowledge, this is the first study investigating an asso-
ciation between statin use and Breslow depth at diagnosis of
CM. Our data suggest that statin use is associated with a sig-
nificantly reduced Breslow thickness at diagnosis ()19.2%,
95% CI = )33.2, )2.3, p = 0.03). As non statin-users in our data-
base had a mean Breslow thickness of 1.8 mm, this would
indicate an average reduction in the depth of the lesion of
0.35 mm with statin use. This is an important finding since
the Breslow thickness at diagnosis is one of the strongest
determinants for prognosis.24,25
Among men this effect was even more pronounced with a
reduction in Breslow thickness of )27.8% (95% CI = )43.7%,
)7.4%, p = 0.01). Male non-statin users had a mean Breslow
thickness of 2.1 mm; therefore, statin use for 0.5 years or
more would result in a mean reduction of 0.58 mm. Because
male cases, especially, had a significant higher number of un-
ique ICD diagnoses compared to male controls (0.84 versus
0.66, p = 0.02), one could also argue that statin use among

Table 2B – Multivariate analysis of risk factors of men and women 3 years before diagnosis of CM
Males Females
Adjusted ORa 95% CI Adjusted ORb 95% CI
Statin use Non-exposed 1.0 Referent 1.0 Referent
>0.5 yr 1.2 0.88–1.6 0.75 0.51–1.1
No. of dispenses 0 1.0 Referent 1.0 Referent
1–8 1.3 0.73–2.2 0.86 0.44–1.7
9–11 0.84 0.44–1.6 0.62 0.26–1.4
12 1.3 0.72–2.3 0.93 0.45–1.9
>12 1.4 0.82–2.3 0.61 0.29–1.3
Cumulative prescription duration 0 yrs 1.0 Referent 1.0 Referent
0.5–1.0 yrs 2.1 1.1–4.2 1.1 0.43–3.0
1.0–2.0 yrs 0.91 0.47–1.7 0.68 0.31–1.5
2.0–3.0 yrs 0.82 0.45–1.5 1.1 0.57–2.0
>3.0 yrs 1.4 0.90–2.2 0.49 0.25–0.99
Cumulative dose 0 DDD 1.0 Referent 1.0 Referent
1–600 DDD 1.6 0.96–2.6 1.0 0.53–1.9
601–1000 DDD 1.2 0.66–2.2 1.1 0.54–2.1
1001–1500 DDD 1.2 0.67–2.0 0.35 0.14–0.88
>= 1501 DDD 0.83 0.44–1.6 0.71 0.32–1.6
Average day dose 0 DDD 1.0 Referent 1.0 Referent
0.01–0.99 DDD 1.4 0.81–2.4 0.99 0.53–1.9
1.00–1.32 DDD 1.5 0.85–2.5 0.88 0.37–2.1
1.33–1.99 DDD 1.3 0.73–2.2 0.63 0.33–1.2
>= 2.00 DDD 0.75 0.40–1.4 0.53 0.21–1.3
Lag timec Non-exposed 1.0 Referent 1.0 Referent
<0.5 yrs 1.1 0.79–1.5 0.72 0.48–1.1
>= 0.5 yrs 2.9 1.0–8.1 1.3 0.36–4.6
a Adjusted for age, year of diagnosis, total number of unique ICD diagnoses and the use of NSAIDs.
b Adjusted for age, year of diagnosis, total number of unique ICD diagnoses, the use of NSAIDs and oestrogens.
c Time interval between estimated last day of use (based on last dispense and amount dispensed) and date of diagnosis of CM.
Table 3 – Melanoma characteristics of the primary CM of the cases
Total n = 1174 Male n=487 Female n = 687 p-value
Breslow
mm 1.75 2.06 1.53 a<0.001
Breslow in AJCC categories
0–1 mm 604 (51.4%) 223 (45.8%) 381 (55.5%) b0.001
1.01–2 mm 284 (24.2%) 123 (25.3%) 161 (23.4%)
2.01–4 mm 188 (16.0%) 85 (17.5%) 103 (15.0%)
>4 mm 98 (8.3%) 56 (11.5%) 42 (6.1%)
Type of melanoma
Superficial spreading 784 (66.8%) 315 (64.7%) 469 (68.3%) b0.02
Nodular 187 (15.9%) 96 (19.7%) 91 (13.2%)
Lentigo maligna 153 (13.0%) 59 (12.1%) 94 (13.7%)
Unknown/others 50 (4.3%) 17 (3.5%) 33 (4.8%)
Regression of primary tumour
Yes 80 (6.8%) 31 (6.4%) 49 (7.1%) b0.61
No / Unknown 1094 (93.2%) 456 (93.6%) 638 (92.9%)
Location of primary tumour
Head/neck 160 (13.6%) 86 (17.7%) 74 (10.8%) b<0.001
Trunk 490 (41.7%) 270 (55.4%) 220 (32.0%)
Extremity 524 (44.6%) 131 (26.9%) 393 (57.2%)
a Number of male versus female cases tested for statistical difference with t-test, equal variances not assumed.
b Number of male versus female cases tested for statistical difference with v2-test.
E U R O P E A N J O U R N A L O F C A N C E R 4 3 ( 2 0 0 7 ) 2 5 8 0 – 2 5 8 9 2587

Table 4 – Multivariable linear regression analysis between Breslow thickness and statin use
Variables Coefficienta 95% CI p Change inindependentvariable
Estimated %change in meanBreslow
95% CI
TOTAL (n = 1174)
Statin use for at least 0.5 years )0.213 )0.40–0.02 0.03 Yes/No )19.2 )33.2–2.3
Nr. of dispenses of statin )0.066 )0.14–0.004 0.06 4 dispenses )6.4 )12.6–0.4
Cumulative duration of prescriptions )0.052 )0.11–0.01 0.10 1 year )5.1 )10.8–0.9
Cumulative dose )0.058 )0.12–0.01 0.08 500 DDD )5.6 )11.5–0.6
Average dose per day )0.072 )0.15–0.01 0.10 0.66 DDD per day )7.0 )13.8–0.6
MALE (n = 487)
Statin use for at least 0.5 years )0.326 )0.57–0.08 0.01 Yes/No )27.8 )43.7–�7.4
Nr. of dispenses of statin )0.113 )0.20–0.02 0.02 4 dispenses )10.7 )18.5–�2.2
Cumulative duration of prescriptions )0.073 )0.15–0.01 0.07 1 year )7.0 )14.0–0.6
Cumulative dose )0.077 )0.16–0.01 0.08 500 DDD )7.4 )15.0–0.9
Average dose per day )0.116 )0.22–0.01 0.03 0.66 DDD per day )11.0 )19.7–�1.2
FEMALE (n = 687)
Statin use for at least 0.5 years )0.049 )0.35–0.25 0.75 Yes/No )4.8 )29.6–28.8
Nr. of dispenses of statin )0.006 )0.12–0.10 0.91 4 dispenses )0.6 )11.0–11.0
Cumulative duration of prescriptions )0.024 )0.13–0.08 0.65 1 year )2.4 )11.8–8.2
Cumulative dose )0.044 )0.14–0.06 0.39 500 DDD )4.3 )13.4–5.8
Average dose per day )0.010 )0.13–0.11 0.87 0.66 DDD per day )1.0 )12.3–11.6
a Adjusted for age, gender (total group only), year of diagnosis, total number of unique ICD diagnoses, use of oestrogens (not in sub analysis
males and use of NSAIDs).
2588 E U R O P E A N J O U R N A L O F C A N C E R 4 3 ( 2 0 0 7 ) 2 5 8 0 – 2 5 8 9
men is simply associated with earlier diagnosis of a CM lesion
and not with slower progression of the CM lesion.
4.3. Strengths and limitations
PALGA and PHARMO are general population based databases
that closely reflect the Dutch population.20,21 Moreover, phar-
macy data are gathered prospectively. Therefore, recall bias is
avoided.
Another strength of our study is that PHARMO enabled us
to study dose-effect responses. For example, our data suggest
Fig. 3 – Statin use between 1 year before CM diagnosis and
metastasis.
thinner melanoma in patients who use higher doses of
statins.
Since risk factors for melanoma do not play a role in the
prescription of statins, confounding by indication seems unli-
kely. However, statin users are likely to have more health care
contacts and therefore might be more likely to be diagnosed
with melanoma. We included the number of unique medical
diagnoses (ICD codes) in our study to adjust for this. Never-
theless, not all health consumption may be reflected in these
diagnoses and ascertainment bias is still possible.
A limitation of our study is the relatively high frequency of
simvastatin prescriptions; 63% of the prescriptions were sim-
vastatin. Because the inhibitory effect of statins may not be
equal for all statins,26 the results of our study cannot be gen-
eralised to all statins.
We were not able to study the effects of statin use longer
than 3 years before CM, but all patients included did have full
follow up for the 3 years before diagnosis of CM. For some sub
analyses the sample sizes may be too small. Most cases were
excluded because they were registered in PHARMO in a differ-
ent time period. Following this line of reasoning, with a re-
quired follow up of only 1 year the number of cases would
increase from 1318 (37.0%) to 1697 (47.7%).
PHARMO does not provide information on lifestyle vari-
ables, such as sun exposure, a risk factor for the development
of melanoma. It seems unlikely however that the use of stat-
ins is associated with sun exposure. However, it is possible
that statin use is associated with the intake of certain foods
and some authors have suggested that specific food items
may influence the incidence of melanoma.27
Therefore, we cannot rule out residual biases or confound-
ing as possible explanations for our findings. A possible cau-
sal relationship with regard to our findings should be studied
in a prospective randomised trial.

E U R O P E A N J O U R N A L O F C A N C E R 4 3 ( 2 0 0 7 ) 2 5 8 0 – 2 5 8 9 2589
4.4. Time to metastasis
In a small sample of about 250 patients, univariate analysis
suggested that statin use may delay time to metastasis. After
adjusting for Breslow thickness and other factors, this associ-
ation was no longer significant (HR = 0.69, 95% CI = 0.42–1.1).
To differentiate between the direct effects of statins on the
process of metastasis and their effect on metastasis through
Breslow thickness, we also performed an analysis excluding
Breslow thickness. This model did show a significant effect
of statin use on time to metastasis (HR = 0.58, 95% CI = 0.36–
0.94), which suggests that the effect of statins on time to
metastasis may not only be caused by the effect of statins
on the Breslow thickness.
Unfortunately, we were not able to perform a sensitivity
analysis, excluding cases with a positive sentinel node proce-
dure (N = 52), since only one statin user had a positive senti-
nel node procedure. Therefore, bias due to early detection of
metastasis in a sentinel node procedure is possible.
5. Conclusion
Our observational study suggests a protective effect of statins
on the progression of melanoma. A validation of our findings
is justified, preferably in a prospective randomised study.
Also, linkage of datasets like ours to death registers may be
helpful in the further exploration of the effect of statins on
(progression of) melanoma.
Conflict of interest statement
None declared.
Acknowledgement
We thank Professor Jan Vandenbroucke for critical discussion
of the design of the study and Dr. Mark Tinga for data selec-
tion in PHARMO.
R E F E R E N C E S
1. http://www.cancer.org/, Cancer facts and figures 2004, visited7th Jan 2007.
2. Eigentler TK, Caroli UM, Radny P, Garbe C. Palliative therapyof disseminated malignant melanoma: a systematic reviewof 41 randomised clinical trials. The Lancet Oncology2003;4:748–59.
3. Graaf MR, Richel DJ, van Noorden CJF, Guchelaar HJ. Effect ofstatins and farnesyltransferase inhibitors on thedevelopment and progression of cancer. Cancer Treat Rev2004;30:609–41.
4. Demierre MF. What about chemoprevention for melanoma?Curr Opin Oncol 2006;18:180–4.
5. Goldstein JL, Brown MS. Regulation of the mevalonatepathway. Nature 1990;343:425–30.
6. Bos JL. Ras oncogenes in human cancer: A review. Cancer Res1989;49:4682–9.
7. Clark EA, Golub TR, Lander ES, Hynes RO. Genomic analysis ofmetastasis reveals an essential role for RhoC. Nature2000;406:532–5.
8. Collisson EA, Kleer C, Wu M, et al. Atorvastatin preventsRhoC isoprenylation, invasion, and metastasis in humanmelanoma cells. Mol Cancer Ther 2003;2:941–8.
9. Graaf MR, Beiderbeck AB, Egberts ACG, Richel DJ, GuchelaarHJ. The risk of cancer in users of statins. J Clin Oncol2004;22:2388–94.
10. Dale KM, Coleman CI, Henyan NN, Kluger J, White CM. Statinsand cancer. A meta-analysis. J Am Med Assoc2006;295(1):74–80.
11. Bonovas S, Filioussi K, Tsavaris N, Sitaras NM. Statins andcancer risk: a literature-based meta-analysis and meta-regression analysis of 35 randomized controlled trials. J ClinOncol 2006;24(30):4808–17.
12. Browning DRL, Martin RM. Statins and risk of cancer: asystematic review and meta-analysis. Int J Cancer2006;120(4):833–43.
13. Cholesterol Treatment Trialists’ (CTT) Collaborators. Efficacyand safety of cholesterol-lowering treatment: prospectivemeta-analysis of data from 90 056 participants in 14randomized trials of statins. Lancet 2005; 366: 1267–1278.
14. Bjerre LM, LeLorier J. Do statins cause cancer? A meta-analysis of large randomized clinical trials. Am J Med2001;110:716–23.
15. Coogan PF, Smith J, Rosenberg L. Statin use and risk ofcolorectal cancer. J Natl Cancer Inst 2007;99(1):32–40.
16. Dellavalle RP, Drake A, Graber M, et al. Cochrane Database SystRev 2005;19(4):CD003697.
17. Freeman SR, Drake AL, Heilig LF, et al. Statins fibrates andmelanoma risk: a systematic review and meta-analysis. J NatlCancer Inst 2006;98(21):1538–46.
18. http://www.pharmo.nl/, PHARMO pharmacy database, visitedJan 8th 2007.
19. Lau HS, de Boer A, Beuning KS, et al. Validation of pharmacyrecords in drug exposure assessment. J Clin Epidemiol1997;50:619–25.
20. Herings R. Pharmo, A record linkage system forpostmarketing surveillance of prescription drugs in theNetherlands [thesis in pharmaco-epidemiology andpharmacotherapy]. The Netherlands, Utrecht University;1993: 17–32.
21. Casparie MK, Tiebosch T, Burger G, et al. Pathologydatabanking and biobanking in The Netherlands, a centralrole for PALGA, the nationwide histopathology andcytopathology data network and archive. Cellular Oncology2007;29(1):19–24.
22. LeBoit PE, Burg G, Weedon D, Sarasin A (editors). WHOclassification of tumours Volume 6, IARC WHO classificationof tumours No 6, Pathology and genetics of tumours of theskin; 2005.
23. Johnson ES. Pharmacy databases can identify waste.Pharmacoepidemiol Drug Saf 2006;15:207–9.
24. Gimotty PA, Botbyl J, Soong S, Guerry DP. A population basedvalidation of the American Joint Committee on CancerMelanoma Staging System. J Clin Oncol 2005;23:8065–75.
25. de Vries E, Houterman S, Janssen-Heijnen MLG, et al. Up-to-date survival estimates and historical trends of cutaneousmalignant melanoma in the south-east of The Netherlands.Ann Oncol 2007;18:1110–6.
26. Negre-Aminou P, van Vliet AK, van Erck M, et al. Inhibition ofproliferation of human smooth muscle cells by various HMG-CoA redyuctase inhibitors: Comparison with other humancell types. Biochim Biochim Biophys Acta 1997;1345:259–68.
27. Vinceti M, Bonvicini F, Pellacani G et al. Food intake and risk ofcutaneous melanoma in an Italian population. Eur J Clin Nutr2007 [epub ahead of printing].