1995 Minnesota Tax Incidence Study
130
1995 Minnesota Tax Incidence Study Who pays Minnesota’s household and business taxes? March 1995 MINNESOTA Department of Revenue Tax Research Division
-
Upload
khangminh22 -
Category
Documents
-
view
1 -
download
0
Transcript of 1995 Minnesota Tax Incidence Study

1995 Minnesota Tax Incidence Study
Who pays Minnesota’s household and business taxes? March 1995
MINNESOTA Department of Revenue Tax Research Division


MINNESOTA Department of Revenue March 1, 1995 To the Members of the Legislature of the State of Minnesota: I am pleased to transmit to you the third Minnesota Tax Incidence Study undertaken by the Department of Revenue in response to Minnesota Statutes, Section 270.0682 (Laws of 1990, Chapter 604, Article 10, Section 9). The tax incidence study provides comprehensive information on the overall distribution by income level of state and local taxes in Minnesota. The study answers the important question: “Who pays Minnesota’s taxes?” This report also presents representative tax burdens for typical taxpayers including elderly, single and married taxpayers at different income levels. Included in the study is a discussion of the expected impact of the 1993 and 1994 legislative session changes on the distribution of Minnesota’s taxes. The information presented herein can be used to evaluate the fairness of Minnesota’s tax system. It should also be valuable in considering any future changes in Minnesota’s tax structure. Minnesota Statutes, Section 3.197, specifies that a report to the Legislature must include the cost of its preparation. The approximate cost of preparing this report was $65,000. Sincerely, Matthew G. Smith Commissioner


i
EXECUTIVE SUMMARY This report presents estimates of the distribution of 1992 Minnesota state and local taxes by taxpayer income levels. It answers the question, “Who pays Minnesota’s taxes?” This is the third biennial tax incidence study prepared in response to the statutory requirement adopted by the 1990 legislature. The major objective of this report is to provide taxpayers and policymakers with important information critical to evaluating the equity or fairness of the overall distribution of Minnesota taxes. To help achieve this objective, the tax incidence study also provides estimates of the effect of law changes in the 1993 and 1994 legislative sessions on the distribution of Minnesota taxes. Scope of the Study Six categories of taxes are included in the incidence study:
• Individual and corporate income taxes • Sales and use taxes, including motor vehicle taxes • Property taxes for homeowners, renters and businesses • Excise taxes on tobacco, alcohol and gasoline • Insurance premiums taxes • Motor vehicle registration taxes
This report includes taxes having an initial impact on businesses, such as the corporate franchise tax and the sales tax on business purchases, as well as taxes imposed directly on individuals. The study includes $7.5 billion of state taxes, (98 percent of all state taxes) and $3.6 billion of local taxes (95 percent of local taxes). Together, the total state and local taxes on individuals and businesses in this study, $11.1 billion, account for over 97 percent of all Minnesota taxes collected in 1992. In this report, tax burdens are measured by effective tax rates -- the ratio of taxes paid to a taxpayer’s comprehensive money income. Effective tax rates are reported for taxpayers at different income levels. All taxpayers are ranked by income level and are then grouped by population deciles; each population decile includes 10 percent of the state’s households. For example, the first decile includes the 10 percent of Minnesota households with the lowest incomes; the tenth decile includes the

ii
10 percent of households with the highest incomes. The pattern of effective tax rates by income level can be used to describe the distribution of the burdens. If effective tax rates fall as income rises, the burden of a tax is regressive; if effective tax rates are constant, a tax is described as proportional. A tax is progressive if effective tax rates rise with income levels. The comprehensive money income measure used in this study includes income subject to the Minnesota personal income tax and nontaxable sources of income such as public assistance payments, tax-exempt interest and nontaxable social security and pension income. Importantly, the study covers the entire population of taxpayers in the state, including low income individuals or families that do not have to file tax returns. The results of any incidence study are sensitive to the economic assumptions used to identify who ultimately pays each type of tax. The incidence of a tax identifies the final resting place of taxes. Incidence can be quite different from the initial “impact’ of a tax, which is usually prescribed by statute in terms of who is legally required to pay the tax. Incidence differs from legal impact when the tax is ultimately shifted to others. For example, landlords may shift a significant part of the local property tax to renters in higher rents, or the corporate franchise tax may be partly absorbed by workers through lower wages. This report describes the incidence assumptions used to distribute Minnesota taxes having an initial impact on households and businesses to major taxpayer groups: Minnesota consumers, workers, landowners and investors, and nonresident taxpayers. Taxes paid by each Minnesota group are then assigned to individual taxpayers at different income levels to determine the overall distribution of state and local taxes paid by Minnesota residents. 1992 Distribution of State and Local Taxes The major findings in this study are summarized in Table 1 and highlighted in Figures 1 through 3. The results show that the combined distribution of state and local taxes in Minnesota is essentially proportional. Overall, Minnesota residents paid an estimated 12.1 percent of their 1992 total income in state and local taxes; the effective tax rate was 8.6 percent for state taxes and 3.5 percent for local property taxes. With the exception of the first decile, effective tax rates do not vary significantly with income. Based on taxes included in the study, effective tax rates are 12.0 percent in the second decile and 11.9 percent in the tenth decile. Taxpayers in the second through tenth deciles pay 98 percent of the taxes included in the study.

iii
The highest effective tax rates (12.2 to 12.3 percent) occur in the middle deciles; the rate declines slightly in the top three deciles. Because the information for the first decile includes data anomalies and measurement limitations discussed in the study, effective tax rates for the first decile should be viewed with caution.
Table 1
Minnesota Effective Tax Rates by Population Deciles All Taxpayers
Consumer Consumer Income Tax Sales Excise Total State Taxes Deciles Income Range Individual Corporate Tax Taxes Individuals Business Total
First Second Third Fourth Fifth Sixth Seventh Eighth Ninth Tenth
$5,542 & Under 5,543 - $9,092 9,093 - 13,332 13,333 - 17,879 17,880 - 23,335 23,336 - 30,079 30,080 - 38,290 38,291 - 48,819 48,820 - 66,630 66,631 & Over
-0.1% 0.2 1.0 1.7 2.4 3.0 3.5 4.1 4.6 5.8
0.7% 0.5 0.4 0.4 0.4 0.3 0.3 0.3 0.3 0.2
4.1% 3.0 2.8 2.6 2.4 2.2 2.1 1.9 1.8 1.2
2.4% 1.5 1.3 1.1 1.0 0.8 0.7 0.6 0.5 0.2
7.4% 5.4 5.6 6.1 6.4 6.7 6.9 7.2 7.4 7.5
3.5% 2.6 2.3 2.0 1.8 1.7 1.6 1.5 1.4 1.2
11.0% 8.0 7.8 8.1 8.2 8.4 8.5 8.7 8.8 8.7
Total 4.2% 0.3% 1.8% 0.6% 7.1% 1.5% 8.6%
Local Property Taxes Total State and Local Taxes Deciles Residential Business Total Individuals Business Total
First Second Third Fourth Fifth Sixth Seventh Eighth Ninth Tenth
2.8% 2.1 2.1 2.2 2.4 2.3 2.1 1.9 1.9 1.8
2.2% 1.8 2.1 1.7 1.5 1.5 1.5 1.3 1.2 1.3
5.1% 4.0 4.3 4.1 4.0 3.9 3.7 3.3 3.1 3.1
10.3% 7.6 7.8 8.4 8.9 9.1 9.1 9.2 9.4 9.4
5.7% 4.4 4.4 3.7 3.3 3.2 3.1 2.8 2.6 2.5
16.1% 12.0 12.1 12.1 12.2 12.3 12.2 12.0 11.9 11.9
Total 2.0% 1.4% 3.5% 9.2% 2.9% 12.1%
Note: Effective tax rates for the first decile reflect an adjustment to exclude a small number of households
with negative income, primarily business losses. Residential property taxes exclude taxes on cabins which are in total property taxes. Total state taxes include taxes not shown in this table.

Figure 1Effective Tax Rates for 1992,
State and Local Taxes by Population Deciles
02468
1012141618
1 2 3 4 5 6 7 8 9 10
Population Decile
Eff
ectiv
e T
ax R
ate
(Per
cent
)
Total Taxes State Taxes Local Property Tax
Figure 2Effective Tax Rates for 1992,
State and Local Taxes by Population Deciles
02468
1012141618
1 2 3 4 5 6 7 8 9 10
Population Decile
Eff
ectiv
e T
ax R
ate
(Per
cent
)
Total Taxes Taxes on Individuals Business Taxes
Note: Effective tax rates for the first decile reflect an adjustment to exclude a small number ofHouseholds with negative income, primarily business losses.
iv

Figure 3Effective Tax Rates for 1992,
State and Local Taxes by Population Deciles
-1
0
1
2
3
4
5
6
7
1 2 3 4 5 6 7 8 9 10
Population Decile
Eff
ectiv
e T
ax R
ate
(Per
cent
)
Business Taxes Income Tax Sales Tax Excise Taxes Residential Property Tax
Note: Effective tax rates for the first decile reflect an adjustment to exclude a small number ofHouseholds with negative income, primarily business losses.
As can also be seen in Figure 1, the system of state taxes in Minnesota is progressive overall. Effective tax rates rise with income from 8.0 percent in the second decile to 8.7 percent in the tenth decile. The local property tax (net of property tax refunds) distribution is regressive with effective tax rates falling from 4.0 percent in the second decile to 3.1 percent in the top decile. Figure 2 indicates that Minnesota state and local taxes on businesses are regressive with effective tax rates falling from 4.4 to 2.5 percent between the second and tenth deciles. However, progressive taxes on individuals offset regressive business taxes, producing an almost proportional overall tax burden distribution. The tax distributions in Figure 3 highlight the role of the individual income tax in balancing Minnesota’s state and local tax burden distribution. The individual income tax is significantly progressive with effective tax rates steadily increasing from a negative 0.1 percent in the first decile to 5.8 percent in the tenth decile. As is discussed in this report, the regressivity of sales, excise and business taxes are offset by Minnesota’s relatively heavy reliance on the progressive income tax.
v

vi
The individual income tax burden distribution reported in Table 1 shows, for the first time, the important impact the Minnesota working family credit (adopted in 1991) will have in increasing the progressivity of the income tax. The combination of the refundable working family and child and dependent care credits actually offsets the total income tax liability in the first decile; this explains the negative tax rate in the first decile. Although limited interstate comparative information is available, it does suggest that most states have regressive state and local tax systems. While these comparisons do not indicate whether state and local taxes in Minnesota are too high or too low, the information does suggest that Minnesota’s taxes are more equitably distributed than in most states. Table 2 indicates the shares of the $9.0 billion in total state and local taxes paid by Minnesota taxpayers in 1992 by decile; excluded from this total are $2.1 billion of taxes exported to nonresidents. Taxpayers in the top decile pay 37.1 percent of the total tax burden and just over one-half of the individual income tax burden; these taxpayers receive 37.8 percent of money income. Taxpayers in the first two deciles pay 3.7 percent of all taxes and receive 3.0 percent of household income; almost all of their tax burden is from property taxes and taxes on consumption imposed directly on individuals or passed through from taxes imposed initially on businesses.
Table 2 Shares of 1992 Minnesota Income and Taxes
Decile
Total Household
Income
Individual Income
Tax
Consumer Sales Tax
Consumer Excise
Tax
Residential Property
Taxes
Other Taxes
Business
Taxes
Total Taxes
First Second Third Fourth Fifth Sixth Seventh Eighth Ninth Tenth
0.9% 2.1 3.2 4.5 5.8 7.6 9.7 12.3 16.2 37.8
0.0% 0.1 0.7 1.8 3.2 5.4 8.0 11.8 17.6 51.3
2.1% 3.5 4.9 6.5 8.0 9.5 11.3 13.3 16.1 24.7
3.8% 5.6 7.0 8.8 9.9 10.7 12.3 13.4 13.8 14.7
2.1% 2.3 3.4 5.1 6.9 8.9 10.5 12.0 15.1 33.8
1.8% 2.4 3.5 5.4 7.2 9.0 11.7 14.2 18.1 26.9
2.8% 3.1 4.7 5.7 6.7 8.3 10.1 11.8 14.2 32.6
1.6% 2.1 3.2 4.5 5.9 7.7 9.8 12.3 16.0 37.1
Total 100.0% 100.0% 100.0% 100.0% 100.0% 100.0% 100.0% 100.0%
Total Amount
($ Millions)
$74,410.3
$3,158.1
$1,330.6
$423.3
$1,471.9
$433.2
$2,174.2
$8,991.4
vii
Tax System Objectives The results of this study focus attention on the issue of fairness in the distribution of Minnesota state and local tax burdens. Fairness refers to both vertical equity (how tax burdens vary with the level of income) and horizontal equity (how tax burdens vary for taxpayers with comparable ability to pay). In addition to fairness, there are other desirable tax-system objectives or characteristics which must be considered in evaluating the overall performance of Minnesota’s tax structure. These objectives include understandability, efficiency, competitiveness and reliability. The Department of Revenue’s Model Revenue System for Minnesota discusses each of these objectives in greater detail. Understandability is important in achieving voluntary compliance with the tax laws; simplification of the tax structure is one method of enhancing understandability. Efficiency includes the objectives of reducing economic distortions created by taxation, maximizing clarity and accountability in terms of tax and spending decisions, and minimizing both taxpayer compliance costs and administrative costs of collecting taxes. Efficiency is enhanced by a balanced use of income, sales and property taxes with broad bases and competitive tax rates. Interstate tax competition for businesses and jobs may constrain a state’s ability to raise tax rates relative to neighboring states. The objective of reliability has several important dimensions, including stability and sufficiency. A balanced use of income, sales and property taxes provides greater revenue stability over the economic cycle and sufficient growth in taxes over time to finance desired government expenditures. A significant insight from the information and results presented in this report is the importance of considering state and local taxes as a system in analyzing the equity of Minnesota’s tax distribution. The highly progressive state income tax, for example, provides an important balance to regressive sales, excise and property taxes. Any specific policy recommendation for changing the distribution of Minnesota’s state and local taxes should be evaluated in terms of the overall tax system and on the basis of the multiple tax policy objectives.

viii
Summary This report provides important information on the level and distribution of overall tax burdens in Minnesota. A unique methodology, including matching of income data from a number of different data sources for specific individuals and a consistent framework for analyzing tax shifting, is used to estimate the tax distribution. The study includes taxes imposed on both individuals and businesses. An explanation of the various components of the analysis, including assumptions and methodology, is provided in the main sections of the report. Detailed analysis of the results is provided in Chapter 6. The results presented in this report should prove valuable to policymakers considering future changes in Minnesota’s state and local taxes. It can be used to evaluate changes in the equity of specific taxes, as well as the overall tax burden distribution. In addition to equity, the results of the study are useful for addressing other tax policy issues, including overall progressivity and the balance in the state and local tax system.

ix
TABLE OF CONTENTS Chapter 1 Introduction...........................................................................................1 Chapter 2 Minnesota State and Local Taxes in 1992 ..........................................3
Taxes on Income ................................................................................................5 Taxes on Consumption.......................................................................................7 Taxes on Property...............................................................................................9 Chapter 3 Measurement of Income.....................................................................13
Definition of Income ........................................................................................13 Adjusted Gross Income (AGI) .........................................................................15 Additions to AGI..............................................................................................15 Income Not Included in Money Income ..........................................................16 The Accounting Period.....................................................................................16 Definition of a Household ................................................................................18 Differences in Household Size.........................................................................18 Summary ..........................................................................................................19 Chapter 4 The Incidence Study Database ..........................................................21
Income Sources ................................................................................................21 Tax Calculations...............................................................................................24 Summary ..........................................................................................................27 Chapter 5 Tax Incidence Analysis.......................................................................29
Introduction ......................................................................................................29 Taxes on Households .......................................................................................31 Taxes on Business ............................................................................................33 Allocation of Business Taxes: An Example....................................................37 Distribution by Taxpayer Categories ...............................................................42 Business Tax Allocators...................................................................................49 Chapter 6 Summary of Results............................................................................53
The Total Tax Burden ......................................................................................53 Overall Effective Tax Rates .............................................................................55 Effective Tax Rates by Type of Tax ................................................................59 Effective Tax Rates in the First Decile ............................................................67 The Suits Index.................................................................................................69

x
Chapter 7 Detailed Results for Different Household Types .............................71
Introduction ......................................................................................................71 Demographic Characteristics of Each Decile ..................................................71 Detailed Incidence Results for Five Different Household Types ....................75 Chapter 8 Effective Tax Rate Projections for Tax Year 1994..........................79
Introduction ......................................................................................................79 Recent Tax Changes.........................................................................................80 1994 Projections...............................................................................................81 Appendices ..............................................................................................................83 Appendix A Distribution of Tax Burden by Income Deciles ...........................85 Appendix B Minnesota Tax Burden Amounts by Population Decile..............91 Appendix C Household Characteristics and Tax Burdens by Population Deciles.........................................................................101 Appendix D Summary of Data Items ...............................................................109 Appendix E Legislative Mandate......................................................................111 Bibliography .........................................................................................................113

xi
LIST OF TABLES AND FIGURES Tables 2-1 Minnesota State and Local Tax Collections in 1992 ................................4 2-2 Distribution of 1992 State and Local Taxes..............................................6 2-3 Property Tax on Homes of Different Value and on Different Classes of Property ..................................................................11 3-1 1992 Tax Incidence Study Components of Total Household Income...................................................................................17 5-1 1992 Minnesota Taxes on Businesses.....................................................34 5-2 Distribution of Business Taxes by Taxpayer Category ..........................44 6-1 Distribution of Taxes and Income by Population Deciles ......................56 6-2 Percent Distribution of Burden by Tax Type within Population Deciles...................................................................................57 6-3 1992 Effective Tax Rates by Population Deciles (All Taxpayers) .........58 6-4 Incidence of Minnesota Business Taxes by Taxpayer Category ............67 6-5 Suits Indexes for Minnesota State and Local Taxes ...............................70 7-1 Average Tax Burdens by Household Type and Income Level ...............76 8-1 Comparison of Effective Tax Rates: 1992 Tax Incidence Study Results and 1994 Projections........................................................82

xii
Appendix Tables A-1 Effective 1992 Minnesota State and Local Tax Rates, Comparison of Distributions by Population and Income Deciles...........87 A-2 (a) State and Local Tax Burden Amounts by Income Decile, All Taxpayers ..........................................................................................88 A-2 (b) Effective Tax Rates by Income Decile, All Taxpayers...........................89 B-1 (a) State and Local Tax Burden Amounts by Population Decile, All Taxpayers ..........................................................................................92 B-1 (b) Effective Tax Rates by Population Decile, All Taxpayers .....................93 B-2 (a) State and Local Tax Burden Amounts by Population Decile, Homeowners............................................................................................94 B-2 (b) Effective Tax Rates by Population Decile, Homeowners.......................95 B-3 (a) State and Local Tax Burden Amounts by Population Decile, Renters.....................................................................................................96 B-3 (b) Effective Tax Rates by Population Decile, Renters ................................97 B-4 (a) State and Local Tax Burden Amounts by Population Decile, Others..........................................................................................98 B-4 (b) Effective Tax Rates by Population Decile, Others .................................99

xiii
Appendix Tables (cont.) Household Characteristics and Average Tax Burden Amounts by Population Decile C-1 One Person Households ........................................................................102 C-2 Retired Elderly ......................................................................................103 C-3 Single Parent Families...........................................................................104 C-4 Married without Children......................................................................105 C-5 Married with Children...........................................................................106 Figures 3-1 Computation of Money Income ..............................................................14 5-1 Estimating Tax Incidence........................................................................30 5-2 Incidence of a Hypothetical $120 Million Tax on Capital .....................38 5-3 Business Tax Allocators..........................................................................50 6-1 Distribution of Minnesota State and Local Tax Burdens by Tax ...........54 6-2 Effective Tax Rates for 1992, State and Local Taxes by Population Deciles...................................................................................60 6-3 Effective Tax Rates for 1992, Individual and Business Taxes by Population Deciles .............................................................................61 6-4 1992 Effective Tax Rates by Tax Type by Population Deciles ..............62 7-1 Households by Family Type ...................................................................72 7-2 Housing Tenure by Decile ......................................................................74


1
CHAPTER 1 INTRODUCTION This study provides estimates of the distribution of state and local taxes among Minnesota households in 1992. These estimates are based on a stratified random sample of almost 38,000 taxpayers representing over 2.1 million households. The sample is “blown up” to represent the total population, and effective tax rates are reported as a percent of total household income for groups of taxpayers. In determining effective tax rates, taxes are calculated as a percentage of a household’s comprehensive money income. Chapter 2 discusses taxes included in the study, as well as the overall Minnesota tax structure in 1992. The income definition used in this study is described in Chapter 3. Chapter 4 explains how the household database was developed. The database consists of four types of data: (1) demographic information about the household (family size, housing tenure, rent payment or home value); (2) the household’s total income (by source); (3) the household’s estimated expenditures on taxable items; and (4) estimated taxes paid based on the household’s income, purchases, and property. In some cases this tax information was obtained directly from tax records or other reported sources; in other cases, it was estimated based on a household’s income, size, and other household characteristics. Chapter 5 outlines how the study allocates the burden (or “incidence”) of each tax to Minnesota residents. In some cases (such as the sales tax on consumer purchases), a tax legally paid by business is assumed to be fully shifted to consumers in higher prices. In other cases (business property taxes and sales taxes on purchases by business), the distribution of the tax depends on the nature of the business and the size of Minnesota tax rates relative to those levied in other states. In most cases, the tax burden is shared among the industry’s owners, consumers, and workers. A full explanation of the logic used in allocating the burden of such business taxes is provided in Chapter 5.

2
Chapter 6 summarizes the results of the tax incidence study. The tax burden of each household is estimated by combining the information in the database (from Chapter 4) with the study’s incidence assumptions (from Chapter 5). Dividing Minnesota’s households into ten deciles, from lowest to highest household income, this chapter shows how the total state and local tax burden (and that of individual taxes) varies with income. The Suits index is presented as a summary measure of the regressivity (or progressivity) of tax burdens. Chapter 7 provides a more detailed look at how tax burdens vary for subgroups of taxpayers. It provides a description of the households in each decile, showing how household type and housing tenure vary with income. It also provides detailed results for five types of households -- senior citizens, one-person households, married couples without children, single parent families, and married couples with children. Chapter 8 discusses the estimated impact of tax law changes in 1993 and 1994 on the distribution of state and local tax burdens in Minnesota. Using the 1992 distribution reported in this study as the starting point, tax burdens are adjusted to reflect the expected impact of the 1993 and 1994 law changes on the tax distribution. A table showing the new distribution of effective tax rates is reported in Chapter 8. Several appendices provide more detailed information. Appendix A compares the distribution of 1992 effective state and local tax rates using two different decile concepts: population deciles and income deciles. Appendix B includes more detailed tables of the overall incidence results shown in Chapter 6; Appendix C includes detailed tables on household characteristics and tax burdens by household type. The final appendix, Appendix D, provides a detailed list of the income and tax data items for each household in the incidence study database.

3
CHAPTER 2 MINNESOTA STATE AND LOCAL TAXES IN 1992 Minnesota collected $11.4 billion in state and local taxes in 1992.1 Approximately two-thirds were collected at the state level; local governments collected one-third of the total, primarily from property taxes. This study estimates how the burden of those taxes was distributed among the residents of Minnesota, with the primary emphasis on the distribution of tax burdens by income level. The study estimates the regressivity (or progressivity) of the total tax system and each individual tax. Tax burdens are also estimated for subgroups of the population, such as senior citizens, single-parent families, homeowners, and renters. The coverage of this study is summarized in Table 2-1. It includes taxes on individuals and businesses accounting for over 97 percent of total state and local tax collections (98 percent of state collections and 95 percent of local collections).2 Table 2-2 shows the distribution of 1992 total tax revenue included in this study by major type of tax. Taxes on income (individual and corporate) accounted for 33.7 percent of total collections. Taxes on consumption (sales tax, excise taxes, and insurance premiums tax) combined for 30.7 percent of total collections. Taxes on property (including second homes and the motor vehicle registration tax) accounted for about 35.6 percent of the total.
1 Collection amounts are based on tax year 1992. Property tax collections are for taxes payable in 1992. 2 Taxes omitted from this study include estate tax, gambling taxes, sales taxes imposed by local governments, gross earnings taxes on utilities, mortgage registry and deed transfer taxes, mining taxes, and state property taxes on aircraft.

Table 2-1 Minnesota State and Local Tax Collections in 1992
($ Millions)
State
Local
Total State and Local
Included Individual income tax $3,271 Corporate franchise tax 457 General sales and use tax 2,277 Sales tax on motor vehicles 287 Motor fuels excise taxes 467 Alcoholic beverage excise taxes 55 Cigarette & tobacco excise taxes 174 Insurance premiums tax 129 Motor vehicle registration tax 376 Total $7,493
Included Gross property taxes (after credits) Homestead property taxes $1,196 Property taxes on second homes 93 Rental property taxes (residential) 499 Other business property taxes (including farming) 1,914 Subtotal $3,702 Property tax refunds (145) Total $3,557
Included $11,050
Omitted Mortgage registration and deed transfer taxes $75 Gambling taxes 57 Gross earnings taxes 4 Mining taxes 2 Other taxes 40 Total $178
Omitted Local sales taxes $60 Gross earnings taxes 31 Mineral taxes 83 Other taxes 2 Total $176
Omitted $354
Total Tax Collections $7,671
Total Tax Collections $3,733
$11,404
4
Note: Income tax includes $24 million in net income tax reciprocity payments from Wisconsin..

5
Included in Table 2-2 is the estimated distribution of state and local taxes by type of taxpayer, resident and nonresident households and businesses. This distribution indicates the initial impact of the taxes by taxpayers legally liable to pay the tax (income and property taxes) or by type of purchaser (consumer taxes).3 For example, over 50 percent of the general sales tax is paid by Minnesota residents, 3.7 percent is paid by non-residents and 45.8 percent is paid initially by businesses. Taxes on Income Individual Income Tax Minnesota enacted the state income tax in 1933 with initial rates ranging from 1 percent to 5 percent. In 1992, state income tax rates ranged from 6 to 8.5 percent with the top rate beginning at taxable incomes of $47,111 for single filers and $83,301 for married filing jointly. In 1987, Minnesota enacted most of the major provisions of the Federal Tax Reform Act of 1986. Since then, federal taxable income has been the starting point in computing the Minnesota tax, and the Minnesota tax structure has incorporated the federal personal exemptions, standard deduction, and itemized deductions. Other reforms adopted in 1987 included eliminating the 60 percent capital gains exclusion and the itemized deduction for sales taxes paid, broadening of the tax base by restricting various other deductions, and lowering state tax rates.4 In computing Minnesota taxable income in 1992, a small number of adjustments were made to federal taxable income. The graduated tax rates were applied to taxable income to calculate 1992 gross income tax. This gross tax was then reduced by several tax credits (dependent care credit and income tax paid to other states) to yield net income tax liability. The Minnesota refundable working family credit, adopted in 1991, is an additional credit available in 1992. It is an earned income tax credit equal to 10 percent of the federal EITC. The working family credit provided over 138,000 Minnesota low-income households with almost $12 million in tax relief in 1992.
3 As explained in Chapter 5, the taxes initially imposed on businesses (an estimated 39.4 percent of total collections in Table 2-2) may ultimately be shifted to consumers, workers or investors. The effective tax rates reported in this study are after the shifting has occurred. Table 5-2 provides estimates of the portion of the taxes initially imposed on businesses that is ultimately borne by Minnesota residents. 4 See Minnesota Department of Revenue, Minnesota Tax Handbook, January 1993, for specific details for each state tax and for descriptions of recent tax law changes.

6
Individual income tax collections totaled $3,271 million in 1992, accounting for almost 30 percent of total state and local tax revenue.
Table 2-2 Distribution of 1992 State and Local Taxes
($ Millions)
Collections Taxpayer Category Percentage Individuals
Tax Category Total Distribution Residents Nonresidents Business Total Taxes on Income Individual income tax Corporate franchise tax Total income taxes
$3,271 457 $3,728
29.6% 4.1 33.7%
96.5% 0.0
84.7%
3.5% 0.0 3.1%
0.0% 100. 0
12.2%
100.0% 100.0 100.0%
Taxes on Consumption General sales and use tax Sales tax on motor vehicles Motor fuels excise tax Alcoholic beverage excise taxes Cigarette and tobacco excise taxes Insurance premiums tax Total consumption taxes
$2,277 287 467 55 174 129 $3,389
20.6% 2.6 4.2 0.5 1.6
1.2 30.7%
50.5% 63.3 43.9 89.7 97.0 77.3 54.7%
3.7% 0.0
16.1 10.3
3.0 0.0 4.9%
45.8% 36.7 40.0
0.0 0.0
22.7 40.4%
100.0% 100.0 100.0 100.0 100.0 100.0 100.0%
Taxes on Property Local Homeowners (gross) Rental property (gross) Property tax refunds received Residential recreational (cabins) Commercial and industrial Farms (other than residence) Other business property State Motor vehicle registration tax Total property taxes
$1,196 499 -145 93 1,310 224 380 376 $3,933
10.8% 4.5
-1.3 0.8
11.9 2.0 3.4
3.4 35.6%
100.0% 0.0
100.0 80.0
0.0 0.0 0.0
69.0 35.2%
0.0% 0.0 0.0
20.0 0.0 0.0 0.0
0.0 0.5%
0.0% 100.0
0.0 0.0
100.0 100.0 100.0
31.0 64.3%
100.0% 100.0 100.0 100.0 100.0 100.0 100.0
100.0 100.0%
Total Taxes
$11,050
100.0%
57.9%
2.7%
39.4%
100.0%

7
Corporate Franchise Tax Minnesota also enacted the state corporate income tax in 1933. As with the individual income tax, major changes in Minnesota corporate taxation followed the 1986 Federal Tax Reform Act. In 1987, the corporate income and bank excise taxes were replaced by a corporate franchise tax based on federal taxable income. In addition, the base of the tax was broadened and the tax rate lowered.
In computing Minnesota taxable income in 1992, a number of adjustments were made to federal taxable income. For corporations with operations or sales in other states, only a portion of their total income is taxable in Minnesota. That portion is calculated by an apportionment formula based on the Minnesota shares of the corporation’s property, payroll, and sales. In apportioning corporate income to Minnesota, the sales factor is weighted 70 percent and payroll and property are each weighted 15 percent.5 In 1992, Minnesota taxable income was subject to a flat 9.8 percent tax rate; corporate franchise tax collections totaled $457 million, accounting for 4.1 percent of total tax revenue. For tax year 1992, over 50,000 corporations filed a state tax return. Taxes on Consumption A wide range of purchases by consumers and businesses are subject to taxation in Minnesota. The general retail sales tax is imposed on the purchase of tangible products and selected services. In addition, the purchases of specific products, such as cigarettes and gasoline, are subject to separate excise taxes. Insurance premiums taxes are also applied to purchases of personal and business insurance. In total, consumption taxes accounted for $3,389 million of state and local collections in 1992 (30.7 percent of all taxes).
5 Domestic unitary reporting is used, and federal taxes are not deductible in computing Minnesota corporate taxes. The apportionment formula weights sales more heavily than in many states, with tax incidence implications that are discussed in Chapter 5.
8
General Sales Tax and Sales Tax on Motor Vehicles The sales tax was first enacted in 1967 at a rate of 3 percent. The rates in effect during 1992, including a 0.5 percent statewide county option tax, were as follows: 6.5% - General rate 9.0% - Liquor and beer 4.5% - Special tooling 2.5% - Farm machinery and logging equipment The tax base is the sales price of tangible personal property and taxable services sold in the state. A complementary use tax is imposed on property purchased outside the state but used or consumed in Minnesota. Major exemptions from the tax base in 1992 included food consumed at home, clothing, prescription drugs, residential heating fuels, water services, vehicle repairs, and motor fuels. While motor vehicles are also exempt from the sales tax, they are subject to a separate sales tax on motor vehicles at the general sales tax rate. The sales tax base was significantly expanded in the late 1980s. Many services became taxable for the first time, including parking, laundry and dry cleaning, lawn and garden services, detective and security services, pet grooming, motor vehicle cleaning, building and residential cleaning, health clubs and tanning salons, interstate telephone service, club dues, and garbage collection. Also made taxable were most purchases by state government and nonprescription drugs. In 1992, purchases by non-school local governments also became taxable. Many purchases by businesses are subject to the sales and use tax and sales tax on motor vehicles. A general exemption is made for purchases of materials consumed in agricultural and industrial production (such as fuels and chemical ingredients) and for products purchased for resale (by wholesalers or retailers). Capital equipment for new and expanding industries is also exempt from tax. Nevertheless, many business purchases are taxed. For 1992, replacement capital equipment purchased by industrial firms and all capital equipment purchased by non-industrial companies was generally subject to tax. Business spending on meals, entertainment, hotels and motels, motor vehicles, and office supplies are generally subject to tax.

9
The general sales and use tax raised $2,277 million in 1992. Combined with the sales tax on motor vehicles ($287 million), they accounted for 23.2 percent of total state and local tax collections in 1992. Excise Taxes The state gasoline tax, first adopted in 1925 at a rate of 2 cents per gallon, had risen to 20 cents per gallon in 1990. The cigarette tax was first levied in 1947 at 3 cents per pack. By 1992, it had risen to 48 cents per pack. Excise tax rates on alcoholic beverages in 1992 were $2.40 per barrel of 3.2 percent beer and $4.60 for strong beer, $5.03 per gallon of liquor and from $0.30 (under 14 percent) to $3.52 (over 24 percent alcohol) per gallon for wine. These three excise taxes accounted for a total of $696 million in taxes in 1992, almost 6.3 percent of total state and local tax revenue. Insurance Premiums Tax Like most states, Minnesota levies a 2 percent tax on most insurance premiums written in Minnesota.6 All types of insurance are taxed including personal insurance (life, automobile, home, health and accident) and business insurance (business property and liability). Business insurance accounts for 23 percent of total premiums tax collections (see Table 2-2). The remainder is paid on personal insurance premiums paid by (or on behalf of) Minnesota residents. In 1992, insurance premiums taxes accounted for 1.2 percent of total state and local tax revenue. Taxes on Property Minnesota’s property tax classification system was instituted in 1913 with only four classes of property. Over time, the number of property tax classes has grown dramatically. Numerous law changes have been adopted almost yearly in recent decades to modify credits, exemptions, tax rates and brackets for different classes of property, and to provide different levels of property tax relief. Today, the Minnesota property tax system is probably the most complex in the nation.
6 The rates vary from 1.0 percent on small mutual property and casualty companies to 3 percent on surplus line agents, and there is an additional fire marshall tax on some insurance. Fraternal organizations and health maintenance organizations, among others, are exempt, and no tax is paid on self-insured plans even if administered by an insurance company.

10
Under a property classification system, property of the same value is legally taxed at very different rates. In 1992, property tax class rates ranged from 0.45 percent to 4.75 percent of market value, depending upon the property’s classification. For example, residential homestead had a class rate of one percent on the first $72,000 of market value, 2 percent on value between $72,000 and $115,000 and 2.5 percent on value over $115,000. The highest class rate, 4.75 percent applied to most commercial and industrial property. To determine the actual property taxes on a specific property, market value is multiplied by the class rate to determine tax capacity which is then multiplied by a local tax rate. As shown in Table 2-3, the class rate structure for residential homesteads results in higher tax rates on higher-valued homes. A $120,000 house, for example, paid taxes equal to 1.63 percent of market value, compared to 1.15 percent for a $60,000 home. In 1992, the actual taxes paid on a $120,000 home were 2.8 times those on a $60,000 home; the taxes on a $360,000 home were over 12.8 times those on a $60,000 home. Table 2-3 also shows how class rates vary for different types of property. Apartments and commercial and industrial property valued at $120,000 were taxed over 2.4 times as heavily as homes of equal value. Since 1971, Minnesota has not levied a property tax on either business and agricultural machinery and equipment or business inventories. Both are taxed in some other states. The only equipment taxed in Minnesota is public utility equipment (subject to tax in most other states). Educational facilities, religious and charitable organizations, Indian lands, cemeteries, and household personal property are also exempt from taxation. 1992 property tax revenues by type of property are shown in Table 2-2. Homeowners (including farm homes and cabins) paid 35 percent of gross local property taxes; rental housing accounted for 13 percent, and other business property (including farm property) accounted for slightly more than half.7 Property Tax Refunds In 1992, homeowners and renters received a total of $145 million in property tax refunds from the state. The refunds were in two forms. First, the “regular” property tax refund was based on the relationship between property taxes and
7 These are the percentages of gross property tax, before subtracting any property tax refunds received by homeowners and renters.

11
Table 2-3 Property Tax on Homes of Different Value
and on Different Classes of Property Taxes Paid in Taxing Jurisdiction
with Average Local Tax Rates
Value of Home
Percent of
Market Value
Total Tax
Ratio of Tax to Tax on
$60,000 Home
$ 60,000 home $120,000 home $360,000 home
1.15% 1.63 2.46
$ 690 1,961 8,862
1.0 2.8
12.8
Type of Property
Percent of
Market Value
Total Tax
Ratio of Tax to Tax on
$120,000 Home
$120,000 home $120,000 rented duplex $120,000 apartment building (4 units) $120,000 commercial or industrial building $120,000 public utility machinery
1.63% 3.22 4.03 3.88 5.46
$1,961 3,864 4,830 4,658 6,556
1.0 2.0 2.5 2.4 3.3
household income. This refund was limited to those with household incomes under $60,000 for homeowners and under $35,000 for renters, with larger refunds generally paid to those with lower income. The second refund was “targeted” to those whose property taxes had increased by more than a minimum percent and dollar amount, regardless of income. Total property tax refunds equaled 8 percent of total taxes paid on residential property. Motor Vehicle Registration Tax Minnesota’s annual motor vehicle registration tax is a tax on property. In 1992, the general tax was $10 plus 1.25 percent of the market value of the vehicle. Vehicles over 10 years old (or worth less than $2,000) paid a minimum fee of $35. A total of $376 million was collected in taxes. Using data on collections by different categories of vehicles, an estimated 31 percent of this tax is paid on business vehicles (including apportioned taxes on large trucks); the other 69 percent is paid by Minnesota residents.


13
CHAPTER 3 MEASUREMENT OF INCOME An appropriate measure of income is critical to any study of tax incidence. By definition, a tax incidence study compares taxes paid to some measure of a household’s economic well-being or ability to pay. In this study, tax burdens are expressed as ratios of taxes paid to a broad measure of household money income. This comprehensive measure of money income includes not only income taxable on income tax returns but also nontaxable income, such as public assistance payments, tax-exempt interest, and nontaxable social security and pension income. Definition of Income The definition of income should be as consistent as possible with the public’s perception of economic well-being. Households with equal incomes should be viewed as being equally well off, and those with higher incomes should be considered consistently better off than those in lower income groups. This argues for a comprehensive definition of income. An incidence study using too narrow a definition of income would overstate the ratio of taxes to income; it might also give a distorted picture of the regressivity or progressivity of the tax system. Four distinct issues must be addressed in choosing an income measure: 1. Should income be restricted to money income or should it include non-
monetary income, such as employer-provided fringe benefits or in-kind government benefits (e.g., food stamps)?
2. What is the appropriate accounting period for measuring income? 3. How should tax-paying households be defined? 4. Should the income distribution be adjusted for family size in measuring ability
to pay?
14
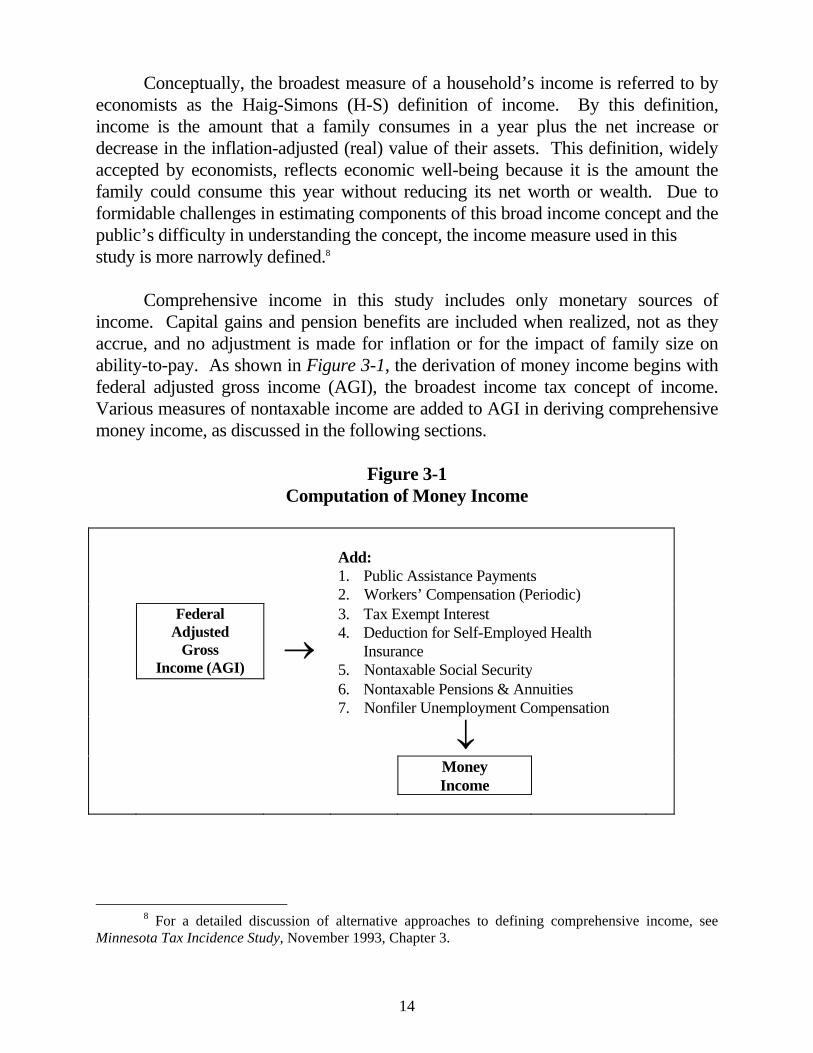
Conceptually, the broadest measure of a household’s income is referred to by economists as the Haig-Simons (H-S) definition of income. By this definition, income is the amount that a family consumes in a year plus the net increase or decrease in the inflation-adjusted (real) value of their assets. This definition, widely accepted by economists, reflects economic well-being because it is the amount the family could consume this year without reducing its net worth or wealth. Due to formidable challenges in estimating components of this broad income concept and the public’s difficulty in understanding the concept, the income measure used in this study is more narrowly defined.8 Comprehensive income in this study includes only monetary sources of income. Capital gains and pension benefits are included when realized, not as they accrue, and no adjustment is made for inflation or for the impact of family size on ability-to-pay. As shown in Figure 3-1, the derivation of money income begins with federal adjusted gross income (AGI), the broadest income tax concept of income. Various measures of nontaxable income are added to AGI in deriving comprehensive money income, as discussed in the following sections.
Figure 3-1 Computation of Money Income
8 For a detailed discussion of alternative approaches to defining comprehensive income, see Minnesota Tax Incidence Study, November 1993, Chapter 3.
Add: 1. Public Assistance Payments 2. Workers’ Compensation (Periodic)
Federal Adjusted
Gross Income (AGI)
→
3. Tax Exempt Interest 4. Deduction for Self-Employed Health Insurance 5. Nontaxable Social Security
6. Nontaxable Pensions & Annuities 7. Nonfiler Unemployment Compensation
↓
Money Income

15
Adjusted Gross Income (AGI) The federal government and many states use this measure of income as the starting point for determining individual income tax liabilities. Federal AGI is defined as total money income from all taxable sources less certain expenses incurred in earning that income. The major taxable sources of income include (but are not limited to) the following:
• Wages and salaries • Income from business • Gains from sale of capital assets • Interest, rent, royalties, and dividends • Alimony • Annuities and pensions • Prizes and awards • A portion of social security payments • Unemployment compensation
Many sources of cash income are statutorily excluded from the federal income tax, including cash received in the form of welfare benefits, interest on most state and local bonds, and most social security benefits. In addition, federal AGI is limited as a comprehensive income measure because it excludes the income of “nonfilers”, those taxpayers whose income falls below the reporting threshold. According to extrapolations from the incidence study database, 83 percent of the state’s households (as defined later in this chapter) are accounted for on state individual income tax returns; the remaining 17 percent do not file income tax returns. Using additional information from property tax refund returns, the household coverage from all tax return filings increased to 89 percent. Only 11 percent of the households filed neither an income tax return nor a property tax refund claim. As explained below, a substantial proportion of the income of these nonfilers is obtained from other state and federal sources of income. Additions to AGI As shown in Figure 3-1, income from a number of sources is added to AGI in deriving a comprehensive measure of Minnesota money income. These include: public assistance payments, the wage replacement portion of workers’ compensation, tax exempt interest, nontaxable social security, nontaxable pensions and annuities,

16
unemployment compensation received by nonfilers, and other income (including wages and salaries) received by households not filing an income tax return but reported on property tax refund returns. Table 3-1 summarizes the components of 1992 Minnesota total money income as measured in this study. The data source for each component of income is also identified. Federal AGI makes up over 89 percent of the $74.4 billion in total money income. Nontaxable social security benefits were the largest source of additional money income, representing 5.5 percent of the total. Income Not Included in Money Income Minnesota money income excludes many forms of income that would be included in the broadest income measure based on the Haig-Simons definition. It excludes all non-monetary forms of income (food stamps, housing subsidies, Medicare and Medicaid benefits, employer-provided fringe benefits, and imputed rent for homeowners). It includes capital gains and pension income only when realized, not when accrued. No adjustment is made for depreciation deductions in excess of economic depreciation, nor is a deduction made for the portion of interest income that represents inflation. Due to data limitations, Minnesota money income still excludes some forms of cash income. Two particular omissions should be noted. First, only a portion of wage and salary and other income could be added to other sources of income, such as public assistance and social security benefits, for taxpayers who file neither an income tax nor a property tax refund return.9 This results in an understatement of money income and an overstatement of tax burdens for the lowest income groups. Second, veterans benefits are excluded (except for those reported on property tax refund returns). The Accounting Period Income received in a single year can be a misleading measure of economic well-being. Individual households may have unusually high or low income in a particular year due to business losses, unemployment, or the sale of capital assets.
9 Compared to the 1990 incidence study, this study does include additional income information on the nonfiler group, including dividend, pension, interest and wage income. This data was derived from income tax administration information.

17
Because of such transitory income, a snapshot of the income distribution in a single year shows more income inequality than a time exposure over several years. In addition, income varies over a household’s life cycle. For these reasons, annual income may not be an accurate measure of a household’s more permanent economic well-being.
Table 3-1 1992 Tax Incidence Study
Components of Total Household Income ($ Millions)
Group Source of Income Amount
Individual income tax filers
Federal Adjusted Gross Income Nontaxable Interest Nontaxable IRA Distributions Nontaxable Pension and Annuity Payments Nontaxable Social Security Benefits Self-Employed Health Insurance Deduction Minnesota Additions to Income Public Assistance Payments 1 Workers’ Compensation Benefits Total Household Income
$66,474704368
1,1642,248
37118143
158$71,414
Property tax refund filers who do not file an individual income tax return
Federal Adjusted Gross Income Nontaxable Social Security Benefits Public Assistance Payments PTR Additions to Income Total Household Income
$264834146
80$1,324
Individuals that do not file either type of return
Public Assistance Payments Workers’ Compensation Benefits Unemployment Benefits Social Security Benefits Dividend Income Pension Income Interest Income Wages
Total Household Income
$1985736
1,00422
179102
75$1,673
Total Population
Total Household Income
$74,410
1 Public Assistance includes Aid to Families with Dependent Children (AFDC), Minnesota Supplemental
Aid (MSA), and General Assistance (GA).
18
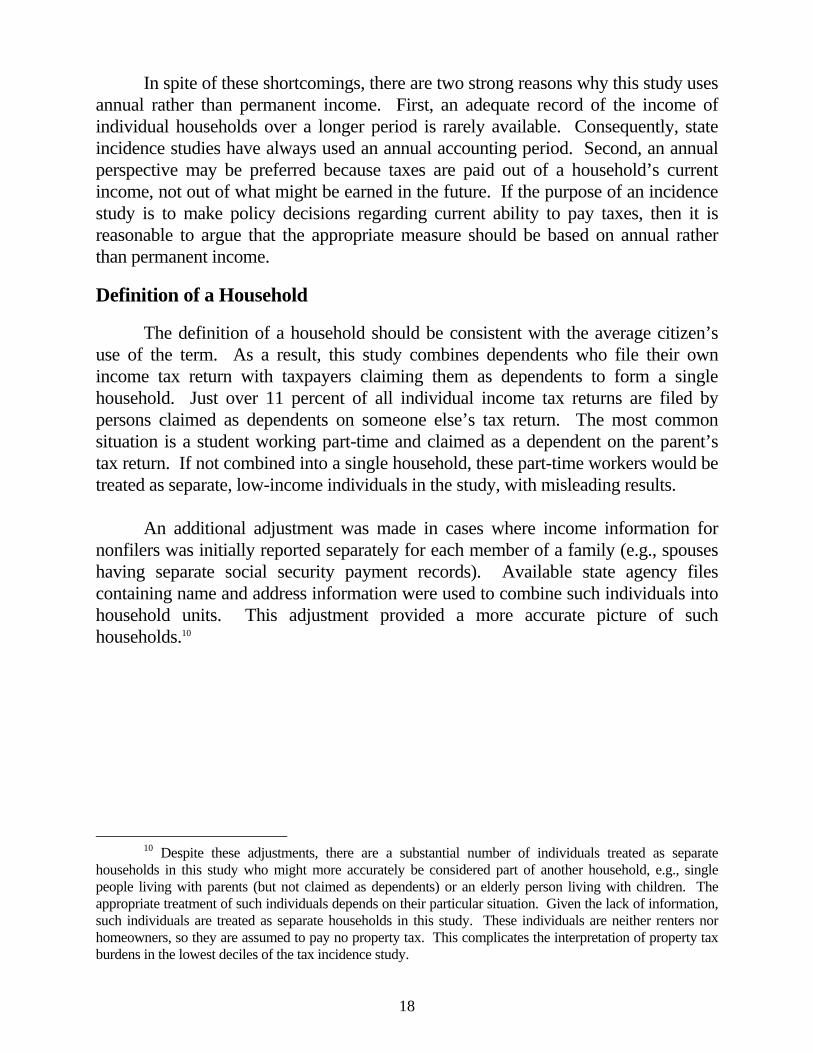
In spite of these shortcomings, there are two strong reasons why this study uses annual rather than permanent income. First, an adequate record of the income of individual households over a longer period is rarely available. Consequently, state incidence studies have always used an annual accounting period. Second, an annual perspective may be preferred because taxes are paid out of a household’s current income, not out of what might be earned in the future. If the purpose of an incidence study is to make policy decisions regarding current ability to pay taxes, then it is reasonable to argue that the appropriate measure should be based on annual rather than permanent income.
Definition of a Household The definition of a household should be consistent with the average citizen’s use of the term. As a result, this study combines dependents who file their own income tax return with taxpayers claiming them as dependents to form a single household. Just over 11 percent of all individual income tax returns are filed by persons claimed as dependents on someone else’s tax return. The most common situation is a student working part-time and claimed as a dependent on the parent’s tax return. If not combined into a single household, these part-time workers would be treated as separate, low-income individuals in the study, with misleading results. An additional adjustment was made in cases where income information for nonfilers was initially reported separately for each member of a family (e.g., spouses having separate social security payment records). Available state agency files containing name and address information were used to combine such individuals into household units. This adjustment provided a more accurate picture of such households.10
10 Despite these adjustments, there are a substantial number of individuals treated as separate households in this study who might more accurately be considered part of another household, e.g., single people living with parents (but not claimed as dependents) or an elderly person living with children. The appropriate treatment of such individuals depends on their particular situation. Given the lack of information, such individuals are treated as separate households in this study. These individuals are neither renters nor homeowners, so they are assumed to pay no property tax. This complicates the interpretation of property tax burdens in the lowest deciles of the tax incidence study.

19
Differences in Household Size In this study, households are divided into income classes with no adjustment for household size to reflect lower ability-to-pay for larger households at the same income level. For example, all households with incomes between $40,000 and $50,000 are considered as a group, whether the household consists of a single person or a family of four. In the incidence study sample, the poorest 20 percent of households are mainly single-person households, while almost all high-income households include two or more individuals. Summary The definition of income used in this study includes all identifiable forms of cash income received in a single year, including nontaxable sources of income. It is less comprehensive than the Haig-Simons definition of income because it includes no non-monetary benefits as income, measures capital gains and pensions when they are received (not when they accrue), and makes no adjustment for the impact of inflation on asset values. Nevertheless, it is a comprehensive definition of money income and is consistent with the public’s perception of ability to pay.


21
CHAPTER 4 THE INCIDENCE STUDY DATABASE The 1992 incidence study database includes detailed information on income and taxes for a stratified random sample of 37,769 Minnesota households. This sample is then “blown up” to represent all 2,120,967 Minnesota households. Data from tax returns filed with the Department of Revenue -- mainly individual income tax and property tax refund returns -- were used as the primary source of information. Data for nontaxable sources of income (public assistance payments and social security benefits, for example) were obtained from alternative sources. This additional information was merged with tax return data to provide a more accurate measure of total household income, especially at the low end of the income distribution for individuals who did not meet tax filing requirements. The use of social security numbers to merge income data from different sources for specific individuals is a unique and important aspect of this study. Income data was matched, for example, with property tax and market value information for individual homeowners. Because of these “hard matches”, the need to impute estimated values of income and tax variables to households in the database is minimized. This chapter describes the steps involved in building the incidence study database and how the database is used to calculate each household’s state and local tax burden. Income Sources The incidence study database was developed in three steps. First, data was taken from state and federal income tax returns. Second, additional data was taken from property tax refund returns. Third, additional income data was added from non-tax sources (social security, unemployment compensation, workers’ compensation, and public assistance). Each of these steps is described more fully in this section.

22
Individual Income Tax Individuals are required to file a state income tax return if they file a federal income tax return. In 1992 single persons were required to file a return if their gross income was $5,900 or more; for married couples, the filing threshold was income over $10,600. A large majority of the working population in Minnesota file income tax returns, providing a wealth of information on income and family characteristics. For tax year 1992, approximately 2 million individual income tax returns were filed by Minnesota residents who paid $3.18 billion in income tax. These income tax filers in the sample accounted for 83 percent of the state’s households. In addition to taxable sources of income, individual income tax returns contain information on some forms of nontaxable income. These include tax-exempt interest, total individual retirement account (IRA) distributions, total pensions and annuities received, and total social security benefits. As explained in the previous chapter, all of these untaxed forms of income are included in the measure of money income. The 1992 individual income tax sample developed by the Tax Research Division was used as the initial source of data for all income tax filers. It includes approximately 22,500 returns (about 1 percent of the filer population), selected randomly based on income levels. The number of sample records in the incidence study database is less, however, than the full sample; nonresidents are excluded, and filers claimed as dependents on another tax return are combined with that return to form one household. Property Tax Refund Since 1975, Minnesota has had a property tax refund (PTR) program, which reduces property taxes for both homeowners and renters. Homeowners and renters are eligible for regular property tax refunds based on the relationship of the property tax paid on a homestead (or rental unit) to total household income. Refunds vary depending on the actual ratio of taxes to income, but they generally decline as income increases.11
11 There is also a special “targeting” property tax refund for those with large annual increases in property taxes, regardless of income. For 1992, a total of $14.6 million in targeting refunds was received by 119,500 households. The numbers in the text refer only to the regular PTR, excluding targeting refunds. Both property tax refunds are included in calculating net property tax in this study, but the numbers in the following paragraph refer only to the regular refund.

23
In 1992, homeowners and renters were eligible for refunds if income was less than $60,000 for homeowners and $35,000 for renters. In that year, 462,000 regular PTR returns were filed, 200,000 for homeowners and 262,000 for renters. A total of $136.3 million of refunds was received, of which $87.7 million (64 percent) was received by renters. The regular PTR is based on total household income. In addition to federal AGI, PTR filers must report nontaxable forms of money income such as workers’ compensation, untaxed social security benefits, veterans’ benefits, and public assistance payments. Because PTR returns include nontaxable income and cover a portion of households that do not file income tax returns, they provide valuable information (including wage income) to assist in filling in the bottom of the income distribution for the state’s residents. Information from the PTR returns was added to income tax information in two steps. First, for those in the income tax sample who also filed for a property tax refund, information from the PTR return was added to their existing income tax database record. This added information included nontaxable income sources reported on the PTR return, as well as property tax information. Second, new database records were added for a 5 percent random sample of PTR filers who filed no income tax return. At this step, PTR and income tax filers combined accounted for 89 percent of the state’s households. Other Sources of Income Data Additional sources of information were used to identify social security payments (including Supplementary Security Income), workers’ compensation, unemployment compensation, and public assistance income (Aid to Families with Dependent Children, General Assistance, and Minnesota Supplemental Aid).12 In each case, social security numbers were used to match payments to specific households.
12 Data on public assistance payments were obtained from the Minnesota Department of Human Services. Information on workers’ compensation and unemployment compensation were obtained from the Department of Labor and Industry and the Department of Economic Security, respectively. Only the cash portion of workers’ compensation representing wage replacement was included in income; payment for medical care and one-time indemnity payments were excluded.

24
A two-step approach was used. First, payments received by individuals in either the income tax sample or the PTR sample were added to their existing database records. Second, new database records were added for a random 5 percent sample of those who received payments from one or more of these sources but filed neither income tax nor PTR returns. These additional records represented 11 percent of all Minnesota households. Although the money income of this population is understated somewhat (as explained in Chapter 3), the database captures the largest part of their income.13 Tax Calculations Taxes were calculated in the construction of the database from a variety of available information. In some cases, tax amounts were imputed based on income level, family size, sources of income, and other household characteristics. The following describes sources of information used and how taxes were estimated for each tax. Individual Income Tax Income tax payments were available directly from the 1992 income tax sample. As such, actual income tax liabilities from sample records were used to estimate income tax liabilities for the entire population of Minnesota residents. Homestead Property Tax The property tax for homeowners was derived from a unique data set that includes the market value of every residential homestead in Minnesota. Counties provide this data to the state annually, along with the social security numbers for owners of homestead property, as required by law. From this information, property tax amounts were calculated for each homestead based on the local tax rate where the property is located. These homestead property tax amounts were added to the appropriate sample records in the incidence study database by matching social security numbers. Any property tax refund received by a homeowner is also on the file (taken from the household’s PTR return), so the household’s net property tax can be calculated by
13 Detailed information is available from the Tax Research Division on the sources of income data and the composition of the household sample.

25
subtracting the property tax refund from the gross property tax. For farms, the study estimates residential property taxes using the average tax on a farm “house, garage, and one acre” in the county; the remaining farm property tax (approximately 79 percent) was treated as a business tax. For farm homesteads, the property tax refund is divided into a residential and a business component.14 Property Tax on Rental Housing The total property tax paid on a rental unit was determined by one of two methods. First, for those filing a property tax refund, the property tax paid on the rental unit is listed on the PTR return. For PTR filers, therefore, the actual property tax on the rental unit is known. For renters who did not file a property tax refund return and were not homeowners, a rental property tax amount was imputed. Data from the 1990 Census of Housing show how rents vary with household income. This relationship was used to impute rent amounts for each rental household, based on its income. Based on data from property tax refund returns, the property tax paid on rental units was assumed to average 16.6 percent of rent paid.15 There are a substantial number of households in the sample who are neither homeowners nor renters. These include cases such as senior citizens living with relatives, adult children living at home (but not claimed as dependents on an income tax return) and, in some cases, people living in subsidized housing. These households are assumed to pay no property taxes. General Sales Tax and Excise Taxes Purchases subject to sales and excise taxes are estimated using a detailed state input-output model. The Minnesota Consumption Tax Model estimates total purchases from 112 Minnesota business sectors. Taxable purchases made by Minnesota residents are separated from taxable purchases by business and visitors. Multiplying taxable purchases by the applicable tax rate gives the total Minnesota tax paid by resident consumers on each of the 112 product categories.
14 The residential portion of the refund is estimated based on the ratio of the county average tax on the house, garage, and one acre to the farmer’s actual total tax on the first 320 acres. 15 The database includes the full amount of the tax paid on the household’s rental unit. The landlord, however, is not able to shift all of the existing property tax to the renter in higher prices. Based on the incidence assumptions in Chapter 5, only part of the property tax is ultimately assigned to renters.

26
This total tax paid by consumers on purchases of each type of product is distributed among individual households using consumer expenditure data from the Bureau of Labor Statistics’ 1992 Consumer Expenditure Survey (CES). Detailed information from this survey is used to obtain an estimate of each household’s share of taxes paid on each of 16 product groups, based on the household’s size, family type, age, and income. The CES estimate of expenditures for each product category was added to each incidence study household record.16 Miscellaneous Taxes The consumer share of the motor vehicle registration tax was estimated from data provided by the Minnesota Department of Transportation. The registration tax is 1.25 percent of a vehicle’s value, except for vehicles valued under $2,000 (or over 10 years old), which pay a flat $35 fee. This tax was allocated based on household expenditures on motor vehicle purchases (gross of trade-in), as estimated from the CES. Minnesota collects a 2 percent insurance premiums tax on almost all insurance policies written in the state. Although this tax (like other sales and excise taxes) is collected by business, this study assumes that the tax is fully shifted to insurance buyers in higher prices. The tax paid on consumer insurance (personal auto, life, homeowner, accident and health) was estimated from collections data. The taxes on each type of insurance buyer was treated differently. Personal auto, life insurance, and homeowner insurance taxes were estimated using CES data. The tax on accident and health insurance was estimated based on a national survey of the distribution of health insurance premiums by income level, and the burden of workers’ compensation insurance taxes was allocated by wage and salary income (subject to a minimum and maximum).17
16 Statistical analysis of CES public use computer tapes provided separate estimates for nine different household types. Additional information on the mechanics of this process is available from the Tax Research Division. 17 Health insurance data was adapted from Hollahan and Zedlewski (1992). The tax on insurance purchased by employers as part of employee fringe benefits is assumed borne by employees. By raising the cost of these fringe benefits, the tax either reduces cash wages or other fringe benefits. The tax on workers’ compensation premiums is allocated to all workers with wage and salary income exceeding $2,000 per year, with a floor for those earning in the bottom fourth of the wage distribution and a cap for those in the top fourth. This reflects the structure of benefits provided by workers’ compensation in Minnesota.

27
The property tax levied on seasonal recreational property (“cabins”) is not included in the homeowner property taxes discussed earlier. The relationship between property taxes on cabins and household income was estimated from special property tax refund returns filed in 1991 (the only year such property qualified for a refund). An average property tax on cabins was allocated to all homeowners, varying by income level. Business Taxes Taxes legally imposed on businesses may be ultimately borne by the owners, shifted to consumers in higher prices, or shifted to workers in lower wages. This study’s estimates of the distribution of the tax burden among these groups are explained in the next chapter. Given an estimate of the dollar amount of tax paid by consumers, workers, or owners, that tax is then allocated among individual households using income and consumption information in the database, as explained in Chapter 5. Summary The incidence study database includes individual records for almost 38,000 households. The data content of each record is described in Appendix D. Each record includes the household’s cash income as obtained from income tax returns, property tax refund returns, and other sources, all matched by social security numbers. Household income includes all taxable income plus almost all forms of nontaxable cash income (including tax-exempt interest, public assistance, untaxed social security income, and workers’ compensation). Property taxes for homeowners (again identified by social security number) are obtained from a special data set. Finally, an estimate of each household’s expenditures on a variety of items (including rent) is obtained from the Consumer Expenditure Survey, the Census of Housing, and other sources. This unique database makes it possible to estimate taxes for each household. When blown up to match the total state population, it provides a detailed description of the distribution of income and state and local taxes among Minnesota residents.


29
CHAPTER 5 TAX INCIDENCE ANALYSIS Introduction Economists commonly distinguish between the initial “impact” of a tax and its “incidence.” The initial impact of a tax is on the taxpayer legally liable to pay the tax, while the incidence of a tax is the final resting place of the tax after any “shifting” has occurred. For example, the initial impact of a retail sales tax is on the retail business, which is legally liable to pay the tax. However, as businesses respond to the tax, consumers may eventually pay the tax in the form of higher retail prices. In this case the incidence of the tax is on consumers, not businesses. Similarly, the impact of a property tax on manufacturing property is on the manufacturer, but the actual incidence may fall partly on consumers (in higher prices) or on workers (in lower wages). This study measures the distribution of tax burdens among households after any such shifting has occurred. As outlined in Figure 5-1, determining the distribution of household tax burdens can be viewed as a three-step process. Step 1 is the collection of data about the initial impact of Minnesota taxes. This step includes compiling information on tax collections by sector, and other estimations, such as the amount of sales tax paid by tourists or on business purchases of capital equipment. Step 2 uses economic theory to estimate how much of the burden of each tax is “shifted” from the initial taxpayer to others. For each tax, Step 2 estimates how much of the tax burden falls on consumers, labor, capital, and land. The portion of the tax burden shifted to nonresidents is also estimated in Step 2. Step 3 combines the incidence assumptions from Step 2 with information on the characteristics of individual households (from the study’s database described in Chapter 4) to estimate the tax burden falling on each of Minnesota’s two million households. Each dollar of tax is “allocated” either to a specific Minnesota household or to nonresidents.

30
Figure 5-1 Estimating Tax Incidence
STEP 1:
STEP 2:
STEP 3:
IMPACT
----------> SHIFTING
INCIDENCE on (resident and
nonresident) consumers, capital
and labor
---------------> ALLOCATION
INCIDENCE
on specific Minnesota households
Initial
Imposition of Tax
Actual Burden
of the Tax
Actual
Burden on Households
For example, consider the business property tax. Step 1 obtains data on total tax collections from each business sector (such as manufacturing, farming, apartments, and public utilities). Step 2 uses economic theory and information about the nature of each business sector to estimate how much of the each sector’s property tax is borne by Minnesota consumers, Minnesota workers, Minnesota owners of capital, and nonresidents. Step 3 allocates the resident tax burden to specific Minnesota households, based on information about each household’s total income, income sources, household size, and housing status (owner or renter). The results of any incidence study are significantly determined by the study’s incidence assumptions. This chapter explains both the incidence assumptions used in this study (Step 2) and the method of allocating tax burdens to specific households (Step 3).18 This study’s incidence assumptions are summarized as follows:
18 A more detailed discussion of the incidence assumptions is provided in the Minnesota Tax Incidence Study, November 1993, Chapter 5 and Appendix A.

31
1. Incidence of Taxes on Households
• The personal income tax is paid by individual taxpayers, and the incidence is the same as the initial impact of the tax.
• Taxes on purchases by consumers (sales, excise, and insurance premiums taxes) are borne by consumers of the taxed items.
• The property tax on homeowners is borne by the homeowner. • The motor vehicle registration tax on vehicles owned by households is
borne by the owner of the vehicle. 2. Incidence of Taxes on Business Taxes on business property, business purchases, and corporate income are
partially shifted to consumers and workers. (If fully shifted to consumers, the taxes are classified as taxes on individuals.) The amount of tax shifting varies by tax and by business sector, depending on the scope of the product market (local or national) and the magnitude of Minnesota’s tax rates compared to those in other states.
The rationale for this study’s incidence assumptions is discussed in the next two sections. First, taxes on households are discussed. The incidence of business taxes, which is discussed next, is much more complex. Many issues are unsettled, and a wide variety of approaches have been used in previous incidence studies. As a result, this section provides an extended discussion of the methodology underlying this study’s approach to business tax incidence. Taxes on Households Individual Income Tax To shift a tax, the individual or business legally liable to pay the tax must alter their economic behavior because of the tax. For example, if a tax on wages reduces a worker’s after-tax pay, the worker may reduce the number of hours worked. This could lead to higher before-tax wages which would shift a part of the tax to employers or consumers. This study assumes that the burden of the individual income tax is not amenable to shifting through increases in either wages or interest rates. This assumption is correct if both total hours worked and savings rates are unresponsive to after-tax returns and the package of public spending and
32
taxes in Minnesota (compared to other states) does not cause significant emigration. Given this assumption, the state income tax burden equals each household’s tax liability, as listed in the study’s database. Taxes on Consumer Purchases Sales and Excise Taxes. This study, like most other incidence studies, assumes that businesses legally liable for sales and excise taxes on final products and services will be able to raise product prices by the full amount of the tax, leaving wages and the return to capital unchanged. Therefore, the tax burden is fully shifted to consumers as businesses adjust output and prices. The sales and excise tax burdens are allocated in proportion to each household’s consumption of taxed items, as estimated in the study’s database. Insurance Premiums Taxes. The insurance premiums tax equals a flat percentage of the premium paid on selected types of insurance. This tax is assumed to raise insurance premiums by the full amount of the tax, so its burden is distributed in proportion to each household’s purchase of insurance subject to the tax. For auto, life, and household insurance, the tax burden was allocated in proportion to expenditures as estimated from the Consumer Expenditure Survey. The premiums tax on insurance provided through employers (most health and workers’ compensation) is assumed borne by the employee. By raising the cost of these fringe benefits, the tax either reduces cash wages or other fringe benefits. The tax on health insurance premiums was allocated according to the distribution of total health insurance premiums. In Minnesota, workers’ compensation policies are purchased from private insurers. Given the structure of wage replacement benefits, the premium per employee is assumed to be proportional to wages but subject to a minimum (for the lowest-paid quarter of wage-earners) and a maximum (for the highest-paid quarter). Property Taxes on Non-Business Property Homeowner Property Taxes. The homeowner is both the owner and consumer of housing. As a result, the homeowner bears the full tax burden, regardless of how the burden is split between consumers and owners. The tax liability on the household is equal to the total property taxes paid on the homestead, as identified in the incidence study database. Similarly, the burden of the property tax on cabins is assumed borne by the owners.

33
Motor Vehicle Registration Tax. The registration tax on motor vehicles owned by households is assumed to be fully borne by the owner. The tax is generally proportional to the market value of the vehicle. Lacking data on the distribution of vehicle stock by income level, this study uses the distribution of vehicle purchases (before subtracting trade-in) as an approximation. The tax burden is allocated in proportion to the average gross vehicle expenditures by households of the same size and income level. Adjustment for Burdens on Nonresident Households The proportion of the total receipts from each of these taxes that is allocated to Minnesota households is shown in Table 2-2. For the general sales and use tax and the excise taxes, the Minnesota household share was estimated by the Minnesota Consumption Tax Model. For the other taxes (insurance premiums, property tax on cabins, and motor vehicle registration tax), the total burden on Minnesota households equals total collections minus estimates of taxes paid by business and nonresident visitors and tourists. Some incidence studies reduce tax burdens for income and property taxes to reflect the “federal tax offset.” These state taxes are deductible in calculating federal income tax liability, so higher Minnesota taxes mean lower federal income taxes (for those who itemized deductions). This study makes no adjustment for the federal tax offset. The reason for not adjusting for the federal tax offset is explained later in this chapter in the discussion of business taxes. Taxes on Business Introduction This study includes over $4.3 billion in business taxes as summarized in Table 5-1. These business taxes (including rental property taxes) account for almost 40 percent of Minnesota’s state and local tax revenue. Business taxes include both taxes on capital (structures, capital equipment, and land) and taxes on business purchases of short-lived intermediate inputs (such as gasoline and restaurant meals). This study estimates the incidence of each of these business taxes. While the initial impact of these taxes is on business, they are partially shifted to others -shifted forward to consumers in higher prices or shifted backward to labor in lower wages. Much of the tax is paid by nonresidents, either as consumers of Minnesota

34
Table 5-1 1992 Minnesota Taxes on Businesses
($ Millions)
Taxes on Capital
Rental property taxes Other business property taxes Corporate franchise tax Sales tax on capital equipment Vehicle registration tax Insurance premiums tax on business property insurance
$ 499 1,888 457 442 117 19
Taxes on Intermediate Products
Sales tax on non-capital purchases Motor fuels excise tax Insurance premiums tax on business non-property insurance
$707 192 11
Total Business Taxes
$4,332
goods and services or as owners of capital and land located in Minnesota. This section summarizes how this study estimates the incidence of business taxes, and how business tax burdens are allocated to Minnesota households. The Conceptual Structure The following six principles define this study’s approach to estimating the incidence of Minnesota’s existing business taxes. 1. Capital moves to where it earns the highest return. If a tax on capital in a
single state (or industry) reduces the after-tax rate of return, investors will move their capital to lower-tax locations (or industries). As production falls, prices will rise or costs (including wages) will fall until the after-tax rate of return is again equal to the after-tax rate of return elsewhere. Only the average tax on all forms of capital in all states -- a tax which owners of capital cannot avoid -- will be fully borne by capital so long as capital is free to move in search of the highest rate of return.

35
2. Minnesota’s taxes do not occur in isolation. Every state levies business taxes. The incidence of a tax levied at the same rate in all states differs greatly from the incidence of a tax levied only in Minnesota. For example, a one percent tax levied on business capital in only Minnesota will be largely shifted to consumers and workers; capital is unlikely to bear much of the final burden due to the ease of capital movement. In contrast, if all states impose the identical one percent tax on the value of all business capital, investors cannot escape the tax. Such a “national” tax on capital is much more likely to be borne by capital, reducing the after-tax rate of return on capital throughout the nation.
This distinction between a single-state tax and a nation-wide tax is crucial to
the results of this study. The incidence of a particular Minnesota tax on business depends on how Minnesota’s tax rate compares to those of other states. If, for example, a particular Minnesota business tax rate is 10 percent above the national average, the incidence of this 10 percent “Minnesota differential” will differ greatly from the incidence of the remainder of the tax.
3. Minnesota’s tax structure evolved over time. In describing the incidence of
existing business taxes, this study assumes that businesses, consumers, and workers have fully adjusted to tax differences across states.
4. Some businesses, depending on their market, can shift Minnesota business
taxes forward to consumers in higher prices. Given time for full adjustment, the ability to shift taxes forward to consumers depends on the nature of the product being sold. Some producers, such as restaurants, compete only with other Minnesota companies; tax increases would affect all restaurants equally, and prices would rise to cover this higher cost. In contrast, a higher Minnesota tax on manufacturers is much harder to shift to consumers because firms compete in a national market. Therefore, Minnesota manufacturers cannot raise prices to cover higher state taxes. In this study, producers of “local market products” are assumed to pass tax differentials on to consumers but producers of “national market products” cannot.
5. A tax that reduces the competitiveness of Minnesota businesses will be borne
by immobile resources -- those either unable or unwilling to leave the state. If capital is mobile and prices cannot be increased (due to competition), the burden of business taxes will reduce payments to inputs that are geographically tied to the state, including labor and land.

36
6. An increase in taxes reflects an increase in state and local government spending. This study assumes that workers do not move between Minnesota and other states in response to changes in state taxes, because tax changes are offset by expenditure changes, leaving the net benefits to Minnesota taxpayers unchanged. In other words, labor (along with land) is assumed to be immobile. In contrast, changes in taxes on business income are assumed not to be offset by changes in benefits from government expenditures.
In summary, these six concepts guide this study’s approach to estimating the incidence of Minnesota’s existing business taxes. The study provides an answer to the question: What is the burden of Minnesota taxes on Minnesota residents, in a multistate context where Minnesota’s taxes coexist with those of other states, assuming that producers and consumers have fully adjusted to existing tax rate differences. Allocation of Business Taxes The six concepts discussed above are used in this section to determine the allocation of business taxes among the four major taxpayer categories: Minnesota consumers, capital and labor, and nonresidents. The methodology used in this step is discussed in detail before the results are presented. There are several major features of the tax incidence approach used in this study which are important to keep in mind. First, this study emphasizes the importance of Minnesota tax rates relative to those in other states. In estimating the incidence of existing business taxes, it is the relative tax rate that matters, not the absolute level of taxes. The incidence of a property tax on manufacturers, for example, depends on how heavily other states tax such property. Second, this study emphasizes the difference between the incidence of existing business taxes and the incidence of an incremental increase in those taxes. Much of an existing business tax is matched by taxes in other states. The incidence of an increase in such a tax (unmatched by increases in other states) would be quite different. The tax incidence results in this study measure the distribution of existing taxes, not the distribution of increasing Minnesota taxes relative to other states.

37
Third, this study estimates the burden of business taxes after businesses, consumers, and workers have fully adjusted to them in the long run. For example, relatively high tax rates on capital may reduce wages of Minnesota workers through less capital investment. This long-term perspective is appropriate for estimating the incidence of existing taxes. Allocation of Business Taxes: An Example To understand the allocation approach used in this study, suppose that Minnesota levied a $120 million tax on capital -- manufacturing equipment, for example. The owners of that capital are legally liable for the tax, but who would bear the ultimate burden? The first step in answering this question is to determine how shifting spreads the tax to capital owners, consumers and labors. Allocating the Burden Among Capital, Consumers, and Labor For each of the business taxes on capital, the tax paid by a particular economic sector is divided into three parts:
• The portion representing the national average tax rate on all capital. • The portion representing the national sector differential. • The portion representing the Minnesota sector differential.
This 3-part division of the tax is based on the answers to three questions. The approach is summarized in Figure 5-2, using the example of a $120 million property tax on capital in the manufacturing sector. Question 1. What portion of this $120 million Minnesota tax represents the national average tax on all capital? If all states levied an identical tax on all forms of capital, capital would be unable to shift that tax to others and the entire burden would be borne by capital.19 Given the variation in rates among the states, it is the “average national tax rate on capital” which is borne by capital owners. The average tax rate on all capital is measured in this study as the average state tax rate on all capital -- total tax revenue (in all states) divided by the total national stock of capital. If the Minnesota tax rate on a particular sector is equal to the
19 This result follows from the assumption that national savings rates are unresponsive to changes in after-tax rates of return.

Figure 5-2Incidence of a Hypothetical $120 Million Tax on Capital
$120 million tax onCAPITAL
1) What portion of thetax represents thenational average taxrate on ALL CAPITAL?
50%
Portion equal to thetax on ALL CAPITALis borne by capital
Borne byMinnesotaResidents
Borne byResidentsof otherStates
2) What portion of theremainder represents ahigher national averagetax on THIS SECTOR?
67%
3) What portion of thissector is competingonly against otherMinnesota companies?
75%
Portion equal to theNATIONAL SECTORDIFFERENTIAL is
Borne byMinnesotaResidents
Borne byResidentsof otherStates
"LOCAL MARKET"portion is borneby consumers
Borne byMinnesotaResidents
Borne byResidentsof otherStates
borne by consumers
Borne by
Borne byMinnesotaResidents
Borne byResidentsof otherStates
Borne byLabor
Borne byMinnesotaResidents
Land
"NATIONAL MARKET"portion is borne byimmobile inputs
$60 $20 $5
$120
$60 $40
$10 $50 $32 $13.5 $1.5$8
$15
$0.2 $1 $3.8
$1.2 $3.8
Summary of Tax Incidence($ Millions)
Minnesota Residents ofCategory Residents Other States
Capital*ConsumersLabor
Total
*Capital includes land.
$61.255.0
3.8$120.0
$10.245.5
3.8$59.5
$51.09.50.0
$60.5
TaxpayerTotal
38

39
national average tax rate on all capital, then the tax will be borne entirely by the owners of capital; if the Minnesota tax rate exceeds the national average tax rate the remainder of the Minnesota tax would be shifted either forward to consumers or backward to labor and other immobile inputs.20 For each particular tax on capital, this study estimates the average national tax rate on all capital. If the Minnesota tax rate on a particular form of capital is twice the national average (as is assumed hypothetically in Figure 5-2), then the burden of the first half of the tax is assumed to fall on capital. What happens to the remaining half ($60 million) depends on the answers to the next two questions. Question 2. What portion of the remaining $60 million in taxes on capital equipment represents a higher national average tax on this particular sector? Because capital taxes are levied at different rates on different forms of capital, some forms of capital are taxed in all states at a higher rate than all capital. For example, commercial property is taxed at a considerably higher rate than manufacturing property, and both are taxed more heavily than agriculture. In this example, suppose the national tax rate in the manufacturing sector is 1.67 times as high as the national average tax on all capital. This 67 percent higher-than-average tax rate difference for the manufacturing sector is referred to as its “national sector differential.” Despite these heavier taxes, however, the after-tax rate of return in manufacturing cannot remain lower (with mobile capital) than the rate of return available in other sectors. As firms adjust by reducing output, the portion of a tax on capital equal to this “national sector differential” is borne entirely by consumers in the form of higher prices. For each tax on capital, this study estimates the average national tax rate on capital invested in each sector. The share of the Minnesota tax representing the “national sector differential” is allocated to consumers of products produced in Minnesota. (See Figure 5-2.) The remaining tax (if any) is the “Minnesota sector differential” -- the amount by which Minnesota’s tax rate on capital invested in this sector exceeds the national average tax rate in this sector. To determine who bears the burden of this “Minnesota differential,” it is necessary to answer the third question.
20 If the Minnesota tax is less than the national average tax on all capital, then the entire Minnesota tax is borne by capital. (From a national perspective, this capital bears all of the Minnesota tax plus some of the tax from other states, but we are only interested in determining who pays the Minnesota tax.)

40
Question 3. What portion of this sector’s producers compete only against other Minnesota producers in “local markets”? For products sold in local markets, the Minnesota differential will result in higher prices to consumers. In contrast, prices for products that compete in national markets (including most manufactured products) are determined nationally. A “Minnesota sector differential” on producers of such national market products cannot usually be shifted to consumers, so that the burden of the tax must fall on immobile resources, land and labor. This study assumes that immobile labor and landowners share the burden of any Minnesota sector differential for national market products in proportion to their relative shares in production.21 In summary, to allocate the burden of taxes among capital owners, consumers, and labor, this study divides the tax into three parts (the percentages refer to the example in Figure 5-2): 1. The portion representing the “national average tax on all capital” is borne by
capital (50 percent). 2. The portion representing the “national sector differential” is borne by
consumers (33 percent). 3. The portion representing the “Minnesota sector differential” is borne by:
• Consumers for products sold in “local markets” (13 percent); • Labor and landowners for products sold in “national markets” (4 percent).
This approach requires an estimate, for each tax, of the national average tax on all capital. For each tax and each sector, it requires an estimate of the Minnesota differential -- the excess of Minnesota taxes over the national average for that sector. The study also needs to estimate, for each sector, the extent to which its products are sold in local as opposed to national markets.
21 For the major sectors of the economy, this ratio is 95 percent labor and 5 percent land. We assume that the burden on land falls only on business owners of land. If labor is immobile and government expenditures rise in line with taxes, there will be no downward pressure on the value of residential land.

41
Allocating the Burden between Minnesota Residents and Nonresidents Exported Tax Burden. A large amount of capital located in Minnesota is owned by nonresidents. For the portion of any tax borne by capital and land, much of the burden will fall on residents of other states. This study assumes that nonresidents own 90 percent of the stock in corporations subject to Minnesota tax, and 20 percent of most noncorporate businesses (but only 5 percent of non-homestead residential property). As such, in sectors which are predominantly corporate, most of the burden falling on capital is exported. Consumers located in other states will pay some of the “national sector differential” on Minnesota firms that is shifted forward in higher prices. In addition, nonresident visitors bear some of the tax shifted to in-state consumption. For each sector, this study estimates the proportion of sales made to (1) out-of-state consumers and (2) visitors. The burden on labor (in the form of reduced wages) is assumed to fall entirely on Minnesota residents. Imported Tax Burden. Both Minnesota consumers and Minnesota owners of capital and land located in other states pay taxes to other states. However, taxes that Minnesota residents pay to other states are ignored here; this study estimates and analyzes the incidence of Minnesota taxes on Minnesota residents. Federal Tax Offset. In estimating the incidence of existing Minnesota taxes, this study makes no adjustment for the “federal tax offset” due to the deductibility of Minnesota business taxes in calculating federal taxable income. Given the “multi-state” approach taken in this study the federal tax offset is most likely to be quite small. All 50 states levy business taxes. Since approximately one-third of every state’s business taxes are offset by a reduction in federal revenues, the federal government has essentially replaced this lost tax revenue through higher federal tax rates. A state’s “net” federal tax offset would be its “gross” federal tax offset minus the state’s share of those increased federal tax payments. As a result, the net offset for the average state would be zero; with above average business taxes, Minnesota’s would be positive. However, given the offset’s small and uncertain size, this study simply assumes it is zero. The same argument also applies to the federal tax offset for non-business taxes (the individual income tax, homeowner property tax, and motor vehicle registration tax) deductible in calculating federal individual income tax liability;

42
the net offset for the average state is again zero. Given the multistate perspective of this study, no federal tax offset for household taxes is calculated either. Taxes on Intermediate Business Inputs The incidence of a tax on short-lived intermediate business inputs like gasoline, business meals, lodging, or liquor, is different from the incidence of a tax on capital. While a uniform national tax on all capital would be borne by capital, a uniform national tax on business purchases of gasoline, for example, would not. It would almost certainly be shifted forward to consumers in higher prices. Taxes on short-lived intermediate products raise the cost of production, but they do not raise the cost of capital. As a result, the approach to the incidence of such taxes skips the first of the three questions asked about capital taxes. The tax on intermediate business purchases is divided into only two parts: 1. The portion representing the “average national tax rate” on this sector is
shifted forward to consumers in higher prices. 2. The portion representing the “Minnesota differential” is borne by: a. Consumers for products sold in “local markets;” b. Labor and landowners for products sold in “national markets.” Distribution by Taxpayer Categories A description of the incidence results for the distribution of each business tax to consumers, capital and labor (both residents and nonresidents) is provided in this section. The business tax allocators used to estimate the business tax burden for specific Minnesota households are discussed at the end of this chapter. Business Property Taxes The burden of the business property tax falls on property owners (“capital”), consumers, and labor. Capital’s share of the tax burden is generally equal to the sum of two parts -- the land share plus the national tax on all capital.22 The
22 The exception is public utilities, where the land share of the tax is assumed to be shifted to consumers. Utility prices are regulated, guaranteeing an after-tax rate of return equal to a fixed proportion of the national average return on all capital. Capital still bears the share of the tax representing the national tax rate on all capital, however, because the property tax reduces the national rate of return.

43
consumers’ share of the tax burden equals all of the national sector differential plus the Minnesota differential for products sold in local markets. For products sold in national markets, the Minnesota differential is borne largely by labor (with capital bearing a small portion of the burden falling on land). As shown in the first section of Table 5-2, 37 percent of the burden of business property taxes for all industries is exported to nonresidents. Almost 55 percent of the tax burden on capital falls on non-residents, as does 12 percent of the burden on consumers. The tax burden shifted to nonresidents is highest for manufacturing (82 percent) and commercial property (45 percent). The tax on capital is almost entirely borne by non-Minnesotans in sectors where ownership is predominantly corporate (manufacturing and public utilities) and is spread widely throughout the nation. Sole proprietors, partnerships, and S corporations (included in the noncorporate sector) are more locally owned, so more of the burden on these noncorporate owners is borne by Minnesota residents. The tax borne by consumers is also shifted partly to nonresidents -- both to consumers purchasing Minnesota products in their home states and partly by visitors to Minnesota. The national sector differential is exported to nonresidents to the extent those products are sold out of state. The out-of-state proportion of sales is high for manufacturing and farms; it is negligible for rental housing and low for the commercial and public utility sectors. The visitor share of in-state sales is significant only for the commercial sector. The portion of business property taxes that are not exported are paid by Minnesota capital, labor and consumers. This study estimates that Minnesota capital bears 26 percent of the total burden of business property taxes, with consumers bearing 34 percent of the burden and labor bearing 3 percent. The burden on Minnesota capital is greatest in sectors where they are capital intensive and locally owned (farming and rental housing). The consumer share is highest in sectors where the Minnesota differential is high and the products or services are sold in local markets (public utilities, rental housing, and commercial). Labor would bear a significant burden only in sectors where the Minnesota differential is large and producers compete in a national market. For sectors competing in a national market (manufacturing and farming), the Minnesota differential is low. As a result, labor bears no more than 7 percent of the total burden in any sector.

44
Table 5-2 Distribution of Business Taxes by Taxpayer Category
Minnesota Taxpayers Exported Consumers Labor Capital Taxes
Business Property Taxes Public Utility Rental Housing Commercial Manufacturing Farm All Sectors
57% 64 35 2 0 34%
4% 0 5 7 0 3%
2% 30 16 9 100 26%
37% 6 45 82 0 37%
Sales Tax on Business Inputs Mining Construction Services Wholesale Finance Retail Utilities Manufacturing Transportation and Comm. Agriculture All Sectors
3% 79 65 52 66 50 8 12 42 23 53%
10% 0 1 1 3 0 0 15 6 0 3%
8% 8 14 5 5 13 9 4 4 46 10%
79% 13 20 42 26 37 83 69 48 31 34%
Corporate Franchise Tax Commercial Public Utility Manufacturing Mining All Sectors
57% 49 12 5 40%
3% 6 3 12 3%
3% 3 4 4 3%
37% 42 81 79 54%
Other Business Taxes Motor Vehicle Registration Insurance Premium Motor Fuels
36% 24 62
8% 0 4
12% 18 0
44% 58 34

45
This study treats taxes on apartments and other rental housing as business taxes. Individuals who invest their capital in rental housing, like those investing elsewhere, are assumed to respond to differences in after-tax rates of return. As with other business property taxes, part of the property tax on rental housing represents a tax on land, and part of it represents the average national tax on all capital. This study assumes that these portions of the rental property tax are borne by capital owners. An estimated 64 percent of existing rental housing taxes are shifted to renters in higher rents, with landlords paying the remaining 36 percent. The assumption that existing rental property taxes are partially borne by landlords follows from the multistate approach used. If the average national property tax rate on all capital is borne by the owners of capital, this will be the case for rental property the same as for manufacturing or commercial property.23 Farm property taxes are levied almost entirely on land. Nationally, property tax rates on non-land capital in the farming sector are below the average taxes on all capital. As a result, the national sector differential is negative. Given the lack of a positive national sector differential and the fact that farm product prices are set in a national market, none of the property tax can be shifted to consumers. As a result, farm property taxes are assumed to be borne entirely by farm owners. Sales Tax on Business Inputs Two distinct kinds of business purchases are fully or partially subject to sales tax: purchases of capital equipment (including motor vehicles) and purchases of non-capital intermediate inputs. Non-capital inputs include things such as general office supplies, business services, meals and entertainment and hotel charges. Construction materials purchased by the construction industry are also intermediate inputs, but the tax on construction materials is assumed to be fully shifted forward in higher prices for buildings, so it is treated as a tax on capital. Total sales taxes paid by business are estimated using the Minnesota Consumption Tax Model, an input-output model of the state economy. The model estimates the dollar value of purchases of capital goods and intermediate purchases by firms in each of the 112 industries. The Minnesota sales tax is applied to the taxable portion of those purchases (based on the identity of the product and the
23 In sharp contrast, an increase in rental property taxes, unmatched by increases in other states, would be expected to be borne almost completely by renters through the Minnesota differential.

46
purchasing company), yielding an estimate of total sales taxes paid by each industry. The estimated total 1992 sales tax paid by Minnesota businesses (45 percent of all sales taxes) is: Taxes on capital Capital equipment $ 443 million Construction materials 194 million Taxes on other intermediate inputs 512 million Total sales tax on business $1,149 million The incidence of the sales tax on business inputs was estimated separately for each of the 112 industries. The sales tax on capital equipment applies only to equipment purchased in the current year, only a fraction of businesses’ total equipment. Therefore, the tax rate (as a proportion of the value of a company’s total capital) is higher in industries which replace equipment more rapidly. Effective tax rates on capital were calculated for each industry by dividing current year taxes by the sector’s total stock of capital. For the tax on capital inputs, the tax was divided into 3 parts -- the national tax on all capital, the national sector differential, and the Minnesota differential. This process was essentially the same as for the property tax (discussed earlier) except that there is no land share with the sales tax. Since the tax on other intermediate inputs is not a tax on capital, it was divided into only 2 parts -- the average national sector tax and the Minnesota differential. Capital’s share of the tax burden is approximately equal to the national tax on all capital. The consumers’ share of the tax burden equals all of the national sector differential plus the Minnesota differential for products sold in “local markets.” For products sold in “national markets,” the Minnesota differential is borne largely by labor (with capital bearing a small portion of the burden shifted backward to landowners). For all industries, 34 percent of the business sales tax tax burden falls on nonresidents. (See Table 5-2.) Over half of the tax burden is shifted to nonresidents in three of the sectors, including 69 percent in manufacturing and 79 percent for mining.

47
Minnesota consumers bear over 50 percent of the total burden in higher prices. Minnesota consumers bear at least half of the tax burden in the construction, finance, wholesale, retail, and service sectors; they bear 12 percent or less in mining, manufacturing and utilities. Minnesota capital owners bear 10 percent of the total burden, ranging from highs of 46 percent of the taxes on farming to less than 10 percent in seven sectors. Minnesota labor bears 3 percent of the total burden (but 15 percent in manufacturing). The Corporate Franchise Tax The corporate franchise tax is a tax on the return to capital in the corporate sector. In estimating the incidence of this tax, as with other taxes levied on capital, this study divides the tax into 3 parts -- the average national tax rate on all capital (corporate and noncorporate), the national sector differential, and the Minnesota differential. For corporations, incidence is estimated separately for four sectors -- manufacturing, commercial, public utilities, and mining. The national average (state) corporate tax rate in 1992 was 7.35 percent.24 The corporate tax is levied on a relatively small share of total national capital. Corporations own only 36 percent of all privately-owned, tangible, non-land capital, so the average tax rate on all capital is only 0.36 times 7.35 percent, or 2.65 percent. The first 2.65 percent of Minnesota’s corporate income tax is therefore assumed to be borne entirely by owners of capital.25 Minnesota’s 1992 corporate tax rate, at 9.8 percent, was 33 percent higher than the national average state tax rate. However, this overstates the relative magnitude of the Minnesota tax for two reasons: first, the Minnesota apportionment formula is different from that used elsewhere, reducing the effective tax rate for the average taxable corporation; and second, Minnesota has no “throwback rule,” used in about half of all states to increase the size of their tax
24 The details of how the national average rate is calculated are presented in Minnesota Tax Incidence Study, November 1993, Chapter 5. 25 The incidence of the 7.35 percent average state tax on corporate income is assumed to be the same as a 7.35 percent national tax on corporate income. This partial tax on capital lowers the return on all capital, corporate and non-corporate, as capital moves in search of the highest rate of return. Given the assumptions of competitive markets and a national capital stock unaffected by taxes, the tax is borne by all capital.

48
base. After both adjustments, the estimated percent by which Minnesota’s effective corporate tax rate for each sector exceeds the national average is reduced to: Manufacturing 3.8% Commercial 30.0 Public Utilities 28.1 Mining 19.6 As seen in Table 5-2, 54 percent of the Minnesota corporate franchise tax burden is borne by nonresidents; Minnesota consumers bear 40 percent and the overall burden on labor is 3 percent. Other Business Taxes Motor Vehicle Registration Tax (Business Vehicles). Business pays an estimated 31 percent of annual motor vehicle registration taxes in Minnesota, including 15 percent of registration fees for automobiles, vans, and pickups, 100 percent for heavy trucks and buses, and 50 percent for utility trailers. Minnesota registration fees for automobiles and pickups are substantially above the national average. This study assumes registration fees for business (and personal) automobiles and pickups exceed the national average by 150 percent, while heavy truck registration fees are only 3 percent above the national average. The $117 million in motor vehicle registration fees paid by business were allocated among eleven sectors in proportion to each sector’s share of automobile and truck purchases. For each sector, as with other taxes on capital, the tax was separated into three parts -- the national average tax on all capital, the national sector differential, and the Minnesota differential. Over 44 percent of the tax is borne by nonresidents (including 74 percent of the capital share and 21 percent of the consumer share). The Minnesota burden of this tax is estimated to fall 12 percent on capital, 8 percent on labor, and 36 percent on consumers. Insurance Premiums Tax (Business Insurance). The insurance premiums tax is a flat percentage tax (generally 2 percent) levied on the value of insurance premiums written in Minnesota. Tax rates vary little among states, and Minnesota’s tax rate is equal to the national average. As a result, we assume the tax raises the price of insurance policies by the amount of the tax. In its impact, it is the same as a sales tax on insurance premiums.

49
Taxes on business insurance make up 23 percent of insurance premium tax revenues. Incidence is estimated in the same way as the incidence of the sales tax on business inputs. The tax base consists of two parts -- insurance on commercial property (fire, theft, auto) and other business insurance (malpractice, liability). The tax on property insurance (62 percent of the business total) is treated as a tax on capital, while the tax on other business insurance (38 percent) is considered a tax on a non-capital intermediate product. Most of the tax burden (58 percent) falls on nonresidents, with 24 percent borne by Minnesota consumers and 18 percent by Minnesota owners of capital. Motor Fuels Excise Tax (Business Purchases). The tax on motor fuels is a tax on a non-capital intermediate product. As such, the average national tax rate is shifted to consumers and the Minnesota differential is shifted either to consumers (local market goods) or to labor and land (national market goods). In 1992, Minnesota gasoline taxes were 8 to 16 percent above the national average, while diesel fuel taxes were 6 percent above the national average. This study assumes that Minnesota fuel taxes paid by business were 11.4 percent above the national average. An estimated 34 percent of the tax burden falls on nonresidents with Minnesota shares equal to 4 percent for labor and 62 percent for consumers. Business Tax Allocators After estimating the share of Minnesota business taxes borne by Minnesota owners of capital and land, consumers, and labor, the final step is to allocate those taxes to specific households based on each household’s characteristics contained in the database records. In most cases, the study allocates to each household the average tax burden for households with the same characteristics. Figure 5-3 summarizes the allocators used in this final step. Burden on Consumers. Taxes shifted forward to consumers are allocated to consumers based on their share of total consumer expenditures, as estimated from the 1992 Consumer Expenditure Survey. The total expenditures for a particular household are estimated based on household income and size.

50
Figure 5-3 Business Tax Allocators
Allocator Used to Distribute Tax Borne By:
Dividend income Noncorporate capital ownership Total consumer expenditures Labor income Farm income Farm rents
Corporate owners Noncorporate owners Consumers Workers Farmers using their own land Farmers leasing their land
Burden on Renters. The portion of rental housing property tax shifted forward to renters is allocated to renters in proportion to their rent. For households filing for property tax refunds, actual rent is known. For other households, it is estimated based on household income and data from the Census of Housing. Burden on Corporate Capital. The burden on corporate capital is allocated to households in proportion to taxable dividends received. This allocator is used for both forms of income received by owners of corporate stock -- dividends and capital gains on appreciated stock. Although dividends received may not always be a good measure of corporate ownership for particular individuals, the decile-by-decile distribution of dividend income should match the distribution of corporate capital fairly closely. Burden on Noncorporate Capital. Noncorporate business capital includes capital owned by sole proprietors, partnerships, and S corporations. This study uses various information from Schedules C and E to develop a reasonable estimate of each household’s ownership of noncorporate capital.26 The construction of this measure makes sure that: (1) households with large business losses are assigned some capital ownership (based on either claimed depreciation or the size of claimed losses); and (2) the shares of capital ownership imputed to those with sole proprietor income, rental income, and partnership and S corporation income are roughly proportional to each income source’s aggregate share of claimed depreciation.
26 See Minnesota Tax Incidence Study, November 1993, pp. 71-72 for a detailed discussion of the method used to measure the distribution of noncorporate capital by income level.
51
Burden on Farmers. Rental land accounts for a substantial proportion of Minnesota farm land. Approximately half of all farm property taxes are paid on rented land, partly reflecting higher classification rates on non-homestead farms. Therefore about half of the farm property tax burden is allocated in proportion to farm income (reported on Schedule F) and the rest is allocated in proportion to farm rents (reported on Schedule E). Burden on Labor. The burden on labor (through lower wages) is allocated based on the share of wages (plus the three-quarters of sole proprietor income that is assumed to be labor income). Given the assignment of taxes to resident and nonresident consumers, capital, labor and land, the allocators are used to assign specific tax amounts to Minnesota resident households based on their characteristics. The results of this allocation are reported in Chapter 6 by income levels.


53
CHAPTER 6 SUMMARY OF RESULTS This section examines the state and local tax burdens imposed on Minnesota taxpayers in 1992. All major taxes are included, those imposed on businesses as well as those imposed directly on households. The taxes included account for 97 percent of Minnesota state and local tax revenue in 1992. Only Minnesota taxes paid by residents are included in these results; Minnesota taxes paid by nonresidents and taxes paid by Minnesota residents to other states are excluded. For business taxes, the study estimates the extent to which they are shifted forward to Minnesota consumers in higher prices or backward to Minnesota workers in lower wages and to owners of capital in lower returns. The incidence results for the entire system of state and local taxes in Minnesota are reported both in terms of the overall distribution of tax burdens and by tax type. The Total Tax Burden For 1992, Minnesota residents paid a total of $8.99 billion in taxes while earning $74.4 billion in total money income.27 Minnesota residents thus paid 12.1 percent of their total income in state and local taxes. As shown in Figure 6-1, the individual income tax accounts for over one-third of the total taxes. Residential property taxes and the consumer sales tax (including sales tax on motor vehicles) account for 16.4 percent and 14.8 percent of the total, respectively. The three excise taxes (on alcohol, tobacco, and gasoline) on consumers account for 4.7 percent, while other taxes (insurance, motor vehicle registration, and property tax
27 Minnesota residents paid $9.0 billion out of a total of $11.1 billion of state and local taxes included in the study. The difference of $2.1 billion is exported to other states, i.e., paid by nonresidents. Business taxes account for 82 percent of all exported taxes, $1.7 billion out of the $2.1 billion total. The amounts for other taxes exported are: individual income tax, $113 million; consumer sales tax, $85 million; consumer excise taxes, $86 million; rental property tax, $60 million; and, other taxes, $19 million.

on cabins) account for 4.8 percent. Business taxes account for the remaining 24.2 percent of total state and local taxes paid by Minnesota residents.28
Figure 6-1Distribution of Minnesota
State and Local Tax Burdens by Tax
Business Taxes 24.2%
Individual Income (35.1%)
Other Taxes (4.8%)
Net ResidentialProperty Taxes (16.4%)**
Excise Taxes* (4.7%)
Sales Tax* (14.8%)
* Consumer portion ** Excludes seasonal recreational property.
To summarize the distribution of tax burdens by income level, the population of Minnesota households is divided into ten equal groups or deciles of households ranked by household income levels. For example, the first decile includes the 10 percent of households with the lowest income levels and the tenth decile includes the highest-income 10 percent of households. There are approximately 212,000 taxpaying households in each population decile. 28 This distribution by tax type differs in significant ways from the distribution in the previous tax incidence study. The business tax share of the burden has risen by over 2.3 percentage points, while the combined sales and excise tax shares have fallen by an equal amount (2.2 percentage points). This shift is largely the result of an improved methodology for allocating the burden of consumption taxes. The current study uses a detailed input-output model to separate the business and consumer sections of the sales and excise taxes. The model estimates that the share of the sales tax representing purchases by business is 44.8 percent and the business share of the excise tax is 27 percent. The corresponding shares from the 1990 study were 40 and 17 percent.
54

55
Examining the distribution of total tax burden by population decile (ranked by income level), one finds that taxpayers in the top decile (incomes above $66,630) bear about 37 percent of the total tax burden and account for 37.8 percent of total income. (See Table 6-1). By tax type, taxpayers in the top decile pay over half of the individual income tax, 24.7 percent of the consumer sales tax, 33.8 percent of the net residential property tax, and 32.6 percent of business taxes. In contrast, taxpayers in the bottom decile (incomes below $5,543) bear 1.6 percent of the total tax burden and receive only 0.9 percent of total income. With regard to each of the tax types, the bottom decile taxpayers have a negative net individual income tax burden due to the refundable working family credit and the child and dependent care credit. The same households pay 2.1 percent of the consumer sales tax, 3.8 percent of the consumer excise tax, 2.1 percent of net residential property tax, and 2.8 percent of business taxes. Table 6-2 summarizes the distribution of the total burden by tax type for each decile. Business taxes, residential property taxes, and the consumer sales tax account for the largest percentage of taxes paid in the lowest deciles. As noted, the income tax burden in the first decile is negative; income tax accounts for only 1.6 percent of tax paid in the second decile. In the top deciles, income tax contributes the largest share of taxes paid, with 48.6 percent of the total tax in the tenth decile coming from the income tax. Another fifth of the top decile’s tax burden comes from business taxes. To evaluate the fairness or equity in the distribution of tax burdens by income level, tax burdens must be compared to the underlying distribution of income. The following section examines this relationship. Overall Effective Tax Rates A key measure used to analyze tax equity is the effective tax rate, which is defined as the ratio of taxes to income. Effective tax rates measure the percentage of income paid in taxes and can be compared for different levels of income. The distribution of tax burdens is characterized as progressive if the effective tax rate rises with income, proportional if it is constant for all income levels, or regressive if it falls as income rises. The actual effective tax rates by tax type are reported in Table 6-3 and in more detail in Appendix Tables B-1 through B-4. Figure 6-2 shows overall

Table 6-1 Distribution of Taxes and Income by Population Deciles
($ Thousands)
Decile
Income Range
Total Household
Income
Individual Income
Tax
Consumer Sales Tax
Consumer Excise Taxes
Residential Property
Taxes1
Other Taxes2
Business Taxes3
Total Taxes
First Second Third Fourth Fifth Sixth Seventh Eighth Ninth Tenth
$5,542 & Under 5,543 - 9,092 9,093 - 13,332 13,333 - 17,879 17,880 - 23,335 23,336 - 30,079 30,080 - 38,290 38,291 - 48,819 48,820 - 66,630 $66,631 & Over
$636,380 1,546,323 2,367,747 3,313,731 4,334,693 5,632,328 7,218,796 9,158,399 12,073,769 28,128,131
-$453 3,052 23,034 56,551 101,952 170,649 252,551 373,685 556,740 1,620,343
$27,493 46,905 65,309 86,693 106,134 126,596 150,780 177,578 214,532 328,590
$15,966 23,626 29,844 37,297 41,819 45,207 52,157 56,927 58,432 62,073
$31,351 33,420 49,720 74,536 101,574 131,113 153,835 177,189 222,067 497,112
$7,793 10,360 15,021 23,182 31,133 39,027 50,485 61,349 78,452 116,443
$60,177 67,649 103,221 123,447 145,277 179,657 220,061 256,702 309,315 708,649
$142,327 185,012 286,149 401,706 527,889 692,249 879,869 1,103,430 1,439,538 3,333,210
Total $74,410,297 $3,158,104 $1,330,610 $423,348 $1,471,917 $433,245 $2,174,155 $8,991,379Top 5% Top 1%
$86,725 & Over $188,099 & Over
$20,147,382 10,266,670
$1,218,524 681,160
$199,692 63,617
$32,150 7,206
$349,076 154,890
$69,890 21,814
$510,323 257,821
$2,379,655 1,186,508
Percentages of Taxes and Income by Population Deciles 56
Decile
Income Range
Total Household
Income
Individual Income
Tax
Consumer Sales Tax
Consumer Excise Taxes
Residential Property
Taxes1
Other Taxes2
Business Taxes3
Total Taxes
First Second Third Fourth Fifth Sixth Seventh Eighth Ninth Tenth
$5,542 & Under 5,543 - 9,092 9,093 - 13,332 13,333 - 17,879 17,880 - 23,335 23,336 - 30,079 30,080 - 38,290 38,291 - 48,819 48,820 - 66,630 $66,631 & Over
0.9% 2.1 3.2 4.5 5.8 7.6 9.7 12.3 16.2 37.8
0.0% 0.1 0.7 1.8 3.2 5.4 8.0 11.8 17.6 51.3
2.1% 3.5 4.9 6.5 8.0 9.5 11.3 13.3 16.1 24.7
3.8% 5.6 7.0 8.8 9.9 10.7 12.3 13.4 13.8 14.7
2.1% 2.3 3.4 5.1 6.9 8.9 10.5 12.0 15.1 33.8
1.8% 2.4 3.5 5.4 7.2 9.0 11.7 14.2 18.1 26.9
2.8% 3.1 4.7 5.7 6.7 8.3 10.1 11.8 14.2 32.6
1.6% 2.1 3.2 4.5 5.9 7.7 9.8 12.3 16.0 37.1
Total 100.0% 100.0% 100.0% 100.0% 100.0% 100.0% 100.0% 100.0%Top 5% Top 1%
$86,725 & Over $188,099 & Over
27.1% 13.8
38.6% 21.6
15.0% 4.8
7.6% 1.7
23.7% 10.5
16.1% 5.0
23.5% 11.9
26.5% 13.2
NOTES: 1Net of renters’ property tax refunds. Includes both the renter and landlord share of rental property taxes, but excludes property tax on second homes (cabins). 2Other taxes include motor vehicle registration tax, insurance premiums tax on personal insurance, and property tax on cabins. 3Excludes the property tax on rental housing.

Table 6-2
Percent Distribution of Burden by Tax Type within Population Deciles
Decile
Individual Income
Tax
Consumer Sales Tax
Consumer Excise Taxes
Residential Property Tax
(Net of Refunds)
Other Taxes
Business
Taxes
Total Taxes
First Second Third Fourth Fifth Sixth Seventh Eighth Ninth Tenth
-0.3% 1.6 8.0 14.1 19.3 24.7 28.7 33.9 38.7 48.6
19.3% 25.4 22.8 21.6 20.1 18.3 17.1 16.1 14.9 9.9
11.2% 12.8 10.4 9.3 7.9 6.5 5.9 5.2 4.1 1.9
22.0% 18.0 17.3 18.5 19.3 18.9 17.5 16.1 15.4 14.9
5.5% 5.6 5.3 5.8 5.9 5.7 5.8 5.5 5.5 3.5
42.3% 36.6 36.0 30.7 27.5 26.0 25.0 23.3 21.5 21.2
100.0% 100.0 100.0 100.0 100.0 100.0 100.0 100.0 100.0 100.0
Total
35.1%
14.8%
4.7%
16.4%
4.8%
24.2%
100.0%
Top 5% Top 1%
51.2% 57.4
8.4% 5.4
1.4% 0.6
14.7% 13.0
2.9% 1.9
21.4% 21.7
100.0% 100.0
57

Table 6-3 1992 Effective Tax Rates by Population Deciles
(All Taxpayers)
Decile
Individual Income
Tax
Consumer Sales Tax
Consumer Excise Taxes
Residential Property
Tax1
Other Taxes2
Total Individual
Taxes
Business Taxes3
Total Taxes
First4 Second Third Fourth Fifth Sixth Seventh Eighth Ninth Tenth
-0.1% 0.2 1.0 1.7 2.4 3.0 3.5 4.1 4.6 5.8
4.1% 3.0 2.8 2.6 2.4 2.2 2.1 1.9 1.8 1.2
2.4% 1.5 1.3 1.1 1.0 0.8 0.7 0.6 0.5 0.2
2.8% 2.1 2.1 2.2 2.4 2.3 2.1 1.9 1.9 1.8
1.1% 0.7 0.7 0.7 0.7 0.7 0.7 0.7 0.6 0.4
10.3% 7.6 7.8 8.4 8.9 9.1 9.1 9.2 9.4 9.4
5.7% 4.4 4.4 3.7 3.3 3.2 3.1 2.8 2.6 2.5
16.1% 12.0 12.1 12.1 12.2 12.3 12.2 12.0 11.9 11.9
Total
4.2%
1.8%
0.6%
2.0%
0.6%
9.2%
2.9%
12.1%
Top 5% Top 1%
6.0% 6.6
1.0% 0.6
0.2% 0.1
1.7% 1.6
0.4% 0.2
9.3% 9.1
2.5% 2.5
11.8% 11.6
58
NOTES: 1 Net of renters’ property tax refunds. Includes both the renter and landlord share of rental property taxes, but excludes property tax on second homes (cabins). 2 Other taxes include individual motor vehicle registration tax, insurance premiums tax on personal insurance, and property tax on cabins. 3 Excludes the property tax on rental housing. 4 As explained later in this chapter, effective tax rates for the first decile reflect an adjustment to exclude a small number of households with negative income, primarily business losses. Unadjusted figures are reported in Appendix B tables.
59
effective tax rates for Minnesota’s state and local tax system and summarizes the most important findings in this study. The effective tax rate is shown on the vertical axis of the figure; population deciles are shown on the horizontal axis (each decile containing 10 percent of total taxpayers). The state and local tax system, except for the first decile, is very close to proportional. Effective tax rates are 12.0 percent in the second decile and 11.9 percent in the tenth decile. With the exception of the first decile, the highest effective tax rates (12.2 to 12.3 percent) occur in the middle deciles. The effective tax rate declines slightly in the top three deciles, falling from 12.2 percent (seventh decile) to 11.9 percent (top decile). Figure 6-2 also shows effective tax rates for state and local taxes, including both business taxes and taxes on individuals. Except for the first decile, state taxes are progressive overall with higher effective tax rates in the upper deciles. Effective tax rates for the local property tax (net of refunds) are regressive, falling from 4.0 to 3.1 percent from the second to tenth deciles. The high tax burdens in the first decile will be discussed in more detail below. Effective Tax Rates by Type of Tax As shown in Figure 6-3, taxes imposed directly on individuals (state taxes on individuals plus residential property taxes) are progressive overall, as effective tax rates increase from 7.6 to 9.4 percent from the second to the tenth decile as income increases. Business taxes, however, are somewhat regressive; that is, effective tax rates decline, from 4.4 in the second decile to 2.5 percent in the tenth decile. Effective tax rates by population deciles for the six major categories of taxes in this study are presented in Table 6-3 and are illustrated in Figure 6-4. The results show that the individual income tax is very progressive, while the five remaining taxes are all regressive. Because the progressive individual income tax accounts for over 35 percent of the total tax burden, it offsets the regressivity of the other state and local taxes combined. Hence, as a whole, the state and local system of taxation in Minnesota is close to proportional, as shown in Figure 6-2. The Individual Income Tax Because of its graduated structure and allowance of personal exemptions and deductions, the individual income tax is, by design, progressive. As shown in Table 6-3, effective tax rates do increase significantly as incomes increase. At the

State and Local Taxes by Population Deciles
1 2 3 4 5 6 7 8 9 102
4
6
8
10
12
14
16
18
Population Deciles
Effective Tax Rate (percent)
Total Taxes State Taxes Local Property Tax
Figure 6-2Effective Tax Rates for 1992,
NOTE: Effective tax rates for the first decile reflect an adjustment to exclude a small number of households with negative income, primarily business losses.
60

61
Effective Tax Rates for 1992,Individual and Business Taxes by Population Deciles
1 2 3 4 5 6 7 8 9 100
2
4
6
8
10
12
14
16
18
Population Deciles
Effective Tax Rate (percent)
Total Taxes Taxes on Individuals Business Taxes
Figure 6-3
NOTE: Effective tax rates for the first decile reflect an adjustment to exclude a small number of households with negative income, primarily business losses.
61

1992 Effective Tax Rates by Tax TypeBy Population Deciles
1 2 3 4 5 6 7 8 9 10(1)
0
1
2
3
4
5
6
7
Population Deciles
Effective Tax Rate (percent)
BusinessTaxes
IncomeTax
SalesTax
ExciseTaxes
ResidentialProperty Tax
Figure 6-4
NOTE: Effective tax rates for the first decile reflect an adjustment to exclude a small number of households with negative income, primarily business losses.
62

63
low end, the effective tax rate for the income tax equals -0.1 percent and 0.2 percent for the first and second deciles, respectively, and rises steadily to 5.8 percent for the tenth decile. A total working family credit of $415,000 and a refundable child and dependent care credit of $331,000 in the first decile more than offsets the $293,000 in positive income tax liabilities in the first decile; the net effect is a $453,000 refund or negative tax for these households. As shown above in Table 6-1, nearly 81 percent of the entire individual income tax burden is borne by the top three deciles (incomes above $38,290), and these taxpayers account for 66 percent of money income. The middle four deciles account for most of the remaining tax, 18.4 percent, while accounting for 28 percent of total income. Sales Tax on Consumer Purchases In agreement with most incidence studies, this analysis finds the consumer portion of the sales tax to be regressive, especially at the low end of the scale. (The sales tax on business purchases is included with the business tax category.) This is due to the fact that the share of income represented by taxable consumption tends to be smaller for high income households than for low income ones. Hence, tax burdens as a proportion of income tend to decline as one moves up the income scale. The effective consumer sales tax rate for the bottom decile is 4.1 percent, compared to the rate for the top decile of 1.2 percent (see Table 6-3). Households in the bottom decile thus pay an effective tax rate almost 3.5 times as large as the effective tax rate on households in the top decile. However, the effective tax rates for the third through ninth deciles, which represent 70 percent of all taxpayers, range from 2.8 to 1.8 percent. Excise Taxes on Consumer Purchases Three excise taxes are included in this study: gasoline, tobacco, and alcohol taxes. Because each is relatively small individually, the three were combined to arrive at one aggregate measure for this analysis. Like the sales tax, the excise taxes are regressive. This is predictable since lower income households spend a greater proportion of their income on consumer goods subject to the excise taxes than higher income households. As a result, effective excise tax rates are higher for low income households than for higher income ones. As shown in Table 6-3,
64
the effective tax rate for the bottom decile is 2.4 percent. It ranges from 1.5 percent to 0.6 percent from the second to the eighth deciles; it declines to 0.2 percent for the tenth decile. Residential Property Taxes The tax incidence study provides information on the distribution of property taxes by decile which is important for property tax policy discussions. The incidence data base can be used to calculate effective property tax rates on all forms of residential property, as well as for renters and homeowners. Net Residential Property Taxes. As shown in Table 6-3, net effective residential property tax rates, after property tax refunds, are regressive. Residential property taxes include the portion of the property tax on rental housing assumed to be borne by the landlord as well as taxes paid by homeowners and renters. Effective property tax rates on residential property decrease from 2.8 percent in the first decile to 1.8 percent in the tenth decile. Homeowner Property Taxes. The property tax on owned homes, net of property tax refunds, is regressive. (See Table B-2 for homeowner effective tax rates.) Generally, burdens decline as taxpayers move up the income scale. The net effective property tax rate for homeowners is 6.1 percent for the second decile and gradually declines to 1.5 percent in the tenth decile. The regressivity of homeowner property taxes is reduced by the impact of the property tax refund (PTR) program which targets relief on taxpayers with high property taxes relative to income. Comparing gross property tax rates (before refunds) to net effective rates (after refunds) shows that effective tax rates are reduced for low to moderate income taxpayers in the lower deciles. (See Table B-2.) For example, the effective property tax rate for homeowners in the second decile is reduced by 1.8 percentage points, with the PTR reduction falling to 0.3 percentage points in the fifth decile. Rental Property Taxes. This study’s estimates of the property tax burden on renters is consistent with the approach used for business taxes more generally. Taxes on rental property, like taxes on other business property, are shifted to renters in higher prices and to property owners in lower returns. Using the methodology applied to business taxes more generally, this study estimates that a sizeable portion of the 1992 level of rental property tax (36 percent) is borne by

65
the investors who’s own rental housing; the remaining share (64 percent) is assumed to be paid by renters in higher prices. The effective tax rate on renters is, therefore, lower than it would be if all of the tax were passed along in higher rents. As shown in Appendix Table B-3, the gross property tax burden borne by renters ($298 million) is regressive. Gross effective property tax rates gradually decline from 4.2 percent in the second decile to 1.0 percent in the tenth decile. The pattern of net effective property tax rates (after PTR) is, however, very different. In this study, the entire amount of property tax refunds received by renter households is subtracted from the portion of the tax estimated to be borne by renters. This offset significantly reduces effective tax rates in the lower deciles. The net effective property tax rate for renters increases from 1.3 percent in the second decile to 2.1 percent in the seventh decile, then falls to 1.0 percent in the top decile. The rather unexpected relationship between gross and net property taxes on renters can be better understood by comparing the incidence assumption in this study to the incidence assumption implicit in the renter property tax refund program. In this study, renters are assumed to bear 64 percent of rental property taxes in the form of higher rents. However, the property tax refund program assumes that the entire property tax on rental property is borne by renters. For lower income renters actual property tax refunds offset a significant portion of the property tax burden assigned to renters in this study. As shown in Table B-2 and Table B-3, in every decile, the net property tax burden on renters is less than the net property tax burden on homeowners after adjusting for the impact of the PTR. While almost two-thirds of the rental tax is shifted forward to renters, some of the burden falls on the property owners. In contrast, homeowners bear the entire burden of homeowner property taxes since they are both the housing consumer and property owner.29
29 A simple comparison of net homeowner and net renter property tax burdens is misleading. The net renter property tax burden includes only the burden on renters as consumers of housing. The net homeowner burden includes the total burden, both the burden on the housing consumer and the burden on the property owner. If property tax rates on homes and rental property were identical, then the share of the homeowner tax burden falling on the owner of the property would be the same as the share of the rental property tax falling on the owner of the rental property (here estimated to be 36 percent). Under Minnesota's class rate system, however, property taxes on rental housing exceed those on homes. As shown in Chapter 5, the portion of a state or local tax on capital shifted forward to consumers increases with the tax rate. As a result, the consumer share of the property tax on renters is much higher than the consumer share of the property tax on homeowners.

66
Business Taxes As shown in Figure 6-1 above, business taxes account for 24.2 percent of the total tax burden on Minnesota residents. Business taxes include the following: Business property taxes (other than rental housing) Corporate franchise tax Sales tax paid on purchases of capital equipment and other intermediate inputs Motor vehicle registration fees paid by business Excise taxes paid by business (motor fuels) Insurance premiums tax on business insurance Although the legal impact of each of these taxes falls on the business entity, each is partially shifted to consumers (in higher prices), to labor (in lower wages), or borne by capital owners as a lower rate of return. Part of each of these taxes is also shifted to nonresidents. This study estimates the degree to which such shifting occurs and then allocates the estimated burden to Minnesota households based on each household’s sources of income and patterns of spending. (An explanation of tax shifting and the method of estimating the incidence of business taxes for this study is found in Chapter 5.) To determine the incidence of each business tax, the study first estimates tax payments made by the different business sectors (manufacturing, mining, retail trade, etc.). Then market characteristics of each business sector are used to estimate the degree to which taxes are shifted to consumers, labor, and nonresidents30. Finally, taxes paid by each of these taxpayer categories (factors) are distributed to individual households in the sample. Table 6-4 summarizes the estimated incidence of business taxes. The overall burden of business taxes is shared almost equally by consumers (50 percent) and owners of capital (46 percent); labor bears the remaining 4 percent. Since capital ownership is concentrated among high income households, it is possible that business taxes are progressive.
30 A separate appendix explaining the details of the shifting analysis is available from the Tax Research Division.
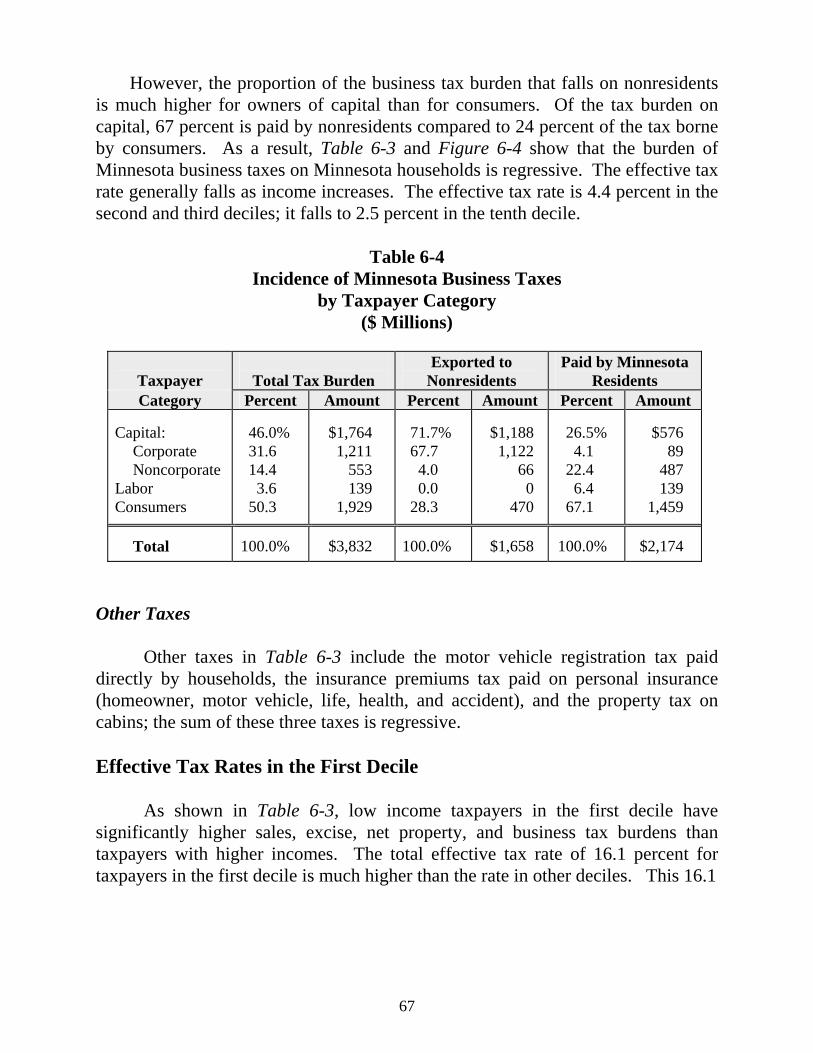
67
However, the proportion of the business tax burden that falls on nonresidents is much higher for owners of capital than for consumers. Of the tax burden on capital, 67 percent is paid by nonresidents compared to 24 percent of the tax borne by consumers. As a result, Table 6-3 and Figure 6-4 show that the burden of Minnesota business taxes on Minnesota households is regressive. The effective tax rate generally falls as income increases. The effective tax rate is 4.4 percent in the second and third deciles; it falls to 2.5 percent in the tenth decile.
Table 6-4
Incidence of Minnesota Business Taxes by Taxpayer Category
($ Millions)
Taxpayer
Total Tax Burden
Exported to Nonresidents
Paid by Minnesota Residents
Category Percent Amount Percent Amount Percent Amount
Capital: Corporate Noncorporate Labor Consumers
46.0% 31.6 14.4 3.6
50.3
$1,764 1,211 553 139 1,929
71.7% 67.7 4.0 0.0
28.3
$1,188 1,122 66 0 470
26.5% 4.1
22.4 6.4
67.1
$576 89 487 139 1,459
Total
100.0%
$3,832
100.0%
$1,658
100.0%
$2,174
Other Taxes Other taxes in Table 6-3 include the motor vehicle registration tax paid directly by households, the insurance premiums tax paid on personal insurance (homeowner, motor vehicle, life, health, and accident), and the property tax on cabins; the sum of these three taxes is regressive. Effective Tax Rates in the First Decile As shown in Table 6-3, low income taxpayers in the first decile have significantly higher sales, excise, net property, and business tax burdens than taxpayers with higher incomes. The total effective tax rate of 16.1 percent for taxpayers in the first decile is much higher than the rate in other deciles. This 16.1

68
percent effective tax rate includes an adjustment to exclude households with negative incomes, as discussed below. (Without this adjustment, the effective tax rate for the first decile is even higher, 22.4 percent, as shown in Appendix Table B-1). These higher effective tax rates require further discussion and explanation. The unadjusted effective tax rate for the first decile is overstated for several reasons. First, the lowest decile includes households who have temporarily low incomes or have better overall economic well-being than is indicated by money income in 1992. A portion of retirees, for example, may be living primarily on savings or other assets but report small amounts of annual money income received. Due to unemployment or business fluctuations, some households who normally have higher incomes are also included in the first decile. One identifiable group of first-decile households is particularly noteworthy. About 8 percent of all first-decile households are in this decile only because they reported business losses or large capital losses for income tax purposes in 1992. Almost all of these 16,000 households had negative household income; 44 percent were farmers. Although their average business loss was $21,000, their average tax burden was estimated to be $2,655.31 Few of these households are actually poor for any length of time. Over 75 percent are homeowners, with homes valued over $55,000, on average. Most had significant amounts of business activity as sole proprietors or partners, and the reported losses are probably temporary. Excluding the small group of households with either negative income or business losses from the first decile reduces the effective tax rate from 22.4 percent to 16.1 percent. Another reason why effective tax rates for the first decile are overstated concerns the measurement of income. The incidence sample does not identify all sources of income. Almost 50 percent of first-decile households filed neither an income tax nor a property tax refund return. The incidence study has identified some wage and capital income for these nofilers, but they may have sources of income which were not identified in this study. An underestimate of household income generally causes effective tax rates to be overestimated.
31 In this study, households with large business losses and negative income (due perhaps to large depreciation deductions) were assumed to still bear large amounts of business taxes. In addition, all households were assumed to bear a minimum amount of sales and excise taxes.

69
Household income is also underestimated in the Consumer Expenditure Survey used to estimate sales and excise tax burdens. To the extent that income is subject to relatively greater underreporting than consumption, particularly for low-income households, the taxable consumption expenditures calculated from CES will be overstated, again resulting in effective tax rates being overestimated.32 A final reason why the effective tax rates for the lowest decile may be overstated concerns the definition of a household. An unknown but significant number of low-income households might more accurately be considered members of another household. Almost half of these households are single adults living with family members. They also include a significant number of elderly parents living with children. While this study does adjust for negative incomes for a small number of households, no attempt has been made to adjust for possible underreported income or for other differences between transitory and long-run measures of income. Consequently, money income at the low end of the income distribution does not provide an accurate measure of overall economic well-being in the first decile. As such, effective tax rates in the first decile are overstated by an unknown but significant amount. The Suits Index The previous sections looked at effective tax rates for each of the six categories of taxes examined in this study. The effective tax rate -- that is, the ratio of taxes paid to income -- can be used to compare tax burdens across income categories. However, it is difficult to summarize the overall distribution of a tax (progressive, proportional or regressive) from the individual effective tax rates. This section uses the Suits Index as a summary measure of the overall distribution for a specific tax.
32 To partly adjust for the unreliability of the CES data, the ratio of consumption to income is adjusted downward for the lowest deciles. This adjustment is largely offset, however, by another adjustment for those with low or negative incomes. In computing sales, excise, and rental property tax burdens, those with incomes below $2,000 were assumed to spend as if they had incomes of $2,000. Even those with zero income were assumed to have some taxable purchases.

70
The Suits Index measures the relationship between the cumulative percentage of taxes and the cumulative percentage of total income for taxpayers ranked by income. A proportional tax has a Suits Index equal to zero; a progressive tax has a positive index. In the extreme case, when the total tax burden is paid by those in the highest income bracket, the index has a value of +1.0. For a regressive tax, the Suits Index has a negative value of between 0 and -1.0, the mostregressive value.
Table 6-5 Suits Indexes for Minnesota State and Local Taxes
Tax Category 1992 Suits Index
Residential Property Tax Gross Net (after PTR) Excise Taxes Sales Tax Consumers Business Total Other Taxes Business Taxes Personal Income Tax
-0.13 -0.07 -0.30 -0.18 -0.11 -0.15 -0.12 -0.10 +0.20
State Taxes Local Taxes Total Taxes
+0.01 -0.07 -0.01
Table 6-5 presents Suits indexes for Minnesota state and local taxes in 1992.33 The only progressive tax is the personal income tax with a positive Suits index of +0.20. The excise tax is the most regressive, followed by the sales tax. Taken as a whole, the system of Minnesota taxes is slightly regressive (a Suits index of -0.01). If one excludes the local property tax, however, the system becomes slightly progressive (+0.01). 33 Due to changes in methodology, the Suits indexes, especially for sales and excise taxes, are not directly comparable to those reported in the 1990 study.

71
CHAPTER 7
DETAILED RESULTS FOR DIFFERENT HOUSEHOLD TYPES
Introduction This chapter provides additional information on the demographic characteristics of households which vary greatly by decile. The lower deciles are much more likely to be single-person households and elderly households. Only a small proportion of the households in the lowest deciles include children. In contrast, most of the upper decile households are married couples with or without children. These detailed characteristics provide further information that can be used to analyze and interpret the results of this study. Demographic Characteristics of Each Decile
The demographic characteristics of the incidence sample vary greatly across the ten deciles. (See Appendix Tables C-1 to C-5.) As shown in Figure 7-1, 83 percent of households in the first two deciles are single-person households. Only about 14 percent of the households in the first decile and 16 percent of the households in the second and third deciles include children. In contrast, only 8 percent of households in the top two deciles are single-person households, while 59 percent include children. Figure 7-1 also shows that elderly households (both married and single) account for over 38 percent of all second decile households and almost 36 percent of all third decile households. In the lowest deciles, single elderly far outnumber elderly couples; in the top deciles, elderly couples are more common than single-person elderly households.34
34 For most households the incidence sample includes no breakdown by age. Here elderly is defined as all Social Security recipients not known to be under age 62 years of age whose Social Security benefits are at least twice as large as earned income. This category therefore excludes some over age 65 (who have not retired) and includes some under age 65 (those retiring at age 62 plus some who are disabled).

Figure 7-1Households by Family Type
1 2 3 4 5 6 7 8 9 10 Total
0
20
40
60
80
100
Deciles
Percent of all Households
Two-parent Familywith Children
Single-parentwith Children
MarriedNo Children
MarriedElderly
SingleElderly
One-personHousehold
72

73
Households with children are primarily single-parent households in the first three deciles. The percent of households with children that include two parents increases fairly steadily with income. About 90 percent of the total number of households in the top two deciles include married persons, with or without children. Figure 7-2 shows how housing status varies with income. As expected, homeownership rates rise steadily with income, from 14 percent in the first decile to 90 percent in the tenth decile. For all households, 54 percent are homeowners. The first decile contains 2.9 renter households for every homeowning household; the tenth decile contains 17 homeowner households for every renter household. Farm homesteads are spread fairly evenly among all deciles.35 A substantial proportion of households in the first five deciles are classified as neither homeowners nor renters. (See Figure 7-2.) This “other” category is largely the result of this study’s definition of a household. While census data generally defines a household to include all individuals living in a particular housing unit, this study (like other tax incidence studies) generally defines a household as a taxpayer, a taxpayer’s spouse, and all others claimed as dependents for income tax purposes; these primary households are assumed to share property taxes on their housing units. In contrast, related households, such as students and other older children living with parents (but not claimed as dependents) or elderly parents living with children, are assumed to pay no property taxes. These secondary households make up most of the group labeled “other” in Figure 7-2. While it might make sense to combine these households into one single household (as in Census data), the incidence sample provides no means of matching such secondary households with a primary household. As a result, a substantial number of lower-income households in the incidence sample do not fit the usual definition of a household. The sizeable number of these households should be kept in mind when interpreting the overall incidence results.
35 Farm households include only those living on farm homestead property. This excludes active farmers who farm only rented land or do not live on a farm homestead. In this study, "homeowners" generally include only non-farm homesteads, but the homeownership rates in this chapter include both farm and non-farm homesteads.

Figure 7-2Housing Tenure by Decile
1 2 3 4 5 6 7 8 9 10 Total0
20
40
60
80
100
Deciles
Percent of all Households
Homeowner Farmer Renter Other
74

75
Detailed Incidence Results for Five Different Household Types As shown in Figure 7-1, the demographic characteristics of each population decile vary greatly. A typical one-person household has much lower income than the typical married couple with children. The median income for a one-person household is $15,400 and falls in the 4th decile; the median income for a married couple with children is $46,300 and falls in the 8th decile. As a result, it is difficult to interpret the overall incidence results, particularly in the lower deciles. Table 7-1 clarifies the nature of the tax burden for typical households from each of the five household types: retired elderly, single-person (non-elderly) households, single-parent families, married (non-elderly) couples with no children, and married couples with children. The representative households are defined in terms of their position in the income distribution for each household type. The following table describes the three household definitions.
Household Income Level 25th Percentile The household with income greater than 25
percent of all households of the same type. 50th Percentile The household with income greater than half of
all households of the same type. (This household’s income is the median income.)
75th Percentile The household with income greater than 75 percent of all households of the same type.
For each household type, Table 7-1 shows the average tax burden for the population deciles that include the three representative households. 36 Appendix Tables C1 through C5 provide additional detailed information, showing how effective tax rates vary with income for each of the separate demographic groups. These detailed tables show the number and characteristics of each type of household by the population deciles for all taxpayers. Information for each group and decile includes household size, household income, housing status 36 The actual population deciles (from Appendix Tables C1-C5) corresponding to the three different relative income levels vary by household type. The 2nd, 4th and 6th deciles were used for one-person, elderly and single parent family households; the 6th, 8th and 9th deciles were used for married with no children; and the 7th, 8th and 9th deciles were used for married with children households.

76
Table 7-1 Average Tax Burdens by Household Type and Income Level
Household Income Level
One-Person Households
Retired Elderly
Single Parent
Families
Married No
Children
Married With
Children 25th Percentile
Net Property Tax: Homeowners Renters All Taxpayers State Income Tax Sales Tax Excise Taxes Other Taxes Business Taxes
$684 147 144 63 225 119 46 309
$347 53 143 0 189 79 43 282
$453 40 81 -84 214 140 19 315
$677 533 590 748 652 255 277 954
$686 698 631 974 783 295 297 1,156
Total Taxes
Effective Tax Rate
$906
12.5%
$735
10.0%
$685
9.4%
$3,475
12.9%
$4,135
12.0% 50th Percentile (median income)
Net Property Tax: Homeowners Renters All Taxpayers State Income Tax Sales Tax Excise Taxes Other Taxes Business Taxes
$511 361 324 518 396 189 76 505
$580 181 383 33 358 119 86 583
$453 238 250 112 405 181 138 504
$872 604 768 1,927 823 291 316 1,153
$856 607 771 1,584 899 305 333 1,343
Total Taxes
Effective Tax Rate
$2,008
12.9%
$1,561
10.0%
$1,591
10.1%
$5,278
12.2%
$5,233
12.1% 75th Percentile
Net Property Tax: Homeowners Renters All Taxpayers State Income Tax Sales Tax Excise Taxes Other Taxes Business Taxes
$690 561 601 1,237 554 205 110 691
$724 526 623 236 568 162 175 955
$730 410 581 825 572 174 225 810
$1,015 685 947 2,893 983 274 377 1,410
$1,085 677 1,016 2,492 1,055 300 399 1,498
Total Taxes
Effective Tax Rate
$3,398
12.8%
$2,719
10.3%
$3,187
12.0%
$6,884
12.1%
$6,760
11.8%

77
(including average rent and home value), average tax burden (for each tax), and effective overall tax rates. This detailed information can be used to compare effective tax rates for different household types at similar money income levels. Effective tax rates are shown both for all households and separately for renters and homeowners. In some deciles, the number of households of a particular type is very small. For example, single-parent families account for only one percent of all tenth-decile households. Whenever a particular household type accounts for less than 5 percent of a decile’s households, the numbers in the Appendix tables may include some error resulting from the small sample size for that particular cell.

79
CHAPTER 8
EFFECTIVE TAX RATE PROJECTIONS FOR TAX YEAR 1994
Introduction This tax incidence report includes data on actual income and taxes for all Minnesota residents for tax year 1992. It is based on a comprehensive data set which combines actual or reported tax and income information. The 1992 distribution of effective tax rates is limited, however, in terms of its usefulness to decisionmakers because it is several years old. This chapter presents projected effective tax rates for tax year 1994 and serves as a reference point for current tax policy discussions. Because the 1992 study could not be replicated for tax year 1994, an alternative methodology is used in this chapter to estimate the impact of tax structure changes between 1992 and 1994.37 Under this alternative approach, changes in statutory tax bases or tax rates are applied to 1992 base year levels of income and market value in the tax incidence study database.38 In other words, the projected effective tax rates for 1994 are calculated as if the 1994 tax structure were in effect during 1992. This method generated estimates of effective tax rate changes for 1994 that can be compared to actual 1992 tax incidence results. The next section discusses the main tax law changes made during the 1993 and 1994 legislative sessions and changes in local property tax rates. The estimated impact of these changes on the distribution of effective tax rates is summarized by comparing the 1992 and 1994 effective tax rates.
37 Actual tax return information for 1994, e.g., income tax, is not yet available and the current incidence modeling framework does not include the overall capability to project both income and taxes simultaneously. 38 For example, individual income tax provisions in effect for tax year 1994 were modeled using the 1992 income levels as a base. For the property tax, gross taxes were calculated under the projection by using the 1994 class rate structure and local tax rates, but holding 1992 market values constant. This method isolates changes in effective tax rates resulting from structural tax changes only. It does not take into account changing economics, such as growth or redistribution of incomes or changes in market values from 1992 to 1994.

80
Recent Tax Changes For the individual income tax, the most significant change occurring in 1993 was the increase in the working family credit (WFC) from 10 percent to 15 percent of the federal earned income tax credit (EITC). The WFC was also expanded in 1994 as a result of adopting federal changes which broadened the base of the EITC. As part of the 1994 federal update, Minnesota conformed to individual income tax changes made at the federal level. In addition to the EITC changes, the state adopted the provisions which increased taxes on social security income for higher income taxpayers. (At higher incomes, the maximum amount of social security income included in the tax base was increased from 50 percent to 85 percent.) To offset a portion of the impact of this change, Minnesota expanded the income tax subtraction for the elderly in 1994. In addition, the state child and dependent care credit was also expanded to allow credit for up to $2,400 of deemed expenses for married couples with a child less than one year of age. For sales and excise taxes, only a small number of significant tax base changes were made between 1992 and 1994. Purchases made by local governments became subject to sales tax effective June 1, 1992. A 1994 legislative session change began a phase-down of the sales tax rate on replacement capital equipment for purchases after June 30, 1994. For the excise tax on cigarettes, a five cent increase in the rate became effective July 1, 1992.39 Numerous state legislative changes in the property tax system were made between 1992 and 1994. For residential property, the class rate on the top tier of homestead market value was reduced from the 2.5 percent rate in effect for taxes payable in 1992 to 2.0 percent for taxes payable in 1994. Various other class rate changes, mainly reductions, also occurred during that time period. For example the class rate for commercial and industrial property market value over $100,000 was reduced from 4.75 percent to 4.60 percent. Other changes, most notably changes in local government aid payments and local budget decisions, also affected the amount of total property tax paid through changes in local property tax rates.
39 The two percent gross receipts tax on hospitals and health care providers was not in effect in 1992. Due to the lack of information, these MinnesotaCare taxes are not included in the 1994 projections.
81
1994 Projections Table 8-1 compares the tax incidence study results for 1992 with the projected effective tax rates for 1994. Compared to 1992, the individual income tax changes projected through 1994 added to the progressivity of the tax. Effective tax rates in the second through the fifth deciles dropped 0.2 percentage points; the drop in the first decile was 0.1. These reductions in effective tax rates are due to low income tax relief provided since 1992, primarily changes which increased the working family credit. However, because the net reduction was relatively small, the overall effective income tax rate did not change. The 1994 projection of overall effective tax rates for sales and excise taxes showed only small increases due to legislative changes. For total local property taxes, the overall effective tax rate for all taxpayers increased from 3.5 percent in 1992 to 3.7 percent under the 1994 projections. The property tax increases are distributed across all deciles and are due primarily to overall local tax rate increases. As shown in Table 8-1, the effective rate for homeowners was 2.1 percent for 1994, an increase of 0.2 percentage points over the 1992 level. Homeowner property taxes showed the highest percentage increase for 1994, compared to other tax categories. The effective tax rate for nonresidential property taxes (business taxes) increased by 0.1 percentage points to 1.5 percent for 1994. The effective tax rate for property tax on renters declined 0.1 percentage points to 1.6 percent for 1994, as actual renter taxes decreased due to class rate changes. Together, these changes added to the regressivity of total property taxes. The projected 1994 overall effective tax rate for total state and local taxes increased to 12.3 percent from 12.1 percent for 1992. The net impact of structural changes in the state and local tax system through 1994 on the distribution of tax burdens, as measured by the Suits index, is a slight increase in regressivity. Overall, the Suits index changed from -0.0133 to -0.0136. In summary, the results of this exercise suggest that legislated changes at the state level and local property tax rate changes at the local level, taken in isolation from economic changes, resulted in only a small increase in the regressivity of Minnesota’s state and local tax structure. The actual change in effective tax rates from 1992 to 1994 (to be reported in the next tax incidence study) will reflect both structural and economic changes.

Table 8-1 Comparison of Effective Tax Rates:
1992 Tax Incidence Study Results and 1994 Projections Consumer Population Individual Income Tax Sales and Excise Taxes Homeowner Property Tax Renters Property Tax
Decile Income Range 1992 1994 Change 1992 1994 Change 1992 1994 Change 1992 1994 Change First Second Third Fourth Fifth Sixth Seventh Eighth Ninth Tenth
$5,542 & Under 5,543 - 9,092 9,093 - 13,332 13,333 - 17,879 17,880 - 23,335 23,336 - 30,079 30,080 - 38,290 38,291 - 48,819 48,820 - 66,630 $66,631 & Over
-0.1% 0.2 1.0 1.7 2.4 3.0 3.5 4.1 4.6 5.8
-0.2% 0.0 0.8 1.5 2.2 3.0 3.5 4.1 4.6 5.8
-0.1% -0.2 -0.2 -0.2 -0.2 0.0 0.0 0.0 0.0 0.0
6.5% 4.5 4.1 3.7 3.4 3.0 2.8 2.5 2.3 1.4
6.7% 4.7 4.1 3.9 3.5 3.1 2.8 2.6 2.3 1.4
0.2% 0.2 0.0 0.2 0.1 0.1 0.0 0.1 0.0 0.0
9.7% 6.1 3.7 3.2 2.9 2.5 2.1 2.0 1.9 1.5
11.7% 6.4 4.0 3.4 3.1 2.7 2.4 2.2 2.1 1.6
2.0% 0.3 0.3 0.2 0.2 0.2 0.3 0.2 0.2 0.1
2.1% 1.3 1.8 2.0 2.1 2.0 2.1 1.4 1.2 1.0
1.9% 1.1 1.7 1.9 2.0 1.9 2.0 1.4 1.2 0.9
-0.2% -0.2 -0.1 -0.1 -0.1 -0.1 -0.1 0.0 0.0
-0.1 Total 4.2% 4.2% 0.0% 2.4% 2.4% 0.0% 1.9% 2.1% 0.2% 1.7% 1.6% -0.1% 82
Total State and Population Business Property Taxes Total Property Tax Total State Taxes Local Taxes
Decile Income Range 1992 1994 Change 1992 1994 Change 1992 1994 Change 1992 1994 Change First Second Third Fourth Fifth Sixth Seventh Eighth Ninth Tenth
$5,542 & Under 5,543 - 9,092 9,093 - 13,332 13,333 - 17,879 17,880 - 23,335 23,336 - 30,079 30,080 - 38,290 38,291 - 48,819 48,820 - 66,630 $66,631 & Over
2.2% 1.8 2.1 1.7 1.5 1.5 1.5 1.3 1.2 1.3
2.4% 1.9 2.3 1.9 1.6 1.6 1.6 1.4 1.2 1.3
0.2% 0.1 0.2 0.2 0.1 0.1 0.1 0.1 0.0 0.0
5.1% 4.0 4.3 4.1 4.0 3.9 3.7 3.3 3.1 3.1
5.6% 4.2 4.5 4.3 4.2 4.2 4.0 3.6 3.4 3.3
0.5% 0.2 0.2 0.2 0.2 0.3 0.3 0.3 0.3 0.2
11.0% 8.0 7.8 8.1 8.2 8.4 8.5 8.7 8.8 8.7
11.0% 7.8 7.7 8.0 8.1 8.4 8.5 8.8 8.9 8.8
0.0% -0.2 -0.1 -0.1 -0.1 0.0 0.0 0.1 0.1 0.1
16.1% 12.0 12.1 12.1 12.2 12.3 12.2 12.0 11.9 11.9
16.6% 12.0 12.2 12.2 12.3 12.6 12.5 12.4 12.2 12.0
0.5% 0.0 0.1 0.1 0.1 0.3 0.3 0.4 0.3 0.1
Total 1.4% 1.5% 0.1% 3.5% 3.7% 0.2% 8.6% 8.6% 0.0% 12.1% 12.3% 0.2% NOTE: Effective tax rates shown are for all taxpayers except for homeowner and renter property taxes.
83
APPENDICES Appendix A compares the distribution of effective tax rates by population deciles used in this study to an alternative distribution by income deciles. Appendix B includes several tables that contain detailed information on the distribution of income, taxes and tax burdens by population deciles. These tables also provide breakdowns by types of taxpayers including homeowners, renters and other taxpayers. Appendix C includes tables showing household characteristics and representative tax burdens by household type distributed by the population deciles for all taxpayers used in the incidence study. Detailed information is shown for five household types, including single, retired elderly, single parent families, married families with children and married couples without children. Appendix D provides a summary table of the data items for each sample household. A copy of the legislative mandate for the tax incidence study is also included in Appendix E.


85
APPENDIX A
Distribution of Tax Burdens by Income Deciles
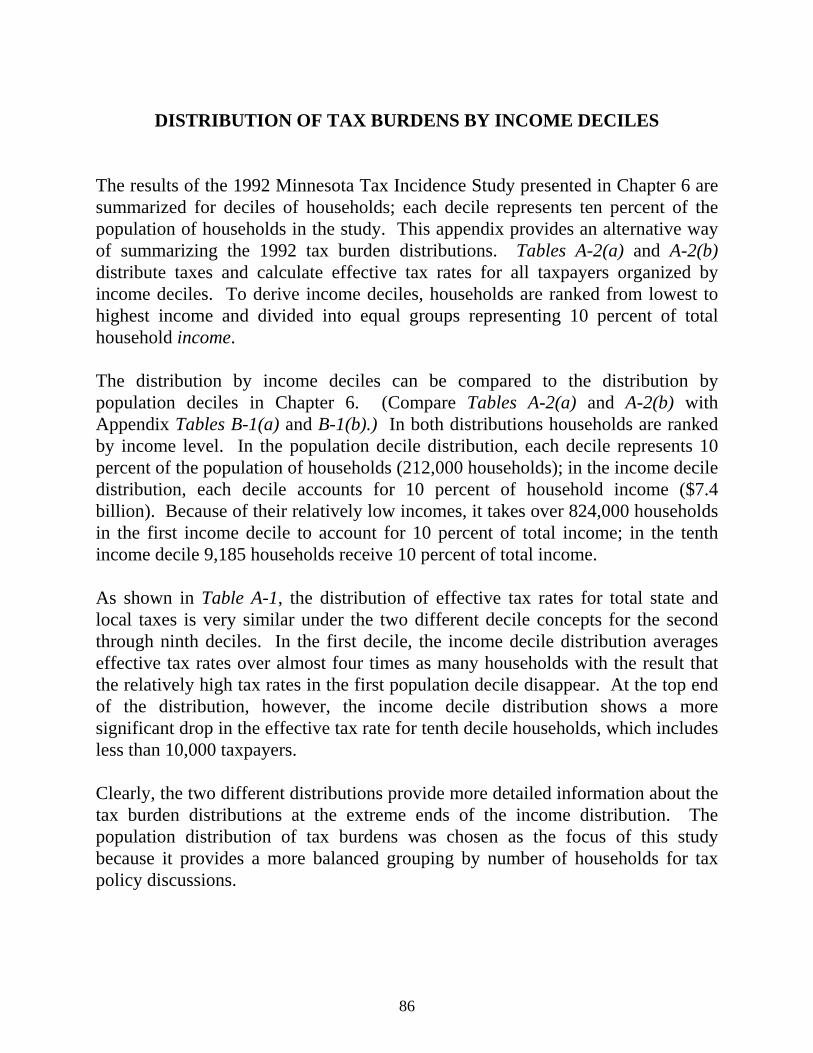
86
DISTRIBUTION OF TAX BURDENS BY INCOME DECILES The results of the 1992 Minnesota Tax Incidence Study presented in Chapter 6 are summarized for deciles of households; each decile represents ten percent of the population of households in the study. This appendix provides an alternative way of summarizing the 1992 tax burden distributions. Tables A-2(a) and A-2(b) distribute taxes and calculate effective tax rates for all taxpayers organized by income deciles. To derive income deciles, households are ranked from lowest to highest income and divided into equal groups representing 10 percent of total household income. The distribution by income deciles can be compared to the distribution by population deciles in Chapter 6. (Compare Tables A-2(a) and A-2(b) with Appendix Tables B-1(a) and B-1(b).) In both distributions households are ranked by income level. In the population decile distribution, each decile represents 10 percent of the population of households (212,000 households); in the income decile distribution, each decile accounts for 10 percent of household income ($7.4 billion). Because of their relatively low incomes, it takes over 824,000 households in the first income decile to account for 10 percent of total income; in the tenth income decile 9,185 households receive 10 percent of total income. As shown in Table A-1, the distribution of effective tax rates for total state and local taxes is very similar under the two different decile concepts for the second through ninth deciles. In the first decile, the income decile distribution averages effective tax rates over almost four times as many households with the result that the relatively high tax rates in the first population decile disappear. At the top end of the distribution, however, the income decile distribution shows a more significant drop in the effective tax rate for tenth decile households, which includes less than 10,000 taxpayers. Clearly, the two different distributions provide more detailed information about the tax burden distributions at the extreme ends of the income distribution. The population distribution of tax burdens was chosen as the focus of this study because it provides a more balanced grouping by number of households for tax policy discussions.

87
Table A-1 Effective 1992 Minnesota State and Local Tax Rates,
Comparison of Distributions by Population and Income Deciles
Effective Tax Rates
Decile Group Population Deciles Income Deciles
First Second Third Fourth Fifth Sixth Seventh Eighth Ninth Tenth
22.4% 12.0 12.1 12.1 12.2 12.3 12.2 12.0 11.9 11.9
12.9% 12.1 12.4 12.0 12.0 11.9 12.0 12.0 12.2 11.2
Totals
12.1%
12.1%
Top 5%
Top 1%
11.8%
11.6
10.9%
10.5%

1992 Minnesota Tax Incidence StudyTable A-2 (a) State and Local Tax Burden Amounts by Inocme Decile (dollars in thousands)
ALL TAXPAYERS
State Income Taxe s State Sales Tax State Excise Taxes Miscellaneous State Taxes Total State Ta xes Population Number of Hous ehold Individual Corporate Purchases by Purchases by Sales Tax Purchases by Purchases by Taxes on Taxes on Total on Total on State Taxes Dec ile Income Range Hous eholds Income Income Tax Franchise Tax Consumers Busines ses Total Consumers Busines ses Individua ls Businesses Individuals Bus iness es Tota l
First $17 ,312 & Under 824,315 $7,4 40,929 $73 ,121 $34,0 12 $215,56 0 $113,542 $329,1 02 $102,15 5 $20,592 $46,909 $11,573 $4 37,745 $179,719 $ 617,464 Second $17 ,313 - $26,562 343,912 7,4 36,922 $185 ,835 25,9 24 178,62 4 83,594 262,2 18 68,72 2 15,357 44,462 8,632 4 77,643 133,507 611,150 Third $26 ,563 - $35,162 241,600 7,4 34,106 248 ,526 23,6 08 159,70 1 76,519 236,2 20 55,77 9 13,806 42,823 8,445 5 06,829 122,378 629,207 Fourth $35 ,163 - $43,539 190,304 7,4 50,784 285 ,792 22,4 46 149,09 6 72,145 221,2 41 49,95 7 12,968 42,968 7,742 5 27,813 115,301 643,114 Fifth $43 ,540 - $52,990 155,279 7,4 36,633 321 ,275 21,1 32 139,69 1 67,641 207,3 32 42,34 9 12,265 41,638 7,268 5 44,953 108,306 653,259 Sixth $52 ,991 - $64,015 128,318 7,4 42,220 347 ,052 20,2 66 131,52 9 64,949 196,4 78 35,40 0 11,693 39,304 7,042 5 53,285 103,950 657,235 Seventh $64 ,016 - $80,030 104,968 7,4 41,105 369 ,179 19,3 42 122,72 1 62,413 185,1 34 29,41 0 11,154 35,944 6,923 5 57,254 99,832 657,086 Eighth $80 ,031 - $ 118,903 79,267 7,4 44,149 385 ,637 18,3 71 111,14 2 61,471 172,6 13 22,68 0 10,177 31,469 6,921 5 50,928 96,940 647,868 Ninth $118 ,904 - $ 311,880 43,819 7,4 41,727 440 ,309 16,3 41 89,29 5 60,194 149,4 89 13,59 2 8,472 23,965 6,877 5 67,161 91,884 659,045 Tenth $331 ,881 & Over 9,185 7,4 41,724 501 ,379 11,6 31 33,24 8 55,476 88,7 24 3,30 3 4,696 9,617 6,663 5 47,547 78,466 626,013
TOTALS 2 ,120,967 $74,4 10,299 $3,158 ,105 $213,0 73 $1,330,60 7 $717,944 $2,048,5 51 $423,34 7 $121,180 $359,099 $78,086 $5,2 71,158 $ 1,130,283 $6, 401,441
Top 5% $9 36,478 & Ove r 1,495 $3,7 19,944 $260 ,398 $4,9 24 $6,53 3 $27,235 $33,7 68 $58 7 $1,686 $2,416 $3,306 $2 69,934 $37,151 $ 307,085 Top 1% $13,5 61,320 & Ove r 27 $7 39,650 $56 ,599 $5 76 $12 3 $4,149 $4,2 72 $1 0 $167 $60 $505 $ 56,792 $5,397 $62,189
Reside ntial Local Property Ta xes Nonresidential Local Property Total State and Population Number of Hous ehold Homeowners Renters Owners of Tota l on Se asonal/ Residential Local Property Tax es Local Property Dec ile Income Range Hous eholds Income a fte r PTR after PTR Rental Prop. Rental Prop. Recreational Total Ta xes Total Taxes
First $17 ,312 & Under 824,315 $7,4 40,929 $109 ,697 $58,5 57 $11,38 4 $69,941 $6,4 41 $186,07 9 $159,596 $345,675 $9 63,139 Second $17 ,313 - $26,562 343,912 7,4 36,922 110 ,603 56,3 96 6,31 0 62,706 8,4 25 181,73 4 110,236 291,970 9 03,120 Third $26 ,563 - $35,162 241,600 7,4 34,106 117 ,625 43,9 36 7,00 7 50,943 8,9 25 177,49 3 115,931 293,424 9 22,631 Fourth $35 ,163 - $43,539 190,304 7,4 50,784 115 ,513 22,7 17 7,50 4 30,221 7,7 27 153,46 1 97,414 250,875 8 93,989 Fifth $43 ,540 - $52,990 155,279 7,4 36,633 122 ,712 12,1 12 6,65 6 18,768 7,8 76 149,35 6 89,738 239,094 8 92,353 Sixth $52 ,991 - $64,015 128,318 7,4 42,220 120 ,133 7,1 17 7,05 1 14,168 8,9 70 143,27 1 86,935 230,206 8 87,441 Seventh $64 ,016 - $80,030 104,968 7,4 41,105 124 ,014 4,9 57 7,37 1 12,328 8,8 53 145,19 5 88,885 234,080 8 91,166 Eighth $80 ,031 - $ 118,903 79,267 7,4 44,149 127 ,483 4,5 28 13,25 4 17,782 8,2 10 153,47 5 91,709 245,184 8 93,052 Ninth $118 ,904 - $ 311,880 43,819 7,4 41,727 118 ,324 3,9 43 25,44 1 29,384 6,7 02 154,41 0 96,104 250,514 9 09,559 Tenth $331 ,881 & Over 9,185 7,4 41,724 49 ,004 1,7 51 48,81 6 50,567 2,0 17 101,58 8 107,332 208,920 8 34,933
TOTALS 2 ,120,967 $74,4 10,299 $1,115 ,108 $216,0 14 $140,79 4 $356,808 $74,1 46 $1,546,06 2 $1,043,880 $ 2,589,942 $8,9 91,383
Top 5% $9 36,478 & Ove r 1,495 $3,7 19,944 $11 ,724 $3 56 $29,34 8 $29,704 $3 37 $41,76 5 $56,060 $97,825 $4 04,910 Top 1% $13,5 61,320 & Ove r 27 $7 39,650 $523 $0 $5,44 0 $5,440 $7 $5,97 0 $9,173 $15,143 $ 77,332
88

1992 Minnesota Tax Incidence StudyTable A-2 (b) Effective Tax Rates by Income Decile
ALL TAXPAYERS
State Income Taxe s State Sales Tax State Excise Taxes Miscellaneous State Taxes Total State Ta xes Population Number of Hous ehold Individual Corporate Purchases by Purchases by Sales Tax Purchases by Purchases by Taxes on Taxes on Total on Total on State Taxes Dec ile Income Range Hous eholds Income Income Tax Franchise Tax Consumers Busines ses Total Consumers Busines ses Individua ls Businesses Individuals Bus iness es Tota l
First $17 ,312 & Under 824,315 $7,4 40,929 1.0% 0.5% 2.9% 1.5% 4.4% 1.4% 0.3% 0 .6% 0.2 % 5.9% 2 .4% 8.3 % Second $17 ,313 - $26,562 343,912 7,4 36,922 2.5% 0.3% 2.4% 1.1% 3.5% 0.9% 0.2% 0 .6% 0.1 % 6.4% 1 .8% 8.2 % Third $26 ,563 - $35,162 241,600 7,4 34,106 3.3% 0.3% 2.1% 1.0% 3.2% 0.8% 0.2% 0 .6% 0.1 % 6.8% 1 .6% 8.5 % Fourth $35 ,163 - $43,539 190,304 7,4 50,784 3.8% 0.3% 2.0% 1.0% 3.0% 0.7% 0.2% 0 .6% 0.1 % 7.1% 1 .5% 8.6 % Fifth $43 ,540 - $52,990 155,279 7,4 36,633 4.3% 0.3% 1.9% 0.9% 2.8% 0.6% 0.2% 0 .6% 0.1 % 7.3% 1 .5% 8.8 % Sixth $52 ,991 - $64,015 128,318 7,4 42,220 4.7% 0.3% 1.8% 0.9% 2.6% 0.5% 0.2% 0 .5% 0.1 % 7.4% 1 .4% 8.8 % Seventh $64 ,016 - $80,030 104,968 7,4 41,105 5.0% 0.3% 1.6% 0.8% 2.5% 0.4% 0.1% 0 .5% 0.1 % 7.5% 1 .3% 8.8 % Eighth $80 ,031 - $ 118,903 79,267 7,4 44,149 5.2% 0.2% 1.5% 0.8% 2.3% 0.3% 0.1% 0 .4% 0.1 % 7.4% 1 .3% 8.7 % Ninth $118 ,904 - $ 311,880 43,819 7,4 41,727 5.9% 0.2% 1.2% 0.8% 2.0% 0.2% 0.1% 0 .3% 0.1 % 7.6% 1 .2% 8.9 % Tenth $331 ,881 & Over 9,185 7,4 41,724 6.7% 0.2% 0.4% 0.7% 1.2% 0.0% 0.1% 0 .1% 0.1 % 7.4% 1 .1% 8.4 %
TOTALS 2 ,120,967 $74,4 10,299 4.2% 0.3% 1.8% 1.0% 2.8% 0.6% 0.2% 0 .5% 0.1 % 7.1% 1 .5% 8.6 %
Top 5% $9 36,478 & Ove r 1,495 $3,7 19,944 7.0% 0.1% 0.2% 0.7% 0.9% 0.0% 0.0% 0 .1% 0.1 % 7.3% 1 .0% 8.3 % Top 1% $13,5 61,320 & Ove r 27 $7 39,650 7.7% 0.1% 0.0% 0.6% 0.6% 0.0% 0.0% 0 .0% 0.1 % 7.7% 0 .7% 8.4 %
Reside ntial Local Property Ta xes Nonresidential Local Property Total State and Population Number of Hous ehold Homeowners Renters Owners of Tota l on Se asonal/ Residential Local Property Tax es Local Property Dec ile Income Range Hous eholds Income a fte r PTR after PTR Rental Prop. Rental Prop. Recreational Total Ta xes Total Taxes
First $17 ,312 & Under 824,315 $7,4 40,929 1.5% 0.8% 0.2% 0.9% 0.1% 2.5% 2.1% 4 .6% 12.9% Second $17 ,313 - $26,562 343,912 7,4 36,922 1.5% 0.8% 0.1% 0.8% 0.1% 2.4% 1.5% 3 .9% 12.1% Third $26 ,563 - $35,162 241,600 7,4 34,106 1.6% 0.6% 0.1% 0.7% 0.1% 2.4% 1.6% 3 .9% 12.4% Fourth $35 ,163 - $43,539 190,304 7,4 50,784 1.6% 0.3% 0.1% 0.4% 0.1% 2.1% 1.3% 3 .4% 12.0% Fifth $43 ,540 - $52,990 155,279 7,4 36,633 1.7% 0.2% 0.1% 0.3% 0.1% 2.0% 1.2% 3 .2% 12.0% Sixth $52 ,991 - $64,015 128,318 7,4 42,220 1.6% 0.1% 0.1% 0.2% 0.1% 1.9% 1.2% 3 .1% 11.9% Seventh $64 ,016 - $80,030 104,968 7,4 41,105 1.7% 0.1% 0.1% 0.2% 0.1% 2.0% 1.2% 3 .1% 12.0% Eighth $80 ,031 - $ 118,903 79,267 7,4 44,149 1.7% 0.1% 0.2% 0.2% 0.1% 2.1% 1.2% 3 .3% 12.0% Ninth $118 ,904 - $ 311,880 43,819 7,4 41,727 1.6% 0.1% 0.3% 0.4% 0.1% 2.1% 1.3% 3 .4% 12.2% Tenth $331 ,881 & Over 9,185 7,4 41,724 0.7% 0.0% 0.7% 0.7% 0.0% 1.4% 1.4% 2 .8% 11.2%
TOTALS 2 ,120,967 $74,4 10,299 1.5% 0.3% 0.2% 0.5% 0.1% 2.1% 1.4% 3 .5% 12.1%
Top 5% $9 36,478 & Ove r 1,495 $3,7 19,944 0.3% 0.0% 0.8% 0.8% 0.0% 1.1% 1.5% 2 .6% 10.9% Top 1% $13,5 61,320 & Ove r 27 $7 39,650 0.1% 0.0% 0.7% 0.7% 0.0% 0.8% 1.2% 2 .0% 10.5%
89


91
APPENDIX B
Minnesota Tax Burden Amounts
by Population Decile

1992 Minnesota Tax Incidence StudyTable B-1 (a) State and Local Tax Burden Amounts by Population Decile (dollars in thousands)
ALL TAXPAYERS
State I ncome Taxes Sta te Sales Tax Sta te Excise Taxes Misc ellane ous State Ta xes Total State Taxe s Population Numbe r of House hold Individual Corpora te Purchases by Purchases by Sa les Tax Purchas es by Purc hases by Taxes on Ta xes on Total on Total on State Taxe s Decil e Income Range House holds Income Income Tax Franchise Tax Cons umers Business es Tota l Consumers Businesses Individuals Businesses Individuals Business es Tota l
Firs t $6,3 84 & Under 2 12,025 $636 ,380 - $ 453 $4,65 2 $27,493 $18,315 $45,808 $ 15,966 $ 2,819 $6, 716 $1,95 9 $49,722 $27,745 $77,467 Second $6,3 84 - $ 9,881 2 12,018 1,546 ,323 $3, 052 7,80 6 46,905 25,186 72,091 23,626 4,777 9, 331 2,29 0 82,914 40,059 122,973 Third $9,8 81 - $1 4,594 2 12,057 2,367 ,747 23, 034 10,21 6 65,309 33,605 98,914 29,844 6,234 13, 395 3,54 0 131,582 53,595 185,177 Fourth $14,5 94 - $1 9,609 2 12,256 3,313 ,731 56, 551 12,90 6 86,693 41,471 128,164 37,297 7,696 20, 066 4,31 0 200,607 66,383 266,990 Fifth $19,6 09 - $2 5,421 2 12,101 4,334 ,693 101, 952 15,37 9 106,134 49,601 155,735 41,819 9,145 26, 257 5,11 4 276,162 79,239 355,401 Sixth $25,4 21 - $3 2,108 2 12,079 5,632 ,328 170, 649 18,71 9 126,596 60,068 186,664 45,207 1 0,867 32, 437 6,42 6 374,889 96,080 470,969 Seventh $32,1 08 - $4 0,785 2 12,032 7,218 ,796 252, 551 22,06 8 150,780 71,575 222,355 52,157 1 3,075 41, 981 7,81 3 497,469 114,531 612,000 Eighth $40,7 85 - $5 2,073 2 12,023 9,158 ,399 373, 685 27,03 0 177,578 87,204 264,782 56,927 1 5,517 51, 991 9,39 2 660,181 139,143 799,324 Ninth $52,0 73 - $7 0,567 2 12,242 12,073 ,769 556, 740 32,91 8 214,532 105,242 319,774 58,432 1 9,061 64, 196 11,39 8 893,900 168,619 1 ,062,519 Tenth $70,5 67 & Over 2 12,134 28,128 ,131 1,620, 343 61,38 0 328,590 225,678 554,268 62,073 3 1,984 92, 730 25,83 9 2,103,736 344,881 2 ,448,617
TOTALS 2,1 20,967 $74,410 ,297 $3,158, 104 $213,07 4 $1,330,610 $717,945 $2 ,048,555 $4 23,348 $12 1,175 $359, 100 $78,08 1 $5,271,162 $ 1,130,275 $6 ,401,437
Top 5% $92,1 67 & Over 1 06,085 $20,147 ,382 $1,218, 524 $40,85 4 $199,692 $159,192 $ 358,884 $ 32,150 $2 0,241 $55, 344 $18,51 7 $1,505,710 $238,804 $1 ,744,514 Top 1% $206,8 69 & Over 21,218 $10,266 ,670 $681, 160 $17,51 2 $63,617 $78,299 $ 141,916 $7,206 $ 7,624 $17, 472 $9,29 2 $769,455 $112,727 $ 882,182
Residential Local Prope rty Taxes Nonresidential Loca l Property Tota l State and Population Numbe r of House hold Homeowners Renters Owners of Total on Seasonal / Res idential Loc al Property Taxes Local Property Decil e Income Range House holds Income after PTR after PTR Rental Prop. Renta l Prop. Recreationa l Total Taxes Total Ta xes
Firs t $6,3 84 & Under 2 12,025 $636 ,380 $19, 188 $5,70 9 $6,454 $12,163 $1,077 $ 32,428 $3 2,432 $64, 860 $142,327 Second $6,3 84 - $ 9,881 2 12,018 1,546 ,323 23, 171 9,26 0 989 10,249 1,029 34,449 2 7,590 62, 039 185,012 Third $9,8 81 - $1 4,594 2 12,057 2,367 ,747 27, 734 19,94 2 2,044 21,986 1,626 51,346 4 9,626 100, 972 286,149 Fourth $14,5 94 - $1 9,609 2 12,256 3,313 ,731 45, 113 27,26 5 2,158 29,423 3,116 77,652 5 7,064 134, 716 401,706 Fifth $19,6 09 - $2 5,421 2 12,101 4,334 ,693 64, 646 33,40 8 3,520 36,928 4,876 1 06,450 6 6,038 172, 488 527,889 Sixth $25,4 21 - $3 2,108 2 12,079 5,632 ,328 86, 389 39,67 5 5,049 44,724 6,590 1 37,703 8 3,577 221, 280 692,249 Seventh $32,1 08 - $4 0,785 2 12,032 7,218 ,796 113, 508 34,20 5 6,122 40,327 8,504 1 62,339 10 5,530 267, 869 879,869 Eighth $40,7 85 - $5 2,073 2 12,023 9,158 ,399 145, 979 20,81 4 10,396 31,210 9,358 1 86,547 11 7,559 304, 106 1,103,430 Ninth $52,0 73 - $7 0,567 2 12,242 12,073 ,769 199, 811 11,68 9 10,567 22,256 14,256 2 36,323 14 0,696 377, 019 1,439,538 Tenth $70,5 67 & Over 2 12,134 28,128 ,131 389, 570 14,04 6 93,496 107,542 23,713 5 20,825 36 3,768 884, 593 3,333,210
TOTALS 2,1 20,967 $74,410 ,297 $1,115, 109 $216,01 3 $140,795 $356,808 $74,145 $1,5 46,062 $1,04 3,880 $2,589, 942 $8,991,379
Top 5% $92,1 67 & Over 1 06,085 $20,147 ,382 $255, 704 $8,91 3 $84,459 $93,372 $14,546 $3 63,622 $27 1,519 $635, 141 $2,379,655 Top 1% $206,8 69 & Over 21,218 $10,266 ,670 $90, 803 $3,26 0 $60,827 $64,087 $4,342 $1 59,232 $14 5,094 $304, 326 $1,186,508
92
See Notes at end of Appendix C.

1992 Minnesota Tax Incidence StudyTable B-1 (b) Effective Tax Rates by Population Decile
ALL TAXPAYERS
State I ncome Taxes Sta te Sales Tax Sta te Excise Taxes Misc ellane ous State Ta xes Total State Taxe s Population Numbe r of House hold Individual Corpora te Purchases by Purchases by Sa les Tax Purchas es by Purc hases by Taxes on Ta xes on Total on Total on State Taxe s Decil e Income Range House holds Income Income Tax Franchise Tax Cons umers Business es Tota l Consumers Businesses Individuals Businesses Individuals Business es Tota l
Firs t $6,3 84 & Under 2 12,025 $636 ,380 - 0.1% 0.7% 4.3% 2 .9% 7. 2% 2.5% 0.4% 1.1% 0.3% 7.8% 4.4% 12. 2% Second $6,3 84 - $ 9,881 2 12,018 1,546 ,323 0.2% 0.5% 3.0% 1 .6% 4. 7% 1.5% 0.3% 0.6% 0.1% 5.4% 2.6% 8. 0% Third $9,8 81 - $1 4,594 2 12,057 2,367 ,747 1.0% 0.4% 2.8% 1 .4% 4. 2% 1.3% 0.3% 0.6% 0.1% 5.6% 2.3% 7. 8% Fourth $14,5 94 - $1 9,609 2 12,256 3,313 ,731 1.7% 0.4% 2.6% 1 .3% 3. 9% 1.1% 0.2% 0.6% 0.1% 6.1% 2.0% 8. 1% Fifth $19,6 09 - $2 5,421 2 12,101 4,334 ,693 2.4% 0.4% 2.4% 1 .1% 3. 6% 1.0% 0.2% 0.6% 0.1% 6.4% 1.8% 8. 2% Sixth $25,4 21 - $3 2,108 2 12,079 5,632 ,328 3.0% 0.3% 2.2% 1 .1% 3. 3% 0.8% 0.2% 0.6% 0.1% 6.7% 1.7% 8. 4% Seventh $32,1 08 - $4 0,785 2 12,032 7,218 ,796 3.5% 0.3% 2.1% 1 .0% 3. 1% 0.7% 0.2% 0.6% 0.1% 6.9% 1.6% 8. 5% Eighth $40,7 85 - $5 2,073 2 12,023 9,158 ,399 4.1% 0.3% 1.9% 1 .0% 2. 9% 0.6% 0.2% 0.6% 0.1% 7.2% 1.5% 8. 7% Ninth $52,0 73 - $7 0,567 2 12,242 12,073 ,769 4.6% 0.3% 1.8% 0 .9% 2. 6% 0.5% 0.2% 0.5% 0.1% 7.4% 1.4% 8. 8% Tenth $70,5 67 & Over 2 12,134 28,128 ,131 5.8% 0.2% 1.2% 0 .8% 2. 0% 0.2% 0.1% 0.3% 0.1% 7.5% 1.2% 8. 7%
TOTALS 2,1 20,967 $74,410 ,297 4.2% 0.3% 1.8% 1 .0% 2. 8% 0.6% 0.2% 0.5% 0.1% 7.1% 1.5% 8. 6%
Top 5% $92,1 67 & Over 1 06,085 $20,147 ,382 6.0% 0.2% 1.0% 0 .8% 1. 8% 0.2% 0.1% 0.3% 0.1% 7.5% 1.2% 8. 7% Top 1% $206,8 69 & Over 21,218 $10,266 ,670 6.6% 0.2% 0.6% 0 .8% 1. 4% 0.1% 0.1% 0.2% 0.1% 7.5% 1.1% 8. 6%
Residential Local Prope rty Taxes Nonresidential Loca l Property Tota l State and Population Numbe r of House hold Homeowners Renters Owners of Total on Seasonal / Res idential Loc al Property Taxes Local Property Decil e Income Range House holds Income after PTR after PTR Rental Prop. Renta l Prop. Recreationa l Total Taxes Total Ta xes
Firs t $6,3 84 & Under 2 12,025 $636 ,380 3.0% 0.9% 1.0% 1 .9% 0. 2% 5.1% 5.1% 10.2% 22.4% Second $6,3 84 - $ 9,881 2 12,018 1,546 ,323 1.5% 0.6% 0.1% 0 .7% 0. 1% 2.2% 1.8% 4.0% 12.0% Third $9,8 81 - $1 4,594 2 12,057 2,367 ,747 1.2% 0.8% 0.1% 0 .9% 0. 1% 2.2% 2.1% 4.3% 12.1% Fourth $14,5 94 - $1 9,609 2 12,256 3,313 ,731 1.4% 0.8% 0.1% 0 .9% 0. 1% 2.3% 1.7% 4.1% 12.1% Fifth $19,6 09 - $2 5,421 2 12,101 4,334 ,693 1.5% 0.8% 0.1% 0 .9% 0. 1% 2.5% 1.5% 4.0% 12.2% Sixth $25,4 21 - $3 2,108 2 12,079 5,632 ,328 1.5% 0.7% 0.1% 0 .8% 0. 1% 2.4% 1.5% 3.9% 12.3% Seventh $32,1 08 - $4 0,785 2 12,032 7,218 ,796 1.6% 0.5% 0.1% 0 .6% 0. 1% 2.2% 1.5% 3.7% 12.2% Eighth $40,7 85 - $5 2,073 2 12,023 9,158 ,399 1.6% 0.2% 0.1% 0 .3% 0. 1% 2.0% 1.3% 3.3% 12.0% Ninth $52,0 73 - $7 0,567 2 12,242 12,073 ,769 1.7% 0.1% 0.1% 0 .2% 0. 1% 2.0% 1.2% 3.1% 11.9% Tenth $70,5 67 & Over 2 12,134 28,128 ,131 1.4% 0.0% 0.3% 0 .4% 0. 1% 1.9% 1.3% 3.1% 11.9%
TOTALS 2,1 20,967 $74,410 ,297 1.5% 0.3% 0.2% 0 .5% 0. 1% 2.1% 1.4% 3.5% 12.1%
Top 5% $92,1 67 & Over 1 06,085 $20,147 ,382 1.3% 0.0% 0.4% 0 .5% 0. 1% 1.8% 1.3% 3.2% 11.8% Top 1% $206,8 69 & Over 21,218 $10,266 ,670 0.9% 0.0% 0.6% 0 .6% 0. 0% 1.6% 1.4% 3.0% 11.6%
93

1992 Minnesota Tax Incidence StudyTable B-2 (a) State and Local Tax Burden Amounts by Population Decile (dollars in thousands)
HOMEOWNERS (excluding farmers)
State I ncome Taxes Sta te Sales Tax Sta te Excise Taxes Misc ellane ous State Ta xes Total State Taxe s Population Numbe r of House hold Individual Corpora te Purchases by Purchases by Sa les Tax Purchas es by Purc hases by Taxes on Ta xes on Total on Total on State Taxe s Decil e Income Range House holds Income Income Tax Franchise Tax Cons umers Business es Tota l Consumers Businesses Individuals Businesses Individuals Business es Tota l
Firs t $6,3 84 & Under 32,716 $103 ,326 - $95 $79 0 $4,404 $4,761 $9,165 $2,430 $453 $1, 329 $49 7 $8,068 $6,501 $14,569 Second $6,3 84 - $ 9,881 45,804 341 ,068 - $ 282 1,70 7 10,193 5,681 15,874 4,748 1,043 2, 307 49 5 16,966 8,926 25,892 Third $9,8 81 - $1 4,594 57,202 644 ,577 1, 687 2,72 4 17,137 9,105 26,242 6,988 1,658 3, 723 83 6 29,535 14,323 43,858 Fourth $14,5 94 - $1 9,609 81,002 1,267 ,463 11, 887 5,11 8 33,573 16,474 50,047 13,576 2,976 8, 529 1,61 8 67,565 26,186 93,751 Fifth $19,6 09 - $2 5,421 1 03,628 2,127 ,975 38, 192 7,68 3 52,705 24,751 77,456 20,037 4,532 13, 849 2,35 0 124,783 39,316 164,099 Sixth $25,4 21 - $3 2,108 1 23,195 3,285 ,211 85, 686 11,07 7 74,570 35,452 110,022 26,079 6,360 20, 111 3,57 3 206,446 56,462 262,908 Seventh $32,1 08 - $4 0,785 1 48,441 5,066 ,785 164, 723 15,65 8 107,076 50,312 157,388 37,376 9,252 31, 176 5,09 9 340,351 80,321 420,672 Eighth $40,7 85 - $5 2,073 1 64,179 7,115 ,516 284, 536 20,91 5 138,570 67,211 205,781 44,500 1 2,118 41, 579 6,81 8 509,185 107,062 616,247 Ninth $52,0 73 - $7 0,567 1 85,568 10,561 ,544 486, 238 28,84 6 188,061 90,873 278,934 51,553 1 6,718 56, 756 9,43 2 782,608 145,869 928,477 Tenth $70,5 67 & Over 1 91,485 25,534 ,167 1,473, 666 55,57 6 297,871 202,390 500,261 56,511 2 9,094 84, 372 22,57 2 1,912,420 309,632 2 ,222,052
TOTALS 1,1 33,220 $56,047 ,632 $2,546, 238 $150,09 4 $924,160 $507,010 $1 ,431,170 $2 63,798 $8 4,204 $263, 731 $53,29 0 $3,997,927 $794,598 $4 ,792,525
Top 5% $92,1 67 & Over 96,222 $18,359 ,122 $1,113, 325 $37,09 2 $181,606 $143,507 $ 325,113 $ 29,318 $1 8,492 $50, 488 $16,35 3 $1,374,737 $215,444 $1 ,590,181 Top 1% $206,8 69 & Over 19,369 $9,403 ,029 $624, 637 $15,90 9 $58,182 $70,801 $ 128,983 $6,598 $ 6,997 $16, 054 $8,31 7 $705,471 $102,024 $ 807,495
Re sidential Local Property Taxe s Nonres idential Loc al Property Total State and Population Numbe r of House hold Total on Homeowners Owners of Seasonal/ Re sidentia l Local Property Taxes Local Property Decil e Income Range House holds Income Homeowners after PTR Rental Prop. Recreational Tota l Taxes Total Taxes
Firs t $6,3 84 & Under 32,716 $103 ,326 $18, 591 $15,72 6 $4,485 $1,077 $21,288 $8,724 $3 0,012 $44,58 1 Second $6,3 84 - $ 9,881 45,804 341 ,068 27, 012 20,92 5 602 1,029 22,556 5,632 2 8,188 54,08 0 Third $9,8 81 - $1 4,594 57,202 644 ,577 30, 916 23,85 3 1,033 1,626 26,512 9,728 3 6,240 80,09 8 Fourth $14,5 94 - $1 9,609 81,002 1,267 ,463 49, 651 40,60 7 1,420 3,116 45,143 19,549 6 4,692 158,44 3 Fifth $19,6 09 - $2 5,421 1 03,628 2,127 ,975 68, 362 60,77 5 2,278 4,876 67,929 25,921 9 3,850 257,94 9 Sixth $25,4 21 - $3 2,108 1 23,195 3,285 ,211 86, 789 81,17 8 3,620 6,590 91,388 41,792 13 3,180 396,08 8 Seventh $32,1 08 - $4 0,785 1 48,441 5,066 ,785 113, 463 108,23 5 4,571 8,504 121,310 59,390 18 0,700 601,37 2 Eighth $40,7 85 - $5 2,073 1 64,179 7,115 ,516 144, 522 140,87 0 8,117 9,358 158,345 75,203 23 3,548 849,79 5 Ninth $52,0 73 - $7 0,567 1 85,568 10,561 ,544 198, 348 195,66 6 7,825 14,256 217,747 1 04,513 32 2,260 1,250,73 7 Tenth $70,5 67 & Over 1 91,485 25,534 ,167 385, 435 384,53 9 82,121 23,713 490,373 3 01,464 79 1,837 3,013,88 9
TOTALS 1,1 33,220 $56,047 ,632 $1,123, 089 $1,072,37 4 $116,072 $74,145 $1 ,262,591 $6 51,916 $1,91 4,507 $6,707,03 2
Top 5% $92,1 67 & Over 96,222 $18,359 ,122 $253, 497 $253,02 7 $75,196 $14,546 $ 342,769 $2 31,010 $57 3,779 $2,163,96 0 Top 1% $206,8 69 & Over 19,369 $9,403 ,029 $90, 363 $90,24 2 $54,514 $4,342 $ 149,098 $1 27,926 $27 7,024 $1,084,51 9
94

1992 Minnesota Tax Incidence StudyTable B-2 (b) Effective Tax Rates by Population Decile
HOMEOWNERS (excluding farmers)
State I ncome Taxes Sta te Sales Tax Sta te Excise Taxes Misc ellane ous State Ta xes Total State Taxe s Population Numbe r of House hold Individual Corpora te Purchases by Purchases by Sa les Tax Purchas es by Purc hases by Taxes on Ta xes on Total on Total on State Taxe s Decil e Income Range House holds Income Income Tax Franchise Tax Cons umers Business es Tota l Consumers Businesses Individuals Businesses Individuals Business es Tota l
Firs t $6,3 84 & Under 32,716 $103 ,326 - 0.1% 0.8% 4.3% 4 .6% 8. 9% 2.4% 0.4% 1.3% 0.5% 7.8% 6.3% 14. 1% Second $6,3 84 - $ 9,881 45,804 341 ,068 - 0.1% 0.5% 3.0% 1 .7% 4. 7% 1.4% 0.3% 0.7% 0.1% 5.0% 2.6% 7. 6% Third $9,8 81 - $1 4,594 57,202 644 ,577 0.3% 0.4% 2.7% 1 .4% 4. 1% 1.1% 0.3% 0.6% 0.1% 4.6% 2.2% 6. 8% Fourth $14,5 94 - $1 9,609 81,002 1,267 ,463 0.9% 0.4% 2.6% 1 .3% 3. 9% 1.1% 0.2% 0.7% 0.1% 5.3% 2.1% 7. 4% Fifth $19,6 09 - $2 5,421 1 03,628 2,127 ,975 1.8% 0.4% 2.5% 1 .2% 3. 6% 0.9% 0.2% 0.7% 0.1% 5.9% 1.8% 7. 7% Sixth $25,4 21 - $3 2,108 1 23,195 3,285 ,211 2.6% 0.3% 2.3% 1 .1% 3. 3% 0.8% 0.2% 0.6% 0.1% 6.3% 1.7% 8. 0% Seventh $32,1 08 - $4 0,785 1 48,441 5,066 ,785 3.3% 0.3% 2.1% 1 .0% 3. 1% 0.7% 0.2% 0.6% 0.1% 6.7% 1.6% 8. 3% Eighth $40,7 85 - $5 2,073 1 64,179 7,115 ,516 4.0% 0.3% 1.9% 0 .9% 2. 9% 0.6% 0.2% 0.6% 0.1% 7.2% 1.5% 8. 7% Ninth $52,0 73 - $7 0,567 1 85,568 10,561 ,544 4.6% 0.3% 1.8% 0 .9% 2. 6% 0.5% 0.2% 0.5% 0.1% 7.4% 1.4% 8. 8% Tenth $70,5 67 & Over 1 91,485 25,534 ,167 5.8% 0.2% 1.2% 0 .8% 2. 0% 0.2% 0.1% 0.3% 0.1% 7.5% 1.2% 8. 7%
TOTALS 1,1 33,220 $56,047 ,632 4.5% 0.3% 1.6% 0 .9% 2. 6% 0.5% 0.2% 0.5% 0.1% 7.1% 1.4% 8. 6%
Top 5% $92,1 67 & Over 96,222 $18,359 ,122 6.1% 0.2% 1.0% 0 .8% 1. 8% 0.2% 0.1% 0.3% 0.1% 7.5% 1.2% 8. 7% Top 1% $206,8 69 & Over 19,369 $9,403 ,029 6.6% 0.2% 0.6% 0 .8% 1. 4% 0.1% 0.1% 0.2% 0.1% 7.5% 1.1% 8. 6%
Re sidential Local Property Taxe s Nonres idential Loc al Property Total State and Population Numbe r of House hold Total on Homeowners Owners of Seasonal/ Re sidentia l Local Property Taxes Local Property Decil e Income Range House holds Income Homeowners after PTR Rental Prop. Recreational Tota l Taxes Total Taxes
Firs t $6,3 84 & Under 32,716 $103 ,326 18.0% 15.2% 4.3% 1 .0% 20. 6% 8.4% 29.0% 43.1% Second $6,3 84 - $ 9,881 45,804 341 ,068 7.9% 6.1% 0.2% 0 .3% 6. 6% 1.7% 8.3% 15.9% Third $9,8 81 - $1 4,594 57,202 644 ,577 4.8% 3.7% 0.2% 0 .3% 4. 1% 1.5% 5.6% 12.4% Fourth $14,5 94 - $1 9,609 81,002 1,267 ,463 3.9% 3.2% 0.1% 0 .2% 3. 6% 1.5% 5.1% 12.5% Fifth $19,6 09 - $2 5,421 1 03,628 2,127 ,975 3.2% 2.9% 0.1% 0 .2% 3. 2% 1.2% 4.4% 12.1% Sixth $25,4 21 - $3 2,108 1 23,195 3,285 ,211 2.6% 2.5% 0.1% 0 .2% 2. 8% 1.3% 4.1% 12.1% Seventh $32,1 08 - $4 0,785 1 48,441 5,066 ,785 2.2% 2.1% 0.1% 0 .2% 2. 4% 1.2% 3.6% 11.9% Eighth $40,7 85 - $5 2,073 1 64,179 7,115 ,516 2.0% 2.0% 0.1% 0 .1% 2. 2% 1.1% 3.3% 11.9% Ninth $52,0 73 - $7 0,567 1 85,568 10,561 ,544 1.9% 1.9% 0.1% 0 .1% 2. 1% 1.0% 3.1% 11.8% Tenth $70,5 67 & Over 1 91,485 25,534 ,167 1.5% 1.5% 0.3% 0 .1% 1. 9% 1.2% 3.1% 11.8%
TOTALS 1,1 33,220 $56,047 ,632 2.0% 1.9% 0.2% 0 .1% 2. 3% 1.2% 3.4% 12.0%
Top 5% $92,1 67 & Over 96,222 $18,359 ,122 1.4% 1.4% 0.4% 0 .1% 1. 9% 1.3% 3.1% 11.8% Top 1% $206,8 69 & Over 19,369 $9,403 ,029 1.0% 1.0% 0.6% 0 .0% 1. 6% 1.4% 2.9% 11.5%
95

1992 Minnesota Tax Incidence StudyTable B-3 (a) State and Local Tax Burden Amounts by Population Decile (dollars in thousands)
RENTERS
State I ncome Taxes Sta te Sales Tax Sta te Excise Taxes Misc ellane ous State Ta xes Total State Taxe s Population Numbe r of House hold Individual Corpora te Purchases by Purchases by Sa les Tax Purchas es by Purc hases by Taxes on Ta xes on Total on Total on State Taxe s Decil e Income Range House holds Income Income Tax Franchise Tax Cons umers Business es Tota l Consumers Businesses Individuals Businesses Individuals Business es Tota l
Firs t $6,3 84 & Under 82,613 $265 ,268 - $25 $1,82 9 $11,038 $6,103 $17,141 $6,465 $ 1,120 $2, 366 $53 8 $19,844 $9,590 $29,434 Second $6,3 84 - $ 9,881 1 00,588 729 ,488 $1, 327 3,67 8 22,115 11,616 33,731 11,408 2,248 4, 030 1,00 2 38,880 18,544 57,424 Third $9,8 81 - $1 4,594 95,528 1,078 ,205 14, 393 4,63 2 29,792 14,593 44,385 14,058 2,812 5, 759 1,40 0 64,002 23,437 87,439 Fourth $14,5 94 - $1 9,609 88,878 1,389 ,016 33, 606 5,18 5 35,692 16,255 51,947 16,119 3,148 7, 365 1,53 0 92,782 26,118 118,900 Fifth $19,6 09 - $2 5,421 76,917 1,569 ,832 47, 733 5,33 7 37,460 16,781 54,241 15,287 3,219 8, 284 1,61 7 108,764 26,954 135,718 Sixth $25,4 21 - $3 2,108 75,111 1,982 ,544 76, 211 6,42 4 43,423 19,862 63,285 15,994 3,754 9, 862 1,97 8 145,490 32,018 177,508 Seventh $32,1 08 - $4 0,785 47,902 1,620 ,974 70, 694 4,78 7 32,475 14,844 47,319 10,888 2,830 7, 670 1,49 6 121,727 23,957 145,684 Eighth $40,7 85 - $5 2,073 34,723 1,484 ,722 66, 872 4,50 0 27,928 13,446 41,374 8,759 2,420 7, 052 1,44 1 110,611 21,807 132,418 Ninth $52,0 73 - $7 0,567 17,145 969 ,363 47, 006 2,61 3 16,840 8,375 25,215 4,316 1,482 4, 568 86 5 72,730 13,335 86,065 Tenth $70,5 67 & Over 11,508 1,444 ,975 82, 479 3,36 8 16,853 12,093 28,946 3,042 1,583 4, 325 1,43 4 106,699 18,478 125,177
TOTALS 6 30,913 $12,534 ,387 $440, 296 $42,35 3 $273,616 $133,968 $ 407,584 $1 06,336 $2 4,616 $61, 281 $13,30 1 $881,529 $214,238 $1 ,095,767
Top 5% $92,1 67 & Over 5,438 $990 ,253 $58, 737 $2,18 3 $9,802 $8,276 $18,078 $1,529 $943 $2, 475 $1,01 9 $72,543 $12,421 $84,964 Top 1% $206,8 69 & Over 1,022 $489 ,869 $31, 759 $94 1 $2,955 $4,007 $6,962 $326 $337 $ 741 $49 9 $35,781 $5,784 $41,565
Residential Loca l Property Taxes Nonre sidentia l Local Property Total State and Population Numbe r of House hold Total Renters Owners of Reside ntial Local Property Taxes Loca l Property Decil e Income Range House holds Income on Renters after PTR Rental Prop. Total Taxes Total Taxes
Firs t $6,3 84 & Under 82,613 $265 ,268 $14, 114 $5,70 9 $650 $6,359 $6,112 $ 12,471 $41, 905 Second $6,3 84 - $ 9,881 1 00,588 729 ,488 30, 576 9,26 0 117 9,377 10,581 19,958 77, 382 Third $9,8 81 - $1 4,594 95,528 1,078 ,205 36, 253 19,94 2 232 20,174 15,484 35,658 123, 097 Fourth $14,5 94 - $1 9,609 88,878 1,389 ,016 44, 209 27,26 5 359 27,624 15,746 43,370 162, 270 Fifth $19,6 09 - $2 5,421 76,917 1,569 ,832 45, 046 33,40 8 587 33,995 17,540 51,535 187, 253 Sixth $25,4 21 - $3 2,108 75,111 1,982 ,544 45, 697 39,67 5 779 40,454 20,376 60,830 238, 338 Seventh $32,1 08 - $4 0,785 47,902 1,620 ,974 35, 344 34,20 5 510 34,715 16,063 50,778 196, 462 Eighth $40,7 85 - $5 2,073 34,723 1,484 ,722 21, 105 20,81 4 664 21,478 15,605 37,083 169, 501 Ninth $52,0 73 - $7 0,567 17,145 969 ,363 11, 780 11,68 9 1,154 12,843 9,558 22,401 108, 466 Tenth $70,5 67 & Over 11,508 1,444 ,975 14, 056 14,04 6 5,338 19,384 20,424 39,808 164, 985
TOTALS 6 30,913 $12,534 ,387 $298, 180 $216,01 3 $10,390 $226,403 $ 147,489 $3 73,892 $1,469, 659
Top 5% $92,1 67 & Over 5,438 $990 ,253 $8, 913 $8,91 3 $4,644 $13,557 $15,462 $ 29,019 $113, 983 Top 1% $206,8 69 & Over 1,022 $489 ,869 $3, 260 $3,26 0 $3,222 $6,482 $7,762 $ 14,244 $55, 809
96
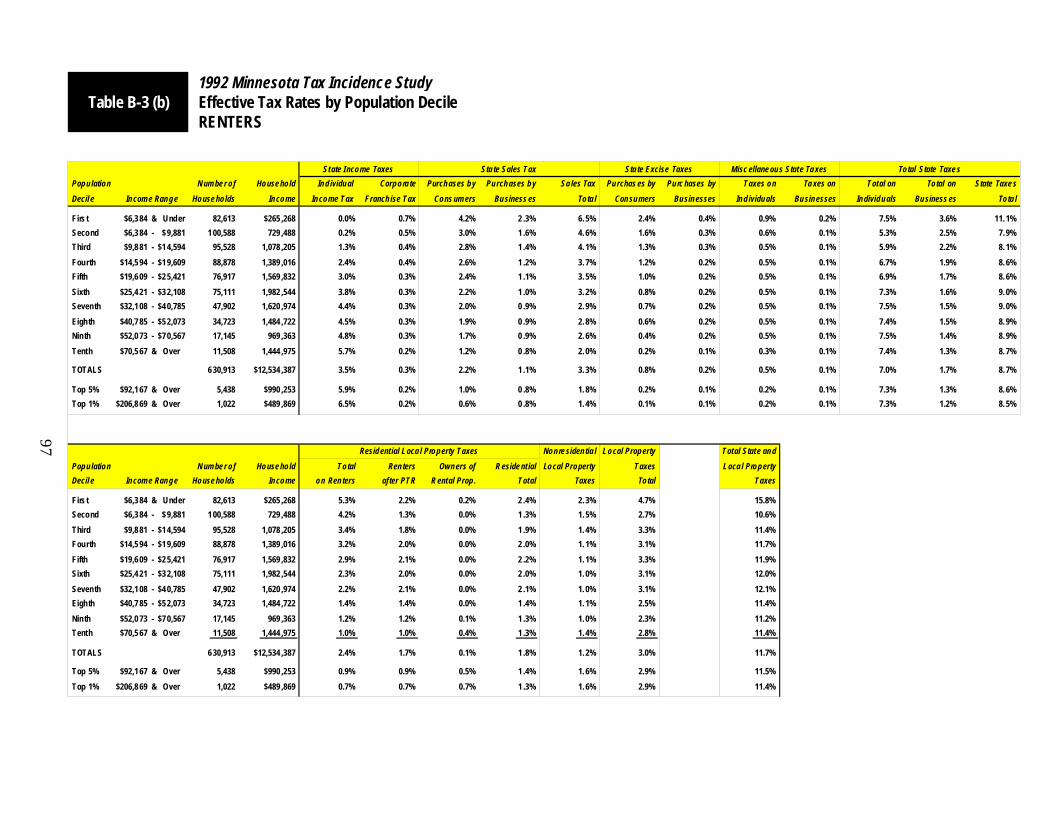
1992 Minnesota Tax Incidence StudyTable B-3 (b) Effective Tax Rates by Population Decile
RENTERS
State I ncome Taxes Sta te Sales Tax Sta te Excise Taxes Misc ellane ous State Ta xes Total State Taxe s Population Numbe r of House hold Individual Corpora te Purchases by Purchases by Sa les Tax Purchas es by Purc hases by Taxes on Ta xes on Total on Total on State Taxe s Decil e Income Range House holds Income Income Tax Franchise Tax Cons umers Business es Tota l Consumers Businesses Individuals Businesses Individuals Business es Tota l
Firs t $6,3 84 & Under 82,613 $265 ,268 0.0% 0.7% 4.2% 2 .3% 6. 5% 2.4% 0.4% 0.9% 0.2% 7.5% 3.6% 11. 1% Second $6,3 84 - $ 9,881 1 00,588 729 ,488 0.2% 0.5% 3.0% 1 .6% 4. 6% 1.6% 0.3% 0.6% 0.1% 5.3% 2.5% 7. 9% Third $9,8 81 - $1 4,594 95,528 1,078 ,205 1.3% 0.4% 2.8% 1 .4% 4. 1% 1.3% 0.3% 0.5% 0.1% 5.9% 2.2% 8. 1% Fourth $14,5 94 - $1 9,609 88,878 1,389 ,016 2.4% 0.4% 2.6% 1 .2% 3. 7% 1.2% 0.2% 0.5% 0.1% 6.7% 1.9% 8. 6% Fifth $19,6 09 - $2 5,421 76,917 1,569 ,832 3.0% 0.3% 2.4% 1 .1% 3. 5% 1.0% 0.2% 0.5% 0.1% 6.9% 1.7% 8. 6% Sixth $25,4 21 - $3 2,108 75,111 1,982 ,544 3.8% 0.3% 2.2% 1 .0% 3. 2% 0.8% 0.2% 0.5% 0.1% 7.3% 1.6% 9. 0% Seventh $32,1 08 - $4 0,785 47,902 1,620 ,974 4.4% 0.3% 2.0% 0 .9% 2. 9% 0.7% 0.2% 0.5% 0.1% 7.5% 1.5% 9. 0% Eighth $40,7 85 - $5 2,073 34,723 1,484 ,722 4.5% 0.3% 1.9% 0 .9% 2. 8% 0.6% 0.2% 0.5% 0.1% 7.4% 1.5% 8. 9% Ninth $52,0 73 - $7 0,567 17,145 969 ,363 4.8% 0.3% 1.7% 0 .9% 2. 6% 0.4% 0.2% 0.5% 0.1% 7.5% 1.4% 8. 9% Tenth $70,5 67 & Over 11,508 1,444 ,975 5.7% 0.2% 1.2% 0 .8% 2. 0% 0.2% 0.1% 0.3% 0.1% 7.4% 1.3% 8. 7%
TOTALS 6 30,913 $12,534 ,387 3.5% 0.3% 2.2% 1 .1% 3. 3% 0.8% 0.2% 0.5% 0.1% 7.0% 1.7% 8. 7%
Top 5% $92,1 67 & Over 5,438 $990 ,253 5.9% 0.2% 1.0% 0 .8% 1. 8% 0.2% 0.1% 0.2% 0.1% 7.3% 1.3% 8. 6% Top 1% $206,8 69 & Over 1,022 $489 ,869 6.5% 0.2% 0.6% 0 .8% 1. 4% 0.1% 0.1% 0.2% 0.1% 7.3% 1.2% 8. 5%
Residential Loca l Property Taxes Nonre sidentia l Local Property Total State and Population Numbe r of House hold Total Renters Owners of Reside ntial Local Property Taxes Loca l Property Decil e Income Range House holds Income on Renters after PTR Rental Prop. Total Taxes Total Taxes
Firs t $6,3 84 & Under 82,613 $265 ,268 5.3% 2.2% 0.2% 2 .4% 2. 3% 4.7% 15.8% Second $6,3 84 - $ 9,881 1 00,588 729 ,488 4.2% 1.3% 0.0% 1 .3% 1. 5% 2.7% 10.6% Third $9,8 81 - $1 4,594 95,528 1,078 ,205 3.4% 1.8% 0.0% 1 .9% 1. 4% 3.3% 11.4% Fourth $14,5 94 - $1 9,609 88,878 1,389 ,016 3.2% 2.0% 0.0% 2 .0% 1. 1% 3.1% 11.7% Fifth $19,6 09 - $2 5,421 76,917 1,569 ,832 2.9% 2.1% 0.0% 2 .2% 1. 1% 3.3% 11.9% Sixth $25,4 21 - $3 2,108 75,111 1,982 ,544 2.3% 2.0% 0.0% 2 .0% 1. 0% 3.1% 12.0% Seventh $32,1 08 - $4 0,785 47,902 1,620 ,974 2.2% 2.1% 0.0% 2 .1% 1. 0% 3.1% 12.1% Eighth $40,7 85 - $5 2,073 34,723 1,484 ,722 1.4% 1.4% 0.0% 1 .4% 1. 1% 2.5% 11.4% Ninth $52,0 73 - $7 0,567 17,145 969 ,363 1.2% 1.2% 0.1% 1 .3% 1. 0% 2.3% 11.2% Tenth $70,5 67 & Over 11,508 1,444 ,975 1.0% 1.0% 0.4% 1 .3% 1. 4% 2.8% 11.4%
TOTALS 6 30,913 $12,534 ,387 2.4% 1.7% 0.1% 1 .8% 1. 2% 3.0% 11.7%
Top 5% $92,1 67 & Over 5,438 $990 ,253 0.9% 0.9% 0.5% 1 .4% 1. 6% 2.9% 11.5% Top 1% $206,8 69 & Over 1,022 $489 ,869 0.7% 0.7% 0.7% 1 .3% 1. 6% 2.9% 11.4%
97

1992 Minnesota Tax Incidence StudyTable B-4 (a) State and Local Tax Burden Amounts by Population Decile (dollars in thousands)
OTHERS (farmers and those with no homeowner or renter property tax)
State I ncome Taxes Sta te Sales Tax Sta te Excise Taxes Misc ellane ous State Ta xes Total State Taxe s Population Numbe r of House hold Individual Corpora te Purchases by Purchases by Sa les Tax Purchas es by Purc hases by Taxes on Ta xes on Total on Total on State Taxe s Decil e Income Range House holds Income Income Tax Franchise Tax Cons umers Business es Tota l Consumers Businesses Individuals Businesses Individuals Business es Tota l
Firs t $6,3 84 & Under 96,696 $267 ,786 - $ 333 $2,03 3 $12,051 $7,451 $19,502 $7,071 $ 1,246 $3, 021 $92 4 $21,810 $11,654 $33,464 Second $6,3 84 - $ 9,881 65,626 475 ,767 $2, 007 2,42 1 14,597 7,889 22,486 7,470 1,486 2, 994 79 3 27,068 12,589 39,657 Third $9,8 81 - $1 4,594 59,327 644 ,965 6, 954 2,86 0 18,380 9,907 28,287 8,798 1,764 3, 913 1,30 4 38,045 15,835 53,880 Fourth $14,5 94 - $1 9,609 42,376 657 ,252 11, 058 2,60 3 17,428 8,742 26,170 7,602 1,572 4, 172 1,16 2 40,260 14,079 54,339 Fifth $19,6 09 - $2 5,421 31,556 636 ,886 16, 027 2,35 9 15,969 8,069 24,038 6,495 1,394 4, 124 1,14 7 42,615 12,969 55,584 Sixth $25,4 21 - $3 2,108 13,773 364 ,573 8, 752 1,21 8 8,603 4,754 13,357 3,134 753 2, 464 87 5 22,953 7,600 30,553 Seventh $32,1 08 - $4 0,785 15,689 531 ,037 17, 134 1,62 3 11,229 6,419 17,648 3,893 993 3, 135 1,21 8 35,391 10,253 45,644 Eighth $40,7 85 - $5 2,073 13,121 558 ,161 22, 277 1,61 5 11,080 6,547 17,627 3,668 979 3, 360 1,13 3 40,385 10,274 50,659 Ninth $52,0 73 - $7 0,567 9,529 542 ,862 23, 496 1,45 9 9,631 5,994 15,625 2,563 861 2, 872 1,10 1 38,562 9,415 47,977 Tenth $70,5 67 & Over 9,141 1,148 ,989 64, 198 2,43 6 13,866 11,195 25,061 2,520 1,307 4, 033 1,83 3 84,617 16,771 101,388
TOTALS 3 56,834 $5,828 ,278 $171, 570 $20,62 7 $132,834 $76,967 $ 209,801 $ 53,214 $1 2,355 $34, 088 $11,49 0 $391,706 $121,439 $ 513,145
Top 5% $92,1 67 & Over 4,425 $798 ,007 $46, 462 $1,57 9 $8,284 $7,409 $15,693 $1,303 $806 $2, 381 $1,14 5 $58,430 $10,939 $69,369 Top 1% $206,8 69 & Over 827 $373 ,772 $24, 764 $66 2 $2,480 $3,491 $5,971 $282 $290 $ 677 $47 6 $28,203 $4,919 $33,122
Residential Loca l Property Taxes Nonre sidentia l Local Property Total State and Population Numbe r of House hold Total (HGA) Farmers Owners of Reside ntial Local Property Taxes Loca l Property Decil e Income Range House holds Income on Fa rmers after PTR Rental Prop. Total Taxes Total Taxes
Firs t $6,3 84 & Under 96,696 $267 ,786 $4, 351 $3,46 2 $1,319 $4,781 $17,596 $ 22,377 $55, 841 Second $6,3 84 - $ 9,881 65,626 475 ,767 2, 739 2,24 6 270 2,516 11,377 13,893 53, 550 Third $9,8 81 - $1 4,594 59,327 644 ,965 4, 559 3,88 1 779 4,660 24,414 29,074 82, 954 Fourth $14,5 94 - $1 9,609 42,376 657 ,252 5, 079 4,50 6 379 4,885 21,769 26,654 80, 993 Fifth $19,6 09 - $2 5,421 31,556 636 ,886 4, 237 3,87 1 655 4,526 22,577 27,103 82, 687 Sixth $25,4 21 - $3 2,108 13,773 364 ,573 5, 458 5,21 1 650 5,861 21,409 27,270 57, 823 Seventh $32,1 08 - $4 0,785 15,689 531 ,037 5, 615 5,27 3 1,041 6,314 30,077 36,391 82, 035 Eighth $40,7 85 - $5 2,073 13,121 558 ,161 5, 298 5,10 9 1,615 6,724 26,751 33,475 84, 134 Ninth $52,0 73 - $7 0,567 9,529 542 ,862 4, 277 4,14 5 1,588 5,733 26,625 32,358 80, 335 Tenth $70,5 67 & Over 9,141 1,148 ,989 5, 106 5,03 1 6,037 11,068 41,880 52,948 154, 336
TOTALS 3 56,834 $5,828 ,278 $46, 719 $42,73 5 $14,333 $57,068 $ 244,475 $3 01,543 $814, 688
Top 5% $92,1 67 & Over 4,425 $798 ,007 $2, 715 $2,67 7 $4,619 $7,296 $25,047 $ 32,343 $101, 712 Top 1% $206,8 69 & Over 827 $373 ,772 $ 565 $56 1 $3,091 $3,652 $9,406 $ 13,058 $46, 180
98

1992 Minnesota Tax Incidence StudyTable B-4 (b) Effective Tax Rates by Population Decile
OTHERS (farmers and those with no homeowner or renter property tax)
State I ncome Taxes Sta te Sales Tax Sta te Excise Taxes Misc ellane ous State Ta xes Total State Taxe s Population Numbe r of House hold Individual Corpora te Purchases by Purchases by Sa les Tax Purchas es by Purc hases by Taxes on Ta xes on Total on Total on State Taxe s Decil e Income Range House holds Income Income Tax Franchise Tax Cons umers Business es Tota l Consumers Businesses Individuals Businesses Individuals Business es Tota l
Firs t $6,3 84 & Under 96,696 $267 ,786 - 0.1% 0.8% 4.5% 2 .8% 7. 3% 2.6% 0.5% 1.1% 0.3% 8.1% 4.4% 12. 5% Second $6,3 84 - $ 9,881 65,626 475 ,767 0.4% 0.5% 3.1% 1 .7% 4. 7% 1.6% 0.3% 0.6% 0.2% 5.7% 2.6% 8. 3% Third $9,8 81 - $1 4,594 59,327 644 ,965 1.1% 0.4% 2.8% 1 .5% 4. 4% 1.4% 0.3% 0.6% 0.2% 5.9% 2.5% 8. 4% Fourth $14,5 94 - $1 9,609 42,376 657 ,252 1.7% 0.4% 2.7% 1 .3% 4. 0% 1.2% 0.2% 0.6% 0.2% 6.1% 2.1% 8. 3% Fifth $19,6 09 - $2 5,421 31,556 636 ,886 2.5% 0.4% 2.5% 1 .3% 3. 8% 1.0% 0.2% 0.6% 0.2% 6.7% 2.0% 8. 7% Sixth $25,4 21 - $3 2,108 13,773 364 ,573 2.4% 0.3% 2.4% 1 .3% 3. 7% 0.9% 0.2% 0.7% 0.2% 6.3% 2.1% 8. 4% Seventh $32,1 08 - $4 0,785 15,689 531 ,037 3.2% 0.3% 2.1% 1 .2% 3. 3% 0.7% 0.2% 0.6% 0.2% 6.7% 1.9% 8. 6% Eighth $40,7 85 - $5 2,073 13,121 558 ,161 4.0% 0.3% 2.0% 1 .2% 3. 2% 0.7% 0.2% 0.6% 0.2% 7.2% 1.8% 9. 1% Ninth $52,0 73 - $7 0,567 9,529 542 ,862 4.3% 0.3% 1.8% 1 .1% 2. 9% 0.5% 0.2% 0.5% 0.2% 7.1% 1.7% 8. 8% Tenth $70,5 67 & Over 9,141 1,148 ,989 5.6% 0.2% 1.2% 1 .0% 2. 2% 0.2% 0.1% 0.4% 0.2% 7.4% 1.5% 8. 8%
TOTALS 3 56,834 $5,828 ,278 2.9% 0.4% 2.3% 1 .3% 3. 6% 0.9% 0.2% 0.6% 0.2% 6.7% 2.1% 8. 8%
Top 5% $92,1 67 & Over 4,425 $798 ,007 5.8% 0.2% 1.0% 0 .9% 2. 0% 0.2% 0.1% 0.3% 0.1% 7.3% 1.4% 8. 7% Top 1% $206,8 69 & Over 827 $373 ,772 6.6% 0.2% 0.7% 0 .9% 1. 6% 0.1% 0.1% 0.2% 0.1% 7.5% 1.3% 8. 9%
Residential Loca l Property Taxes Nonre sidentia l Local Property Total State and Population Numbe r of House hold Total (HGA) Farmers Owners of Reside ntial Local Property Taxes Loca l Property Decil e Income Range House holds Income on Fa rmers after PTR Rental Prop. Total Taxes Total Taxes
Firs t $6,3 84 & Under 96,696 $267 ,786 1.6% 1.3% 0.5% 1 .8% 6. 6% 8.4% 20.9% Second $6,3 84 - $ 9,881 65,626 475 ,767 0.6% 0.5% 0.1% 0 .5% 2. 4% 2.9% 11.3% Third $9,8 81 - $1 4,594 59,327 644 ,965 0.7% 0.6% 0.1% 0 .7% 3. 8% 4.5% 12.9% Fourth $14,5 94 - $1 9,609 42,376 657 ,252 0.8% 0.7% 0.1% 0 .7% 3. 3% 4.1% 12.3% Fifth $19,6 09 - $2 5,421 31,556 636 ,886 0.7% 0.6% 0.1% 0 .7% 3. 5% 4.3% 13.0% Sixth $25,4 21 - $3 2,108 13,773 364 ,573 1.5% 1.4% 0.2% 1 .6% 5. 9% 7.5% 15.9% Seventh $32,1 08 - $4 0,785 15,689 531 ,037 1.1% 1.0% 0.2% 1 .2% 5. 7% 6.9% 15.4% Eighth $40,7 85 - $5 2,073 13,121 558 ,161 0.9% 0.9% 0.3% 1 .2% 4. 8% 6.0% 15.1% Ninth $52,0 73 - $7 0,567 9,529 542 ,862 0.8% 0.8% 0.3% 1 .1% 4. 9% 6.0% 14.8% Tenth $70,5 67 & Over 9,141 1,148 ,989 0.4% 0.4% 0.5% 1 .0% 3. 6% 4.6% 13.4%
TOTALS 3 56,834 $5,828 ,278 0.8% 0.7% 0.2% 1 .0% 4. 2% 5.2% 14.0%
Top 5% $92,1 67 & Over 4,425 $798 ,007 0.3% 0.3% 0.6% 0 .9% 3. 1% 4.1% 12.7% Top 1% $206,8 69 & Over 827 $373 ,772 0.2% 0.2% 0.8% 1 .0% 2. 5% 3.5% 12.4%
99


101
APPENDIX C
Household Characteristics and Tax Burdens by Population Deciles
1992 Minnesota Tax Incidence StudyTable C-1 Household Characteristics and Average Tax Burden Amounts by Population Decile
ONE-PERSON HOUSEHOLDS (except retired elderly)
Population DecileHOUSEHOLD CHARACTERISTICS One Two Three Four Five Six Seven Eight Nine Te n Total
Number of households 114,366 89,291 92,2 11 96 ,789 9 3,621 82,030 57,121 32,377 15,37 5 10,8 50 684,0 31 Percent of households in given decile 58% 43% 46% 46% 44% 39 % 2 7% 15% 7% 5% 33%
Average household income $2,763 $7,224 $11,2 30 $15 ,593 $2 0,400 $26,452 $33,771 $42,647 $55,59 8 $164,9 24 $19,7 94 Percent with earned income 60% 84% 92% 95% 98% 96 % 9 9% 95% 97% 92% 88% Average e arned income $3,038 $6,523 $10,2 48 $14 ,394 $1 8,760 $24,824 $32,210 $38,152 $48,43 0 $96,8 93 $18,6 36
Housi ng Status Homeowners 8% 10% 12% 22% 33% 43 % 5 0% 62% 76% 73% 27% Renters 43% 49% 55% 58% 52% 55 % 4 4% 36% 23% 24% 49% Farme rs 1% 1% 1% 1% 1% 1 % 2% 2% 1% 2% 1% Other 48% 40% 32% 18% 14% 1 % 4% 1% 0% 0% 23%
Average market value of home $38,698 $54,309 $41,1 65 $47 ,543 $5 5,235 $58,446 $66,267 $75,635 $89,04 6 $133,9 37 $62,4 65 Average monthly rent $128 $226 $2 91 $ 377 $456 $477 $568 $466 $53 7 $1,0 35 $3 57
AVERAGE TAX BURDENS
Local Property Tax A ll hous eholds Total tax $111 $227 $2 70 $ 413 $536 $639 $721 $808 $1,05 1 $2,0 56 $4 48 - Property tax refund -50 -84 -56 -88 -77 -38 -11 -3 -1 1 -2 -56 Tax after PTR $62 $144 $2 15 $ 324 $459 $601 $710 $804 $1,04 0 $2,0 54 $3 92 Renters only Total tax on rental unit $254 $451 $5 80 $ 750 $909 $949 $1,131 $928 $1,07 0 $2,0 62 $7 11 Renters' total tax on unit $164 $290 $3 74 $ 483 $586 $611 $729 $598 $68 9 $1,3 28 $4 58 - Property tax refund -94 -144 -89 -122 -103 -50 -6 0 0 0 -88 Renters' tax afte r PTR $70 $147 $2 85 $ 361 $483 $561 $723 $598 $68 9 $1,3 28 $3 70 Homeowners only Total tax on home $502 $811 $5 50 $ 589 $697 $714 $796 $958 $1,17 6 $2,3 66 $8 20 - Property tax refund -115 -127 -58 -78 -70 -24 -16 -5 -1 5 -3 -45 Homeowners' ta x after PTR $387 $684 $4 92 $ 511 $627 $690 $780 $953 $1,16 2 $2,3 64 $7 75
State Income Tax $1 $63 $2 67 $ 518 $793 $1,237 $1,793 $2,323 $3,16 7 $10,6 77 $8 75 State Sales Tax 117 225 3 08 396 476 554 641 738 87 3 1,4 41 4 09 State Excise Taxes 66 119 1 54 189 206 205 204 203 20 4 2 21 1 62 Other Tax es 25 46 60 76 95 110 128 148 18 5 3 07 82 Business Ta xes 177 309 3 99 505 552 691 854 1,028 1,27 5 4,9 29 5 80
Tota l State and Local Tax Burden $448 $906 $1,4 03 $2 ,008 $ 2,582 $3,398 $4,332 $5,246 $6,74 4 $19,6 28 $2,5 00
Effective Tax Rate for al l taxes 1 6.2% 12.5% 12.5% 12.9% 12.7% 12.8 % 12 .8% 1 2.3% 12.1% 11.9% 12.6% Renters only 1 5.8% 12.4% 12.9% 13.0% 12.8% 12.7 % 12 .8% 1 2.0% 11.7% 11.7% 12.7% Homeowners only 2 8.9% 20.0% 14.8% 13.5% 13.2% 13.1 % 13 .0% 1 2.5% 12.3% 12.0% 12.9%
102
See notes at end of this section.

1992 Minnesota Tax Incidence StudyTable C-2 Household Characteristics and Average Tax Burden Amounts by Population Decile
RETIRED ELDERLY
Population DecileHOUSEHOLD CHARACTERISTICS One Two Three Four Five Six Seven Eight Nine Te n Total
Number of households 50,937 79,201 71,8 68 57 ,957 4 6,874 40,324 25,695 18,191 13,83 2 13,4 59 418,3 38 Percent of households in given decile 26% 39% 36% 27% 22% 19 % 1 2% 9% 7% 6% 20%
Percent that are ma rried 1% 4% 12% 23% 41% 65 % 7 5% 61% 72% 74% 29%
Average household income $3,936 $7,327 $11,0 01 $15 ,558 $2 0,352 $26,278 $33,913 $42,901 $56,90 0 $130,8 18 $20,7 64 Social Security Income 3,657 6,300 7,9 42 8 ,885 9,577 10,913 12,400 12,209 13,09 5 16,1 38 8,6 03 SS income as % of household income 93% 86% 72% 57% 47% 42 % 3 7% 28% 23% 12% 41%
Housi ng Status Homeowners 28% 34% 48% 58% 70% 75 % 8 0% 72% 76% 75% 54% Renters 37% 44% 35% 26% 21% 15 % 1 3% 22% 13% 8% 29% Farme rs 6% 4% 6% 8% 6% 9 % 6% 6% 10% 17% 7% Other 30% 18% 12% 8% 4% 1 % 1% 0% 1% 0% 11%
Average market value of home $34,507 $38,402 $44,4 21 $51 ,904 $5 7,480 $59,310 $73,568 $79,059 $85,70 9 $106,0 11 $57,5 43 Average monthly rent $140 $219 $3 03 $ 387 $497 $484 $559 $484 $52 5 $9 41 $3 12
AVERAGE TAX BURDENS
Local Property Tax A ll hous eholds Total tax $198 $292 $4 08 $ 547 $657 $694 $904 $989 $1,06 9 $1,5 99 $5 51 - Property tax refund -63 -149 -1 70 -164 -130 -71 -51 -46 -4 0 -8 -1 16 Tax after PTR $136 $143 $2 38 $ 383 $527 $623 $853 $943 $1,02 9 $1,5 91 $4 35 Renters only Total tax on rental unit $279 $436 $6 05 $ 771 $989 $964 $1,113 $964 $1,04 6 $1,8 75 $6 21 Renters' total tax on unit $180 $281 $3 89 $ 497 $637 $621 $717 $621 $67 3 $1,2 07 $4 00 - Property tax refund -112 -228 -2 73 -316 -331 -95 -12 -20 0 0 -2 13 Renters' tax afte r PTR $68 $53 $1 16 $ 181 $306 $526 $705 $601 $67 3 $1,2 07 $1 87 Homeowners only Total tax on home $472 $493 $5 75 $ 722 $754 $799 $1,011 $1,179 $1,28 5 $2,0 03 $8 07 - Property tax refund -78 -146 -1 59 -142 -89 -75 -62 -57 -5 3 -11 -1 02 Homeowners' ta x after PTR $394 $347 $4 16 $ 580 $665 $724 $949 $1,122 $1,23 3 $1,9 93 $7 05
State Income Tax $0 $0 $0 $33 $125 $236 $450 $1,163 $1,86 1 $5,1 67 $3 47 State Sales Tax 129 189 2 63 358 454 568 673 774 94 6 1,4 56 4 05 State Excise Taxes 68 79 92 119 136 162 180 183 19 9 2 31 1 19 Other Tax es 55 43 58 86 125 175 222 228 30 4 5 48 1 19 Business Ta xes 179 282 3 85 583 775 955 1,253 1,666 2,16 8 5,3 83 7 95
Tota l State and Local Tax Burden $567 $735 $1,0 37 $1 ,561 $ 2,142 $2,719 $3,630 $4,957 $6,50 7 $14,3 76 $2,2 21
Effective Tax Rate for al l taxes 1 4.4% 10.0% 9.4% 10.0% 10.5% 10.3 % 10 .7% 1 1.6% 11.4% 11.0% 10.7% Renters only 1 2.3% 8.6% 8.5% 7.8% 8.5% 8.9 % 8 .7% 1 0.1% 9.7% 9.7% 9.0% Homeowners only 1 9.0% 12.9% 10.7% 10.9% 11.3% 10.6 % 11 .1% 1 2.0% 11.7% 11.1% 11.3%
103

1992 Minnesota Tax Incidence StudyTable C-3 Household Characteristics and Average Tax Burden Amounts by Population Decile
SINGLE-PARENT FAMILIES (except retired elderly)
Population DecileHOUSEHOLD CHARACTERISTICS One Two Three Four Five Six Seven Eight Nine Te n Total
Number of households 22,891 26,103 22,9 79 24 ,907 2 4,171 20,583 15,744 11,763 6,58 8 4,0 12 179,7 41 Percent of households in given decile 12% 13% 11% 12% 11% 10 % 7% 6% 3% 2% 9%
Average number of children 1.4 1.8 1 .6 1.5 1.6 1.6 1.6 1.6 1. 3 1.5 1.6
Average household income $3,501 $7,265 $11,0 88 $15 ,711 $2 0,407 $26,488 $33,859 $42,452 $55,89 0 $134,2 69 $21,6 63 Percent with earned income 14% 59% 93% 99% 96% 100 % 10 0% 98% 96% 97% 81% Average e arned income $2,845 $4,816 $9,6 64 $14 ,210 $1 8,992 $24,861 $31,156 $41,088 $51,13 3 $95,8 62 $22,3 02
Housi ng Status Homeowners 9% 13% 21% 30% 43% 57 % 6 8% 80% 77% 80% 38% Renters 45% 58% 48% 48% 42% 39 % 3 0% 16% 21% 16% 42% Farme rs 0% 2% 3% 1% 4% 1 % 2% 5% 3% 4% 2% Other 45% 28% 27% 21% 11% 2 % 0% 0% 0% 0% 18%
Average market value of home $33,757 $37,162 $41,7 21 $47 ,275 $3 9,991 $66,322 $70,429 $66,943 $77,87 3 $151,9 12 $61,7 70 Average monthly rent $138 $248 $2 92 $ 428 $434 $461 $617 $486 $53 4 $8 16 $3 54
AVERAGE TAX BURDENS
Local Property Tax A ll hous eholds Total tax $113 $259 $2 98 $ 444 $459 $686 $865 $737 $95 3 $2,3 65 $5 04 - Property tax refund -49 -178 -1 73 -194 -112 -105 -71 -24 -6 -32 -1 17 Tax after PTR $64 $81 $1 25 $ 250 $347 $581 $794 $713 $94 7 $2,3 34 $3 87 Renters only Total tax on rental unit $275 $494 $5 82 $ 853 $864 $918 $1,229 $968 $1,06 3 $1,6 26 $7 06 Renters' total tax on unit $177 $318 $3 75 $ 549 $556 $591 $791 $623 $68 4 $1,0 47 $4 55 - Property tax refund -101 -278 -2 92 -312 -211 -180 -89 -72 0 0 -2 17 Renters' tax afte r PTR $76 $40 $ 83 $ 238 $345 $410 $702 $551 $68 4 $1,0 47 $2 38 Homeowners only Total tax on home $355 $587 $5 56 $ 605 $520 $788 $925 $801 $1,05 9 $2,7 33 $8 23 - Property tax refund -31 -133 -1 55 -151 -53 -59 -65 -16 -8 -39 -68 Homeowners' ta x after PTR $324 $453 $4 01 $ 453 $467 $730 $860 $785 $1,05 1 $2,6 94 $7 55
State Income Tax -$13 -$84 -$ 54 $ 112 $381 $825 $1,231 $1,826 $2,70 4 $8,6 73 $6 60 State Sales Tax 178 214 3 01 405 483 572 663 780 95 3 1,4 90 4 56 State Excise Taxes 137 140 1 70 181 177 174 169 178 18 4 2 63 1 67 Other Tax es 5 19 52 138 196 225 264 301 36 5 5 03 1 49 Business Ta xes 197 315 4 32 504 622 810 1,057 1,097 1,73 1 4,1 52 6 93
Tota l State and Local Tax Burden $568 $685 $1,0 25 $1 ,591 $ 2,205 $3,187 $4,179 $4,895 $6,88 5 $17,4 14 $2,5 12
Effective Tax Rate for al l taxes 1 6.2% 9.4% 9.2% 10.1% 10.8% 12.0 % 12 .3% 1 1.5% 12.3% 13.0% 11.6% Renters only 1 6.6% 8.3% 8.6% 10.0% 10.6% 11.2 % 11 .9% 1 1.4% 11.9% 11.7% 10.7% Homeowners only 2 8.0% 16.3% 11.8% 11.5% 11.3% 12.7 % 12 .5% 1 1.6% 12.4% 13.1% 12.4%
104

1992 Minnesota Tax Incidence StudyTable C-4 Household Characteristics and Average Tax Burden Amounts by Population Decile
MARRIED WITHOUT CHILDREN (except retired elderly)
Population DecileHOUSEHOLD CHARACTERISTICS One Two Three Four Five Six Seven Eight Nine Te n Total
Number of households 2,726 2,391 5,3 43 13 ,395 1 7,253 30,924 36,852 54,697 61,65 8 60,7 61 286,0 00 Percent of households in given decile 1% 1% 3% 6% 8% 15 % 1 7% 26% 29% 29% 14%
Average household income $2,777 $7,910 $11,7 15 $15 ,797 $2 0,821 $27,013 $34,039 $43,372 $56,87 3 $151,1 37 $62,2 79 Percent with earned income 44% 69% 70% 99% 88% 93 % 9 8% 99% 99% 99% 96% Average e arned income $3,849 $4,738 $10,5 89 $12 ,736 $1 7,786 $20,370 $28,294 $36,021 $49,36 6 $92,7 98 $45,9 00
Housi ng Status Homeowners 22% 45% 34% 68% 60% 71 % 7 5% 78% 89% 91% 79% Renters 43% 36% 46% 8% 16% 20 % 1 4% 14% 7% 6% 12% Farme rs 13% 0% 13% 21% 14% 8 % 9% 7% 4% 4% 7% Other 21% 19% 8% 3% 10% 1 % 1% 0% 0% 0% 2%
Average market value of home $32,161 $49,197 $56,0 14 $54 ,784 $5 9,756 $58,242 $62,930 $68,254 $80,47 5 $123,1 89 $80,8 88 Average monthly rent $239 $270 $3 00 $ 398 $489 $478 $568 $478 $53 4 $9 28 $5 14
AVERAGE TAX BURDENS
Local Property Tax A ll hous eholds Total tax $284 $403 $4 51 $ 633 $622 $636 $695 $786 $95 4 $1,8 60 $9 91 - Property tax refund -158 -213 -1 51 -80 -58 -46 -34 -18 -7 -4 -29 Tax after PTR $126 $189 $3 00 $ 553 $564 $590 $661 $768 $94 7 $1,8 56 $9 63 Renters only Total tax on rental unit $477 $537 $5 98 $ 792 $975 $951 $1,132 $953 $1,06 4 $1,8 49 $1,0 24 Renters' total tax on unit $307 $346 $3 85 $ 510 $628 $613 $729 $614 $68 5 $1,1 91 $6 60 - Property tax refund -331 -225 -2 08 -29 -128 -80 -12 -10 0 0 -60 Renters' tax afte r PTR -$23 $121 $1 76 $ 481 $500 $533 $717 $604 $68 5 $1,1 91 $5 99 Homeowners only Total tax on home $678 $613 $8 11 $ 870 $871 $718 $791 $893 $1,02 4 $1,9 79 $1,1 56 - Property tax refund -65 -291 -1 64 -114 -62 -41 -43 -21 -8 -5 -27 Homeowners' ta x after PTR $613 $322 $6 47 $ 755 $809 $677 $747 $872 $1,01 5 $1,9 74 $1,1 29
State Income Tax $0 $0 $ 39 $ 202 $416 $748 $1,209 $1,927 $2,89 3 $8,9 37 $3,1 63 State Sales Tax 230 491 5 24 559 600 652 717 823 98 3 1,5 78 9 46 State Excise Taxes 82 197 2 17 229 238 255 289 291 27 4 2 68 2 68 Other Tax es 159 290 2 71 293 274 277 286 316 37 7 5 66 3 68 Business Ta xes 301 532 1,4 77 949 1,058 954 1,084 1,153 1,41 0 4,2 82 1,8 20
Tota l State and Local Tax Burden $898 $1,700 $2,8 28 $2 ,785 $ 3,150 $3,475 $4,247 $5,278 $6,88 4 $17,4 87 $7,5 28
Effective Tax Rate for al l taxes 3 2.3% 21.5% 24.1% 17.6% 15.1% 12.9 % 12 .5% 1 2.2% 12.1% 11.6% 12.1% Renters only 2 2.9% 19.8% 15.9% 15.4% 13.9% 12.0 % 12 .4% 1 1.7% 11.7% 11.4% 12.0% Homeowners only 4 7.5% 23.9% 33.0% 18.1% 15.6% 13.1 % 12 .6% 1 2.3% 12.1% 11.6% 12.1%
105

1992 Minnesota Tax Incidence StudyTable C-5 Household Characteristics and Average Tax Burden Amounts by Population Decile
MARRIED WITH CHILDREN (except retired elderly)
Population DecileHOUSEHOLD CHARACTERISTICS One Two Three Four Five Six Seven Eight Nine Te n Total
Number of households 4,931 8,466 8,4 11 19 ,208 3 0,182 38,218 76,621 94,994 114,79 0 123,0 52 518,8 73 Percent of households in given decile 3% 4% 4% 9% 14% 18 % 3 6% 45% 54% 58% 25%
Average number of children 1.9 2.2 2 .4 2.2 2.1 2.2 2.2 2.1 2. 0 2.0 2.1
Average household income $2,850 $7,253 $11,5 35 $15 ,616 $2 0,487 $26,750 $34,336 $43,429 $57,12 2 $120,7 30 $58,3 62 Percent with earned income 46% 67% 88% 99% 100% 98 % 9 9% 100% 100% 100% 98% Average e arned income $4,516 $7,672 $9,7 86 $14 ,786 $1 9,349 $25,065 $32,531 $42,176 $54,66 9 $98,5 20 $52,4 59
Housi ng Status Homeowners 27% 29% 33% 47% 64% 63 % 8 0% 83% 90% 94% 81% Renters 24% 50% 41% 24% 18% 25 % 1 2% 10% 5% 3% 11% Farme rs 2% 10% 13% 25% 14% 10 % 8% 7% 4% 3% 7% Other 46% 11% 12% 4% 5% 1 % 0% 0% 0% 0% 1%
Average market value of home $68,299 $38,316 $51,4 56 $34 ,554 $4 4,746 $57,306 $58,174 $70,372 $85,78 8 $126,9 96 $83,5 69 Average monthly rent $114 $386 $2 78 $ 419 $410 $467 $584 $473 $53 9 $9 41 $4 92
AVERAGE TAX BURDENS
Local Property Tax A ll hous eholds Total tax $296 $402 $4 09 $ 402 $492 $623 $663 $791 $1,03 1 $1,9 36 $1,0 35 - Property tax refund -82 -278 -1 71 -135 -86 -62 -32 -20 -1 5 -4 -35 Tax after PTR $214 $124 $2 38 $ 267 $407 $561 $631 $771 $1,01 6 $1,9 33 $1,0 00 Renters only Total tax on rental unit $227 $768 $5 53 $ 836 $817 $929 $1,163 $943 $1,07 4 $1,8 75 $9 80 Renters' total tax on unit $146 $495 $3 56 $ 538 $526 $599 $749 $607 $69 2 $1,2 07 $6 31 - Property tax refund -63 -467 -3 04 -348 -167 -125 -51 0 -1 5 -3 -1 29 Renters' tax afte r PTR $83 $27 $ 53 $ 190 $360 $474 $698 $607 $67 7 $1,2 05 $5 02 Homeowners only Total tax on home $949 $535 $7 85 $ 574 $623 $745 $718 $881 $1,10 0 $2,0 30 $1,1 99 - Property tax refund -242 -149 -1 39 -108 -88 -48 -32 -24 -1 5 -4 -26 Homeowners' ta x after PTR $707 $387 $6 45 $ 466 $534 $698 $686 $856 $1,08 5 $2,0 26 $1,1 73
State Income Tax -$41 -$58 -$1 17 -$49 $180 $512 $974 $1,584 $2,49 2 $6,9 66 $2,6 80 State Sales Tax 172 363 4 54 524 603 688 783 899 1,05 5 1,5 56 1,0 03 State Excise Taxes 104 191 2 19 236 257 273 295 305 30 0 3 19 2 93 Other Tax es 48 101 1 46 183 229 255 297 333 39 9 5 63 3 70 Business Ta xes 274 563 6 84 920 910 1,134 1,156 1,343 1,49 8 3,2 46 1,7 11
Tota l State and Local Tax Burden $770 $1,284 $1,6 24 $2 ,081 $ 2,586 $3,423 $4,135 $5,233 $6,76 0 $14,5 82 $7,0 57
Effective Tax Rate for al l taxes 2 7.0% 17.7% 14.1% 13.3% 12.6% 12.8 % 12 .0% 1 2.1% 11.8% 12.1% 12.1% Renters only 2 2.3% 14.6% 11.6% 11.0% 11.6% 11.5 % 11 .6% 1 1.1% 10.9% 11.7% 11.4% Homeowners only 4 8.2% 22.0% 16.9% 14.3% 13.0% 13.3 % 12 .1% 1 2.2% 11.9% 12.1% 12.1%
106

107
NOTES FOR APPENDICES B AND C Notes for Table B-1 through B-4: 1. The negative individual income taxes and effective tax rates in the first decile
are due to refundable credits. 2. Miscellaneous state taxes include insurance premium taxes and motor vehicle
registration tax. 3. The residential property tax total is after subtracting property tax refunds
(PTR). Notes for Tables C-1 through C-5: 1. Tax rates for the first three deciles are calculated after excluding (a) households with business losses (sum of income reported on Schedules C,
E, and F less than zero) and (b) households with negative total incomes. As a result, the number of households in Tables C-1 through C-5 do not total the number of households shown on Table B-1.
2. Retired elderly households includes social security recipients not known to be under 62 years of age, whose social security benefits are at least twice as large as earned income. Earned income includes wage and salary income plus self-employment income from Schedules C and F.
3. “Children” include anyone claimed as a dependent on an income tax return or public assistance file. “Single parent families” are all those with only one adult and one or more children.
4. Homeowners do not include those living in farm homesteads. 5. Farmers are defined as those who own farm homestead property, not those
actively farming. 6. Those who are not renters, homeowners, or farmers are classified as “other.”
Examples would include a person living with parents (but not claimed as a dependent on tax forms), senior citizens living with children, or someone living in fully subsidized housing.
7. Earned income is defined as the sum of wage and salary income and positive amounts from Schedules C (sole proprietor) and F (farms).
8. The landlord’s share of rental property taxes is included in business taxes.

108
APPENDIX D Summary of Data Items for Each Household
Household Characteristics, Income, and Taxes Household Characteristics, Income, and Taxes (cont.)
General Taxpayer social security number Public Aid to families with dependent childrenInformation Spouse social security number Assistance General assistance
Household size Minnesota supplemental aidNumber of adults in household Miscellaneous Workers' compensation benefitsNumber of dependents in household Unemployment benefitsSample conversion rate Social security benefitsOver age 65 indicator (taxpayer or spouse) Available for some nonfiler households:Housing type: homeowner, renter, farmer Wages, salaries and tips or mobile home owner Pension incomeCounty of residence Dividend income
Minnesota State income tax filing status Interest incomeIndividual State income tax liability Local Homestead market value for homeownersIncome Tax Working family credit Property Taxes Homestead property tax for homeowners
Dependent care creditAdditions to income
Federal Federal income tax filing status Estimated Expenditures and TaxesIndividual Wages, salaries and tips Consumer Expenditures used in calculating sales, excise,Income Tax Taxable dividends Expenditure insurance, vehicle registration and other taxes:
Business income Survey Total household expendituresRent, royalty, partnership and estate income Hotel and motelFarm income Food (taxable)Nontaxable interest AlcoholNontaxable IRA income TobaccoNontaxable pensions and annuities GasolineAdjusted gross income Vehicles (before trade-in)Taxable income Vehicles (net of trade-in)Net tax liability Other vehicle expensesAlternative minimum tax Furniture and equipmentEarned income credit Household suppliesDependent care credit Home maintenanceSchedule A: Utilities (taxable) Real estate taxes Miscellaneous manufactured items State and local income tax Entertainment Total itemized deductions Miscellaneous services (taxable)Schedule C : depreciation Drugs (taxable)Schedule E: Life insurance Depreciation Automobile insurance Rental gains Homeowners insurance Rental losses State taxes State sales tax and sales tax on motor vehicles Passive partnership gains Alcoholic beverage excise tax Passive partnership losses Motor fuels excise tax Nonpassive partnership gains Cigarette and tobacco products excise taxes Nonpassive partnership losses Insurance premiums tax Section 179 losses Motor vehicle registration tax Estate gain Local Homestead estimated market value for farmers Estate loss Property Homestead property tax for farmers and mobile REMIC income Taxes home owners Farm rent Renter's proper ty taxSchedule F : taxes paid, depreciation Seasonal/recreational pr operty tax
Minnesota Federal adjusted gross income P roperty tax refund for farmers split intoProperty Nontaxable social security payments individual and business partsTax Refund IRA, Keogh, SEP or other retirement plan Business Nonrental property taxes
payments Taxes Rental property taxesPublic assistance payments State sales tax and sales tax on motor vehiclesOther income (including workers' comp., pensions, Corporate franchise tax veterans' payments, nontaxable interest) Motor fuels excise taxRenter's property tax Motor vehicle registration taxReal estate taxes Insurance premiums taxMobile home property taxes and rentRegular proper ty tax refundSpecial property tax refund

109
APPENDIX E
LEGISLATIVE MANDATE 270.0682 Tax Incidence Reports Subdivision 1. Biennial report. The commissioner of revenue shall report to the legislature by March 1 of each odd-numbered year on the overall incidence of the income tax, sales and excise taxes, and property tax. The report shall present information on the distribution of the tax burden (1) for the overall income distribution, using a systemwide incidence measure such as the Suits index or other appropriate measures of equality and inequality, (2) by income classes, including at a minimum deciles of the income distribution, and (3) by other appropriate taxpayer characteristics. Subdivision 2. Bill analyses. At the request of the chair of the house tax committee or the senate committee on taxes and tax laws, the commissioner of revenue shall prepare an incidence impact analysis of a bill or a proposal to change the tax system which increases, decreases, or redistributes taxes by more than $20,000,000. To the extent data is available on the changes in the distribution of the tax burden that are affected by the bill or proposal, the analysis shall report on the incidence effects that would result if the bill were enacted. The report may present information using systemwide measures, such as Suits or other similar indexes, by income classes, taxpayer characteristics, or other relevant categories. The report may include analyses of the effect of the bill or proposal on representative taxpayers. The analysis must include a statement of the incidence assumptions that were used in computing the burdens. Subdivision 3. Income measure. The incidence analyses shall use the broadest measure of economic income for which reliable data is available. History: 1990 c 604 art 10 s 9.

110
BIBLIOGRAPHY40 Advisory Commission on Intergovernmental Relations (1994). Significant
Features of Fiscal Federalism. Washington, D.C.: ACIR. District of Columbia (1994). Tax Rates and Tax Burdens in the District of
Columbia: A Nationwide Comparison. Washington D.C., June. Hollahan, J. and S. Zedlewski (1992). “Who Pays for Health Care in the United
States? Implications for Health System Reform,” Inquiry, Summer, pp. 231-248.
Minnesota Department of Revenue (1993). Property Taxes Levied in Minnesota:
Taxes Payable in 1992. Property Tax Division. Minnesota Department of Revenue (1993). Minnesota Tax Handbook. Tax
Research Division, December. Minnesota Department of Revenue (1993). Minnesota Tax Incidence Study. Tax
Research Division, November. Minnesota Department of Revenue (1992). Model Revenue System for Minnesota.
Tax Research Division, July. Suits, D.B. (1977). “Measurement of Tax Progressivity,” American Economic
Review, September, pp. 747-752. U.S. Department of Commerce (1994). Bureau of Economic Analysis, Fixed
Reproducible Tangible Wealth in the United States: 1925-1993. Washington, D.C. (on diskettes).
40 For a more detailed bibliography, see Minnesota Department of Revenue (1993). Minnesota Tax Incidence Study. Tax Research Division, November.

111
U.S. Department of Commerce (1994). Bureau of Economic Analysis, Detailed Investment by Industry: 1947-1993. Washington, D.C. (on diskettes).
U.S. Department of Commerce (1991). Bureau of the Census, 1990 Census of
Population and Housing. Washington, D.C.: Bureau of the Census. U.S. Department of Labor (1993). Bureau of Labor Statistics, 1992 Consumer
Expenditure Survey. (Diary and Interview microdata public use tapes). Wisconsin Department of Revenue (1995). Corporate Tax Climate: A
Comparison of Nineteen States. Madison: Wisconsin Department of Revenue.