Lifecycle Series: Anthropometrics Transcript - Minnesota ...
29
1 Lifecycle Series: Anthropometrics Transcript UPDATED NOVEMBER 2021 Module 1: Anthropometric Measurements 1.1 Welcome 1.2 Introduction Welcome to Anthropometrics. After completing this course, you will be able to: • Define the term Anthropometrics • Describe the 4 factors that affect growth • Understand how to accurately measure heights, weights, and lengths • Define Body Mass Index (BMI), and • Interpret growth charts for clients 1.3 What is Anthropometrics Anthropometrics--now there's a big fancy word. So, what does it mean exactly? Anthropometrics or Anthropometry simply means the study of body measurements. In the WIC program, we take the heights, weights and lengths of women, infants, and children, so we can better assess their growth, development, and nutrition status. These measurements are an important step in helping WIC staff members determine whether or not there is a nutrition risk. Since these measurements are used by the WIC computer system to help identify risks, accuracy and precision are extremely important. That's what this lesson is all about, how to accurately obtain anthropometric measurements in order to assess risk. Let’s begin this lesson by learning about the four factors that affect growth and development. Click 'Next' to continue. Before you go to the next page, make sure you click on the ‘Did You Know’ button to learn more. Did You Know (button) This WIC data is collected and submitted to the federal government yearly, which helps to evaluate the effectiveness of the WIC Program, as well as assess the health of the country. 1.4 Growth and Development Factors It's no surprise that kids and adults come in many different shapes and sizes. If you look at kids in the same grade at any school, you'll see a dramatic difference in heights, weights and body sizes between them.
-
Upload
khangminh22 -
Category
Documents
-
view
0 -
download
0
Transcript of Lifecycle Series: Anthropometrics Transcript - Minnesota ...

1
Lifecycle Series: Anthropometrics Transcript U P D A T E D N O V E M B E R 2 0 2 1
Module 1: Anthropometric Measurements
1.1 Welcome
1.2 Introduction Welcome to Anthropometrics. After completing this course, you will be able to:
• Define the term Anthropometrics
• Describe the 4 factors that affect growth
• Understand how to accurately measure heights, weights, and lengths
• Define Body Mass Index (BMI), and
• Interpret growth charts for clients
1.3 What is Anthropometrics Anthropometrics--now there's a big fancy word. So, what does it mean exactly?
Anthropometrics or Anthropometry simply means the study of body measurements. In the WIC program, we take the heights, weights and lengths of women, infants, and children, so we can better assess their growth, development, and nutrition status. These measurements are an important step in helping WIC staff members determine whether or not there is a nutrition risk.
Since these measurements are used by the WIC computer system to help identify risks, accuracy and precision are extremely important. That's what this lesson is all about, how to accurately obtain anthropometric measurements in order to assess risk.
Let’s begin this lesson by learning about the four factors that affect growth and development.
Click 'Next' to continue. Before you go to the next page, make sure you click on the ‘Did You Know’ button to learn more.
Did You Know (button) This WIC data is collected and submitted to the federal government yearly, which helps to evaluate the effectiveness of the WIC Program, as well as assess the health of the country.
1.4 Growth and Development Factors It's no surprise that kids and adults come in many different shapes and sizes. If you look at kids in the same grade at any school, you'll see a dramatic difference in heights, weights and body sizes between them.

L I F E C Y C L E S E R I E S : A N T H R O P O M E T R I C S
2
So, what contributes to these growth and development differences? There are four factors in all. Click on each image to learn more about each factor.
Genetic Genetic factors include inherited family characteristics.
Behavioral Behavioral factors include physical activity, exercise patterns, and eating habits. Habits of the mother during pregnancy, such as smoking or drug use, are behavioral in nature, as well.
Hormonal Hormonal factors include such things as “morning sickness”, commonly experienced by women during pregnancy, may affect early pregnancy weight gain.
Environmental Environmental factors include sunshine, quality and quantity of the food, water, ad exposure to disease, illness, and pollution.
1.5 Measuring Weights of Infants The first anthropometric measurement you'll be learning about is how to take the weight of an infant. And depending upon the clinic you'll be working at, you'll either be using an infant balance beam or digital scale. Both scales do a great job of determining an infant’s weight. It’s just that with a balance beam scale, you'll have to manually adjust it to determine weight, whereas with a digital scale, the weight is taken at the press of a button.
You will typically be weighing infants and children up to about 24 months in age on the infant scale. After 24 months, many children will be able to stand on their own, allowing you to take their weight standing up. In some cases, though, such as a developmental disability, children up to 36 months can be weighed using an infant scale.
On the 'Next' page, we’ll talk about accuracy and precision when it comes to taking measurements.
Note: The scales at your clinic may vary from those shown and used in this training.
1.6 Accuracy & Precision in Measuring As you'll see in the coming slides, the measurements you'll be taking will be used to help determine if a child is growing on a healthy track or if a woman is gaining the recommended amount of weight during her pregnancy. So, if you make errors in your measurements, then the growth assessment you'll be providing your clients will be in error too. This is where accuracy and precision play an important role.

L I F E C Y C L E S E R I E S : A N T H R O P O M E T R I C S
3
Let's go to the 'Next' page to see how these two terms differ.
1.7 Accuracy & Precision in measuring- Continued Accuracy and precision. These two terms sound similar, don’t they? Well, let’s see how they differ when it comes to taking anthropometric measurements.
Let’s say you took the weight of a child to be 12 pounds 3 ounces, and you reweighed and got 12 pounds 3 ounces again. Would you be accurate or precise? Precise. See, precision has to do with your ability to get the same result over and over.
So, what about accuracy? Do you think that 12 pounds 3 ounces would be accurate? Let's say you forgot to ask the mother to check her child's diaper, and it was full. You know, a real mess. Yuck. So even though you were very precise getting the same measurement, this measurement would actually be inaccurate because a full diaper could weigh up to two pounds. See the difference?
Now, onto our first anthropometric measurement. We’ll be measuring the weight of an infant using the balance beam and electronic scale. Ready? Click 'Next' to continue.
1.8 Measuring Weights of Infants In these videos, you'll see how to weigh an infant using the electronic and balance beam scales. And as easy as weighing an infant might seem, mistakes are often made because of not paying careful attention to detail, such as if the child’s arms or legs are hanging outside the scale or if you’re trying to rush through it because the child is fussy, moving or crying. Errors in measurement can be avoided. And that’s what you are here to learn.
After watching the videos, we'll go over how to read the scale’s measurements, as well as how to round off measurements, so you can properly enter them into the WIC computer system.
So here we go. Click the images to watch the videos now.
Note: Click the Resource tab to download a job aid that highlights the procedure.
Infant Balance Beam Scale In this video, we’ll be taking the weight of a 2-month-old infant using a balance beam scale. Before weighing, have the caregiver take off the infant’s clothes, such as shoes, pants, jackets, sweaters or hats that will affect the weight. A t-shirt or onesie and a dry diaper is fine.
Additionally, have the caregiver check the infant’s diaper and change it, if needed, as a full diaper could weigh up to two pounds. Make sure a paper liner is placed onto the scale before weighing, and that the upper and lower counterbalance weights are at the far left at zero.
Have the caregiver gently place the child onto the center of the scale. Younger infants should be weighed lying down. You may consider weighing older infants sitting up, so they fit comfortably in the center of the scale. Make sure the child does not hang onto the caregiver nor can the caregiver hold or touch the child; also, the child cannot touch the sides of the scale,
L I F E C Y C L E S E R I E S : A N T H R O P O M E T R I C S
4
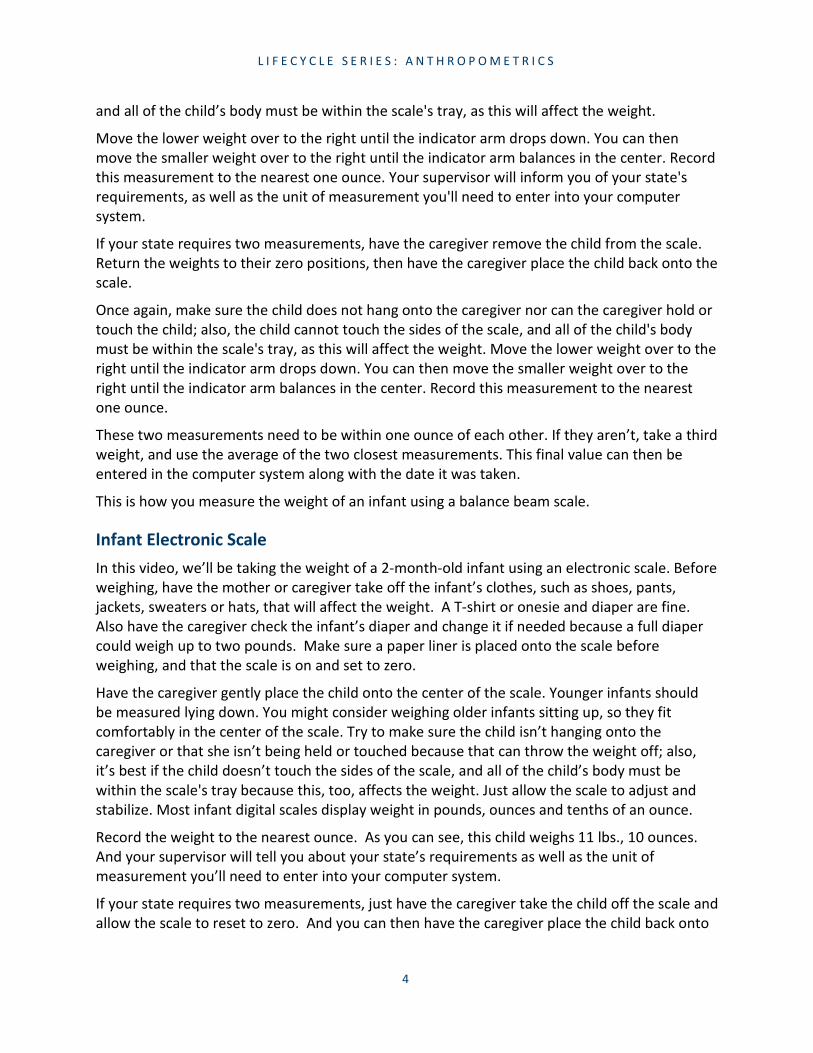
and all of the child’s body must be within the scale's tray, as this will affect the weight.
Move the lower weight over to the right until the indicator arm drops down. You can then move the smaller weight over to the right until the indicator arm balances in the center. Record this measurement to the nearest one ounce. Your supervisor will inform you of your state's requirements, as well as the unit of measurement you'll need to enter into your computer system.
If your state requires two measurements, have the caregiver remove the child from the scale. Return the weights to their zero positions, then have the caregiver place the child back onto the scale.
Once again, make sure the child does not hang onto the caregiver nor can the caregiver hold or touch the child; also, the child cannot touch the sides of the scale, and all of the child's body must be within the scale's tray, as this will affect the weight. Move the lower weight over to the right until the indicator arm drops down. You can then move the smaller weight over to the right until the indicator arm balances in the center. Record this measurement to the nearest one ounce.
These two measurements need to be within one ounce of each other. If they aren’t, take a third weight, and use the average of the two closest measurements. This final value can then be entered in the computer system along with the date it was taken.
This is how you measure the weight of an infant using a balance beam scale.
Infant Electronic Scale In this video, we’ll be taking the weight of a 2-month-old infant using an electronic scale. Before weighing, have the mother or caregiver take off the infant’s clothes, such as shoes, pants, jackets, sweaters or hats, that will affect the weight. A T-shirt or onesie and diaper are fine. Also have the caregiver check the infant’s diaper and change it if needed because a full diaper could weigh up to two pounds. Make sure a paper liner is placed onto the scale before weighing, and that the scale is on and set to zero.
Have the caregiver gently place the child onto the center of the scale. Younger infants should be measured lying down. You might consider weighing older infants sitting up, so they fit comfortably in the center of the scale. Try to make sure the child isn’t hanging onto the caregiver or that she isn’t being held or touched because that can throw the weight off; also, it’s best if the child doesn’t touch the sides of the scale, and all of the child’s body must be within the scale's tray because this, too, affects the weight. Just allow the scale to adjust and stabilize. Most infant digital scales display weight in pounds, ounces and tenths of an ounce.
Record the weight to the nearest ounce. As you can see, this child weighs 11 lbs., 10 ounces. And your supervisor will tell you about your state’s requirements as well as the unit of measurement you’ll need to enter into your computer system.
If your state requires two measurements, just have the caregiver take the child off the scale and allow the scale to reset to zero. And you can then have the caregiver place the child back onto

L I F E C Y C L E S E R I E S : A N T H R O P O M E T R I C S
5
the center of the scale for a second measurement. Once again, record to the nearest ounce.
Again, these two measurements need to be within one ounce of each other. If they aren’t, take a third measurement, and use the average of the two closest measurements. This final value can then be entered into the computer system along with the date it was taken. Make every reasonable effort to obtain as accurate a measurement as possible by weighing the child alone, but we all know young children can be a sometimes be a challenge to manage.
If you find yourself in this situation, you can weigh the caregiver and child on the adult scale, and then weigh the caregiver without the child. Then, all you need to do is subtract the weight of the caregiver from the weight of the caregiver and child together, and you’ll have the weight of the child. Record this measurement in the computer as "weight obtained in caregiver’s arms."
That’s how you measure the weight of an infant using an electronic scale.
Balance Beam
Digital Scale
1.9 Reading a Balance Beam Scale Now that you've seen how to take the weight of an infant and a child using both types of scales, we’ll take a look at how to read the measurements. We’ll start with the balance beam scale first.
Here’s a close-up of a measurement taken on a balance beam scale. As you can see, the lower weight, which increases in ten-pound units, was moved over one notch to the ten-pound position. And the top weight, which increases in pounds and ounces, was moved to the 4-pound 5-ounce position, making this child weigh…let’s see, 4 pounds plus 10 pounds is 14 pounds, then add the ounces which are 5…14 pounds 5 ounces. And what was this 14-pound 5-ounce measurement based upon? The indicator arm being balanced in the center.
On the 'Next' page, we’ll take a look at how to read measurements displayed on the electronic scale
1.10 Reading an Electronic Scale Electronic scales are a bit easier to read because they display the measurement for you; however, not all infant electronic scales display the same units of measurement. Same for the adult electronic scales, too. Now, electronic scales do all display pounds, but I’m talking about how they display the smaller units, such as tenths of an ounce, tenths of a pound or quarter pound units. These smaller units, especially with infants who don’t weigh that much to begin with, can mean a big difference in determining risk.

L I F E C Y C L E S E R I E S : A N T H R O P O M E T R I C S
6
Here is an image of the electronic scale. This scale displays measurements in pounds, ounces and tenths of an ounce. So, this child weighs how much? 9 pounds, 5 and 5 tenths of an ounce. Excellent. You’re doing great.
1.11 Reading an Electronic Scale, Continued Now, take a look at this image. Here’s another variation of an electronic scale. This scale displays measurements in pounds and quarter pounds. Here, this child weighs, you got it… 35 and three-quarter pounds.
What type of scale will you be using? Well, that really depends upon your clinic. But don’t worry. Really. Once you get to the clinic, your supervisor or another WIC staff member will go over all of these details with you.
Right now, we’re just going over the types of scales used by various agencies, how to use them, and how to read them. Got it? Good.
On the 'Next' page, we’ll take a look at how to round off those tenths of ounces to just ounces, as many WIC computer systems take pounds and ounces.
1.12 Rounding Tenth of an Ounce If you use an electronic scale that displays units in tenths of an ounce, more than likely, you will need to round the tenths up or down, as many of the WIC computer systems only take pounds and ounces. You know where I’m going with this, don’t you? Thought so. Five tenths of an ounce or more gets rounded up to the next highest ounce, whereas four tenths or less, gets rounded down. Generally, when rounding numbers, this is usually the case. Anything five or greater gets rounded up to the next highest number, whereas anything four or less gets rounded down.
So, let’s test your ability to round numbers now. Select the correctly rounded number for the measurement displayed. Click 'SUBMIT' to check your answers.
(Pick many, 10 points, 2 attempts permitted)
“Incorrect”: Sorry, try again.
“Incorrect”: Sorry, that is not correct this time either.
“Correct”: That’s right! You selected the correct responses.
1. 4 pound 9 ounces
2. 7 pounds 7 ounces
3. 9 pounds 6 ounces
1.13 Review Activity 1

L I F E C Y C L E S E R I E S : A N T H R O P O M E T R I C S
7
Here’s another review activity. Select the correct weight based upon the measurement on the balance beam or electronic scale. Click each image to see larger versions. Click 'SUBMIT' to check your answers.
Slide “Try Again”: You did not select the correct responses.
Slide “Incorrect”: You did not select the correct responses. The correct answers are:
1. 5 lbs. 13 oz.
2. 7 lbs. 15 oz.
3. 20 lbs. 10 oz.
4. 13 lbs. 12 oz.
Slide “Correct”: That’s right! You selected the correct responses.
1. 5 lbs. 13 oz.
2. 7 lbs. 15 oz.
3. 20 lbs. 10 oz.
4. 13 lbs. 12 oz.
1.14 Measuring Weights of Children & Adults Just like with infants, balance beam and electronic scales are used to weigh women and children in the WIC program, too. Most balance beam scales will display units in pounds and ounces. Electronic scales could display in pounds and ounces, pounds and tenths of a pound, and pounds and quarter pounds. Once again, make sure you check with your supervisor or another WIC staff member as to the units your scale displays.
Click the images to watch the videos now.
Adult Balance Beam Scale In this video, we’ll be using a balance beam scale to measure the weight of an adult.
Before weighing, have the adult take off her shoes, and any heavy clothing like jackets or sweaters.
Make sure a paper liner is placed onto the scale before weighing, and that the upper and lower counterbalance weights are at the far left at zero.
Have your client step onto the scale and remain still. Move the lower weight over to the right until the indicator arm drops. You can then move the upper weight to the right, until the indicator arm balances in the center.
Record measurement to the nearest quarter pound or four ounces. Your supervisor will inform you of your state's requirements, as well as the unit of measurement you'll need to enter into your computer system.

L I F E C Y C L E S E R I E S : A N T H R O P O M E T R I C S
8
If your state requires two measurements, have your client step off the scale, move the two weights back to their zero positions, then have your client step back onto the scale.
Once again, have your client remain still. Move the lower and upper weights over until the indicator arm balances in the center.
Record this measurement to the nearest quarter pound or four ounces.
These two measurements need to be within a ¼ pound or four ounces of each other. If they aren’t, take a third measurement, and use the average the two closest measurements. This final value can then be entered in the computer system, along with the date it was taken.
This is how you measure the weight of an adult using a balance beam scale.
Child Electronic Scale In this video, we’ll be taking the weight of a 4-year-old boy using an electronic scale.
Before weighing, have the caregiver take off the child’s shoes or any heavy clothing like jackets or sweaters that might affect the child’s weight. Make sure a paper liner is placed onto the scale before weighing, and that the scale is on and set to zero.
Have the child step onto the scale, and remain still until the scale finishes adjusting, which is usually a couple of seconds. Depending upon the type of electronic scale you'll be using, this measurement will be displayed in pounds and ounces or pounds and tenths of a pound, as pictured here. Your supervisor will tell you of your state's requirements, as well as the unit of measurement you'll need to enter into your computer system.
Write down the weight, and then have the child step off the scale. This will cause most electronic scales to reset to zero. If your state requires two measurements, you can then have the child step back onto the scale for a second measurement.
These two measurements need to be within one quarter pound or four ounces of each other. If not, take a third measurement, and use the average of the two closest measurements. This final value can then be entered in the computer system, along with the date it was taken.
This is how you measure the weight of a child or an adult using a digital scale.
1.5 Measuring Units on Electronic Scales As you had seen in the video, the 4-year-old boy weighed 40.6 pounds. Okay, I get 40 pounds, but what about the point six? Great question. It’s pounds and tenths of a pound. How would you have known? Well, that’s where you’d ask someone at your clinic, like your supervisor or another WIC staff member.
Now, let’s say you needed to convert this measurement from tenths of a pound into ounces because that’s what your WIC computer system requires. How will you do this? No worries. We’ve got you covered. That’s what this table is for. You can find it in your job aid under the Resources tab. One like it should also be posted at your clinic, in case you need to do this type of conversion.

L I F E C Y C L E S E R I E S : A N T H R O P O M E T R I C S
9
Looking at this table, sixth tenths of a pound equate to 10 ounces. So, 40 pounds 10 ounces is what you or someone else would put into the WIC computer.
Now, let's say the child weighed 35 ¾ pounds, and your WIC computer system, once again, took pounds and ounces. How many ounces would 3/4 of a pound be? Using this table, you can see that 3/4 of a pound equals 12 ounces. So, this boy weighed 35 pounds, 12 ounces. See? This conversion stuff is a breeze. Just be aware of the type of scale you have, and your agency's requirements, and you’ll be good to go.
So, what are my agency's requirements? Great question. We’ll go over that next. After that, we’ll get back on track with the most common errors made when measuring weight.
1.16 State Requirements Since this is a general course on Anthropometrics, we cannot cover every agency’s height, weight and length requirements. For example, one state might require only one measurement of an infant on the electronic scale, whereas another might require two. One agency might require these two measurements to be within ½ ounce of each other, while another requires it to be just one.
Now, it would be great if all the agencies had all the same equipment and recorded all the measurements in the exact same way. But they don’t--not yet anyway.
So, what do you do? That’s what your supervisor or your local policy manual will provide you. Once you start working at your particular agency, make sure to ask your supervisor and to look through your policy manual to get familiar with your agency’s requirements.
On the 'Next' page, we’ll go over the most common errors in making weight measurements.
1.17 Common Errors in Weighing When you learn how to do it, weighing infants, children, and pregnant women is pretty easy. But mistakes can still be made. Knowing what these errors are ahead of time can help you avoid them and help you make the most accurate health assessment possible.
Click the table to see the most common errors in weighing
Most Common Errors in Weighing:
• Outer clothing not removed
• Shoes not removed
• Child weighed with wet or soiled diaper
• Electronic Scale not set to zero before weighing
• Units switched to kilograms, not pounds
• Quarter pound or tenth of a pound measurement not properly converted

L I F E C Y C L E S E R I E S : A N T H R O P O M E T R I C S
1 0
• Child or adult not in center of scale or moving around or holding onto an object or a person
• Using the wrong equipment, such as a bathroom scale
• Poorly maintained equipment
• Equipment not properly calibrated
• Reading and recording measurements incorrectly
1.18 Review Activity 2 Test your knowledge with this review activity. Select the correct measurement in pounds and ounces for each of the measurements displayed. If needed, use the table icon to help convert to ounces. Click 'SUBMIT' to check your answers.
(Pick many, 10 points, 2 attempts permitted)
Slide “Try Again”: You did not select the correct responses.
Slide “Incorrect”: You did not select the correct responses. The correct responses are:
1. 132 pounds 3 ounces
2. 189 pounds 6 ounces
3. 87 pounds 0 ounces
4. 138 pounds 8 ounces
5. 121 pound 4 ounces
6. 35 pounds 12 ounces
Slide “Correct”: That’s right! You selected the correct responses.
7. 132 pounds 3 ounces
8. 189 pounds 6 ounces
9. 87 pounds 0 ounces
10. 138 pounds 8 ounces
11. 121 pound 4 ounces
12. 35 pounds 12 ounces
1.19 Measuring Recumbent Lengths of Infants Now that you have a good understanding of what is needed to accurately weigh women, children and infants, it’s time to learn how to measure lengths and heights. We’ll start with infants, just like we did before.

L I F E C Y C L E S E R I E S : A N T H R O P O M E T R I C S
1 1
Infants 24 months or less need to be measured lying down. Makes sense, right? After all, if the child cannot stand, how else would you measure him? This lying down measurement is called recumbent length, and requires a recumbent length board, as shown here.
The recumbent length board has a fixed headpiece and sliding footboard that rests against the infant’s feet. The foot area is where you’ll read the measurement. Units for this measurement are entered into the computer system as inches and eighths of an inch, such as 20 and 3/8 inches, which are the same units used for heights of women and children.
As mentioned, this device is typically used with infants and children up to 24 months; however, it can still be used with children up to 36 months, if the child is less than 30 inches in length while lying down or if he has trouble standing on his own due to something like a developmental disability.
Next, you'll see a short video on how to take recumbent length.
1.20 Video: Measuring Recumbent Lengths In this video, you'll see how to measure recumbent length. After watching this video, we'll go over how to read the measurements, as well as rounding them up or down, if needed.
Infant Recumbent Length In this video, we’ll be measuring the length of a 2-month-old infant using a recumbent length board.
Before measuring, have the caregiver remove shoes and any heavy clothing the child might be wearing. Make sure that a paper liner is placed onto the board and that the child's diaper is dry. Have the caregiver change it, if necessary.
Since the headboard needs to rest flat against the child’s head, make sure anything like hair clips or hats are removed. Some hairstyles, like braids, can also prevent the headboard from resting flat, and can cause an inaccurate measurement. Under these circumstances, have the caregiver do her best to flatten the hair. If the caregiver is unable to do so, record it in the chart.
The caregiver will then gently place the child flat on his back, then hold the child’s head firmly against the headboard by gently cupping their hands over the child’s ears. You can then bring the child’s legs together by holding both of the child’s ankles with one hand. Use your hand and arm to firmly, but gently, push down on the legs to straighten them out.
Make sure the child's head is flat against the headboard, and both legs are straight and feet are flat against the footboard, as this will ensure an accurate measurement. You can then slide the footboard flat against the bottom of the child’s feet using your free hand.
Make a mental note of this measurement to the nearest one eighth of an inch. Two measurements are required to ensure accuracy, so move the footboard out. Recheck the child's position to make sure the child's head is flat against the headboard, and that the legs are straight, then reposition the footboard. Make sure the child's feet are flat before taking the

L I F E C Y C L E S E R I E S : A N T H R O P O M E T R I C S
1 2
second measurement.
These two measurements need to be within 1/4 of an inch of each other. If they aren’t, take a third measurement, and average the two closest measurements. This final value can then be entered in the computer system, along with the date it was taken.
Since children are not comfortable in this position, they might become fussy or cry. Keep patient and focus on getting two accurate measurements. With some time and practice, you’ll perfect your ability and become very skilled at this technique.
This is how you measure the recumbent length of an infant.
1.21 Reading Recumbent Length Measurements As you heard previously, each 1" increment on the recumbent length board is broken down into 1/8ths of an inch. And since you’ll need to enter the measurement to the nearest 1/8th inch into the computer, you’ll need to round up or round down, if the measurement is in between eighths. You know what that means, right? Anything beyond the half-way point gets rounded up to the next higher eighth and anything below, you got it… gets rounded down.
Take a look at this image. Let's say the heels of the child went to the red line. Since the heels went further than the halfway point between 4/8" and 5/8", you'd round this measurement up to 21 5/8". If the measurement was less than the halfway point, you'd round down to 21 4/8". What if the measurement was right in the middle? Exactly. You'd round it up to 21 5/8".
Next, we’ll take a look at some of the most common errors in measuring lengths.
1.22 Common Errors: Recumbent Lengths Let’s take a look at the most common errors in taking recumbent length. As with weighing, with a little bit of planning ahead, these errors can easily be avoided, too.
Click the table to see the most common errors in measuring recumbent length.
Most Common Errors in Measuring Recumbent Length
• Incorrect equipment for the age of the child.
• Shoes, hats, and hair accessories not removed
• Board not firmly against both heels
• Feet not parallel to moveable board
• Head not firmly against headboard, remove braids, barrettes, ponytails, or anything that prevents board from resting against the head
• Body not straight
• Eyes not looking forward
• Body or knees arched or bent

L I F E C Y C L E S E R I E S : A N T H R O P O M E T R I C S
1 3
• Only one leg extended
• Board not on a flat surface
1.23 Review Activity 3 Test your knowledge with this review activity. Select the correct measurement shown on the recumbent length board. Click 'SUBMIT' to check your answers.
Slide “Incorrect”: That is incorrect. Please try again.
Slide “Incorrect”: You did not select the correct responses. The correct responses are:
1. 19 1/8 inches
2. 20 inches
3. 20 4/8 inches
Slide “Correct”: That’s right! You selected the correct responses.
4. 19 1/8 inches
5. 20 inches
6. 20 4/8 inches
1.24 Taking Heights- Children 24 Months or Older Let’s face it. Children grow quickly. In fact, by 24 months most toddlers will be able to stand on their own, so you will measure them standing up using the stadiometer, which is the device used to measure the heights of adults and older children. We’ll talk about how to do this in the coming pages.
Why is this so important? Well, using the child’s height, and not length, will allow you to calculate the Body Mass Index of a child aged two and older. That’s why we’d like to take height, as soon as the child is two years old.
Now, we’ll talk about the importance of Body Mass Index in lesson two, as well as how to interpret growth chart information for your clients, but for now, realize that Body Mass Index is an important number used to determine if the child is at risk for any nutrition-related concerns.
Oh, one more thing. Some computer systems auto-default to recumbent length for children 36 months and younger. This mean you’ll want to make note of taking standing height in the lab, so when you or someone else enters it into the computer, the system will be able to calculate the Body Mass Index for you.
1.25 Measuring Heights of Adults and Children

L I F E C Y C L E S E R I E S : A N T H R O P O M E T R I C S
1 4
Now that you’ve seen how to take recumbent lengths of infants, you are now ready to measure the heights of adults and children over 30" using a stadiometer, which is the official name of this device. You’ve got to love the medical industry and their use of technical words.
The stadiometer can be wall-mounted, portable and either electronic or manual. Instead of a moveable footboard, as in the recumbent length board for infants, the stadiometer has a moveable headboard to accommodate for differences in height.
Manual stadiometers display measurements in inches and eighths of an inch, while digital or electronic stadiometers display measurements in inches and decimals, which need to be converted to eighths of an inch. On the 'Next' page, you’ll see two videos on how to measure height using these stadiometers
1.26 Video: Measuring height with Stadiometer In these videos, you'll see how height is measured using the manual and electronic stadiometer. After watching, we'll go over how to read the measurements. You may be taking two measurements, depending upon your agency's policies.
Click the images to watch the videos now.
Adult Manual Stadiometer In this video, we’ll be measuring the height of an adult using a manual stadiometer.
Before measuring, have the client take off her shoes, and any heavy clothing she might be wearing.
Since the headboard needs to rest flat against the client's head, make sure anything like hair clips or hats are removed. Some hairstyles, like braids, can also prevent the headboard from resting flat, and can cause an inaccurate measurement. Under these circumstances, have the client do her best to flatten her hair. If the client is unable to do so, record it in the chart.
Have the client stand under the headboard. Make sure the client’s heels, buttocks, shoulders and head are all flat up against the vertical beam before lowering the headboard. This will ensure an accurate measurement.
Loosen the wing nut that holds the headboard in place. Then lower the headboard gently onto the client’s head and re-tighten the nut. Read the measurement at the “Read Here” arrow or designated line to the nearest one eighth of an inch.
Two measurements are required to ensure accuracy. Loosen and move the headboard up. Recheck the client’s position to make sure the client’s heels, buttocks, shoulders and head are all flat against the vertical beam. Lower the headboard firmly onto the client’s head and take a second measurement.
These two measurements need to be within 1/4". If they aren’t, take a third measurement, and use the average of the two closest measurements. This final value can then be entered in the computer system, along with the date it was taken.

L I F E C Y C L E S E R I E S : A N T H R O P O M E T R I C S
1 5
This is how you measure the height of an adult or child using a manual stadiometer.
Child Electronic Stadiometer In this video, we’ll be measuring the height of a four-year-old boy using an electronic stadiometer.
Before measuring, have the caregiver remove shoes and any heavy clothing the child might be wearing.
Since the headboard needs to rest flat against the child’s head, make sure anything like hair clips or hats are removed. Some hairstyles, like braids, can also prevent the headboard from resting flat, and can cause an inaccurate measurement. Under these circumstances, have the caregiver do her best to flatten the child's hair. If the caregiver is unable to do so, record it in the chart.
Have the child stand under the headboard. Make sure the child’s heels, buttocks, shoulders, and head are all flat against the vertical beam before lowering the headboard onto the head. This will ensure an accurate measurement. Lower the headboard gently onto the child’s head and note the measurement. Most digital stadiometers measure in decimal values, which you'll need to convert to eights of an inch. You’ll learn how to convert these numbers later in the course. Your supervisor will also inform you of your state's requirements, as well as the unit of measurement you'll need to enter into your computer system.
Two measurements are required to ensure accuracy, so raise the headboard, double check the child’s position to make sure the child’s heels, buttocks, shoulders, and head are all flat against the vertical beam. Lower the headboard firmly onto the child’s head and write down the second measurement.
These two measurements to be within 1/4". If they aren’t, take a third measurement, and use the average of the two closest measurements. This final value can then be entered in the computer system, along with the date it was taken.
This is how you take the height of a child using a digital stadiometer.
1.27 Reading the manual Stadiometer As you know, each 1" increment on the manual stadiometer is broken down into 1/8ths, just like with the recumbent length board. And like with recumbent length, you will round your measurement up or down, if the measurement is between 1/8ths.
Each stadiometer also has a “Read Here” or designated line to mark the measurement. Per the “Read Here” area in this image, the height of this individual would be, right… 67 4/8 inches.
On the 'Next' page, we’ll take a look at reading the digital stadiometer.
1.28 Reading the Digital Stadiometer

L I F E C Y C L E S E R I E S : A N T H R O P O M E T R I C S
1 6
Digital stadiometers make taking heights pretty easy. Just move the headboard up and down, and the measurement adjusts on the display. Easy stuff: however, since this is a digital display, you’ll need to convert the decimal values into 1/8ths of an inch. The following table will help you do that. We’ve included it in the job aid, too.
1.29 Common Errors: Standing Height Let’s take a look at the most common errors in taking standing height. With a little bit of planning ahead, they, too, can easily be avoided.
Click the table to see the most common errors in measuring standing height.
Common Errors in Height Measurements
• Incorrect equipment
• Shoes and hats not removed
• Feet not straight or flat on the floor
• Shoulders, buttocks, head, and heels not firmly against the backboard
• Head not held straight or eyes not looking forward
• Head not firmly against headboard; remove braids, barrettes, ponytails, or anything that prevents board from resting against the head. If unable to do so, record in WIC computer system.
• Knees bent
1.30 Review Activity 4 Test your knowledge with this review activity. If the “Read Here” was at the blue arrow, how tall would the individual be? Select the correct height from the choices. Click 'SUBMIT' to check your answers.
Slide “Incorrect”: That is incorrect. Please try again.
Slide “Incorrect”: You did not select the correct responses. The correct responses are:
1. 65 6/8 inches
2. 66 2/8 inches
3. 66 7/8 inches
Slide “Correct”: That’s right! You selected the correct responses.
1. 65 6/8 inches
2. 66 2/8 inches
3. 66 7/8 inches

L I F E C Y C L E S E R I E S : A N T H R O P O M E T R I C S
1 7
1.31 Review Activity 5 Ok, this time. Select the correct eighth-inch measurement for the electronic display. Use the table icon to help convert the digital display. Click 'SUBMIT' to check your answers.
Slide “Try Again”: You did not select the correct responses.
Slide “Incorrect”: You did not select the correct responses. The correct responses are:
1. 58 5/8 inches
2. 58 1/8 inches
3. 58 7/8 inches
4. 58 3/8 inches
Slide “Correct”: That’s right! You selected the correct responses.
1. 58 5/8 inches
2. 58 1/8 inches
3. 58 7/8 inches
4. 58 3/8 inches
1.32 When to Take a Third Measurement Let’s face it. There will be times when kids will not cooperate like you want them to. They can fidget, squirm and even cry, making your measuring difficult. And if you work at an agency that requires two measurements to be within a certain range, like a half an ounce for an infant’s weight, and they aren’t, what do you do?
In cases like these, you might need to take a third measurement, then average the two closest measurements and enter it into your WIC computer. If you find yourself in this situation, make sure to check with your supervisor, as well as your agency’s policy manual, about what to do.
1.33 A Client’s Previous Documentation Before you head off to learn about what the Body Mass Index is in the next lesson, or BMI for short, and how it's used in growth charts to assess risk, there’s one final thing to cover. That is, what if a mother or caregiver comes in with previous weight, height and/or length documentation from her health care provider. It makes sense to be able to use this information, doesn’t it?
Yes, it does. And you can. But there are some things to remember:
• The documentation must have been taken within the last 60 days, and must reflect current health status (i.e., was the woman pregnant then?).

L I F E C Y C L E S E R I E S : A N T H R O P O M E T R I C S
1 8
• The documentation must be official paperwork from a health care provider, like a physician’s prescription pad, letterhead, or a computer printout with the doctor’s name/address on it.
• Make sure to enter these measurements into the WIC computer system using the date on which they were taken; this contributes to the overall health assessment.
• You can still take anthropometric measurements that day, if possible; however, this is not mandatory, but suggested. The more measurements we have on our clients, the better we can assess their growth.
Okay, all the basics are covered. Next, you’ll take a short review, and then we’ll cover what Body Mass Index (BMI) is and how it will be used to determine whether or not a client is at risk in the next lesson.
1.34 Review Activity 6 Let’s see what you’ve learned in this lesson. Answer each question. Make sure you click ‘Submit’ to check your answers.
(Pick many, 10 points, 2 attempts permitted)
Slide “Try Again”: You did not select the correct responses.
Slide “Incorrect”: You did not select the correct responses. The correct responses are:
1. Recumbent length board
2. False
3. True
4. Ask your supervisor or another WIC staff member what measurement units your anthropometric equipment takes measurements in
Slide “Correct”: That’s right! You selected the correct responses.
1. Recumbent length board
2. False
3. True
4. Ask your supervisor or another WIC staff member what measurement units your anthropometric equipment takes measurements in
1.35 Lesson One Summary In this lesson, you learned about the four factors that affect growth, and how to take anthropometric measurements using equipment such as the balance beam and electronic scale, a recumbent length board, and how to measure height using a stadiometer, both manual and digital.

L I F E C Y C L E S E R I E S : A N T H R O P O M E T R I C S
1 9
You also learned about needing to ask your supervisor and checking your agency’s policy manual for the number of measurements you’ll need to take, the units of measurement your equipment displays in, whether or not you’ll need to convert the units, when or if a third measurement is necessary, and whether or not you can use your client’s previous documentation.
In this 'Next' lesson, you’ll get to see how anthropometric measurements are used to determine if your client is at risk for any nutrition-related concerns.
Click ‘Next’ to access the 'Next' lesson and learn how Body Mass Index is calculated and used in growth charts, and how to interpret growth chart information for your clients.
Module 2: BMI & Interpreting Growth Charts
2.1 Introduction Welcome to Lesson Two. Now that you know how to take anthropometric measurements, it’s time to learn how to interpret growth charts using anthropometric data.
There are two organizations that have developed growth standards for children: the Centers for Disease Control (CDC) and the World Health Organization (WHO).
CDC growth charts are based on the results obtained from the National Health and Nutrition Examination Survey (NHANES) which studied the growth patterns for children and adults throughout the U.S. These charts show how children have grown in a particular time and place. Those studied were a mixture of both breastfed and formula fed infants and children.
2.2 History Introduction In 2006, WHO released international growth standards which describe the growth of children ages 0 to 59 months living in optimal conditions in six countries throughout the world, including the U.S. Those studied were exclusively breastfed for at least four months, with continued breastfeeding at 12 months of age. The WHO charts show how infants and young children should grow regardless of time or place.
To monitor growth in children, the American Academy of Pediatrics (AAP), National Institutes of Health (NIH) and CDC recommend national use of WHO charts from birth to 2 years and continued use of the CDC charts for children 2 years and older.
Growth charts are not intended to be used as a sole diagnostic instrument. Instead, they are used to assess physical growth over time and as a piece of the overall nutrition assessment puzzle.
On the next page, we’ll take a look at two different types of growth charts.
2.3 Growth Charts

L I F E C Y C L E S E R I E S : A N T H R O P O M E T R I C S
2 0
For purposes of interpreting growth charts in WIC, we’ll use two types of growth charts using these national standards:
• Children less than 24 months: WHO percentiles are used to show how a child should grow compared to other children their age under optimal conditions.
• Children 24 months or older (measured standing): CDC percentiles and Body Mass Index (BMI) are used to show how a child is growing compared to other children of the same age who grew in a particular time and place
First up, you will learn about WHO growth charts for children under 24 months.
2.4 How to Interpret Growth Charts To interpret growth charts for children less than 24 months of age, it’s important to understand what a percentile is, so let’s plot a point for an 18-month-old boy weighing 26 pounds. It’s important to note that only a percentile, not Body Mass Index or BMI for short, is used for children less than 24 months. As you heard in Lesson One, Body Mass Index is never used for this stage of development. We’ll talk about Body Mass Index when we get to growth charts for children 24 months or older.
To determine the child’s percentile, find the boy’s age on the chart (18 months). Second, find the boy’s weight (26 pounds). The intersection of these two points shows the percentile. In this case, the intersection of the lines falls directly on the line marked 75. So, what does this 75 mean?
It means that the child is heavier than 75 percent of boys his age living in optimal conditions. 25 percent of boys his age in optimal conditions weigh more. Is this normal? Yes. Anything above the 2nd and below the 98th percentiles can be a “normal” value on the WHO chart, but what is more important than the plot is how the child grows over time. It is typical for children to remain on or near the same percentile curve as they age, this is what you are assessing when looking at growth charts. Yes, there is some variation to this, as each individual child’s growth pattern is unique, but a few percentiles up or down isn’t uncommon. However, if a child has a dramatic change, such as a 25% change or more, it may require more assessment.
On the next page, we’ll discuss the meaning of the various percentiles for children in this age bracket. Click Next to go there now.
2.5 How to Interpret Growth Charts, Continued This WHO chart is used for boys from birth to 24 months who cannot stand on their own. Anything between the 2nd and 98th percentiles is normal on the WHO chart. It’s similar for girls, except for the values on the chart and the color being pink, not blue. Now, once children reach 24 months AND can stand on their own, which will be most kids except those with developmental disabilities, we’ll use another growth chart, which we will see shortly.
On the next page, we'll take a look at some examples of how to interpret this growth chart.
L I F E C Y C L E S E R I E S : A N T H R O P O M E T R I C S
2 1
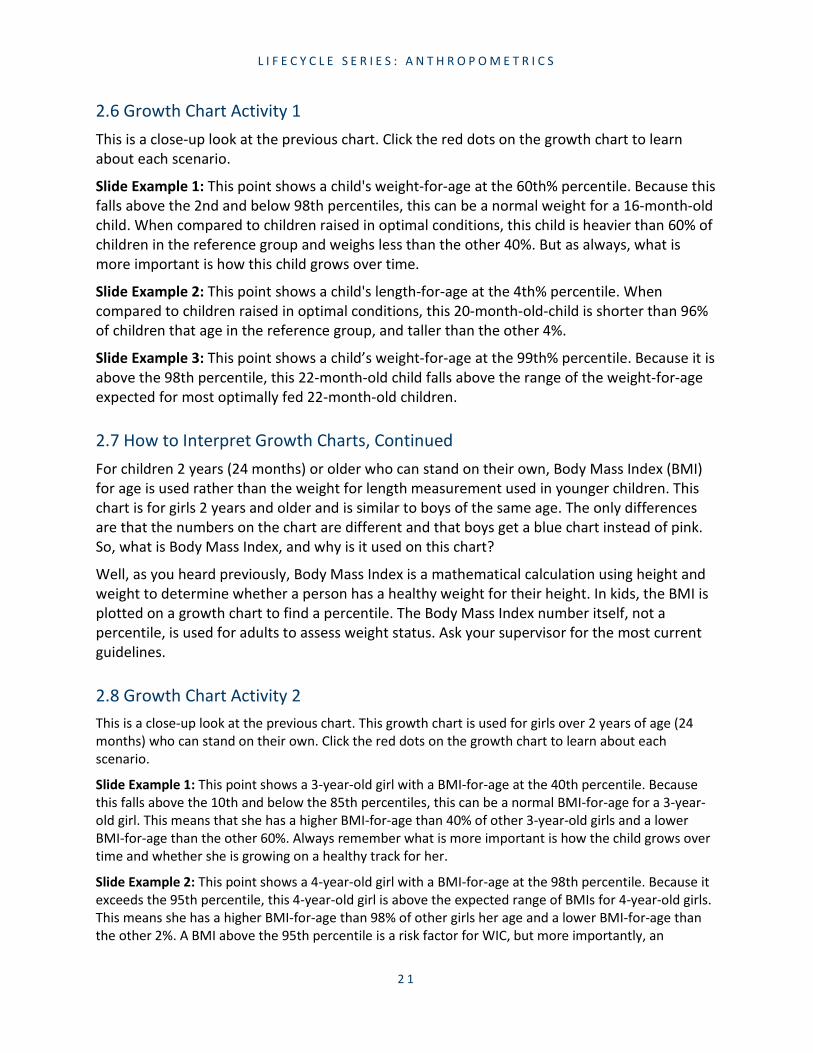
2.6 Growth Chart Activity 1 This is a close-up look at the previous chart. Click the red dots on the growth chart to learn about each scenario.
Slide Example 1: This point shows a child's weight-for-age at the 60th% percentile. Because this falls above the 2nd and below 98th percentiles, this can be a normal weight for a 16-month-old child. When compared to children raised in optimal conditions, this child is heavier than 60% of children in the reference group and weighs less than the other 40%. But as always, what is more important is how this child grows over time.
Slide Example 2: This point shows a child's length-for-age at the 4th% percentile. When compared to children raised in optimal conditions, this 20-month-old-child is shorter than 96% of children that age in the reference group, and taller than the other 4%.
Slide Example 3: This point shows a child’s weight-for-age at the 99th% percentile. Because it is above the 98th percentile, this 22-month-old child falls above the range of the weight-for-age expected for most optimally fed 22-month-old children.
2.7 How to Interpret Growth Charts, Continued For children 2 years (24 months) or older who can stand on their own, Body Mass Index (BMI) for age is used rather than the weight for length measurement used in younger children. This chart is for girls 2 years and older and is similar to boys of the same age. The only differences are that the numbers on the chart are different and that boys get a blue chart instead of pink. So, what is Body Mass Index, and why is it used on this chart?
Well, as you heard previously, Body Mass Index is a mathematical calculation using height and weight to determine whether a person has a healthy weight for their height. In kids, the BMI is plotted on a growth chart to find a percentile. The Body Mass Index number itself, not a percentile, is used for adults to assess weight status. Ask your supervisor for the most current guidelines.
2.8 Growth Chart Activity 2 This is a close-up look at the previous chart. This growth chart is used for girls over 2 years of age (24 months) who can stand on their own. Click the red dots on the growth chart to learn about each scenario.
Slide Example 1: This point shows a 3-year-old girl with a BMI-for-age at the 40th percentile. Because this falls above the 10th and below the 85th percentiles, this can be a normal BMI-for-age for a 3-year-old girl. This means that she has a higher BMI-for-age than 40% of other 3-year-old girls and a lower BMI-for-age than the other 60%. Always remember what is more important is how the child grows over time and whether she is growing on a healthy track for her.
Slide Example 2: This point shows a 4-year-old girl with a BMI-for-age at the 98th percentile. Because it exceeds the 95th percentile, this 4-year-old girl is above the expected range of BMIs for 4-year-old girls. This means she has a higher BMI-for-age than 98% of other girls her age and a lower BMI-for-age than the other 2%. A BMI above the 95th percentile is a risk factor for WIC, but more importantly, an

L I F E C Y C L E S E R I E S : A N T H R O P O M E T R I C S
2 2
indicator that a further detailed assessment of the family’s nutrition practices can provide more information to assess this situation.
Slide Example 3: This point shows a 2-year-old girl with a BMI-for-age at the 3rd percentile. Because it is below the 5th percentile, this 2-year-old girl falls below the expected range of BMIs for 2-year-old girls. This means she has a lower BMI-for-age than 97% of other girls her age and a higher BMI-for-age than the other 3%. A BMI below the 5th percentile is a risk factor for WIC, but more importantly, an indicator that a further detailed assessment of the family’s nutrition practices can provide more information to assess this situation.
2.9 Accuracy of Taking Measurements After seeing how to interpret growth charts using heights, weights and BMIs, I'm sure you can see why it’s so important to be accurate and precise with your measurements. Errors can create an inaccurate BMI. And an inaccurate BMI leads to an incorrect health assessment. And that doesn’t do anyone any good.
Here are a couple of points to keep in mind. First, BMI is never calculated for children less than 24 months or who are measured recumbently. That’s why it wasn’t on the chart. Secondly, weight loss is NEVER recommended for children. It is important to remember that not only is a single plot important, but also the way a child tracks over time.
2.10 Accuracy of Taking Measurements, Continued Take this case, for example. A fully formula-fed infant had been tracking at the 50th percentile on the WHO weight-for-length growth chart for the past several months. At 9 months old, the infant is weighed again and has suddenly dropped on the chart to the 2nd percentile. Luckily, the WIC staff member noticed the drop and began to assess how much formula and complimentary foods the infant was consuming. Through open-ended questions and probing, the WIC staff member discovered that the caregiver was adding extra water to the formula so that she wouldn’t run out at the end of the month. The WIC staff member was then able to provide nutrition education and the appropriate referrals to the caregiver.
2.11 Review Activity 1 Let’s see what you’ve learned in this lesson. Answer each question. Make sure you click ‘SUBMIT’ to check your answers.
(Pick many, 10 points, 2 attempts permitted)
Slide “Try Again”: You did not select the correct responses.
Slide “Incorrect”: You did not select the correct responses. The correct responses are:
1. Weight and Height
2. True
3. True
Slide “Correct”: That’s correct! You selected the correct responses.

L I F E C Y C L E S E R I E S : A N T H R O P O M E T R I C S
2 3
1. Weight and Height
2. True
3. True
2.12 Children with Special Needs/Circumstances Every now and then, you'll come across a child who has special needs. Children with birth defects or congenital disorders, such as Downs Syndrome, fall into this category. You may also come across a child who has been diagnosed as Failure to Thrive or FTT.
In these cases, it may be difficult to assess the child's growth using standard growth charts. Consult with the nutritionist at your clinic or your supervisor as to how you should take heights and weights.
2.13 Discussing Growth Charts with Caregivers Most parents do not understand percentiles, or incorrectly interpret what they mean. For example, they may hear "99th percentile" and see it as good because in school a 99% is considered an A+ grade.
Rather than referring to the percentile number, effective communication with the caregiver focuses more on the growth pattern over time or its location in the range of "normal" on the chart.
Here are some examples of how to discuss growth charts with caregivers:
• "In general, children plot somewhere between these lines. Your child is plotting here today."
• "What is more important than each dot is the trend over time and if the trend stays around the same line on the grid."
• "The growth is only one piece of the puzzle when it comes to nutrition. I would like to hear more about how you feel regarding his/her appetite."
Now that you’ve learned how to take anthropometric measurements and know how to plot points on growth charts for children, let’s take a closer look at weight gain in pregnant women.
2.14 Pregnancy & Prenatal Weight Gain Do you know the official medical term for weight gained during pregnancy? It’s called gestational or prenatal weight gain. And as a WIC staff member, you’ll be following this weight gain throughout your client’s pregnancy.
With pregnant women, the pattern of weight gained, such as two pounds in one month and three pounds the next, is just as important as the total amount of weight gained. This is because both the pre-pregnancy weight and the total weight gained during pregnancy affect

L I F E C Y C L E S E R I E S : A N T H R O P O M E T R I C S
2 4
fetal growth, the infant’s birth weight, and the health of the mother. A woman increases her chance of having a healthy pregnancy and delivery by gaining a healthy amount of weight.
What is the recommended amount of weight a woman should gain over the course of her pregnancy? That’s what we’re going to discuss on the next page.
2.15 Pregnancy & Prenatal Weight Gain, Continued Let's say a woman comes into your WIC clinic and is six weeks pregnant. How much weight does she need to gain during her pregnancy?
If you think it's different for every woman, you're almost there. The recommended weight gain for a pregnant woman is based upon her pre-pregnancy Body Mass Index, which is calculated from her height and her pre-pregnancy weight.
But wait a minute. If she's pregnant, how do I get her pre-pregnancy weight? Great question. All you have to do is ask. And if she doesn't know? Simply ask her how much weight she thinks she's gained since she's been pregnant. Document what she says her pre-pregnancy weight was or how much weight she thinks she has gained so far. You can then use this to get her pre-pregnancy weight. So if she is 156 pounds now, and thinks she has gained 6 pounds since being pregnant, her pre-pregnancy weight would be 150 pounds.
You can then use this weight and her current height, enter it into the WIC computer system and get her pre-pregnancy BMI. Once you’ve got that, you can determine her target weight gain range using a table like this. For instance, if the computer gave you a pre-pregnancy BMI of 22, you’d see she was of normal weight, and would need to gain 25-35 pounds. Pretty easy and straightforward.
On the next page, you’ll learn about some special considerations when it comes to pregnancy and weight gain. Click Next to continue.
2.16 Considerations: Pregnancy & Prenatal Weight Gain Here are some special considerations when it comes to pregnancy and weight gain:
• Weight gain goals for women with low BMI are higher than those with normal BMIs.
• Women who are underweight before pregnancy tend to have smaller babies than heavier women, even when both women gain the same amount of weight during pregnancy.
• Women with high BMIs do not need to gain as much weight as women with normal BMIs
• A slightly lower or higher rate of weight gain than recommended is not cause for alarm, as long as there is a progression toward the recommended goal.
On the next page, you'll see how the WIC computer system compares the actual amount of weight your client gains to this target range. Let’s go there now.
L I F E C Y C L E S E R I E S : A N T H R O P O M E T R I C S
2 5
2.17 How to Interpret Prenatal Weight Gain Charts Now that you’ve found your client’s recommended weight gain range using her pre-pregnancy BMI, you’ll need to monitor whether or not she is staying within this range throughout her pregnancy. Prenatal weight gain grids, as shown here, differ by pre-pregnancy category. Prenatal weight gain grids for single pregnancies are different than those for women with multi-fetal pregnancies.
On the next page, you’ll see how you can easily plot the weight gain of a woman whose pre-pregnancy BMI placed her within the normal range.
2.18 How to Interpret Prenatal Weight Gain Charts, Continued Let’s say you had a client come in whose pre-pregnancy BMI showed she had a normal BMI. The recommended amount of weight gain for this client would be about 25-35 pounds, which corresponds to the white region on the prenatal weight gain graph for a normal BMI shown here.
On her first visit to the office, right around week five, her weight gain was about five pounds, slightly above the recommended amount. On her next visit, it was five pounds again, a pound or so under what’s recommended for that visit. On the next three visits, she pretty much stayed on track for her target amount. Can you do this for underweight women or women with BMIs that are low or high? You bet. The only difference would be to select the prenatal weight gain graph that corresponds to the woman’s pre-pregnancy BMI. For example, a pregnant woman who has a pre-pregnancy BMI below 18.5 should be plotted on the prenatal weight gain graph designated for her pre-pregnancy BMI.
As you can see, prenatal weight gain grids are a useful tool allowing you to quickly assess if your client’s weight gain puts her at risk or if it is within the recommended range.
2.19 Trimesters A full-term pregnancy lasts 3 trimesters, which is 40 weeks, and is measured from the mother's last menstrual period. That makes each trimester right around 13 weeks long.
From this prenatal weight gain grid, you can see that weight is slowly gained - only a few pounds in the first trimester, but then a steady ½ pound to 1 pound per week in the second and third trimesters. Of course, the recommended amount of weight gain per trimester depends upon pre-pregnancy BMI.
Using this chart, you can see how much weight your client gains per trimester, as each trimester is marked by thick vertical lines.
2.20 Discussing Growth Charts with Pregnant Women

L I F E C Y C L E S E R I E S : A N T H R O P O M E T R I C S
2 6
Pregnancy can be a stressful time, and weight gain grids can lead to confusion and add to mom’s stress. A weight gain grid can be a useful nutrition education aid, and it is important to effectively explain it to mom when she is interested in discussing pregnancy weight gain.
Here are some examples of how to discuss weight gain grids with pregnant women:
• “In general, pregnant women plot somewhere between these two lines. You are plotting here today.”
• “We only have one measurement to look at today. What is more important is how this looks over time."
• “The grid is only one piece of the puzzle when it comes to nutrition. I would like to hear more about how you feel regarding your appetite”
2.21 Review Activity 2 Let’s see what you’ve learned in this lesson. Answer each question. Make sure you click ‘SUBMIT’ to check your answers.
(Pick many, 10 points each, 2 attempts permitted)
Slide “Try Again”: You did not select the correct responses.
Slide “Incorrect”: You did not select the correct responses. The correct responses are:
1. True
2. The weight gain is slower at first, then picks up to a steady ½ pound to 1 pound per week and how much weight she gains per trimester.
Slide “Correct”: That’s correct! You selected the correct responses.
1. True
2. The weight gain is slower at first, then picks up to a steady ½ pound to 1 pound per week and how much weight she gains per trimester.
2.22 Premature Births If a baby is born prematurely, it means the baby was born at or before 37 weeks of gestation, which is at least 21 days early.
Your computer system will automatically calculate adjusted gestational age for you, when the baby’s due date and actual date of birth are entered.
As a WIC staff member, it is helpful to understand what this calculation is. We’ll discuss this on the next page.
2.23 Adjusted Gestational Age

L I F E C Y C L E S E R I E S : A N T H R O P O M E T R I C S
2 7
When a pregnant woman comes in for Certification, she would likely have seen her doctor already and been given a due date. This due date is often called an “Expected Date of Delivery” (EDD) or “Expected Date of Confinement” (EDC). This is typically 40 weeks from her last menstrual period; however, as you heard before, not all pregnancies make it to 40 weeks, and those babies are born prematurely. For these situations we use "adjusted age” to plot weights and lengths in addition to chronological age plots, so for these babies you will have two plots on the growth grid each time a measurement is done.
Because these babies were born early, they've had less time to develop, so when they're born, you can adjust all growth measurements, including size and developmental milestones, based on their adjusted gestational age so it more accurately reflects the expectations for their growth and development. For more information on this, talk to your supervisor.
Let’s look at an example of how to calculate adjusted gestational age on the next page.
2.24 Adjusted Gestational Age, Continued Let's use an example. Let's say Sara was born at week 30, and her mother brings her in 2 weeks after her due date (considered week 42). Now, you might think Sara is 12 weeks old, which is true; that is her chronological age. But since a full-term pregnancy is 40 weeks long, and it's now two weeks beyond that date, her adjusted age is 2 weeks. It's easy to figure out. Just consider how many days or weeks beyond this 40-week period the child actually is.
Now, if a child was born at week 34, and the mother comes in a week before her actual due date, (week 39), what then? After all, if adjusted age is the number of days or weeks beyond 40 weeks, does this child have an adjusted age? Great question. You may see a warning message in your computer system that the baby’s due date has not occurred yet. All this means is that the child is premature, and adjusted age can’t be graphed because the computer can’t adjust age until the due date has occurred.
2.25 Review Activity 3 Let’s see what you’ve learned in this lesson. Answer each question. Make sure you click ‘SUBMIT’ to check your answers.
(Pick many, 10 points, 2 attempts permitted)
Slide “Try Again”: You did not select the correct responses.
Slide “Incorrect”: You did not select the correct responses. The correct responses are:
1. How to calculate a premature baby's age, if born prematurely
2. False
3. True
4. Her pre-pregnancy Body Mass Index
Slide “Correct”: That’s correct! You selected the correct responses.

L I F E C Y C L E S E R I E S : A N T H R O P O M E T R I C S
2 8
1. How to calculate a premature baby's age, if born prematurely
2. False
3. True
4. Her pre-pregnancy Body Mass Index
2.26 Recap: The Importance of Anthropometrics Pretty interesting stuff, isn’t it? Who knew height and weight measurements could mean so much to so many people? And the growth chart information? Well, as you can see, you’ll be helping mothers and caregivers understand how their child is growing by knowing how to interpret them.
So, let’s do a recap as to why taking accurate height and weight measurements are so important. Taking accurate measurements will allow you and others to:
• Identify women, infants, and children at risk for health problems.
• Provide counseling to prevent and correct nutrition-related health problems.
• Discuss growth and development of infants and children with their parent/caretaker
• Counsel pregnant women on their weight gain, and
• Evaluate the effectiveness of the nutrition counseling being offered
2.27 Lesson 2 Summary In this lesson, you've learned about how growth charts from the Center for Disease Control (CDC) and World Health Organization (WHO) are used to track growth patterns for children and adults.
You also learned about the two different growth charts for children: one for children less than 24 months (WHO), and the other for children 24 months and older measured standing (CDC).
You also learned that prenatal growth charts are used for pregnant women, and that the recommended amount of weight a woman needs to gain depends upon her pre-pregnancy BMI.
You also learned how to calculate adjusted gestational age for premature infants.
2.28 Course Summary You are now able to:
• Define the term Anthropometrics.
• Describe the 4 factors that affect growth.
• Understand how to accurately measure heights/lengths and weights.

L I F E C Y C L E S E R I E S : A N T H R O P O M E T R I C S
2 9
• Define Body Mass Index (BMI)
• Interpret growth charts and prenatal weight gain grids to clients
2.29 Congratulations! Congratulations! You’ve completed the Anthropometrics Training.
Minnesota Department of Health - WIC Program 85 E 7th Place, PO BOX 64882, ST PAUL MN 55164-0882; 651-201-4404, [email protected], www.health.state.mn.us; To obtain this information in a different format, call: 651-201-4404