Epithelial-Mesenchymal Interactions in Oral Cancer Metastasis
Upload
khangminh22Category
view
0download
0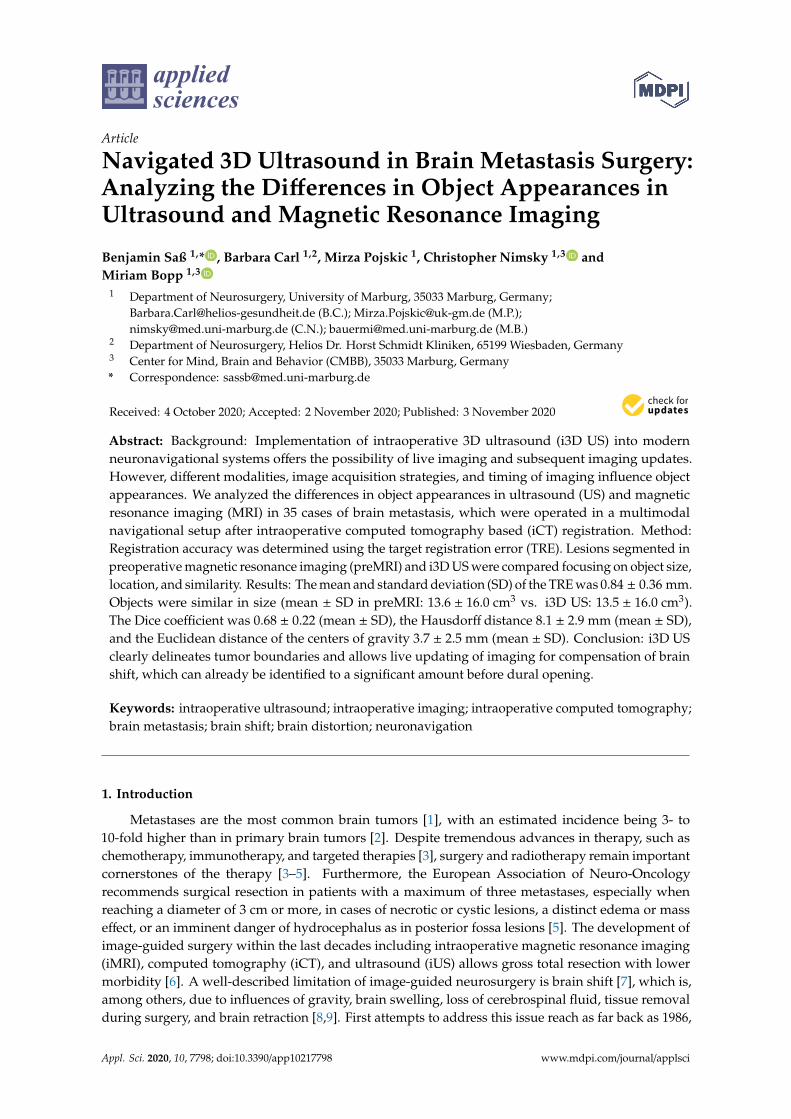
applied sciences
Article
Navigated 3D Ultrasound in Brain Metastasis Surgery:Analyzing the Differences in Object Appearances inUltrasound and Magnetic Resonance Imaging
Benjamin Saß 1,* , Barbara Carl 1,2, Mirza Pojskic 1, Christopher Nimsky 1,3 andMiriam Bopp 1,3
1 Department of Neurosurgery, University of Marburg, 35033 Marburg, Germany;[email protected] (B.C.); [email protected] (M.P.);[email protected] (C.N.); [email protected] (M.B.)
2 Department of Neurosurgery, Helios Dr. Horst Schmidt Kliniken, 65199 Wiesbaden, Germany3 Center for Mind, Brain and Behavior (CMBB), 35033 Marburg, Germany* Correspondence: [email protected]
Received: 4 October 2020; Accepted: 2 November 2020; Published: 3 November 2020�����������������
Abstract: Background: Implementation of intraoperative 3D ultrasound (i3D US) into modernneuronavigational systems offers the possibility of live imaging and subsequent imaging updates.However, different modalities, image acquisition strategies, and timing of imaging influence objectappearances. We analyzed the differences in object appearances in ultrasound (US) and magneticresonance imaging (MRI) in 35 cases of brain metastasis, which were operated in a multimodalnavigational setup after intraoperative computed tomography based (iCT) registration. Method:Registration accuracy was determined using the target registration error (TRE). Lesions segmented inpreoperative magnetic resonance imaging (preMRI) and i3D US were compared focusing on object size,location, and similarity. Results: The mean and standard deviation (SD) of the TRE was 0.84 ± 0.36 mm.Objects were similar in size (mean ± SD in preMRI: 13.6 ± 16.0 cm3 vs. i3D US: 13.5 ± 16.0 cm3).The Dice coefficient was 0.68 ± 0.22 (mean ± SD), the Hausdorff distance 8.1 ± 2.9 mm (mean ± SD),and the Euclidean distance of the centers of gravity 3.7 ± 2.5 mm (mean ± SD). Conclusion: i3D USclearly delineates tumor boundaries and allows live updating of imaging for compensation of brainshift, which can already be identified to a significant amount before dural opening.
Keywords: intraoperative ultrasound; intraoperative imaging; intraoperative computed tomography;brain metastasis; brain shift; brain distortion; neuronavigation
1. Introduction
Metastases are the most common brain tumors [1], with an estimated incidence being 3- to10-fold higher than in primary brain tumors [2]. Despite tremendous advances in therapy, such aschemotherapy, immunotherapy, and targeted therapies [3], surgery and radiotherapy remain importantcornerstones of the therapy [3–5]. Furthermore, the European Association of Neuro-Oncologyrecommends surgical resection in patients with a maximum of three metastases, especially whenreaching a diameter of 3 cm or more, in cases of necrotic or cystic lesions, a distinct edema or masseffect, or an imminent danger of hydrocephalus as in posterior fossa lesions [5]. The development ofimage-guided surgery within the last decades including intraoperative magnetic resonance imaging(iMRI), computed tomography (iCT), and ultrasound (iUS) allows gross total resection with lowermorbidity [6]. A well-described limitation of image-guided neurosurgery is brain shift [7], which is,among others, due to influences of gravity, brain swelling, loss of cerebrospinal fluid, tissue removalduring surgery, and brain retraction [8,9]. First attempts to address this issue reach as far back as 1986,
Appl. Sci. 2020, 10, 7798; doi:10.3390/app10217798 www.mdpi.com/journal/applsci

Appl. Sci. 2020, 10, 7798 2 of 14
when Kelly et al. assessed brain movement during neurosurgical procedures. They placed stainlesssteel reference balls into the tumor and obtained radiographic images, which allowed computeradjustment for tumor location in three-dimensional space [10]. Subsequently, different methods toassess the extent of brain distortion were developed utilizing a navigated pointer [11,12], microscope [9],optical scanning [13], or analysis of video images [9]. IMRI [14,15] and iUS allow analyzation of brainshift and deformation of brain or tumor structures [8]. However, brain shift is a dynamic phenomenonoccurring during the whole course of tumor resection, which can only be partially compensated byserially updated imaging [16]. While iMRI provides high-quality images, it is not widely available andhas its drawbacks, such as an interruption of the surgical procedure, limitations in patient positioning,specific requirements on the organization of the operating theatre and staff [17], and, not least, highcosts [18]. IUS, on the other hand, as introduced by Chandler et al. in 1982, who described the use ofintraoperative brightness modulation (B-mode) ultrasound in 21 neurosurgical procedures [19] andbegan to use it routinely in their institution [20], provides real-time imaging without or at least withonly minimal interruption of surgery, is nowadays widely available, and cost effective [21]. Initially,US did not receive much attention amongst neurosurgeons, probably mostly due to low imagingquality compared to other modalities, a lack of training and only few available specialized devices.The development of new integrative setups, combining neuronavigation and high quality ultrasounddrew attention to this intraoperative imaging modality again [22,23]. A major step forward in thepractical application of these systems was the introduction of navigated intraoperative 3D ultrasound(i3D US) [24,25], which allows updating of the 3D imaging data at several time points during surgeryand delivers information on brain shift and resection extent with high specificity [24,26].
A prerequisite for brain shift determination is an accurate registration of the preoperative imaging(e.g., MRI) and iUS. Using a navigational system, both modalities can be co-registered, reaching anaverage accuracy of less than 2 mm for deeply located reference structures, which are less prone toshifting, as demonstrated by Keles et al. [27]. Co-registration is based on the assumption of a rigidconnection between the coordinate frames of the equipment (e.g., US probe) and the object of interest(patient’s head). The violation of this basic assumption, caused by distortion within the brain tissueduring surgery, results in a mismatch between preoperative and intraoperatively acquired imaging,which can be reported as brain shift [28,29], and is expected to a larger extent after durotomy [23].
Generally, iUS is believed to improve resection control in tumor surgery. However, Chacko et al.described a rate of 18% of discordance between 2D iUS and postoperative imaging with regards tothe extent of tumor resection of parenchymal brain lesions [30]. Additionally, 2D ultrasound (either5 MHz phase array for deeply located or 10 MHz for superficial lesions) was found to be less reliablethan 1.5T iMRI in detecting small remnants of a size of less than 1 cm3 [31] and imaging qualitydiminishes during tumor resection [32]. Similarly, when using navigated 3D ultrasound in gliomasurgery, Rygh et al. found a high specificity and sensitivity of 95% before resection, which decreasedover the course of the operation and sensitivity was as low as 26% after resection, while specificityremained at 88% [33]. Nonetheless, the authors of the mentioned studies pointed out, that the benefitsof iUS outbalance the shortcomings, provided the surgeon is aware of its limitations [30–33].
In our institution, navigated 3D ultrasound became fully implemented into the workflow ofmost cranial procedures. For tumor resection, navigated i3D US images are acquired routinely aftercraniotomy and as a resection control after tumor removal. Since the initial ultrasound acquisitionis conducted before dural opening, one would assume the influence of brain shift to be moderate.However, displaying the ultrasound images as an overlay to the preoperative MRI during surgeryconveys in some cases the impression of object incongruency, although this method only allows agross estimation. Different aspects contributed to the decision to acquire the first i3D US before duralopening. First, the dural layer protects the brain and allows a gentle probe swiping over the surfacewithout direct contact to the cortex, while it does not cause significant artifacts. Second, the toughdural layer also reduces the influence of probe pressure and brain pulsation. Finally, we aimed toaddress the question of how the imaging modalities MRI and iUS resemble each other, respectively,

Appl. Sci. 2020, 10, 7798 3 of 14
differ under optimal conditions of a minimized brain shift, which is given at the earliest possibleoperative stage right after craniotomy. To specify this, we prospectively obtained navigated i3D USdatasets in a series of 35 cases of brain metastasis, which shared the feature to have more delineatedboundaries in US than, e.g., gliomas, as described by Unsgaard et al. before [34]. We compared i3D USto preoperative MRI, analyzing the tumor volume, shape, and distance of segmented objects.
2. Materials and Methods
The prospective study included initially 37 patients, who were operated between February 2019and July 2020. In the course of the study, two cases had to be excluded due incomplete image acquisition.
In all participants, preoperative MRI detected at least one lesion suggestive of brain metastasisand an interdisciplinary tumor board recommended resection. We obtained informed consent from allpatients included in this study and received ethics approval for prospectively archiving clinical andtechnical data applying intraoperative imaging and navigation (study no. 99/18).
All patients received an MRI within a few days before resection, typically encompassing a 3Ddata set of T1-weighted contrast-enhanced images. These were transferred to the navigational system(Brainlab, Munich, Germany), which consists of a ceiling mounted double monitor (Curve, Brainlab,Munich, Germany) and two displays (Buzz, Brainlab, Munich, Germany) and navigational software.
All patients were operated under general anesthesia. After narcosis induction the patients werepositioned on the operating room (OR) table and the head was fixed to a radiolucent carbon Dorohead clamp with metallic pins. A reference array with four reflective markers was attached to thehead clamp. Three fiducial markers were placed on the head within the scanning area, which werenot needed for registration. The OR table was rotated 90◦ to the 32-slice mobile CT scanner (AIRO,Brainlab, Munich) and a low-dose registration scan of 62 mm scan length was performed. Reflectivemarkers, which are permanently attached to the AIRO scanner, and the reference array must be in thefield of view of the navigational camera during the scanning process. The CT scan was automaticallytransferred to the navigational system and fused with the preoperative imaging datasets, establishingautomatic patient registration. The patient was rotated back, and registration accuracy was checked byplacing the navigational pointer into the divot of each skin fiducial. This allows the calculation of atarget registration error as the Euclidian offset of the pointer tip. The reference array was removedand replaced by a sterile one after draping. Details of the aforementioned set-up, scanning process,and patient registration were published before [35].
All patients received 40 mg of dexamethasone. After team time-out, skin disinfection, and steriledraping, the skin was incised. One-hundred-and-twenty-five milliliters of mannitol 15% wasadministered before craniotomy. After bone flap removal, and before dural opening, a navigatedi3D US dataset was acquired using the bk5000 system (bk medical, Herlev, Denmark), which wasconnected to the navigational system. For acquisition, a reference array with three reflective markersis attached to the precalibrated bk medical transducer N13C5, which is fully immersible, can besterilized and therefore be used without a sterile cover. The transducer offers a convex contact surfaceof 29 × 10 mm and has a scanning frequency of 5–13 MHz. Whenever possible, the patient’s headwas positioned in a way exposing the dura horizontally after bone removal, allowing a saline depotto be administered as a coupling fluid. During image acquisition the probe was smoothly sweptover the dura, whilst the reference arrays attached to the head clamp and the transducer were inthe line of sight of the navigational camera (Figure A1). The bk5000 actually generated 2D slicesof 0.3 mm, which were transformed into 3D image volumes and automatically registered by thenavigational software (Figure 1a). Those 3D data sets, which were now available during the furthersurgical procedure, were displayed in an overlay or side-by-side fashion, or as a standalone and couldbe reformatted to an oblique plane matching the surgeon’s view through the operating microscope(Figure 1b,c). A second image acquisition was performed after tumor removal as a resection control orif demanded at any timepoint during the surgery.

Appl. Sci. 2020, 10, 7798 4 of 14
Appl. Sci. 2020, 10, x FOR PEER REVIEW 4 of 14
(Figure 1b,c). A second image acquisition was performed after tumor removal as a resection control
or if demanded at any timepoint during the surgery.
(a)
(b)
(c)
Figure 1. (a) Live view of precalibrated ultrasound just before image acquisition. The yellow lines
indicate the tumor boundaries segmented in preMRI, depicting a spatial deviation. (b) Simultaneous
visualization of preMRI and corresponding i3D US slices. Segmented tumor objects are displayed in
yellow (preMRI) and orange (i3D US). (c) During surgery preMRI and i3D US datasets were acquired
during different surgical steps (1st row preMRI, 2nd row before dural opening, and 3rd row after
tumor resection) are displayed in an overlay fashion. Yellow lines indicate the preMRI tumor
segmentation.
Lesions were identified and segmented in the preMRI and pre-resectional ultrasound using the
smart brush tool element (Brainlab, Munich, Germany) in the navigational software, which
automatically calculates the tumor volume. The 3D datasets were exported to MeVisLab (MeVis
Medical Solutions AG, Bremen, Germany) for further calculations. To assess similarity of the objects,
the Dice coefficient [36] and the Hausdorff distances were computed.
Figure 1. (a) Live view of precalibrated ultrasound just before image acquisition. The yellow linesindicate the tumor boundaries segmented in preMRI, depicting a spatial deviation. (b) Simultaneousvisualization of preMRI and corresponding i3D US slices. Segmented tumor objects are displayed inyellow (preMRI) and orange (i3D US). (c) During surgery preMRI and i3D US datasets were acquiredduring different surgical steps (1st row preMRI, 2nd row before dural opening, and 3rd row after tumorresection) are displayed in an overlay fashion. Yellow lines indicate the preMRI tumor segmentation.
Lesions were identified and segmented in the preMRI and pre-resectional ultrasoundusing the smart brush tool element (Brainlab, Munich, Germany) in the navigational software,which automatically calculates the tumor volume. The 3D datasets were exported to MeVisLab (MeVisMedical Solutions AG, Bremen, Germany) for further calculations. To assess similarity of the objects,the Dice coefficient [36] and the Hausdorff distances were computed.

Appl. Sci. 2020, 10, 7798 5 of 14
The Dice coefficient (CDSC) is a spatial overlap index that can be used for comparing segmentedobjects [37,38] and is calculated as
CDsc =2 |AUS ∩ BMR|
|AUS|+ |BMR|
where AUS and BMR are number of voxels of the segmented objects. The Dice coefficient is restrictedto values between 0 and 1, with a value of 0 indicating no overlap and a value of 1 representing anexact match [38].
The Hausdorff distance measures the extent to which each voxel of one segmentation lies nearto some voxel of the other segmentation, and vice versa [39]. The calculated distance can be used tomeasure the degree of resemblance of the object contours [38,39].
The formula is defined as
H(AUS, BMR) = max{dmax(AUS, BMR), dmax(BMR, AUS)
}with dmax = max
a ∈ AUSmin
b ∈ BMR‖a− b‖ [38,39].
The Hausdorff distance is measured in mm; it is a small distance indicating a good resemblance ofthe segmented objects [38].
Furthermore, the geometric centers of gravity (CoG) were calculated, which have the advantageof being invariant under rotation, scaling and skewing, and a stable measurement even under randomnoise [40]. The CoG has been used for measuring the displacement of objects in different MRI sequencesbefore [41]. Put simply, the geometric center of gravity is calculated by summing up the coordinates ofvoxels, divided by the number of voxels:
CoGUS =1|AUS|
×
∑a ∈ AUS
a and CoGMR =1|BMR|
×
∑b ∈ BMR
b
The displacement is calculated by subtraction of the geometric centers of gravity, expressed asEuclidean distance.
For statistical analysis GrapPad Prism 8.4.3 (GrapPad Software, San Diego, CA, USA) for MacOSwas used.
If necessary, testing for normal distribution was performed using the D’Agostino and Pearson test.For the analysis of not normally distributed data either the two-tailed Mann–Whitney test (un-paired)or the Wilcoxon matched-pairs signed rank test (paired data) were used.
A p-value < 0.05 was considered statistically significant.
3. Results
3.1. Patient Characteristics
Of the 37 patients, two had to be excluded because the acquired i3D US did not capture thewhole lesion due to artifacts. Of the remaining 35, 18 were females and 17 males. Mean patient agewas 62.7 ± 12.1 (mean ± SD) years, ranging from 28.6 to 79.1 years. Thirty-one patients sufferedfrom single brain metastasis and four were diagnosed with more than one lesion. The most commontumor location was in the frontal lobe (15), followed by the parietal (five, of which each one wastemporo-parietal or parieto-occipital), occipital (five), and temporal (two). In six cases, the tumor waslocated cerebellar. One lesion was located at the head of the caudate nucleus, and one lesion wasinsular. Histopathological work-up revealed metastasis of an adenocarcinoma of the lung in elevencases and neuroendocrine carcinoma of the lung in three cases. In seven patients, a melanoma wasfound as the primary site, three patients suffered from breast cancer, four were diagnosed with renalcell carcinoma, six with gastrointestinal adenocarcinoma encompassing colon (three), gall bladder(one), esophagus (one), and one which was not specified further. One lesion was defined as a carcinomaof unknown primary site. Table 1 summarizes patient characteristics.

Appl. Sci. 2020, 10, 7798 6 of 14
Table 1. Patient characteristics.
Case Age[Years] Sex Localization Diagnosis/
Primary Tumor
1 59.5 male left frontal melanoma2 73.3 male right frontal ADC, colon3 32.7 male left frontal melanoma4 64.2 male cerebellar ADC, lung5 50.7 female left temporal ADC, lung6 69.0 male right parieto-occipital ADC, gall bladder7 78.1 male cerebellar RCC8 76.6 female left occipital ADC, lung9 79.1 male right frontal RCC
10 62.8 female left frontal ADC, lung11 57.2 female left frontal CA, CUP12 59.2 female cerebellar ADC, lung13 62.8 female left frontal NEC, lung14 56.7 female left frontal melanoma15 67.3 female left parietal RCC16 72.8 male right insular ADC, GI17 74.1 female left occipital ADC, colon18 71.1 male cerebellar RCC19 56.0 male left frontal melanoma20 28.6 female right frontal mammary CA (NST)
21 * 53.5 male right frontal NEC, lung22 50.5 female right occipital melanoma23 59.5 male left parietal ADC, lung24 51.2 female cerebellar NEC, lung25 65.3 female left temporo-parietal ADC, lung26 74.6 female left occipital ADC, colon27 71.5 male left frontal ADC, esophagus28 78.2 male left temporal melanoma29 67.6 female left parietal NEC, lung30 69.5 female cerebellar ADC, lung31 55.4 female right frontal ADC, lung32 70.7 male right frontal ADC, lung33 41.8 female right frontal mammary ADC34 69.7 male right parietal mammary ADC35 58.6 male left CN melanoma36 58.6 male left frontal ADC, lung
37 * 64.9 female left frontal ADC, lung
ADC: adenocarcinoma; CA: carcinoma; CN: caudate nucleus; CUP: carcinoma of unknown primary site; GI:gastrointestinal; NEC: neuroendocrine carcinoma; NST: no specific type; RCC: renal cell carcinoma; * patient excluded.
3.2. Tumor Object Characteristics
Table 2 summarizes tumor object characteristics and reports the target registration error.Descriptive analysis of the segmented tumor volumes revealed a mean tumor volume of
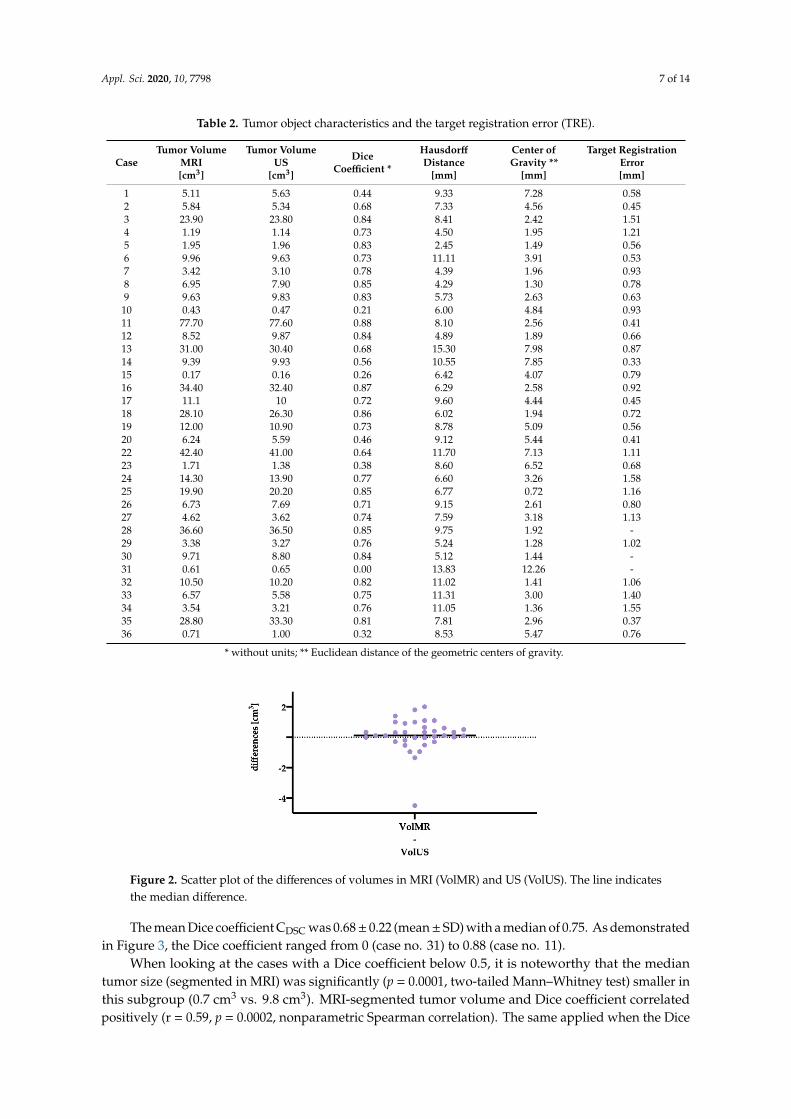
13.6 ± 16.0 cm3 (mean ± SD) and a median of 8.5 cm3 in MRI, whereas it was 13.5± 16.0 cm3 (mean ± SD)with a median of 8.8 cm3, when segmented in ultrasound. The data were not normally distributed(D’Agostino and Pearson test). For further analysis a two-tailed Wilcoxon matched pairs test was used(Figure 2), demonstrating a median of differences of 0.11 cm3, which was not significant (p = 0.0595).To take into account that some of the values were negative and thus the median of differences might bemisleading, we also determined the median of the magnitude of the differences, which was 0.40 cm3.
Appl. Sci. 2020, 10, 7798 7 of 14
Table 2. Tumor object characteristics and the target registration error (TRE).
CaseTumor Volume
MRI[cm3]
Tumor VolumeUS
[cm3]
DiceCoefficient *
HausdorffDistance
[mm]
Center ofGravity **
[mm]
Target RegistrationError[mm]
1 5.11 5.63 0.44 9.33 7.28 0.582 5.84 5.34 0.68 7.33 4.56 0.453 23.90 23.80 0.84 8.41 2.42 1.514 1.19 1.14 0.73 4.50 1.95 1.215 1.95 1.96 0.83 2.45 1.49 0.566 9.96 9.63 0.73 11.11 3.91 0.537 3.42 3.10 0.78 4.39 1.96 0.938 6.95 7.90 0.85 4.29 1.30 0.789 9.63 9.83 0.83 5.73 2.63 0.63
10 0.43 0.47 0.21 6.00 4.84 0.9311 77.70 77.60 0.88 8.10 2.56 0.4112 8.52 9.87 0.84 4.89 1.89 0.6613 31.00 30.40 0.68 15.30 7.98 0.8714 9.39 9.93 0.56 10.55 7.85 0.3315 0.17 0.16 0.26 6.42 4.07 0.7916 34.40 32.40 0.87 6.29 2.58 0.9217 11.1 10 0.72 9.60 4.44 0.4518 28.10 26.30 0.86 6.02 1.94 0.7219 12.00 10.90 0.73 8.78 5.09 0.5620 6.24 5.59 0.46 9.12 5.44 0.4122 42.40 41.00 0.64 11.70 7.13 1.1123 1.71 1.38 0.38 8.60 6.52 0.6824 14.30 13.90 0.77 6.60 3.26 1.5825 19.90 20.20 0.85 6.77 0.72 1.1626 6.73 7.69 0.71 9.15 2.61 0.8027 4.62 3.62 0.74 7.59 3.18 1.1328 36.60 36.50 0.85 9.75 1.92 -29 3.38 3.27 0.76 5.24 1.28 1.0230 9.71 8.80 0.84 5.12 1.44 -31 0.61 0.65 0.00 13.83 12.26 -32 10.50 10.20 0.82 11.02 1.41 1.0633 6.57 5.58 0.75 11.31 3.00 1.4034 3.54 3.21 0.76 11.05 1.36 1.5535 28.80 33.30 0.81 7.81 2.96 0.3736 0.71 1.00 0.32 8.53 5.47 0.76
* without units; ** Euclidean distance of the geometric centers of gravity.
Appl. Sci. 2020, 10, x FOR PEER REVIEW 7 of 14
Table 2. Tumor object characteristics and the target registration error (TRE).
Case
Tumor
Volume
MRI
[cm3]
Tumor
Volume
US
[cm3]
Dice
Coefficient *
Hausdorff
Distance
[mm]
Center of
Gravity **
[mm]
Target Registration
Error
[mm]
1 5.11 5.63 0.44 9.33 7.28 0.58
2 5.84 5.34 0.68 7.33 4.56 0.45
3 23.90 23.80 0.84 8.41 2.42 1.51
4 1.19 1.14 0.73 4.50 1.95 1.21
5 1.95 1.96 0.83 2.45 1.49 0.56
6 9.96 9.63 0.73 11.11 3.91 0.53
7 3.42 3.10 0.78 4.39 1.96 0.93
8 6.95 7.90 0.85 4.29 1.30 0.78
9 9.63 9.83 0.83 5.73 2.63 0.63
10 0.43 0.47 0.21 6.00 4.84 0.93
11 77.70 77.60 0.88 8.10 2.56 0.41
12 8.52 9.87 0.84 4.89 1.89 0.66
13 31.00 30.40 0.68 15.30 7.98 0.87
14 9.39 9.93 0.56 10.55 7.85 0.33
15 0.17 0.16 0.26 6.42 4.07 0.79
16 34.40 32.40 0.87 6.29 2.58 0.92
17 11.1 10 0.72 9.60 4.44 0.45
18 28.10 26.30 0.86 6.02 1.94 0.72
19 12.00 10.90 0.73 8.78 5.09 0.56
20 6.24 5.59 0.46 9.12 5.44 0.41
22 42.40 41.00 0.64 11.70 7.13 1.11
23 1.71 1.38 0.38 8.60 6.52 0.68
24 14.30 13.90 0.77 6.60 3.26 1.58
25 19.90 20.20 0.85 6.77 0.72 1.16
26 6.73 7.69 0.71 9.15 2.61 0.80
27 4.62 3.62 0.74 7.59 3.18 1.13
28 36.60 36.50 0.85 9.75 1.92 -
29 3.38 3.27 0.76 5.24 1.28 1.02
30 9.71 8.80 0.84 5.12 1.44 -
31 0.61 0.65 0.00 13.83 12.26 -
32 10.50 10.20 0.82 11.02 1.41 1.06
33 6.57 5.58 0.75 11.31 3.00 1.40
34 3.54 3.21 0.76 11.05 1.36 1.55
35 28.80 33.30 0.81 7.81 2.96 0.37
36 0.71 1.00 0.32 8.53 5.47 0.76
* without units; ** Euclidean distance of the geometric centers of gravity.
Descriptive analysis of the segmented tumor volumes revealed a mean tumor volume of 13.6 ±
16.0 cm3 (mean ± SD) and a median of 8.5 cm3 in MRI, whereas it was 13.5 ± 16.0 cm3 (mean ± SD) with
a median of 8.8 cm3, when segmented in ultrasound. The data were not normally distributed
(D’Agostino and Pearson test). For further analysis a two-tailed Wilcoxon matched pairs test was
used (Figure 2), demonstrating a median of differences of 0.11 cm3, which was not significant (p =
0.0595). To take into account that some of the values were negative and thus the median of differences
might be misleading, we also determined the median of the magnitude of the differences, which was
0.40 cm3.
Figure 2. Scatter plot of the differences of volumes in MRI (VolMR) and US (VolUS). The line indicatesthe median difference.
The mean Dice coefficient CDSC was 0.68± 0.22 (mean± SD) with a median of 0.75. As demonstratedin Figure 3, the Dice coefficient ranged from 0 (case no. 31) to 0.88 (case no. 11).
When looking at the cases with a Dice coefficient below 0.5, it is noteworthy that the mediantumor size (segmented in MRI) was significantly (p = 0.0001, two-tailed Mann–Whitney test) smaller inthis subgroup (0.7 cm3 vs. 9.8 cm3). MRI-segmented tumor volume and Dice coefficient correlatedpositively (r = 0.59, p = 0.0002, nonparametric Spearman correlation). The same applied when the Dice

Appl. Sci. 2020, 10, 7798 8 of 14
coefficient was correlated to the volume of the segmented US objects (r = 0.58, p = 0.0003, nonparametricSpearman correlation).
Appl. Sci. 2020, 10, x FOR PEER REVIEW 8 of 14
Figure 2. Scatter plot of the differences of volumes in MRI (VolMR) and US (VolUS). The line indicates
the median difference.
The mean Dice coefficient CDSC was 0.68 ± 0.22 (mean ± SD) with a median of 0.75. As
demonstrated in Figure 3, the Dice coefficient ranged from 0 (case no. 31) to 0.88 (case no. 11).
Figure 3. Scatter plot of the Dice coefficients. The line represents the median Dice coefficient of 0.75.
When looking at the cases with a Dice coefficient below 0.5, it is noteworthy that the median
tumor size (segmented in MRI) was significantly (p = 0.0001, two-tailed Mann–Whitney test) smaller
in this subgroup (0.7 cm3 vs. 9.8 cm3). MRI-segmented tumor volume and Dice coefficient correlated
positively (r = 0.59, p = 0.0002, nonparametric Spearman correlation). The same applied when the Dice
coefficient was correlated to the volume of the segmented US objects (r = 0.58, p = 0.0003,
nonparametric Spearman correlation).
The Hausdorff distance was 8.1 ± 2.9 mm (mean ± SD), respectively, 8.1 mm (median), whereas
the Euclidean distance of the geometric centers of gravity was 3.7 ± 2.5 mm (mean ± SD) with a median
of 3.0 mm, see Figure 4.
3.3. Influence of Registration
The mean TRE was 0.84 ± 0.36 mm (mean ± SD) with a median of 0.79 mm, in three cases the
TRE could not be quantified. The TRE did neither correlate with the Dice coefficient (r = 0.14, p =
0.4369, Spearman correlation) nor the Hausdorff distance (r = −0.04, p = 0.8242, Spearman correlation).
TRE and the Euclidean distance of the geometric center of gravity correlated negatively (r = −0.3616,
p = 0.0420, Spearman correlation), demonstration only a week association of the registration accuracy
and brain shift.
(a) (b)
Figure 3. Scatter plot of the Dice coefficients. The line represents the median Dice coefficient of 0.75.
The Hausdorff distance was 8.1 ± 2.9 mm (mean ± SD), respectively, 8.1 mm (median), whereasthe Euclidean distance of the geometric centers of gravity was 3.7 ± 2.5 mm (mean ± SD) with a medianof 3.0 mm, see Figure 4.
Appl. Sci. 2020, 10, x FOR PEER REVIEW 8 of 14
Figure 2. Scatter plot of the differences of volumes in MRI (VolMR) and US (VolUS). The line indicates
the median difference.
The mean Dice coefficient CDSC was 0.68 ± 0.22 (mean ± SD) with a median of 0.75. As
demonstrated in Figure 3, the Dice coefficient ranged from 0 (case no. 31) to 0.88 (case no. 11).
Figure 3. Scatter plot of the Dice coefficients. The line represents the median Dice coefficient of 0.75.
When looking at the cases with a Dice coefficient below 0.5, it is noteworthy that the median
tumor size (segmented in MRI) was significantly (p = 0.0001, two-tailed Mann–Whitney test) smaller
in this subgroup (0.7 cm3 vs. 9.8 cm3). MRI-segmented tumor volume and Dice coefficient correlated
positively (r = 0.59, p = 0.0002, nonparametric Spearman correlation). The same applied when the Dice
coefficient was correlated to the volume of the segmented US objects (r = 0.58, p = 0.0003,
nonparametric Spearman correlation).
The Hausdorff distance was 8.1 ± 2.9 mm (mean ± SD), respectively, 8.1 mm (median), whereas
the Euclidean distance of the geometric centers of gravity was 3.7 ± 2.5 mm (mean ± SD) with a median
of 3.0 mm, see Figure 4.
3.3. Influence of Registration
The mean TRE was 0.84 ± 0.36 mm (mean ± SD) with a median of 0.79 mm, in three cases the
TRE could not be quantified. The TRE did neither correlate with the Dice coefficient (r = 0.14, p =
0.4369, Spearman correlation) nor the Hausdorff distance (r = −0.04, p = 0.8242, Spearman correlation).
TRE and the Euclidean distance of the geometric center of gravity correlated negatively (r = −0.3616,
p = 0.0420, Spearman correlation), demonstration only a week association of the registration accuracy
and brain shift.
(a) (b)
Figure 4. Scatterplots with median line of (a) Hausdorff distance. Median: 8.1 mm, mean ± SD:8.1 ± 2.9 mm. (b) Euclidean distance of geometric center of gravity. Median: 3.0 mm, mean ± SD:3.7 ± 2.5 mm.
3.3. Influence of Registration
The mean TRE was 0.84 ± 0.36 mm (mean ± SD) with a median of 0.79 mm, in three cases the TREcould not be quantified. The TRE did neither correlate with the Dice coefficient (r = 0.14, p = 0.4369,Spearman correlation) nor the Hausdorff distance (r = −0.04, p = 0.8242, Spearman correlation).TRE and the Euclidean distance of the geometric center of gravity correlated negatively (r = −0.3616,p = 0.0420, Spearman correlation), demonstration only a week association of the registration accuracyand brain shift.
4. Discussion
Despite an enormous increase in ultrasound image quality in recent years, recognizing anatomicalstructures in oblique and narrow US sections can become tedious. The first attempts to address thisissue date as far back as 1993, when Koivukangas et al. used intraoperative ultrasound as a control

Appl. Sci. 2020, 10, 7798 9 of 14
for reformatted CT and MRI image sets during neurosurgical procedures by establishing a commonaxes on which preoperative and intraoperative images where aligned [42]. However, only whentrackable US probes were developed, US and navigational systems were able to coalesce to integratedsystems [22,43,44], which allowed displaying preoperative and intraoperative image sets as overlaysor side-by-side [23,28].
This baseline study was conducted to describe the obvious differences in object appearances iniUS and preoperative MRI at the earliest possible surgical stage after craniotomy. We chose to acquirethe iUS-scan before dural opening, to keep the influence of brain shifting as low as possible and toenable a comparison of the imaging modalities under optimized conditions.
Initial patient registration was achieved by an iCT scan and fusion to the preoperative MRI datasets with high accuracy (mean ± SD TRE: 0.84 ± 0.36 mm), which is comparable to our previouslypublished data [35]. The US probes were precalibrated, meaning that they were fully implemented intothe navigational system, and thus a co-registration was automatically established. This kind of MRI andUS fusion is based on spatial position information and can be categorized as a rigid or non-deformableregistration [45,46]. Alternatively, rigid registration can be performed image-based using differentalgorithms to match structures in MRI and US [47,48], but any non-deformable registration approachdoes not tackle the issue of brain deformation and distortion. However, rigid co-registration allowedthe assessment of the spatial deviation and deformation of structures segmented in both modalities.Statistical analysis of the segmented tumor volumes in preoperative MRI and intraoperative US revealeda very similar mean ± SD (preMRI: 13.6 ± 16.0 cm3; iUS: 13.5 ±16.0 cm3) and median (preMRI: 8.5 cm3;iUS: 8.8 cm3), which did not differ significantly. The median of the magnitude of the differences was0.40 cm3. These results indicate both modalities being comparable with respect to tumor delineation.This might be partially fostered by the study design that only included brain metastases, whose tumorboundaries could be clearly identified in both T1-enhanced MRI and US. Including gliomas in thisstudy, especially low-grade gliomas, on the other hand, would have made tumor identification andsubsequent analysis of data dependent on the segmentation much more difficult.
Spatial overlap was assessed using the Dice coefficient, which was 0.68 ± 0.22 (mean ± SD) with amedian of 0.75, where 1.0 would indicate a perfect match and 0 no association at all [36]. Consistently,the Dice coefficient correlated positively to the tumor size. Even though the Dice coefficient is thoughtto allow straightforward comparison, interpretation of the coefficient in this study must take intoaccount several factors. First, the calculated measures are influenced by segmentation inaccuracy,as shown by Zou et al., who found in a series of repeated segmentation of the prostate peripheral zonein patients with prostate cancer, a mean Dice coefficient of 0.883 in 1.5 T MRI and 0.838 in 0.5 T MRIsegmentations [37]. Interestingly, the same work group compared manual segmentations of braintumors to a semi-automated probabilistic fractional segmentation and found wide ranges of the Dicecoefficients (0.487–0.972) [37]. Additionally, Nitsch et al. compared automatic segmentations of the falxand tentorium to manual segmentations of an expert in US and found an average Dice coefficient of 0.74.They also found a very high inter-observer variability in segmentations resulting in a Dice coefficient of0.52–0.83 [38]. Secondly, spatial overlap is influenced by brain shift. With respect to this, we determinedthe Euclidean distance of the geometric centers of gravity, which were 3.7 ± 2.5 mm (mean ± SD)with a median of 3.0 mm, indicating a relevant shift of the segmented objects. Although the mainshifting takes place after dural opening, Hill et al. reported a dural displacement of 1.2 mm right aftercraniotomy [12]. However, Ohue et al. found a brain shift of 3.4 ± 1.9 mm (range: 0.4–10.8 mm) atthe tumor margins before dural opening, which was increased to 5.1 ± 2.7 mm (range: 0.9–15.7 mm)before tumor removal [23] and Letteboer et al. reported an average brain shift of 3.0 mm parallel tothe direction of gravity and 3.9 mm perpendicular to the direction of gravity before dural opening.They described only an additional shift of 0.2 mm to the direction of gravity respectively 1.4 mmin the perpendicular plane after durotomy [29]. Sastry et al. discussed this unexpected finding ofa larger extent of brain shift before dural opening to be attributed to calibration errors rather thantrue brain shift [21]. Although our study incorporated the evaluation of the registration procedure,

Appl. Sci. 2020, 10, 7798 10 of 14
the quality of the co-registration of the precalibrated US probes was not determined for each singlecase. To overcome this issue, we performed an accuracy measurement using a tracked ultrasoundphantom containing wires. The expected positions of the wires were displayed within the US imageand the offset was calculated to be 1.33 ± 0.33 mm (mean ± SD).
To evaluate object deformation possibly caused by either brain shift or the pressure applied withthe US probe on the tissue during i3D US image acquisition, we analyzed the resemblance of segmentedtumor objects in preMRI and iUS by calculating the Hausdorff distance [38,39], resulting in a mean of8.1 mm (SD: ±2.9 mm) and a median of 8.1 mm. Interestingly, our computed value was lower thanin the above citied study of Nitsch et al., who compared automatic and manual segmentations ofrigid and deeply located anatomic structures in one and the same US and found a Hausdorff distanceof 12.2 mm [38]. Thus, segmentations were similar in preMRI and iUS and the deformation of theUS objects was only moderate. We conclude that the brain shift is on the one hand partially due tothe craniotomy and on the other hand influenced by the probe placement. However, unraveling theimpact of each of these factors is virtually impossible, because first the iUS can only be performed aftercraniotomy and second the acquisition of ultrasound images requires contact to the brain’s surface.
Finally, the influence of the initial registration procedure expressed as TRE on the Dice coefficient,the Hausdorff distance, and the Euclidean distance of the geometric centers of gravity was evaluatedfacilitated by correlation analysis. Solely TRE and Euclidean distance of the geometric centers of gravityshowed a significant (p = 0.0420), but only moderate negative correlation (r = −0.3616). Taken together,the influence of the initial registration procedure was low, which is not surprising, given the verylow TRE.
Among the limitations of this study was the exclusion of two cases, in which the acquired i3D USdatasets did not fully cover the lesions, and three cases, in which the TRE was not available. However,the amount of collected data is still large enough to allow a reliable evaluation. Another drawback isthe fact that the quality of the precalibration, respectively, the co-registration of the US probes wasnot sufficiently assessed for each case. When reflecting the results of the accuracy measurement in aphantom, which showed an offset of 1.3 mm, compared to the Euclidean distance of the geometriccenters of gravity (mean ± SD: 3.7 ± 2.5 mm) and the partially small tumor volumes, we see the needfor further improvement in future applications. However, we believe the influence of the precalibrationerror to be within a just acceptable range.
Summing up the results of this study, we found the segmented tumor objects in i3D US clearlydelineated the tumor boundaries and was comparable to preMRI segmentations. Dice coefficient andEuclidean distance of geometric centers of gravity indicated a moderate brain shift even before duralopening, and the Hausdorff distance of 8.1 mm suggested a good resemblance of the objects withonly moderate deformation. Both the measured shift and deformation might be partially affectedby the pressure applied with the US probe during image acquisition and calibration inaccuracy tosome extent. An additional feature of i3D US, which was not evaluated in this study, is the possibilityof updating the navigation during surgery based on i3D US. The simplest way to do so is to relysolely on the i3D US data sets rigid co-registration of preoperative and intraoperative imaging islimited by brain deformation or distortion. Approaches addressing this problem utilize deformablemethods [49], different mathematical algorithms [7], and deep learning with convolutional neuralnetworks to improve registration and segmentations [50]. Yet, all of these share the common featureof an increase in computation time and registration uncertainty [51], making them less suitable forroutine use in brain tumor resection when compared to fully implemented rigidly co-registrated US.
Taken together, even under optimal conditions, we found differences in object appearances in bothmodalities. Nevertheless, we conclude that our study contributes to the body of literature showingthat the rigid co-registration of i3D US utilizing a precalibrated trackable transducer offers a valuablesupplement to multimodal neuronavigational set-ups with high imaging quality allowing a precisedepiction of pathologies, whereby it is straightforward in use and allows convenient integration inpreexisting systems and workflows.

Appl. Sci. 2020, 10, 7798 11 of 14
Author Contributions: Conceptualization, M.B., C.N., and B.S.; methodology, M.B. and B.S; validation, B.C., C.N.,and M.P.; investigation, M.B. and B.S.; resources, M.B., B.C., C.N., M.P., and B.S.; data curation, M.B. and B.S.;writing—original draft preparation, B.S.; writing—review and editing, M.B. and C.N.; visualization, M.B. and B.S.;supervision, M.B., C.N., and B.S.; project administration, M.B. All authors have read and agreed to the publishedversion of the manuscript.
Funding: This research received no external funding.
Conflicts of Interest: The authors declare no conflict of interest.
Appendix A
Appl. Sci. 2020, 10, x FOR PEER REVIEW 11 of 14
in computation time and registration uncertainty [51], making them less suitable for routine use in
brain tumor resection when compared to fully implemented rigidly co-registrated US.
Taken together, even under optimal conditions, we found differences in object appearances in
both modalities. Nevertheless, we conclude that our study contributes to the body of literature
showing that the rigid co-registration of i3D US utilizing a precalibrated trackable transducer offers
a valuable supplement to multimodal neuronavigational set-ups with high imaging quality allowing
a precise depiction of pathologies, whereby it is straightforward in use and allows convenient
integration in preexisting systems and workflows.
Author Contributions: Conceptualization, M.B., C.N., and B.S.; methodology, M.B. and B.S; validation, B.C.,
C.N., and M.P.; investigation, M.B. and B.S.; resources, M.B., B.C., C.N., M.P., and B.S.; data curation, M.B. and
B.S.; writing—original draft preparation, B.S.; writing—review and editing, M.B. and C.N.; visualization, M.B.
and B.S.; supervision, M.B., C.N., and B.S.; project administration, M.B. All authors have read and agreed to the
published version of the manuscript.
Funding: This research received no external funding
Conflicts of Interest: The authors declare no conflicts of interest.
Appendix A
Figure A1. Acquisition of i3D US. The navigated US probe is swiped over the dural layer. The
reference array on the probe and the head clamp must be in the sight of line of the navigational
camera. 2D slices of 0.3 mm are generated and transformed to a 3D data set.
References
1. Tabouret, E.; Chinot, O.; Metellus, P.; Tallet, A.; Viens, P.; Goncalves, A. Recent trends in epidemiology of
brain metastases: An overview. Anticancer Res. 2012, 32, 4655–4662.
2. Davis, F.G.; Dolecek, T.A.; McCarthy, B.J.; Villano, J.L. Toward determining the lifetime occurrence of
metastatic brain tumors estimated from 2007 United States cancer incidence data. Neuro-Oncol. 2012, 14,
1171–1177, doi:10.1093/neuonc/nos152.
3. Lauko, A.; Rauf, Y.; Ahluwalia, M.S. Medical management of brain metastases. Neuro-Oncol. Adv. 2020, 2,
vdaa015, doi:10.1093/noajnl/vdaa015.
4. Sankey, E.W.; Tsvankin, V.; Grabowski, M.M.; Nayar, G.; Batich, K.A.; Risman, A.; Champion, C.D.;
Salama, A.K.S.; Goodwin, C.R.; Fecci, P.E. Operative and peri-operative considerations in the management
of brain metastasis. Cancer Med. 2019, 8, 6809–6831, doi:10.1002/cam4.2577.
5. Soffietti, R.; Abacioglu, U.; Baumert, B.; Combs, S.E.; Kinhult, S.; Kros, J.M.; Marosi, C.; Metellus, P.;
Radbruch, A.; Villa Freixa, S.S.; et al. Diagnosis and treatment of brain metastases from solid tumors:
Guidelines from the European Association of Neuro-Oncology (EANO). Neuro Oncol. 2017, 19, 162–174,
doi:10.1093/neuonc/now241.
6. Vogelbaum, M.A.; Suh, J.H. Resectable brain metastases. J. Clin. Oncol. 2006, 24, 1289–1294,
doi:10.1200/JCO.2005.04.6235.
Figure A1. Acquisition of i3D US. The navigated US probe is swiped over the dural layer. The referencearray on the probe and the head clamp must be in the sight of line of the navigational camera. 2D slicesof 0.3 mm are generated and transformed to a 3D data set.
References
1. Tabouret, E.; Chinot, O.; Metellus, P.; Tallet, A.; Viens, P.; Goncalves, A. Recent trends in epidemiology ofbrain metastases: An overview. Anticancer Res. 2012, 32, 4655–4662. [PubMed]
2. Davis, F.G.; Dolecek, T.A.; McCarthy, B.J.; Villano, J.L. Toward determining the lifetime occurrence ofmetastatic brain tumors estimated from 2007 United States cancer incidence data. Neuro-Oncology 2012, 14,1171–1177. [CrossRef] [PubMed]
3. Lauko, A.; Rauf, Y.; Ahluwalia, M.S. Medical management of brain metastases. Neuro-Oncol. Adv. 2020, 2,vdaa015. [CrossRef] [PubMed]
4. Sankey, E.W.; Tsvankin, V.; Grabowski, M.M.; Nayar, G.; Batich, K.A.; Risman, A.; Champion, C.D.;Salama, A.K.S.; Goodwin, C.R.; Fecci, P.E. Operative and peri-operative considerations in the managementof brain metastasis. Cancer Med. 2019, 8, 6809–6831. [CrossRef] [PubMed]
5. Soffietti, R.; Abacioglu, U.; Baumert, B.; Combs, S.E.; Kinhult, S.; Kros, J.M.; Marosi, C.; Metellus, P.;Radbruch, A.; Villa Freixa, S.S.; et al. Diagnosis and treatment of brain metastases from solid tumors:Guidelines from the European Association of Neuro-Oncology (EANO). Neuro Oncol. 2017, 19, 162–174.[CrossRef] [PubMed]
6. Vogelbaum, M.A.; Suh, J.H. Resectable brain metastases. J. Clin. Oncol. 2006, 24, 1289–1294. [CrossRef]7. Bayer, S.; Maier, A.; Ostermeier, M.; Fahrig, R. Intraoperative Imaging Modalities and Compensation for
Brain Shift in Tumor Resection Surgery. Int. J. Biomed. Imaging 2017, 2017, 1–18. [CrossRef] [PubMed]8. Nimsky, C.; Ganslandt, O.; Cerny, S.; Hastreiter, P.; Greiner, G.; Fahlbusch, R. Quantification of, visualization
of, and compensation for brain shift using intraoperative magnetic resonance imaging. Neurosurgery 2000,47, 1070–1079. [CrossRef]
9. Roberts, D.W.; Hartov, A.; Kennedy, F.E.; Miga, M.I.; Paulsen, K.D. Intraoperative brain shift and deformation:A quantitative analysis of cortical displacement in 28 cases. Neurosurgery 1998, 43, 749–758. [CrossRef][PubMed]
10. Kelly, P.J.; Kall, B.A.; Goerss, S.; Earnest, F.T. Computer-assisted stereotaxic laser resection of intra-axial brainneoplasms. J. Neurosurg. 1986, 64, 427–439. [CrossRef]

Appl. Sci. 2020, 10, 7798 12 of 14
11. Dorward, N.L.; Alberti, O.; Velani, B.; Gerritsen, F.A.; Harkness, W.F.; Kitchen, N.D.; Thomas, D.G.Postimaging brain distortion: Magnitude, correlates, and impact on neuronavigation. J. Neurosurg. 1998, 88,656–662. [CrossRef]
12. Hill, D.L.; Maurer, C.R., Jr.; Maciunas, R.J.; Barwise, J.A.; Fitzpatrick, J.M.; Wang, M.Y. Measurement ofintraoperative brain surface deformation under a craniotomy. Neurosurgery 1998, 43, 514–526. [CrossRef]
13. Audette, M.A.; Siddiqi, K.; Peters, T.M. Level-Set Surface Segmentation and Fast Cortical Range ImageTracking for Computing Intrasurgical Deformations. In Medical Image Computing and Computer-AssistedIntervention—MICCAI’99, Proceeding of the International Conference on Medical Image Computing andComputer-Assisted Intervention, Cambridge, UK, 19–22 September, 1999; Springer: Berlin/Heidelberg, Germany,1999; pp. 788–797.
14. Wirtz, C.R.; Bonsanto, M.M.; Knauth, M.; Tronnier, V.M.; Albert, F.K.; Staubert, A.; Kunze, S. Intraoperativemagnetic resonance imaging to update interactive navigation in neurosurgery: Method and preliminaryexperience. Comput. Aided Surg. 1997, 2, 172–179. [CrossRef] [PubMed]
15. Nimsky, C.; Ganslandt, O.; Hastreiter, P.; Fahlbusch, R. Intraoperative compensation for brain shift.Surg. Neurol. 2001, 56, 357–364. [CrossRef]
16. Nabavi, A.; Black, P.M.; Gering, D.T.; Westin, C.F.; Mehta, V.; Pergolizzi, R.S., Jr.; Ferrant, M.; Warfield, S.K.;Hata, N.; Schwartz, R.B.; et al. Serial intraoperative magnetic resonance imaging of brain shift. Neurosurgery2001, 48, 787–797. [CrossRef]
17. Nimsky, C.; Ganslandt, O.; von Keller, B.; Romstock, J.; Fahlbusch, R. Intraoperative high-field-strength MRimaging: Implementation and experience in 200 patients. Radiology 2004, 233, 67–78. [CrossRef]
18. Reinertsen, I.; Lindseth, F.; Askeland, C.; Iversen, D.H.; Unsgard, G. Intra-operative correction of brain-shift.Acta Neurochir. 2014, 156, 1301–1310. [CrossRef] [PubMed]
19. Chandler, W.F.; Knake, J.E.; McGillicuddy, J.E.; Lillehei, K.O.; Silver, T.M. Intraoperative use of real-timeultrasonography in neurosurgery. J. Neurosurg. 1982, 57, 157–163. [CrossRef] [PubMed]
20. Knake, J.E.; Chandler, W.F.; McGillicuddy, J.E.; Silver, T.M.; Gabrielsen, T.O. Intraoperative sonography forbrain tumor localization and ventricular shunt placement. Am. J. Roentgenol. 1982, 139, 733–738. [CrossRef]
21. Sastry, R.; Bi, W.L.; Pieper, S.; Frisken, S.; Kapur, T.; Wells, W., III; Golby, A.J. Applications of Ultrasound inthe Resection of Brain Tumors. J. Neuroimaging 2017, 27, 5–15. [CrossRef]
22. Gronningsaeter, A.; Kleven, A.; Ommedal, S.; Aarseth, T.E.; Lie, T.; Lindseth, F.; Lango, T.; Unsgard, G.SonoWand, an ultrasound-based neuronavigation system. Neurosurgery 2000, 47, 1373–1379. [CrossRef]
23. Ohue, S.; Kumon, Y.; Nagato, S.; Kohno, S.; Harada, H.; Nakagawa, K.; Kikuchi, K.; Miki, H.; Ohnishi, T.Evaluation of intraoperative brain shift using an ultrasound-linked navigation system for brain tumorsurgery. Neurol. Med. Chir. 2010, 50, 291–300. [CrossRef]
24. Unsgaard, G.; Ommedal, S.; Muller, T.; Gronningsaeter, A.; Nagelhus Hernes, T.A. Neuronavigation byintraoperative three-dimensional ultrasound: Initial experience during brain tumor resection. Neurosurgery2002, 50, 804–812. [CrossRef]
25. Tronnier, V.M.; Bonsanto, M.M.; Staubert, A.; Knauth, M.; Kunze, S.; Wirtz, C.R. Comparison ofintraoperative MR imaging and 3D-navigated ultrasonography in the detection and resection controlof lesions. Neurosurg. Focus 2001, 10, 1–5. [CrossRef] [PubMed]
26. Munkvold, B.K.R.; Jakola, A.S.; Reinertsen, I.; Sagberg, L.M.; Unsgard, G.; Solheim, O. The DiagnosticProperties of Intraoperative Ultrasound in Glioma Surgery and Factors Associated with Gross Total TumorResection. World Neurosurg. 2018, 115, e129–e136. [CrossRef]
27. Keles, G.E.; Lamborn, K.R.; Berger, M.S. Coregistration accuracy and detection of brain shift usingintraoperative sononavigation during resection of hemispheric tumors. Neurosurgery 2003, 53, 556–562.[CrossRef]
28. Comeau, R.M.; Fenster, A.; Peters, T.M. Intraoperative US in interactive image-guided neurosurgery.Radiographics 1998, 18, 1019–1027. [CrossRef]
29. Letteboer, M.M.; Willems, P.W.; Viergever, M.A.; Niessen, W.J. Brain shift estimation in image-guidedneurosurgery using 3-D ultrasound. IEEE Trans. Biomed. Eng. 2005, 52, 268–276. [CrossRef]
30. Chacko, A.G.; Kumar, N.K.; Chacko, G.; Athyal, R.; Rajshekhar, V. Intraoperative ultrasound in determiningthe extent of resection of parenchymal brain tumours—a comparative study with computed tomographyand histopathology. Acta Neurochir. 2003, 145, 743–748. [CrossRef] [PubMed]

Appl. Sci. 2020, 10, 7798 13 of 14
31. Gerganov, V.M.; Samii, A.; Akbarian, A.; Stieglitz, L.; Samii, M.; Fahlbusch, R. Reliability of intraoperativehigh-resolution 2D ultrasound as an alternative to high-field strength MR imaging for tumor resectioncontrol: A prospective comparative study. J. Neurosurg. 2009, 111, 512–519. [CrossRef] [PubMed]
32. Gerganov, V.M.; Samii, A.; Giordano, M.; Samii, M.; Fahlbusch, R. Two-dimensional high-end ultrasoundimaging compared to intraoperative MRI during resection of low-grade gliomas. J. Clin. Neurosci. 2011, 18,669–673. [CrossRef] [PubMed]
33. Rygh, O.M.; Selbekk, T.; Torp, S.H.; Lydersen, S.; Hernes, T.A.; Unsgaard, G. Comparison of navigated 3Dultrasound findings with histopathology in subsequent phases of glioblastoma resection. Acta Neurochir.2008, 150, 1033–1041. [CrossRef]
34. Unsgaard, G.; Selbekk, T.; Brostrup Muller, T.; Ommedal, S.; Torp, S.H.; Myhr, G.; Bang, J.;Nagelhus Hernes, T.A. Ability of navigated 3D ultrasound to delineate gliomas and metastases—comparisonof image interpretations with histopathology. Acta Neurochir. 2005, 147, 1259–1269. [CrossRef] [PubMed]
35. Carl, B.; Bopp, M.; Sass, B.; Nimsky, C. Intraoperative computed tomography as reliable navigationregistration device in 200 cranial procedures. Acta Neurochir. 2018, 160, 1681–1689. [CrossRef]
36. Dice, L.R. Measures of the Amount of Ecologic Association Between Species. Ecology 1945, 26, 297–302.[CrossRef]
37. Zou, K.H.; Warfield, S.K.; Bharatha, A.; Tempany, C.M.; Kaus, M.R.; Haker, S.J.; Wells, W.M., III; Jolesz, F.A.;Kikinis, R. Statistical validation of image segmentation quality based on a spatial overlap index. Acad. Radiol.2004, 11, 178–189. [CrossRef]
38. Nitsch, J.; Klein, J.; Dammann, P.; Wrede, K.; Gembruch, O.; Moltz, J.H.; Meine, H.; Sure, U.; Kikinis, R.;Miller, D. Automatic and efficient MRI-US segmentations for improving intraoperative image fusion inimage-guided neurosurgery. Neuroimage Clin. 2019, 22, 101766. [CrossRef]
39. Huttenlocher, D.P.; Klanderman, G.A.; Rucklidge, W.J. Comparing Images Using the Hausdorff Distance.IEEE Trans. Pattern Anal. Mach. Intell. 1993, 15, 850–863. [CrossRef]
40. Flusser, J.; Suk, T. A moment-based approach to registration of images with affine geometric distortion.IEEE Trans. Geosci. Remote Sens. 1994, 32, 382–387. [CrossRef]
41. Paul, K.; Graessl, A.; Rieger, J.; Lysiak, D.; Huelnhagen, T.; Winter, L.; Heidemann, R.; Lindner, T.; Hadlich, S.;Zimpfer, A.; et al. Diffusion-sensitized ophthalmic magnetic resonance imaging free of geometric distortionat 3.0 and 7.0 T: A feasibility study in healthy subjects and patients with intraocular masses. Investig. Radiol.2015, 50, 309–321. [CrossRef]
42. Koivukangas, J.; Louhisalmi, Y.; Alakuijala, J.; Oikarinen, J. Ultrasound-controlled neuronavigator-guidedbrain surgery. J. Neurosurg. 1993, 79, 36–42. [CrossRef]
43. Hata, N.; Dohi, T.; Iseki, H.; Takakura, K. Development of a frameless and armless stereotactic neuronavigationsystem with ultrasonographic registration. Neurosurgery 1997, 41, 608–613. [CrossRef]
44. Hirschberg, H.; Unsgaard, G. Incorporation of ultrasonic imaging in an optically coupled frameless stereotacticsystem. Acta Neurochir Suppl. 1997, 68, 75–80. [CrossRef] [PubMed]
45. Prada, F.; del Bene, M.; Mattei, L.; Lodigiani, L.; DeBeni, S.; Kolev, V.; Vetrano, I.; Solbiati, L.; Sakas, G.;DiMeco, F. Preoperative magnetic resonance and intraoperative ultrasound fusion imaging for real-timeneuronavigation in brain tumor surgery. Ultraschall Med. 2015, 36, 174–186. [CrossRef]
46. Lunn, K.E.; Paulsen, K.D.; Roberts, D.W.; Kennedy, F.E.; Hartov, A.; West, J.D. Displacement estimation withco-registered ultrasound for image guided neurosurgery: A quantitative in vivo porcine study. IEEE Trans.Med. Imaging 2003, 22, 1358–1368. [CrossRef]
47. Schneider, R.J.; Perrin, D.P.; Vasilyev, N.V.; Marx, G.R.; Del Nido, P.J.; Howe, R.D. Real-time image-basedrigid registration of three-dimensional ultrasound. Med. Image Anal. 2012, 16, 402–414. [CrossRef] [PubMed]
48. Coupe, P.; Hellier, P.; Morandi, X.; Barillot, C. 3D Rigid Registration of Intraoperative Ultrasound andPreoperative MR Brain Images based on Hyperechogenic Structures. Int. J. Biomed. Imaging 2012, 2012, 1–14.[CrossRef]
49. Canalini, L.; Klein, J.; Miller, D.; Kikinis, R. Segmentation-based registration of ultrasound volumes forglioma resection in image-guided neurosurgery. Int. J. Comput. Assist. Radiol. Surg. 2019, 14, 1697–1713.[CrossRef]

Appl. Sci. 2020, 10, 7798 14 of 14
50. Rackerseder, J.; Göbl, R.; Navab, N.; Hennersperger, C. Fully Automatic Segmentation of 3D Brain Ultrasound:Learning from Coarse Annotations. arXiv 2019, arXiv:1904.08655.
51. Risholm, P.; Pieper, S.; Samset, E.; Wells, W.M., III. Summarizing and visualizing uncertainty in non-rigidregistration. Med Image Comput Comput Assist Interv. 2010, 13 Pt 2, 554–561, PMCID:PMC2976974. [CrossRef][PubMed]
Publisher’s Note: MDPI stays neutral with regard to jurisdictional claims in published maps and institutionalaffiliations.
© 2020 by the authors. Licensee MDPI, Basel, Switzerland. This article is an open accessarticle distributed under the terms and conditions of the Creative Commons Attribution(CC BY) license (http://creativecommons.org/licenses/by/4.0/).
Copyright © 2022 FDOKUMEN