Precipitation phenomena in B4C-reinforced magnesium-based composite
,
Ultrasound in Med. & Biol., Vol. 30, No. 6, pp. 827–840, 2004Copyright © 2004 World Federation for Ultrasound in Medicine & Biology
Printed in the USA. All rights reserved0301-5629/04/$–see front matter
doi:10.1016/j.ultrasmedbio.2004.02.010
● Original Contribution
ULTRASOUND-INDUCED ENCAPSULATED MICROBUBBLE PHENOMENA
MICHIEL POSTEMA,*† ANNEMIEKE VAN WAMEL,*† CHARLES T. LANCEE* andNICO DE JONG*†‡
*Department of Experimental Echocardiography, Thoraxcentre, Erasmus MC, Rotterdam, The Netherlands;†Interuniversity Cardiology Institute of the Netherlands, Utrecht, The Netherlands; and‡Physics of Fluids,
Department of Applied Physics, Faculty of Science and Technology, University of Twente, EnschedeThe Netherlands
(Received 29 September 2003;revised 17 February 2004; in final form 26 February 2004)
Abstract—When encapsulated microbubbles are subjected to high-amplitude ultrasound, the following phenom-ena have been reported: oscillation, translation, coalescence, fragmentation, sonic cracking and jetting. In thispaper, we explain these phenomena, based on theories that were validated for relatively big, free (not encapsu-lated) gas bubbles. These theories are compared with high-speed optical observations of insonified contrast agentmicrobubbles. Furthermore, the potential clinical applications of the bubble-ultrasound interaction are explored.We conclude that most of the results obtained are consistent with free gas bubble theory. Similar to cavitationtheory, the number of fragments after bubble fission is in agreement with the dominant spherical harmonicoscillation mode. Remarkable are our observations of jetting through contrast agent microbubbles. The pressureat the tip of a jet is high enough to penetrate any human cell. Hence, liquid jets may act as remote-controlledmicrosyringes, delivering a drug to a region-of-interest. Encapsulated microbubbles have (potential) clinicalapplications in both diagnostics and therapeutics. (E-mail:[email protected]) © 2004 World Feder-ation for Ultrasound in Medicine & Biology.
Key Words: Encapsulated microbubbles, Ultrasound contrast agent, Radiation forces, Coalescence,Fragmentation, Jets.
nsemi-
loodil-arac-
on-shell.ing
n of
sueentsnpre-
.
aviorsticssub-a)tical
av-es inor oftrastde2bd to
ech-al.
lest
t. of, Dr.
eth-
INTRODUCTION
Blood does not reflect ultrasound well, but its respomay be enhanced by gas microbubbles of a fewcrometers in diameter that are introduced into the bpool (Goldberg et al. 2001). These microbubbles osclate upon insonification and generate as such a chteristic acoustic response.
An ultrasound contrast agent (UCA) is a liquid ctaining gas microbubbles that are encapsulated by aUCAs are widely used in clinical diagnostic imag(Becher and Burns 2000; Goldberg et al. 2001). Theintravascular use of UCA enhances the quantificatioperfusion and blood flow (Klibanov 1999; Wei 2001)and lowers the detectability threshold of tumor and tisvascularization, using conventional Doppler instrum(Burns et al. 1990). An overview of UCA detectioprocedures in ultrasound (US) imaging has been
Address correspondence to: Michiel Postema, MSc, DepExperimental Echocardiography, Thoraxcentre, Erasmus MCMolewaterplein 50, Room Ee-23.02, 3015 GE, Rotterdam, The N
erlands. E-mail: [email protected]827
sented byde Jong et al. (2000b)and an overview of UCAimaging innovations has been put forward byChiou et al(2000).
To understand encapsulated microbubble behbetter to develop or enhance applications in diagnoand therapeutics, UCA microbubbles have beenjected to high-speed photography.Postema et al. (2003gave an overview of publications on high-speed opobservations of insonified UCA.
Observations of dynamic UCA microbubble behior have resulted in new insights and novel approachdiagnostics and therapeutics: The nonlinear behavioscillating bubbles has led to the development of conharmonic imaging (Schrope and Newhouse 1993;Jong et al. 1994, 2002; Bouakaz et al. 2002a, 200),whereas observations of bubble destruction have lethe development of high mechanical index imaging tniques (Uhlendorf and Hoffmann 1994; Frinking et2001).
Targeted UCA delivery is based on microbubbwith ligands attached to them (Klibanov 1999; Unger e
al. 2001). These bubbles circulate through vessels and
828 Ultrasound in Medicine and Biology Volume 30, Number 6, 2004
accumulate at a target tissue, thereby marking the targetin US images. Klibanov (1999) put forward the idea thattargeted microbubbles may be applied for selective de-livery to the areas where selective enhancement of theaction of US would be required and, if such a bubblewould contain plasmid DNA, enzyme, or another thera-peutic agent, it might be released at the site of interestduring insonification. Another means of targeting wassuggested by Dayton et al. (2001b). They provided op-tical verification that microbubbles oscillate differentlywhen inside neutrophils in response to insonification, andemit acoustic signals that are distinct from free micro-bubbles. Thus, microbubbles within neutrophils might bedetected, providing a potential method to image activatedneutrophils as they accumulate at sites of inflammation.
Recently, Unger et al. (2002) gave an overview ofthe therapeutic applications of UCA microbubbles. Theypresented experimental results using UCAs for throm-bolysis, drug delivery and gene delivery. Other recentadvances in local drug and gene delivery include the invivo delivery of a virus vector, attached to albuminmicrobubbles (Shohet et al. 2000), the in vitro and invivo transfection of endothelial cells with plasmid DNAmixed with UCA (Taniyama et al. 2002), and the accel-erated cellular drug uptake in vitro when UCA micro-bubbles are present (van Wamel et al. 2002). Tachibanaet al. (1999) subjected cells in the presence of a photo-sensitive drug to continuous US, and noticed surfacepores on the cells. Inducing porosities in cells with US,generally referred to as sonoporation, has potential ap-plications in (tumor) cell lysis and selective delivery ofdrugs and genes into cells. Independently, it was dem-onstrated that moderate microbubble oscillations are suf-ficient to achieve rupture of lipid membranes, in a regi-men in which the bubble dynamics can be accuratelycontrolled (Marmottant and Hilgenfeldt 2003). Thismight enable the transport of drugs through the cellmembrane.
At high acoustic amplitudes, destructive effects ofUCA microbubbles have been observed, such as hemor-rhaging (Skyba et al. 1998; Maruvada and Hynynen2002), and lysis (van Wamel et al. 2002). Kudo et al.(2002) performed an in vitro study on bovine arterial celldamage by US in combination with microbubbles. Theyfound that the locations of damaged cells were similar tothe locations where violent bubble collapse was ob-served, suggesting that bubble collapse is responsible forcell membrane damage.
In this paper, we present an overview of dynamicencapsulated microbubble behavior observed at highacoustic amplitudes. The mechanisms for each type ofbehavior found in literature on free (not encapsulated)gas bubbles, acoustics and cavitation are correlated to
our high-speed optical observations. Furthermore, weaddress the potential clinical applications of the phe-nomena.
Previously, some UCA microbubble destructionphenomena were categorized by Chomas et al. (2001a)and Postema et al. (2002a). From our optical observa-tions, we discriminate the following categories: oscilla-tion, translation, coalescence, fragmentation, soniccracking and jetting.
In the following subsections, we give a brief over-view of these phenomena and an explanation of theiroccurrence. Most theories on bubble behavior were val-idated for big, free (not encapsulated) microbubbles.
OscillationWhen a microbubble is exposed to an oscillating
acoustic signal, it undergoes alternate expansions andcontractions with the same amplitude and duration at lowdriving pressures (Strasberg 1956). This regimen of pul-sation amplitudes has been referred to as moderate(Vokurka 1986). Bubble activity that may occur at rela-tively low-amplitude pressures has been denoted as sta-ble cavitation (Miller and Nyborg 1983). As the drivingpressure increases, more complex nonlinear interactionsoccur; there is greater bubble expansion amplitude thancontraction amplitude and relatively slow expansion fol-lowed by rapid contraction (collapse). This behavior hasbeen referred to as violent (Vokurka 1986) or inertial (ortransient) cavitation (Miller and Nyborg 1983; Flynnand Church 1988; Barnett 1998). It has been associatedwith the production of harmonic signals (Postema et al.2003a).
The transition from the moderate to the violentregimen is rather abrupt. For any driving pressure, thereexists a transitional equilibrium microbubble radius R0
tr,above which microbubbles pulsate like inertial cavities(Flynn 1975; Flynn and Church 1988; Hilgenfeldt et al.1998). This transition is referred to as the cavitationthreshold. A bubble is judged to have grown into aninertial cavity when its maximum radius is greater thanapproximately twice its equilibrium radius (Flynn 1975;Flynn and Church 1988).
A number of models for computing radius-timecurves of insonified gas bubbles has been developed.These models differ both in complexity and in the rangeof acoustic amplitudes for which they can be used(Vokurka 1986).
To model the behavior of UCA microbubbles, thepresence of an encapsulation around the gas core has tobe accounted for. Hence, we have to introduce parame-ters that describe the dynamic behavior of the shell.
Presently, two models have been used for modelingUCA microbubble oscillations. de Jong et al. (1994) useda modified RPNNP equation, named after its developers
Rayleigh, Plesset, Neppiras, Noltingk and Poritsky. They
Encapsulated microbubble phenomena ● M. POSTEMA et al. 829
accounted for the presence of a shell by introducing ashell stiffness and a shell friction parameter. Morgan etal. (2000) used a modified Herring equation. They intro-duced the shell properties thickness, elasticity modulusand viscosity. Both models are consistent with opticalobservations at low driving pressures (de Jong et al.2000a; Morgan et al. 2000; Postema et al. 2003a). Cur-rently, models on UCA microbubble oscillating behaviorat high driving pressures have been under investigation(Stride and Saffari 2003).
TranslationTranslations of UCA microbubbles in the direction
of the sound field and toward each other have beenfrequently observed with high-speed cameras (Dayton etal. 1996, 1997b, 1999, 2001a; Postema et al. 2003c).Microbubble translation in the direction of the soundfield has been attributed to a primary radiation forceresulting from a pressure gradient across the bubblesurface. The translation is maximal in contraction phase(Reddy and Szeri 2002). It was demonstrated that thevelocity � of a bubble in a steady fluid subjected to anultrasound field can be expressed by the following ordi-nary differential equation (Tortoli et al. 2001; de Vries etal. 2002):
Frad � Fd �d�M��
dt� 0 , (1)
where Frad is the primary radiation force, Fd is the drag
force, M �2�
3�R0
3 is the added mass of the translating
bubble, equivalent to half the mass of the displacedsurrounding fluid (Leighton 1994), in which R0 is theambient bubble radius and � is the density of the sur-rounding fluid. Averaging over one acoustic cycle, theprimary radiation force is given by (Dayton et al. 1997b;Tortoli et al. 2001):
Frad �pac
2 R0
�cf
�t
fr
f
�� fr
f �2
� 1� 2
� ��t
fr
f �2 , (2)
where c is the speed of sound, pac is the peak rarefac-tional acoustic pressure, �t is the dimensionless totaldamping coefficient (Medwin 1977) and fr is the bubbleresonant frequency (Medwin 1977). The drag force isgiven by (Tortoli et al. 2001; de Vries et al. 2002):
Fd � ���
CdReR0��t�, (3)
4where � is the shear viscosity of the fluid,Re�2�R0|�(t)|/� represents the Reynolds number, and
Cd �24
Re�1 � 0.15 Re0.687� (4)
is the drag coefficient of a contaminated system (DiMarco et al. 2003), such as a contrast agent.
The microbubble translations toward each otherhave been attributed to secondary radiation forces; oscil-lating bubbles generate spatially varying pressure fields.If two bubbles are either both below or both above theresonant size, this results in attraction. However, if onebubble is below and the other is above the resonant size,they oscillate out of phase (Pain 1992; Leighton 1994;Reddy and Szeri 2002), causing the bubbles to recedefrom each other. The mean approach velocity �a of twoidentical bubbles is given by Dayton et al. (1997b):
�a � ��2�fpac�
2
27��2
R05
d02 , (5)
where is the compressibility of the bubble, and d0 is thedistance between the centers of the two bubbles.
CoalescenceUltrasound-induced microbubble coalescence is the
fusion of two or more microbubbles. As adjacent bubblesexpand, the pressure in the film between them increases,resulting in a deformation (flattening) of the bubble sur-faces. The continuing bubble expansion causes drainageof the interposed film. This thinning continues until acritical thickness around 0.1 m is reached, at which theVan der Waals attractive force results in film rupture andthe coalescence of the bubbles (Duineveld 1994). Thin-ning and rupture of thin liquid films have been describedby Sheludko (1967); Kralchevsky et al. (1996) and Nar-simhan and Ruckenstein (1996).
Flattening of the adjacent bubble surfaces occurs if,and only if, the bubble system has a Weber numberWe � 0.5 (Chesters and Hofman 1982). The Webernumber for a fluid containing two bubbles with radii R1
and R2, respectively, is given by the inertial force relativeto the surface tension force:
We ��u2
�
Rm
, (6)
where u is the relative approach velocity of the bubblewalls: u � R1 � R2, � is the fluid density, � is the surface
tension, and Rm is the mean bubble radius for which
830 Ultrasound in Medicine and Biology Volume 30, Number 6, 2004
holds:
2
Rm�
1
R1�
1
R2. (7)
In our results, Weber numbers are relatively high be-cause of the rapid bubble expansions, with maximalradius increases of several m s�1. If the Weber number islower than 0.5, bubble coalescence will always occur,without flattening of the adjacent surfaces prior to con-tact (Chesters and Hofman 1982).
In a separate paper, we investigated the coalescencemechanism of microbubbles, based on high-speed opticalobservations of insonified UCA (Postema et al. 2003c).We investigated the mechanism of film drainage bycomparing the observed coalescence times with calcu-lated film drainage times for mobile interfaces and im-mobile interfaces eqn (8). The drainage time �d of aninterposed film with immobile interfaces until a criticalthickness hc is given by:
�d �3�Rf
2Rm
8�hc2 , (8)
where Rf is the film radius, and Rm is the mean bubbleradius. The drainage time of a film with immobile inter-faces is three times as low.
The calculated drainage times prove too long to becompatible with the observations. Stated differently, ifthe film between bubbles thinned by (8) alone during theobserved time span, it would only reach a minimumthickness that is much larger than that needed to inducefilm rupture. Hence, a mechanism for film rupture mustbe at work that overrules the drainage. We investigated ifshape instabilities of the bubble can cause local corruga-tions that bridge the film and rupture it, before thinningof the whole film (Postema et al. 2003d). Although smallperturbations on the bubble surface may grow tremen-dously, a phenomenon known as parametric instability,sufficiently large perturbations to bridge the liquid filmcannot be formed within the times observed.
Bounce is the process where bubbles approach andflatten, but do not coalesce (Postema et al. 2003c). Thisbehavior has been attributed to the drainage given in eqn(8) taking more time than the expansion phase.
FragmentationFragmentation is the fission of a bubble into smaller
bubbles (Postema et al. 2002a). Although acoustical ob-servations have been associated with microbubble de-struction (Shi et al. 2000), fragmentation of UCA micro-bubbles was first visualized with high-speed cameras in
2001 (Chomas et al. 2001a; Postema et al. 2001). In thesame year, Brennen (2001) computed the number offragments for a cavitation bubble distorted by sphericalharmonics. He demonstrated that, for any positive
� ��R2R
�, (9)
where R denotes the second time derivative of R, theremust be a mode n for which the spherical harmonicdistortion has a maximum. This mode depends on � as
n �1
3�7 � 3� �
2
3. (10)
The number of fragments N is estimated N � n3.Chomas et al. (2001b) showed that fragmentation
occurs around peak contraction, when the bubble col-lapse is driven by inertial forces because the inwardacceleration continues to increase as the bubble ap-proaches its minimum radius, and suddenly changes signas the bubble begins a rebound. They suggest that, if theenergy that is transferred during collapse is not suffi-ciently dissipated during one ultrasonic cycle, the bubblewill become unstable and fragment.
Longuet–Higgins (1992) related the intrinsic energyof a bubble fragment population with a size distributionP(R) to the initial intrinsic energy of the mother-bubblewith equilibrium radius R0:
E* � �0
� R
R0� 2
P�R�dR, (11)
where E* is the intrinsic energy ratio and R is the radiusof a fragment. For bubble fragments of equal sizes.
E* �R0
R� 3�N. (12)
Longuet–Higgins (1992) also presented an elegantmethod to compute the size distribution of bubbles gen-erated by “shattering a single air cavity.”
Sonic crackingSonic cracking is the US-induced formation of a
shell defect causing gas to escape from UCA micro-bubbles. It has been observed with rigid-shelled UCAmicrobubbles (Dayton et al. 1997a; Takeuchi 1999;Postema et al. 2002a). The physical mechanism behindsonic cracking is yet not known. Tiny flaws in the shellsmay account for the fact that certain bubbles crack and
others stay intact (Postema et al. 2002a).
Encapsulated microbubble phenomena ● M. POSTEMA et al. 831
JettingWhen a bubble rapidly contracts (collapses) near a
boundary, this collapse will be asymmetrical. A high-speed liquid jet may form that projects through thebubble toward the boundary (Barnett 1998), pulling aslight volume of the bubble content along. This remark-able phenomenon is called jetting.
The jetting phenomenon for cavitation bubbles wasdescribed by Philipp and Lauterborn (1998) and depictedby Ory (cf. Fig. 1). The asymmetrical collapse causes thevelocity of the upper bubble wall to exceed the velocityof the lower wall to conserve the impulse of the bubble/fluid system. Consequently, the fluid volume above thebubble is accelerated and focused during collapse, lead-ing to the formation of a liquid jet directed toward theboundary. This jet hits the lower bubble wall, causing afunnel-shaped protrusion and, finally, impacts on theboundary.
Jets have regularly been observed with cavitation bub-bles (Lauterborn 1976; Philipp and Lauterborn 1998). Anillustrative enlargement of a high-speed photograph of acavitation jet in the millimeter range was published byLauterborn and Ohl (1997). Ohl and Ory (2000) calculatedthe shapes of asymmetrically collapsing bubbles. Their re-sults are consistent with photographs of a collapsing cavi-tation bubble developing a jet. Kodama and Takayama(1998) studied the impact of jets on gelatin surfaces. Theyfound that the radius of the jet Rj is approximately related to
Fig. 1. Schematic evolution of jet development in a collapsingbubble near a boundary (below) (a) Bubble on the verge ofcollapse; (b) asymmetric collapse; (c) jet development; (d)
funnel-shaped protrusion.
the radius of the bubble on the verge of collapsing Rc as
Rj
Rc� 0.1 (13)
(Kodama and Takayama 1998; Ohl and Ikink 2003). Thelength of the jet lj, defined as the full travel path of thepropelled liquid, is approximately related to Rc as
lj
Rc� 3 (14)
(Ohl and Ikink 2003). From these two ratios, the amountof liquid within the jet, Vj, is estimated as Vj � 0.1 Rc
3
(Ohl and Ikink 2003).The impact of a jet on a surface generates a high-
pressure region. The pressure in this region was dubbed“water-hammer pressure” by Cook (1928). For a per-fectly plastic impact, the water-hammer pressure of acavitation jet was estimated by de Haller (1933) and Ohland Ory (2000):
pwh �1
2�c�j , (15)
where pwh is the water-hammer pressure, �j is the jetvelocity, � is the fluid density and c is the speed of sound.
The damage caused by a jet can be estimated bycomparing the water-hammer pressure with the maxi-mum stress that the impact surface can withstand beforerupture. The maximum stress �max is given by:
�max � E r , (16)
where E is the elastic (Young’s) modulus of the materialand r is the relative deformation of the surface beforerupture.
Clinical applicationsUCA microbubble oscillating behavior is the basis
of most diagnostic imaging techniques (Becher andBurns 2000; Goldberg et al. 2001). Because oscillatingmicrobubbles provide a means to discriminate bloodfrom tissue, they are applicable in perfusion and flowimaging and in tumor detection (Burns et al. 1990; Weiet al. 1998; Wei 2001).
Medical applications of the manipulation of themovement of UCA microbubbles by means of acousticenergy will be primarily in directing UCA toward cells(Dayton et al. 2001a).
If small UCA microbubbles, having passed throughthe narrowest vessels, coalesce, they may be controlledto obtain resonant sizes. Especially for subharmonic im-
aging (Shankar et al. 1999), where twice the resonant
832 Ultrasound in Medicine and Biology Volume 30, Number 6, 2004
bubble size is needed, and for tracking the diffusion offree gas bubbles with subharmonics, a promising tech-nique in noninvasive blood pressure measurements(Postema et al. 2003b), controlled microbubble coales-cence may be applicable. If coalescence of a lipid-shelledmicrobubble and a cell membrane can be induced, thiswill imply a promising technique in targeted drug deliv-ery.
Bouncing behavior of UCA microbubbles has nopotential medical application yet.
UCA microbubble fragmentation has been associ-ated with violent effects, such as cell membrane perme-abilization and lysis. The reason for this may lie in thefact that fragmenting bubbles produce shock waves. Be-cause of the strong acoustic signal generated, fragmen-tation finds applications in high-MI imaging. The appli-cability of microbubble fragmentation for local drugdelivery is fully dependent of the presence of a shell afterfragmentation. If the shell is absent after fragmentation,the fragments will behave as released gas bubbles. Thus,the potential therapeutic applications will then be iden-tical to those for sonic cracking.
Sonic cracking may find applications in drug deliv-ery, if the released bubble content has therapeutic prop-erties (Frinking et al. 1998). Frinking et al. (2001) sug-gested a technique they called “ release burst imaging”Upon transmission of a high-MI US burst, there will bea strong scattering response from the released gas bub-bles. The free gas will rapidly dissolve and, with it, thestrong scattering response will fade away. Wei et al.(1998) proposed that the acoustical measurement of thereappearance of UCA microbubbles may provide ameans for determining tissue perfusion in any organaccessible to US.
The diffusion rate of a gas bubble with a certain sizeis known for every hydrostatic pressure. By making useof the changing acoustic properties of the dissolving gasbubbles, hydrostatic pressures may be determined in aminimally invasive clinical setting (Bouakaz et al. 2000;Postema et al. 2003b).
It has been speculated that jets may be formed whenUCA microbubbles in the bloodstream are insonifiedwith high enough acoustic pressures. These jets would bedirected toward a boundary, such as a cell or a capillarywall with adjacent cells. As such, jets might function asmicrosyringes (Miller 2000; Ohl and Ikink 2003), if theycould penetrate cells. The maximum extension measuredin human cells is less than 50% ( r 0.5) (Lendon et al.1991). Therefore, we may assume that, for any humancell or cell part, r � 1. Elastic moduli of human cellswere measured E ½ 7.3 kPa for endothelial cells (Mathuret al. 2000) and E ½ 12 kPa for fibroblasts (Rotsch et al.1999); less than half the elastic modulus of murine
skeletal muscle cells (E � 24 kPa) (Mathur et al. 2001).Rabbit cardiac cells are among the stiffest, with E � 100kPa (Mathur et al. 2001). It is safe to assume that, evenfor the stiffest human cell, E � 200 kPa. Combining bothassumptions in eqn (16) gives �max � 200 kPa. If thewater-hammer pressure of a jet exceeds this stress, the jetwill be able to penetrate any human cell.
The porosities observed on cell-membranes byTachibana et al. (1999) may well be attributed to jets.Probably, particles that were present in the photosensi-tive drug acted as cavitation nuclei, whereas the cell-membranes acted as the boundaries toward which the jetswere directed.
EXPERIMENTAL SETUP
OverviewFor the high-speed observations, we made use of the
Brandaris-128 system (Chin et al. 2003) and an Imacon468 fast-framing camera. An overview of this experi-mental setup is shown in Fig. 2. A computer controlledthe triggering of a waveform generator, a Xenon flashsource and the cameras.
The electrical signal was generated by an AWG 520arbitrary waveform generator (Tektronix, Inc., Beaver-ton, OR), or by an LW 420A arbitrary waveform gener-ator (LeCroy Corp., Chestnut Ridge, NY). The signalwas adjusted by two variable 355C/D attenuators(Hewlett Packard Company, Palo Alto, CA) in series andan A-500 60-dB linear power amplifier (ENI technology,Inc., Rochester, NY). It was converted to US by aV389-SU 500 kHz, or by a V397-SU 2.25-MHz single-element transducer (Panametrics Inc., Waltham, MA),both spherically focused at 7.5 cm. The transducers weremounted in a Perspex container at an angle of 45° rela-tive to the top of the container. This container was filledwith saturated water. A 200 m diameter cellulose Cu-
Fig. 2. Basic setup of the high-speed photography system.
prophan® capillary tube (Membrana GmbH, Wuppertal,

Encapsulated microbubble phenomena ● M. POSTEMA et al. 833
Germany) was fixed in the focal area of the transducer,through which contrast agent was flowing. Because thecapillary tube was water-soaked and much smaller indiameter than the acoustic wavelength, it was not ex-pected to interfere with the US transmitted. Withoutcontrast agent inserted, we did not observe reflectionsfrom the tube.
OpticsUnderneath the capillary tube, an optic fiber was
mounted. This fiber was connected to an MVS-7010fiberoptic strobe (PerkinElmer Optoelectronics, Salem,MA), and to a KLS-201 continuous fiber light source(Olympus KMI (KeyMed Ltd); Southend-on-Sea, UK).The pulsed light source was triggered by a PM 5716pulse/delay generator (Koninklijke Philips ElectronicsN.V., Eindhoven, The Netherlands). The container waspositioned beneath a customized BXFM microscope sys-tem (Olympus Optical Co., Ltd., Tokyo, Japan) with aU-CA magnification changer (Olympus), switched to 2�magnification and a LUMPlanFl 60� water immersionobjective lens (Olympus). For the measurements with theImacon 468 camera, we made use of a BH-2 model(Olympus) with an SPlan 100 oil immersion objectivelens (Olympus). For image control purposes, an LCL-902K or a WAT-902HS CCD camera (Watec Co., Ltd.,Yamagata, Japan) was fitted to the microscope. Focusingwas done manually at the middle of the cellulose tube.Because the tube was wide compared with the contrastmicrobubbles measured, its upper half was considered tobe a flat surface between contrast microbubbles andobject lens, not causing aberrations but lowering thedynamic range of the images.
CameraThe optical observations were recorded with a
Brandaris-128 fast-framing camera system (Chin et al.2003). The Brandaris-128 captured sequences of 128image frames at an average speed of 13 million framesper s. Typical frame sizes correspond to 89 � 68 m2. Inall observations, image frames were captured before,during and after US insonification. A line drawing of theoptical observation part of the setup is shown in Figs. 3and 4.
Furthermore, we made use of an Imacon 468 fast-framing camera (DRS Hadland, Ltd., Tring, UK), cap-turing eight 2-D frames at 3 MHz. In all observations, thefirst frame was taken a few microseconds before USwaves reached the contrast agent. The other seven frameswere taken during US insonification, with 330 ns inter-frame time for 500-kHz US, spanning a full US cycle.Frame exposure times ranged from 10 ns to 70 ns. A linedrawing of the optical observation part of this setup is
shown in Fig. 5.Contrast agentsWe investigated the US contrast agent Quantison™
(Upperton Limited, Nottingham, UK). It consists of hu-man serum albumin-encapsulated air bubbles with amean diameter of 3.2 m. Shell thicknesses are between0.2 and 0.3 m (Frinking and de Jong 1998). The contentof a Quantison™ vial was resuspended in 5 mL ofIsoton® II (Beckman Coulter, Inc., Fullerton, CA) andshaken gently for 20 s before further dilution. The agent
Fig. 3. Line drawing of the Brandaris-128 system.
Fig. 4. Line drawing of the optical observation part of the
Brandaris-128 system.
834 Ultrasound in Medicine and Biology Volume 30, Number 6, 2004
was inserted through the capillary tube using a syringepressed by hand.
We also investigated an experimental UCA (sup-
Fig. 5. Line drawing of the optical observation of the Imacon-468 system.
plied by Bracco Research SA, Geneva, Switzerland). It
consists of phospholipid-encapsulated gas bubbles rang-ing in diameter from 1 to 6 m with a median of 2 m.The acoustic behavior of a very similar contrast agentwas modeled and described in Gorce et al. (2000). Un-diluted UCA (5 mL of a 0.9% sodium chloride dilution,added to a 25-mg UCA vial) was inserted through thecapillary tube using either a syringe pressed by hand ora hose operated by a gravity-fed or pumped infusion.
UltrasoundFor the experiments with the Brandaris-128 camera
system, the UCA bubbles were insonified by eight cyclesof 1.7-MHz US at a peak rarefactional acoustic pressureof 2 MPa, corresponding to a mechanical index of MI �1.5. For the experiments with the Imacon 468 camera,the UCA bubbles were insonified by 10 cycles of 500-kHz US at peak rarefactional acoustic pressures between0.66 and 0.85 MPa, corresponding to mechanical indicesin the range 0.9 MI 1.2. The mechanical index isdefined as MI � pac/�f, where pac is the peak rarefac-tional acoustic pressure in MPa and f is the center fre-quency of the US in MHz.
Acoustic pressures applied were measured with acalibrated MH28–10 hydrophone (FORCE Technology,Brøndby, Denmark) in a separate water tank. An exam-ple of the acoustic signal measured at the transducerfocus has been published in Postema et al. (2003a). Thein situ reverberant component due to the presence of themicroscopic lens was observed to be less than �14 dB.Thus, it is assumed that the in situ acoustic signal is thesame as the signal measured.
ProcedureWe recorded 277 image sequences with the Bran-
daris-128 system. We performed 527 experiments at highacoustic amplitudes with the Imacon 468 camera. Bubblesizes and distances were measured manually or by usinga segmentation method described by Postema et al.(2003a).
RESULTS AND DISCUSSION
The following types of ultrasound-induced UCAmicrobubble behavior have been distinctly observed andcategorized: oscillation, translation, coalescence, frag-mentation, sonic cracking and jetting.
OscillationFigure 6i shows an optical image sequence of two
identical 6-m diameter moderately oscillating experi-mental UCA microbubbles freely flowing through a cap-illary tube. The frames have been taken during one cycleof US insonification, with a center frequency of 0.5 MHz
and MI � 0.09. Interframe times for frames b to h are
Encapsulated microbubble phenomena ● M. POSTEMA et al. 835
0.33 s. Each frame corresponds to a 88 � 58 m2 area.Frame a has been taken prior to US arrival. Maximalsizes are reached in frame d with bubble diameters of 7.6m, whereas minimal sizes are displayed in frame f withbubble diameters of 4.4 m. Thus, the expansion andcontraction of the bubbles are symmetrical. We do notexpect a violent collapse in this regimen because themaximum bubble radius is less than twice its equilibriumradius. The oscillating amplitude is represented in the leftframe of Fig. 6iii. The solid line represents the radius-period curve of a free gas bubble (de Jong et al. 1994).Apparently, the UCA bubbles have comparable excur-sions to those of a free gas bubble.
Figure 6ii and the right frame of Fig. 6iii show asimilar situation for a 1.5-m diameter strongly oscillat-
Fig. 6. Oscillating experimental UCA microbubbles. Botha have been captured prior to US arrival. Interframe tim88 � 58 m2 area. (i) Two 6-m diameter bubbles modstrongly oscillating (MI � 0.67); (iii) radius-period plots
b
ing microbubble insonified at MI � 0.67. Again, the
UCA bubble excursion is comparable to that of a free gasbubble. At the acoustic amplitude applied, there may besome energy loss in the shell, causing increased thermaldamping. Maximum size is reached in frame e with abubble diameter of 10.0 m, whereas minimum size isdisplayed in frame g with a bubble diameter of 0.57 m.The bubble oscillates highly asymmetrically. We expectthe microbubble to grow into an inertial cavity in thisregimen because the maximum bubble radius is muchgreater than its equilibrium radius.
TranslationFigure 7 shows a high-speed optical image se-
quence of Quantison™ insonified by eight cycles of1.7-MHz US with MI � 1.5. The US travels from the
ctive image sequences span one ultrasonic cycle. Framesframes b to h are 0.33 s. Each frame corresponds to aoscillating (MI � 0.09); (ii) a 1.5-m diameter bubble
h events. The solid line represents an oscillating free gas
respees foreratelyof botubble.
lower side of the frames to the upper side. Frame times

836 Ultrasound in Medicine and Biology Volume 30, Number 6, 2004
are indicated in nanoseconds. Each frame corresponds toa 30 � 16 m2 area. In Fig. 7 (b, c, d), gas escapes froma 4-m diameter bubble. This free gas bubble expandsand contracts, and translates towards the upper side ofthe frames. The displacement of the free gas bubblecenter has been measured 14 m over four periods (Fig.7 e–h). The resting diameter of the released bubble afterinsonification was 1.3 m. The theoretical mean bubbledisplacement over time has been computed by integrat-ing eqn (1) over four periods, taking c � 1480 m s�1, �� 998 kg m�3, R0 � 0.65 m, f � 1.7 MHz, fr � 5.3MHz, �t � 1.0, pac(t) � [2 MPa] sin 2� ft and � � 0.001Pa s. The damping was computed using the parametersstated in Medwin (1977) and de Jong (1993). The theo-retical displacement is 18 m. The measured displace-ment is lower than the theoretical value. At the acousticpressure applied, the expansion phase is longer than thecontraction phase, which may account for this difference.
Figure 8 shows five image frames of two 4-mdiameter experimental UCA microbubbles, each cap-tured after insonification by 10 cycles of 0.5-MHz US
Fig. 7. (a)–(d) Sonic cracking of a 4-m diameter Quantito a primary radiation force. Each image frame correspoa sequence of 128 frames. The travel distance of the bu
c
Fig. 8. The approach of two 4-m diameter experimental UCAbubbles induced by a secondary radiation force. Each imageframe corresponds to a 30 � 20 m2 area. Frames are eachcaptured after insonification by 10 cycles of 0.5-MHz ultra-
sound (MI � 0.67).
(duration Tp � 20 s). Each image frame corresponds toa 30 � 20 m2 area. During every US burst, the bubblesdraw nearer to each other. For each center-to-centerdistance d0 measured, the mean approach velocity �a hasbeen computed from eqn (5), taking � 5 � 10�6 m2
N�1. By combining d0 with �a, the theoretical distances�dth � �aTp have been computed. These were comparedwith the distance �dm measured from Fig. 8. The resultsare summarized in Table 1. The measured values �d areconsistent with theory.
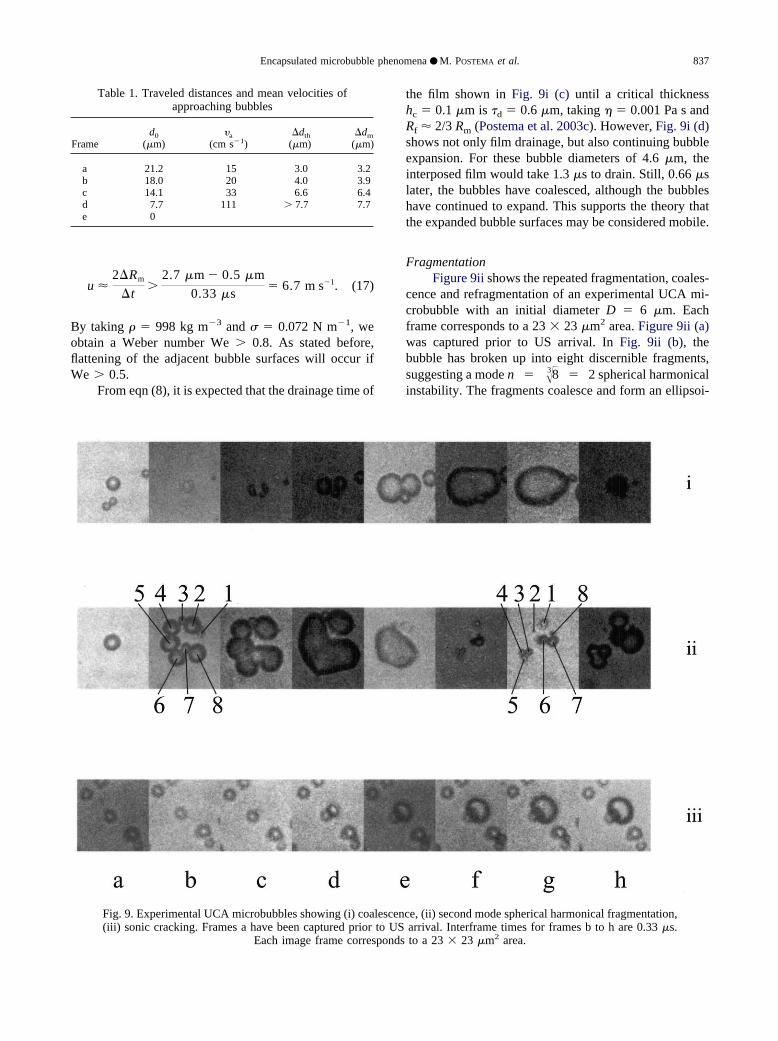
CoalescenceFigure 9i shows an example of microbubble coales-
cence. The first frame has been captured prior to USarrival. In Fig. 9i (b), the main bubble, with an initialdiameter of 4 m, has split into several fragments withdiameters below or around optical resolution and thesefragments have started to coalesce upon expansion. Be-cause the resulting two bubbles have expanded to meandiameters of approximately 2.7 m, shown in Fig. 9i (c),the flattening of the adjacent bubble surfaces is clearlyvisible. After the bubbles have expanded further to meandiameters of 4.6 m, as demonstrated in Fig. 9i (d), theinterposed film has drained to a critical thickness torupture (Fig. 9i (e)), which has resulted in the formationof a single bubble (Fig. 9i (f)).
The flattening of the adjacent bubble surfaces inFig. 9i (b) is supported by a conservative estimate of theWeber number. Based on our analysis of the opticalsystem (Postema et al. 2003a), we may assume that theoptical resolution R � 0.5 m and fragment diameters inFig. 9i (b) 0.5 m. Even if the bubbles would expandlinearly to the sizes observed in Fig. 9i (c) the approach
bubble (MI � 1.5). (e)–(i) The released gas is subjecteda 30 � 16 m2 area. Frames shown were selected fromnter between (e) and (h) is 14 m over four ultrasonic
sonTM
nds tobble ceycles.
velocity would still have to be:
Encapsulated microbubble phenomena ● M. POSTEMA et al. 837
u �2�Rm
�t�
2.7 m � 0.5 m
0.33 s� 6.7 m s�1. (17)
By taking � � 998 kg m�3 and � � 0.072 N m�1, weobtain a Weber number We � 0.8. As stated before,flattening of the adjacent bubble surfaces will occur ifWe � 0.5.
From eqn (8), it is expected that the drainage time of
Table 1. Traveled distances and mean velocities ofapproaching bubbles
Framed0
(m)�a
(cm s�1)�dth
(m)�dm
(m)
a 21.2 15 3.0 3.2b 18.0 20 4.0 3.9c 14.1 33 6.6 6.4d 7.7 111 � 7.7 7.7e 0
Fig. 9. Experimental UCA microbubbles showing (i) coa(iii) sonic cracking. Frames a have been captured prior
Each image frame corresponds
the film shown in Fig. 9i (c) until a critical thicknesshc � 0.1 m is �d � 0.6 m, taking � � 0.001 Pa s andRf � 2/3 Rm (Postema et al. 2003c). However, Fig. 9i (d)shows not only film drainage, but also continuing bubbleexpansion. For these bubble diameters of 4.6 m, theinterposed film would take 1.3 s to drain. Still, 0.66 slater, the bubbles have coalesced, although the bubbleshave continued to expand. This supports the theory thatthe expanded bubble surfaces may be considered mobile.
FragmentationFigure 9ii shows the repeated fragmentation, coales-
cence and refragmentation of an experimental UCA mi-crobubble with an initial diameter D � 6 m. Eachframe corresponds to a 23 � 23 m2 area. Figure 9ii (a)was captured prior to US arrival. In Fig. 9ii (b), thebubble has broken up into eight discernible fragments,suggesting a mode n � �38 � 2 spherical harmonicalinstability. The fragments coalesce and form an ellipsoi-
e, (ii) second mode spherical harmonical fragmentation,arrival. Interframe times for frames b to h are 0.33 s.
2
lescencto US
to a 23 � 23 m area.

838 Ultrasound in Medicine and Biology Volume 30, Number 6, 2004
dal bubble in Fig. 9ii (e). Because the ellipsoidal shapecan be discriminated, we may conclude that the secondspherical harmonic mode is dominant. After collapse, thefragments in Fig. 9ii (f) are too small to be counted but,in Fig. 9ii (g), captured while the fragments have begunto expand, eight fragments can be discerned, which con-firms the second mode instability.
Sonic crackingFigure 9iii shows the sonic cracking of a 3-m
diameter Quantison™ microbubble. Each frame corre-sponds to a 23 � 23 m2 area. In Fig. 9iii (d), gas startsto escape from the bubble in the middle of the frame. Itexpands to approximately 8-m diameter in Fig. 9iii (g),and then begins to contract in Fig. 9iii (h).
Clearly, the gas bubble has been released from itsrigid shell. However, in the image sequence, the pixelsize (0.15 � 0.15 m2) corresponds in approximation tothe shell thickness. Thus, even if the optical resolutionwere on the order of the shortest wavelength of the light,the presence of tiny flaws in the rigid shell would nothave been detectible.
JettingWe recorded two optical sequences showing jet
development in UCA microbubbles (Postema et al.2002b), one of which is shown in Fig. 10. Figure 10ashows a microbubble with a radius Rc � 8.43 m. Figure
Fig. 10. US-induced jet development in an experimental UCAmicrobubble (MI � 1.2). Each image frame corresponds to a 38� 30 m2 area. Interframe time is 0.33 s and exposure time
is 10 ns.
Table 2. Potential clinical applications for
Oscillation Translation
Imaging * –Pressure measurements – –Tumor detection * –Permeabilization and lysis – –Targeting – *Drug delivery – –
10b has been captured 0.33 s later. Liquid is propelledthrough the lower left and escapes from the upper right ofthe bubble. The jet has traveled over a length lj � 26.2m in 0.33 s, giving an average jet velocity �j � 79.4 ms�1. The ratio lj:Rc is in agreement with the ratio putforward by Ohl and Ikink (2003). The volume of the jetis approximately �j � 0.1 Rc
3 � 60 femtoliter.Taking � � 998 kg m�3 and c � 1480 m s�2, the
water-hammer pressure is around 60 MPa. Becausepwh � 200 kPa � �max, such a jet may penetrate any cell.
Influence of the capillary tubeIshida et al. (2001) demonstrated that, with simula-
tions and high-speed optical observations, if the distancebetween the walls of their solid test vessel was greaterthan five times the maximum free-field expansion radiusof a cavitation bubble, the bubble would remain sphericalwhile expanding. In our setup, the diameter of the water-soaked capillary tube is approximately 20 times the larg-est microbubble radius measured. Thus, the phenomenadescribed, other than jetting, cannot be attributed to theboundaries imposed by the capillary tube, because ourimaging plane is at the center of the tube.
CONCLUSIONS
An overview of dynamic behavior of US insonifiedencapsulated microbubbles has been presented. The fol-lowing types of behavior have been observed and cate-gorized: oscillation, translation, coalescence and bounce,fragmentation, sonic cracking and jetting.
Oscillation is the expanding and contracting bubbleresponse to an oscillating acoustic signal. At low acous-tic amplitudes, bubbles pulsate moderately; at high am-plitudes, their longer expansion phase is followed by aviolent collapse. Microbubble translation has been asso-ciated with primary and secondary radiation forces. Ouroptical observations of translating bubbles are consistentwith theory. Coalescence, the fusion of two or morebubbles, is mainly caused by the drainage of the liquidfilm separating expanding bubbles, whereas bounce (un-successful coalescence) is caused by the drainage takinglonger than the expansion of the bubbles. Fragmentation
sulated microbubble phenomena observed
lescence Fragmentation Sonic cracking Jetting
* * * –* ? * –– – – –– * – ** – – –* ? * *
encap
Coa

Encapsulated microbubble phenomena ● M. POSTEMA et al. 839
is the fission of a bubble into smaller bubbles. Thenumber of fragments has been related to the dominantspherical harmonic oscillation mode of a bubble. In ourobservations, the second spherical harmonic mode ap-pears to be the dominant mode. Remarkable are ourobservations of jetting through encapsulated micro-bubbles. For an observed jet, we computed a volume ofapproximately 60 femtoliter, generating a pressure at thetip of the jet around 60 MPa. This is high enough topenetrate any human cell. Hence, liquid jets may act asmicrosyringes, delivering a drug to a region-of-interest.
Table 2 gives an overview of potential clinical ap-plications related to the encapsulated microbubble phe-nomena discussed. The phenomena have potential clini-cal applications in imaging, pressure measurements, tu-mor detection, permeabilization, lysis, targeting and drugdelivery.
Acknowledgments—This work has been supported by the TechnologyFoundation STW (RKG.5104). The authors thank Kees Slager for thedata on cell elasticity, Emmanuel Ory (Laboratory of Applied Ther-modynamics, Helsinki University of Technology) for computing Fig. 1,Leo Bekkering and Elmer Koene for technical assistance and CeesPakvis for drawing Figs. 3, 4 and 5.
Barnett S. Nonthermal issues: Cavitation—its nature, detection andmeasurement. Ultrasound Med Biol 1998;24:S11–S21.
Becher H, Burns PN. Handbook of contrast echocardiography: LVfunction and myocardial perfusion. Berlin: Springer-Verlag, 2000.
Bouakaz A, Frigstad S, Ten Cate FJ, de Jong N. Improved contrast totissue ratio at higher harmonics. Ultrasonics 2002a;40:575–578.
Bouakaz A, Frigstad S, Ten Cate FJ, de Jong N. Super harmonicimaging: A new imaging technique for improved contrast detection.Ultrasound Med Biol 2002b;28(1):59–68.
Bouakaz A, Frinking PJA, de Jong N. Noninvasive pressure measure-ment using microbubble contrast agent and wavelet transforms.Proc IEEE Ultrason Sympos 2000;1907–1910.
Brennen CE. Fission of collapsing cavitation bubbles. Proceedings ofCAV 2001, 4th International Symposium on Cavitation 2001.
Burns PN, Hilpert P, Goldberg BB. Intravenous contrast agent forultrasound Doppler: In vivo measurement of small tumor vesseldose-response. Proc Ann Int Conf IEEE Eng Med Biol Soc 1990;12(1):322–324.
Chesters AK, Hofman G. Bubble coalescence in pure liquids. Appl SciRes 1982;38:353–361.
Chin CT, Lancee C, Borsboom J, et al. Brandaris 128: A 25 millionframes per second digital camera with 128 highly sensitive frames.Rev Sci Instru 2003;74(12):5026–5034.
Chiou KR, Liu CP, Chiang HT, Lin SL. Clinical applications ofcontrast echocardiography. Acta Cardiol Sin 2000;16:63–78.
Chomas JE, Dayton P, Allen J, Morgan K, Ferrara KW. Mechanisms ofcontrast agent destruction. IEEE Trans Ultrason Ferroelec FreqControl 2001a;48(1):232–248.
Chomas JE, Dayton P, May D, Ferrara K. Threshold of fragmentationfor ultrasonic contrast. J Biomed Opt 2001b;6(2):141–150.
Cook SS. Erosion by water-hammer. Proc Roy Soc London A 1928;119:481–488.
Dayton P, Goode A, Morgan K, et al. Action of microbubbles wheninsonified: Experimental evidence. Proc IEEE Ultrason Sympos1996;1131–1134.
Dayton P, Klibanov A, Brandenburger G, Ferrara K. Acoustic radiationforce in vivo: A mechanism to assist targeting of microbubbles.Ultrasound Med Biol 1999;25(8):1195–1201.
Dayton P, Morgan K, Allietta M, et al. Simultaneous optical andacoustical observations of contrast agents. Proc IEEE Ultrason
Sympos 1997a;1583–1591.Dayton PA, Allen JS, Kruse DE, Ferrara KW. Experimental validationof a theoretical framework to predict radiation force displacementof contrast agents. Proc IEEE Ultrason Sympos 2001a;1687–1690.
Dayton PA, Chomas JE, Lum AFH, et al. Optical and acousticaldynamics of microbubble contrast agents inside neutrophils. Bio-phys J 2001b;80:1547–1556.
Dayton PA, Morgan KE, Klibanov AL, et al. A preliminary evaluationof the effects of primary and secondary radiation forces on acousticcontrast agents. IEEE Trans Ultrason Ferroelec Freq Control1997b;44(6):1264–1277.
de Haller P. Untersuchungen uber die durch Kavitation hergerufenenKorrosionen. Schweiz Bauzeit 1933;101(21):243–246.
de Jong N. Acoustic properties of ultrasound contrast agents. Rotter-dam: N de Jong, 1993.
de Jong N, Bouakaz A, Ten Cate FJ. Contrast harmonic imaging.Ultrasonics 2002;40:567–573.
de Jong N, Cornet R, Lancee CT. Higher harmonics of vibratinggas-filled microspheres. Part one: Simulations. Ultrasonics 1994;32(6):447–453.
de Jong N, Frinking PJA, Bouakaz A, et al. Optical imaging of contrastagent microbubbles in an ultrasound field with a 100-MHz camera.Ultrasound Med Biol 2000a;26(3):487–492.
de Jong N, Frinking PJA, Bouakaz A, Ten Cate FJ. Detection proce-dures of ultrasound contrast agents. Ultrasonics 2000b;38:87–92.
de Vries J, Luther S, Lohse D. Induced bubble shape oscillations andtheir impact on the rise velocity. Eur Phys J B 2002;29:503–509.
Di Marco P, Grassi W, Memoli G. Experimental study on risingvelocity in FC-72. Int J Therm Sci 2003;42:435–446.
Duineveld PC. Bouncing and coalescence of two bubbles in water.Enschede: PC Duineveld, 1994.
Flynn HG. Cavitation dynamics. II. Free pulsations and models forcavitation bubbles. J Acoust Soc Am 1975;58(6):1160–1170.
Flynn HG, Church CC. Transient pulsations of small gas bubbles inwater. J Acoust Soc Am 1988;84(3):985–998.
Frinking PJA, Bouakaz A, de Jong N, Ten Cate FJ, Keating S. Effectof ultrasound on the release of micro-encapsulated drugs. Ultrason-ics 1998;36:709–712.
Frinking PJA, Cespedes EI, Kirkhorn J, Torp HG, de Jong N. A newultrasound contrast imaging approach based on the combination ofmultiple imaging pulses and a separate release burst. IEEE TransUltrason Ferroelec Freq Control 2001;48(3):643–651.
Frinking PJA, de Jong N. Acoustic modeling of shell-encapsulated gasbubbles. Ultrasound Med Biol 1998;24(4):523–533.
Goldberg BB, Raichlen JS, Forsberg F, eds. Ultrasound contrast agents.Basic principles and clinical applications, 2nd ed. London: MartinDunitz Ltd, 2001.
Gorce JM, Arditi M, Schneider M. Influence of bubble size distributionon the echogenicity of ultrasound contrast agents: A study ofSonoVue™. Invest Radiol 2000;35(11):661–671.
Hilgenfeldt S, Brenner MP, Grossmann S, Lohse D. Analysis of Ray-leigh–Plesset dynamics for sonoluminescing bubbles. J Fluid Mech1998;365:171–204.
Ishida H, Nuntadusit C, Kimoto H, Nakagawa T, Yamamoto T. Cav-itation behavior near solid boundaries. Proceedings of CAV 20014th International Symposium on Cavitation, 2001.
Klibanov AL. Targeted delivery of gas-filled microspheres, contrastagents for ultrasound imaging. Adv Drug Delivery Rev 1999;37:139–157.
Kodama T, Takayama K. Dynamic behavior of bubbles during extra-corporeal shock-wave lithotripsy. Ultrasound Med Biol 1998;24(5):723–738.
Kralchevsky PA, Danov KD, Ivanov IB. Thin liquid film physics. In:Prud’homme R, Khan S, eds. Foams, theory, measurements andapplications. New York: Marcel Dekker, 1996:1–98.
Kudo N, Miyaoka T, Okada K, Yamamoto K, Niwa K. Study onmechanism of cell damage caused by microbubbles exposed toultrasound. Proc IEEE Ultrason Sympos 2002;1351–1354.
Lauterborn W. Optische Kavitation. Phys Blatter 1976;32(12):553–563.
Lauterborn W, Ohl CD. Cavitation bubble dynamics. Ultrason Sono-
chem 1997;4:65–75.
840 Ultrasound in Medicine and Biology Volume 30, Number 6, 2004
Leighton TG. The acoustic bubble. London: Academic Press Ltd, 1994.Lendon CL, Davies MJ, Born GVR, Richardson PD. Atherosclerotic
plaque caps are locally weakened when macrophages density isincreased. Atherosclerosis 1991;87:87–90.
Longuet–Higgins MS. The crushing of air cavities in a liquid. Proc RoySoc London A 1992;439:611–626.
Marmottant P, Hilgenfeldt S. Controlled vesicle deformation and lysisby single oscillating bubbles. Nature 2003;423:153–156.
Maruvada S, Hynynen K. Optical monitoring of ultrasound interactionwith blood vessels in transparent fish after injection with contrastagents. Proc IEEE Ultrason Sympos 2002;1936–1939.
Mathur AB, Collinsworth AM, Reichert WM, Kraus WE, Truskey GA.Endothelial, cardiac muscle and skeletal muscle exhibit differentviscous and elastic properties as determined by atomic force mi-croscopy. J Biomech 2001;34:1545–1553.
Mathur AB, Truskey GA, Reichert WM. Atomic force and total inter-nal reflection fluorescence microscopy for the study of force trans-mission in endothelial cells. Biophys J 2000;78:1725–1735.
Medwin H. Counting bubbles acoustically: A review. Ultrasonics 1977;15:7–13.
Miller DL, Nyborg WL. Theoretical investigation of the response ofgas-filled micropores and cavitation nuclei to ultrasound. J AcoustSoc Am 1983;73(5):1537–1544.
Miller MW. Gene transfection and drug delivery. Ultrasound Med Biol2000;26(Suppl. 1):S59–S62.
Morgan KE, Allen JS, Dayton PA, et al. Experimental and theoreticalevaluation of microbubble behavior: Effect of transmitted phaseand bubble size. IEEE Trans Ultrason Ferroelec Freq Control2000;47(6):1494–1509.
Narsimhan G, Ruckenstein E. Structure, drainage, and coalescence offoams and concentrated emulsions. In: Prud’homme R, Khan S,eds. Foams, theory, measurements and applications. New York:Marcel Dekker, 1996:99–187.
Ohl CD, Ikink R. Shock-wave-induced jetting of micron-size bubbles.Phys Rev Lett 2003;90:214502.
Ohl CD, Ory E. Aspherical bubble collapse—Comparison with simu-lations. In: Lauterborn W, Kurz T, eds. Nonlinear acoustics at theturn of the millennium: ISNA 15. New York: American Institute ofPhysics, 2000:393–396.
Pain HJ. The physics of vibrations and waves, 3rd ed. Chichester: JohnWiley & Sons Ltd, 1992.
Philipp A, Lauterborn W. Cavitation erosion by single laser-producedbubbles. J Fluid Mech 1998;361:75–116.
Postema M, Bouakaz A, Chin CT, de Jong N. Real-time opticalimaging of individual microbubbles in an ultrasonic field. ProcIEEE Ultrason Sympos 2001;1679–1682.
Postema M, Bouakaz A, Chin CT, de Jong N. Optically observedmicrobubble coalescence and collapse. Proc IEEE Ultrason Sympos2002a;1900–1903.
Postema M, Bouakaz A, Chin CT, de Jong N. Simulations and mea-surements of optical images of insonified ultrasound contrast mi-crobubbles. IEEE Trans Ultrason Ferroelec Freq Control 2003a;50(5):523–536.
Postema M, Bouakaz A, de Jong N. IEEE Trans Ultrason FerroelecFreq Control 2002b;49(3):cover page.
Postema M, Bouakaz A, de Jong N. Noninvasive microbubble-basedpressure measurements: A simulation study. Ultrasonics 2004;42(1-9):759–762.
Postema M, Lancee CT, de Jong N, Marmottant P, Hilgenfeldt S.Ultrasound-induced microbubble coalescence. 2003c (submitted).
Postema M, Marmottant P, Lancee C, Hilgenfeldt S, de Jong N.Ultrasound-induced microbubble coalescence by parametric insta-bility. Proc 10th Dutch Annu Conf BioMed Eng 2003d;177.
Reddy AJ, Szeri AJ. Coupled dynamics of translation and collapse ofacoustically driven microbubbles. J Acoust Soc Am 2002;112(4):1346–1352.
Rotsch C, Jacobson K, Radmacher M. Dimensional and mechanicaldynamics of active and stable edges in motile fibroblasts investi-gated by using atomic force microscopy. Proc Natl Acad Sci USA1999;96:921–926.
Schrope BA, Newhouse VL. Second harmonic ultrasonic blood perfu-sion measurement. Ultrasound Med Biol 1993;19(7):567–579.
Shankar PM, Krishna PD, Newhouse VL. Subharmonic backscatteringfrom ultrasound contrast agents. J Acoust Soc Am 1999;106(4):2104–2110.
Sheludko A. Thin liquid films. Advan Colloid Interf Sci 1967;1:391–464.
Shi WT, Forsberg F, Tornes A, Østensen J, Goldberg BB. Destructionof contrast microbubbles and the association with inertial cavita-tion. Ultrasound Med Biol 2000;26(6):1009–1019.
Shohet RV, Chen S, Zhou YT, et al. Echocardiographic destruction ofalbumin microbubbles directs gene delivery to the myocardium.Circulation 2000;101:2554–2556.
Skyba DM, Price RJ, Linka AZ, Skalak TC, Kaul S. Direct in vivovisualization of intravascular destruction of microbubbles by ultra-sound and its local effects on tissue. Circulation 1998;98:290–293.
Strasberg M. Gas bubbles as sources of sound in liquids. J Acoust SocAm 1956;28(1):20–26.
Stride E, Saffari N. On the destruction of microbubble ultrasoundcontrast agents. Ultrasound Med Biol 2003;29(4):563–573.
Tachibana K, Uchida T, Ogawa K, Yamashita N, Tamura K. Inductionof cell-membrane porosity by ultrasound. Lancet 1999;353:1409.
Takeuchi Y. IEEE Trans Ultrason Ferroelec Freq Control 1999;46(4):cover page.
Taniyama Y, Tachibana K, Hiraoka K, et al. Local delivery of plasmidDNA into rat carotid artery using ultrasound. Circulation 2002;105:1233–1239.
Tortoli P, Michelassi V, Corsi M, Righi D, Takeuchi Y. On theinteraction between ultrasound and contrast agents during Dopplerinvestigations. Ultrasound Med Biol 2001;27(9):1265–1273.
Uhlendorf V, Hoffmann C. Nonlinear acoustical response of coatedmicrobubbles in diagnostic ultrasound. Proc IEEE Ultrason Sym-pos 1994;1559–1562.
Unger EC, Matsunaga TO, McCreery T, et al. Therapeutic applicationsof microbubbles. Eur J Radiol 2002;42:160–168.
Unger EC, Wu Q, McGreery TP, Matsunaga TO. Thrombus-specificcontrast agents for imaging and thrombolysis. In: Goldberg B,Raichlen J, Forsberg F, eds. Ultrasound contrast agents. Basicprinciples and clinical applications, 2nd ed. London: Martin DunitzLtd, 2001:337–345.
van Wamel A, Bouakaz A, ten Cate F, de Jong N. Effects of diagnosticultrasound parameters on molecular uptake and cell viability. ProcIEEE Ultrason Sympos 2002;1387–1390.
Vokurka K. Comparison of Rayleigh’s, Herring’s, and Gilmore’s mod-els of gas bubbles. Acustica 1986;59:214–219.
Wei K. Blood flow and perfusion measurements: Background andclinical utility. In: Goldberg B, Raichlen J, Forsberg F, eds. Ultra-sound contrast agents. Basic principles and clinical applications,2nd ed. London: Martin Dunitz Ltd, 2001:89–104.
Wei K, Jayaweera AR, Firoozan S, et al. Quantification of myocardialblood flow with ultrasound-induced destruction of microbubblesadministered as a constant venous infusion. Circulation 1998;97:473–483.
Copyright © 2022 FDOKUMEN