Single-substrate encapsulated cholesteric LCDs: Coatable, drapable, and foldable
Upload
independentCategory
view
9download
0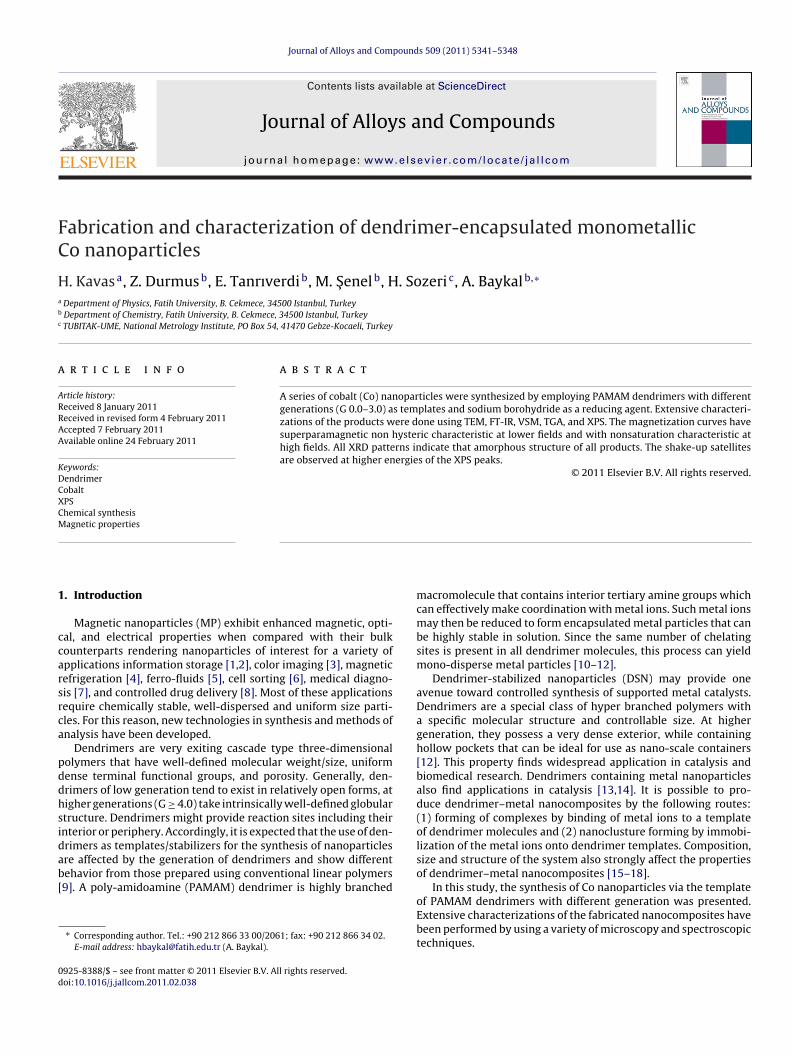
FC
Ha
b
c
a
ARRAA
KDCXCM
1
ccarsrca
pddhsidab[
0d
Journal of Alloys and Compounds 509 (2011) 5341–5348
Contents lists available at ScienceDirect
Journal of Alloys and Compounds
journa l homepage: www.e lsev ier .com/ locate / ja l l com
abrication and characterization of dendrimer-encapsulated monometallico nanoparticles
. Kavasa, Z. Durmusb, E. Tanrıverdib, M. Senelb, H. Sozeri c, A. Baykalb,∗
Department of Physics, Fatih University, B. Cekmece, 34500 Istanbul, TurkeyDepartment of Chemistry, Fatih University, B. Cekmece, 34500 Istanbul, TurkeyTUBITAK-UME, National Metrology Institute, PO Box 54, 41470 Gebze-Kocaeli, Turkey
r t i c l e i n f o
rticle history:eceived 8 January 2011eceived in revised form 4 February 2011ccepted 7 February 2011
a b s t r a c t
A series of cobalt (Co) nanoparticles were synthesized by employing PAMAM dendrimers with differentgenerations (G 0.0–3.0) as templates and sodium borohydride as a reducing agent. Extensive characteri-zations of the products were done using TEM, FT-IR, VSM, TGA, and XPS. The magnetization curves havesuperparamagnetic non hysteric characteristic at lower fields and with nonsaturation characteristic at
vailable online 24 February 2011
eywords:endrimerobaltPShemical synthesisagnetic properties
high fields. All XRD patterns indicate that amorphous structure of all products. The shake-up satellitesare observed at higher energies of the XPS peaks.
© 2011 Elsevier B.V. All rights reserved.
. Introduction
Magnetic nanoparticles (MP) exhibit enhanced magnetic, opti-al, and electrical properties when compared with their bulkounterparts rendering nanoparticles of interest for a variety ofpplications information storage [1,2], color imaging [3], magneticefrigeration [4], ferro-fluids [5], cell sorting [6], medical diagno-is [7], and controlled drug delivery [8]. Most of these applicationsequire chemically stable, well-dispersed and uniform size parti-les. For this reason, new technologies in synthesis and methods ofnalysis have been developed.
Dendrimers are very exiting cascade type three-dimensionalolymers that have well-defined molecular weight/size, uniformense terminal functional groups, and porosity. Generally, den-rimers of low generation tend to exist in relatively open forms, atigher generations (G ≥ 4.0) take intrinsically well-defined globulartructure. Dendrimers might provide reaction sites including theirnterior or periphery. Accordingly, it is expected that the use of den-
rimers as templates/stabilizers for the synthesis of nanoparticlesre affected by the generation of dendrimers and show differentehavior from those prepared using conventional linear polymers9]. A poly-amidoamine (PAMAM) dendrimer is highly branched∗ Corresponding author. Tel.: +90 212 866 33 00/2061; fax: +90 212 866 34 02.E-mail address: [email protected] (A. Baykal).
925-8388/$ – see front matter © 2011 Elsevier B.V. All rights reserved.oi:10.1016/j.jallcom.2011.02.038
macromolecule that contains interior tertiary amine groups whichcan effectively make coordination with metal ions. Such metal ionsmay then be reduced to form encapsulated metal particles that canbe highly stable in solution. Since the same number of chelatingsites is present in all dendrimer molecules, this process can yieldmono-disperse metal particles [10–12].
Dendrimer-stabilized nanoparticles (DSN) may provide oneavenue toward controlled synthesis of supported metal catalysts.Dendrimers are a special class of hyper branched polymers witha specific molecular structure and controllable size. At highergeneration, they possess a very dense exterior, while containinghollow pockets that can be ideal for use as nano-scale containers[12]. This property finds widespread application in catalysis andbiomedical research. Dendrimers containing metal nanoparticlesalso find applications in catalysis [13,14]. It is possible to pro-duce dendrimer–metal nanocomposites by the following routes:(1) forming of complexes by binding of metal ions to a templateof dendrimer molecules and (2) nanoclusture forming by immobi-lization of the metal ions onto dendrimer templates. Composition,size and structure of the system also strongly affect the propertiesof dendrimer–metal nanocomposites [15–18].
In this study, the synthesis of Co nanoparticles via the templateof PAMAM dendrimers with different generation was presented.Extensive characterizations of the fabricated nanocomposites havebeen performed by using a variety of microscopy and spectroscopictechniques.

5342 H. Kavas et al. / Journal of Alloys and Compounds 509 (2011) 5341–5348
O
NH
NH
O
N
O
HN
HN
O
N
ONH
HN
ON
O NH
HN
O
N
ONH
HN
O
N
ONH HN
O
H2N
N
NH2
O NH
HN
O
H2N
N
NH2
ONH
HN
O
NH2
N
NH2
O
NH
NH
O
NH2
N
NH2
O
HN
NHO
N
O
NH
NHO
N
O
HN
NHO
N
O
NH
NH
O
NH2
N
NH2
O
NH
NHO
NH2
N
NH2
O
HN
NHO NH2
N
H2N
OHNNH
O
N
O
NH
HN O
N
O
HN
HNO
N
O
NH
HNOH
N
O
HN
HN
O
H2N
N
H2N
O
HN
HNO
H2N
N
H2NO
NH
HN OH2N
N
NH2
ONH HN
O
H2N
N
NH2
OHN
NH
ON
OHN
NH
O
N
OHN
NH
O
N
OHNNH
O
N
H2N
OHN
NH
O
NH2
N
H2N
OHN
NH
O
H2N
N
H2N
O
HN
HN
O
H2N
N
H2NG-0
G-1
G-2
G-3
of G0
2
2
fo
NH2
Fig. 1. The structure
. Experimental
.1. Materials
Cobalt chloride (CoCl2·6H2O), sodium borohydride (NaBH4), were purchasedrom Merck and used as received without further purification. All the chemicals aref analytical grade.
Fig. 2. Schematic representation of the synthesis o
NH2H2N
.0–G3.0 dendrimers.
2.2. Characterization
X-ray powder diffraction (XRD) analysis was conducted on a Rigaku Smart Lab
Diffractometer operated at 40 kV and 35 mA using Cu K� radiation (� = 1.54178 A).Fourier transform infrared (FT-IR) spectra were recorded in transmission modewith a Perkin Elmer BX FT-IR infrared spectrometer. The powder samples wereground with KBr and compressed into a pellet (in the range 4000–400 cm−1).
f dendrimer encapsulated Co nanoparticles.
H. Kavas et al. / Journal of Alloys and Compounds 509 (2011) 5341–5348 5343
r redu
Jg
Pfo
ptwm
Fig. 3. Changes in solution color of G220–Co2+ before (a) and afte
Transmission electron microscopy (TEM) analysis was performed using a JEOLEM 2100 microscope. A drop of diluted sample in alcohol was dripped on a TEMrid.
The thermal stability was determined by thermogravimetric analysis (TGA,erkin Elmer Instruments model, STA 6000). The TGA thermograms were recordedor 5 mg of powder sample at a heating rate of 10 ◦C min in the temperature range
f 30–800 ◦C under nitrogen atmosphere.VSM measurements were performed by using a Quantum Design Vibrating sam-le magnetometer (QD-VSM). The sample was measured between ±10 kOe at roomemperature and 10 K. ZFC (zero field cooling) and FC (field cooling) measurementsere carried out at 100 Oe and the blocking temperature was determined from theeasurements.
5001000150020002500300035004000
Wavenumber (cm-1)
% T
ran
sm
itta
nc
e (
a.u
.)
C010
C020
C030
C040
G0
a
5001000150020002500300035004000
Wavenumber (cm-1)
% T
ran
sm
itta
nc
e (
a.u
.)
C210
C220
C230
C240
G2 1649 1545
16421538
c
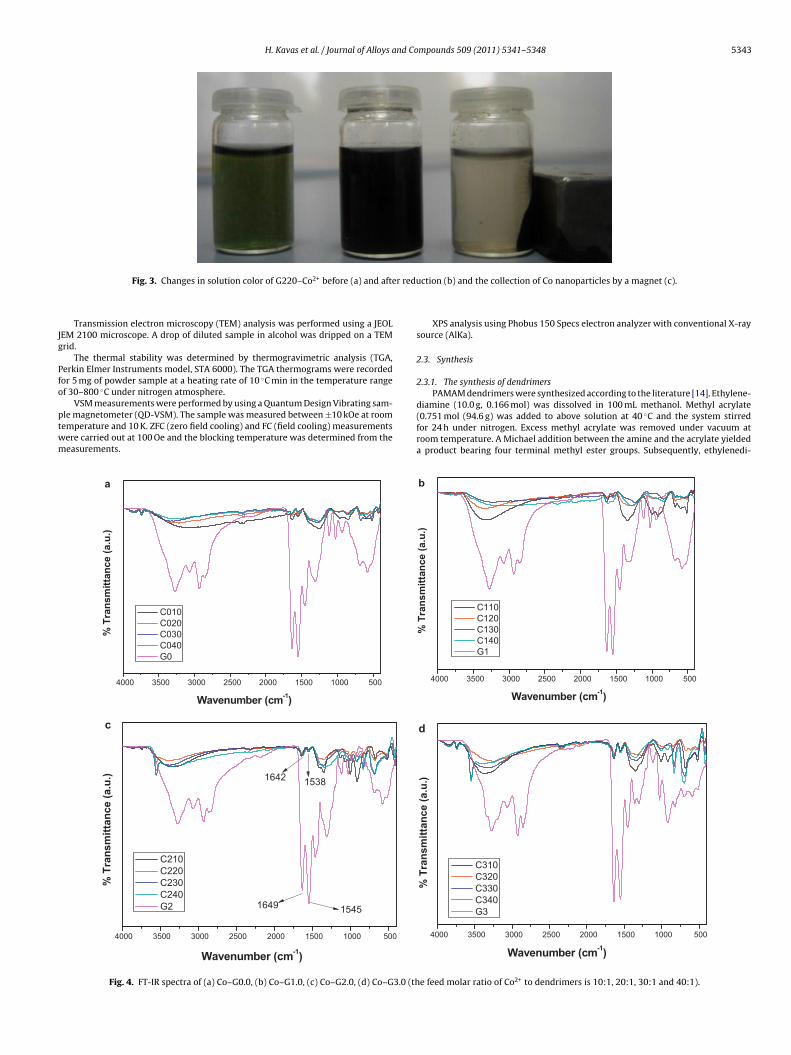
Fig. 4. FT-IR spectra of (a) Co–G0.0, (b) Co–G1.0, (c) Co–G2.0, (d) Co–G3.0 (th
ction (b) and the collection of Co nanoparticles by a magnet (c).
XPS analysis using Phobus 150 Specs electron analyzer with conventional X-raysource (AlKa).
2.3. Synthesis
2.3.1. The synthesis of dendrimers
PAMAM dendrimers were synthesized according to the literature [14]. Ethylene-diamine (10.0 g, 0.166 mol) was dissolved in 100 mL methanol. Methyl acrylate(0.751 mol (94.6 g) was added to above solution at 40 ◦C and the system stirredfor 24 h under nitrogen. Excess methyl acrylate was removed under vacuum atroom temperature. A Michael addition between the amine and the acrylate yieldeda product bearing four terminal methyl ester groups. Subsequently, ethylenedi-
5001000150020002500300035004000
Wavenumber (cm-1)
% T
ran
sm
itta
nce
(a
.u.)
C110
C120
C130
C140
G1
b
5001000150020002500300035004000
Wavenumber (cm-1)
% T
ran
sm
itta
nc
e (
a.u
.)
C310
C320
C330
C340
G3
d
e feed molar ratio of Co2+ to dendrimers is 10:1, 20:1, 30:1 and 40:1).

5344 H. Kavas et al. / Journal of Alloys and Compounds 509 (2011) 5341–5348
4000 3500 3000 2500 2000 1500 1000 500
-1
C020
C120
C220
C320
% T
ran
sm
itta
nce (
a.u
.)
F2
amtactNtp
2
a
Table 1Some chemical and physical characteristic of dendrimers.
Generation Molecular formula Molecularweight(g mol−1)
Number ofterminalaminogroups
Number oftotal aminogroups
G0 C22H48O4N10 516 4 10G1 C62H128O12N26 1429 8 26G2 C142H288O28N58 3254 16 58G3 C302H609O60N132 6905 32 122
Table 2Denotation of dendrimer-encapsulated monometallic Co-nanoparticles.
Generation Metal/Dendrimer molar ratio
10:1 20:1 30:1 40:1
G0 C010 C020 C030 C040G1 C110 C120 C130 C140
Wavenumber (cm )
ig. 5. FT-IR spectra of Co–G0–G3 (the feed molar ratio of Co2+ to dendrimers is0:1).
mine (120 g, 2.00 mol) was dissolved in methanol and added to the four terminalethyl ester containing dendrimer, stirred for 48 h under nitrogen and excess reac-
ants were removed by vacuum distillation. Then, product bearing four terminalmino groups were obtained, defined as the G0 PAMAM. By repeating the aboveycle, higher generation PAMAM dendrimers (up to G3) were synthesized. Purity ofhe amine-terminated PAMAM dendrimers was characterized via FT-IR, 1H and 13CMR. The results agreed well with that reported in the literature [19]. The struc-
ures of dendrimers are given in Fig. 1. The characteristics and abbreviations areresented in Table 1.
.3.2. The synthesis of Co nanoparticles via the template of dendrimersBriefly, certain amount of CoCl2·6H2O dissolved in 10 mL of in Milli-Q water was
dded drop-wise into a 10 mL of 1 mM dendrimer (G0.0, 1.0, 2.0 and 3.0) solution,
80706050403020
C010
C020
C030
C040
b a
50403020
c
Fig. 6. XRD powder pattern of (a) Co–G0, (b) Co–G1, (c) Co–G2 (the fee
G2 C210 C220 C230 C240G3 C310 C320 C330 C340
followed by further stirring for 2 h in order to drive the coordination reaction tocompletion (Fig. 2). The feed molar ratio of Co2+ to dendrimers is 10:1, 20:1, 30:1and 40:1, respectively (Table 2). Afterwards, 10 mL of 0.3 M NaBH4 solution (freshlyprepared) was introduced into the above solution quickly, and then the mixturewas stirred vigorously for 1 h. The solid was filtered, rinsed three times with Milli-Qwater, and then dried under vacuum at 50 ◦C (Fig. 3).
As presented in Fig. 3, the Co NP’s were prepared via a two-step sequence. Thecoordination of Co2+ ions with dendrimers and subsequent chemical reduction toproduce Co NP’s. After the coordination of Co2+ to the dendrimer, solution turns intogreen (Fig. 3a). When Co2+ ions were reduced into Co NP’s, solution color becomes
dark gray (Fig. 3b). This is an important indication of reduction of Co2+ ions into Co[20,21]. After the dispersion of solid product in an aqueous solution, they could beeasily collected by magnet (Fig. 3c).80706050403020
C110
C120
C130
C140
7060
C210
C220
C230
C240
d molar ratio of Co2+ to dendrimers is 10:1, 20:1, 30:1 and 40:1).
H. Kavas et al. / Journal of Alloys and Compounds 509 (2011) 5341–5348 5345
700600500400300200100
60
70
80
90
100
C320
C220
C120
Weig
ht
% C020
F
3
3
dGtc(tba
-15000 -10000 -5000 0 5000 10000 15000
-15
-10
-5
0
5
10
15
C020
C120
C220
C320
Ma
gn
etiza
tio
n (
em
u/g
)
Magnetic Field (kOe)
Temperature (°C)
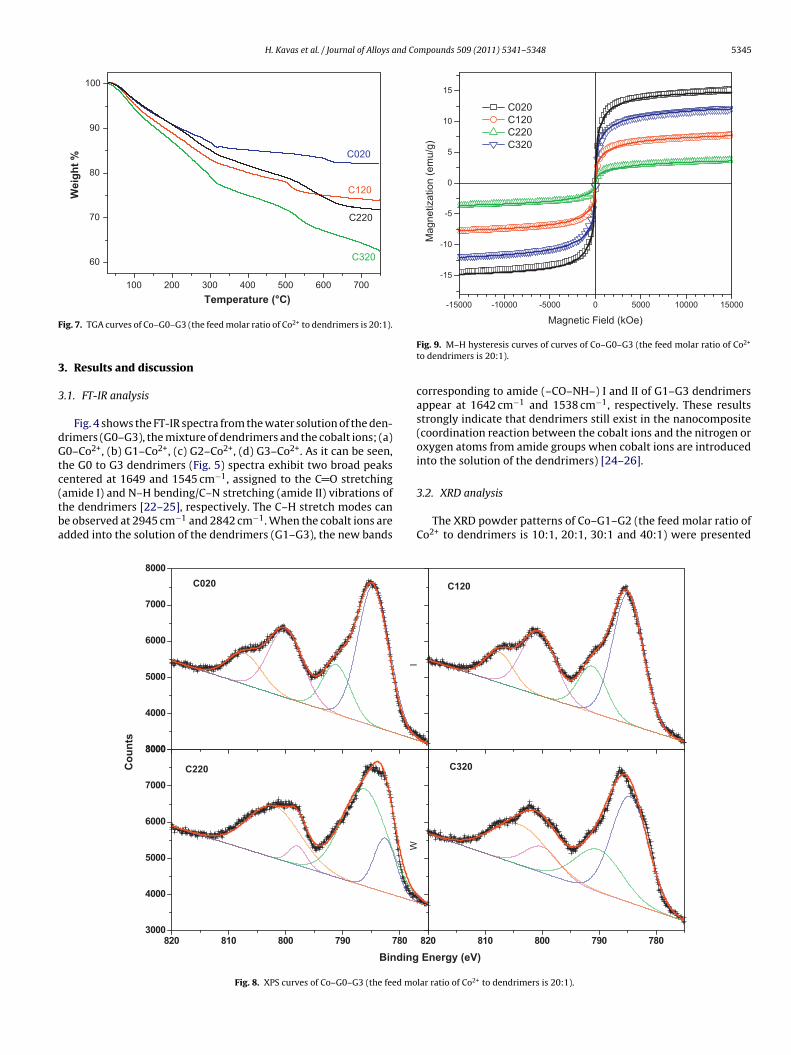
ig. 7. TGA curves of Co–G0–G3 (the feed molar ratio of Co2+ to dendrimers is 20:1).
. Results and discussion
.1. FT-IR analysis
Fig. 4 shows the FT-IR spectra from the water solution of the den-rimers (G0–G3), the mixture of dendrimers and the cobalt ions; (a)0–Co2+, (b) G1–Co2+, (c) G2–Co2+, (d) G3–Co2+. As it can be seen,
he G0 to G3 dendrimers (Fig. 5) spectra exhibit two broad peaksentered at 1649 and 1545 cm−1, assigned to the C O stretching
amide I) and N–H bending/C–N stretching (amide II) vibrations ofhe dendrimers [22–25], respectively. The C–H stretch modes cane observed at 2945 cm−1 and 2842 cm−1. When the cobalt ions aredded into the solution of the dendrimers (G1–G3), the new bands3000
4000
5000
6000
7000
8000
C020
820 810 800 790 7803000
4000
5000
6000
7000
8000
C220Co
un
ts
Binding
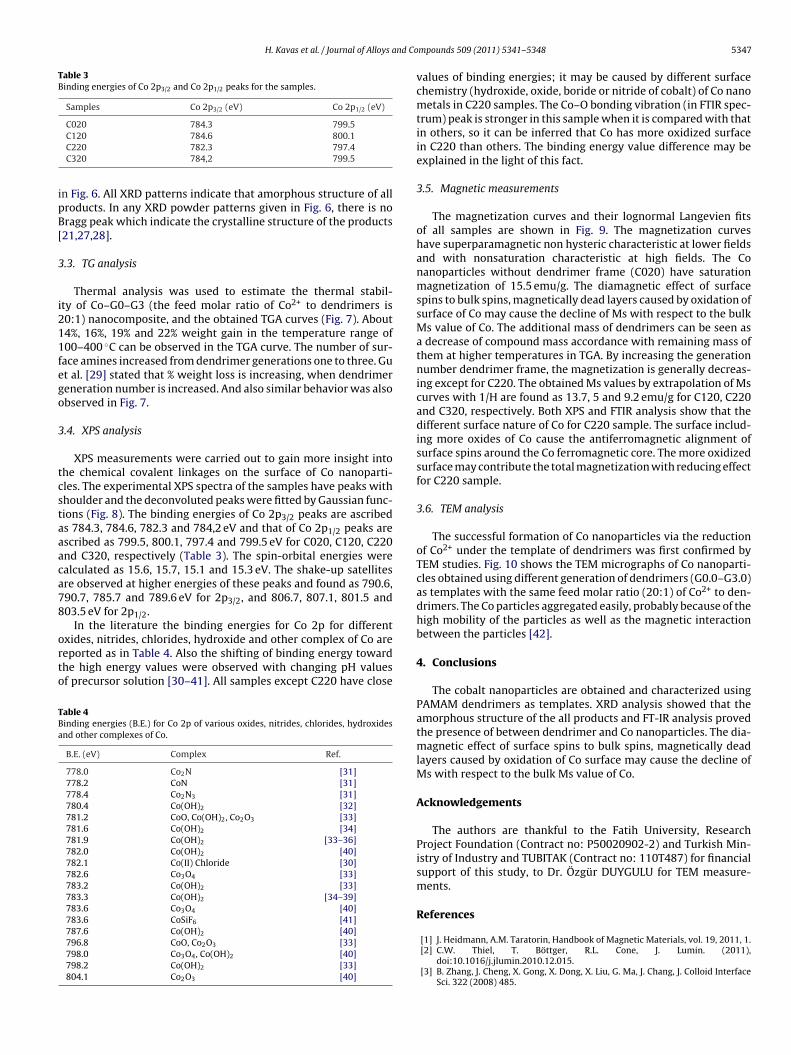
Fig. 8. XPS curves of Co–G0–G3 (the feed mo
Fig. 9. M–H hysteresis curves of curves of Co–G0–G3 (the feed molar ratio of Co2+
to dendrimers is 20:1).
corresponding to amide (–CO–NH–) I and II of G1–G3 dendrimersappear at 1642 cm−1 and 1538 cm−1, respectively. These resultsstrongly indicate that dendrimers still exist in the nanocomposite(coordination reaction between the cobalt ions and the nitrogen oroxygen atoms from amide groups when cobalt ions are introducedinto the solution of the dendrimers) [24–26].
3.2. XRD analysis
The XRD powder patterns of Co–G1–G2 (the feed molar ratio ofCo2+ to dendrimers is 10:1, 20:1, 30:1 and 40:1) were presented
C120
I
820 810 800 790 780
C320
W
Energy (eV)
lar ratio of Co2+ to dendrimers is 20:1).

5346 H. Kavas et al. / Journal of Alloys and Compounds 509 (2011) 5341–5348
Fig. 10. TEM images of (a) Co–G0, (b) Co–G1, (c) Co–G2, (d) Co–G3 (the feed molar ratio of Co2+ to dendrimers is 20:1).
H. Kavas et al. / Journal of Alloys and Co
Table 3Binding energies of Co 2p3/2 and Co 2p1/2 peaks for the samples.
Samples Co 2p3/2 (eV) Co 2p1/2 (eV)
ipB[
3
i211fego
3
tcstaaaca78
orto
TBa
C020 784.3 799.5C120 784.6 800.1C220 782.3 797.4C320 784,2 799.5
n Fig. 6. All XRD patterns indicate that amorphous structure of allroducts. In any XRD powder patterns given in Fig. 6, there is noragg peak which indicate the crystalline structure of the products21,27,28].
.3. TG analysis
Thermal analysis was used to estimate the thermal stabil-ty of Co–G0–G3 (the feed molar ratio of Co2+ to dendrimers is0:1) nanocomposite, and the obtained TGA curves (Fig. 7). About4%, 16%, 19% and 22% weight gain in the temperature range of00–400 ◦C can be observed in the TGA curve. The number of sur-ace amines increased from dendrimer generations one to three. Gut al. [29] stated that % weight loss is increasing, when dendrimereneration number is increased. And also similar behavior was alsobserved in Fig. 7.
.4. XPS analysis
XPS measurements were carried out to gain more insight intohe chemical covalent linkages on the surface of Co nanoparti-les. The experimental XPS spectra of the samples have peaks withhoulder and the deconvoluted peaks were fitted by Gaussian func-ions (Fig. 8). The binding energies of Co 2p3/2 peaks are ascribeds 784.3, 784.6, 782.3 and 784,2 eV and that of Co 2p1/2 peaks arescribed as 799.5, 800.1, 797.4 and 799.5 eV for C020, C120, C220nd C320, respectively (Table 3). The spin-orbital energies werealculated as 15.6, 15.7, 15.1 and 15.3 eV. The shake-up satellitesre observed at higher energies of these peaks and found as 790.6,90.7, 785.7 and 789.6 eV for 2p3/2, and 806.7, 807.1, 801.5 and03.5 eV for 2p1/2.
In the literature the binding energies for Co 2p for differentxides, nitrides, chlorides, hydroxide and other complex of Co areeported as in Table 4. Also the shifting of binding energy towardhe high energy values were observed with changing pH valuesf precursor solution [30–41]. All samples except C220 have close
able 4inding energies (B.E.) for Co 2p of various oxides, nitrides, chlorides, hydroxidesnd other complexes of Co.
B.E. (eV) Complex Ref.
778.0 Co2N [31]778.2 CoN [31]778.4 Co2N3 [31]780.4 Co(OH)2 [32]781.2 CoO, Co(OH)2, Co2O3 [33]781.6 Co(OH)2 [34]781.9 Co(OH)2 [33–36]782.0 Co(OH)2 [40]782.1 Co(II) Chloride [30]782.6 Co3O4 [33]783.2 Co(OH)2 [33]783.3 Co(OH)2 [34–39]783.6 Co3O4 [40]783.6 CoSiF6 [41]787.6 Co(OH)2 [40]796.8 CoO, Co2O3 [33]798.0 Co3O4, Co(OH)2 [40]798.2 Co(OH)2 [33]804.1 Co2O3 [40]
mpounds 509 (2011) 5341–5348 5347
values of binding energies; it may be caused by different surfacechemistry (hydroxide, oxide, boride or nitride of cobalt) of Co nanometals in C220 samples. The Co–O bonding vibration (in FTIR spec-trum) peak is stronger in this sample when it is compared with thatin others, so it can be inferred that Co has more oxidized surfacein C220 than others. The binding energy value difference may beexplained in the light of this fact.
3.5. Magnetic measurements
The magnetization curves and their lognormal Langevien fitsof all samples are shown in Fig. 9. The magnetization curveshave superparamagnetic non hysteric characteristic at lower fieldsand with nonsaturation characteristic at high fields. The Conanoparticles without dendrimer frame (C020) have saturationmagnetization of 15.5 emu/g. The diamagnetic effect of surfacespins to bulk spins, magnetically dead layers caused by oxidation ofsurface of Co may cause the decline of Ms with respect to the bulkMs value of Co. The additional mass of dendrimers can be seen asa decrease of compound mass accordance with remaining mass ofthem at higher temperatures in TGA. By increasing the generationnumber dendrimer frame, the magnetization is generally decreas-ing except for C220. The obtained Ms values by extrapolation of Mscurves with 1/H are found as 13.7, 5 and 9.2 emu/g for C120, C220and C320, respectively. Both XPS and FTIR analysis show that thedifferent surface nature of Co for C220 sample. The surface includ-ing more oxides of Co cause the antiferromagnetic alignment ofsurface spins around the Co ferromagnetic core. The more oxidizedsurface may contribute the total magnetization with reducing effectfor C220 sample.
3.6. TEM analysis
The successful formation of Co nanoparticles via the reductionof Co2+ under the template of dendrimers was first confirmed byTEM studies. Fig. 10 shows the TEM micrographs of Co nanoparti-cles obtained using different generation of dendrimers (G0.0–G3.0)as templates with the same feed molar ratio (20:1) of Co2+ to den-drimers. The Co particles aggregated easily, probably because of thehigh mobility of the particles as well as the magnetic interactionbetween the particles [42].
4. Conclusions
The cobalt nanoparticles are obtained and characterized usingPAMAM dendrimers as templates. XRD analysis showed that theamorphous structure of the all products and FT-IR analysis provedthe presence of between dendrimer and Co nanoparticles. The dia-magnetic effect of surface spins to bulk spins, magnetically deadlayers caused by oxidation of Co surface may cause the decline ofMs with respect to the bulk Ms value of Co.
Acknowledgements
The authors are thankful to the Fatih University, ResearchProject Foundation (Contract no: P50020902-2) and Turkish Min-istry of Industry and TUBITAK (Contract no: 110T487) for financialsupport of this study, to Dr. Özgür DUYGULU for TEM measure-ments.
References
[1] J. Heidmann, A.M. Taratorin, Handbook of Magnetic Materials, vol. 19, 2011, 1.[2] C.W. Thiel, T. Böttger, R.L. Cone, J. Lumin. (2011),
doi:10.1016/j.jlumin.2010.12.015.[3] B. Zhang, J. Cheng, X. Gong, X. Dong, X. Liu, G. Ma, J. Chang, J. Colloid Interface
Sci. 322 (2008) 485.
5 nd Co
[[[
[[[
[
[[[[[
[
[
[[[[[[[[
[
[
[
[
[[
348 H. Kavas et al. / Journal of Alloys a
[4] S. Othmani, R. Blel, M. Bejar, M. Sajieddine, E. Dhahri, E.K. Hlil, Solid StateCommun. 149 (2009) 969.
[5] M.F. Casula, A. Corrias, P. Arosio, A. Lascialfari, T. Sen, P. Floris, I.J. Bruce, J. ColloidInterface Sci. (2011), doi:10.1016/j.jcis.2011.01.088.
[6] H. Ito, R. Kato, K. Ino, H. Honda, J. Biosci. Bioeng. 109 (2010) 182.[7] B. Fenga, R.Y. Honga, Y.J. Wua, G.H. Liuc, L.H. Zhongb, Y. Zhengd, J.M. Dinge, D.G.
Wei, J. Alloys Compd. 473 (2009) 356.[8] S. Laurent, D. Forge, M. Port, A. Roch, C. Robic, L.V. Elst, R.N. Muller, Chem. Rev.
108 (2008) 2064.[9] L. Jin, S. Yang, Q. Tian, H. Wu, Y. Cai, Mater. Chem. Phys. 112 (2008) 977.10] R.C. Hedden, B.J. Bauer, A.P. Smith, F. Grohn, E. Amis, Polymer 43 (2002) 5473.11] Y. Niu, H. Lu, D. Wang, Y. Yue, S. Feng, J. Organomet. Chem. 696 (2011) 544.12] O. Ozturk, T.J. Black, K. Perrine, K. Pizzolato, C.T. Williams, F.W. Parsons, J.S.
Ratliff, J. Gao, C.J. Murphy, H. Xie, H.J. Ploehn, D.A. Chen, Langmuir 21 (2005)3998.
13] B. Natarajan, N. Jayaraman, J. Organomet. Chem. 696 (2011) 722.14] Y. Niu, R.M. Crooks, C. R. Chim. 6 (2003) 1049.15] Y.J. Jin, Y.J. Luo, G.P. Li, J. Li, Y.F. Wang, R.Q. Yang, W.T. Lu, Forensic Sci. Int. 179
(2008) 34.16] L. Balogh, R. Valluzzi, G.L. Hagnauer, K.S. Laverdure, S.P. Gido, D.A. Tomalia, J.
Nanopart. Res. 1 (1999) 353.17] M.F. Ottaviani, R. Valluzzi, L. Balogh, Macromolecules 35 (2002) 5105.
18] Y.Y. Cheng, D.Z. Chen, R.Q. Fu, Polym. Int. 54 (2005) 495.19] D.A. Tomalia, A.M. Naylor, W.A. Goddard, Angew. Chem. 29 (1990) 138.20] Y. Chen, K.Y. Liev, J.L. Li, Appl. Surf. Sci. 255 (2009) 4039.21] H.X. Wu, C.X. Zhang, L. Jin, H. Yang, S.P. Yang, Mater. Chem. Phys. 121 (2010)342.22] H.M. Tan, Y.J. Luo, Dendritic Polymer, Chemical Industry Press, Beijing, 2002.
[[[
[[
mpounds 509 (2011) 5341–5348
23] G. Socrates, Infrared and Raman Characteristic Group Frequencies: Tables andCharts, 3rd ed., Wiley, Chichester, 2001.
24] L. Jin, S. Yang, Q.W. Tiana, H.X. Wua, Y.J. Cai, Mat. Chem. Phys. 112 (2008) 977.25] T. Endo, T. Yoshimura, K. Esumi, J. Colloid Interface Sci. 286 (2005) 602.26] D.X. Liu, J.X. Gao, J.C. Murphy, T.C. Williams, J. Phys. Chem. B 108 (2004) 12911.27] K. Yasui, T. Morikawa, K. Nishio, H. Masuda, Jpn. J. Appl. Phys. 44 (2005) L469.28] J.X. Xu, Y. Xu, Mater. Lett. 60 (2006) 2069.29] B.F. Pan, F. Gao, H.C. Gu, J. Colloid Interface Sci. 284 (2005) 1.30] J.G. Dillard, M.H. Koppelman, J. Colloid Interface Sci. 87 (1982) 56.31] W. De La Cruz, O. Contreras, G. Soto, E.P. Tijerina, Revista Mexicana De Fisica
52 (5) (2006) 409.32] Y.P. Wang, Y.J. Wang, Q.L. Ren, L. Li, L.F. Jiao, D.W. Song, G. Liu, Y. Han, H.T. Yuan,
Fuel Cells 10 (2010) 510.33] C.H. Liu, B.H. Chen, C.L. Hsueh, J.R. Ku, F. Tsau, K.J. Hwang, Appl. Catal. B 91
(2009) 368.34] N. Patel, G. Guella, A. Kale, A. Miotello, B. Patton, C. Zanchetta, L. Mirenghi, P.
Rotolo, Appl. Catal. A 323 (2007) 18.35] N. Patel, R. Fernandes, G. Guella, A. Kale, A. Miotello, B. Patton, C. Zanchetta, J.
Phys. Chem. 112 (2008) 6968.36] N. Patel, R. Fernandes, A. Miotello, J. Power Sources 188 (2009) 411.37] R. Fernandes, N. Patel, A. Miotello, M. Filippi, J. Mol. Catal. A: Chem. 298 (2009)
1.
38] R. Fernandes, N. Patel, A. Miotello, Appl. Catal. B 92 (2009) 68.39] R. Fernandes, N. Patel, A. Miotello, Int. J. Hydrogen Energy 34 (2009) 2893.40] C.H. Liu, Y.C. Kuo, B.H. Chen, C.L. Hsueh, K.J. Hwang, J.R. Ku, F. Tsau, M.S. Jeng,Int. J. Hydrogen Energy 35 (2010) 4027.41] T. Sekine, N. Ikeo, Y. Nagasawa, Appl. Surf. Sci. 100/101 (1996) 30.42] Y. Chen, K.Y. Liew, J.L. Li, Appl. Surf. Sci. 255 (2009) 4039.
Copyright © 2022 FDOKUMEN