
Encapsulated Salt Hydrate Phase Change Materials for ...
253
Encapsulated Salt Hydrate Phase Change Materials for Thermal Energy Storage Thesis submitted in accordance with the requirements of the University of Liverpool for the Degree of Doctor in Philosophy Michael Graham Supervisor: Prof. Dmitry Shchukin September 2017
-
Upload
khangminh22 -
Category
Documents
-
view
4 -
download
0
Transcript of Encapsulated Salt Hydrate Phase Change Materials for ...

Encapsulated Salt Hydrate
Phase Change Materials for
Thermal Energy Storage
Thesis submitted in accordance with the requirements of the University of Liverpool for the
Degree of Doctor in Philosophy
Michael Graham
Supervisor: Prof. Dmitry Shchukin
September 2017
i | P a g e
Abstract
Man-made climate change is the biggest threat to humanity and other species inhabiting planet
Earth. As technological advancement becomes ubiquitous with modern life, energy demand has
increased immensely. It is vital to develop sustainable sources for energy production. Around 80% of
worldwide energy is currently produced by fossil fuels. Coal, natural gas and oil are huge
contributors to the release of CO2 and methane into the atmosphere, which has led to a global
average temperature increase of 0.8°C since the Industrial Revolution. Much research has been
undertaken in developing renewable energies, with great recent advancements made on solar, wind
and hydropower amongst others. Renewable energies garner much attention, both within the
scientific community and mainstream media. However, renewable energies suffer from
intermittency and cannot be used continuously. An often overlooked yet essential component of
renewable energies is thermal energy storage, which will vastly improve their continued use and
efficiency.
Chapter 1 provides a literature overview of the current world energy problem and energy storage.
Thermal energy storage is currently achieved using sensible heat storage materials, which store heat
as they increase in temperature. They have low volumetric energy capacity, especially when
compared to latent heat storage materials, which store and release energy as they change phase.
These materials are known as phase change materials (PCMs), of which organic paraffin waxes and
inorganic salt hydrates (also known as crystallohydrates) are the most promising candidates. PCMs
not only have the potential to improve efficiency of renewable energy sources, they may also be
used for applications such as passive thermal regulation. Thermal regulation can greatly reduce air
conditioning demands of buildings, and increase lifetimes of photovoltaics and electronics.
Unfortunately, PCMs are not available for use in their bulk state due to several drawbacks which
lead to short lifetimes. Numerous approaches have been made to increase their lifespan.
Encapsulation within a polymer shell is considered the best approach, as it gives numerous
advantages whilst employing simple reaction methods, allowing for industrial scale-up. Reducing
ii | P a g e
capsule diameter to the nanometre range hugely increases surface area to volume ratio, which can
eliminate several inherent drawbacks of PCMs.
Salt hydrates are the most promising PCM, due to their very high volumetric energy storage density.
However, they are also the most problematic PCM to work with. They are corrosive, incongruently
melt and are prone to supercooling. Due to their hydrophilicity, they are also difficult to encapsulate.
Our initial approach to confine them on the nanoscale was to produce water-in-oil emulsions using
surfactants. Chapter 2 details how we found that several surfactant combinations could be used to
provide an initial shell with salt hydrates solubilised within them. However, a more robust shell was
required for full analysis.
To fully stabilise the salt hydrates, a polymer shell needs to form around the emulsion droplets.
Chapter 3 details the use of poly(ethyl-2-cyanoacrylate) (PECA) for the formation of nanocapsules
containing magnesium nitrate hexahydrate and sodium sulphate decahydrate. The salt hydrates
showed vastly increased stability and thermal properties once encapsulated. Hydration level of the
salts could be maintained by employing ultrasound to create miniemulsions, whilst supercooling was
greatly reduced. The PECA nanocapsules were stable for at least 100 cycles, with results suggesting
they would be stable for many more. This is in stark contrast to the bulk PCMs which were stable for
less than 10 cycles.
Developing several polymer shells for encapsulation is of benefit as capsules can then be tailored to
suit different applications. We used polyurethane (PU), one of the most commonly used polymers in
industry, which displays great versatility. Chapter 4 documents how micro- and nanocapsules can be
synthesised with a PU shell. Initial results have been promising, with the materials stable for at least
10 cycles when encapsulated. PU also displays better thermal stability and chemical resistance
compared to PECA. Our results demonstrate the potential of salt hydrates for use in thermal energy
storage applications.
iii | P a g e
Contents
Abstract i
List of figures viii
List of tables xi
Abbreviations xii
Dedication xiv
Acknowledgements xiv
1. Introduction 1
1.1 Energy: our most important resource and greatest challenge 2
1.2 Current energy production and energy storage techniques 4
1.3 Solar power 8
1.4 Thermal energy storage media 11
1.4.1 Sensible heat storage 11
1.4.2 Latent heat storage 12
1.4.3 Thermochemical heat storage 14
1.5 Phase change materials (PCMs) 17
1.5.1 PCM classification 17
1.5.2 Solid-solid PCMs 17
1.5.3 Solid-liquid PCMs 18
1.5.4 Form-stable PCMS 24
1.6 PCM applications 26
1.6.1 Concentrated solar power storage 26
1.6.2 Waste heat storage 32
1.6.3 Thermal regulation 34
1.6.3.1 Thermal control of space equipment and textiles 35
1.6.3.2 Passive air conditioning 36
1.6.3.3 Passive cooling systems 39
iv | P a g e
1.7 Improvements to PCMs for practical applications 42
1.7.1 Enhancing thermal conductivity 42
1.7.2 Cascaded and thermocline latent heat storage 43
1.7.3 Controlling TM 46
1.8 Encapsulation of active materials 49
1.8.1 Emulsions 50
1.8.2 Sonochemistry 53
1.8.3 Polymerisation 59
1.9 Organic and inorganic PCM encapsulation – a review 64
1.9.1 Encapsulation of organic PCMs 65
1.9.2 Encapsulation of inorganic PCMs 67
1.10 Current research 73
1.11 References 74
2. Results: Solubilising salt hydrates in W/O emulsions 86
2.1 Introduction 87
2.2 Results – microemulsions 97
2.3 Creating miniemulsions via high energy processes 105
2.4 Attempts using PMMA as capsule shell material 112
2.5 References 116
3. Poly(ethyl-2-cyanoacrylate) nanocapsules for thermal energy storage 119
3.1 Introduction 120
3.2 Analytical methods for testing energy storage capsules 124
3.3 Results 128
3.3.1 Initial results 128
3.3.2 Crystalline structure of Mg(NO3)2.6H2O and NanoPCM1 131
3.3.3 Morphology and size 132
3.3.4 Chemical composition of NanoPCM1-3 136
v | P a g e
3.3.5 Thermal analysis of NanoPCM1-3 138
3.3.6 Chemical stability of NanoPCM1-3 145
3.3.7 Encapsulation of multiple PCMs 147
3.3.8 Morphology and chemical analysis 149
3.3.9 Spatial confinement and crystalline phase effects on NO32- group wavenumber 154
3.3.10 Further chemical analysis 155
3.3.11 Thermal analysis 159
3.3.12 Thermal cycling stability of single crystallohydrate capsules 161
3.3.13 Additive mixtures of single crystallohydrate capsules 164
3.3.14 Salt hydrate mixtures and eutectics 167
3.3.15 Encapsulated salt hydrate mixtures and eutectics 171
3.3.16 Chemical stability of NanoPCMs 176
3.3.17 Capsule reproducibility 177
3.3.18 PECA nanocapsules in textile applications 181
3.4 References 183
4. Polyurethane micro- and nanocapsules 186
4.1 Introduction 187
4.2 PU microcapsules 192
4.2.1 Stability of PU microcapsules 197
4.3 PU nanocapsules 200
4.3.1 Formulation of PUNCs, morphology and chemical analysis 205
4.3.2 Thermal stability of PUNCs 209
4.3.3 Latent heat storage of PUNCs 210
4.4 References 216
5. Materials and methods 218
5.1 Materials 219
5.1.1 Oils and solvents 219
vi | P a g e
5.1.2 Surfactants 219
5.1.3 Monomers/polymers and initiators etc. 219
5.1.4 Salt hydrates 220
5.1.5 Nanocellulose 220
5.2 Methods 221
5.2.1 Chapter 2 methods 221
5.2.1.1 Microemulsion formation 221
5.2.1.2 Miniemulsion formation 221
5.2.1.3 PMMA suspension polymerisation 221
5.2.1.4 PMMA nanoprecipitation 222
5.2.1.5 PMMA miniemulsion polymerisation 222
5.2.2 Chapter 3 methods 223
5.2.2.1 PECA inverse microemulsion polymerisation 223
5.2.2.2 PECA inverse miniemulsion polymerisation 223
5.2.2.3 Formation of salt hydrate mixtures and eutectics 224
5.2.2.4 Addition of PECA nanocapsules to nanocellulose and textiles 224
5.2.3 Chapter 4 methods 225
5.2.3.1 Complex coacervation of PU microcapsules 225
5.2.3.2 Interfacial polymerisation of PU nanocapsules 225
5.2.4 Characterisation techniques 226
5.2.4.1 FTIR 226
5.2.4.2 SEM and TEM 226
5.2.4.3 TGA 227
5.2.4.4 DSC 227
5.2.4.5 XPS 227
5.2.4.6 XRD 227
5.3 References 228

vii | P a g e
6. Conclusions and future work 229
6.1 General conclusions 230
6.2 Chapter 2 conclusions 231
6.3 Chapter 3 conclusions 232
6.4 Chapter 4 conclusions 235
6.5 Future work 236
6.6 References 237
viii | P a g e
List of Figures
Fig 1.1 Chart displaying breakdown of worldwide energy sources in 2013 7
Fig 1.2 Photograph of Ivanpah concentrated solar power plant 10
Fig 1.3 Comparison between sensible heat storage and latent heat storage 12
Fig 1.4 Classification of various solid-solid and solid-liquid PCMs 19
Fig 1.5 Graph showing how carbon chain length affects paraffin wax TM 20
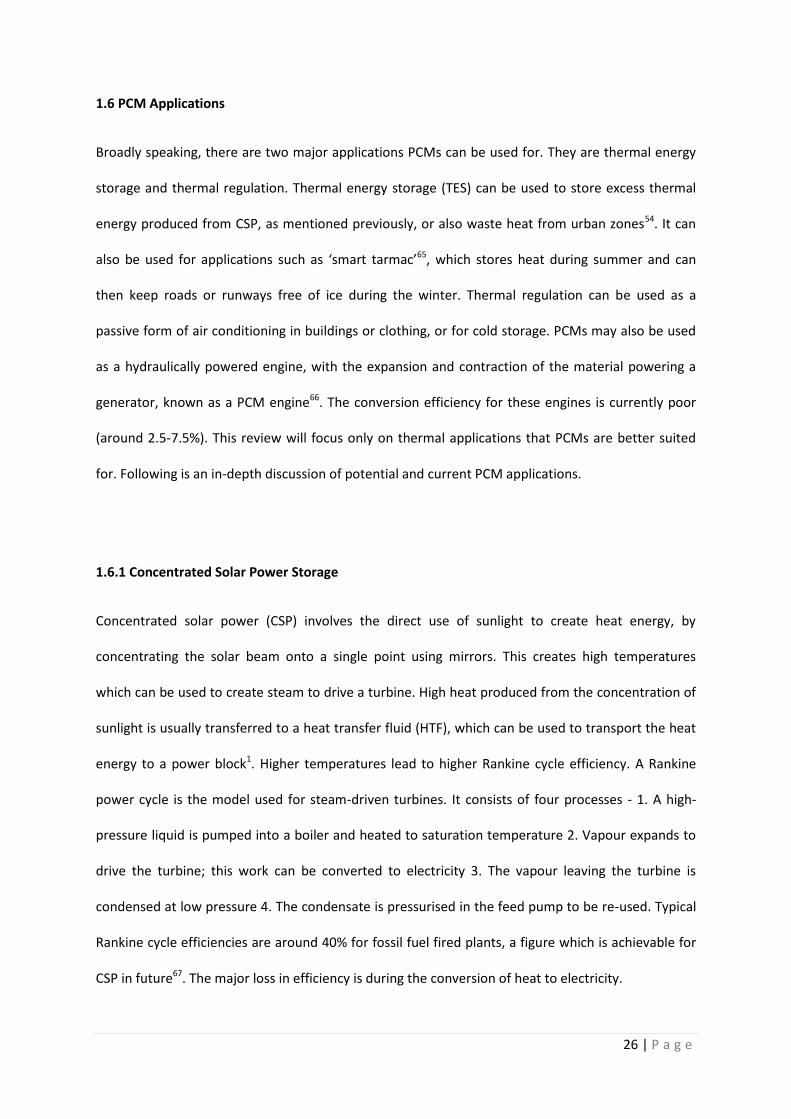
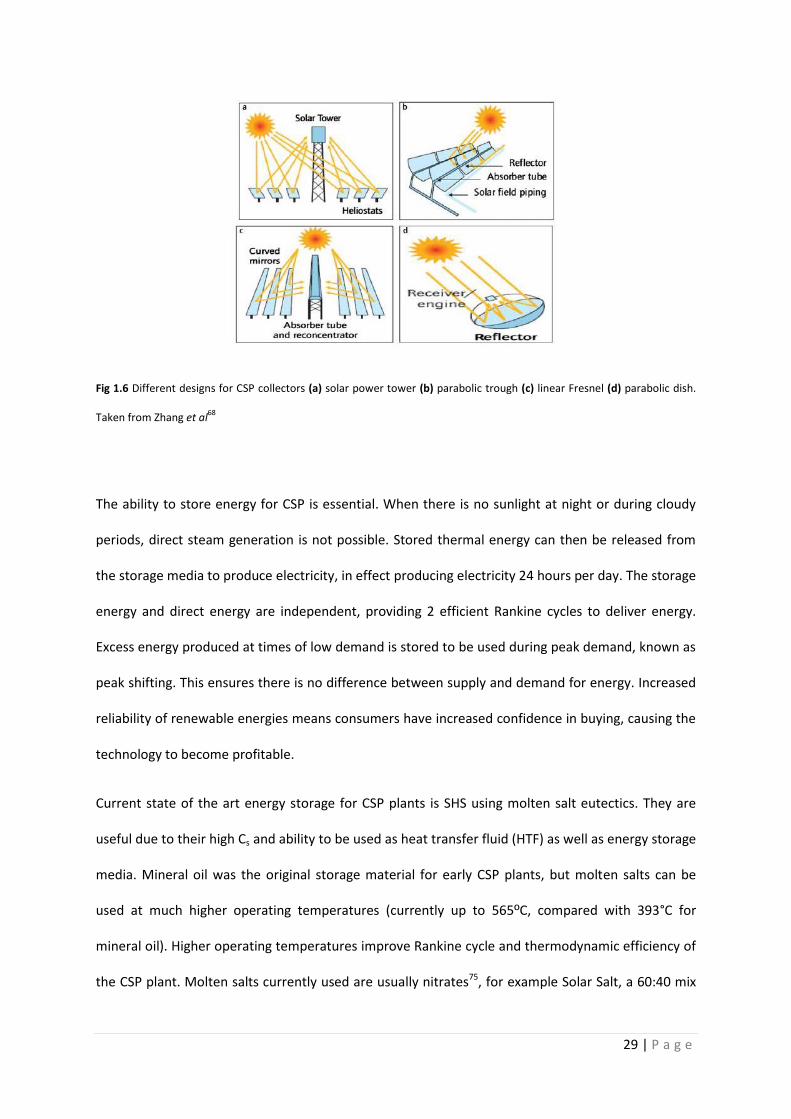
Fig 1.6 Different designs for concentrated solar power collectors 29
Fig 1.7 Representation of cascaded latent heat storage system 45
Fig 1.8 Eutectic phase diagram 48
Fig 1.9 Growth and collapse of bubbles due to acoustic cavitation 55
Fig 1.10 Photograph of working sonicator 58
Fig 1.11 Cartoon of ideal salt hydrate capsule behaviour 69
Fig 2.1 Cartoon of various types of emulsion 90
Fig 2.2 Molecular structure of various surfactants 99
Fig 2.3 SEM micrographs of AOT microemulsions 100
Fig 2.4 Photographs of miniemulsions before and after sonication 108
Fig 2.5 FTIR spectra of micro- and miniemulsions 110
Fig 2.6 FTIR spectra of Na2SO4.10H2O and suspension polymerisation product 113
Fig 2.7 SEM images of PMMA nanoprecipitation product 114
Fig 3.1 Mechanisms of PECA formation 121
Fig 3.2 Flowchart of techniques for PCM analysis 125
Fig 3.3 SEM image of PECA capsules containing 2 %wt CaCl2.6H2O core 129
Fig 3.4 Synthesis of salt hydrate-loaded PECA nanocapsules by in situ polymerisation 130
Fig 3.5 XRD patterns for Mg(NO3)2.6H2O and NanoPCM1 132
Fig 3.6 SEM images of Mg(NO3)2.6H2O and NanoPCM1-3 134
Fig 3.7 TEM images of NanoPCM1 and 2 135
Fig 3.8 FTIR spectra for Mg(NO3)2.6H2O and NanoPCM1-3 137
ix | P a g e
Fig 3.9 TGA curves for Mg(NO3)2.6H2O and NanoPCM1-3 140
Fig 3.10 DSC curves for Mg(NO3)2.6H2O and NanoPCM1-3 141
Fig 3.11 FTIR spectra of NanoPCM3 before and after 100 thermal cycles 145
Fig 3.12 Photographs of Mg(NO3)2.6H2O and NanoPCM before and after heating 147
Fig 3.13 SEM images of salt hydrates and NanoPCM4-7 150
Fig 3.14 TEM image of NanoPCM4 151
Fig 3.15 FTIR spectra of salt hydrates and NanoPCM4-7 153
Fig 3.16 Core composition effects on wavenumber of NO32- wavenumber 154
Fig 3.17 XPS spectrum for Mg(NO3)2.6H2O 156
Fig 3.18 XPS spectrum for NanoPCM4 157
Fig 3.19 XPS spectrum for NanoPCM5 158
Fig 3.20 TGA curves for pure salt hydrates and NanoPCM4-7 161
Fig 3.21 DSC thermograms of pure salt hydrates and NanoPCM4-7 163
Fig 3.22 DSC thermograms for additive mixtures of NanoPCM4 and 5 165
Fig 3.23 SEM images of Mg(NO3)2.6H2O and Na2SO4.10H2O mixtures 169
Fig 3.24 Influence of Mg(NO3)2.6H2O:Na2SO4.10H2O ratio on TM 170
Fig 3.25 Cartoon showing formation of salt hydrate-loaded capsules 172
Fig 3.26 DSC thermograms of bulk salt hydrate mixtures and NanoPCM6 and 7 174
Fig 3.27 FTIR spectra of NanoPCMs after 100 thermal cycles 177
Fig 3.28 FTIR spectra of repeated NanoPCMs 178
Fig 3.29 Comparison of TGA data between NanoPCM3 and 4 179
Fig 3.30 SEM images of nanocellulose with and without adsorbed NanoPCMs 181
Fig 3.31 SEM images of textiles with and without adsorbed nanocellulose 182
Fig 4.1 SEM images of PU microcapsules washed with toluene and water 193
Fig 4.2 SEM images of PU microcapsules washed with ethanol, and acetone and water 195
Fig 4.3 SEM images of PU microcapsules synthesised without PVA 196
Fig 4.4 FTIR spectra for Mg(NO3)2.6H2O and PU microcapsules 197
x | P a g e
Fig 4.5 SEM images of PU microcapsules after 6 months 199
Fig 4.6 Proposed mechanism of PU formation 201
Fig 4.7 SEM images of PU nanocapsules synthesised with 5 %wt surfactants 202
Fig 4.8 Photographs of macroscale appearance of PU micro- and nanocapsules 204
Fig 4.9 SEM images of PU nanocapsules synthesised with 1 %wt surfactants 206
Fig 4.10 FTIR spectra of PUNC1-5 207
Fig 4.11 TGA curves for PUNC1, 2, 4 and 5 209
Fig 4.12 DSC curves for PUNC1 212
Fig 4.13 DSC curves for PUNC3 214
Fig 6.1 Image for inside back cover of Journal of Materials Chemistry A, Vol. 4, 2016 233
xi | P a g e
List of Tables
Table 1.1 Comparison of key properties of paraffin waxes and salt hydrates 23
Table 1.2 Comparison of different types of emulsions 53
Table 2.1 Solubilisation capacity of different concentrations of AOT in toluene and 99
cyclohexane
Table 2.2 Amount of H2O solubilised by AOT blended with cosurfactants 102
Table 2.3 Observations of PCM microemulsions prepared by mechanical stirring 104
Table 2.4 Observations of PCM miniemulsions formed with sonication 106
Table 3.1 Composition of NanoPCM1-3 131
Table 3.2 Composition of NanoPCM4-7 149
Table 3.3 Summary of XPS data 159
Table 3.4 Thermal properties of NanoPCMs 176
Table 3.5 DSC comparison of NanoPCM3 and 4 180
Table 4.1 Formulation of PUNC1-5 204
Table 4.2 FTIR peaks for PUNC1-5 208
Table 4.3 DSC results for PUNC1 212
Table 4.4 DSC results for PUNC3 214
xii | P a g e
Abbreviations
%wt – Weight percentage
∆H – Latent heat
AOT – Aerosol OT (dioctyl sulfosuccinate sodium salt)
Cs – Specific heat capacity
CLHS – Cascaded latent heat storage
CSP – Concentrated solar power
DBDL – Dibutyltin dilaurate
DSC – Differential scanning calorimetry
DTA – Differential thermal analysis
EA – ethyl acrylate
ECA – ethyl-2-cyanoacrylate
EDX – Energy dispersive X-ray analysis
EE – Encapsulation efficiency
FTIR – Fourier transform infrared spectroscopy
LbL – Layer-by-layer assembly
LHS – Latent heat storage
MDI – methylene diphenyl diisocyanate
MMA – Methyl methacrylate
O/W – Oil-in-water emulsion
PACA – Poly(alky cyanoacrylates)
PAH – polyallylamine hydrochloride
PCM – Phase change material
PECA – Poly(ethyl-2-cyanoacrylate)
PEFC – Polymer electrolyte fuel cell
PEG – Polyethylene glycol
PEMA – Poly(ethyl methacrylate)
xiii | P a g e
PHU - Polyhydroxyurethane
PMMA – Poly(methyl methacrylate)
PSS – Poly(sodium styrene sulfonate)
PU – Polyurethane
PUMC – Polyurethane microcapsule
PUNC – Polyurethane nanocapsule
PV – Photovoltaic
PVP – poly(vinylpyrrolidone)
SA/V – Surface-area-to-volume ratio
SEM – Scanning electron microscopy
SHS – Sensible heat storage
TCS – Thermochemical energy storage
TEM – Transmission electron microscopy
TES – Thermal energy storage
TEOS – Tetraethyl orthosilicate
TGA – Thermogravimetric analysis
TPV – Thermovoltaic cell
TM – Melting temperature
TF – Freezing temperature
W/O – Water-in-oil emulsion
W/O/W – Water-in-oil-in-water emulsion
XPS – X-ray photoelectron spectroscopy
XRD – X-ray diffraction

xiv | P a g e
Dedication
I dedicate this thesis to Kathleen Halpin (24/09/34-15/08/2014) & John Graham (24/04/1930-
15/08/2017), my dear grandparents who died whilst I was undertaking my PhD. I am fortunate to
have great memories with each of them. I would also like to dedicate the thesis to my other
grandparents Shane Halpin (14/08/35-23/10/2003) and June Graham, who is the last one standing!
Acknowledgements
Firstly, I want to thank my supervisor Prof. Dmitry Shchukin, who has helped me greatly over the
past 4 years and allowed me to develop as a scientist. I hope I have repaid your faith with some good
results.
Many thanks go to Dr. Paula Felix de Castro, who joined the group just before me and has been an
invaluable help. I also thank the great group of people who have been in the Shchukin group during
my PhD – Marios, Dan, Zhaoliang, Lorena, Xiaolei, Maria, Hongqiang, Claudia, Vicente, Mar, Yanli,
Simona and Stewart.
The Stephenson Institute has been a great place to work and I don’t know how I would have pulled
through without the people in it. Firstly, my gratitude goes to 2 of my very best friends Mark Forster
and Tom Galloway, who I had the pleasure of living with for 3 years. Our nights in the pub,
hilariously aggressive political arguments, bizarre YouTube videos and times at Glastonbury Festival I
will never forget. To the other guys who have helped me through the last 4 years I thank you all,
we’ve had some great times and I’m sure we’ll have many more!
Where would I be without music. I must thank Stars of the Lid, I have listened to literally hundreds of
hours of their music whilst I’ve been reading and writing. Any other stuff I’ve been listening to - like
Bing & Ruth, Jon Hopkins, William Basinski, Floating Points, Boards of Canada, Dawn of Midi, Leon
Vynehall, Max Richter, thank you also for helping me concentrate. The National, my favourite band, I
feel like we are best friends. No matter whether I’ve been happy, sad, angry, whatever – whenever I
hear Matt Berninger’s voice I feel better! My heart also goes out to my other favourites Radiohead,
Yo La Tengo, Red House Painters/Sun Kil Moon, Nirvana, Sonic Youth, Pink Floyd, Velvet
Underground, Sleater-Kinney, Godspeed You Black Emperor; and to Deafheaven, Mastodon, Drive
Like Jehu, Inter Arma, Metallica & Sannhet amongst others for tearing my ears to shreds.
I thank the EPSRC and University of Liverpool for funding and for providing good facilities and
working environment. Thanks to Karl Dawson, Tobias Heil and Keith Arnold at NiCaL for help with
SEM and TEM measurements. Thanks to José Coca-Clemente for XPS data and Elena Shchukina for
DSC measurements.
To my mum Sharon & dad Mark, thank you for all you have ever done for me. There’s no way I
would be where I am today without both of you. To my only sibling Chris, Britain’s strongest man
under 25, thank you for your utterly bizarre and hilarious anecdotes, and I will forever be fascinated
with your ability to eat 12000 calories in a day.

xv | P a g e
Finally, to my wonderful girlfriend Becki, who still smiles every time she looks at me after 9 years
(don’t know how you do it!!!). I thank you for all you do for me.

1 | P a g e
1.
Introduction
2 | P a g e
1.1 Energy: Our most important resource and greatest problem
With each passing year, energy becomes more crucial in modern society. Rapid technological
expansion and a growing population lead to increased electricity demand. A one third increase in
demand is predicted by 20351. There is a correlation between higher energy usage and higher
literacy rates in countries2. As the developing world improves their technological infrastructure, their
energy demands will increase. More developed countries will also increase their energy demand as
artificial intelligence improves. Many common jobs will soon be performed by computers or involve
more computing, and innovations such as self-driving cars will become widespread. Increased
efficiency of energy production and use is crucial moving forwards.
Fossil fuels have been humanity’s greatest energy resource since the dawn of the Industrial
Revolution. In 2001, global consumption of energy was 4.25 x 10²⁰J, of which 86% was produced by
fossil fuels3. Global energy demand will rise by approximately 33% from 2011-2035, according to the
World Energy Outlook report in 20141. However, oil, coal and natural gas reserves are not infinite,
and have had an enormous impact on our environment. Atmospheric levels of carbon dioxide have
risen from around 250ppm in the early 1800s to above 400ppm in 2016, while levels of methane
have also soared. Large amounts of greenhouse gases in the atmosphere lead to the global warming
effect, along with acidification of the oceans. Due to the lack of natural removal mechanisms for
CO2, it is predicted that it will remain in the atmosphere for 400-2000 years once absorbed3.
Environmental change can already be observed by the behaviour of wild plants and animals, with
their behaviour and geographical distribution already being affected4,5. Since the Industrial
Revolution, average global temperatures have risen by approximately 0.8ºC, with the subsequent
destruction of habitats contributing to the dramatic recent increase in the rate of extinction amongst
species6. Global warming has also lead to increased melting of land based ice such as glaciers. Rising
sea levels will eventually have grave consequences for life on land, especially due to the coastal
location of many settlements which are rapidly growing in population7. Fossil fuels also lead to major

3 | P a g e
political problems. Their uneven distribution can lead to interdependencies between countries and
may even lead to conflict8.
Despite the catastrophic consequences of consuming fossil fuels, it is not currently an option to stop.
The use of smartphones, the Internet and cars are now ubiquitous in modern life. More people have
a mobile phone than proper toilet facilities, for instance. Energy consumption is vital for continuing
technological development. Therefore, it is important to develop cleaner energy sources. The best
possible energy sources are renewable energies. They are unlimited in the amount of energy they
can supply, and often produce zero greenhouse gases. They are also cheap once equipment used to
harvest the energy is built, as renewable sources are often free and require little to no sourcing of
feedstock. Unfortunately, renewable energies suffer from several deficiencies which must be
overcome for their widespread use. Renewable energies, combined with energy storage, carbon
capture and geoengineering technologies can go a long way in helping prevent further man-made
climate change9,10.
Energy policy has become an increasingly important political issue, due to its humanitarian and
environmental impacts. For example, the EU’s energy strategy states that members must reduce
greenhouse gas emissions by 40% and increase energy efficiency by 27% by 2030. Resulting from the
focus on energy, a large amount of funding has been granted to many researchers working in the
field. There are many ways in which energy can be harvested and stored, which will now be
discussed.
4 | P a g e
1.2 Current Energy Production & Energy Storage Technologies
Fossil fuels provide most of the energy that we use and are an extremely large business, worth $4.65
trillion in 2014. In 2016, Forbes listed 6 oil companies as part of the top 10 most valuable businesses
in the world. However, this economy will soon collapse due to the rapidly declining value and
availability of oil. It is predicted that supplies of oil, coal and natural gas will expire by around 2050,
2060 and 2100, respectively; although including undiscovered and unconventional (such as shale, tar
sands and methane clathrates) fossil fuels could have over a thousand years left3. However, the
greenhouse effect would become catastrophic far more quickly. Nuclear power is an alternative
power source, but there is concern about its use due to potential disaster, nuclear waste products
and the high price of decommissioning. Unfortunately, due to the high demand for immediate
power, renewable energies are not currently reliable or economically viable enough to fully replace
oil, coal and natural gas. Therefore, it is vital to develop energy storage systems to ensure clean
energy can be provided round the clock. Large amounts of research have been undertaken on
energy storage. Lithium-ion11 and lithium-air12 batteries can be used to store electricity, while carbon
nanotubes13 and metal organic frameworks14 can act as storage media for hydrogen. These
measures have great potential to reduce emissions from the transport sector. Electric cars running
on lithium batteries are now widely available. Lithium-air batteries suffer from reliability issues due
to chemical instability and sensitivity to moisture, but theoretically can provide as much power as a
traditional petrol driven engine15–17. Despite this progress, electric cars are only as green as their
power source. For example, most energy in India is provided by coal-fired power plants. An electric
vehicle in India will therefore be more polluting than a regular one, due to the increased emissions
during production. In Paraguay and Iceland, almost 100% of electricity is produced from hydropower
and geothermal energy. Therefore, an electric vehicle manufactured in Paraguay or Iceland will
produce no emissions aside from those associated with the manufacturing process. Clearly, clean
renewable energies are the key to future energy security and economy, along with prevention of
further climate change.
5 | P a g e
While there are many types of renewable energy, reliability remains their main drawback.
Hydropower is the most successful current renewable, due to its far superior reliability. It is
extremely effective and can be up to 85% efficient, and was producing 19.8% of electricity in Europe
as of the year 200018. Hydro-electric plants use the energy of falling water to drive a turbine. Some
utilise pumped hydropower where 2 reservoirs are used, with water being pumped to the reservoir
of higher elevation. Pumped hydropower actually uses more electricity than it produces but is useful
for electricity production during peak periods when demand outweighs production. Many more
hydropower dams are planned19 despite opposition to new developments, often from
environmentalists due to the destruction of habitats. The number of sites available for hydropower
are not unlimited however, so other renewable sources are also required. Due to effects from
flooding on local vegetation, hydropower reservoirs may also release methane, a greenhouse gas.
Compressed air energy storage (CAES) is another renewable energy source. Air is compressed and
stored in underground caverns. The air can then be heated during peak demand for electricity,
making it a reliable source of energy. Air expansion during heating drives a turbine. Only 2 CAES
plants have ever been constructed; the first in Germany in 1977, the second in Alabama, USA in
1991. Despite its reliability, Lund et al determined it was unlikely CAES is economically viable on a
wide scale20. However, more CAES plants are currently under construction.
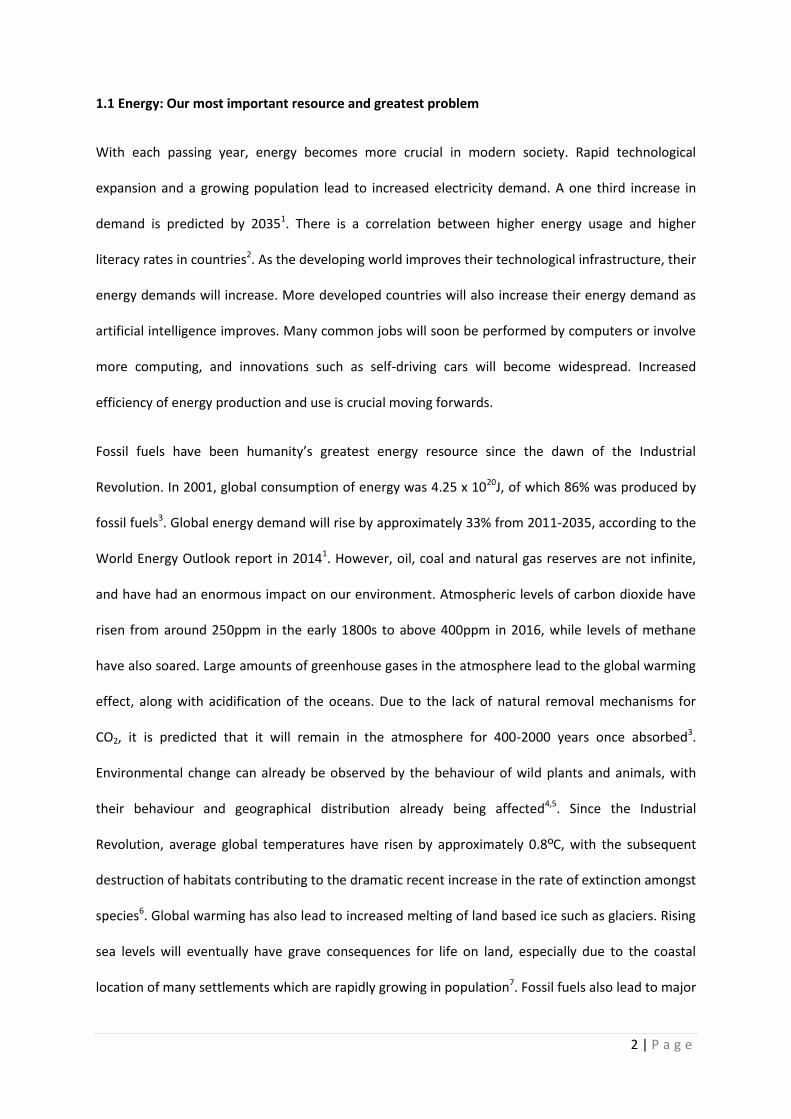
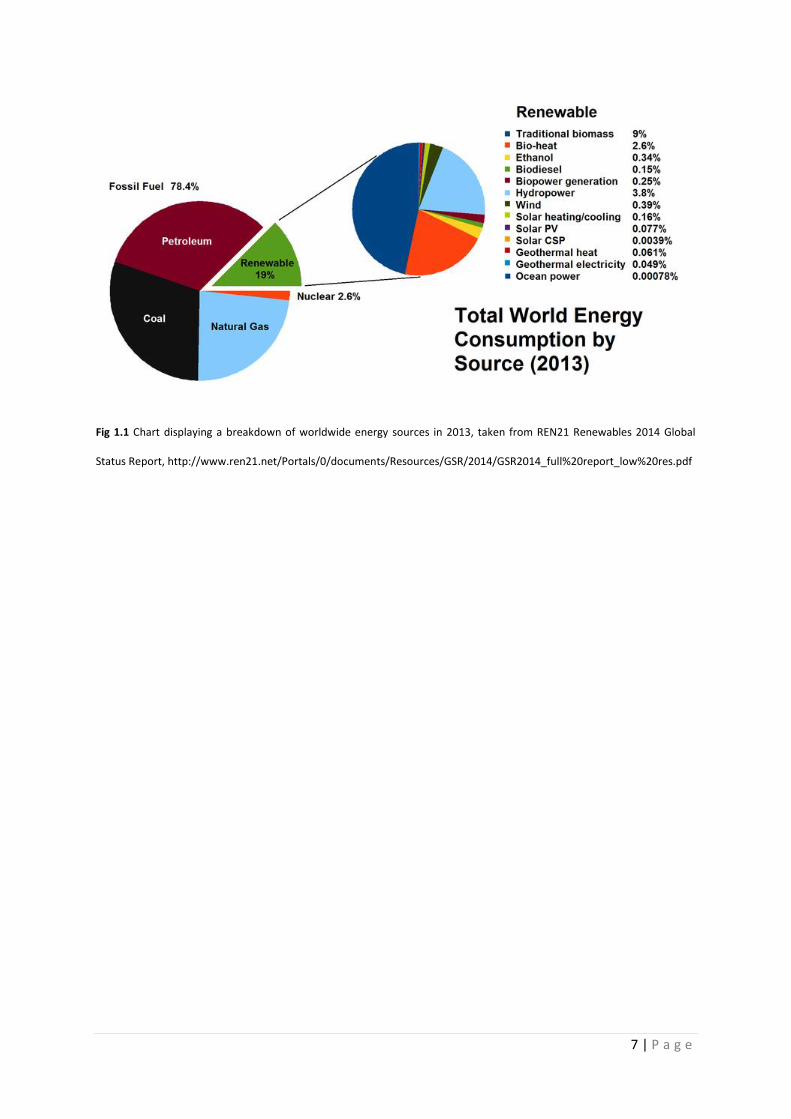
As can be seen from Fig 1.1, renewable energy provides a reasonable chunk of the world’s energy
(19.8% in 2013). However, around half of this is from burning biomass. Although renewable, burning
biomass sources such as wood creates carbon emissions. Despite their minimal current production,
solar and wind are the most promising renewable energies moving forward. The percentage of
electricity produced by these means is rapidly increasing. Wind power is intermittent and requires
many large turbines. The turbines are mounted on a tower to take advantage of faster and less
turbulent wind. The turbines rotate due to air flow around the blades. The rotation spins a shaft
which in turn drives a generator to produce electricity. Turbines are considered an eyesore by the

6 | P a g e
general public and generate noise pollution, so are usually limited to off shore wind farms. This
negative perception is the major issue for wind power, although countries such as Denmark have
found great success with its use. Energy storage to combat intermittency is also an issue for wind
power. Excess wind energy must be stored in batteries or flywheels, the technology for which is
currently very expensive. Solar power is more widely accepted as a major energy source. Huge
amounts of research have been undertaken into improving the efficiency of solar power. Although
many issues remain, technologies are under development which will greatly increase the potential of
solar energy.
7 | P a g e
Fig 1.1 Chart displaying a breakdown of worldwide energy sources in 2013, taken from REN21 Renewables 2014 Global
Status Report, http://www.ren21.net/Portals/0/documents/Resources/GSR/2014/GSR2014_full%20report_low%20res.pdf
8 | P a g e
1.3 Solar Power
Solar power is considered the most promising renewable energy due to its abundance, zero cost and
lack of emissions21. The sun provides an unlimited source of energy which dwarfs that available from
all other energy sources combined - in 2006 the US Department of Energy calculated that the
worldwide consumption of energy in 2001 could be met with less than 1 and a half hours of
sunlight22. Space missions have relied on solar energy for many years23. There are numerous ways to
utilise solar power. Photovoltaics (PV) convert light into energy using semiconductors which display
the photovoltaic effect. As the semiconductor absorbs photons, electron-hole pairs are created. An
electrical potential difference can then be set up at the interface between two materials24. Doped
silicon is traditionally used as semiconductor. The next generation of PV solar cells are being
developed using halide perovskites25–27 or polymers28,29, with the new materials displaying excellent
light harvesting abilities and potential improved efficiency. PV cells are often used to power smaller-
scale applications such as single houses, although PV power stations have been built, consisting of
many PV panels. Excess energy produced by PV can be stored by batteries in the form of electricity.
Concentrated solar power (CSP) allows large amounts of energy to be produced using the sun’s rays,
by concentrating the solar beam to create large amounts of thermal energy. It is the most promising
way of utilising solar energy, due to its future cost effectiveness once the technology has been
sufficiently improved. There are several different designs for CSP, which will be discussed below. All
types operate by focusing sunlight which heats up water, creating steam. The heat can also be
collected by an energy storage material for later use, an advantage over PV - which is difficult to
incorporate energy storage into1. The steam created is used to drive a turbine to produce electrical
energy, akin to a coal or natural gas-fired power station. CSP will be discussed in further detail later
(page 26).
The major drawback of solar power is its intermittency - when the sun isn’t shining, no electricity can
be produced. This is where thermal energy storage is of great importance. Instead of producing
9 | P a g e
steam, excess thermal energy can be stored using an energy storage media, which acts as an energy
sink. The energy can then be released during peak hours to meet demand, known as peak shifting.
Despite the minimal publicity energy storage systems receive in comparison to other renewable
technology, they are crucial in solving the intermittency problem. There is a distinct lack of
successful storage options currently. On 8th June 2017, BBC reported that despite over 50% of energy
in the UK being provided by renewables for the first time on the previous day, only 1% of it was
produced from stored energy. Although there is a continued reliability issue with renewables,
progress is rapidly being made. In late 2016, Portugal provided its entire energy supply for 4 days in
a row using only renewables. Solar power is fast becoming the cheapest available energy source, a
great improvement from the early days of photovoltaics when they were extremely expensive
(around $77 per Watt in 1977 compared to $0.30 per Watt now). PV technology has been favoured
over CSP despite the lower amount of energy production. This is due to the large amount of land and
near perfect conditions (no cloud or haze) required for CSP to operate. CSP is therefore only suitable
for wide scale energy production, while PV is more effective on a smaller scale.
CSP does have an advantage over other power plants in that destruction of habitats during
construction can be minimal, although extreme heat produced from the parabolic mirrors can kill
birds and other wildlife passing by during energy harvesting. CSP plants need large areas with no
obstruction of sunlight for maximum exposure. Deserts are an excellent choice, providing large areas
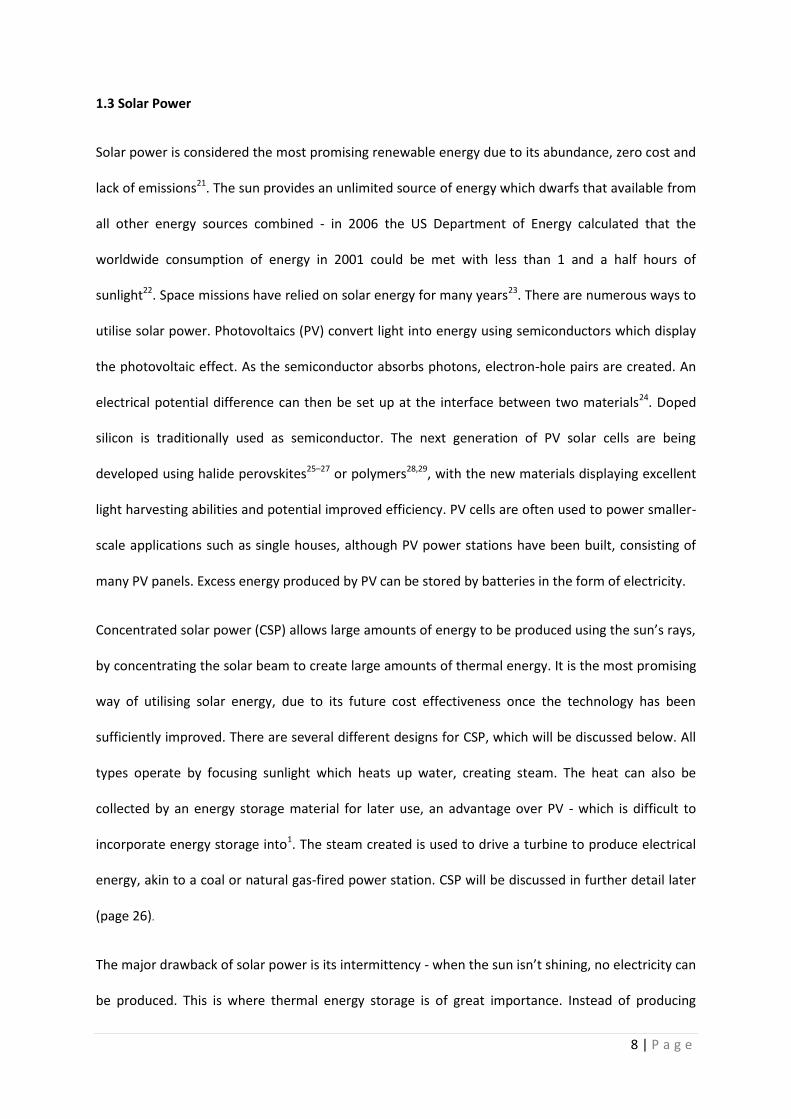
which contain minimal wildlife or human settlements. Indeed, the largest CSP plant currently built is
the Ivanpah facility in the Mojave Desert, California (shown in Fig 1.2). Morocco has pledged to
produce 42% of its electricity through renewables by 2020, and built the Ouarzazate CSP facility in
2015. Phase 2 and 3 of the project will open in 2017 and 2018, giving the facility a total energy
production of 580MW.
10 | P a g e
Fig 1.2 The Ivanpah CSP plant in California, producing 390MW of energy
Renewable energies suffer not only from issues of reliability and energy production, but also from
scepticism over climate change from some of the general public and high-ranking politicians (often
with conflicts of interest!), despite a near unanimous consensus from climate scientists. Noam
Chomsky described the Republican party of the USA as “the most dangerous organisation in human
history” due to their refusal to tackle climate change. It is crucial that funding in renewable energies
is continually increased and made a top priority, to reduce further climate change and increase
future energy security.
Although the most important factor in the improvement of renewable energies is their efficiency,
energy storage is a solution that can be developed more quickly. Due to the high temperatures
involved, thermal energy storage is ideal for use in conjunction with CSP. Firstly, a suitable heat
storage material must be selected. Factors involved in the selection of heat storage materials include
cost, storage density and reliability. The various forms of thermal energy storage will now be
discussed.

11 | P a g e
1.4 Thermal Energy Storage Media
1.4.1 Sensible Heat Storage (SHS)
Sensible heat refers to heat that can be detected (‘sensed’) by a temperature change. As materials
heat up they store energy in a linear relationship with temperature (as seen in Fig 1.3). All materials
can store heat sensibly, although some are more effective than others. The heat stored is dependent
on the specific heat capacity (Cs) of the material in question. Water has a high Cs, and is widely used
for SHS due to its low toxicity and availability. Rock or concrete are often used as solid SHS media,
these store heat more uniformly than water but have lower heat capacity30. As temperature
increases, thermal conductivity of rock decreases. At higher temperatures, rocks containing quartz
will expand rapidly, affecting thermal cycling stability31.
SHS is the simplest and most developed form of heat storage, and is the only heat storage method to
be industrialised. However, it suffers from several issues, such as low energy density and loss of
thermal energy at any temperature32. Large containers are required to house enough material to
store heat effectively. This increases costs and maintenance requirements. The mediocre heat
storage capacity of SHS has led to research into other storage materials to improve economic
feasibility. SHS is still useful due to its simplicity, and can be used in conjunction with other energy
storage methods such as latent heat storage to improve heat transfer33.
12 | P a g e
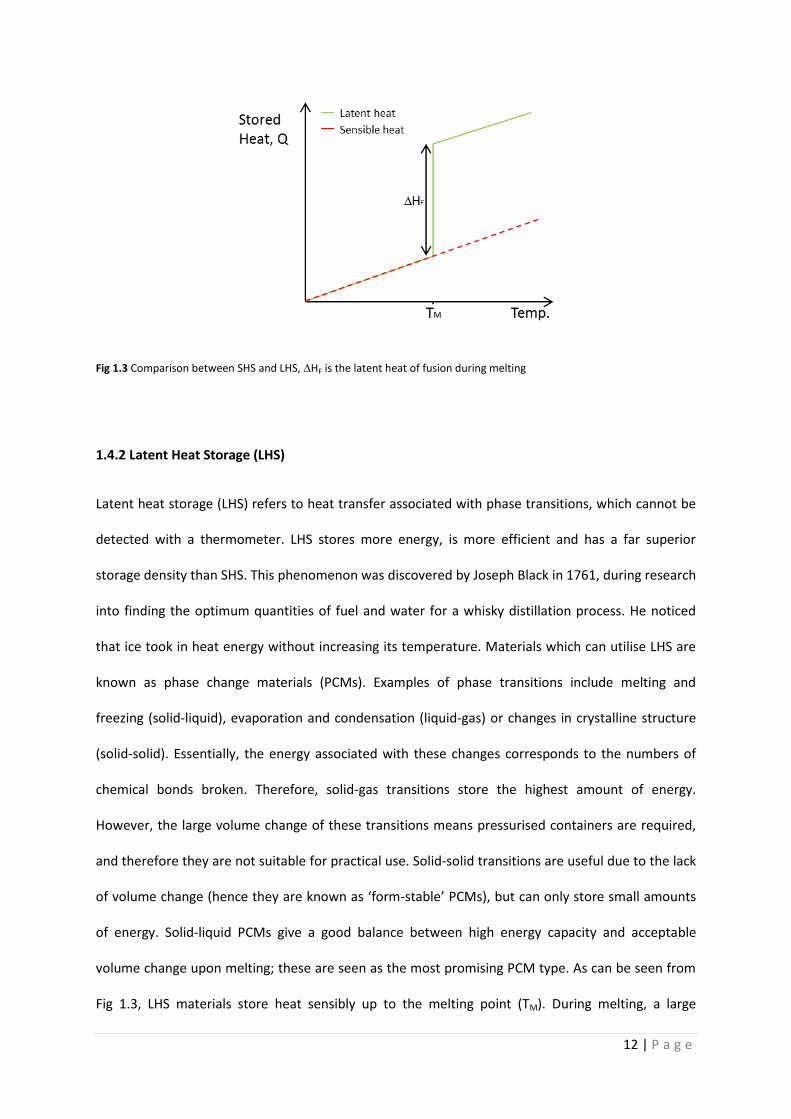
Fig 1.3 Comparison between SHS and LHS, ∆HF is the latent heat of fusion during melting
1.4.2 Latent Heat Storage (LHS)
Latent heat storage (LHS) refers to heat transfer associated with phase transitions, which cannot be
detected with a thermometer. LHS stores more energy, is more efficient and has a far superior
storage density than SHS. This phenomenon was discovered by Joseph Black in 1761, during research
into finding the optimum quantities of fuel and water for a whisky distillation process. He noticed
that ice took in heat energy without increasing its temperature. Materials which can utilise LHS are
known as phase change materials (PCMs). Examples of phase transitions include melting and
freezing (solid-liquid), evaporation and condensation (liquid-gas) or changes in crystalline structure
(solid-solid). Essentially, the energy associated with these changes corresponds to the numbers of
chemical bonds broken. Therefore, solid-gas transitions store the highest amount of energy.
However, the large volume change of these transitions means pressurised containers are required,
and therefore they are not suitable for practical use. Solid-solid transitions are useful due to the lack
of volume change (hence they are known as ‘form-stable’ PCMs), but can only store small amounts
of energy. Solid-liquid PCMs give a good balance between high energy capacity and acceptable
volume change upon melting; these are seen as the most promising PCM type. As can be seen from
Fig 1.3, LHS materials store heat sensibly up to the melting point (TM). During melting, a large

13 | P a g e
amount of heat is stored almost isothermally. Once the material freezes, this heat energy is released
again. PCMs are far more efficient than SHS materials, especially over the small temperature range
associated with their phase transition. It is also advantageous for PCMs to have good specific heat
capacity to provide additional SHS whilst the material is not undergoing a phase change.
In 1983, Abhat34 outlined the ideal properties for a PCM:
Thermodynamic
TM in desired application range
High latent heat of fusion
High density
High specific heat for additional SHS
High thermal conductivity
Congruent melting
Small volume changes during phase transition
Kinetic
No supercooling
Chemical
Chemically stable over long periods
Non-corrosive to container materials
Non-flammable, non-toxic and non-explosive
Economic
Low cost
Available in large quantities
14 | P a g e
However, there are no PCMs to date which fit all these criteria. Practical applications and
classification of PCMs will be further discussed in more detail below (see page 17)
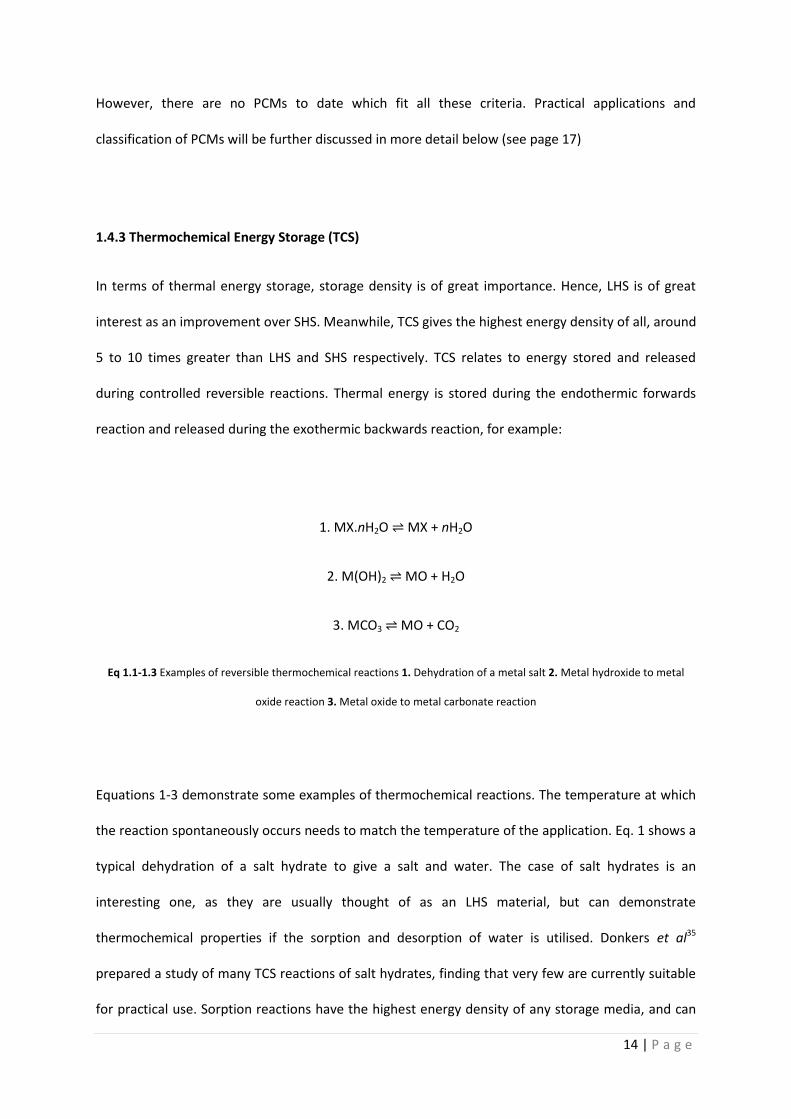
1.4.3 Thermochemical Energy Storage (TCS)
In terms of thermal energy storage, storage density is of great importance. Hence, LHS is of great
interest as an improvement over SHS. Meanwhile, TCS gives the highest energy density of all, around
5 to 10 times greater than LHS and SHS respectively. TCS relates to energy stored and released
during controlled reversible reactions. Thermal energy is stored during the endothermic forwards
reaction and released during the exothermic backwards reaction, for example:
1. MX.nH2O ⇌ MX + nH2O
2. M(OH)2 ⇌ MO + H2O
3. MCO3 ⇌ MO + CO2
Eq 1.1-1.3 Examples of reversible thermochemical reactions 1. Dehydration of a metal salt 2. Metal hydroxide to metal
oxide reaction 3. Metal oxide to metal carbonate reaction
Equations 1-3 demonstrate some examples of thermochemical reactions. The temperature at which
the reaction spontaneously occurs needs to match the temperature of the application. Eq. 1 shows a
typical dehydration of a salt hydrate to give a salt and water. The case of salt hydrates is an
interesting one, as they are usually thought of as an LHS material, but can demonstrate
thermochemical properties if the sorption and desorption of water is utilised. Donkers et al35
prepared a study of many TCS reactions of salt hydrates, finding that very few are currently suitable
for practical use. Sorption reactions have the highest energy density of any storage media, and can
15 | P a g e
refer to adsorption or absorption. It is defined as the capture of a gas or vapour by a substance in
the solid or liquid state36. Sorption can be a physical or chemical process, with chemisorption giving
higher energy densities but may be irreversible. Adsorbent materials for use in these reactions are
usually porous materials such as zeolites or silica gels36. Eq. 2 is the hydration/dehydration of a metal
hydroxide. Magnesium oxide has been proposed as a useful example for storage between 90-110°C
with good durability37. In 1977, Ervin38 showed magnesium oxide had a conversion decrease from
95% to 60% over the first 40 thermal cycles before it stabilised. Eq. 3 shows the decarboxylation of a
metal carbonate. Calcium carbonate is the most studied material for this reaction, which has shown
reasonable cycling stability and can be improved with additives39.
TCS has been outlined as especially important for long term energy storage over many months, with
a theoretically unlimited storage period due to zero thermal losses. SHS and LHS are not as ideal for
long-term storage as they progressively lose energy40. For use in practical applications, suitable TCS
reactions must first be identified. Factors such as the rate of reaction, reversibility and the effects of
temperature and pressure must be considered. Unlike with LHS where gas phase reactions are
undesirable, TCS can take advantage of the extra energy density of solid-gas reactions. Posern and
Kaps41 utilised a mixture of MgCl2 and MgSO4 salts impregnated into attapulgite, based on their
hydration/dehydration reactions. The two salts were selected due to their differences in
deliquescent relative humidities (DRH) – MgSO4 is more hydrothermally stable, so has a higher DRH
than MgCl2 (90% compared to 33% at 30ºC). They found increasing the ratio of MgCl2 had a positive
effect. Although MgCl2 has a lower ∆Hf, the increase in the rate of water vapour condensation due to
the lower DRH increases heat of sorption overall. This interesting effect should be considered when
using salts as TCS materials. A drawback of their approach was that the increase in water vapour led
to leakage out of the porous attapulgite. They hypothesised new porous host materials with
differing pore sizes could be utilised in future to prevent leakage. Another drawback was that low
desorption temperatures must be used, as higher temperatures led to increased corrosion. Neises et
al42 tested a solar heated rotary kiln utilising the redox reaction of cobalt oxide. They found the

16 | P a g e
reaction had good thermal storage abilities at temperatures between 800-900°C, the reaction being
followed by a measure of the oxygen concentration at different temperatures. A complex reactor
design would be necessary for larger scale use, however.
Despite the progress made with TCS and its potential for high temperature applications, like LHS it
has issues with long-term stability but to a larger degree. Reactions must have constant conversion
efficiency without degradation of energy storage capacity over long periods of time43. This is
especially difficult when dealing with gas and liquid phase reactions. A potential solution to leakage
could be to encapsulate the reactants in a shell material. It has been shown that organic reactions
can be improved by encapsulating the reactants for example44. TCS also currently requires high cost
materials for long-term storage40, improved heat transfer43 and complex reactor design40, meaning
SHS and LHS are preferable for now. Essentially, the major problem for TCS is the lack of research
and understanding. Currently, SHS has been developed to an industrial level, LHS to pilot plant scale,
while TCS has only been tested on a laboratory scale39. TCS may be valuable in future, but LHS should
be the focus for immediate research as a solution to energy storage issues.
17 | P a g e
1.5 Phase Change Materials (PCMs)
1.5.1 PCM Classification
There are many kinds of PCM, as seen in Fig 1.4. PCMs can be classified according to the specific
phase transitions they undergo. The possible transitions that yield LHS are solid-solid, solid-liquid,
solid-gas and liquid-gas. While sublimation and evaporation give the highest latent heat of fusion,
they are not practical due to the large volume change and need for specialised containment to
prevent material losses. Solid-liquid PCMs are viewed as the most practical, as they give a good
balance between high latent heat of fusion and manageable volume change.
1.5.2 Solid-Solid
Solid-solid PCMs have pseudo-phase transitions arising from a rearrangement of the crystal
structure. The main advantage of these materials is that they have almost zero volume change
during phase transition, meaning they require no encapsulation. A downside to this is that the latent
heat of fusion is relatively low. Solid-solid PCMs can only be cost effective if the low cost of not
having to contain the material can be balanced by a relatively high latent heat and energy storage
density.
Polyurethane polymers are commonly synthesised as solid-solid PCMs. Du and collaborators45
synthesised a hyperbranched polyurethane as a PCM. Hyperbranched structures increases phase
change enthalpy compared with linear polymers due to the increased number of possible
arrangements of the compound. Even so, they found the latent heat was lower than that of PEG
6000, a solid-liquid PCM. The lower latent heat and high cost of synthesis mean it is unlikely solid-
solid PCMs will ever be seriously considered for large scale use.
18 | P a g e
1.5.3 Solid-Liquid
From now on, all PCMs described in the thesis will be solid-liquid. As described earlier, solid-liquid
are most useful for practical applications. Due to the volume changes upon melting, suitable
containment is necessary. Solid-liquid PCMs can be classified according to whether they are organic
or inorganic materials (Fig 1.4). Organic PCMs include paraffin wax, fatty acids and polyethylene
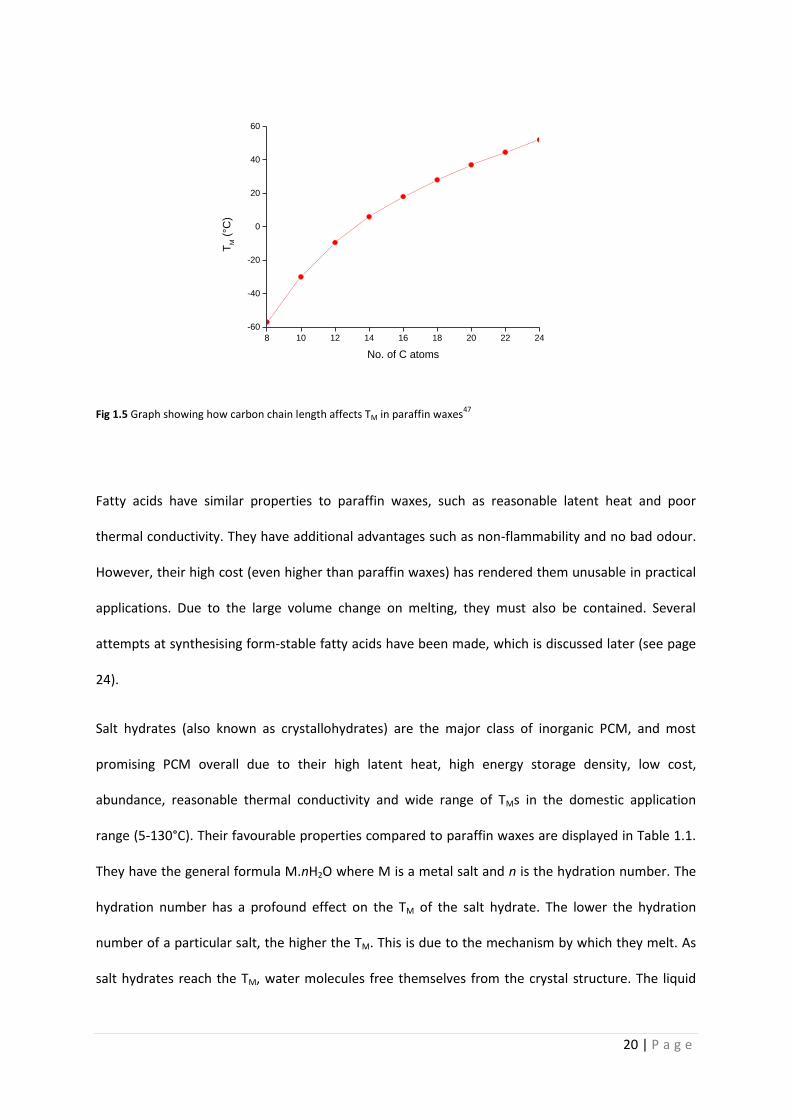
glycol (PEG), whilst inorganic PCMs can be salt hydrates, salts or metallic.
Paraffin waxes are the major organic PCM. They are linear alkanes containing between 8-40 carbon
atoms. Longer carbon chains give higher TMs, in a relatively linear fashion (Fig 1.5). Paraffins often
display additional LHS in the form of solid-solid transitions associated with different crystalline
phases. They have several advantages, including good thermal and chemical stability, good latent
heat of fusion (∆HF), congruent melting and no supercooling. Disadvantages include low thermal
conductivity, bad odour, flammability and high cost. It has been shown that the cost of paraffin wax
is so great, that a storage tank for a CSP plant would cost more to maintain than the value of the
energy stored. Paraffin waxes are also non-renewable, as they are refined from petroleum. With
regard to their low thermal conductivity, Javani et al46 simulated a PCM heat exchanger with
octadecane to control the battery pack temperature of an electric car. They found that improving
the thermal conductivity to a practical level using finned tubes to increase heat transfer area was
impossible, as the tubes would be too long to fit in the car. Conductive particles would be required
instead.

19 | P a g e
Fig 1.4 Classification of various solid-solid and solid-liquid PCMs
20 | P a g e
8 10 12 14 16 18 20 22 24
-60
-40
-20
0
20
40
60
TM (
°C)
No. of C atoms
Fig 1.5 Graph showing how carbon chain length affects TM in paraffin waxes47
Fatty acids have similar properties to paraffin waxes, such as reasonable latent heat and poor
thermal conductivity. They have additional advantages such as non-flammability and no bad odour.
However, their high cost (even higher than paraffin waxes) has rendered them unusable in practical
applications. Due to the large volume change on melting, they must also be contained. Several
attempts at synthesising form-stable fatty acids have been made, which is discussed later (see page
24).
Salt hydrates (also known as crystallohydrates) are the major class of inorganic PCM, and most
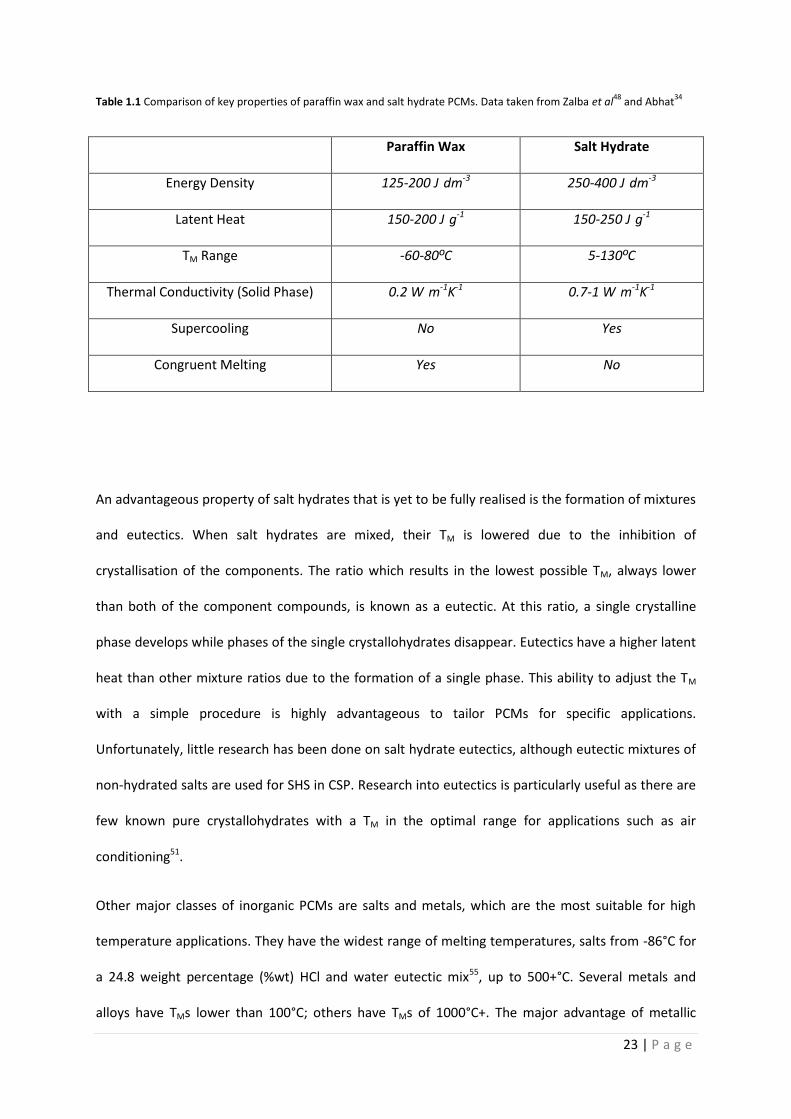
promising PCM overall due to their high latent heat, high energy storage density, low cost,
abundance, reasonable thermal conductivity and wide range of TMs in the domestic application
range (5-130°C). Their favourable properties compared to paraffin waxes are displayed in Table 1.1.
They have the general formula M.nH2O where M is a metal salt and n is the hydration number. The
hydration number has a profound effect on the TM of the salt hydrate. The lower the hydration
number of a particular salt, the higher the TM. This is due to the mechanism by which they melt. As
salt hydrates reach the TM, water molecules free themselves from the crystal structure. The liquid
21 | P a g e
water then dissolves the salt. Therefore, the less water molecules available to dissolve the salt, the
higher the TM. For example, magnesium nitrate hexahydrate has a TM of 89ºC, whereas its dihydrate
form has a TM of 129ºC. Especially, salt hydrates’ high energy density is attractive as less material is
required. Smaller containers are therefore needed, reducing costs further. Salt hydrates have
densities in the region of 1500-2000 kg·m-3, whereas paraffin waxes have densities of around 900
kg·m-3. Combined with their higher latent heats of around 200-250 J·g-1 compared with 150-200 J·g-1
for paraffins48, their energy storage ability is far greater. Some paraffin waxes have latent heat
values equal to that of some salt hydrates. However, when the latent heat per unit volume is
quoted, salt hydrates will demonstrate greater energy storage ability. Salt hydrates have energy
densities of around 250-400 J·dm-3 compared with around 125-200 J·dm-3 for paraffin waxes34,49,50.
Data for energy density in J·dm-3 is sparse in the literature, but is very useful when considering
container sizes. It is also a good illustration of why more research into salt hydrate PCMs is
beneficial. Salt hydrates have a greater range of TMs (5-130ºC) for use in domestic applications
compared with paraffin waxes (5-80ºC). They can be as cheap as <100$/ton in the case of sodium
sulphate decahydrate51. The research presented in this thesis is based around salt hydrate PCMs.
When interest in PCMs first arose after the oil crisis of the 1970s, most investigations were centred
on salt hydrates. However, their use leads to numerous problems that could not be solved at the
time, and paraffin waxes became the most frequently investigated PCM. Disadvantages of salt
hydrates include incongruent melting, phase separation, supercooling and corrosiveness towards
container materials, especially metals. Incongruent melting is incomplete melting of the salt hydrate,
leading to the irreversible formation of a salt of lower hydration number. This salt then precipitates
at the bottom of the melt, known as phase separation34. These effects reduce ∆H at the desired TM,
and will eventually lead to zero latent heat, and also rendering salt hydrates chemically unstable,
often after very few melting/freezing cycles. Supercooling is also a major problem. It is a
phenomenon where a material must be cooled far below its TF in order to freeze, caused by poor
heat transfer and lack of nucleation34. This can be as much as 40ºC. Salt hydrates also display

22 | P a g e
corrosiveness towards container materials, and several studies have been undertaken to understand
which materials can be used to contain them52,53. In hermetically sealed vessels it is possible to
stabilise salt hydrates with minimal losses of latent heat for many cycles54. However, other factors
such as corrosion, supercooling and volume changes must be considered. Some commercial salt
hydrates have been produced which are stable over very many cycles (>10000), made possible using
additives. These are roughly 10x more costly than pure salt hydrates51 though, and encapsulation is
still necessary. More cost-effective methods need to be found.
23 | P a g e
Table 1.1 Comparison of key properties of paraffin wax and salt hydrate PCMs. Data taken from Zalba et al48
and Abhat34
Paraffin Wax Salt Hydrate
Energy Density 125-200 J·dm-3 250-400 J·dm-3
Latent Heat 150-200 J·g-1 150-250 J·g-1
TM Range -60-80ºC 5-130ºC
Thermal Conductivity (Solid Phase) 0.2 W·m-1K-1 0.7-1 W·m-1K-1
Supercooling No Yes
Congruent Melting Yes No
An advantageous property of salt hydrates that is yet to be fully realised is the formation of mixtures
and eutectics. When salt hydrates are mixed, their TM is lowered due to the inhibition of
crystallisation of the components. The ratio which results in the lowest possible TM, always lower
than both of the component compounds, is known as a eutectic. At this ratio, a single crystalline
phase develops while phases of the single crystallohydrates disappear. Eutectics have a higher latent
heat than other mixture ratios due to the formation of a single phase. This ability to adjust the TM
with a simple procedure is highly advantageous to tailor PCMs for specific applications.
Unfortunately, little research has been done on salt hydrate eutectics, although eutectic mixtures of
non-hydrated salts are used for SHS in CSP. Research into eutectics is particularly useful as there are
few known pure crystallohydrates with a TM in the optimal range for applications such as air
conditioning51.
Other major classes of inorganic PCMs are salts and metals, which are the most suitable for high
temperature applications. They have the widest range of melting temperatures, salts from -86°C for
a 24.8 weight percentage (%wt) HCl and water eutectic mix55, up to 500+°C. Several metals and
alloys have TMs lower than 100°C; others have TMs of 1000°C+. The major advantage of metallic
24 | P a g e
PCMs is their high thermal conductivity56, but they have low storage density. The high mass of
metals must also be considered for any practical applications such as their use in building materials,
and also makes them unsuitable for transportation of heat energy57. Low temperature metallic PCMs
such as Gallium (TM = 29.8°C) have been used to cool computer chips58 and USB memory drives59. It
is anticipated in future that encapsulation techniques for high temperature PCMs will be developed,
which will make them available for applications such as storage for CSP or reusing waste heat57.
Another class of PCM which may be of use are clathrate hydrates. Clathrate hydrates are compounds
in which guest molecules are entrapped by a network of hydrogen bonded water. A similar
compound to a clathrate is the ‘organic hydrate’ pinacol, which can be found in monohydrate and
hexahydrate forms. It has rarely been investigated as a PCM, although Rathgeber et al60 showed that
it combined advantages of inorganic and organic PCMs, with high volumetric latent capacity and lack
of corrosion. However, they did not demonstrate prolonged cycling stability and pinacol is
expensive.
1.5.4 Form-Stable PCMs
Form-stable PCMs are solid-liquid PCMs which have been combined with a structural support,
usually a polymer such as polyurethane (PU) or polymethyl methacrylate (PMMA), so that they keep
their shape even after melting. Organic or polymeric PCMs can be made form-stable. Essentially, the
PCM is embedded into a polymer matrix, thereby preventing leakage and preserving latent heat
capacity. This provides several other advantages, such as removing the need for further
containment, reducing thermal resistance caused by any shell material that would otherwise be
required and preventing reaction with any external materials61. It is possible to load the PCMs into
the polymer up to around 80 %wt, meaning the latent heat remains high62. Several researchers have
formulated fatty acid-based form-stable PCMs. Sari and collaborators have made numerous fatty

25 | P a g e
acid blends for use as form-stable PCMs61,63,64. They confirmed the PCMs had reasonable latent heat
and were suitable for use without further encapsulation. Despite some positives of form-stable
PCMs, leakage remains a problem at high loading, and the need for a large amount of structural
support means form-stable PCMs are not cost-effective.
26 | P a g e
1.6 PCM Applications
Broadly speaking, there are two major applications PCMs can be used for. They are thermal energy
storage and thermal regulation. Thermal energy storage (TES) can be used to store excess thermal
energy produced from CSP, as mentioned previously, or also waste heat from urban zones54. It can
also be used for applications such as ‘smart tarmac’65, which stores heat during summer and can
then keep roads or runways free of ice during the winter. Thermal regulation can be used as a
passive form of air conditioning in buildings or clothing, or for cold storage. PCMs may also be used
as a hydraulically powered engine, with the expansion and contraction of the material powering a
generator, known as a PCM engine66. The conversion efficiency for these engines is currently poor
(around 2.5-7.5%). This review will focus only on thermal applications that PCMs are better suited
for. Following is an in-depth discussion of potential and current PCM applications.
1.6.1 Concentrated Solar Power Storage
Concentrated solar power (CSP) involves the direct use of sunlight to create heat energy, by
concentrating the solar beam onto a single point using mirrors. This creates high temperatures
which can be used to create steam to drive a turbine. High heat produced from the concentration of
sunlight is usually transferred to a heat transfer fluid (HTF), which can be used to transport the heat
energy to a power block1. Higher temperatures lead to higher Rankine cycle efficiency. A Rankine
power cycle is the model used for steam-driven turbines. It consists of four processes - 1. A high-
pressure liquid is pumped into a boiler and heated to saturation temperature 2. Vapour expands to
drive the turbine; this work can be converted to electricity 3. The vapour leaving the turbine is
condensed at low pressure 4. The condensate is pressurised in the feed pump to be re-used. Typical
Rankine cycle efficiencies are around 40% for fossil fuel fired plants, a figure which is achievable for
CSP in future67. The major loss in efficiency is during the conversion of heat to electricity.
27 | P a g e
USA and Spain are the leading countries in the development of CSP, although many other countries
are building or have expressed interest in using CSP. Indeed, any country except those above latitude
45°N or below 45°S are well-placed to utilise solar energy. The countries between these two
latitudes have average irradiation of at least 1.6MWh/m2. Numerous ‘hot spots’ exist, including the
Sahara, Kalihari, Atacama and Mojave deserts; the Middle East and north west Australia68. To
illustrate its potential, if only 1% of the land area with the required solar radiation were used for
CSP, the energy production would still be higher than the total world energy supply for the year
200069. CSP has relied on government subsidies in order to be cost effective70, so improving
efficiency and output is a must. There are various types of CSP plant designs. These are linear
Fresnel, parabolic dish, parabolic trough and power tower68, visualised in Fig 1.6. All kinds of CSP
depend on their solar collectors, as they are the means to focus the solar beam. Each design has its
own set of advantages and disadvantages, which will now be discussed.
The power tower CSP design has been highlighted as the most promising. A recent example is the
Gemasolar plant in Seville, Spain. It has an operating capacity of 74% the total theoretical energy
yield. This compares with 41% for previously developed parabolic trough plants67. A large number of
heliostats focus the sunlight onto a central tower. Heliostats are mirrors which follow the sun by
means of electronic operation, in order to focus the solar beam onto a single point – the power
tower. Heliostats have the added advantage of using flat glass, which is cheaper than the curved
glass used in parabolic mirrors. This heat is transferred to the HTF, which can either create steam
directly, transfer it to an energy storage material or store the energy itself. Power towers have
several advantages, such as the creation of high temperatures – producing higher efficiency and
reduced storage costs; and a flexible setup allowing the choice between various HTFs, heliostats and
receivers. Due to the improved tracking of the sun by heliostats, they are more effective at
producing energy in winter than other CSP plants67. Over a third of planned CSP plants are of the
power tower design.
28 | P a g e
Parabolic trough systems form a large majority of operational CSP plants71, such as the Solana
Generating Station in Arizona and the Solnova Solar Power Station near Seville, Spain. The collectors
are parabolic reflectors which reflect onto an absorber tube attached along the parabola. The
absorber consists of a metal tube and glass covering, separated by air or vacuum to reduce thermal
losses. The reflectors and tubes move consistently with the sun. Again, with this method it is
possible for direct steam generation or storage with the use of a HTF. Main advantages of this design
are that it is easily scalable, and the troughs only require two dimensional tracking of the sun,
whereas other designs require three dimensional tracking72.
Linear Fresnel systems are similar to parabolic trough collectors, but consist of a series of flat mirrors
with a downward facing absorber tube, which is fixed to a tower and lies above the reflectors.
Puerto Errado 1 in Murcia, Spain is a small capacity Linear Fresnel power plant. The main advantage
in this method is its simplicity which lowers costs and allows direct steam generation. However, it
has a lower efficiency than other CSP designs73 and energy storage is difficult to incorporate.
Parabolic dish collectors are single collectors with the heat absorber located above the dish. Both
components move in tandem to react to track the sun. They have a higher efficiency than the other
CSP collectors and do not require a HTF. Their major disadvantages are their expense due to the
large number of different dish collectors required. Each dish produces electricity independently,
meaning hundreds or thousands of them are needed to create a CSP plant. It is also difficult to
incorporate energy storage to the parabolic dish design. Despite their deficiencies, several parabolic
dish power plants are under construction74.
29 | P a g e
Fig 1.6 Different designs for CSP collectors (a) solar power tower (b) parabolic trough (c) linear Fresnel (d) parabolic dish.
Taken from Zhang et al68
The ability to store energy for CSP is essential. When there is no sunlight at night or during cloudy
periods, direct steam generation is not possible. Stored thermal energy can then be released from
the storage media to produce electricity, in effect producing electricity 24 hours per day. The storage
energy and direct energy are independent, providing 2 efficient Rankine cycles to deliver energy.
Excess energy produced at times of low demand is stored to be used during peak demand, known as
peak shifting. This ensures there is no difference between supply and demand for energy. Increased
reliability of renewable energies means consumers have increased confidence in buying, causing the
technology to become profitable.
Current state of the art energy storage for CSP plants is SHS using molten salt eutectics. They are
useful due to their high Cs and ability to be used as heat transfer fluid (HTF) as well as energy storage
media. Mineral oil was the original storage material for early CSP plants, but molten salts can be
used at much higher operating temperatures (currently up to 565ºC, compared with 393°C for
mineral oil). Higher operating temperatures improve Rankine cycle and thermodynamic efficiency of
the CSP plant. Molten salts currently used are usually nitrates75, for example Solar Salt, a 60:40 mix
30 | P a g e
of sodium nitrate and potassium nitrate. At temperatures above 600°C, nitrate salts degrade and
release highly corrosive nitrogen oxide76, causing problems with containment and mass loss. Current
solar power tower plants can produce temperatures of up to 950°C77, so new materials are required
for higher temperature storage. Molten salts have high TFs (e.g. Solar Salt TF = 220°C), meaning anti-
freeze measures are required which use lots of energy. Freezing results in an unwanted discharge of
large amounts of energy, and can lead to blockages and damage to the system67. Current CSP plants
must burn fossil fuels to quickly reach operating temperatures each day. Also, due to the inferior
heat storage SHS provides, large tanks are required to house the molten salts. Larger containers and
amounts of storage material increase costs. Problems also remain with corrosion and salt
decomposition78. Current production of the commonly used SHS nitrate salts is not sufficient to
supply the proposed number of CSP plants in future - 30 times the current production would be
required to supply CSP plants by 20501, so the development of new thermal storage materials is
crucial. An ideal solution would be to develop a high temperature PCM of TM at least 300-550ºC to
improve the Rankine efficiency of the energy cycle, along with increased energy density of storage.
HTFs and other components must also be developed for use at these temperatures76. The cost of
keeping the PCMs above their TM would be offset by the better energy storage capacity compared to
SHS materials. The candidates for high temperature PCMs are inorganic salts and metals.
Inorganic salts proposed as high temperature PCMs include nitrates, chlorides, sulphates and
carbonates. They have fewer problems with supercooling and phase separation than salt hydrates,
although still have low thermal conductivity. Volume changes upon melting of salts can exceed 10%,
which must be taken into account when designing containers to house them79. Liu et al80 found salts
with higher TMs generally have higher heat storage capacity, and therefore give lower costs per kWh
of energy produced. Fluoride salts have good heat capacity, especially some eutectics, but have
higher costs and are less compatible with containment materials.
31 | P a g e
Metals have higher thermal conductivity than salts, but much lower energy storage per unit weight.
Relatively few studies have been undertaken on understanding their properties. A study in 199481
found the major advantage of the high thermal conductivity, using aluminium as PCM. The Al was
encapsulated in a stainless steel capsule 4cm in diameter. They found a uniform temperature
throughout the metal core, whilst identical tests with salts resulted in a thermal gradient depending
on the proximity of the salt to the capsule shell. Blanco-Rodriguez et al82 investigated a eutectic alloy
of 49 %wt magnesium and 51 %wt zinc, which had a TM of 342°C, for use in CSP storage. The material
had minimal supercooling, due to its high thermal conductivity of 75 Wm-1K-1 at 300°C, which is 2
orders of magnitude higher than any inorganic salt. Despite this, the metal alloy had a higher cost
and much lower energy storage than salts. Metallic PCMs also have an issue with corrosion in the
liquid phase83. Investigators have attempted to solve this problem by coating in other metals, such
as coating a copper PCM in an iron shell84. Of course, other safety issues arise from the use of
molten metal.
Datas et al85 conceptualised a high-temperature LHS system using silicon as PCM. Silicon has very
high latent heat (1800 J·g-1), high thermal conductivity, low cost ($2/kg) and a high TM of 1414ºC.
They simulated a system which directly converted the stored energy into electricity using
thermovoltaic cells (TPV). They discovered the TPV would have discharge efficiencies of 20-45%,
which would lead to electric energy densities in the range of the best performing Li ion batteries.
The problem with adapting this potential technology for use with CSP, is safety and practicality in
working with such high temperatures. Containers and other equipment would have to be stable at
temperatures approaching 2000ºC.
Some researchers have proposed combining high temperature PCMs with additional SHS storage
materials. Laing and collaborators86 designed a prototype utilising sodium nitrate LHS for steam
generation combined with concrete-based SHS for preheating and superheating. They proposed
using aluminium fins in the PCM containers to increase heat transfer to the salt. Future CSP plants
32 | P a g e
should be multi-purpose, able to not only produce electricity but also sustainably produce hydrogen,
convert CO2 into methane and methanol and also desalinate water (Sattler et al, DLR presentation
on thermochemical energy storage, 2013 -
https://energy.gov/sites/prod/files/2014/01/f6/tces_workshop_2013_sattler.pdf). Ozturk et al87
suggested combining a solar power tower CSP plant with coal gasification to produce syngas. Their
calculations showed the system would have good Rankine cycle efficiency and waste heat recovery
abilities. The increased heat storage efficiency PCMs provide would make CSP as valuable as coal or
gas-fired power stations. Solutions must be found to combat poor thermal conductivity,
supercooling, container corrosion and incongruent melting.
1.6.2 Waste Heat Storage
Thermal energy is produced as a by-product of a huge number of industrial processes, and usually
considered as ‘waste heat’. Waste heat at varying temperatures is created by different processes, for
example in steelmaking it is between 150°C and 1500°C88. The US Department of Energy defined
waste heat <230ºC as ‘low-temperature heat’66. These processes contribute to a phenomenon
known as ‘urban heat islands’. Urban areas are hotter than rural areas due to several other factors,
such as the differing heat capacities of asphalt and concrete compared with green spaces, tall
buildings reflecting/absorbing sunlight and the reduced amount of vegetation. It is also possible
increased urban heat contributes to global warming, although this is disputed. Waste heat can be
utilised for applications such as space heating or to drive small power stations like the Riverside
power plant in London, which is run on transported waste heat. The International Energy Agency in
2014 stated that waste heat utilisation was key in achieving a low-carbon future.
PCMs are a good solution to reduce urban heating by recycling waste heat. Industrial applications
produce waste heat at a wide range of temperatures. Salt hydrates are suitable for use at

33 | P a g e
temperatures from 60-120°C. At higher temperatures, salts may be considered for use. Despite great
potential for utilising waste heat, several impeding factors persist such as lack of nearby heat sinks,
interference with industrial operation and lack of financial returns with current technology89. With
TES systems in place, it is possible to either reuse waste heat, or transport the waste heat elsewhere
to an off-site purchaser for applications such as greenhousing66. Thermoelectric generators are
devices which can convert waste heat to electricity, which can be especially useful in cars90,91. TES
offers a flexible approach to the usage of excess heat.
Other contributors to the urban heat phenomenon are applications such as fuel cells which may be
used to drive cars etc. Polymer electrolyte fuel cells (PEFCs) emerged as a promising energy
generation system in the 2000s, usually producing waste heat at a temperature of 60-100ºC92.
Clearly for applications such as powering cars, thermal energy storage must be compact. PCMs are
therefore a good choice due to their high storage density. Nagano et al54 investigated the use of
magnesium nitrate hexahydrate (Mg(NO3)2.6H2O) as a suitable PCM for PEFCs. Mg(NO3)2.6H2O has a
TM of 89ºC, a latent heat of 160.2 J·g-1 and is cheap compared to other PCMs in that temperature
range. In order to modulate the TM, they added magnesium chloride hexahydrate (MgCl2.6H2O).
Adding a 2nd PCM with the same base metal eliminates the chance of any unwanted reactions that
may occur between the two salts, and resulted in a minimal loss of latent heat. When calcium nitrate
tetrahydrate was used as an additive, the latent heat significantly declined. With the use of
additives, the TM could be modulated between 56ºC (eutectic point, 40% MgCl2.6H2O) and
approximately 80ºC (10% MgCl2.6H2O). They also noted that cheaper industrial grade materials
behaved similarly to pure reagents, making salt hydrates even more cost effective. The use of
crystallohydrate mixtures for the modification of TM will be further discussed in the section
‘Controlling TM’ (see page 46).
34 | P a g e
1.6.3 Thermal Regulation
Most of the energy we use leads to increased emissions. To combat this, other than developing
electricity sources which result in no emissions, passive systems which reduce the overall energy
demand can be developed. A great example of this is thermal regulation, which accounts for a huge
amount of energy use, especially in more developed nations. Thermal regulation is probably the
most researched application for PCMs, as most of these applications require low temperature PCMs
- ideal for paraffin waxes and salt hydrates. Thermal regulation can be used for many applications to
keep them within a specific temperature range, or to prevent overheating. Applications benefitting
from thermal regulation include air conditioning/space heating in buildings93–95, electronics96,97,
lithium batteries98–101, photovoltaics99,102,103, spacecraft/spacesuits104 and textiles105–107. As melting is
an endothermic process, energy is withdrawn from the surrounding area, having a cooling effect on
the surroundings. Once the temperature falls and the PCM freezes, this energy is then released and
the surroundings heat up again, thus temperature is controlled within the desired range. A classic
example of thermal regulation using PCMs is ice in a drink. As the ice melts, the drink is continuously
kept cool. Ice exemplifies the energy storage density of PCMs compared with SHS materials such as
liquid water: if the energy required to melt ice was applied to an equivalent volume of water, the
water temperature would increase by 82ºC52. Snow is still used today, and can be stored for use in
applications such as food storage and cooling systems108. This is especially useful in places such as
Scandinavia and parts of Japan, where snow is abundant and must be removed from cities and
towns at a high cost. Transporting this snow for use elsewhere in practical applications minimises
monetary losses.
35 | P a g e
1.6.3.1 Thermal control of space equipment and textiles
The use of PCMs as thermal regulation materials was pioneered by NASA, who helped produce the
Phase Change Materials Handbook in 1971109. They needed to protect their spacecraft and
astronauts from the extreme temperatures of space, which can range from approximately -150°C to
120°C. A large amount of the equipment used requires stable temperature control to combat
temperature fluxes110. As recently as September 2016, a heat exchanger module containing the
paraffin wax pentadecane was installed in the International Space Station for thermal control. PCMs
are ideal for compact storage which is especially important for outer space applications, as materials
cost approximately $20000 per kg to launch104.
Short term high heat-flux is a major cause of components failing on spacecraft111. Technologies often
employed such as capillary pumped loops have proved fairly effective, however are not suitable for
future challenges in space technology110. Wu et al111 simulated a PCM designed to protect multi-
layer insulation on spacecraft. This insulation material is applied externally on almost the entire
spacecraft and so is highly exposed to radiation. Their simulated results showed that the PCM kept
the insulation within the desired operating temperature. They also found adding graphite as an
additive to increase thermal conductivity helped with the temperature regulation. Paraffin waxes
were used as PCMs for these applications for many years, however more recent research has
focused on new materials to improve thermal conductivity. In 2007, NASA developed lithium nitrate
trihydrate with carbon fillers as a PCM for potential use in a Mars rover112. As the carbon filler is
hydrophobic, a surfactant was required for use with the hydrophilic lithium nitrate. They also doped
the lithium nitrate with zinc nitrate hexahydrate which greatly reduced the supercooling. The
resulting material had a heat storage capacity of 40 J·g-1 and prevented large heat-fluxes even with
high power input. This shows salt hydrates can be used for thermal regulation when sufficiently
modified, although the heat storage capacity is not yet satisfactory.
36 | P a g e
Thermal management of textiles is one of the major applications that PCMs have been commercially
available for. PCMs have been used in outdoor wear such as coats, along with underwear, bedding
and sleeping bags etc106. They react to changes in environmental temperature to automatically heat
or cool the user, whilst preventing discomfort associated with large temperature fluxes105,113.
Encapsulated PCMs incorporated in textiles can have minimal effect on the fabric properties114,
although this may be problematic at high loading capacity115. It is important therefore, that PCMs
incorporated into textiles have good latent heat so a small volume may be used. Companies such as
BASF and Samsung have used PCMs in their products. There are numerous methods to apply PCM
materials into textiles, such as knife over roll116, dip coating117 and screen printing106. PCMs
incorporated into textiles run the risk of being removed or damaged during washing. Studies by Shin
et al115,118 showed fabrics loaded with melamine formaldehyde capsules containing eicosane
retained only a quarter of their heat storage capacity after 10 cycles. A potential solution to this
problem is to first attach the PCM to a support material such as nanocellulose fibres, which can act
as an anchor to prevent material loss.
1.6.3.2 Passive air conditioning
Passive air conditioning can be considered the primary application for low-temperature PCMs.
Buildings account for approximately 40% of global energy usage119–121. Air conditioning is a large part
of this energy demand. This is especially true of modern buildings, whose lightweight construction
leads to large temperature swings due to a lack of thermal mass122. Many recent skyscrapers and
other buildings have been built with large amounts of glass for example, making them unbearably
hot in summer and meaning they must be heavily air conditioned. It is possible to reduce these
fluctuations with the addition of PCMs to various parts of the building. PCMs increase the thermal
mass of buildings whilst taking up a relatively small volume123. To keep internal temperature within
the range of human comfort, a PCM with a TM of 20-25ºC is required. Using a passive air conditioning
37 | P a g e
system, it is possible to reduce space heating energy requirements by up to approximately 90%. An
EU directive has called for all new buildings to be zero net energy by 2020, PCMs can be of great
value in achieving this goal. A building erected in 2012 at the University of Washington in Seattle,
USA used a ‘bioPCM’ in its walls. They estimated that the 1.25cm thick layer of bioPCM had the same
thermal insulation effect as a 25cm thick concrete wall.
Once PCM technology for thermoregulation is developed, new buildings can be constructed
accordingly. A major problem is the improvement of existing buildings to reduce their energy
demands. Retrofitting PCM components i.e. replacing existing building parts, is a potential
solution124. Replacing whole walls or roof spaces is not economically viable; a method to get around
this is to add PCMs to smaller building components which can more easily be retrofitted. Drywall
(wallboard) is a good candidate for the addition of PCMs. Drywall is a lightweight material made of
gypsum and is used for wall interiors. It is possible to directly incorporate PCMs into gypsum. In
1991, Feldman et al125 fabricated gypsum plaster containing butyl stearate as PCM. The incorporated
PCM had no impact on the physical properties of the wallboard, and increased the energy storage
capacity tenfold. Sari et al126 used a form-stable eutectic blend of capric and stearic acids to add to
wallboards, while Shilei et al127 found the same mixture had good thermal stability. Using a similar
procedure with commercial PCMs, Kuznik and collaborators128 found the temperature inside a test
cell were kept 2-3°C lower when using a PCM wallboard compared with regular wallboard. Several
investigations have determined PCMs need to be encapsulated for addition to building materials to
prevent leakage or interaction with the walls122,129. Capsules must have sufficient surface area in
order to deliver acceptable heat transfer through the building123. Hexadecane-loaded capsules with a
diameter of 5-20µm incorporated into gypsum was shown to keep temperatures in the level of
human comfort for far longer than conventional wallboards130. PCMs are most effective in tropical
climates, as space cooling is required every day of the year, unlike many countries such as the UK
which have both warm and cold seasons. A simulation based on the tropical weather in Singapore
displayed that an ideal PCM could reduce heat gains within a building by 21-32% during a year131.
38 | P a g e
A new solution to the retrofitting problem is the development of PCM ‘thermopaint’. PCMs can be
combined with commercial paint which, when added to a surface such as a wall, will thermally
regulate the internal building area. PCM paints have not yet been developed. Due to the issues
outlined earlier, it is not possible to simply add PCMs directly to the paint. They must firstly be
contained, of which currently there are no mass-scale or cost-effective methods. Other energy
saving paints such as Insuladd and SuperTherm have been available since the late 1990s. These
paints act as thermally reflective coatings due to hollow structures in their composition which
reduce heat transfer through the coating. This allows the paint to reflect heat either inside or
outside of the building. The main drawback is that the paint must be uniformly applied so that there
is a perfect angle between the heat source and insulating surface. If the heat source changes angle
the efficiency is decreased. These paints, although partially effective, do not allow control over
indoor temperature. PCM thermopaint would allow an ideal indoor temperature to be chosen. The
space will be kept at approximately the PCMs TM, as the PCM will melt or freeze depending on
external temperature. Although still a passive system requiring zero energy, thermal energy is stored
and released based on the PCM melting and freezing, rather than reflection of any heat source. As
the heat storage relies on temperature rather than reflection, the paint can be applied anywhere in
the building with the same thermal regulation effect.
Another interesting ‘new’ technological development is the erection of wooden skyscrapers. Wood
fell out of favour as a building material due to disasters such as the Great Fire of London in 1666.
Contrary to popular belief, wood is more resistant to fire than steel, which most modern
constructions are made of. Wood chars during fire, forming a layer of carbon which restricts oxygen
supply to timber underneath. This protects internal layers and maintains structural stability. In
contrast, steel will bend and buckle after reaching a critical temperature. As an example of the new
trend in using wood, the Hoho building in Vienna has been constructed in 2017. At 84m, it is the
tallest wooden building ever made. The major issue with wooden buildings is rot due to moisture. It
39 | P a g e
is feasible that thermopaint could be used to help prevent wood rot in addition to temperature
control – paint is used on cars for rust prevention, for instance.
Older buildings which tend to be made of concrete do not suffer temperature fluctuations to the
same extent as more lightweight buildings. This is due to their high thermal mass. Walls impregnated
with PCM have been shown to outperform concrete whilst requiring less wall thickness. As a further
advantage, porous materials used in buildings which can be impregnated with PCMs are low cost
and easy to fabricate132. A numerical simulation showed that calcium chloride hexahydrate
outperformed paraffin wax and concrete when comparing indoor temperatures. The 0.08m thick
calcium chloride impregnated wall kept the room temperature between 18-22°C, compared to 15-
25°C when using a 0.05m thick paraffin wax impregnated wall or a 0.2m thick concrete wall133. The
simulation demonstrates the additional energy density salt hydrates provide, leading to the
prevention of large temperature fluctuations.
1.6.3.3 Passive cooling systems
Refrigeration systems can also benefit from the use of PCMs. Refrigeration is very widely used in
such applications as transportation of food, vaccines and ice55. Refrigerated trucks using PCMs have
been tested for effectiveness. Refrigeration units used currently rely on diesel engines for cooling,
which consume energy and produce emissions. Temperature fluctuations within the refrigerator
lead to reduced product quality or possible destruction134; PCMs reduce these fluctuations as well as
decreasing energy requirements. Transportation conditions are dependent on the contained
material, so a range of PCMs with differing TMs should be developed. Ahmed et al135 used a paraffin
with a TM of 7°C concealed in copper pipes, which were incorporated into regular truck panels.
During tests, the PCM panels reduced peak heat transfer by an average of 29.1% compared with the
regular panels. Liu et al136 developed a PCM with TM of -26.8°C for refrigerating raw meat, which is
40 | P a g e
usually stored at -18°C. The PCM used was an inorganic salt and water solution. They found the
system could reduce energy requirements by up to 86% compared to using a diesel driven coolant.
Melone and collaborators137 produced an encapsulated PCM/cellulose composite for refrigeration.
They developed a mathematical modelling simulation, which showed the PCMs effectiveness in food
preservation.
Large amounts of research have been devoted to the thermal management of electronics, Li-ion
batteries and photovoltaics. Most failures of these products are due to overheating99, which PCMs
can help prevent with no additional energy input. Traditional cooling technologies such as active air
and liquid cooling are ineffectual due to low heat transfer rates138, and also consume energy. Many
modern technologies such as smart phones are small closed systems, meaning active air cooling
using bulky fans is not practical139.
Numerous studies have shown loss of capacity in Li-ion batteries is highly temperature
dependent140–143. Temperatures which are either much lower or much higher than the optimum
operating temperature will cause rapid degradation of the battery. Khateeb et al98,144 first designed a
thermal management system for Li ion batteries in an electric scooter using simulated results,
followed by experimental tests. Simulations showed that a paraffin wax PCM module alone was not
enough to continuously cool the battery, due to poor thermal conductivity. This was improved by
the addition of aluminium fins to increase the heat transfer area. Experimental and simulated values
were similar, and confirmed that a finned configuration was necessary in hot conditions to improve
performance.
PVs have an optimum working temperature of around 25°C. Less than 20% of the solar energy they
receive is converted to electricity, the rest is converted to heat which causes efficiency losses. It has
been estimated than PVs lose around 0.4-0.65% K-1 power output upon heating145,146, due to
alteration of the working voltages99. PCMs can provide better thermal management of PV than other
systems147. In a series of studies, Huang et al148–151 determined through both simulations and

41 | P a g e
experimental data, that PCMs were highly effective at preventing temperature rises in PV modules.
PV integrated into buildings especially require thermal regulation as their temperatures rise up to
9% higher than regular PV150. The temperature was reduced by as much as 30°C in some cases
compared to regular PV design. Also suggested was the use of finned configurations to apply a more
uniform temperature, while salt hydrates were found to be more effective at reducing temperatures
than fatty acids.
42 | P a g e
1.7 Improvements to PCMs for Practical Applications
The practical use of PCMs is hindered by their limitations. For instance, the solid-liquid transition
must be suitably contained to prevent leakage. No known PCM fulfils all of their ideal criteria
(outlined by Abhat34 and listed on page 13). The main drawbacks of salt hydrates are incongruent
melting and phase separation. These can be improved by additives. The ‘extra water principal’
involves adding extra water to the salt hydrate melt, preventing change in hydration number and
maintaining TM. The idea is that once melted, salt hydrates may lose water due to evaporation. With
more water in the mix, they are able to remain in the correct hydration state. This effect was
investigated by El Sebaii et al152, who showed calcium chloride hexahydrate (CaCl2.6H2O) could be
kept stable over 1000 cycles with minimum loss of ∆H simply by adding extra water at intervals.
Nucleators can be added to prevent incongruent melting, while thickeners can be used to stop phase
separation. It must be noted that the use of additives reduces ∆H, as there is less salt hydrate in the
mix. Even with the use of nucleators and thickeners, PCMs will still degrade over time152, so they are
not an ideal solution for solving the problems associated with PCMs. Following is a discussion of the
numerous ways in which researchers have approached enhancing the thermal conductivity and
chemical stability of both organic and inorganic PCMs.
1.7.1 Enhancing Thermal Conductivity
PCMs in general suffer from low thermal conductivity (aside from metallic PCMs). There are ways to
improve this, such as the use of conductive particles. Many studies have shown that a very small
number of conductive particles can cause large increases in the thermal conductivity. A simulation in
2002153 showed addition of copper or aluminium particles considerably increased the thermal
conductivity of a PCM melt. As an increase in the number of conductive particles results in lower
latent heat, an optimum number of particles must be determined. A compromise is required
43 | P a g e
between high latent heat, material stability and conductivity. Oya et al154 enhanced the conductivity
of erythritol using both nickel and graphite particles. When using only 15 %wt of expanded graphite
particles, the thermal conductivity of the PCM was increased by 640%. Qi et al155 produced a sample
of PEG impregnated with graphene oxide as a support material, with graphite nanoplatelets as
conductivity enhancer. With only 4 %wt graphite nanoplatelets in the mix, thermal conductivity was
490% that of regular PEG. Latent heat was minimally affected, reduced by only 1.8%.
Metal foams provide high surface area, increasing contact with the PCM to provide conductivity
enhancement. Mathematical modelling has shown foams cause faster melting times for paraffins156.
Experimental results using metal foams have shown the thermal conductivity can be increased by a
factor of 3157, while heat transfer increases by a factor of 3-10158.
Finned configurations of containers are another method of increasing heat transfer contact with the
PCM. It is simpler than using metal foams as no chemical synthesis is required. Zhang and Faghri159
used a numerical simulation to show the effect of fins, and found it was an efficient way of
conductivity enhancement for HTFs which have low thermal conductivity. It was found to be
especially useful for PCMs which suffer from a large degree of supercooling. Agyenim et al160 used
fins to increase the conductivity of erythritol. Longitudinal fins gave the best results, achieving
complete melting due to better thermal response during charging, and reduced supercooling during
discharge. A combination of these approaches to increase thermal conductivity could be highly
effective for heat storage systems of the future.
1.7.2 Cascaded and Thermocline LHS
A chemical engineering approach to improving the use of PCMs is changing the arrangement of the
PCMs in a heat storage unit. The cascaded LHS (CLHS) is an energy storage tank with a packed bed of
PCMs in decreasing order of TM with respect to the flow of the HTF during charging, as shown in Fig
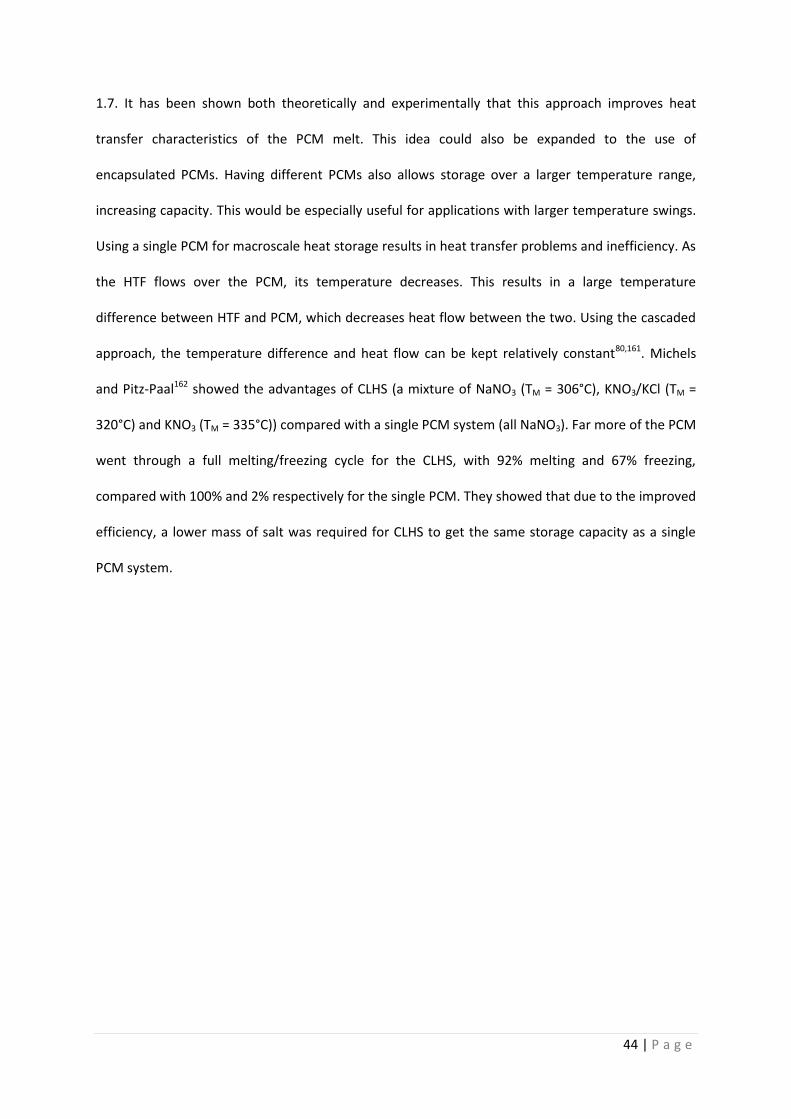
44 | P a g e
1.7. It has been shown both theoretically and experimentally that this approach improves heat
transfer characteristics of the PCM melt. This idea could also be expanded to the use of
encapsulated PCMs. Having different PCMs also allows storage over a larger temperature range,
increasing capacity. This would be especially useful for applications with larger temperature swings.
Using a single PCM for macroscale heat storage results in heat transfer problems and inefficiency. As
the HTF flows over the PCM, its temperature decreases. This results in a large temperature
difference between HTF and PCM, which decreases heat flow between the two. Using the cascaded
approach, the temperature difference and heat flow can be kept relatively constant80,161. Michels
and Pitz-Paal162 showed the advantages of CLHS (a mixture of NaNO3 (TM = 306°C), KNO3/KCl (TM =
320°C) and KNO3 (TM = 335°C)) compared with a single PCM system (all NaNO3). Far more of the PCM
went through a full melting/freezing cycle for the CLHS, with 92% melting and 67% freezing,
compared with 100% and 2% respectively for the single PCM. They showed that due to the improved
efficiency, a lower mass of salt was required for CLHS to get the same storage capacity as a single
PCM system.
45 | P a g e
Fig 1.7 Representation of CLHS system, with PCMs set in order of decreasing TM with regards to HTF flow during charging.
Thermocline energy storage consists of a porous bed of heat storage filler material with the HTF
flowing through. As most of the storage tank is filled with the solid material, less HTF is required. It is
possible to use PCM capsules with this method. Thermocline works due to thermal stratification,
where hot fluid rises to the top of the tank and cold fluid to the bottom, creating a thermal gradient
known as a thermocline163. The filler material helps maintain the gradient. It is possible to utilise
PCMs within this setup, by adding them between layers of solid filler. A cascaded approach can also
be used, with higher TM PCMs added as a top layer, with alternating layers of solid filler and lower TM
PCMs below. Galione et al163 ran a simulation which determined this kind of cascaded thermocline
was more efficient than a regular CLHS system, using only 20% mass of the PCM but storing 83% of
the energy compared to the CLHS. However, the thermocline system used far more filler material, so
a cost analysis would be required.
CLHS has great potential, especially for large scale heat storage such as that used in CSP, due to
improved melting and freezing characteristics. Further thermal conductivity enhancement may be
necessary for complete melting and freezing, such as using finned containers. It is also feasible CLHS
could be used at lower temperatures and for smaller scale applications. It could be useful for passive
46 | P a g e
air conditioning for example, especially if atmospheric temperatures fall outside the melting range of
a single PCM. CLHS may be the approach used once PCM systems are adopted for use in CSP storage.
1.7.3 Controlling TM
The key property for any PCM is the TM. The TM must be in the range of the application temperature,
otherwise no energy storage will be possible. Therefore, a method of altering the TM to suit any
application would be highly advantageous. For paraffin waxes, longer carbon chains give higher TMs.
Paraffins only have a small range of useful temperatures in which they can be used in. Salt hydrates
and salts can be mixed together to tailor the TM to the desired range. A mixture of two compounds
with the lowest possible TM is known as a eutectic. This effect is caused by the compounds inhibiting
the crystallisation of each other164. At any ratio other than the eutectic point, the two compounds
are separate phases. At the eutectic point, a single phase is formed with a defined TM lower than
that of the single components41,165. A typical phase diagram for a eutectic system is shown in Fig 1.8.
Eutectic mixtures also have higher latent heat in comparison to other mixtures54, potentially boosted
by additional thermochemical heat41. For salt hydrates, the latent heat for mixtures other than the
eutectic will be lower than that of the single components, due to the release of water.
Although eutectics and mixtures have these advantageous properties, they are not well researched
with regards to crystallohydrates. They also retain the disadvantages that are inherent in single
crystallohydrates, such as supercooling. More research is needed on the creation of salt hydrate
eutectics. It has been suggested that molecules with similar crystal structures form eutectics better
than others. Phase behaviour can also be studied. Due to the huge number of available
crystallohydrates, it would be of use to develop some molecular modelling or other screening
software to determine which mixtures have good potential. Zeng and collaborators166
computationally determined phase diagrams of several ternary salt-water mixtures. This allows the

47 | P a g e
development of new heat storage materials and reduces the required amount of experimental work,
saving time and money. The software was accurate in predicting phase diagrams for known salt
mixtures, showing this can be useful in future eutectic work. In a further study167, they calculated
phase diagrams for manganese nitrate hydrates (tetrahydrate TM = 26°C, hexahydrate TM = 37°C)
doped with 10 different salts, giving TMs between 11 and 32°C. Alteration of the TM opens up new
applications for salt hydrates. The modulation of manganese nitrate hydrate TM has also been done
experimentally168. It was found that when zinc nitrate hexahydrate and potassium nitrate were
added, a eutectic of TM 18-21°C is formed with a reasonable latent heat of 110 J·g-1. They also found
suitable nucleating agents and thickeners to prevent supercooling and phase separation,
respectively.
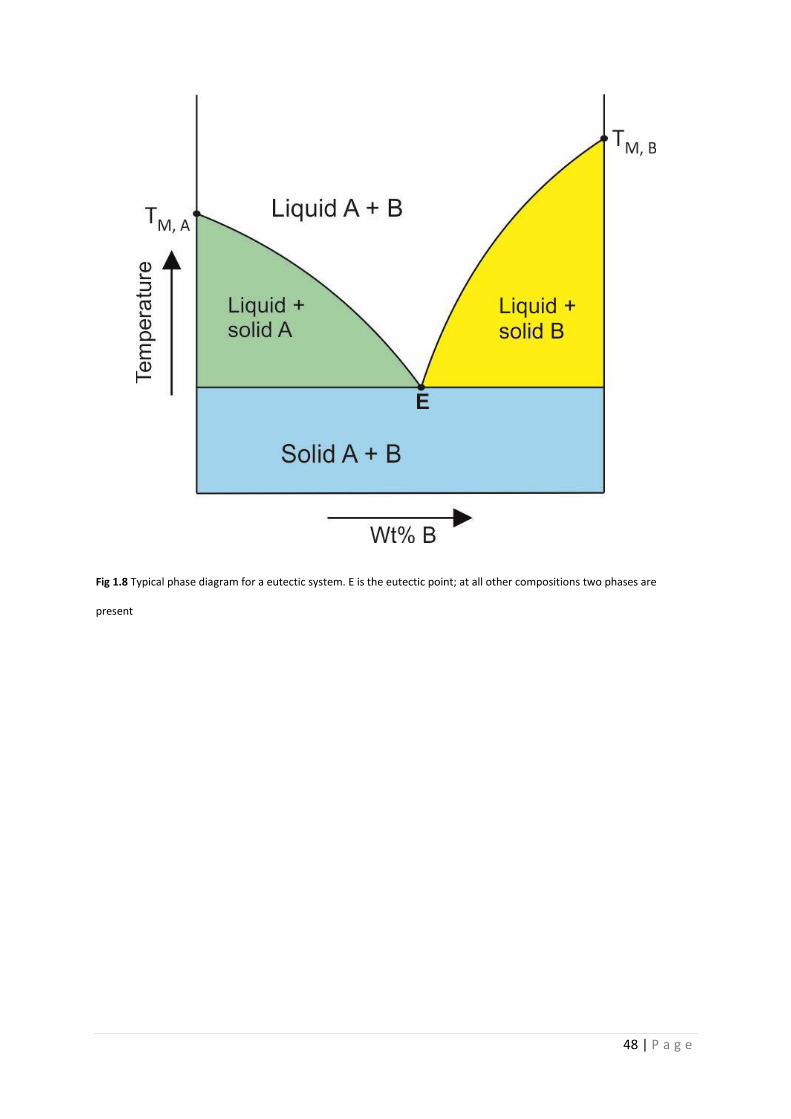
48 | P a g e
Fig 1.8 Typical phase diagram for a eutectic system. E is the eutectic point; at all other compositions two phases are
present
49 | P a g e
1.8 Encapsulation of Active Materials
The most promising way to improve PCM properties is by encapsulation within a composite shell
material. Encapsulation is a widely used technique to protect materials such as corrosion inhibitors,
drugs, pesticides and DNA. Capsules can be macro- (>1000µm), micro- (1-1000µm) or nanosized (1-
1000nm). Smaller capsules greatly increase the surface-area-to-volume-ratio of the material, which
improves heat transfer. For example, it has been predicted that encapsulating PCMs in capsules
1mm in size would increase the surface area by 300m2 per m3 when compared with the bulk PCM1.
Reducing their diameter to the nanometre range would vastly increase this. Other advantages of
encapsulating PCMs include prevention of both leakage and reactions with the external
environment, corrosion protection for container materials, control over volume change upon
melting and improved thermal cycling stability122,169. All these properties are crucial to PCM usage in
practical applications, so encapsulation can almost be thought of as a ‘one size fits all’ solution. The
shell is usually made up of a polymer, as they give a good balance between strength and flexibility.
Inorganic shells can also be used, which have higher thermal conductivity (silica is a good example of
an inorganic shell for PCMs due to its enhanced heat transfer) but are more brittle. Polymer shells
are more favourable due to their prolonged durability and low cost.
To create capsules containing active materials, it is first important to understand the basic chemistry
and processes that contribute to encapsulation. To fabricate a capsule, an emulsion of the desired
droplet size must first be formed, followed by the formation of shell material at the emulsion droplet
interface. The encapsulation of active materials and their specific effects on PCMs will now be
discussed.
50 | P a g e
1.8.1 Emulsions
An emulsion is a liquid dispersed in another liquid in which it is not soluble or miscible. This is
achieved with stabilisers called surface active agents, commonly abbreviated to surfactants.
Surfactants spontaneously form a shell around the dispersed liquid to create droplets known as
micelles. This ‘dispersed phase’ is dispersed through the ‘continuous phase’. The spontaneity of
micelle formation is due to the amphiphilic nature of surfactants. They consist of a hydrophilic head
group and hydrophobic tail group, which arrange accordingly to minimise contact between the 2
emulsion phases. An emulsion can be oil-in-water (O/W) or water-in-oil (W/O), depending on the
ratio of the two. The liquid of least volume is dispersed within the other liquid. O/W emulsions are
more common as there is no need for selection of the continuous phase. A good example of an O/W
emulsion is the use of soap. Surfactants in the soap surround hydrophobic dirt which can then be
rinsed away. W/O emulsions require careful selection of the continuous oil phase and surfactants to
give the highest solubilisation capacity for the dispersed phase170,171. W/O emulsions are also known
as ‘inverse emulsions’. Capsules provide protection and enhance the properties of many materials;
emulsion droplets provide a template for capsules to form. The shell material can either polymerise
around the droplets, or can be premade and deposited.
It is possible to reduce emulsion droplet size by an energy input. Common energy inputs include
homogenisation and sonication. Droplet size is a key factor in capsule formation, determining the
diameter of the resulting capsules. An emulsion with nanosized droplets formed with a high energy
input is known as a miniemulsion (or nanoemulsion). This is in contrast with microemulsions, which
also have nanometre sized droplets, but form spontaneously. Miniemulsions are kinetically stable
while microemulsions are thermodynamically stable172. Microemulsions require a larger amount of
surfactant than miniemulsions, usually at least 20 %wt of surfactants in the oil phase, whereas
miniemulsions require 3-10 %wt173. Regular emulsions and miniemulsions are thermodynamically
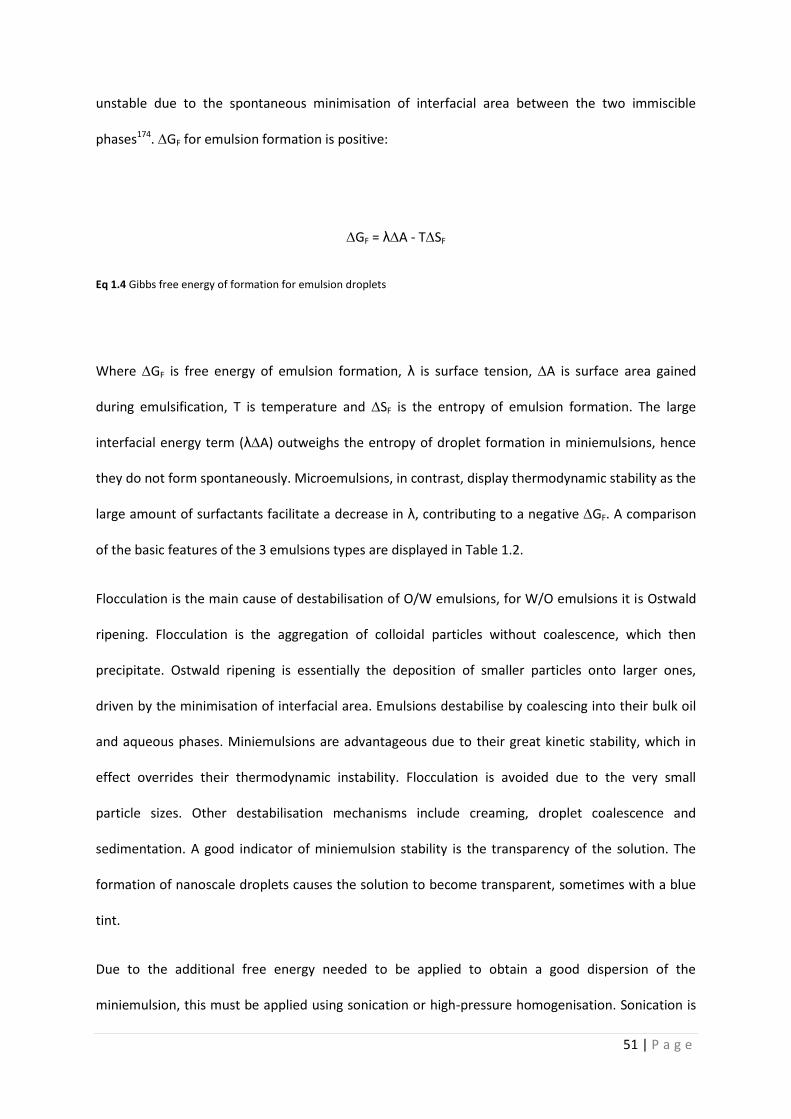
51 | P a g e
unstable due to the spontaneous minimisation of interfacial area between the two immiscible
phases174. ∆GF for emulsion formation is positive:
∆GF = λ∆A - T∆SF
Eq 1.4 Gibbs free energy of formation for emulsion droplets
Where ∆GF is free energy of emulsion formation, λ is surface tension, ∆A is surface area gained
during emulsification, T is temperature and ∆SF is the entropy of emulsion formation. The large
interfacial energy term (λ∆A) outweighs the entropy of droplet formation in miniemulsions, hence
they do not form spontaneously. Microemulsions, in contrast, display thermodynamic stability as the
large amount of surfactants facilitate a decrease in λ, contributing to a negative ∆GF. A comparison
of the basic features of the 3 emulsions types are displayed in Table 1.2.
Flocculation is the main cause of destabilisation of O/W emulsions, for W/O emulsions it is Ostwald
ripening. Flocculation is the aggregation of colloidal particles without coalescence, which then
precipitate. Ostwald ripening is essentially the deposition of smaller particles onto larger ones,
driven by the minimisation of interfacial area. Emulsions destabilise by coalescing into their bulk oil
and aqueous phases. Miniemulsions are advantageous due to their great kinetic stability, which in
effect overrides their thermodynamic instability. Flocculation is avoided due to the very small
particle sizes. Other destabilisation mechanisms include creaming, droplet coalescence and
sedimentation. A good indicator of miniemulsion stability is the transparency of the solution. The
formation of nanoscale droplets causes the solution to become transparent, sometimes with a blue
tint.
Due to the additional free energy needed to be applied to obtain a good dispersion of the
miniemulsion, this must be applied using sonication or high-pressure homogenisation. Sonication is

52 | P a g e
a good option for lab scale experiments, but is not currently suitable for use on an industrial scale.
Regular homogenisation (such as Ultraturrax) does not provide the required amount of energy to
form a miniemulsion, as much energy is lost as heat due to friction174. Regular homogenisation is
therefore only effective at producing microcapsules >1µm in size.
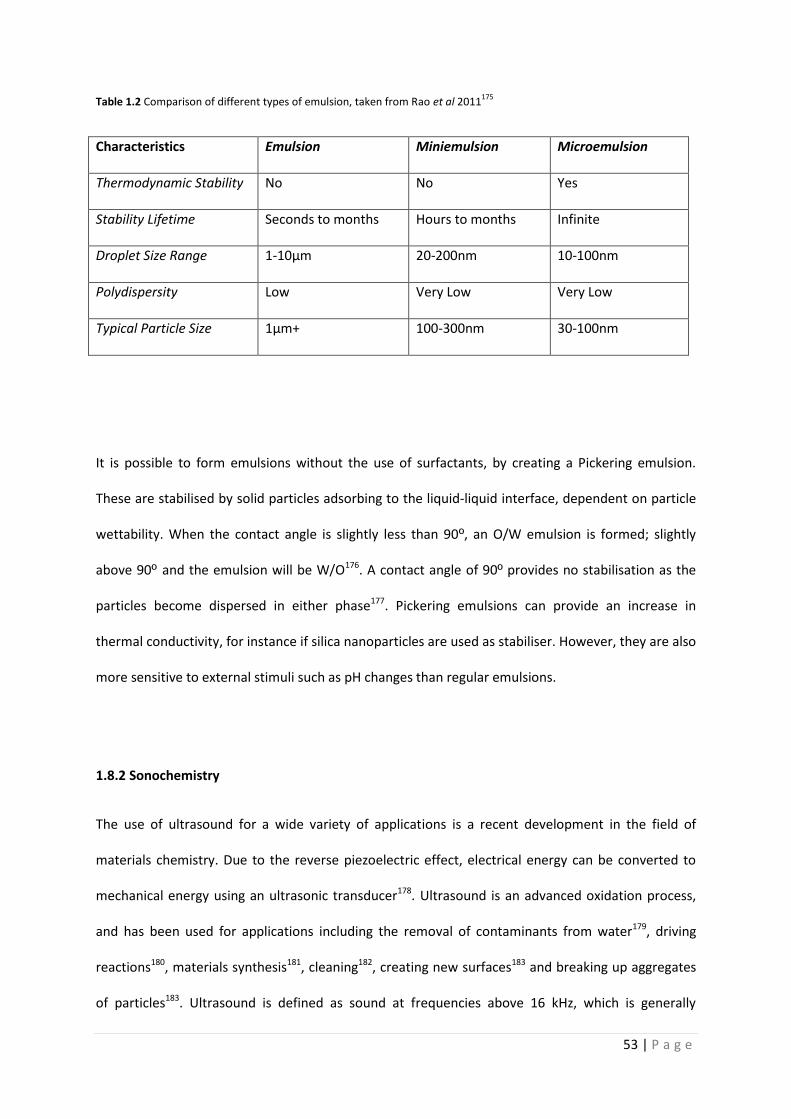
53 | P a g e
Table 1.2 Comparison of different types of emulsion, taken from Rao et al 2011175
Characteristics Emulsion Miniemulsion Microemulsion
Thermodynamic Stability No No Yes
Stability Lifetime Seconds to months Hours to months Infinite
Droplet Size Range 1-10µm 20-200nm 10-100nm
Polydispersity Low Very Low Very Low
Typical Particle Size 1µm+ 100-300nm 30-100nm
It is possible to form emulsions without the use of surfactants, by creating a Pickering emulsion.
These are stabilised by solid particles adsorbing to the liquid-liquid interface, dependent on particle
wettability. When the contact angle is slightly less than 90º, an O/W emulsion is formed; slightly
above 90º and the emulsion will be W/O176. A contact angle of 90º provides no stabilisation as the
particles become dispersed in either phase177. Pickering emulsions can provide an increase in
thermal conductivity, for instance if silica nanoparticles are used as stabiliser. However, they are also
more sensitive to external stimuli such as pH changes than regular emulsions.
1.8.2 Sonochemistry
The use of ultrasound for a wide variety of applications is a recent development in the field of
materials chemistry. Due to the reverse piezoelectric effect, electrical energy can be converted to
mechanical energy using an ultrasonic transducer178. Ultrasound is an advanced oxidation process,
and has been used for applications including the removal of contaminants from water179, driving
reactions180, materials synthesis181, cleaning182, creating new surfaces183 and breaking up aggregates
of particles183. Ultrasound is defined as sound at frequencies above 16 kHz, which is generally
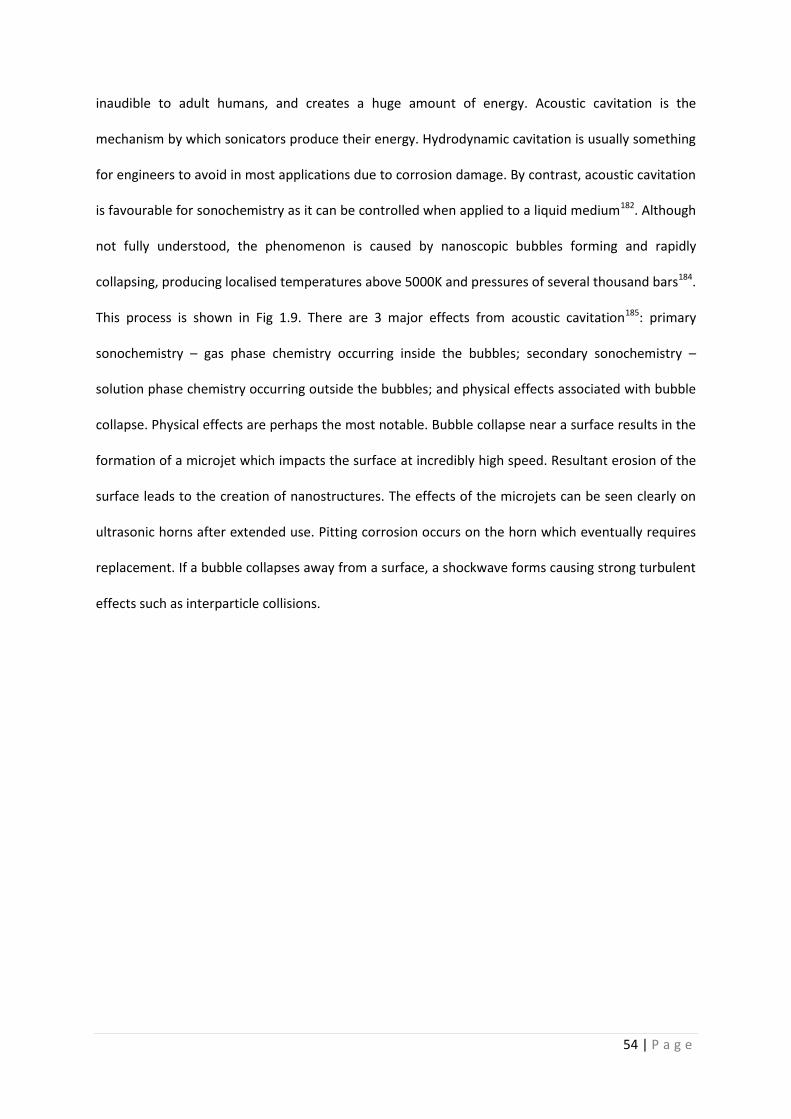
54 | P a g e
inaudible to adult humans, and creates a huge amount of energy. Acoustic cavitation is the
mechanism by which sonicators produce their energy. Hydrodynamic cavitation is usually something
for engineers to avoid in most applications due to corrosion damage. By contrast, acoustic cavitation
is favourable for sonochemistry as it can be controlled when applied to a liquid medium182. Although
not fully understood, the phenomenon is caused by nanoscopic bubbles forming and rapidly
collapsing, producing localised temperatures above 5000K and pressures of several thousand bars184.
This process is shown in Fig 1.9. There are 3 major effects from acoustic cavitation185: primary
sonochemistry – gas phase chemistry occurring inside the bubbles; secondary sonochemistry –
solution phase chemistry occurring outside the bubbles; and physical effects associated with bubble
collapse. Physical effects are perhaps the most notable. Bubble collapse near a surface results in the
formation of a microjet which impacts the surface at incredibly high speed. Resultant erosion of the
surface leads to the creation of nanostructures. The effects of the microjets can be seen clearly on
ultrasonic horns after extended use. Pitting corrosion occurs on the horn which eventually requires
replacement. If a bubble collapses away from a surface, a shockwave forms causing strong turbulent
effects such as interparticle collisions.
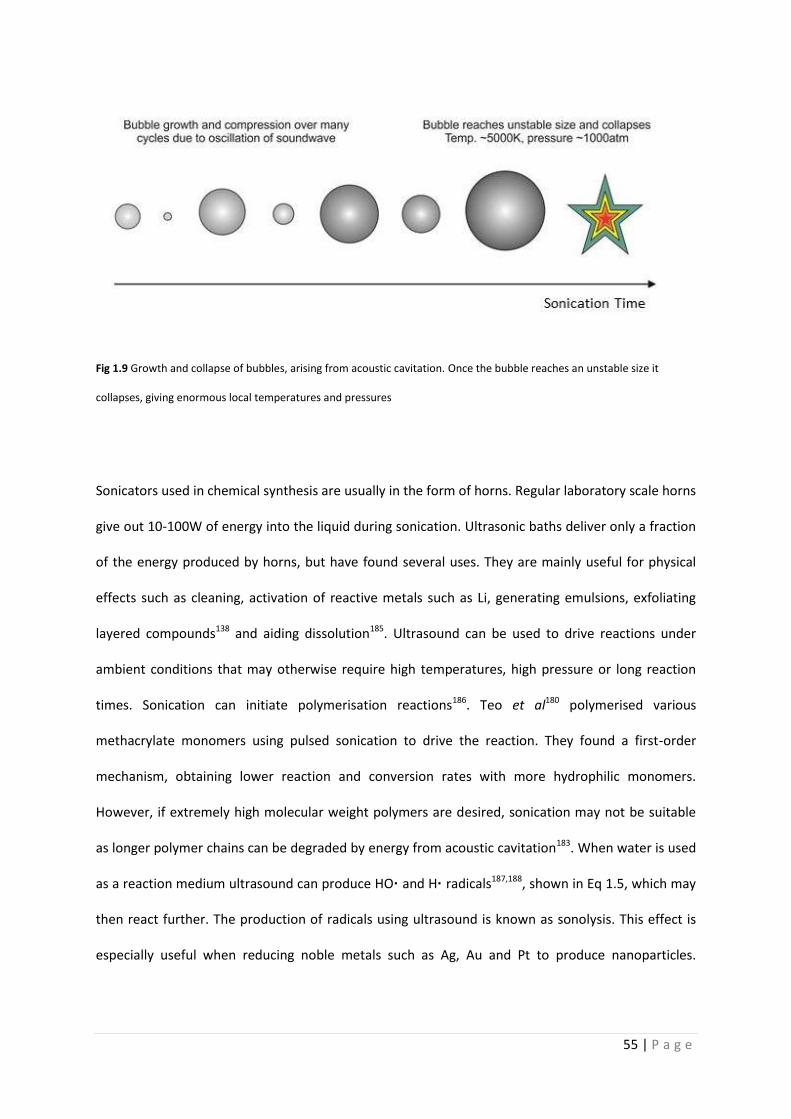
55 | P a g e
Fig 1.9 Growth and collapse of bubbles, arising from acoustic cavitation. Once the bubble reaches an unstable size it
collapses, giving enormous local temperatures and pressures
Sonicators used in chemical synthesis are usually in the form of horns. Regular laboratory scale horns
give out 10-100W of energy into the liquid during sonication. Ultrasonic baths deliver only a fraction
of the energy produced by horns, but have found several uses. They are mainly useful for physical
effects such as cleaning, activation of reactive metals such as Li, generating emulsions, exfoliating
layered compounds138 and aiding dissolution185. Ultrasound can be used to drive reactions under
ambient conditions that may otherwise require high temperatures, high pressure or long reaction
times. Sonication can initiate polymerisation reactions186. Teo et al180 polymerised various
methacrylate monomers using pulsed sonication to drive the reaction. They found a first-order
mechanism, obtaining lower reaction and conversion rates with more hydrophilic monomers.
However, if extremely high molecular weight polymers are desired, sonication may not be suitable
as longer polymer chains can be degraded by energy from acoustic cavitation183. When water is used
as a reaction medium ultrasound can produce HO· and H· radicals187,188, shown in Eq 1.5, which may
then react further. The production of radicals using ultrasound is known as sonolysis. This effect is
especially useful when reducing noble metals such as Ag, Au and Pt to produce nanoparticles.
56 | P a g e
Sonolysis can be used to remove pollutants from water, which is especially effective when combined
with other oxidation techniques such as photocatalysis189.
H2O H· + HO·
O2 O + O
Eq. 1.5 Typical reactions producing radicals from water, driven by ultrasonic cavitation
Due to the fossil fuel energy problem, many countries are considering expanding nuclear energy
generation. Despite negative public perception of the hazards involved, nuclear reactors can be
invaluable if strict safety standards are enforced. Nuclear waste, such as spent fuel rods, presents a
large problem however. Currently they must be safely stored for long periods until their radioactivity
has significantly decreased. A potential use of sonochemistry is the treatment of spent nuclear fuel
which can be recycled and reused. This is driven by the reaction of sonolytic products with actinide
ions (such as uranium or plutonium ions)190. Recycling spent fuel rods makes the whole process more
efficient and lessens the impact of radioactive waste.
In the context of PCM technology and other materials requiring encapsulation, the major application
of sonochemistry is in generating emulsions. As mentioned above, the formation of miniemulsions
requires a great deal of energy. Sonication is an ideal method to create them at laboratory scale.
High pressure homogenisation produces results akin to sonication, however is mainly available on a
large-scale. Regular homogenisers (such as Ultraturrax) are available for lab-scale use but are less
effective than sonication. Emulsion droplet size is dependent on the shearing rate32, with higher
homogenisation speeds producing smaller droplets and narrower size distributions. Shearing an
oil/water/surfactant mix with homogenisation or sonication will yield an emulsion or miniemulsion
57 | P a g e
(depending on the amount of energy applied) very quickly. Sonication can also be used to fully
disperse other materials.
It is a common misconception that higher sonication power automatically leads to increased
efficiency, which is not the case. Certain sonochemically driven reactions, such as the oxidation of
iodide, have a maximum intensity value which gives the highest yield. At intensities higher than this
maximum value, the yield is heavily reduced. This is attributed to the change in cavitation
conditions191. All sonochemical applications require the optimisation of reaction conditions, such as
the total time sonicating and amplitude. A suitable sized probe should also be used. The power
delivered to the solution is dependent on probe size and amplitude. Selecting a suitable probe will
prevent splashing or foaming of the liquid, allowing maximum power to be delivered to the solution.
A photograph of a lab-scale sonicator is shown in Fig 1.10. It consists of a transducer, which converts
electrical energy into mechanical vibration via the reverse piezoelectric effect; this travels through
the probe to the tip, which rapidly expands and contracts rapidly based on the amplitude chosen by
the user. Expansion and contraction of the tip causes cavitation. The diagram shows a sonicator
equipped with a ½” tip. Larger or smaller probes may be chosen based on the sample size.
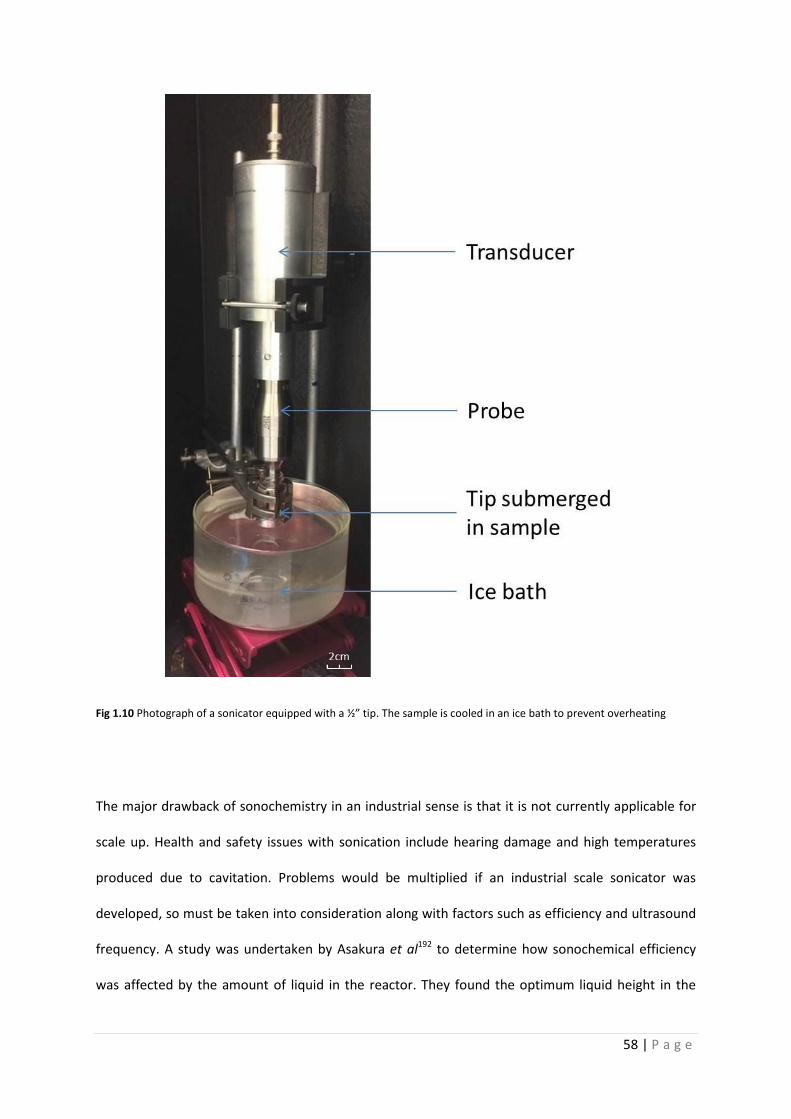
58 | P a g e
Fig 1.10 Photograph of a sonicator equipped with a ½” tip. The sample is cooled in an ice bath to prevent overheating
The major drawback of sonochemistry in an industrial sense is that it is not currently applicable for
scale up. Health and safety issues with sonication include hearing damage and high temperatures
produced due to cavitation. Problems would be multiplied if an industrial scale sonicator was
developed, so must be taken into consideration along with factors such as efficiency and ultrasound
frequency. A study was undertaken by Asakura et al192 to determine how sonochemical efficiency
was affected by the amount of liquid in the reactor. They found the optimum liquid height in the
59 | P a g e
reactor was approximately 15 times the height of the wavelength, with the ideal frequency being
200-600kHz. Lower frequencies mean too few bubbles for cavitation are formed, whereas greater
frequencies result in many bubble collisions189. Bubble collisions lead to coalescence, where
adiabatic compression leads to internal bubble temperatures being lower than that of smaller
bubbles193.
Another factor why current sonicator probes are not available for industrial scale-up is that they are
designed in a tapering fashion, where power is concentrated at a small tip. This leads to an uneven
cavitation field around the probe, meaning an uneven distribution of ultrasound187. The efficiency
has been shown to be better with a more evenly distributed cavitation zone. Wei et al194 designed a
multi-stepped ultrasonic probe. They demonstrated that regular probes deliver the highest acoustic
power in a small area below the probe, whereas their novel multi-stepped probe provided several
high-power regions. Improved probe design can be combined with optimal reactor geometry195,196
and favourable operating conditions178,179,192 to suit industrial scale reactions. Industrial scale
sonicators will be more efficient than the currently used homogenisers, which require numerous
passes to achieve nanosized droplets197.
Due to the high power, speed of reaction and efficiency that sonicators deliver, it is clear they can be
a powerful tool for improving the properties of PCMs. By creating miniemulsions, PCM loaded
nanocapsules may be formed. It is also possible for ultrasonic probes to be scaled up in the near
future, as long as several factors of practicality and safety are taken into account. Polymerisation
reactions based on emulsion chemistry will now be discussed.
1.8.3 Polymerisation
Capsules have found many uses in chemical industry, such as in food technology198,199, dyes200,
catalysis201,202, corrosion inhibitors203,204 and drug delivery205–209. Their main purpose is to provide
60 | P a g e
protection for the core material from the external environment. Encapsulation is found throughout
nature, for example egg shells and cell membranes. Synthesised capsules can be used to encapsulate
many species, including drugs, enzymes210, PCMs and DNA211,212. They can also be used as a reaction
medium, for example Kang et al showed the rate of a Diels-Alder reaction could be rapidly sped up
due to the vastly increased concentration of reactants inside the capsule44. Other interesting effects
can be achieved using capsules. Capsules can be used to prevent corrosion203,204,213, self-heal214,215
and ‘switch on’ catalysts202.
With technological advances over the last half century, preparing capsules with diameters from
1000µm down to around 40nm has become possible. Searching the literature using Web of Science,
the first mention of microcapsules is from 1964 where Chang reported the encapsulation of
enzymes216. Nanocapsules are referenced from 1976 onwards, with an early example being Couvreur
et al, who demonstrated how polyacrylamide capsules 200nm in diameter could encapsulate
fluorescein217. Capsule size can play a role in functionality. For instance, in drug delivery nanosized
drug-loaded capsules have advantages over regular drugs. Certain membranes in the body only
allow diffusion of molecules less than 100nm218, and specific locations in the body can be targeted
by specific particles219–221. Particle size is important for thermal energy storage materials due to its
effect on thermal properties. Particle size is determined by factors including stirring rate of the
emulsion, emulsifier content, initiators, core-to-shell ratio, polymerisation temperature and reaction
time222.
The interest in extremely small capsules is essentially an attempt to increase the surface-area-to-
volume ratio (SA/V) of the active material. Increasing SA/V is the driving force for all nanotechnology
and is inspired nature. The best example of enormous SA/V is the supercoiling of DNA – if uncoiled,
the total length of DNA in one human body would be approximately twice the diameter of our solar
system. A good example of increasing SA/V in technology is computer chips – the size of chips has
rapidly decreased in accordance with the famous Moore’s Law, allowing faster processing and
61 | P a g e
improved data storage. It has recently been proven that single atom data storage is possible by
producing stable single atom magnets223. Higher SA/Vs give increased efficiency, for instance more
finely ground substances will dissolve more quickly in a solvent. Along with increased SA,
nanocapsules provide increased structural stability compared to microcapsules, which may break
whilst being pumped round a system169,224,225.
Many shell materials can be used to fabricate capsules. Most often, polymers are used due to their
attractive mix of strength and flexibility226. As many different polymers can be used as shell material,
it also allows scientists to select specific properties. Polymers have various inherent properties such
as differing glass transition and melting temperatures and thermal conductivities. They may be
hydrophilic, hydrophobic or amphiphilic. Typical polymers used as capsule shell material are
polyurethane, polyurea, poly(methyl methacrylate), poly(lactic acid) and poly(alkyl cyanoacrylates).
Polyurethane and polyurea are possibly the most ideal shell material, due to their good thermal
resistance, chemical stability and their insolubility in many common solvents including water.
A problem with the adaptation of encapsulation methods to create PCM loaded capsules is that
capsules are often used as a delivery mechanism. As a result, most capsules prepared are either
deliberately designed for short lifetimes, or long lifespan may just not be taken into account. For
instance, drug delivery capsules have shells designed to purposely degrade over a period of time for
sustained release. Selection of shell materials is therefore important. As an example of lifetime
requirements, a PCM incorporated into a building wall for air conditioning requires a life of at least
20 years. Assuming 1 melting/freezing cycle per day, the material must be stable for around 7300
cycles. Polymers are often very durable, so long lifetimes are possible although it is more difficult
when a capsule shell may be only a few nanometres thick. If extended stability cannot be achieved, a
postulated solution is the use of self-healing capsules. There a numerous examples in the literature
of self-healing capsules which contain shell material in the core (e.g. diisocyanate in the core of a PU
capsule227). The self-healing material is released when the shell is damaged. It may be possible to
62 | P a g e
combine this effect with PCMs in the capsule core to provide a longer lasting heat storage material.
Self-healing materials will often be organic. Therefore, for a regular encapsulation reaction, only
organic PCMs such as paraffin wax could be combined. The development of multi-compartmental
capsules228 may be of interest in order to use inorganic PCMs such as salt hydrates for heat storage
in conjunction with self-healing.
There have been many reported techniques for creating micro- and nanocapsules. These include
spray-drying229,230, miniemulsion polymerisation231,232, precipitation of pre-formed polymers233, layer-
by-layer assembly (LbL)203,210, or other more advanced polymerisation reactions such as radical
addition-fragmentation chain-transfer (RAFT)234 and the creation of dendrimers235. Each of these
techniques has their own advantages and disadvantages. While the deposition of pre-formed
materials is a simple process, polymerisation reactions are generally more useful, as polymers of
desired properties can be formed175.
LbL is an interesting approach for its precise control over shell thickness. Oppositely charged
polyelectrolyte layers are deposited successively236. Layers are generally a few nanometres thick,
therefore simply by altering the number of layers deposited, a shell of desired thickness can be
formed. The deposition can be easily followed by making zeta potential measurements, which will
change from positive to negative based on the previous layer deposited. Sodium polystyrene
sulfonate (PSS) and polyallylamine hydrochloride (PAH) are typical polyelectrolytes used for LbL, as
polyanion and polycation, respectively. Often a sacrificial core is used as a template for deposition.
The core can be dissolved once the desired shell thickness is achieved, leaving hollow capsules which
can be loaded with a target material. Despite the simplicity of this method, the large numbers of
steps required make it difficult for scale-up. Polyelectrolyte shells synthesised by LbL result in semi-
permeable membranes which can allow smaller molecules to pass in and out, while large molecules
such as proteins cannot diffuse across237.

63 | P a g e
Polymerisation using a miniemulsion template is generally accepted to be the most reliable way to
produce small capsules, especially when working in the nanometre size range. It is also feasible for
scale up to industrial production197, and requires less steps than methods such as LbL238. Traditional
emulsion polymerisation is a type of free radical polymerisation, where polymerisation is started by
radicals which enter monomer droplets239. By producing a miniemulsion, monomer droplets become
much smaller (around 100nm compared to 1-10µm). This gives a far greater surface area, and
therefore a better chance of radical initiation. The miniemulsion therefore provides an enormous
number of parallel reactions – taking place inside 1018-1020 nanodroplets240. Two other important
types of polymerisation for encapsulating materials benefit from the use of miniemulsions.
Miniemulsion droplets provide a template for the polymer shell to form. They are: interfacial
polymerisation, where each of the dispersed and continuous phases contains a different monomer;
and in situ polymerisation, where the monomer is only present in the continuous phase. Many
examples of encapsulated PCMs appear in the literature.
64 | P a g e
1.9 Organic and Inorganic PCM Encapsulation – A Review
As mentioned previously, containment is crucial in giving PCMs the desirable properties for wide-
scale use. PCM capsules provide the previously mentioned improvements compared to bulk PCMs,
such as prevention of leakage, increased heat transfer area and decreased interaction with the
external environment. Capsules come in various sizes, in the range of centimetres or millimetres
(macroencapsulation), micrometres (microencapsulation) or nanometres (nanoencapsulation). As
stated earlier, nanocapsules are most desirable due to the huge increase in surface-to-volume ratio,
leading more pronounced improvements in heat transfer and structural strength. Various
encapsulated PCM products are already on the market, although none are nanocapsules. The
earliest example of an encapsulated PCM was a simulation by Theunissen and Buchlin241, who
determined a PCM storage system utilising CaCl2.6H2O would require a volume 5 times less than that
of an SHS rock bed, in order to store an equal amount of energy. The encapsulation process for that
study simply consisted of a large tank, however modern technology allows for the fabrication of
PCM capsules at the nanoscale. The positive effects of encapsulation have been proven with a huge
number of journal articles on the encapsulation of paraffin waxes242–245. The most successful
techniques for the fabrication of PCM-loaded capsules have been polymerisation reactions based on
miniemulsions; these are miniemulsion, in situ and interfacial polymerisations, as described on the
previous page.
1.9.1 Encapsulation of Organic PCMs
Much research has been done on the encapsulation of PCMs, mostly using paraffin wax as a core
material. Paraffins must be contained due to potential reaction with external environment, difficulty
in handling, large volume changes during melting, and their flammability. Additional fire retardant
materials may also be added to the capsules105. Paraffin waxes have several advantages over salt
65 | P a g e
hydrates when it comes to their encapsulation. Firstly, O/W emulsions are more easily formulated.
O/W emulsions are well researched; for example, it is well known sodium dodecyl sulphate (SDS,
also known as sodium lauryl sulphate) can emulsify oils into aqueous solution, and is found in many
common domestic cleaning products and is registered safe for use in food. Water being used as the
continuous phase for O/W emulsions means costs are low. Paraffin waxes are comparatively easy to
encapsulate compared to salt hydrates. Research into encapsulated paraffin waxes has proven the
benefits of encapsulation in solving problems associated with PCMs.
Several researchers have synthesised capsules using melamine-formaldehyde or urea formaldehyde
shells. The potential release of toxic formaldehyde into the environment means these shell materials
are not suitable for use246, especially as there are many inert and non-toxic polymer materials
available to replace them.
Felix et al32,246 fabricated docosane loaded microcapsules using PU as shell material. The capsules
were stable over at least 100 cycles. They also found that by modifying homogenisation speed
during the emulsion forming phase, capsules of different sizes could be made. An interesting effect
was that the smaller capsules displayed higher latent heat compared with larger capsules. These
effects show the benefits of reduced capsule size, resulting in higher encapsulation efficiency.
Increased heat transfer to the core material also contributes to maximise latent heat. Another effect
they found with decreasing capsule size was the distinct appearance of multiple crystalline phases
during freezing. Spatial confinement clearly has a significant effect on PCM behaviour.
Zhang and collaborators247 noted monomer effects on encapsulation. They used tolylene
diisocyanate along with amines as crosslinkers for polyurea shell formation. Amines used were
ethylene diamine, diethylene triamine and Jeffamine (amine-terminated polyoxypropylene). Longer
chain amines formed capsules of larger diameter, along with better coverage of the core material.
The authors state this is due to the hydrophilic amines requiring migration into the oil phase to react
with the diisocyanate. Longer chains mean slower diffusion processes and so the emulsion remains
66 | P a g e
more stabilised during reaction. Due to the more complete coverage of shell material, the larger
capsules had a higher EE and improved latent heat. Monomer selection is therefore an important
factor to consider when fabricating PCM loaded capsules.
There have been several studies using acrylates as monomers for the polymerisation reactions.
Acrylate-based polymers are particularly suitable for PCM encapsulation as they are softer than
other polymers such as polystyrene. Increased flexibility allows them to withstand the volume
changes of the solid-liquid transition. Yang et al248 synthesised PMMA, poly(ethyl methacrylate)
(PEMA) and polystyrene microcapsules containing tetradecane using in situ polymerisation, and
found the acrylate capsules performed far better with regards to heat storage. Zhang et al224 also
made PEMA and PMMA capsules, but used sonication in order to perform a miniemulsion
polymerisation. This resulted in nanocapsules 100-150nm in size, and encapsulated octadecane with
a high efficiency of 89-95%. Both sets of researchers noted that supercooling of the paraffin was
reduced once encapsulated. Sari et al249 proved the durability of PEMA and PMMA capsules. They
encapsulated nonadecane with 60.3% encapsulation efficiency (EE), with only a 5% loss in latent
heat after 5000 cycles.
It has also been possible to synthesise capsules with full and partial inorganic shells. Yin et al226 made
a hybrid SiO2/polystyrene/poly(divinyl benzene) shell using a Pickering emulsion template, resulting
in capsules of approximately 100µm diameter. Modified SiO2 particles were used as stabiliser and,
due to the presence of -C=C groups on their surface, became embedded in the shell by covalent
bonding. Other researchers have reported forming a full SiO2 shell by hydrolysing tetraethyl
orthosilicate (TEOS) to create an encapsulation precursor. This gave capsules of 8-15µm and a high
encapsulation efficiency up to 87.5%250. Sol-gel processes can also be used to encapsulate paraffins
with hydrolysed TEOS251. The authors reported capsules of 7-16µm, and noted the microcapsule
thermal conductivity was 0.621Wm-1K-1 compared with 0.151Wm-1K-1 for bulk octadecane. They also
67 | P a g e
showed the silica shell has a conductivity of 1.296Wm-1K-1, compared with polymers which are
around 0.20Wm-1K-1.
Although silica shells have given some promising results, especially with regards to thermal
conductivity enhancement, their long-term stability is brought into question due to their brittleness.
Despite good thermal and chemical stability, they may fracture due to stress brought about by PCM
volume change. Besides, it is possible to impregnate polymer capsules with thermally conductive
nanoparticles to increase thermal conductivity, without sacrificing shell flexibility.
Despite the great progress made with organic PCMs and their ongoing research, their low thermal
conductivity and high cost mean other large-scale energy storage materials must be sought.
Another issue to consider with the encapsulation and general use of organic PCMs is the possible
release of carbon into the environment upon degradation. Encapsulated carbon release is an
unknown quantity in environmental studies and may lead to unwanted side effects such as soil
erosion252.
1.9.2 Encapsulation of Inorganic PCMs
The major focus of the project that is the subject of this thesis was to nanoencapsulate salt hydrates
and analyse their thermal storage abilities. It is important to account for historical and current
research, to understand advantages and problems associated with their use. Several researchers
have used salt hydrates in their bulk state for use in energy storage. More recently, some successful
attempts at making salt hydrate capsules on the micro- and nanoscale have been achieved. Salt
hydrates are difficult to encapsulate due to their hydrophilicity, tendency to alter water content and
surface polarity253,254. Further added to these issues is their general chemical instability, which is well
documented34,255–259. Another problem is that of washing and drying the capsules. Vacuum drying is
not suitable as it may dehydrate the crystallohydrate core and therefore alter its TM. Encapsulation
68 | P a g e
can promote improved stability due to effects described above, such as confinement of
stoichiometry and improved heat transfer to decrease supercooling. It also acts as a barrier to
prevent water loss from the crystallohydrate core, maintaining thermal characteristics. Ideal phase
change behaviour for inorganic PCM capsules is described in Fig 1.11. Encapsulation of inorganic
PCMs is currently more expensive than organic PCMs, due to the large amount of organic solvents
required to form W/O emulsions260. The use of organic solvents may also be regulated due to health
and safety concerns, so may not be suitable for industrial use261,262. It may be possible in future to
reduce these costs by using waste products from industry, such as vegetable or other bio oils. The
enhanced properties of inorganic PCMs compared with organics make further research into their
encapsulation highly beneficial. Techniques to make aqueous core nanocapsules as cost effective as
possible should be developed to maximise the benefit of energy storage using inorganic PCMs.
Methodology for encapsulating salt hydrates requires a high EE to maximise heat storage potential.
This is dependent on a good emulsification step263, and also the viscosity of the continuous and
dispersed phases. Increase in dispersion viscosity can prevent migration of the salt into the
continuous phase264. Other factors influencing EE include polymer concentration265,266, surfactant
concentration266,267, stirring rate during emulsification267,268 and temperature269,270.
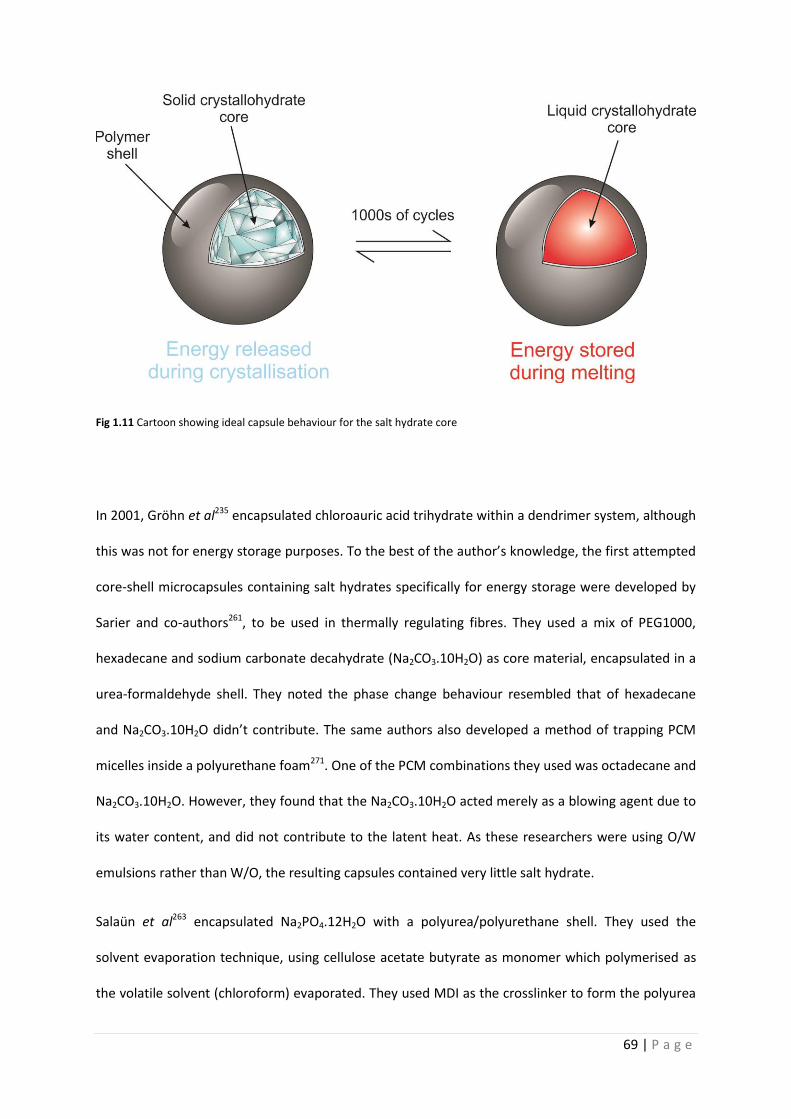
69 | P a g e
Fig 1.11 Cartoon showing ideal capsule behaviour for the salt hydrate core
In 2001, Gröhn et al235 encapsulated chloroauric acid trihydrate within a dendrimer system, although
this was not for energy storage purposes. To the best of the author’s knowledge, the first attempted
core-shell microcapsules containing salt hydrates specifically for energy storage were developed by
Sarier and co-authors261, to be used in thermally regulating fibres. They used a mix of PEG1000,
hexadecane and sodium carbonate decahydrate (Na2CO3.10H2O) as core material, encapsulated in a
urea-formaldehyde shell. They noted the phase change behaviour resembled that of hexadecane
and Na2CO3.10H2O didn’t contribute. The same authors also developed a method of trapping PCM
micelles inside a polyurethane foam271. One of the PCM combinations they used was octadecane and
Na2CO3.10H2O. However, they found that the Na2CO3.10H2O acted merely as a blowing agent due to
its water content, and did not contribute to the latent heat. As these researchers were using O/W
emulsions rather than W/O, the resulting capsules contained very little salt hydrate.
Salaün et al263 encapsulated Na2PO4.12H2O with a polyurea/polyurethane shell. They used the
solvent evaporation technique, using cellulose acetate butyrate as monomer which polymerised as
the volatile solvent (chloroform) evaporated. They used MDI as the crosslinker to form the polyurea
70 | P a g e
shell. Unfortunately, they provided no results displaying thermal energy storage characteristics or
accurate size measurements (only stating they were >1µm), although they did show the capsules
contained a large amount of salt, up to 79%. In further research, they investigated the influence of
the solvent on capsule properties. They found that changing the solvent for the dispersed and
continuous phases had a profound influence on the characteristics of the microcapsules. Using
chloroform as dispersed phase solvent instead of acetone facilitated the full coverage of the core
with shell material. Using toluene as continuous phase instead of carbon tetrachloride reduced the
rate of coacervation and produced better defined capsules. DSC results revealed most of the formed
capsules had incomplete crystallisation processes, meaning that by the 2nd thermal cycle, no latent
heat storage was possible. The most successful capsules were produced using toluene and
chloroform as solvents, and produced capsules with a latent heat of melting of 140.4 J·g-1. However,
the latent heat of crystallisation was only 48.9 J·g-1, suggesting long-term stability is not possible.
In another work, Salaün and co-authors272 also made polymer nanocapsules containing
Na2PO4.12H2O, and added these to microcapsules containing paraffin wax mixtures. They found the
addition of the nanoparticles decreased the thermal conductivity of the microcapsules, leading to a
wider range of the TM. They concluded this would have a positive effect for use as a ‘thermal barrier’.
It also shows how the low thermal conductivity of polymers can be a problem for LHS due to slower
melting and freezing characteristics. The article proved that it was possible to encapsulate salt
hydrates on the nanoscale, unfortunately no thermal data was provided for the salt hydrate
containing nanoparticles alone.
Huang and collaborators made two attempts at encapsulating salt hydrates253,273. They also used
Na2PO4.12H2O as core material. They used MMA as monomer, along with ethyl acrylate (EA) as
crosslinker. The shell was made by a suspension polymerisation combined with solvent evaporation.
They found that upon encapsulation the PCM was partially dehydrated to form Na2PO4.7H2O which
resulted in an increase in TM from 36ºC to 51ºC. They also made a follow up article273, where they
71 | P a g e
compared their PMMA/EA capsules to urea-formaldehyde (UF) ones. The PMMA demonstrated
much better thermal characteristics, with the UF capsules giving a very broad TM with a peak at 41ºC.
Broad TMs are unsuitable for practical when a narrow temperature range is required. They proved
the shell material prevents water loss from the encapsulated salt hydrate by thermogravimetry
measurements, therefore resisting dehydration and maintaining the TM. Importantly, upon
encapsulation the thermal conductivity was increased from 1.01Wm-1K-1 for pure Na2PO4.12H2O to
1.426Wm-1K-1 for the encapsulated Na2PO4.7H2O, an increase of 29%274.
Platte et al254 encapsulated different mixtures of sodium sulphate, sodium phosphate and sodium
carbonate which were hydrated by dissolving in water. They used a surface-thiol Michael addition
polymerisation using ORMOCER polymers as shell material, which are biodegradable inorganic-
organic hybrid polymers developed by Fraunhofer ISC. ORMOCERs are impermeable to water, which
can be of great benefit to encapsulated salt hydrates to maintain the desired hydration state.
Formed capsules were around 40µm in diameter. They noted the difficulty in maintaining the
hydration state of the encapsulated crystallohydrates even when the shell formed has no defects,
due to water permeation through the shell. Supercooling was still a problem, showing the
microcapsules did not sufficiently improve heat transfer.
Schoth et al275 developed a surfactant free method to encapsulate sodium sulphate decahydrate.
They utilised the Pickering emulsion technique to create the initial emulsion. They made
polyurethane nanocapsules with an average size of 750-1000nm, the first time a silica stabilised
capsule had been made in that size range. It was shown that Na2SO4.10H2O could be encapsulated
up to 20%wt, which is its solubility limit in water.
An interesting approach for salt hydrate encapsulation was the use of nanobowls, consisting of an
SiO2 matrix impregnated with Na2SO4.10H2O276. The formation of the unusual bowl shape is due to
non-synchronous rotation of droplets caused by viscosity differences between the liquid and solid
phases. Of course, the SiO2 matrix improved conductivity of the PCM, as well as reducing phase
72 | P a g e
separation. The sample also had high latent heat of 180.7 J·g-1 which was relatively unchanged after
60 cycles. However, supercooling was only marginally reduced.
One company, Capzo, has made commercial salt hydrate capsules known as Thermusol277, showing
future large scale developments in this area are viable. Despite this recent progress in encapsulating
salt hydrates, issues remain with regards to their long-term stability, thermal characteristics and the
expense and scale-up of encapsulation methodology.
High-temperature PCM encapsulation is also currently being researched. Gimenez-Gavarell and
Fereres278 developed borosilicate macrocapsules for encapsulating sodium nitrate salt, and metallic
lead. The capsules performed well in the 300-400°C range, although some phase segregation was
observed during melting. They also simulated results, which agreed with those experimentally
determined. Smaller capsules will be developed in future. These high temperature PCMs are
especially important for CSP energy storage systems.
73 | P a g e
1.10 Current research
Research for this thesis was based around the encapsulation of salt hydrates for LHS. Simple
methods were sought, which may be scaled up in the future. Initial research focused on finding salt
hydrates suitable as core materials, i.e. could be solubilised in a W/O emulsion. Once materials
suitable for encapsulation were found, numerous methods were attempted for the creation of
crystallohydrate-loaded capsules. Low temperature PCMs were chosen for investigation due to ease
of handling and analysis.
We found numerous kinds of capsules with differing shell material could be formed once initial
miniemulsions had been created. The materials synthesised were tested according to their thermal
and chemical characteristics, paying specific attention to their stability over many thermal cycles.
Long-term stability is the single biggest issue with crystallohydrate PCMs, we postulated this could
be solved by nanoencapsulation, due to improved heat transfer and confinement of the PCM.
Capsule characteristics were compared to the bulk salt hydrates. Salt hydrate PCMs are good
candidates for use in low temperature applications such as passive air conditioning and thermal
management of batteries. Results detailed in this thesis may also be of use to researchers studying
other inorganic PCMs such as salts.

74 | P a g e
1.11 References
1 B. Xu, P. Li and C. Chan, Appl. Energy, 2015, 160, 286–307.
2 S. Sargunanathan, A. Elango and S. T. Mohideen, Renew. Sustain. Energy Rev., 2016, 64, 382–393.
3 N. S. Lewis and D. G. Nocera, Proc. Natl. Acad. Sci. U. S. A., 2006, 103, 15729–15735.
4 G. Walther, E. Post, P. Convey, A. Menzel, C. Parmesan, T. J. C. Beebee, J. Fromentin, O. Hoegh-Guldberg and F. Bairlein, Nature, 2002, 416, 389–395.
5 W. Thuiller, C. Albert, M. B. Araújo, P. M. Berry, M. Cabeza, A. Guisan, T. Hickler, G. F. Midgley, J. Paterson, F. M. Schurr, M. T. Sykes and N. E. Zimmermann, Perspect. Plant Ecol. Evol. Syst., 2008, 9, 137–152.
6 A. D. Barnosky, N. Matzke, S. Tomiya, G. O. U. Wogan, B. Swartz, T. B. Quental, C. Marshall, J. L. McGuire, E. L. Lindsey, K. C. Maguire, B. Mersey and E. A. Ferrer, Nature, 2011, 471, 51–57.
7 G. McGranahan, D. Balk and B. Anderson, Environ. Urban., 2007, 19, 17–37.
8 M. Asif and T. Muneer, Renew. Sustain. Energy Rev., 2007, 11, 1388–1413.
9 M. I. Hoffert, K. Caldeira, G. Benford, D. R. Criswell, C. Green, H. Herzog, A. K. Jain, H. S. Kheshgi, K. S. Lackner, J. S. Lewis, H. D. Lightfoot, W. Manheimer, J. C. Mankins, M. E. Mauel, L. J. Perkins, M. E. Schlesinger, T. Volk and T. M. L. Wigley, Science, 2002, 298, 981–987.
10 D. Y. C. Leung, G. Caramanna and M. M. Maroto-Valer, Renew. Sustain. Energy Rev., 2014, 39, 426–443.
11 A. S. Arico, P. Bruce, B. Scrosati, J.-M. Tarascon and W. van Schalkwijk, Nat. Mater., 2005, 4, 366–377.
12 G. Girishkumar, B. McCloskey, A. C. Luntz, S. Swanson and W. Wilcke, J. Phys. Chem. Lett., 2010, 1, 2193–2203.
13 A. C. Dillon, K. M. Jones, T. A. Bekkedahl, C. H. Kiang, D. S. Bethune and M. J. Heben, Nature, 1997, 386, 377–379.
14 N. L. Rosi, J. Eckert, M. Eddaoudi, D. T. Vodak, J. Kim, M. O’Keeffe and O. M. Yaghi, J. Inorg. Organomet. Polym. Mater., 2003, 300, 1127–1129.
15 T. Ogasawara, A. Débart, M. Holzapfel, P. Novák and P. G. Bruce, J. Am. Chem. Soc., 2006, 128, 1390–1393.
16 J. S. Lee, S. T. Kim, R. Cao, N. S. Choi, M. Liu, K. T. Lee and J. Cho, Adv. Energy Mater., 2011, 1, 34–50.
17 Z. Peng, S. A. Freunberger, Y. Chen and P. G. Bruce, Science, 2012, 337, 563–566.
18 B. Lehner, G. Czisch and S. Vassolo, Energy Policy, 2005, 33, 839–855.
19 C. Zarfl, A. E. Lumsdon, J. Berlekamp, L. Tydecks and K. Tockner, Aquat. Sci., 2015, 77, 161–170.
20 H. Lund and G. Salgi, Energy Convers. Manag., 2009, 50, 1172–1179.
75 | P a g e
21 V. Siva Reddy, S. C. Kaushik, K. R. Ranjan and S. K. Tyagi, Renew. Sustain. Energy Rev., 2013, 27, 258–273.
22 J. Tsao, N. Lewis and G. Crabtree, US Dep. Energy, 2006, 1–24.
23 M. S. Dresselhaus and I. L. Thomas, Nature, 2001, 414, 332–7.
24 M. Grätzel, Nature, 2001, 414, 338–344.
25 M. M. Lee, J. Teuscher, T. Miyasaka, T. N. Murakami and H. J. Snaith, Science, 2012, 338, 643–648.
26 D. P. McMeekin, G. Sadoughi, W. Rehman, G. E. Eperon, M. Saliba, M. T. Horantner, A. Haghighirad, N. Sakai, L. Korte, B. Rech, M. B. Johnston, L. M. Herz and H. J. Snaith, Science, 2016, 351, 151–155.
27 J. Burschka, N. Pellet, S.-J. Moon, R. Humphry-Baker, P. Gao, M. K. Nazeeruddin and M. Grätzel, Nature, 2013, 499, 316–319.
28 S. H. Park, A. Roy, S. Beaupré, S. Cho, N. Coates, J. S. Moon, D. Moses, M. Leclerc, K. Lee and A. J. Heeger, Nat. Photonics, 2009, 3, 297–302.
29 L. Huo, T. Liu, X. Sun, Y. Cai, A. J. Heeger and Y. Sun, Adv. Mater., 2015, 27, 2938–2944.
30 I. Dincer, S. Dost and X. Li, Fuel Energy Abstr., 1997, 38, 435.
31 R. Tiskatine, R. Oaddi, R. Ait El Cadi, A. Bazgaou, L. Bouirden, A. Aharoune and A. Ihlal, Sol. Energy Mater. Sol. Cells, 2017, 169, 245–257.
32 P. Felix De Castro, A. Ahmed and D. G. Shchukin, Chem. - A Eur. J., 2016, 22, 4389–4394.
33 N. Nallusamy, S. Sampath and R. Velraj, Renew. Energy, 2007, 32, 1206–1227.
34 A. Abhat, Sol. Energy, 1983, 30, 313–332.
35 P. A. J. Donkers, L. C. Sögütoglu, H. P. Huinink, H. R. Fischer and O. C. G. Adan, Appl. Energy, 2017, 199, 45–68.
36 H. Ö. Paksoy, Thermal Energy Storage for Sustainable Energy Consumption, 2007.
37 Y. Kato, J. Nakahata and Y. Yoshizawa, J. Mater. Sci., 1999, 34, 475–480.
38 G. Ervin, J. Solid State Chem., 1977, 22, 51–61.
39 P. Pardo, A. Deydier, Z. Anxionnaz-Minvielle, S. Rougé, M. Cabassud and P. Cognet, Renew. Sustain. Energy Rev., 2014, 32, 591–610.
40 K. E. N’Tsoukpoe, H. Liu, N. Le Pierres and L. Luo, Renew. Sustain. Energy Rev., 2009, 13, 2385–2396.
41 K. Posern and C. Kaps, Thermochim. Acta, 2010, 502, 73–76.
42 M. Neises, S. Tescari, L. de Oliveira, M. Roeb, C. Sattler and B. Wong, Sol. Energy, 2012, 86, 3040–3048.
43 P. Pardo, A. Deydier, Z. Anxionnaz-Minvielle, S. Rougé, M. Cabassud and P. Cognet, Renew. Sustain. Energy Rev., 2014, 32, 591–610.
76 | P a g e
44 J. Kang and J. Rebek, Nature, 1997, 385, 50–52.
45 X. Du, H. Wang, Y. Wu, Z. Du and X. Cheng, J. Appl. Polym. Sci., 2017, 134, 1–8.
46 N. Javani, I. Dincer and G. F. Naterer, J. Power Sources, 2014, 268, 718–727.
47 P. Zhang, Z. W. Ma and R. Z. Wang, Renew. Sustain. Energy Rev., 2010, 14, 598–614.
48 B. Zalba, J. M. Marin, L. F. Cabeza and H. Mehling, Appl. Therm. Eng., 2003, 23, 251–283.
49 S. A. Mohamed, F. A. Al-Sulaiman, N. I. Ibrahim, M. H. Zahir, A. Al-Ahmed, R. Saidur, B. S. Yılbaş and A. Z. Sahin, Renew. Sustain. Energy Rev., 2017, 70, 1072–1089.
50 R. Naumann and H. H. Emons, J. Therm. Anal. Calorim., 1989, 35, 1009–1031.
51 M. Kenisarin and K. Mahkamov, Sol. Energy Mater. Sol. Cells, 2016, 145, 255–286.
52 L. F. Cabeza, J. Illa, J. Roca, F. Badia, H. Mehling, S. Hiebler and F. Ziegler, Mater. Corros., 2001, 52, 140–146.
53 F. C. Porisini, Sol. Energy, 1988, 41, 193–197.
54 K. Nagano, K. Ogawa, T. Mochida, K. Hayashi and H. Ogoshi, Appl. Therm. Eng., 2004, 24, 221–232.
55 E. Oró, a. de Gracia, a. Castell, M. M. Farid and L. F. Cabeza, Appl. Energy, 2012, 99, 513–533.
56 H. S. Ge, H. Y. Li, S. F. Mei and J. Liu, Renew. Sustain. Energy Rev., 2013, 21, 331–346.
57 T. Nomura, N. Okinaka and T. Akiyama, ISIJ Int., 2010, 50, 1229–1239.
58 K. Ma and J. Liu, Front. Energy Power Eng. China, 2007, 1, 384–402.
59 H. Ge and J. Liu, Front. Energy, 2012, 6, 207–209.
60 C. Rathgeber, H. Schmit, P. Hennemann and S. Hiebler, Appl. Energy, 2014, 136, 7–13.
61 C. Alkan and A. Sari, Sol. Energy, 2008, 82, 118–124.
62 Y. Hong and X. Ge, Sol. Energy Mater. Sol. Cells, 2000, 64, 37–44.
63 A. Sari, C. Alkan, A. Karaipekli and A. Önal, Energy Convers. Manag., 2008, 49, 373–380.
64 A. Sari, C. Alkan, U. Kolemen and O. Uzun, J. Appl. Polym. Sci., 2006, 101, 1402–1406.
65 B. J. Manning, P. R. Bender, S. A. Cote, R. A. Lewis, A. R. Sakulich and R. B. Mallick, Sustain. Cities Soc., 2015, 19, 11–16.
66 M. T. Johansson and M. Söderström, Energy Effic., 2014, 7, 203–215.
67 R. I. Dunn, P. J. Hearps and M. N. Wright, Proc. IEEE, 2012, 100, 504–515.
68 H. L. Zhang, J. Baeyens, J. Degrève and G. Cacères, Renew. Sustain. Energy Rev., 2013, 22, 466–481.
69 A. Fernández-García, E. Zarza, L. Valenzuela and M. Pérez, Renew. Sustain. Energy Rev., 2010, 14, 1695–1721.
77 | P a g e
70 D. R. Mills and G. L. Morrison, Sol. Energy, 2000, 68, 263–283.
71 I. Llorente García, J. L. Álvarez and D. Blanco, Sol. Energy, 2011, 85, 2443–2460.
72 Y. Tian and C. Y. Zhao, Appl. Energy, 2013, 104, 538–553.
73 G. Morin, J. Dersch, W. Platzer, M. Eck and A. Häberle, Sol. Energy, 2012, 86, 1–12.
74 U. Pelay, L. Luo, Y. Fan, D. Stitou and M. Rood, Renew. Sustain. Energy Rev., 2017, 79, 82–100.
75 K. Vignarooban, X. Xu, A. Arvay, K. Hsu and A. M. Kannan, Appl. Energy, 2015, 146, 383–396.
76 C. K. Ho and B. D. Iverson, Renew. Sustain. Energy Rev., 2014, 29, 835–846.
77 P. D. Myers and D. Y. Goswami, Appl. Therm. Eng., 2016, 109, 889–900.
78 T. Bauer, N. Pfleger, N. Breidenbach, M. Eck, D. Laing and S. Kaesche, Appl. Energy, 2013, 111, 1114–1119.
79 M. M. Kenisarin, Renew. Sustain. Energy Rev., 2010, 14, 955–970.
80 M. Liu, W. Saman and F. Bruno, Renew. Sustain. Energy Rev., 2012, 16, 2118–2132.
81 J. Yagi and T. Akiyama, J. Mater. Process. Technol., 1995, 48, 793–804.
82 P. Blanco-Rodríguez, J. Rodríguez-Aseguinolaza, E. Risueño and M. Tello, Energy, 2014, 72, 414–420.
83 J. J. Park, D. P. Butt and C. A. Beard, Nucl. Eng. Des., 2000, 196, 315–325.
84 B. Ma, J. Li, Z. Xu and Z. Peng, Appl. Energy, 2014, 132, 568–574.
85 A. Datas, A. Ramos, A. Martí, C. del Cañizo and A. Luque, Energy, 2016, 107, 542–549.
86 D. Laing, C. Bahl, T. Bauer, D. Lehmann and W. D. Steinmann, Sol. Energy, 2011, 85, 627–633.
87 M. Ozturk and I. Dincer, Energy Convers. Manag., 2013, 76, 1061–1072.
88 N. Maruoka, T. Mizuochi, H. Purwanto and T. Akiyama, ISIJ Int., 2004, 44, 257–262.
89 L. Miró, J. Gasia and L. F. Cabeza, Appl. Energy, 2016, 179, 284–301.
90 M. A. Korzhuev and I. V. Katin, J. Electron. Mater., 2010, 39, 1390–1394.
91 S. Kumar, S. D. Heister, X. Xu, J. R. Salvador and G. P. Meisner, J. Electron. Mater., 2013, 42, 944–955.
92 Q. Li, R. He, J. Jensen and N. Bjerrum, Chem. Mater., 2003, 15, 4896–4915.
93 A. M. Khudhair and M. M. Farid, Energy Convers. Manag., 2004, 45, 263–275.
94 B. Zalba, J. M. Marín, L. F. Cabeza and H. Mehling, Int. J. Refrig., 2004, 27, 839–849.
95 S. A. Memon, Renew. Sustain. Energy Rev., 2014, 31, 870–906.
96 R. Kandasamy, X. Q. Wang and A. S. Mujumdar, Appl. Therm. Eng., 2008, 28, 1047–1057.
97 R. D. Weinstein, T. C. Kopec, A. S. Fleischer, E. D’Addio and C. A. Bessel, J. Heat Transfer,
78 | P a g e
2008, 130, 42405.
98 S. A. Khateeb, S. Amiruddin, M. Farid, J. R. Selman and S. Al-Hallaj, J. Power Sources, 2005, 142, 345–353.
99 Z. Ling, Z. Zhang, G. Shi, X. Fang, L. Wang, X. Gao, Y. Fang, T. Xu, S. Wang and X. Liu, Renew. Sustain. Energy Rev., 2014, 31, 427–438.
100 G. Jiang, J. Huang, Y. Fu, M. Cao and M. Liu, Appl. Therm. Eng., 2016, 108, 1119–1125.
101 N. O. Moraga, J. P. Xamán and R. H. Araya, Appl. Therm. Eng., 2016, 108, 1041–1054.
102 C. J. Smith, P. M. Forster and R. Crook, Appl. Energy, 2014, 126, 21–28.
103 M. C. Browne, B. Norton and S. J. McCormack, Renew. Sustain. Energy Rev., 2015, 47, 762–782.
104 T. Y. Kim, B. S. Hyun, J. J. Lee and J. Rhee, Aerosp. Sci. Technol., 2013, 27, 10–16.
105 S. Mondal, Appl. Therm. Eng., 2008, 28, 1536–1550.
106 N. Sarier and E. Onder, Thermochim. Acta, 2012, 540, 7–60.
107 X. Liu and Y. Lou, Fibres Text. East. Eur., 2015, 23, 63–67.
108 B. Nordell, 8 - Using ice and snow in thermal energy storage systems, Woodhead Publishing Limited, 2015, vol. 8.
109 D. V. Hale, M. J. Hoover and M. J. O’Neill, 1971, 232.
110 T. D. Swanson and G. C. Birur, Appl. Therm. Eng., 2003, 23, 1055–1065.
111 W. F. Wu, N. Liu, W. L. Cheng and Y. Liu, Energy Convers. Manag., 2013, 69, 174–180.
112 M. Pauken, N. Emis and B. Watkins, Sp. Technol. Appl. Int. FORUM - STAIF 2007, 2007, 880, 412–420.
113 B. A. Ying, Y. L. Kwok, Y. Li, Q. Y. Zhu and C. Y. Yeung, Polym. Test., 2004, 23, 541–549.
114 G. Nelson, Int. J. Pharm., 2002, 242, 55–62.
115 Y. Shin, D. I. Yoo and K. Son, J. Appl. Polym. Sci., 2005, 97, 910–915.
116 J. Kim and G. Cho, Text. Res. J., 2002, 72, 1093–1098.
117 C. Gao, K. Kuklane and I. Holmér, Eur. J. Appl. Physiol., 2011, 111, 1207–1216.
118 Y. Shin, D. I. Yoo and K. Son, J. Appl. Polym. Sci., 2005, 96, 2005–2010.
119 M. Kenisarin and K. Mahkamov, Renew. Sustain. Energy Rev., 2016, 55, 371–398.
120 H. Akeiber, P. Nejat, M. Z. A. Majid, M. A. Wahid, F. Jomehzadeh, I. Zeynali Famileh, J. K. Calautit, B. R. Hughes and S. A. Zaki, Renew. Sustain. Energy Rev., 2016, 60, 1470–1497.
121 N. Soares, J. J. Costa, A. R. Gaspar and P. Santos, Energy Build., 2013, 59, 82–103.
122 P. Schossig, H. M. Henning, S. Gschwander and T. Haussmann, Sol. Energy Mater. Sol. Cells, 2005, 89, 297–306.
79 | P a g e
123 V. V. Tyagi, S. C. Kaushik, S. K. Tyagi and T. Akiyama, Renew. Sustain. Energy Rev., 2011, 15, 1373–1391.
124 F. Ascione, N. Bianco, R. F. De Masi, F. de’ Rossi and G. P. Vanoli, Appl. Energy, 2014, 113, 990–1007.
125 D. Feldman, D. Banu, D. Hawes and E. Ghanbari, Sol. Energy Mater., 1991, 22, 231–242.
126 A. Sari, A. Karaipekli and K. Kaygusuz, Int. J. Energy Res., 2008, 32, 154–160.
127 L. Shilei, Z. Neng and F. Guohui, Energy Build., 2006, 38, 708–711.
128 F. Kuznik and J. Virgone, Appl. Energy, 2009, 86, 2038–2046.
129 F. Kuznik, D. David, K. Johannes and J. J. Roux, Renew. Sustain. Energy Rev., 2011, 15, 379–391.
130 S. H. Lee, S. J. Yoon, Y. G. Kim, Y. C. Choi, J. H. Kim and J. G. Lee, 2007, 24, 332–335.
131 J. Lei, J. Yang and E.-H. Yang, Appl. Energy, 2016, 162, 207–217.
132 A. G. Entrop, H. J. H. Brouwers and A. H. M. E. Reinders, Sol. Energy, 2011, 85, 1007–1020.
133 A. J. N. Khalifa and E. F. Abbas, Energy Build., 2009, 41, 407–415.
134 E. Oro, L. Miro, M. M. Farid and L. F. Cabeza, Int. J. Refrig., 2012, 35, 984–991.
135 M. Ahmed, O. Meade and M. A. Medina, Energy Convers. Manag., 2010, 51, 383–392.
136 M. Liu, W. Saman and F. Bruno, Appl. Energy, 2012, 92, 336–342.
137 L. Melone, L. Altomare, A. Cigada and L. De Nardo, Appl. Energy, 2012, 89, 339–346.
138 K. Dai, L. Lu, Q. Liu, G. Zhu, X. Wei, J. Bai, L. Xuan and H. Wang, Dalton Trans., 2014, 43, 6295–6299.
139 F. L. Tan and C. P. Tso, Appl. Therm. Eng., 2004, 24, 159–169.
140 P. Ramadass, B. Haran, R. White and B. N. Popov, J. Power Sources, 2002, 112, 606–613.
141 P. Ramadass, B. Haran, R. White and B. N. Popov, J. Power Sources, 2002, 112, 614–620.
142 K. Amine, J. Liu and I. Belharouak, Electrochem. commun., 2005, 7, 669–673.
143 Y. Zhang, C. Y. Wang and X. Tang, J. Power Sources, 2011, 196, 1513–1520.
144 S. A. Khateeb, M. M. Farid, J. R. Selman and S. Al-Hallaj, J. Power Sources, 2004, 128, 292–307.
145 H. A. Weakliem and D. Redfield, J. Appl. Phys., 1979, 50, 1491–1493.
146 E. Radziemska, Renew. Energy, 2003, 28, 1–12.
147 D. Du, J. Darkwa and G. Kokogiannakis, Sol. Energy, 2013, 97, 238–254.
148 M. J. Huang, P. C. Eames and B. Norton, Int. J. Heat Mass Transf., 2004, 47, 2715–2733.
149 M. J. Huang, P. C. Eames and B. Norton, Sol. Energy, 2006, 80, 1121–1130.

80 | P a g e
150 A. Hasan, S. J. McCormack, M. J. Huang and B. Norton, Sol. Energy, 2010, 84, 1601–1612.
151 A. Hasan, S. J. McCormack, M. J. Huang, J. Sarwar and B. Norton, Sol. Energy, 2015, 115, 264–276.
152 A. A. El-Sebaii, S. Al-Heniti, F. Al-Agel, A. A. Al-Ghamdi and F. Al-Marzouki, Energy Convers. Manag., 2011, 52, 1771–1777.
153 R. V Seeniraj, R. Velraj and N. L. Narasimhan, J. Sol. Energy Eng. Asme, 2002, 124, 243–249.
154 T. Oya, T. Nomura, M. Tsubota, N. Okinaka and T. Akiyama, Appl. Therm. Eng., 2013, 61, 825–828.
155 G.-Q. Qi, J. Yang, R.-Y. Bao, Z.-Y. Liu, W. Yang, B.-H. Xie and M.-B. Yang, Carbon N. Y., 2015, 88, 196–205.
156 Z. Chen, M. Gu and D. Peng, Appl. Therm. Eng., 2010, 30, 1967–1973.
157 X. Xiao, P. Zhang and M. Li, Appl. Energy, 2013, 112, 1357–1366.
158 C. Y. Zhao, W. Lu and Y. Tian, Sol. Energy, 2010, 84, 1402–1412.
159 Y. W. Zhang and a Faghri, Int. J. Heat Mass Transf., 1996, 39, 3165–3173.
160 F. Agyenim, P. Eames and M. Smyth, Sol. Energy, 2009, 83, 1509–1520.
161 M. Liu, N. H. S. Tay, S. Bell, M. Belusko, R. Jacob, G. Will, W. Saman and F. Bruno, Renew. Sustain. Energy Rev., 2016, 53, 1411–1432.
162 H. Michels and R. Pitz-Paal, Sol. Energy, 2007, 81, 829–837.
163 P. A. Galione, C. D. Pérez-Segarra, I. Rodríguez, A. Oliva and J. Rigola, Appl. Energy, 2015, 142, 337–351.
164 P. W. Stott, A. C. Williams and B. W. Barry, J. Control. Release, 1998, 50, 297–308.
165 S. S. Chandel and T. Agarwal, Renew. Sustain. Energy Rev., 2017, 67, 581–596.
166 D. Zeng and W. Voigt, Calphad Comput. Coupling Phase Diagrams Thermochem., 2003, 27, 243–251.
167 D. Zeng, C. Fang and S. Chen, Trans. Nonferrous Met. Soc. China, 2004, 14, 1192–1198.
168 A. Efimova, S. Pinnau, M. Mischke, C. Breitkopf, M. Ruck and P. Schmidt, Thermochim. Acta, 2014, 575, 276–278.
169 P. B. Salunkhe and P. S. Shembekar, Renew. Sustain. Energy Rev., 2012, 16, 5603–5616.
170 B. K. Paul and R. K. Mitra, J. Colloid Interface Sci., 2005, 288, 261–279.
171 K. Kundu and B. K. Paul, Colloids Surfaces a-Physicochemical Eng. Asp., 2013, 433, 154–165.
172 D. J. McClements, Soft Matter, 2012, 8, 1719.
173 L. C. Peng, C. H. Liu, C. C. Kwan and K. F. Huang, Colloids Surfaces A Physicochem. Eng. Asp., 2010, 370, 136–142.
174 N. Anton, J. P. Benoit and P. Saulnier, J. Control. Release, 2008, 128, 185–199.
81 | P a g e
175 J. P. Rao and K. E. Geckeler, Prog. Polym. Sci., 2011, 36, 887–913.
176 B. P. Binks, Curr. Opin. Colloid Interface Sci., 2002, 7, 21–41.
177 J. H. Schulman and J. Leja, Trans. Faraday Soc., 1954, 50, 598–605.
178 S. De La Rochebrochard, J. Suptil, J. F. Blais and E. Naffrechoux, Ultrason. Sonochem., 2012, 19, 280–285.
179 R. Xiao, Z. Wei, D. Chen and L. K. Weavers, Environ. Sci. Technol., 2014, 48, 9675–9683.
180 B. Teo, S. Prescott, M. Ashokkumar and F. Grieser, Ultrason. Sonochem., 2008, 15, 89–94.
181 J. H. Bang and K. S. Suslick, Adv. Mater., 2010, 22, 1039–1059.
182 T. J. Mason, Ultrason. Sonochem., 2000, 7, 145–9.
183 K. S. Suslick and G. J. Price, Annu. Rev. Mater. Sci., 1999, 29, 295–326.
184 K. S. Suslick and D. J. Flannigan, Annu. Rev. Phys. Chem., 2008, 59, 659–683.
185 H. Xu, B. W. Zeiger and K. S. Suslick, Chem. Soc. Rev., 2013, 42, 2555–67.
186 G. J. Price, Ultrason. Sonochem., 2003, 10, 277–283.
187 H. N. McMurray and B. P. Wilson, J. Phys. Chem. A, 1999, 103, 3955–3962.
188 E. J. Hart and A. Henglein, J. Phys. Chem., 1987, 91, 3654–3656.
189 P. Sathishkumar, R. V. Mangalaraja and S. Anandan, Renew. Sustain. Energy Rev., 2016, 55, 426–454.
190 S. I. Nikitenko, L. Venault, R. Pflieger, T. Chave, I. Bisel and P. Moisy, Ultrason. Sonochem., 2010, 17, 1033–1040.
191 M. Gutierrez and A. Henglein, J. Phys. Chem., 1990, 94, 3625–3628.
192 Y. Asakura, T. Nishida, T. Matsuoka and S. Koda, Ultrason. Sonochem., 2008, 15, 244–250.
193 A. Henglein and M. Gutierrez, J. Phys. Chem., 1990, 94, 5169–5172.
194 Z. Wei, J. A. Kosterman, R. Xiao, G. Y. Pee, M. Cai and L. K. Weavers, Ultrason. Sonochem., 2015, 27, 325–333.
195 S. I. Nikitenko, C. Le Naour and P. Moisy, Ultrason. Sonochem., 2007, 14, 330–336.
196 G. Cravotto, G. Omiccioli and L. Stevanato, Ultrason. Sonochem., 2005, 12, 213–217.
197 J. M. Asua, Prog. Polym. Sci., 2014, 39, 1797–1826.
198 B. F. Gibbs, Selim Kermasha, Inteaz Al, Int. J. Food Sci. Nutr., 1999, 50, 213–224.
199 A. Madene, M. Jacquot, J. Scher and S. Desobry, Int. J. Food Sci. Technol., 2006, 41, 1–21.
200 L. Cheng, W. He, H. Gong, C. Wang, Q. Chen, Z. Cheng and Z. Liu, Adv. Funct. Mater., 2013, 23, 5893–5902.
201 P. M. Arnal, M. Comotti and F. Schüth, Angew. Chemie - Int. Ed., 2006, 45, 8224–8227.

82 | P a g e
202 A. C. Bijlard, A. Hansen, I. Lieberwirth, K. Landfester and A. Taden, Adv. Mater., 2016, 28, 6372–6377.
203 D. G. Shchukin, M. Zheludkevich, K. Yasakau, S. Lamaka, M. G. S. Ferreira and H. Möhwald, Adv. Mater., 2006, 18, 1672–1678.
204 D. G. Shchukin and H. Möhwald, Adv. Funct. Mater., 2007, 17, 1451–1458.
205 A. P. Kafka, B. J. McLeod, T. Rades and A. McDowell, J. Control. Release, 2011, 149, 307–313.
206 D. Chitkara and N. Kumar, Pharm. Res., 2013, 30, 2396–2409.
207 S. Vrignaud, N. Anton, C. Passirani, J. P. Benoit and P. Saulnier, Drug Dev. Ind. Pharm., 2013, 39, 1706–1711.
208 J. Panyam and V. Labhasetwar, Adv. Drug Deliv. Rev., 2003, 55, 329–347.
209 C. E. Mora-Huertas, H. Fessi and A. Elaissari, Int. J. Pharm., 2010, 385, 113–142.
210 F. Caruso, D. Trau, H. Mo and R. Renneberg, 2011, 2324–2327.
211 H. Cohen, R. J. Levy, J. Gao, I. Fishbein, V. Kousaev, S. Sosnowski, S. Slomkowski and G. Golomb, Gene Ther., 2000, 7, 1896–1905.
212 H. Lomas, I. Canton, S. MacNeil, J. Du, S. P. Armes, A. J. Ryan, A. L. Lewis and G. Battaglia, Adv. Mater., 2007, 19, 4238–4243.
213 T. H. Tran, A. Vimalanandan, G. Genchev, J. Fickert, K. Landfester, D. Crespy and M. Rohwerder, Adv. Mater., 2015, 3825–3830.
214 S. R. White, N. R. Sottos, P. H. Geubelle, J. S. Moore, M. R. Kessler, S. R. Sriram, E. N. Brown and S. Viswanathan, Nature, 2001, 409, 794–797.
215 B. J. Blaiszik, N. R. Sottos and S. R. White, Compos. Sci. Technol., 2008, 68, 978–986.
216 T. M. S. Chang, Science, 1964, 146, 524–525.
217 P. Couvreur, P. Speiser, P. Tulkens, M. Roland and A. Trouet, FEBS Lett., 1977, 84, 323–326.
218 J. Ballenger and R. Post, Am. J. Psychiatry, 1980, 137, 782–790.
219 A. K. Gupta and M. Gupta, Biomaterials, 2005, 26, 3995–4021.
220 S. M. S. M. Moghimi, A. C. A. C. Hunter and J. C. J. C. Murray, Pharmacol. Rev., 2001, 53, 283–318.
221 J. Rytkönen, R. Miettinen, M. Kaasalainen, V. P. Lehto, J. Salonen and A. Närvänen, J. Nanomater., 2012.
222 T. Khadiran, M. Z. Hussein, Z. Zainal and R. Rusli, Sol. Energy Mater. Sol. Cells, 2015, 143, 78–98.
223 F. D. Natterer, K. Yang, W. Paul, P. Willke, T. Choi, T. Greber, A. J. Heinrich and C. P. Lutz, Nature, 2017, 543, 226–228.
224 G. H. Zhang, S. A. F. Bon and C. Y. Zhao, Sol. Energy, 2012, 86, 1149–1154.
83 | P a g e
225 A. Jamekhorshid, S. M. Sadrameli and M. Farid, Renew. Sustain. Energy Rev., 2014, 31, 531–542.
226 D. Z. Yin, L. Ma, J. J. Liu and Q. Y. Zhang, Energy, 2014, 64, 575–581.
227 J. Yang, M. W. Keller, J. S. Moore, S. R. White, N. R. Sottos, J. Yang, M. W. Keller, J. S. Moore, S. R. White and N. R. Sottos, 2008, 41, 9650–9655.
228 X. Huang and B. Voit, Polym. Chem., 2013, 435–443.
229 A. Soottitantawat, H. Yoshii, T. Furuta, M. Ohkawara and P. Linko, J. Food Sci., 2003, 68, 2256–2262.
230 A. Gharsallaoui, G. Roudaut, O. Chambin, A. Voilley and R. Saurel, Food Res. Int., 2007, 40, 1107–1121.
231 Y. W. Luo and X. D. Zhou, J. Polym. Sci. Part a-Polymer Chem., 2004, 42, 2145–2154.
232 F. Tiarks, K. Landfester and M. Antonietti, Langmuir, 2001, 17, 908–918.
233 U. Paiphansiri, P. Tangboriboonrat and K. Landfester, Macromol. Biosci., 2006, 6, 33–40.
234 R. H. Utama, M. H. Stenzel and P. B. Zetterlund, Macromolecules, 2013, 46, 2118–2127.
235 F. Gröhn, B. J. Bauer and E. J. Amis, Macromolecules, 2001, 34, 6701–6707.
236 A. P. R. Johnston, C. Cortez, A. S. Angelatos and F. Caruso, Curr. Opin. Colloid Interface Sci., 2006, 11, 203–209.
237 G. B. Sukhorukov, A. A. Antipov, A. Voigt, E. Donath and H. Mhwald, Macromol. Rapid Commun., 2001, 22, 44–46.
238 E. M. Rosenbauer, K. Landfester and A. Musyanovych, Langmuir, 2009, 25, 12084–12091.
239 J. M. Asua, Prog. Polym. Sci., 2002, 27, 1283–1346.
240 K. Landfester, J. Eisenblätter and R. Rothe, J. Coatings Technol. Res., 2004, 1, 65–68.
241 P.-H. Theunissen and J.-M. Buchlin, Sol. Energy, 1983, 31, 271–277.
242 A. Sari, C. Alkan, A. Karaipekli and O. Uzun, Sol. Energy, 2009, 83, 1757–1763.
243 K. Tumirah, M. Z. Hussein, Z. Zulkarnain and R. Rafeadah, Energy, 2014, 66, 881–890.
244 M. G. de Cortazar and R. Rodriguez, J. Appl. Polym. Sci., 2013, 127, 5059–5064.
245 Z. Zheng, J. Jin, G.-K. Xu, J. Zou, U. Wais, A. Beckett, T. Heil, S. Higgins, L. Guan, Y. Wang and D. Shchukin, ACS Nano, 2016, 10, 4695–4703.
246 P. Felix De Castro and D. G. Shchukin, Chem. - A Eur. J., 2015, 21, 11174–11179.
247 H. Zhang and X. Wang, Sol. Energy Mater. Sol. Cells, 2009, 93, 1366–1376.
248 R. Yang, H. Xu and Y. Zhang, Sol. Energy Mater. Sol. Cells, 2003, 80, 405–416.
249 A. Sari, C. Alkan, A. Biçer, A. Altuntaş and C. Bilgin, Energy Convers. Manag., 2014, 86, 614–621.
84 | P a g e
250 G. Fang, Z. Chen and H. Li, Chem. Eng. J., 2010, 163, 154–159.
251 H. Zhang, X. Wang and D. Wu, J. Colloid Interface Sci., 2010, 343, 246–255.
252 R. Lal, Environ. Int., 2003, 29, 437–450.
253 J. Huang, T. Y. Wang, P. P. Zhu and J. B. Xiao, Thermochim. Acta, 2013, 557, 1–6.
254 D. Platte, U. Helbig, R. Houbertz and G. Sextl, Macromol. Mater. Eng., 2013, 298, 67–77.
255 D. R. Biswas, Sol. Energy, 1977, 19, 99–100.
256 A. E. Fouda, G. J. G. Despault, J. B. Taylor and C. E. Capes, Sol. Energy, 1980, 25, 437–444.
257 M. M. Farid, A. M. Khudhair, S. A. K. Razack and S. Al-Hallaj, Energy Convers. Manag., 2004, 45, 1597–1615.
258 R. A. Taylor, N. Tsafnat and A. Washer, Appl. Therm. Eng., 2016, 93, 935–938.
259 D. C. Hyun, N. S. Levinson, U. Jeong and Y. A. Xia, Angew. Chemie-International Ed., 2014, 53, 3780–3795.
260 W. Su, J. Darkwa and G. Kokogiannakis, Renew. Sustain. Energy Rev., 2015, 48, 373–391.
261 N. Sarier and E. Onder, Thermochim. Acta, 2007, 452, 149–160.
262 C. Y. Zhao and G. H. Zhang, Renew. Sustain. Energy Rev., 2011, 15, 3813–3832.
263 F. Salaün, E. Devaux, S. Bourbigot and P. Rumeau, Carbohydr. Polym., 2008, 73, 231–240.
264 C. Yan, J. H. Resau, J. Hewetson, M. West, W. L. Rill and M. Kende, J. Control. Release, 1994, 32, 231–241.
265 R. Ghaderi, C. Sturesson and J. Carlfors, Int. J. Pharm., 1996, 141, 205–216.
266 Z. El Bahri and J. L. Taverdet, Powder Technol., 2007, 172, 30–40.
267 P. Sansdrap and A. J. Moës, Int. J. Pharm., 1993, 98, 157–164.
268 T. Mateovic, B. Kriznar, M. Bogataj and A. Mrhar, J. Microencapsul., 2002, 19, 29–36.
269 R. Jeyanthi, R. Mehta, T. BC and P. P. Deluca, J. Microencapsul., 1997, 14, 163–174.
270 G. Fundueanu, M. Constantin, E. Esposito, R. Cortesi, C. Nastruzzi and E. Menegatti, Biomaterials, 2005, 26, 4337–4347.
271 N. Sarier and E. Onder, Thermochim. Acta, 2007, 454, 90–98.
272 F. Salaün, E. Devaux, S. Bourbigot, P. Rumeau, P. O. Chapuis, S. K. Saha and S. Volz, Thermochim. Acta, 2008, 477, 25–31.
273 T. Wang, J. Huang, P. Zhu and J. Xiao, Colloid Polym. Sci., 2013, 291, 2463–2468.
274 Y. E. Milián, A. Gutiérrez, M. Grágeda and S. Ushak, Renew. Sustain. Energy Rev., 2017, 73, 983–999.
275 A. Schoth, K. Landfester and R. Muñoz-Espí, Langmuir, 2015, 31, 3784–3788.

85 | P a g e
276 J. Zhang, S. S. Wang, S. D. Zhang, Q. H. Tao, L. Pan, Z. Y. Wang, Z. P. Zhang, Y. Lei, S. K. Yang and H. P. Zhao, J. Phys. Chem. C, 2011, 115, 20061–20066.
277 M. Delgado, A. Lázaro, J. Mazo and B. Zalba, Renew. Sustain. Energy Rev., 2012, 16, 253–273.
278 P. Gimenez-Gavarrell and S. Fereres, Renew. Energy, 2017, 107, 497–507.

86 | P a g e
2. Results:
Solubilising
Salt Hydrates
in W/O
Emulsions

87 | P a g e
2.1 Introduction Salt hydrate PCMs have great potential for use in wide scale applications for thermal energy storage
and delivery. For practical use, they must be confined to a small volume to improve issues such as
supercooling and incongruent melting. To do so, an initial salt hydrate loaded emulsion must be
formed. Emulsions are the necessary first step for many encapsulation methods and may be used
without further processing for certain applications, although a more robust shell is often added.
Other encapsulation methods based on solid particle templates may be used, such as layer-by-layer
deposition. However, emulsions require less steps, can be formed on a large scale and can often use
cheap reactants. Emulsions are mixtures of a liquid dispersed through another liquid with which it is
not miscible or soluble. Emulsions consist of a continuous phase, and a dispersed phase which
consists of droplets dispersed through the continuous phase. For a hydrophobic active material, an
oil-in-water (O/W) emulsion is required. For a hydrophilic core, a water-in-oil (W/O) emulsion needs
to be created. Various types of emulsions are displayed in Fig 2.1. Salt hydrates are hydrophilic and
therefore a combination of oil and surfactant suitable for W/O emulsions is required. Our aim was to
solubilise as much water within the oil as possible, creating stable emulsions with nanometre sized
droplets. Emulsions with submicron droplets are known as mini- or microemulsions, depending on
the method of formation. Droplet size determines the size of any capsules which may be
subsequently formed, and is influenced by factors such as emulsifier content and stirring rate1. For
the synthesis of nanocapsules, nanometre sized droplets are a prerequisite. We wanted to use
nanomaterials for our PCM systems to achieve the highest possible heat transfer area.
Dispersed emulsion droplets require a stabiliser to solubilise them. Without a stabiliser, the oil and
water will separate due to gravitational energy reducing their surface energy according to their
relative densities, with the least dense material on top. Surfactants are the classic stabilisers for
emulsions. Stabilisers are necessary for long lasting emulsions, which can be stable for months or
years. The surfactants are usually soluble in the continuous phase and non- or sparingly soluble in
88 | P a g e
the dispersed phase2. They consist of a hydrophilic head group and a hydrophobic tail, which arrange
themselves according to the make-up of the solution. Surfactant stabilised emulsions have
applications such as soap and other cleaning products, and enhanced oil recovery3,4. Droplets
formed by the rearrangement of surfactants are known as micelles for O/W emulsions, and reverse
micelles for W/O emulsions (W/O emulsions are also known as ‘inverse’ emulsions). Surfactants are
often selected according to their hydrophile-lipophile balance (HLB), assigned based on the size and
number of each of the functional groups present in the surfactant chain5. Emulsions can either be a
precursor for the addition of a polymer shell material, or can be used as a delivery system itself.
Although surfactants are most often used as emulsions stabilisers, it is possible to replace them with
solid particles which adsorb onto the interface between the emulsion phases. These systems are
known as Pickering emulsions.
Water-in-oil-in-water (W/O/W) emulsions have often been employed as a template for aqueous
core capsules6. This consists of a W/O emulsion further dispersed in an aqueous phase. W/O/W
emulsions have the advantage of being able to introduce incompatible compounds into the same
system7. They are effective at protecting encapsulated active compounds from degradation
catalysed by light8 and enzymes9. Choice of emulsifiers is key in determining droplet size and
characteristics of the double emulsion10, as different surfactants are required to stabilise each of the
phases. Jager-Lezer et al11 found that drug release from the W/O/W droplets is achieved via a
swelling mechanism followed by oil droplet breakdown. The lipophilic surfactant had a profound
effect on behaviour, increasing its amount reduced drug release. By altering the amount of lipophilic
surfactant present, the rate of release could be controlled, which is highly beneficial for drug
delivery systems.
W/O/W emulsions have often been used in conjunction with poly(lactide-co-glycolide) (PLGA) as
shell material. The PLGA is preformed and added to the oil phase, which is then solubilised in the
external aqueous phase. The organic solvent is then removed by evaporation, leaving PLGA capsules
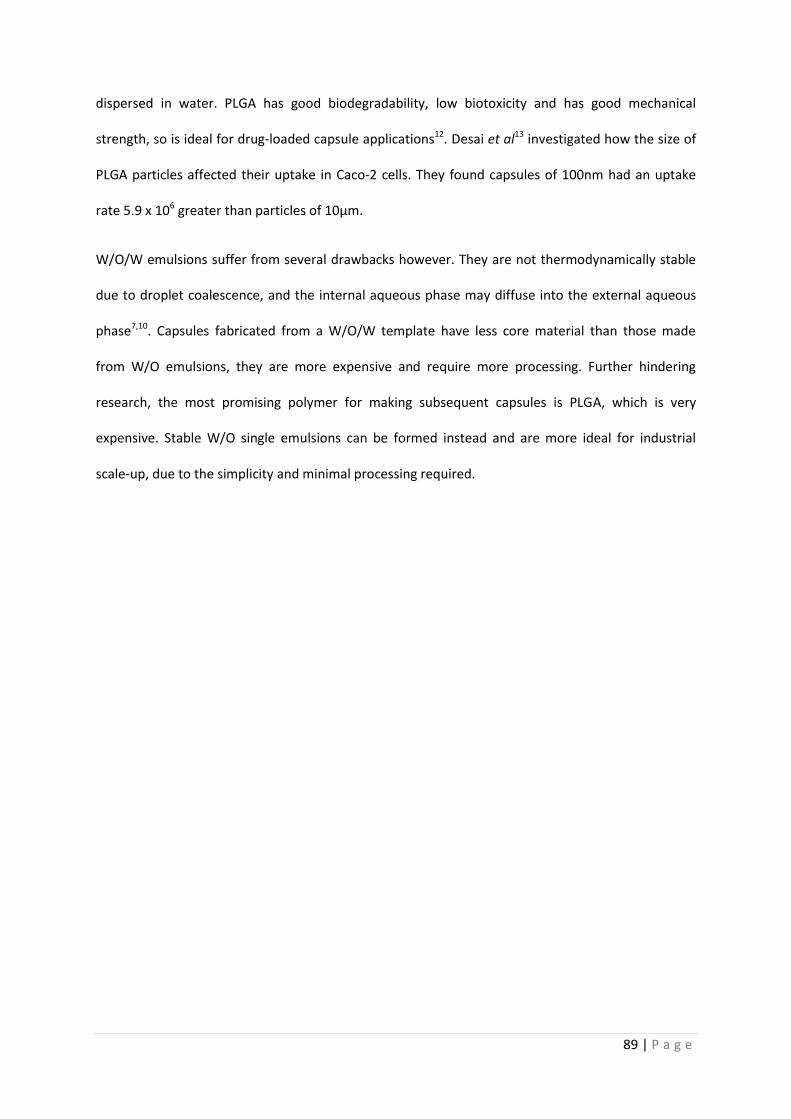
89 | P a g e
dispersed in water. PLGA has good biodegradability, low biotoxicity and has good mechanical
strength, so is ideal for drug-loaded capsule applications12. Desai et al13 investigated how the size of
PLGA particles affected their uptake in Caco-2 cells. They found capsules of 100nm had an uptake
rate 5.9 x 10⁶ greater than particles of 10µm.
W/O/W emulsions suffer from several drawbacks however. They are not thermodynamically stable
due to droplet coalescence, and the internal aqueous phase may diffuse into the external aqueous
phase7,10. Capsules fabricated from a W/O/W template have less core material than those made
from W/O emulsions, they are more expensive and require more processing. Further hindering
research, the most promising polymer for making subsequent capsules is PLGA, which is very
expensive. Stable W/O single emulsions can be formed instead and are more ideal for industrial
scale-up, due to the simplicity and minimal processing required.
90 | P a g e
Fig 2.1 Cartoon depicting various types of emulsion droplets, a O/W b W/O c W/O/W d W/O Pickering emulsion
Many researchers have investigated how to maximise solubility of the dispersed phase within
emulsions. Mini- and microemulsions are of great interest due to the nanometre sized droplets,
whereas regular emulsions consist of droplets of micrometre diameters. Mini- and microemulsions
differ in two ways: 1. Microemulsions are thermodynamically stable, miniemulsions are kinetically
stable 2. Microemulsions are formed spontaneously by low energy methods with droplet sizes
usually <100nm, miniemulsions by high energy shearing with droplet size of <300nm14. High shear is
required by miniemulsions to overcome surface tension effects to force droplets into the nanoscale
regimen2; microemulsions overcome this by use of a higher concentration of surfactants.
Miniemulsions can be formed using high energy methods, such as sonication. Final droplet size is
dependent on shearing rate or power, interfacial tension and the viscoelasticity of the emulsion
fluid15. Miniemulsions are also known as nanoemulsions, with the terms usually being
interchangeable16. However, some researchers describe nanoemulsions as a miniemulsion with
91 | P a g e
extremely small droplets <100nm2. Such small droplet sizes of mini- and microemulsions mean they
avoid coalescence, a common cause of instability in classical emulsions16.
To gauge the stability of mini- and microemulsions, several methods can be used. When W/O
emulsions reach their solubilisation threshold, it may be accompanied by a large increase in
electrical conductivity17,18. This percolation in conductance can be followed by measurements with a
conductivity meter. The easiest method of observing mini-/microemulsion stability however, is
simply looking at it by eye. When submicron droplets are formed, the solution will become
transparent or translucent, in contrast with a regular emulsion which will be cloudy19. The
transparency is due to very small particle size20. Using high energy input to form miniemulsions is
valuable due to the fast speed of processing.
A problem with the use of high energy inputs during the creation of miniemulsions is that it can
initiate possible degradation of the entrapped materials21. Low energy methods for microemulsion
formation, such as the phase inversion temperature (PIT) method are an alternative. PIT is a
phenomenon where an agitated O/W emulsion inverts to a W/O emulsion at a specific temperature.
This is due to several effects, such as non-ionic surfactants becoming more hydrophilic when heated.
Microemulsions are similar to miniemulsions but formed via low energy methods. However, these
systems are complex and must be formulated using deep knowledge of surfactant chemistry; a large
amount of surfactant is required to stabilise them. Due to the low energy methods used to form
microemulsions, they are available for industrial scale up22. However, using large amount of
surfactants proves problematic for processing and environmental reasons15. PIT requires good
thermal control; although this can be achieved on an industrial scale, it requires large amounts of
surfactant and a low solid content to produce nanometre-scale droplets. Increasing solid content of
the active material can lead to micron-sized droplets23, so the size of the subsequently formed
capsules is limited to µm.
92 | P a g e
The usage of surfactants as stabilisers presents some problems. For instance, in the formation of
polyurethane (PU), the hydrophilic alcohol monomer and the hydrophobic diisocyanate monomer
will react with many polar groups. Side reactions between these monomers and the surfactant may
occur, which may inhibit shell formation or weaken the shell24. To avoid this, other options may be
sought, such as the formation of a Pickering emulsion – an emulsion stabilised by solid particles
(often SiO2) rather than surfactants. However, these are not as stable or flexible as micelles
produced by surfactants. Another potential solution is to use ‘surfmers’, which are polymerizable
surfactants used as both emulsifier and monomer. These surfactants are then covalently anchored
within the shell, which provides additional strength and prevents permeability25. This approach can
be particularly useful during high shear processes, as it helps prevent surfactant desorption from
emulsion droplets. Surfmers suffer from several drawbacks however. They may need specific
synthesis, increasing costs; and highly reactive surfmers will require a higher concentration than
regular surfactants in order to stabilise emulsions26. We investigated both high energy (UltraTurrax
homogenisation, sonication) and low energy (vortex mixing, mechanical stirring) methods, to test
which gave stable emulsions. We anticipated the use of high energy input would be beneficial in
order to reduce the amount of surfactants required for stabilisation.
Pickering emulsions are named after S.U. Pickering, one of the first scientists to describe them27, and
are stabilised by solid particles rather than surfactants. They can be O/W or W/O depending on
wettability of the particles. Colloidal silica is the typical solid emulsifier chosen, however many other
particles can be used28. Wettability is a key property of the solid stabiliser; for hydrophobic particles
such as suitably treated silica, the contact angle is usually >90° and results in a W/O emulsion. For
hydrophilic particles such as metal oxides, the contact angle is usually <90° and results in the
formation of a O/W emulsion29. Although Pickering emulsions have been employed more rarely than
conventional emulsions, researchers have found potential applications for them. Pickering emulsions
avoid the drawbacks of using surfactants, such as irritancy or cytotoxicity found in some drug
delivery systems28. Frelichowska et al30 found that drug release from a Pickering emulsion was
93 | P a g e
slower compared with a conventional emulsion. A full coverage of the emulsion droplets with the
stabilising solid particles is crucial or leakage will occur. Pickering emulsions can also be used as a
template for polymerisation reactions31–33.
In the context of PCMs, the inorganic solid stabilisers inherent in Pickering emulsions are attractive
for their increased heat transfer. They have superior thermal conductivity in comparison with
polymers. Despite their positive attributes, Pickering emulsions suffer from some drawbacks which
will prevent their use with PCMs. First is that inorganic stabilisers are brittle, unlike their polymeric
counterparts. During thermal cycling, PCMs undergo many phase changes, with volume increase
during melting and decrease during solidification. This requires a flexible shell material; a Pickering
shell may become fractured. Pickering emulsions are also susceptible to destabilisation caused by pH
changes. Midmore34 found that after addition of either strong acid or strong base, flocculation
occurred in the emulsion. This was caused by acid/alkali catalysed cleavage of surface siloxane
groups. Nanosized droplets are also difficult to form with Pickering emulsions, often droplet size is in
the range of micrometres28. For the research presented in this thesis, we chose to use polymeric
surfactants as emulsifiers due to their low cost and effective stabilisation.
Many researchers have investigated ‘PCM emulsions’, which are PCMs solubilised within the core of
the dispersed emulsion droplets35. PCM emulsions have been of interest due to the simple one step
procedure, without the need for further reactions such as polymerisation. Due to their fluid state
and heat capacity greater than water, they are a good candidate as a HTF for a latent heat storage
system36. Additional sensible heat can also be stored by the continuous phase37. PCM emulsion
systems have been exclusively used with organic PCMs. A key property of phase change slurries
(including both PCM emulsions and PCM microcapsule slurries) is the supercooling. According to
nucleation theory, smaller volumes of material have a higher degree of supercooling38, as there is a
lower probability of any nucleating material required to start crystallisation being present35.
Although supercooling may be increased by decreasing particle size, other factors must be

94 | P a g e
considered. Nucleation is a random process, so supercooling is difficult to predict. In a miniemulsion,
each droplet requires a nucleation site, making simultaneous nucleation for the whole sample more
difficult39. Huang et al40,41 published two articles on PCM supercooling in emulsions. They found an
increase in supercooling for PCM emulsions compared to the bulk material. The authors suggest that
as the PCMs solidify in one emulsion droplet, the release of latent heat prevents nucleation at other
sites due to the increase in local temperature. It was also noted that supercooling was altered with
the use of different surfactants, due to the interaction of the surfactants with the PCM. Several
researchers have made PCM nanocapsules without an increase in the supercooling however.
Decreasing the droplet size can also have positive effects. Felix et al42 showed that decreasing
particle size has a profound effect on the core material, due to the confined volume and the
increased heat transfer. Smaller capsules had larger latent heat due to the increase in heat flow to
the core – PCM in the core therefore melted more uniformly and quickly. The confined volume also
produced more distinct phases of the PCM.
It is also possible that differential scanning calorimetry (DSC) measurements give overstated
supercooling values for some encapsulated PCM samples in the literature. As only small sample sizes
are used, supercooling may increase. Due to low thermal conductivity of PCMs, sample
temperatures will often not be uniform, potentially leading to inaccurate measurements.
Investigating the thermal properties of the same material on a larger scale may demonstrate
different properties. This is a factor that must be considered when determining the degree of
supercooling. Heating rate also affects the TM, so potential commercial PCMs should be tested at
heating rates that replicate the application. DSC using the T-history method can be applied for bulk
samples. Samples for this method are around 1000 times larger than regular DSC samples, which are
around 5-10mg. T-history is therefore better placed to demonstrate bulk properties, although it is
not as precise as regular DSC43. For T-history, a large amount of PCM is placed in a sample holder
with a thermocouple placed in the centre of the sample. As the sample undergoes thermal cycling,
95 | P a g e
sample temperature is measured as a function of time. Combining the two types of measurement
can be highly beneficial44.
As the degree of supercooling in crystallohydrates is already very high, we anticipate that confining
them to a small volume will be beneficial. The increased heat transfer, coupled with the higher
thermal conductivity of inorganic PCMs in comparison with paraffins, should mean supercooling is
reduced. As the crystallohydrate composition is confined, crystallisation may occur more freely. In
addition to higher heat transfer, smaller droplets also have the added benefit of reducing the
incidence of clogging any systems the PCMs may be used in. Zou and collaborators45 designed a
phase change emulsion with a working temperature of 80-90°C for use in domestic water heating
systems. They used small droplet sizes to avoid agglomeration and therefore prevent any clogging.
They also found that increasing the concentration from 20 %wt to 30 %wt of PCM, more
agglomeration occurred, increasing viscosity which required increased pumping power. The system
made less energy savings at 30 %wt compared to 20 %wt PCM due to this effect. Adding more PCM
to increase latent heat capacity leads to increased viscosity and potential clogging.
Metal nanoparticles have been formed from or encapsulated in miniemulsions in several studies,
and find use in applications such as heterogeneous catalysis, electrochemistry and sensing46,47.
Bonnet et al7 made W/O/W emulsions containing magnesium ions in order to treat magnesium
deficiency, showing the emulsions were fairly stable. Yin et al48 created bimetallic PdAu
nanoparticles using oleic acid and oleylamine as surfactants. The average particle size was 7.4nm,
achieving good monodispersity. Metal-containing compounds can also be synthesised or
encapsulated in emulsion droplets. Winkelmann and collaborators49 solubilised iron chloride within
reverse micelles. The addition of hydroxide ions leads to iron oxide formation within the droplet
cores, which could be precipitated as a nanosuspension once the water was removed by distillation.
Zhao and collaborators50 synthesised ZIF-8 metal organic framework nanocrystals within reverse
micelle droplets. They found that by adjusting the initial inverse miniemulsion parameters, such as

96 | P a g e
changing concentration of reactants, crystal size could be tuned. The ZIF-8 crystals were shown to be
useful for catalytic applications. From these studies, it is clear that W/O emulsions can solubilise
metal salts, including salt hydrates51.
97 | P a g e
2.2 Results - Microemulsions
O/W emulsions are well understood and simpler to formulate than W/O emulsions. For an O/W
emulsion, the continuous phase will always be water. For a W/O emulsion, a vast number of oils may
be used as continuous phase. Coupled with the need to select suitable surfactants, there are
essentially infinite combinations to choose from. Optimisation of W/O emulsions is subsequently
very time consuming. We chose surfactants based on numerous studies which had either looked at
optimising the water solubilisation capacity of W/O emulsions, or had been used as a precursor to
form polymer capsules.
The first surfactant we investigated to encapsulate salt hydrates was dioctyl sulfosuccinate sodium
salt, more commonly known as Aerosol OT (AOT). The molecular structure of AOT and various other
surfactants we used are shown in Fig 2.2. AOT has often been used in the creation of W/O
emulsions. Hopwood and Mann52 used AOT emulsions to prepare barium sulphate nanoparticles and
nanofilaments, finding that AOT was more effective than other surfactants for filament formation.
Several researchers have found that adding an additional surfactant provides a synergistic effect in
AOT W/O emulsions. Gonzalez-Blanco et al53 probed the formation of AOT based W/O
microemulsions with FTIR spectroscopy, finding the addition of poly(sodium styrene sulfonate) (PSS)
or poly(vinylpyrrolidone) (PVP) even at low concentrations prevented aggregation of the reverse
micelles in the W/O emulsion. When using solely AOT as surfactant, the reverse micelles displayed
aggregation. Paul and collaborators17,18,54,55 made multiple studies on AOT reverse micelles. They
investigated both the influence of co-surfactants and oils of different properties used as the
continuous phase on the resulting emulsions. They based their studies on the work of Shah et al in
198756–58, who made numerous observations on the formation of reverse micellar systems. They
concluded the solubilisation of water in W/O microemulsions is determined by the curvature and
elasticity of the interface, along with the total interfacial area. When the interfacial area is constant,
solubilisation is proportional with droplet radii. Maximum solubilisation is achieved with optimal
98 | P a g e
interfacial curvature and elasticity values, which results in minimisation of bending stress and
attractive force of the interface. Other factors contribute to the solubilisation of water within oil,
including surfactant concentration, aqueous phase:oil phase ratio and type of oil. In a large study on
W/O reverse micelles, Paul et al17 found that cyclohexane was an excellent oil to use for W/O
emulsions due to the high solubilisation capacity for water. Factors affecting the solubilisation
capacity of specific oils include the oil’s molar volume, polarity, viscosity and molecular structure.
We tested the solubilisation capacity of AOT solutions in both toluene and cyclohexane, and found
cyclohexane was far more effective. The aqueous dispersed phase (pure water) was simply added to
the AOT solution and vortexed. The weight percentage of AOT in the oil phase was varied.
Solubilisation capacity is measured by recording the amount of aqueous phase added that results in
a permanent turbidity i.e. no further water can be solubilised. Results are shown in Table 2.1. At 5
%wt concentration, both oils solubilise a similar amount of water (0.2 and 0.3mL). At increased
concentrations, cyclohexane has almost doubled solubilisation capacity. At 40 %wt, toluene
solubilised 2.4mL of water, whilst cyclohexane solubilised 3.8mL. An interesting effect is that
doubling the weight percentage of AOT more than doubles the amount of water solubilised. This can
be rationalised as increasing the amount of surfactants decreases interfacial tension, which in turn
decreases Gibbs free energy and makes microemulsion formation more favourable, according to the
equation:
∆GF = λ∆A - T∆SF
Eq. 2.1 Gibbs free energy of emulsion formation
Where ∆GF is free energy of emulsion formation, λ is surface tension, ∆A is surface area gained
during emulsification, T is temperature and ∆SF is the entropy of emulsion formation.
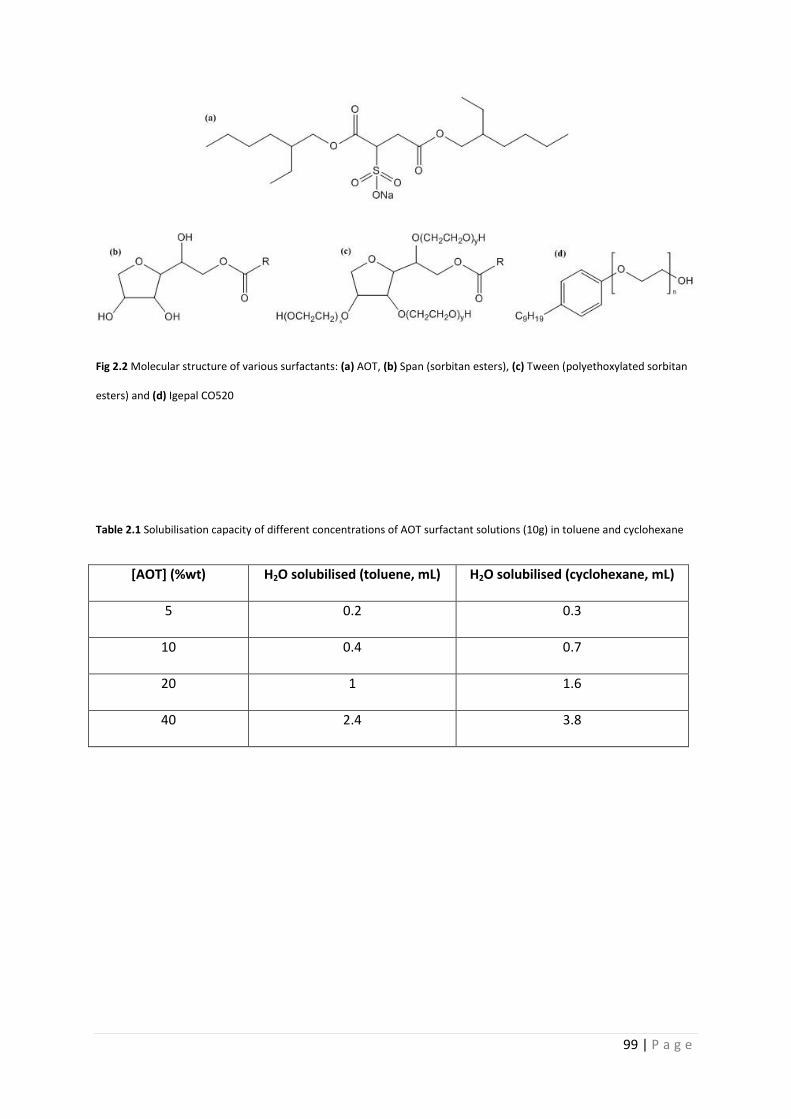
99 | P a g e
Fig 2.2 Molecular structure of various surfactants: (a) AOT, (b) Span (sorbitan esters), (c) Tween (polyethoxylated sorbitan
esters) and (d) Igepal CO520
Table 2.1 Solubilisation capacity of different concentrations of AOT surfactant solutions (10g) in toluene and cyclohexane
[AOT] (%wt) H2O solubilised (toluene, mL) H2O solubilised (cyclohexane, mL)
5 0.2 0.3
10 0.4 0.7
20 1 1.6
40 2.4 3.8
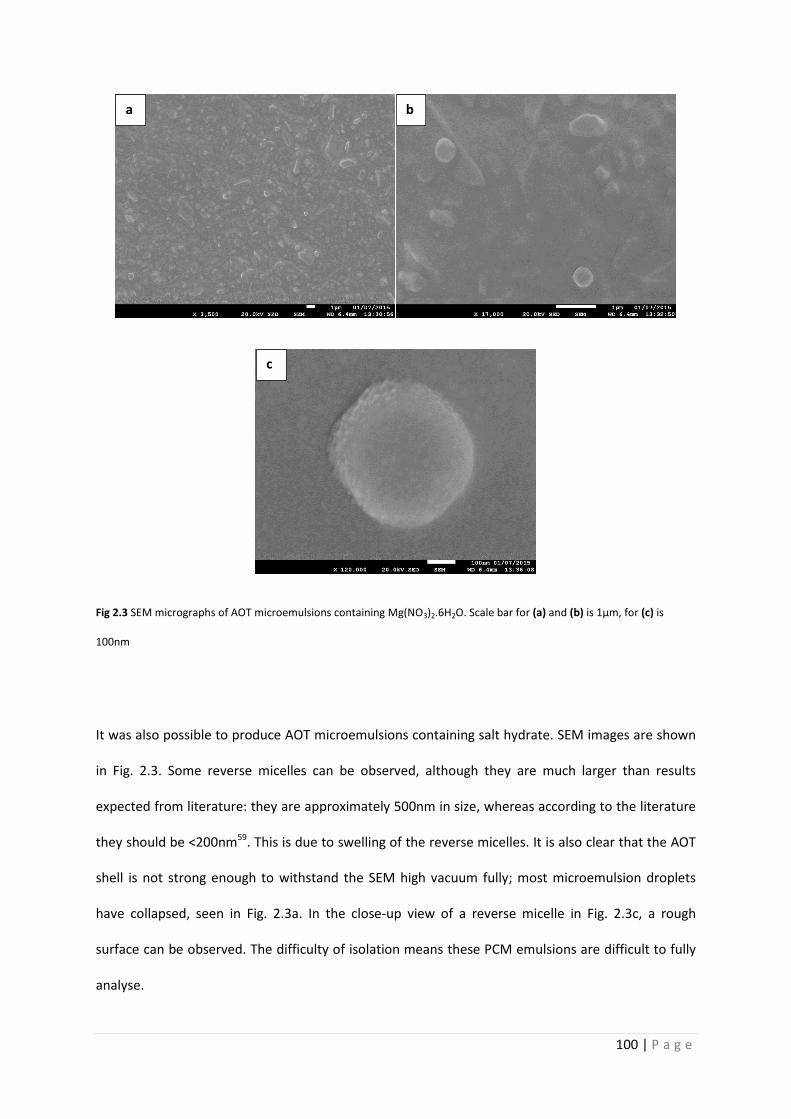
100 | P a g e
Fig 2.3 SEM micrographs of AOT microemulsions containing Mg(NO3)2.6H2O. Scale bar for (a) and (b) is 1µm, for (c) is
100nm
It was also possible to produce AOT microemulsions containing salt hydrate. SEM images are shown
in Fig. 2.3. Some reverse micelles can be observed, although they are much larger than results
expected from literature: they are approximately 500nm in size, whereas according to the literature
they should be <200nm59. This is due to swelling of the reverse micelles. It is also clear that the AOT
shell is not strong enough to withstand the SEM high vacuum fully; most microemulsion droplets
have collapsed, seen in Fig. 2.3a. In the close-up view of a reverse micelle in Fig. 2.3c, a rough
surface can be observed. The difficulty of isolation means these PCM emulsions are difficult to fully
analyse.
a b
c
101 | P a g e
To test the synergistic effect of adding a cosurfactant to AOT, we used commercial surfactants
Tween 80 (PEG sorbitan monooleate) and Igepal CO520 (nonyl phenol ethoxylate). They were added
at the %wt that would give the maximum solubilisation capacity, according to Paul et al17. The ratio
of surfactants used was 95:5 for AOT:Tween 80 and 60:40 for AOT:Igepal CO520. The overall %wt of
surfactants in the continuous phase was 10%. Oil used was cyclohexane (90 %wt of continuous
phase). As can be seen from Table 2.2, both cosurfactants lead to an increase in solubilisation
capacity compared to only using AOT. Using only AOT at 10 %wt, 0.7mL of water was solubilised.
With the addition of Tween 80 and Igepal CO520, this was increased to 0.8 and 1.1mL, respectively.
Commercially produced surfactants are widely used and cheap. Nonionic Tween and Span
surfactants are amongst the most common. Nonionic surfactants have advantages over ionic
surfactants, for example higher stability, lower reactivity and compatibility with more materials.
Many researchers have combined Tweens and Spans, changing the HLB ratio to maximise
solubilisation of oils or water. Span is the brand name of sorbitan esters, while a Tween is a
polyethoxylated sorbitan ester i.e. a polyethoxylated Span. Their structures are shown in Fig. 2.2.
The HLB value for Spans decreases with increasing esterification, giving better lipophilic solubility.
Tweens are hydrophilic; increasing the degree of ethoxylation increases aqueous solubility.

102 | P a g e
Table 2.2 Amount of H2O solubilised by solutions of AOT blended with cosurfactants (10g)
Surfactant Combination (total 10 %wt of continuous phase) H2O solubilised (mL)
95 %wt AOT, 5 %wt Tween 80 0.8
60 %wt AOT, 40 %wt Igepal CO520 1.1
We initially wanted to solubilise pure salt hydrate i.e. with no additional water added. We
anticipated confining the crystallohydrate to the small volume in the emulsion droplets would allow
it to maintain its hydration level, while using 100 %wt of the crystallohydrate as aqueous phase
would maximise latent heat. To do this, we used a continuous phase of 60 %wt of a blend of 3:2
Tween:Span, with 40% toluene as oil. This continuous phase had been used by Kafka et al60 who had
used their emulsions to fabricate poly(ethyl-2-cyanoacrylate) (PECA) nanocapsules. To the
continuous phase, we added salt hydrate and stirred overnight to yield a W/O microemulsion.
Initially we chose crystallohydrates with relatively high TMs in to make handling easier, as they will be
solid at room temperature. Magnesium nitrate hexahydrate (Mg(NO3)2.6H2O) and aluminium
sulphate octadecahydrate (Al2(SO4)3.18H2O), which have TMs of 89 and 86°C respectively, were
chosen. These PCMs also do not release any hazardous by-products upon dissolution, unlike other
crystallohydrates. For instance, sodium sulphide nonahydrate (Na2S.9H2O) releases poisonous
hydrogen sulphide, and this hinders its practical use. The TM of around 90°C can be useful for
domestic applications such as solar cooking. Domanski et al61 investigated Mg(NO3)2.6H2O for this
purpose, and found it was far more effective than a corresponding organic PCM, stearic acid. It was
also beneficial to use our chosen PCMs as they have stable lower hydrated structures, meaning
some heat storage capacity may be maintained even if they partially dehydrate during
emulsification/polymerisation. This effect was observed by Huang et al62, who found that upon
encapsulation, Na2HPO4.12H2O was dehydrated to Na2HPO4.7H2O but still had good heat storage
103 | P a g e
capacity. We found that Mg(NO3)2.6H2O formed stable W/O emulsions with 60 %wt of a 3:2 blend of
Tween:Span surfactants in toluene, simply by magnetically stirring. Even when solid Mg(NO3)2.6H2O
was added, after stirring overnight it had ‘melted’ into the solution. On the other hand,
Al2(SO4)3.18H2O formed a precipitate without being emulsified.
Later, to study the universality of our methodology, we selected other salt hydrates to encapsulate.
We chose PCMs with a TM close to room temperature, which can potentially be used for passive air
conditioning applications and therefore can be combined into thermally-regulating paints. Sodium
sulphate decahydrate (Na2SO4.10H2O) and calcium chloride hexahydrate (CaCl2.6H2O) were chosen,
which have TMs of 32 and 30°C respectively. These are possibly the two most researched salt
hydrates for thermal energy storage. We mainly used Na2SO4.10H2O for making emulsions, because
it was compatible with Mg(NO3)2.6H2O to form crystallohydrate mixtures, while CaCl2.6H2O was not
as useful for this purpose (please see Chapter 3 for eutectics for PECA nanocapsules). CaCl2.6H2O
also may react with atmospheric CO2 to form calcium carbonate. As shown by the results with AOT
above, vortexing the solutions for a brief period is sufficient to prepare microemulsions containing a
small amount of water. However, overnight magnetic stirring is required to solubilise
crystallohydrates, especially as we wanted to solubilise a maximum amount.
Observations of the attempts to form microemulsions by magnetic stirring are shown in Table 2.3.
Mg(NO3)2.6H2O was the only salt hydrate used that could form miniemulsions using this method. The
other three selected crystallohydrates didn’t solubilise into an emulsion, remaining as a separate
solid phase in the form of a crystalline precipitate. Using 70 %wt Mg(NO3)2.6H2O and 30% water as
aqueous phase gave a cloudy emulsion, whilst using 100 %wt led to a translucent emulsion. The
cloudy effect is caused by the excess water saturating the emulsion, leading to some larger droplets.
The emulsions also took on an orange/yellow colour due to the large amount of surfactants used
(Tweens and Spans are viscous orange liquids at room temperature).
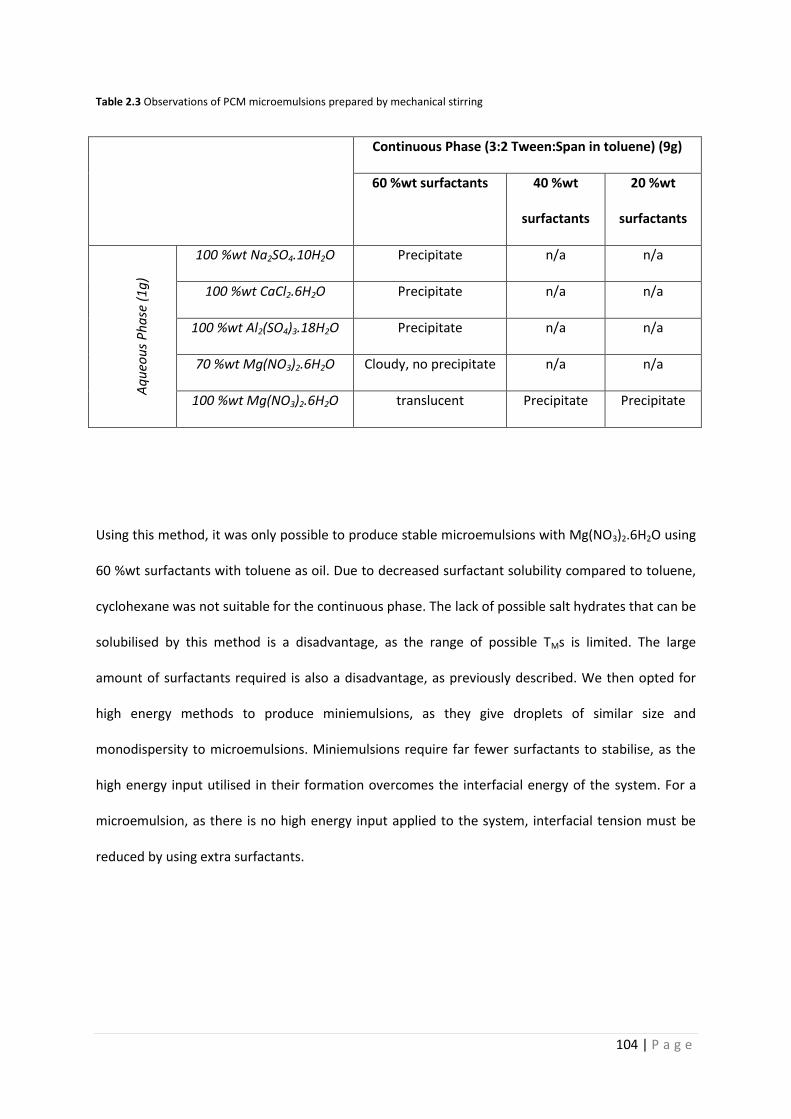
104 | P a g e
Table 2.3 Observations of PCM microemulsions prepared by mechanical stirring
Continuous Phase (3:2 Tween:Span in toluene) (9g)
60 %wt surfactants 40 %wt
surfactants
20 %wt
surfactants
Aq
ueo
us
Ph
ase
(1
g)
100 %wt Na2SO4.10H2O Precipitate n/a n/a
100 %wt CaCl2.6H2O Precipitate n/a n/a
100 %wt Al2(SO4)3.18H2O Precipitate n/a n/a
70 %wt Mg(NO3)2.6H2O Cloudy, no precipitate n/a n/a
100 %wt Mg(NO3)2.6H2O translucent Precipitate Precipitate
Using this method, it was only possible to produce stable microemulsions with Mg(NO3)2.6H2O using
60 %wt surfactants with toluene as oil. Due to decreased surfactant solubility compared to toluene,
cyclohexane was not suitable for the continuous phase. The lack of possible salt hydrates that can be
solubilised by this method is a disadvantage, as the range of possible TMs is limited. The large
amount of surfactants required is also a disadvantage, as previously described. We then opted for
high energy methods to produce miniemulsions, as they give droplets of similar size and
monodispersity to microemulsions. Miniemulsions require far fewer surfactants to stabilise, as the
high energy input utilised in their formation overcomes the interfacial energy of the system. For a
microemulsion, as there is no high energy input applied to the system, interfacial tension must be
reduced by using extra surfactants.
105 | P a g e
2.3 Creating miniemulsions via high energy processes
To reduce the amount of surfactants required to stabilise emulsions, high energy equipment is
needed. Reducing the volume of surfactants is beneficial as it reduces costs and prevents side
reactions that may occur with surfactant functional groups. High energy processing on an industrial
scale can be costly, but will produce miniemulsions quickly and with a high degree of
monodispersity.
Lab scale homogenisers are useful for producing emulsions. In general, the higher the speed of
homogenisation, the smaller the capsules produced. However, this conventional method of forming
emulsions is not sufficiently powerful enough to obtain nanometre sized droplets. Nanodroplets lead
to nanocapsules with improved structural strength, thermal transfer, reduced sedimentation and
better thermal stability63. We initially used an Ultraturrax homogeniser to produce miniemulsions.
After homogenisation, the resulting emulsions were cloudy, showing a stable miniemulsion had not
been formed. Clearly, not enough power is delivered to overcome the interfacial tension effects.
High pressure homogenisers, available for industrial applications, are more effective in reducing
droplet size.
Sonicators deliver far more power than regular homogenisers, and are key in producing nanosized
emulsion droplets. They are readily available and inexpensive for laboratory scale applications.
Badnore et al64 compared the synthesis of CaCO3 nanoparticles using both conventional and
sonochemical methods. Conventional synthesis gave nanoparticles 10-150nm in size with an 80%
yield, while the sonochemical synthesis gave uniform 20nm particles and a 98% yield. This
demonstrates the consistency sonication gives in producing small particle sizes, and increases yields
without the need for extreme conditions. Reactions are driven with energy provided by ultrasonic
cavitation.
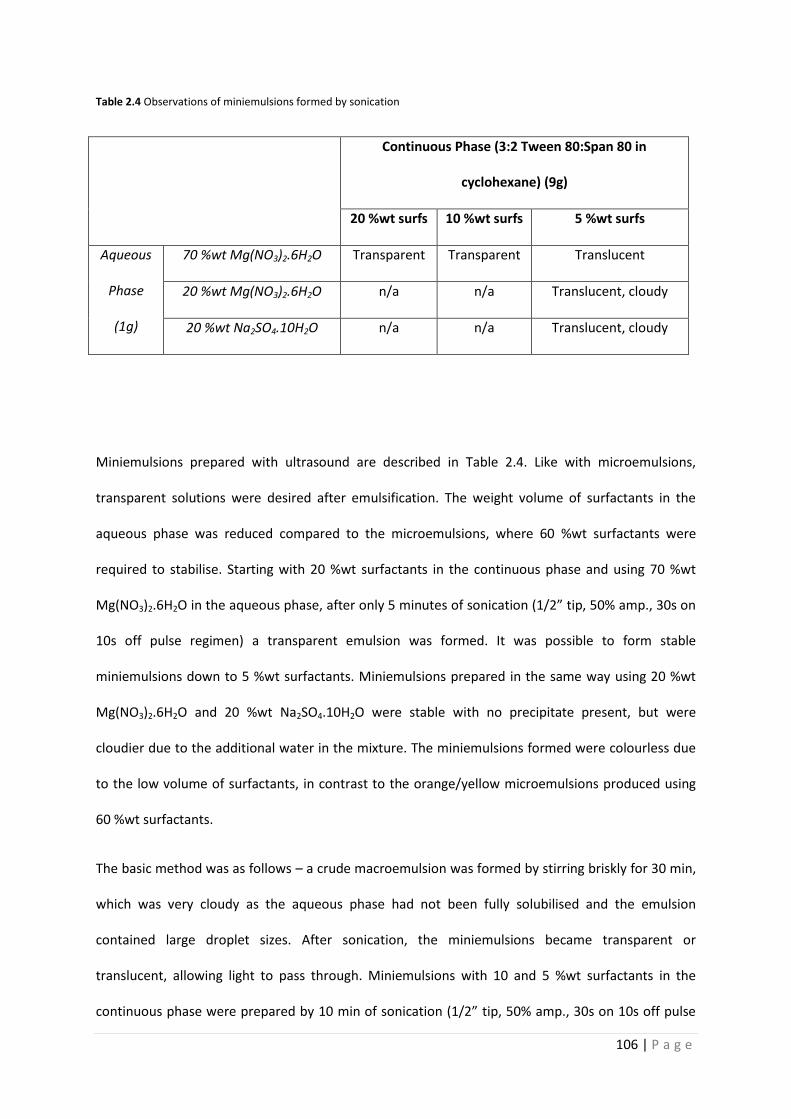
106 | P a g e
Table 2.4 Observations of miniemulsions formed by sonication
Continuous Phase (3:2 Tween 80:Span 80 in
cyclohexane) (9g)
20 %wt surfs 10 %wt surfs 5 %wt surfs
Aqueous
Phase
(1g)
70 %wt Mg(NO3)2.6H2O Transparent Transparent Translucent
20 %wt Mg(NO3)2.6H2O n/a n/a Translucent, cloudy
20 %wt Na2SO4.10H2O n/a n/a Translucent, cloudy
Miniemulsions prepared with ultrasound are described in Table 2.4. Like with microemulsions,
transparent solutions were desired after emulsification. The weight volume of surfactants in the
aqueous phase was reduced compared to the microemulsions, where 60 %wt surfactants were
required to stabilise. Starting with 20 %wt surfactants in the continuous phase and using 70 %wt
Mg(NO3)2.6H2O in the aqueous phase, after only 5 minutes of sonication (1/2” tip, 50% amp., 30s on
10s off pulse regimen) a transparent emulsion was formed. It was possible to form stable
miniemulsions down to 5 %wt surfactants. Miniemulsions prepared in the same way using 20 %wt
Mg(NO3)2.6H2O and 20 %wt Na2SO4.10H2O were stable with no precipitate present, but were
cloudier due to the additional water in the mixture. The miniemulsions formed were colourless due
to the low volume of surfactants, in contrast to the orange/yellow microemulsions produced using
60 %wt surfactants.
The basic method was as follows – a crude macroemulsion was formed by stirring briskly for 30 min,
which was very cloudy as the aqueous phase had not been fully solubilised and the emulsion
contained large droplet sizes. After sonication, the miniemulsions became transparent or
translucent, allowing light to pass through. Miniemulsions with 10 and 5 %wt surfactants in the
continuous phase were prepared by 10 min of sonication (1/2” tip, 50% amp., 30s on 10s off pulse

107 | P a g e
regime). Other Tween and Span surfactants (e.g. Tween 20 and Span 20) gave similar results. We
also found a blend of 5 %wt 2:1 Span 85:polyethylene glycol dioleate (PEGDO), used by Saihi et al65
was effective at miniemulsion stabilisation.
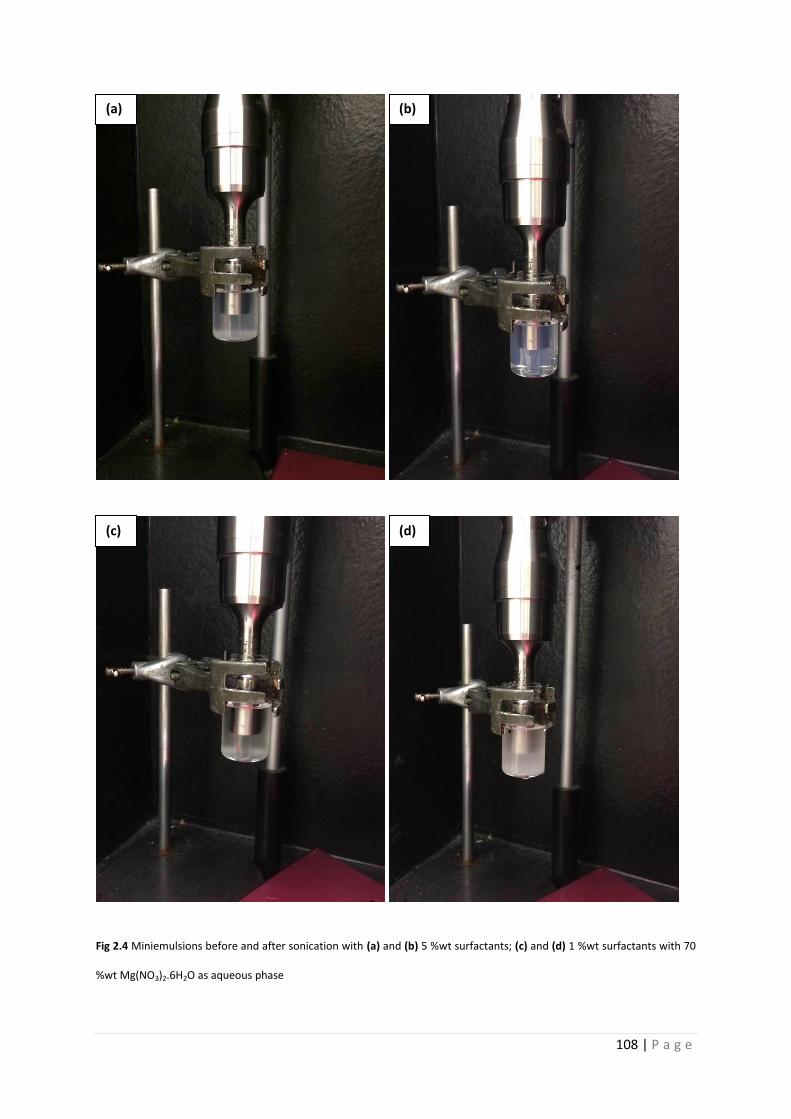
108 | P a g e
Fig 2.4 Miniemulsions before and after sonication with (a) and (b) 5 %wt surfactants; (c) and (d) 1 %wt surfactants with 70
%wt Mg(NO3)2.6H2O as aqueous phase
(a)
(d) (c)
(b)
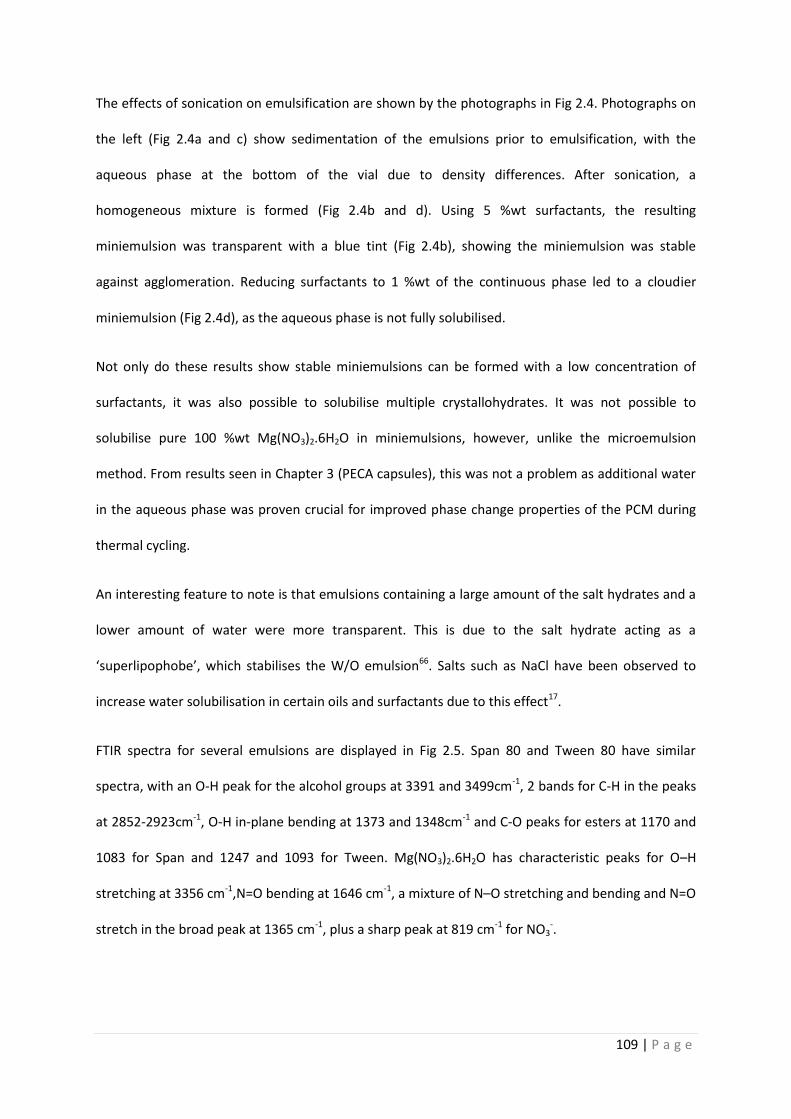
109 | P a g e
The effects of sonication on emulsification are shown by the photographs in Fig 2.4. Photographs on
the left (Fig 2.4a and c) show sedimentation of the emulsions prior to emulsification, with the
aqueous phase at the bottom of the vial due to density differences. After sonication, a
homogeneous mixture is formed (Fig 2.4b and d). Using 5 %wt surfactants, the resulting
miniemulsion was transparent with a blue tint (Fig 2.4b), showing the miniemulsion was stable
against agglomeration. Reducing surfactants to 1 %wt of the continuous phase led to a cloudier
miniemulsion (Fig 2.4d), as the aqueous phase is not fully solubilised.
Not only do these results show stable miniemulsions can be formed with a low concentration of
surfactants, it was also possible to solubilise multiple crystallohydrates. It was not possible to
solubilise pure 100 %wt Mg(NO3)2.6H2O in miniemulsions, however, unlike the microemulsion
method. From results seen in Chapter 3 (PECA capsules), this was not a problem as additional water
in the aqueous phase was proven crucial for improved phase change properties of the PCM during
thermal cycling.
An interesting feature to note is that emulsions containing a large amount of the salt hydrates and a
lower amount of water were more transparent. This is due to the salt hydrate acting as a
‘superlipophobe’, which stabilises the W/O emulsion66. Salts such as NaCl have been observed to
increase water solubilisation in certain oils and surfactants due to this effect17.
FTIR spectra for several emulsions are displayed in Fig 2.5. Span 80 and Tween 80 have similar
spectra, with an O-H peak for the alcohol groups at 3391 and 3499cm-1, 2 bands for C-H in the peaks
at 2852-2923cm-1, O-H in-plane bending at 1373 and 1348cm-1 and C-O peaks for esters at 1170 and
1083 for Span and 1247 and 1093 for Tween. Mg(NO3)2.6H2O has characteristic peaks for O–H
stretching at 3356 cm-1,N=O bending at 1646 cm-1, a mixture of N–O stretching and bending and N=O
stretch in the broad peak at 1365 cm-1, plus a sharp peak at 819 cm-1 for NO3-.
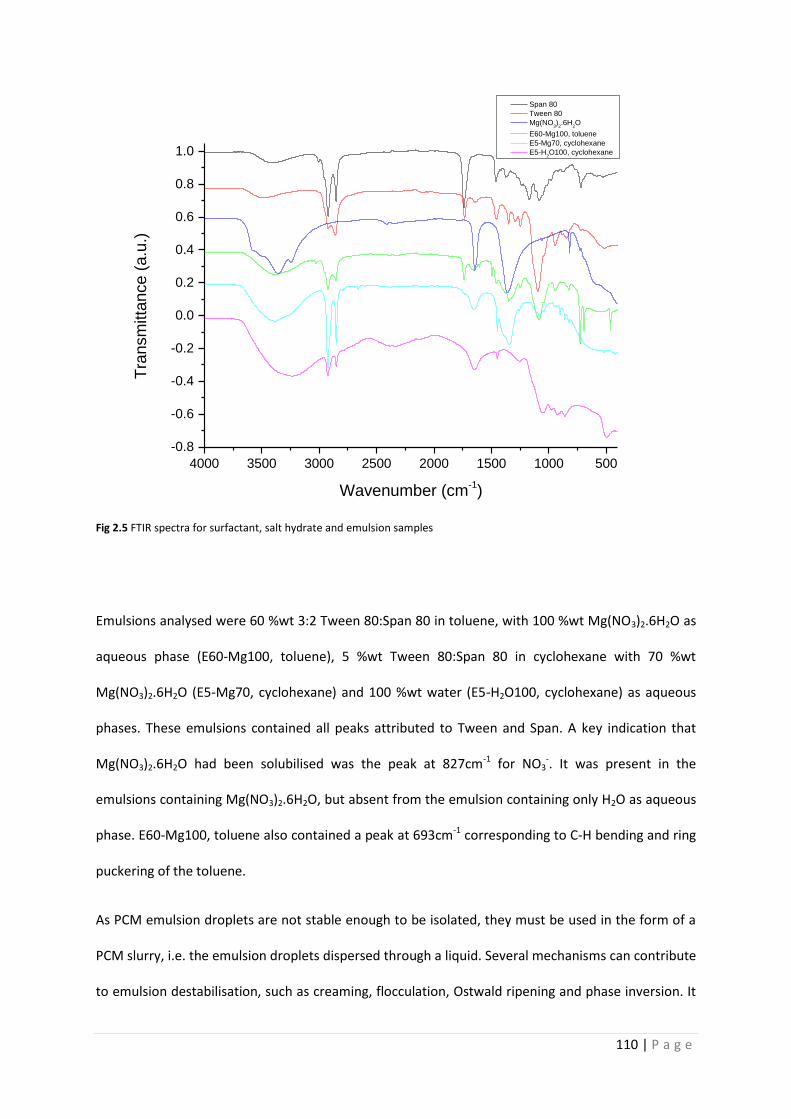
110 | P a g e
4000 3500 3000 2500 2000 1500 1000 500
-0.8
-0.6
-0.4
-0.2
0.0
0.2
0.4
0.6
0.8
1.0
Span 80
Tween 80
Mg(NO3)
2.6H
2O
E60-Mg100, toluene
E5-Mg70, cyclohexane
E5-H2O100, cyclohexane
Tra
nsm
itta
nce (
a.u
.)
Wavenumber (cm-1)
Fig 2.5 FTIR spectra for surfactant, salt hydrate and emulsion samples
Emulsions analysed were 60 %wt 3:2 Tween 80:Span 80 in toluene, with 100 %wt Mg(NO3)2.6H2O as
aqueous phase (E60-Mg100, toluene), 5 %wt Tween 80:Span 80 in cyclohexane with 70 %wt
Mg(NO3)2.6H2O (E5-Mg70, cyclohexane) and 100 %wt water (E5-H2O100, cyclohexane) as aqueous
phases. These emulsions contained all peaks attributed to Tween and Span. A key indication that
Mg(NO3)2.6H2O had been solubilised was the peak at 827cm-1 for NO3-. It was present in the
emulsions containing Mg(NO3)2.6H2O, but absent from the emulsion containing only H2O as aqueous
phase. E60-Mg100, toluene also contained a peak at 693cm-1 corresponding to C-H bending and ring
puckering of the toluene.
As PCM emulsion droplets are not stable enough to be isolated, they must be used in the form of a
PCM slurry, i.e. the emulsion droplets dispersed through a liquid. Several mechanisms can contribute
to emulsion destabilisation, such as creaming, flocculation, Ostwald ripening and phase inversion. It

111 | P a g e
is possible to prepare highly stable emulsions which avoid these problems, but most emulsions will
separate. This is a serious problem for any practical applications of PCM emulsions. PCM slurries are
used as both heat transfer fluid and energy storage material, making them highly beneficial. PCM
slurries must be able to be pumped round a system, producing stress on the material. Therefore,
strong materials are required to withstand any shell damage that may occur. Because of this, we
wanted to add extra protection to our PCM emulsions, by fabricating a polymer shell around the
droplets. PCM capsules can also be employed as a PCM slurry for heat transfer.
The additional shell material improves stability and allows isolation of the PCM capsules, which can
then be characterised more easily. PCM capsules are also more versatile; they can be used in their
isolated form, or as a slurry. We decided to make nanocapsules based on the initial miniemulsions
we prepared. Numerous studies have shown microcapsules display lower structural stability than
nanocapsules, especially when used in slurries which require pumping. Yamagishi et al67 found that
approximately 90% of capsules with an average diameter of 1000µm were broken after 500 thermal
cycles. In contrast, 0% of capsules with an average diameter of 5µm were broken after 8000 thermal
cycles. This clearly demonstrates the additional stability smaller capsules bring.
Our findings that we could form stable sub-micron emulsions containing salt hydrates were
promising as a precursor for nanocapsule formation. Suitable polymerisation methods were then
sought to form an additional shell. Any capsules formed using these emulsions as a template would
necessarily contain crystallohydrate as core material. Polymerisations based on miniemulsions, such
as in situ and interfacial polymerisations were researched. Once crystallohydrates are successfully
encapsulated and the capsules isolated, thermal properties of the material can be measured. First
attempts at encapsulation were made using methyl methacrylate (MMA) as monomer for the shell.
112 | P a g e
2.4 Attempts using poly(methyl methacrylate) as capsule shell material
Poly(methyl methacrylate) (PMMA) is a widely used polymer for shell material in micro- and
nanocapsules. As it is a soft polymer, it is ideally suited to resist the volume changes of PCMs during
melting. First attempts at making PMMA capsules crosslinked with ethyl acrylate (EA) containing
crystallohydrates were based on the suspension polymerisation method of Huang et al62,68. They
used Span as emulsifier with high energy input from an ultrasonic homogeniser. Despite washing the
monomers with sodium hydroxide solution to remove any inhibitors present and using benzoyl
peroxide as catalyst, we had trouble initiating the reaction. In later attempts, ultrasonic energy was
used to attempt to initiate the reaction, a technique which has been used to prepare PMMA from
O/W emulsions69.
After the reaction was complete, the mixture was left to dry in a fume hood overnight. After
evaporation of liquid, a white powder was left. As can be seen from FTIR spectra shown in Fig 2.6,
this powder consisted of Na2SO4.10H2O only, no PMMA had formed. As the MMA and EA were left
unreacted, they were still liquid and free to evaporate. It was clear the MMA/EA crosslinking
reaction had not occurred.
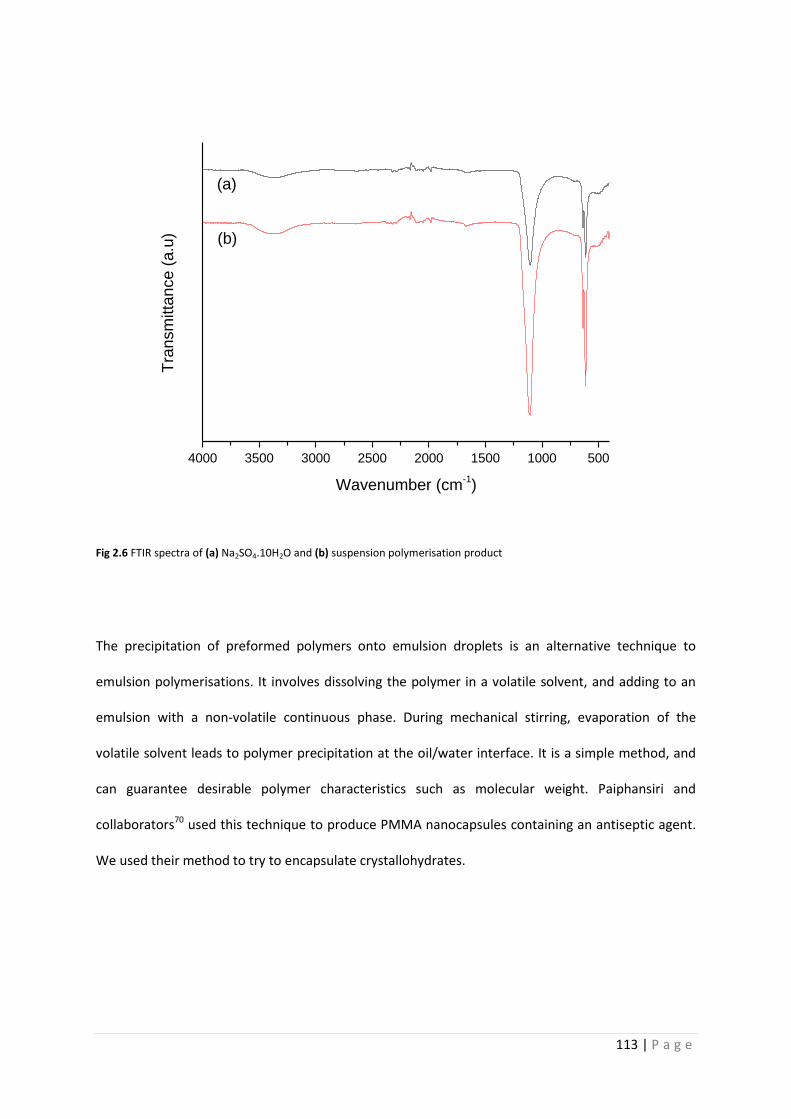
113 | P a g e
4000 3500 3000 2500 2000 1500 1000 500
(b)
Tra
nsm
itta
nce (
a.u
)
Wavenumber (cm-1)
(a)
Fig 2.6 FTIR spectra of (a) Na2SO4.10H2O and (b) suspension polymerisation product
The precipitation of preformed polymers onto emulsion droplets is an alternative technique to
emulsion polymerisations. It involves dissolving the polymer in a volatile solvent, and adding to an
emulsion with a non-volatile continuous phase. During mechanical stirring, evaporation of the
volatile solvent leads to polymer precipitation at the oil/water interface. It is a simple method, and
can guarantee desirable polymer characteristics such as molecular weight. Paiphansiri and
collaborators70 used this technique to produce PMMA nanocapsules containing an antiseptic agent.
We used their method to try to encapsulate crystallohydrates.

114 | P a g e
Fig 2.7 SEM images of attempts at PMMA nanoprecipitation at (a) x300 magnification (scale bar 10µm) (b) x4000
magnification (scale bar 1µm)
Upon evaporation of the chloroform, the PMMA coagulated into a solid block which was extremely
rubbery. SEM images of the material are shown in Fig 2.7. As can be seen, the solid is a porous
material, but no capsules have been formed. The pores are 1-50µm in size. In Fig. 2.7b, when
zoomed into to x4000 magnification, small particles 0.1-2µm in size can be seen. These are particles
of Mg(NO3)2.6H2O that have adsorbed to the surface.
A final attempt to use PMMA was made by ‘inverting’ the method of Zhang et al71, who used PMMA
to encapsulate octadecane. Octadecane was first emulsified in water by sonication, employing
sodium dodecyl sulphate as surfactant. We made a W/O miniemulsion containing Mg(NO3)2.6H2O
using a 2:1 blend of Span85:PEGDO as surfactants. Benzoyl peroxide was used as initiator for the
polymerisation, which produces reactive benzoyl radicals at temperatures above 70°C. After leaving
the mixture to react overnight, it was centrifuged. No capsules were observed.
With all PMMA samples, there have been issues with initiation of the reaction. Despite the
favourable properties of PMMA such as softness and flexibility, all our attempts to use it for
nanoencapsulation of crystallohydrates have failed. We moved on to other polymers with different
(a) (b)

115 | P a g e
controls over initiation mechanisms, finding that poly(ethyl-2-cyanoacrylate) and polyurethane were
useful in encapsulating salt hydrates, as discussed in the following chapters.
116 | P a g e
2.5 References
1 T. Khadiran, M. Z. Hussein, Z. Zainal and R. Rusli, Sol. Energy Mater. Sol. Cells, 2015, 143, 78–98.
2 T. G. Mason, J. N. Wilking, K. Meleson, C. B. Chang and S. M. Graves, J. Phys. Condens. Matter, 2006, 18, R635–R666.
3 A. Mandal, A. Samanta, A. Bera and K. Ojha, Ind. Eng. Chem. Res., 2010, 49, 12756–12761.
4 M. A. Ahmadi and S. R. Shadizadeh, J. Pet. Sci. Eng., 2013, 110, 66–73.
5 I. J. Lin, J. Phys. Chem., 1972, 76, 2019–2023.
6 R. Atkin, P. Davies, J. Hardy and B. Vincent, Macromolecules, 2004, 37, 7979–7985.
7 M. Bonnet, M. Cansell, A. Berkaoui, M. H. Ropers, M. Anton and F. Leal-Calderon, Food Hydrocoll., 2009, 23, 92–101.
8 G. M. Tedajo, S. Bouttier, J. Fourniat, J. L. Grossiord, J. P. Marty and M. Seiller, Int. J. Pharm., 2005, 288, 63–72.
9 A. Silva-Cunha, J. Grossiord, F. Puisieux and M. Seiller, Int J Pharm., 1997, 158, 79–89.
10 D. Vasiljevic, J. Parojcic, M. Primorac and G. Vuleta, Int. J. Pharm., 2006, 309, 171–177.
11 N. Jager-Lezer, I. Terrisse, F. Bruneau, S. Tokgoz, L. Ferreira, D. Clausse, M. Seiller and J. L. Grossiord, J. Control. Release, 1997, 45, 1–13.
12 R. A. Jain, Biomaterials, 2000, 21, 2475–2490.
13 M. P. Desai, V. Labhasetwar, E. Walter, R. J. Levy and G. L. Amidon, Pharm. Res., 1997, 14, 1568–1573.
14 D. J. McClements, Soft Matter, 2012, 8, 1719.
15 C. Mabille, V. Schmitt, P. Gorria, F. Leal Calderon, V. Faye, B. Deminière and J. Bibette, Langmuir, 2000, 16, 422–429.
16 T. Delmas, H. Piraux, A. C. Couffin, I. Texier, F. Vinet, P. Poulin, M. E. Cates and J. Bibette, Langmuir, 2011, 27, 1683–1692.
17 B. K. Paul and R. K. Mitra, J. Colloid Interface Sci., 2005, 288, 261–279.
18 K. Kundu and B. K. Paul, Colloids Surfaces a-Physicochemical Eng. Asp., 2013, 433, 154–165.
19 M. J. Lawrence and G. D. Rees, Adv. Drug Deliv. Rev., 2000, 45, 89–121.
20 S. Cheng, S. R. S. Ting, F. P. Lucien and P. B. Zetterlund, Macromolecules, 2012, 45, 1803–1810.
21 S. Vrignaud, J. P. Benoit and P. Saulnier, Biomaterials, 2011, 32, 8593–8604.
22 S. Watnasirichaikul, T. Rades, I. G. Tucker and N. M. Davies, Int. J. Pharm., 2002, 235, 237–246.
23 J. M. Asua, Prog. Polym. Sci., 2014, 39, 1797–1826.
117 | P a g e
24 A. Schoth, K. Landfester and R. Muñoz-Espí, Langmuir, 2015, 31, 3784–3788.
25 E. M. Rosenbauer, K. Landfester and A. Musyanovych, Langmuir, 2009, 25, 12084–12091.
26 A. Guyot, Macromol. Symp., 2002, 179, 105–132.
27 S. U. Pickering, J. Chem. Soc., 1907, 91, 2001–2021.
28 Y. Chevalier and M. A. Bolzinger, Colloids Surfaces A Physicochem. Eng. Asp., 2013, 439, 23–34.
29 R. Aveyard, B. P. Binks and J. H. Clint, Adv. Colloid Interface Sci., 2003, 100–102, 503–546.
30 J. Frelichowska, M. A. Bolzinger, J. P. Valour, H. Mouaziz, J. Pelletier and Y. Chevalier, Int. J. Pharm., 2009, 368, 7–15.
31 K. Zhang, W. Wu, K. Guo, J. F. Chen and P. Y. Zhang, Colloids Surfaces A Physicochem. Eng. Asp., 2009, 349, 110–116.
32 Chen, Tao, Colver, Patrick J. and Bon, Stefan A. F., Adv. Mater., 2007, 19, 2286–2289.
33 S. A. F. Bon and P. J. Colver, Langmuir, 2007, 23, 8316–8322.
34 B. Midmore, J. Colloid Interface Sci., 1999, 213, 352–359.
35 M. Delgado, A. Lázaro, J. Mazo and B. Zalba, Renew. Sustain. Energy Rev., 2012, 16, 253–273.
36 B. Chen, X. Wang, Y. Zhang, H. Xu and R. Yang, Appl. Therm. Eng., 2006, 26, 1238–1245.
37 L. Huang, M. Petermann and C. Doetsch, Energy, 2009, 34, 1145–1155.
38 E. Gunther, T. Schmid, H. Mehling, S. Hiebler and L. Huang, Int. J. Refrig., 2010, 33, 1605–1611.
39 R. Montenegro, M. Antonietti, Y. Mastai and K. Landfester, J. Phys. Chem. B, 2003, 107, 5088–5094.
40 L. Huang, E. Gunther, C. Doetsch and H. Mehling, Thermochim. Acta, 2010, 509, 93–99.
41 E. Gunther, L. Huang, H. Mehling and C. Doetsch, Thermochim. Acta, 2011, 522, 199–204.
42 P. Felix De Castro, A. Ahmed and D. G. Shchukin, Chem. - A Eur. J., 2016, 22, 4389–4394.
43 R. A. Taylor, N. Tsafnat and A. Washer, Appl. Therm. Eng., 2016, 93, 935–938.
44 C. Rathgeber, L. Miró, L. F. Cabeza and S. Hiebler, Thermochim. Acta, 2014, 596, 79–88.
45 D. Zou, Z. Feng, R. Xiao, K. Qin, J. Zhang, W. Song and Q. Tu, Sol. Energy Mater. Sol. Cells, 2010, 94, 2292–2297.
46 A. Martínez and G. Prieto, Catal. Commun., 2007, 8, 1479–1486.
47 X. Liu and D. Astruc, Adv. Mater., 2017, 29.
48 Z. Yin, D. Ma and X. Bao, Chem. Commun., 2010, 46, 1344–1346.
49 M. Winkelmann and H. P. Schuchmann, Particuology, 2011, 9, 502–505.
118 | P a g e
50 X. J. Zhao, X. L. Fang, B. H. Wu, L. S. Zheng and N. F. Zheng, Sci. China-Chemistry, 2014, 57, 141–146.
51 F. Gröhn, B. J. Bauer and E. J. Amis, Macromolecules, 2001, 34, 6701–6707.
52 J. D. Hopwood and S. Mann, Chem. Mater., 1997, 9, 1819–1828.
53 C. González-Blanco, L. Rodriguez and M. Velazquez, Langmuir, 1997, 7463, 1938–1945.
54 B. K. Paul and R. K. Mitra, J. Colloid Interface Sci., 2006, 295, 230–242.
55 K. Kundu and B. K. Paul, J. Surfactants Deterg., 2013, 16, 865–879.
56 M. J. Hou and D. O. Shah, Langmuir, 1987, 3, 1086–1096.
57 R. Leung and D. O. Shah, J. Colloid Interface Sci., 1987, 120, 320–329.
58 R. Leung and D. O. Shah, J. Colloid Interface Sci., 1987, 120, 330–344.
59 L. Qi, Encycl. Surf. Colloid Sci., 2006, 6183–6207.
60 A. P. Kafka, B. J. McLeod, T. Rades and A. McDowell, J. Control. Release, 2011, 149, 307–313.
61 R. Domanski, A. A. El-Sebaii and M. Jaworski, Energy, 1995, 20, 607–616.
62 J. Huang, T. Y. Wang, P. P. Zhu and J. B. Xiao, Thermochim. Acta, 2013, 557, 1–6.
63 F. Cheng, Y. Wei, Y. Zhang, F. Wang, T. Shen and C. Zong, J. Appl. Polym. Sci., 2013, 130, 1879–1889.
64 A. U. Badnore and A. B. Pandit, Chem. Eng. Process. Process Intensif., 2015, 98, 13–21.
65 D. Saihi, I. Vroman, S. Giraud and S. Bourbigot, React. Funct. Polym., 2005, 64, 127–138.
66 D. Crespy, M. Stark, C. Hoffmann-Richter, U. Ziener and K. Landfester, Macromolecules, 2007, 40, 3122–3135.
67 Y. Yamagishi, T. Sugeno, T. Ishige, H. Takeuchi and A. T. Pyatenko, Energy Convers. Eng. Conf. 1996. IECEC 96. Proc. 31st Intersoc., 1996, 3, 2077–2083 vol.3.
68 T. Wang, J. Huang, P. Zhu and J. Xiao, Colloid Polym. Sci., 2013, 291, 2463–2468.
69 B. Teo, S. Prescott, M. Ashokkumar and F. Grieser, Ultrason. Sonochem., 2008, 15, 89–94.
70 U. Paiphansiri, P. Tangboriboonrat and K. Landfester, Macromol. Biosci., 2006, 6, 33–40.
71 G. H. Zhang, S. A. F. Bon and C. Y. Zhao, Sol. Energy, 2012, 86, 1149–1154.
119 | P a g e
3. Poly(ethyl-2-
cyanoacrylate)
Nanocapsules
for Thermal
Energy Storage
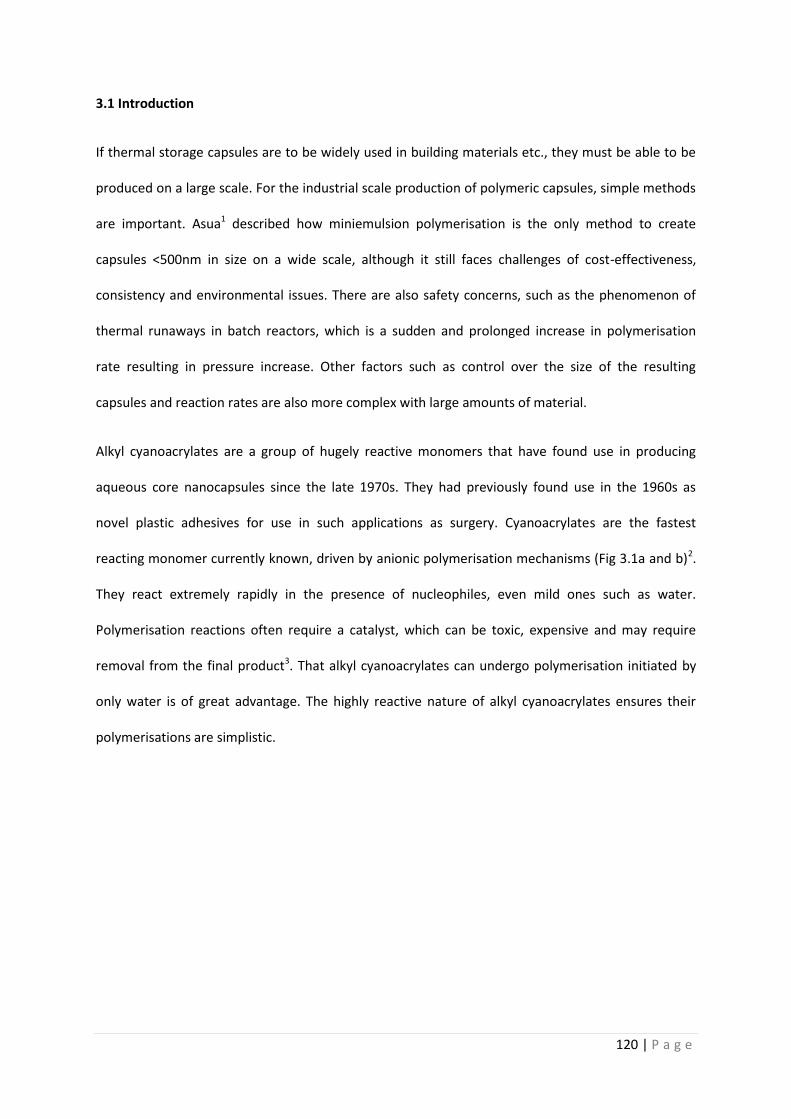
120 | P a g e
3.1 Introduction
If thermal storage capsules are to be widely used in building materials etc., they must be able to be
produced on a large scale. For the industrial scale production of polymeric capsules, simple methods
are important. Asua1 described how miniemulsion polymerisation is the only method to create
capsules <500nm in size on a wide scale, although it still faces challenges of cost-effectiveness,
consistency and environmental issues. There are also safety concerns, such as the phenomenon of
thermal runaways in batch reactors, which is a sudden and prolonged increase in polymerisation
rate resulting in pressure increase. Other factors such as control over the size of the resulting
capsules and reaction rates are also more complex with large amounts of material.
Alkyl cyanoacrylates are a group of hugely reactive monomers that have found use in producing
aqueous core nanocapsules since the late 1970s. They had previously found use in the 1960s as
novel plastic adhesives for use in such applications as surgery. Cyanoacrylates are the fastest
reacting monomer currently known, driven by anionic polymerisation mechanisms (Fig 3.1a and b)2.
They react extremely rapidly in the presence of nucleophiles, even mild ones such as water.
Polymerisation reactions often require a catalyst, which can be toxic, expensive and may require
removal from the final product3. That alkyl cyanoacrylates can undergo polymerisation initiated by
only water is of great advantage. The highly reactive nature of alkyl cyanoacrylates ensures their
polymerisations are simplistic.
121 | P a g e
Fig 3.1 (a) and (b) Suggested mechanisms for the formation of PACA (the monomer shown is ethyl-2-cyanoacrylate). (b)
was suggested by Behan et al2
Most poly(alkylcyanoacrylate) (PACA) nanocapsules have been fabricated for use as drug delivery
systems. They have proved particularly efficient for the encapsulation of hydrophilic materials,
particularly smaller molecules4,5 – but have been less successful in trapping larger molecules such as
proteins6. PACA polymers are also non-toxic and biodegradable. Drug entrapment is dependent on
the type of PACA used, the concentration of the drug and pH4,6. Shorter chain lengths give better
mechanical trapping due to faster polymerisation kinetics6,7. It is also possible for additional
adsorption of any active material not trapped inside the capsules, onto the capsule outer surface.
Materials adsorbed on the outside are released prior to degradation of the shell8, whilst
encapsulated material is released after the shell degrades. Hydrophilic drugs are often less stable
than their hydrophobic analogues upon encapsulation, as they must be suspended in water for
human consumption. Hydrophilic materials in the core may be released prematurely into the
external aqueous phase by diffusion9. Strong and non-permeable shell materials are therefore
desired for protection. In comparison to hydrophilic drugs, unwanted diffusion of core material may
not be as prominent for hydrophilic PCMs, as they may be added directly to materials (e.g.
wallboards, paints) for practical applications without the need for suspending in aqueous solution.
122 | P a g e
We chose ethyl-2-cyanoacrylate (ECA) as the monomer of choice to encapsulate salt hydrates due to
the simple nature of the reaction, its availability compared to other cyanoacrylates and its
prominence in the literature. Also, the short chain length of this monomer may lead to better
trapping of core material, as stated earlier. Most people will have unknowingly used ethyl-2-
cyanoacrylate at some time or another – it is believed to be the major component of superglue.
Simple reactions are preferred for large scale applications, as more complex reactions have a higher
cost10. Addition of ECA to a W/O emulsion will lead to spontaneous polymer shell formation at the
oil/water interface. Cyanoacrylates form nanoparticles in the region of 100-300nm in diameter2,8,11–
14. Some researchers have reduced the temperature or decreased the pH of the reaction mixture to
slow down polymerisation. We found this was unnecessary, and performing the reaction at room
temperature kept the procedure as simple as possible. Decreasing the pH has been found to reduce
molecular weight of the resulting PECA shell anyhow, forming a weaker shell which will degrade
more quickly15. ECA was dissolved in chloroform and added to the W/O emulsion. As the chloroform
evaporates, a poly(ethyl-2-cyanoacrylate) (PECA) shell is formed.
Two separate methods were used, both based on the well-established procedure of PECA
polymerisation. Kafka et al11 employed a large amount of surfactant (60 %wt of the oil phase) as
stabilisers. By simply adding Mg(NO3)2.6H2O and stirring, a W/O microemulsion was formed. In order
to significantly reduce the amount of surfactant used, a high energy input is required. Musyanovych
et al12 used poly(butyl cyanoacrylate) as their shell material, creating miniemulsions using
ultrasound, which required only 5 %wt surfactants in the oil phase. They also noted that a lower
amount of surfactants led to a higher molecular weight shell, which should result in improved
strength and stability. Using lower amounts of monomer also ensures the shell is of decreased
thickness15; increasing shell thickness decreases thermal transfer due to the low thermal
conductivity of the polymer. Increased stability of the shell is paramount, as after prolonged thermal
cycling shell deterioration may occur. Shell deterioration leads to decreased diffusion tightness,
123 | P a g e
absorption of H2O and potential release of active material16. Our inverse micro-/miniemulsion in situ
polymerisation was found to be a simple yet effective method for encapsulation.
ECA has previously been used to encapsulate a PCM. Makuta et al17 made cyanoacrylate covered
microcapsules with a xylitol core using a novel method. They first made xylitol-in-oil and
cyanoacrylate-in-oil emulsions before mixing them together. This resulted in capsule of 35µm
average diameter, with a latent heat of 115 J·g-1. Their results show cyanoacrylates are suitable for
use in thermal energy storage at temperatures up to 120°C. Looking at the synthesis of drug-loaded
PECA nanocapsules, it was clear that if a W/O miniemulsion containing crystallohydrate PCMs within
reverse micelle droplets was prepared, they could also be encapsulated at the nanoscale. Small
capsules should lead to improved thermal properties for two reasons: 1. higher heat transfer due to
increased SA:V ratio 2. confinement of the PCM into a nanosized core should assist faster melting
and freezing due to the small amount of material present18. We found that nanoencapsulation
improved physical and chemical properties of Mg(NO3)2.6H2O19,20.
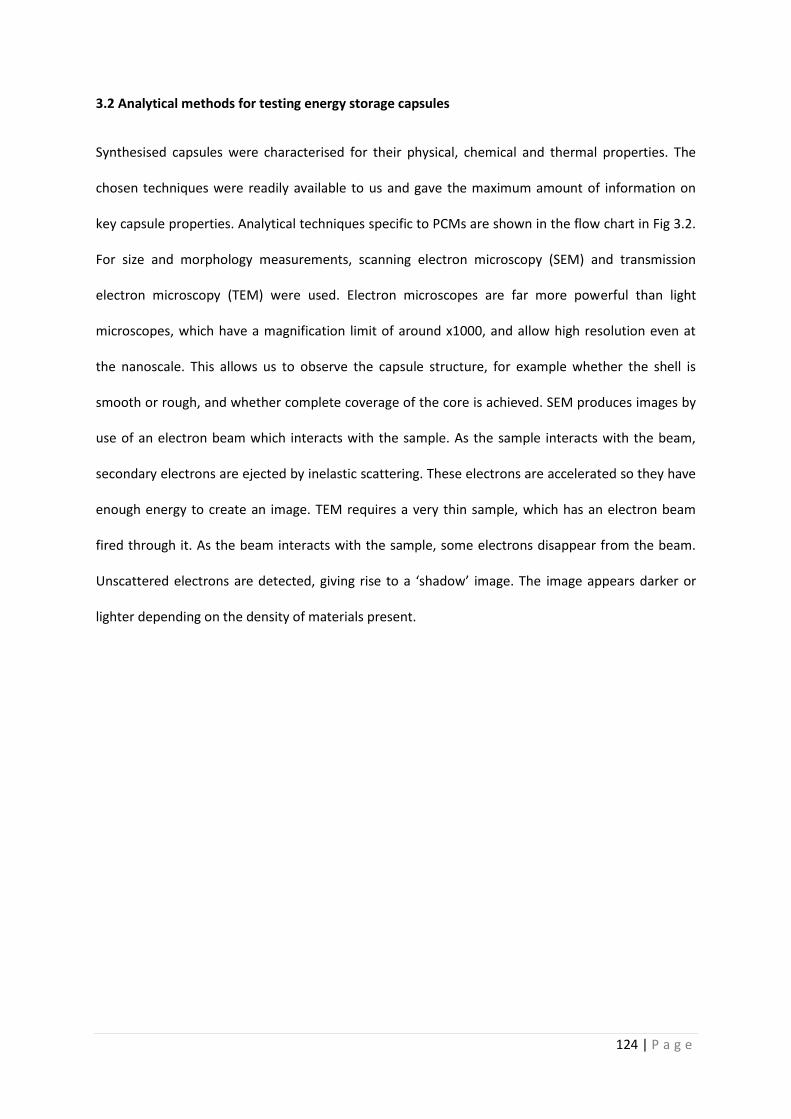
124 | P a g e
3.2 Analytical methods for testing energy storage capsules
Synthesised capsules were characterised for their physical, chemical and thermal properties. The
chosen techniques were readily available to us and gave the maximum amount of information on
key capsule properties. Analytical techniques specific to PCMs are shown in the flow chart in Fig 3.2.
For size and morphology measurements, scanning electron microscopy (SEM) and transmission
electron microscopy (TEM) were used. Electron microscopes are far more powerful than light
microscopes, which have a magnification limit of around x1000, and allow high resolution even at
the nanoscale. This allows us to observe the capsule structure, for example whether the shell is
smooth or rough, and whether complete coverage of the core is achieved. SEM produces images by
use of an electron beam which interacts with the sample. As the sample interacts with the beam,
secondary electrons are ejected by inelastic scattering. These electrons are accelerated so they have
enough energy to create an image. TEM requires a very thin sample, which has an electron beam
fired through it. As the beam interacts with the sample, some electrons disappear from the beam.
Unscattered electrons are detected, giving rise to a ‘shadow’ image. The image appears darker or
lighter depending on the density of materials present.
125 | P a g e
Fig 3.2 Flowchart describing techniques for thorough analysis of PCMs. Adapted from Khadiran et al21
Fourier transform infrared spectroscopy (FTIR) is a simple method to obtain the chemical structure
of materials. It can also be used to observe mechanisms in chemical reactions. Samples are exposed
to infrared light which molecules absorb, causing a change in dipole moment of certain functional
groups. Molecules with no dipole moment, such as O2, will not appear in the spectrum. Vibrational
energy levels of the molecule are transferred from the ground state to the excited state upon
absorption of infrared light. The vibrational energy gap determines the frequency of the absorption
peak, which is inherent for particular functional groups and allows the user to determine the
chemical structure of the sample. The commonly used wavenumber range for FTIR is between 4000-
400 cm-1, as most peaks for organic molecules and inorganic ions appear in this region.
Thermogravimetric analysis (TGA) is a common method of determining thermal stability, where
changes in chemical and physical properties are monitored as temperature is increased. This can
give information on changes of state such as decomposition and vaporisation. As the temperature
126 | P a g e
changes the material is constantly weighed and compared to a blank reference. The changes in mass
can then be recorded and assigned to the phase transition that has occurred.
Differential scanning calorimetry (DSC) is a vital method of characterisation for heat storage
materials, giving information on melting temperature (TM), freezing temperature (TF) and latent
heat. DSC measures the difference in heat flow required to keep the sample at the same
temperature as a blank reference. This is different from an earlier technique known as differential
thermal analysis (DTA), which measures the difference in temperature between a reference and a
sample when heat flow is kept constant. DSC gives a thermogram with endothermic (heating) and
exothermic (cooling) curves. The area underneath the curves is the latent heat for the phase
transition. The onset temperature (TM, onset for endothermic melting and TF, onset for exothermic
freezing), peak temperature (TM and TF) and end temperature (TM, end and TF, end), of the curves are
important as they outline the temperature range in which the PCM may be used. DSC peaks arising
from an ideal PCM would be sharp, give a large latent heat and have no supercooling. Sample sizes
for DSC are around 5-10mg so may not give an accurate representation of larger samples required
for practical applications. For instance, supercooling may be increased due to the small sample size.
As a consequence, the T-history method was developed, which uses samples in the region of 10-
100g. Sample sizes are approximately 1000 times larger than regular DSC samples, which are usually
5-10mg. Homemade instruments are used for T-history. They consist of a large tank containing the
sample, with a thermocouple added so that it is probing the centre of the sample. The material is
then thermally cycled and temperature changes recorded as a function of time22. As instruments
used by different research groups are different, accurate comparisons between results are difficult23.
Therefore, DSC must also be used in tandem. T-history gives a better representation of bulk
properties, which can then be used alongside the more accurate regular DSC measurements. Good
energy storage candidates then can be tested on a larger scale. For instance, PCMs for passive air
conditioning may be tested by adding to panels in a test building to observe the changes in
atmospheric temperature.
127 | P a g e
X-ray diffraction (XRD) is a commonly used technique for analysing crystalline structures, in which
powder samples are bombarded with electrons. It is an uncommon technique for analysing PCMs.
However, as salt hydrates are crystalline materials, we hypothesised their associated Bragg peaks
should be detected in the XRD pattern of our nanocapsules.
X-ray photoelectron spectroscopy (XPS) is another technique not regularly used in examining
polymer nanocapsules or PCMs, however provides valuable information about the %wt of each
element present in the sample. This was useful for determining how much salt hydrate was present
within synthesised nanocapsules. It was used in place of energy dispersive X-ray analysis (EDX),
which is used in conjunction with SEM and can provide an elemental map of a site of interest in the
sample. However, we found EDX was not sensitive enough to map the extremely small nanocapsules
we fabricated. XPS works by exciting the surface of a powder sample using X-rays. The top 5nm of
the sample is analysed – the energy of the emitted photoelectrons released from this region are
analysed. From this binding energy and intensity of the resulting peak, the chemical identity and
quantity of each element in the sample can be detected.
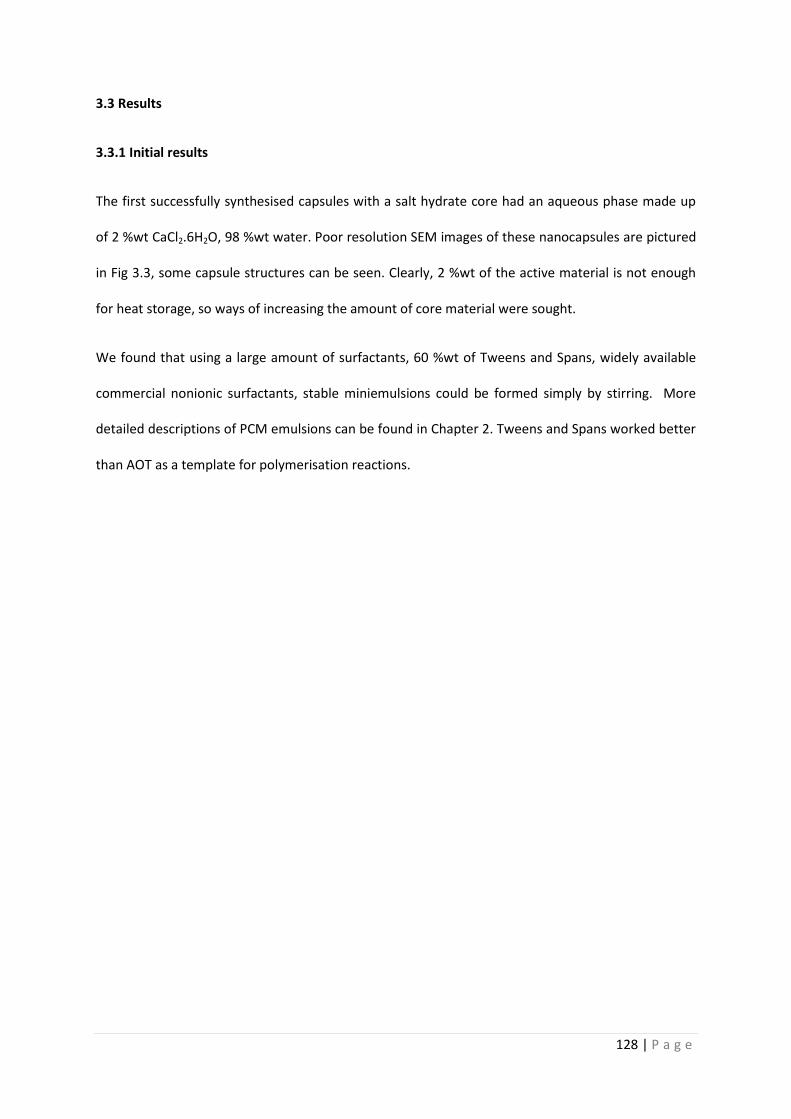
128 | P a g e
3.3 Results
3.3.1 Initial results
The first successfully synthesised capsules with a salt hydrate core had an aqueous phase made up
of 2 %wt CaCl2.6H2O, 98 %wt water. Poor resolution SEM images of these nanocapsules are pictured
in Fig 3.3, some capsule structures can be seen. Clearly, 2 %wt of the active material is not enough
for heat storage, so ways of increasing the amount of core material were sought.
We found that using a large amount of surfactants, 60 %wt of Tweens and Spans, widely available
commercial nonionic surfactants, stable miniemulsions could be formed simply by stirring. More
detailed descriptions of PCM emulsions can be found in Chapter 2. Tweens and Spans worked better
than AOT as a template for polymerisation reactions.
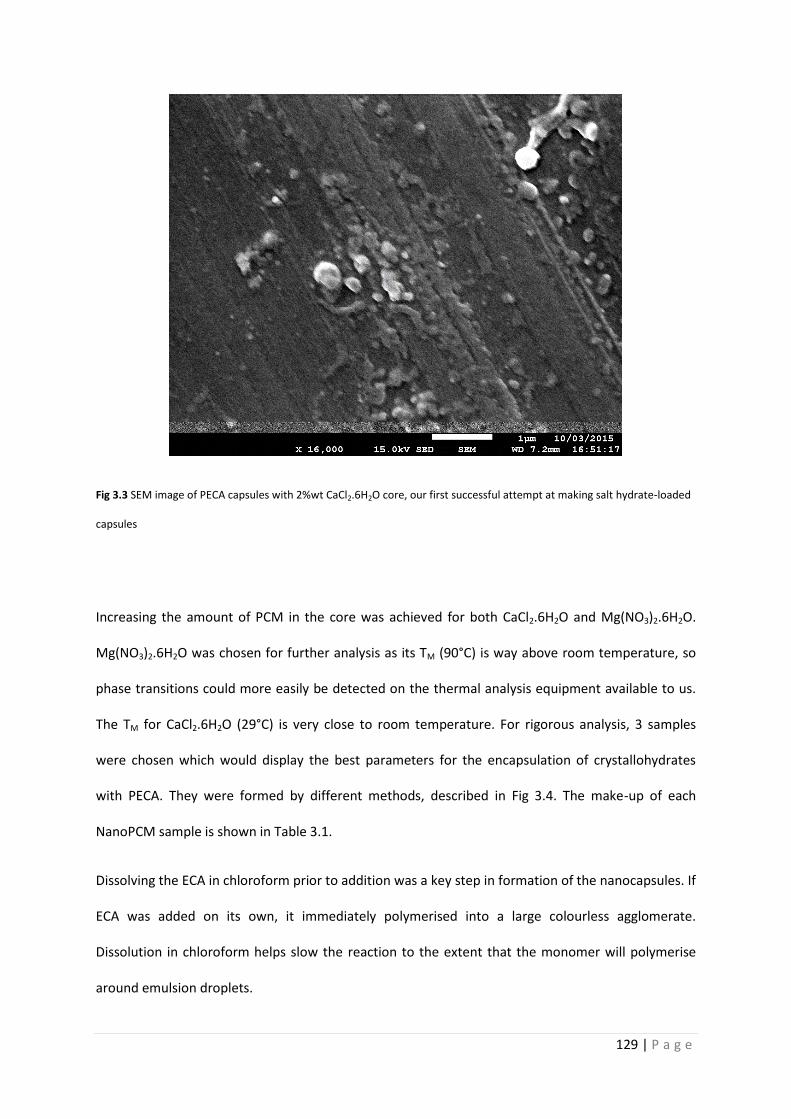
129 | P a g e
Fig 3.3 SEM image of PECA capsules with 2%wt CaCl2.6H2O core, our first successful attempt at making salt hydrate-loaded
capsules
Increasing the amount of PCM in the core was achieved for both CaCl2.6H2O and Mg(NO3)2.6H2O.
Mg(NO3)2.6H2O was chosen for further analysis as its TM (90°C) is way above room temperature, so
phase transitions could more easily be detected on the thermal analysis equipment available to us.
The TM for CaCl2.6H2O (29°C) is very close to room temperature. For rigorous analysis, 3 samples
were chosen which would display the best parameters for the encapsulation of crystallohydrates
with PECA. They were formed by different methods, described in Fig 3.4. The make-up of each
NanoPCM sample is shown in Table 3.1.
Dissolving the ECA in chloroform prior to addition was a key step in formation of the nanocapsules. If
ECA was added on its own, it immediately polymerised into a large colourless agglomerate.
Dissolution in chloroform helps slow the reaction to the extent that the monomer will polymerise
around emulsion droplets.
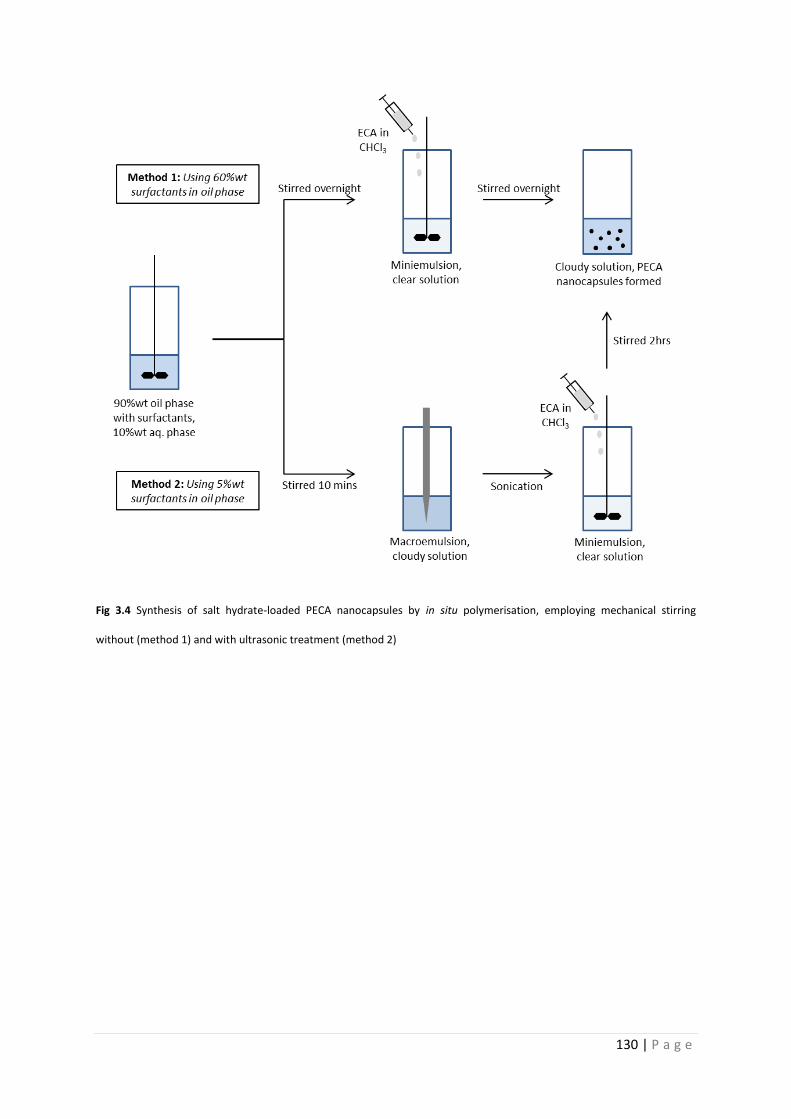
130 | P a g e
Fig 3.4 Synthesis of salt hydrate-loaded PECA nanocapsules by in situ polymerisation, employing mechanical stirring
without (method 1) and with ultrasonic treatment (method 2)
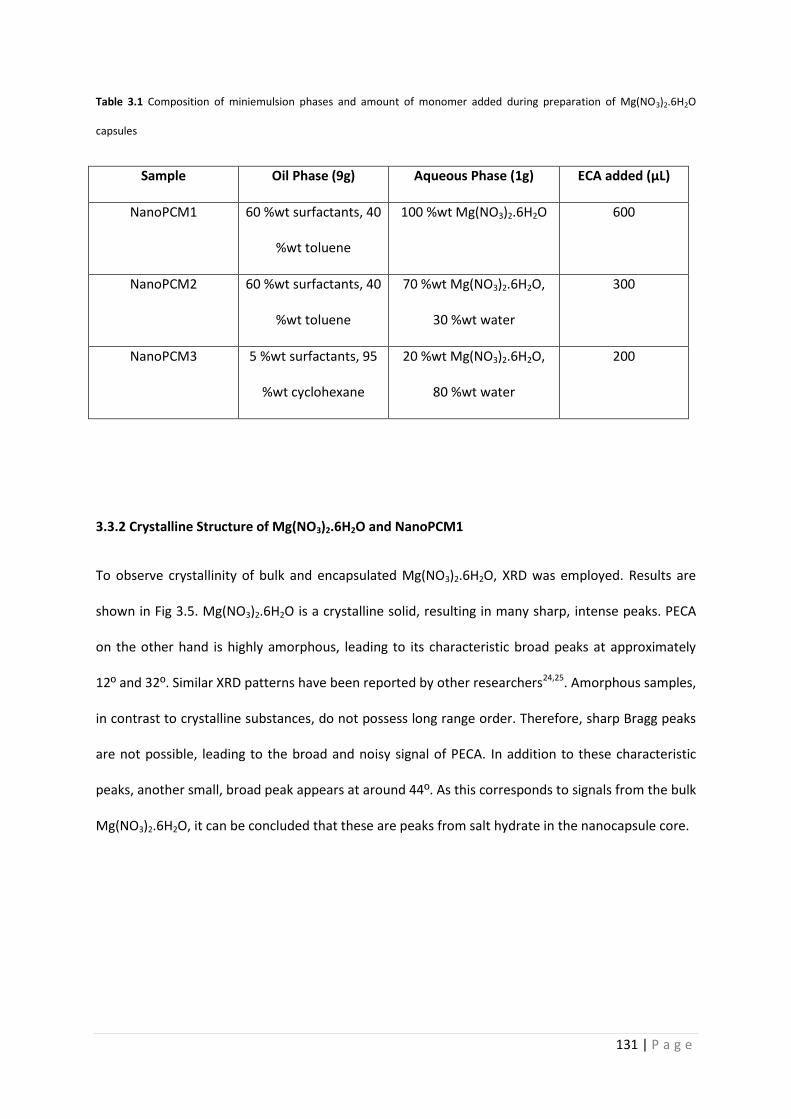
131 | P a g e
Table 3.1 Composition of miniemulsion phases and amount of monomer added during preparation of Mg(NO3)2.6H2O
capsules
Sample Oil Phase (9g) Aqueous Phase (1g) ECA added (µL)
NanoPCM1 60 %wt surfactants, 40
%wt toluene
100 %wt Mg(NO3)2.6H2O 600
NanoPCM2 60 %wt surfactants, 40
%wt toluene
70 %wt Mg(NO3)2.6H2O,
30 %wt water
300
NanoPCM3 5 %wt surfactants, 95
%wt cyclohexane
20 %wt Mg(NO3)2.6H2O,
80 %wt water
200
3.3.2 Crystalline Structure of Mg(NO3)2.6H2O and NanoPCM1
To observe crystallinity of bulk and encapsulated Mg(NO3)2.6H2O, XRD was employed. Results are
shown in Fig 3.5. Mg(NO3)2.6H2O is a crystalline solid, resulting in many sharp, intense peaks. PECA
on the other hand is highly amorphous, leading to its characteristic broad peaks at approximately
12º and 32º. Similar XRD patterns have been reported by other researchers24,25. Amorphous samples,
in contrast to crystalline substances, do not possess long range order. Therefore, sharp Bragg peaks
are not possible, leading to the broad and noisy signal of PECA. In addition to these characteristic
peaks, another small, broad peak appears at around 44º. As this corresponds to signals from the bulk
Mg(NO3)2.6H2O, it can be concluded that these are peaks from salt hydrate in the nanocapsule core.
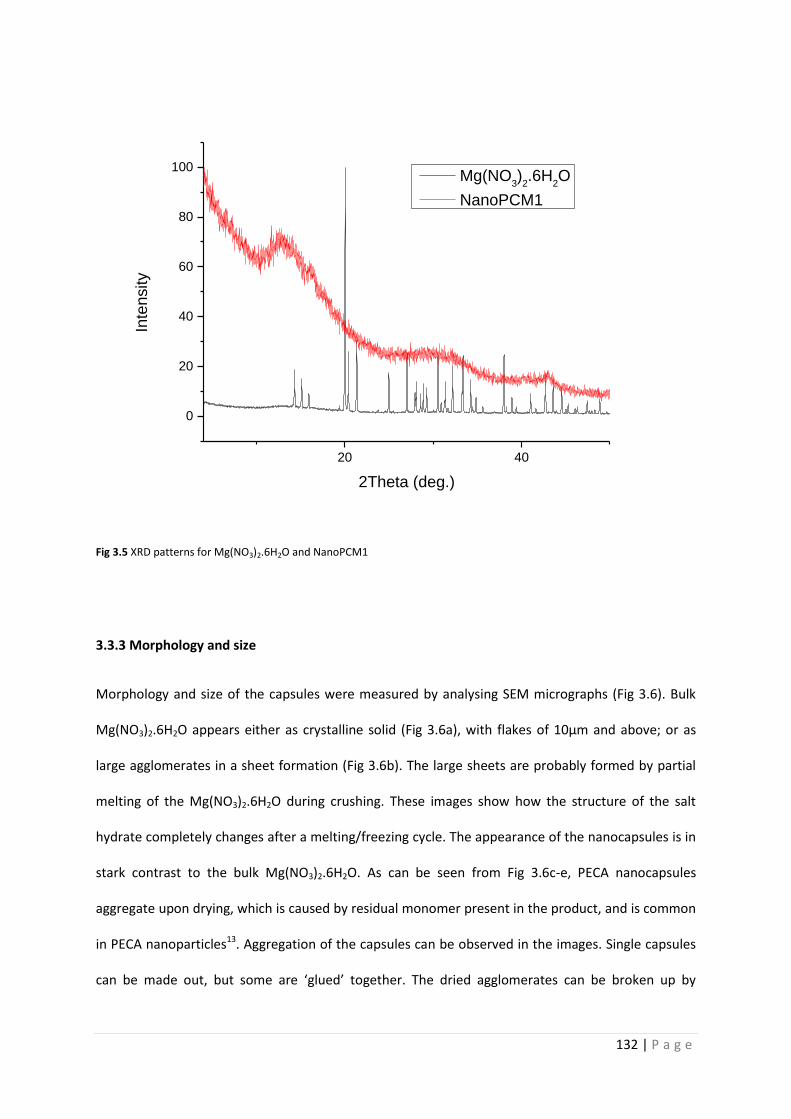
132 | P a g e
20 40
0
20
40
60
80
100
Inte
nsity
2Theta (deg.)
Mg(NO3)2.6H
2O
NanoPCM1
Fig 3.5 XRD patterns for Mg(NO3)2.6H2O and NanoPCM1
3.3.3 Morphology and size
Morphology and size of the capsules were measured by analysing SEM micrographs (Fig 3.6). Bulk
Mg(NO3)2.6H2O appears either as crystalline solid (Fig 3.6a), with flakes of 10µm and above; or as
large agglomerates in a sheet formation (Fig 3.6b). The large sheets are probably formed by partial
melting of the Mg(NO3)2.6H2O during crushing. These images show how the structure of the salt
hydrate completely changes after a melting/freezing cycle. The appearance of the nanocapsules is in
stark contrast to the bulk Mg(NO3)2.6H2O. As can be seen from Fig 3.6c-e, PECA nanocapsules
aggregate upon drying, which is caused by residual monomer present in the product, and is common
in PECA nanoparticles13. Aggregation of the capsules can be observed in the images. Single capsules
can be made out, but some are ‘glued’ together. The dried agglomerates can be broken up by
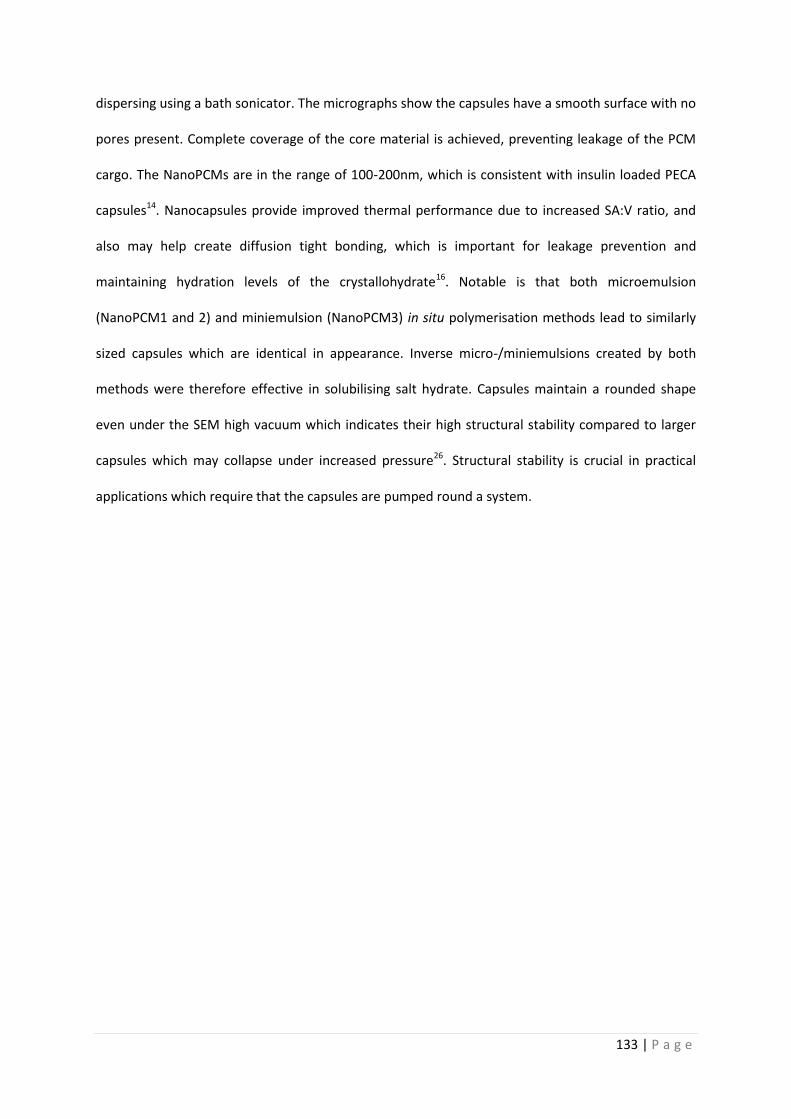
133 | P a g e
dispersing using a bath sonicator. The micrographs show the capsules have a smooth surface with no
pores present. Complete coverage of the core material is achieved, preventing leakage of the PCM
cargo. The NanoPCMs are in the range of 100-200nm, which is consistent with insulin loaded PECA
capsules14. Nanocapsules provide improved thermal performance due to increased SA:V ratio, and
also may help create diffusion tight bonding, which is important for leakage prevention and
maintaining hydration levels of the crystallohydrate16. Notable is that both microemulsion
(NanoPCM1 and 2) and miniemulsion (NanoPCM3) in situ polymerisation methods lead to similarly
sized capsules which are identical in appearance. Inverse micro-/miniemulsions created by both
methods were therefore effective in solubilising salt hydrate. Capsules maintain a rounded shape
even under the SEM high vacuum which indicates their high structural stability compared to larger
capsules which may collapse under increased pressure26. Structural stability is crucial in practical
applications which require that the capsules are pumped round a system.
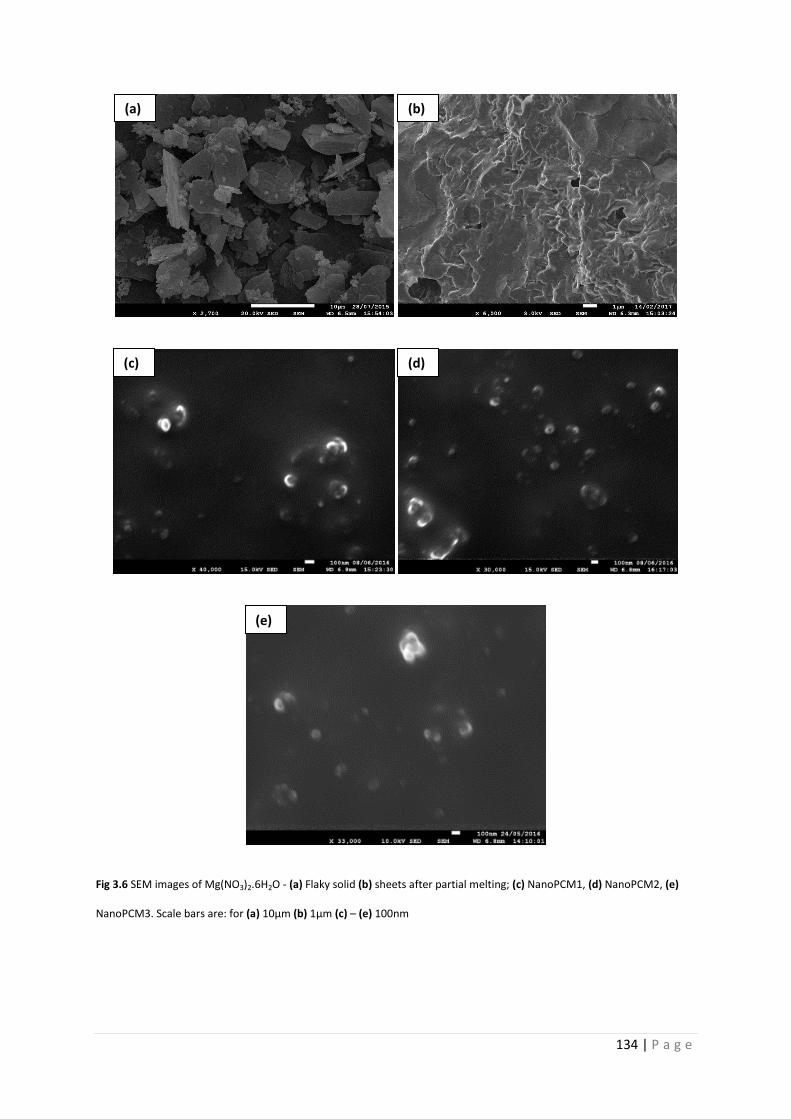
134 | P a g e
Fig 3.6 SEM images of Mg(NO3)2.6H2O - (a) Flaky solid (b) sheets after partial melting; (c) NanoPCM1, (d) NanoPCM2, (e)
NanoPCM3. Scale bars are: for (a) 10µm (b) 1µm (c) – (e) 100nm
(a) (b)
(d) (c)
(e)
135 | P a g e
Fig 3.7 TEM images of (a) NanoPCM1, and (b)-(c) NanoPCM2.
TEM images of NanoPCM1 and 2 are shown in Fig 3.7. Single capsules can be observed in Fig 3.7a
and c. They are approximately 200nm in diameter, identical to those seen in the SEM images. Darker
areas appearing on the images are caused by difference in densities of the salt hydrate core and
polymer shell. Fig 3.7b shows aggregated capsules of NanoPCM2.
(b)
(a)
(c)
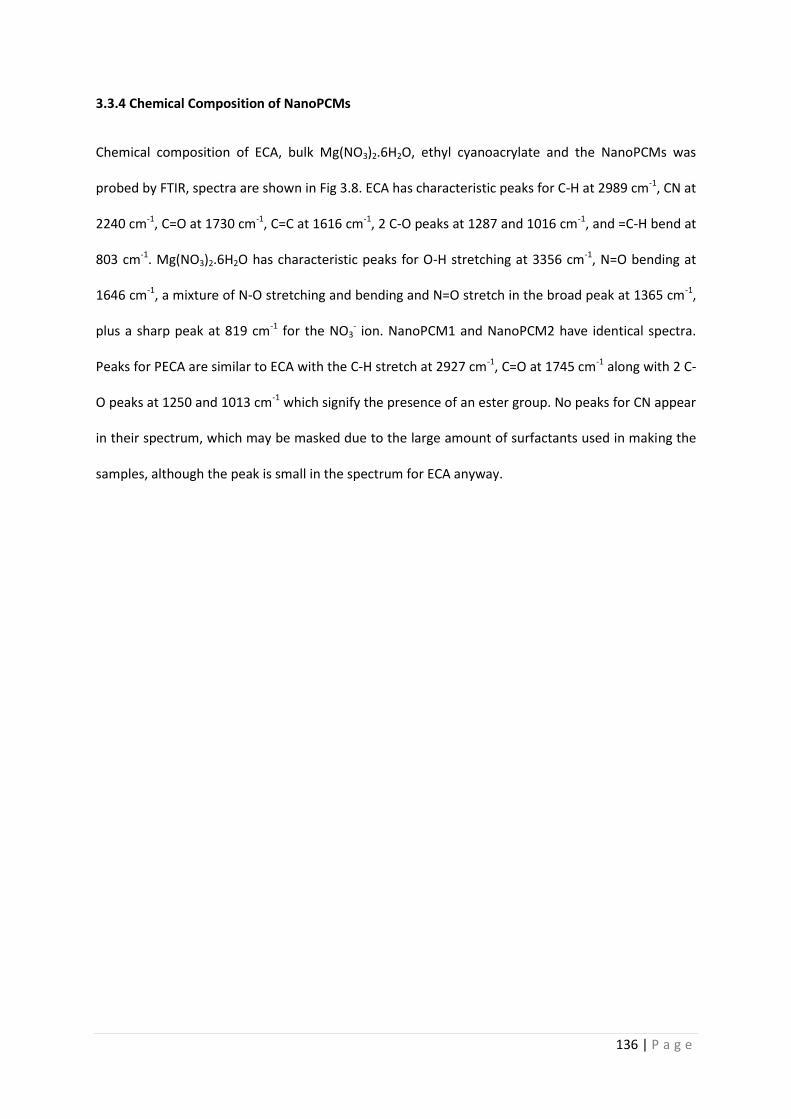
136 | P a g e
3.3.4 Chemical Composition of NanoPCMs
Chemical composition of ECA, bulk Mg(NO3)2.6H2O, ethyl cyanoacrylate and the NanoPCMs was
probed by FTIR, spectra are shown in Fig 3.8. ECA has characteristic peaks for C-H at 2989 cm-1, CN at
2240 cm-1, C=O at 1730 cm-1, C=C at 1616 cm-1, 2 C-O peaks at 1287 and 1016 cm-1, and =C-H bend at
803 cm-1. Mg(NO3)2.6H2O has characteristic peaks for O-H stretching at 3356 cm-1, N=O bending at
1646 cm-1, a mixture of N-O stretching and bending and N=O stretch in the broad peak at 1365 cm-1,
plus a sharp peak at 819 cm-1 for the NO3- ion. NanoPCM1 and NanoPCM2 have identical spectra.
Peaks for PECA are similar to ECA with the C-H stretch at 2927 cm-1, C=O at 1745 cm-1 along with 2 C-
O peaks at 1250 and 1013 cm-1 which signify the presence of an ester group. No peaks for CN appear
in their spectrum, which may be masked due to the large amount of surfactants used in making the
samples, although the peak is small in the spectrum for ECA anyway.
137 | P a g e
4000 3500 3000 2500 2000 1500 1000 500
(d)
(c)
(b)
Tra
nsm
itta
nce (
a.u
.)
Wavenumber (cm-1)
(a)
Fig 3.8 FTIR spectra for (a) ECA (b) Mg(NO3)2.6H2O (c) NanoPCM1 and (d) NanoPCM3.
NanoPCM3 has a similar spectrum with regards to NanoPCMs 1 and 2, confirming that the alternate
methods produce nanocapsules that are chemically similar. It has peaks for PECA at 2923, 1745,
1253 and 1079 cm-1 respectively, corresponding to the previously mentioned functional groups. It
also has a CN peak at 2360 cm-1, due to residual ECA monomer. The peaks attributed to
Mg(NO3)2.6H2O are more pronounced in the NanoPCM3 spectrum at 3373, 1643, 1345 and 827 cm-1.
Stronger peaks indicate that there is more Mg(NO3)2.6H2O present in the core and that the salt
hydrate has a similar composition to that of the bulk material. The minor wavelength shifts for
Mg(NO3)2.6H2O upon encapsulation are due to spatial confinement, which affects H-bonding. Spatial
confinement effects on organic PCMs were noted in an article by Felix et al27.
138 | P a g e
3.3.5 Thermal Analysis of NanoPCMs
Thermal properties of the capsules were studied by TGA and DSC. TGA curves are shown in Fig 3.9.
The bulk Mg(NO3)2.6H2O starts mass loss at approximately 70°C. By 160°C, 36% mass has been lost,
which corresponds to water loss and is in good agreement with the theoretical water content of
42%. The remaining mass is lost from 300 to 460°C. The decomposition of Mg(NO3)2.6H2O proceeds
at 330°C according to literature, our TGA curve is in good agreement with Han et al28. 14% mass
remains at 800°C, consisting mainly of magnesium oxide (MgO). Magnesium makes up 10% mass
content of Mg(NO3)2.6H2O according to the stoichiometry, so the obtained values fit nicely.
NanoPCM1 and 2 have very similar curves, due to the almost identical synthesis. Both lose 4% mass
by 150°C due to water evaporation. NanoPCM1 and 2 lose 65% and 60% mass, respectively, from
150-300°C. This is due to the PECA shell degrading, in agreement with previous research28.
NanoPCM1s higher mass loss was due to a larger amount of shell material being present, which is to
be expected as more monomer was added during synthesis. Further mass loss occurs from 330-
400°C due to magnesium nitrate decomposition. After complete heating to 800°C, NanoPCM1 and 2
have 2% and 8% mass remaining, consisting of MgO and carbon residue. NanoPCM2’s higher
remaining mass shows there was more Mg(NO3)2.6H2O present in the core in comparison with
NanoPCM1, which was confirmed by DSC thermal analysis.
NanoPCM3 was created using different methodology than NanoPCM1 and 2, leading to different
thermal behaviour. It lost mass more rapidly between 30-150°C, with 15% mass loss attributed to
water evaporation. The higher amount of water loss for NanoPCM3 can be rationalised as its
aqueous phase contained a far larger amount of excess water than NanoPCM1 and 2. Mass loss
increases at 150°C corresponding to the degradation of the PECA shell. Similar TGA curves have been
obtained for pure PECA, with degradation starting at around 150°C28,29. Between 150-300ºC,
NanoPCM3 loses 35% mass. Notable is that the PECA shell degrades much more slowly and has
better temperature resistance than NanoPCM1 and 2. This is a good indication that a higher
139 | P a g e
molecular weight shell has been formed. Other researchers have shown that low amounts of
surfactants and low volumes of added monomer lead to higher molecular weight shell12, which is
confirmed by the TGA curve for NanoPCM3. It is also possible the low amount of monomer prevents
too much crosslinking from occurring in the polymer, which can be difficult to separate onto the
emulsion droplet surface and hindering capsule formation30. Lower mass loss in comparison to
NanoPCM1 and 2 is also due to the increased Mg(NO3)2.6H2O in the core of NanoPCM3, which was
confirmed by DSC results. Upon degradation of the salt at 330°C, a further increase in mass loss
occurs. After heating to 800°C, 14% mass remains, which is much higher than NanoPCM1 & 2. Again,
this shows the increased level of crystallohydrate in the NanoPCM core, despite NanoPCM3 having a
lower amount of Mg(NO3)2.6H2O added during synthesis. This can be explained by the fact
NanoPCM3 also has a lower amount of monomer added, which leads to a thinner polymer shell. As
NanoPCM1-3 are all of similar sizes, thinner shell material leads to a larger cavity in the core,
solubilising more salt hydrate.
From 450-750ºC, NanoPCM3 has more remaining mass than bulk Mg(NO3)2.6H2O. This can be
explained by two factors. The error range of the TA Instruments SDT Q600 DSC instrument is ±2%.
Also, the polymer shell may act as an intumescent. Intumescents swell during heating, leading to a
volume increase. They act as a protective layer, and adding a hydrate core aids this effect by
releasing water vapour which cools the material.
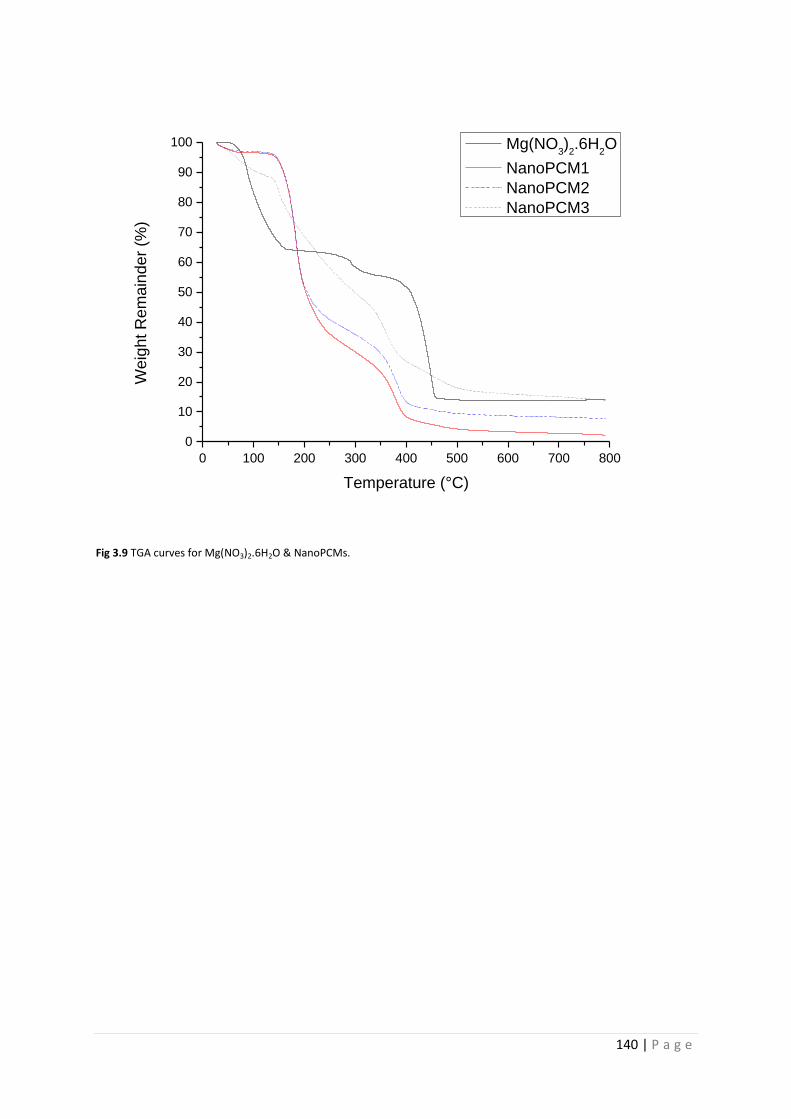
140 | P a g e
0 100 200 300 400 500 600 700 800
0
10
20
30
40
50
60
70
80
90
100W
eig
ht R
em
ain
de
r (%
)
Temperature (°C)
Mg(NO3)2.6H
2O
NanoPCM1
NanoPCM2
NanoPCM3
Fig 3.9 TGA curves for Mg(NO3)2.6H2O & NanoPCMs.
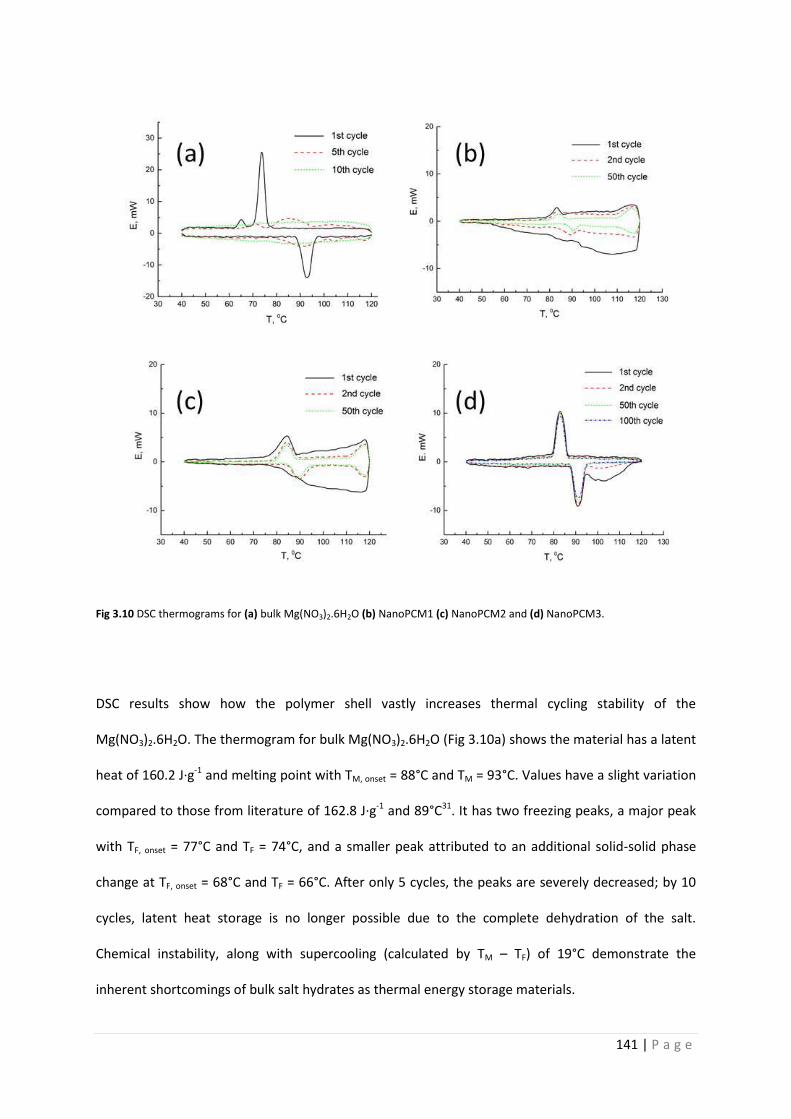
141 | P a g e
Fig 3.10 DSC thermograms for (a) bulk Mg(NO3)2.6H2O (b) NanoPCM1 (c) NanoPCM2 and (d) NanoPCM3.
DSC results show how the polymer shell vastly increases thermal cycling stability of the
Mg(NO3)2.6H2O. The thermogram for bulk Mg(NO3)2.6H2O (Fig 3.10a) shows the material has a latent
heat of 160.2 J·g-1 and melting point with TM, onset = 88°C and TM = 93°C. Values have a slight variation
compared to those from literature of 162.8 J·g-1 and 89°C31. It has two freezing peaks, a major peak
with TF, onset = 77°C and TF = 74°C, and a smaller peak attributed to an additional solid-solid phase
change at TF, onset = 68°C and TF = 66°C. After only 5 cycles, the peaks are severely decreased; by 10
cycles, latent heat storage is no longer possible due to the complete dehydration of the salt.
Chemical instability, along with supercooling (calculated by TM – TF) of 19°C demonstrate the
inherent shortcomings of bulk salt hydrates as thermal energy storage materials.
142 | P a g e
By confining the Mg(NO3)2.6H2O within a nanocontainer, its chemical stability and heat transfer
abilities are improved. In the first cycle for both NanoPCM1 and 2 (Fig 3.10b and c), a broad
endothermic peak appears between 60-120°C and 80-120°C, respectively. This can be attributed to
evaporation of excess water which is not associated to the salt hydrate. As the aqueous phase for
NanoPCM1 consisted solely of Mg(NO3)2.6H2O, any water that evaporates will necessarily dehydrate
the salt to some extent. This process decreases its latent heat storage abilities; resulting in
NanoPCM1 having the lowest latent heat capacity of all 3 NanoPCM samples. Excess water is still
being lost from NanoPCM1 in the 2nd thermal cycle; for NanoPCM2, water evaporation only occurs
on the first cycle. NanoPCM2 therefore has more water associated to the salt hydrate in the core. As
the aqueous phase for NanoPCM2 contained extra water (30 %wt), it is clear extra water preserves
the salt hydrate composition, an effect reported by several researchers32,33. Both NanoPCM1 and 2
have two melting and freezing peaks attributed to crystallohydrate. The peaks at approximately 90°C
are due to the presence of Mg(NO3)2.6H2O, whilst at 120°C the incomplete peaks are attributed to
another stable hydrate, Mg(NO3)2.2H2O (TM = 129°C). Lower hydrates are formed by incongruent
melting, which is an irreversible process. The mechanism of incongruent melting for Mg(NO3)2.6H2O
is shown in Eq. 3.1 and 3.234,35. The presence of two hydrates is undesirable as it gives two TMs, both
with low latent heat (after 50 cycles, ΔHM for the peak at 90°C was 26.3 J·g-1 for NanoPCM1 and 39.4
J·g-1 for NanoPCM2). As PCM applications require a small temperature range, the incongruent
melting effect limits effectiveness of salt hydrate PCMs.
Eq 3.1 Congruent melting of Mg(NO3)2.6H2O
143 | P a g e
Eq 3.2 Incongruent melting of Mg(NO3)2.6H2O, occurring in 2 stages.
NanoPCM3 displays improved characteristics (Fig 3.10d), with a latent heat of 83.2 J·g-1 after 50
cycles, with TM, onset = 87°C, TM = 91°C and TF, onset = 86°C, TF = 83°C. Encapsulation efficiency (EE) for
PCM capsules is often measured by the equation:
ΔHcapsules/ΔHbulk salt hydrate x 100
Eq 3.3 Commonly used equation to determine encapsulation efficiency for PCM capsules
However, EE for drug delivery systems is simply defined as the amount of added drug that has been
encapsulated. Using ∆H values means an EE of 100% could never be achieved due to the presence of
the polymer shell. Also, any incongruent melting would lead to a lower EE, despite entrapment of
the material. Results obtained using Eq 3.3 may better be described as ‘thermal capacity’, but will be
described as EE in this work for consistency with other research. EE for NanoPCM3 is 51.9%. The high
EE in comparison with the %wt of salt hydrate in the aqueous phase (51.9% EE compared to 20 %wt
Mg(NO3)2.6H2O added to the aqueous phase) has been observed by other researchers36. This may be
due to the salt hydrate acting as a ‘superlipophobe’, stabilising the W/O miniemulsion and
favourably encapsulating the crystallohydrate37. Also, cyanoacrylates are efficient at encapsulating
hydrophilic molecules due to the lack of diffusion processes by the monomer during polymerisation,
thanks to the fast reaction kinetics. Like NanoPCM1 and 2, there is also loss of excess water in the 1st
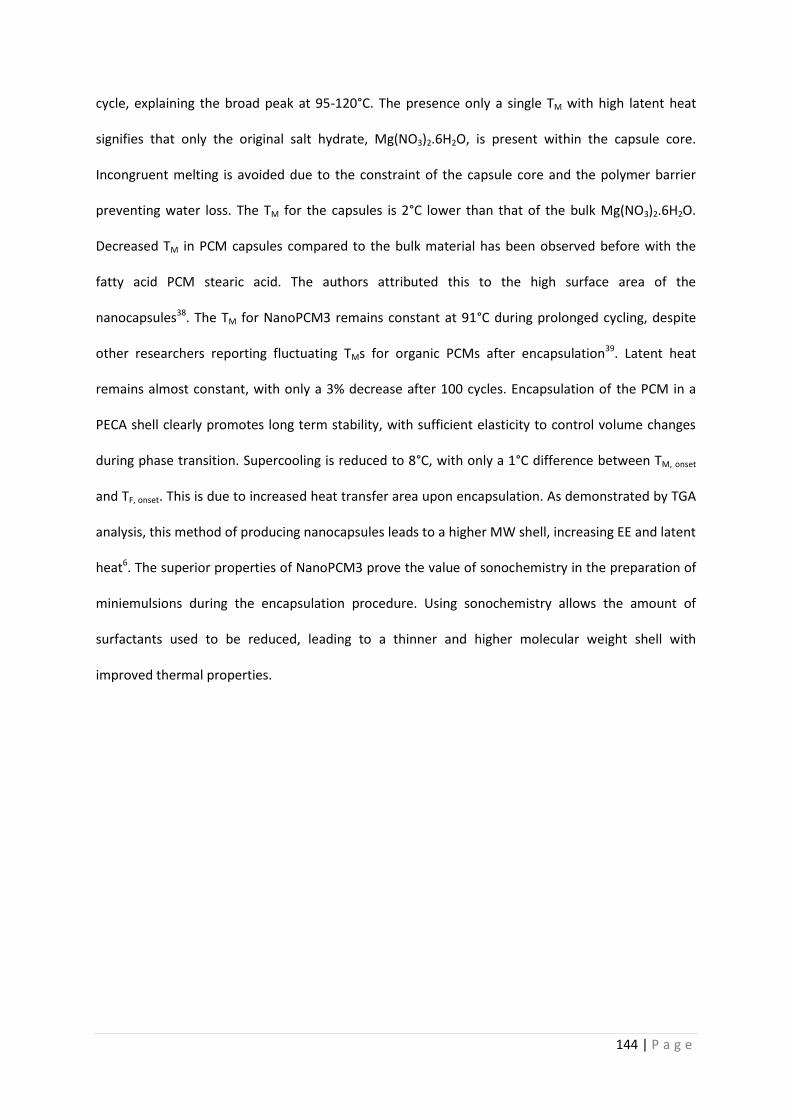
144 | P a g e
cycle, explaining the broad peak at 95-120°C. The presence only a single TM with high latent heat
signifies that only the original salt hydrate, Mg(NO3)2.6H2O, is present within the capsule core.
Incongruent melting is avoided due to the constraint of the capsule core and the polymer barrier
preventing water loss. The TM for the capsules is 2°C lower than that of the bulk Mg(NO3)2.6H2O.
Decreased TM in PCM capsules compared to the bulk material has been observed before with the
fatty acid PCM stearic acid. The authors attributed this to the high surface area of the
nanocapsules38. The TM for NanoPCM3 remains constant at 91°C during prolonged cycling, despite
other researchers reporting fluctuating TMs for organic PCMs after encapsulation39. Latent heat
remains almost constant, with only a 3% decrease after 100 cycles. Encapsulation of the PCM in a
PECA shell clearly promotes long term stability, with sufficient elasticity to control volume changes
during phase transition. Supercooling is reduced to 8°C, with only a 1°C difference between TM, onset
and TF, onset. This is due to increased heat transfer area upon encapsulation. As demonstrated by TGA
analysis, this method of producing nanocapsules leads to a higher MW shell, increasing EE and latent
heat6. The superior properties of NanoPCM3 prove the value of sonochemistry in the preparation of
miniemulsions during the encapsulation procedure. Using sonochemistry allows the amount of
surfactants used to be reduced, leading to a thinner and higher molecular weight shell with
improved thermal properties.
145 | P a g e
4000 3000 2000 1000
(b)
Tra
nsm
itta
nce (
a.u
.)
Wavenumber (cm-1)
(a)
Fig 3.11 FTIR spectra for NanoPCM3 (a) before and (b) after 100 thermal cycles.
3.3.6 Chemical stability of NanoPCMs
Chemical stability is of great importance for crystallohydrate PCMs, so they can maintain heat
storage properties over a vast number of cycles. Clearly this was demonstrated by DSC, especially by
NanoPCM3. After 100 melting/freezing cycles between 50 and 120°C, the FTIR spectrum of
NanoPCM3 was retaken to ensure the capsule and core material was chemically unchanged (Fig
3.11). Characteristic peaks of Mg(NO3)2.6H2O are present at 3373 cm-1 for O-H stretch, 1643 cm-1 for
N=O bending, a mixture of N-O stretching and bending and N=O stretch at 1345 cm-1, and NO3- at
827 cm-1. Peaks for PECA are also unchanged, with C-H stretch at 2923 cm-1, C=O at 1745 cm-1 and 2
C-O peaks at 1253 and 1079 cm-1. The identical spectrum after 100 thermal cycles demonstrates the
nanocapsule stability during the uptake and release of latent heat.
146 | P a g e
To observe the macroscale appearance of the NanoPCMs in comparison to bulk Mg(NO3)2.6H2O
during thermal cycling, pictures were taken of the capsules before and after heating to 100°C.
Results are displayed in Fig 3.12. Mg(NO3)2.6H2O is a crystalline solid before melting. After melting
and refreezing, the material coagulates into a compact block surrounded by water. This
demonstrates the volume change upon melting of a salt hydrate. This refrozen structure can limit
the diffusion of water vapour40, leading to dehydration of the salt hydrate. In contrast, the
nanoencapsulated Mg(NO3)2.6H2O display no increase in volume or change in appearance after
heating to 100°C. Absence of any leakage of the core material confirms the complete coverage of
the core by the polymer shell. The salt hydrate is therefore fully protected from the external
environment, helping prevent dehydration and leading to the increased thermal stability shown in
the DSC thermograms.
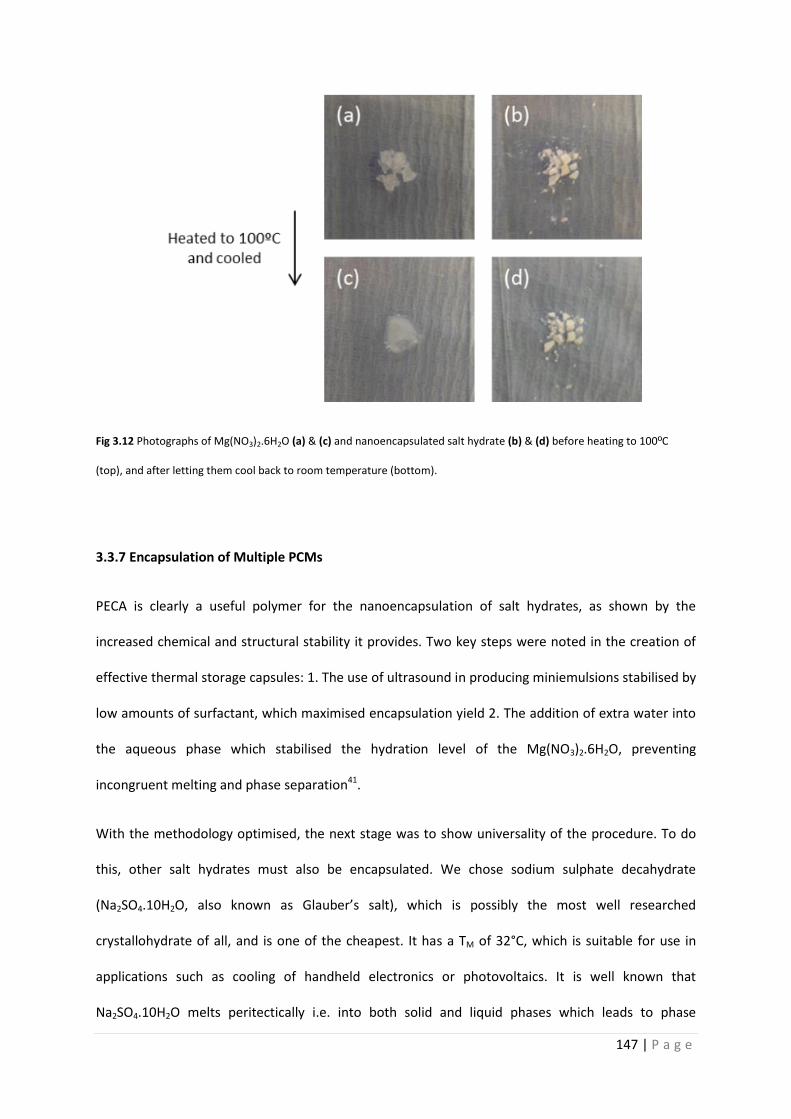
147 | P a g e
Fig 3.12 Photographs of Mg(NO3)2.6H2O (a) & (c) and nanoencapsulated salt hydrate (b) & (d) before heating to 100ºC
(top), and after letting them cool back to room temperature (bottom).
3.3.7 Encapsulation of Multiple PCMs
PECA is clearly a useful polymer for the nanoencapsulation of salt hydrates, as shown by the
increased chemical and structural stability it provides. Two key steps were noted in the creation of
effective thermal storage capsules: 1. The use of ultrasound in producing miniemulsions stabilised by
low amounts of surfactant, which maximised encapsulation yield 2. The addition of extra water into
the aqueous phase which stabilised the hydration level of the Mg(NO3)2.6H2O, preventing
incongruent melting and phase separation41.
With the methodology optimised, the next stage was to show universality of the procedure. To do
this, other salt hydrates must also be encapsulated. We chose sodium sulphate decahydrate
(Na2SO4.10H2O, also known as Glauber’s salt), which is possibly the most well researched
crystallohydrate of all, and is one of the cheapest. It has a TM of 32°C, which is suitable for use in
applications such as cooling of handheld electronics or photovoltaics. It is well known that
Na2SO4.10H2O melts peritectically i.e. into both solid and liquid phases which leads to phase

148 | P a g e
separation32. With extra water added this process can be eliminated. NanoPCM3 was also remade to
demonstrate reproducibility of the nanocapsules, which is highly important for capsules produced
on an industrial scale. We also encapsulated mixtures of the two salts, described in more detail
below. Composition of NanoPCM4-7 is shown in Table 3.2.
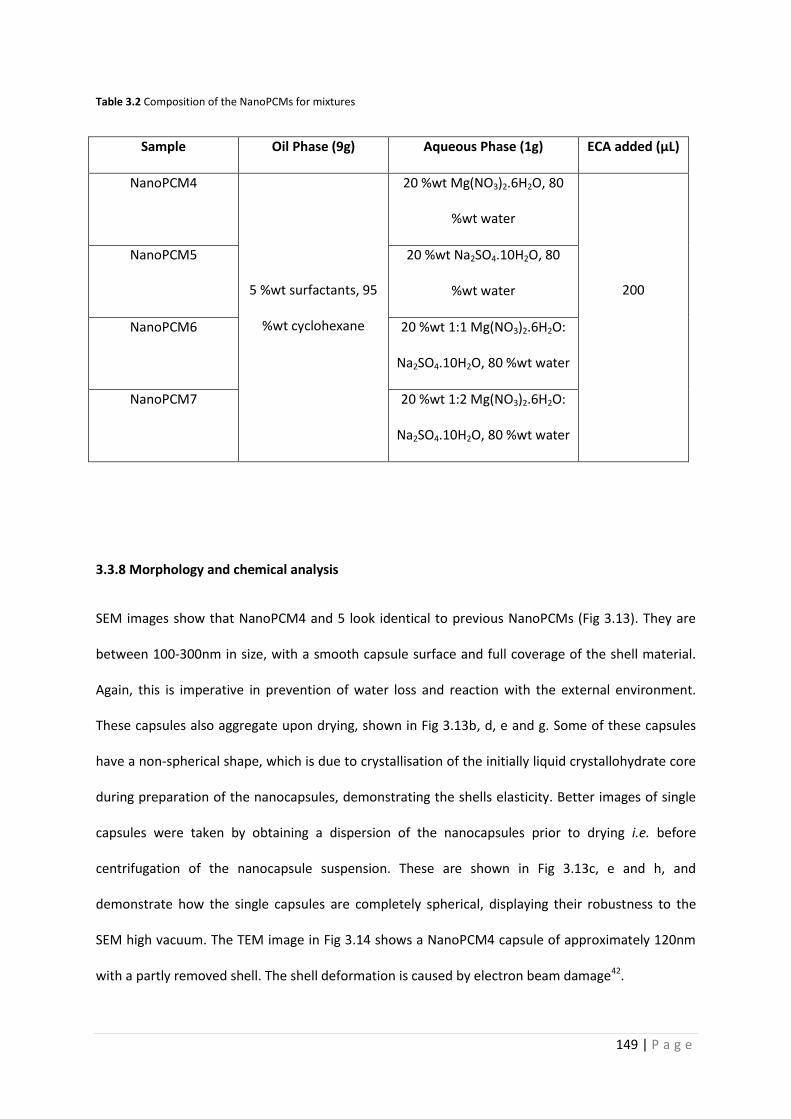
149 | P a g e
Table 3.2 Composition of the NanoPCMs for mixtures
Sample Oil Phase (9g) Aqueous Phase (1g) ECA added (µL)
NanoPCM4
5 %wt surfactants, 95
%wt cyclohexane
20 %wt Mg(NO3)2.6H2O, 80
%wt water
200
NanoPCM5 20 %wt Na2SO4.10H2O, 80
%wt water
NanoPCM6 20 %wt 1:1 Mg(NO3)2.6H2O:
Na2SO4.10H2O, 80 %wt water
NanoPCM7 20 %wt 1:2 Mg(NO3)2.6H2O:
Na2SO4.10H2O, 80 %wt water
3.3.8 Morphology and chemical analysis
SEM images show that NanoPCM4 and 5 look identical to previous NanoPCMs (Fig 3.13). They are
between 100-300nm in size, with a smooth capsule surface and full coverage of the shell material.
Again, this is imperative in prevention of water loss and reaction with the external environment.
These capsules also aggregate upon drying, shown in Fig 3.13b, d, e and g. Some of these capsules
have a non-spherical shape, which is due to crystallisation of the initially liquid crystallohydrate core
during preparation of the nanocapsules, demonstrating the shells elasticity. Better images of single
capsules were taken by obtaining a dispersion of the nanocapsules prior to drying i.e. before
centrifugation of the nanocapsule suspension. These are shown in Fig 3.13c, e and h, and
demonstrate how the single capsules are completely spherical, displaying their robustness to the
SEM high vacuum. The TEM image in Fig 3.14 shows a NanoPCM4 capsule of approximately 120nm
with a partly removed shell. The shell deformation is caused by electron beam damage42.
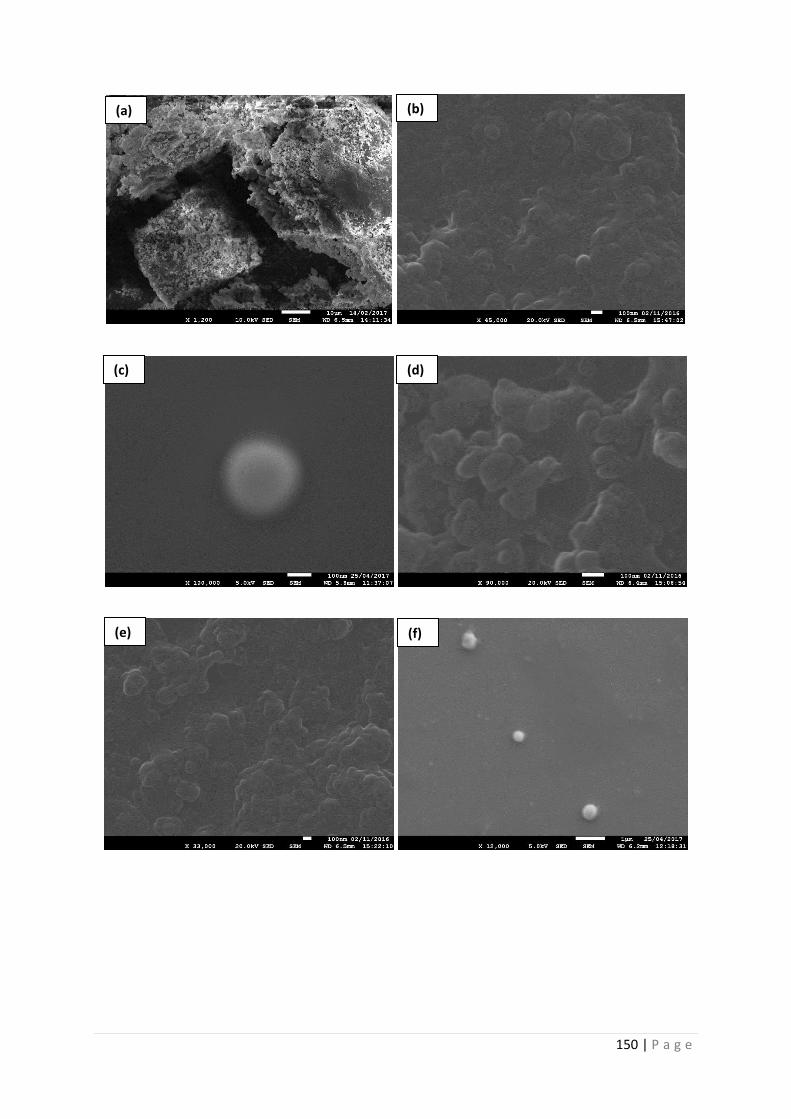
150 | P a g e
(a)
(c)
(e) (f)
(d)
(b)
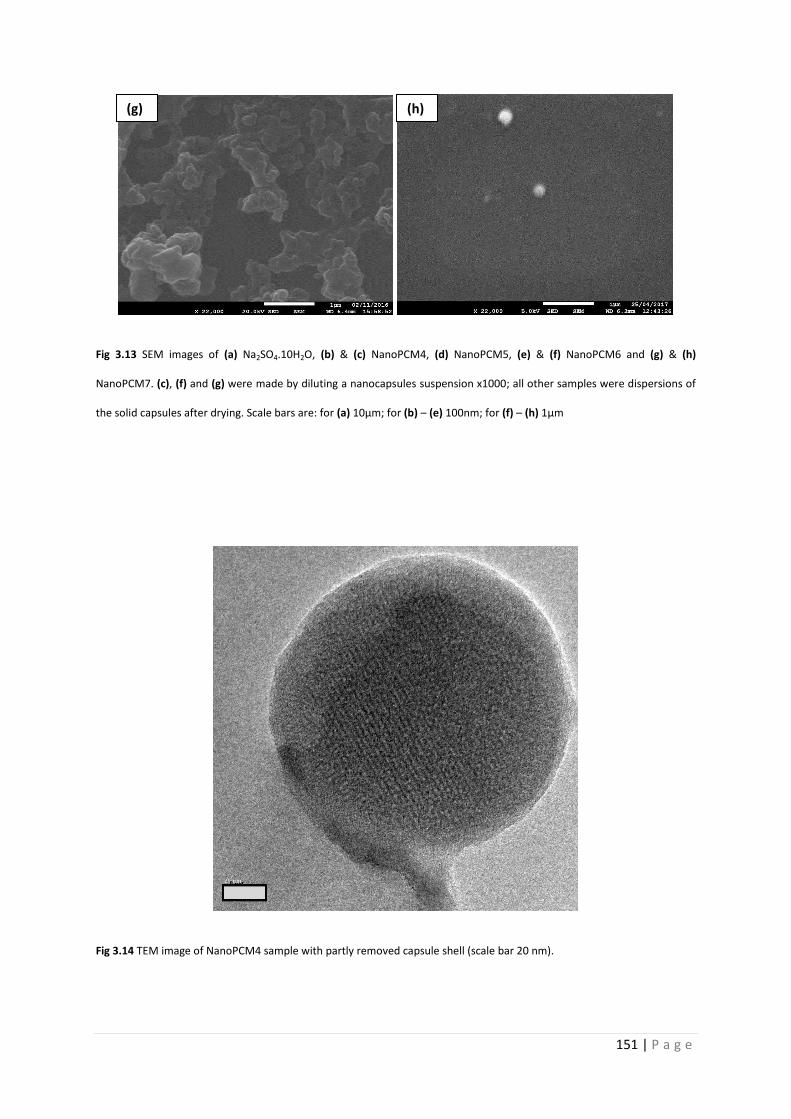
151 | P a g e
Fig 3.13 SEM images of (a) Na2SO4.10H2O, (b) & (c) NanoPCM4, (d) NanoPCM5, (e) & (f) NanoPCM6 and (g) & (h)
NanoPCM7. (c), (f) and (g) were made by diluting a nanocapsules suspension x1000; all other samples were dispersions of
the solid capsules after drying. Scale bars are: for (a) 10µm; for (b) – (e) 100nm; for (f) – (h) 1µm
Fig 3.14 TEM image of NanoPCM4 sample with partly removed capsule shell (scale bar 20 nm).
(g) (h)
152 | P a g e
FTIR spectra for the bulk salt hydrates and NanoPCMs is shown in Fig 3.15. Peaks for Mg(NO3)2.6H2O
(Fig 3.15a) are described in the chemical analysis section for NanoPCMs 1-3. Na2SO4.10H2O (Fig
3.15b) has peaks for O-H at 3334 cm-1, a mix of S-O and S=O at 1078 cm-1 and the SO42- group at 613
cm-1. All NanoPCMs were fabricated by identical methodology so form a similar capsule shell. PECA
peaks are seen for all NanoPCMs (Fig 3.15c-f), C-H stretch at 2927 cm-1, C=O at 1747 cm-1 and C-O
ester peaks at 1249 and 1013 cm-1. Only NanoPCM6 has a peak for CN at 2361 cm-1, which can be
explained by the presence of unreacted ECA residue in the capsule shell.
Peaks for the core material within the NanoPCMs correspond to the encapsulated salt hydrates.
NanoPCM4 contains Mg(NO3)2.6H2O, as shown by peaks a 3387 cm-1 for O-H, N=O bend at 1657 cm-1,
mix of N-O stretching and bending and N=O stretch at 1373 cm-1, and NO3- at 827 cm-1. NanoPCM5
contains Na2SO4.10H2O, with a very small O-H peak at 3539 cm-1, S-O and S=O in the broad peak at
around 1121 cm-1 and SO42- at 620 cm-1. NanoPCM6 and 7 contain both Mg(NO3)2.6H2O and
Na2SO4.10H2O. They have peaks at 3259 and 3327 cm-1 respectively for O-H, 1651 and 1657 cm-1 for
N=O bend, 1370 and 1373 cm-1 for a mix of N-O stretching and bending and N=O, 1084 cm-1 for S-O
and S=O, and 613 cm-1 for SO42-. NanoPCM6 has a small peak at 827 cm-1 for NO3
-, this shifts to 830
cm-1 for NanoPCM7 with the increase of Na2SO4.10H2O in the core (described in more detail below).
All FTIR signals reflect the core/shell composition of each nanocapsule sample. Deviations between
wavenumbers for the bulk and nanoencapsulated crystallohydrates are due to spatial confinement
effects, which influence H-bonding in the capsule core. Clearly, if a stable miniemulsion containing a
salt hydrate or a mixture within the miniemulsion droplets is formed, it can be encapsulated to give
the material improved thermal properties and chemical stability.

153 | P a g e
Fig 3.15 FTIR spectra for (a) Mg(NO3)2·6H2O, (b) Na2SO4·10H2O, (c) NanoPCM4, (d) NanoPCM5, (e) NanoPCM6 and (f)
NanoPCM7
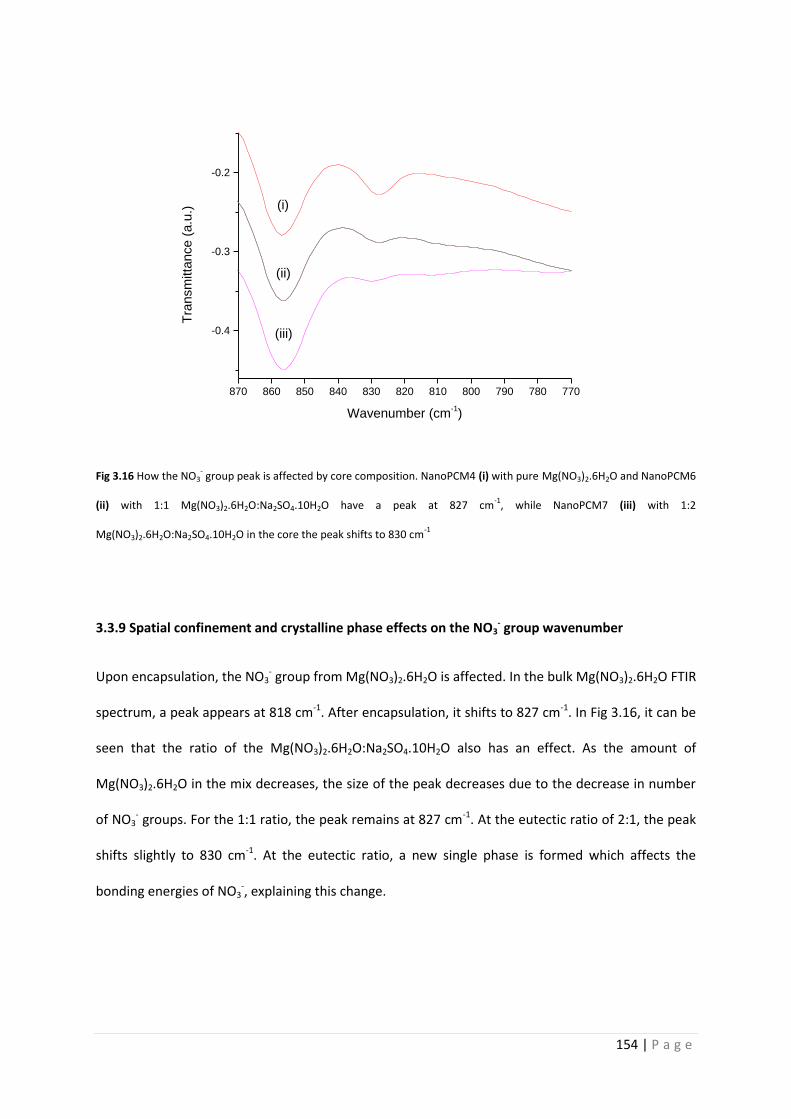
154 | P a g e
870 860 850 840 830 820 810 800 790 780 770
-0.4
-0.3
-0.2
(iii)
(ii)
Tra
nsm
itta
nce (
a.u
.)
Wavenumber (cm-1)
(i)
Fig 3.16 How the NO3- group peak is affected by core composition. NanoPCM4 (i) with pure Mg(NO3)2.6H2O and NanoPCM6
(ii) with 1:1 Mg(NO3)2.6H2O:Na2SO4.10H2O have a peak at 827 cm-1
, while NanoPCM7 (iii) with 1:2
Mg(NO3)2.6H2O:Na2SO4.10H2O in the core the peak shifts to 830 cm-1
3.3.9 Spatial confinement and crystalline phase effects on the NO3- group wavenumber
Upon encapsulation, the NO3- group from Mg(NO3)2.6H2O is affected. In the bulk Mg(NO3)2.6H2O FTIR
spectrum, a peak appears at 818 cm-1. After encapsulation, it shifts to 827 cm-1. In Fig 3.16, it can be
seen that the ratio of the Mg(NO3)2.6H2O:Na2SO4.10H2O also has an effect. As the amount of
Mg(NO3)2.6H2O in the mix decreases, the size of the peak decreases due to the decrease in number
of NO3- groups. For the 1:1 ratio, the peak remains at 827 cm-1. At the eutectic ratio of 2:1, the peak
shifts slightly to 830 cm-1. At the eutectic ratio, a new single phase is formed which affects the
bonding energies of NO3-, explaining this change.

155 | P a g e
3.3.10 Further Chemical Analysis
Further study was also made on the chemical composition of the NanoPCM samples, using XPS (Fig
3.17-3.19, Table 3.3). XPS confirmed the presence of all expected elements in the samples, with
corresponding peaks labelled on the spectra. Values are consistent with thermal and chemical
analysis. % values for C and O may be higher than expected due to the formation of carbonates. The
PECA shell also chars due to the X-ray beam, which is common for polymers during XPS.
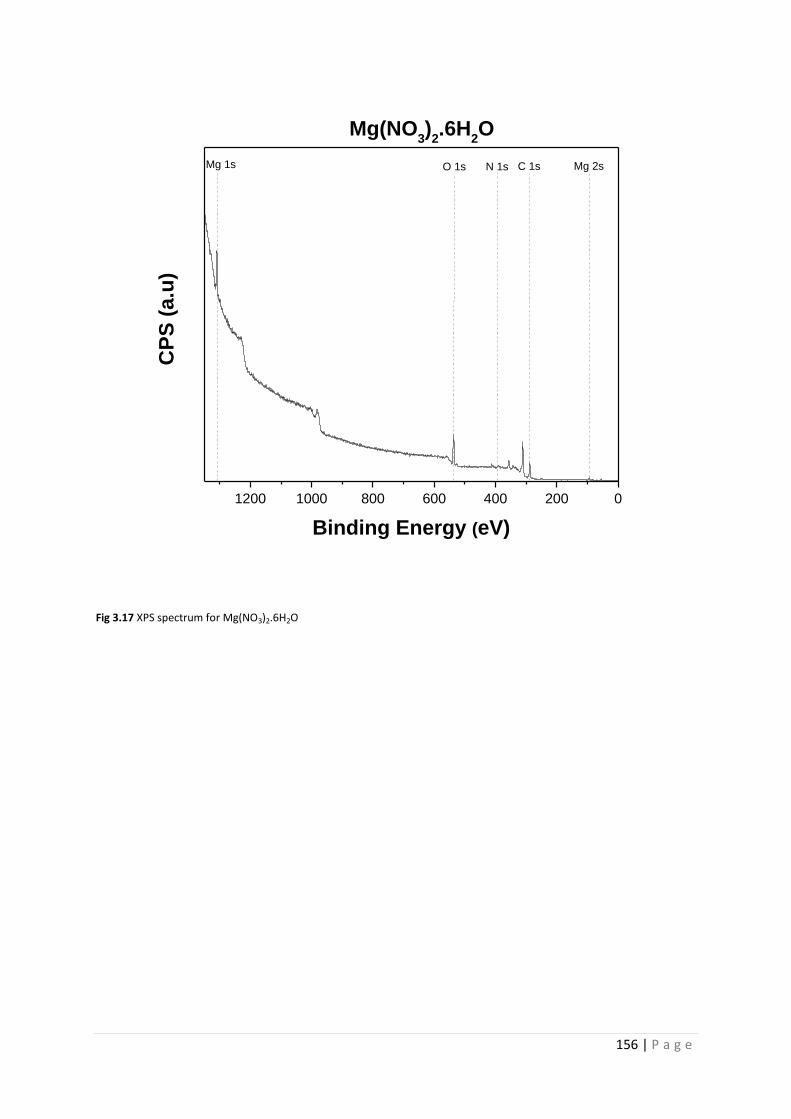
156 | P a g e
1200 1000 800 600 400 200 0
Mg 1s Mg 2sN 1sO 1sC
PS
(a.u
)
Binding Energy (eV)
Mg(NO3)
2.6H
2O
C 1s
Fig 3.17 XPS spectrum for Mg(NO3)2.6H2O
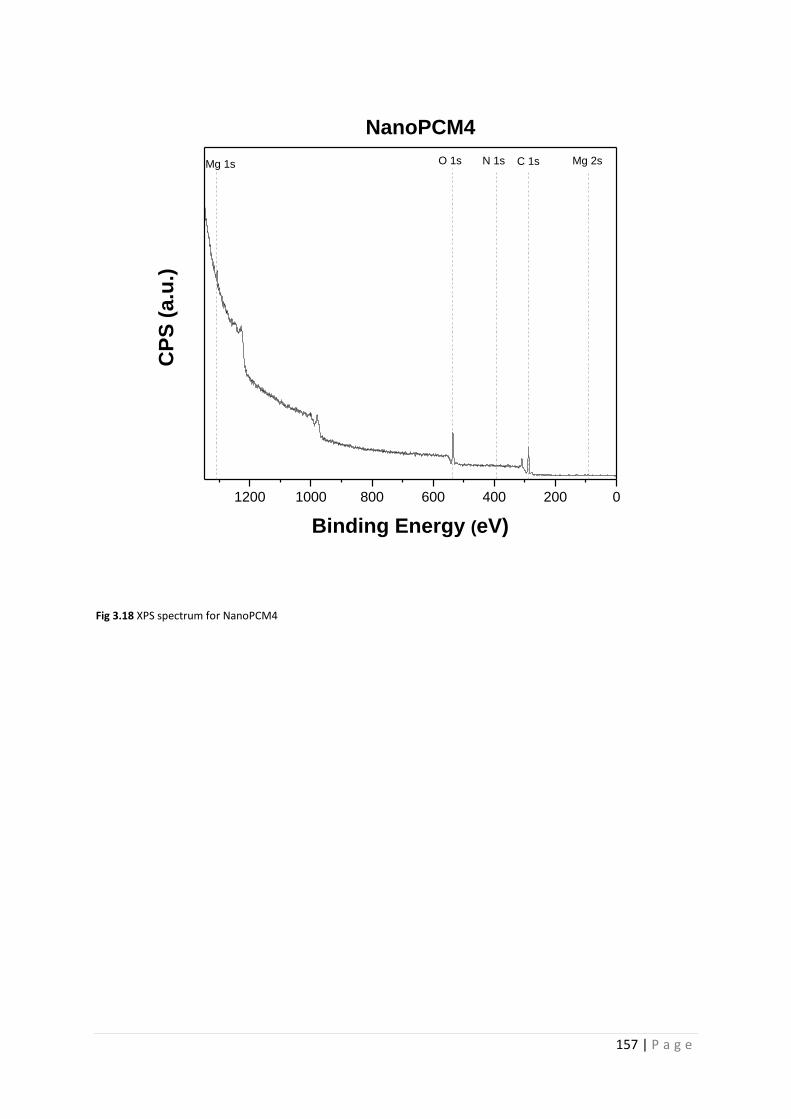
157 | P a g e
1200 1000 800 600 400 200 0
Mg 1s Mg 2sN 1sO 1sC
PS
(a.u
.)
Binding Energy (eV)
NanoPCM4
C 1s
Fig 3.18 XPS spectrum for NanoPCM4
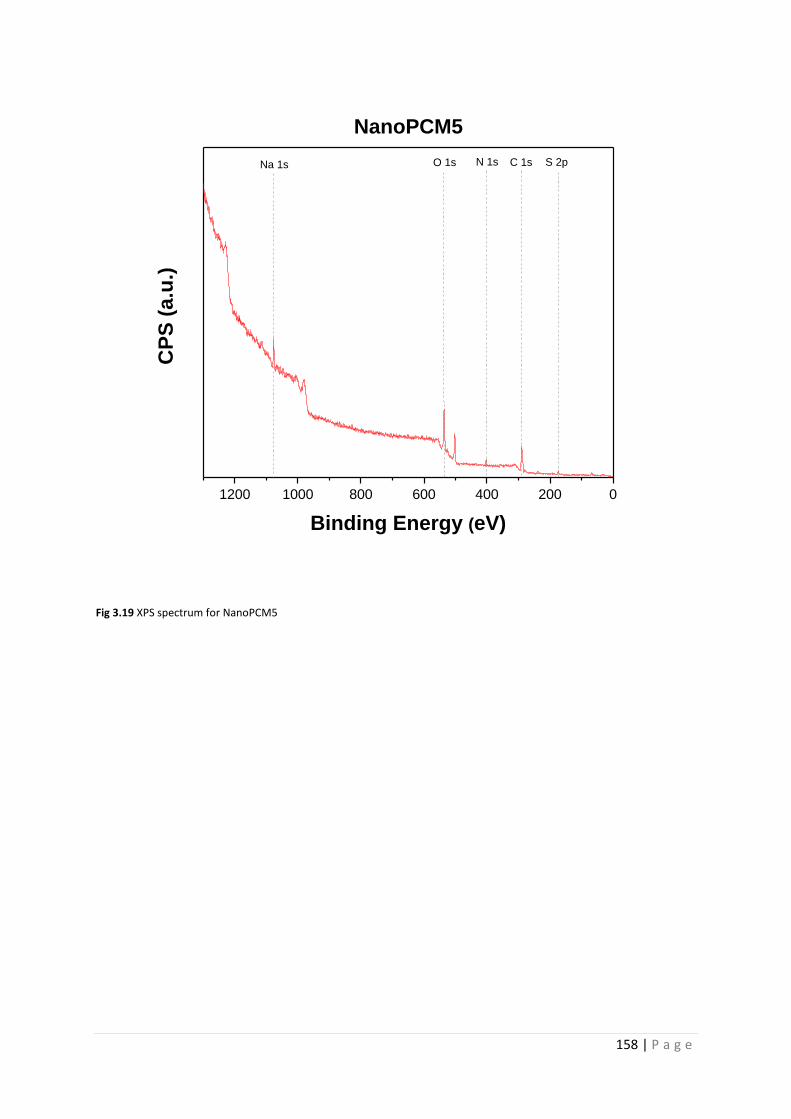
158 | P a g e
1200 1000 800 600 400 200 0
Na 1s S 2pN 1sO 1sC
PS
(a.u
.)
Binding Energy (eV)
NanoPCM5
C 1s
Fig 3.19 XPS spectrum for NanoPCM5
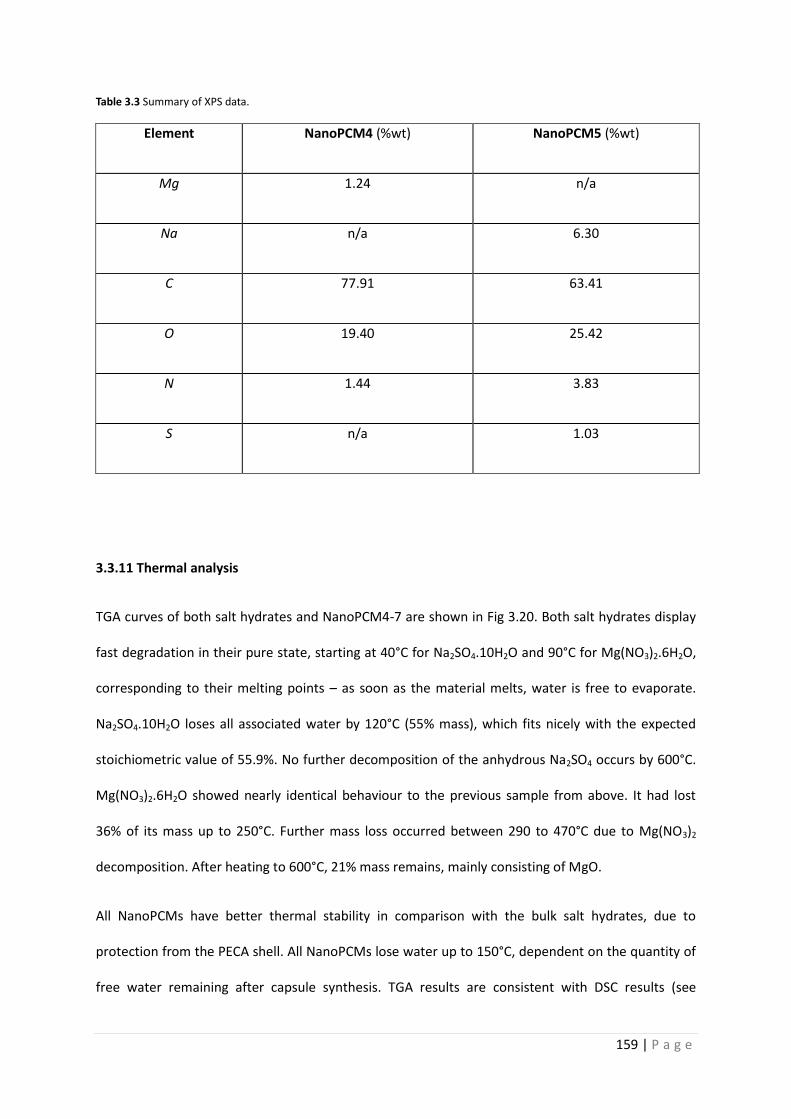
159 | P a g e
Table 3.3 Summary of XPS data.
Element NanoPCM4 (%wt) NanoPCM5 (%wt)
Mg 1.24 n/a
Na n/a 6.30
C 77.91 63.41
O 19.40 25.42
N 1.44 3.83
S n/a 1.03
3.3.11 Thermal analysis
TGA curves of both salt hydrates and NanoPCM4-7 are shown in Fig 3.20. Both salt hydrates display
fast degradation in their pure state, starting at 40°C for Na2SO4.10H2O and 90°C for Mg(NO3)2.6H2O,
corresponding to their melting points – as soon as the material melts, water is free to evaporate.
Na2SO4.10H2O loses all associated water by 120°C (55% mass), which fits nicely with the expected
stoichiometric value of 55.9%. No further decomposition of the anhydrous Na2SO4 occurs by 600°C.
Mg(NO3)2.6H2O showed nearly identical behaviour to the previous sample from above. It had lost
36% of its mass up to 250°C. Further mass loss occurred between 290 to 470°C due to Mg(NO3)2
decomposition. After heating to 600°C, 21% mass remains, mainly consisting of MgO.
All NanoPCMs have better thermal stability in comparison with the bulk salt hydrates, due to
protection from the PECA shell. All NanoPCMs lose water up to 150°C, dependent on the quantity of
free water remaining after capsule synthesis. TGA results are consistent with DSC results (see

160 | P a g e
below). NanoPCM4 loses 16% mass by 150°C, increasing the amount of Na2SO4.10H2O in the core
reduces the amount of water loss over this temperature range. NanoPCM7 commences weight loss
at a lower temperature than NanoPCM5 and 6, which is probably due to residual cyclohexane
present in the sample. Mass loss is then accelerated for all samples at 150°C due to PECA
disintegration, and additionally, the decomposition of magnesium nitrate into magnesium oxide. The
TGA curves stabilise at 450°C, with minimal subsequent mass loss. Increasing the amount of
Na2SO4.10H2O in the mixture increases the % mass remaining at 600°C. Remaining mass is 20% for
NanoPCM4, 22% for NanoPCM6, 24% for NanoPCM7 and 29% for NanoPCM5.
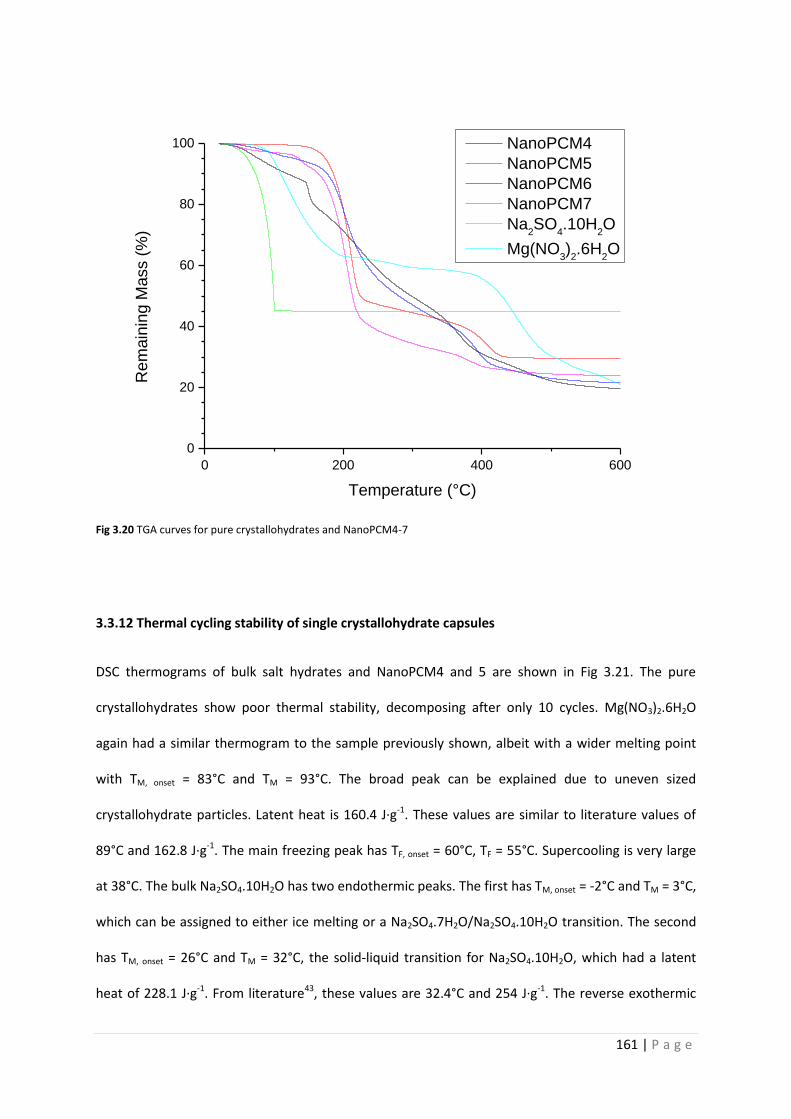
161 | P a g e
0 200 400 600
0
20
40
60
80
100R
em
ain
ing M
ass (
%)
Temperature (°C)
NanoPCM4
NanoPCM5
NanoPCM6
NanoPCM7
Na2SO
4.10H
2O
Mg(NO3)2.6H
2O
Fig 3.20 TGA curves for pure crystallohydrates and NanoPCM4-7
3.3.12 Thermal cycling stability of single crystallohydrate capsules
DSC thermograms of bulk salt hydrates and NanoPCM4 and 5 are shown in Fig 3.21. The pure
crystallohydrates show poor thermal stability, decomposing after only 10 cycles. Mg(NO3)2.6H2O
again had a similar thermogram to the sample previously shown, albeit with a wider melting point
with TM, onset = 83°C and TM = 93°C. The broad peak can be explained due to uneven sized
crystallohydrate particles. Latent heat is 160.4 J·g-1. These values are similar to literature values of
89°C and 162.8 J·g-1. The main freezing peak has TF, onset = 60°C, TF = 55°C. Supercooling is very large
at 38°C. The bulk Na2SO4.10H2O has two endothermic peaks. The first has TM, onset = -2°C and TM = 3°C,
which can be assigned to either ice melting or a Na2SO4.7H2O/Na2SO4.10H2O transition. The second
has TM, onset = 26°C and TM = 32°C, the solid-liquid transition for Na2SO4.10H2O, which had a latent
heat of 228.1 J·g-1. From literature43, these values are 32.4°C and 254 J·g-1. The reverse exothermic
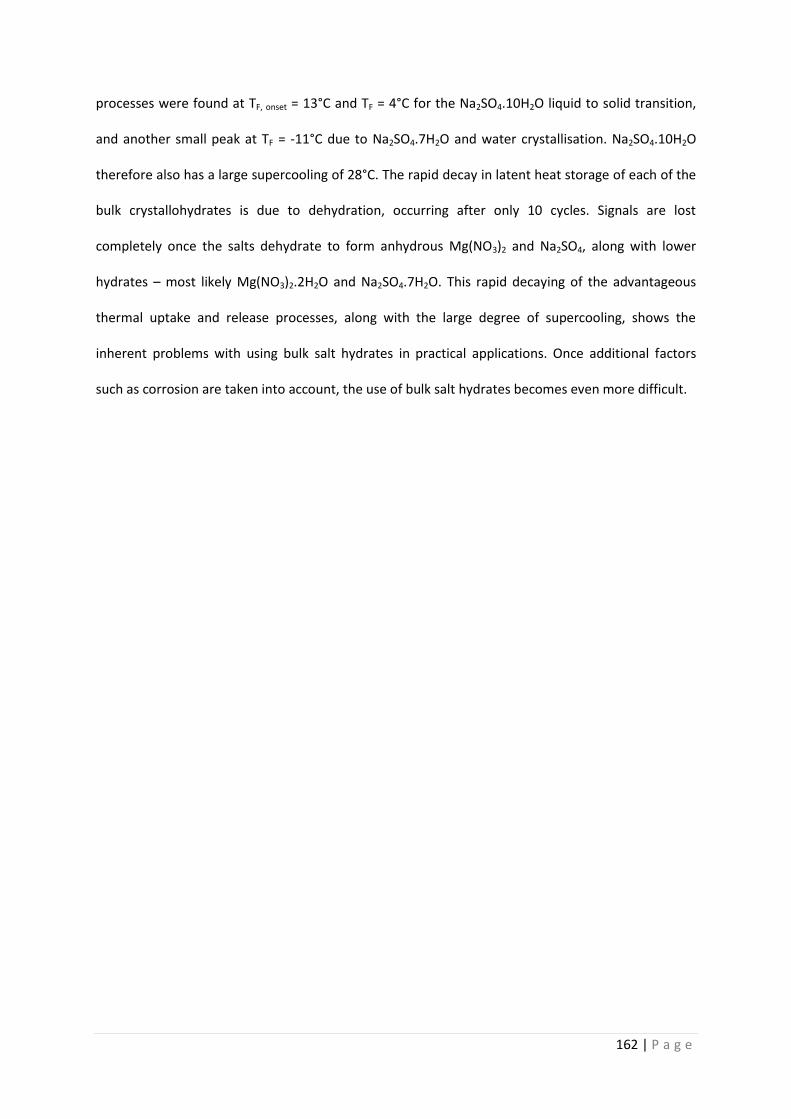
162 | P a g e
processes were found at TF, onset = 13°C and TF = 4°C for the Na2SO4.10H2O liquid to solid transition,
and another small peak at TF = -11°C due to Na2SO4.7H2O and water crystallisation. Na2SO4.10H2O
therefore also has a large supercooling of 28°C. The rapid decay in latent heat storage of each of the
bulk crystallohydrates is due to dehydration, occurring after only 10 cycles. Signals are lost
completely once the salts dehydrate to form anhydrous Mg(NO3)2 and Na2SO4, along with lower
hydrates – most likely Mg(NO3)2.2H2O and Na2SO4.7H2O. This rapid decaying of the advantageous
thermal uptake and release processes, along with the large degree of supercooling, shows the
inherent problems with using bulk salt hydrates in practical applications. Once additional factors
such as corrosion are taken into account, the use of bulk salt hydrates becomes even more difficult.
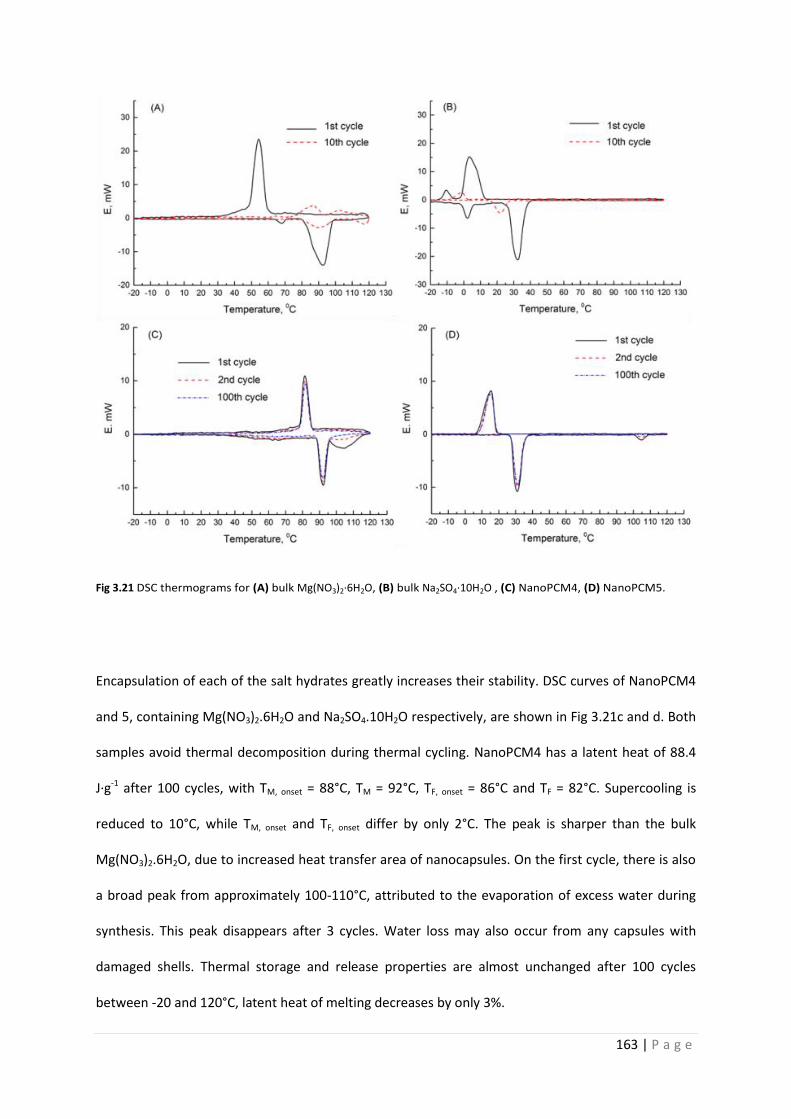
163 | P a g e
Fig 3.21 DSC thermograms for (A) bulk Mg(NO3)2·6H2O, (B) bulk Na2SO4·10H2O , (C) NanoPCM4, (D) NanoPCM5.
Encapsulation of each of the salt hydrates greatly increases their stability. DSC curves of NanoPCM4
and 5, containing Mg(NO3)2.6H2O and Na2SO4.10H2O respectively, are shown in Fig 3.21c and d. Both
samples avoid thermal decomposition during thermal cycling. NanoPCM4 has a latent heat of 88.4
J·g-1 after 100 cycles, with TM, onset = 88°C, TM = 92°C, TF, onset = 86°C and TF = 82°C. Supercooling is
reduced to 10°C, while TM, onset and TF, onset differ by only 2°C. The peak is sharper than the bulk
Mg(NO3)2.6H2O, due to increased heat transfer area of nanocapsules. On the first cycle, there is also
a broad peak from approximately 100-110°C, attributed to the evaporation of excess water during
synthesis. This peak disappears after 3 cycles. Water loss may also occur from any capsules with
damaged shells. Thermal storage and release properties are almost unchanged after 100 cycles
between -20 and 120°C, latent heat of melting decreases by only 3%.
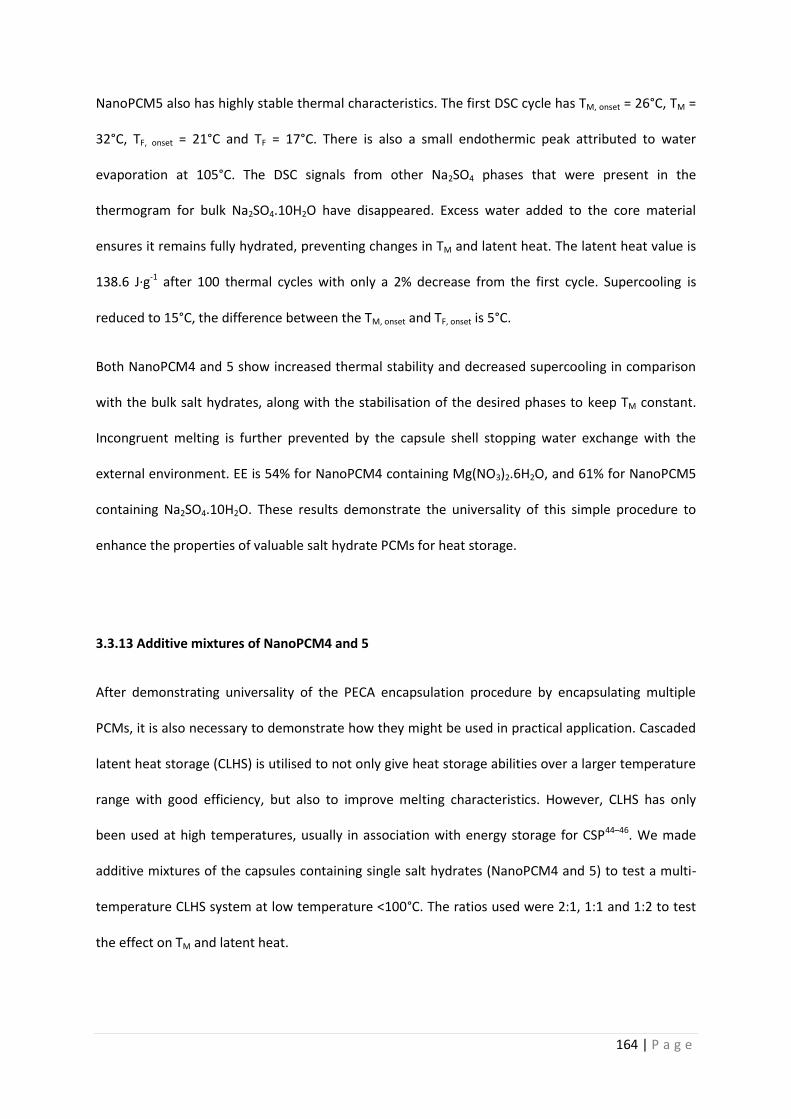
164 | P a g e
NanoPCM5 also has highly stable thermal characteristics. The first DSC cycle has TM, onset = 26°C, TM =
32°C, TF, onset = 21°C and TF = 17°C. There is also a small endothermic peak attributed to water
evaporation at 105°C. The DSC signals from other Na2SO4 phases that were present in the
thermogram for bulk Na2SO4.10H2O have disappeared. Excess water added to the core material
ensures it remains fully hydrated, preventing changes in TM and latent heat. The latent heat value is
138.6 J·g-1 after 100 thermal cycles with only a 2% decrease from the first cycle. Supercooling is
reduced to 15°C, the difference between the TM, onset and TF, onset is 5°C.
Both NanoPCM4 and 5 show increased thermal stability and decreased supercooling in comparison
with the bulk salt hydrates, along with the stabilisation of the desired phases to keep TM constant.
Incongruent melting is further prevented by the capsule shell stopping water exchange with the
external environment. EE is 54% for NanoPCM4 containing Mg(NO3)2.6H2O, and 61% for NanoPCM5
containing Na2SO4.10H2O. These results demonstrate the universality of this simple procedure to
enhance the properties of valuable salt hydrate PCMs for heat storage.
3.3.13 Additive mixtures of NanoPCM4 and 5
After demonstrating universality of the PECA encapsulation procedure by encapsulating multiple
PCMs, it is also necessary to demonstrate how they might be used in practical application. Cascaded
latent heat storage (CLHS) is utilised to not only give heat storage abilities over a larger temperature
range with good efficiency, but also to improve melting characteristics. However, CLHS has only
been used at high temperatures, usually in association with energy storage for CSP44–46. We made
additive mixtures of the capsules containing single salt hydrates (NanoPCM4 and 5) to test a multi-
temperature CLHS system at low temperature <100°C. The ratios used were 2:1, 1:1 and 1:2 to test
the effect on TM and latent heat.
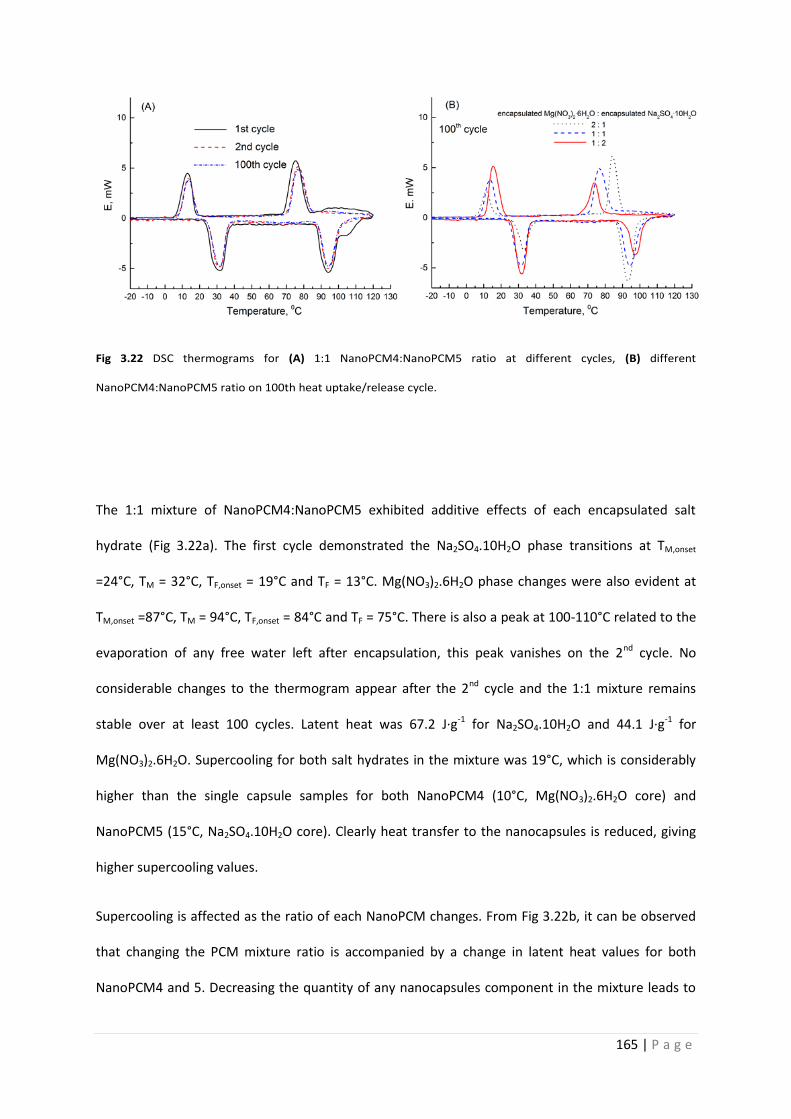
165 | P a g e
Fig 3.22 DSC thermograms for (A) 1:1 NanoPCM4:NanoPCM5 ratio at different cycles, (B) different
NanoPCM4:NanoPCM5 ratio on 100th heat uptake/release cycle.
The 1:1 mixture of NanoPCM4:NanoPCM5 exhibited additive effects of each encapsulated salt
hydrate (Fig 3.22a). The first cycle demonstrated the Na2SO4.10H2O phase transitions at TM,onset
=24°C, TM = 32°C, TF,onset = 19°C and TF = 13°C. Mg(NO3)2.6H2O phase changes were also evident at
TM,onset =87°C, TM = 94°C, TF,onset = 84°C and TF = 75°C. There is also a peak at 100-110°C related to the
evaporation of any free water left after encapsulation, this peak vanishes on the 2nd cycle. No
considerable changes to the thermogram appear after the 2nd cycle and the 1:1 mixture remains
stable over at least 100 cycles. Latent heat was 67.2 J·g-1 for Na2SO4.10H2O and 44.1 J·g-1 for
Mg(NO3)2.6H2O. Supercooling for both salt hydrates in the mixture was 19°C, which is considerably
higher than the single capsule samples for both NanoPCM4 (10°C, Mg(NO3)2.6H2O core) and
NanoPCM5 (15°C, Na2SO4.10H2O core). Clearly heat transfer to the nanocapsules is reduced, giving
higher supercooling values.
Supercooling is affected as the ratio of each NanoPCM changes. From Fig 3.22b, it can be observed
that changing the PCM mixture ratio is accompanied by a change in latent heat values for both
NanoPCM4 and 5. Decreasing the quantity of any nanocapsules component in the mixture leads to
166 | P a g e
an increase in supercooling for the minor component and a decrease in supercooling for the major
component. A 2:1 mixture of NanoPCM4:NanoPCM5 resulted in TM = 33°C and TF = 12°C for
Na2SO4.10H2O; and TM = 93°C and TF = 84°C for Mg(NO3)2.6H2O. Supercooling is therefore decreased
in Mg(NO3)2.6H2O to 9°C and increased for Na2SO4.10H2O to 21°C. Latent heat values for the 2:1
mixture are 59.0 J·g-1:46.1 J·g-1 for NanoPCM4:NanoPCM5 respectively.
For the 1:2 mixture of NanoPCM4:NanoPCM5, the opposite effect occurs. Phase transitions for
Mg(NO3)2.6H2O are TM = 97°C and TF = 74°C; while for Na2SO4.10H2O they are TM = 32°C and TF =
15°C. Supercooling for the encapsulated salt hydrates is therefore 23°C for Mg(NO3)2.6H2O and 17°C
for Na2SO4.10H2O. The latent heat also changed in accordance with the proportion of each
crystallohydrate in the mixture, being 29.1 J·g-1:93.1 J·g-1 for NanoPCM4:NanoPCM5 respectively. In
all additive mixtures, latent heat values are consistent with the ratio of each NanoPCM.
Supercooling is caused by low thermal conductivity of the PCMs during melting and freezing, and the
changes in supercooling in PCM mixtures can be rationalised by taking this into account. The additive
mixtures of salt hydrate loaded nanocapsules enhance thermoinsulating properties during each
phase transition process, where one encapsulated component can reduce thermal transfer to the
second component during phase transition. NanoPCM4 does not absorb heat during the phase
transition of Na2SO4.10H2O in the NanoPCM5 core. Hence, NanoPCM4 acts as a heat insulator for
NanoPCM5 capsules at 10-35°C. An increased amount of NanoPCM4 in the mixture causes a greater
degree of supercooling in NanoPCM5. Likewise, during the phase transition of Mg(NO3)2.6H2O in the
NanoPCM4 core at 70-100°C, the Na2SO4.10H2O inside NanoPCM5 capsules remains liquid and not
active for heat transfer. Supercooling for NanoPCM4 increases with NanoPCM5 content. This is the
most evident explanation of the supercooling effect observed in the additive mixtures of energy
storage nanocapsules. Contrary to the additive mixtures, when NanoPCM4 and 5 are used
individually, the single crystallohydrate cores undergo phase transition over the same temperature
range across the whole sample and remain thermally active for heat transfer.
167 | P a g e
The magnitude of the change in supercooling can also be rationalised. When doubling the amount of
the other component, TM and TF values for Mg(NO3)2.6H2O are more heavily affected than those for
Na2SO4.10H2O. When the ratio of NanoPCM4:NanoPCM5 is 1:2, the TM and TF for Mg(NO3)2.6H2O are
+4°C and -10°C respectively, compared with when the ratio is 2:1. For Na2SO4.10H2O, TM and TF are
+1°C and -3°C when the ratio is 2:1 compared with when the ratio is 1:2. This can be rationalised by
considering the phases of each component. During any Mg(NO3)2.6H2O phase change, Na2SO4.10H2O
will necessarily be in the liquid phase. Liquid phases have lower thermal conductivity than the solid
phase. Therefore, heat transfer from the liquid core NanoPCM5 capsules into the solid core
NanoPCM4 capsules will be poor, and leads to lower amount of heat uptake and a higher TM for
NanoPCM4. During melting of the NanoPCM4 core, the decreased amount of heat uptake by
NanoPCM5 means that NanoPCM4 will absorb more heat energy which causes it to remain in the
liquid phase and decrease TF.
Likewise, during any Na2SO4.10H2O phase transition, Mg(NO3)2.6H2O will be in the solid phase,
therefore giving increased heat transfer to the Na2SO4.10H2O during melting. During freezing, more
heat energy will flow to NanoPCM4 rather than NanoPCM5, allowing more rapid temperature
decrease in NanoPCM5. TM and TF values for NanoPCM5 are therefore not as heavily affected. These
supercooling effects must be accounted for when designing a CLHS system for encapsulated salt
hydrates. Supercooling may be reduced by the incorporation of conductive particles into the matrix
of the NanoPCMs.
3.3.14 Salt hydrate mixtures and eutectics
An interesting phenomenon amongst salt hydrates is that of eutectics. As salt hydrates are mixed,
their TM is adjusted, due to inhibition of crystallisation processes in each component47. The melting
of the first component in the mixture initiates dissolution of components with higher transition
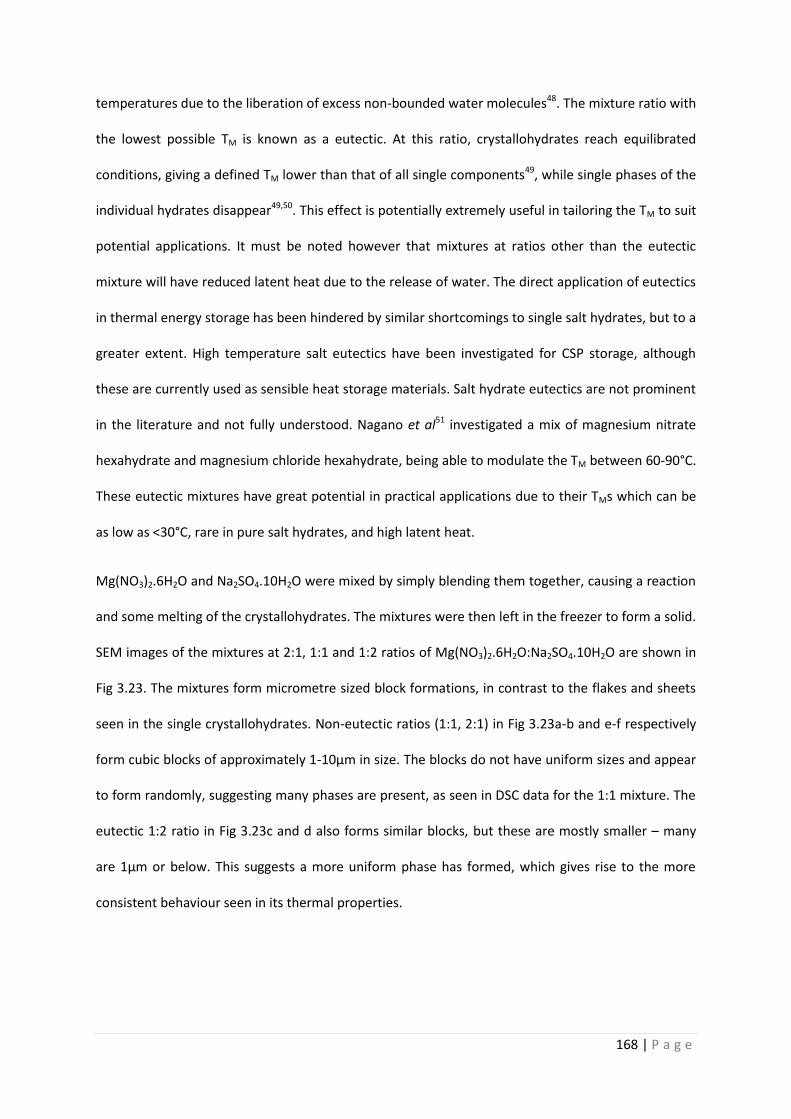
168 | P a g e
temperatures due to the liberation of excess non-bounded water molecules48. The mixture ratio with
the lowest possible TM is known as a eutectic. At this ratio, crystallohydrates reach equilibrated
conditions, giving a defined TM lower than that of all single components49, while single phases of the
individual hydrates disappear49,50. This effect is potentially extremely useful in tailoring the TM to suit
potential applications. It must be noted however that mixtures at ratios other than the eutectic
mixture will have reduced latent heat due to the release of water. The direct application of eutectics
in thermal energy storage has been hindered by similar shortcomings to single salt hydrates, but to a
greater extent. High temperature salt eutectics have been investigated for CSP storage, although
these are currently used as sensible heat storage materials. Salt hydrate eutectics are not prominent
in the literature and not fully understood. Nagano et al51 investigated a mix of magnesium nitrate
hexahydrate and magnesium chloride hexahydrate, being able to modulate the TM between 60-90°C.
These eutectic mixtures have great potential in practical applications due to their TMs which can be
as low as <30°C, rare in pure salt hydrates, and high latent heat.
Mg(NO3)2.6H2O and Na2SO4.10H2O were mixed by simply blending them together, causing a reaction
and some melting of the crystallohydrates. The mixtures were then left in the freezer to form a solid.
SEM images of the mixtures at 2:1, 1:1 and 1:2 ratios of Mg(NO3)2.6H2O:Na2SO4.10H2O are shown in
Fig 3.23. The mixtures form micrometre sized block formations, in contrast to the flakes and sheets
seen in the single crystallohydrates. Non-eutectic ratios (1:1, 2:1) in Fig 3.23a-b and e-f respectively
form cubic blocks of approximately 1-10µm in size. The blocks do not have uniform sizes and appear
to form randomly, suggesting many phases are present, as seen in DSC data for the 1:1 mixture. The
eutectic 1:2 ratio in Fig 3.23c and d also forms similar blocks, but these are mostly smaller – many
are 1µm or below. This suggests a more uniform phase has formed, which gives rise to the more
consistent behaviour seen in its thermal properties.
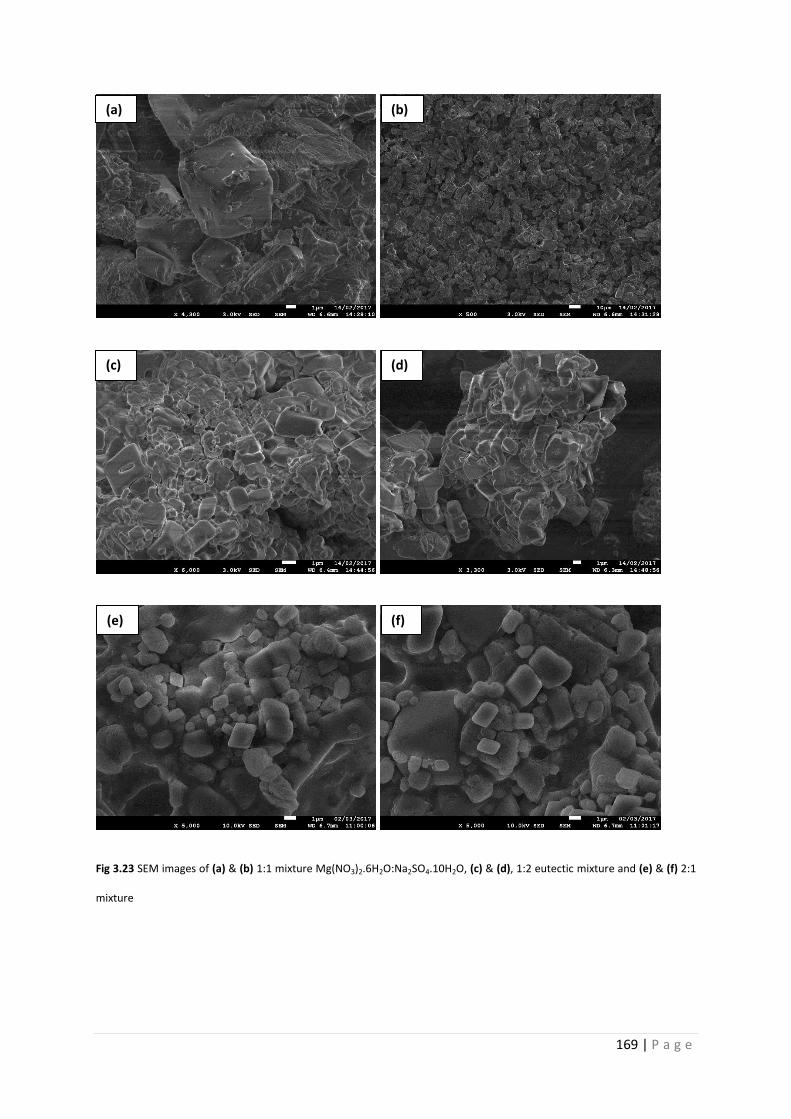
169 | P a g e
Fig 3.23 SEM images of (a) & (b) 1:1 mixture Mg(NO3)2.6H2O:Na2SO4.10H2O, (c) & (d), 1:2 eutectic mixture and (e) & (f) 2:1
mixture
(a)
(f) (e)
(d) (c)
(b)
170 | P a g e
Fig 3.24 Influence of the Mg(NO3)2·6H2O:Na2SO4·10H2O wt.% ratio on melting temperature of the corresponding
mixture.
DSC results show how TM of the non-encapsulated bulk salt hydrates is influenced by ratio, shown in
Fig 3.24. TMs for both pure salt hydrates were taken from Zalba et al43 as these values are widely
accepted by researchers, and our values differed by several degrees. All mixtures give a lower TM
than pure Mg(NO3)2.6H2O. At 100 %wt Na2SO4.10H2O, the TM is 32°C. Addition of Mg(NO3)2.6H2O
causes this to decrease until the eutectic point (TM = 15.0°C) is reached at 33.3 %wt Mg(NO3)2.6H2O.
The TM increases sharply from 40 %wt to 66.6 %wt Mg(NO3)2.6H2O (16.7 to 67.4°C). The TM then
decreases again at 75 and 80 %wt Mg(NO3)2.6H2O (57.5 and 57.7°C) exhibiting a pseudo-eutectic
ratio, before again increasing at 90 %wt Mg(NO3)2.6H2O (79.1°C). A similar ‘double bell’ shaped curve
for salt hydrate mixtures has been observed using Mg(NO3)2.6H2O and aluminium nitrate
nonahydrate52. The results show a wide range of TMs can be developed using only two
crystallohydrates. It is possible to develop mixtures of three or more salts, although clearly this will
171 | P a g e
lead to large amounts of research needing to be done. Developing a molecular modelling strategy to
estimate how mixtures will affect TM would be of great benefit.
3.3.15 Encapsulated salt hydrate mixtures and eutectics
Encapsulation of multiple salts inside the same capsule was of interest to see if eutectic character
could be maintained on a nanoscale level. It also provides an interesting contrast in behaviour with
the additive mixtures of single salt hydrate cored NanoPCMs. Methodology to obtain the capsules is
described in detail in Fig 3.25, the multi-salt hydrate core is made in step d. The eutectic blend of 1:2
Mg(NO3)2.6H2O:Na2SO4.10H2O (TM = 15.0°C, NanoPCM7) was chosen along with the 1:1 ratio (TM =
45.5°C, NanoPCM6) to observe behaviour of a non-eutectic ratio.
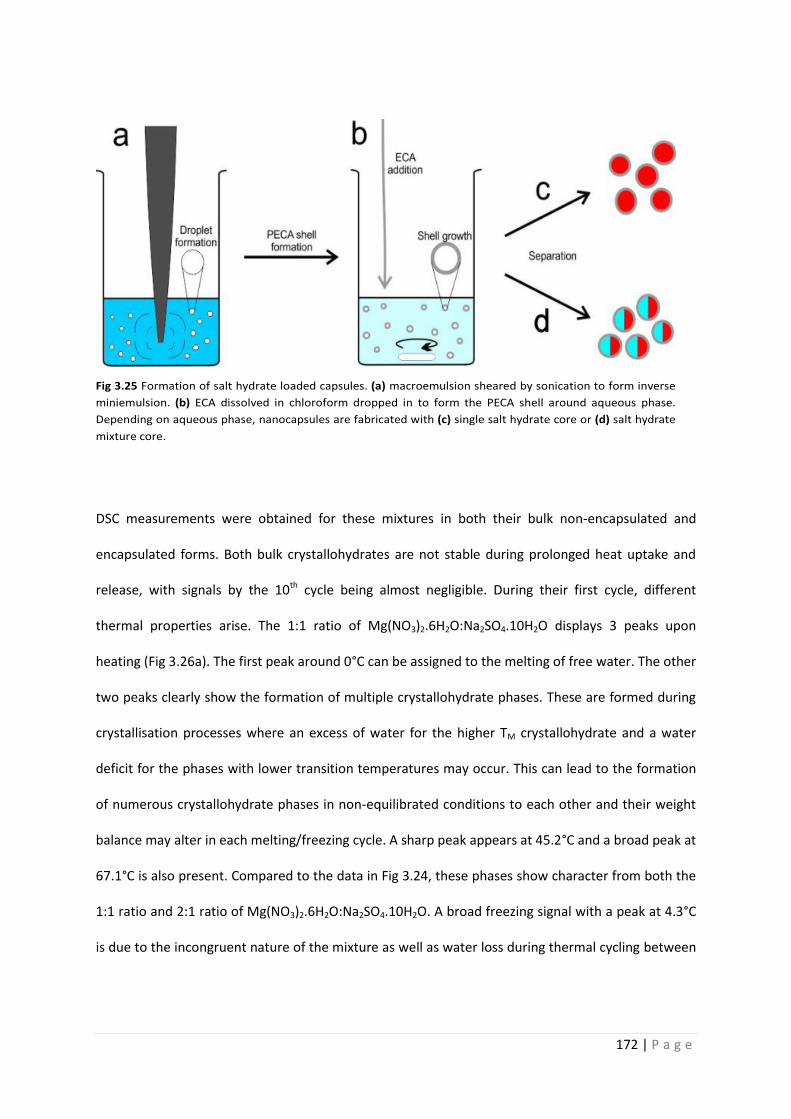
172 | P a g e
DSC measurements were obtained for these mixtures in both their bulk non-encapsulated and
encapsulated forms. Both bulk crystallohydrates are not stable during prolonged heat uptake and
release, with signals by the 10th cycle being almost negligible. During their first cycle, different
thermal properties arise. The 1:1 ratio of Mg(NO3)2.6H2O:Na2SO4.10H2O displays 3 peaks upon
heating (Fig 3.26a). The first peak around 0°C can be assigned to the melting of free water. The other
two peaks clearly show the formation of multiple crystallohydrate phases. These are formed during
crystallisation processes where an excess of water for the higher TM crystallohydrate and a water
deficit for the phases with lower transition temperatures may occur. This can lead to the formation
of numerous crystallohydrate phases in non-equilibrated conditions to each other and their weight
balance may alter in each melting/freezing cycle. A sharp peak appears at 45.2°C and a broad peak at
67.1°C is also present. Compared to the data in Fig 3.24, these phases show character from both the
1:1 ratio and 2:1 ratio of Mg(NO3)2.6H2O:Na2SO4.10H2O. A broad freezing signal with a peak at 4.3°C
is due to the incongruent nature of the mixture as well as water loss during thermal cycling between
173 | P a g e
-20 to 120°C. Latent heat capacity of the 1:1 mixture is 103.3 J·g-1, which is lower than the additive
sum of the crystallohydrates in the mixture (194.3 J·g-1).
The 1:2 mixture of Mg(NO3)2.6H2O:Na2SO4.10H2O has only one endothermic peak, melting at 15.9°C
(Fig 3.26b). A single eutectic phase has formed, with high latent heat of 189.3 J·g-1, almost equal to
the additive sum of crystallohydrates in the mixture (205.5 J·g-1). The high latent heat can further be
rationalised by taking into account the possibility of additional thermochemical heat48. The shoulder
of the peak until approximately 45°C is most likely due to excess water. The eutectic mixture also has
a more defined freezing point than the 1:1 mixture, with a TF of -11.4°C. Supercooling for the
eutectic is therefore 27.1°C, and the latent heat is not stable during prolonged thermal cycling.
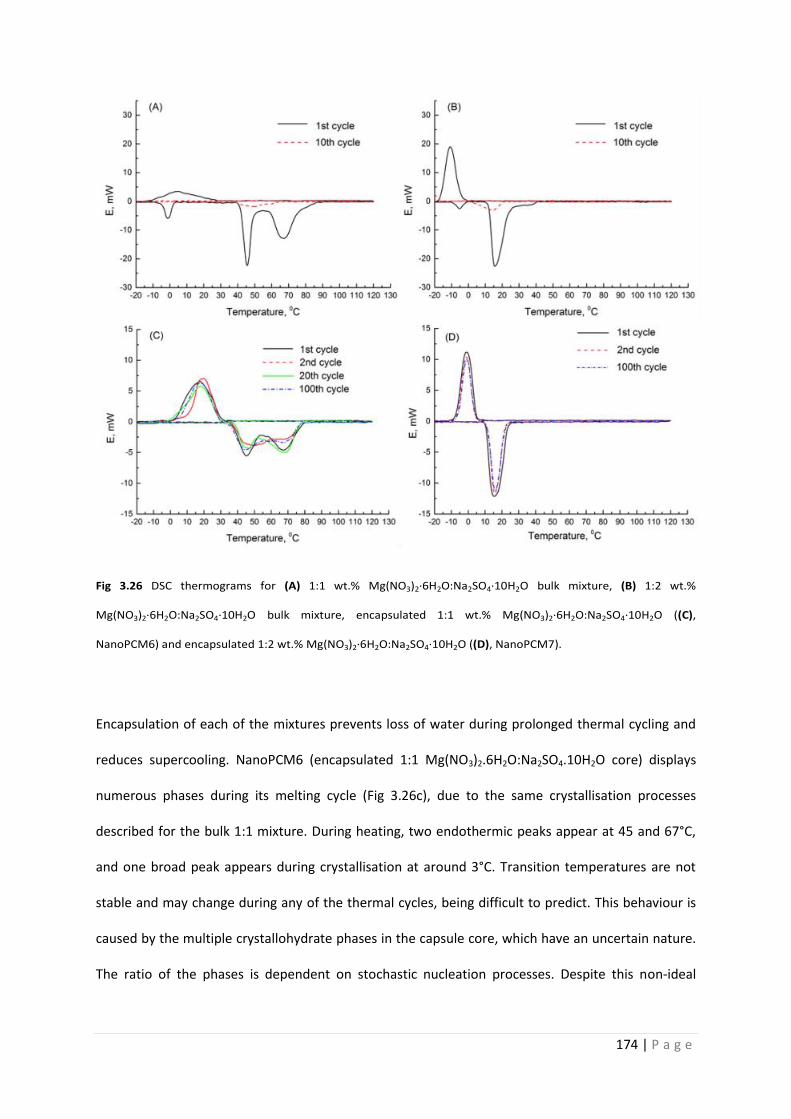
174 | P a g e
Fig 3.26 DSC thermograms for (A) 1:1 wt.% Mg(NO3)2·6H2O:Na2SO4·10H2O bulk mixture, (B) 1:2 wt.%
Mg(NO3)2·6H2O:Na2SO4·10H2O bulk mixture, encapsulated 1:1 wt.% Mg(NO3)2·6H2O:Na2SO4·10H2O ((C),
NanoPCM6) and encapsulated 1:2 wt.% Mg(NO3)2·6H2O:Na2SO4·10H2O ((D), NanoPCM7).
Encapsulation of each of the mixtures prevents loss of water during prolonged thermal cycling and
reduces supercooling. NanoPCM6 (encapsulated 1:1 Mg(NO3)2.6H2O:Na2SO4.10H2O core) displays
numerous phases during its melting cycle (Fig 3.26c), due to the same crystallisation processes
described for the bulk 1:1 mixture. During heating, two endothermic peaks appear at 45 and 67°C,
and one broad peak appears during crystallisation at around 3°C. Transition temperatures are not
stable and may change during any of the thermal cycles, being difficult to predict. This behaviour is
caused by the multiple crystallohydrate phases in the capsule core, which have an uncertain nature.
The ratio of the phases is dependent on stochastic nucleation processes. Despite this non-ideal
175 | P a g e
behaviour, the mixture still has large peaks for both melting and freezing after 100 cycles, once again
showing the benefits of encapsulation.
NanoPCM7 (encapsulated eutectic 1:2 Mg(NO3)2.6H2O:Na2SO4.10H2O ratio) again behaves
differently, similar to the bulk mixtures (Fig 3.26d). It has one well defined transition temperature
for both endothermic and exothermic processes, with TM, onset = 9.3°C, TM = 15.4°C, TF, onset = 6.8°C and
TF = -1.1°C. Supercooling is therefore reduced to 16.5°C, 10.6°C lower than the supercooling inherent
in the non-encapsulated eutectic. Difference between TM, onset and TF, onset is only 2.5°C. Like the other
nanoencapsulated salt hydrates, NanoPCM7 is stable over 100+ thermal cycles and has a latent heat
of 126.8 J·g-1. Encapsulation efficiency is 67%. The effect of nanoencapsulation on salt hydrate
mixtures is similar to the effects on single crystallohydrates, producing chemically and thermally
stable energy storage materials with boosted heat transfer properties. A summary of thermal
parameters for the NanoPCMs is shown in Table 3.4.
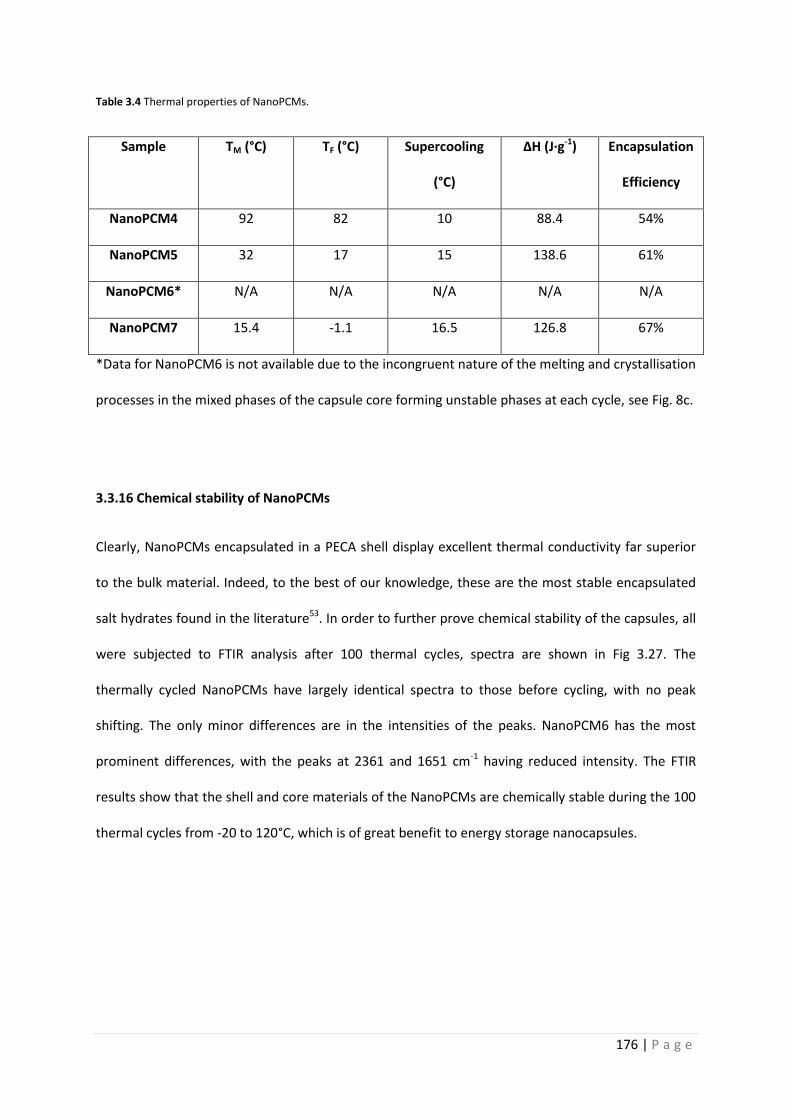
176 | P a g e
Table 3.4 Thermal properties of NanoPCMs.
Sample TM (°C) TF (°C) Supercooling
(°C)
∆H (J·g-1) Encapsulation
Efficiency
NanoPCM4 92 82 10 88.4 54%
NanoPCM5 32 17 15 138.6 61%
NanoPCM6* N/A N/A N/A N/A N/A
NanoPCM7 15.4 -1.1 16.5 126.8 67%
*Data for NanoPCM6 is not available due to the incongruent nature of the melting and crystallisation
processes in the mixed phases of the capsule core forming unstable phases at each cycle, see Fig. 8c.
3.3.16 Chemical stability of NanoPCMs
Clearly, NanoPCMs encapsulated in a PECA shell display excellent thermal conductivity far superior
to the bulk material. Indeed, to the best of our knowledge, these are the most stable encapsulated
salt hydrates found in the literature53. In order to further prove chemical stability of the capsules, all
were subjected to FTIR analysis after 100 thermal cycles, spectra are shown in Fig 3.27. The
thermally cycled NanoPCMs have largely identical spectra to those before cycling, with no peak
shifting. The only minor differences are in the intensities of the peaks. NanoPCM6 has the most
prominent differences, with the peaks at 2361 and 1651 cm-1 having reduced intensity. The FTIR
results show that the shell and core materials of the NanoPCMs are chemically stable during the 100
thermal cycles from -20 to 120°C, which is of great benefit to energy storage nanocapsules.
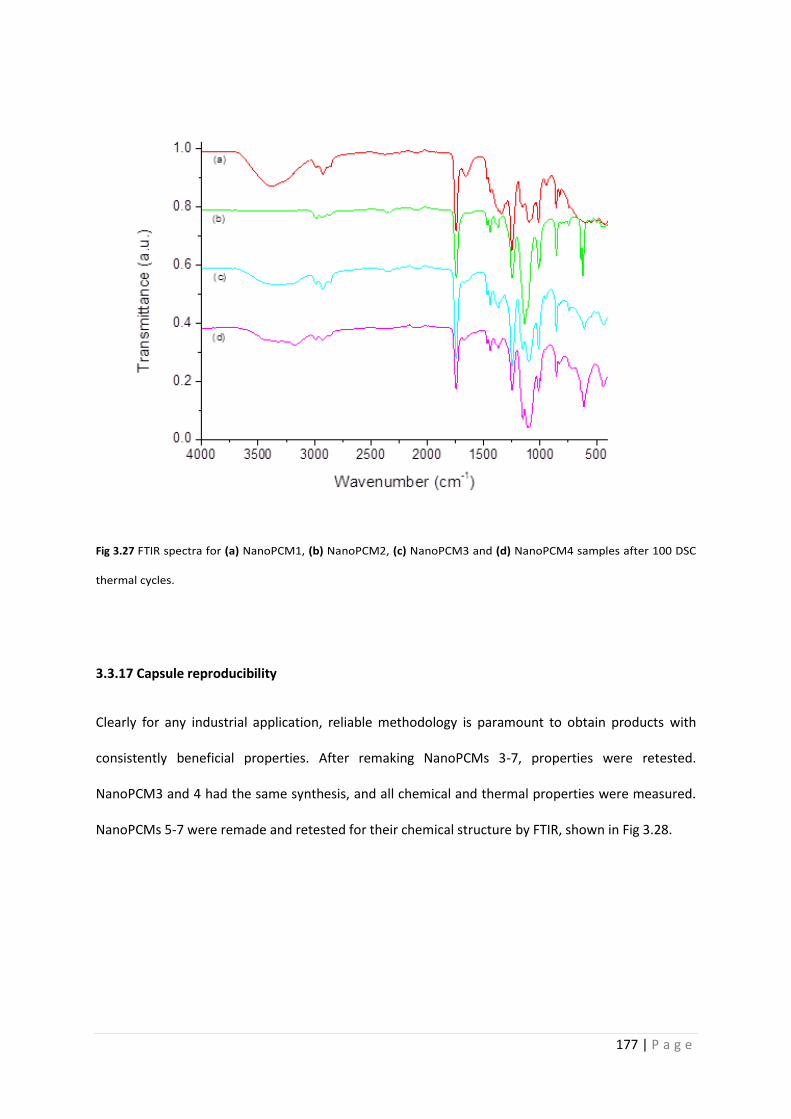
177 | P a g e
Fig 3.27 FTIR spectra for (a) NanoPCM1, (b) NanoPCM2, (c) NanoPCM3 and (d) NanoPCM4 samples after 100 DSC
thermal cycles.
3.3.17 Capsule reproducibility
Clearly for any industrial application, reliable methodology is paramount to obtain products with
consistently beneficial properties. After remaking NanoPCMs 3-7, properties were retested.
NanoPCM3 and 4 had the same synthesis, and all chemical and thermal properties were measured.
NanoPCMs 5-7 were remade and retested for their chemical structure by FTIR, shown in Fig 3.28.
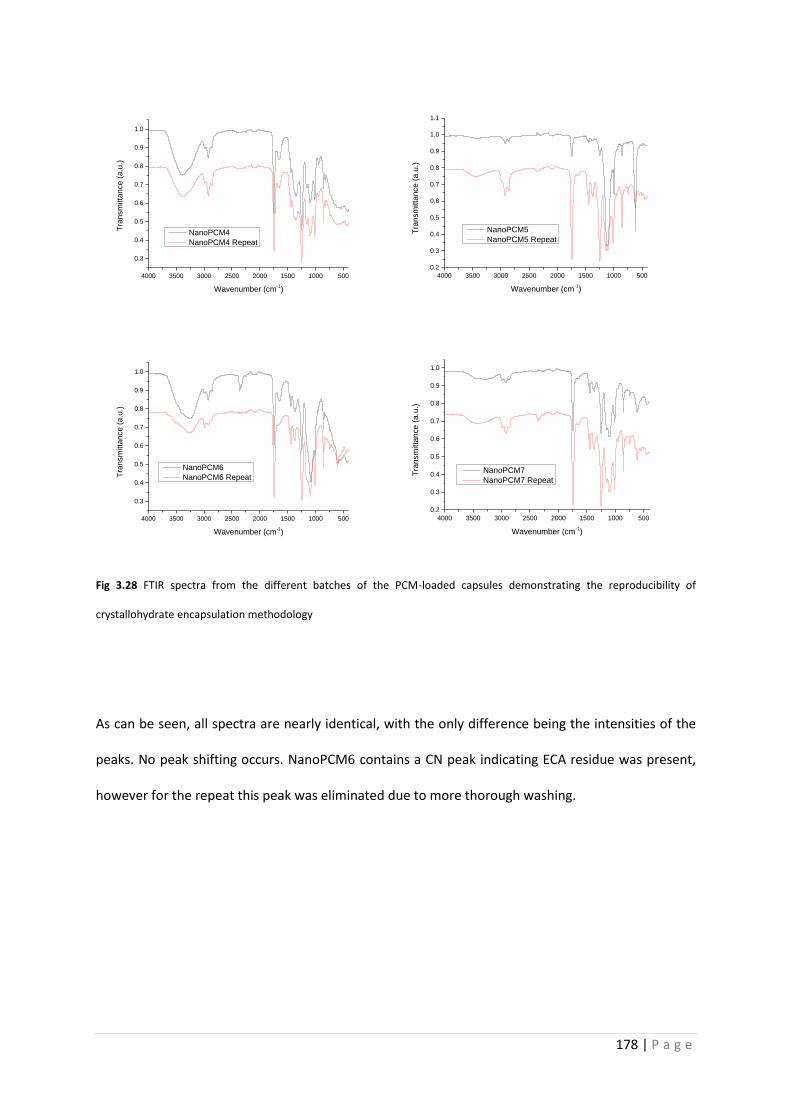
178 | P a g e
4000 3500 3000 2500 2000 1500 1000 500
0.3
0.4
0.5
0.6
0.7
0.8
0.9
1.0
Tra
nsm
itta
nce (
a.u
.)
Wavenumber (cm-1)
NanoPCM4
NanoPCM4 Repeat
4000 3500 3000 2500 2000 1500 1000 500
0.2
0.3
0.4
0.5
0.6
0.7
0.8
0.9
1.0
1.1
Tra
nsm
itta
nce (
a.u
.)
Wavenumber (cm-1)
NanoPCM5
NanoPCM5 Repeat
4000 3500 3000 2500 2000 1500 1000 500
0.3
0.4
0.5
0.6
0.7
0.8
0.9
1.0
Tra
nsm
itta
nce (
a.u
.)
Wavenumber (cm-1)
NanoPCM6
NanoPCM6 Repeat
4000 3500 3000 2500 2000 1500 1000 500
0.2
0.3
0.4
0.5
0.6
0.7
0.8
0.9
1.0
Tra
nsm
itta
nce (
a.u
.)
Wavenumber (cm-1)
NanoPCM7
NanoPCM7 Repeat
Fig 3.28 FTIR spectra from the different batches of the PCM-loaded capsules demonstrating the reproducibility of
crystallohydrate encapsulation methodology
As can be seen, all spectra are nearly identical, with the only difference being the intensities of the
peaks. No peak shifting occurs. NanoPCM6 contains a CN peak indicating ECA residue was present,
however for the repeat this peak was eliminated due to more thorough washing.
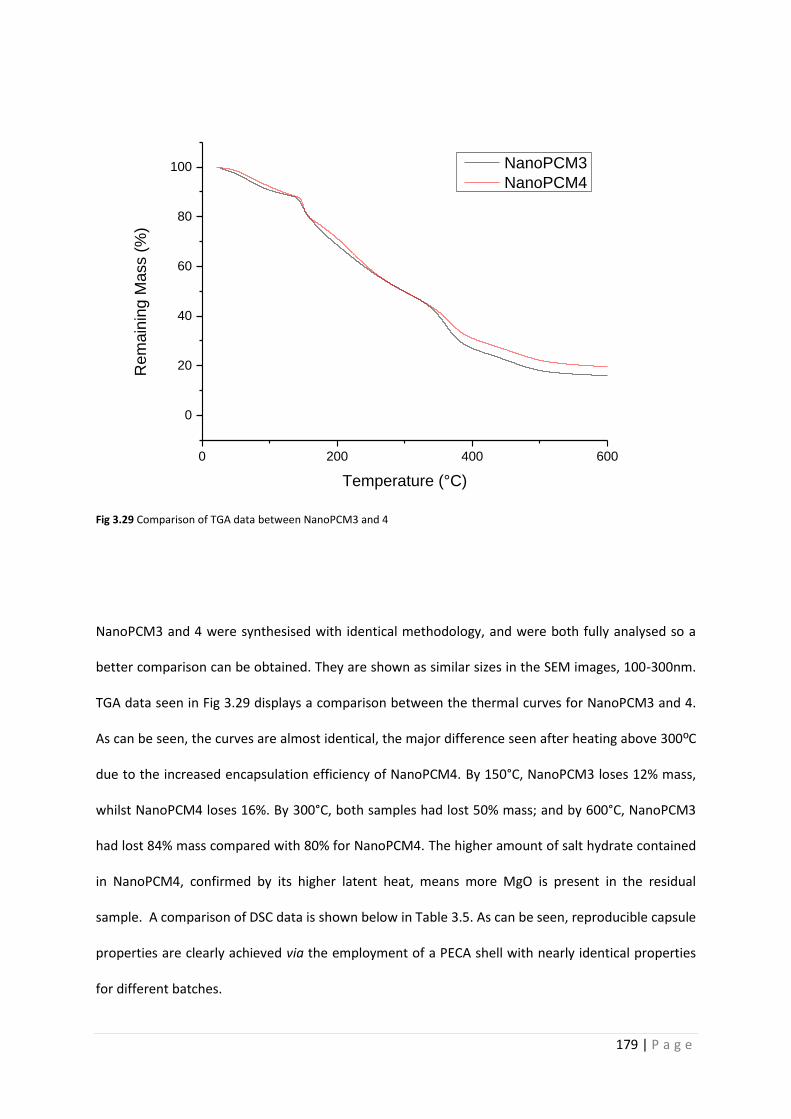
179 | P a g e
0 200 400 600
0
20
40
60
80
100
Re
main
ing M
ass (
%)
Temperature (°C)
NanoPCM3
NanoPCM4
Fig 3.29 Comparison of TGA data between NanoPCM3 and 4
NanoPCM3 and 4 were synthesised with identical methodology, and were both fully analysed so a
better comparison can be obtained. They are shown as similar sizes in the SEM images, 100-300nm.
TGA data seen in Fig 3.29 displays a comparison between the thermal curves for NanoPCM3 and 4.
As can be seen, the curves are almost identical, the major difference seen after heating above 300ºC
due to the increased encapsulation efficiency of NanoPCM4. By 150°C, NanoPCM3 loses 12% mass,
whilst NanoPCM4 loses 16%. By 300°C, both samples had lost 50% mass; and by 600°C, NanoPCM3
had lost 84% mass compared with 80% for NanoPCM4. The higher amount of salt hydrate contained
in NanoPCM4, confirmed by its higher latent heat, means more MgO is present in the residual
sample. A comparison of DSC data is shown below in Table 3.5. As can be seen, reproducible capsule
properties are clearly achieved via the employment of a PECA shell with nearly identical properties
for different batches.
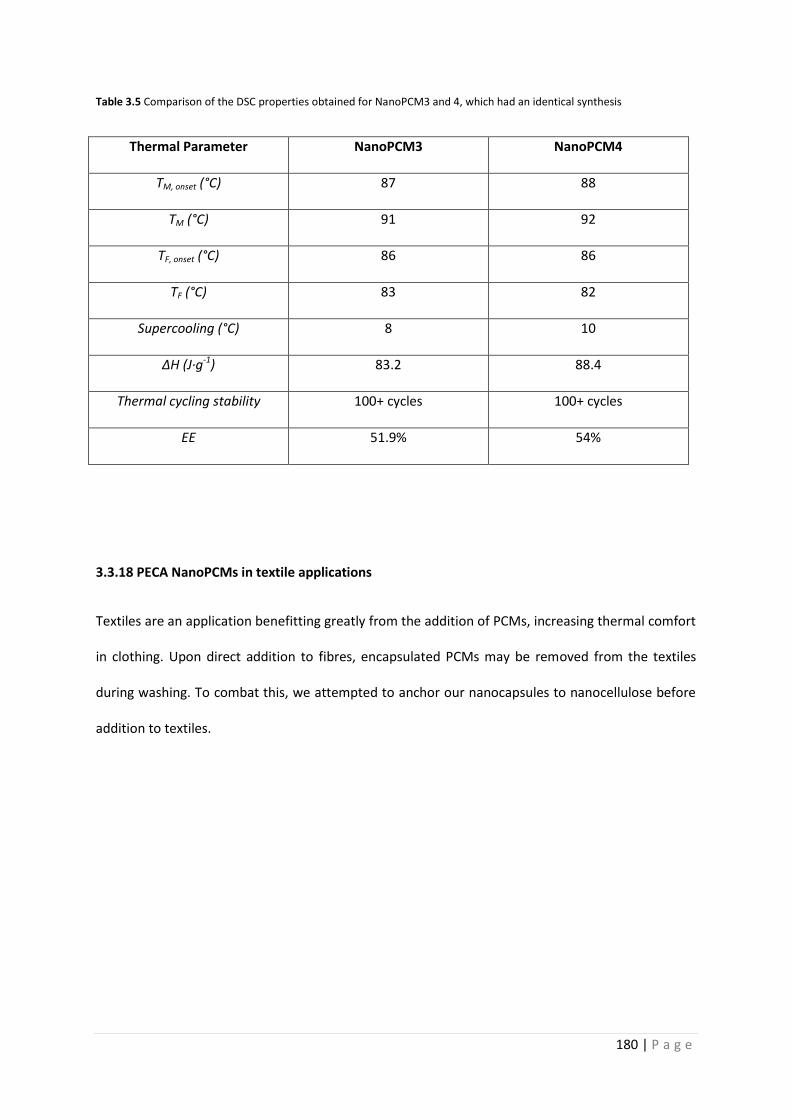
180 | P a g e
Table 3.5 Comparison of the DSC properties obtained for NanoPCM3 and 4, which had an identical synthesis
Thermal Parameter NanoPCM3 NanoPCM4
TM, onset (°C) 87 88
TM (°C) 91 92
TF, onset (°C) 86 86
TF (°C) 83 82
Supercooling (°C) 8 10
ΔH (J·g-1) 83.2 88.4
Thermal cycling stability 100+ cycles 100+ cycles
EE 51.9% 54%
3.3.18 PECA NanoPCMs in textile applications
Textiles are an application benefitting greatly from the addition of PCMs, increasing thermal comfort
in clothing. Upon direct addition to fibres, encapsulated PCMs may be removed from the textiles
during washing. To combat this, we attempted to anchor our nanocapsules to nanocellulose before
addition to textiles.
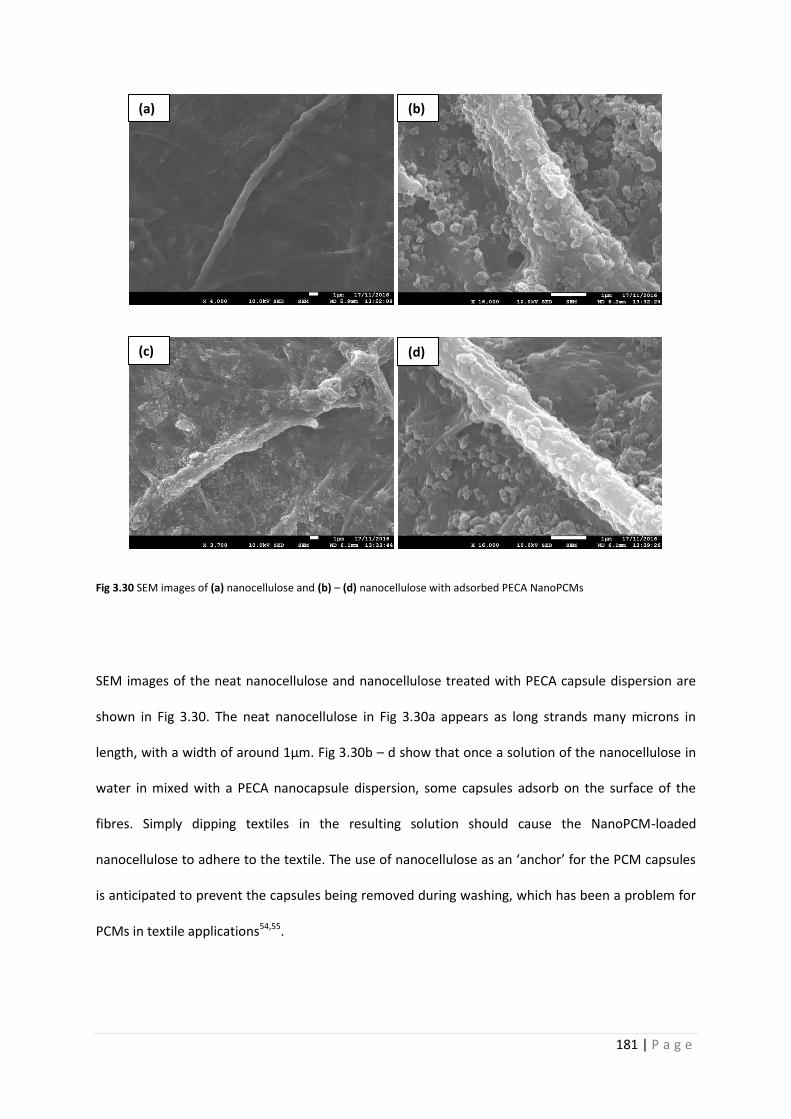
181 | P a g e
Fig 3.30 SEM images of (a) nanocellulose and (b) – (d) nanocellulose with adsorbed PECA NanoPCMs
SEM images of the neat nanocellulose and nanocellulose treated with PECA capsule dispersion are
shown in Fig 3.30. The neat nanocellulose in Fig 3.30a appears as long strands many microns in
length, with a width of around 1µm. Fig 3.30b – d show that once a solution of the nanocellulose in
water in mixed with a PECA nanocapsule dispersion, some capsules adsorb on the surface of the
fibres. Simply dipping textiles in the resulting solution should cause the NanoPCM-loaded
nanocellulose to adhere to the textile. The use of nanocellulose as an ‘anchor’ for the PCM capsules
is anticipated to prevent the capsules being removed during washing, which has been a problem for
PCMs in textile applications54,55.
(a) (b)
(c) (d)
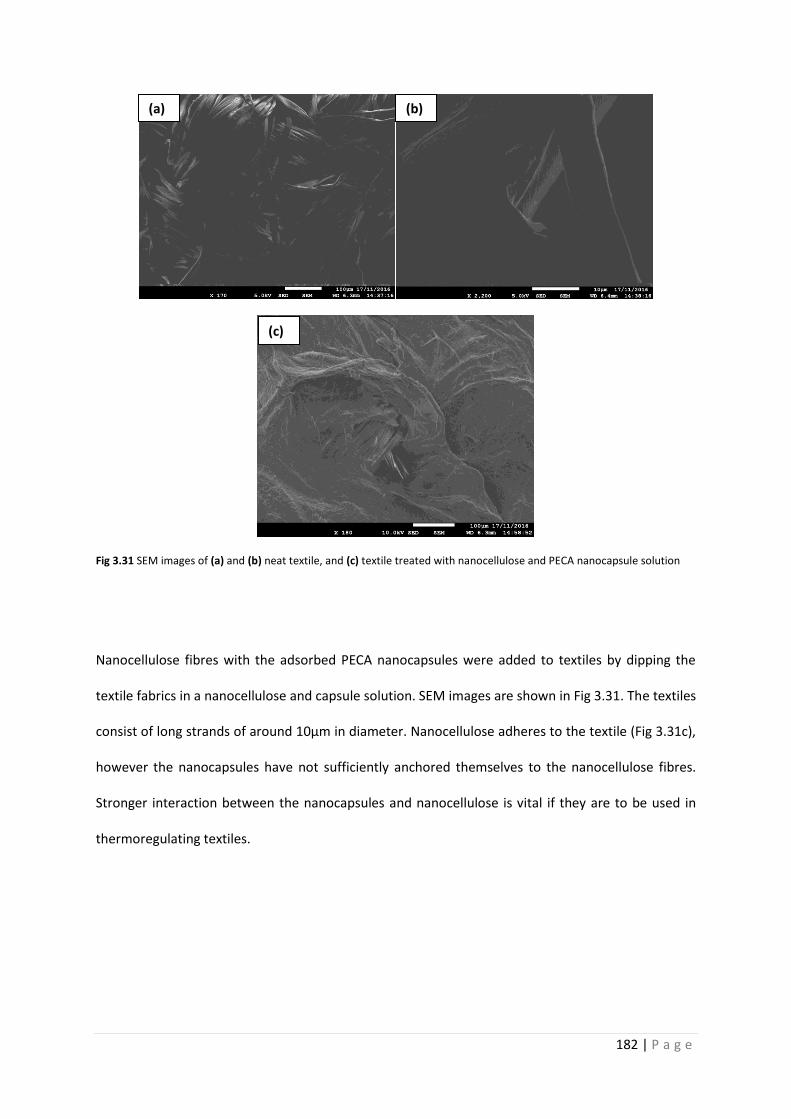
182 | P a g e
Fig 3.31 SEM images of (a) and (b) neat textile, and (c) textile treated with nanocellulose and PECA nanocapsule solution
Nanocellulose fibres with the adsorbed PECA nanocapsules were added to textiles by dipping the
textile fabrics in a nanocellulose and capsule solution. SEM images are shown in Fig 3.31. The textiles
consist of long strands of around 10µm in diameter. Nanocellulose adheres to the textile (Fig 3.31c),
however the nanocapsules have not sufficiently anchored themselves to the nanocellulose fibres.
Stronger interaction between the nanocapsules and nanocellulose is vital if they are to be used in
thermoregulating textiles.
(c)
(b) (a)
183 | P a g e
3.4 References
1 J. M. Asua, Prog. Polym. Sci., 2014, 39, 1797–1826.
2 N. Behan, C. Birkinshaw and N. Clarke, Biomaterials, 2001, 22, 1335–1344.
3 M. G. Schwab, B. Fassbender, H. W. Spiess and A. Thomas, 2009, 7216–7217.
4 F. Fawaz, M. Guyot, A. M. Lagueny and J. P. Devissaguet, Int. J. Pharm., 1997, 154, 191–203.
5 B. Seijo, E. Fattal, L. Roblot-Treupel and P. Couvreur, Int. J. Pharm., 1990, 62, 1–7.
6 S. Vrignaud, J. P. Benoit and P. Saulnier, Biomaterials, 2011, 32, 8593–8604.
7 J. L. Arias, M. A. Ruiz, M. López-Viota and Á. V. Delgado, Colloids Surfaces B Biointerfaces, 2008, 62, 64–70.
8 M. R. Gasco and M. Trotta, Int. J. Pharm., 1986, 29, 267–268.
9 S. Vrignaud, N. Anton, C. Passirani, J. P. Benoit and P. Saulnier, Drug Dev. Ind. Pharm., 2013, 39, 1706–1711.
10 A. Sari, C. Alkan, D. Kahraman Doguscu and A. Bicer, Sol. Energy Mater. Sol. Cells, 2014, 126, 42–50.
11 A. P. Kafka, B. J. McLeod, T. Rades and A. McDowell, J. Control. Release, 2011, 149, 307–313.
12 A. Musyanovych and K. Landfester, Prog. Colloid Polym. Sci., 2007, 134, 120–127.
13 T. Pitaksuteepong, N. M. Davies, I. G. Tucker and T. Rades, Eur. J. Pharm. Biopharm., 2002, 53, 335–342.
14 S. Watnasirichaikul, N. M. Davies, T. Rades and I. G. Tucker, Pharm. Res., 2000, 17, 684–689.
15 S. Watnasirichaikul, T. Rades, I. G. Tucker and N. M. Davies, Int. J. Pharm., 2002, 235, 237–246.
16 P. B. Salunkhe and P. S. Shembekar, Renew. Sustain. Energy Rev., 2012, 16, 5603–5616.
17 T. Makuta, K. Kadoya, H. Izumi and M. Miyatake, Chem. Eng. J., 2015, 273, 192–196.
18 Z. H. Chen, F. Yu, X. R. Zeng and Z. G. Zhang, Appl. Energy, 2012, 91, 7–12.
19 M. J. Graham, E. Shchukina, P. Felix De Castro and D. G. Shchukin, J. Mater. Chem. A, 2016, 4, 16906–16912.
20 M. J. Graham, J. A. Coca-Clemente, E. Shchukina and D. Shchukin, J. Mater. Chem. A, 2017, 5, 13683–13691.
21 T. Khadiran, M. Z. Hussein, Z. Zainal and R. Rusli, Sol. Energy Mater. Sol. Cells, 2015, 143, 78–98.
22 A. Solé, L. Miró, C. Barreneche, I. Martorell and L. F. Cabeza, Renew. Sustain. Energy Rev., 2013, 26, 425–436.
23 C. Rathgeber, L. Miró, L. F. Cabeza and S. Hiebler, Thermochim. Acta, 2014, 596, 79–88.
184 | P a g e
24 Q. Chen, Z. Gan, J. Wang and G. Chen, Chem. - A Eur. J., 2011, 17, 12458–12464.
25 J. Xu, L. Zhang and G. Chen, Sensors Actuators, B Chem., 2013, 182, 689–695.
26 P. Felix De Castro and D. G. Shchukin, Chem. - A Eur. J., 2015, 21, 11174–11179.
27 P. Felix De Castro, A. Ahmed and D. G. Shchukin, Chem. - A Eur. J., 2016, 22, 4389–4394.
28 M. G. Han, S. Kim and S. X. Liu, Polym. Degrad. Stab., 2008, 93, 1243–1251.
29 M. K. Tiwari, I. S. Bayer, G. M. Jursich, T. M. Schutzius and C. M. Megaridis, Macromol. Mater. Eng., 2009, 294, 775–780.
30 D. Z. Yin, L. Ma, J. J. Liu and Q. Y. Zhang, Energy, 2014, 64, 575–581.
31 M. M. Farid, A. M. Khudhair, S. A. K. Razack and S. Al-Hallaj, Energy Convers. Manag., 2004, 45, 1597–1615.
32 D. R. Biswas, Sol. Energy, 1977, 19, 99–100.
33 A. A. El-Sebaii, S. Al-Heniti, F. Al-Agel, A. A. Al-Ghamdi and F. Al-Marzouki, Energy Convers. Manag., 2011, 52, 1771–1777.
34 A. Abhat, Sol. Energy, 1983, 30, 313–332.
35 L. F. Cabeza, A. Castell, C. Barreneche, A. De Gracia and A. I. Fernández, Renew. Sustain. Energy Rev., 2011, 15, 1675–1695.
36 J. Zhang, S. S. Wang, S. D. Zhang, Q. H. Tao, L. Pan, Z. Y. Wang, Z. P. Zhang, Y. Lei, S. K. Yang and H. P. Zhao, J. Phys. Chem. C, 2011, 115, 20061–20066.
37 D. Crespy, M. Stark, C. Hoffmann-Richter, U. Ziener and K. Landfester, Macromolecules, 2007, 40, 3122–3135.
38 G. Wang, W. Xu, Q. Hou and S. Guo, Ultrason. Sonochem., 2015, 27, 403–407.
39 C. Alkan, A. Sari, A. Karaipekli and O. Uzun, Sol. Energy Mater. Sol. Cells, 2009, 93, 143–147.
40 A. Solé, I. Martorell and L. F. Cabeza, Renew. Sustain. Energy Rev., 2015, 47, 386–398.
41 D. Platte, U. Helbig, R. Houbertz and G. Sextl, Macromol. Mater. Eng., 2013, 298, 67–77.
42 C. Scott, D. Wu, C. C. Ho and C. C. Co, J. Am. Chem. Soc., 2005, 127, 4160–4161.
43 B. Zalba, J. M. Marin, L. F. Cabeza and H. Mehling, Appl. Therm. Eng., 2003, 23, 251–283.
44 H. Michels and R. Pitz-Paal, Sol. Energy, 2007, 81, 829–837.
45 Y. Tian and C. Y. Zhao, Appl. Energy, 2013, 104, 538–553.
46 L. Solomon and A. Oztekin, J. Energy Storage, 2016, 8, 12–26.
47 P. W. Stott, A. C. Williams and B. W. Barry, J. Control. Release, 1998, 50, 297–308.
48 K. Posern and C. Kaps, Thermochim. Acta, 2010, 502, 73–76.
49 S. S. Chandel and T. Agarwal, Renew. Sustain. Energy Rev., 2017, 67, 581–596.

185 | P a g e
50 K. Pielichowska and K. Pielichowski, Prog. Mater. Sci., 2014, 65, 67–123.
51 K. Nagano, K. Ogawa, T. Mochida, K. Hayashi and H. Ogoshi, Appl. Therm. Eng., 2004, 24, 221–232.
52 Y. Marcus, A. Minevich and L. Ben-Dor, Thermochim. Acta, 2004, 412, 163–170.
53 Y. E. Milián, A. Gutiérrez, M. Grágeda and S. Ushak, Renew. Sustain. Energy Rev., 2017, 73, 983–999.
54 Y. Shin, D. I. Yoo and K. Son, J. Appl. Polym. Sci., 2005, 96, 2005–2010.
55 Y. Shin, D. I. Yoo and K. Son, J. Appl. Polym. Sci., 2005, 97, 910–915.
186 | P a g e
4.
Polyurethane
Micro- and
Nanocapsules
187 | P a g e
4.1 Introduction
Although PECA nanocapsules have excellent promise for low temperature applications, they still
have limitations. ECA is reasonably expensive and highly moisture sensitive. It must be kept below
5°C and hermetically sealed. PECA also has a low degradation temperature (150°C) in contrast with
other polymers. It is also permeable to water1, which would hinder any applications requiring a
suspension of nanocapsules in aqueous solution. It is possible to develop aqueous core nanocapsules
which can be suspended in water by developing impermeable shell materials. PECA is also soluble in
many organic solvents, which may hinder some applications. For instance, we attempted to add the
PECA capsules to a xylene based paint for thermal regulation, but the capsules dissolved. Other
polymers show greater thermal and chemical stability. It is also beneficial to demonstrate that
several shells can be used for the encapsulation of PCMs, so that specific properties can be chosen
for energy storage systems.
Polyurethane (PU) is a highly versatile polymer and one of the most common – accounting for
roughly 5% of the total polymer market2. It can be hard or soft depending on the building blocks
used to form it and the way that they are blended. PU was discovered by Bayer and co-workers in
19373. It is used in many diverse applications such as rigid foams, condoms, rollercoaster wheels,
mattresses, surface coatings etc. It has excellent thermal properties, which have led to it being used
in flame retardant coatings4. PU is synthesised by the interfacial polymerisation of hydrophilic (a
diol, such as hexanediol; or polyol, such as polyvinyl alcohol (PVA)) and hydrophobic (diisocyanate)
monomers, which join via a carbamate (urethane) link. If a diamine is used in place of the di-/polyol,
a polyurea is formed instead. The wide variety of monomers mean different properties can be
achieved, such as hard or soft polymer formation. Isocyanates are highly reactive monomers,
ensuring good yields can be achieved on an industrial scale3. The reactivity of the isocyanate group
can also lead to unwanted side reactions, such as with water present in reactants or with any
condensation products2. Although the electron density of the carbamate group is not fully

188 | P a g e
understood, researchers agree that the least electron density is at the carbon atom5. The higher the
positive charge on the carbon, the higher the reactivity of the isocyanate3. Isocyanates must be fully
removed from the final product as they are highly toxic and potentially carcinogenic. PU however is
entirely non-toxic. PU has the potential to form aqueous core nanocapsules which can be dispersed
in water; aqueous PU dispersions have been used commercially since the 1970s6. When sufficiently
crosslinked, hydrophilic groups remain attached to the PU shell even when submersed in water,
demonstrating shell stability and meaning surfactants are not required to stabilise PU capsule
dispersions7. The large range of applications for PU is possible due to two physical processes; phase
separation between hard and soft segments, and hydrogen bonding between carbamate links.
PU can also be used for long-life ‘self-healing’ capsules. Isocyanates can be encapsulated in the core
of PU capsules along with active materials8. When the PU shell becomes damaged, isocyanates are
released and react to reform the shell. This is especially useful for advanced coating materials, as it
greatly extends material lifespan. It is also possible to encapsulate corrosion inhibitors, which are
released into the damaged region. Corrosion causes huge expense in maintenance costs, so these
materials are of great commercial value. With the potential for the formation of multi-
compartmental capsules9, it may be possible to synthesise compartments with PCMs along with self-
healing materials or corrosion inhibitors for long lasting energy storage capsules.
Environmentally friendly materials are highly desirable for industrial production; especially as the
general public becomes increasingly aware of issues such as global warming and the huge amount of
unnecessary waste produced by human activity. A challenge for industrial PU is that they are
traditionally produced using petrochemical reactants. Petrochemicals release large amounts of
emissions and are non-renewable, as they are obtained by distilling crude oil. PU can be sustainably
produced from many renewable, recycled or otherwise sustainable feedstocks, such as vegetable
oils10. Vegetable oils are cheap and abundant, and can be treated to obtain different polyols leading
to a variety of properties for the PU11. Various methods of treatment can be used to obtain the
189 | P a g e
polyols, such as reactions involving ester groups or C-C bonds12. Vegetable oil-based polymers
experience a performance gap compared to those that are petrochemically produced, including their
processing, thermal and mechanical properties13. More research is therefore required to narrow this
gap and ensure renewable feedstocks become economically viable. Javni et al14 showed that
vegetable oil-based PU can be more thermally stable than those produced with polypropylene oxide.
It is possible to remove isocyanates from PU synthesis altogether; they can be replaced by cyclic
carbonates, which are non-toxic. Cyclic carbonates can be produced from renewable natural
resources such as soybean oil15. These non-isocyanate PUs often have some superior properties to
regular PU, such as increased porosity and water adsorption; but perform more poorly in other
areas, for example their elasticity is not good enough to produce effective elastomers16.
Polyhydroxyurethanes (PHUs) may be a suitable alternative to PU, synthesised from the reaction of
cyclic carbonates with diamines by a nucleophilic addition2. PHUs were patented by Groszos in 1957.
Isocyanates are used for commercial PU synthesis due to low cost and availability, and they are
suitable for continued use at high yields of PU formation which eliminates toxicity. We used
methylene diphenyl diisocyanate (MDI) as our hydrophobic hard segment monomer of choice. MDI
is one of the most common isocyanates used for PU production, along with toluene diisocyanate. For
our hydrophilic soft segment monomer, polyvinyl alcohol (PVA) or polyethylene glycol (PEG) were
used. These are both cheap and abundant polymers which are widely used in many applications.
Due to its low biotoxicity and biodegradability, much research in PU chemistry has focused on
medical applications. An article in Science from Boretos and Pierce in 196717 focused on PU being
used for components in a heart-assistance system. They found the PU was useful as a coating for
stainless steel tubing as it was highly stable when in contact with the bloodstream, displaying no
biotoxicity. PU can also be reinforced by deposition of layers of clay or other materials which
enhance rigidity18, reduce permeability and improve solvent resistance.
190 | P a g e
PU micro- and nanocapsules are prominent in literature, often used to encapsulate drugs.
Rosenbauer et al19 synthesised their own custom diol for addition to toluene diisocyanate, further
demonstrating how PU properties can be tuned. They found they could trigger release of any active
core material by decomposition of the polymer shell by several external stimuli, such as pH or
temperature change. Poorly water soluble drugs, such as α-tocopherol20 and curcumin21 have been
encapsulated in PU. These studies found by varying experimental conditions, encapsulation
efficiency and nanocapsule size could be influenced.
Several researchers have used PU to encapsulate PCMs. Commonly used shell materials for PCMs
such as urea formaldehyde22,23 and melamine formaldehyde24,25 can lead to toxic chemicals being
released upon decomposition. PU is more inert and non-toxic. Su et al26 made PU microcapsules
containing octadecane. These capsules displayed good thermal stability and latent heat. By adding a
dispersant, the capsules could be suspended in ethanol solution with reduced leakage of core
material. Felix et al27,28 made two studies on PU microcapsules containing docosane. By altering the
speed of homogenisation to form their initial emulsion, they showed capsule size could be
controlled. The largest capsules produced were 10µm from a homogenisation speed of 6000 RPM,
whilst increasing the speed to 20000 RPM decreased capsule size to 2µm. The 10µm capsules had an
encapsulation efficiency of 19.2%, for the 2µm capsules this was increased to 31.6%.
PU has also been used to encapsulate crystallohydrates. Schoth and collaborators29 synthesised PU
nanocapsules containing sodium sulphate decahydrate, using a Pickering emulsion template.
Resulting capsules were an average of 860nm, although had a wide size range, and had a latent heat
of 58 J·g-1. They also demonstrated versatility of their method by also encapsulating a water-soluble
dye.
In addition to encapsulation, PU foams can be used as a supporting material for PCMs. Either PCM-
loaded capsules can be dispersed within the PU matrix, or a form-stable PCM can be synthesised.
Borreguero et al30,31 synthesised PU foam containing microcapsules with a Rubitherm RT27 core, a
191 | P a g e
commercial PCM based on paraffin wax. They found catalyst selection to be important in the
formation of foams, and showed that larger amounts of incorporated Rubitherm led to better
thermal storage but decreased mechanical properties. Therefore, a balance between the two must
be struck. Aydin and Okutan32 noted how PU foams are considered the best thermal insulation
material due to its superior thermal insulation per unit thickness. By adding a fatty acid-based PCM
to the PU foam they could further improve thermal insulation by 34%, displaying the compatibility of
PU with PCMs. Sarier and Onder33 impregnated PU foams with various PEG polymers for use in
insulating concrete. Best results were achieved by having inner and outer layers containing different
types of PEG, which increased heat collection ability of the material. Zhu et al34 demonstrated the
suitability of PU as superhydrophobic sponges for use in oil recovery. The foams were robust and
highly reusable, showing PU foams can be effective in numerous applications.
PEG-based PU can be used as form-stable PU PCM. PEG acts as the soft phase change component
with solid-liquid transitions, and PU acts as a solid support and prevents leakage. Numerous
researchers35–37 have reported the synthesis of form stable bulk PU PCMs, with latent heats from
100-140 J·g-1. Leakage will still occur at high loading capacities. Form-stable PCMs are not considered
for future energy saving applications however, due to the expense of synthesis and the fact that
encapsulation is more effective at preventing leakage. Emulsion polymerisation is also available for
industrial scale-up38, so it is possible to form capsules on a larger scale.
The large amount of research on polyurethane shows it is a highly promising candidate for the
encapsulation of inorganic PCMs, with good thermal stability and encapsulation efficiencies. We
sought simple methods based on miniemulsion polymerisations, and were able to form both
microcapsules and nanocapsules depending on the methodology used. Promising heat storage
abilities were observed, with good thermal stability and simple synthetic procedures.
192 | P a g e
4.2 Polyurethane microcapsules
PU is a good candidate for the encapsulation of salt hydrates. Saihi et al39,40 encapsulated
ammonium phosphate, a non-hydrated salt, in PU microcapsules (PUMCs) for flame retardant
coatings. The intumescent system protects from fire by expanding upon heating which protects the
material underneath. A carbonaceous residue is formed after decomposition of the system which is
thermally stable. During decomposition, ammonium phosphate degrades to form NH3 and H3PO4
which catalyse the char formation. They reported the success of both a coacervation technique and
an interfacial polymerisation in separate studies to form the capsules. Their coacervation technique
required more steps but led to smaller capsules. Coacervation is the formation of a liquid polymer
rich phase in equilibrium with another liquid phase of core material. The coacervate is then treated
to form a shell around the core. The method consisted of coating the salt core with the polyol
monomer, which was then crosslinked by adding a diisocyanate. We adapted their methods, using
Mg(NO3)2.6H2O as core material. The method involves a reaction between the isocyanate groups of
MDI and the OH groups of polyol PVA.
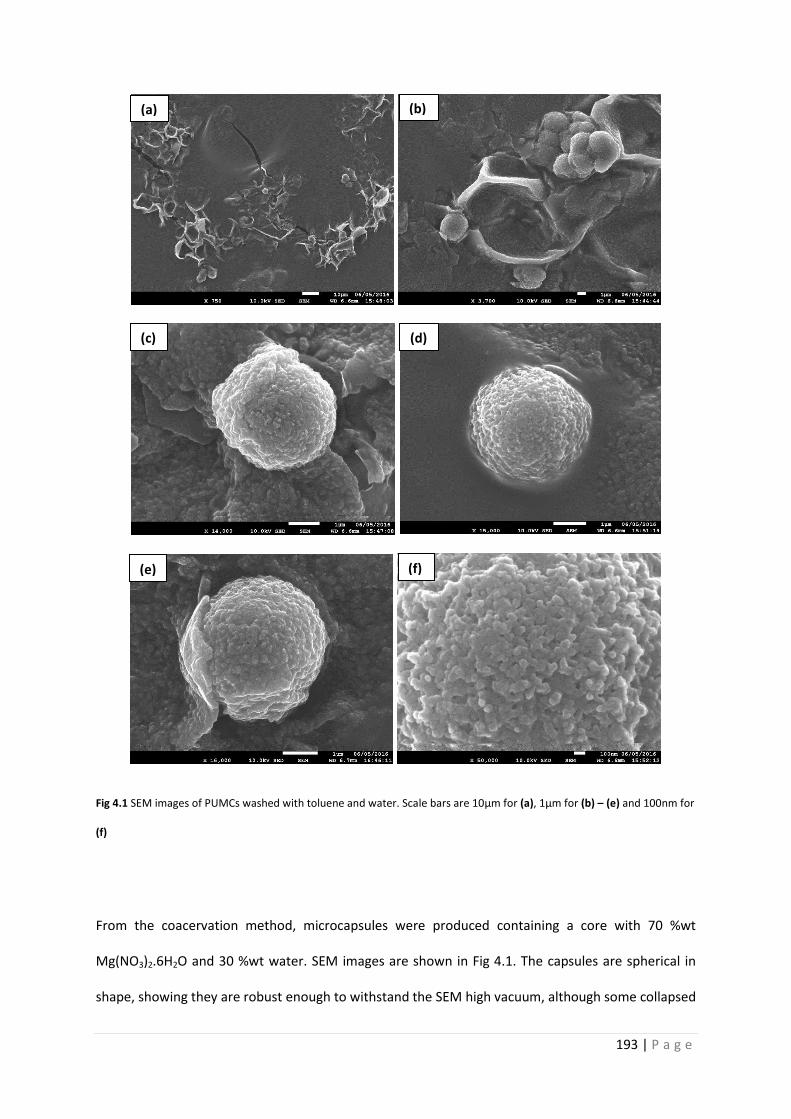
193 | P a g e
Fig 4.1 SEM images of PUMCs washed with toluene and water. Scale bars are 10µm for (a), 1µm for (b) – (e) and 100nm for
(f)
From the coacervation method, microcapsules were produced containing a core with 70 %wt
Mg(NO3)2.6H2O and 30 %wt water. SEM images are shown in Fig 4.1. The capsules are spherical in
shape, showing they are robust enough to withstand the SEM high vacuum, although some collapsed
(a) (b)
(c)
(e) (f)
(d)
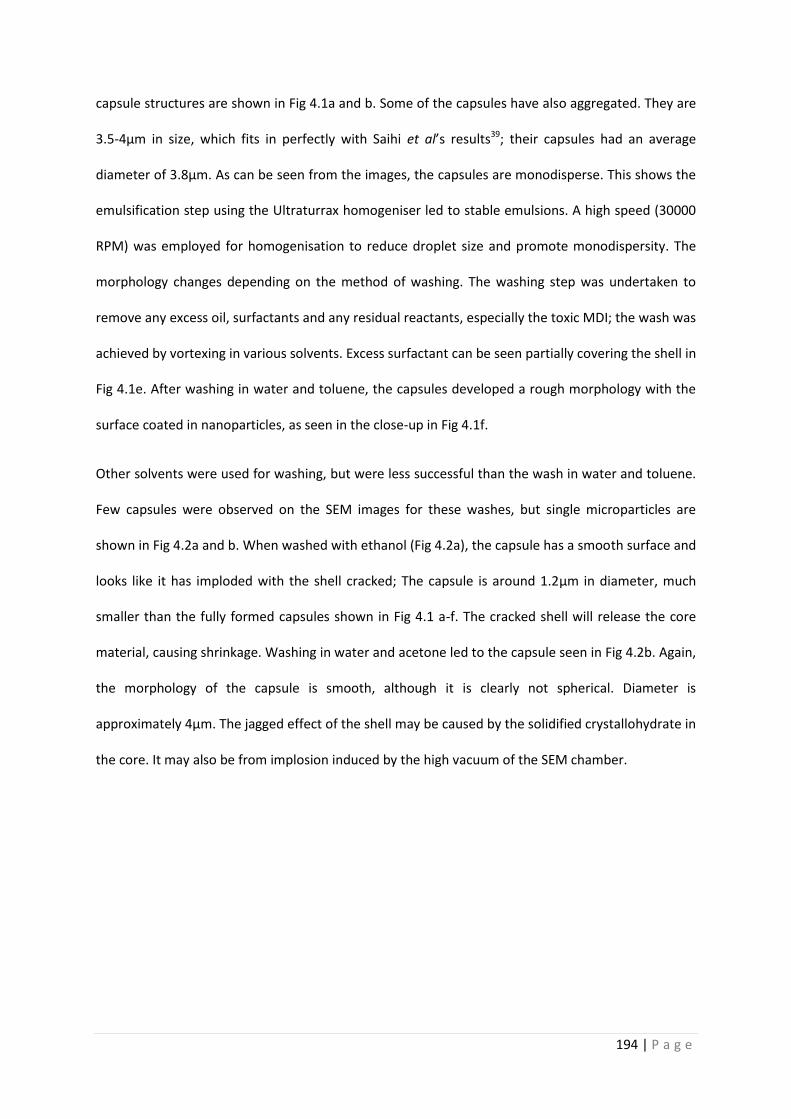
194 | P a g e
capsule structures are shown in Fig 4.1a and b. Some of the capsules have also aggregated. They are
3.5-4µm in size, which fits in perfectly with Saihi et al’s results39; their capsules had an average
diameter of 3.8µm. As can be seen from the images, the capsules are monodisperse. This shows the
emulsification step using the Ultraturrax homogeniser led to stable emulsions. A high speed (30000
RPM) was employed for homogenisation to reduce droplet size and promote monodispersity. The
morphology changes depending on the method of washing. The washing step was undertaken to
remove any excess oil, surfactants and any residual reactants, especially the toxic MDI; the wash was
achieved by vortexing in various solvents. Excess surfactant can be seen partially covering the shell in
Fig 4.1e. After washing in water and toluene, the capsules developed a rough morphology with the
surface coated in nanoparticles, as seen in the close-up in Fig 4.1f.
Other solvents were used for washing, but were less successful than the wash in water and toluene.
Few capsules were observed on the SEM images for these washes, but single microparticles are
shown in Fig 4.2a and b. When washed with ethanol (Fig 4.2a), the capsule has a smooth surface and
looks like it has imploded with the shell cracked; The capsule is around 1.2µm in diameter, much
smaller than the fully formed capsules shown in Fig 4.1 a-f. The cracked shell will release the core
material, causing shrinkage. Washing in water and acetone led to the capsule seen in Fig 4.2b. Again,
the morphology of the capsule is smooth, although it is clearly not spherical. Diameter is
approximately 4µm. The jagged effect of the shell may be caused by the solidified crystallohydrate in
the core. It may also be from implosion induced by the high vacuum of the SEM chamber.
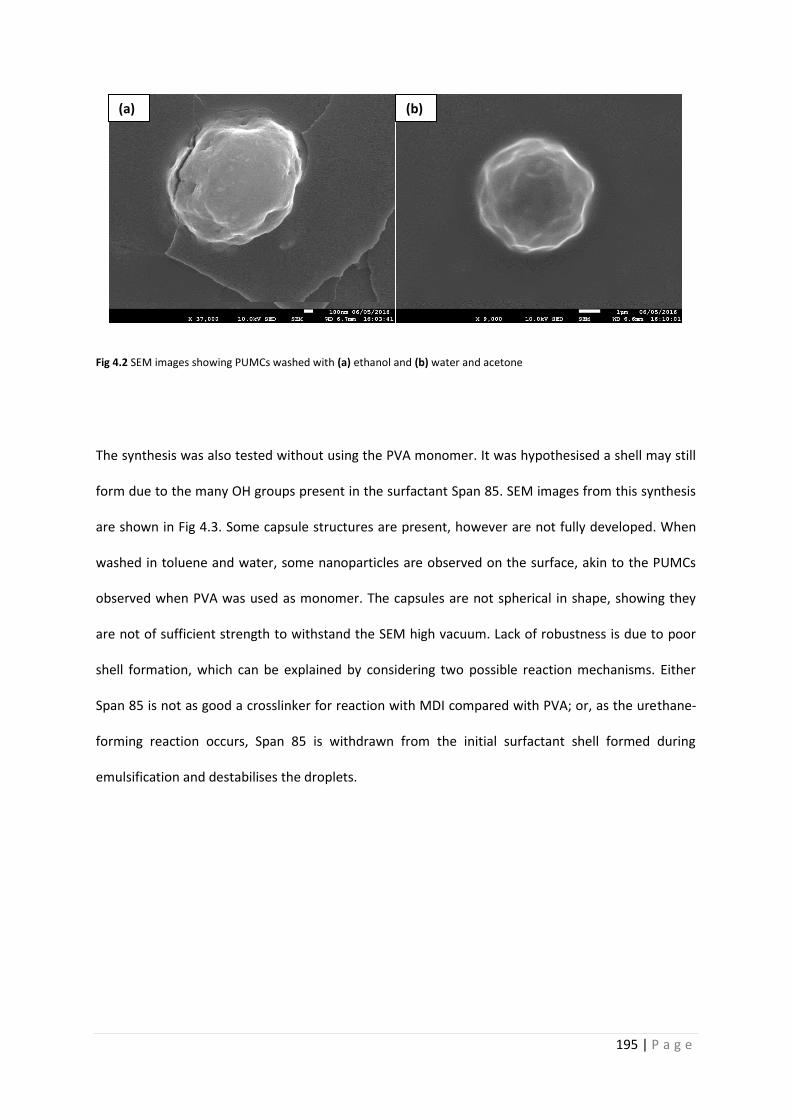
195 | P a g e
Fig 4.2 SEM images showing PUMCs washed with (a) ethanol and (b) water and acetone
The synthesis was also tested without using the PVA monomer. It was hypothesised a shell may still
form due to the many OH groups present in the surfactant Span 85. SEM images from this synthesis
are shown in Fig 4.3. Some capsule structures are present, however are not fully developed. When
washed in toluene and water, some nanoparticles are observed on the surface, akin to the PUMCs
observed when PVA was used as monomer. The capsules are not spherical in shape, showing they
are not of sufficient strength to withstand the SEM high vacuum. Lack of robustness is due to poor
shell formation, which can be explained by considering two possible reaction mechanisms. Either
Span 85 is not as good a crosslinker for reaction with MDI compared with PVA; or, as the urethane-
forming reaction occurs, Span 85 is withdrawn from the initial surfactant shell formed during
emulsification and destabilises the droplets.
(a) (b)
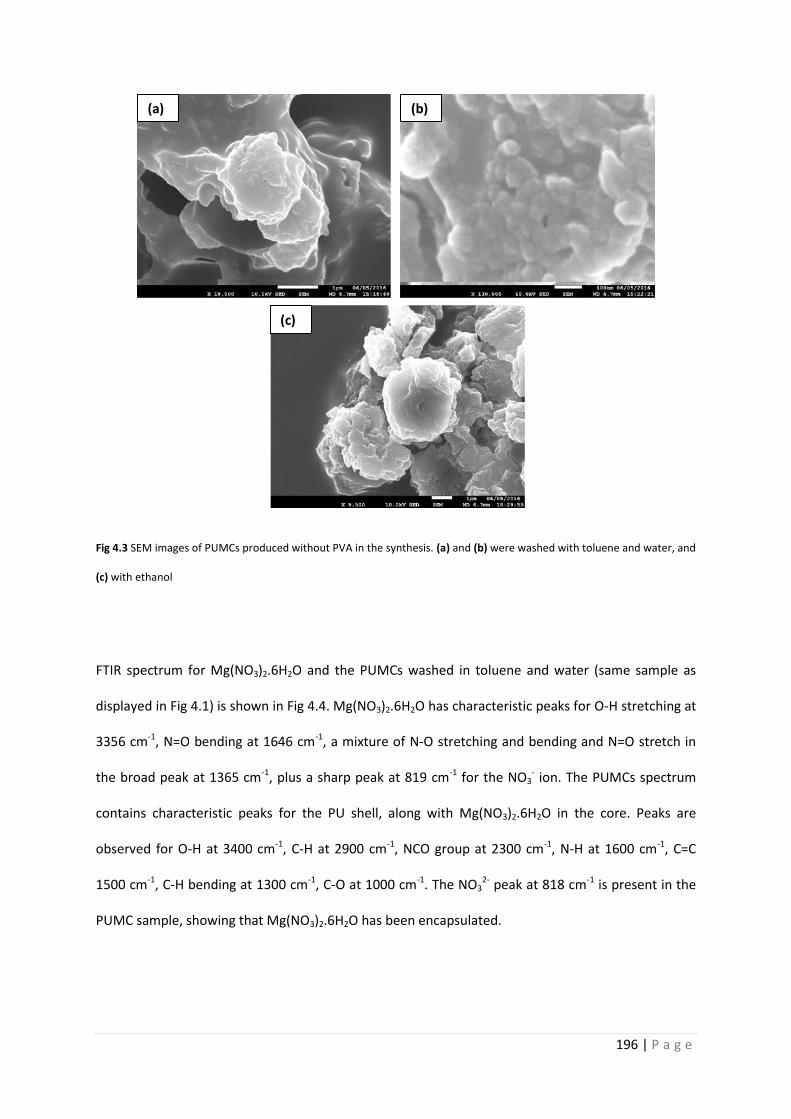
196 | P a g e
Fig 4.3 SEM images of PUMCs produced without PVA in the synthesis. (a) and (b) were washed with toluene and water, and
(c) with ethanol
FTIR spectrum for Mg(NO3)2.6H2O and the PUMCs washed in toluene and water (same sample as
displayed in Fig 4.1) is shown in Fig 4.4. Mg(NO3)2.6H2O has characteristic peaks for O-H stretching at
3356 cm-1, N=O bending at 1646 cm-1, a mixture of N-O stretching and bending and N=O stretch in
the broad peak at 1365 cm-1, plus a sharp peak at 819 cm-1 for the NO3- ion. The PUMCs spectrum
contains characteristic peaks for the PU shell, along with Mg(NO3)2.6H2O in the core. Peaks are
observed for O-H at 3400 cm-1, C-H at 2900 cm-1, NCO group at 2300 cm-1, N-H at 1600 cm-1, C=C
1500 cm-1, C-H bending at 1300 cm-1, C-O at 1000 cm-1. The NO32- peak at 818 cm-1 is present in the
PUMC sample, showing that Mg(NO3)2.6H2O has been encapsulated.
(c)
(b) (a)
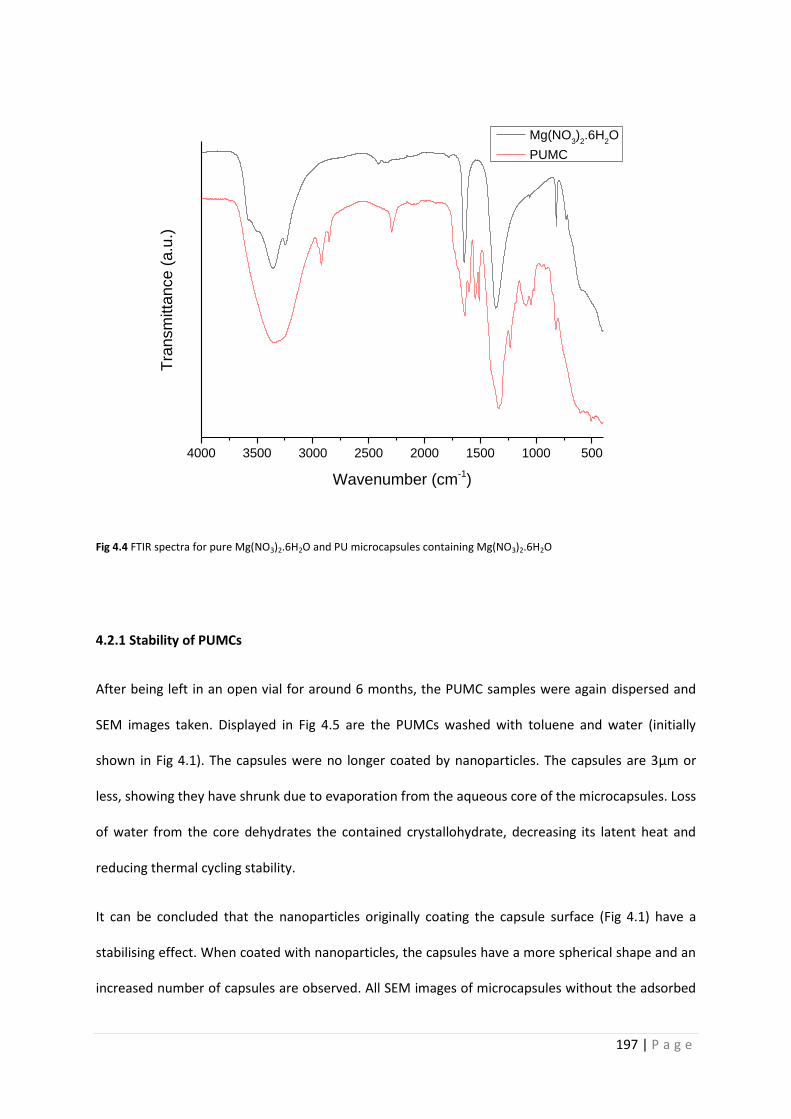
197 | P a g e
4000 3500 3000 2500 2000 1500 1000 500
Tra
nsm
itta
nce (
a.u
.)
Wavenumber (cm-1)
Mg(NO3)2.6H
2O
PUMC
Fig 4.4 FTIR spectra for pure Mg(NO3)2.6H2O and PU microcapsules containing Mg(NO3)2.6H2O
4.2.1 Stability of PUMCs
After being left in an open vial for around 6 months, the PUMC samples were again dispersed and
SEM images taken. Displayed in Fig 4.5 are the PUMCs washed with toluene and water (initially
shown in Fig 4.1). The capsules were no longer coated by nanoparticles. The capsules are 3µm or
less, showing they have shrunk due to evaporation from the aqueous core of the microcapsules. Loss
of water from the core dehydrates the contained crystallohydrate, decreasing its latent heat and
reducing thermal cycling stability.
It can be concluded that the nanoparticles originally coating the capsule surface (Fig 4.1) have a
stabilising effect. When coated with nanoparticles, the capsules have a more spherical shape and an
increased number of capsules are observed. All SEM images of microcapsules without the adsorbed

198 | P a g e
nanoparticles are smaller in comparison, due to loss of core material. Overall, these results show
that microcapsules do not give the necessary stability required for long lasting heat storage energy
capsules, due to shell degradation and loss of core material.
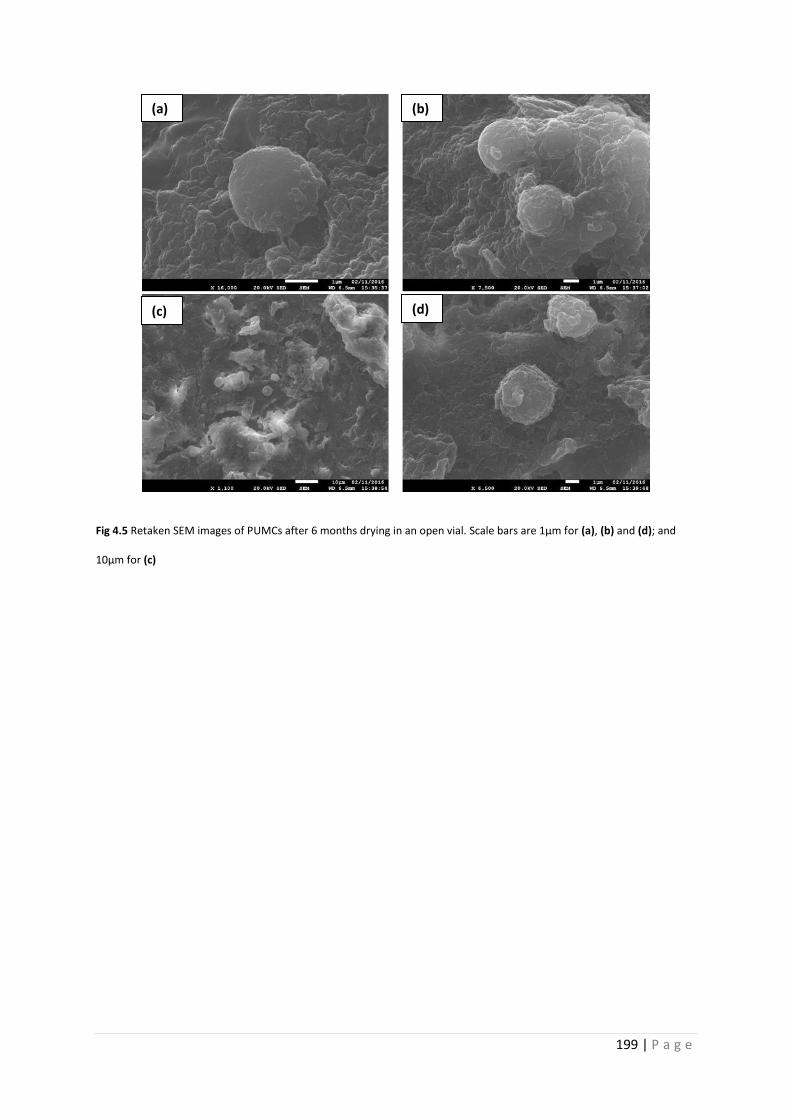
199 | P a g e
Fig 4.5 Retaken SEM images of PUMCs after 6 months drying in an open vial. Scale bars are 1µm for (a), (b) and (d); and
10µm for (c)
(a)
(c) (d)
(b)
200 | P a g e
4.3 Polyurethane Nanocapsules
Clearly the PUMCs do not show the necessary stability for thermal energy storage. New methods
were then sought. Due to the success of our PECA nanocapsules described in the previous chapter,
we wanted to synthesise nanocapsules using PU as shell material (PUNCs). Ultrasonication was used
to emulsify the reactants rather than homogenisation, in order to reduce the size of emulsion
droplets.
Hamberger et al41 precipitated non-water-soluble salts inside PU nanocapsules by introducing two
separate W/O miniemulsions containing water-soluble salts. These salts then reacted to form non-
water-soluble salts within the capsule core. We condensed their method to form one W/O
miniemulsion containing crystallohydrates. As with our method to produce PUMCs, the process
involves the reaction of diisocyanate with a polyol. The proposed reaction mechanism is shown in Fig
4.6.
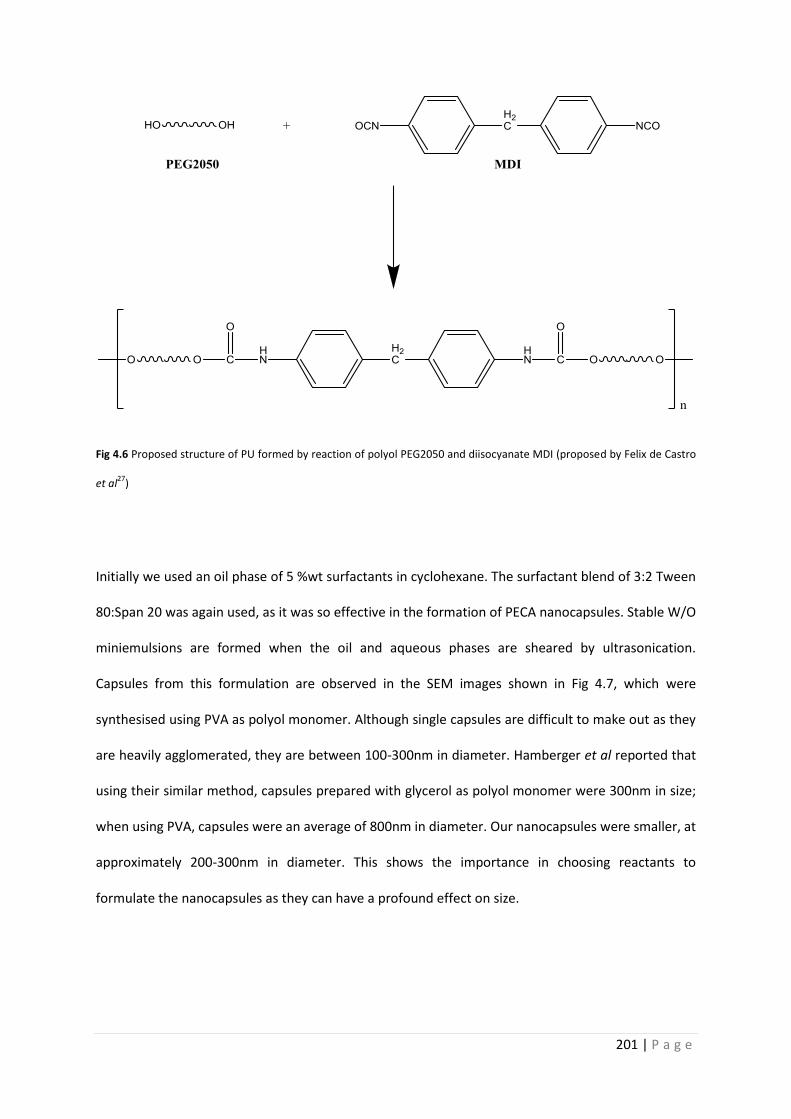
201 | P a g e
Fig 4.6 Proposed structure of PU formed by reaction of polyol PEG2050 and diisocyanate MDI (proposed by Felix de Castro
et al27
)
Initially we used an oil phase of 5 %wt surfactants in cyclohexane. The surfactant blend of 3:2 Tween
80:Span 20 was again used, as it was so effective in the formation of PECA nanocapsules. Stable W/O
miniemulsions are formed when the oil and aqueous phases are sheared by ultrasonication.
Capsules from this formulation are observed in the SEM images shown in Fig 4.7, which were
synthesised using PVA as polyol monomer. Although single capsules are difficult to make out as they
are heavily agglomerated, they are between 100-300nm in diameter. Hamberger et al reported that
using their similar method, capsules prepared with glycerol as polyol monomer were 300nm in size;
when using PVA, capsules were an average of 800nm in diameter. Our nanocapsules were smaller, at
approximately 200-300nm in diameter. This shows the importance in choosing reactants to
formulate the nanocapsules as they can have a profound effect on size.
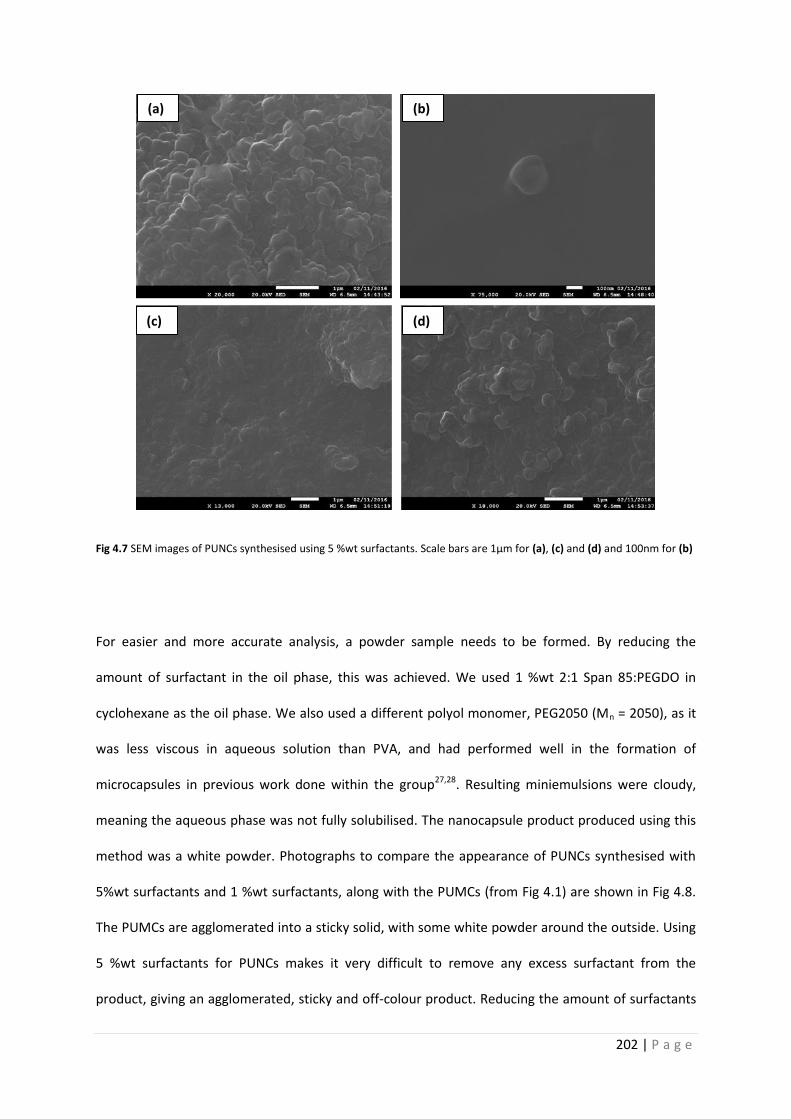
202 | P a g e
Fig 4.7 SEM images of PUNCs synthesised using 5 %wt surfactants. Scale bars are 1µm for (a), (c) and (d) and 100nm for (b)
For easier and more accurate analysis, a powder sample needs to be formed. By reducing the
amount of surfactant in the oil phase, this was achieved. We used 1 %wt 2:1 Span 85:PEGDO in
cyclohexane as the oil phase. We also used a different polyol monomer, PEG2050 (Mn = 2050), as it
was less viscous in aqueous solution than PVA, and had performed well in the formation of
microcapsules in previous work done within the group27,28. Resulting miniemulsions were cloudy,
meaning the aqueous phase was not fully solubilised. The nanocapsule product produced using this
method was a white powder. Photographs to compare the appearance of PUNCs synthesised with
5%wt surfactants and 1 %wt surfactants, along with the PUMCs (from Fig 4.1) are shown in Fig 4.8.
The PUMCs are agglomerated into a sticky solid, with some white powder around the outside. Using
5 %wt surfactants for PUNCs makes it very difficult to remove any excess surfactant from the
product, giving an agglomerated, sticky and off-colour product. Reducing the amount of surfactants
(a) (b)
(c) (d)

203 | P a g e
to 1 %wt of the continuous phase resulted in a powder sample, seen on the right of Fig 4.8. A simple
way of ensuring PU has formed is to add the product to acetone. MDI is highly soluble in acetone,
whereas PU is insoluble.
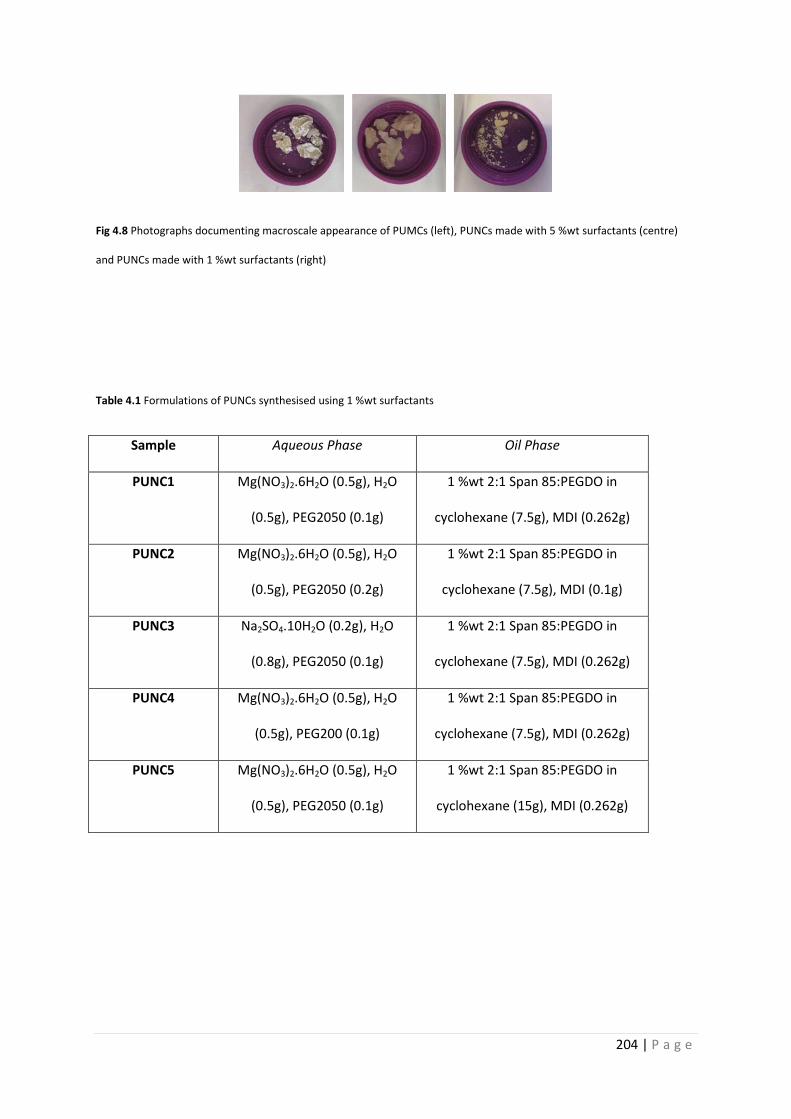
204 | P a g e
Fig 4.8 Photographs documenting macroscale appearance of PUMCs (left), PUNCs made with 5 %wt surfactants (centre)
and PUNCs made with 1 %wt surfactants (right)
Table 4.1 Formulations of PUNCs synthesised using 1 %wt surfactants
Sample Aqueous Phase Oil Phase
PUNC1 Mg(NO3)2.6H2O (0.5g), H2O
(0.5g), PEG2050 (0.1g)
1 %wt 2:1 Span 85:PEGDO in
cyclohexane (7.5g), MDI (0.262g)
PUNC2 Mg(NO3)2.6H2O (0.5g), H2O
(0.5g), PEG2050 (0.2g)
1 %wt 2:1 Span 85:PEGDO in
cyclohexane (7.5g), MDI (0.1g)
PUNC3 Na2SO4.10H2O (0.2g), H2O
(0.8g), PEG2050 (0.1g)
1 %wt 2:1 Span 85:PEGDO in
cyclohexane (7.5g), MDI (0.262g)
PUNC4 Mg(NO3)2.6H2O (0.5g), H2O
(0.5g), PEG200 (0.1g)
1 %wt 2:1 Span 85:PEGDO in
cyclohexane (7.5g), MDI (0.262g)
PUNC5 Mg(NO3)2.6H2O (0.5g), H2O
(0.5g), PEG2050 (0.1g)
1 %wt 2:1 Span 85:PEGDO in
cyclohexane (15g), MDI (0.262g)
205 | P a g e
4.3.1 Formulation of PUNCs, morphology and chemical analysis
Yields for PUNCs were between 0.15-0.2g per reaction. The yield seems rather low considering the
amount of monomers used (0.2-0.4g), and the core material consisted of 1g crystallohydrate
solution. Any reactants left unreacted after synthesis were removed by centrifugation. By adding a
catalyst to the reaction, dibutyltin dilaurate (DBDL), the yield was increased to 0.67g. However, no
thermal data could be collected from this sample.
SEM images for PUNCs are shown in Fig 4.9. The capsules are 200-400nm in size, with a smooth
morphology. They are slightly larger than capsules made with 5 %wt surfactants, as the decreased
amount of surfactants results in a higher polydispersity of miniemulsion droplets. The shell material
is completely intact and provides full coverage of the core material. This is essential to prevent any
leakage from occurring. The capsules were fully isolated by taking them directly out of solution
straight after synthesis and dispersing by sonication, rather than drying them before dispersion. This
prevents agglomeration. The capsules remain a roughly spherical shape with none collapsing, in
contrast to the PUMCs. This demonstrates the robustness of nanomaterials compared with larger
capsules.
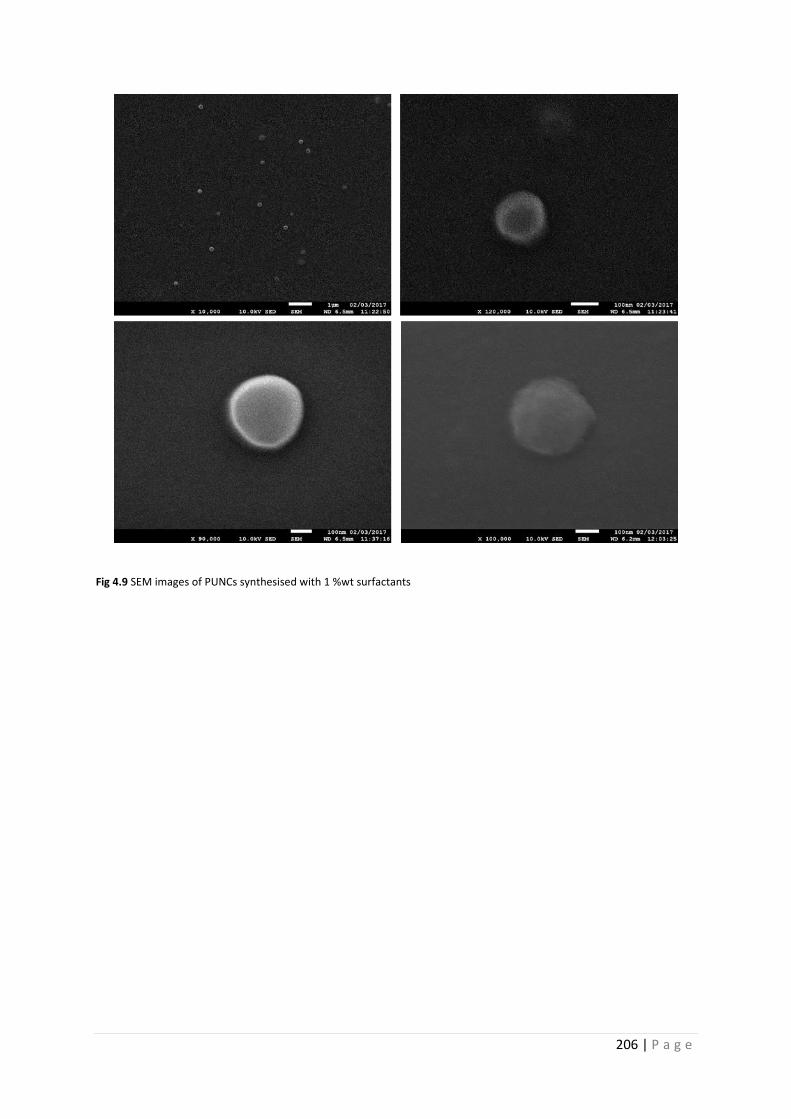
206 | P a g e
Fig 4.9 SEM images of PUNCs synthesised with 1 %wt surfactants
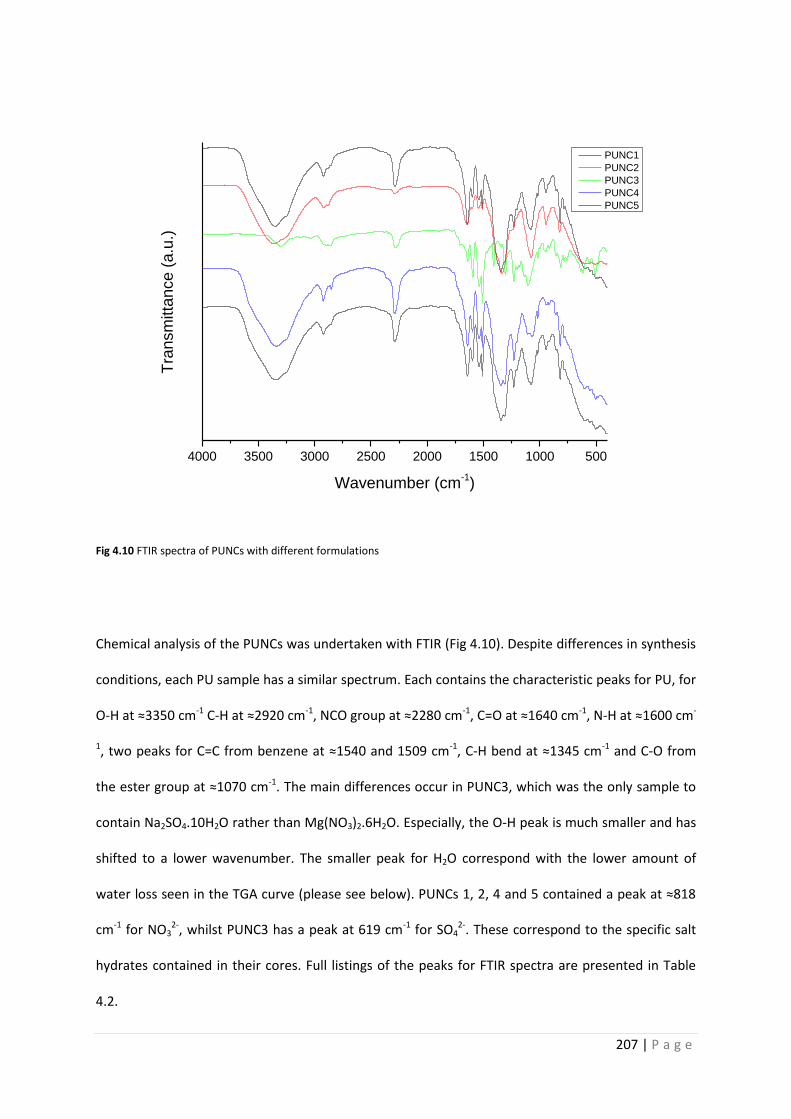
207 | P a g e
4000 3500 3000 2500 2000 1500 1000 500
Tra
nsm
itta
nce (
a.u
.)
Wavenumber (cm-1)
PUNC1
PUNC2
PUNC3
PUNC4
PUNC5
Fig 4.10 FTIR spectra of PUNCs with different formulations
Chemical analysis of the PUNCs was undertaken with FTIR (Fig 4.10). Despite differences in synthesis
conditions, each PU sample has a similar spectrum. Each contains the characteristic peaks for PU, for
O-H at ≈3350 cm-1 C-H at ≈2920 cm-1, NCO group at ≈2280 cm-1, C=O at ≈1640 cm-1, N-H at ≈1600 cm-
1, two peaks for C=C from benzene at ≈1540 and 1509 cm-1, C-H bend at ≈1345 cm-1 and C-O from
the ester group at ≈1070 cm-1. The main differences occur in PUNC3, which was the only sample to
contain Na2SO4.10H2O rather than Mg(NO3)2.6H2O. Especially, the O-H peak is much smaller and has
shifted to a lower wavenumber. The smaller peak for H2O correspond with the lower amount of
water loss seen in the TGA curve (please see below). PUNCs 1, 2, 4 and 5 contained a peak at ≈818
cm-1 for NO32-, whilst PUNC3 has a peak at 619 cm-1 for SO4
2-. These correspond to the specific salt
hydrates contained in their cores. Full listings of the peaks for FTIR spectra are presented in Table
4.2.
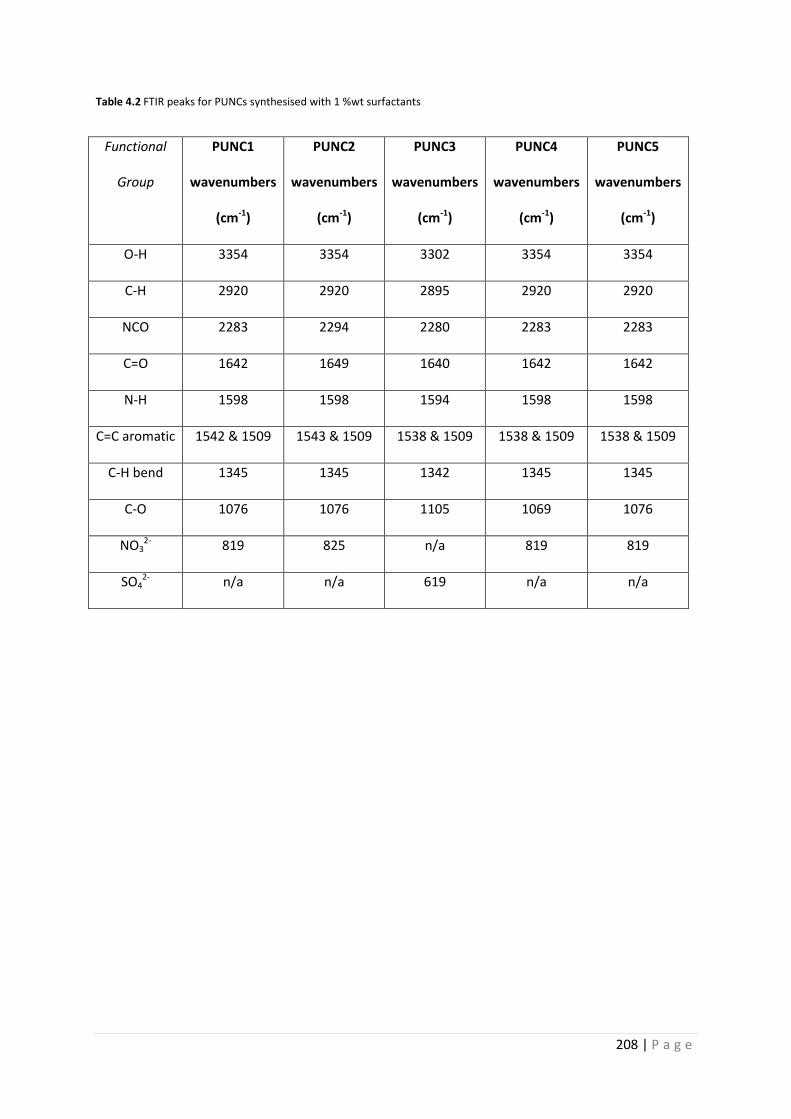
208 | P a g e
Table 4.2 FTIR peaks for PUNCs synthesised with 1 %wt surfactants
Functional
Group
PUNC1
wavenumbers
(cm-1)
PUNC2
wavenumbers
(cm-1)
PUNC3
wavenumbers
(cm-1)
PUNC4
wavenumbers
(cm-1)
PUNC5
wavenumbers
(cm-1)
O-H 3354 3354 3302 3354 3354
C-H 2920 2920 2895 2920 2920
NCO 2283 2294 2280 2283 2283
C=O 1642 1649 1640 1642 1642
N-H 1598 1598 1594 1598 1598
C=C aromatic 1542 & 1509 1543 & 1509 1538 & 1509 1538 & 1509 1538 & 1509
C-H bend 1345 1345 1342 1345 1345
C-O 1076 1076 1105 1069 1076
NO32- 819 825 n/a 819 819
SO42- n/a n/a 619 n/a n/a
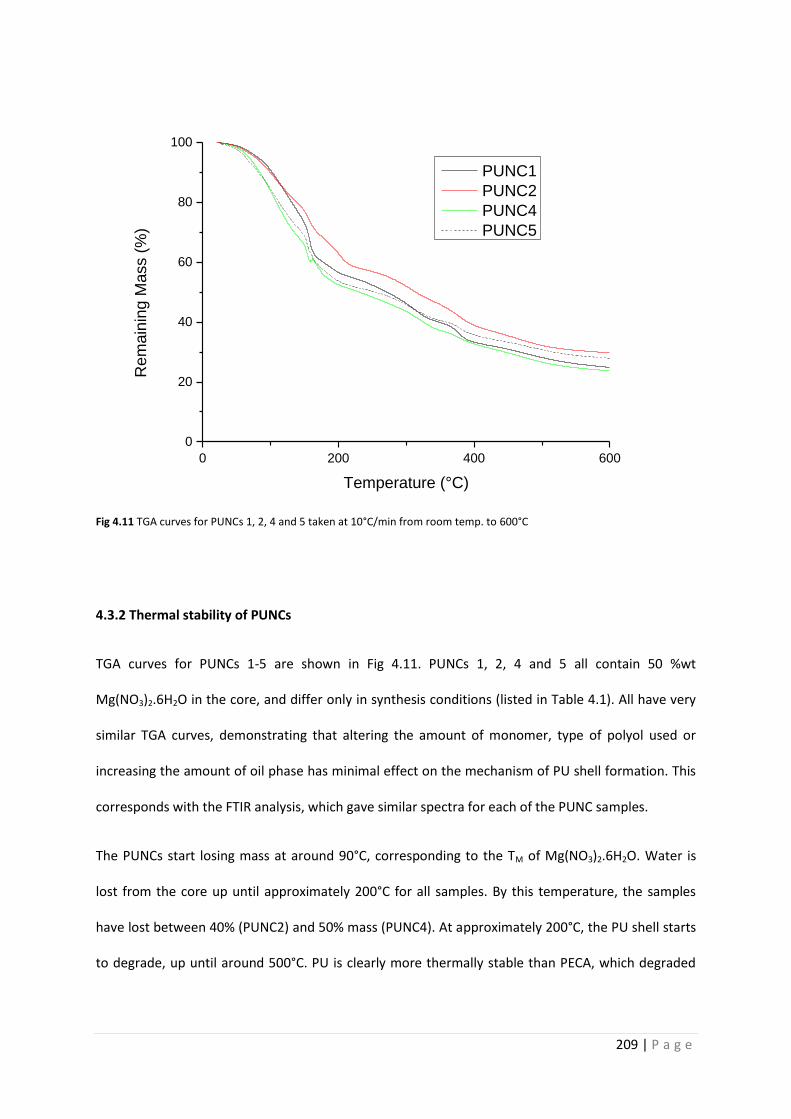
209 | P a g e
0 200 400 600
0
20
40
60
80
100R
em
ain
ing M
ass (
%)
Temperature (°C)
PUNC1
PUNC2
PUNC4
PUNC5
Fig 4.11 TGA curves for PUNCs 1, 2, 4 and 5 taken at 10°C/min from room temp. to 600°C
4.3.2 Thermal stability of PUNCs
TGA curves for PUNCs 1-5 are shown in Fig 4.11. PUNCs 1, 2, 4 and 5 all contain 50 %wt
Mg(NO3)2.6H2O in the core, and differ only in synthesis conditions (listed in Table 4.1). All have very
similar TGA curves, demonstrating that altering the amount of monomer, type of polyol used or
increasing the amount of oil phase has minimal effect on the mechanism of PU shell formation. This
corresponds with the FTIR analysis, which gave similar spectra for each of the PUNC samples.
The PUNCs start losing mass at around 90°C, corresponding to the TM of Mg(NO3)2.6H2O. Water is
lost from the core up until approximately 200°C for all samples. By this temperature, the samples
have lost between 40% (PUNC2) and 50% mass (PUNC4). At approximately 200°C, the PU shell starts
to degrade, up until around 500°C. PU is clearly more thermally stable than PECA, which degraded
210 | P a g e
between 150-300°C. After heating to 600°C, the PUNCs have lost between 69% (PUNC2) and 75%
(PUNC4) mass.
PUNC2 was synthesised using an excess of PEG2050 compared to the other samples, leading to the
highest thermal stability. The excess of PEG may promote further crosslinking of the shell, leading to
a higher MW polymer with better thermal stability. PUNC4 used a lower MW PEG (PEG200)
monomer, and is the least thermally stable sample. This shows a high MW polyol is best for PU
synthesis of energy storage nanocapsules. The high MW PEG molecules have more OH groups, aiding
crosslinking during urethane formation resulting in increased thermal stability. No TGA curve was
obtained for PUNC3 due to the lack of concordant results, possibly caused by impurities in the
sample.
The PU TGA curves are similar to those of PECA nanocapsules displayed in Chapter 3 (Fig 3.9). The
major differences are that PU has a higher degradation temperature (200°C compared to 150°C), but
also that PUNCs have more mass loss between 100-150°C. By 150°C, PECA nanocapsules containing
Mg(NO3)2.6H2O have lost 10% mass; corresponding PUNCs have lost 30%. Mass loss over this
temperature range is attributed to water loss from the core crystallohydrate. It can be concluded
that the PUNCs contain more water in the core in comparison to PECA. This was further confirmed
by DSC results showing PUNCs had a lower encapsulation efficiency for the salt hydrates compared
with PECA.
4.3.3 Latent heat storage of PUNCs
The key property of any thermal storage energy capsule is their latent heat storage capacity. DSC
thermal cycling was undertaken on PUNC1 and PUNC3 (new samples were synthesised for these
measurements, using 0.2g of MDI rather than 0.262g). It should be noted that DSC measurements
for PUNC were taken on a less sophisticated instrument compared with the PECA samples, so results
211 | P a g e
may be less accurate due to less isolation and control of sample conditions. The samples were cycled
between -20 to 120°C at 10°C/min. PUNC1 underwent 10 cycles. Full values obtained are shown in
Table 4.3, while selected curves are shown in Fig 4.12. Melting peaks are broad, containing a small
initial peak at around 79°C, which can be associated with a solid-solid transition of the crystalline
structure. The peak melting temperature (TM) changes during increased cycling, from 83.9°C in cycle
1 to 89.1°C by cycle 10, which is the literature value for Mg(NO3)2.6H2O. Noticeable is the formation
of multiple phases in the core of the PUNCs. Many peaks are present for the crystallisation of the
crystallohydrate core, indicating these processes are non-homogeneous. As nucleation for freezing is
a random process, it is difficult to achieve when the material is confined within a nanosized core.
The PUNCs also display a large degree of supercooling, from 41.5°C in cycle 1 to 30.5°C in cycle 5.
This is in stark contrast to the PECA nanocapsules, which practically eliminated supercooling. There
are several possible explanations for the difference in supercooling seen in crystallohydrate-loaded
nanocapsules. Supercooling results from poor nucleation properties. The inner shell surface
composition can affect nucleation, so it is probable that nucleation occurs from the inner shell rather
than the centre of the capsule, resulting in the difference between the two polymer shells. The PU
polymerisation may also result in a thicker shell than PECA, reducing heat transfer and hindering
crystallisation processes.
Latent heat actually increases from cycle 1 to cycle 10, which is unusual. Usually, a PCM decreases its
latent heat over time, as the crystallohydrate gradually dehydrates. The increase can be explained by
considering the non-homogeneous crystallisation. During each cycle, more of the crystallohydrate
freezes into its hexahydrate form, leading to a more uniform core material, higher latent heat and
the TM equilibrating to the expected value. Latent heat after 10 cycles is 57.4 J·g-1, giving an
encapsulation efficiency of 35.8%. The core material contained 50 %wt of Mg(NO3)2.6H2O, so this is
lower than expected, and can be explained by the poor nucleation inside the capsule core along with
minimal heat transfer across the shell. Previous work in our group encapsulating paraffin wax
docosane in PU had resulted in similar encapsulation efficiencies28.
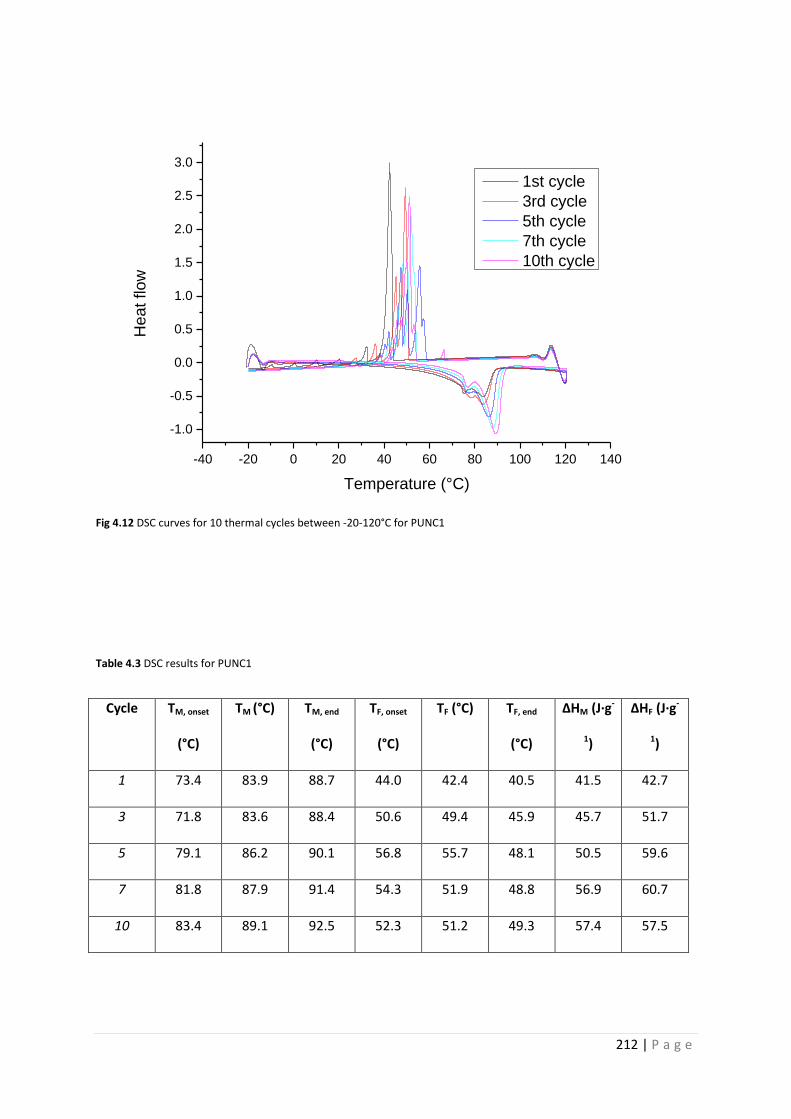
212 | P a g e
-40 -20 0 20 40 60 80 100 120 140
-1.0
-0.5
0.0
0.5
1.0
1.5
2.0
2.5
3.0
He
at flo
w
Temperature (°C)
1st cycle
3rd cycle
5th cycle
7th cycle
10th cycle
Fig 4.12 DSC curves for 10 thermal cycles between -20-120°C for PUNC1
Table 4.3 DSC results for PUNC1
Cycle TM, onset
(°C)
TM (°C) TM, end
(°C)
TF, onset
(°C)
TF (°C) TF, end
(°C)
ΔHM (J·g-
1)
ΔHF (J·g-
1)
1 73.4 83.9 88.7 44.0 42.4 40.5 41.5 42.7
3 71.8 83.6 88.4 50.6 49.4 45.9 45.7 51.7
5 79.1 86.2 90.1 56.8 55.7 48.1 50.5 59.6
7 81.8 87.9 91.4 54.3 51.9 48.8 56.9 60.7
10 83.4 89.1 92.5 52.3 51.2 49.3 57.4 57.5
213 | P a g e
PUNC3 contains Na2SO4.10H2O, but shows similar behaviour to PUNC1. The material was cycled 3
times, and melts between 32.9 and 36.5°C. Literature value for the TM is 32°C. Again, latent heat
increases from cycle 1 to cycle 3. After 3 cycles, latent heat is 67 J·g-1, giving an encapsulation
efficiency of 29.4%. The core material contained 20 %wt of Na2SO4.10H2O, so the latent heat is
higher than expected. The melting peaks are fairly sharp, with only 1 peak present, showing
Na2SO4.10H2O is the dominant phase present in the core. Thermal parameters are fully described in
Table 4.4, DSC curves for PUNC3 are shown in Fig. 4.13.
Crystallisation is non-homogeneous with several peaks, and has a latent heat that is much smaller
than that of the melting process. This can be explained that the material has not fully frozen during
the measurement cycle. After the completion of each cycle, the material was set with an isothermal
step at -20°C allowing the core PCM to fully freeze, leading to the higher latent heat seen in the
melting cycle.

214 | P a g e
-20 0 20 40 60 80 100 120 140
-2.0
-1.5
-1.0
-0.5
0.0
0.5
1.0
1.5
2.0
He
at flo
w
Temperature (°C)
1st cycle
2nd cycle
3rd cycle
Fig 4.13 DSC curves for 3 thermal cycles between -20-120°C for PUNC3
Table 4.4 DSC results for PUNC3
Cycle TM, onset
(°C)
TM (°C) TM, end
(°C)
TF, onset
(°C)
TF (°C) TF, end
(°C)
ΔHM
(J·g-1)
ΔHF (J·g-1)
1 24.3 32.9 37.0 1.0 -3.4 n/a 62.6 33.2
2 26.2 35.4 38.8 3.0 0.2 -10.3 66.8 33.8
3 30.6 36.5 40.9 2.2 0.7 -1.5 67.0 22.4
215 | P a g e
From these results, it is clear PU can be used for the encapsulation of crystallohydrate PCMs.
Thermal stability of the shell is improved compared to PECA nanocapsules in the previous chapter,
with a higher degradation temperature for PU. PU is also more chemically resistant to many
common solvents than PECA, including acetone and toluene, making it a good candidate for addition
to oil-based host materials. The major drawback found in the results is supercooling of the core
crystallohydrates and non-homogeneous nucleation, leading to unpredictable heat storage abilities.
This problem is exacerbated by poor thermal conductivity of the PU shell, and possible issues of
nucleation within the core. Future work to improve this is to add conductive carbon nanoparticles to
the nanocapsule shell. Salt hydrate eutectics will also be encapsulated for modulation of the melting
temperature.
216 | P a g e
4.4 References
1 T. Pitaksuteepong, N. M. Davies, I. G. Tucker and T. Rades, Eur. J. Pharm. Biopharm., 2002, 53, 335–342.
2 B. Nohra, L. Candy, J. F. Blanco, C. Guerin, Y. Raoul and Z. Mouloungui, Macromolecules, 2013, 46, 3771–3792.
3 E. Delebecq, J. P. Pascault, B. Boutevin and F. Ganachaud, Chem. Rev., 2013, 113, 80–118.
4 D. K. Chattopadhyay and D. C. Webster, Prog. Polym. Sci., 2009, 34, 1068–1133.
5 A. A. Caraculacu and S. Coseri, Isocyanates in polyaddition processes. Structure and reaction mechanisms, 2001, vol. 26.
6 B. K. Kim, Colloid Polym. Sci., 1996, 274, 599–611.
7 F. Cheng, Y. Wei, Y. Zhang, F. Wang, T. Shen and C. Zong, J. Appl. Polym. Sci., 2013, 130, 1879–1889.
8 J. Yang, M. W. Keller, J. S. Moore, S. R. White, N. R. Sottos, J. Yang, M. W. Keller, J. S. Moore, S. R. White and N. R. Sottos, Macromolecules, 2008, 41, 9650–9655.
9 X. Huang and B. Voit, Polym. Chem., 2013, 435–443.
10 C. Zhang, S. A. Madbouly and M. R. Kessler, ACS Appl. Mater. Interfaces, 2015, 7, 1226–1233.
11 Z. Petrovic, Polym. Rev., 2008, 48, 109–155.
12 G. Lligadas, J. C. Ronda, M. Galia, V. Cadiz, M. Galia, V. Cadiz, M. Galia, V. Cadiz, M. Galia and V. Cádiz, Biomacromolecules, 2010, 11, 2825–2835.
13 C. Zhang, T. F. Garrison, S. A. Madbouly and M. R. Kessler, Prog. Polym. Sci., 2017, 71, 91–143.
14 I. Javni, Z. S. Petrović, A. Guo and R. Fuller, J. Appl. Polym. Sci., 2000, 77, 1723–1734.
15 B. Tamami, S. Sohn and G. L. Wilkes, J. Appl. Polym. Sci., 2004, 92, 883–891.
16 J. Guan, Y. Song, Y. Lin, X. Yin, M. Zuo, Y. Zhao, X. Tao and Q. Zheng, Ind. Eng. Chem. Res., 2011, 50, 6517–6527.
17 J. W. Boretos and W. S. Pierce, Science (80-. )., 1967, 158, 1481–1482.
18 Z. Wang and T. J. Pinnavaia, Chem. Mater., 1998, 10, 3769–3771.
19 E.-M. Rosenbauer, M. Wagner, A. Musyanovych and K. Landfester, Macromolecules, 2010, 43, 5083–5093.
20 K. Bouchemal, S. Briançon, E. Perrier, H. Fessi, I. Bonnet and N. Zydowicz, Int. J. Pharm., 2004, 269, 89–100.
21 H. Souguir, F. Salaün, P. Douillet, I. Vroman and S. Chatterjee, Chem. Eng. J., 2013, 221, 133–145.
22 X. X. Zhang, Y. F. Fan, X. M. Tao and K. L. Yick, J. Colloid Interface Sci., 2005, 281, 299–306.
23 J. P. Wang, X. P. Zhao, H. L. Guo and Q. Zheng, Langmuir, 2004, 20, 10845–10850.
217 | P a g e
24 J. F. Su, L. X. Wang and L. Ren, J. Appl. Polym. Sci., 2005, 97, 1755–1762.
25 J. Su, L. Wang and L. Ren, J. Appl. Polym. Sci., 2006, 101, 1522–1528.
26 J. F. Su, L. X. Wang and L. Ren, Colloids Surfaces A Physicochem. Eng. Asp., 2007, 299, 268–275.
27 P. Felix De Castro and D. G. Shchukin, Chem. - A Eur. J., 2015, 21, 11174–11179.
28 P. Felix De Castro, A. Ahmed and D. G. Shchukin, Chem. - A Eur. J., 2016, 22, 4389–4394.
29 A. Schoth, K. Landfester and R. Muñoz-Espí, Langmuir, 2015, 31, 3784–3788.
30 A. M. Borreguero, J. F. Rodriguez, J. L. Valverde, R. Arevalo, T. Peijs and M. Carmona, J. Mater. Sci., 2010, 45, 4462=4469.
31 A. M. Borreguero, J. F. Rodriguez, J. L. Valverde, R. Arevalo, T. Peijs and M. Carmona, J. Mater. Sci., 2011, 46, 347–356.
32 A. A. Aydin and H. Okutan, Energy Convers. Manag., 2013, 68, 74–81.
33 N. Sarier and E. Onder, Thermochim. Acta, 2008, 475, 15–21.
34 Q. Zhu, Y. Chu, Z. Wang, N. Chen, L. Lin, F. Liu and Q. Pan, J. Mater. Chem. A, 2013, 1, 5386.
35 J. C. Su and P. S. Liu, Energy Convers. Manag., 2006, 47, 3185–3191.
36 W. Kong, X. Fu, Z. Liu, C. Zhou and J. Lei, Appl. Therm. Eng., 2016, 117, 622–628.
37 X. Du, H. Wang, Y. Wu, Z. Du and X. Cheng, J. Appl. Polym. Sci., 2017, 134, 1–8.
38 J. M. Asua, Prog. Polym. Sci., 2014, 39, 1797–1826.
39 D. Saihi, I. Vroman, S. Giraud and S. Bourbigot, React. Funct. Polym., 2005, 64, 127–138.
40 D. Saihi, I. Vroman, S. Giraud and S. Bourbigot, React. Funct. Polym., 2006, 66, 1118–1125.
41 A. Hamberger, U. Ziener and K. Landfester, Macromol. Chem. Phys., 2013, 214, 691–699.

218 | P a g e
5. Materials
and Methods
219 | P a g e
5.1 Materials
All chemicals were purchased from Sigma Aldrich (UK) except where noted. All were used as
received without further purification.
5.1.1 Oils and solvents
Toluene (anhydrous, 99.8%) and cyclohexane (anhydrous, 99.5%) were employed as oils for W/O
emulsion continuous phases. Chloroform (99.8%) and dichloromethane (anhydrous, 99.8% with 50-
150ppm amylene as stabiliser) were used as solvents. Technical grade acetone and technical grade
ethanol, along with Milli-Q water were used throughout.
5.1.2 Surfactants
Various commercial surfactants were used: Span 20 (sorbitan laurate), Span 80 (sorbitan
monooleate) and Span 85 (sorbitan trioleate); Tween 20 BioXtra (polyethylene glycol sorbitan
monolaurate) and Tween 80 (polyethylene glycol sorbitan monooleate); Igepal CO520 (branched
polyoxyethylene nonylphenyl ether, average Mn 441); polyethylene glycol dioleate (PEGDO, average
Mn 914) and Aerosol OT (AOT, dioctyl sulfosuccinate sodium salt, 97%).
5.1.3 Monomers/polymers and initiators etc.
Methyl methacrylate (MMA, 99%) was used for several polymerisation reactions, including
crosslinking with ethyl acrylate (EA, 99.5% with 220ppm antioxidant as stabiliser). Ethyl-2-
cyanoacrylate liquid was used as monomer for inverse micro-/miniemulsion in situ polymerisation.
Methylene diphenyl diisocyanate (MDI, 98%) was used as diisocyanate monomer for PU crosslinking,
220 | P a g e
along with polyethylene glycol (PEG) 200 (average MW 200), PEG2050 (average Mn 2050) and
polyvinyl alcohol (PVA, average MW 9000-10000 80% hydrolysed) as polyol monomers. Benzoyl
peroxide (75%, remainder water) and dibutyltin dilaurate (DBDL, 95%) were used as initiators.
Crosslinked sodium polyacrylate and stearic acid (98.5%) were used as lubricant and stabilisers for
MMA/EA crosslinking.
5.1.4 Salt hydrates
Salt hydrates used as core materials for PCM emulsions and PCM capsules were magnesium nitrate
hexahydrate (Mg(NO3)2.6H2O, BioUltra 99%), sodium sulphate decahydrate (Na2SO4.10H2O, 99%),
calcium chloride hexahydrate (CaCl2.6H2O, 98%) and aluminium sulphate octadecahydrate
(Al2(SO4)3.18H2O, 98%).
5.1.5 Nanocellulose
Nanocellulose was gratefully received as a gift from the Minko group at the University of Georgia,
USA.
221 | P a g e
5.2 Methods
5.2.1 Chapter 2 methods
5.2.1.1 Microemulsion formation
To test the solubility of water in AOT, AOT was dissolved at different weight percentages in oil
(either toluene or cyclohexane). Overall the oil phase was 10g. Water was then added in 100µL
aliquots and vortexed until a permanent turbidity of the solution appeared, which indicated a
saturated emulsion.
To solubilise large amounts of PCM, a high quantity of surfactants was required. 60 %wt of a
surfactant blend of 3:2 Tween:Span was dissolved in toluene. Either solid (100 %wt) or 70 %wt (in
water) Mg(NO3)2.6H2O (1g) was added and stirred mechanically overnight at 600 RPM.
5.2.1.2 Miniemulsion formation
A 20 %wt solution of salt hydrate (Mg(NO3)2.6H2O or Na2SO4.10H2O) (1g) was added to a solution of
3:2 Tween:Span in cyclohexane (9g), and stirred for 30 min at 600RPM. The resulting macroemulsion
was ultrasonicated for 10 min (1/2” tip, 70% amplitude; 30s on, 20s off pulse regime) in an ice bath
to prevent evaporation of solvent, using a QSonica Q700-220 sonicator (700 W). After sonication,
the previously milky solution became transparent/translucent and stable against agglomeration.
5.2.1.3 PMMA suspension copolymerisation
PMMA suspension copolymerisation was based on the method of Huang et al1. An aqueous phase
(15g) of 70 %wt Na2SO4.10H2O in water was added to a solution of Span 80 (0.2g) in toluene (50mL).
The solution was homogenised for 30 min at approximately 30000 RPM. The resulting emulsion was
222 | P a g e
milky and contained some precipitated salt hydrate. The emulsion was poured into a round-bottom
flask, and a solution of MMA (10g) and EA (1.5g) in acetone (50mL) was added. Benzoyl peroxide
(0.004g), stearic acid (0.007g) and sodium polyacrylate (0.003g) were added. The temperature was
rose to 85ºC in a water bath and the reaction mixture left to polymerise for 5 hours. Product was
separated by centrifugation at 12000 RPM for 30 mins and filtering under vacuum. The same
procedure was also attempted but instead of the step of adding benzoyl peroxide for initiation,
sonication was instead used. Sonication has been used to initiate MMA monomers previously2.
5.2.1.4 PMMA nanoprecipitation
Nanoprecipitation of preformed polymer was based on the methods of Paiphansiri et al3. PMMA
(MW = 996000 gmol-1) was dissolved in DCM (2.25g) and added to a solution of 5 %wt 3:2
Tween80:Span20 in cyclohexane (13g), DCM (7.25g) and 70 %wt Mg(NO3)2.6H2O in water (0.5g). This
was stirred for 30 minutes before sonicating for 2 mins (1/2” tip, 90% amplitude) in an ice bath. The
resulting mixture was stirred at 50ºC overnight.
5.2.1.5 PMMA miniemulsion polymerisation
Miniemulsion polymerisation of PMMA was based on a method by Zhang et al4. A 70 %wt solution of
Mg(NO3)2.6H2O was added to a surfactant blend of 1 %wt 2:1 Span 85:PEGDO in cyclohexane (15g),
along with MMA (0.25g). This mixture was stirred at 600 RPM for 30 min at room temperature.
Benzoyl peroxide (1.9mg) was added and the mixture sonicated for 10 min (1/2” tip, 50% amplitude;
30s on, 10s off pulse regimen) in an ice bath, yielding a milky solution. This was added to a sealed
round-bottom flask and stirred at 600 RPM for 30 min under N2 bubbling to deoxygenate the
solution. Temperature was then increased to 70ºC and stirred at 600 RPM with N2 bubbling for 24 hr.
223 | P a g e
The reaction mixture turned bright yellow due to the homolysis of benzoyl peroxide, and was left to
dry in the fume hood to evaporate solvent and residual monomer.
5.2.2 Chapter 3 methods
5.2.2.1 PECA inverse microemulsion polymerisation
PECA nanocapsules were prepared according to the method used by Kafka et al5, which was in turn
based on a well-established procedure6–8. An aqueous phase (1g) consisting of different
Mg(NO3)2.6H2O:water ratios, either solid or solubilised in water, was added to the continuous oil
phase (9g) consisting of 60 %wt surfactants (3:2 blend of Tween 80:Span 20) and 40 %wt toluene.
The mixture was stirred overnight at 600 RPM to create a W/O miniemulsion. Then, ECA was
dissolved in 3 times the amount of chloroform and added to the mixture dropwise. This was left to
stir at 600 RPM overnight in an open vial. As chloroform evaporates, the polymerisation occurs
around the microemulsion droplets. This procedure is outlined in Fig 3.4 (Method 1). The capsules
were separated by centrifugation (11000 RPM for 10 mins at 10ºC) and washed by redispersing in
cyclohexane via sonication. The capsules were again centrifuged (6000 RPM for 5 mins at 10ºC), and
the product left to dry at room temperature, giving a white powder.
5.2.2.2 PECA inverse miniemulsion polymerisation
In order to decrease the amount of surfactants required, ultrasound was employed to create a W/O
miniemulsion based on the method of Musyanovych et al9. An aqueous phase (1g) containing single
or mixed crystallohydrates in water was added to an oil phase (9g) consisting of 5%wt surfactants
and 95%wt cyclohexane. The mixture was mechanically stirred for 10 minutes at 600RPM to create a
224 | P a g e
macroemulsion. This was then sonicated for 12 mins (30s on, 20s off pulse regime, 70% amplitude)
with ice bath cooling, using a Qsonica Q700-220 sonicator (700W) equipped with a micro tip. During
sonication the cloudy solution became almost transparent, signifying a stable W/O miniemulsion had
formed. After sonication, ECA dissolved in 3 times the amount of chloroform was added dropwise
and left to stir at 600 RPM in an open vial for around 2 hours. This procedure is outlined in Fig. 3.4
(Method 2) and Fig 3.25. The product was separated by centrifugation (11000RPM for 10 mins at
10ºC) and left to dry at room temperature, yielding a translucent sticky solid. This was then
redispersed in ethanol by sonication and centrifuged (6000 RPM for 5 mins at 10ºC). After drying at
room temperature, a powder sample was obtained.
5.2.2.3 Formation of salt hydrate mixtures and eutectics
Salt hydrates were mixed together thoroughly, which resulted in partial melting due to the release of
water. The mixtures were then frozen.
5.2.2.4 Addition of PECA nanocapsules to nanocellulose and textiles
1 %wt of dried PECA nanocapsules were dispersed in water by bath sonication for 20 min. The
resulting dispersion was added to a 2 %wt nanocellulose fibre solution in water, at a ratio of 1:1. The
mixture was stirred at 550 RPM for 2 hours.
To adsorb the nanocellulose on to textiles, the textile was dipped in the nanocellulose solution for 5
minutes, before curing at 70ºC overnight in an oven.
225 | P a g e
5.2.3 Chapter 4 methods
5.2.3.1 Complex coacervation of PU microcapsules
Pu microcapsules were synthesised based on the method of Saihi et al10. A solution of Span 85 (1g),
PEGDO (0.38g) and toluene (45mL) was added to a second solution of Mg(NO3)2.6H2O (10.5g) in
water (4.5mL). These were homogenised at approximately 30000 RPM for 1 min. A solution of MDI
(1.25g) and DBDL (5 drops) dissolved in 10mL of Span 85 and PEGDO in toluene was added and
sheared at 70ºC for 1 min at 30000 RPM. The temperature was reduced to 63ºC and the mixture left
to react in a closed vial for 4 hours. The resulting microcapsules were washed with various solvents
and centrifuged to separate.
5.2.3.2 Interfacial polymerisation of PU nanocapsules
PU nanocapsule preparation was based on the method of Hamberger et al11. An aqueous solution
(1g) of crystallohydrate in water and hydrophilic monomer (PEG or PVA) (0.1g) was prepared. The
solution was added to the oil phase (7.5g) consisting of 1 %wt surfactants (2:1 ratio of Span 85 to
PEGDO) in cyclohexane. The mixture was stirred at 600 RPM for 30 min, creating a macroemulsion.
The macroemulsion was ultrasonicated for 10 min (1/2” tip, 30s on, 10s off pulse regimen, 50%
amplitude) in an ice bath to prevent evaporation of oil. The resulting miniemulsion contained no
precipitate.
The miniemulsion was stirred at around 800RPM at 50ºC and a solution of MDI (approx. 0.2g) in
1%wt surfactants in cyclohexane (5g) was added dropwise over 15 min at 50ºC. The mixture was
allowed to react for 2 hr to form a PU shell via carbamate links from the –NCO groups of the
diisocyanate and the –OH groups of the polyol. The nanocapsules were separated by centrifugation
(12000RPM, 10 min), and allowed to dry in a fume hood under ambient conditions.
226 | P a g e
5.2.4 Characterisation techniques
5.2.4.1 FTIR
Chemical analysis of the samples was made using a Bruker TENSOR II FTIR spectrometer equipped
with an all-reflective diamond ATR. Transmittance measurements were taken on powder samples
with 64 scans from 400 to 4000 cm-1. The same procedure was used for liquid samples of PCM
emulsions.
5.2.4.2 SEM and TEM
To analyse morphology of samples, along with capsule size, SEM measurements were taken with a
JEOL JSM-7001F scanning electron microscope; whilst TEM images were obtained using a JEOL
2100FCs with a Schottky Field Emission Gun TEM (200 kV accelerating voltage). SEM samples were
prepared as follows. Salt hydrates were crushed using a pestle and mortar and added directly to
carbon tape attached to an SEM stub. Micro-/nanocapsule samples were diluted to approximately
0.1 %wt solid content in ethanol by bath sonication for 20 minutes. Best results are obtained when
dispersing the reaction mixture directly from solution, rather than after centrifugation and drying. 50
µL of the resulting dispersion was added to a glass cover slide attached to SEM stub, and dried at
room temperature overnight. The samples were coated by chromium sputtering (100 amp, 60s
coating time) before measurement. To prepare TEM samples the same procedure was carried out
but at 0.05 %wt solid content, before allowing samples to dry on a copper TEM grid.
227 | P a g e
5.2.4.3 TGA
Thermogravimetric analysis was taken using a TA Instruments SDT Q600, providing data on thermal
degradation behaviour of both bulk and encapsulated salt hydrates. Measurements were taken from
room temperature up to 600ºC, with a ramp of 10ºC min-1 under an N2 atmosphere.
5.2.4.4 DSC
DSC measurements of PECA nanocapsules were taken using a DSC6 (Perkin Elmer, USA) to
study cycling stability of the energy nanocapsules during heat uptake and release. 100 cycles
were undertaken between -20 to 120ºC with a ramp of 5ºC under a nitrogen atmosphere.
Measurements of the salt hydrate mixture TMs, along with DSC curves for PUNCs were taken
using a DSC 214 (NETZSCH, Germany) with a ramp of 10ºC under a nitrogen atmosphere. TMs
of salt hydrate mixtures were averaged over the 2nd and 3rd cycles between -20 to 120ºC.
5.2.4.5 XPS
X-ray Photoelectron Spectroscopy (XPS) measurements were made for NanoPCM1 and 2, using an
PSP Electron Energy Analyser with Al Ka X-ray source (hn ¼1486.6 eV, 12 kV, 144 W, pass energy ¼
20 eV). The base pressure of the system was <2 x 10⁻¹⁰ mbar with H2 as the main residual gas. The
NanoPCM samples were crushed to form a fine powder before measuring.
5.2.4.6 XRD
X-ray diffraction measurements were taken using a Bruker diffractometer. Fine powder samples
were scanned in transmission mode from 4 to 50 degrees (2θ) for 60 min.
228 | P a g e
5.3 References
1 J. Huang, T. Y. Wang, P. P. Zhu and J. B. Xiao, Thermochim. Acta, 2013, 557, 1–6.
2 B. Teo, S. Prescott, M. Ashokkumar and F. Grieser, Ultrason. Sonochem., 2008, 15, 89–94.
3 U. Paiphansiri, P. Tangboriboonrat and K. Landfester, Macromol. Biosci., 2006, 6, 33–40.
4 G. H. Zhang, S. A. F. Bon and C. Y. Zhao, Sol. Energy, 2012, 86, 1149–1154.
5 A. P. Kafka, B. J. McLeod, T. Rades and A. McDowell, J. Control. Release, 2011, 149, 307–313.
6 M. R. Gasco and M. Trotta, Int. J. Pharm., 1986, 29, 267–268.
7 S. Watnasirichaikul, N. M. Davies, T. Rades and I. G. Tucker, Pharm. Res., 2000, 17, 684–689.
8 N. Behan, C. Birkinshaw and N. Clarke, Biomaterials, 2001, 22, 1335–1344.
9 A. Musyanovych and K. Landfester, Prog. Colloid Polym. Sci., 2007, 134, 120–127.
10 D. Saihi, I. Vroman, S. Giraud and S. Bourbigot, React. Funct. Polym., 2005, 64, 127–138.
11 A. Hamberger, U. Ziener and K. Landfester, Macromol. Chem. Phys., 2013, 214, 691–699.

229 | P a g e
6. Conclusions
and Future
Work
230 | P a g e
6.1 General conclusions
This thesis details the importance of thermal energy storage within the context of humanity’s energy
problem. Increased demand and importance of energy, coupled with potential catastrophe of
climate change mean new and non-polluting sources of energy are vital. Thermal energy storage
using phase change materials (PCMs) is a cheap and efficient method to reduce energy problems
associated with renewable energies and thermal regulation. Salt hydrates are the most promising
PCM due to their high energy storage density, but suffer from chemical instability and thermal
transfer issues. We found that confining them on the nanoscale within polymer capsules could vastly
improve their thermal and chemical properties for potential domestic applications. Miniemulsions
were found to be optimal templates for nanocapsule formation.
231 | P a g e
6.2 Chapter 2 conclusions
Surfactants can be employed as stabilisers for PCM emulsions. Aerosol OT (AOT) was the first
surfactant investigated, using water to test for optimum parameters. Increasing the concentration of
AOT led to an increase in solubilisation capacity in a non-linear fashion. Adding a co-surfactant led to
a synergistic effect, increasing solubilisation capacity.
Using inverse microemulsions with large amounts of commercial Tween and Span surfactants (60
%wt of the continuous oil phase), it was possible to solubilise pure Mg(NO3)2.6H2O by stirring the
mixture overnight. The amount of surfactant required could be greatly decreased by using
ultrasonication for high energy processing to form miniemulsions, which have similar sized droplets
to microemulsions but are kinetically, rather than thermodynamically, stable. Fully stable
miniemulsions could be formed with only 5 %wt surfactants in the continuous phase. The
miniemulsion technique also allowed the formation of PCM emulsions containing other salt hydrates
such as Na2SO4.10H2O and CaCl2.6H2O.
It was not possible to isolate PCM emulsions for further analysis, however they provided an excellent
template for polymerisation reactions to create polymer nanocapsules. Our first attempts at adding
a polymer shell were using poly(methyl methacrylate). It was not possible to initiate the monomers
however despite using several methods, so new polymer shell materials were sought.
232 | P a g e
6.3 Chapter 3 conclusions
To increase stability of our salt hydrate-loaded emulsions, we added a polymer shell. This was
achieved with the in situ polymerisation of ethyl-2-cyanoacrylate around inverse micro-
/miniemulsion droplets. The micro- and miniemulsions we had formulated using Tween and Span
surfactants in Chapter 2 were useful as templates for the polymerisation. SEM and TEM showed the
capsules were 100-300nm in size with complete coverage of the core material. Chemical analysis by
FTIR, XPS and XRD showed salt hydrate was present within the sample. The microemulsion
templates using large amount of surfactants were not as useful in producing salt hydrate loaded
capsules. Although Mg(NO3)2.6H2O could be solubilised within the nanocapsule core and was stable
over 100 cycles, it partially dehydrated to its dihydrate due to incongruent melting. This leads to 2
separate melting temperatures on the DSC curves, which is problematic for applications requiring a
narrow temperature range. It was also discovered adding extra water to the aqueous core material
promoted continued hydration of the salt, leading to higher latent heat.
Employing ultrasound to form miniemulsions led to improved results. Similarly sized capsules of 100-
300nm were formed, but with Mg(NO3)2.6H2O remaining fully hydrated in the core, leading to a
single melting point with high latent heat. Supercooling was also practically eliminated. Chemical
and thermal stability over at least 100 melting/freezing cycles for these capsules was a great
improvement over the bulk salt hydrates, which lose latent heat storage ability after around 5 cycles.
The lower amount of surfactants needed for miniemulsions in comparison to microemulsions also
led to a more thermally stable polymer shell. The work on salt hydrate-loaded PECA nanocapsules
was summarised in a publication featured in Journal of Materials Chemistry A, ‘Nanocapsules
containing salt hydrate phase change materials for thermal energy storage’ (DOI:
10.1039/c6ta06189c)1. An image we created was also featured on the inside back cover of the
journal seen in Fig 6.1.
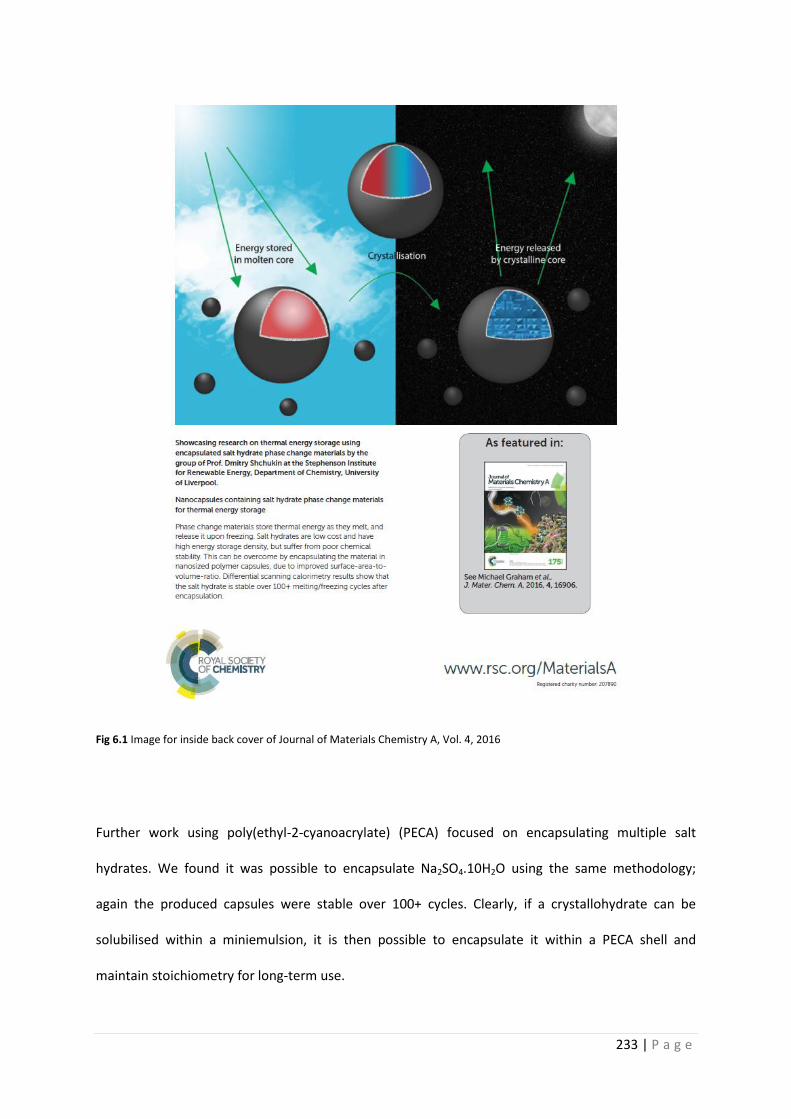
233 | P a g e
Fig 6.1 Image for inside back cover of Journal of Materials Chemistry A, Vol. 4, 2016
Further work using poly(ethyl-2-cyanoacrylate) (PECA) focused on encapsulating multiple salt
hydrates. We found it was possible to encapsulate Na2SO4.10H2O using the same methodology;
again the produced capsules were stable over 100+ cycles. Clearly, if a crystallohydrate can be
solubilised within a miniemulsion, it is then possible to encapsulate it within a PECA shell and
maintain stoichiometry for long-term use.
234 | P a g e
Two kinds of salt hydrate mixtures were investigated (i) additive mixtures of capsules containing
single salt hydrates (ii) capsules containing mixed Mg(NO3)2.6H2O and Na2SO4.10H2O cores. The
additive mixtures can prove highly useful in designing multi-temperature heat storage systems with
different components reacting to different transition temperatures. Encapsulating salt hydrate
mixtures can be very beneficial when encapsulated at the eutectic ratio – giving synergistic effects of
low transition temperature, single defined melting temperature and high latent heat. However,
when encapsulating at ratios other than the eutectic point, predictable melting and freezing was not
achieved due to the formation of several crystallohydrate phases within the core. The work on salt
hydrate mixtures led to a follow up publication in Journal of Materials Chemistry A, entitled
‘Nanoencapsulated crystallohydrate mixtures for advanced thermal energy storage’ (DOI:
10.1039/c7ta02494k)2.
235 | P a g e
6.4 Chapter 4 conclusions
PECA nanocapsules showed the benefit of encapsulating crystallohydrates with a polymer shell.
However, PECA is unstable at temperatures of 150°C and above, and can dissolve in several common
organic solvents. Polyurethane (PU) is a commonly used commercial polymer with excellent
durability. Many researchers have used PU as capsule shell material. We adapted two methods from
the literature; a complex coacervation method yielding microcapsules, and an interfacial
polymerisation reaction resulting in nanocapsules.
PU microcapsules were shown to be spherical in shape with diameters around 4µm. Chemical
analysis suggested salt hydrate was present within the capsule core. Thermal properties were not
fully analysed, however SEM images showed the capsules shrunk over time due to loss of core
material. Methods to produce nanocapsules were then sought, as they are more durable as well as
providing improved thermal performance.
PU nanocapsules were shown to have superior properties compared to the microcapsules. Using 1
%wt surfactants in the continuous phase led to powder samples being formed, which could be fully
analysed. Both Mg(NO3)2.6H2O and Na2SO4.10H2O could be encapsulated. Again, chemical analysis
from FTIR showed the presence of salt hydrate in the capsule samples. Thermal analysis from TGA
showed the PU was more thermally stable than PECA, with shell degradation starting at
approximately 200°C. DSC curves displayed promising results, with Mg(NO3)2.6H2O stable over 10
cycles and Na2SO4.10H2O over 3. Despite promising results, supercooling was a problem with PU
capsules, which may be due to a thick shell forming, preventing thermal transfer. Poor nucleation
inside the core was also an issue, as several phases formed.
236 | P a g e
6.5 Future Work
Generally, polymer shells have poor thermal conductivity, which can lead to poor thermal transfer to
core materials. Conductive particles such as graphite may be added into the shell material to
improve thermal transfer. Improved thermal conductivity leads to faster melting and freezing and a
reduction of supercooling. PU nanocapsules studied in Chapter 4 will require prolonged thermal
cycling tests to ensure long-term stability. Supercooling properties of PU nanocapsules may be due
to a thick shell deposited on the miniemulsion droplets. This may be alleviated by varying the
amount of monomers used in the synthesis. The effects of using a catalyst on the formation of PU
nanocapsules will also be investigated, as it has the potential to greatly increase yield. Maximising
encapsulation efficiency to maximise latent heat is also a priority.
As PU is a chemically and thermally durable polymer, it has great promise for addition to
thermopaint, which is commercial paint with thermal storage abilities. PCM capsules may also be
added to textiles for use in air-conditioned garments.
The work also has an impact for other researchers. Once salt hydrate-loaded capsule properties are
optimised, they can be used in such applications as passive air conditioning in building walls.
Creating stable capsules is also a goal for high temperature inorganic PCMs. Inorganic salts with TMs
of 300ºC or more are planned for encapsulation using thermally resistant polymers or other shell
material. Long term thermal energy storage materials have great potential for energy saving
applications, with large chemical companies such as BASF interested in their use. These materials are
vital as nations and companies attempt to fully realise an emission-free future, which will preserve
our environment for future generations.

237 | P a g e
6.6 References
1 M. J. Graham, E. Shchukina, P. Felix De Castro and D. G. Shchukin, J. Mater. Chem. A, 2016, 4, 16906–16912.
2 M. J. Graham, J. A. Coca-Clemente, E. Shchukina and D. Shchukin, J. Mater. Chem. A, 2017, 5, 13683–13691.