Corrosion and Hydrate Formation in Natural Gas Pipelines
239
Faculty of Science and Engineering Department of Chemical Engineering Corrosion and Hydrate Formation in Natural Gas Pipelines Emmanuel Ogo-Oluwa OBANIJESU This thesis is presented for the degree of Doctor of Philosophy of Curtin University May 2012
-
Upload
khangminh22 -
Category
Documents
-
view
2 -
download
0
Transcript of Corrosion and Hydrate Formation in Natural Gas Pipelines

Faculty of Science and Engineering
Department of Chemical Engineering
Corrosion and Hydrate Formation in Natural Gas Pipelines
Emmanuel Ogo-Oluwa OBANIJESU
This thesis is presented for the degree of
Doctor of Philosophy
of
Curtin University
May 2012

ii
Statement of Originality
To the best of my knowledge and belief, this thesis contains no material previously
published by any other person except where due acknowledgement has been made.
This thesis contains no material which has been accepted for award of any other
degree or diploma in any university.
I give consent to this copy of my thesis, when deposited to the University Library, to
be made available for loan and photocopying subject to the provision of the
Copyright Act 1968
Signature: ………………………………………….
Date: ………………………………………….

iii
Biography of the Author
Emmanuel was born on 10th
August, 1968 in Ibadan, Nigeria. He completed his
B.Sc. (Chemical Engineering) degree from Obafemi Awolowo University, Nigeria in
1991 and M.Sc. (Chemical Engineering) degree at University of Lagos in 1997 with
a PhD grade. He commenced his Ph.D. research at Curtin University of Technology
(now Curtin University), Western Australia on 8th June 2009 under the 3-year Curtin
Strategic International Research Scholarship (CSIRS) and 3-year Curtin International
Postgraduate Research Scholarship (CIPRS). He also received the Australia-China
Natural Gas Technology Partnership Fund Top-up Scholarship from Western
Australian Energy Research Alliance (WA:ERA) in September 2010 and finally
received a Departmental Top-up Scholarship from Curtin‘s Chemical Engineering
Department in September 2011. The Ph.D. thesis was successfully completed with
published two book chapters, two journal articles, four internationally peer reviewed
conference papers and two seminar presentations (Australia and Malaysia).
As a Petroleum Engineer Trainee with Nigerian Petroleum Development Company
Limited in 1992, Emmanuel was involved in various oilfield operations such as well
drilling and completion, swabbing operation, and Bottom Hole Diagnostic Survey
amongst others. He joined Josef Ross & Company Ltd, Nigeria in 1993 as a Project
Engineer, where he coordinated and managed various national and international
projects sponsored by Chevron (Nig) Ltd, Mobil Petroleum, World Bank, United
Nations Environment Programs and Federal Government of Nigeria. Emmanuel
worked as a Research Officer with Federal Institute of Industrial Research, Oshodi
(FIIRO) between 1997 and 2003 before joining Ladoke Akintola University of
Technology (LAUTECH), Nigeria as a Lecturer in 2004 to 2010.
Between 1997 and now, Emmanuel has been involved in pure and applied research a
ctivities that have resulted into 4 book chapters, over 20 published articles in peer-
reviewed journals, 10 peer-reviewed international conference proceedings and many
other technical presentations nationally and internationally. He has been teaching
undergraduate and postgraduate students both in Nigeria and Australia, and also
successfully supervised over 100 undergraduate and postgraduate research theses
from both countries. Emmanuel was nominated for the 2010 Edition of Eni Scientific
Award (Environmental Engineering Option) in Italy.

iv
Peer Reviewed Manuscripts from this PhD Thesis
A. Published book chapters
1. Obanijesu, E.O., Akindeju, M.K., Pareek, V. and Tade, M.O. (2011),
―Modeling the Natural Gas Pipeline Internal Corrosion Rate as a Result of
Hydrate Formation‖, In: Environmental Systems Engineering Section,
Elsevier 21st European Symposium on Computer-Aided Process Engineering,
(Part B), E.N. Pistikopoulos, M.C. Georgiadis and A.C. Kokossis (Editors),
Computer-Aided Chemical Engineering (Elsevier), Vol. 29, pp. 1160-1164.
2. Hunt, D., Akindeju, M.K., Obanijesu, E.O., Pareek, V. and Tade, M.O.
(2011), ―Potential Impacts and Modeling the Heat Value Loss Due to
Chelation in Natural Gas Processing and Transport‖, In: Energy Systems
Engineering Section, Elsevier 21st European Symposium on Computer-Aided
Process Engineering, (Part B), E.N. Pistikopoulos, M.C. Georgiadis and A.C.
Kokossis (Editors), Computer-Aided Chemical Engineering (Elsevier), Vol.
29, pp. 1648-1652.
B. Published journal articles
1 Obanijesu, E.O., Pareek, V., Gubner, R and Tade, M.O. (2011), ―Hydrate
Formation and its Influence on Natural Gas Pipeline Internal Corrosion
Rate‖, NAFTA Journal, Year 62, No 5-6, pp 164-173.
2 Obanijesu, E.O., Pareek, V., Gubner, R and Tade, M.O. (2010), ―Corrosion
Education as a Tool for the Survival of Natural Gas Industry‖, NAFTA
Journal, Year 61, No 12, pp 541-554.
C. Published conference proceedings
1. Obanijesu, E.O., Akindeju, M.K., Pareek, V. and Tade, M.O. (2011),
―Modeling the Natural Gas Pipeline Internal Corrosion Rate as a Result of
Hydrate Formation‖, Elsevier 21st European Symposium on Computer-Aided
Process Engineering (ESCAPE-21) Conference, Porto Carras Resort, N.
Marmaras, Chalkidiki, Greece, May 29th
-June 1st
2. Hunt, D., Akindeju, M.K., Obanijesu, E.O., Pareek, V. and Tade, M.O.
(2011), ―Potential Impacts and Modeling the Heat Value Loss Due to
Chelation in Natural Gas Processing and Transport‖ Elsevier 21st European
v
Symposium on Computer-Aided Process Engineering (ESCAPE-21)
Conference, Porto Carras Resort, N. Marmaras, Chalkidiki, Greece, May
29th
-June 1st
3. E.O. Obanijesu, V. Pareek, A. Barifcani, R. Gubner and M.O. Tade (2011),
―Influence of Corrosion Inhibitors on Hydrate Formation Temperature‖,
Presented at 3rd
Regional Materials Technology Conference, Imperial Palace
Hotel, Miri, Malaysia, April 26-27.
4. Obanijesu, E.O., Pareek, V. and Tade, M.O. (2010), ―Hydrate Formation and
its Influence on Natural Gas Pipeline Internal Corrosion Rate‖, MS-128544,
Presented at Asia-Pacific Oil and Gas Conference and Exhibition, Society of
Petroleum Engineers, Mumbai, India, January 20-22.
D. Orally presented seminars
1. Obanijesu, E.O., Tade, M.O., Pareek, V., Gubner, R. and Barifcani, A.
(2011), ―Pipeline Engineering in Oil and Gas Industry: Importance and
Problems‖, Presented during Research & Development Seminar, Curtin
University, Miri Campus, Malaysia, April 28
2. Obanijesu, E.O., Pareek, V., Gubner, and Tade, M.O. (2010), ―Corrosion
Education as a Tool for the Survival of Natural Gas Industry‖, Presented
during Research & Development Seminar, Curtin University, Perth,
Australia, November, 2010

vi
Dedication
To God Almighty
Who single-handedly picked me up from my rough beginning with full
determination to take me to the glorious end. He has always being there
for me, to HIM be the glory and honour forever more (AMEN).
To My Parents
Late Prince Akintola Adekunle and Late Madam Olusola Ajoke for
taking it upon themselves to train me from their meagre resources. I
appreciate you.
To my children
Oluwagbemiga, Adedamola, Adewale, Fiyinfoluwa, Aderogbayimika,
Zawadi and Olusola for their understanding during the trial periods.

vii
Acknowledgement
Knowledge is a continuous process that requires contributions in various forms and
degrees from different people. Several people supported me during this research; I
appreciate their valuable contributions which motivated me to the successful
completion of the program.
Foremost, my sincere appreciation goes to Curtin University, Australia; Western
Australian Energy Research Alliance (WAERA) and Curtin‘s Chemical Engineering
Department for sponsoring this Ph.D. study under the Curtin Strategic International
Research Scholarship (CSIRS) and Curtin International Postgraduate Research
Scholarship (CIPRS); Australia-China Natural Gas Technology Partnership Fund
Top-up Scholarship; and Departmental Top-up Scholarship schemes respectively.
Their collective financial supports produced this thesis.
I sincerely express my deepest gratitude to my Main Supervisor, Prof. Moses
Oludayo Tade who supported me throughout my entire PhD program with his
patience and knowledge. Professor Tade encouraged me to work on this challenging
project and drove me hard to produce ‗double thesis‘ through full financial support
(in securing chemicals and materials) and his availability to discuss the technicality
of my work (even at odd hours). I am highly honored to work with such a great man;
he shared his wealth of experience with me through patience, attention, constructive
criticisms, editing, direction and desire for quality. I also wish to thank my other
three Supervisors in the persons of Prof. Vishnu Pareek, Prof. Rolf Gubner and
Associate Prof. Ahmed Barifcani. Prof. Barifcani as an expert in hydrate formation
and related problems gave me complete access to the ever precious cryogenic
sapphire cell. Also, he was always available in the laboratory to discuss my
experiments and results with me on many occasions; Prof. Gubner was always
available to share his wealth of experience in Corrosion Science and Engineering. As
a corrosion expert and Director of Western Australian Corrosion Group, he was
always available to share knowledge with me; we spent qualitative time together to
discuss my methodology. He also supplied all the corrosion inhibitors through his
corrosion research group. Prof. Pareek supported with advice, motivation and always
happy to assist with computers and accessories. I equally thank my Thesis Chairman
viii
and the former Head of Chemical Engineering Department, Prof. Ming Ang for his
reassurance and guidance.
I also use this opportunity to thank Dr. David Pack of Gas Measurement & Auditing
Pty Ltd for sharing some data with me. Also, the technical support of Mr. Saif
Ghadhban during the experiments is acknowledged. Saif as the Laboratory
Supervisor for the Curtin University‘s Clean Gas Technology section always assisted
in solving technical problems associated with the use of equipment (cryogenic
sapphire cell). Furthermore, Ketrrina Lephova and Kriti Bhardwaj of CORR-CERT
are acknowledged for preparing the corrosion inhibitors used in this study. I
appreciate Mrs Delia Giggin who recently resigned as the Scholarship Manager for
Curtin University for her availability to discuss and coordinate my various
scholarships.
I appreciate Faculty of Engineering and Department of Chemical Engineering at
Curtin University for employing me as a Sessional Lecturer and Research Associate
since July 2009. These employments have enabled me to participate in the teaching
of seven undergraduate courses namely Foundation Chemistry, Engineering
Foundation Design Process (EFDP), Chemical Engineering Thermodynamics,
Process Synthesis & Design, Oilfield Processing, Advance Process Control,
Advance Separation Processes as well as two postgraduate units namely Corrosion
Chemistry 500 and Flowline Corrosion 500 during this Ph.D. program. I appreciate
their trust in my capability which enabled me to function as the Examiner and
Coordinator for the two postgraduate units and some of the undergraduate units. I
equally express my sincere appreciations to Prof. Vishnu Pareek, Associate Prof. Qin
Li, Dr. Hussein Znad, Dr. Milinkumar Shah, Dr. Shahin Hosseini, Mr. Divyamann
Vadnerkar and Mr. Anteneh Yeneneh for the good working relationships and other
supports I enjoyed from them during the teachings and research activities. I wish to
thank Mr. Michael Akindeju for his enormous support and advise especially, in early
part of my arriving and living in Australia, he really assisted in my immediate
settling down in the country.
Special thanks to the secretarial staff, namely, Ms Jann Bolton, Mrs Naomi
Mockford, Mrs Stephanie Blakiston and Ms Tammy Atkins for their numerous

ix
supports. All their assistance on conference and holiday traveling supports,
secretariat materials and other related issues are well appreciated.
I owe so much to my two main mentors in the persons of Dr. S.R.A. Macaulay and
Dr. F.A.O. Osinowo. Dr. Macaulay retired as a Senior Lecturer at Obafemi
Awolowo University, Nigeria while Dr. Osinowo retired as a Director at Federal
Institute of Industrial Research, Oshodi (FIIRO), Nigeria. I also acknowledge my
very good friends in the persons of Dr. Jide Sonibare, Dr. Oladele Bello, Mr. Olu
George, Mr. Dele Ogunfeitimi, Mr. Remy Tiako, Ms Morenike Adekaiyero, Mrs
Moradesa, and Miss Oyeladun Mubo Adeyeba for their various supports along the
journey of my life. Furthermore, I thank my uncle, Dr. Simeon Afolayan and siblings
Mr. Bisi Adekunle, Mr. Femi Adekunle, Dr. Adeniran Adekunle and Dr. Ademola
Adekunle as well as a host of others who have helped me in any respect during the
completion of this thesis but I cannot mention due to space limit, you are all well
appreciated. Finally, I thank Ms Phanice Imari for all her understanding and
supports.
Lastly, I specifically acknowledge Miss Anita Ojwang for her unforgettable
sacrifices during the winter period of 2010 in the name of friendship. Anita had to
start her work at 6am but was always coming to pick me at home at 5:30am in order
to drop me off in my office. This regular singular act enabled me to get into the
laboratory on time despite the heavy rainfalls and cold weather.

x
TABLE OF CONTENTS
List of Tables xvi
List of Figures xviii
Nomenclatures xxi
Abstract xxv
1. Introduction 1
1.1 Background 1
1.2 Submerged Pipelines: Failure and Consequences 3
1.3 Aim and Objectives 4
1.4 Scope of Study 5
1.5 Significance of Study 5
1.6 Contributions of This Research Work 6
1.7 The Thesis Outline 7
2. Natural Gas Pipeline: Importance and Problems 10
2.1 Introduction 10
2.2 Natural Gas Production and Transportation 13
2.3 Natural Gas Transportation Options 14
2.3.1 Classification of pipelines 14
2.4 Some Existing Natural Gas Pipeline Projects 17
2.4.1 WAGP project – project description 22
2.4.2 The Australian Gorgon Project – project description 26
2.5 Hydrate Formation Problems along Offshore Gas Pipelines 34
2.5.1 General description 34
2.5.2 Hydrate formation process 35
2.5.3 Identified types of hydrates 36
2.5.4 Growth 36
2.5.5 Hydrate implications on subsea transport system 37
2.5.6 Existing prevention/minimization options 38
2.6 Part of Present Research Contribution to Knowledge 41
2.7 Corrosion Initiation through Physical and Electrochemical Processes 41
2.7.1 Cavitation corrosion through physical process 42
2.7.2 Erosion corrosion through physical process 42

xi
2.7.3 Electrolytic and galvanic corrosions from electrochemical
processes 43
2.8 Corrosion: Chemistry and Implications on Flow Assurance 44
2.8.1 Chemistry and electrochemistry of corrosion 46
2.8.2 Classification of corrosion 47
2.8.2.1 Pitting and crevice corrosions 47
2.8.2.2 Stress-corrosion cracking (SCC) 49
2.8.2.3 Erosion, cavitations and fretting corrosions 50
2.8.2.4 Uniform corrosion of carbon steel 51
2.9 Factors Influencing Gas Pipeline Corrosion 51
2.9.1 pH 51
2.9.2 Oxidizing agents 52
2.9.3 Temperature 52
2.9.4 Fluid velocity 52
2.9.5 Wall shear stress 53
2.9.6 Particle size 53
2.9.7 Chemical composition and concentration 53
2.9.8 The Gas Viscosity 54
2.10 Consequences of Pipeline Failures on the Industry 54
2.10.1 The economic impacts 55
2.10.1.1 Economic impacts on the consumers 55
2.10.1.2 Economic impacts on the industry 57
2.10.2 Safety consequences 60
2.10.3 Environmental consequences 64
2.10.3.1 Soil and vegetation impacts 65
2.10.3.2 Impacts on water quality 65
2.10.3.3 Air pollution 66
2.10.3.3.1 Climate change 66
2.10.3.3.2 Flammability and VOC discharge 68
2.10.3.3.3 Release of toxic gas 69
2.11 Corrosion inhibition 74
2.12 Project Focus and other Contributions to knowledge 74
3. Corrosion Inhibitors as Hydrate Promoters 76
3.1 General Background 76

xii
3.2 Introduction 76
3.3 Methodology 79
3.3.1 Reagent, materials and equipment 79
3.3.2 The gas preparation for laboratory experimentation 82
3.3.3 General experimental operations 82
3.3.4 Experimental procedure 83
3.4 Results and Discussions 84
3.4.1 Promotion of hydrate formation 84
3.4.1.1 Effects of corrosion inhibitors‘ surfactant properties
on formation temperature 85
3.4.1.2 Contributions of the material orientation 86
3.4.1.3 Hydrogen bonding contributions 87
3.4.2 Impact of different inhibitors on formation temperature 89
3.4.2.1 Structural distribution 90
3.4.2.2 Active functional group 90
3.4.2.3 Affinity for water 91
3.4.3 Hydrate formation patterns 92
3.4.3.1 The blank formation patterns 92
3.4.3.2 The formation patterns for MP 93
3.4.3.3 The CPC formation patterns. 94
3.4.3.4 Formation patterns for DPC 94
3.4.3.5 The formation patterns for TB 95
3.4.3.6 The formation patterns for BDHC 96
3.5 Conclusion 96
4. Hydrate Promotional Behaviour of DPC 98
4.1 Background 98
4.2 Introduction 98
4.2.1 Corrosion inhibition mechanism 98
4.2.2 Factors influencing inhibition efficiency 99
4.2.3 Study justification 99
4.3 Methodology 100
4.3.1 Reagent, materials and equipment 100
4.3.2 Preliminary study 100
4.3.3 Experimentation 101

xiii
4.3.4 Concentration profile 103
4.3.5 Location of critical/peak operating concentration 104
4.4 Results and Discussions 106
4.4.1 Hydrate formation ability 106
4.4.2 Specific observations at various operating pressures 110
4.4.2.1 Specific observations at 100bar and 150bar 110
4.4.2.2 Specific observation at 50 bar 112
4.4.3 Concentration profile 112
4.4.4 Critical operating concentration 113
4.4.5 Pressure effect on formation temperature point 114
4.5. Conclusion 114
5. Hydrate-Corrosion Model: Development and Simulation 116
5.1 Background 116
5.2 Introduction 116
5.3 Existing Corrosion Rate Monitoring Methods 116
5.4 Hydrate Corrosion Rate Modeling 126
5.5 Model Development 127
5.5.1 Calculation of the pH factor ( ) 127
5.5.2 Calculation of the wall shear stress (S) 138
5.5.3 The formation fugacity 138
5.6 Model Simulation 129
5.6.1 Calculation of the fluid fugacity 129
5.6.2 Calculation of the wall shear stress 131
5.7 Result and Discussions 136
5.8 The Limitations of the Model 139
5.9 Conclusions 140
6. Application of Component Interactions for Gas Hydrate Inhibition 141
6.1 Background 141
6.2 Introduction 141
6.3 Methodology 142
6.3.1 Reagent, materials and equipment 142
6.3.2 Preliminary study 143
6.3.3 Preparation of experimental gas mix 143
6.3.4 The study of hydrate formation points 147

xiv
6.3.5 The experimental sequence 147
6.3.6 Beginning and end of dissociation study 148
6.3.7 Instrumental analysis of gas composition 149
6.3.8 Precautions 149
6.4 Results and discussions 150
6.4.1 Validity of generated data set 150
6.4.2 Studying the characteristics of pure CO2 hydrates 151
6.4.3 Methane and methane mixture hydrates 152
6.4.4 Studying the effects of H2 concentration on methane hydrates 154
6.4.5 The effects of concentration variation on sweet gas hydrates 155
6.4.6 The effects of N2 and H2 on hydrates formation temperature 156
6.4.7 Study on software prediction accuracy 158
6.5 Conclusions 161
7. Conclusions and Recommendations 162
7.1 Conclusions 162
7.1.1 Impacts of corrosion and hydrate formation on the industry 162
7.1.2 Corrosion-Hydrate Relationships _ experimental assessments 163
7.1.3 Corrosion-Hydrate Relationships _ mathematical assessment 164
7.1.4 The gas component interactions 165
7.2 Recommendations 166
7.2.1 Laboratory investigation on the corrosion patterns 166
7.2.2 Investigations on applicability of H2 and N2 as hydrate inhibitors 166
REFERENCES 168
APPENDIX A: The solution flowchart for the developed model 209

xv
LIST OF TABLES
Table 1.1: The global natural gas reserve, production and consumption 3
Table 2.1: Typical uncontrolled factors for natural gas and other
stream generator fuels 10
Table 2.2: Natural gas compositions from different gas fields 11
Table 2.3: Summary of some European gas demand scenarios (bm3) 12
Table 2.4: Natural gas thermodynamic properties at normal temp
and pressure 13
Table 2.5: Room temperature mechanical properties of AZ91 castings 16
Table 2:6: Typical tensile properties of AZ91C-T6 sand castings at
elevated temperatures 16
Table 2.7: Various interstate pipeline projects, their diameter and length 18
Table 2.8: Various global transboundary natural gas pipeline projects 20
Table 2.9: Benin power plant 24
Table 2.10: Segment 2 of the pipeline system (Cotonou to Tema) 25
Table 2.11: Operating capacity of Valco Power Plant in Tema 25
Table 2.12: Segment 3 of the proposed project (Tema to Takoradi) 25
Table 2.13: Takoradi power plant 26
Table 2.14: Tema power plant 26
Table 2.15: Gorgon Operators by share 27
Table 2.16: Already signed sales and purchase agreements between the
Gorgon project stakeholders and Asia-Pacific establishments 27
Table 2.17: Gorgon and Jansz field compositions and required specifications 30
Table 2.18: Production rates of exports from Barrow Island 31
Table 2.19: The NFPA rating for methanol 40
Table 2.20: Pipeline failures by cause in some developed countries 45
Table 2.21: Some global pipeline accidents from corrosion and consequences 58
Table 2.22: Some global major pipeline accidents 63
Table 2.23: Some major pipeline accidents in Nigeria and consequences 72
Table 3.1: Some Australian gas field compositions at platform separators 77
Table 3.2: The list of inhibitors used for the study 78
Table 3.3: Composition of the studied natural gas 80
Table 3.4: The surfactant types and their world production rates 86

xvi
Table 4.1: HYSYS prediction on the gas composition‘s phase behavior 101
Table 5.1: Constant at different temperatures 127
Table 5.2: The hydrate composition used for the study 130
Table 5.3: The values of the constants in
132
Table 5.4: Values for the mol. wt, and for the hydrate components 132
Table 5.5: Corresponding values of , for the hydrate components 134
Table 5.6: Other parameters used to test the model 135
Table 5.7: The values for Sutherland‘s reference points 136
Table 6.1: Typical values for H2 and CO2 mixture during the experiments 145

xvii
LIST OF FIGURES
Figure 1.1: World liquid fuels production between 2001 and 2008 1
Figure 1.2: Thesis structure 9
Figure 2.1: Alaska oil pipeline - A suspended pipeline 17
Fig 2.2: View of the WAGP Project from Nigeria to Ghana
with Laterals at Cotonou, Lome, Tema and Takoradi. 22
Figure 2.3: The eleven gas fields to be developed under Gorgon project 27
Figure 2.4: Conceptual map of Gorgon gas project showing relevant
gas fields, pipelines and processing plant on Barrow Island 28
Figure 2.5: Gorgon gas project subsea well development schematic. 29
Figure 2.6: Seabed Profiles at Jansz 31
Figure 2.7: Pipe span due to cliff 31
Figure 2.8: The gas treatment facility at Barrow Island 32
Figure 2.9: Gorgon Gas processing plant 33
Figure 2.10: Barrow Island and surrounding area 33
Figure 2.11: Gas hydrate when formed inside a gas pipeline. 34
Figure 2.12: Hydrate formation model in a Gas-Oil-Water
multiphase flow system 37
Figure 2.13: Subsea gas pipeline plugged by hydrate 37
Fig. 2.14: Cavitation of a nickel alloy pump impeller blade exposed
to HCl acid medium 42
Figure 2.15: ―Horseshoe‖ erosion-corrosion damage in a copper pipeline 43
Figure 2.16: Metals attacked by galvanic corrosion 44
Figure 2.17: A metal attacked by pitting corrosion 48
Figure 2.18: A metal attacked by crevice corrosions 48
Figure 2.19: Three-dimensional reproduction of SCC shape 49
Figure 2.20: Fretting corrosion on metal plates 50
Figure 2.21: Uniform corrosion of structural steel 51
Figure 2.22: The copper chelates that flow with gas stream to consumers 56
Figure 2.23: Veranus Island pipeline explosion 59
Figure 2.24: The North Sea Piper Alpha accident 61
Figure 2.25: Human deaths from Alagbado pipeline fire 62
Figure 2.26: Human deaths from Ijegun pipeline accident 64

xviii
Figure 2.27: Resulting fire from Elume pipeline failure 68
Figure 3.1: Schematic of the Sapphire Cell 80
Figure 3.2: The liquid-gas interaction section in the sapphire cell 81
Figure 3.3: Hydrate formation temperature trend for the investigated inhibitors 85
Figure 3.4: Methane hydrate structures 87
Figure 3.5: The chemical structure of MP 88
Figure 3.6: The chemical structures of CPC 88
Figure 3.7: Chemical formula DPC 88
Figure 3.8: Chemical formula for BDHA 89
Figure 3.9: Formation temperature deviation of different inhibitors 89
Figure 3.10: Another structural representation of CPC 91
Figure 3.11: Another structural representation of DPC 91
Figure 3.12: The chemical structures of TB 91
Figure 3.13: The chemical structure of BDHA 91
Figure 3.14: Captured images of hydrates at blank concentration 93
Figure 3.15: Captured Images of hydrates formed by MP 93
Figure 3.16: Captured Images of hydrates formed by CPC 94
Figure 3.17: Captured Images of hydrates formed by DPC 95
Figure 3.18: Captured Images of hydrates formed by TB 95
Figure 3.19: Captured Images of hydrates formed by BDHC 96
Figure 4.1: HYSYS prediction vs experimental result for the formation
temperature at blank concentration 101
Figure 4.2: Investigation of critical operating concentration of DPC 105
Figure 4.3: Formed hydrates at various concentrations and pressures 106
Figure 4.4: Decreasing foaming with concentration except at 5000ppm 107
Figure 4.5: Foam growth with time at 3000ppm and 150bar 108
Figure 4.6: Images showing the hydrate growth in gas phase. 110
Figure 4.7: Formation of flocs in the liquid phase 111
Figure 4.8: The collapsing and rebuilding trend at 100bar and10000ppm 111
Figure 4.9: Concentration–pressure matrix showing similar structure
at all pressures 113
Figure 4.10: Result establishing the peak concentration for CPC as 200ppm 113
Figure 4.11: Pressure impacts on formation temperature at studied
concentrations 114

xix
Figure 5.1: SEM image of the corroded steel surfaces taken from the
study of CO2 corrosion in multiphase flow 119
Figure 5.2: Simulated metal surface morphology following moderate
precipitation leading to a partially protective film and
localized corrosion. ST = 0.53 119
Figure 5.3: Temperature against wall shear tress and corrosion rate
at pH=5.0 and 100bar 136
Figure 5.4: Pressure against velocity loss and corrosion rate at 15oC
and pH=5.0 138
Figure 5.5: Impact of pH on corrosion rate 138
Figure 6.1: Gas hydrate formation point by component 151
Figure 6.2: A chart on CO2 hydrate formation pattern 152
Figure 6.3: Hydrate characteristics of methane and gas mixtures 153
Figure 6.4: Effects of varying H2 concentration on methane hydrates 155
Figure 6.5: Effects of concentration variation on CH4+CO2 gas hydrates 156
Figure 6.6: Effects of pure N2 and H2 gases on gas hydrate formation 157
Figure 6.7: Comparison of inhibition trend between H2 and N2 157
Figure 6.8a: Comparing HYSYS and Experimental Results for CH4+H2 159
Figure 6.8b: Comparing HYSYS and Experimental Results for CH4+CO2 159
Figure 6.8c: Comparing HYSYS and Experimental Results for CH4+CO2+H2 159
Figure 6.8d: Comparing HYSYS and Experimental Results for CH4+CO2+N2 160
Figure 7.1: Proposed diagram for corrosion-hydrate interaction study 166
Figure A1: The solution flowchart for the developed model 209
xx
Nomenclatures
ST = Scaling tendency
3FeCOR = Precipitation rate of iron carbonate (mm/yr)
CR = Corrosion rate (mm/yr)
jR = The source or sink due to chemical reaction
jC = The concentration of species j (kmol/m3)
= The porosity of the film
= Porosity of the porous media
eff
jD
= The Effective diffusion coefficient of species j (which include both
the molecular and the turbulent components, m2/s)
jR = The source or sink of species j due to all the chemical reactions in
which the particular species is involved, kmolm-3
s-1
)
t = Time, (s)
x = The spatial coordinate (m)
i = The specific capacity
ClC = The amount or concentration of chlorine ions
ClJ = The diffusion flux of chloride ions
ClQ = The sink term
S = The Saturation
rS = Salinity ratio (Actual salinity/nominal salinity)
)( rSf = Corrosion rate correction factor for salinity (Corrosion rate at actual
salinity/Corrosion rate at nominal condition)
FeM = The Molecular weight of iron
corri = Corrosion current density
FeZ = Number of electric charge of iron
F = Faraday number/constant (96487 C/e-)
CorrR = Corrosion rate
2gO
= Density of dissolved O2 in pore water (kg/m3)
2dO = Density of gaseous O2 (kg/m3)

xxi
2OJ = Total flux of dissolved and gaseous O2 (kg/m2.s)
2OQ
= Sink term for the rate of consumption due to corrosion (kg/m3s)
rustW = Accumulated corrosion amount
CritW = Critical amount of corrosion products
st = Density of steel
rust = Density of rust
od = Original diameter
sd = Displaced steel (i.e. diameter of displacement)
D = Material thickness.
= A constant introduced as a magnification factor )0(
= A constant introduced to adjust a truncated portion )0(
= A constant corresponding to mean value of the distribution
= A constant corresponding to the standard deviation of the distribution.
)( rTf = Corrosion rate correction factor for temperature (Corrosion rate at
actual temperature/Corrosion rate at nominal temperature)
rT = Temperature ratio (Actual temp/nominal temp)
c = Constant representing the slope of the rr TTf )( relationship
d = The constant representing the )( rTf value at zero rT
T = Temperature (OK)
S = Salinity {Part per thousand (oo
o )}
)( rVf = Corrosion rate correction factor for velocity
rV = Velocity ratio
= Magnification factor )0(
v = Velocity
= Constant to adjust the truncated portion of the distribution )0(
SR = Saturation ratio
o = The constant controlling the slope at (t=0)
o
1 = The slope at t=0

xxii
iP = The weighting factor representing the relative duration of the ith
stationary period along the lifetime of material; and icd , is the
short-term corrosion wastage of the ith period.
= The Electric potential (V)
iD = Diffusion coefficient (m2s
-1)
iZ = The charge (e-/mol)
R = Universal constant (Jmol-1
k-1
)
jiS , = Stoichiometric coefficient of species i in the jth homogenous reaction
jr = The Rate (molm-3
s-1
)
= Divergence operator written in 3-D Cartesian coordinates
Crt = Corrosion Rate at temperature T (mm/yr.)
tk
= Temperature constant
Z = Compressibility factor
k = Pipe roughness (m)
Tc = Temperature at standard condition (60ıF/15.55ıC)
S = Wall shear stress (Pa)
f = Friction factor
tpHf )( = pH factor at temp t
Um = Mixed velocity (m/s)
m = Mixture density (Kg/m3)
k = Pipe roughness (m)
D = Pipe diameter (mm)
m = Mixed viscosity (Ns/m2)
G = Gas density (Kg/m3)
L = Liquid density (Kg/m3)
m = Mixture density (Kg/m3)
= Liquid fraction
s
GU = Gas superficial velocity (m/s)
s
LU = Liquid Superficial velocity (m/s)
Um = Mixed velocity (m/s)

xxiii
μG = Viscosity of gas (Ns/m2)
μL = Viscosity of liquid (Ns/m2)
w = Viscosity of water (Ns/m2)
μm = Mixed viscosity
QG = Volumetric flow rate of gas (m3/s)
QL = Volumetric flow rate of liquid (m3/s)
R = Gas constant
T = Operating temperature
Cp = Heat capacity
S = Entropy change,
H = Enthalpy change,
Z = Compressibility factor
Tc = Temp at standard condition (60OF/15.55
OC)
= Fugacity coefficient (watercut)
g = Specific gravity
GsU = Gas superficial velocity (m/s)
G = Gibb free energy
if = The fluid fugacity
t
C j
)( = Accumulation term
x
CD
x
jeff
j
5.1 = The net flux

xxiv
Abstract
Gas industry annually invests millions of dollars on corrosion inhibitors in order to
minimize corrosion implications on flow assurance; however, attention has never
been focused on possibilities of these chemicals to promote hydrate formation along
deepwater pipelines, which would equally result in another flow assurance problem
of high magnitude. This study investigated the possibilities of corrosion inhibitors to
aid the formation of gas hydrate along offshore (or underwater) pipeline systems;
developed a predictive model on corrosion rate for natural gas pipelines with gas
hydrates as the corroding agent and finally investigated the ability of pure N2 and H2
gases to inhibit the formation of gas hydrates.
All experiments in this thesis were conducted by forming various water-gas systems
in a cylindrical cryogenic sapphire cell. The first investigative work on hydrate-
corrosion relationship was conducted by allowing contacts between an industrial
grade natural gas (with 20% CO2 content) and five different corrosion inhibitors that
are commonly used at offshore fields. The equipment, consisting of several fittings
could operate at a temperature range of -160oC – 60
oC (with accuracy of ± 0.10
oC)
and pressure range of 1bar to 500bar (with accuracy of ± 0.5bar). Using the
‗Temperature Search‘ method, the hydrate formation temperature point for each
inhibitor was located at 500ppm and 100bar and the result compared with that of
control experiment. Due to observed significant influence, further investigations
were conducted on Dodecylpyridinium Chloride (DPC) at various concentrations
and pressures. The corrosion model was developed based on hydrate‘s
thermodynamic properties such as the operating temperature, pressure, fluid
fugacity, wall shear stress, superficial velocity, enthalpy, entropy and activity
coefficient amongst others, and a Matlab computer code was written to simulate the
generated solution algorithm. Finally, components interaction study was conducted
on various gas mixtures inside the sapphire cell to investigate the ability of pure N2
and H2 gases to inhibit the formation of gas hydrates.
The obtained results established that all corrosion inhibitors aid hydrate promotion;
this was attributed to their surfactant and hydrogen bonding properties which were
essential for hydrate formation. The five investigated inhibitors showed different

xxv
promotional rates with DPC having the highest promotional ability. The different
promotional rate is due to their different sizes and structures, active functional
groups and affinity for water molecules which determine the type(s) of hydrogen
bonding exhibited by each inhibitor while in solution. The significant performance of
DPC compared to other inhibitors was justified by the specific available active
functional group which obeys electronegativity trend of periodic table to determine
whether the resulting bond type will be polar covalent, ionic or ionic with some
covalent characteristic in nature. Also, DPC hydrates revealed strong influence of the
chemical‘s surfactant properties at all pressures and concentrations while its Critical
Micelle Concentration (CMC) was believed to be 5000ppm due to the various
anomaly behaviors exhibited at this particular concentration.
The developed mathematical model adequately predicted corrosion rates with gas
hydrate as the corroding agent and its effectiveness was confirmed by the level of
agreement between its generated results and existing literatures. The resulting
corrosion rate from hydrates could be as high as 174mm/yr (0.48mm/day). This is
extremely alarming compared to the industry‘s aim to operate below 2mm/yr. At this
rate, an underwater pipeline would be subjected to full bore rupture within some
days if corrective measures are not quickly taken.
Furthermore, the components interaction study revealed that CH4 played key roles on
hydrate formation patterns during natural gas transportation through offshore
pipeline system; the higher a natural gas CH4 content, the higher the risk of hydrates
promotion. It also showed that when alone, CO2 does not form hydrate at low
concentrations but showed a remarkable ability to aid hydrate formation when mixed
with CH4. This is not surprising since it is also a former with ability to form Type I
hydrate due to its very small size. Again, the ability of pure N2 and pure H2 gases to
inhibit the formation of gas hydrate was confirmed but with H2 showing more
significant effects. This was ascribed to their individual pressure condition to form
hydrate. Though, N2 gas with small molecules forms Type II hydrate at a relatively
higher pressure above the investigated pressures, it still forms hydrate within higher
operating pressures practiced at gas fields during the transportation. However, H2 gas
can never form hydrate at any natural gas transportation conditions. H2 gas only
forms hydrates at extremely high pressure of about 2000bar because its molecules

xxvi
are too small and usually leaked out of hydrate cage, thus, reducing the amount that
could be stored. By extension, these individual properties affect their interactions
with natural gas during the hydrate formation process.
Conclusively, this study has essentially revealed a new hydrate-corrosion
relationship and established the need for comprehensive investigations in this
research area. At all the investigated pressures, it was realized that DPC prolonged
the complete blockage of the glass orifice at 10000ppm. This special characteristic
may suggest the potential in applying the chemical as an additive for natural gas
transportation and storage in slurry forms. Finally, the use of pure N2 or H2 as
hydrate inhibitor in the offshore pipeline would be very cost effective to the industry.
However, extreme care should be taken during the selection process since there are
needs to further investigate the safety factors, material availability, cost implication
and recovery from the main gas stream in order to choose the better option.

1
1. Introduction
1.1 Background
Global energy demand has rapidly increased as a result of increase in population and
industrialization, with oil and natural gas constituting over 65% of the primary
sources. Measured in financial indicators, 90% of chemical products in industrially
developed countries are from organic sources whose 98% production are based on
oil and natural gas as basic organic chemical feeds (Janovic, 2005). Since petroleum
as an energy source is non-renewable, the crude reserves are fast declining due to
long period of utilization (Figure 1.1) while the global focus is now shifting towards
natural gas as the major source of energy due to its abundance availability, economic
viability and environmental friendliness.
Figure 1.1: World liquid fuels production between 2001and 2008 (Hook et al, 2009)
Note: Since mid-2004, production has stayed within a 4% fluctuation band, which
indicates that new production has only been able to offset the decline in existing
production
The increasing use of natural gas as a primary fuel source has led to its greater
production and exportation in gaseous and liquid ((Liquefied Natural Gas (LNG))

2
forms from many countries that hold sufficient reserves. This has equally increased
the global transboundary pipeline networks with minimal considerations to the
impacts its failure could have on the environment.
Natural gas is a combustible gaseous mixture of light hydrocarbon compounds and
other components. Its main components are methane (CH4) and other non-reactive
hydrocarbons in gaseous state at ambient temperature and atmospheric pressure. The
gas with low energy density is either found in association with crude oil (either
dissolved at high temperature and pressure or as gas cap in the same reservoir) or as
a non-associated gas. This origin of formation, coupled with type, location of
deposit, geological structure of the region and other factors determine its
composition. The gas is colorless and odorless in its pure state and when burnt, it
gives off a great deal of energy with low level of pollutants compared with other
fossil fuels.
As of 2007 the world natural gas reserve was estimated at 183.1 trillion cubic meters
(tcm). 70% of this reserve was available in the Former Soviet Union (FSU) and the
Middle East, while Oceania and Asia countries accounted for a further 8.9%. As of
2006, FSU and North American countries accounted for 53.1% of global production
while the Oceania and Asian countries produced 13.1%; the African gas reserves are
produced from Nigeria, Algeria, Egypt, Libya, Angola, Mozambique, Namibia,
Tunisia and Tanzania (Obanijesu and Sonibare, 2005). The gas is largely consumed
in North America and the FSU with United States demand for 2003 put at 786.32
bcm (Hill, 2005). Europe also has a large demand for the gas with considerable
trading sourced mostly from regional supplies, Africa and the FSU. Furthermore, the
Oceania and Asia countries accounted for 14.8% of total global consumption rate
(Table 1.1).
After production from the reservoir, the gas distribution involves transportation
through long pipeline network systems from the production platform to different
terminals, treatment plants and process units under high pressure. This is followed
by further transportation through another set of pipeline systems to an offtake station
and onward transmission in lower pressure pipes to end-users. The pipelines may be
laid over several kilometers on land or buried underground (both referred to as

3
onshore pipeline system) or submerged deeply inside water (offshore/deepwater
pipeline system).
Table 1.1: The global natural gas reserve, production and consumption (Morikawa,
2008)
Proven Reserve
(2007)
Production
(2006)
Consumption
(2006)
(Tcm) Share (%) (Bcm) Share (%) (Bcm) Share (%)
North America 8.0 4.4 753.2 26.1 769.9 26.7
Latin America 6.9 3.8 147.0 5.1 130.8 4.5
Europe 6.3 3.4 305.4 10.6 568.3 19.7
FSU 57.2 31.2 778.7 27.0 616.4 21.3
Africa 14.5 7.9 191.7 6.6 88.5 3.1
Middle East 73.9 40.4 334.8 11.6 287.1 9.9
Asia Oceania 16.3 8.9 377.0 13.1 426.7 14.8
Total 183.1 100.0 2887.7 100.0 2887.7 100.0
1.2 Submerged Pipelines: Failure and Consequences
Submerged gas pipelines are susceptible to failure in the form of leakage or full bore
rupture (FBR) as a result of corrosion and/or hydrate formation (Huang et al, 2012;
Zhang and Wu, 2012). These two flow assurance problems are caused by the flow
conditions and the fluid properties that introduce thermodynamic conditions and
electrochemical/chemical reactions that are conducive enough to encourage their
occurrence within the pipelength. The resulting accidents always discharge the gas
into the waterbody to cause hazardous impacts on the four environmental matrices
(soil, vegetation, air and water). Some of the havocs are dissolution of acidic
components which may cause fish scattering, abnormal behavior and reduction in
production capacity; air pollution which may result into climate change; soil
degradation which affects food crops; fire; explosion and human deaths.
Economically, hydrate prevention costs the gas industry about US$1 million per mile
(Jassim and Abdi, 2008) while corrosion loss alone on USA economy in 1995 was
estimated at US$300 billion with 1% coming from pipeline industry (Battelle, 1996).

4
Several attempts have been made by the industry to prevent these two problems
without success; research has shown however that the problems could only be
minimized; hence the industry continues to spend heavily on inhibitors.
In the research fields, all the existing work seem to be isolating each of these two
problems without consideration given to a possibility of them leading to one another;
hence, the significance of this work.
This thesis investigated the feasibility of the hydrate-corrosion relationship. This was
achieved by studying the possibilities of corrosion inhibitors to aid the promotion of
hydrate formation along the gas pipeline and the ability of the resulting hydrate to
initiate internal corrosion along the same pipelength. This study was necessitated
since corrosion inhibitors have surfactant properties and structural resemblance in
common with some established hydrate promoters. Five corrosion inhibitors
commonly used in the gas industry were investigated while further study was carried
out on the one with most significant impacts. A predictive corrosion model was also
developed with gas hydrate as the corroding agent. Finally, two gases were
investigated for their hydrate inhibition properties.
1.3 Aim and Objectives
The main aim of this work is to investigate the feasibility of any relationship
between hydrate formation and corrosion along deepwater natural gas pipeline
network systems. Consequently, the objectives of the project are:
1. To investigate the feasibility of corrosion inhibitors to aid hydrate
formation along the deepwater natural gas pipeline.
2. To investigate if the resulting hydrates could initiate corrosion along
the internal wall of the pipeline.
3. To develop a predictive corrosion rate model as a result of the hydrate
formation within the pipelength.
4. To investigate the use of some gases to inhibit hydrate formation rate
along the pipeline.

5
1.4 Scope of the Study
Though corrosion and hydrate formation problems are experienced in both the oil
and gas pipelines, this study focused mainly on the gas pipelines. This is to prevent
repitition and duplication of experiments. If the investigated problem could be
established with the gas pipeline, it then extends to the oil pipelines by implications.
Also, five corrosion inhibitors were investigated for the hydrate-corrosion
relationship while only one was chosen for further experimentation due to its
observed significant influence compared to others. For the corrosion rate modeling,
gas hydrate was considered as the only corroding agent. Finally, only H2 and N2
gases were investigated for the inhibition behaviour.
1.5 Significance of this Study
The global increase in offshore transboundary natural gas transportation increases
the risk of pipeline accidents thereby making the global environmental consequences
imminent. Gas hydrates and internal corrosion have been identified as the major
factors responsible for offshore pipeline failure while an accident in such
environment can contaminate the aquatic environment, destroy the biological
component of the ecosystem and affect human health.
Many efforts by the industry to solve one of the problems at a time always prove
abortive due to the unforeseen situation that one can assist the other. It is highly
likely that the existing gas hydrates within the pipelength would have initiated
internal corrosions before its removal. If this happened, the corrosion would grow
with time to undermine the pipe‘s integrity by destroying its material, hence, causing
failure. Also, if hydrate is promoted due to an attempt to inhibit corrosion, a serious
flow assurance problem is bound to happen. Based on this, development of adequate
knowledge in hydrate-corrosion relationship would go a long way in solving many
of the existing ‗unsolvable‘ problems in the industry. An example is the application
of H2 and N2 gases to inhibit hydrate formation along the pipeline as proposed in the
closing chapter of this report.
Furthermore, many corrosion models, focusing on several corroding agents have
been developed and improved upon with contingency plans put in place for such
accidents; but none of such existing models have considered hydrate as a possible

6
cause. An important element in the existing plans is the use of mathematical models
to predict the transport and fate of the fluid (Yapa and Zheng, 1998; Zheng and
Yapa, 1998; Lain et al, 2002; Melchers, 2003a; Nesic et al, 2004; Obanijesu and
Mosobalaje, 2008). Development of a predictive corrosion rate model on a possible
hydrate-corrosion relationship will go a long way in assisting the pipe designers at
the developmental stage. It will also assist the Pipeline Operator in the choice of pipe
material, and to know the likely period to replace the pipes.
1.6 Contributions of This Research Work
After addressing the above objectives, significant contributions have been made in
this study by establishing various relationships between hydrate formation and
corrosion along natural gas pipelines. So far, there is no known literature in this
research area apart from those published by the authors either through conferences or
journal articles; therefore, some of the specific contributions are:
1. This thesis was able to establish that gas hydrate could initiate corrosion
along the natural gas pipeline.
2. The thesis also established that corrosion inhibitors aid the hydrate formation
along the deepwater gas pipeline but at different rates. It further investigated
DPC at different pressures and concentrations due to its significant
promotional ability which opened more knowledge to the negative and
positive consequences of using the chemical.
3. Since this study appeared to be an entirely new research area, there was no
known existing mathematical model to rely upon, hence, the need for an
extensive literature. Finally, a functional and reliable model was developed
and validated by comparing the generated results with the outputs from other
related corrosion models. This model serves as another contribution to
knowledge from this work.
4. This thesis established the importance of component interactions during the
formation of gas hydrates and the ability of H2 and N2 gases to significantly
inhibit this flow assurance problem.
5. Through the recommendation for further work, this thesis successfully
demonstrated both the academic and commercial values of the entire study.

7
1.7 The Thesis Outline
The objectives of this work were achieved by following a systematic research
projection based on four questions as summarized below while Figure 1.2 provides a
diagrammatic representative of the thesis structure.
Step 1: Can Gas Hydrate (Clathrates) initiate Internal Corrosions along Gas
Pipelines?
This question came up due to critical observations on physical shape and chemical
composition of hydrates during and after formation. Both the semi and fully formed
hydrates could be considered as particles, and particles are initiators of erosion-
corrosion.
Thorough literature search was carried out while considering the above question.
Several pipeline projects were studied with their various operating conditions.
Kinetic and thermodynamic conditions aiding hydrate formation along the deepwater
pipelines were studied. The clathrates flow behaviors during and after the formation
were eventually used to positively fill this knowledge gap.
Step 2: Can Corrosion Inhibitors aid Hydrate Promotion along Deepwater
Pipelines?
This question was necessitated due to similarities in the surfactant properties and
chemical structures between corrosion inhibitors and some established hydrate
promoters.
This question was answered through experimental investigations on five corrosion
inhibitors commonly used at offshore regions. The considered inhibitors have
different active functional groups and chemical structures. The general investigations
on the inhibitors were carried out in a Cryogenic sapphire cell at 100bar and 500ppm
while the particular inhibitor with the highest significant impact on hydrate
formation temperature was further studied at different concentrations and pressures.
An industrially prepared natural gas composition containing 20% CO2 was used
throughout this study. A constant composition gas is needed to ascertain acceptable
accuracy for this work.
8
Step 3: Can the Resulting Corrosion Rate be Quantified?
If hydrates actually behave like particles within the underwater pipelines to cause
corrosions, the rate should be considered for quantification. This will assist in the
pipeline design stage, material selection as well as in projecting the shelf-life of the
pipeline.
Since this model was new, the existing corrosion models were reviewed, followed by
systematic development of a functional model for the corrosion-hydrate relationship.
A program, written in Matlab code was then developed to simulate the model whose
validity was finally verified by comparison of the generated results with the outputs
from previous corrosion models.
Step 4: Are there other possible means of inhibiting the Formation of Gas
Hydrates?
Considering the cost implications of these new discoveries on the industry, there
could be cheaper but still effective means of inhibiting gas hydrates along the
pipeline trunk.
This part of the study was conducted by mixing the most effective hydrate formers in
the gas composition (CH4 and CO2) at different ratios to study the impacts of
component interactions on the formation properties. H2 and N2 were then mixed with
these compositions at various ratios to study their inhibitive abilities.

9
Roles of Corrosion and Hydrate Formation on Natural Gas Pipeline Failures
Background Contributions Methodology
A literature review on existing
models (5.2)
Identification of knowledge gap
(5.3)
The model development (5.4)
Model simulation with data (5.5
and appendix 1)
Comparison of results with
outputs from existing models
for validation (5.6)
Chapter 1
Introduction
Chapter 2
Natural Gas Pipelines:
Importance and
problems
Comprehensive literature review on gas pipeline
history, classifications and existing projects (2.1-2.4)
Hydrate formation, types and consequences (2.5-2.7)
Natural Gas pipeline corrosion: Types, chemistry
and implications on flow assurance (2.8-2.9).
Pipeline failures: Economic, safety and
environmental impacts with case studies (2.10-2.11).
Motivations
Importance and
global acceptability
of natural gas (1.1)
Shortcomings on
knowledge about
hydrate-corrosion
relationships (1.2)
No experimental work
on hydrate-corrosion
relationships (1.6).
No existing corrosion
rate model with gas
hydrate as corroding
agent (1.6)
Background
Methodology
A literature review on existing
models (5.2)
Identification of knowledge gap
(5.3)
The model development (5.4)
Model simulation with data (5.5
and appendix 1)
Comparison of results with
outputs from existing models
for validation (5.6)
Chapter 1
Introduction
Chapter 2
Natural Gas Pipelines:
Importance and
problems
Comprehensive literature review on gas pipeline
history, classifications and existing projects (2.1-2.4)
Hydrate formation, types and consequences (2.5-2.7)
Natural Gas pipeline corrosion: Types, chemistry
and implications on flow assurance (2.8-2.9).
Pipeline failures: Economic, safety and
environmental impacts with case studies (2.10-2.11).
Motivations
Importance and
global acceptability
of natural gas (1.1)
Shortcomings on
knowledge about
hydrate-corrosion
relationships (1.2)
No experimental work
on hydrate-corrosion
relationships (1.6).
No existing corrosion
rate model with gas
hydrate as corroding
agent (1.6)
Background
Chapters 3 and 4
Investigated the ability of corrosion
inhibitors to promote gas hydrates
Literature review (3.2 and 4.2)
Experimental set-up (3. 3.1, 3.3.2,
3.3.3)
Preliminary investigations (3.3.4 and
4.3.2)
Experimental procedures (3.3.4, 4.3.3,
4.3.4, 4.3.5)
Results and discussions (3.4 and 4.4)
Chapter 6
Investigated the application of H2 and
N2 gases as hydrate inhibitors
Literature review (6.2)
Preliminary studies (6.3.2)
Mixed gas preparations (6.3.3)
Experimentation (6.3.4 - 6.3.8)
Investigation on CH4 only
Investigation on CH4 + H2
Investigation on CO2 + H2
Investigation on CH4 + CO2
Investigation on CH4 +CO2 + H2
Investigation on CH4 + CO2 + N2
Results and discussions (6.4)
Figure 1.2: Thesis structure.
Mathematical Modeling Experimental studies
Methodology
Chapter 5
Corrosion-Hydrate model
Review of existing models (5.2)
Identified knowledge gap (5.3)
The model development (5.4)
Model simulation with required
data (5.5 and appendix 1)
Model validation (5.6)
Chapter 1
Introduction
Chapter 2
Natural Gas Pipelines:
Importance and
problems
Comprehensive literature review on gas pipeline
history, classifications and existing projects (2.1-2.4)
Hydrate formation, types and consequences (2.5-2.7)
Natural Gas pipeline corrosion: Types, chemistry
and implications on flow assurance (2.8-2.9).
Pipeline failures: Economic, safety and
environmental impacts with case studies (2.10-2.11).
Motivations
Importance and
global acceptability
of natural gas (1.1)
Shortcomings on
knowledge about
hydrate-corrosion
relationships (1.2)
No experimental work
on hydrate-corrosion
relationships (1.5).
No existing corrosion
rate model with gas
hydrate as corroding
agent (1.5)
Background
Identified the possibilities for gas
hydrates to initiate internal
corrosions in gas pipelines (2.6 and
7.1.1)
Documentation of case studies on
pipeline failures (2.10)
Established the ability of corrosion
inhibitors to promote formation of
gas hydrates, chemistry and the
hydrate patterns (3.4, 4.4 & 7.1.2)
Developed a corrosion rate model
with gas hydrates as the corroding
agent (5.4, 5.5, 5.6 and 7.1.3)
Established the ability of H2 and
N2 gases to inhibit gas hydrates
(6.4.6 and 7.1.4)
Established two potential PhD
works for further studies and the
Thesis commercial value (7.2)
Mathematical Modeling Experimental studies
Methodology
Chapter 5
Corrosion-Hydrate model
Review of existing models (5.2)
Identified knowledge gap (5.3)
The model development (5.4)
Model simulation with required
data (5.5 and appendix 1)
Model validation (5.6)
Chapter 1
Introduction
Chapter 2
Natural Gas Pipelines:
Importance and
problems
Comprehensive literature review on gas pipeline
history, classifications and existing projects (2.1-2.4)
Hydrate formation, types and consequences (2.5-2.7)
Natural Gas pipeline corrosion: Types, chemistry
and implications on flow assurance (2.8-2.9).
Pipeline failures: Economic, safety and
environmental impacts with case studies (2.10-2.11).
Motivations
Importance and
global acceptability
of natural gas (1.1)
Shortcomings on
knowledge about
hydrate-corrosion
relationships (1.2)
No experimental work
on hydrate-corrosion
relationships (1.5).
No existing corrosion
rate model with gas
hydrate as corroding
agent (1.5)
Background

10
2. Natural Gas Pipelines: Importance and Problems
2.1 Introduction
The global demand and utilization of natural gas and its major component (methane),
compared with other fossil fuels have increased most rapidly over the past few years.
The gas has been gradually accepted as a substitute to other fossil fuels since it is
economically cheaper to produce; coupled with its abundance availability and
environmental friendliness (Table 2.1). The gas composition varies from field to field
and region to region (Table 2.2).
Table 2.1: Typical uncontrolled factors for natural gas and other stream generator fuels
(Pounds per MMBtu heat input) (American Gas Association, 1986; Obanijesu and
Sonibare, 2005)
SOx Particulate NOx HC Trace Metals
Coal 5.70 2.54 0.90 0.005 0.009
Oil (Residual) 3.22 0.23 0.39 0.01 0.0002
Solid Waste 0.49 3.22 0.31 - -
Wood 0.02 4.88 0.25 - -
Natural Gas 0.001 0.01 0.23 0.003 0.00
Natural gas is domestically used for heating buildings and water, cooking, drying and
lighting (Brkić and Tanasković, 2008; Joelsson and Gustavsson, 2009). Home
appliances running on natural gas include furnaces, barbecues, fireplace logs, pool and
spa heaters, and fire pits. Natural gas air conditioning also exists, though; this is not as
popular as the electrical alternative.

11
Table 2.2: Natural gas compositions from different gas fields (Obanijesu et al, 2011)
Composition Molar Composition (%)
Utorogu
Nigeria
Kokori
Nigeria
Burgan
Kuwait
Kirkuk
Iraq
Uthmaniyah
S/Arabia
Hassi R‘mel
Algeria
Ekofisk
Norway
Kapuni
N/Zealand
Uch
Pakistan
Lacq
France
Groningen
Netherland
Methane 90.19 68.42 74.3 56.9 55.5 83.7 83.3 45.6 27.3 69.0 81.3
Ethane 6.94 7.65 14.0 21.2 18.0 6.8 8.5 5.8 0.7 3.0 2.9
Propane 2.09 11.27 5.8 6.0 9.8 2.1 3.4 2.9 0.3 0.9 0.4
Butane 0.775 8.42 2.0 3.7 4.5 0.8 1.5 1.1 0.3 1.0 0.1
C5+
0.012 2.67 0.9 1.6 1.6 0.4 1.0 0.8 - - 0.1
Nitrogen - 0.16 2.9 - 0.2 5.8 0.3 - 25.2 1.5 14.31
Hydrogen
sulfide
- - 0.1 3.5 1.5 - - - - 15.3 -
Carbon-
dioxide
- 1.02 - 7.1 8.9 0.2 2.0 43.8 46.2 9.3 0.9

12
Industrially, the gas is a major source of electricity generation (Shukla et al, 2009;
Tourkolias et al, 2009). As an efficient and convenient fuel, the gas is used in
developed countries such as Australia, Canada and most European countries in
transportation sector to run cars, trucks and heavy duty service vehicles (Kamimura,
2006; Felder and Dones, 2007), while some current researches in the aviation
industry are targeted at designing aircrafts that will use natural gas as fuel (Gazzard,
2008a; Gazzard, 2008b; Greenair, 2009). Also, the gas plays a significant role in the
power plant technology (Mahmut, 2005; Pilavachi et al, 2009). Natural gas is used in
the making of anti-freeze and plastic. Food processing industries essentially use the
gas to power up their plants while waste treatment and petroleum refining are also
recognised consumers of natural gas. The gas is also useful in the production of
petrochemicals.
In 2000, the total world reserve and production of the gas were 150.19 trillion cubic
meters (tm3) and 2.4223tm
3 respectively (UNCTAD, 2009). Russia is the major
producing nation (Gelb, 2006) with the global highest oil and gas reserves of 69.1
billion barrel and 48.14tm3 respectively (representing 38% of global natural gas
reserve) while Australian conventional gas reserve as at 2006 was 2.43tm3 (DRET,
2009). The United States gas demand for 2003 was estimated at 786.32billion cubic
meters (bm3) (Hill, 2005) while gas demand of the EU 15 was projected to be 420–
650bm3 and 610-900bm
3 by 2010 and 2020 respectively (Table 2.3).
Table 2.3: Summary of some European gas demand scenarios (bm3) (
a OME,2002;
b IEA, 2001);
c Stern, 2001)
1999 2010 2020
EU 15 a 386 500 597
EU 30 a 462 642 777
EU 15 b 386 420-650 533-650
EU 30 c 580-690 610-900
EU 15 = Austria, France, Belgium, Greece, Germany, Italy, Luxembourg,
Netherlands, Portugal, Spain, Ireland, United Kingdom, Denmark, Sweden, Finland.
EU 30 = EU 15 + Turkey, Bulgaria, Greece, Rumania, Czech Republic, Hungary,
Poland, Slovakia, Slovenia, Estonia, Latvia, Lithuania, Norway, Switzerland.

13
2.2 Natural Gas Production and Transportation
Natural gas exists in the reservoir as a non-associated, associated (or solution) or
gas-cap gas. The non-associated gas is the one existing in a reservoir without a
contact with oil, the solution gas is the one where the gas dissolves in the oil at the
reservoir conditions whereas, and the gas cap is the gas overlying the oil phase in the
reservoir. Of the three groups, non-associated gas represents 72% of the available
global reserves while solution and gas-cap gases are 8.5% and 9.5% respectively
(Valais, 1983). The gas is located thousands of meters below the earth surface with
the fluid‘s pressure in the pores of the rocks ranging between 10MPa/km while in
hydrostatic regime (only supporting the weight of the overlying fluid column) to
25MPa/km in geostatic regime (supporting all or part of the weight of the rock
column) (Rojey et al, 1997). The gas molar mass and density at STP are 19.5g and
0.862Kg/m3 respectively while (Table 2.4) shows its thermodynamic properties at
NTP.
Table 2.4: Natural gas thermodynamic properties at normal temp and pressure of
293K and 1 atm (Obanijesu et al, 2010a)
MW Density R (Gas constant) Cp Cv Cp/Cv= γ
(kg/m3) kJ/(kg.K) kJ/(kg.K) kJ/(kg.K)
19.5 0.8034 0.426 2.345 1.846 1.27
This compressible hydrocarbon is detected in a reservoir by sensors which are
geophones for onshore reservoir or hydrophones for offshore. This is based on the
analysis of the reflection of elastic waves transmitted by the seismic source, gathered
on a surface marking the boundary between two layers of different acoustic
impedance. For onshore reservoirs, the reflection is generated by the use of
explosives to blast the reservoirs whereas; air guns are used for offshore reservoirs to
discharge compressed air into the water. These will propagate pressure (P) or shear
(S) waves which propagate the reflections at different velocities. The reflection of
the waves on impedance discontinuities is used to obtain the structural image of the
geological layer. The discovered hydrocarbon is then produced using a rotary drilling
technique. The well is then completed after acquiring wireline logs to measure the

14
formation‘s characteristics and fluid in place. The casing packer and some safety
devices (storm choke at downhole or surface-controlled subsurface safety valve near
the surface) are then installed before installing the Christmas tree. Finally, pipelines
are connected to transport the gas off the field over a long distance to a flowstation
for various separation operations as required based on composition. Various products
are finally transported through other set of long pipeline networks to various end
users.
2.3 Natural Gas Transportation Options
Various transportation options of natural gas from off-take include long pipelines
transport, methanol, Liquefied Natural Gas (LNG) and compressed natural gas
(CNG) of pressure between 3000 and 3600 psi (Imperial Venture Corp, 1998). From
these options, only long pipelines and LNG are in common use. The unit cost of
pipeline option is clearly superior to that of LNG due to the required high cost of
refrigeration and liquefaction of boiled-off liquids and the high risk of over-
pressurization for LNG. Transportation by methanol and CNG demonstrate unit
costs which are similar to pipelines but these are largely theoretical at present. Due
to easier transportation option as the low-cost and safe mode of long distance
transportation of petroleum and its products (Jacobs, 2002), the gas is conveyed from
reservoir to depots, refineries, jetties and final end-users through long pipeline
network systems.
2.3.1 Classification of pipelines
Pipelines are mainly divided into gas and oil pipelines depending on the nature of the
cargo conveyed. Main components of a pipeline network are operational areas and
the pipeline segments. Operational areas may be distribution centers, ports or
refineries and are connected by pipeline segments. Gas and liquid hydrocarbon
pipelines are essentially similar with the greatest operational difference resulting
from the varying needs of transporting gas versus liquid. Oil pipelines require pumps
to propel the liquid contents while gas lines rely on compressors to force the resource
through the pipes.
Although, the fundamental design and purpose of oil and gas pipelines are similar,
there are differences in their conveyance systems. Gas well flowlines connect

15
individual gas wells to field, gas treating and processing facilities, or to branches of a
larger gathering system, processed at the treating facility to remove impurities. From
field processing facilities, the dried, cleaned natural gas enters the gas transmission
pipeline system, analogous to the oil trunk line system (EPA, 1997). For oil
pipelines, once oil is pumped from a reservoir, it travels to a tank battery. One or
more tank batteries may be installed in a single field, each serving a number of
individual wells. From the tanks, oil is moved through large diameter, long-distance
trunk lines to refineries or to other storage terminals.
Pipelines are usually manufactured with material of special characteristics and
properties due to the nature of the conveyed cargo to be transported. Special
considerations are given to factors such as tensile strength, stiffness (elastic
modulus), toughness (fracture resistance), hardness (wear resistance) and fatigue
resistance; the effects of high and low temperatures on the mechanical properties;
corrosion resistance; thermal conductivity, electrical resistance and magnetic
properties; availability in standard sizes-plates, sections and tubes; and cost.
Commonly used materials are the carbon steel, stainless steel and the Monel.
Stainless steel is the most frequently used corrosion resistant material in chemical
industry. To impact corrosion resistance, the chromium content must be higher than
12% and the higher the chromium content, the more resistant is the alloy to corrosion
in oxidizing conditions. Nickel is added to improve the corrosion resistance in non-
oxidizing environments with three broad classes, which include Ferritic, Austenitic,
and Martensitic depending on material compositions. The uniform structure of
Austenite is the structure desired for corrosion resistance and it is widely used in the
chemical industry.
Monel, the classical nickel-copper alloy with the metals in the ratio 2:1 is probably
after the stainless steels. It has good mechanical properties up to 5000C. It is more
expensive than stainless steel, has good resistance to dilute mineral acids and can be
used in reducing conditions where the stainless steel would be unsuitable.
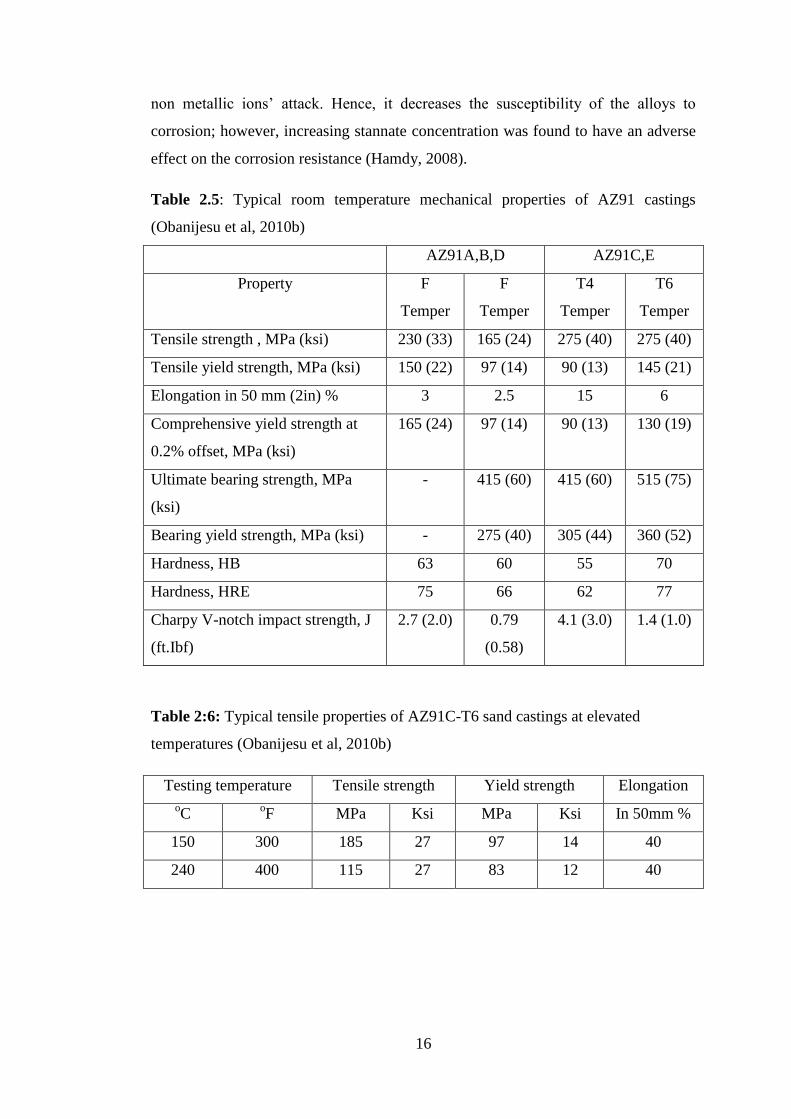
The stannates, AZ91D (a Die casting magnesium alloy known as the alternative to
zinc and aluminum because of its high-purity and excellent corrosion resistance) is
appreciated in the industry due to its properties (Tables 2.5 and 2.6) and ability to
reduce corrosion rates of a coated pipeline by behaving as a barrier to prevent the
16
non metallic ions‘ attack. Hence, it decreases the susceptibility of the alloys to
corrosion; however, increasing stannate concentration was found to have an adverse
effect on the corrosion resistance (Hamdy, 2008).
Table 2.5: Typical room temperature mechanical properties of AZ91 castings
(Obanijesu et al, 2010b)
AZ91A,B,D AZ91C,E
Property F
Temper
F
Temper
T4
Temper
T6
Temper
Tensile strength , MPa (ksi) 230 (33) 165 (24) 275 (40) 275 (40)
Tensile yield strength, MPa (ksi) 150 (22) 97 (14) 90 (13) 145 (21)
Elongation in 50 mm (2in) % 3 2.5 15 6
Comprehensive yield strength at
0.2% offset, MPa (ksi)
165 (24) 97 (14) 90 (13) 130 (19)
Ultimate bearing strength, MPa
(ksi)
- 415 (60) 415 (60) 515 (75)
Bearing yield strength, MPa (ksi) - 275 (40) 305 (44) 360 (52)
Hardness, HB 63 60 55 70
Hardness, HRE 75 66 62 77
Charpy V-notch impact strength, J
(ft.Ibf)
2.7 (2.0) 0.79
(0.58)
4.1 (3.0) 1.4 (1.0)
Table 2:6: Typical tensile properties of AZ91C-T6 sand castings at elevated
temperatures (Obanijesu et al, 2010b)
Testing temperature Tensile strength Yield strength Elongation
oC
oF MPa Ksi MPa Ksi In 50mm %
150 300 185 27 97 14 40
240 400 115 27 83 12 40

17
2.4 Some Existing Natural Gas Pipeline Projects
Due to its rising global demand, several onshore and offshore inter-state and
transboundary natural gas pipeline networks are being constructed with each
transporting millions to billions cubic meters per day with construction cost running
into several millions or billions of US dollar (Tables 2.7 and 2.8).
Almost 500,000 miles of oil and gas transmission pipeline criss-cross the United
States (Parformak, 2004) with the Alaskan oil pipeline bringing crude oil from the
Prudhoe Bay oil field on the North Slope to tanker ships docked in southern Alaska,
traversing 1270 km of Alaskan wilderness (Figure 2.1). The pipeline carries up to 2
million barrels of oil per day from the Arctic coast to the Gulf of Alaska (Encarta,
2004).
Shell Transmission owns over 17 Gulf of Mexico natural gas pipelines in operation
or under construction with capacity of almost 9 billion cubic feet per day (b-ft3/d)
while as at 2003, Equitable Gas Company was supplying over 250,000 customers in
Southwestern Pennsylvania as well as providing natural gas distribution services to
over 260,000 residential, commercial and industrial customers located mainly in the
city of Pittsburgh and surrounding municipalities in Southwestern Pennsylvania.
Figure 2.1: Alaska oil pipeline - A suspended pipeline (Encarta, 2004)
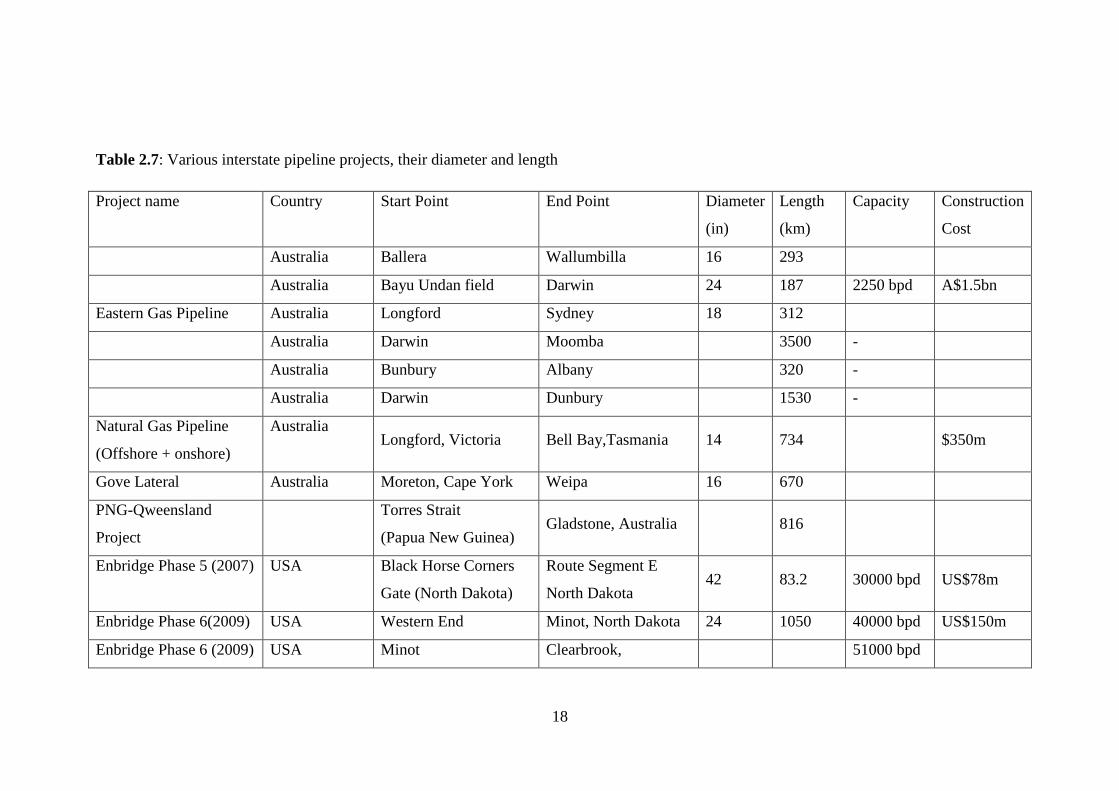
18
Table 2.7: Various interstate pipeline projects, their diameter and length
Project name Country Start Point End Point Diameter
(in)
Length
(km)
Capacity Construction
Cost
Australia Ballera Wallumbilla 16 293
Australia Bayu Undan field Darwin 24 187 2250 bpd A$1.5bn
Eastern Gas Pipeline Australia Longford Sydney 18 312
Australia Darwin Moomba 3500 -
Australia Bunbury Albany 320 -
Australia Darwin Dunbury 1530 -
Natural Gas Pipeline
(Offshore + onshore)
Australia Longford, Victoria Bell Bay,Tasmania 14 734 $350m
Gove Lateral Australia Moreton, Cape York Weipa 16 670
PNG-Qweensland
Project
Torres Strait
(Papua New Guinea) Gladstone, Australia 816
Enbridge Phase 5 (2007) USA Black Horse Corners
Gate (North Dakota)
Route Segment E
North Dakota 42 83.2 30000 bpd US$78m
Enbridge Phase 6(2009) USA Western End Minot, North Dakota 24 1050 40000 bpd US$150m
Enbridge Phase 6 (2009) USA Minot Clearbrook, 51000 bpd

19
Minnesota
Pathfinder (Proposed) USA North Border Pipeline
Moyes, Minnesota
and Emerson 440
Pathfinder Natural Gas
(on-going)
USA
(2008-2010) Wamsutter, Wyoming Midwest 42 800
2.0 billion
cfpd
Bison (On-going) USA
(2008-2010)
Rookies Mountain
Area Midwest and Chicago 36 1076.8 Over 610
Pathfinder USA Meeker Colorado Wamsutter 30 225
Escravos – Lagos
Pipeline System
Nigeria Escravos
Warri Alagbado, Lagos 24 359
2.7 billion
cfpd
WAGP Nigeria Alagbado, Lagos Badagry, Lagos 30 57
WAGP Ghana Takoradi Effasu 12 80

20
Table 2.8: Various global transboundary natural gas pipeline projects
Project name From To Diam (in) Length (km) Nature Capacity Construction Cost
PNG-Qweensland
Project
Kubutu, Papua New
Guinea
Gladstone
(Australia) 16 1195
Onshore/
Offshore
Keystone XL
pipeline (2008)
Alberta, Canada Nebraska
USA 36 3200
Onshore/
Offshore 1.1 million bpd US$12 billion
WAGP, Project Lagos, Nigeria Takoradi, Ghana
Vary with
portion 674
Offshore 11.3 billion cmpd US$550 million
WAGP, Project Nigeria Cotonou, Benin 20 51 Offshore
WAGP, 2009 Cotonou, Benin Lome & Tema
Togo 16 276
Offshore 3.39 billion cmpd US$130 million
WAGP, 2009 Tema, Togo Takoradi, Ghana 12 233 Offshore 1.7 billion cmpd US$106 million
BTC Pipeline 2004 Baku, Azerbaijan Ceyhan Turkey 1572
Offshore US$3.6 billion
Subsea Gas
Pipeline 2004
Sangachal Terminal,
Azerbaijan
Central Azeri
Georgia 28 186
Offshore

21
Due to the mounting pressure on the gas utilization from increase in global
population and industrial applications, Gas Industry is now forced to explore at
deepwater regions in search for the crucial energy source; and with the successful
operation of the existing pipeline networks, more countries are getting involved
thereby promoting cross-border networking. Offshore gas wells run from various
depths depending on the depth of the water which are generally classified as shallow
or deep water. While Sangachal gas terminal pipeline, located at 55km South of
Baku and covering area of 500 km2 and known as one of the world‘s largest
integrated oil and gas processing terminals was laid by a pipe-lay barge at 200m
water depth, the depth of the six East Azeri gas well range from 4000m to 5300m;
and the design depth for the Shah Deniz well is 6285m.
Saipem s.p.A constructed a $7 billion worth of natural gas export pipeline between
Qatar, Oman and UAE. The two-phase project, tagged as the Dolphin Gas Project
(DGC) started in March 2004 and was completed in August 2006. The project which
still remains one of the largest Transboundary projects in the Middle East, involved
shipping about 440,000 tons of steel pipes manufactured from Japan to the Gulf for
coating and laying in a continuous process to a maximum depth of 50 meters. The
first phase involved the development of two platforms in Qatar's North field, two
multi-phase offshore sealines to the processing facilities and the gas treatment and
compression plants at Ras Laffan. The second phase involved the construction of a
48in diameter by 364km subsea pipeline that carries gas to the UAE at a cost of
$3.5bn. The pipeline, with maximum capacity of 3.2 billion cubic feet of natural gas
per day (b-ft3/d) carried its first gas in 2007 at 2b-ft
3/d with an expected life period of
25 years.
In 2004, a 1440 km long pipeline was constructed from Libya at a cost of $6.6
billion to Egypt and Tunisia for natural gas supply (Cordesman and Al-Rodhan,
2006). The Transboundary pipeline project termed ―Western Libyan Gas Project‖
was constructed at 2km offshore Wafa Coaster Plant at the water depth of 28m. The
pipeline was designed for 25 years duration at a flowrate of 5600m3/hr.
Nigeria is presently constructing a $550 million pipeline of 617 km offshore pipeline
and 57 km onshore pipe-length to transport 11.3 bm3/d of natural gas to power
generators and industrial consumers in Ghana, Benin and Togo for thermal and

22
industrial. The project tagged ―West African Gas Pipeline (WAGP)‖ Project called
for installation of 617 km of offshore pipeline and 57 km of onshore pipeline from
an offtake at an existing natural gas system near Lagos (Amao, 2004) with a
throughput capacity of 12.718 x 10⁹ m
3 (450 MMscfd). The project was planned to
be extended to some other West African countries with time.
Of equal importance is the on-going Gorgon project in Australia which is notably
known for her significant natural gas reserves. The Gorgon Project, estimated at
AUS$43 billion is designed to extract and process natural gas from eleven separate
natural gas reservoirs on the North West Shelf of Western Australia. The project is
set to produce up to 15 million tonnes per annum of LNG which is to be transported
to China and also provide 300 tera joules (276 million ft3) of natural gas per day to
Western Australia‘s domestic gas pipelines. The project also incorporates a carbon
dioxide (CO2) sequestration plant that will inject up to 120 million tons of CO2
underground within the lifetime of the plant. The processing plant for the natural gas
production and CO2 sequestration is to be built on a small section of Barrow Island, a
―Class A‖ nature reserve. The Gorgon project involves lengthy subsea piping from
the natural gas fields to the processing plant.
2.4.1 WAGP Project – Project description
WAGP project (Fig 2.2) involved transportation of 11.3 bm3/d natural gas supplies
from Nigeria to power generators and industrial consumers in Ghana, Benin and
Togo for thermal and industrial uses through an additional installation of 617km of
offshore pipeline and 57km of onshore pipeline from an offtake at the existing
359km Escravos-Lagos natural gas system.
The project, whose construction started in 2005 with an estimated cost of $550m and
initial shelf-life of 20 years before renewal, included pipeline installation and
metering, pressure regulation, gas scrubbing and compression facilities. The work
was sponsored through the joint venture agreement of Nigerian National Petroleum
Corporation (NNPC), ChevronTexaco West African Gas Pipeline Co. Ltd, Shell
Overseas Holdings Ltd and Takoradi Power Co. Ltd and the total pipe-length is
1033km.

23
Figure 2.2: View of the WAGP project from Nigeria to Ghana with laterals at
Cotonou, Lome, Tema and Takoradi (Obanijesu and Sonibare, 2005 – modified)
359km of the total 1033km pipe-length was already in place through the existing
pipeline system from Escravos at Niger-Delta area of Nigeria to Alagbado in Lagos.
Of the remaining 674km that was constructed, 57km of the pipe-length would
transport the gas from Alagbado (Lagos) to Badagry beach in Nigeria while 617km
transboundary portion ran offshore from Badagry beach (in Nigeria) through
Cotonou (in Benin) and Lome (in Togo) to Takoradi Power Station (in Ghana).
Another 80km offshore pipe-length was then run from Takoradi to Effasu in Ghana.
Specifically, the existing Escravos-Lagos pipeline with 24in internal diameter and
capacity of about 2.5b-ft3/d (4.24 x 10
9 m
3/d) had the tie-in point to the WAGP
project at Alagbado West of Lagos. The Alagbado-Badagry pipeline network had an
internal diameter of 30in with length of 30km onshore and 27km offshore as an
extension of the existing Escravos-Lagos Pipeline System. The onshore portion
commenced at Alagbado and terminated at the Atlantic Beach in South of Ajido near
Topol Badagry in Lagos state after crossing the Badagry Creek. The Badagry
Lateral spurs

24
Lagoon Creek and the Atlantic beach crossing was achieved using both the
horizontal directional drilling and trenching and burial operations.
The onshore pipeline system included a mid-line relief system located off the Otta-
Idi Iroko highway near Canaan Land in Ogun state. An 18000-horse power onshore
compressor station was put in place at the Lagos beach from where 20in by 51km
pipeline was connected and extended 15km offshore before turning west across the
Nigeria-Benin border to Cotonou. While maintaining the 15km offshore extension,
the internal diameter was reduced to 16in for 276km to Tema where a further size
reduction to 12in for another 233km to Takoradi. Another 12in x 80km offshore
pipeline was linked from Takoradi to Effasu.
Along the base route, additional lateral spurs, averaging 15km were extended from
the base pipeline route to landfall regulating and metering facilities at Cotonou,
Lome and Tema. The spur diameters were 8in, 10in and 18in at Cotonou, Lome and
Tema respectively while a compression station operating between 40 and 150MW
was installed at Cotonou. The Cotonou-Tema pipe-length with the initial cost
estimate of $130million was designed to convey 60MMscfd (1.70 x 10⁹ m
3/d)
natural gas initially with the ultimate expectation of 120MMscfd (3.39 x 10⁹ m
3/d).
The ultimate destination in Ghana was the Volta River Authority Plant in Takoradi.
The Tema-Takoradi pipe-length with the initial cost estimate of $106million was
also designed to supply 60MMscfd (1.70 x 10⁹ m
3/d) of natural gas to Takoradi
Power Plant with gas demand of 43MMscfd (1.22 x 10⁹ m
3/d) and the additional
Hydro Power Plant in Effasu. In Tema, it was expected to supply VALCO power
plant whose gas demand is 21MMscfd (0.60 x 10⁹ m
3/d). The specifications for
each location are given in Tables 2.9 – 2.14.
Table 2.9: Benin power plant (Obanijesu and Macaulay, 2009)
Item Comment
Operator CEB
Capacity 40-150MW
Status Preliminary Studies Done

25
Table 2.10: Segment 2 of the pipeline system (Cotonou to Tema) (Obanijesu and
Macaulay, 2009)
Item Comment
Capacity 80mmscfd (2.26 x 10⁹ m
3) (initial)
120mmscfd (3.39 x 10⁹ m
3) (final)
Length 276km
Diameter 16in
Cost $130million (initial)
Table 2.11: Operating capacity of Valco power plant in Tema (Obanijesu and
Macaulay, 2009)
Item Comment
Operator Valco
Capacity Up to 100MW
Gas Demand 21MMSCFD (0.60 x 10⁹ m
3) (Max.)
Type: Combined Cycled Gas Turbine
Status Under Evaluation
Remarks Valco considering supplemental power to allow them to
restart their 25% of capacity that is currently idle
Table 2.12: Segment 3 of the project (Tema to Takoradi) (Obanijesu and Macaulay,
2009)
Item Comment
Capacity 60MMSCFD (1.70 x 10⁹ m
3)
Diameter 12in
Length 233km
Cost $106million (initial)

26
Table 2.13: Takoradi power plant (Obanijesu and Macaulay, 2009)
Item Comment
Operator Volta River Authority
Capacity 40MMSCFD (1.13 x 10⁹ m
3)
Type Combined Cycle Gas Turbine.
Type Start-up: 2Q 1997
Status Under construction
Initial fuel Light crude oil
Financing World Bank
Remarks Two-100MW GE turbine to be installed.
Table 2.14: Tema power plant (Obanijesu and Macaulay, 2009)
Item Comment
Operator GNPC
Phase 1
Capacity 131MW (simple cycle)
Expanded capacity 200MW (Combined Cycle)
Start-Up Funding Pending
Phase2
Capacity 120MW
2.4.2 The Australian Gorgon Project – Project Description
The Gorgon gas project, aimed at developing eleven natural gas fields (Figure 2.3) is
estimated to cost about AUS$43 billion to the operators (Table 2.15).
As the biggest single investment ever made so far in Australia, the Gorgon LNG is
expected to provide jobs for about 6000 people at the peak construction period, bring
an export income of about $300 billion from LNG sales to customers in the Asia-
Pacific over the next 20 years (Table 2.16). The project is also expected to buy about
$33 billion worth of Australian good and services over the next few years and
generate about $40 billion in government revenue over the next two decades.

27
Figure 2.3: The eleven gas fields to be developed under Gorgon gas project
(Thoebald, 2006).
Table 2.15: Gorgon operators by share (DSD, 2010)
Operators Share (%)
Chevron Australia (main operator) 50
Exxon Mobil 25
Royal Dutch Shell 25
Table 2.16: Already signed sales and purchase agreements between the Gorgon
Project stakeholders and Asia-Pacific establishments.
Stake holder Quantity Duration
Chevron
Australia
Osaka Gas 1.4 Mtpa 25 years
Tokyo Gas 1.1 Mtpa 25 years
Chubu Electric Power 1.44 Mtpa 25 years
GS Caltex of South Korea 0.5 Mtpa 20 years
Shell Petroleum
PetroChina Long term
BP Long term
ExxonMobil Petronet LNG (India) 1.5 Mtpa 20 year
PetroChina (China) 2.25 Mtpa 20 year

28
The gas fields are located about 130 km off the north-west coast of Western
Australia and collectively contain about 40 trillion cubic feet (tcf) of natural gas
which is approximately 25% of Australia‘s known gas reservoirs with majority of
the recoverable gas comings from the Jansz-lo and Gorgon fields. Gases from the
fields would be channeled into Gorgon and Jansz fields depending on the nearer field
and then transported through two separate subsea pipelines, one from each field
(Figure 2.4) to a process plant located on Barrow Island (Figure 2.5) for separation
into various components before further distribution to final destinations as Liquefied
Natural Gas (LNG) or town gas (domestic gas).
Each pipeline has a different gas composition with the pipeline from Gorgon gas
field consisting of high amounts of CO2 while the pipeline from Jansz-Io
predominately contains gas with very low condensate content (Table 2.17).
Figure 2.4: Conceptual map of Gorgon gas project showing relevant gas fields,
pipelines and processing plant on Barrow Island (Theobald, 2006)

29
Figure 2.5: Gorgon gas project subsea well development schematic (Chevron
Australia, 2011)
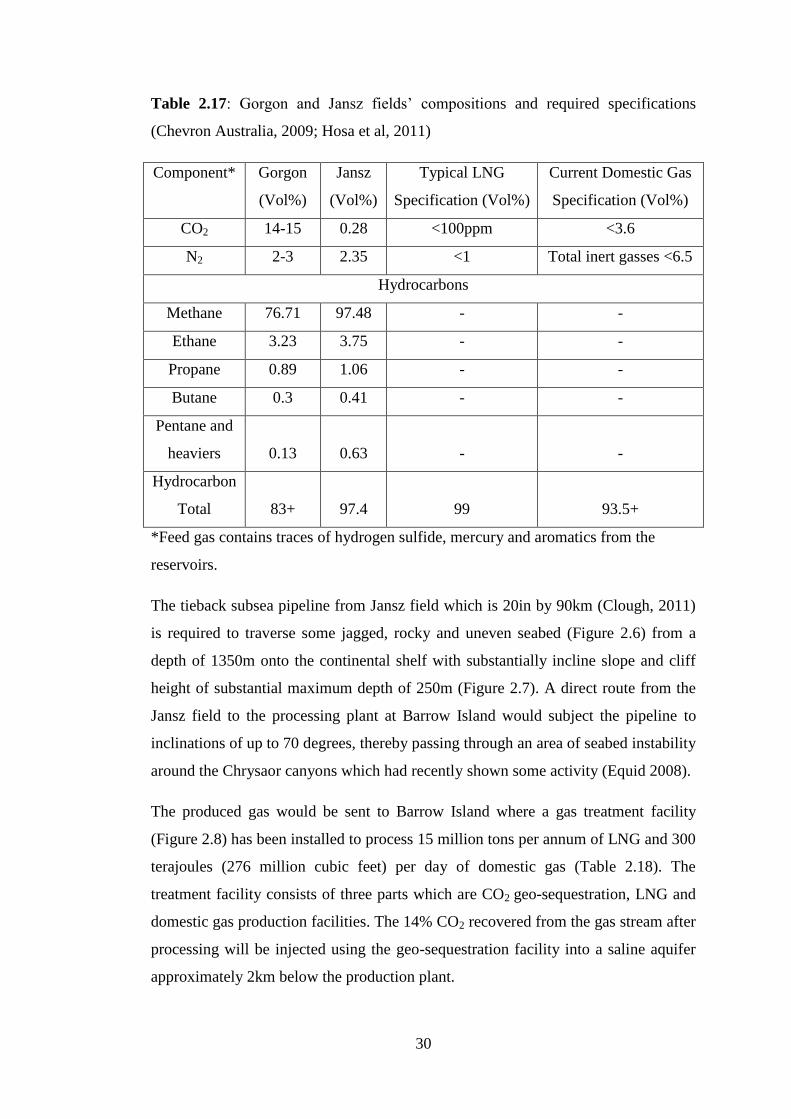
30
Table 2.17: Gorgon and Jansz fields‘ compositions and required specifications
(Chevron Australia, 2009; Hosa et al, 2011)
Component* Gorgon
(Vol%)
Jansz
(Vol%)
Typical LNG
Specification (Vol%)
Current Domestic Gas
Specification (Vol%)
CO2 14-15 0.28 <100ppm <3.6
N2 2-3 2.35 <1 Total inert gasses <6.5
Hydrocarbons
Methane 76.71 97.48 - -
Ethane 3.23 3.75 - -
Propane 0.89 1.06 - -
Butane 0.3 0.41 - -
Pentane and
heaviers 0.13 0.63 - -
Hydrocarbon
Total 83+ 97.4 99 93.5+
*Feed gas contains traces of hydrogen sulfide, mercury and aromatics from the
reservoirs.
The tieback subsea pipeline from Jansz field which is 20in by 90km (Clough, 2011)
is required to traverse some jagged, rocky and uneven seabed (Figure 2.6) from a
depth of 1350m onto the continental shelf with substantially incline slope and cliff
height of substantial maximum depth of 250m (Figure 2.7). A direct route from the
Jansz field to the processing plant at Barrow Island would subject the pipeline to
inclinations of up to 70 degrees, thereby passing through an area of seabed instability
around the Chrysaor canyons which had recently shown some activity (Equid 2008).
The produced gas would be sent to Barrow Island where a gas treatment facility
(Figure 2.8) has been installed to process 15 million tons per annum of LNG and 300
terajoules (276 million cubic feet) per day of domestic gas (Table 2.18). The
treatment facility consists of three parts which are CO2 geo-sequestration, LNG and
domestic gas production facilities. The 14% CO2 recovered from the gas stream after
processing will be injected using the geo-sequestration facility into a saline aquifer
approximately 2km below the production plant.

31
Table 2.18: Production rates of exports from Barrow Island.
Product Production rate Product destination
Condensate 20000 bbl/day Japan, India and local markets
Liquefied Natural Gas 15 MTPA Japan and India
Domestic Gas 300 terajoules/day Perth, Western Australia
Figure 2.6: Seabed profiles at Jansz (Equid, 2008)
Figure 2.7: Pipe span due to cliff (RCEBC, 2009)

32
Figure 2.8: The gas treatment facility at Barrow Island
It is estimated that the plant will sequester a total of 120 million tons of carbon
dioxide within the lifetime of the plant with a proposed maximum injection of 4.9
million tons per year through 8 wells. If these injection rates are reached, the Gorgon
project is expected to reduce net global greenhouse gas emissions by approximately
45 million tons per year. Geo-sequestration injections are expected to commence in
2014 (Hosa et al. 2011).
The LNG is to be exported to China and neighboring countries whereas, the
domestic gas whose main treatments involve acid gas removal, dehydration and
liquefaction (Figure 2.9) is for local consumption within Western Australia.
Barrow Island (Figure 2.10) is a Class ―A‖ nature reserve due to the presence of
unique and endangered flora, fauna and surrounding waters. It is located off the
Pilbara coast 85 km North-North-East of the town of Onslow and 140 km west of
Karratha. The Island is approximately 25 km long and 10 km wide and covers
approximately 23500 ha. It is the largest of a group of islands, including the
Montebello and Lowendal Islands. The Island is home to at least 22 unique terrestrial
species which include the endemic Barrow Island Euro, White winged Fairy Wren, a
subterranean blink snake and a range of other cave dwelling species. The island is
also a significant nesting site for marine turtles. The mean ambient wind speed
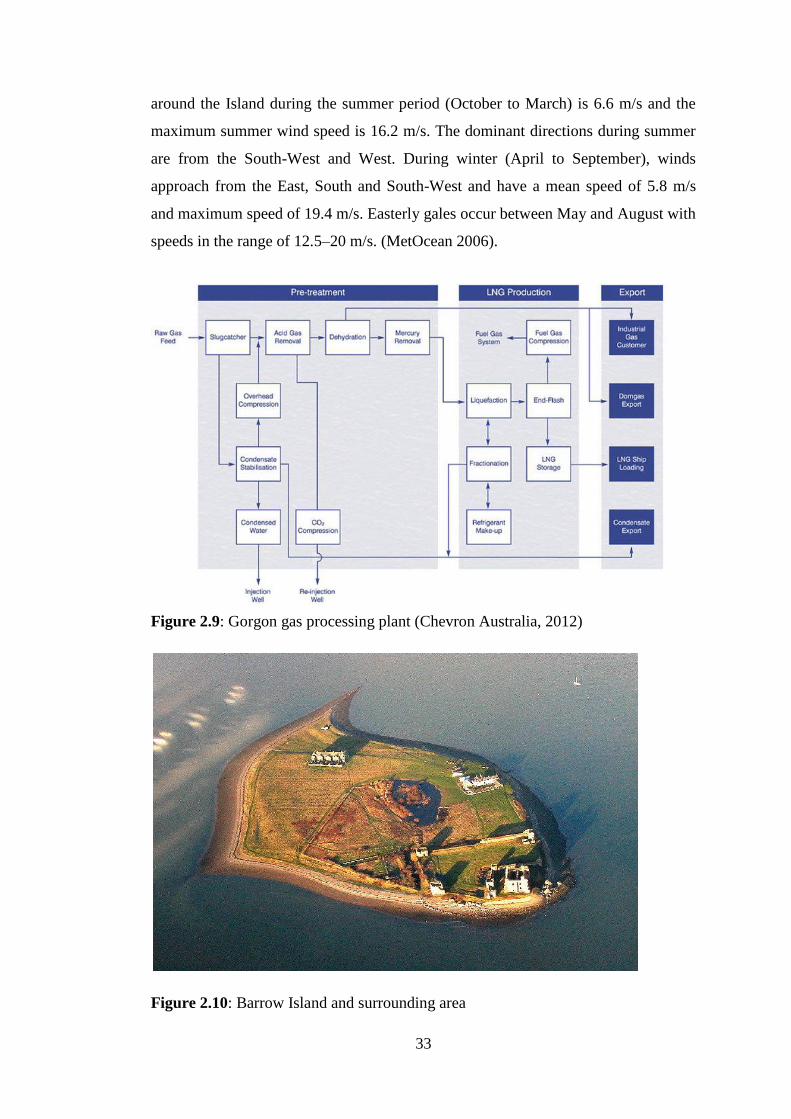
33
around the Island during the summer period (October to March) is 6.6 m/s and the
maximum summer wind speed is 16.2 m/s. The dominant directions during summer
are from the South-West and West. During winter (April to September), winds
approach from the East, South and South-West and have a mean speed of 5.8 m/s
and maximum speed of 19.4 m/s. Easterly gales occur between May and August with
speeds in the range of 12.5–20 m/s. (MetOcean 2006).
Figure 2.9: Gorgon gas processing plant (Chevron Australia, 2012)
Figure 2.10: Barrow Island and surrounding area

34
2.5 Hydrate Formation Problems along Offshore Gas Pipelines
2.5.1 General Description
During the offshore pipeline transportation, the low paraffinic homologous (C1 – C4)
composition of natural gas usually combines with the non-hydrocarbon components
of the gas (such as N2, CO2, H2S) and water vapour to form gas hydrate which is one
of the major flow assurance problems encountered in the production, processing and
transportation of natural gas. Gas hydrates are ice-shaped, crystal lattice, solid
compounds formed by the physical combination of water molecules with small
hydrocarbon molecules and the non-hydrocarbon components at high pressure and
low temperature due to the weak Van der Waals forces and the hydrogen bonding
properties of water (Hao et al., 2006; Du et al., 2007; Liu et al. 2007). The crystalline
compound is stabilized by the encapsulated smaller molecular diameters guest such
as CH4 and C2H6 (Sloan and Koh, 2007) which are trapped in the microcavities of a
crystal lattice provided by the host water (Figure 2.11).
Figure 2.11: Gas hydrate when formed inside a gas pipeline (Obanijesu et al, 2011)
A typical hydrate composes of 90% H2O while other components constitute the
remaining 10% (Abdel-Aal et al, 2003). Specifically, at 1 MPa, ethane gas can form
gas hydrates at temperatures below 4OC whereas, at 3 MPa, it can easily form
hydrate at temperature below 14 OC (Talaghat et al, 2009). Undersea gas
transportation pipelines often have such thermodynamically suitable conditions for
this formation (Palmer and King, 2008; Lorenzo, 2009) because the gas is

35
transported at supersonic velocity under high pressure and a very low ambient
temperature.
Due to the rapid formation of gas hydrates, it is considered by far the most serious
and common problem in flow assurance in the case of deep subsea transportation
compared to other solid deposits (Sloan, 2005).
Hydrates have important bearing on flow assurance and safety issues in oil and gas
pipelines due to their physical properties, most notably, the non-flowing crystalline
solids which make them denser than typical fluid (Sloan, 2003).
2.5.2 Hydrate Formation Process
Water molecules are known to show some unusual properties through the boiling
point, enthalpy of vaporization and expansion upon freezing when compared to other
molecules with similar characteristics. This is explained by its possession of two
unbounded pairs of electrons (from oxygen) which induce electrostatic charges on
the molecules to result in hydrogen bonding. Though, hydrogen bonding is also
present in alcohols and group 6A compounds with hydrogen, it is particularly
stronger in water (Uno et al, 2000; Sovago et al, 2008). This enables water to form
hydrates as a result of its hydrogen bonding property. This bonding causes water
molecules as the host to align in regular orientation while the guest or former
molecules (CH4, C2H6, C3H8, Cl2, H2S, CO2, e.t.c.) stabilize the aligned molecules
through the van der Waal forces (which must be strong enough) to precipitate a solid
mixture known as hydrate (Cwiklik and Devlin, 2010), however, there is no bonding
between the guest and host molecules.
Solubility of the guest molecule is also of paramount importance since it must not be
highly soluble in water (Martın and Peters, 2009; Jacobson and Molinero, 2010).
CO2, H2S and SO2 that are significantly soluble represent the upper limits while
ammonia and HCl that are highly soluble in water cannot form hydrates.
Hydrate formation is enhanced by turbulence (velocity and agitation), nucleation
sites and free water (Moon et al, 2003; Anderson et al, 2007; Wenji et al, 2009). Gas
is normally transported at high velocity which gives rise to agitation along the pipe-
length due to the flow condition. This gas will finally flow through the narrowing at
the choke valves where temperature drop will be experienced due to Joule Thompson

36
effects, hence, the formation of hydrates (Harun and Watt, 2009). Presence of
welded spots (elbows, tee etc), dirt, scales, slits and sands also make good nucleation
sites while free-water is an enhancer since the gas-water interface is a good
nucleation point.
2.5.3 Identified Types of Hydrates
Hydrates are generally grouped into Type I, Type II and Type H as defined by their
structures (Hashimoto et al, 2006); however, type I and Type II are the most
encountered hydrates in natural gas pipelines. Type I, with Dodecahedron (12-sided
polyhedron) and Tetrakaidecahedron (14-sided polyhedron) structures is the simplest
hydrate structures. It is generally formed by CH4, C2H6, CO2, and H2S (Takeya et al,
2006; Makino et al, 2010) and consists of 14 water molecules with the theoretical
formula of X.5
H2O where X is the former.
Type II, with Dodecahedron and Hexakaidecahedron (16-sided polyhedron)
structures and formed by N2, C3H8 and i-C4H10 consists of 136 water molecules with
X.5
H2O and X.17H2O as theoretical compositions (Das et al, 2009; Liang and
Kusalik, 2010). While N2 occupies both the small and large cages, the other two only
occupy the large cages due to their sizes.
Type H can only be formed in the presence of two formers, which are of small
molecule (mainly methane) and large molecules such as 2-methylbutane, 2-2
dimethyl butane, cyclohexane, etc. these large molecules are rarely found in natural
gas.
Size-wise, the CH4, H2S, and CO2 have the molecular size range of 4.4-5.4Å. These
sizes are small enough to occupy both the small and large cages to form Type I
hydrate. C2H6 falls within the next region of 5.6-5.8Å to occupy the large cage alone,
it equally forms Type I hydrate. C3H8 and i-C4H10 with size range of 6.0-6.9Å fall
within the next range to occupy only the large cages to form Type II.
2.5.4 Growth
Hydrate is ideally formed as tiny particles at the interface between the water and
hydrocarbon phases. These entrained hydrate-encrusted water droplets would start to
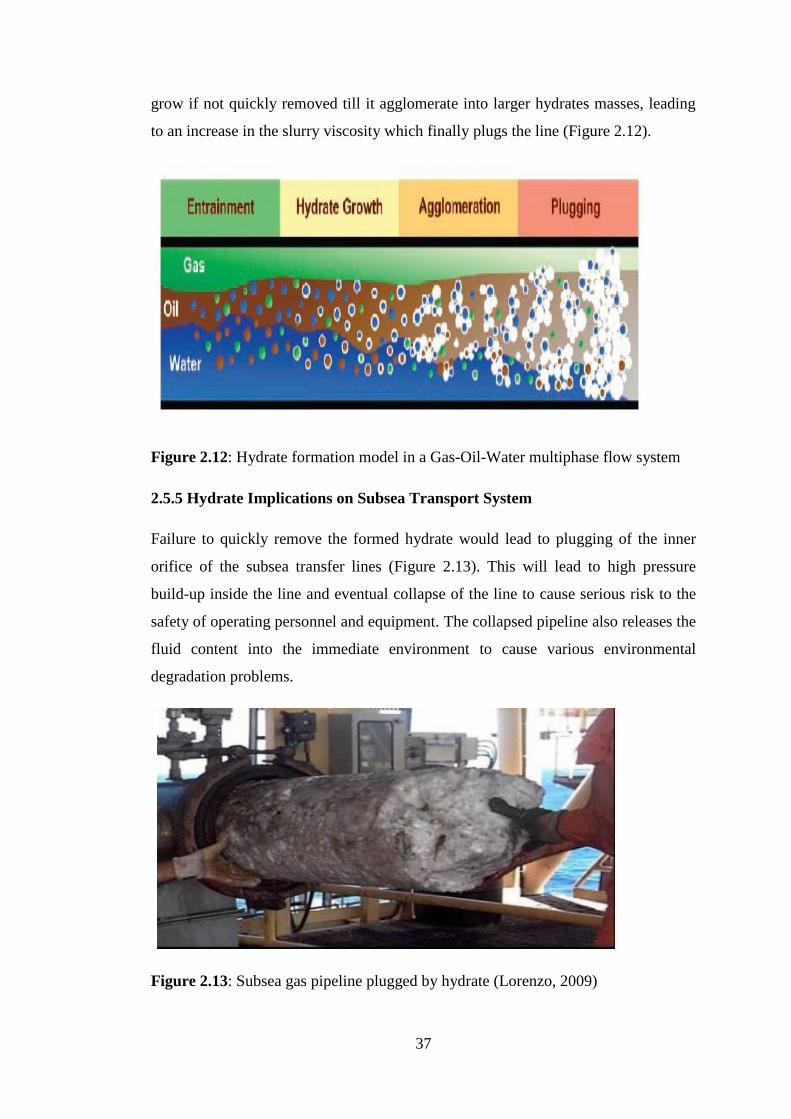
37
grow if not quickly removed till it agglomerate into larger hydrates masses, leading
to an increase in the slurry viscosity which finally plugs the line (Figure 2.12).
Figure 2.12: Hydrate formation model in a Gas-Oil-Water multiphase flow system
2.5.5 Hydrate Implications on Subsea Transport System
Failure to quickly remove the formed hydrate would lead to plugging of the inner
orifice of the subsea transfer lines (Figure 2.13). This will lead to high pressure
build-up inside the line and eventual collapse of the line to cause serious risk to the
safety of operating personnel and equipment. The collapsed pipeline also releases the
fluid content into the immediate environment to cause various environmental
degradation problems.
Figure 2.13: Subsea gas pipeline plugged by hydrate (Lorenzo, 2009)

38
This problem usually costs the industry billions of dollars to mitigate annually with
no permanent solution in focus. A significant operating expense equal to hundreds of
millions of US dollars is annually devoted to hydrate prevention with half spent on
inhibition while offshore operations additionally spends approximately US$ 1
million per mile on insulation to prevent hydrate formation along the subsea
pipelines (Jassim and Abdi, 2008). Prevention of hydrate formation requires as much
as 10-15% of the production cost, this is a substantial investment. Also, the continual
removal of hydrate plugs from an onshore well can cost up to $1 million with an
offshore pipeline costing upwards of $2-4 million (Makogon, 1997).
2.5.6 Existing Prevention/Minimization Options
Formation of hydrates require three conditions which are low temperature and high
pressure with formation point values depending on the gas composition; presence of
a former (or a guest) and appropriate amount of water. One of these three conditions
must be eliminated in order to prevent the hydrate formation. However, apart from
being desired products, the former(s) cannot be removed from the reservoir; hence,
the need to work on the other two conditions.
Since hydrate formation could not be totally prevented, all efforts in the industry are
directed towards inhibiting its formation and/or preventing its agglomeration by the
use of chemicals generally referred to as hydrate inhibitors. These inhibitors are
generally categorized into thermodynamics, kinetics and anti-coagulants (or anti-
agglomeration) based on their inhibiting techniques (Frostman et al, 2003; Gao,
2009).
Thermodynamic inhibitors, which are the alcohols and glycols (both are polar
solvents), and the ionic salts inhibit by depressing the freezing point. At required
concentration, these chemicals effectively shift the thermodynamic equilibrium by
lowering the temperature of formation point or increasing the pressure. The alcohols
used in gas industry are methanol (MeOH), ethanol and glycerol while the glycols
are ethylene glycol, diethylene glycol and triethylene glycol. Also, the applied ionic
salts include the NaCl, CaCl2, NaBr, K2CO3, KBr and KCl (Ostergaard et al, 2005).
According to Carroll (2009), the freezing point depression is a function of inhibitor‘s
concentration and molar mass. This is given as

39
Equation 2.1
Where is the mole fraction of the solute (inhibitor); is the Temprature
depression (oC); is the Universal gas constant (8.314 Jmol
-1k
-1); is the Melting
point of the solvent (K) and is the Heat transfer coefficient
Conversion of the mole fraction to mass fraction followed by re-arrangement gives
*
Equation 2.2
Thus
Equation 2.3
Where
is the molar mass of the solvent (the H2O), is the molar mass of the solute (the
inhibitor), is the weight percent of the solute (the inhibitor) and For H2O, the
value is .
While transmitting gas through pipeline, methanol is injected at low rates of 0.5 –
1.5m3/day and high pressure of 7000Kpa (Carroll, 2009) at a typical deepwater
concentration of 0.25-1.0 bbl MeOH/bbl H2O (Frostman et al, 2003). Methyl
ethylene glycol (MEG) rates are comparable to that of MeOH but very expensive
cost-wise. For it to be economical, MEG is usually recovered and recycled. Though,
methanol is very useful in combating hydrate formation along gas pipeline and
process equipment, it however has an adverse effect by forming azeotropes with
some of the gas components such as propane and butane (Hadler et al, 2009). This
makes binary distillation impossible as a separation option. Also, it can easily
dissolve alcohol-based corrosion inhibitors to lead to unexpected corrosion problem
along the line (Carroll, 2009). Also, small quantity of air from the atmosphere
usually dissolves into methanol during its storage. As this is injected into the
pipeline system with methanol as inhibitor, the air accumulates within the line with
time to promote corrosion.
Furthermore, based on National Fluid Power Association (NFPA) rating (Table
2.19), methanol is highly flammable compared to glycols. This makes its storage

40
more dangerous especially, at a confined place such as offshore rigs. Ethylene glycol
is slightly toxic, though, methanol, ethanol, dietheylene glycol and triethylene glycol
are non-toxic.
Table 2.19: The NFPA rating for methanol (MSDS, 2009)
Item Rating
Health 1
Flammability 3
Instability 0
Ammonia (NH3) could have been a better economical and operational inhibitor
compared to methanol. With NH3, lower weight percent would have been required to
achieve the same result due to its lower molar mass. It can also diffuse through the
gas phase to reach the hydrate plug. However, it is toxic (Megraud et al, 1992;
Klerke et al, 2008; Li and Duan, 2012) and can also react with CO2 and H2S in
aqueous phase.
Acetone is expensive, thus, making its use as an inhibitor costly. It also promotes
hydrate at low concentration while acting as an inhibitor at high concentrations
(Mainusch et al, 1997).
The kinetic and anti-coagulant inhibitors however require lower dosage compared to
thermodynamic inhibitors (Villano et al, 2008). The Kinetic hydrate inhibitors
(KHIs) inhibit by slowing down the process of crystallization. They achieve this by
causing interference with the nucleation and/or the crystal growth of hydrate, thus,
delaying the growth of hydrate formation and provide enough time for transportation
of the gas to its destination (Al-Adel et al, 2008; Kelland et al, 2008). They are
mostly polymers and significantly soluble in water. Fu et al (2001) indicated that
KHIs can reduce the hydrate formation temperature by about 11oC at 3000ppm or
lower concentration. The use of KHIs is capable of saving the industry up to 40% of
chemical cost compared to thermodynamic inhibitors.
Instead of preventing the formation of hydrate, anti-coagulants inhibitors allow the
formation but prevent the accumulation. This allows its transport as slurry with the
natural gas thus, preventing the plugging.

41
However, all the inhibitor types can only significantly reduce the hydrate formation
temperatures; they cannot prevent its formation. Hydrate is finally formed as the
temperature along the pipelength continues to drop. This is especially imminent at
the cold regions and offshore pipelines where the seawater temperature ranges
between −1°C to +6°C. The formation starts in bits and agglomerates to chips that
finally solidify to plug the flowlines.
2.6 Part of Present Research Contribution to Knowledge
Before this study, all the available articles on hydrate formation have been focusing
mainly on its ability to plug the pipe-length without any suggestion on its ability to
initiate corrosion, thus, undermining the magnitude of this problem to pipeline
industry. Obanijesu et al (2010a; 2011a) bridged this knowledge gap by identifying
the ability of hydrate formation to initiate corrosion along the offshore gas pipelines.
They further identify the types of corrosion that could be initiated, the mechanisms
of initiation, and the consequences of the resulted corrosions and finally proposed
some management options. Their work opened a new area of research interest on
hydrate-corrosion relationship.
According to Obanijesu et al (2010a; 2011a), gas hydrates are capable to initiate
various corrosion types along the internal portion of natural gas pipelines through
physical and chemical and electrochemical processes based on the hydrate formation
stage, the hydrate size and the contact period with the pipe‘s surface. The acidic
gases (H2S, CO2 and Cl-) that are part of hydrate composition are eventually
responsible for the corrosions (NS, 2005; Obanijesu, 2009). Available water is also a
corrosion agent. At each stage of hydrate processes, interaction and reaction take
place between the hydrate composition and the pipe‘s inner wall to initiate the
internal corrosion as henceforth reported.
2.7 Corrosion Intiation by Physical and Electrochemical Processes
At different formation stages, the fluid goes from liquid to semi-solid hydrate and
finally to solid hydrate. During each of these stages, a continuous interaction
between the hydrate phase and the pipe wall could initiate cavitations, erosion,
pitting, galvanized and stress cracking corrosions.

42
2.7.1 Cavitation corrosion through Physical Process
The first formation stage is in a semi-solid state with the hydrate blocks having
liquid inside the cavities. This will readily collapse at high impact with a rigid
surface like that of pipe‘s wall to initiate the cavitations corrosion. Cavitation
corrosion (Figure 2.14) is caused by the collapse of bubbles formed at areas of low
pressure in the conveyed fluid (Roberge, 2008).
Figure 2.14: Cavitation of a nickel alloy pump impeller blade exposed to HCl acid
medium (CHCMT, 2009)
The fluid, traveling at a very high speed will experience a drop in pressure at a point
of discontinuity in the flow path, especially, at the joints and bends. This will lead to
the formation of gas or vapor bubbles (transient voids or vacuum bubbles) in the
stream which would implode upon hitting the metal surface to produce a shock wave
sufficiently strong enough to remove the protective films. The cavitations corrosion
is then greatly accelerated at this mechanically damaged surface by the reaction
between the pipes‘ ‗naked‘ surface and the acidic content of the fluid.
2.7.2 Erosion Corrosion through Physical Process
With time, the hydrates graduate from semi-solid iced-chips to solidified iced-chips.
While traveling at high velocity, these chips will be bombarding the inner surface of
the pipe wall to cause erosion. Erosion as the destruction of a metal by abrasion or
attrition is caused by the relative motion/flow of liquid or gas (with or without
suspended solids in the pipe) against the metal surface. For erosion-corrosion to

43
occur, there must be a constant bombardment of particles on the pipe wall surface.
This gradually removes the surface protective film or the metal oxide from the metal
surface, thus, exposing the surface to erosion-corrosion (Figure 2.15) from the fluid
properties. Factors such as turbulence, cavitations, impingement or galvanic effects
can add to the severity of erosion-corrosion attack which eventually leads to
pipeline‘s rapid failure.
Figure 2.15: ―Horseshoe‖ erosion-corrosion damage in a copper pipeline (Obanijesu
et al, 2011d)
Likewise, the hydrate chips agglomerate with time to form bigger iced-block chips
which will require more energy to transport across the surface of the pipe-wall. This
movement will induce a relative motion between the pipe-wall and the hydrate block
to initiate large scale of erosion-corrosion.
2.7.3 Electrolytic and Galvanic corrosions from Electrochemical Processes
The CO2 and/or H2S gases from the gas constituents as well as the Cl- ions (and
sometimes the acetic acid (CH3COOH)) originating from the formation water always
react with the available water during hydrate formation process. These will produce
acidic solutions that dissociate with time to individually yield corrosive electrolysis
products (Equation 2.4) that ultimately interact with the pipe‘s inner surface during
the hydrate solidification process or melting (during hydrate removal).
COOCHHCOOHCH
HCOHCOH
33
332 Equation 2.4
Corrosion reactions will be promoted over time from these components through
electrochemical reactions to yield galvanic and electrolytic corrosions. The corrosion

44
rate will be a function of time, composition, pH and other thermodynamic properties
such as temperature, pressure and gas fugacity amongst others (Obanijesu, 2009).
Oxidation-reduction (or redox) reaction takes place in electrochemical corrosions
with oxidation taking place at anode while reduction takes place at the cathode.
However, spontaneous reactions occur in galvanic (voltaic) cells to produce galvanic
corrosion attack (Figure 2.16) while non-spontaneous reactions take place in
electrolytic cells.
Figure 2.16: Metals attacked by galvanic corrosion (Obanijesu et al, 2010c)
For an electrolytic cell, the anode is positive while the cathode is negative.
Therefore, the anode attracts anions from the solution (Equations 2.5 and 2.6).
However, the anode of a galvanic cell is negatively charged and its spontaneous
oxidation is the source of the cell's electrons or negative charges while the cathode is
its positive terminal.
Anode: eFeFe 22 Equation 2.5
Cathode: 222 HeH Equation 2.6
Apart from the ability of each of these corrosion types to single-handedly collapse a
pipeline, they can also individually or collectively lead to pitting corrosion or Stress
cracking corrosion (SCC) to partially or totally destroy the system.
2.8 Corrosion: Chemistry and Implications on Flow Assurance
Corrosion has been identified to be responsible for almost 50% of pipeline failure in
the industrialized countries (Table 2.20). Corrosion is the chemical or

45
electrochemical reaction between a material, usually a metal, and its environment
that produces a deterioration of the material and its properties (HGMCE, 2004).
The process involves electrolytic action whereby the substances which increase the
concentration of hydrogen ions (H+) such as acids and acid salts stimulate it while
those substances that increase hydroxyl ion (OH-) inhibit it. Pipeline corrosions
could be broadly classified as internal and external corrosions. While the
environmental conditions around the pipeline are responsible for the external
corrosion (Soares et al, 2009), the internal corrosion is mainly caused by the fluid
flowing through the pipeline and the pipe‘s geometry. Corrosion may also be caused
or facilitated by the activities of microorganisms living within or on the pipe wall
(Picioreanu and Loosdrecht, 2002; Reyes et al., 2008).
Table 2.20: Pipeline failure by cause in some developed countries (a DOT, 2005;
b
Cribb, 2003; c Mokrousov, 2008)
Cause Contribution (%)
USAa Canada
b Russia
c
Liquid
Pipeline
Gas
Pipeline
Gas
Pipeline
Gas
Pipeline
Corrosion 19.26 41.25 57 31
Natural forces - - 12
Defective Weld 8.61 - 15
Incorrect operation 3.28 - 5
Defective pipe 4.51 - 8 12
Outside damage 23.36 28.75 4 23
Equipment Malfunction 9.02 11.25
Construction defects 29
Others 31.97 18.75 4
Corrosion of the internal wall of a gas pipeline signifies the presence of significant
partial pressures of CO2 and/or H2S. This occurs when the pipe wall is exposed to
water and contaminants in the gas such as oxygen (O2), dihydrogen sulphide (H2S),
carbon-dioxide (CO2) or chloride ion (Cl-). On a weight percentage or weight
fraction basis, O2 is more dissolved to ordinary steels than either CO2 or H2S (Stress,

46
2003). Although, the probability of having appreciable concentrations of O2 inside a
gas transmission line is apparently quite low, a small partial pressure of O2 can
produce surprisingly high internal corrosion rates in steel pipes than that containing
liquid water.
2.8.1 Chemistry and electrochemistry of corrosion
Electrochemical process involves the transfer of electrons from one chemical species
to another. Metal atoms characteristically lose or give up electrons through oxidation
reaction (Equation 2.7) which takes place at the anode (Nakajima et al, 2008) or
reduction reaction (Equation 2.8) taking place at the cathode (Nakajima and Tajima,
2009).
eAlAl
eFeFe
neMM
3
2
3
2 Equation 2.7
Most metals undergo corrosion in acid solutions that have high concentration of
hydrogen ion ( H ) which reduced to hydrogen gas, 2H through reduction process
(Equation 2.8).
222 HeH
Equation 2.8
For an acid solution having dissolved oxygen, reduction according to Equation (2.9)
may occur (Miah and Ohsaka, 2009) whereas, for a neutral or basic aqueous solution
in which oxygen is dissolved, reduction according to Equation (2.10) is mostly
favored (Xu et al, 2009a).
OHeHO 22 244
Equation 2.9
)(442 22
OHeOHO Equation 2.10
For multivalent ions, reduction may occur by decreasing its valence state through
acceptance of an electron (Equation 2.11) or by totally reducing itself from an ionic
state to a neutral metallic state (Equation 2.12). Two or more of the reduction
processes may occur simultaneously.
)1(n
n MeM Equation 2.11

47
MneM n
Equation 2.12
However, corrosion by chemical reaction does not involve electron transfer. In this
case, the metal is attacked by a diluted acid (e.g HCl) to evolve hydrogen gas
(Equation 2.13).
222 HFeClHClFe Equation 2.13
2.8.2 Classification of corrosion
Corrosion can be generally classified into three major categories while the corrosion
through microbial activities could be the fourth group. The first group belongs to
those that can be readily identified by visual examination; this includes uniform
corrosion, localized corrosion and galvanic corrosion. In the second group are those
that require further examination for identification. They include erosion-corrosion,
cavitations corrosion, fretting corrosion (these three are classified under velocity
corrosion), intergranular corrosion and dealloyed corrosion. The third group which
involves cracking form of corrosion and high-temperature corrosion are those that
can only be confirmed through the use of microscope(s). Another form apart from
these three general groups is the hydrogen ion induced corrosion (Heppner and
Evitts, 2008). Each of these corrosion groups is uniquely initiated.
2.8.2.1 Pitting and Crevice Corrosions
Crevice and pitting corrosions are related because of their familiar mechanisms and
they both require stagnant water, Cl- and O2 or CO2. They are confined to a point or
small area that develops in highly localized areas on the metal surface (Pardo et al,
2008). This results in the development of cavities or ―holes‖ that may range from
deep cavities of small diameters to relatively shallow depressions in the material
(Figures 2.17 and 2.18).
Pitting corrosion is frequently observed in both the sweet and sour fields. It is very
difficult to detect, predict or design against at the plant design stage. Through its
gradual formation, the products from the corrosion cover the cavities, hence, making
the small narrow pit unnoticed. However, this small pit is capable of collapsing the
whole pipeline structure.

48
Figure 2.17: A metal attacked by pitting corrosions (Obanijesu et al, 2010c)
Crevice corrosion is formed by contact with adjacent piece of the same or another
metal with a non-metallic material. When this occurs, the intensity of attack is
usually more severe than on surrounding areas of the same surface (Kennell and
Evitts, 2009). It is mostly formed under a shielded area such as under gaskets,
washers, insulation material, fastener heads, surface deposits, disbonded coatings,
threads, lap joints and clamps.
Figure 2.18: A metal attacked by crevice corrosions (Obanijesu et al, 2010c)
Chloride ions and operating temperature influence pitting formation, thus, offshore
pipelines are more prone to this corrosion type since sea water contains sodium

49
chloride which could be produced with wet gas from the reservoir. Stagnant fluid
inside the tubing can also easily initiate pitting corrosion and crevice attacks,
especially, if particles settle out of the liquid. Stainless steel Type 304 can be
attacked by pitting corrosion inside the sea at 10OC even, at low chloride level, while
Type 316 which is more resistant to pitting can easily be attacked by crevices or at a
slightly increased temperature.
2.8.2.2 Stress-corrosion cracking (SCC)
SCC corrosion (Figure 2.19) can be accelerated by residual internal stress in the
metal or external applied stress. Residual stresses are produced by deformation
during fabrication, by unequal cooling from high temperature and by internal
structural arrangements involving volume change.
Figure 2.19: Three-dimensional reproduction of SCC shape (Itakura et al, 2005)
The steel pipeline is composed of many crystals of about 0.05mm (Itakura et al,
2005; Choi et al, 2009) whose temperature is always kept high to prevent hydrate
formation and/or the liquefaction of some other components during operation. This
may generate irradiation inside the steel especially at a high temperature, thus,
subjecting the material to tensile stress in a corrosive environment.
This problem increases at pH≥8 but decreases at pH≤6 (Guo et al, 2002). When SCC
occurs, its intricate crack shape follows the interface between these grains in a zigzag

50
manner. There can be multiple cracks in the pipeline, thus, making the study of SCC
progression in a pipelength very crucial for the pipe‘s safety assessment.
2.8.2.3 Erosion, Cavitations and Fretting Corrosions
These corrosions occur as a result of high velocity flow of fluid inside the pipe. The
processes of initiation for both erosion and cavitations corrosion have been fully
explained in sections 2.7.1 and 2.7.2.
Fretting corrosion damage (Figure 2.20) is induced by repeatedly moving a load
across a surface at a relatively high velocity (Park et al, 2008). It is experienced at
rough contact surfaces that are exposed to vibration during transportation because
the interface of the two highly loaded metal surfaces will be moving against each
other. The protective film on the surfaces is removed by the rubbing action and
exposes fresh, active metal to the corrosive action of the immediate environment.
This problem is experienced in the oil and gas pipelines as the motion of the fluid
inside the tube causes a lot of vibration due to the contact of the weight of the fluid
with the inner surface of the tubing.
Figure 2.20: Fretting corrosion on metal plates (ILZRO, 2009)
Erosion-corrosion (Figure 2.15) has been rated in the top five most prevalent forms
of corrosion damage in the oil and gas industry (Rajahram et al., 2009). The
industries transporting slurries and other particle-laden liquids in pipes through
offshore and marine technologies spend millions of pounds every year to repair
material damage from this corrosion type (Meng et al, 2007).

51
2.8.2.4 Uniform corrosion of carbon steel
Uniform corrosion (Figure 2.21) is the least damaging form of corrosion in that it is
predictable if the corrosion rate is known. This is a corrosion process exhibiting
uniform thinning that proceeds without appreciable localized attack and commonly
occur on metal surfaces having homogenous chemical composition and
microstructure. As the corrosion occurs uniformly over the entire surface of the
metal component, it can be practically controlled by cathodic protection, use of
coatings or paints, or simply by specifying a corrosion allowance.
Figure 2.21: Uniform corrosion of structural steel (KSC, 2009)
2.9 Factors Influencing Gas Pipeline Corrosion
The nature and extent of gas pipeline corrosion are functions of the gas pH, present
oxidizing agent(s), the system temperature, operating pressure, the fluid velocity, the
pipe wall‘s shear stress, size of available particles, the gas composition and the gas
viscosity amongst others (Maier et al, 2007; Mercier and Barthes-Labrousse, 2009).
2.9.1 pH
Corrosion rate of most metals is affected by pH (Zhao et al, 2008) which promotes
the galvanic corrosion in metals and alloys (Tada et al., 2004). For pH related
corrosions, the corrosion rate of acid- soluble metals such as iron is controlled by the
rate of transport of oxidizers (usually dissolved oxygen) to the metal surface whereas
the amphoteric metals such as aluminum and zinc dissolve rapidly in either acidic or
basic solutions. However, corrosion of noble metals such as gold or platinum is not
appreciably affected by pH. The Hydrocarbon pipelines are susceptible to corrosion–

52
induced stress and stress corrosion cracking at high pH (Guo et al, 2002; Song,
2009).
2.9.2 Oxidizing agents
Oxidizing agents are often powerful accelerators of corrosion. In their study based
on monoethanolamine (MEA) system, Veawab and Aroonwilas (2002) indicated
bicarbonate ion (HCO3−) and water (H2O) as primary oxidizing agents while Stack et
al (2003) revealed oxygen as a contributor to erosion-corrosion in aqueous slurries.
In many cases, the oxidizing power of a solution is its most important single property
in promoting corrosion. When oxygen is involved, there is a rapid reaction between
the O2 and the polarizing layer of atomic hydrogen absorbed on the oxide layer and
this reaction rapidly removes the polarizing layer.
2.9.3 Temperature
Like most other chemical reactions, corrosion rate increases with temperature since
ionic mobility increases with temperature, thus, leading to conductance increase
(Niklasson et al, 2008; Krishnan et al, 2008; Ezuber, 2009). The process temperature
and pressure govern the solubility of the corrosive species in the fluid. These species
include oxygen, carbon-dioxide (or hydrogen sulfide in case of sour field), chlorides
and acetic acid amongst others. From the rule of thumb, reaction rate doubles
between the temperature rises of 20OF to 50
OF. This linear increase stops along the
line partly due to a change in the oxide film covering the surface. Temperature also
has secondary effects through the influence on the solubility of air (O2), which is the
most common oxidizing substance influencing corrosion.
2.9.4 Fluid Velocity
The fluid velocity plays a great role in corrosion rate (Aw et al, 2008; Stack and Abd
El-Badia, 2008; Badiea and Mohana, 2009). When the velocity is very high, the
available particles in the fluid impact upon the inner wall and remove the protective
oxide layer as well as erode the exposed metals. This causes erosion-corrosion with
time. Also, when H2O is involved, water velocity of 30 to 40 ft per second initiate
corrosion since increase in the relative movement between a corrosive solution and a
metallic surface frequently accelerate corrosion.

53
2.9.5 Wall shear stress
Wall shear stress highly influence hydrodynamically induced corrosion such as
erosion corrosion (Boutoudj et al, 2008; Demoz and Dabros, 2008; Chaal et al,
2009). In pipeline industry, natural gas is frequently transferred at turbulent flow in
order to increase the transportation efficiency at a minimized cost. Particles and
other geometrical changes in the flow give rise to higher shear stress though
abrasion. This leads to drag (skin friction) which eventually induced corrosion of the
inner wall by wearing off the protective coatings.
2.9.6 Particle size
The size of the particle traveling with the gas inside the pipeline network plays a
significant role in initiating corrosion (Lau et al, 2008; Pardo et al, 2009). Erosion
and cavitations corrosions are among the identified corrosion types that could be
initiated by the particle size distributions. Niu and Cheng (2008) and Xu et al
(2009b) established that particles are capable of initiating erosion-corrosion by using
sand and Nano-Particle-Reinforced Ni Matrix Composite Alloying Layer
respectively while Obanijesu et al (2010a) established the capability of hydrate
clathrates in gas pipeline to initiate the erosion, cavitation, galvanic and electrolytic
corrosions depending on the formation stage, the point of contact, the gas velocity
and composition.
2.9.7 Chemical Composition and Concentration
Composition and concentration play significant roles in the corrosion rate of a gas
pipeline. While Zhao et al, (2008) established that ion concentrations of a conveyed
fluid aids Stress Corrosion Cracking (SCC), various relationships between corrosion
rates of pipes and the composition and concentration have also been established by
other researchers (Gonzalez-Rodriguez et al, 2008; Hamdy (2008); Skrifvars et al.,
2008; Montemor et al, 2009).
The influence of pH and concentration on corrosion rate is best understood through
electrochemical reaction. At any considered pH, the pipe corrosion rate increases
with concentration of non metallic components of the gas. This is so as the corrosion
behavior of the metallic alloys is governed by a partially protective surface film, with
the corrosion reactions occurring predominantly at the break or imperfection of the

54
partially protective film. The implication is that, the fraction of film free surface
increases with decreasing bulk pH and with increasing fluid non metallic ion
concentration. This is consistent with the known tendency of non metallic ions to
cause film breakdown and the known instability of the metallic hydroxides in
solutions with pH less than 10.5.
2.9.8 The Gas Viscosity
This has been an area where researchers have not really developed, Ricciardiello and
Roitti (1972) was likely to be the most recently available literatures on this area
before Obanijesu et al (2010b). However, science can easily be used to support this
claim. Viscosity is the resistance of a liquid to shear forces and hence to flow
(Obanijesu and Omidiora, 2009). This is a quantity expressing the magnitude of
internal friction in a fluid, as measured by the force per unit area resisting uniform
flow. Thus, the higher the viscosity, the lower the mobility and higher the time of
surface interaction between the fluid‘s properties and the pipe inner surface to
facilitating corrosion initiation.
2.10 Consequences of Pipeline Failures on the Industry
Pipeline failure is the malfunction of the pipe body due to metallurgical or
processing abnormalities. It can be a leak or rupture. Leakage is a small opening,
crack or hole in the pipeline causing loss of pipeline products, but not immediately
impairing the line operation. Small leaks due to fractured or small corrosion holes
often lead to leak rates usually less than 1% of flow and go unnoticed for weeks.
Medium leaks are caused by fractures that remained narrow. This usually takes place
by the worn gaskets and valve stem packing. These leaks are not large enough to
cause a loss of working line pressure. Large leaks result in rapid loss of working line
pressure that generates an alarm to the dispatcher even without a leak detection
system (LDS). However, rupture is the instantaneous tearing or fracturing of pipe
material, this immediately impairs the operation of the pipeline.
The spate of accidents in the pipeline industry has attracted a significant level of
awareness in safety and loss prevention, and has earned considerable public and
regulatory attentions globally. A case study of a typical offshore platform in the
North Sea, UK showed that the amount of gas present in a 150 km long and 0.4 m

55
diameter pipeline at 100 bars could be as much as 637,000 kg (Mahgerefteh et al,
1997). This represents an enormous source of energy release, which in the event of
Full Bore Rupture (FBR) poses the risks of general and extreme fire exposure to all
personnel in open platform areas and also undermines platform safety.
Though, hydrate formation has been established as a flow assurance problem to gas
industry, corrosion is of higher consequences. Apart from the ability of both
problems to collapse the offshore pipeline systems (Gbaruko et al, 2007; Netto et al,
2007; Netto, 2009), corrosion would further deteriorate the integrity of the pipe
material which may necessitate a total replacement (Shipilov and May, 2006; Adib et
al, 2007). The impacts of pipeline failure on the industry could be classified into
economic, safety and environmental consequences.
2.10.1 The Economic Impacts
The economic consequence of pipeline accidents includes the cost of product loss;
the public, private and operator property damage costs, and the cleanup/recovery
cost (Restrepo et al, 2009). Two of the six categories included in a ‗gravity scale‘ are
related to the cost of production losses and the cost of environmental cleanup
(Papadakis et al, 1999). The economic impact of such accident is experienced by
both the consumer and the industry.
2.10.1.1 Economic impacts on the consumers
Raw natural gas from reservoir is normally treated at gas plants with ethanolamine
and diethanolamine amongst other chemicals during the sweetening process before
the final transport to customers. The unrecoverable trace amounts of these chemicals
escape into the product gas stream because of their vapour pressures (Mokhatab et al,
2006). When corrosion takes place within the pipe, these chemicals would react with
the exposed carbon alloyed to form chelation with metals used to construct the
pipeline. The resulting products (Figure 2.22) then travel downstream with the sales
gas to the client terminal (consumers) where, it will be used for cooking and other
required domestic and industry applications.
At the client terminals, the gas often burns with discolorations, with reduction in heat
value and potential health hazard implications. Apart from the significant heat value
loss, cancer and memory loss are few of the resulting health hazards. This will
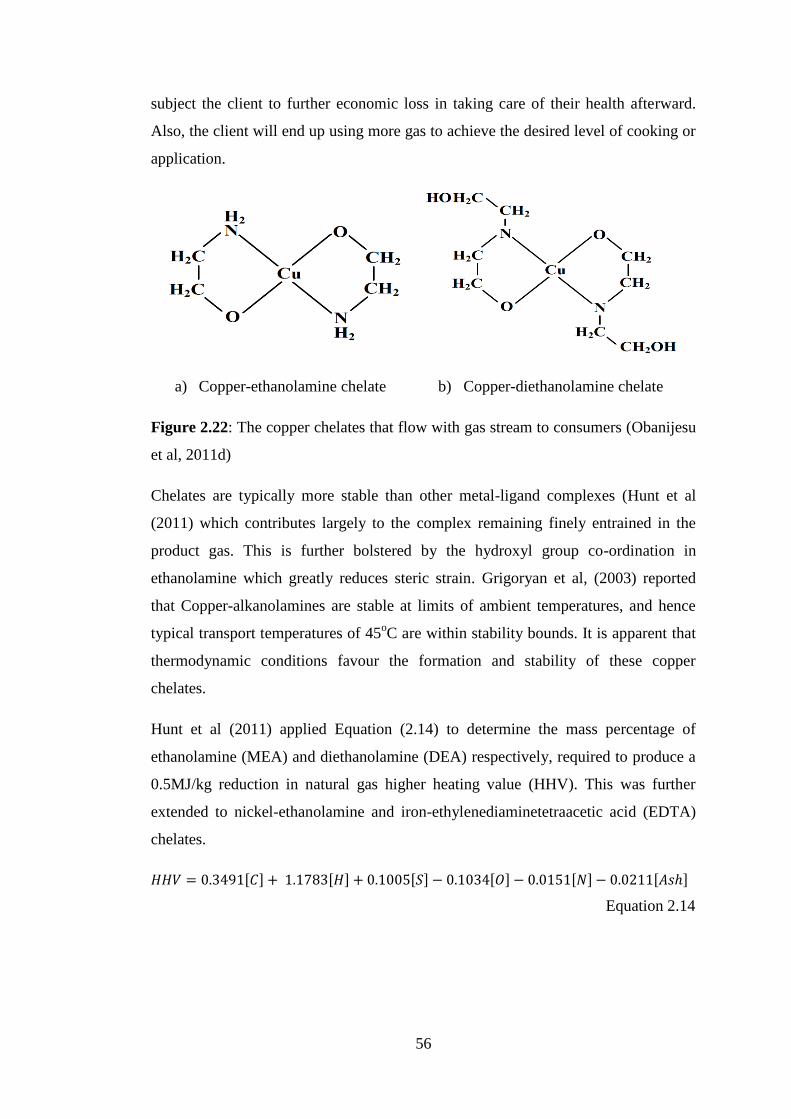
56
subject the client to further economic loss in taking care of their health afterward.
Also, the client will end up using more gas to achieve the desired level of cooking or
application.
a) Copper-ethanolamine chelate b) Copper-diethanolamine chelate
Figure 2.22: The copper chelates that flow with gas stream to consumers (Obanijesu
et al, 2011d)
Chelates are typically more stable than other metal-ligand complexes (Hunt et al
(2011) which contributes largely to the complex remaining finely entrained in the
product gas. This is further bolstered by the hydroxyl group co-ordination in
ethanolamine which greatly reduces steric strain. Grigoryan et al, (2003) reported
that Copper-alkanolamines are stable at limits of ambient temperatures, and hence
typical transport temperatures of 45oC are within stability bounds. It is apparent that
thermodynamic conditions favour the formation and stability of these copper
chelates.
Hunt et al (2011) applied Equation (2.14) to determine the mass percentage of
ethanolamine (MEA) and diethanolamine (DEA) respectively, required to produce a
0.5MJ/kg reduction in natural gas higher heating value (HHV). This was further
extended to nickel-ethanolamine and iron-ethylenediaminetetraacetic acid (EDTA)
chelates.
Equation 2.14

57
2.10.1.2 Economic impacts on the industry
Hydrate prevention costs the gas industry about US$1 million per mile (Jassim and
Abdi, 2008) while the pipelines eventual rupture costs the industry an extra cost on
welding, product loss and loss of production time.
Fingerhurt and Westlake (2000) reported that the total length of high pressure gas
transmission lines in North America alone (USA and Canada) was more than
480,000km, and estimated the outage cost, in case of rupture from any of the
pipelines between $500,000 and $1,000,000 per day. This loss can be recorded for a
rupture from both hydrate and corrosion. However, corrosion presents a worse
scenario by introducing a further cost of assets‘ capital replacement value which can
be estimated by applying the average cost as given by Parker (2004). This costing
method gave the capital replacement cost for 36in and 42in pipelines as $1,767,710
per mile and $1,977,644 per mile respectively with the cost distributed as material
26%, labor 45%, Right of Way 22% and Misc. 7%. The miscellaneous included the
cost on surveying, engineering, supervision, contingencies, allowances, overhead
and filing fees.
Applying this on existing 305,438 km (190,899 miles) of natural gas pipeline in the
United States, additional pipeline replacement costs for USA and Canada as a result
of corrosion are US$337 - US$378 billion and US$193 – US$216 billion
respectively. For offshore productions, these estimations exclude other
considerations such as location, climatic conditions, political situations as well as
specific requirements such as the need for a barge for pipe laying, sea depth and
wave function. In actual fact, Fingerhurt and Westlake (2000) put the total
replacement cost for the whole North American pipelines at over US$3 trillion.
A review on effects of corrosion on US economy showed that corrosion of metals
and alloys cost U.S. companies and consumers approximately $300 billion per year
with about 1% of it ($3bn) coming from the pipeline industry (Battelle, 1996). After
much attempts to reduce corrosion problems, Thompson and Vieth (2003) later put
the new annual cost on corrosion from the same country at $276bn (representing 3%
of annual GDP) with $8.6bn coming from oil and gas transmission pipelines.
Considering this economic trend, the cost implication of corrosion on USA pipeline
industry alone has increase from $3bn to $8.6bn within a short period of 8 yrs (1995-

58
2003). Since 2003 however, the country has embarked on various new gas projects
which have reasonably increased the number and length of existing pipelines.
Globally likewise, there is a sharp increase in the number of onshore and offshore
transboundary pipelines from gas rich countries to those lacking the hydrocarbon due
to increase in population and gas demand. These pipelines have been generally
subjected to conditions favoring various corrosion accidents with related
consequences (Table 2.21). The product loss alone from the pipeline failure of
September 17, 1999 at Ekakpamre, Nigeria was estimated at over $10 billion dollars
(Obanijesu et al, 2006).
Table 2.21: Some global pipeline accidents from corrosion and consequences
(Obanijesu et al, 2010)
Date Location Nature of Accident Damage Caused
03-02-09
19-08-00
08-08-96
04-03-65
Shah Oilfield,
Al Gharbia,
UAE
Carlsbad,
New Mexico
USA
Lively, Texas,
USA
Louisiana,
Tennessee,
USA
Corrosion led to a leakage on a
pipeline carrying 50,000 barrel
of oil per day; thus, releasing
H2S gas to the environment
before explosion.
A 30-in diameter natural gas
pipeline ruptured due to severe
internal corrosion (pitting) and
exploded.
An 8-in diameter LPG pipeline
transporting Liquid butane
burst due to inadequate
corrosion protection.
Gas transmission pipeline
exploded from stress corrosion
cracking.
3 killed by inhaling high
concentration of H2S gas.
12 members of the same
family killed, 3 vehicles
burnt and 2 nearby steel
suspended bridges
damaged. Property and
losses totaled $998,296.
2 men killed, 25 families
evacuated, damages cost
over $217,000.
17 killed.

59
The Varunus Island Explosion of 3rd
of June 2008 offered a perfect case study on the
economic implication of a total pipeline failure. As of then, Western Australia was
consuming approximately one petajoule of gas per day with 35% supply from the
Varanus Island while the remaining 65% was supplied by other North West shelf
companies.
The accident (Figure 2.23) occurred when one pipeline failed and caused an
explosion which severed three adjacent pipelines. This led to stoppage of all
operations at the processing plant and resulted in cutting gas supply to Western
Australia by a third (Logan, 2008). Industries and the general populous were also
asked to reduce their gas and power usage to account for the shortfalls in supply.
Subsequently, all possible gas power stations switched to alternative fuels such as
diesel and coal with associated coordination to ensure supplies of these fuel stocks.
This necessitated the hurried rebuilding of a shattered turbine; also, the mothballed
Muja AB power units and all coal fired power stations that were undergoing routine
winter maintenance were brought online.
Figure 2.23: Veranus Island pipeline explosion (Cutler, 2010)
With industry and household power usage dropping by 28858 megawatt hours,
North West Shelf supplies were increased by 100 terajoules per day while the Verve

60
Energy workers freed a further 100 terajoules of gas for other industry by bringing
the Muja 7, Collie A and Kwinana B coal fired power generators back online.
However, heavy consumers of natural gas had to reduce their production or stop
entirely as related products such as CO2 and N2 from CSBP (a major chemical and
fertilizer producer in Western Australia) were in short supply due to gas interruption.
Small industries were harder hit with many customers receiving little or no gas
supplies. Gas flow from the Varanus Island processing plant was partially restored
by August 8th
. The cost to the Western Australian economy from this incident was
estimated to be AUS$2.5 billion, equating to 0.5% reduction in gross state product
(Eggleston et al, 2008).
2.10.2 Safety consequences
Pipeline blow-outs always endanger human life and subject the pipeline operators
working on the platform as well as the community to severe safety risks which are
predominantly death. Notably is the Bellingham, Wash pipeline accident of June 10,
1999 where 250,000 gallons of gasoline from a ruptured large transmission pipeline
spilled into a nearby creek and ignited. This led to the death of three young
individuals, eight injuries, and over US$45 million worth of property damaged
(PHMSA, 2009).
Also, the pipeline explosion of December 19, 2010 at a Petroleos
Mexicanospumping station in Central Mexico resulted in over 27 deaths, 50 injuries
and destruction of 32 houses.
Again, the Piper Alpha offshore pipeline accident of 6th
July 1988 at North Sea
(Figure 2.24) clearly demonstrated the catastrophic consequence. The accident
started when the failure of a primary propane condensate pump led to an explosion.
Within 20 minutes of the failure, the gas risers (pipes between 24 and 36 inches in
diameter) on the platform carrying gas at 2000 pounds per square inch
(1,406,139.16kg/m2) burst and created inferno. 167 out of the 226 personnel died
with 109 from smoke inhalation (Coombs, 2003). The fire was visible up to 85 miles
away and the heat felt at 1 mile away. Almost the whole production platform melted
to sea level. It was further estimated that the energy released during this tragedy was
equal to 1/5th
of the UK energy consumption at the period. The experience from this

61
accident can never be forgotten in gas industry and it is still regarded till today as the
global worst offshore pipeline accident ever.
A: Before the fire b) During burning
c) Final platform stage d) Memorial status
Figure 2.24: The North Sea Piper Alpha accident (Obanijesu et al, 2010)
Nigeria has a long history of devastating experience from various pipeline accidents.
Over 2000 people were burnt to death in the Jesse pipeline disaster of 15th
December, 1998 (Obanijesu et al, 2006). Consequent upon the death of many parents
in this fire, several children were left orphaned and some parents widowed. Among
the survivors, many suffered severe burns and damaged internal organs as a result of
inhalations of fumes and smoke; thus, becoming liabilities because they were unable
to fend for themselves any longer. In July 2000, another pipeline explosion outside

62
the city of Warri caused 250 deaths while an explosion in Lagos in December 2000
killed at least 60. A pipeline fire incidence at Alagbado in Lagos on December 26,
2006 resulted in over 500 people been burnt to death (Figure 2.25).
Figure 2.25: Human deaths from Alagbado pipeline fire (Obanijesu et al, 2009)
A similar pipeline explosion occurred at Ijegun in Lagos on May 16, 2008 after a
bulldozer struck a pipeline. The fire spread to surrounding homes and schools with
occupants inside. More than 15 homes and 20 vehicles were completely burnt. The
Nigerian Red Cross claimed that over 100 people died (Figure 2.26) with a pregnant
woman and her 4-year-old son among the dead. Eight out of sixteen primary school
students that were trampled upon died the following day at hospital while three
residents were killed after being run over by vehicles whose drivers attempted to flee
the fire zone. Table 2.22 further shows some of the global pipeline accidents that
result into human deaths.

63
Table 2.22: Some global major pipeline accidents (Obanijesu et al, 2010)
Date Location Nature of Accident Damage Caused
05-05-09
Rockville,
USA
Natural gas pipeline explosion.
Homes were evacuated
in a one-mile area of
explosion.
16-05-08
Ijegun, Lagos,
Nigeria.
A bulldozer accidentally struck an
oil pipeline which eventually
exploded.
100 deaths. 15 homes
and 20 vehicles burnt.
01-11-07 Carmichael,
USA
Propane pipeline explosion. 2 deaths, 5 injured.
26-12-06 Lagos,
Nigeria.
A vandalized oil pipeline exploded Over 500 deaths.
30-07-04
Ghislenghien,
Belgium
Explosion of a major natural gas
pipeline.
23 killed, 122 injured.
2003 Chongqing,
China
A gas well blew out releasing toxic
sour gas cloud to the environment.
243 deaths.
21-10-00 Colombia Pipeline explosion. 43 deaths.
10-06-99
Bellingham,
Washington.
A gasoline pipeline ruptured.
250,000 gallons of gasoline
escaped into a creek and resulted
into fire.
3 deaths, 8 injured, over
$45 million property
damages.
21-11-96 San Juan PR Liquid natural gas line explosion
due to employee‘s negligence in
responding to leak.
33 people killed.
09-11-93 Nam Khe
Village, East
of Hanoi.
A 9-year-old boy lit a match while
scooping fuel from broken
underground pipe leading to
explosion
45 deaths.
01-03-98 Ecuador Pipeline explosion and fire at
Ecuador‘s largest oil pipeline.
11 deaths, 80 injured.
18-10-98 Jesse Village
Delta, Nigeria
Oil pipeline explosion while
villagers were scooping fuel from a
ruptured pipeline.
Over 2000 deaths.
04-06-89
Ufa, Russia
The gas leaking from an LPG
pipeline was detonated by two
passing trains.
645 deaths.
03-06-89 Russia
Liquefied natural gas Pipeline
explosion
575 deaths.
23-06-89 Eastern
Pakistan
Gas Pipeline ruptured and
exploded.
12 killed; hundreds
injured.
03-10-89 Gulf of
Mexico
Submerged Gas pipeline exploded. 11 deaths.
28-10-93
Las Tejeria,
Venezuela
Telephone crew laying fiber optic
cable ruptured natural gas pipeline
beneath highway leading to
explosion
36 deaths.
1982 Amoco field,
Canada
A high profile blowout releasing
sour gas for 67 days.
2 human and hundreds
of cattle death.

64
Figure 2.26: Human deaths from Ijegun pipeline accident (Obanijesu et al, 2009)
2.10.3 Environmental consequences
The threats posed by a gas pipeline failure on the environment depend on the quality
and quantity of gas released, operating pressure, failure mode and the immediate
environment. There could be severe damage and debris throw due to stored energy
released by the failure, vapour cloud explosion, release of toxic gases (e.g. H2S,
VOCs, SO2, e.t.c), asphyxiation and thermal radiation, hydrate formation in water
body, dissolution of components, loss of human lives and livestock, climate change
as well as flammability amongst others (Stevens, 2003; Sonibare et al., 2005;
Obanijesu and Macaulay, 2009). A catastrophic failure of pipeline at its usual
operating pressure may cause surface damage within 50 feet of rupture while an oil
and gas pipeline of over 800 mm in diameter and over 40 km long may affect
sensitive ecosystems or change the lifestyle of local populations.
Generally, the impacts are felt in all the four environmental matrices which are the
soil, vegetation, water and air as expatiated below.

65
2.10.3.1 Soil and Vegetation Impacts
A discharge of gas from an underground pipe would drive out the oxygen from the
soil in the vicinity thus killing plants. Large areas of arable land get destroyed as a
result of gas pipeline failure and the resulted fire out-breaks with degree of damage
to soil depending on the level of contamination. The soil becomes less fertile as a
subsequent of nutrients essential to plants growth becoming scarce while those that
are more toxic to plants becoming more available. The effect on soil microorganisms
may persist for several years. This adversely impacts on plant growth rate.
2.10.3.2 Impacts on Water Quality
A failure along a submerged offshore pipeline will strongly release natural gas into
the water body as bubbles with high volume of gas. This generates a plume
(McGinnis et al, 2005) which is guided by four main mechanisms of transport. These
are the vertical bubble transport (bulk flow), vertical turbulent diffusion, dissolution
of components and horizontal advection by ambient currents (Obanijesu and
Mosobalaje, 2008). These gas flow patterns are controlled by laws (including Fick‘s
law of diffusion and Brownian law of motion) to cause hazardous impacts on the
ecosystems. Some impacts on the marine lives are explained below.
The immediate flow pattern upon failure is the vertical bubble transport which is the
transport of gas molecules due to the bulk flow (flux). It is a convective transfer and
governed by principle of mass conservation. Natural gas boils at -162OC, hence, its
release at this rate and condition will result into formation of hydrates within the
water body (Obanijesu and Macaulay, 2009). The hydrates cause problems ranging
from behavioral nature such as fish excitement, increased activity, and scattering in
the water as well as to chronic poisoning depending on the quantity of the gas and
the total period of exposure (Patin, 2004).
When discharged into water body, the water soluble components such as H2S and
CO2 dissolve and are transported into the ocean. The dissolution and stripping are
responsible for the noticeable changes in bubble size in a typical plume. Specifically,
the discharged fluid increases the hydrocarbon content of swamps, streams or rivers,
and also acidifies the water course. Dissolved CO2 indirectly affects seawater

66
temperature, salinity, ice-cover, turbulence and current while all these abiotic effects
have biotic consequences (US DOE, 1985).
The acidified water could be taken up by plants within the watercourse through their
roots to impair their growth. Also, the dissolved acidic gases alter the pH of the sea
water which is eventually taken in by the sea animals; this reduces their reproduction
rate which also reduces their availability for human consumption, thereby leading to
increase in price. Through the bioaccumulation process, man takes in the poisoned
fish and this could be very detrimental to his health.
2.10.3.3 Air Pollution
Due to high pressure of discharge at the point of offshore failure and insolubility of
most of the components, the gas is ultimately released to the atmosphere at a
particular distance either through vertical transport or by water inversion. This
causes air pollution and could further lead to deaths. Typical of this accident is the
Lake Nyos, Cameroon, incidence of August 1986 where an enormous volume of
CO2 was released from a collapsed underwater pipeline to atmosphere by water
inversion. 1700 people and livestock up to 25km away from the point of discharge
were killed (Clarke, 2001). Another example is the Lake Monoun incidence of 1984
where a smaller release of CO2 killed 37 people (Steven, 2000). Air pollution is of
greater environmental concern in pipeline failure because of the nature of transported
fluid. It affects the air quality through climate change, poisoning and fire amongst
others.
2.10.3.3.1 Climate Change
Considering WAGP project as an example, Nigerian natural gas contains between
68% and 90% methane (CH4). Upon offshore failure, it would take millions of years
for the CH4 to oxidize in the water by bacteria (Dickens, 2001). But this is not
achievable considering the pressure at which the gas is been discharged from the
point of failure, hence, it will reach the water surface shortly and the large volume of
CH4 will escapes into the atmosphere.
With 8.4years global mean atmospheric lifetime (Prather et al, 1995), 12years
perturbation lifetime (Schimel et al, 1996) and average transport distance by wind in
the lower atmosphere of 500 – 1000 km per day (NEGTAP, 2001), it is easy to see
67
how the substantial quantity of CH4 will be exchanged between countries in Africa.
Any full bore rupture along the pipelength will negatively impact on the whole
continent if left unattended to within three day.
CH4 is a greenhouse gas (GHG) which aids climate change. The dangers posed by
atmospheric abundance of CH4 which increase from 1520ppb in 1978 to 1745ppb in
1998 (Prather and Ehbalt, 2001) has led to global desired declination observed
annually over the last three decades. Global Warming Potential (GWP) increase in
CH4 production from energy source (in Tg (CH4/yr)) has been estimated at 75 (Fung
et al, 1991), 97 (Hein et al, 1997), 110 (Lelieveld et al, 1998), 89 (Houweling et al,
1999) and 109 (Olivier et al, 1999). Based on its atmospheric burden and climatic
impacts (Alcamo, 1994), CH4 was among the GHGes listed in the Kyoto Protocol of
11 December 1997 and enforced on 16 February 2005. Definitely, any accidental
discharge of natural gas through WAGP project will jeopardize the treaty on the
global climate.
Apart from being a direct threat, CH4 oxidizes in stratosphere with OH, Cl and O
leading to in-situ source of stratospheric water vapor (equation 2.15)
2
.
334 OOHCHOCH
OHCHOHCH 234 …………………… (2.15)
ClCHClCH 33
.
34 HClCHClCH
Oxidation of CH4 is a source of mid-stratospheric H2O and currently causes its
abundance to increase from about 3ppm at the tropopause to about 6ppm in the upper
stratosphere. Water vapor in the lower stratosphere is a very effective GHG. Baseline
levels of stratospheric H2O are controlled by temperature of the tropical tropopause,
a parameter that changes the climate (Moyer et al, 1996; Rosenlof et al, 1997;
Dessler 1998; Mote et al, 1998). Finally, stratospheric ozone depletion increases
tropospheric OH (Bekki et al, 1994; Fuglestvedt et al, 1994) which reacts with CH4
to produce more water vapor. CH4 also reacts with Cl atoms in the troposphere
(Singh et al, 1996) as shown in Equation (2.15).
Climate change impacts negatively on fish population and aquatic life. It was
responsible for the drastic declination in the availability of king crab stock in the

68
Eastern North Pacific which include Eastern Bering Sea and Gulf of Alaska
(Wooster, 1982) and the rapid disappearance of California Sardine (Ueber and
McCall, 1982) amongst others.
2.10.3.3.2 Flammability and VOC Discharge
Natural gas is 35% lighter than air; it therefore dissipates into air to explode or
otherwise burn in the presence of ignition source. The fumes escaping from the fire
are carcinogenic and have other direct and indirect impacts on human health.
The fire resulting from the ignition (Figure 2.27) always introduces VOCs into the
atmosphere. VOCs have been determined to be human risk factors in urban
environment (Sonibare et al, 2005), as well as primary contributors to the formation
of photochemical oxidants (Seguel et al 2012). To reduce anthropogenically
produced O3, and human risk, their (VOCs) presence in the environment must be
reduced (Huang et al, 2012). Human exposure to certain level of some of these
compounds could increase cancer risk (Ramirez et al, 2012) and their existence in
high concentration have been found to have negative impact on outcome of
pregnancy (Yang et al, 2002; Chun-Yuh et al, 2004). Cape (2003) confirmed that
adverse effects of VOCs on vegetation in urban areas cannot be rejected;
reproductive processes (flowering and seed production) were found to be most
sensitive.
Figure 2.27: Resulting fire from Elume pipeline failure (EFR, 2000)

69
Leaf water content and photosynthetic efficiency were identified by Cape et al
(2003) as additional parameters by which impacts of VOCs on plants can be
determined. Water quality can be reduced by VOCs (Johnson et al, 2003) while soil
can equally be affected if their ambient concentrations exceed certain level (Kim et
al, 2001). Benzene, Toluene and Xylene (BTX, some common VOCs) could be of
great risk to the environment if their emissions are not adequately controlled. They
were found to affect luteal function in females exposed to such emissions (Chen et
al, 2000) and Gamo et al (2003) identified them as part of the 12 major
environmental pollutants in Japan. Chronic Benzene exposure may result in DNA
break in bone marrow cells and peripheral blood lymphocytes and decrease the
activities of antioxidative enzymes (Zhongha et al, 2003).
2.10.3.3.3 Release of toxic gas
Toxic gases are release from gas pipeline accidents and could lead to human death
amongst several other hazards. In 1982, a high-profile blow out at an Amoco well in
Western Canada spewed sour-gas cloud for 67 days, killing two workers and
hundreds of cattle. In 2003, a blown out gas well near the city of Chongqing in
Central China clouded the environment and the released toxic gas killed 243 people
through inhalation. Hydrogen sulfide (H2S) is a corrosive material that is frequently
associated with pipeline failure at sour fields, the gas combines with other chemicals
in a pipeline to produce microbial reduced corrosion (tiny cracks that are not
detectable with the naked eye but can leak deadly quantities of gas). H2S exists in
many gas fields especially in Asian countries such as India, China, Pakistan, etc.
Noteworthy is the Shah natural gas field in India that contains up to 30% H2S.
Similar fields with such high sour gas are Bah, Asab and the offshore Hail fields (all
in India). The H2S gas is heavier than air (OSHA, 2005) and can travel along the
ground to easily cause respiratory failure and brain damage even at low
concentration. The threshold for human tolerance to this gas is very low. It is
estimated to be less than 20ppm (GAEI, 2009) and the fatality of the gas as a killer
has been recorded to be high worldwide.
Conclusively, the impacts of pipeline failure on the four environmental matrices
(soil, water, air and vegetation) are interwoven and can only be appreciated by

70
considering real-life scenarios. Some of the existing and projected scenarios are
discussed below.
Many of the existing and proposed gas pipelines are routed through critical wildlife
and wild lands. An example is the $2.23billion worth 3056-kilometres-long Bolivia-
Brazil pipeline. The 20 year contract pipeline is expected to transport 8 million m3
for the first 7 years and l6 million m3 for the remaining 13years (Pató, 2000). The
pipeline runs through the Amazon River Basin which contains the world‘s largest
tropical forest and almost half of the planet‘s terrestrial biodiversity. This is the
largest basin in the world and covers about 4,195 miles long and 2,720,000 square
miles in area. Specifically, the river basin includes 15,000 tributaries and sub-
tributaries, four of which are in excess of 1,000 miles long each. Any failure from
such pipelines will result in release of toxic gas or fire which in addition to affecting
the community living could add to the destruction of the tropical ecosystems, loss of
species and specimens, degradation of soil, water, air and destruction of basic
infrastructures. Most importantly, it could add to the extinct of this wildlife.
The Niger-Delta region of Nigeria is another perfect case study to showcase the
environmental consequences of pipeline failure. Nigeria is the world‘s 6th
largest oil
producer and 7th
for natural gas with an average production rate of 2.5 million barrels
per day and 4 billion cubic feet per day respectively. Her proven hydrocarbon
reserves had been estimated at 35 billion barrels of crude oil and 5.24 trillion cubic
meters of gas, while her undiscovered gas reserves was estimated at 8.5 – 16.99
trillion cubic meters (Oyekunle, 1999; Gbenga Biobaku & Co., 2008). However,
these resources that account for over 90% of the country‘s revenue are located in the
Niger-Delta region (Sonibare and Akeredolu, 2006), thus, majority of the existing
pipeline networks in Nigeria are located in this region. The Niger-Delta region is
described as one of the largest wetlands in the world covering an area of over 70,000
square kilometers (Groundwork, 2003) with a number of ecological zones that range
from sandy coastal ridge barriers, brackish or saline mangrove, freshwater,
permanent and seasonal swamps, forests as well as lowland rain forests. The total
population of the region is over 30 million people in long settled communities
spreading through nine states of the Nigerian federation, this accounted for about
20% of Nigeria‘s total population. The population density of the region is also
among the highest in the world with 265 people per kilometer squared. Fishing,

71
hunting and subsistence agriculture are the major occupation of the people while the
oil and gas industry is the major industrial sector. Some of the recorded pipeline
failures (Table 2.23) included the Jones Creek of March 27th, 1998 where a pipeline
failure spilled 840,000 barrels of crude oil into the environment (Doyle, 2002). In
1998, a pipeline leakage in Bayelsa State spilled 800,000 barrels of oil into the
nearby farmlands and rivers. On 19th
June 2003 also, a pipeline failure at Onicha
Amaiyi-Uhu Village of Abia State caused a fire outbreak where over 200 deaths
were recorded while the only drinking water serving the village was adversely
polluted (Akinola, 2004). Again, Mobil Producing had a pipeline failure in 1998 that
discharged 840,000 barrels of crude into the environment with adverse impact on the
soils in the communities near Qua-Iboe. The spill completely extinguished the local
fauna and flora including periwinkles – a major food source for the local people.
Furthermore, a typical product loss from a pipeline accident in Nigeria resulted in
contaminated soil with clay (34%), gravel (5%), heavy soil (16%), peat (12%), sand
(6%), and others (18%) of average composition. 4.7% of the product loss resulted in
ignition (Advantica, 2002; Onianwa, 1995).
Generally, most of the farmlands in Niger-Delta region can no longer produce good
harvest and the ecosystem has equally been negatively affected as a result of
environmental degradation arising from numerous pipelines failures and perpetual
gas flaring. Fishing is no longer lucrative for the same reason and strange diseases
that defy medical explanations are emerging.

72
Table 2.23: Some major pipeline accidents in Nigeria and consequences (Obanijesu
et al, 2006)
Date Location Nature of Accident Damage caused
15-04-04 Obeakpu
village,
Rivers State
Shell pipeline vandalized
by youths resulting into
fire
15 deaths. 13 injured.
26-09-03 Atlas cove,
Lagos
Saboteur resulting to fire Some injured.
29-08-03 Gio Village,
Rivers State
Shell ruptured crude oil
pipeline caught fire
Farmlands destroyed. The only
river polluted. The village
covered with smoke and soot.
19-06-03 Onicha
Amaiyi-
Uhu, Abia
State
Fuel scooping from a
vandalized pipeline
resulted into fire.
Over 200 deaths. Iyi-Eruru, the
only drinking water polluted.
12-02-02 Amukpe,
Delta State
NNPC pipeline leaking
from valve resulted into
fire
4 deaths.
2001 Atlas Cove,
Lagos State
Leaking PPMC pipeline
resulted into fire
500 deaths.
Dec 2000 Lagos Pipeline explosion Over 60 deaths.
Nov 2000 Ebute-Ero,
Lagos State
Pipeline failure resulted
to fire
Over 70 deaths.
30-11-00 Lagos A fractured pipeline
caught fire near a fishing
village
50 deaths.
08-11-00 Elume,
Delta State
Fire erupted from PPMC
pipeline that leaked for 4
months.
Several communities affected.
Farmlands, rivers and aquatic
lives destroyed. Ibada-Elume
bridge collapsed. The stream
polluted with diesel. NEPA
transmission line burnt/cut.
July 2000 Warri-
South, Delta
State
Fuel scooping from a
leaking pipeline resulted
into explosion and fire
40 deaths.
July 2000 Ethiope-
West, Delta
State
Fuel scooping from a
leaking pipeline resulted
into explosion and fire
15 deaths
10-07-00 Egborode,
Delta State
Ruptured Pipeline burst
into fire
3000 death. Omugba, the only
water source polluted. Over 30
km affected. Farmlands, forest
and crops roasted
July 2000
10-07-00
July 2000
Warri City,
Delta State.
Adeje, Delta
State
Okpe, Delta
State
Pipeline Explosion
A damaged oil pipeline
resulted into fire.
Fuel scooping from a
leaking pipeline resulted
into explosion and fire
250 deaths
Over 300 deaths.
230 deaths. 30 missing.
Farmlands destroyed

73
Table 2.23 (Contd.)
Date Location Nature of Accident Damage caused
July 2000 Umuichichi/
Umunigbod
e, Abia
State
Pipeline failure resulted
into fire
Over 50 deaths.
July 2000 Iffie/Ajala,
Delta State
Pipeline failure resulted
into fire
Over 80 deaths.
09-07-00 Oviri Court,
Delta State
Vandalized pipeline
resulted into fire
Over 300 deaths.
Jun 2000 Ogwe-Asa,
Abia State
Pipeline failure resulted
into fire
Undetermined number of
deaths.
Mar 2000 Adeje
Village,
Delta State
Pipeline failure resulted
into fire
250 deaths.
14-03-00 Osisioma
Ngwa
Village,
Abia State
Pipeline failure resulted
into fire
50 deaths.
Jan 2000 Ogwo, Abia
State
Vandalized pipeline burst
into fire
Several lives lost
26-12-99
to
Apr 2000
Adeje
Village,
Delta State
Fuel pipeline leaked
continuously for over 4
months
Destruction of farmland. The
smell of petrol in air made
breathing difficult. This
eventually resulted into catarrh
and cough.
17-09-99 Ekakpamre,
Delta State
Ruptured Shell BP
pipeline caught fire.
Lives, animals, fishes and
properties destroyed. River and
land polluted.
Jun 1999
Oct 1998
17-10-98
27-03-98
1998
Aketedo,
Lagos
Jesse Town,
Delta State
Idjerhe,
Delta State
Jones Creek
Bayelsa
Pipeline failure resulted
into fire
Explosion and fire while
scooping fuel from
NNPC vandalized
pipeline
Leaking pipeline caught
fire.
Pipeline failure
Pipeline failure
30 deaths.
Over 1200 deaths. Farmlands,
trees, forests, crops and fauna
roasted. Pollution of river
body.
Over 500 deaths. Lives,
farmlands, houses and other
properties destroyed.
840000 barrels of crude spilt
into the environment.
800000 barrels spilt into the
environment

74
2.11 Corrosion inhibition
Various types of inhibitors are being applied by pipeline industry to minimize
corrosion along the internal wall of pipelines during gas transport. These inhibitors
are generally organic and inorganic in nature (Ryu and Lee, 2012; Teryusheva et al,
2012). They include hexamine (Vashi and Naik, 2010), phenylenediamine (Abd El
Rehim et al, 2010), dimethylethanolamine (Muller and Fischer, 2006), nitrites (Loto,
2012), cinnamaldehyde and condensation products of aldehydes (Kandepi and
Narender, 2012; Seiad et al, 2012), amine (imines) (Khaled et al, 2005; Aiad et al,
2011), chromates (Sangeetha et al, 2011), phosphates, hydrazine and ascorbic acid
amongst others (Rani and Basu, 2011).
The suitability of each chemical for a task in hand depends on many factors such as
the material of the pipeline under consideration, the nature of the substances they are
added into and the operating conditions such as temperature and pressure. The
inhibitors could be anodic in nature or cathodic, the anodic inhibitors form a
passivation layer on the metal surface thus, preventing its oxidation while cathodic
inhibitors retard the corrosion by inhibiting the reduction of water to hydrogen gas.
However, corrosion inhibitors have surfactants properties and some surfactants have
been established to promote hydrate by increasing the gas content and the formation
rate (Zhong and Rogers, 2000; Ricaurte et al, 2012).
2.12 Project Focus and other Contributions to knowledge
Hydrate formation cannot be totally prevented along the offshore gas pipeline due to
various favourable thermodynamic conditions. As mentioned in section 2.6, these
hydrates have been established by Obanijesu et al (2010; 2011) to be able to initiate
corrosions along the pipelength. Also, corrosion inhibitors are equally applied to the
gas stream in order to minimize corrosion during the transportation; however, the
corrosion inhibitors have some surfactants properties in nature. Surfactants have
been established to be hydrate promoters through various studies, therefore, there is
may be a possibility for these surfactant properties of corrosion inhibitors to aid
hydrate formation. However, all the reported research has not been studying this
possibility, hence the uniqueness of this work. This work addressed these issues
through various laboratory investigations. Once established, it means that the gas

75
industry is directly engaged in-between these two flow assurance problems. Efforts
to solve one will conveniently promote the other, hence, the need to find a way to
break away from the cyclic problems. This study further investigated the application
of some gases to reduce the hydrate formation temperature. Any achievement on this
will go a long way in minimizing hydrate-corrosion problems for the industry. This
will help to save millions of dollars for the industry each year, increase production
time which will lead to more profitability, reduce the environmental and safety risk
of the operation thereby improve the operational conditions of the pipeline industry.

76
3. Corrosion Inhibitors as Hydrate Promoters
3.1 General Background
In response to the flow assurance issue raised in Chapter 2.12, this chapter properly
investigated the use of corrosion inhibitors to aid the promotion of gas hydrate
formation during the natural gas transport through offshore (underwater) pipelines.
This investigation is divided into two separate studies. The first study which is
reported in this chapter, investigated the ability of corrosion inhibitors to promote
hydrate formation along deepwater gas pipeline. The study, carried out at 100bar and
500ppm in a cryogenic sapphire cell at static condition involved the use of five
different corrosion inhibitors with different sizes, structures, active functional
groups, and affinity for water molecules. This study is significant since there is no
existing literature on it. The results obtained established the need for further
investigation in this research. This further investigation is reported in chapter four.
3.2 Introduction
Inhibition of corrosion along the inner wall of pipelines during natural gas
transportation is a major investment in the gas industry due to the implications of
corrosion problems on flow assurance. Corrosion has been established to be
specifically responsible for 57% of oil & gas pipeline ruptures in Canada (Cribb,
2003) and about 50% of worldwide pipeline failures with a replacement cost of
about $1,767,710 and $1,977,644 per mile for 36‘ and 42‘ pipelines respectively
(Parker et al, 2004). In 1995 alone, corrosion of metals and alloys cost U.S.
companies and consumers approximately $300bn with 1% ($3bn) coming from the
pipeline industry (Battelle, 1996); this cost increased for pipeline industry within the
same country to $8bn by 2003 (Thompson and Vieth, 2003).
Australia with good quality of natural gas (Table 3.1) is susceptible to sweet
corrosion. Millions of dollars are annually invested on corrosion inhibition through
chemical injections into the flow lines during the gas transportations and sponsorship
of various researches to improve the performance of these chemicals.
Corrosion inhibitors are generally organic and inorganic in nature. The suitability of
each chemical for a task depends on many factors such as the pipe‘s material of

77
construction, the nature of the substance that the inhibitor is added into, the gas
composition and the operating conditions such as temperature and pressure. The
inhibitors could be anodic in nature or cathodic. While the anodic inhibitors form a
passivation layer on the metal surface thus preventing its oxidation, the cathodic
inhibitors retard the corrosion by inhibiting the reduction of water to hydrogen gas.
However, most of these inhibitors have similar chemical properties and structures to
the established hydrate formation promoters in gas pipelines.
Table 3.1: Some Australian gas field compositions at platform separators (Pack, 2011)
Component North West Shelf gas (mol %) Timor Sea gas (mol %)
Methane 84.120 79.543
Ethane 4.282 8.137
Propane 1.733 1.746
i-Butane 0.345 0.158
n-Butane 0.532 0.133
i-Pentane 0.213 0.023
n-Pentane 0.193 0.012
n-Hexane 0.132 0
Carbon dioxide 2.513 6.146
Nitrogen 5.938 4.102
Hydrate formation along offshore gas pipelines is always aided by the favourable
thermodynamic conditions of the producing environment, which are the gas
transportation at a very high pressure and the low deepwater temperature of about
4oC. With the presence of these conditions, the low paraffinic homologous
composition of the gas (C1-C4) and/or the impurities present in the gas (such as H2S,
CO2, etc) combine(s) with the available water vapour at the liquid/gas interphase in
the presence of weak Van der Waals forces to form hydrates. If not quickly removed,
the hydrate grows along the line and blocks the inner orifice of the pipe, hence,
leading to pressure build-up along the line and eventual rupture. Hydrates, which
have been costing the gas industry millions of dollars annually on prevention have
been established to be promoted by surfactants (Karaaslan and Parlaktuna, 2000;
Mandal and Laik, 2008). Some of the established hydrate promoters with surfactant

78
properties include tetra butyl ammonium chloride (Prasad et al, 2009) and Tetra-n-
butyl ammonium bromide (Sun et al, 2008).
Of the five surfactants‘ classifications, the cationic surfactants are the most
expensive due to the high pressure hydrogenation reaction carried out during their
synthesis. However, due to their ability to adsorb on negatively charged substrates to
produce antistatic and hydrophobant effects, they are of most value as corrosion
inhibitors. Technically, it is observed that most of the corrosion inhibitors used in the
gas fields either belong to the cationic surfactant group or have similar chemical
structures with some members in the group.
Several studies have been carried out to investigate the properties and efficiencies of
various corrosion inhibitors (Bentiss et al, 2000; Aljourani et al, 2009) but none of
the existing literatures have investigated the ability of these chemicals to promote
hydrate formation, hence, the significance of this study. This study investigated the
possibility of corrosion inhibitors to promote hydrate formation along deepwater gas
pipelines. Five chemicals from the most regularly used inhibitors for sweet
corrosions in gas fields (Table 3.2) are investigated due to its significance since
carbon dioxide (CO2) corrosion is caused by carbonic acid (H2CO3) and remains one
of the major problems associated with the oil and gas industry (Marco et al, 2001).
Table 3.2: The list of inhibitors used for the study
Inhibitor Abbreviat
ion
Molecular Formula Mol. Wt.
(g/mol)
2-mercapto pyrimidine MP C4H4H2S 112.15
Cetylpyridinium
chloride
CPC C21H38NCl.H2O 358.07
Dodecylpyridinium
chloride
DPC C17H30ClN 283.88
Thiobenzamide TB C6H5CONH2 121.14
Benzl dimethyl
hexadecylammonium
chloride
BDHC CH3(CH2)15N(CH3)2CH2C6H5.Cl 396

79
2-mercaptopyrimidine (MP) is a derivative of Pyrimidine. Pyrimidine is a
heterocyclic compound containing nitrogen atoms at positions 1 and 3 in six-
membered ring structure molecule. Nandeesh and Sheshadri (1991) reported the
corrosion inhibitory effect of MP on copper. Cetylpyridinium chloride (CPC) is a
cationic quaternary ammonium compound with anti-microbial properties and an
IUPAC naming of 1-Hexadecylpyridinium chloride. It is a white powder with 80-
83oC as melting point. The inhibitory effect of CPC on acid corrosion of low carbon
steel was studied by Atia and Saleh (2003). Dodecylpyridinium Chloride (DPC) is a
Heterocyclic Quarternary Ammonium Salts and cationic surfactant that undergoes
complex formation with multicharged anionic planar substances (Murakani, 2004).
Thiobenzamide (TB) is a sulphur-containing organic compounds used as a corrosion
inhibitor (Zcan and Dehri, 2004). Finally, Benzyl dimethyl Hexadexyl Ammonium
chloride (BDHA) is a Quaternary ammonium compounds with colour ranging from
white to creamy crystalline powder and the melting point of 54-58oC. It is freely
soluble with pH of 6.0-8.5 (10% solution), non-reactive, slightly inflammable but
stable under ordinary conditions. Marco et al (2001) studied the adsorption behavior
of this chemical as a corrosion inhibitor on mild steel in CO2 saturated brine media.
3.3 Methodology
3.3.1 Reagent, Materials and Equipment
Natural gas containing 20% CO2 (Table 3.3) was prepared by the BOC Pty Australia.
The industrially prepared specific composition was necessary to maintain constant
composition throughout the experimentation period. Purified water was obtained
from a Milli-Q†-system (MQ-H2O). MQ-H2O is double-distilled, ultrapure
laboratory grade water that is filtered and purified by reverse osmosis method.
The five inhibitors were prepared from their various fresh stocks at CORR_CERT
centre of Curtin University and the experiments were conducted at static condition
inside a cryogenic sapphire cell (Figure 3.1) in the Clean Gas Technology Section of
Curtin University, Perth, Australia. The cryogenic sapphire cell equipment is made
up of piston pump, pneumatic pump, sapphire cell unit, valves, two cameras and
other fittings. The equipment was manufactured by ST (Sanchez Technology) France
and operates at a temperature range of -160 o
C – 60 o
C (with accuracy of ± 0.10oC)

80
and pressure range of 1bar – 500bar (with accuracy of ± 0.5bar). The specified
accuracies were given by the manufacturers with the equipment.
Table 3.3: Composition of the studied natural gas
Component Concentration (%)
CH4 70.90
C2H6 5.00
C3H8 3.00
n-C4H10 0.94
n-C5H12 0.10
N2 0.06
CO2 20.0
Figure 3.1: Schematic of the sapphire cell (Sucortseva et al, 2009; Obanijesu et al,
2012a)
The sapphire cell unit (Figure 3.2) is an inner glass cell of 60ml for liquid/gas
interaction and has a magnetic stirrer which could be regulated to a desired speed. A
thermocouple is screwed to the top of the cell to read the gas phase temperature (or
TOP TEMPERATURE) and another to the bottom to read the liquid phase
temperature (or BOTTOM TEMPERATURE) during an experiment. For each
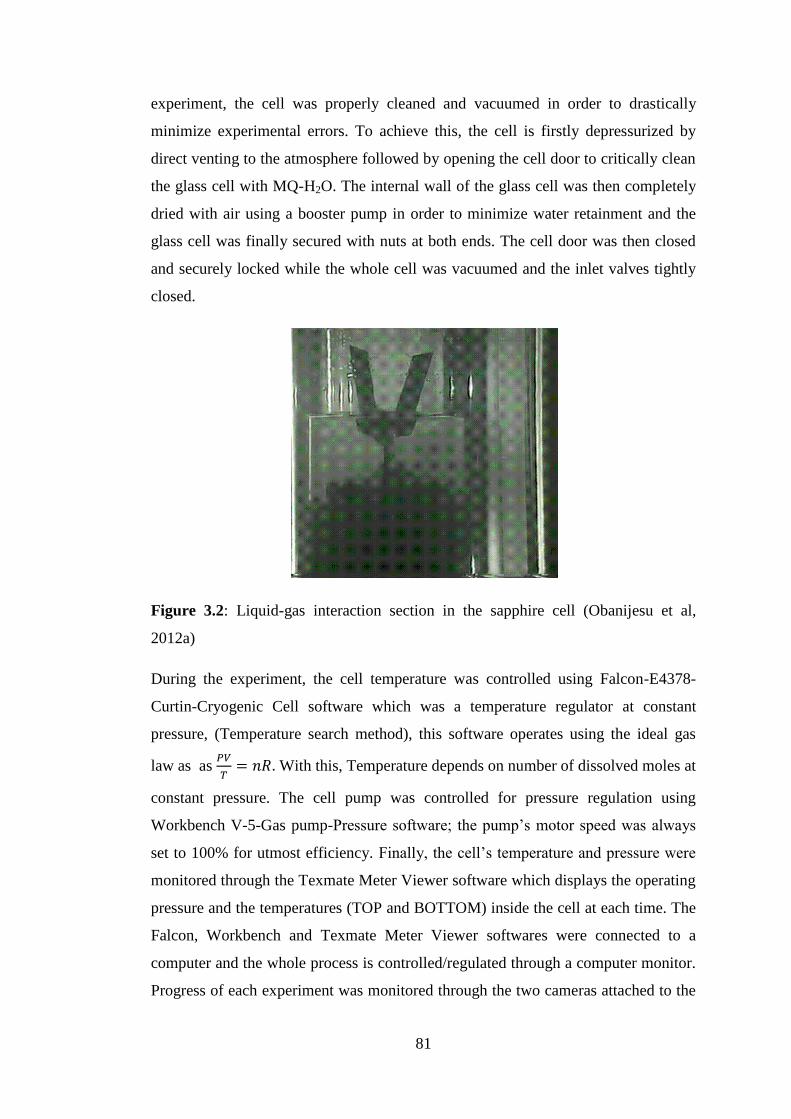
81
experiment, the cell was properly cleaned and vacuumed in order to drastically
minimize experimental errors. To achieve this, the cell is firstly depressurized by
direct venting to the atmosphere followed by opening the cell door to critically clean
the glass cell with MQ-H2O. The internal wall of the glass cell was then completely
dried with air using a booster pump in order to minimize water retainment and the
glass cell was finally secured with nuts at both ends. The cell door was then closed
and securely locked while the whole cell was vacuumed and the inlet valves tightly
closed.
Figure 3.2: Liquid-gas interaction section in the sapphire cell (Obanijesu et al,
2012a)
During the experiment, the cell temperature was controlled using Falcon-E4378-
Curtin-Cryogenic Cell software which was a temperature regulator at constant
pressure, (Temperature search method), this software operates using the ideal gas
law as as
With this, Temperature depends on number of dissolved moles at
constant pressure. The cell pump was controlled for pressure regulation using
Workbench V-5-Gas pump-Pressure software; the pump‘s motor speed was always
set to 100% for utmost efficiency. Finally, the cell‘s temperature and pressure were
monitored through the Texmate Meter Viewer software which displays the operating
pressure and the temperatures (TOP and BOTTOM) inside the cell at each time. The
Falcon, Workbench and Texmate Meter Viewer softwares were connected to a
computer and the whole process is controlled/regulated through a computer monitor.
Progress of each experiment was monitored through the two cameras attached to the
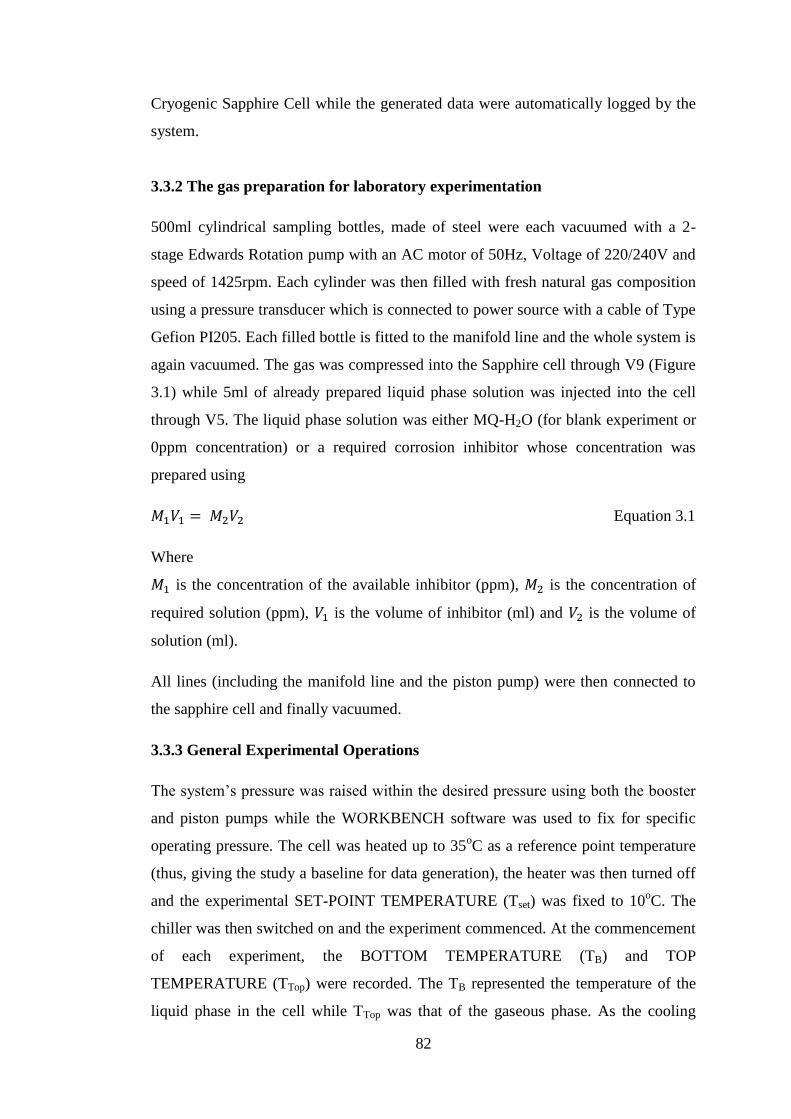
82
Cryogenic Sapphire Cell while the generated data were automatically logged by the
system.
3.3.2 The gas preparation for laboratory experimentation
500ml cylindrical sampling bottles, made of steel were each vacuumed with a 2-
stage Edwards Rotation pump with an AC motor of 50Hz, Voltage of 220/240V and
speed of 1425rpm. Each cylinder was then filled with fresh natural gas composition
using a pressure transducer which is connected to power source with a cable of Type
Gefion PI205. Each filled bottle is fitted to the manifold line and the whole system is
again vacuumed. The gas was compressed into the Sapphire cell through V9 (Figure
3.1) while 5ml of already prepared liquid phase solution was injected into the cell
through V5. The liquid phase solution was either MQ-H2O (for blank experiment or
0ppm concentration) or a required corrosion inhibitor whose concentration was
prepared using
Equation 3.1
Where
is the concentration of the available inhibitor (ppm), is the concentration of
required solution (ppm), is the volume of inhibitor (ml) and is the volume of
solution (ml).
All lines (including the manifold line and the piston pump) were then connected to
the sapphire cell and finally vacuumed.
3.3.3 General Experimental Operations
The system‘s pressure was raised within the desired pressure using both the booster
and piston pumps while the WORKBENCH software was used to fix for specific
operating pressure. The cell was heated up to 35oC as a reference point temperature
(thus, giving the study a baseline for data generation), the heater was then turned off
and the experimental SET-POINT TEMPERATURE (Tset) was fixed to 10oC. The
chiller was then switched on and the experiment commenced. At the commencement
of each experiment, the BOTTOM TEMPERATURE (TB) and TOP
TEMPERATURE (TTop) were recorded. The TB represented the temperature of the
liquid phase in the cell while TTop was that of the gaseous phase. As the cooling

83
progressed, changes in the TTop, TB, and AIR BATH TEMPERATURE (TAB) were
automatically logged (in milliseconds) by the Falcon software for retrieval after each
experiment. Other external observations such as the interphase condition (clear or
cloudy), the point when the wall of the sapphire cell started turning (or fully turned)
cloudy; the temperature where the first hydrate particle was formed, the
agglomeration, growth and behaviour; the foaming properties, the point where the
stirrer stops rotating due to complete hydrate blockage and the reduction rate of the
liquid volume in the cell, were recorded into a log-book. These information points
were also recorded through the video cassette recorder (VCR) embedded into the
computer software for the study. At the end of each experiment, the hydrate
formation temperature was recorded while the automatically logged data were
downloaded.
3.3.4: Experimental Procedure
The experiments were conducted at 100bar. Before the commencement of the
experiments, HYSYS software was used to investigate the compositional phase
behavior of the gas at 100 bar for various temperatures. This was to investigate if the
gas will remain gaseous at a very low temperature and maintain a constant
composition throughout the study. This was important since the experiments were to
be conducted at winter period; at a very low temperature, CO2 gas can undergo
partial condensation to give the gas mixture different composition at different
experiment based on the environmental conditions.
HYSYS software was also used to predict the formation temperature of the gas
composition at 100bar to give a rough formation temperature point for the blank
studies in order to save time during the experiment. A blank experimental study was
carried out to establish the hydrate formation temperature point. This was conducted
by introducing 1200ml of the gas mixture through the manifold into the system and
then pressurized with 5ml of MQ-H2O (liquid phase) in the 60ml sapphire cell at
100bar while the temperature was gradually reduced till the first point where hydrate
was formed. The gas/liquid mixture in the cell represents blank mixture. The value
from this experiment served as the baseline temperature (TBlank).
After establishing the hydrate formation temperature at blank condition, 500ppm of
MP was prepared using Equation (3.1) to form the newly desired mixture of liquid

84
phase (blank+inhibitor). 5ml of the prepared 500ppm solution was injected into the
sapphire cell through V5 while 1200ml of the gas was compressed in through V9
and the experiment repeated at 100bar till hydrate is formed, this generate a new
formation temperature (TNew). This same experimental procedure was repeated for
the other inhibitors, one at a time. Deviation in temperature (TDeviation) was obtained
by comparing the (TBlank) with (TNew). The difference in value for each showed how
much the inhibitor impacted on the formation temperature along the offshore gas
pipeline.
To evaluate the performance of the equipment and ascertain accuracy of the
generated experimental data, the blank study was repeated three times while some of
the experiments (with inhibitors) were selected at random for replication; it was
observed that the same results were obtained. Fluid leakages were also prevented
during the experimentations in order to minimize errors; this was done by threading
a Teflon tape along the outlet part of each valve and soap tested before starting the
experiment. Furthermore, parallax error was avoided during the preparation of liquid
phase solutions. Again, there was no source for the liquid head in the cell to fluctuate
throughout the experiments. Statistical analysis on the generated data gave the
maximum experimental error of 1.299%; this clearly showed that the data obtained
were accurate within the limits of experimental errors since the probability limit
(confidence level) is above 95%.
3.4 Results and Discussions
3.4.1 Promotion of hydrate formation
The deviation in the formation temperature for all the investigated inhibitors was
calculated using Equation (3.2) and the results plotted as shown in Figure 3.3.
TDeviation = Equation 3.2
Where
is the Formation temperature for the blank experiment and is the
Formation temperature for (blank + Inhibitor).
From Figure 3.3, it is established that corrosion inhibitors generally promote hydrate
formation along deepwater natural gas pipelines by increasing the formation

85
temperature. This development is best explained through their surfactant and
hydrogen bonding properties.
Figure 3.3: Hydrate formation temperature trend for the investigated inhibitors
3.4.1.1 Effects of the inhibitors’ surfactant properties on formation temperature
It was not surprising that all the investigated corrosion inhibitors aided hydrated
formation since all corrosion inhibitors are surfactants and surfactants have generally
been established to be hydrate promoters (Sun et al, 2003b; Gayet et al, 2005; Wu et
al, 2011). A surfactant (also known as "surface-active agent") is a chemical that
stabilizes mixtures of hydrocarbon and water by reducing the surface tension at the
interface between the fluids‘ molecules. Because the fluids do not dissolve in each
other, the present surfactant keeps the entire fluids mixture from separating into
layers, thus, affecting surface characteristics of the system by increasing the contact
of the two materials involved (wettability). There are generally five types of
surfactants which are anionic, non-ionic, amphoteric, polymeric and cationic
surfactants (Huntsman, 2010) with their production rates and utilization shown in
Table 3.4.
Corrosion inhibitors are mostly cationic surfactants. The cationic surfactants are
more expensive than (and hence, rarely used compared to) the anionic surfactants
due to the high pressure hydrogenation reaction carried out during their synthesis.
However, due to their ability to absorb on negatively charged substrates to produce
antistatic and hydrophobant effects, they are of most value as corrosion inhibitors.
14.5
15
15.5
16
16.5
17
MP CPC DPC TB BDHC
Form
atio
n t
em
pe
ratu
re (
oC
)
Inhibitor
Concentration = 500ppm; Pressure = 100bar
Blank
Blank + Inhibitor

86
Table 3.4: The surfactant types and their world production rates (Salager, 2002)
The Surfactant Type World Production (%)
Anionic 50
Nonionic 45
Others 5
Cationic surfactants dissociate in aqueous solution into anion and cation but exhibits
positively charged head groups and have anti-static properties (Salagar, 2002). Anti-
static property of a material is its ability to minimize the generation of static charges
without depending upon the material‘s resistivity (ESD, 2009). Large proportion of
this surfactant group corresponds to nitrogen compounds such as fatty amine salts
and quaternary ammoniums, with one or more long chain of the alkyl type often
coming from natural fatty acids. Karaaslan and Parlaktuna (2000) experimentally
investigated the effects of surfactants on hydrate formation kinetics and established
that the hydrate formation rate is increased by anionic surfactants at all
concentrations while cationic surfactants increase the formation rate at low
concentrations; whereas, corrosion inhibitors (which are also cationic surfactants) are
generally introduced at low concentrations into the gas stream during transportation
through pipelines, thus, behaving as proposed by Karaaslan and Parlaktuna (2000).
3.4.1.2 Contributions of the material orientation
Surfactants are amphiphilic substances by exhibiting double affinity defined from
physico-chemical point as polar-apolar duality (Salagar, 2002). An amphiphilic
molecule consists of two ends where the first end is a polar (hydrophilic) group with
heteroatoms contents such as O, S, P, or N included in the functional groups. The
other apolar (hydrophobic or lipophilic) end however is generally a hydrocarbon
chain of alkyl or alkylbenzene, atimes, with halogen or non-ionized oxygen atoms.
When in hydrocarbon-water mixture, the surfactant migrates to the interface and
orientates in such a way that the hydrophilic end is placed in water while the
hydrophobic end lies in the hydrocarbon, thus, reducing the tension at the interface
through the surface activities. The hydrophilic end is always regarded as the head
while the lipophilic end is the tail.

87
Just like surfactant where the hydrophilic end is placed in water and the hydrophobic
end lies in the hydrocarbon in a hydrocarbon-water mixture, corrosion inhibitors
when injected into a gas pipeline system have their hydrophilic end adsorbed
(attached) to the pipe wall because of the high intensity HOMO structure while the
hydrophobic end (carbon chain length) in the gas stream. In this case, the metal
surface which is a conductor of electricity acts like water (which is also an electricity
conductor). This enables the inhibitors to prevent any interaction between the water
molecules in the gas stream and the pipeline, thus, inhibiting corrosion by spreading
themselves throughout the entire pipe surface. However, the hydrophobic end within
the gas stream encourage the gas components to dissolve more into the water
molecules present in the gas stream to promote hydrate formation. This is due to the
strong interaction between the carbon in the corrosion inhibitor and the methane
present in the gas stream (Daimaru et al, 2007).
3.4.1.3 Hydrogen bonding Contributions
Gas clathrates (Figures 3.4a and 3.4b) exist due to the ability of H2O molecules to
assemble through hydrogen bonding and form polyhedral cavities.
Fig. 3.4a: Schematic drawing of natural gas clathrate structure Fig. 3.4b: Methane clathrate
where a methane molecule is encaged by a lattice of water molecules. dual structure.
Figure 3.4: Methane hydrate structures (Mahajan et al, 2007)
According to Vysniauskas and Bishnoi (2003) and Zhong and Rogers (2000), the
hydrate formation mechanism in a water-gas system depends on the hydrogen-
bonded water molecules clustering with the solutes of the hydrocarbon gas to form
hydrate crystals at certain concentration and size. In each water molecule, the two
hydrogen atoms are separated at an angle of 108oC as a result of the hydrogen bonds

88
formed with oxygen (Caroll, 2009); this results in the formation of polyhedral
cavities between several H2O molecules. The solute molecules (CH4, CO2, etc) are
then trapped in- between the cavities to form the required hydrate type.
Just like water molecule which is able to form hydrate because of its hydrogen
bonding property, all amphiphiles exhibit hydrogen bonding abilities (Ali and Saha,
2001). Corrosion inhibitors are amphiphiles, hence, their ability to exhibit hydrogen
bonding property in their solid and/or liquid states. For the five investigated
inhibitors, MP (Figure 3.5) has the ability to form a dimensional chain complex due
to the existence N....H hydrogen bonding (Ma et al, 2005).
Figure 3.5: The chemical structure of MP.
The inhibitor also owns a de-protonated heterocyclic thioamide group (N-C-S)- that
makes it to act as an S or N-bridging ligand. Okazaki et al (1976) strongly confirmed
the hydrogen bonding ability of CPC by experimenting with chloroform.
Observation of the chemical structure (Figure 3.6) shows the ability of the inhibitor
to form N—H bond.
Figure 3.6: The chemical structures of CPC.
Akba and Batigoc (2008) confirmed the hydrogen bonding ability of DPC (Figure
3.7) while Saeed et al (2011) and Al-Kady et al (2011) equally confirmed the
hydrogen bonding properties of TB and BDHA (Figure 3.8) respectively.
Figure 3.7: Chemical formula DPC

89
Figure 3.8: Chemical formula for BDHA
3.4.2 Impact of Different Inhibitors on Formation Temperature.
The variation in promotion rate of different corrosion inhibitors on gas hydrate
formation temperature was investigated based on the formation trends observed in
Figure 3.3. This variation was necessary to study the impact of different types of
corrosion inhibitors on offshore pipeline systems. It was observed that at the same
inhibitor concentration, liquid volume and operating pressure, all the inhibitors
increased the formation temperature with a trend of DPC > BDHC > MP > CPC >
TB (Figure 3.9).
These results show that corrosion inhibitors aid promotion of hydrate formation at
different rates. This characteristic may depend on cumulative effects of many factors
such as their sizes and structural distributions, active functional groups and affinity
for water molecules which eventually impact on their hydrogen bonding properties
and electronegativity.
Figure 3.9: Formation temperature deviation of different inhibitors.
0
0.2
0.4
0.6
0.8
1
1.2
1.4
1.6
1.8
MP CPC DPC TB BDHC
De
viat
ion
(oC
)
Corrosion inhibitor type
Concentration = 500ppm; Pressure = 100bar

90
3.4.2.1 Structural Distribution
The apolar (hydrophobic or lipophilic) end of corrosion inhibitors is generally
known to be hydrocarbon chain of alkyl or alkylbenzene, and sometimes with
halogen or non-ionized oxygen. The different sizes of this end for different inhibitors
give them structures that are responsible for their different molecular aggregations;
this gives each inhibitor unique chemical, physical and other phenomena ability. As
cationic amphiphiles molecules, they possess non-polar hydrocarbon chains ending
with methyl group; nitrogen; chloride and sulphide to enable them form onium and
counterion structures (Vongbupnimit et al, 1995). By determining the distance
between the active atom(s) at the outermost shell and the nucleus, the structure and
size of each inhibitor therefore affects its electronegativity since the active electrons
of some of the inhibitors have direct exposure to the nucleus while for others, the
active electrons at the outermost shell have been shielded from the direct contact.
The electronegativity of a substance has a direct influence on the impact of its
hydrogen bonding type, the higher the electronegativity, the stronger the bond type.
Electronegativity is a function of atomic radius, number of electrons in the outermost
shell. The farther the electrons attached to the outermost shell from the influence of
the nucleus charge, the easier it is to draw it away and the weaker the hydrogen bond
that could be formed. The types and strength of the resulting hydrogen bonding will
impact the average bond length, bond angle, the molecular packing and the torsion
angles.
3.4.2.2 Active functional group
The polar (hydrophilic) group of each inhibitor contains heteroatom(s) such as O, S,
P, or N which determines its impact on hydrate formation temperature through the
type(s) of hydrogen bonding exhibited while in solution. The type of functional
group will further determine whether the formed bonding will be polar covalent,
ionic or ionic with covalent character in nature.
While forming hydrate, MP (Figure 3.5) serves as a bridging ligand coordinate to a
crystal structure which is stabilized by N···H, O—H···O and O—H···S (Li et al,
2010). However Lima et al (2006) used Second- and fourth-order M ller-Plesset
perturbation theory and thermodynamic perturbation theory implemented on a Monte

91
Carlo NpT simulation to show that the SH is more stable in gas phase while NH type
is more stable in solution. From their structure likewise, CPC (Figure 3.10) can form
N···H and H···Cl bond types; DPC (Figure 3.11) forms N···H, H···O and H···Cl;
TB (Figure 3.12) forms S···H and N···H and BDHA (Figure 3.13) forms N···H and
H···Cl.
Figure 3.10: Another structural representation of CPC
Figure 3.11: Another structural representation of DPC
Figure 3.12: The chemical structures of TB.
Figure 3.13: The chemical structure of BDHA.
3.4.2.3 Affinity for water
Also, the affinity of each inhibitor for water molecules affects its level of promotion;
the more the affinity, the more the promotion ability. This affects the inhibitor‘s
hydration ability to forming more hydrogen bond with water by taking more water

92
molecules into the complex three dimensional structures which will confine the gas
into its cage (matrix) to form X.H2O, X.10H2O and/or X.50H20 where X is a
particular inhibitor. The strength of the hydrogen bonds to be formed will be
determined by the accessibility of the hydrogen atom(s) to the required site which
thus encourages electrolyte selectivity through stericity and Nucleophelicity.
Considering cumulative effects of the structural distribution, active functional group
and affinity for water based on above explanations, the hydrate formation pattern as
observed can be justified. DPC which is shows the strongest ability contains both the
Cl- and N
+ groups that can react very fast with water molecules because of highly
polar and strong hydrogen bonding properties which have higher affinity for water
molecules meeting the thermodynamic energy needed for the breaks and formations.
BDHA also contains these two groups, it however has a large non-polar part that
restricts interaction with water because of increase in apolar character which
involves London dispersion force (instantaneous dipole). Though, MP is expected to
have more affinity for water compared with DPC due to it‘s readily solubility
property, DPC and BDHA however show more polar character comparatively.
Finally, although CPC also has Cl- and N
+ groups in its structure and expected to be
readily soluble and reactive with water like DPC; the hydrophobic end however is
very large.
3.4.3 Hydrate Formation Patterns
3.4.3.1 The blank formation patterns.
The hydrate formation patterns for the blank and the five inhibitors were studied
through physical observations. At the blank concentration (Figure 3.14a), the formed
hydrate started building at the gas phase and grew gradually at the gas phase (Figure
3.14 b-d); while the liquid volume was gradually reducing till the whole cell become
blocked (Figure 3.14d-f).
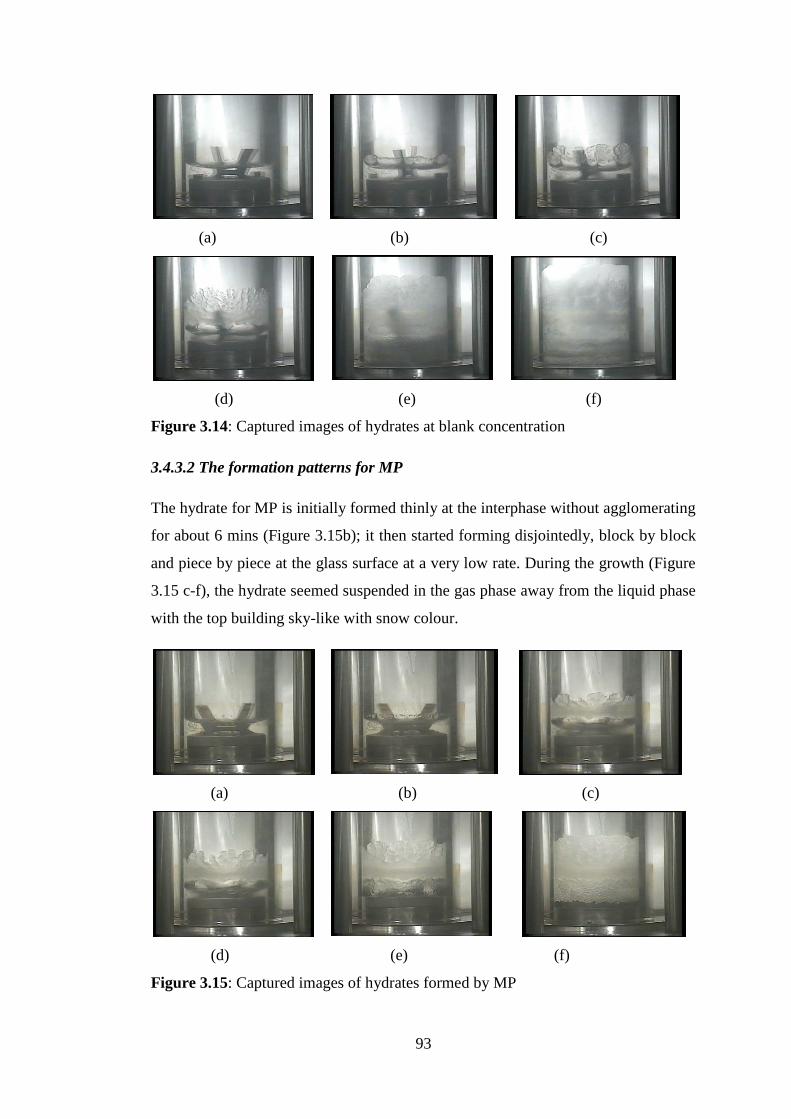
93
(a) (b) (c)
(d) (e) (f)
Figure 3.14: Captured images of hydrates at blank concentration
3.4.3.2 The formation patterns for MP
The hydrate for MP is initially formed thinly at the interphase without agglomerating
for about 6 mins (Figure 3.15b); it then started forming disjointedly, block by block
and piece by piece at the glass surface at a very low rate. During the growth (Figure
3.15 c-f), the hydrate seemed suspended in the gas phase away from the liquid phase
with the top building sky-like with snow colour.
(a) (b) (c)
(d) (e) (f)
Figure 3.15: Captured images of hydrates formed by MP

94
3.4.3.3 The CPC formation patterns.
At the formation temperature, CPC‘s hydrates were initially formed at the interphase
in chips form (Fig 3.16b). They then dissolved within two minutes into the liquid
phase (Figure 3.16c) and started growing gradually but at a slow rate (Figure 3.16d).
(a) (b)
(c) (d)
Figure 3.16: Captured images of hydrates formed by CPC
3.4.3.4 Formation patterns for DPC
The hydrate for DPC initially started growing slowly for the first 7mins after which
the growth rate increased rapidly (Figure 3.17a-f). The growth rate was so alarming
and the whole glass column was blocked within the next 4mins while the stirrer
stopped rotating 1min after. For this chemical, it is observed that the liquid
disappearance rate and the hydrate formation rate are very much higher when
compared with the other four inhibitors.

95
(a) (b) (c)
(d) (e) (f)
Figure 3.17: Captured images of hydrates formed by DPC
3.4.3.5 The formation patterns for TB
The hydrate for TB, which was as white as snow, was formed at the interphase
(Figure 3.18a-b), and then started growing upward along the cell glass column at the
gas phase without mixing with the liquid phase (Figure 3.18c-d). The growth rate at
the gas phase was rapid while the liquid phase was slightly turning cloudy and
disappearing downward till it finally vanished (Figure 3.18d-e). Throughout, this
experiment, the hydrate never collapsed into the liquid phase but solidified in the gas
phase and grew.
(a) (b) (c)
(d) (e)
Figure 3.18: Captured images of hydrates formed by TB

96
3.4.3.6 The formation patterns for BDHC
The BDHC‘s hydrate was observed to form rapidly by breaking into chips and
mixing with the liquid phase (Figure 3.19a-d). This was followed by the hydrate
growing inside the liquid as flocs, breaking up and adding up to the existing hydrates
(Figure 3.19e-f). The hydrate grow rate for this inhibitor was observed to be higher
than those of the other inhibitors except for the DPC.
(a) (b) (c)
(d) (e) (f)
Figure 3.19: Captured images of hydrates formed by BDHC
3.5 Conclusions
This study has successfully established the ability of corrosion inhibitors to generally
promote hydrate formation along the deepwater gas pipelines. This has strong
consequences on flow assurance policy of the industry through creation of one
problem while solving the other. It has further established that the inhibitors promote
the hydrate at different rates probably based on their structural distributions, active
functional groups and affinity for water molecules which eventually impact on their
hydrogen bonding properties and electronegativity. Based on the experimental
results, care must be taken in the use of DPC by the industry at deepwater facilities
due to its alarming ability to aid the hydrate promotion compared to other inhibitors.
Essentially, this study has brought a new focus to corrosion-hydrate relationship as
well as establishes the need for comprehensive investigations along this area of

97
research interest. Further studies should be conducted on the growth and dissociation
rates. Also, other inhibitors with similar structural distribution and active functional
groups with DPC should be investigated for any correlation.

98
4. Hydrate Promotional Behaviour of DPC
4.1 Background
This chapter reports a further study conducted subsequent to the laboratory
discoveries reported in chapter three. It was conducted on Dodecylpyridinium
Chloride based on its remarkable promotion ability as reported in the chapter three.
This further study was carried out on the inhibitor at pressure range of 50 - 150bar
and concentration range of 0 - 10,000ppm in order to establish its behaviors under
different operating conditions.
4.2 Introduction
DPC is one of the chemicals commonly used in the gas industry to remarkably
extend the shelf-life of process equipment through inhibition of carbon-dioxide
corrosion (Pandarinathan et al, 2011). It is a cationic surfactant (with a molecular
weight of 283.88g/mole and melting point of 66-70°C) that inhibits corrosion by
adsorbing onto the active anodic and cathodic sites of the metal, and by forming
bilayers, thus, classifying it as a mixed type inhibitor.
DPC adsorbs onto the pipe surface both chemically and physically (Durnie et al,
2005) through electrostatic adsorption and π-electron sharing (Durnie et al, 2003),
although, the exact mechanism remains unknown (Likhanova et al, 2010). Where
physical adsorption dominates, DPC molecules can associate to form bilayers
depending on its concentration and chain length (Fuerstenau and Jia, 2004).
4.2.1 Corrosion Inhibition Mechanism
DPC exhibits mixed type inhibition properties by inhibiting corrosion both at anodic
and the cathodic sites (Frignani and Trabanelli, 1999; Saleh, 2006). The important
difference between the two sites is that physical adsorption occurs on the anodic
sites, while chemical adsorption occurs on the cathodic sites (Likhanova et al, 2010).
At anodic sites where iron is dissolved into the solution through electrochemical
processes, DPC molecules slow down the dissolving rate through physical
adsorption by generating ions with localised adsorption occurring initially, followed
by the formation of monolayers and bilayers. The van der Waal forces between the

99
alkyl chains help to achieve a closely packed film at the metal surface, thus,
increasing the inhibition effectiveness.
At the cathodic site however, iron is oxidised. Without the corrosion inhibitor at this
site, hydronium ions are adsorbed and hydrogen gas is desorbed. With the presence
of the inhibitor however, its pyridinium head, being quite large compared to
hydrogen, is able to cover a relatively large area of the steel surface. The pyridinium
head bonds to the steel surface through the pi electrons in the aromatic ring and the
free electron pair that is present on the nitrogen. The compound then accepts an
electron from the metallic surface to achieve electroneutraility.
4.2.2 Factors influencing Inhibition Efficiency
These factors can broadly be distinctly classified into two, which are the operating
conditions and material properties. Operating conditions include the operating
temperature, pressure, pH, inhibitor concentration, flow rate and CO2 concentration.
These have effects on the corrosion rate of steel.
Also, the internal properties of a corrosion inhibitor determine its effectiveness.
These properties include the alkyl chain length, ring size, type of head, bond type,
bond strength, contact angle and unit cell structure and parameters. The physical
structure of DPC consists of a pyridine head, a twelve long carbon chain and a
chloride ion. The twelve-long carbon chain, often called a fatty chain, consists of
carbons bonded together by single sigma bonds. The pyridine head is similar to that
of benzene molecule, but with a nitrogen ion substituted into the ring (Figure 3.9).
4.2.3 Study Justification
Recent laboratory study by Obanijesu et al (2012a) however revealed that care
should be taken in the use of DPC by the gas industry at deepwater facilities due to
its ability to aid hydrate promotion compared to other corrosion inhibitors. This
behaviour was justified by the presence of the Cl- and N
+ groups that could react
very fast with water molecules due to highly polar and strong hydrogen bonding
properties, thus, making it to have higher affinity for water molecules to meet the
thermodynamic energy needed for the breaks and formations.

100
This study was carried out at 50bar, 100bar and 150bar since many offshore
transmission and distribution operations are performed around these pressures. These
encourage rapid hydrates formation, growth and agglomerate. These pressures are
practically justified considering that the Line 300B that ruptured during pressure test
in USA on 20th
October 2011 was transmitting natural gas at 52.19bar (757psi)
(Derbeken, 2011). This 34-inch pipeline runs from Arizona boarder to Milpitas and it
is operated by Pacific Gas and Electric Company (PG&E). Typically, natural gas is
transported through pipelines at 100bar and above (Mahgerefteh et al, 2011). The gas
is transported through interstate pipelines at pressures up to 103.42 bar (1500psi) in
order to reduce its volume by about 600 times and propel it through the pipeline
(NG, 2011); while a compression of about 200bar (20MPa) is required for its
transportation as fuel (Matranga et al, 1992).
4.3 Methodology
4.3.1 Reagent, Materials and Equipment
This study was carried out inside the Cryogenic Sapphire Cell at the Clean Gas
Technology Unit of Curtin University, Australia using exactly the same reagents,
materials and equipment as explained in chapter 3.3 but with little modifications.
The modifications include the use of DPC only for this study and the use of a range
of pressures and concentrations. 10000ppm fresh stock of DPC was prepared at
CORR_CERT centre of Curtin University and diluted to the required concentration
for each experiment. Also, the experiments were conducted at 50bar, 100bar and
150bar, these variations automatically led to more preliminary studies before the
commencement of the experiments and other modifications to the experimental
procedure are explained below
4.3.2 Preliminary Study
Before the experimentation, HYSYS software was used to investigate the formulated
gas phase behaviour at various temperatures ranges for 50bar, 100bar and 150bar
respectively (Table 4.1).
This investigation was necessary before the experiment in order to establish if the
gas will remain gaseous at a very low temperature and maintain a constant

101
composition throughout the study since the experiment was to be performed during
winter period. At a very low temperature, CO2 gas can undergo partial condensation
to give the gas mixture different composition at different experiment based on the
environmental conditions (weather).
Table 4.1: HYSYS prediction on the gas composition‘s phase behaviour
Temperature (OC) Pressure (bar)
50 100 150
5 Gas Gas Gas
0 Gas Gas Gas
-5 Gas Gas Gas
-10 Gas Gas Gas
-15 Gas Gas Gas
4.3.3 Experimentation
HYSYS software was used to predict the formation temperature of the gas
composition at the chosen pressures for rough formation temperature points for the
blank studies in order to save time during the experiment (Figure 4.1).
Figure 4.1: HYSYS prediction vs experimental result for the formation temperature
at blank concentration.
0
2
4
6
8
10
12
14
16
18
20
50 100 150
Form
atio
n t
em
pe
ratu
re (
0 C)
Operating pressure (bar)
Hysis prediction vs experimental result for the formation temperature of blank sample
Hysis Experiment

102
Blank studies were then carried out experimentally at each of these set pressures to
locate the hydrate formation temperature point (Figure 4.1). This was carried out by
introducing a specific volume of gas as required by each pressure under study with
5ml of MQ-H2O into the cell before carrying out the experiment. The formed
gas/liquid mixture in the cell represents blank mixture. The value from this
experiment served as a baseline for the deviation from the experiments to be
conducted with the addition of the corrosion inhibitors. Introduced volume at 50, 100
and 150bar were 600ml, 1200ml and 1500ml respectively.
500ppm of DPC was prepared from the 10000ppm stock with a beaker, a pipette and
Milli-Q water using the dilution factor calculated as equations (4.1-4.3).
Equation 4.1
Equation 4.2
Therefore, the required MQ-H2O for dilution is given as
Equation 4.3
Where
is the concentration of the available inhibitor (ppm); is the concentration of
required solution (ppm); is the volume of inhibitor (ml) and is the volume of
solution (ml).
5ml of the prepared solution was injected into the system through V5 while 1200ml
of the gas was compressed in through V9. The newly formed gas/liquid mixture in
the cell represents (blank+inhibitor) mixture and the experiment repeated at 100bar
until hydrate was formed. This same experimental procedure was repeated three
times to ascertain accuracy of the result.
The deviation in temperature for each experiment was calculated as
Equation 4.4
Where
is the formation temperature for the blank experiment; is the formation
temperature for (blank + Inhibitor) experiment.
103
To ascertain accuracy of the generated experimental data, the blank study was
repeated three times while some of the experiments were selected at random for
repetition; it was observed that the same results were obtained. . Fluid leakages were
also prevented during the experimentations in order to minimize errors; this was
done by threading a Teflon tape along the outlet part of each valve and soap tested
before starting the experiment. Furthermore, parallax errors were avoided during the
preparation of liquid phase solutions by reading the values at the bottom of
meniscus. At the concentrations where the cell solution became very foamy before
commencement of experiment, the cell was heated to high temperature of 45OC to
obtain clear solution and clear interphase. The system was then cooled to the
reference Temperature of 25OC before conducting the experiment.
Also, explosion was avoided through complete venting of the whole system before
vacuuming the gas cylinders. This was compulsory noting that, venting the system
after completion of each experiment usually left 3bar in the line, which must be
totally bleeded before fixing the vacuuming pump to the line. This remaining
pressure (3bar) was always bled off by opening all the valves connected to the lines
for about 60 seconds. Furthermore, care was taken to prevent hydrate blockage along
the manifold line as this usually leads to pressure drop in the cell. This was
experienced two times during the experiments and they have to be repeated for
certainty. Whenever hydrate blocked the line, the sensors along the line would no
longer receive data from the pump, thus, preventing data transmission to the sensors
in the cell. If this should occur in the industry, explosion is inevitable as the line
operator would have been reading low pressure as generated by the system and his
efforts to increase the pressure to ‗normal‘ operating pressure would result into over-
pressurization.
Due to all these precautions, the statistical analysis on the generated data gave the
maximum experimental error of 1.823%; this clearly showed that the data obtained
were accurate within the limits of experimental errors since the probability limit
(confidence level) is above 95%.
4.3.4 Concentration Profile
Due to observed high hydrate promotion rate of DPC, a concentration profile was
investigated in order to study the inhibitor‘s behavious at different pressures and

104
concentrations. First, concentration profile for the inhibitor at 50 bar was developed.
This was carried out by introducing a solution of (blank+inhibitor) at a required
concentration prepared using Equations 4.1 – 4.3 into the Sapphire cell and the
experiment was carried out. The considered concentrations of 1000ppm, 2000ppm,
3000ppm, 5000ppm and 10000ppm were prepared from the fresh stock each at a
time for experimentation. This wide concentration range was used for both academic
and industrial applications. Industrially, 200ppm is the maximum applied
concentration due to cost implication on operation; however, it is important to
academically study the trend at higher concentrations in order to study the possibility
of the chemical to serve as hydrate inhibitor at such concentration(s). For each
experiment, 5ml of the prepared concentration (in ppm) and 600ml of the fresh gas
were fed into the cell and the experiment carried out at 50bar till hydrate is formed.
The formation temperature was recorded and the cell cleaned. The experiment was
then repeated at 100bar and 150bar for each of these concentration ranges. 1200ml
and 1500ml gas volume were introduced into the sapphire cell respectively for the
experimentations at 100bar and 150bar. The hydrate formation temperatures were
properly recorded and the cell cleaned after each experiment. The complete set of
experimental data generated at these three pressures were analysed for the Pressure-
Concentration matrix. Many of these experimental conditions were randomly
selected for repetition in order to ascertain the accuracy and duplicability of the
results.
4.3.5 Location of Critical/Peak Operating Concentration
While the effectiveness of a corrosion inhibitor depends on fluid composition,
quantity of water, and flow regime, the quantity of corrosion inhibitor required for
gas line is a function of the chemical price, pipe dimension, the length of the
pipeline, the desired film thickness, the quantity and the quality of the transported
natural gas (Whited, 2003; Schlumberger, 2011). This quantity, which is displaced
down the lines between pigs, is estimated by Schlumberger (2011) as
Equation 4.5
Where
is the vol (l); is the length (km); is the Desired film thickness (ml)

105
However, the chemical concentration should play a critical role since this study has
established that there is variation in hydrate influence at varying concentration and
pressure; hence, the need to establish the critical operating concentration. The critical
(or peak) operating concentration is that concentration at which the highest
formation temperature is recorded. Hydrate could easily be promoted along the
pipeline system at this concentration due to the corrosion inhibitor‘s influence.
Operating at critical concentration should be avoided at all cost due to the safety and
economic impacts on the industry. Continual operation at this concentration means
that, the industry has to invest in the continual removal of the hydrate blocks within
the line in order to prevent full-bore rupture of the pipeline. Since it has been
observed through the pressure-concentration matrix that at all pressure, the formation
temperature dropped between the concentrations of 500ppm and 1000ppm (Figure
4.7), definitely, the peak could not be within this range. Further studies were carried
out to investigate whether the concentration falls between 0ppm (blank) and
500ppm. This was done by carrying out the experiments at the mid-point
concentration of 250ppm for the three pressures. The results (Figure 4.2) established
that, at all pressures, the influence on formation temperature at 250ppm was higher
than both at 0ppm and 500ppm, hence, the conclusion that the critical concentration
lies between 0ppm and 500ppm.
Figure 4.2: Investigation of critical operating concentration of DPC
The experiment was repeated on DPC solutions between the blank (0ppm) and
500ppm at 50ppm interval (0, 50, 100, ...., 450, 500). Each concentration was studied
0
2
4
6
8
10
12
14
16
18
20
50 100 150
Form
atio
n T
em
pe
ratu
re (
OC
)
Pressure (bar)
Investigation of critical concentration between 0ppm - 500ppm
0ppm
250ppm
500ppm

106
at a time inside the cryogenic cell at 100bar and the results recorded. The 100bar
pressure was selected for this study because, 150bar is very dangerous when
considering safety factors, whereas, at 50bar, the hydrate formation temperature was
more difficult to locate and the formed hydrate grew too slowly for recognition.
4.4 Results and Discussions
4.4.1 Hydrate Formation Ability
At all inhibitor concentrations for the three experimented pressures, it was observed
that hydrate was always formed at temperatures above those for blank studies; this
shows that DPC promotes hydrate formation at all concentrations. This is a negative
influence on gas industry since the chemical is introduced into the gas stream to
assist in solving a flow assurance problem by minimizing corrosion along the
pipeline network; due to this negative influence however, the same pipeline is
subject to hydrate formation which is another flow assurance problem. Either way,
the outcome will result into loss of product, environmental degradation and other
economic losses apart from the political issues depending on the sensitivities of the
terrain and neighbouring habitat.
Throughout the experiment, the liquid phase never turned cloudy for all
concentrations and pressures until the formation period and hydrate always started to
form at the gas (Figure 4.3), the hydrates are very clear and ice-like in colour.
1000ppm at 50bar 2000ppm at 100bar 3000ppm at 50bar
5000ppm at 100bar 10000ppm at 150bar
Figure 4.3: Images of hydrates formed at various concentrations and pressures.

107
The liquid phase takes a long time to completely disappear as the hydrate turned into
slurry and built-up very slowly in the glass cell.
It was also observed that the inhibitor was very foamy regardless of the
concentration, the foaming ability however reduced with increase in concentration
except for 5000ppm (Figure 4.4). Also, the formed hydrate flake at this
concentration failed to completely block the glass orifice. Furthermore, unlike other
concentrations, the stirrer keeps rotating at 5000ppm even after all the liquid had
turned into hydrate. All these showed that 500ppm could be a special concentration
to the chemical. After further differential results were obtained at this concentration,
it was later believed to be the Critical Micelle Concentration (CMC) for the
chemical.
1000ppm at 100bar 2000ppm at 100bar 3000ppm at 100bar
5000ppm at 100bar 10000ppm at 100bar
Figure 4.4: Decreasing foaming property with concentration except at 5000ppm
Critical Micelle Concentration (CMC) is that concentration where all the available
molecules of a surfactant in solution go into micellization. Micellization is the
submicroscopic aggregation of surfactant molecules (DPC for this study) that are
dispersed in a liquid colloid. This aggregation is formed at each polar (hydrophilic)
end of the molecules that are in direct contact with the surrounding liquid to form
micelles, and this leads to sequestration of existing hydrophobic tails within the
micelle centre. These polar ends are capable of forming hydrogen bonding. The
shape and size of each micelle is determined by the molecular geometry of the

108
surfactant molecules and the solution conditions such as the pH, temperature,
surfactant concentration, and the ionic strength. For any given surfactant, CMC is
strongly dependant on temperature, pressure and concentration (Hara et al, 2004;
Metha et al, 2005). Surface tension is strongly influenced below CMC but remains
relatively constant once CMC is reached. Korotkikh and Kochurova (2006) gave the
CMC value for DPC at 200C as 1.78*10
-2M and gave those of 25
0C, 30
0C, 35
0C and
400C as 1.75*10
-2M, 1.36*10
-2M, 1.97*10
-2M and 2.15*10
-2M respectively.
It was further observed that the inhibitor remained foamy even after the hydrate
might have stopped the stirrer from working due to total blockage of the orifice
(Figure 4.5).
Towards blockage Towards blockage Towards blockage
About to block Foamy at blockage
Figure 4.5: Foam growth with time at 3000ppm and 150bar.
At each pressure, it was further observed that the liquid disappearance rate decreased
with increase in concentration. At 100bar and 1000ppm for instance, over 80% of the
liquid had disappeared within 5 minutes after formation whereas at the same pressure
but 5000ppm and 10000ppm, it took 12 and 15 minutes respectively to have this
same quantity to disappear. Likewise, the hydrate growth rate followed the same
trend. These suggest the possibility of using this chemical to aid the transportation
and storage of natural gas in slurry form. This research area was investigated by
Gudmundsson and Børrehaug (1996), Javanmardi et al (2004) and Rogers et al
(2005) as a means of solving hydrate problems. Recently, Wang et al (2010)

109
conducted a similar study using tetrahydrofuran, while Delahaye et al (2011)
conducted a similar work to study the rhelogical properties of CO2 hydrate slurry
flow using surfactants and antiagglomerants as additives.
For both 100bar and 150bar, the blockage time decreases with increase in
concentration. At 100bar for instance, it was observed that at 1000ppm, the stirrer
stopped working due to total blockage of the glass orifice at 18minutes after
formation time whereas, the stirrer stopped at 28 minutes and 32 minutes
respectively for 5000ppm and 10000ppm respectively. This means that at very high
concentration, DPC exhibited some hydrate inhibition properties which might make
it a useful additive for transporting natural gas at such concentration. This might
further support the potential of using the chemical in natural gas transportation in
slurry form.
It was further observed that increase in agitation (stirring) rate could prolong the
hydrate growth rate. At 150bar as an example, when the rate was very slow, the
hydrate was formed at 17.3OC; however, when the rate was significantly increased,
the flocs dissolved into the liquid completely and later started to form again at 16OC.
This might have to do with the combined influences of pressure, temperature,
agitation and particle size on the gas solubility which could be explained as follows.
According to kinetic theory, reduction in kinetic energy was experienced by the gas-
liquid system as temperature dropped towards the hydrate formation point. This
resulted in reduction in the molecules‘ motion that eventually led to reduction in the
rate at which the gas molecules escaped from the solution since there was already a
reduction in the rate that the intermolecular bonds broke up. This effectively
increased the gas solubility. The gas solubility is further enhanced by the 150bar at
which the study is conducted. At this high pressure, Henry‘s Law is obeyed and the
gas molecules are further pushed into the liquid; hence, the initially obtained hydrate
formation temperature of 17.3OC.
When the agitation rate was increased however, the solubility now depended on the
particle size. The existing fine hydrate particles had more exposed surface area to the
surrounding solvent. The solute (hydrate particles) then dissolved rapidly into the
liquid since agitation brought the available fresh solvent into contact with the surface
of the solute. As the temperature dropped further to 16OC, another hydrate formation

110
temperature was reached based on the new agitation rate. At this point, the hydrate
agglomerated and grew to form an ‗ice‘ that blocked the glass orifice.
Agitation and particle size can only affect the solute (hydrate) dissolution rate but
cannot influence the saturation point, this phenomenon could further be investigated
as related to deepwater natural gas pipeline in order to understand the hydrate growth
process.
4.4.2 Specific Observations at Various Operating Pressures
During the experimentation, specific observations were made that were unique to the
operating pressures. There were some unique to 50bar while others were unique to
the high pressure range of 100bar and 150bar. These are discussed below.
4.4.2.1 Specific observations at 100bar and 150bar
Experiments for all concentrations at 100bar and 150bar followed the same observed
trends. At all concentrations, hydrates were generally formed at the interphase and
grew along the gaseous phase (Figure 4.6) while the liquid disappeared downward.
10000ppm and 150bar 10000ppm and 100bar
Figure 4.6: Images showing the hydrate growth in gas phase.
At Initial stage after formation, each time hydrate flocs were formed within the
liquid phase, they would quickly rise to the interphase (this hardly happened and
required a very good observation to notice); with time however, the flocs started to
dissolve in the liquid thus, turning it into slurry and the floc particles became
noticeable in the liquor or as the hydrate agglomerated and grew. The growth pattern
might have been influenced by concentration and pressure (Figure 4.7).

111
3000ppm and 100bar 5000ppm and 100 bar 5000ppm and 150 bar
Figure 4.7: Formation of flocs in the liquid phase
As the temperature continued to drop, the hydrate slurry turned into flakes up to
about 0.5OC below the formation temperature. Within this period, the hydrate growth
rate was generally slow. At about 0.5OC below formation temperature however, the
temperature started to rise but suddenly dropped sharply while approaching the
formation temperature. Within this period, the hydrate growth rate was noticed to
increase sharply and completely block the whole glass orifice within a very short
period of time at a temperature varying between 0.3 O
C and 0.5OC away from
formation temperature. This trend was noticed for all concentrations except for
10000ppm where the temperature dropped to 1OC below the formation temperature
before it started rising again. Again, at 10000ppm for both 100bar and 150bar, it was
observed that at some point, the formed hydrate collapsed inside the liquid and
started rebuilding and growing until the blockage time (Figure 4.8).
Initial stage Collapsed Rebuilding
Growing Growing Final growth
Figure 4.8: The collapsing and rebuilding trend at 100bar and10000ppm

112
4.4.2.2 Specific observation at 50 bar
At each concentration, hydrates were generally formed at lower temperature
compared to those of higher pressures. After formation, the temperature is generally
reduced to a very low value compared to those at 100bar and 150bar before the
hydrates agglomerate, even despite that, the growth rate is noticed to be very very
slow comparatively. This is an indication that hydrate growth rate may be directly
proportional to operating pressure. The hydrates, independently formed in bits,
formed a ‗ring‘ at various spots and cycle round the glass wall at interphase while
growing. At a pressure mostly between 2OC - 3
OC below the formation temperature,
the temperature usually increased sharply due to heat transfer process taking place at
this point. This resulted in the hydrates completely filling the glass orifice which in
turn blocked the glass and stopped the stirrer within 4-6 minutes.
4.4.3 Concentration Profile
The concentration-pressure matrix study carried out on DPC showed a unique trend
at all the pressures (Figure 4.9). From the figure, it is observed that though, at same
the concentration but different pressures, the formation temperature was different;
however, a look at the results from the three pressures gave a similar ‗camel back‘
structure with that of 100bar more obvious. Generally, the formation temperature
increases sharply from 0ppm to 500ppm and then reduced at 500ppm to 2000ppm
and then starts to increase at 3000ppm; however, a sharp increase was noted at
5000ppm before a final drop at 10000ppm.
The experiment for 5000ppm was repeated to confirm the noticed sharp increase as
against the normal on-going reduction trend and the same result was obtained. This
increase may be due to the effect of change in the hydrate formation rate beyond the
critical micelles concentration (CMC). According to Zhong and Rogers (2000), at a
concentration above its CMC, the formation rate of gas hydrate in a static system
increases in multiple times (over 700).

113
Figure 4.9: Concentration–pressure matrix showing similar structure at all pressures.
4.4.4 Critical Operating Concentration
Because of the very significant saddled structure observed at 100bar, this pressure
was used to further investigate the trend in relationship between concentration and
formation temperature in the concentration range of 0-500ppm. From Figure 4.10, it
could be proposed that the critical operating concentration for DPC at 100bar is
200ppm. This result suggests that the gas industry should avoid the use of this
chemical around this concentration for the deepwater pipeline in order to prevent
hydrate promotion. All points close to this value may have the same effect which
could easily lead to full bore rupture and the subsequent consequences.
Figure 4.10: Result establishing the peak concentration for CPC as 200ppm.
10
12
14
16
18
0 500 1000 2000 3000 5000 10000
Form
atio
n T
em
pe
ratu
re (
OC
)
Concentration (ppm)
Corrosion inhibitor = DPC
50 bar
100 bar
150 bar
14.5
15
15.5
16
16.5
17
17.5
18
0 100 200 300 400 500 Form
atio
n T
em
pe
ratu
re (
OC
)
Concentration
P = 100bar
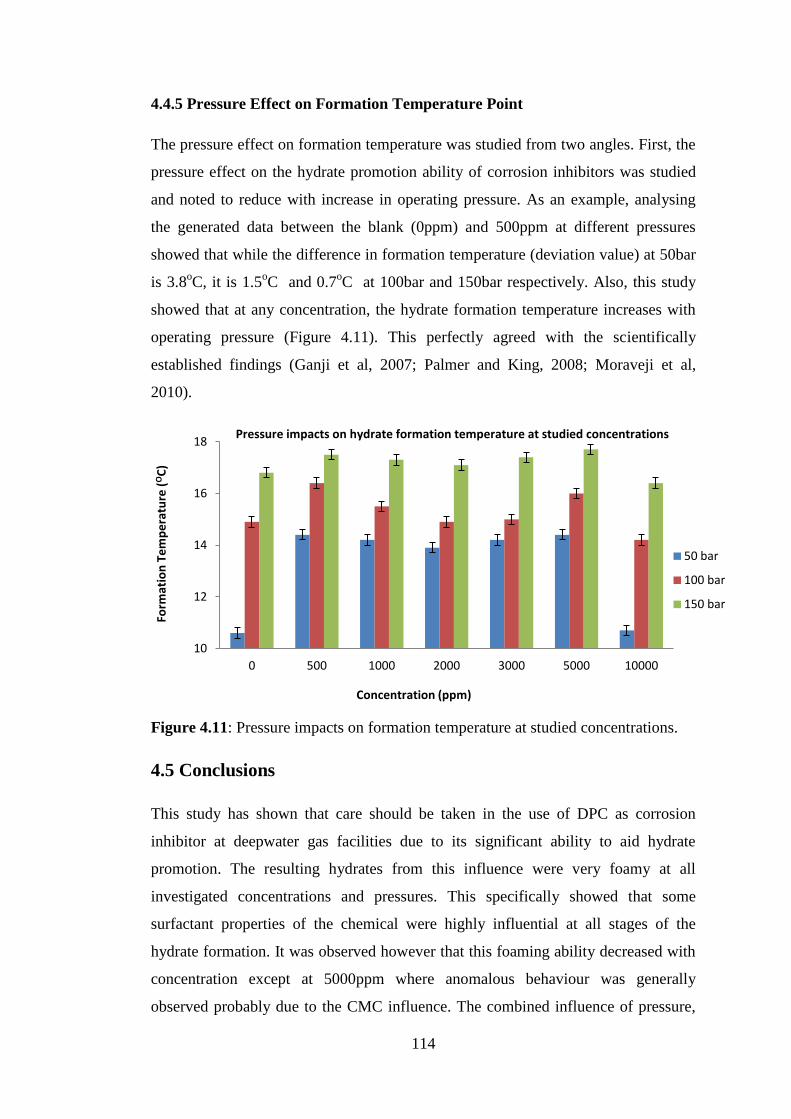
114
4.4.5 Pressure Effect on Formation Temperature Point
The pressure effect on formation temperature was studied from two angles. First, the
pressure effect on the hydrate promotion ability of corrosion inhibitors was studied
and noted to reduce with increase in operating pressure. As an example, analysing
the generated data between the blank (0ppm) and 500ppm at different pressures
showed that while the difference in formation temperature (deviation value) at 50bar
is 3.8oC, it is 1.5
oC and 0.7
oC at 100bar and 150bar respectively. Also, this study
showed that at any concentration, the hydrate formation temperature increases with
operating pressure (Figure 4.11). This perfectly agreed with the scientifically
established findings (Ganji et al, 2007; Palmer and King, 2008; Moraveji et al,
2010).
Figure 4.11: Pressure impacts on formation temperature at studied concentrations.
4.5 Conclusions
This study has shown that care should be taken in the use of DPC as corrosion
inhibitor at deepwater gas facilities due to its significant ability to aid hydrate
promotion. The resulting hydrates from this influence were very foamy at all
investigated concentrations and pressures. This specifically showed that some
surfactant properties of the chemical were highly influential at all stages of the
hydrate formation. It was observed however that this foaming ability decreased with
concentration except at 5000ppm where anomalous behaviour was generally
observed probably due to the CMC influence. The combined influence of pressure,
10
12
14
16
18
0 500 1000 2000 3000 5000 10000
Form
atio
n T
em
pe
ratu
re (
OC
)
Concentration (ppm)
Pressure impacts on hydrate formation temperature at studied concentrations
50 bar
100 bar
150 bar

115
temperature, agitation and particle size were noticed on hydrate solubility. At all the
investigated pressures, it was also realized that DPC prolonged the complete
blockage of the glass orifice at 10000ppm. This special characteristic may suggest
the potentiality in applying the chemical as an additive for natural gas transportation
and storage in slurry form. Besides, it may further suggest the possibilities of using
the chemical as corrosion and hydrate inhibitor along offshore gas pipeline at very
high concentrations. Though the usage as both the corrosion and hydrate inhibitor
could be expensive, it could be cost effective since it would serve a dual purpose and
there would be no further need to add another hydrate inhibitor.
Finally, this study has further confirmed the need to investigate the hydrate
formation ability of the corrosion inhibitors that are used along the deepwater natural
gas pipeline.

116
5. Hydrate-Corrosion Model: Development and Simulation
5.1 Background
Chapters 3 and 4 have established the ability of corrosion inhibitors to aid in the
promotion of gas hydrate within the offshore natural gas pipelines. Considering
Chapter 2.6 that suggested that gas hydrates can initiate internal corrosion along the
same pipelength with time, it is then necessary to consider measures to handle this
possibility. Preventive and corrective options are the only available options. The
preventive options are always better since they are easy to control with no future
repercussions. This chapter considered development of a predictive model as a
preventive measure.
5.2 Introduction
Hydrate formation along a long natural gas pipeline has been established as a
potential initiator of different types of internal corrosion along the pipe-length based
on the formation stage and point (Obanijesu et al, 2011b). These corrosions may lead
to disintegration of the pipe‘s properties and eventually result into the pipe‘s leakage
or full-bore rupture. Apart from the enormous economic implications on the
operating company, the conveyed fluid upon escape to the environment poses the
risk of fire, reduction of air quality and other health hazards.
This work theoretically developed an empirical model on natural gas corrosion rate
with gas hydrate as the corroding agent. The model considered carbon steel pipelines
(with iron as alloyed metal) conveying natural gas at different temperatures, pHs,
fugacities and wall shear stresses and is based on turbulent flow (Re › 2300), closed
system and homogenous phase conditions. This model, with emphasis laid on the
thermodynamic properties of the gas composition is a preventive model which will
enable prediction of the pipe‘s shelf-life.
5.3 Existing Corrosion Rate Monitoring Methods
In recognition of the dangers posed by corrosion to gas pipeline, various methods
have been proposed by scientists to minimize its occurrence. These methods can
broadly be classified as preventive and corrective measures and many of them are

117
presently in use in the industry while several studies are still going on globally for
improvement. One of the corrective techniques is the use of on-line electrical
resistance (ER) probes for instantaneous corrosion velocity readings (Huang and Ji,
2008; Saravanan et al, 2009). These readings are linked to computer software
systems over a determined period to establish an accurate corrosion rate. This
method allows for a continuous monitoring without multiple exposures to transferred
fluid. However, it is subject to fouling and may not read pitting corrosion (Pickthall
et al, 2011). Also, this method has a slow reaction time and there is a need to obtain
a balance between the sensitivity and the probe lifespan.
Pigging is another corrective method commonly used in the pipeline industry. A pig
is used to scrape off the corroded surface of the inner portion of hydrocarbon
transporting pipeline but eventually reduces the pipe‘s thickness. Guided wave
corrosion detection (Konstantinidis et al, 2006; Clarke et al, 2010; Croxford et al.,
2010) could have been a valid substitute for smart pigging considering the recent
advances in the technology which makes it more reliable on unpiggable process
lines, road crossing and overhead (gantry lines). It however has an accuracy of
location detection problem among others (ETF, 2011). Also, it is only applicable in
buried lines but not on a subsea line where the probes are exposed.
Predictive model development is a preventive measure. It predicts the likely shelf-
life of the pipe for the industrial use on planning the replacement time. Both the CO2
corrosion (sweet corrosion) and H2S corrosion (sour corrosion) are major concern in
the application of carbon and low alloy steels which are still the principal
construction materials offering economy, availability and strength (Nesic et al,
2004). In practice, localized corrosion is the most dangerous mode of attack and can
result in serious failures, hence, the need to predict the occurrence. Localized
corrosion of metals is stochastic in nature (Williams et al, 1985, Bertocci et al, 1986;
Gabrielli et al, 1990; Wu et al, 1997; Frankel and Sridhar, 2008; Caleyo et al, 2009;
di Caprio et al, 2011) and it is believed to relate to two stochastic processes: the
breakdown of the passive film and repassivation of the exposed area (Bettocci et al,
1986; Hashimoto et al, 1992; Stockert and Bohni, 1989; Pistdrius and Burstien,
1992; Gabrielli and Keddam, 1992; Pujar et al, 2007; Estupinan-Lopez et al, 2011;
Montesperelli and Gusmani, 2011). The probabilistic characters of localized attack
make a stochastic approach to its study attractive. Gunaltum (1996) proposed a

118
localized corrosion prediction model, which applies a turbulence factor to general
corrosion rate, assuming the flow to be the main parameter initiating localized attack.
Schmitt et al (2000) developed a probabilistic model for prediction of flow-induced
localized corrosion. It is well known however that there are other environmental
factors such as pH, temperature, partial pressure of the corroding agent (Sun et al,
2003a) amongst others, causing carbon steel to undergo rapid, localized corrosion
and therefore, a model that could predict it should take all these into account.
van Hunnik et al (1996) developed a two-dimensional (2-D) stochastic algorithm to
simulate the morphology of localized attack (Equation 4.1). The rule-based
algorithm operated on the assumption that the morphology of corrosion attack
depended on the balance of two processes: corrosion (leading to metal loss) and
precipitation (leading to metal protection). This balance was effectively quantified
using a single parameter: the scaling tendency ST:
CR
RST
FeCO3 Equation 5.1
Where
3FeCOR is the precipitation rate of iron carbonate (mm/yr) and CR is the corrosion
rate (mm/yr)
The algorithm produced a wide range of acceptable corrosion surface morphologies.
Though, there was not much physico-chemical contents built into the algorithm, the
appearance of the 2-D corroded surface, including the one with localized attack was
rather similar to what is seen in Scanning Electron Microscope (SEM) images of
corroded steel samples (Plates 5.1 and 5.2).
However, the model‘s strength (the requirement of only one input: the ST) turns out
to be its weakness since knowing the ST was not straight forward. ST depends on
both the precipitation rate and corrosion rate, and neither is easy to predict as they
depend on many other factors including water chemistry, steel composition, surface
electrochemistry and transport of species in the solution.

119
Figure 5.1: SEM image of the corroded steel surfaces taken from the study of CO2
corrosion in multiphase flow (Nesic et al, 2004)
Figure 5.2: Simulated metal surface morphology following moderate precipitation
leading to a partially protective film and localized corrosion. ST = 0.53 (Nesic et al,
2004)
Nesic et al (2004) modified the van Hunnik et al (1996) to enable simulation of a
broader variety of localized corrosion morphologies found in practice. The 2-D
algorithm, which used ST as the only input parameter was connected with the 1-D
mechanistic model of CO2 corrosion so that the morphology of localized attack can
be predicted as a function of primitive parameters such as temperature, pH, partial
pressure of CO2, velocity, etc. The model which was on uniform corrosion, stretched
from the steel surface though the pores of a surface film and mass transfer boundary
layer, ending in the turbulence bulk of the solution. The concentration of each
species was governed by a species conservation (mass balance) equation. The model
equation was finally presented as

120
j
jeff
j
jR
x
CD
xt
C
5.1
)( Equation 5.2
Where
t
C j
)( is the accumulation term;
x
CD
x
jeff
j
5.1 is the net flux; jR is the
source or sink due to chemical reaction; jC is the concentration of species j
(kmol/m3); is the porosity of the film;
eff
jD is the Effective diffusion coefficient
of species j (which include both the molecular and the turbulent components, m2/s);
jR is the source or sink of species j due to all the chemical reactions in which the
particular species is involved, kmolm-3
s-1
); t is the time, (s) and x is the spatial
coordinate (m).
Based on the results of its simulation, the model postulated that partially protective
films were all that was needed to trigger localized attack; this was in agreement with
the experimental study of Sun et al (2003a). The shortcoming in the model was the
neglect of electromigration component in the transport equation. An assumption that
its contribution to the overall flux of species was small as the cumulative
contribution from various species could be significant. Also, turbulent convention
was replaced with turbulent diffusion as the former was difficult to determine
explicitly in turbulent flow. This will however affect the final output of the model.
Further improvement and adjustment on this model was reported through Xiao and
Nesic (2005).
Song et al (2007) developed a micro-mechanics based corrosion model to predict the
service life of reinforced concrete (RC) structure. The corrosion model consisted of a
chloride penetration model (Equation 5.3) to evaluate the initiation of corrosion, an
electric corrosion cell model (Equation 5.4) and an oxygen diffusion model to
evaluate the rate and the accumulated amounts of corrosion products (Equation 5.5).
0
ClCl
Cli QdivJ
t
C Equation 5.3

121
Where
i is the specific capacity; ClC is the amount or concentration of chlorine ions; ClJ
is the diffusion flux of chloride ions; ClQ is the sink term and t is the time.
)( 12 skgmFZ
iMSR
Fe
corrFeCorr Equation 5.4
Where
is Porosity of the porous media; S is the Saturation; FeM is the Molecular weight
of iron; corri is Corrosion current density; FeZ is Number of electric charge of
iron and F is the Faraday number.
0)1(2222
OOdOgO QdivJSS
t Equation 5.5
Where
is the Porosity of the porous media; S is the Degree of saturation of the porous
media; 2gO is the Density of dissolved O2 in pore water (kg/m
3);
2dO is the Density
of gaseous O2 (kg/m3);
2OJ is the Total flux of dissolved and gaseous O2 (kg/m2.s);
2OQ is the Sink term that represents the rate of consumption due to corrosion
(kg/m3s) and t is the Time (s).
A corrosion cracking model (Equation 5.6) was then combined with the three models
to evaluate the critical amount of corrosion product required for initiating cracking in
covered concrete. By implementing the model into a finite element analysis program,
a time and space dependent corrosion analysis and a service life prediction of RC
structures due to chloride attack are simulated.
so
stst
ruststCritrust ddDWW
Equation 5.6
Where
rustW is the Accumulated corrosion amount; CritW is the Critical amount of corrosion
products; st is the Density of steel; rust is the Density of rust; od is the Original

122
diameter; sd is the Displaced steel (i.e. diameter of displacement) and D is the
Material thickness.
Classifying deterioration process due to corrosion into initiation period, propagation
period, acceleration period and deterioration period with service life defined as the
time for the corrosion initiation, the model predicted corrosion rate of a pipe at
submerged zone exposed to marine environment over a period of ten (10) years. The
model, however, could have overestimated the chloride content to be penetrated into
the RC structure, hence, underestimated the service life of the concrete structure.
Development of refined corrosion wastage models is another interesting aspect in
corrosion science. This is so since the quality of any analysis on collapse and
reliability depends to a large degree on corrosion model. Southwell et al (1979)
proposed linear and bilinear models for corrosion wastage that were considered
appropriate for design purposes while Melchers (2001) suggested a steady state
trilinear and another power function for corrosion wastage. Yamamoto and Ikegami
(1998) proposed a three-stage corrosion model based on analysis data collected from
plate thickness measurements. Soares and Garbatov (1999) proposed a non-linear
model that described the growth of corrosion wastage in three phases: durability of
coating, transition to visibly obvious corrosion with an exponential growth, and the
progress and leveling of such corrosion. Sun et al (2001) and Sun and Yong (2003)
used the same mathematical formulation of Soares and Garbatov (1999) to describe
the corrosion rate instead of corrosion wastage. Qin and Cui (2002) assumed that the
corrosion rate is defined by equating the volume of pitting corrosion to uniform
corrosion. The corrosion model of Paik et al (2003) also categorized the corrosion
behaviour into three phases. The model of Ivanov et al (2003) assumed that the
transition phase of non-linear thickness reduction increases with time by a linear
relation. A different probabilistic model was developed by Melchers (2003a) which
divided the corrosion process into four stages: initial corrosion, oxygen diffusion
controlled by corrosion products and micro-organic growth, aerobic activity with
limited food supply, and anaerobic activity. Wang et al (2003) collected a very large
databank of measurements of thickness of ships to derive regression relations of
corrosion wastage as a function of time that provides a consistent fitting to the
collected data. Garbatov et al (2005) use the model of Soares and Garbatov (1999) to
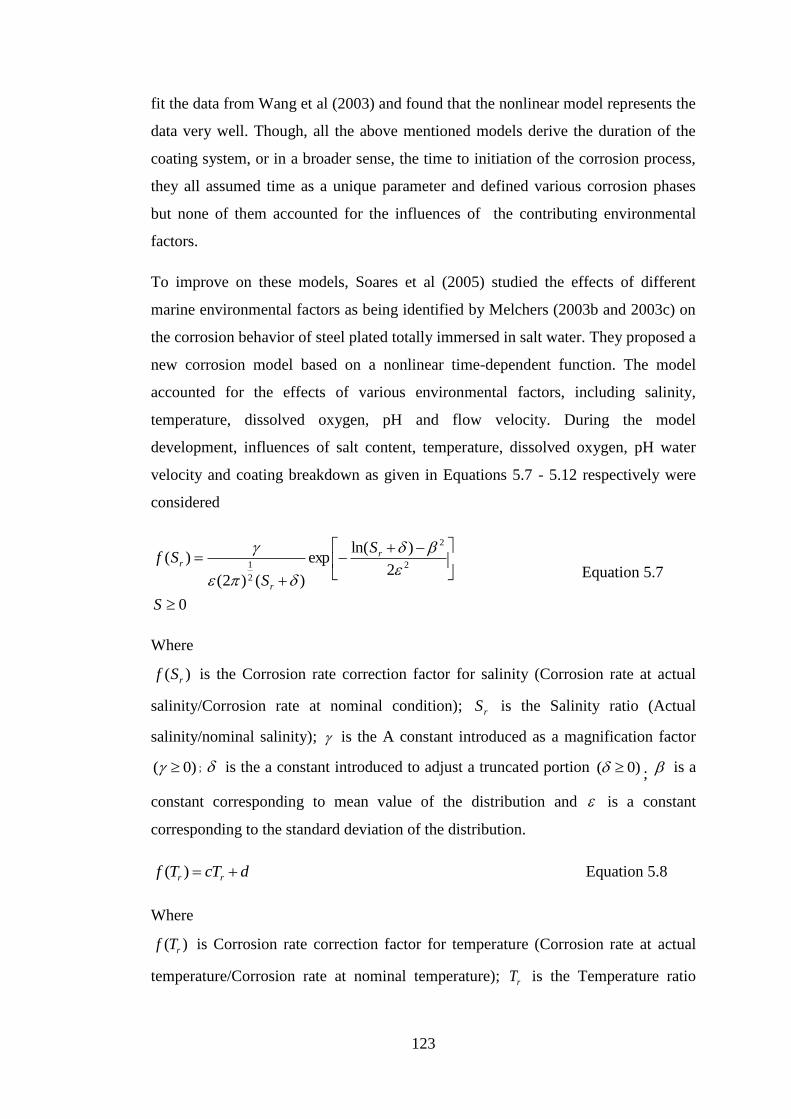
123
fit the data from Wang et al (2003) and found that the nonlinear model represents the
data very well. Though, all the above mentioned models derive the duration of the
coating system, or in a broader sense, the time to initiation of the corrosion process,
they all assumed time as a unique parameter and defined various corrosion phases
but none of them accounted for the influences of the contributing environmental
factors.
To improve on these models, Soares et al (2005) studied the effects of different
marine environmental factors as being identified by Melchers (2003b and 2003c) on
the corrosion behavior of steel plated totally immersed in salt water. They proposed a
new corrosion model based on a nonlinear time-dependent function. The model
accounted for the effects of various environmental factors, including salinity,
temperature, dissolved oxygen, pH and flow velocity. During the model
development, influences of salt content, temperature, dissolved oxygen, pH water
velocity and coating breakdown as given in Equations 5.7 - 5.12 respectively were
considered
0
2
)ln(exp
)()2(
)(2
2
2
1
S
S
S
Sf r
r
r
Equation 5.7
Where
)( rSf is the Corrosion rate correction factor for salinity (Corrosion rate at actual
salinity/Corrosion rate at nominal condition); rS is the Salinity ratio (Actual
salinity/nominal salinity); is the A constant introduced as a magnification factor
)0( ; is the a constant introduced to adjust a truncated portion )0( ; is a
constant corresponding to mean value of the distribution and is a constant
corresponding to the standard deviation of the distribution.
dcTTf rr )( Equation 5.8
Where
)( rTf is Corrosion rate correction factor for temperature (Corrosion rate at actual
temperature/Corrosion rate at nominal temperature); rT is the Temperature ratio

124
(Actual temp/nominal temp); c is a constant representing the slope of the rr TTf )(
relationship and d is the The constant representing the )( rTf value at zero rT
2
32143212100100100100
ln100
)ln(T
BT
BBST
AT
AT
AAO
(ml/L) Equation 5.9
Where
T is the Temperature (OK); S is the Salinity {Part per thousand (
ooo )}; and A1, A2,
A3, A4, B1, B2, B3 are Constants to be found in Kester (1975)
)(10)( npHkpHf Equation 5.10
Where
k, n = Constants
11ln
1exp1)(
vVf r Equation 5.11
Where
)( rVf is the Corrosion rate correction factor for velocity; rV is the Velocity ratio;
is the Magnification factor )0( ; v is the Velocity and is an introduced
constant to adjust the truncated portion of the distribution )0(
o
t
eSR
1 Equation 5.12
Where
SR is the Saturation ratio; o
is the Constant controlling the slope at (t=0) and o
1 is
the Slope at t=0
Equations 5.7 – 5.12 were synchronized to give a model on a long term effect of the
environmental factors as

125
n
i
n
i
jnjiiciL tdftdPtd1 1
,,, )()()( Equation 5.13
Where
iP is the Weighting factor representing the relative duration of the ith stationary
period along the lifetime of material; and icd , is the short-term corrosion wastage of
the ith period.
This model has an advantage over most others because instead of providing only the
average corrosion wastage, it also provided information about how the corrosion
changed with respect to the associated environmental factors. However, the model
was too cumbersome to solve.
Also, further studies have shown that metals could be corroded through microbial
activities (Geesey, 1991; Schwermer et al, 2008; Little and Lee, 2009). It was
discovered that patchy bacterial colonies could enhance corrosion by formation of
differential aeration cells. The possible oxygen depletion at the metal surface in the
areas covered with biofilms, combined with a higher oxygen concentration in the
zones exposed to bulk aqueous phase, may create differential aeration cell which
could lead to intensification of local corrosion rate under the biofilm. Moreover,
anaerobic bacteria could later colonize the biofilm, producing corrosion substances
like acids (Videla, 1996). Picioreanu and Loosdrecht (2002) developed a three-
dimensional mathematical model to investigate interactions between aerobic biofilms
and a metal surface, and to clarify conditions under which the onset of localized
corrosion caused by anaerobic microorganisms is likely to occur. The model includes
transport of seven chemical species (O2, Fe2+
, Fe3+
, HO-, H
+, Na
+ and Cl
-) by
diffusion and migration, electrochemical reactions at the metal surface, and
homogenous reaction in solution. Material balances for a small liquid volume
element were developed for all the seven chemical species as
7..........3,2,1
0)(1
,
22
i
rSCRT
FZDCD
I
j
jjiii
iii Equation 5.14
126
Where
is the Electric potential (V); iD is the Diffusion coefficient (m2s
-1); iZ is the
charge (e-/mol); F is the Faraday constant (96487 C/e
-); R is the Universal constant
(Jmol-1
k-1
); jiS , is the Stoichiometric coefficient of species i in the jth homogenous
reaction; jr is the Rate (molm-3
s-1
) and is the Divergence operator written in 3-D
Cartesian coordinates.
The system was solved using classical Newton-Raphson procedure and Jacobian
matrix computed with the symbolic package from MATLAB. The model results
show that the degree of metal coverage with bacteria significantly influences the
heterogeneity of the corrosion pattern. The results equally show that in certain region
of the parameter space, formation of differential aeration cells leads to localized
enhancement of corrosion under biofilm colonies, although the average corrosion
rate decreases by decreasing oxygen concentration. The model however assumed
amongst others, a steady-state operation, isothermal system and that physical
parameters (e.g. diffusion coefficient) were constant, which are not likely to be
accomplished in real-life situation.
5.4 Hydrate Corrosion Rate Modeling
Of the entire existing corrosion model, none has focus on developing a model on
hydrate-corrosion relationship. In actual fact, there was no known existing literature
identifying the possibility of hydrate chips to initiate corrosion along the natural gas
pipeline till 2010 when a paper was presented on this area by Obanijesu et al (2010).
This chapter develops a predictive model on internal corrosion rate resulting from
hydrate formation along the offshore segment of natural gas pipeline. The model is
developed based on the Norsok method and application of the thermodynamic
properties of the possible hydrate composition. The hydrate composition is based on
the recommendation of Abdel-Aal et al (2003) that water is of 90% composition of
the hydrate lattice while other components constitute 10%. The other component in
this work is taken to be the natural gas composition used in the laboratory as given in
Chapter three of this thesis.

127
5.5 Model Development
From the laboratory studies conducted on the specially prepared 20% CO2 natural
gas composition, it had been deduced from Chapter three that the hydrate formation
temperature range from 10 and 18 for the operating pressure range 5 Mpa (50
bar) and 15 Mpa (150 bar).
At the operation condition of 5 ≤ T ≤ 15 , NORSORK STANDARD (2005)
proposed a corrosion rate equation as
Equation 5.15
is a constant with values at various temperatures given in Table 5.1.
Table 5.1: Constant at different temperatures (NORSORK STANDARD, 2005)
Temperature ( ) Value (dimensionless)
5 0.42
15 1.59
20 4.762
40 8.927
60 10.695
80 9.949
90 6.250
120 7.770
150 5.203
5.5.1 Calculation of the pH factor ( )
The pH factor within this operating temperature range is given as
Equation 5.16
3.5 ≤ pH ≤ 4.6
Or
Equation 5.17
4.6 ≤ pH ≤ 6.5

128
5.5.2 Calculation of the Wall Shear Stress (S)
Wall shear stress is a parameter to be accounted for when modeling corrosion rate.
High shear stress may cause a mesa corrosion attach (Singh and Krishnathasan,
2009; Nyborg, 2010). The wall shear stress is a function of friction factor at the
specific temperature ( ), mixture density ( ) and superficial velocity ( ). It is
given by NORSORK STANDARD (2005) as
Equation 5.18
Where
Equation 5.19
The mixture density, mixture velocity and mixture viscosity are calculated as
Equation 5.20
Equation 5.21
Equation 5.22
Where is given as
Equation 5.23
5.5.3 The formation fugacity
Apart from the water molecule, every other molecule in the hydrate is gaseous.
However, at high pressure, an ideal gas situation can no longer be assumed, hence,
the partial pressure of individual gas should be multiplied by its fugacity constant.
The general equation for the fugacity of the multi-component hydrate can be
expressed as
Equation 5.24
The partial pressure is found using
Equation 5.25

129
The fugacity coefficient ( ) as a function of temperature and pressure is given by
Waard et al (1991) as
Equation 5.26
Equation 5.27
Since is constant for the system, then,
Equation 5.28
However, Equation (5.26) was applied for this study since most pipeline operations
are carried out below 250 bar coupled with the fact that hydrates could even be
formed at the pressure as low as 28 bar (Moudrakovski et al, 1999).
5.6 Model Simulation
The composition of the natural gas used for this study is presented in Table 5.2a. For
the appropriate simulation of the model as applied to hydrate formation, an
assumption of 90% water composition in the total hydrate as given by Abdel-Aal et
al (2003) was used to compute Table 5.2b. The computational method is shown in
Equation 5.28.
Equation 5.28
Where
is the Mole fraction of gas X in the hydrate; is the Mole fraction of gas X
in the natural gas stream and Water content is 90%.
5.6.1 Calculation of the Fluid Fugacity
The fugacity of a fluid is given by Smith et al (2008) as
Equation 5.29
Therefore, for a multi-component stream
Equation 5.29a

130
Re-arrangement of this gives
Equation 5.29b
Table 5.2: The hydrate composition used for the study
Component Natural gas component (mole %) a Hydrate component (mole %)
b
CH4 70.90 7.090
C2H6 5.00 0.500
C3H8 3.00 0.300
n-C4H10 0.94 0.094
n-C5H12 0.10 0.010
N2 0.06 0.006
CO2 20 2.000
H2O (l) -- 90.000
a Natural gas formulation in use for the on-going laboratory experiments.
b Calculated values using Equation 5.28 based on Abdel-Aal et al (2003).
A component‘s Gibb-free energy is a state property which is expressed as
Equation 5.30
Where each component‘s enthalpy change ( ) is given as
Equation 5.31
And , a component‘s entropy change is expressed as
Equation 5.32
Equations 5.30 – 5.32 are property related only and completely independent of the
process causing the change of state. is temperature dependent however and
expressed as
Equation 5.33

131
Thermodynamically, the temperature dependence of Equation 5.33 allows for the
integration of Equation 5.31 and Equation 5.32 to give more simplified equations for
the enthalpy change and entropy change respectively as
Equation 5.34
Equation 5.35
Where
Equation 5.36
A, B, C and D are the characteristics of a particular fluid and are of constant values
for specific fluid regardless of operating conditions. Either C or D is zero depending
on the fluid.
is dimensionless, thus, the unit of depends mainly on the unit of
chosen. The values of A, B, C and D for the gases present in hydrate composition
for this study are presented in Table 5.3
5.6.2 Calculation of the wall shear stress
Equations 5.18 to 5.23 are necessary to calculate the wall shear stress. However,
and are respectively given by NS (2005) as
Equation 5.37
For multi-component fluid therefore,
Equation 5.37b
Equation 5.38
The only liquid for this study is water; therefore, is not a multicomponent
parameter. The data to calculate the hydrate density are presented in Table 5.4.

132
Table 5.3: Values of the constants in
(Smith et al,
2005)
Component A B (103) C (10
6) D (10
-5)
CH4 1.702 9.081 -2.164 0.000
C2H6 1.131 19.225 -5.561 0.000
C3H8 1.213 28.785 -8.824 0.000
n-C4H10 1.935 36.915 -11.402 0.000
n-C5H12 2.464 45.351 -14.111 0.000
N2 4.982 1.195 0.000 -0.792
CO2 5.457 1.045 0.000 -1.157
H2O (l) 8.712 1.250 0.000 -0.180
Table 5.4: Values for the mol. wt, and for the hydrate components (a TET,
2011a; bTET, 2011b)
Component Molecular wt
(Kg/Kmol)
(NTP)
(Kg/m3)
(STP)
(Kg/m3)
CH4 16.043 a 0.668
a 0.717
a 0.5537
b
C2H6 30.07 a 1.264
a 1.0378
b
C3H8 44.09 a 1.882
a 1.5219
b
n-C4H10 58.1 a 2.489
a 2.500
a 2.0061
b
n-C5H12 2.487 b
N2 28.02 a 1.165
a 1.2506
a 0.9669
b
CO2 44.01 a 1.842
a 1.977
a 1.5189
b
H2O (l) 18.016 a 0.804
a 0.804
a
Furthermore, the compressibility factor for each component, , can be calculated
using the Ptizer Correlations for the Second Virial Coefficient given as
Equation 5.39
Where
and
=
Equation 5.40

133
Equation 5.41
Equation 5.42
Thermodynamically for a multi-component system, and
can be respectively
represented as
Equation 5.43
Equation 5.44
Where and
are given by
Equation 5.45
Equation 5.46
Substituting Equations 5.43, 5.44, 5.45 and 5.46 into Equation 5.39 gives
Equation 5.47
Therefore
Equation 5.48
The required values for , and for the hydrate components are presented in
Table 5.5.
The associated water in the hydrate is considered incompressible; hence, the liquid
superficial velocity is given as
Equation 5.49
Also, the gas superficial velocity is expressed as
Equation 5.50

134
Table 5.5: Corresponding values of , for the hydrate components (Smith et
al, 2005)
Component (/K) (/bar)
CH4 0.012 190.60 45.99
C2H6 0.100 305.3 48.72
C3H8 0.152 369.8 42.48
n-C4H10 0.200 425.1 37.96
n-C5H12 0.252 469.7 33.70
N2 0.038 126.2 34.00
CO2 0.224 304.2 73.83
H2O (l) 0.345 647.1 220.55
is expressed by Lide (2006) as a function of temperature only as
Equation 5.51
While
Equation 5.52
However, equation 5.51 was considered for this study since the temperature range
used for this study is within this region. Also, since the main liquid in the hydrate is
water while the other component(s) which might liquefy within this temperature
range at a very high pressure are infinitesimal, is assumed to be equal to i.e.
Equation 5.53
The gas viscosity ( ) for the hydrate fluid was calculated using the Sutherland‘s
viscosity law with 3-co-efficient (FLUENTS Incorporated, 2001; Roux et al, 2008)
expressed as

135
Equation 5.54
Where
is the Viscosity in ; is the a reference value in ; is the a
reference Temperature ; is the static Temperature ; is the Effective
Temperature also known as Sunderland constant which, is the characteristic of the
gas .
Other set of data used to evaluate the model‘s performance include pH, specific
gravity, water density and others as stated in Table 5.6. At moderate temperature and
pressure, values for the reference points in Equation 5.54 are presented in Table 5.7.
Sutherland gave the viscosity law in 1893 from a kinetic theory by using an idealized
intermolecular-force potential. The solution flowchart for the simulation is displayed
in Appendix A.
Table 5.6: Other parameters used to test the model
Parameter Value
, Ambient temperature (K)* 298.15
, temperature at zero degree (K)* 273.15
, Temperature at standard condition, K (oF)* 288.70 (60)
Operating temperature, T ( )** 5, 6, 7, 8, ……, 13, 14, 15
Operating pressure (MPa)** 5, 7, 9, 11… 21, 23, 25
Atmospheric pressure (KPa)* 101.33
Typical liquid rate in pipelines, (m3/day)*** 100
Typical gas rate in pipelines, (m3/day)*** 10200
pH range**** 3.5 - 6.5
D, pipe diameter (inches)*** 12, 18, 24, 30, 36, 42, 48
K, Pipe roughness (m)**** 50*10-6
Where
* are from Smith et al (2005); ** are assumed based on the experimental results and
others factors; *** are typical natural gas flowrate in a pipe (CNL, 2007) and ****
are obtained from NORSORK STANDARD (2005).
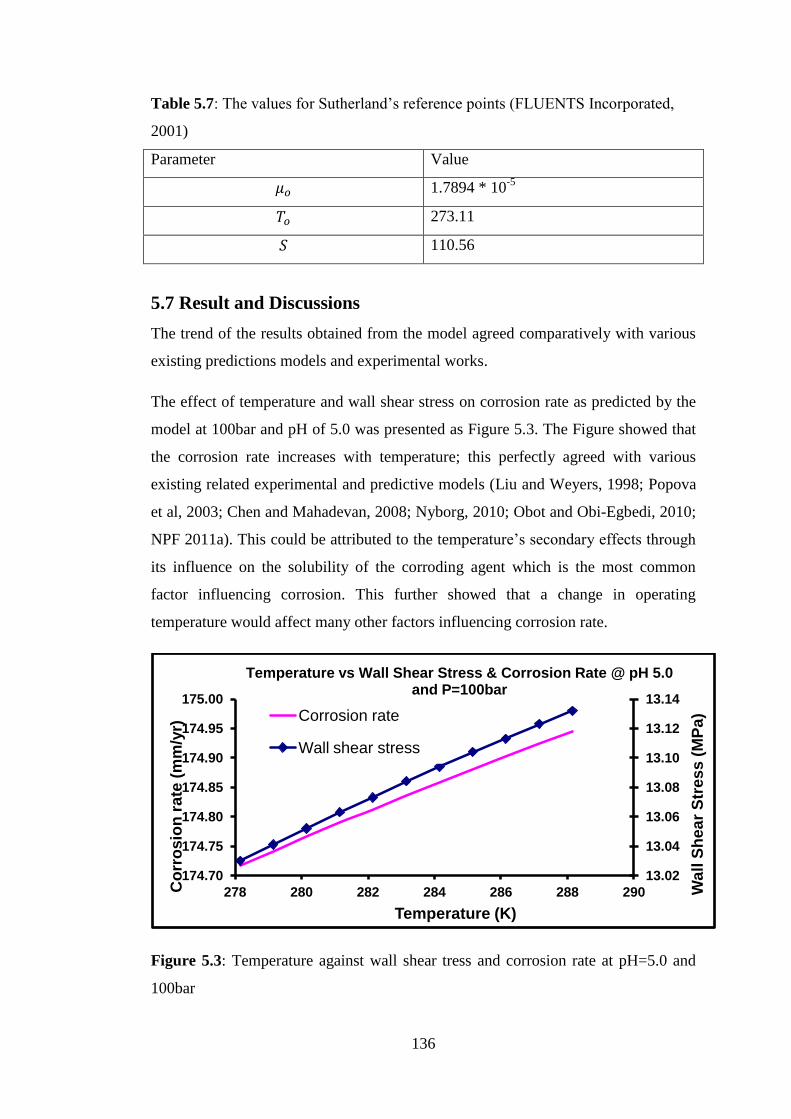
136
Table 5.7: The values for Sutherland‘s reference points (FLUENTS Incorporated,
2001)
Parameter Value
1.7894 * 10-5
273.11
110.56
5.7 Result and Discussions
The trend of the results obtained from the model agreed comparatively with various
existing predictions models and experimental works.
The effect of temperature and wall shear stress on corrosion rate as predicted by the
model at 100bar and pH of 5.0 was presented as Figure 5.3. The Figure showed that
the corrosion rate increases with temperature; this perfectly agreed with various
existing related experimental and predictive models (Liu and Weyers, 1998; Popova
et al, 2003; Chen and Mahadevan, 2008; Nyborg, 2010; Obot and Obi-Egbedi, 2010;
NPF 2011a). This could be attributed to the temperature‘s secondary effects through
its influence on the solubility of the corroding agent which is the most common
factor influencing corrosion. This further showed that a change in operating
temperature would affect many other factors influencing corrosion rate.
Figure 5.3: Temperature against wall shear tress and corrosion rate at pH=5.0 and
100bar
13.02
13.04
13.06
13.08
13.10
13.12
13.14
174.70
174.75
174.80
174.85
174.90
174.95
175.00
278 280 282 284 286 288 290 Wa
ll S
hea
r S
tres
s (
MP
a)
Co
rro
sio
n r
ate
(m
m/y
r)
Temperature (K)
Temperature vs Wall Shear Stress & Corrosion Rate @ pH 5.0 and P=100bar
Corrosion rate
Wall shear stress

137
Specifically, Figure 5.3 showed that within the studied hydrate formation
temperature range and 100bar, the minimum corrosion rate for the transportation
pipeline is about 175mm/yr (0.48mm/day) while the wall shear stress is also
increasing at high rate. This is alarming since at this rate, the pipeline may be subject
to permanent failure within weeks due to continuous usage of the pipeline. This is
true since hydrate chips will be increasing in size and this will initiate more pitting
and crevice corrosions.
Also, the Figure agreed with related studies to show that corrosion rate increases
with the wall shear stress (Ahammed and Melchers, 1997; Vlachos et al, 1997;
Wharton and Wood, 2004). Corrosion can be accelerated by stress through either
residual internal stress in the pipe or externally applied stress (Ginzel and Kanters,
2002; Mochizuki, 2007). Residual stresses are usually produced by deformation
during the pipeline fabrication, unequal cooling from high temperature and /or the
internal structure arrangements that involve the volume change. The geometrical
changes and any obstacles in the flow regime also give rise to higher shear stress.
Again, the the different flow regimes and geometrical obstacles may generate
flunctuation in shear stress at those points where the shear stress peaks may be
considerably higher than the average shear stress.
As the operating pressure increases, the erosion-corrosion rate increases while the
velocity loss also increases (Figure 5.4). The obtained pressure-corrosion rate
relationship is true considering the thermodynamic properties of hydrate formation
(Sarshar et al, 2010). Increasing the operating pressure would lead to increase in
velocity along the pipe-length, this would increase agitation in the transport fluid
which would aid hydrate formation through turbulence (Moon et al, 2003; Anderson
et al, 2007; Wenji et al, 2009). At choke also, temperature drop will be experienced
through Joule Thompson effects to further promote the formation (Harun and Watt,
2009) while the presence of welded spots (elbows, tee, etc), dirt, scales, slits and
sands along the pipe will make good nucleation sites and the available free-water
will be an enhancer due to gas-water interface. With time, the formed hydrates will
increase in quantity and size through agglomeration inside the pipeline. This will
cause reduction in the pipe‘s orifice, thus, resulting into velocity loss. This ultimately
results into line plugging, pressure build-up and eventual pipeline rupture.

138
Figure 5.4: Pressure against velocity loss and corrosion rate at 15oC and pH=5.0
The impact of pH on the eventual corrosion rate along the longitudinal section of a
pipeline depends on the soluble corroding agent and the type of metal used for the
pipe‘s construction. If the metal is acid soluble, the corrosion rate is controlled by the
rate of transport of available oxidiser to the metal surface. Amphoteric metals such
as aluminium and zinc dissolve rapidly in acidic or basic solutions to aid corrosion
while noble metals such as gold and platinum are not appreciably affected by pH.
Figure 5.5: Impact of pH on corrosion rate
Figure 5.5 perfectly agreed with NPF (2011b) that pH hardly influences corrosion
rate of iron within the pH region of 4 - 10. Within this range, corrosion rate of iron is
relatively independent of pH for it is governed mostly by the rate at which oxygen
-25.00
-20.00
-15.00
-10.00
-5.00
0
50
100
150
200
250
300
0 100 200 300 400 500
Velo
cit
y L
oss (
m/s
)
Co
rro
sio
n R
ate
(m
m/y
r)
Pressure (bar)
Pressure Vs Velocity Loss & Corrosion Rate
Corrosion rate
50
100
150
200
250
300
3.5 4.0 4.5 5.0 5.5 6.0 6.5 7.0 Co
rro
sio
n R
ate
(m
/yr)
pH
pH Vs Corrosion rate

139
would react with the absorbed atomic hydrogen. This will depolarize the pipe‘s
surface and allow continuation of the reduction reaction.
Ferrous oxide (FeO) is however soluble below pH of 4 and would dissolve upon
formation rather than being deposited on the metal surface for film formation. The
pipe‘s surface will directly be in contact with the acid solution due to an absence of
the protective film, and this will result in sharp increase in corrosion rate. At this
lower pH range, corrosion rate is dependent on both the depolarization of oxygen
and hydrogen evolution since hydrogen will be produced in the acid solution at this
lower pH range. Above pH of 10, corrosion rate decreases with an increase in pH
probably due to the increase in reaction rate of oxygen with hydrated FeO (Fe(OH)2)
to form a more protective FeO in the oxide layer.
The sharp variation noticed at pH of 4.6 in Figure 5.5 is due to the change in the
corrosion modelling formula at this point as indicated by Equations 5.16 and 5.17.
This further confirmed the activeness of the developed MATLAB code for
simulation.
5.8 The Limitations of the Model
Since the parameters needed for the model are subjective to various operating
conditions and often change with distance within the pipe-length, the model could be
thought of as being a point corrosion rate model. Nonetheless, since the model
makes use of some physical data such as temperature and pressure, other parameters
such as concentration, composition e.t.c. could be assumed to be constant over a few
kilometers to reduce the iteration of measurement. This assumption could be costly.
Also, where gases such as CO2, H2S, O3, and other organic and inorganic gases are
present, this model should be modified to accommodate the contributions of each
agent to corrosion rate of the pipeline.
Finally, the generated results from this model were calculated without full
consideration being given to corrosion inhibitors, like the introduction of glycol.
When these inhibitors are present (which is common in pipeline systems) their
effects must be evaluated separately.

140
5.9 Conclusions
The model adequately predicted the pipe‘s shelf-life due to corrosion initiated
through hydrate formed within a pipeline transporting natural gas at deepwater
location and its effectiveness is confirmed by the ability of its plotted trends which
agree with existing literatures. The resulting corrosion rates from this model
increased with temperature, pressure and wall shear stress. This is in agreement with
the existing mathematical and experimental reports, hence, the reliability of this
predictive model. The resulting corrosion rate from hydrates could be as high as
174mm/yr (0.48mm/day). This is extremely alarming compared to the industry‘s aim
to operate below 2mm/yr. At this rate, a pipeline would be subjected to full bore
rupture within some days if corrective actions are not quickly taken. This extreme
increase in corrosion rate will negatively impact operation by reducing the pipe-shelf
life as well as the pipe‘s integrity. Also, increase in operating pressure increases the
hydrate formation temperature. This increase in temperature will have secondary
effects through its influence on the solubility of the corroding agent(s). Since CO2 as
the corroding agent for this study is very soluble in the formation water, any change
in temperature would have resulting effects on other factors influencing the
corrosion rate.
Again, an increase in operating pressure increases the erosion-corrosion rate as well
as the velocity loss along the pipeline system. Finally, further work should be done
on improving this model to accommodate other operating conditions experienced
during the gas transport operation.
141
6. Application of Component Interactions for Gas Hydrate
Inhibition
6.1 Background
Chapter 5 has shown that the rate at which gas pipelines corrode as a result of
hydrate formation is significantly very high, hence, the need to investigate some
avenues of inhibiting the formation. Corrosion rate highly depends on gas
composition, therefore, there is need to investigate the contributions of the
components before a deceleration options could be ascertained. CH4 and CO2 are the
major components for sweet gas (and Australian fields majorly produce sweet).
These two gases are also strong guests for Type I gas hydrates. Using ‗Temperature
Search‘ method, this chapter investigated the consequences of CH4 and CO2 varying
compositions in gas stream on formation temperatures. Finally, the use of pure H2
and N2 gases to inhibit the resulting effects was investigated. This chapter goes a
long way in proposing a solution that could help the gas industry to minimize the
pertinent hydrate problems that have besieged the industry for several years.
6.2 Introduction
The quality of natural gas at a particular location is measured by its methane (CH4)
content, the higher the CH4 content, the better the gas field. This is informed by the
industrial desire for gases ≥96% CH4 composition as sales gas as a result of its high
caloric value as fuel which is the quantity of heat produced by its combustion.
Studies have shown that gas hydrates are formed due to interactions between water
and the gas components. These interactions could be functions of gas composition,
concentration and operating conditions.
Various studies have been conducted on component interactions within the resulting
gas hydrates. Snell et al (1961) investigated the initial hydrate conditions for C2H4-
H2O and CH4-C2H4-H2O systems. They finally compared the experimental and
predicted hydrate forming conditions for several mixtures of CH4-C2H4-C3H6-H2O
hydrate formation systems. Again, Ma et al (2001) used the ―pressure search‖
method to study the CH4+C2H4 and CH4+C3H6 interactions in a cylindrical

142
transparent sapphire cell and finally presented valuable data that could be used to test
the existing hydrate models and softwares. Furthermore, Fray et al (2010) measured
three-phase (ice + clathrate hydrate + vapour) equilibrium in a water system with
xenon (Xe), CO2 and CH4 as guest species. The generated results were used to
determine the empirical laws that could be used to calculation the equilibrium
pressure of pure Clathrates at all temperatures. Using the ‗Pressure search‘ method,
Li et al (2010c) also reported the ability of Tetrabutyl Ammonium Bromide to
remarkably reduce the equilibrium hydrate formation pressure of CO2+H2 hydrate.
This study primarily investigated the CH4+CO2 gas mixture because Australia gas
fields have been identified to be rich in high level of CO2 content. A typical example
is the Gorgon Project with 14% CO2 content as explained in Chapter 2. This CO2
would have passed through the underwater pipeline systems before the separation at
Barrow Island is carried out.
‗Temperature search‘ method was employed for this study and all the experiments
were conducted in a cylindrical transparent sapphire cell. This method allows the gas
industry to operate at any desired pressure while the hydrate formation temperature
is controlled. By this, there will be no restriction to the operating conditions of the
industry, hence, no negative impact on the net profit margin except for the additional
investments resulting from utilizing any recommendations from this study.
6.3 Methodology
6.3.1 Reagent, Materials and Equipment
This study was carried out inside the same Cryogenic Sapphire Cell at the Clean Gas
Technology Unit of Curtin University, Australia as explained in chapter 3.3 but with
several modifications. The modifications included preparation of CH4+CO2
mixtures, CO2 +H2 mixtures, CH4+H2 mixtures, CH4+CO2+N2 mixtures and
CH4+CO2+H2 mixture for investigations. All the gases used are industrial grades and
the hydrate formation temperature was monitored for each set of experiment at
100bar, 125bar, 150bar, 175bar and 200bar.

143
6.3.2: Preliminary Study
HYSYS software was used to initially predict the hydrate formation temperature of
each gas mix at the chosen pressures for estimates. This assisted in saving
experimentation time.
6.3.3 Preparation of Experimental Gas Mix
CH4 and CO2 gases were used for the first set of studies while H2 and N2 were
subsequently added to these gases for further investigations. Each gas mix was
prepared by the following two steps. The first step was achieved by the use of a
transducer to fill a specific gas into a 500cc cylinder bottle and the second step was
by weighing the quantity of the gas in the bottle. The second step was necessary to
confirm the accuracy of the first step. Subsequent steps were taken as well before the
experimental runs.
When filling a specific gas, a cylinder steel bottle was first vacuumed and weighed
with an electrical weighing balance. The 500cc bottles were then filled with the gas
using an electrical transducer that was fitted to the main gas cylinder at one end and
the bottle at the other end. While other gases were filled directly from the main gas
cylinder to the bottle, CO2 gas had to be heated to 60oC before filling in order to
prevent CO2 gas from undergoing partial condensation during experimentation.
The quantity of each gas needed for each experiment was determined as a calculated
ratio following the general gas equation principles as shown in Equations 6.1 – 6.13.
The general gas equation is given as
Equation 6.1
Where
is the Pressure of gas component n (bar); is the Volume of gas component n
(cc); is the Number of mole of component n (mol); is the Desired operating
Temperature (oC) and is the Universal gas constant (lit.barK
-1mol
-1).
In case of two gas mix (CO2 and H2 for example),
Equation 6.2

144
Equation 6.3
Dividing Equation (6.2) by Equation (6.3) gives
Equation 6.4
Since the volume of the cylinder to be used is fixed, then,
Equation 6.5
This implies that
Equation 6.6
Equation (6.6) was then used to work out the quantity of each gas to be pressurized
into the sapphire cell at a certain gas mix.
Consider 20% mol of CO2 and 80% mol of H2, and taking 100 moles as basis, then
Equation 6.7
4
Equation 6.8
i.e.
Equation 6.9
For this system therefore
Equation 6.10
Though, the experiments were conducted inside the sapphire cell in bar, the available
laboratory gauge could only measure in psi, thus, the need for conversion.
According to Smith et al (2007)
Equation 6.11
Therefore a successful operation at 80% H2 and 20% CO2 gas composition and
100bar requires 294psi (20 bar) of CO2 and 1176psi (80 bar) of H2.

145
After using the calculated pressure ratio to fill the cylinder bottles with the desired
gases, weight was used to confirm accuracy before the experimentation. This was
achieved by weighing the bottles again to calculate the weight difference as shown in
Equation 6.12 with a typical example given as Table 6.1.
Equation 6.12
Where
is the initial weight before filling the cylinder, is the Weight of the gas filled
into the cylinder (Mass difference) and is the final weight after filling the
cylinder.
Table 6.1: Typical measured values for H2 and CO2 mixture during the experiments
Cylinder 1 Cylinder 2 Cylinder 3
Empty
(E)
E + H2 H2 E E + H2 H2 E E +
CO2
CO2
1276.98 1278.68 1.70 1597.50 1599.21 1.71 1359.20 1377.79 18.59
P (psi) 793 P (psi) 782 P (psi) 394
The accuracy of the filled in gases was determined by the ratio of the weighed
differences as given by Equations 6.13 – 6.20.
Equation 6.13
For CO2 and H2 for instance,
Equation 6.14
Equation 6.15
From 6.13 and 6.14, the weight ratio is given by
=
Equation 6.16
Molar masses for the two gases are given respectively as

146
;
Equation 6.17
Therefore, Equation 6.15 becomes
Equation 6.18
For 20% mol CO2 + 80% mol H2 as earlier calculated in section 6.3.4, the mass ratio
will be
Equation 6.19
Equation 6.20
This simply means that, filling the cylinders A and B for CO2 (20% mol) and H2
(80% mol) respectively, increase in weight A ( ) will be 5.5 times that in
where is the weight of gas component .
As an example from Table 6.6, the pressure ratio was calculated as
Quantity of CO2 (psi) = 394
Quantity of H2 (psi) = 793 + 782 = 1575
Therefore,
**
The mass ratio was calculated as
Total mass of CO2 = 18.59
Total mass of H2 = 1.70 + 1.71 = 3.41
Therefore,
***
Comparing the values from Equation (**) with Equation (6.7) with further
comparison of Equation (***) with Equation 6.20 confirmed the accuracy of this gas

147
mix. These calculations and confirmations were repeated for all the gas mixes
throughout the experimentation.
6.3.4 The study of Hydrate formation points
Prepared gas mixtures containing CH4, CO2+H2, CH4+CO2, CH4+CO2+N2 and
CH4+CO2+H2 were individually fed into the sapphire cell, each at an
experimentation time through V9 (Figure 3.1) while 5ml of Millin-Q water (the
liquid phase solution) was injected into the cell through V5. The system was heated
up to TB of 25 oC, operating pressure was set at 100 bar while the Tset was set at
15oC. The experiment commenced by switching on the system while the Tset was
gradually and systematically reduced through the cooling system. The chillers was
switched off immediately the hydrate particles were noticed in order to stop further
supply of external cooling to the system, the formation temperature was recorded
and the hydrate behaviours were visually observed. The beginning and end of
dissociation studies were then carried out and recorded as explained in section 6.3.7.
This set of experiments was then repeated for the same gas composition at 125bar,
150bar, 175bar and 200bar respectively and all the data recorded. The system was
then purged, vented and cleaned before changing the gas composition.
6.3.5 The Experimental Sequence
The experimental study sequence was divided into two separate parts. The first part
considered the consequences CH4 and CO2 compositions in natural gas mix. The
second part considered the application of H2 and N2 gases for inhibition purposes.
This was carried out by addition of these two gases (one at a time) to the CH4+CO2
gas mixtures. These two gases were considered because H2 does not form hydrate at
any pressure and temperature while N2 can only form hydrates at a very high
pressure. Each of the following was investigated.
a. CH4 hydrate study
Experiments were conducted on industrially prepared methane gas in the sapphire
cell at 100bar, 125bar, 150bar, 175bar and 200bar. The experiments were divided
into three parts which included a study on the formation temperature, beginning of
dissociation and the end of dissociation. All generated data were properly recorded
and stored.

148
b. CO2 hydrate study
Studies were carried out on CO2 hydrates. This very study was technical due to the
ability of CO2 to undergo partial condensation at a very low temperature. To solve
this problem, hydrogen gas was mixed with the desired percent of CO2 gas. Initially,
10% mol CO2 was mixed with 90% mol H2 gas for experimentation. This was later
changed to 20%CO2 +80%H2. H2 gas was considered as a mix because H2 gas forms
hydrate at about 2000bar, therefore, it is inert at these experimented pressures. By
this claim, the gas would have absolutely no effect on the hydrate formation point of
the CO2 gas.
c. CH4+CO2 hydrate study
After the individual studies, a gas mix of CH4 and CO2 was then fed into the
sapphire cell to enable a study on typical natural gas composition in the pipelines.
d. CH4+H2 hydrate study
Effect of hydrogen gas on CH4 hydrate formation temperature was study at all the
pressures. This is necessary to investigate the impact(s) of H2 gas on CH4 hydrate
properties.
e. CH4+CO2+H2 hydrate study
H2 gas was later added to the CH4+CO2 mixture and the hydrate formation
temperatures were studied at all experimental pressures. This was to investigate the
impact of H2 gas on real natural gas environment.
f. CH4+CO2+N2 hydrate study
Another round of experiments were conducted by adding N2 gas to the CH4+CO2
mixture and the hydrate formation temperatures studied at all experimental
pressures. This was also to investigate the impact of N2 gas on real natural gas
environment.
6.3.6 Beginning and end of dissociation study
Beginning and end of dissociation study was carried out on each composition under
study. Beginning of dissociation point is the temperature where the first solid

149
hydrate turns to liquid while end of dissociation is that point where the last hydrate
solid turns to liquid form.
These were determined for each composition through physical observations.
Immediately the hydrate was formed, the chiller was switched off to prevent further
supply of external cooling effects to the system and the system temperature was
allowed to rise on its own accord till the hydrate begins to dissociate. This required
heat needed to raise the temperature was naturally transferred from the environment
to the enclosed system. The temperature where the first liquid was formed was
recorded while the heating continues till all the solid turned to liquid. The final
temperature was also recorded.
6.3.7 Instrumental Analysis of Gas Composition
After each experiment, the compositions of the gas in the cell were instrumentally
analysed in order to compare with that estimated. The estimation was carried out
through calculation and filling the cylinders at the calculated ratios using the
pressure transducer while the actual value was measured using a gas transmitter.
The gas transmitter used for the analysis was a PolyGard (R) Transmitter
manufactured by MSR in Germany with serial number No: 38/08. It was an AT-A2-
3400-4-001 model with 100% Vol. CH4. It had an alarm controller system attached
with model MGC-03-02-02-9-110005011. The alarm system which was also
manufactured by the same company had a serial number of 03-31/08. The equipment
had a rating of 230V, AC/0.1VA and input of 4-20mA. To analyse, a rubber tube
was connected from the outlet part of the cell to the inlet part of the analyzer. The
gas inside the cell was then gradually released for the transmitter to read. The gas
composition, displayed in percentage was read off and the value compared to the
previous estimated value for precision.
6.3.8 Precautions
All the experimental and equipment precautions stated in section 4.3.3 were
observed. Further precautions taken for this study included carrying out pressure test
on the cell before starting the experiments. This was carried out to make the system
leak-proof. A leak within the system could lead to discharge of hazardous gas(es) to
the environment and/or explosion in the laboratory when operating at high pressure.
150
The pressure test was carried out after the system had earlier been decoupled and
sent for a proper industrial cleaning. The system was coupled back, vacuumed, filled
with N2 gas, and pressurized at 150bar for 30 minutes. Generally, the system
pressure used to increase at the initial stage of pressurization. The leakage is bound
to be noticed either during the pressurizing because at a point, there will be a sudden
drop in cell pressure. Alternatively, after reaching the 150bar, the cell pressure
would start dropping after few minutes. A chemical ―Gas and Air Leak Detector‖
was sprayed at all joints to enable location of the leaking point or joint. In case this
failed, the system would need to be re-pressurized but this time, some sections of the
system would be closed while others left opened in order to isolate the leaking
point(s). To achieve this, the whole system was sectionalized into the feeding unit,
the piston pump unit and the cell unit. After locating a leak, the point would be
tightened and the pressure test repeated till a stable pressure was achieved for the 30
minutes period.
Also, since the gas composition was used for a set of pressure range, it could have
been wise enough to just reduce the operating pressure for the next experiment. This
would have dissociated the hydrates formed at higher temperature. However, wrong
results would have been generated if this was done because the gas composition
would not have been at equilibrium. To prevent this error, the cell was heated to
30 o
C and left for about 2 hours before the next experimentation. The heating to such
temperature released all the gas that had dissolved into the liquid phase while the
2-hr time lag allowed both the liquid and gaseous phases to be at equilibrium with
one another before the next experiment. After these precautions, the statistical
analysis on the generated data gave the maximum experimental error of 1.68%. This
was acceptable since the confidence level was above 95%. This confirmed the
accuracy of the generated data set.
6.4 Results and Discussions
6.4.1 Validity of generated data set
The validity of the generated data sets for all the conducted gas mix was
investigated. This was carried out by plotting them all on a chart (Figure 6.1) and

151
their trends compared with those on similar study presented by Ma et al (2001) and
Li et al (2010c). For each gas mixture from this study (regardless of the
components), the formation temperature increases with pressure, and this trend is in
perfect agreement with those from existing literatures. This validity test indicated
that this study is reliable within the limit of experimental errors.
Figure 6.1: Gas hydrate formation point by component
6.4.2 Studying the characteristics of pure CO2 hydrates
This study was conducted by investigating the hydrate formation characteristics of
10% CO2 and 20% CO2. It was observed that the 10%CO2 did not form hydrate even
at 200bar whereas the 20%CO2 formed. Figure 6.2 showed that CO2 form hydrate at
comparatively low temperatures and high pressures. At pressures close to 100bar, the
chart showed that CO2 might not form hydrate till the whole liquid is solidified.
However, exception to all these took place when the gas was mixed with CH4 as
obtainable in natural gas.
At all pressures, the hydrate particles started forming inside the liquid and travelled
to the interphase in the tangential form according to the direction of agitation. The
formation was very rapid with the particles independent of one another. 5 minutes
after, the particles started to form slurries that look like ‗corn flakes‘ and suspended
at the interphase. However, the growth rate, even at 200bar, was very slow to the
extent that, the particles were still independent at 0oC. Visual observation showed
that the hydrates were thinly deposited at the wall of the glass within a short
-2
0
2
4
6
8
10
12
14
16
90 110 130 150 170 190 210
Form
atio
n T
em
pe
ratu
re (o
C)
Pressure (bar)
Gas hydrate formation point by component
CH4 74%CH4+26%H2
83%CH4+17%H2 28%CO2+72%H2

152
thickness of about 1 mm while others kept moving within the liquid phase. The
stirring rate was later increased vigorously to study the impact but there was not
change. The same observations were made at other pressures for this composition;
however, different formation temperatures were obtained as a function of pressure
(Figure 6.2). While the hydrates were pronouncedly noticed at 150bar and above, it
was hardly noticed at 125bar and was formed below 0oC at 100bar.
Figure 6.2: A chart on CO2 hydrate formation pattern
6.4.3 Methane and methane mixture hydrates
This study was conducted to understudy the implications of having other
components with methane gas in the pipeline during natural gas transport.
The characteristics of hydrates generated from CH4 and its mixture with CO2 and H2
are presented as Figure 6.3. Pure CH4 showed a strong ability to form hydrate at all
experimented pressures. This is justified by its small molecular size range of 4.4-5.4
Å which is capable to occupy the small and large cages to form Type I hydrate.
Though, CO2 also falls within the same molecular size range, it could not exhibit this
same hydrate formation behavior with CH4 due to its solubility. CO2 is readily
soluble in water while CH4 is sparingly soluble.
At about 110bar however, the hydrate forming part of CO2 gas became suddenly
activated when mixed with CH4. Figure 6.2 showed that the CH4+CO2 mixture is
more hydrate prone compared to CH4 gas at all pressures above 110bar. This might
be due to the combine property effects of the two guests on hydrate formation point.
-2
-1
0
1
2
3
4
5
90 110 130 150 170 190 210 Form
atio
n t
em
pe
ratu
re (
oC
)
Pressure (bar)
CO2 hydrate formation pattern

153
Also, the Figure clearly showed the inhibition ability of H2 gas by seriously reducing
the hydrate formation temperature at all pressure. The ability to this could be
attributed to the fact that hydrogen forms hydrate at a very high pressure of about
2000bar but not these pressure and temperature. Introduction of H2 gas also
discourage agglomeration of the hydrates.
Figure 6.3: Hydrate characteristics of methane and gas mixtures.
For 100% CH4, the formed hydrate was very whitish like snow. It was formed at the
interphase as tiny flocs that gradually increased in size and kept building up
downward into the liquid. At all pressures, the hydrate particles rapidly
agglomerated to produce slurry, which solidified to block the whole orifice within a
period range of 5 minutes at 100bar and 3 minutes at 200bar. This showed that the
uncontrolled presence of CH4 within natural gas is very ‗poisonous‘ to pipeline
industry.
The hydrates from CH4+CO2 were formed within the waterbody but quickly
travelled to settle at the water-gas interphase. The hydrate cloud was usually formed
within the waterbody and travelled fast to the interphase to join and stick to the
existing hydrate particles for fast agglomeration. The growth rate at all pressures was
observed to be significantly very high. At 200bar and Tset of 5oC, the whole liquid
turned to hydrate block within 8 minutes of spotting the first hydrate particle and
further 3 minutes stopped the stirrer (blocked hydrate formation). This showed that
gas within this compositional value could be extremely troublesome for pipelines in
Australia at winter period. Various analyses have shown that Australian gas fields,
7
8
9
10
11
12
13
14
15
16
90 110 130 150 170 190 210
Form
atio
n T
em
pe
ratu
re (
oC
)
Pressure (bar)
Comparison of CH4, (CH4+CO2) and (CH4+H2) hydrate formation points
CH4 (CH4+CO2) (CH4+H2)
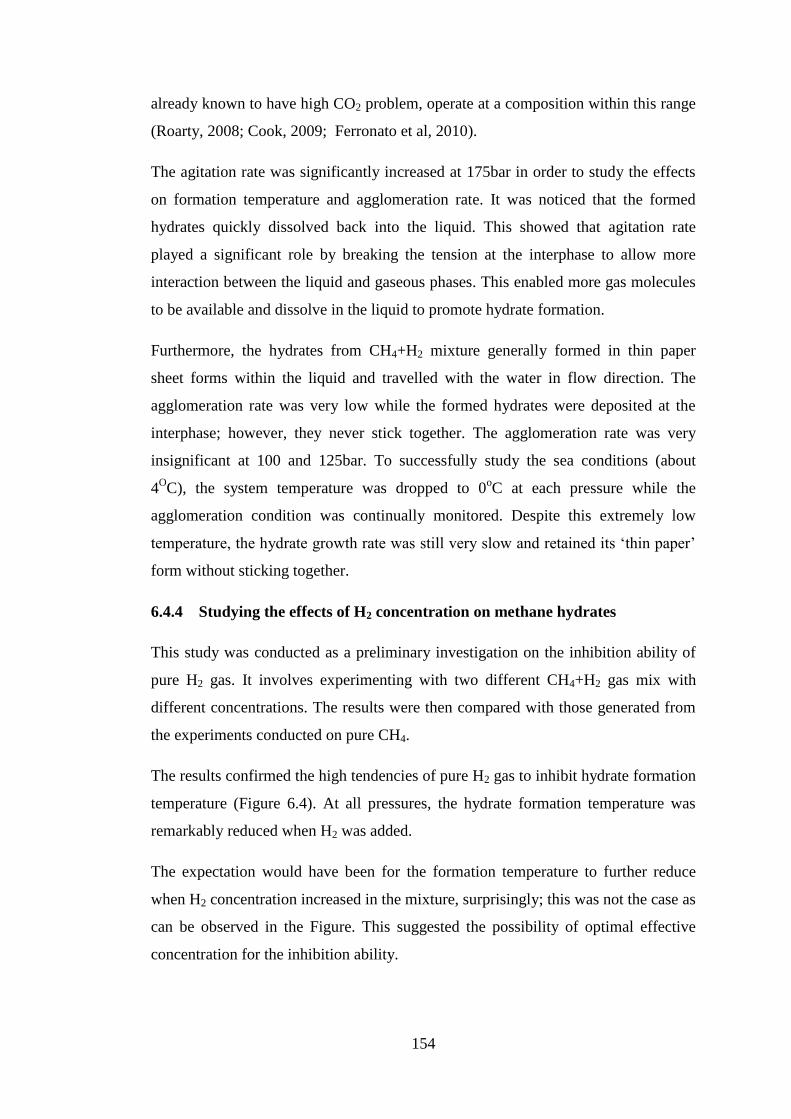
154
already known to have high CO2 problem, operate at a composition within this range
(Roarty, 2008; Cook, 2009; Ferronato et al, 2010).
The agitation rate was significantly increased at 175bar in order to study the effects
on formation temperature and agglomeration rate. It was noticed that the formed
hydrates quickly dissolved back into the liquid. This showed that agitation rate
played a significant role by breaking the tension at the interphase to allow more
interaction between the liquid and gaseous phases. This enabled more gas molecules
to be available and dissolve in the liquid to promote hydrate formation.
Furthermore, the hydrates from CH4+H2 mixture generally formed in thin paper
sheet forms within the liquid and travelled with the water in flow direction. The
agglomeration rate was very low while the formed hydrates were deposited at the
interphase; however, they never stick together. The agglomeration rate was very
insignificant at 100 and 125bar. To successfully study the sea conditions (about
4OC), the system temperature was dropped to 0
oC at each pressure while the
agglomeration condition was continually monitored. Despite this extremely low
temperature, the hydrate growth rate was still very slow and retained its ‗thin paper‘
form without sticking together.
6.4.4 Studying the effects of H2 concentration on methane hydrates
This study was conducted as a preliminary investigation on the inhibition ability of
pure H2 gas. It involves experimenting with two different CH4+H2 gas mix with
different concentrations. The results were then compared with those generated from
the experiments conducted on pure CH4.
The results confirmed the high tendencies of pure H2 gas to inhibit hydrate formation
temperature (Figure 6.4). At all pressures, the hydrate formation temperature was
remarkably reduced when H2 was added.
The expectation would have been for the formation temperature to further reduce
when H2 concentration increased in the mixture, surprisingly; this was not the case as
can be observed in the Figure. This suggested the possibility of optimal effective
concentration for the inhibition ability.

155
Figure 6.4: Effects of varying H2 concentration on methane hydrates
6.4.5 The effects of concentration variation on sweet gas hydrates
The effect of concentration variation of the hydrates from sweet natural gas was
studied through the CH4+CO2 gas mixture. This study was important considering the
variations in gas composition from field to field and from region to region.
Knowledge from this study would assist in predicting the hydrate expectations from
a field based on the gas composition. A set of experiment was conducted on two
different gas mixtures with the same compositions but 2% concentration variation.
The experiments were conducted at the five pressure points.
From Figure (6.5), it could be seen that the presence of CO2 in the gas mixture
reduced the hydrate formation temperature. Considering the CH4+CO2 gas mix, the
difference in the hydrate formation point at each pressure is significantly large
despite just a slight variation of 2% in their concentrations (Figure 6.5).
Further observation of Figure 6.5 showed that the gas mix with 22%CO2
concentration was able to promote hydrate more than that of 20%CO2; this may
probably be due to the combined hydrate promotional effects of the individual
component. It could be further noticed from the Figure that the difference increases
with pressure. This gives more credence to the explanation from section 6.4.2 that
CO2 gas has the ability to display greater hydrate promotional tendencies at higher
pressures.
6
7
8
9
10
11
12
13
14
15
16
90 110 130 150 170 190 210
Form
atio
n T
emp
erat
ure
(oC
)
Pressure (bar)
Effects of varying H2 concentration on methane hydrates
83%CH4 + 17%H2 74%CH4 + 26%H2 CH4

156
Figure 6.5: Effects of concentration variation on CH4+CO2 gas hydrates
6.4.6 The effects of N2 and H2 on hydrates formation temperature
Effects of N2 and H2 on hydrate formation temperature were individually studied in
order to investigate their abilities to inhibit the formation of gas hydrates. A positive
achievement in this area would suggest a cost effective process of handling this flow
assurance problem along the deepwater pipelines. For the first study, 10%N2 was
added to 100% (CH4+CO2) and then normalized to final 100%. A gas mixture,
prepared based on the normalized composition was then studied in the sapphire cell
at all the five pressures for the formation temperatures, beginning of dissociation and
end of dissociation. After this set of experiments, the cell was vacuumed, thoroughly
cleaned and vacuumed again. These same experiments were repeated for 10% H2.
The results were processed for analysis and comparison, and finally presented as
Figure 6.6.
The effects of the two gases on gas hydrate were glaringly shown in the Figure 6.6.
The two gases were able to remarkably reduce the formation temperature at all
pressures. However, the reduction ability of H2 gas was very much significant
compared to N2 gas (Figure 6.7).
8
9
10
11
12
13
14
15
90 110 130 150 170 190 210
Form
atio
n T
em
pe
ratu
re (
oC
)
Pressure (bar)
Effects of component concentrations on CH4+CO2 gas hydrate
78%CH4 + 22%CO2 80%CH4 + 20%CO2

157
Figure 6.6: Effects of pure N2 and H2 gases on gas hydrate formation.
Figure 6.7: Comparison of inhibition trend between H2 and N2
The sharp difference in the hydrate inhibition capability of the two gases may be due
to their abilities to individually form gas hydrate. N2 gas, with small molecules forms
Type II hydrate at a relatively higher pressure above the experimented pressures but
can still form hydrate within other higher operating pressures practice at gas fields
during the gas transportation. However, H2 gas can never form hydrate at any natural
gas transportation conditions. H2 gas can form hydrates at extremely high pressure of
about 2000bar because its molecules are too small and usually leaked out of hydrate
cage, thus, reducing the amount that could be stored. By extension, these individual
properties affect their interactions with natural gas during the hydrate formation
process.
8
9
10
11
12
13
14
90 110 130 150 170 190 210
Form
atio
n T
em
pe
ratu
re (
oC
)
Pressure
Effects of N2 and H2 on gas hydrate formation
(CH4+CO2) (CH4+CO2+H2) (CH4+CO2+N2)
0
2
4
6
8
10
12
14
16
18
90 110 130 150 170 190 210
Re
du
ctio
n (
%)
Pressure (bar)
Hydrate reduction trend with corresponding pressure point
H2 N2

158
The observed downward and upward trend for the Nitrogen gas in Figure 6.7 may be
due to diffussional resistance at higher pressures. At lower pressure, nitrogen
molecules could move more easily between the hydrates. However, increasing the
pressure causes the hydrate particles to become more compact and then proxy
between the particles will decrease; this will result in increase of the diffusional
resistance to the nitrogen molecules. However, at these higher pressures, hydrogen
molecules are small enough to still penetrate. This justification should be further
investigated experimentally.
Further laboratory observations showed that hydrates produced after adding each of
these two gases were very tiny with low agglomeration rates. In actual fact,
agglomeration was not taking place at all for H2 mixture at all pressures. The floating
hydrates remained in tiny bits throughout. For N2, agglomeration was hardly noticed
at 100bar while the rate was almost ignorable at other investigated pressure points up
to 4o below the formation temperature. The formed hydrate particles were only
floating at the liquid phase without any agglomeration. The hydrates were very
distinct while the liquid phase was very clear.
Though, this could be pointing towards the preference for H2 gas as inhibitor,
however, care must be taken by considering other factors such as safety, cost
implications, material availability and recovery before a final decision could be
taken. Any dissociation of H2 as a result of partial pressure would easily initiate
internal corrosion along the pipeline; whereas, N2 as an inert gas is less dangerous.
6.4.7 Study on software prediction accuracy
Industrially, there are many available software packages in use to predict the hydrate
formation temperatures for both gas and liquid mixtures. Some of these packages
include HYSYS, PVTsim, OLGA, e.t.c. This thesis conducted this part of the study
on HYSYS since it was the Software used to roughly estimate the formation
temperatures before the laboratory experimentations. This study was conducted by
comparing the outputs from HYSYS software to those generated from the
experimental sets. The HYSYS outputs were generated through the Hydrate
envelope in the software after supplying the composition, concentrations and other
operating conditions while the experimental data were generated through the

159
Sapphire cell equipment with strict precautions. For a robust study, the experimental
aspect included investigating the hydrate formation temperature, the beginning of
dissociation and the end of dissociation on four different types of gas mixtures.
All the results as shown in Figure 6.8 (a-d) gave exactly almost the same trends. The
Figures revealed that the HYSYS predictions are closely the same with the values
obtained as end of dissociation. It can then be deduced that the software has been
predicting the end of dissociation value instead of the actual hydrate formation point.
Nevertheless, this ability of the Software to predict values that are a bit higher could
be viewed as a preventive guide to the industry.
Figure 6.8a: Comparing the HYSYS and experimental results for CH4+H2
Figure 6.8b: Comparing the HYSYS and experimental results for CH4+CO2
6
8
10
12
14
16
18
90 110 130 150 170 190 210
Form
atio
n T
em
pe
ratu
re (o
C)
Pressure (bar)
HYSYS predictions vs exp. results for CH4+H2 mixture
Formation temperature (HYSYS) Formation temperature ( Experimental)
Beginning of dissociation End of Dissociation
9
11
13
15
17
19
90 110 130 150 170 190 210
Form
atio
n T
em
pe
ratu
re (o
C)
Pressure (bar)
HYSYS prediction vs exp. results for CH4+ CO2 mixture
Formation temperature (Experiment) Formation Temperature (HYSYS)
Beginning of dissociation End of dissociation

160
Fig. 6.8c: Comparing the HYSYS and experimental results for CH4+CO2+H2
Figure 6.8d: Comparing the HYSYS and experimental results for CH4+CO2+N2
Also, the experimental results showed that the hydrate formation temperature is
closely equal to the temperature of the beginning of dissociation. This is
thermodynamically correct because the amount of heat the system lost to the
surrounding at the hydrate formation point (through the cooling process) would be
the same amount gained at the point where the hydrate would start to melt.
Water molecules could appear in gaseous, liquid or solid (ice) state. The liquid
molecules could move through rotation, vibration and translation motions while the
ice molecules could only vibrate due to rigidity of the structure. Gas hydrates are
Ice-like. During the experimentation, the water-gas system released latent heat to the
surrounding at the point of changing from liquid phase to hydrate. This slowed down
the hydrogen bonds till the liquid could no longer rotate (freezing point), thus, the
8
9
10
11
12
13
14
15
16
17
90 110 130 150 170 190 210
Form
atio
n T
em
pe
ratu
re (o
C)
Pressure (bar)
HYSYS predictions vs exp. results for CH4+CO2+H2 mixture
Formation temperature (HYSYS) Formation temperature (oC)
Beginning of Dissociation End of Dissociation
8
10
12
14
16
18
90 110 130 150 170 190 210
Form
atio
n T
em
pe
ratu
re (o
C)
Pressure (bar)
HYSYS predictions vs exp. results for CH4+CO2+N2
Formation Temperature (HYSYS) Formation Temperature (Experiment)
Beg of Diss End of Diss

161
formation of gas hydrate. For the hydrate to dissociate (the beginning of
dissociation), latent heat was absorbed from the surrounding. This enabled the
hydrate to go from higher ordered state to the lower one by weakening the hydrogen
bonds between the hydrate molecules.
Temperature remained constant throughout the phase changes (solidification or
melting) because the available energy was used either to loosen or tighten the
hydrogen bonds. The entire hydrogen bonds must be broken (in case of melting) or
tightened (in case of solidification) before further energy could be used to increase
the temperature.
6.5 Conclusions
This study has successfully investigated the implications of component interactions
of CH4, CO2, CH4+CO2, CH4+CO2+N2 and CH4+CO2+H2 gas mixtures on hydrate
formation temperature. It was discovered that CH4 played key roles on hydrate
formation patterns during natural gas transportation through offshore pipeline
system, the higher the CH4 content in a natural gas mix, the higher the risk of
hydrates promotion. The resulting CH4 hydrates grew very fast and blocked the
pipe‘s orifice within a short period of formation. It was also discovered that CO2
does not form hydrate at low concentrations. However, its presence in CH4+CO2 gas
mix showed its remarkable ability to aid hydrate formation. This is not surprising
since it is also a former with ability to form Type I hydrate.
Furthermore, the study confirmed the ability of pure N2 and pure H2 gases to
significantly inhibit the formation of gas hydrate; however, H2 experimentally
showed a more promising characteristic. This was ascribed to the fact that H2 gas
only forms hydrate at an extremely high pressure of 2000bar and above. This
pressure range is far above the operating pressure range for gas transport; thus,
making it to behave as an inert gas at all the investigated pressures. However, safety
factors, material availability, cost implication and recovery from stream should be
further investigations for these two gases in order to choose the better option.

162
7. Conclusions and Recommendations
This chapter is divided into conclusions and recommendations. The conclusion part
highlights the various conclusions generated from the different sections of the study
while the recommendation part proposes two potential PhD studies for future
investigation.
7.1 Conclusions
This thesis extensively evaluated the implications of corrosion and hydrate formation
along underwater natural gas pipelines systems on the industry. Experimental studies
were conducted to assess the links between these two flow assurance problems, these
included several laboratory experiments to investigate the ability of corrosion
inhibitors to promote hydrate formation along the offshore/cold region pipelines due
to similar chemical and structural properties. Based on the findings, a comprehensive
mathematical model was developed to predict the corrosion rate as a result of the
formed gas hydrate. Finally, another set of experimental study was carried out to
investigate the ability of H2 and N2 gases to inhibit the formation of hydrate along
the gas pipeline. The study comprises of four parts which are summarized below.
7.1.1 Impacts of Corrosion and Hydrate Formation on the Industry
Pipeline industry is searching for all possible means to minimize the occurrence of
these two flow assurance problems during operations as a result of their economic,
safety, health and environment implications. Some existing and proposed global
natural gas pipeline networks systems were considered while the causes of these two
flow assurance problems were thoroughly evaluated. The full impacts of any failure
along the pipelength as a result of any of these problems were presented with the
support of many case studies. This was followed by descriptions and analyses of the
existing prevention measures. Finally, it was established that gas hydrate could
initiate corrosion. This is one of the major contributions of this work to knowledge.
The conclusions of this part of the study included:
Increase in natural gas demands due to economical and increased population
purposes have driven the industry to deepwater (offshore) regions in search
of this energy source.

163
Attempts to Prevent hydrate formation along these pipelines annually cost
millions of dollars to the industry while its eventual occurrence was equally
fatal. Unfortunately, all existing preventive measures could only minimize its
occurrence but cannot stop its promotion along the pipelength.
Through extensive literature search, this study successfully justified a need to
investigate the ability of the corrosion inhibitors to promote hydrate
formation. This was due to the observed similar chemical and structural
properties between the corrosion inhibitors and established hydrate
promoters. This has been outside the existing general research on hydrates.
Finally, this study has successfully recommended a need to investigate the
ability of gas hydrates to initiate different types of internal corrosions along
gas pipelines. This research area is also completely new.
7.1.2 Corrosion-Hydrate Relationships (Experimental Assessments)
This is another major contribution to knowledge from the thesis because all known
literature have not considered this research area. Ability of corrosion inhibitors to
promote hydrate formation was experimentally investigated. Five corrosion
inhibitors commonly used in the gas industry were studied in a cryogenic sapphire
cell at 500ppm and 100bar. They were all discovered to aid hydrate formation but at
different rates. DPC was further studied at different pressures and concentrations due
to its significant promotional ability compared with other investigated inhibitors.
The conclusions of this part of the study included:
Corrosion inhibitors generally promote hydrate formation along the
deepwater natural gas pipeline due to their surfactant properties and hydrogen
bonding distributions within their chain lengths.
They however promote at different rates based on their different structural
distributions, active functional groups and affinity for water molecules. These
properties affect the hydrogen bonding and electronegativity properties of
individual inhibitor.
Care should be taken in using DPC as a corrosion inhibitor along the
deepwater gas pipelines due to its significant ability to aid hydrate formation.

164
The resulting hydrates from DPC are foamy at all operating pressures and
concentrations. This showed that the surfactant properties of this chemical
are highly influential during operation.
Hydrate formation temperature is directly proportional to the operating
pressure.
The CMC for DPC is about 5000ppm due to various anomalous behaviours
observed at this particular concentration compared to other concentrations.
At all pressures, the liquid disappearance rate and the hydrate growth rate for
DPC decreases with increase in concentration. This suggests the potential of
using the chemical as an additive for natural gas transportation and storage in
slurry form.
At high concentrations, DPC prolonged the complete blockage of the glass
orifice. This strengthens the potential of the chemical to serve as both the
corrosion and hydrate inhibitors at high concentrations such as 10000ppm
and above.
7.1.3 Corrosion-Hydrate Relationships (Mathematical Assessment)
A predictive corrosion rate model was mathematically developed to further assess
the resulting problems from the established corrosion-hydrate relationships. This
study area is entirely new, hence, the need for an extensive literature search on the
existing corrosion models. Finally, a model was developed and validated by
comparing the generated results with the outputs from other corrosion models. This
new model again serves as another contribution to knowledge from this work.
The conclusions from this part of the study included:
The resulting corrosion rates increased with temperature, pressure and wall
shear stress. This perfectly agreed with all existing mathematical and
experimental reports, hence, the reliability of this predictive model.
The resulting corrosion rate from hydrates alone could be as high as
174mm/yr. This is extremely alarming compared to the industry‘s aim to
operate below 2mm/yr. At this rate, a pipeline would be subjected to full bore
rupture within some days if corrective actions are not quickly taken.
165
This extreme increase in corrosion rate will negatively impact on operation
by reducing the pipe-shelf life as well as the pipe‘s integrity.
Increase in operating pressure increases the hydrate formation temperature.
This increase in temperature will have secondary effects by influencing the
solubility of the corroding agent(s) and other factors affecting the corrosion
rate.
Increase in operating pressure also promotes the initiation of erosion-
corrosion as well as increases the rate of velocity loss along the pipeline.
7.1.4 The Gas Component Interactions
The final stage of this thesis searched for some means to inhibit hydrate promotion
within the pipeline system. The investigation was carried out by initially studying the
interactions between different components of natural gas, and then followed by
investigating the ability of H2 and N2 gases to achieve the inhibiting feat.
This final part is another major contribution to knowledge from this work and
successfully place both academic and commercial values on the entire thesis. These
are clearly shown in the recommendations section.
The conclusions from this part of the study included:
The higher the CH4 content in a natural gas mix, the higher the risk of
hydrate formation along the deepwater pipeline networks. The resulting
hydrates from this component agglomerate very fast to block the pipe‘s
orifice.
Regardless of the operating pressure, CO2 does not form hydrate at very low
concentrations.
Addition of H2 and/or N2 to CH4 and CO2 mixture significantly reduced the
formation temperature at all operating pressures and concentrations. This
confirmed that the two gases can individually serve as hydrate inhibitor along
the deepwater natural gas pipelines.
H2 gas has better inhibition capability compared to N2. This is attributed to
the fact that pure H2 gas forms hydrate at extremely high pressure and low
temperature whereas, pure N2 gas will form hydrate at a very low
temperature but relatively very low pressure.

166
7.2 Recommendations
Further studies should be conducted on the types of corrosion that could be initiated
by gas hydrates along the inner wall of underwater pipelines and the likely points of
initiation. Also, further studies on the use of H2 and N2 gases as hydrate inhibitors
are highly recommended for further investigation. The importance of the two
recommended studies is highlighted below.
7.2.1 Laboratory Investigation on the Corrosion Patterns
This thesis has presented (through extensive literature review) that resulting hydrates
could initiate different types of corrosion within the internal wall of gas pipelines;
therefore, there is a need to experimentally authenticate this discovery and
understand the patterns and the extent of damages that could be caused at each point.
Figure 7.1 was designed by the author for consideration. It involves cutting a typical
gas pipeline with various pits that could be caused by hydrate particles during the gas
transport. This alone could be the basis for a Ph.D. thesis in the area.
Figure 7.1: Proposed diagram for corrosion-hydrate interaction study
7.2.2 Investigations on Applicability of H2 and N2 as Hydrate Inhibitors
In-depth investigations should be conducted on the abilities of H2 and N2 gases to
inhibit the formation of gas hydrate based on the observations from the latest part of
this work. From what this thesis has achieved so far, it would have been more

167
appropriate to recommend H2 gas instead of N2 gas because of its hydrate inhibition
capability which is more significant compared to that of N2. However, this could be
negated by the cost implications and reactivity properties of the two gases. Pure N2
gas can be obtained from the atmosphere thus, an initial cost of plant installation for
processing is all that is required and the freely obtained N2 gas would thereafter be
passed through the pipe-length with the raw natural gas. In other hand, H2 gas has to
be obtained from another source (through a process) before passing through the
pipeline; this simply means that, using H2 gas will involve the initial cost of
installation, the continual processing cost from the source and other operational
costs. To prevent the continuous processing of fresh H2, the gas can be recycled after
separation at the exit; however, this will require additional pipelines which will also
add to the cost of production.
Also, N2 gas can easily be separated from the natural gas compared to H2 gas. This
means that after successfully transporting the natural gas through the pipeline
system, more capital will be required to separate H2 gas from the stream and this will
add to the cost of production. Again, passing H2 gas along the pipeline might be
dangerous for the safety of the pipeline system because any dissociation of the gas as
a result of partial pressure will easily initiate corrosion along the pipe-length.
The procedures itemized below might assist in achieving this goal;
1. Application of N2 gas at various concentrations.
2. Application of H2 gas at various concentrations.
3. Application of N2 and H2 mixed at various concentrations.
4. Engineering design for installing the required inhibitor at the inlet point. The
design should consider the inhibitor and the natural gas as the feeds into the
pipeline. This should involve material of construction, the feed rate, the feed
point(s), etc.
5. Engineering design for the required separation at the outlet of the pipeline.
From the foregone, it can be seen that this recommendation could also form the basis
for another Ph.D. thesis in this area.

168
REFERENCES
Abd El Rehim, S.S, Sayyah, S.M., El-Deeb, M.M., Kamal, S.M and Azooz, R.E.
(2010), ―Poly(o-phenylenediamine) as an inhibitor of mild steel corrosion in HCl
solution‖, Materials Chemistry and Physics, Vol. 123, Iss. 1, pp. 20–27
Abdel-Aal, H.K., Aggour, M. and Fahim, M.A. (2003), ―Petroleum and Gas Field
Prosessing‖, Marcel Dekker Inc., New York, USA.
Adib, H., Jallouf, S., Schmitt, C., Carmasol, A. and Pluvinage, G. (2007), ―Evaluation
of the Effect of Corrosion Defects on the Structural Integrity of X52 Gas Pipelines
Using the SINTAP Procedure and Notch Theory‖, International Journal of Pressure
Vessels and Piping, Vol. 84, Is. 3, pp. 123-131
Advantica (2002), ―Ukopa Pipeline Fault Database: Pipeline Product Loss Incidents
(1961-2000)‖, 2nd
Report of UKOPA Fault Database Management Group, Advantica
Report Reference R4798. pp 22
Ahammed, M. and Melchers, R.E. (1997), ―Probabilistic Analysis of Underground
Pipelines Subject to Combined Stresses and Corrosion‖, Engineering Structures, Vol.
19, Iss. 12, pp. 988-994.
Aiad, I., Ahmed, S. M. and Dardir . M. M. (2011), ―Synthesis and some applications
of Anionic Palmitic Acid Schiff Base Salt Surfactants‖, Journal of American Science,
Vol. 7, Iss. 1, pp. 799-807
Akba, H., and Batigoc, C.D. (2008), ―Micellization of Dodecylpyridinium Chloride in
Water–Ethanol Solutions‖, Colloid Journal, Vol. 70, Iss. 2, pp. 127–133.
Akinola, T., (2004), ―Pipeline Vandalization and Oil Scooping in the Niger Delta and
Others" African Conservation FORUMS, http://www.africanconservation.org/
accessed in Jan, 2006
Al-Adel, S., Dick, J.A.G., El-Ghafari, R. and Servio, P. (2008), ―The effect of
biological and polymeric inhibitors on methane gas hydrate growth kinetics‖, Fluid
Phase Equilibria, Vol. 267, Iss. 1, pp. 92-98.

169
Alcamo, J (1994), ―IMAGE 2.0: Integrated Modelling of Global Climate Change‖,
Special Issue of Water, Air and Soil Pollution, Vol. 76, pp. 1-2
Ali, M., and Saha, S. (2011), ―Hydrogen-Bonded Large Molecular Aggregates of
Charged Amphiphiles and Unusual Rheology: Photochemistry and Photophysics of
Hydroxyaromatics Dopants‖, In: K. Han, G. Zhao (Eds.), Hydrogen Bonding and
Transfer in the Excited State, John Wiley and Sons, U.K., pp. 711-747.
Aljourani, J., Raeissi, K., and Golozar, M.A. (2009), ―Benzimidazole and its
Derivatives as Corrosion Inhibitors for Mild Steel in 1M HCl Solution‖, Corrosion
Science, Vol. 51, Iss. 8, pp. 1836–1843.
Al-Kady, A.S., Gaber, M., Hussein, M.M. and Ebeid, E.M. (2011), ―Nanostructure-
Loaded Mesoporous Silica for Controlled Release of Coumarin Derivatives: A Novel
Testing of the Hyperthermia Effect‖, European Journal of Pharmaceutics and
Biopharmaceutics, Vol. 77, Iss. 1, pp. 66–74.
Amao, L (2004), ―ChevronTexaco Pressing Nigerian Gas Monetization Plans‖, Oil and
Gas Journal, Nigeria, 23 Mar. 2004,
http://ogje.pennnet.com/news/news_display.cfm?Section=NEWS&ArticleID=19601
accessed in Jan 2012
American Gas Association (1986), ―Natural Gas Application for Air Pollution
Control‖, Nelson E. Hay, Editor; The Fairmount Press Inc., Lilburn, Pp 1 – 41.
Anderson, R. Chapoy, A. and Tohidi, B. (2007), ―Phase Relations and Binary
Clathrate Hydrate Formation in the System H2-THF-H2O‖, Langmuir, Vol. 23, Iss. 6,
pp. 3440-3444.
Atia, A.A. and Saleh, M.M. (2003), ―Inhibition of Acid Corrosion of Steel using
Cetylpyridinium Chloride‖, J. of Applied Electrochemistry, Vol. 33, Iss. 2, pp. 171-
177.
Aw, P.K., Tan, A.L.K., Tan, T.P. and Qiu, J. (2008), ―Corrosion Resistance of
Tungsten Carbide Based Cermet Coatings Deposited by High Velocity Oxy-Fuel
Spray Process‖, Thin Solid Films, Vol. 516, Is. 16, pp. 5710-5715.

170
Badiea, A.M. and Mohana, K.N. (2009), ―Effects of Temperature and Fluid Velocity
on Corrosion Mechanism of Low Carbon Steel in Presence of 2-Hydrazino-4,7-
dimethylbenzothiazole in Industrial Water Medium‖, Corrosion Science, Vol. 51, Is. 9,
pp 2231-2241.
Bai, Y. and Bai, Q. (2005), ―Hydrates‖, Subsea Pipelines and Risers, pp. 357-382
Battelle (1996) ―Economic Effects of Metallic Corrosion in the United States: A 1995
Update‖, Battelle Columbus Report to Specialty Steel Industry of North America,
USA: Battelle Institute.
Bekki, S, Law, K.S and Pyle, J.A (1994), ―Effect of Ozone Depletion on Atmospheric
CH4 and CO Concentrations‖, Nature, 371, 595-597
Bentiss, F., Traisnel, M. and Lagrenee, M. (2000), ―The Substituted 1,3,4-
Oxadiazoles: A New Class of Corrosion Inhibitors of Mild Steel in Acidic Media‖,
Corrosion Science, Vol. 42, Iss. 1, pp. 127-146.
Bertocci, U., Koike, M., Leigh, S., Qiu, F and Yang, G (1986), ―A Quasi 2-D
Localized Corrosion Model‖, J. Electrochem Soc., Vol. 133, pp. 1782-1790.
Boutoudj, M.S., Ouibrahim, A., Barbeu, F., Deslouis, C. and Martemianov, S. (2008),
―Local Shear Stress Measurements with Microelectrodes in Turbulent Flow of Drag
Reducing Surfactant Solutions‖, Chemical Engineering and Processing: Process
Intensification, Vol. 47, Iss. 5, pp. 793-798.
Brkić, D. and Tanasković, T.I. (2008), ―Systematic Approach to Natural Gas Usage for
Domestic Heating in Urban Areas‖, Energy, Vol. 33, Is. 12, pp. 1738-1753
Buddy I (2004), ―BPA Membership‖, Pipeline and Gas Technology, June 2004
Caleyo, F., Velazquez, J.C., Valor, A. and Hallen, J.M. (2009), ―Markov Chain
Modelling of Pitting Corrosion in Underground Pipelines‖, Corrosion Science, Vol.
51, Iss. 9, pp. 2197–2207
Cape, J.N. (2003), ‗Effects of Airborne Volatile Organic Compounds on Plants‖,
Environmental Pollution, Vol. 122, Iss. 1, pp. 145 – 157.

171
Cape, J.N., Leith, I.D., Price, D.N., Brown, A.R., and Sharpe, A.D. (2003), ―Effects of
VOCs on Herbaceous Plants in an Open-Top Chamber Experiment‖, Environmental
Pollution, Vol. 124, Iss. 2, pp. 341 – 353.
Carrol, J.J. (2009), ―Natural Gas Hydrates - A Guide for Engineers‖, 2nd
Edition, Gulf
Professional Publishing, USA.
Chaal, L., Albinet, B., Deslouis, C., Al-Janabi, Y.T., Pailleret, A. Saidani, B. and
Schmitt, G. (2009), ―Wall Shear Stress Mapping in the Rotating Cage Geometry and
Evaluation of Drag Reduction Efficiency using an Electrochemical Method‖,
Corrosion Science, Vol. 51, Is. 8, pp 1809-1816.
Chapoy, A., Haghighi, H., Burgass, R. and Tohidi, B. (2010), ―Gas Hydrates in Low
Water Content Gases: Experimental Measurements and Modelling using the CPA
Equation of State‖, Fluid Phase Equilibria, Vol. 296, Iss. 1, pp. 9–14
CHCMT (2009), ―Erosion and Cavitation Corrosions‖, Cli Houston Corrosion
Material Technology, Texas, USA.
Chen, D and Mahadevan, S. (2008), ―Chloride-induced Reinforcement Corrosion and
Concrete Cracking Simulation‖, Cement & Concrete Composites, Vol. 30, Iss. 3, pp.
227–238.
Chen, H., Song, L., Wang, X., and Wang, S. (2000), ―Effect of Exposure to Low
Concentration of Benzene and Its Analogous on Luetal Function of Female Workers‖,
Wei Sheng Yan Jiu, Vol. 29, Iss. 6, pp. 351 – 353.
Chevron Australia (2008), ―Gorgon Baseline Survey‖, Corporate Report, Perth,
Australia.
Chevron Australia (2009), ―Gorgon Gas Devolopment Revised and Expanded
Proposal: Barrow Island Nature Reserve.‖ Corporate Report, Perth, Australia.
Chevron Australia (2011b), ―Reservoir Carbon Dioxide Injection‖ Corporate Article,
Perth, Australia.
Chevron Australia (2012) ―Downstream: Gas Processing Facility‖
http://www.chevronaustralia.com/ourbusinesses/gorgon/downstream.aspx (accessed on
January 19th
, 2012).

172
Chun-Yuh, Y., Chih-Ching, C., Hung-Yi, C., Chi-Kung, H., Trong-Neng, W., and Po-
Ya, C. (2004) ―Increased Risk of Preterm Delivery among People Living Near the
Three Oil Refineries in Taiwan‖, Environment International, Vol. 30, Iss. 3, pp. 337 –
342
Clarke, T (2001), ―Taming Africa’s killer lake”, Nature, V. 409, p. 554-555, February
2001.
Clarke, T., Simonetti, F. and Cawley, P. (2010) ―Guided Wave Health Monitoring of
Complex Structures by Sparse Array Systems: Influence of Temperature Changes on
Performance‖, Journal of Sound and Vibration, Vol. 329, Iss. 12, pp. 2306–2322
Clough Limited Australia (2012), ―Gorgon DOMGAS Pipeline Installation‖ Accessed
on 20th
January, 2012 from
http://www.clough.com.au/images/UpstreamOilGas/PDF/DOMGAS_Pipeline_OG193
a.pdf.
CNL (2007), ―Natural Gas Operation Factsheet‖, Chevron (Nigeria) Limited, Lagos,
Nigeria.
Colomba, L. (2010), ―Gorgon Natural Gas Project‖, Thesis, Norwegian Institute of
Science and Technology, Norway.
Cook, P.J. (2009), ―Demonstration and Deployment of Carbon Dioxide Capture and
Storage in Australia‖, Energy Procedia, Vol. 1, Iss. 1, pp. 3859–3866
Coombs, V. (2003), ―Fire in the Oil and Gas Industry: Case Study – The Petrotrin Oil
Refinery‖. http://www.disaster-info.net/ accessed in Jan 2010.
Cordesman, A.H. and Al-Rodhan, K.R. (2006), ―The Changing Dynamics of Energy in
the Middle East‖, 1st Edition, Greenwood Publishing Group Inc., USA. ISBN 0-275-
99188-1 (set).
Cribb, R. (2003), ―Danger Below: When Pipelines Go Bad‖, Toronto Star, Canada.
Available from http://www.corrosion-club.com/pipelines.htm (accessed on July 12,
2011).

173
Croxford, A.J., Moll, J., Wilcox, P.D. and Michaels, J.E (2010), ―Efficient
Temperature Compensation Strategies for Guided Wave Structural Health
Monitoring‖, Ultrasonics, Vol. 50, Iss 4-5, pp. 517–528.
CSIRO (2011), ―A holistic approach to solving corrosion problems‖, Accessed on 24
November 2011 from http://www.csiro.au/science/Corrosion-Research.html
Cwiklik, L. and Devlin, J.P. (2010), ―Hindering of Rotational Motion of Guest
Molecules in the Type I Clathrate Hydrate‖, Chemical Physics Letters , Vol. 494, Iss.
4-6, pp. 206-212
Daimaru, T., Yamasaki, A., and Yanagisawa, Y. (2007), ―Effect of Surfactant Carbon
Chain Length on Hydrate Formation Kinetics‖, Journal of Petroleum Science and
Engineering, Vol. 56, Iss. 1-3, pp. 89–96.
Das, M.C., Ghosh, S.K., Sanudo, E.C., and Bharadwaj, P.K. (2009), ―Coordination
polymers with pyridine-2,4,6-tricarboxylic acid and alkaline-
earth/lanthanide/transition metals: synthesis and X-ray structures‖, Dalton Trans.,
2009, 1644–1658
Delahaye, A., Fournaison, L., Jerbi, S. and Mayoufi, N. (2011), ―Rheological
Properties of CO2 Hydrate Slurry Flow in the Presence of Additives‖, Ind. Eng. Chem.
Res., Vol. 50, Iss. 13, pp 8344–8353.
Demoz, A. and Dabros, T. (2008), ―Relationship between Shear Stress on the Walls of
a Pipe and an Impinging Jet‖, Corrosion Science, Vol. 50, Is. 11, pp 3241-3246.
Derbeken, J.V. (2011), ―Utilities: Major PG&E Gas Line Ruptures During Hydro
Test‖, Hearst Communications Inc., New York. Accessed on 28th
December 2011
from http://articles.sfgate.com/2011-10-25/news/30322862_1_pg-e-officials-
longitudinal-seam-compressor-station
Dessler, A.E (1998), ―A Reexamination of the ‗Stratospheric Fountain‘ Hypothesis‖,
Geophys. Res. Lett., Vol. 25, pp. 4165-4168
di Caprio, D., Vautrin-Ul, C., Stafiej, J., Saunier, J., Chaussé, A., Féron, D. and
Badiali, J.P. (2011), ―Morphology of Corroded Surfaces: Contribution of Cellular
Automaton Modelling‖, Corrosion Science, Vol. 53, Iss. 1, pp. 418–425

174
Dickens, G (2001), ―On the Fate of Past Gas: What Happens to Methane Release from
a Bacterially Mediated Gas Hydrate Capacitor?‖, Geochem. Geophys. Geosyst., 2,
2000GC000131
Doyle, J. (2002), ―Riding the Dragon: Royal Dutch Shell and the Fossil Fire‖
Environmental Health Fund, Washington D.C. p 178
DRET (2009), ―Energy in Australia‖, Department of Resources, Energy and Tourism,
Canberra ACT 2601, Australia Government, pp 1-104
DSD (2010), ―Gorgon Project Factsheet‖ Department of State Development, Perth,
Australia.
Du, Q., Chen, Y. and Li, S. (2007), ―Mathematical model for natural gas hydrate
production by heat injection‖, Petroleum Exploration and Development, Vol. 34, Iss.
4, pp. 470–473, 487.
Durnie, W., De Marco, R., Jefferson, A. and Kinsella, B. (2003), ―In situ SERS Study
of the Adsorption of Inhibitors of Carbon Dioxide Corrosion‖, Surface and Interface
Analysis, Vol. 35, Iss. 6, pp. 536-543.
Durnie, W., De Marco, R., Kinsella, B., Jefferson, A. and Pejcic, B. (2005), Predicting
the Adsorption Properties of Carbon Dioxide Corrosion Inhibitors Using a Structure-
Activity Relationship. Journal of the Electrochemical Society, Vol. 152, Iss. 1, pp. B1-
B11.
EFR (2000), ―PPMC Pipeline Spill Sparks Fire‖, ERA Field Report Number 73 Nov.
16, 2000,
www.waado.org/Environment/OilFires_2000/ElumeRiverFire/ERAReport.html
Eggleston, A., Adams, J., Bushby, D., Johnston, D. and Joyce, B. (2008), ―Coalition
Senators‘ Dissenting Report‖, Parliament of Australia, Canberra.
Encarta, (2004), ―Petroleum‖, Encarta Encyclopedia Photo Researchers, Microsoft
Corporation, U.S.A.
Equid, D. (2008), ―Challenges of the Jansz Deepwater Tieback‖, Deep Offshore
Technology International Conference & Exhibition, Perth Convention Exhibition
Centre, Australia, December 3-5.

175
Equitable (2004), ―Equitable Hires Meter-reading Firm‖, Pipeline and Gas
Technology, June 2004
EPA (1997), ―Ground Transportation Industry‖, United States Environmental
Protection Agency, EPA/310-R-97-002. USA.
ESD (2009), ―Electrostatic Discharge‖, Glossary of ESD Terms, Accessed on 28th
August, 2011 from http://www.interfacebus.com/glossary-of-terms-esd-
definition.html.
Estupinan-Lopez, F.H. Almeraya-Calderon, F., Bautista Margulis, R.G., Zamora,
M.A.B., Martínez-Villafane1, A., Ch., J.U. and Gaona-Tiburcio, C. (2011), ―Transient
Analysis of Electrochemical Noise for 316 and Duplex 2205 Stainless Steels under
Pitting Corrosion‖, Int. J. Electrochem. Sci., Vol. 6, pp. 1785 – 1796
ETF (2011), ―Guided Wave –v- Smart Pigging‖, Corrosion Engineering Technical
Support Forum and Mutual Help System for Engineering, http://www.eng-
tips.com/viewthread.cfm?qid=156660. Retrieved on 16 December, 2011
Ezuber, H.M. (2009), ―Influence of Temperature and Thiosulfate on the Corrosion
Behavoir of Steel in Chloride Solutions Saturated in CO2‖, Materials & Design, Vol.
30, Is. 9, pp 3420-3427.
Felder, R. and Dones, R. (2007), ―Evaluation of Ecological Impacts of Synthetic
Natural Gas from Wood Used in Current Heating and Car Systems‖, Biomass and
Bioenergy, Vol. 31, Iss. 6, pp. 403-415
Ferronato, M., Gambolati, G., Janna, C. and Teatini, P (2010), ―Geomechanical Issues
of Anthropogenic CO2 Sequestration in Exploited Gas Fields‖, Energy Conversion and
Management, Vol. 51, Iss. 10, pp. 1918–1928
Fingerhut, M., and Westlake, H. (2000), ―Pipeline fitness-for-purpose certification‖,
Corrosion Prevention & Control March, pp. 3–14. Accessed on November 24, 2009
from http://www.corrosion-club.com/pipelines.htm
FLUENT Incorporated (2005), ―Viscosity as a Function of Temperature‖, Accessed
from

176
http://sydney.edu.au/engineering/aeromech/AMME4210/old_manuals/manuals/fluent_
help/html/ug/node300.htm on 12th
December, 2011.
Frankel, G.S. and Sridhar, N. (2008), ―Understanding Localized Corrosion‖,
Materialstoday, Vol. 11, Iss. 10, pp. 38-44.
Fray, N., Marboeuf, U., Brissaud, O. and Schmitt, B. (2010), ―Equilibrium Data of
Methane, Carbon Dioxide, and Xenon Clathrate Hydrates below the Freezing Point of
Water. Applications to Astrophysical Environments‖, J. Chem. Eng. Data, Vol. 55,
Iss. 11, pp 5101–5108
Frignani, A. and Trabanelli, G. (1999), ―Influence of Organic Additives on the
Corrosion of Iron-Based Amorphous Alloys in Dilute Sulfuric Acid Solution‖,
CORROSION, Vol. 55, Iss. 7, pp. 653-660.
Frostman, L.M., Thieu, V., Crosby, D.L. and Downs, H.H. (2003), ―Low-Dosage
Hydrate Inhibitors (LDHIs): Reducing Costs in Existing Systems and Designing for
the Future‖, International Symposium on Oilfield Chemistry, Society of Petroleum
Engineers, Houston, Texas, 5-7 February.
Fu, S.B., Cenegy, L.M. and Neff, C.S. (2001), ―A Summary of Successful Field
Application of a Kinetic Hydrate Inhibitor‖, International Symposium of Oil Field
Chemistry, SPE Conference, Paper SPE 65022, Houston, Texas, Feb. 13-16.
Fuerstenau, D.W. and Jia, R. (2004), ―The Adsorption of Alkylpyridinium Chlorides
and Their Effect on the Interfacial Behavior of Quartz‖, Colloids and Surfaces A:
Physiochemical and Engineering Aspects, Vol. 250, Iss. 1-3, pp. 223-231.
Fuglestveld, J.S, Jonson, J.E and Isaksen, I.S.A (1994), ―Effects of Reduction in
Stratospheric Ozone on Tropospheric Chemistry Through Changes in Photolysis
Rates‖, Tellus, Vol. 46B, pp. 172-192
Fung, I, John, J, Lerner, J, Matthew, E, Prather, M, Steeler, L.P and Fraser, P.J (1991),
―Three-Dimensional Model Synthesis of the Global Methane Cycle‖, J. Geophys. Res.,
Vol. 96, pp. 13033-13065
Gabrielli, C., Huet, F., Keddam, M., and Oltra (1990), ―Application of Phase Shifting
Interferential Microscopy to Pitting Corrosion‖, CORROSION, Vol. 46, Iss. 4, 266-278
177
Gabrielli, C., and Keddam, M., (1992), ―Quantitative Evaluation of General Corrosion
of Type-304 Stainless Steel in Subcritical and Supercritical Aqueous Solutions via
Electrochemical Noise Analysis‖, CORROSION, Vol. 48, 794-802.
GAEI (2009), ―Workplace Health and Safety Bulletin – Hydrogen Sulphide at the
Work Site‖ Document, CH 029, Government of Alberta, Employment and
Immigration, Canada, pp 1-17. Accessed online on 20-12-09 from
http://employment.alberta.ca/documents/WHS/WHS-PUB_ch029.pdf.
Gamo, M., Oka, T., and Nakanishi, J. (2003), ―Ranking the Risks of 12 Major
Environmental Pollutants that Occur in Japan‖, Chemosphere, Vol. 53, Iss. 4, pp. 277
– 284.
Ganji, H., Manteghian, M. And Mofrad, H.R. (2007), ―Effect of Mixed Compounds on
Methane Hydrate Formation and Dissociation Rates and Storage Capacity‖, Fuel
Processing Technology, Vol. 88, Iss. 9, pp. 891-895.
Gao, S. (2009), ―Hydrate Risk Management at High Watercuts with Anti-agglomerant
Hydrate Inhibitors‖, Energy & Fuels, Vol. 23, pp. 2118–2121
Gazzard, J. (2008a), ―Aviation and climate change: Can alternative fuel save the
day?‖, Aviation Environment Federation, London, UK.
Gazzard, J. (2008b), ―Pros and contrails‖, Aerospace Testing International, UKIP
Media & Events Abinger House, Dorking Surrey, United Kingdom
Garbatov, Y, ,Soares, C.G, and Wang, G (2005), ―Non-linear Time Depandent
Corrosion Wastage of Deck Plates of Ballast and Cargo Tanks of Tankers‖,
Proceedings of the 24th
International Conference on Offshore Mechanics and Arctic
Engineering, ASME, Paper OMAE2005-67579.
Gaverick, L. (1994), ―Corrosion in the Petrochemical Industry‖, 1st Edition, ASM
International, Metal Park, Ohio, USA.
Gayet, P., Dicharry, C., Marion, G., Graciaa, A., Lachaise, J. and Nesterov, A. (2005),
―Experimental Determination of Methane Hydrate Dissociation Curve up to 55 MPa
by using a Small Amount of Surfactant as Hydrate Promoter‖, Chemical Engineering
Science, Vol. 60, Iss. 21, pp. 5751-5758

178
Gbaruko, B.C., Igwe, J.C., Gbaruko, P.N. and Nwokeoma, R.C. (2007), ―Gas Hydrates
and Clathrates: Flow Assurance, Environmental and Economic Perspectives and the
Nigerian Liquified Natural Gas Project‖, Journal of Petroleum Science and
Engineering, Vol. 56, Is. 1-3, pp. 192-198
Gbenga Biobaku & Co. (2008), ―Investing in Nigeria‘s Oil and Gas Industry‖,
Babafemi Osoba Crescent, Victoria Island, Lagos, Nigeria.
Geesey, G.G. (1991), ―Biofouling and Biocorrosion in Industrial Water Systems‖,
Springer-Verlag, Berlin, pp. 1-220
Gelb, B.A. (2006), ―Russian Oil and Gas Challenges‖, Congressional Research
Service, Report Order Code RL 33212, Washington, USA, pp. 1-15
Ginzel, R.K. and Kanters, W.A. (2002), ―Pipeline Corrosion and Cracking and the
Associated Calibration Considerations for Same Side Sizing Applications‖, The e-
Journal of Nondestructive Testing, Canada, Vol 7, No7.
Grigoryan, S., A. Manukyan, A. Hayrapetyan, A. Arzumanyan, A. Kuzanyan, Y.
Kafadaryan, and E. Vardanyan, E. (2003), ―A New Way of Preparing the Y-Ba-Cu-O
High Temperature Superconductor Using the Sol-Gel Method‖, Superconductor
Science and Technology, Vol. 16, pp 1202-1206.
Gonzalez-Rodriguez, J.G., Mejia, E., Rosales, I., Salinas-Bravo, V.M., Rosas, G., and
MArtinez-Villafañe, A. (2008), ―Effect of Heat Treatment and Chemical Composition
on the Corrosion Behavoiur of Ni-Al Intermetallics in Molten (Li+K) Carbonate‖,
Journal of Power Sources, Vol. 176, Issue 1, pp. 215-221.
GreenAir (2009), ―The search for alternative aviation fuels: understanding the
challenge‖, Greenair Communications, London, U.K.
Groundwork (2003), ―Shell International‘s Legacy of Pollution and Damage‖,
Pietermaritzburg, South Africa. http://www.groundwork.org.za/Pamphlets/Shell.htm
Gudmundsson, J.S. and Børrehaug, A. (1996), ―Frozen Hydrate for Transportation of
Natural Gas‖, 2nd International Conference on Natural Gas Hydrate, Toulouse,
France, June 2-6, pp. 415-422.
179
Gunaltun, Y.M. (1996), ―Integrated CO2 Corrosion-Multiphase Flow Model‖,
CORROSION, Paper No. 27, NACE International, Houston, Texas.
Guo, X.J., Gao, K.W., Qiao, L.J. and Chu, W.Y. (2002), ―The Correspondence
between Susceptiblity to SCC of Brass and Corrosion-Induced Tensile Stress with
Various pH Values‖, Corrosion Science, Vol. 44, Is. 10, pp 2367-2378
Hadler, A.B., Ott, L.S. and Bruno, T.J. (2009), ―Study of azeotropic mixtures with the
advanced distillation curve approach‖, Fluid Phase Equilibria, Vol. 281, Iss. 1, pp. 49-
59
Hamdy, A.S. (2008), ―The Effect of Surface Modification and Stannate Concentration
on the Corrosion Protection Performance of Magnesium Alloys‖, Surface and
Coatings Technology, Vol. 203, Is. 3-4, pp. 240-249.
Hao, Y., Bo, Q. and Chen, Y (2006), ―Laboratory investigation of pressure
development of natural gas hydrates‖, Petroleum Exploration and Development, Vol.
33, Iss. 2, pp. 217–220.
Hara, K., Baden, N. and Kajimoto, O. (2004), ―Pressure Effect on Water Solvation
Dynamics in Micellar Media‖, Journal of Physics: Condensed Matter, Vol. 16, Iss. 14,
pp. 1207–1214.
Harun, A.F., and Watt, N. (2009), ―Bringing the 1st BP Operated Subsea to Shore Gas
Field into Production: Flow Assurance Lessons Learned‖, Asia Pacific Oil and Gas
Conference & Exhibition, Society of Petroleum Engineers, Jakarta, Indonesia, 4-6
August.
Hashimoto, M., Miyajima, S. and Murata, T. (1992), ―An Experimental Study of
Potential Fluctuation during Passive Film Breakdown and Repair on Iron‖, Corrosion
Science, Vol. 33 Iss. 66, pp. 905-915.
Hashimoto, S, Murayama, S., Sugahara, T., Sato, H., and Kazunari Ohgaki, K. (2006),
―Thermodynamic and Raman spectroscopic studies on H2+tetrahydrofuran+water and
H2+ tetra-n-butyl ammonium bromide+water mixtures containing gas hydrates‖,
Chemical Engineering Science, Vol. 61, Iss. 24, pp. 7884-7888

180
Hein, R, Crutzen, P.J and Heinmann, M (1997), ―An Inverse Modeling Approach to
Investigate the Global Atmospheric Methane Cycle‖, Global Biogeochem. Cycles, Vol.
11, pp. 43-76
Heppner, K.L. and Evitts, R.W. (2008), ―Modelling of the Effect of Hydrogen ion on
the Crevice Corrosion of Titanium‖, Environment-Induced Cracking of Materials, pp
95-104.
HGMCE (2004), ―Glossary of Corrosion Related Terms‖, The Hendrix Group:
Material and Corrosion Engineers, http://www.hghouston.com/c.html, Retrieved on 16
Jan, 2010.
Hill, Z (2005), ―LNG Will Supply More Than 20% of US Gas by 2025‖, NAFTA
Journal, Year 56, No 6, pp 220
Hook, M., R. Hirsch, R. and K. Aleklett. K. (2009), ―Giant Oil Field Decline Rates
and their Influence on World Oil Production‖, Energy Policy, Vol. 37, Iss. 6, pp. 2262-
2272.
Hosa, A., Esentia, M., Stewart, J. and Haszeldine, S. (2011), ―Injection of CO2 into
Saline Formations: Benchmarking Worldwide Projects‖, Chemical Engineering
Research and Design, Vol. 89, Iss. 9, pp. 1855-1864
Houweling, S, Kaminski, T, Dentener, F, Lelieveld, J and Heinmann, M (1999),
―Inverse Modeling of Methane Sources and Sinks Using the Adjoint of a Global
Transport Model‖, J.Geophys. Res., Vol. 104, pp. 26137-26160
Huang, Y. and Ji, D. (2008), ―Experimental Study on Seawater-Pipeline Internal
Corrosion Monitoring System‖, Sensors and Actuators B, Vol. 135, Iss. 1, pp 375–380
Huang, B.X., Xue, W.C., Wang, Y.Z. and Zhang, T. (2012), ―Review of Theory and
Practice on Natural Gas Hydrate‖, Advanced Material Research, Vol. 361-363, pp.
149-160
Huang, C., Chen, C. H., Li, L., Cheng, Z., Wang, H.L., Huang, H.Y., Streets, D.G,
Wang, Y.J, Zhang, G.F. and Chen, Y. R. (2011), ―Emission inventory of
anthropogenic air pollutants and VOC species in the Yangtze River Delta region,
China‖, Atmospheric Chemistry and Physics, Vol. 11, pp. 4105–4120

181
Hunt, D., Akindeju, M.K., Obanijesu, E.O., Pareek, V. and Tade, M.O. (2011),
―Potential Impacts and Modeling the Heat Value Loss Due to Chelation in Natural Gas
Processing and Transport‖ Elsevier 21st European Symposium on Computer-Aided
Process Engineering, (Part B), pp. 1573-1577
Huntsman (2010), ―Chemical Types by Surfactant Class‖, Huntsman Performance
Products, Woodloch Forest Drive, Woodlands, TX, USA.
IEA (2001), ―World Energy Outlook – 2001 Insights, Assessing Today‘s Supplies to
Fuel Tomorrow‘s Growth‖, International Energy Agency, October 2001
IEA (2010), International Enery Agency, ―Key World Energy Statistics‖. Paris:
SOREGRAPH.
ILZRO (2009), ―Fretting Corrosion (Transit Abrasion) on Galvanized Sheet‖, The
International Lead Zinc Research Organization, Durham, North California, USA.
Imperial Venture Corp (1998), ―Natural Gas Utilization Study: Offshore
Newfoundland‖, A Report Prepared for Atlantic Canada Opportunity Agencies and
Newfoundland Oceanic Industies Association, pp 1-85
IPCC Climate Change (2001): Mitigation. A Report of Working Group III of the
Intergovernmental panel on Climate Change. Sixth Session held in Accra, Ghana.
Itakura, M.; Kaburaki, H.; Arakawa, C. (2005), ―Branching mechanism of
intergranular crack propagation in three dimensions‖, Phys. Rev., Vol. 71, Issue 5, pp
5102 -5105.
Ivanov, L., Spencer, J. and Wang, G. (2003), ―Probabilistic Evaluation of Hull
Structure Renewals for Aging Ships‖, Proceedings of the 8th
International Marine
Design Conference (IMDC), Athens, Greece, 5-8 May, pp 393-406
Jacobs, S, (2002), ―Pipeline Factors Affecting Gasoline Prices‖, Federal Trade
Commission Conference, Washington DC, May 8-9, 2002, pp. 1-23.
Jacobson, L.C. and Molinero, V. (2010), ―A Methane-Water Model for Coarse-
Grained Simulations of Solutions and Clathrate Hydrates‖, J. Phys. Chem. Vol. 114,
pp. 7302–7311

182
Janovic, Z (2005), ―Oil and Petrochemical Processes and Products‖, Hrvatsko, drustvo
za goriva I maziva, Zagreb, Croatia, pp 1-427
Jassim, E. and Abdi, M.A. (2008), ―A CFD-Based Model to Locate Flow Restriction
Induced Hydrate Deposition in Pipelines‖, Manuscript OTC 19190, Offshore
Technology Conference, Houston, Texas, USA, 5-8 May, 2008
Javanmardi, J., Nasrifar, K. and Moshfeghian, M. (2004), ―Economic Evaluation of
Natural Gas Hydrate as an Alternative for Natural Gas Transportation‖, GPA-GCC
Chapter-12th
Technical Conference, World Petroleum Congress, Kuwait, May 5th
, pp.
1-14
Joelsson, A. and Gustavsson, L. (2009), ―District Heating and Energy Efficiency in
Detached Houses of Differing Size and Construction‖, Applied Energy, Vol. 86, Is. 2,
pp. 126-134
Johnson, R.L., Thoms, R.B., and Zogorski, J.J. (2003), ―Effects of Daily Precipitation
and Evapotranspiration Patterns on Flow and VOC Transport to Groundwater along a
Watershed Flow Path‖, Environ Sci. Technol, Vol. 37, Iss. 21, pp. 4944 – 4954.
Kamimura, A, Guerra, S.M.G. and Sauer, I.L. (2006), ―On the Substitution of Energy
Sources: Prospective of the Natural Gas Market Share in the Brazilian Urban
Transportation and Dwelling Sectors‖, Energy Policy, Vol. 34, Is. 18, pp. 3583-3590
Kandepi, V.V. and Narender, N. (2012), ―Synthesis of N-heterocyclic Compounds
over Zeolite Molecular Sieve Catalysts: An Approach Towards Green Chemistry‖,
Catalysis Science & Technology, Manuscript accepted for publication and available
online at http://pubs.rsc.org/en/content/articlepdf/2012/cy/c2cy00162d
Kang, S. and Wang, J. (2010), ―Kinetic Behaviors of CO2 Hydrates in Porous Media
and Effect of Kinetic Promoter on the Formation Kinetics‖, Chemical Engineering
Science, Vol. 65, Iss 5, pp. 1840–1845
Karaaslan, U. and Parlaktuna, M. (2000), ―Surfactants as Hydrate Promoters?‖, Energy
& Fuels, Vol. 14, Iss. 5, pp. 1103-1107

183
Karimi, A. and Abdi, M.A. (2009), ―Selective Dehydration of High-Pressure Natural
Gas using Supersonic Nozzles‖, Chemical Engineering and Processing: Process
Intensification, Vol. 48, Is. 1, pp. 560-568.
Kelland, M.A., Monig, K., Iversen, J. E. and Lekvam, K (2008), ―Feasibility Study for
the Use of Kinetic Hydrate Inhibitors in Deep-Water Drilling Fluids‖, Energy & Fuels,
Vol. 22, Iss. 4, pp 2405–2410
Kennell, G.F. and Evitts, R.W. (2009), ―Crevice Corrosion Cathodic Reactions and
Crevice Scaling Laws‖, Electrochimica Acta, Vol. 54, Is. 20, pp 4696-4703.
Kester, D. (1975), ―Dissolved Gases Other Than CO2‖, Chemical Oceanography, Vol.
1, 2nd
Edition, J.P Riley and Skirrow, G. (Editors), Academy Press, New York, pp. 497
- 556.
Khaled, K.F., Babić-Samardžija, K. and Hackerman, N. (2005), ―Theoretical Study of
the Structural Effects of Polymethylene Amines on Corrosion Inhibition of Iron in
Acid Solutions‖, Electrochimica Acta, Vol. 50, Iss. 12, pp. 2515–2520
Kim, H., Annabel, M.D., and Rao, P.S. (2001), ―Gaseous Transport of Volatile
Organic Chemicals in Unsaturated Porous Media: Effect of Water-Partitioning and
Air-Water Interfacial Adsorption‖, Environ. Sci. Technol., Vol. 35, Iss. 22, pp. 4457 –
4462.
Klerke, A., Christensen, C.H., Norskov, J.K. and Vegge, T. (2008), ―Ammonia for
hydrogen storage: challenges and opportunities‖, Journal of Materials Chemistry, Vol.
18, Iss. 20, pp. 2304-2310
Konstantinidis, G., Drinkwater, B.W. and Wilcox, P.D. (2006), ―The Temperature
Stability of Guided Wave Structural Health Monitoring Systems‖, Smart Mater.
Struct., Vol. 15, No. 4, pp. 967–976
Korotkikh, O.P. and Kochurova, N.N. (2006), ―Micelle Formation in Aqueous
Dodecylpyridinium Chloride‖, Russian Journal of Applied Chemistry, Vol. 79, No. 7,
pp. 1204 - 1206.
Krishnan, V., Bharani, S., Kapat, J.S, Sohn, Y.H. and Desai, V.H. (2008), ―A
Simplistic Model to Study the Influence of Film Cooling on Low Temperature Hot

184
Corrosion Rate in Coal Gas/Syngas Fired Gas Turbines‖, International Journal of
Heat and Mass Transfer, Vol. 51, Is. 5-6, pp. 1049-1060.
KSC (2009), ―Uniform Corrosion‖, Corrosion Technology Laboratory, Kennedy
Space Centre, NASA, USA.
Lain, S., Broder, D., Sommerfeld, M. and Goz, M.F. (2002), ―Modelling
hydrodynamics and turbulence in a bubble column using the Euler–Lagrange
procedure‖, International Journal of Multiphase Flow, Vol. 28, Iss. 8, pp. 1381–1407
Lau, N.T., Chan, C.K., Chan, L.I., and Fang, M. (2008), ―A Microscopic Study of the
Effects of Particle Size and Composition of Atmospheric Aerosols on the Corrosion of
Mild Steel Corrosion‖, Corrosion Science, Vol. 50, Is. 10, pp. 2927-2933
Lelieveld, J, Crutzen, P.J and Dentener, F.J (1998), ―Changing Concentration,
Lifetime and Climate Forcing of Atmospheric Methane‖, Tellus, Vol. 50B, pp. 128-
150
Li, B., Li, W., Ye, L., Hou, G.F. and Wu, L.X. (2010), ―Metal-Organic Compounds:
Poly[di-l2-aqua-l4-chlorido-l4-(2-mercaptopyrimidine-4,6-diolatoj4O:O:O0:O0)-
disodium(I)]‖, Acta Cryst., Vol. E66, pp. 1-5
Li, S., Fan, S., Wang, J., Lang, X. and Wang, Y. (2010), ―Semiclathrate Hydrate Phase
Equilibria for CO2 in the Presence of Tetra-n-butyl Ammonium Halide (Bromide,
Chloride, or Fluoride)‖, J. Chem. Eng. Data, Vol. 55, Iss. 9, pp 3212–3215
Li, X.S., Xia, Z.M., Chen, Z.Y., Yan, K.F., Li, G. and Wu, H.J. (2010c), ―Equilibrium
Hydrate Formation Conditions for the Mixtures of CO2 + H2 +Tetrabutyl Ammonium
Bromide‖, J. Chem. Eng. Data, Vol. 55, pp. 2180–2184
Li, Y. and Duan, Y. (2012), ―Treatment of Wastewater Containing High Concentration
Ammonia-Nitrogen by Electrochemical Oxidation Process‖, Advanced Materials
Research, Vols. 393-395, pp. 1587-1590
Liang, S. and Kusalik, P.G. (2010), ―Explorations of Gas Hydrate Crystal Growth by
Molecular Simulations‖, Chemical Physics Letters, Vol. 494, Iss. 4-6, pp 123-133
Lide, D.R (2006), ―CRC Handbook of Chemistry and Physics‖ 87th
Edition, CRC
Press Inc, Boca Raton, Fl, U.S.A.
185
Likhanova, N. V., Dominguez-Aguilar, M. A., Olivares-Xometi, O. and Nava-
Entzana, N. (2010), ―The Effect of Ionic Liquids with Imidazolium and Pyridinium
Cations on the Corrosion Inhibition of Mild Steel in Acidic Environment‖, Corrosion
Science, Vol. 52, Iss. 6, pp. 2088-2097.
Lima, M.C.P., Coutinho, K., Canuto, S. and Rocha, W.R. (2006), ―Reaction
Mechanism and Tautomeric Equilibrium of 2-Mercaptopyrimidine in the Gas Phase
and in Aqueous Solution: A Combined Monte Carlo and Quantum Mechanics Study‖,
J. Phys. Chem., Vol. 110, Iss. 22, pp. 7253-7261.
Little, B.J. and Lee, J.S. (2009), ―Microbiologically Influenced Corrosion‖, Kirk-
Othmer Encyclopedia of Chemical Technology, John Wiley & Sons, Inc., pp. 1-3
Liu, T. and Weyers, R.W. (1998), ―Modeling the Dynamic Corrosion Process in
Chloride Contaminated Concrete Structures‖, Cement and Concrete Research, Vol. 28,
No. 3, pp. 365–379
Liu, Y., Liu, X. and Liu, D. (2007), ―Applications of geophysical techniques to gas
hydrate prediction‖, Petroleum Exploration and Development, Vol. 34, Iss. 5, pp. 566–
573
Logan, F. (2008) ―Opening Statement to the Senate Standing Economics Committee‖
on Inquiry into Matters Relating to the Gas Explosion at Varanus Island, Perth,
Australia.
Lopez, D. A., Perez, T. and Simison, S. N. (2003), ―The Influence of Microstructure
and Chemical Composition of Carbon and Low Alloy Steels in CO2 Corrosion: A
State of the Art Appraisal‖, Materials and Design, Vol. 24, Iss. 8, pp. 561-575.
Lorenzo, M.D. (2009), ―The Hydra Flow Loop: A Tool for Testing the Hydrates
Behavior in Gas Pipelines‖, R & D Seminar Organized by National Research
Flagship/Commonwealth Scientific and Industrial Research Organization (CSIRO),
Australian Resources Research Center Building, Perth, Australia
Loto, C.A. (2012), ―Electrode Potential Evaluation of Effect of Inhibitors on the
Electrochemical Corrosion Behaviour of Mild Steel Reinforcement in Concrete in
H2SO4‖, J. Mater. Environ. Sci., Vol. 3, Iss. 1, pp. 195-205

186
Ma, C.F., Chen, G.J., Wang, F., Sun, C.Y. and Guo, T.M. (2001), ―Hydrate Formation
of (CH4+C2H4) and (CH4+C3H6) Gas Mixtures‖, Fluid Phase Equilibria, Vol. 191, pp.
41-47
Ma, C., Shi, Y. and Jiang, Q. (2005), ―Syntheses, Characterizations and Crystal
Structures of New Triorganotin Complexes with 2-Mercaptopyrimidine and 4-amino-
2-mercaptopyrimidine‖, Heteroatom Chemistry, Vol. 16, Iss. 1, pp. 69-75
Mahajan, D., Taylor, C.E. and Mansoori, G.A. (2007), ―An Introduction to Natural
Gas Hydrate/Clathrate: The Major Organic Carbon Reserve of the Earth‖, Journal of
Petroleum Science and Engineering, Vol. 56, Iss. 1-3, pp. 1–8.
Mahgerefteh, H, Saha, P. and Economou, I.G (1997). ―A Study of the Dynamic
Response of Emergency Shutdown Valves following Full Bore Rupture of Gas
Pipelines‖, Trans IchemE, Vol. 75 (b), pp. 201-209
Mahgerefteh, H., Jalali, N. and Fernandez, M.I. (2011), ―When Does a Vessel Become
a Pipe?‖, AIChE J, Vol. 57, No. 12, pp. 3305-3314.
Mahmut, K.A. (2005), ―Major Utilization of Natural Gas in Turkey‖, Energy
Exploration and Exploitation, Vol. 23, No. 2, Issue 16, Multi-Science Publishing Co.
Ltd, pp. 125-140 (16)
Maier, N., Nickel, K.G. and Rixecker, G. (2007), ―High Temperature Water Vapor
Corrosion of Rare Earth Disilicates (Y, Yb, Lu)2 Si2O7 in the Presence of Al(OH)3
Impurities‖, Journal of the European Ceramic Society, Vol. 27, Issue 7, pp 2705-2713
Mainusch, S., Peter, C.J., de Swaan, A.J., Javanmardi, J. and Moshfeghian, M. (1997),
―Experimental Determination and Modelling of Methane Hydrates in Mixtures of
Acetone and Water‖, J. Chem. Eng. Data, Vol. 42, pp. 948-950
Makino, T., Yamamoto, T., Nagata, K., Sakamoto, H., Hashimoto, S., Sugahara, T.
and Ohgaki, K. (2010), ―Thermodynamic Stabilities of Tetra-n-butyl Ammonium
Chloride + H2, N2, CH4, CO2, or C2H6 Semiclathrate Hydrate Systems‖, J. of Chem.
Eng. Data, Vol. 55, Iss. 2, pp 839–841
Makogon, Y. F. 1997. Hydrates of hydrocarbons: Pennwell Corp.

187
Mandal, A. and Laik, S. (2008), ―Effect of the Promoter on Gas Hydrate Formation
and Dissociation‖, Energy & Fuels, Vol. 22, Iss. 4, pp. 2527–2532
Marco, R.D., Durnie, W., Jefferson, A. and Kinsella, B. (2001), ―Surface Analysis of
Adsorbed Carbon Dioxide Corrosion Inhibitors‖, Corrosion Science Section, NACE
International, Vol. 57, No.1, pp. 9-18
Martın, A. and Peters, C.J (2009), ―Hydrogen Storage in sH Clathrate Hydrates:
Thermodynamic Model‖, J. Phys. Chem. Vol. B 2009, Iss. 113, pp. 7558–7563
Matranga, K.R., Myers, A.L. and Glandt, E.D. (1992), ―Storage of Natural Gas by
Adsorption on Activated Carbon‖, Chemical Engineering Science, Vol. 47, Iss. 7, pp.
1569-1579
Mathiesen, T., Nielsen, T.S., Haugen, T., Espelid, B., Hummelgaard, P. and
Vilpponen, K. (2004), ―Improved Method for ASTM G48 Corrosion Testing of
Welds‖, NT Technical Report, Report No. TR 548, Nordic Innovation Centre, Oslo,
Norway, pp. 1-58.
Megraud, F., Neman-Simha, V. and Brugmann, D. (1992), ―Further evidence of the
toxic effect of ammonia produced by Helicobacter pylori urease on human epithelial
cells‖, Infect Immun., Vol. 60, Iss. 5, pp. 1858-1863
Mehrian, T., de Keizer, A., Korteweg, A.J. and Lyklema, J. (1993),
―Thermodynamics of Adsorption of Dodecylpyridinium Chloride on Na-kaolinite‖,
Colloids and Surfaces A: Physicochemical and Engineering Aspects, Vol. 73, pp 133-
143.
Melchers, R. (2001), ―Probabilistic Model of Corrosion for Reliability Assessment and
Maintenance Planning‖, Proceedings of the 20th
International Conference on Offshore
Mechanics and Arctic Engineering, OMAE2001/S&R-2108
Melchers, R. (2003a), ―Modeling of Marine Immersion Corrosion for Mild and Low
alloy Steels – Part 1 Phenomenological Model‖, CORROSION, Vol. 59, Iss 4, pp. 319-
334

188
Melchers, R. (2003b), ―Mathematical Modeling of the Diffusion Controlled Phase in
Marine Immersion Corrosion of Mild Steel‖, Corrosion Science, Vol. 45, Iss. 5, pp.
923-940
Melchers, R. (2003c), ―Effect on Marine Immersion Corrosion of Carbon Content of
Low Alloyed Steels‖, Corrosion Science, Vol. 45, Iss. 11, 2609-2625
Meng, H., Hu, X. and Neville, A (2007), ―A Systematic Erosion-Corrosion Study of
Two Stainless Steels in Marine Conditions via Experimental Design‖, Wear, Vol. 263,
Is. 1-6, pp 355-362.
Mercier, D. and Barthés-Labrousse, M.G. (2009), ―The role of chelating agents on the
corrosion mechanisms of aluminium in alkaline aqueous solutions‖, Corrosion
Science, Vol. 51, pp 339-348.
Metha, S.K., Bhasin, K.K., Chauhan, R. and Dham, S. (2005), ―Effect of Temperature
on Critical Micelle Concentration and Thermodynamic Behavior of
Dodecyldimethylethylammonium Bromide and Dodecyltrimethylammonium chloride
in Aqueous Media‖, Colloids and Surfaces A: Physicochemical and Engineering
Aspects, Vol. 255, Iss. 1-3, pp. 153-157
MetOcean. Final MetOcean Design Criteria Gorgon MOG and Revised Export Jetty
Corporate, Perth, Western Australia: MetOcean, 2006.
Miah, R. and Ohsaka, T. (2009), ―Kinetics of Oxygen Reduction Reaction at Tin-
Adatom-Modified Gold Electrodes in Acidic Media‖, Electrochimica Acta, Vol. 54, Is.
24, pp 5871-5876.
Mochizuki, M. (2007), ―Control of Welding Residual Stress for Ensuring Integrity
against Fatigue and Stress–Corrosion Cracking‖, Nuclear Engineering and Design,
Vol. 237, Iss. 2, pp. 107–123
Mokhatab, S., W. A. Poe, and J. G. Speight. 2006. Handbook of Natural Gas
Transmission and Processing. Edited by M. Saeid, A. P. William and G. S. James.
Burlington: Gulf Professional Publishing.

189
Montemor, M.F., Pinto, R. and Ferreira, M.G.S. (2009), ―Chemical Composition and
Corrosion Protection of Silane Films Modified with CeO2 Nanoparticles‖,
Electrochimica Acta, Vol. 54, Is. 22, pp. 5179-5189
Montesperelli, G. and Gusmano, G. (2011), ―Electrochemical Noise for Corrosion
Detection‖, Corrosion Reviews, Vol 29, Iss.5-6, pp. 247–252
Moon, C., Taylor, P.C., and Rodger, P.M. (2003), ―Molecular Dynamics Study of Gas
Hydrate Formation‖, American Chemical Society, Vol. 125, Iss. 16, 4706-4707
Moraveji, M.K., Sadeghi, A., Fazlali, A. and Davarnejad, R. (2010), ―Effect of an
Anionic Surfactant on the Methane Hydrate Formation: Induction Time and Stability‖,
World Applied Science Journal, Vol. 9, Iss. 10, pp. 1121-1128.
Morikawa, T. (2008), ―Natural Gas and LNG Supply/Demand Trends in Asia Pacific
and Atlantic Markets‖, Report FY2007, The Institute of Energy Economic, Japan, pp.
1-28
Mote, P.W, Dunkerton, T.J, McIntyre, M.E, Ray, E.A, Haynes, P.H and Russel, J.M
(1998), ―Vertical Velocity, Vertical Diffusion and Dilution by Midlatitude Air in the
Tropical Lower Stratosphere‖, J. Geophys. Res., 103, 8651-8666
Moudrakovski, I.L., Ratcliffe, C.I., McLaurin, G.E, Simard, B. and Ripmeester, J.A.
(1999), ―Hydrate Layers on Ice Particles and Superheated Ice: A 1H NMR
Microimaging Study‖, J. Phys. Chem. A, Vol. 103, Iss. 26, pp 4969–4972
Moyer, E.J, Irion, F.W, Yung, Y.L and Gunson, M.R (1996), ―ATMO Stratospheric
Deuterated Water and Implications for Troposhere-Stratosphere Transport‖, Geophys.
Res. Lett., 23, 2385-2388
MSDS (2009), ―Instant FAME/Instant Anaerobe Methods - Methanol‖, Section 1 –
Chemical Product and Company Identification, Material Safety Data Sheet, 19th
June,
pp. 1-6
Muller, B. and Fischer, S. (2006), ―Epoxy Ester Resins as Corrosion Inhibitors for
Aluminium and Zinc Pigments‖, Corrosion Science, Vol. 48, Iss. 9, pp. 2406–2416
Murakani, K. (2004), ―Complex Formation between Dodecylpyridinium Chloride and
Multicharged Anionic Planar Substances‖, Langmuir, Vol. 20, Iss. 19, pp. 8183-8191

190
Nakajima, A, Doi, Y, Fuchigami, T and Tajima, T. (2008), ―Indirect Anodic Oxidation
Based on the Cation Exchange Reaction between (Earth) Metal Halides and Solid-
Supported Acids‖, Journal of Electroanalytical Chemistry, Vol. 623, Is. 2, 15 pp 177-
180.
Nakajima, A. and Tajima, T (2009), ―Anodic Oxidation of Organic Compounds Based
on the Cation Exchange Reaction between KBF4 and Solid-Supported Acids‖,
Electrochemistry Communications, Vol. 11, Is. 2, pp 305-308.
Nandeesh, L.S. and Sheshadri, B.S. (1991), ―Inhibitory Effect of 2-Mercapto
Pyrimidine on Corrosion of Copper Single Crystal Planes in 0·1 M H2SO4‖, Journal of
Chemical Sciences, Vol. 103, No. 6, pp. 763-775.
NEGTAP (2001) ―Transboundary Air Pollution: Acidification Eutrophication and
Ground-Level Ozone in the UK‖, National Expert Group on Transboundary Air
Pollution, Department for Environment, Food and Rural Affairs (DEFRA), UK, pp 1
Nesic, S, Xiao, Y. and Pots, B.F.M. (2004), ―A Quasi 2-D Localized Corrosion
Model‖, CORROSION, NACE, Paper No. 04628, Houston, Texas, pp 1-16
Netto, T.A., Ferraz, U.S. and Botto, A. (2007), ―On the Effect of Corrosion Defects on
the Collapse Pressure of Pipelines‖, International Journal of Solids and Structures,
Volume 44, Issues 22-23, November 2007, Pages 7597-7614
Netto, T.A. (2009), ―On the Effect of Narrow and Long Corrosion Defects on the
Collapse Pressure of Pipelines‖, Applied Ocean Research, Vol. 31, Iss. 2, pp. 75-81
NG (2011), ―The Transportation of Natural Gas‖, Natural Gas.Org, Accessed on 25th
October 2011 from http://www.naturalgas.org/naturalgas/transport.asp
Niklasson, A., Johansson, L. and Svensson, J. (2008), ―The Influence of Relative
Humidity and Temperature on the Acetic Acid Vapour-Induced Atmospheric
Corrosion of Lead‖, Corrosion Science, Vol. 50, Is. 11, pp 3031-3037.
Niu, L. and Cheng, Y.F (2008), ―Synergestic Effects of Fluid Flow and Sand Particles
on Erosion-Corrosion of Aluminum in Ethylene Glycol-Water Solution‖, Wear, Vol.
265, Is. 3-4, pp. 367-374.

191
NORSORK STANDARD (2005), ―CO2 Corrosion Rate Calculation Model‖,
Norwegian Technological Standards Institute, Oscarsgt. 20, Majorstural, NORWAY.
NPF (2011a), ―Factors Affecting General Corrosion Rate‖, Nuclear Power
Fundamentals, Integrated Publishing,
http://www.tpub.com/content/doe/h1015v1/css/h1015v1_115.htm, Retrieved on 16
Dec., 2011
NPF (2011b), ―Effect of pH on the Corrosion Rate of Iron in Water‖, Integrated
Publishing, http://www.tpub.com/content/doe/h1015v1/css/h1015v1_117.htm,
Retrieved on 16 Dec., 2011.
Nyborg, R. (2010), ―CO2 Corrosion Models for Oil and Gas Production Systems‖,
Corrosion 2010 Conference & Expo, NACE International, San Antonio, TX, March 14
- 18, Paper No. 10371, pp. 1-20
Obanijesu, E.O. and Sonibare, J.A. (2005), ―Natural Gas Flaring and Environmental
Protection in Nigeria‖, NAFTA Journal, Year 56, No 7, pp 287-294
Obanijesu, E.O., Sonibare, J.A., Bello, O.O., Akeredolu, F.A. and Macaulay, S.R.A.
(2006), ―The Impact of Pipeline Failures on the Oil and Gas Industry in Nigeria‖,
Engineering Journal of University of Qatar, Qatar, Vol. 19, pp 1-12
Obanijesu, E.O. and Mosobalaje, O.O. (2008), ―Concentration Profile Simulation on
Natural Gas Accidental Release from a Submerged Offshore Pipeline‖, NAFTA
Journal, Year 59, No 9, pp 419-431
Obanijesu, E.O. (2009), ―Modeling the H2S Contribution in Corrosion Rate of Natural
Gas Pipeline‖, Energy Sources Part A: Recovery, Utilization and Environmental
Effects, Vol. 31, Iss. 4, pp 348-363
Obanijesu, E.O. and Macaulay, S.R.A. (2009),―West African Gas Pipeline (WAGP)
Project: Associated Problems and Possible Remedies‖, E.K Yanful (Ed), Chapter 2,
Appropriate Technology for Environmental Protection in the Developing World,
Springer Books, Netherlands, pp 101–112
192
Obanijesu, E.O. and Omidiora, E.O. (2009), ―Velocity Profile Simulation for Natural
Gas underneath Waterbody following a Full-Bore Rupture of an Offshore Pipeline‖,
NAFTA Journal, Year 60, No 11, pp 610-614.
Obanijesu, E.O., Pareek, V. and Tade, M.O. (2010a), ―Hydrate Formation and its
Influence on Natural Gas Pipeline Internal Corrosion Rate‖, SPE-128544, Asia-Pacific
Oil and Gas Conference and Exhibition, Society of Petroleum Engineers, Mumbai,
India, January 20-22.
Obanijesu, E.O., Pareek, V., Gubner, R and Tade, M.O. (2010b), ―Corrosion
Education as a Tool for the Survival of Natural Gas Industry‖, NAFTA Journal, Year
61, No 12, pp 541-554.
Obanijesu, E.O., Pareek, V., Gubner, and Tade, M.O. (2010c), ―Corrosion Education
as a Tool for the Survival of Natural Gas Industry‖, Presented during Research &
Development Seminar, Curtin University, Perth, Australia, November, 2010
Obanijesu, E.O., Akindeju, M.K., Pareek, V. and Tade, M.O. (2011a), ―Modeling the
Natural Gas Pipeline Internal Corrosion Rate as a Result of Hydrate Formation‖,
Elsevier 21st European Symposium on Computer-Aided Process Engineering, (Part B)
pp. 1160-1164.
Obanijesu, E.O., Pareek, V., Gubner, R and Tade, M.O. (2011b), ―Hydrate Formation
and its Influence on Natural Gas Pipeline Internal Corrosion Rate‖, NAFTA Journal,
Year 62, No 5-6, pp 164-173.
Obanijesu, E.O., Pareek, V., Barifcani, A., Gubner, R. and Tade, M.O. (2011c),
―Influence of Corrosion Inhibitors on Hydrate Formation Temperature‖, 3rd
Regional
Materials Technology Conference, Imperial Palace Hotel, Miri, Malaysia, April 26-27.
Obanijesu, E.O., Tade, M.O., Pareek, V., Gubner, R. and Barifcani, A. (2011d),
―Pipeline Engineering in Oil and Gas Industry: Importance and Problems‖, Presented
during Research & Development Seminar, Curtin University, Miri Campus, Malaysia,
April 28
Obanijesu, E.O., Gubner, R., Barifcani, A., Pareek, V. and Tade, M.O. (2012a)
―Experimental Investigations on the Influence of Corrosion Inhibitors Commonly used

193
in Offshore Natural Gas Pipelines on Hydrate Formation Temperature‖, Submitted to
Chemical Engineering Communications, on January 11th
, 2012.
Obanijesu, E.O., Gubner, R., Barifcani, A., Pareek, V. and Tade, M.O. (2012b),
Investigations on the Impacts of Dodecylpyridinium chloride as a CO2 Corrosion
Inhibitor for Subsea Natural Gas Pipeline Networks, To be submitted to Chemical
Engineering Science, Elsevier.
Obot, I.B. and Obi-Egbedi, N.O. (2010), ―Adsorption Properties and Inhibition of Mild
Steel Corrosion in Sulphuric Acid Solution by Ketoconazole: Experimental and
Theoretical Investigation‖, Corrosion Science, Vol 52, Iss. 1, pp.198–204
Okazaki, M., Hara, I. and Fullyema, T. (1976), ―Spectroscopic Studies of Surfactant
Solubility. 1. Formation of Hydrogen Bonding between Surfactants and Chloroform‖,
The Journal of Physical Chemistry, Vol. 80, Iss. 1, pp. 64-68
Olivier, J.G.J, Bouwman, A.E, Berdowski, J.J.M, Veldt, C, Bloos, J.P.J, Visschedijk,
A.J.H van der Maas, C.W.M and Zasndveld, P.Y.J (1999), ―Sectorial Emmision
Inventories of Greenhouse Gases for 1990 on a Per Country Basis as Well as on 1x1”,
Envir. Sci. Policy, Vol. 2, pp. 241-263
OME (2002), ―Assessment of Internal and External Gas Supply for the EU, Evaluation
of the Supply Costs of New Natural Gas Supply Projects to the EU and an
Investigation of Related Financial Requirements and Tools‖, Executive Report,
Observatoire Mediterraneen De L'Energie, Nanterre, France, pp 1-17
Onianwa, P.C (1995) ―Petroleum Hydrocarbon Pollution of Urban Topsoil in Ibadan
City, Nigeria‖, Environment International Vol. 21, Iss. 3, pp. 341 – 343.
OSHA (2005), ―OSHA Fact Sheet: Hydrogen Sulfide (H2S)‖, Occupational Safety and
Health Administration, U.S. Department of Labor, DSG 10/2005, www.osha.gov.
Accessed online on 20-12-09 at
http://www.osha.gov/OshDoc/data_Hurricane_Facts/hydrogen_sulfide_fact.pdf.
Oyekunle, L.O. (1999), ―Gas Flaring in Nigeria and Environment Pollution Control‖,
In: Natural Gas: The Energy for the Next Millennium, 29th
Annual Conference of
Nigerian Society of Chemical Engineers, Kaduna, Nigeria

194
Pack, D.J. (2011), Gas Measurement and Auditing Property Ltd, Kalamunda, Western
Australia.
Paik, J. Lee, J., Hwang, J and Park, Y. (2003), ―A Time-Dependent Corrosion Wastage
Model for the Structures of Single and Double Hull Tankers and FSOs and FPSOs‖,
Marine Technology, The Society of Naval Architects and Marine Engineers, New
Jersey, Vol. 40, Iss. 3, pp. 201-217
Palmer, A.C. and King, R.A. (2008), ―Subsea Pipeline Engineering‖, 2nd
Ed.,
PennWell Corporation, Oklahoma, USA, pp. 1 – 624
Pandarinathan, V., Lepková, K. and Gubner, R. (2011), ―Inhibition of CO2 Corrosion
of 1030 Carbon Steel Beneath Sand-Deposits‖, Paper 11261, CORROSION 2011
Conference & Expo, NACE International, Houston, USA, March 13 – 17
Papadakis, G.A., Porter, S. and Wettig, J. (1999), ―EU Initiative on the Control of
Major Accident Hazards Arising from Pipelines‖, Journal of Loss Prevention in the
Process Industries, Vol. 12, Iss. 1, pp 85.90.
Papavinasam, S., Doiron, A., Panneerselvam, T. and Revie, R.W. (2007), ―Effect of
Hydrocarbons on the Internal Corrosion of Oil and Gas Pipelines‖, Corrosion, Vol. 63,
Is. 7, pp. 704-712.
Pardo, A., Merino, M.C., Coy, A.E., Viejo, F., Arrabal, R. and Matykina, E. (2008),
―Pitting Corrosion Behaviour of Austenitic Stainless Steels – Combining Effects of
Mn and Mo Additions‖, Corrosion Science, Vol. 50, Is. 6, pp. 1796-1806.
Pardo, A., Merino, S., Merino, M.C., Barroso, I., Mohedano, M., Arrabal, R. and
Viejo, F. (2009), ―Corrosion Behaviour of Silicon-Carbide-Particle Reinforced AZ92
Magnesium Alloy‖, Corrosion Science, Vol. 51, Is. 4, pp 841-849.
Parfomak, P.W. (2004), ―Pipeline Security: An Overview of Federal Activities and
Current Policy Issues‖, Congregational Research Services, The Library of Congress,
U.S. (Feb 5).
Park, Y.W., Sankara-Narayanan, T.S.N. and Lee, K.Y. (2008), ―Fretting Corrosion of
Tin-Plated Contacts‖, Tribology International, Vol. 41, Is. 7, pp. 616-628.

195
Parker, N.C. (2004), ―Using Natural Gas Transmission Pipeline Costs to Estimate
Hydrogen Pipeline Costs‖, Research Report UCD-ITS-RR-04-35, Institute of
Transportation Studies, University of California, Davis.
Parker, N.C. (2004), ―Using Natural Gas Transmission Pipeline Costs to Estimate
Hydrogen Pipelien Costs.‖, Institute of Transportation Studies, University of
California, Davis, Research Report UCD-ITS-RR-04-35, pp 1-85.
Patin S (2004a), ―Gas impact on fish and other marine organisms‖, Retrieved June 19,
2009 from http://www.offshore-environment.com/gasimpact.html.
Patin, S. (2004b) ―Environmental Impact of the Offshore Oil & Gas Industry‖,
Retrieved June 19, 2009 from http://www.offshore-environment.com
/naturalgas.html.
Pató, Z (2000), ―Piping the Forest: A Case Study of the Bolivia-Brasil Gas Pipeline‖,
CEE Bankwatch Network, January 2000.
PHMSA (2009), ―Remembering Bellingham: Pipeline Accident Plays Huge Role in
Restructuring DOT‘s Pipeline Safety Program‖, Pipeline and Hazardous Materials
Safety Administration, U.S. Department of Transportation, Vol.3, No.3, pp 1-15.
Picioreanu, C. and Loosdrecht, M.C.M (2002), ―A Mathematical Model for Initiation
of Microbiologically Influenced Corrosion by Differential Aeration‖, Journal of
Electrochemical Society, Vol. 149, Iss. 6, pp. B211-B223
Pickthall, T., Rivera, M., McConnell, M. and Vezis, R. (2011), ―Corrosion Monitoring
Equipment, A Review of Application and Technique‖, Paper 11280, Corrosion 2011
Conference and Expo, Houston, Texas, March 13-17, pp. 1-16.
Pilavachi, P.A., Stephanidis, S.D., Pappas, V.A. and Afgan, N.H (2009), ―Multi-
criteria Evaluation of Hydrogen and Natural Gas Fuelled Power Plant Technologies‖,
Applied Thermal Engineering, Vol. 29, Is. 11-12, pp. 2228-2234
Pistdrius, P.C and Burstein, G.T (1992), ―Metastable Pitting Corrosion of Stainless
Steel and the Transition to Stability‖, Philos. Trans. R. Soc. Lond., A341, pp. 531-559

196
Popova, A., Sokolova, E., Raicheva, S. and Christov, M. (2003), ―AC and DC Study
of the Temperature Effect on Mild Steel Corrosion in Acid Media in the Presence of
Benzimidazole Derivatives‖, Corrosion Science, Vol. 45, Iss. 1, pp. 33–58
Prasad, P.S.R., Sugahara, T., Sum, A.K., Sloan, E.D. and Koh, C.A. (2009),
―Hydrogen Storage in Double Clathrates with tert-Butylamine‖, The Journal of
Physical Chemistry A, Vol. 113, Iss. 24, pp. 6540–6543
Prather, M, Derwent, R, Ehhalt, D, Frazer, P, Sanhueza, E and Zhou, X (1995),
―Other Tracer Gases and Atmospheric Chemistry In: Climate Change 1994,
[Houghton, J.T, MeiraFilho, L.G, Bruce, J, Hoesung L, Callander, B.A, Haites, F,
Harris, N and Maskell, K (ed)] Cambridge University Press, UK, pp 73-126
Prather, M and Ehhalt, D (2001), ―Atmospheric Chemistry and Greenhouse Gases: In
Climate Change 2001- The Scientific Basis (2001) [Contribution of Working Group 1
to the Third Assessment Report of the Intergovernmental Panel on Climate Change]
Cambridge University Press, UK, 239-287
Pujar, M.G., Anita T., Shaikh H., Dayal, R.K. and Khatak, H.S. (2007), ―Analysis of
Electrochemical Noise (EN) Data Using MEM for Pitting Corrosion of 316 SS in
Chloride Solution‖, Int. J. Electrochem. Sci., Vol. 2, pp. 301 – 310
Qin, S and Cui, W. (2002), ―Effect of Corrosion Models on the Time-Dependent
Reliability of Steel Plated Elements‖, Marine Structures, Vol. 16, Iss. 1, pp 15-34
Railroad Commission of Texas (2008), "Barnett Shale Information – Updated July 30,
2010", On-line document: http://www.rrc.state.tx.us/barnettshale/index.html
Rajahram, S.S., Harvey, T.J. and Wood, R.J.K. (2009), ―Erosion-Corrosion Resistance
of Engineering Materials in Various Test Conditions‖, Wear, Vol. 267, Iss. 1-4, pp.
244-254
Ramirez, N., Cuadras, A., Rovira, E., Borrull, F. and Marce, R.M. (2012), ―Chronic
Risk Assessment of Exposure to Volatile Organic Compounds in the Atmosphere near
the Largest Mediterranean Industrial Site‖, Environment International, Vol. 39, Iss. 1,
pp. 200–209

197
Rani, B.E.A. and Basu, B.B.J. (2011), ―Green Inhibitors for Corrosion Protection of
Metals and Alloys: An Overview‖, International Journal of Corrosion, Vol. 2012, pp.
1-15
RCEBC (2009), ―I.T. Super Models: European Oil and Gas from Exploration to End
Users‖, Roadbridge Civil Engineering and Building Contractor‖, Issue 2, Schofield
Publishing Ltd, Norwich, U.K.
Restrepo, C.E, Simonoff, J.S and Rae Zimmerman, R. (2009), ―Causes, cost
consequences, and risk implications of accidents in US hazardous liquid pipeline
infrastructure‖, International Journal of Critical Infrastructure Protection, Vol. 2, pp.
38 – 50
Reyes, A., Letelier, M.V., De la Iglesia, R., González, B and Lagos, G (2008),
―Microbiologically Induced Corrosion of Copper Pipes in Low-pH Water‖,
International Biodeterioration & Biodegradation, Vol. 61, Iss. 2, pp 135-141.
Ricciardiello, F. and Roitti, S. (1972), ―The Corrosion of Fe and Ag in S Liquid at
Low Temperature, Effect of S Viscosity‖, Corrosion Science, Vol. 12, Is. 8, pp. 651-
659.
Roarty, M. (2008), ―Australia‘s Natural Gas: Issues and Trends‖, Science,
Technology, Environment and Resources Section, Department of Parliamentary
Services, Parliament of Australia, no. 25, ISSN 1834-9854, pp. 1-22
Roberge, P.R. (2008), ―Corrosion Engineering: Principle and Practise‖, 1st Ed., The
McGraw-Hill Companies Inc., New York, pp. 1 – 754
Rogers, R.E., Zhong, Y., Arunkumar, R., Etheridge, J.A., Pearson, L.E., McCown, J.
and Hogancamp, K. (2005), ―Gas Hydrate Storage Process for Natural Gas‖, GasTIPS,
Winter, pp. 14-18
Rojey, A., Jaffret, C., Cornot-Gandolphe, S., Durand, B., Jullian, S. and Valais, M.
(1997), ―Natural Gas: Production, Processing, Transport‖, Imprimerie Nouvelle, Saint-
Jean-de-Braye, France.
198
Rosenlof, K.H, Tuck, A.F, Kelly, K.K, Russel, J.M and McCormick, M.P (1997),
―Hemispheric Asymmetries in Water Vapor and Interferences about Transport in the
Lower Stratosphere‖, J. Geophys. Res., Vol. 102, pp. 13213-13234
Roux, A., Gicquel, L.Y.M, Sommerer, Y. and Poinsot, T.J. (2008), ―Large Eddy
Simulation of Mean and Oscillating Flow in a Side-Dump Ramjet Combustor‖,
Combustion and Flame, Vol. 152, Iss. 1-2, pp. 154-176.
Roymech (2009), ―Properties Of Gases‖, Accessed on 24th
November, 2009 from
http://www.roymech.co.uk/Useful_Tables/Matter/Prop_Gas.htm
Ryu, H.S. and Lee, H.S. (2012), ―Study of Anti-corrosion Properties of Organic and
Inorganic Inhibitors by Electrochemical Treatment in Aqueous Solution‖, Advanced
Materials Research, Vol. 415 – 417, pp. 2070-2073
Saeed, A., Erben, M.F., Shaheen, U. and Flörke, U. (2011), ―Synthesis, Structural and
Vibrational Properties of 1-(4-Fluorobenzoyl)-3-(Isomeric Fluorophenyl)thioureas‖,
Journal of Molecular Structure, Vol. 1000, Iss. 1-3, pp. 49–57
Saipem (2004), ―Saipem to Lay Dolphin Line‖, Pipeline and Gas Technology, USA,
June.
Salagar, J.L. (2002), ―Surfactants: Types and Uses – Teaching Aid in Surfactant
Science and Engineering‖, Laboratory of Formulation, Interfaces, Rhelogy and
Processes, Version #2, FIRP Booklet #E300-A, Universidad De Los Andes, Merida-
Venezuela. pp 1-50
Saleh, M. M. (2006), ―Inhibition of Mild Steel Corrosion by Hexadecylpyridinium
Bromide in 0.5M H2SO4‖, Materials Chemistry and Physics, Vol. 98, Iss. 1, pp. 83-89.
Sangeetha, M., Rajendran, S., Muthumegala, T.S. and Krishnaveni, A. (2011), ―Green
Corrosion Inhibitors-An Overview‖, Zastita Materijala, Vol 52, Iss. 1, pp. 3-19
Saravanan, K., Kumar, K. and Palaniswamy, N. (2009), ―Corrosions, Condition
Monitoring and Rehabilitation of Concrete Structures‖, Corrosion Reviews, Vol. 27,
Iss. Supplement, pp. 213–286.

199
Sarshar, M., Fathikalajahi, J. and Esmaeilzadeh, F. (2010), ―Experimental and
Theoretical Study of Gas Hydrate Formation in a High-Pressure Flow Loop‖, The
Canadian Journal of Chemical Engineering, Vol. 88, Iss. 5, pp. 751-757
Scheiner, S. and Hellmich, C. (2007), ―Stable Pitting Corrosion of Stainless Steel as
Diffusion-Controlled Dissolution Process with a Sharp Moving Electrode Boundary‖,
Corrosion Science, Vol. 49, Is. 2, pp. 319-346.
Schimel, D, Alves, D, Enting, I, Heinmann, M, Joos, F, Raynaud, D, Wigley, T,
Prather, M, Derwent, R, Ehhart, D, Frazer, P, Sanhueza, E, Zhou, X, Jonas, P,
Charlson, R, Rodha, H, Sadasivan, S, Shine, K.P, Fouquart, Y, Ramaswamy, V,
Solomon, S, Srivinasan, J, Albritton, D, Isaksen, I, Lal, M and Wuebbles, D (1996),
―Chapter 2, Radioactive Forcing of Climate Change‖, In: Climate Change 1995: The
Science of Climate Change, Contribution of Working Group 1 to the Second
Assessment Report of the Intergovernmental Panel on Climate Change, Cambridge
University Press, UK, pp 65-131
Schlumberger (2011), ―Corrosion Inhibitor KI-3882* High Film Persistent, Batch-type
Corrosion Inhibitor Designed to Control Corrosion in Oil Production Systems‖,
Houston Texas, U.S.A, pp 1-2. Accessed on 3rd
November, 2011 from
http://www.slb.com/~/media/Files/miswaco/product_sheets/ki_3882.ashx
Schmitt, G., Bosch, C., Mueller, M. and Siegmund, G. (2000), ―A Probabilistic Model
for Flow Induced Localized Corrosion‖, CORROSION, Paper No. 49, NACE
International, Houston, Texas.
Schwermer, C.U., Lavik, G., Abed, R.M.M., Dunsmore, B., Ferdelman, T.G.,
Stoodley, P., Gieseke, A. and Dirk de Beer, D. (2008), ―Impact of Nitrate on the
Structure and Function of Bacterial Biofilm Communities in Pipelines Used for
Injection of Seawater into Oil Fields, Applied and Environmental Microbiology, Vol.
74, No. 9, pp. 2841–2851
Scientific and Industrial Research Organization (CSIRO), Australian Resources
Research Center, Perth, Australia.
Seguel, R.J., Morales S.R.G.E. and Leiva G. M.A. (2012) ―Ozone weekend effect in
Santiago, Chile‖, Environmental Pollution, Vol. 162, pp. 72-79

200
Seiad, L.L., Villemin, D., Bar, N. and Hachemi,
M. (2012), ―Solvent-Free
Condensation of Methyl Pyridinium and Quinolinium Salts with Aldehydes Catalyzed
by DBU‖, Synthetic Communications, Vol. 42, Iss. 5, pp. 650–657
Shell (2004), ―Shell to Sell Gulf of Mexico System‖, Pipeline and Gas Technology,
USA, June.
Singh, B. and Krishnathasan, K. (2009), ―Pragmatic Effects of Flow on Corrosion
Prediction‖, Corrosion 2009 Conference & Expo, NACE International, Atlanta, GA,
March 22 – 26, Paper No. 09275, pp. 1-29
Singh, H.B, Thakur, A.N, Chen, Y.E and Kanakidou, M (1996), ―Tetrachloroethylene
as an Indicator of Low Cl Atom Concentrations in the Troposhere‖, Geophys. Res.
Lett., 23, 1529-1532
Shipilov, S.A. and May, L.L (2006), ―Structural Integrity of Aging Buried Pipelines
Having Cathodic Protection‖, Engineering Failure Analysis, Vol. 13, Is. 7, pp. 1159-
1176
Shukla, P.R., Dhar, S., Victor, D.G. and Jackson, M. (2009), ―Assessment of Demand
for Natural Gas from the Electricity Sector in India‖, Energy Policy, Vol. 37, Is. 9, pp.
3520-3534
Skrifvars, B-J., Backman, R., Hupa, M., Salmenoja, K., and Vakkilainen, E. (2008),
―Corrosion of Superheated Steel Materials under Alkali Salt Deposits Part 1: The
Effect of Salt Deposit Composition and Temperature‖, Corrosion Science, Vol. 50, Is.
5, pp. 1274-1282.
Sloan, E. D. (2003), ―Fundamental Principles and Applications of Natural Gas
Hydrates‖, Nature, Vol. 426, Iss. 6964, pp. 353-363.
Sloan, E. D. (2005), ―A Changing Hydrate Paradigm - from Apprehension to
Avoidance to Risk Management‖, Fluid Phase Equilibria, Vol. 228-229, pp. 67-74.
Sloan, E. D. and Koh, C.A. (2007), ―Clathrate Hydrates of Natural Gases‖, 3rd
Edition,
CRC Press, USA.
Smith, J.M., Van Ness, H.C. and Abbott, M.M. (2008), ―Introduction to Chemical
Engineering Thermodynamics‖, 7th
Edition, McGraw-Hills, New York.

201
Snell, E., Otto, F.D. and Robinson, D.B. (1961), ―Hydrates in Systems Containing
Methane, Ethylene, Propylene and Water‖, AIChE Journal, Vol. 7, Iss. 3, pp. 482–485
Soares, C.G and Garbatov, Y. (1999), ―Reliability of Maintained, Corrosion Protected
Plate Subjected to Non-linear Corrosion and Compressive Loads‖, Marine Structures,
Vol. 12, Iss. 6, 425-446
Soares, C.G, Garbatov, Y, Zayed, A. and Wang, G (2005), ―Non-linear Corrosion
Model for Immersed Steel Plates Accounting for Environmental Factors‖, Marine
Technology Conference & Expo., Society of Naval Architects and Engineers, New
Jersey, pp 193-211
Soares, G. C., Garbatov, Y., Zayed, A. and Wang, G. (2009), ―Influence of
Environmental Factors on Corrosion of Ship Structures in Marine Atmosphere‖,
Corrosion Science, vol. 51, pp. 2014-2026
Song, F.M. (2009), ―Predicting the Mechanisms and Crack Growth Rates of Pipelines
Undergoing Stress Corrosion Cracking at High pH‖, Corrosion Science, Vol. 51, Is.
11, pp. 2657-2674.
Song, H.W., Kim, H.J., Saraswathy, V. and Kim, T.W. (2007), ―A Micro-mechanics
Based Corrosion Model for Predicting the Service Life of Reinforced Concrete
Structures‖, Int. J. Electrochem. Sci., Vol. 2, pp. 341-354
Sonibare, J.A., Obanijesu, E.O., Adebiyi, F.M. and Akeredolu, F.A. (2005),‖ Potential
Contribution of Volatile Organic Compounds (VOCs) to Nigeria‘s Airshed by
Petroleum Refineries‖, NAFTA Journal, Year 56, No 6, pp 231-242
Sonibare, J.A. and Akeredolu, F.A. (2006), ―Natural Gas Domestic Market
Development for Total Elimination of Routine Flares in Nigeria‘s Upstream Petroleum
Operations‖, Energy Policy, Vol. 34, Iss. 6, pp. 743 – 753
Sonibare, J.A, Adebiyi, F.M, Obanijesu, E.O and Okelana, O.A. (2010), ―Air Quality
Index Pattern around Petroleum Production Facilities‖, Management of Environmental
Quality: An Internal Journal, Vol. 21, Iss. 3, pp. 379-392.
Southwell, C., Bultman, J. and Hummer, C. (1979), ―Estimating of Service Life of
Steel in Seawater‖, Seawater Corrosion Handbook, pp. 374-387

202
Sovago, M., Campen, R.K., Wurpel, G.W.H, Muller, M., Bakker, H.J., and Bonn, M
(2008), ―Vibrational Response of Hydrogen-bonded Interface Water is Dominated by
Intramolecular Coupling‖, Phys Rev Lett. , Vol. 100, Iss. 17, pp. 173901-1 - 173901-4
Stack, M.M. and Abd El-Badia, T.M. (2008), ―Some Comments on Mapping the
Combined Effects of Slurry Concentration, Impact Velocity and Electrochemical
Potential on the Erosion-Corrosion of WC/Co-Cr Coating‖, Wear, Vol. 264, Is. 9-10,
pp 826-837.
Stack, M.M., Corlett, N. and Turgoose, S. (2003), ―Some Thoughts on Modelling the
Effects of Oxygen and Particle Concentration on the Erosion-Corrosion of Steels in
Aqueous Slurries‖, Wear, Vol. 255, Is. 1-6, pp. 225-236
Stern, J. (2001), ―Traditionalists Versus the New Economy: Competing Agendas for
European Gas Markets to 2020‖, Briefing Paper-Draft, The Royal Institute of
International Affairs – Energy and Environment Programme, London, New Series, No.
26, pp 1-7
Steven, E. (2000) ―Plan for Degassing Lakes Nyos and Monoun‖, www.lake
nyos\Lake Nyos plan for degassing lakes Nyos and Monoun, Cameroon_ Gas disaster
at Nyos mitigation of a natural hazard at Nyos.htm
Stevens P., (2003), ―Cross-Border Oil and Gas Pipelines: Problems and Prospects‖.
Joint UNDP/World Bank Energy Sector Management Assistance Program (ESMAP).
pp. 130
Stockert, L. and Bohni, H. (1989), ―The Pitting Potential of Aluminum in Halide
Solution‖, Corrosion Engineering and Sciences, Vol 42, Iss. 4, pp 158-168
Stress (2003), ―Pipeline Corrosion‖, Stress Engineering Services, Inc., USA.
Sun, H. H., Yong, B., Bea, R. and Cui, W.C. (2001), ―Time-Variant Reliability of
FPSO Hulls‖, Transaction – Society of Naval Architects and Marine Engineers, Vol.
109, pp. 341-366
Sun, H.H. and Yong, B. (2003), ―Time-variant Reliability Assessment of FPSO Hull
Girders‖, Marine Structures, Vol. 16, pp. 219–253

203
Sun, Z., Wang, R., Ma, R., Guo, K. and Fan, S. (2003b), ―Natural Gas Storage in
Hydrates with the Presence of Promoters‖, Energy Conversion and Management, Vol.
44, Iss. 17, pp. 2733-2742
Sun, Y., George, K. and Nesic, S. (2003a), ―The Effect of Cl-
and Acetic Acid on
Localized CO2 Corrosion in Wet Gas Flow‖, CORROSION, Paper No 3327, Houston,
Texas, NACE International.
Sun, Z.G., Jiang, C.M. and Xie, N.L. (2008), ―Hydrate Equilibrium Conditions for
Tetra-n-butyl Ammonium Bromide‖, J. Chem. Eng. Data, Vol. 53, Iss. 10, pp. 2375–
2377.
Surovetseva, D., Barifcani, A. and Amin, R. (2009), ―Cryogenic Condensation Capture
of Cr2 from IGCC flue gases‖, CO2CRC Research Symposium, Coolum, Queensland,
Australia, December, 1-5.
Tada, E., Sugawara, K. and Kaneko, H. (2004), ―Distribution of pH During Galvanic
Corrosion of a Zn/Steel Couple‖, Electrochimica Acta, Vol. 49, Is. 7, pp 1019-1026.
Takeya, S., Hori, A., Uchida, T. and Ohmura, R. (2006), ―Crystal Lattice Size and
Stability of Type H Clathrate Hydrates with Various Large-Molecule Guest
Substances‖, J. Phys. Chem. B, Vol. 110, pp. 12943-12947
Talaghat, M.R., Esmaeilzadeh, F. and Fathikaljahi, J. (2009), ―Experimental and
Theoretical Investigation of Simple Gas Hydrate Formation with or without Presence
of Kinetic Inhibitors in A Flow Mini-Loop Apparatus‖, Fluid Phase Equilibria, Vol.
279, Is. 1, pp 28-40
Teryusheva, S.A., Beloglazov, G.S. and Beloglazov, S.M. (2012), ―Experimental and
Quantum Chemical Study of Quinone Derivatives as Inhibitors of Corrosion and
Hydrogen Absorption by Steel‖, Solid State Phenomena, Vol. 183, pp. 249-255
TET (2011a), ―Gases-Densities: Densities and molecular weights of some common
gases - acetylene, air, methane, nitrogen, oxygen and many others‖, The Engineering
Toolbox, Access on 20/12/2011 at http://www.engineeringtoolbox.com/gas-density-
d_158.html
204
TET (2011b), ―Gases-Specific Gravities: ―Specific gravity of air, ammonia, butadiene,
carbon dioxide, carbon monoxide and some other Common Gases‖, The Engineering
Toolbox, Access on 20/12/2011 at http://www.engineeringtoolbox.com/specific-
gravities-gases-d_334.html
Theobald, N. (2006) ―The World's Most Significant Gas Field: Gorgon Project.‖,
http://www.igu.org/html/wgc2006pres/data/wgcppt/pdf/WOC%20Working%20Comm
itteeWOC%201/The%20worlds%20most%20significant%20gas%20fields/1.1CS.07.p
df Accessed on 19th
January, 2012 from
Thompson, N.G. and Vieth, P.H. (2003), ―Corrosion Costs U.S. Transmission
Pipelines as much as $8.6 billion/year‖, Pipeline & Gas Journal, March Edition, pp.
21-23
Tourkolias, C., S. Mirasgedis, S., Damigos, D., and Diakoulaki, D. (2009),
―Employment Benefits of Electricity Generation: A Comparative Assessment of
Lignite and Natural Gas Power Plants in Greece‖, Energy Policy, Vol. 37, Iss. 10, pp.
4155–4166
Ueber, E and McCall, A (1982), ―The Rise and Fall of the Calfornia Sardine Empire‖,
In: Climate Variability, Climate Change and Fisheries, Edited by Glantz, M.H,
Cambridge University Press, UK, 31-48
UNCTAD (2009), ―Info Comm Market Information in the Commodity Areas‖, United
Nations Conference on Trade and Development, Palais des Nations, Geneva,
Switzerland.
Uno, B., Okumura,N., Goto, M. and Kano, K. (2000), ―n-ó Charge-Transfer
Interaction and Molecular and Electronic Structural Properties in the Hydrogen-
Bonding Systems Consisting of p-Quinone Dianions and Methyl Alcohol‖, J. Org.
Chem., Vol, 65, pp. 1448-1455
US DOE (Department of Energy) (1985), ―Characterization of Infornation
Requirements for Studies of CO2 Effects: Water Resources, Agriculture, Fisheries,
Forests and Human Health‖, DOE/ER-0236, Washington DC,: Carbon Dioxide
Research Division, US DOE

205
Van Hunnik, E.W.J., Pot, B.F.M. and Hendrisken, E.L.J.A. (1996), ―The Formation of
Protective FeCO3 Corrosion Product Layers in CO2 Corrosion‖, CORROSION, Paper
6, NACE, Houston Texas.
Vashi, R.T. and Naik, D. (2010), ―Hexamine as Corrosion Inhibitors for Zinc in
Phosphoric Acid‖, E-Journal of Chemistry, Vol. 7, Iss. S1, pp. S1-S6
Valais, M. (1983), ―Analyse des Chaines Gas. Etudes, Ressources et Valorisation du
Gas. Les Reserves et la Production de Gaz Naturel dans le Monde: Situation et
Perspectives‖, Intern. Rep. Inst. Fr. Petr., No. 31092, p. 31 (fr).
Veawab, A and Aroonwilas, A. (2002), ―Indentification of Oxidizing Agents in
Aqueous Amine-CO2 Systems using a Mechanistic Corrosion Model‖, Corrosion
Science, Vol. 44, Is. 5, pp. 967-987.
Videla, H.A. (1996), ―Manual of Biocorrosion‖, CRC Press, Boca-Raton, Florida,
U.S.A.
Villano, L.D., Kommedal, R. and Kelland, M.A. (2008), ―Class of Kinetic Hydrate
Inhibitors with Good Biodegradability‖, Energy & Fuels, Vol. 22, pp. 3143–3149
Vlachos, N.A., Paras, S.V. and Karabelas, A.J. (1997), ―Liquid-to-wall shear stress
distribution in stratified/atomization flow‖, International Journal of Multiphase Flow,
Vol. 23, Iss. 5, pp. 845-863
Vongbupnimit, K., Noguchi, K. and Okuyama, K. (1995), ―1-Dodecylpyridinium
Chloride Monohydrate‖, Acta Crystallographica Section C, Crystal Structure
Communications, Vol. 51, Part 9, pp. 1940-1941
Vysniauskas, A. and Bishnoi, P.R. (1983), ―A Kinetic Study of Methane Hydrate
Formation‖, Chemical Engineering Science, Vol. 38, pp. 1061- 1072.
Wang, W. and Free, M.L. (2003), ―Prediction and Measurement of Mild Steel
Corrosion Inhibition by Alkyl Pyridinium Chloride and Alkyl Trimethyl Ammonium
Bromide Surfactants in Acidic Chloride Media‖, Anti-Corrosion Methods and
Materials, Vol. 50, Is. 3, pp. 186-192.

206
Wang, G., Spencer, J. and Elsayed, T. (2003), ―Estimation of Corrosion Rates of Oil
Tankers‖, Proceedings of 22nd
International Conference on Offshore Mechanics and
Arctic Engineering, ASME, Paper OMAE2003-37361
Wang, W., Fan, S., Liang, D., and Li, Y. (2010), ―Experimental Study on Flow
Characteristics of Tetrahydrofuran Hydrate Slurry in Pipelines‖, Journal of Natural
Gas Chemistry, Vol. 19, Iss. 3, pp. 318-322.
Wenji, S., Rui, X., Chong, H., Shihui, H., Kaijun, D.,and Ziping, F. (2009),
―Experimental investigation on TBAB Clathrate Hydrate Slurry Flows in a Horizontal
Tube: Forced Convective Heat Transfer Behaviors‖, International Journal of
Refrigeration, Vol. 32, Iss. 7, pp. 1801-1807.
Wharton, J.A. and Wood, R.J.K. (2004), ―Influence of Flow Conditions on the
Corrosion of AISI 304L Stainless Steel‘, Wear, Vol. 256, Iss. 5, pp. 525–536
Whited, T. (2003), ―Use of Corrosion Inhibitors for Control of Corrosion in Double
Bottom AST‘s‖, Praxair Services, Inc. (PSI), Broomfield, CO, USA, pp 1-5. Accessed
on 3rd
November, 2011 from
http://www.cortecvci.com/Publications/Papers/AST%20Corrosion%20Inhibitor%20Pr
ocess%20v2.pdf
Williams, D.E, Westcott, C and Fleischmann, M (1985), ―Stochastic Models of Pitting
Corrosion of Stainless Steels‖, J. Electrochem, Soc., Vol. 132, 1796-1804
Wooster, W.S (1982), ―King Crab Dethroned‖, In: Climate Variability, Climate
Change and Fisheries, Edited by Glantz, M.H, Cambridge University Press, UK, pp
15-30
Wu, B., Scully, J.R, MiKhailov, A.S and Hudson, J.L., (1997), ―Cooperative
Stochastic Behaviour in Localized Corrosion: Model I‖, J. Electrochem. Soc., Vol.
144, 1614-1620
Wu, Q., Gao, X. and Zhang, B.Y. (2011), ―SDS Effect on CH4/N2/O2 Hydrate
Formation Rate for CMM Separation and Storage‖, Advanced Materials Research,
Vol. 201-203, pp. 471-475.

207
Xiao, Y. and Nesic, S. (2005), ―A Stochastic Prediction Model of Localized CO2
Corrosion‖, CORROSION, Paper # 05057, NACE, Houston, Texas, pp. 1-12.
Xu, W., Daub, K, Zhang, X., Noel, J.J., Shoesmith, D.W. and Wren, J.C. (2009a),
―Oxide Formation and Conversion on Carbon Steel in Mildly Basic Solutions‖,
Electrochimica Acta, Vol. 54, Is. 24, pp. 5727-5738.
Xu, J., Zhuo, C., Han, D., Tao, J., Liu, L. and Jiang, S. (2009b), ―Erosion-Corrosion
Behaviour of Nano-Particle-Reinforced Ni Matrix Composite Alloying Layer by
Duplex Surface Treatment in Aqueous Slurry Environment‖, Corrosion Science, Vol.
51, Is. 5, pp. 1055-1068.
Yamamoto, N. and Ikegami, K (1998), ―A Study on the Degradation of Coating and
Corrosion of Ship‘s Hull Based on the Probabilistic Approach‖, Journal of Offshore
Mechanics and Arctic Engineering, Vol. 120, Iss. 3, pp. 121-128
Yang, C.Y., Chu, H.F., Tsai, S.S., Chng, C.C., and Chuang, H.Y. (2002) ―Increased
Risk of Preterm Delivery in Areas with Cancer Mortality Problems from
Petrochemical Complexes‖, Environmental Research, Vol. 89, Iss. 3, pp. 195 – 2000.
Yapa P.D. and Zheng, L (1998), ―Simulations of Oil Spills from Under Accidents I:
Model Development, Journal of Hydraulic Research, Vol. 35, No 5, pp 673-687.
Zcan, M.O. and Dehri, I. (2004), ―Electrochemical and Quantum Chemical Studies of
Some Sulphur-Containing Organic Compounds as Inhibitors for the Acid Corrosion of
Mild Steel‖, Progress in Organic Coatings, Vol. 51, Iss. 3, pp. 181–187
Zhang, L. Burgass, R., Chapoy, A. and Bahman, B. (2011), ―Measurement and
Modeling of Water Content in Low Temperature Hydrate–Methane and Hydrate–
Natural Gas Systems‖, J. Chem. Eng. Data, Vol. 56, Iss. 6, pp. 2932–2935
Zhang, Z.X and Wu, D. (2012), ―Reliability Analysis of Factors Affecting Gas
Pipeline Operational Conditions‖, Applied Mechanics and Materials, Vol. 135-136,
pp. 720-724
Zhao, M., Liu, M., Song, G. and Atrens, A. (2008), ―Influence of pH and Chloride ion
Concentration on the Corrosion of Mg alloy ZE41‖, Corrosion Science, Vol. 50, Is.
11, pp 3168-3178

208
Zheng, L and Yapa P.D (1998), ―Simulations of Oil Spills from Under Accidents II:
Model Verification‖, Journal of Hydraulic Research, Volume 36, No 1, pp 117-134.
Zhong, Y. and Rogers, R.E. (2000), ―Surfactant Effects on Gas Hydrate Formation‖,
Chemical Engineering Science, Vol.55, Iss. 19, pp. 4175-4187.
Zhongha, L., Dong, W., and Sheng, Z.Y. (2003), ―DNA Damage and Changes of
Antioxidative Enzymes in Chronic Benzene Poisoning Mice‖, Bing Za Zhi, Vol 21,
Iss. 6, pp. 423 – 425.

209
APPENDIX A
YES
2
NO
I
I = I+1
Cpi = 0.0
I = 0
WRITE
3.5 ≤ pH ≤ 4.6
4.6 ≤ pH ≤ 6.5
READ N, Ni, NT, Mi, pHi,
KT, R, T0, Tf, Ti, Tstd, Tci, ρi,
ωi, Pϲ, Cpi, Pci, Pi, Ai, Bi, Ci,
Di, Dp, QL, QG,
START
YES
NO
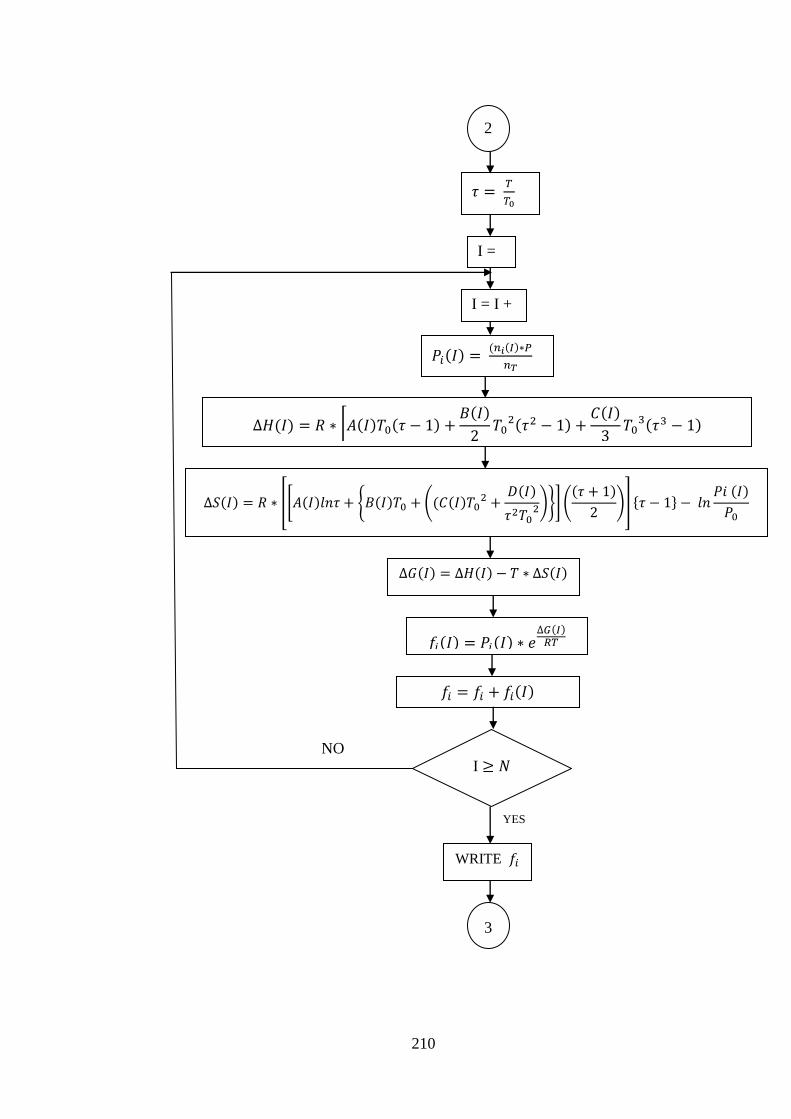
210
NO
I =
0
2
I = I +
1
I
YES
WRITE
3

211
YES
NO
3
I = 0
I = I + 1
I
4

212
YES
4
I =
0
I = I +
1
NO I -1
5
5

213
Figure A1: The solution flowchart for the newly developed corrosion model
WRIT
5
5
STOP