Measuring and modeling thermal conductivity of gas hydrate-bearing sand
Science in China Series D: Earth Sciences
© 2007 SCIENCE IN CHINA PRESS
Springer
www.scichina.com www.springerlink.com Sci China Ser D-Earth Sci | Nov. 2007 | vol. 50 | no. 11 | 1733-1745
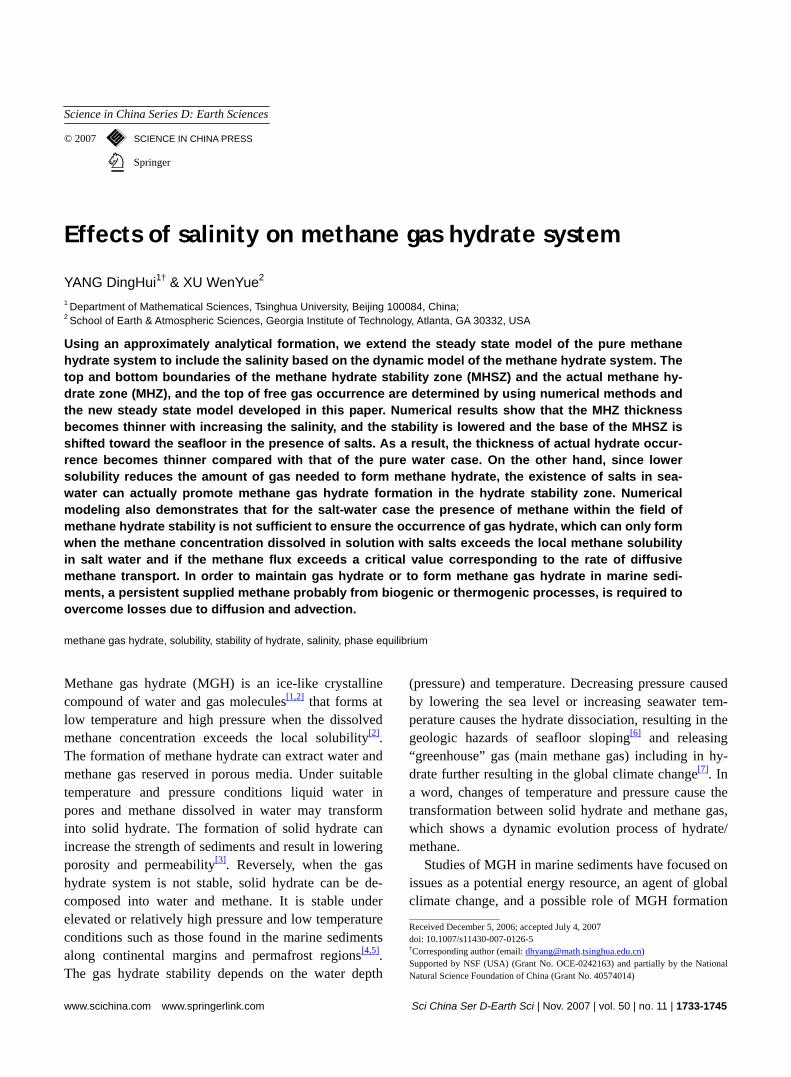
Effects of salinity on methane gas hydrate system
YANG DingHui1† & XU WenYue2
1 Department of Mathematical Sciences, Tsinghua University, Beijing 100084, China; 2 School of Earth & Atmospheric Sciences, Georgia Institute of Technology, Atlanta, GA 30332, USA
Using an approximately analytical formation, we extend the steady state model of the pure methane hydrate system to include the salinity based on the dynamic model of the methane hydrate system. The top and bottom boundaries of the methane hydrate stability zone (MHSZ) and the actual methane hy-drate zone (MHZ), and the top of free gas occurrence are determined by using numerical methods and the new steady state model developed in this paper. Numerical results show that the MHZ thickness becomes thinner with increasing the salinity, and the stability is lowered and the base of the MHSZ is shifted toward the seafloor in the presence of salts. As a result, the thickness of actual hydrate occur-rence becomes thinner compared with that of the pure water case. On the other hand, since lower solubility reduces the amount of gas needed to form methane hydrate, the existence of salts in sea-water can actually promote methane gas hydrate formation in the hydrate stability zone. Numerical modeling also demonstrates that for the salt-water case the presence of methane within the field of methane hydrate stability is not sufficient to ensure the occurrence of gas hydrate, which can only form when the methane concentration dissolved in solution with salts exceeds the local methane solubility in salt water and if the methane flux exceeds a critical value corresponding to the rate of diffusive methane transport. In order to maintain gas hydrate or to form methane gas hydrate in marine sedi-ments, a persistent supplied methane probably from biogenic or thermogenic processes, is required to overcome losses due to diffusion and advection.
methane gas hydrate, solubility, stability of hydrate, salinity, phase equilibrium
Methane gas hydrate (MGH) is an ice-like crystalline compound of water and gas molecules[1,2] that forms at low temperature and high pressure when the dissolved methane concentration exceeds the local solubility[2]. The formation of methane hydrate can extract water and methane gas reserved in porous media. Under suitable temperature and pressure conditions liquid water in pores and methane dissolved in water may transform into solid hydrate. The formation of solid hydrate can increase the strength of sediments and result in lowering porosity and permeability[3]. Reversely, when the gas hydrate system is not stable, solid hydrate can be de-composed into water and methane. It is stable under elevated or relatively high pressure and low temperature conditions such as those found in the marine sediments along continental margins and permafrost regions[4,5]. The gas hydrate stability depends on the water depth
(pressure) and temperature. Decreasing pressure caused by lowering the sea level or increasing seawater tem-perature causes the hydrate dissociation, resulting in the geologic hazards of seafloor sloping[6] and releasing “greenhouse” gas (main methane gas) including in hy-drate further resulting in the global climate change[7]. In a word, changes of temperature and pressure cause the transformation between solid hydrate and methane gas, which shows a dynamic evolution process of hydrate/ methane.
Studies of MGH in marine sediments have focused on issues as a potential energy resource, an agent of global climate change, and a possible role of MGH formation Received December 5, 2006; accepted July 4, 2007 doi: 10.1007/s11430-007-0126-5 †Corresponding author (email: [email protected]) Supported by NSF (USA) (Grant No. OCE-0242163) and partially by the National Natural Science Foundation of China (Grant No. 40574014)
1734 YANG DingHui et al. Sci China Ser D-Earth Sci | Nov. 2007 | vol. 50 | no. 11 | 1733-1745
and dissociation in slope instability and other geologic hazards[8], and so on. These are all issues of global im-portance; consequently there have been significant ad-vances in theoretical and laboratory research on MGH and numerous field studies of MGH in the natural envi-ronment[9―17]. In recent years the observational data set on the in situ conditions associated with gas hydrate oc-currences has expanded rapidly[12,18]. Many results of such field-based programs have been a clearer under-standing of in situ porosities[12], advective flux rates[11,19], natural gas hydrate concentration[9,10,20,21], dynamic process and effects of temperature change on the hydrate stability[22,23], and hydrate distribution patterns[11,24]. Based on steady state models, some fundamental ques-tions about gas hydrate formation and stability in marine sediments have also been investigated by Xu and Rup-pel[25] and Davie and Buffett[26]. It makes that our under-standing of hydrate systems is clearer. However, the quantitative estimates given by Xu and Ruppel[25] do not include the effect of salinity on the hydrate system. Ac-tually, it is an important factor for predicting the occur-rence, distribution, and evolution of methane gas hydrate to consider the effect of salinity on the hydrate system in the seafloor. Therefore, the present study extends the steady state model suggested by Xu and Ruppel[25] to include the salinity and presents some numerical results showing the effects of salinity on the hydrate system.
Addition of simple salts to water previously has been shown to decrease the stability of gas hydrate such that for certain pressure ranges the dissociation temperature is depressed by a constant amount relative to the pure water system[27,28]. For the pressure range of 2.75―10.0 MPa, at any given pressure, the dissociation temperature of methane hydrate is depressed by approximately –1.1℃ relative to the pure methane-pure water sys-tem[29]. The phase equilibria of hydrate under conditions that are relevant to marine environments have been also studied for three-phase equilibrium between hydrate, free gas, and seawater[29―31]. The conditions for two- phase equilibrium between hydrate and salt water were also investigated by Zatsepina and Buffet[21]. Such con- ditions are important for determining the deepest depth of actual occurrence of gas hydrate in marine sediments, which often coincides with a mark of the bottom simu- lating reflector (BSR)[9,32] but occurs subtantially deeper than the bases of the MHZ and the MHSZ in some set- tings[25]. Consequently, the conditions for three-phase
equilibrium between hydrate, free gas, and salt water are most important for establishing the stability of methane gas hydrate in marine sediments.
The equilibrium methane concentration or solubility is also important because it determines the minimum methane concentration needed for hydrate stability. The gas in solution is limited by the solubility that defines the minimum methane concentration needed to form hydrate or represents the maximum concentration of gas that can be dissolved in salt water under equilibrium conditions, so that any additional gas is present in the hydrate phase. Within the stability region of methane gas hydrate methane solubility increases with both tempera-ture and pressure increasing, and decreases as the salin-ity increases[20,33,34]. Below the MHSZ, methane solubil-ity increases with decreasing temperature[20,34]. Recently, Davie et al.[21] suggested a practical method of calculat-ing the solubility profile within the MHSZ in marine sediments for a given water depth, seafloor temperature and geothermal gradient. But this method is based on phase equilibrium calculations of Zatsepina and Buf-fett[35] and an extension of simple parametric models into the MHSZ[21]. The extension may produce big er-rors at the intersection points (the boundaries of the MHSZ and the MHZ). Our present calculations of solu-bility at any depths are based on the extension of ana-lytic model suggested by Xu and Ruppel[25], which in-cludes the effects of multi-factors on the solubility. In other words, the solubility in our present model is treated as a function of pressure, temperature, and salin-ity of the liquid solution.
The main purpose of this paper is to investigate the role of salts in the methane gas hydrate system. For this we incorporate the salinity into a steady state model for the formation of hydrate below the seafloor, and then determine distributions of MHSZ and MHZ and inves-tigate the influence of salinity on the MHSZ and the MHZ by using the quasi analytical model. Estimates of the bases of MHSZ and MHZ and the top of free gas in the pure-methane pure-water and pure-methane saltwa-ter cases are numerically compared. Our calculation shows that the effect of salinity on the hydrate system is very significant.
1 Basic theory 1.1 Theoretical time-dependent model
We adapt the model of Xu and Ruppel3
[25]to incorporate
YANG DingHui et al. Sci China Ser D-Earth Sci | Nov. 2007 | vol. 50 | no. 11 | 1733-1745 1735
the influences of salinity on the MGH formation and stability. For this we consider such a MGH system con-taining four components, which are methane, salt, water (subscript w), and solid porous sediment of porosity φ and permeability k, and five phases: liquid solution, free gas, solid gas hydrate, solid salt, and solid sediment (subscript s, density = ρs). Assuming that salt is com-pletely solved in liquid solution, for the case of our con-sideration the governing equations can be derived from the thermodynamic model developed by Xu[22], which are based on the mass conservations (including methane mass conservation, salt mass conservation, and total mass conservation) and heat conservation, and be simply written by[22]
( ) [ ( )] ,l l g g h h l c l l cC q C q C q C S D C Q
tφρ φ ρ∂
+ ∇ ⋅ + + − ∇ =∂
v v v
(1)
( ) [ ( )] 0l l h h l x l lX q X q C S D X
tφρ φ ρ∂
+ ∇ ⋅ + − ∇ =∂
v v , (2)
( ) { [l g h l w lq q q S Dt
φρ φ ρ∂+ ∇ ⋅ + + + ∇ +
∂v v v
( ) ( ) ( ) ( )]} ,c w l l x w l l cD D C D D X Qρ ρ− ∇ + − ∇ = (3)
[ (1 ) ] (s s l l g gH H q H q Ht
φρ φ ρ∂+ − + ∇ ⋅ + +
∂v v
) 0h h x x s sq H q H q H Tλ+ + − ∇ =v v v , (4)
where eqs. (1)―(3) describe the conservations of mass for methane gas, salt mass, and total mass for the gas hydrate system, respectively, and eq. (4) represents the conservation of heat energy. Dc, Dx and Dw in eqs. (1)―(3) are the diffusivities of methane, salt, and water in liquid solution, respectively. Qc represents the rate of in situ methane production, λ is effective thermal conduc-tivity, and Sl denotes the liquid saturation. ρ, C, X, and H denote the composite density, concentration, salinity, and enthalpy, respectively. The vector q with subscripts l, g, h, x, and s are the fluxes of liquid, free gas, hydrate, salt, and solid sediment, respectively. Variables C (concentra-tion), ρ (density), X (salinity), and H (enthalpy) with subscripts l (liquid), g (gas), h (hydrate), x (salt), and s (sediment) are the properties of individual phases (liquid solution, free gas, solid gas hydrate, salt, and solid sediment). For example, Hl, Hg, Hs, Hx, and Hh represent enthalpies of liquid, gas, solid sediment, salt, and hy-drate, respectively. Similarly, we can define other vari-ables with subscripts. These variables are either con-stants or functions of P, T, and salinity of the corre-
sponding phases in our present study. Using Xu’s notations[22] and assuming that Darcy’s
law describes the conservation of momentum for multi-phase fluid flow through oceanic sediments that are moving downward at a velocity us, the mass fluxes q of liquid (subscript l ), gas (subscript g), hydrate (subscript h) and solid sediment phases in eqs. (1)―(4) are given by
( )l ll l l l s
l
kkq P g S u
ρρ φ ρ
μ= − ∇ + +
r r r ,
( )g gg g g g s
g
kkq P g S u
ρρ φ ρ
μ= − ∇ + +
r r r ,
and
h h h sq S uφ ρ=r r , (1 )s s sq uφ ρ= −
r r , where the vector g is the gravitational acceleration, P denotes pressure, μl is fluid viscosity, and kl and kg are the relative permeabilities of the liquid and gas phases, respectively. The saturations of liquid, gas, salt (sub-script x), hydrate satisfy
1l g x hS S S S+ + + = ,
which are determined by the phase equilibrium calcula-tion[22].
1.2 An approximate steady state model
Time-dependent equations stated above show that the hydrate and bubble volumes evolve into steady states after approximately several million years. For the one- dimensional case steady state solutions can be obtained by integrating the time-dependent equations (1)―(4) from t = 0 for a sufficiently long time. But the treatment in computational efficiency is low. Substantial im-provements are possible if the problem is reformulated to solve directly for the steady state. One method is the approximate analytical method under some suitable as-sumptions, and the other is the discretization method such as finite-difference and finite-element methods in which we first discretize eqs. (1)―(4) and then solve the resulting finite-difference equations. We note that the goal of this paper is to gain fundamental physical in-sights into the effects of salinity on the natural gas hy-drate systems in natural environments through the ap-plication of a simple model. For this like Xu and Rup-pel’s work[25] we assume that the hydrate system is steady under certain boundary conditions and salts are completely dissolved into liquid. At the same time, we also assume that the amount of hydrate and salt in pore
1736 YANG DingHui et al. Sci China Ser D-Earth Sci | Nov. 2007 | vol. 50 | no. 11 | 1733-1745
space is sufficiently small that the liquid phase occupies almost the entire available porosity, and the advective and diffusive effects of solid hydrate are negligible. Following the treatment suggested by Xu and Ruppel[25], with these assumptions the governing equations for the one-dimensional system reduce approximately from eqs. (1)―(4) to
lf l
l
k dPq gdz
ρρ
μ⎛ ⎞= − + =⎜ ⎟⎝ ⎠
constant, (5)
0e f ldTq q C Tdz
λ= − = constant, (6)
lm f l c l l
dCq q C D S
dzφ ρ= − , (7)
where Cl0 is specific heat capacity of liquid water, Cl is concentration of methane, qf and qe stand for constant fluxes of total fluid mass and energy in all regions below the seafloor, respectively. Sl equals 1 based on our pre-vious assumptions, and qm represents depth-dependent methane flux, which is a subsection function. In other words, below the base of the MHZ, qm is a constant given by the corresponding boundary condition. In the region above the top of the MHZ, qm reduces to a con-stant and equals the flux qmT at the top of the MHZ. And qm is not a constant within the MHZ.
1.3 Hydrate stability and actual zone of hydrate occurrence
(i) Locations of MHSZ boundaries. The phase bounda-ries for methane gas hydrate have been determined ex-perimentally for pure water[2] and salt-water[29] systems. In theory, the intersection of the local geotherm with gas hydrate stability constraints defined the base of the gas hydrate zone. However, in dynamic systems, the posi-tions of the MHSZ boundaries depend on the flux of various system components and must be written as func-tions of the mass and energy transport[25]. In other words, we first determine the actual geotherm via the approxi-mate model in section 1.2 and then solve the intersection of the geotherm with hydrate stability constraints to get the position of the MHSZ. For the steady state system, integrating to eqs. (5) and (6), we can obtain the follow-ing expressions[25]:
0 0
0 0
0
ln , 0
( ), 0
e f lf
f l e f l
fe
q q C Tz q
q C q q C T
z T T qq
λ
λ
⎧ ⎛ ⎞−= − ≠⎪ ⎜ ⎟⎜ ⎟−⎪ ⎝ ⎠⎨
⎪ = − − =⎪⎩
(8)
and these relations between pressure and temperature
0 00
0 0
0 0
ln ,
0
( ), 0
f l e f ll
l f l e f l
f
lf
e
q q q C TP P g
k q C q q C T
q
gP P T T q
q
μ λρρ
ρ λ
⎧ ⎛ ⎞−⎛ ⎞= + +⎪ ⎜ ⎟⎜ ⎟ ⎜ ⎟−⎪ ⎝ ⎠ ⎝ ⎠
⎪ ≠⎨⎪⎪ = + − =⎪⎩
(9)
where P0 and T0 are seafloor pressure and temperature, respectively.
When eq. (9) is coupled with methane hydrate stabil-ity curves that are treated as a function of pressure and salinity and is regressed from the data obtained using the CSMHYD software[2] (Appendix), the pressure PT (and PB) and temperature TT (and TB) at both the top and base of the MHSZ can be determined. We can determine the locations of the MHSZ by substituting the values of TT and TB into (8), respectively. (ii) Top and bottom of MHZ. The locations of MHZ boundaries can be determined by solving the intersec-tions of the solubility curve with concentration curve for the steady state system. Within the MHZ solubility or the dissolved methane mass fraction can be written as a function of pressure and temperature[35]. Above the top of the MHZ, integrating (7) with the seafloor boundary condition Cl (z = 0) = C0 from the top of MHZ to the seafloor, we can determine the top depth of the MHZ as follows:
0
0
ln , 0( )
[ ( ) ], 0
mT fc lT f
f mT f sl T
c lT sl T f
mT
q q CDz q
q q q C z
Dz C z C q
q
φ ρ
φ ρ
⎧ ⎛ ⎞−= − ≠⎪ ⎜ ⎟⎜ ⎟−⎪ ⎝ ⎠⎨
⎪ = − − =⎪⎩
(10)
where C0 is the concentration of methane at the seafloor boundary, Csl (zT) is the solubility of methane at the top boundary (zT) of the MHZ. From the computational ex-pression stated above we can see that eq. (10) is the same as Xu and Ruppel’s results[25] for the pure-water case except that the solubility (Csl (zT)) in eq. (10) is calculated as a function of pressure, temperature, and salinity of liquid solution. The above intersection point (top of the MHZ) (zT) of the solubility and methane concentration curves yields[25]
( ) ( ),l T sl TC z C z= ( ) ( )l T sl TdC z dC z
dz dz= , (11)
so from (7) we have
( )
( ) sl TmT f sl T c l l
dC zq q C z D S
dzφ ρ= − . (12)
YANG DingHui et al. Sci China Ser D-Earth Sci | Nov. 2007 | vol. 50 | no. 11 | 1733-1745 1737
Knowing methane solubility Csl and its derivative at z = zT, the position of the top of the MHZ can be calcu-lated from (10) for the steady state system. In practical calculations, we can calculate iteratively to determine zT by using eqs. (10) and (12).
The base of the MHZ (zB) may often be shallower than the base of the MHSZ (MHSZB) due to the de-pendence of the MHZ base on the rate of methane sup-ply[25]. At the location of the base of the MHZ (MHZB), the following relations are satisfied by
( ) ( ),l B sl BC z C z= ( ) ( )l B sl BdC z dC z
dz dz= ,
m mBq q= , (13) so we have
( )
( ) sl Bm mB f sl B c l l
dC zq q q C z D S
dzφ ρ= = − . (14)
Knowing the methane flux qm at the boundary, the location of the MHZB can be determined iteratively us-ing (14). Using (12) and (14) together yields the thick-ness of the MHZ, which depends obviously on a combi-nation of the rates of fluid flux qf, energy flux qe, meth-ane flux qm, salinity, and the water depth at the seafloor. For a given rate of fluid flux, increasing methane flux qm results in a thicker MHZ up to the critical point, which occurs when the MHZB coincides with the MHSZB for a pure-methane and pure-water system[25]. For the pure- methane and saltwater system we shall further show the results for the critical flux in subsection 2.4.
2 Numerical results
The basic theory stated above can be used to derive the relations between the MHSZ, the MHZ and these pa-rameters such as the rates of fluid flux qf, energy flux qe, methane flux qm, the salinity, the water depth at the sea-floor, and so on. In this section, numerical results are used further to demonstrate the influence of different parameters such as salinity, water depth, energy flux, and methane flux on the MGH system with saltwater. Following Xu and Ruppel[25], we here use observational data to constrain the physical parameters given in sec-tion 1. Table 1 lists the physical properties of the hydrate system used in our present calculations. These parame-ters coincide basically with those of the standard MGH system. Some values in Table 1 have been chosen to crudely represent those that might be applied to marine systems like the Blake Ridge[25].
Table 1 Physical parameters used in calculations Symbol Parameter Value Units
g gravitational acceleration 9.81 m s−2 T0 temperature at seafloor 3 ℃ us sedimentation rate 0 m s−1 φ porosity 0.5
Dm methane diffusivity in seawater 1.3×10⁻⁹ kg m−1 s−1
C0 methane concentration at seafloor 1×10⁻⁸ kg kg-1
qf total mass flux 1×10⁻⁸ kg m−2 s−1
qe total energy flux 30―60 mW m−2 qh total hydrate flux 0 kg m−2 s−1
Qc rate of methane gas production 0 kg m−3 s−1
k permeability 1×10⁻¹⁴ m2
λ bulk thermal conductivity 1.0 W m−1 K−1
ρl density of liquid-phase fluid 1024 kg m−3 Cl0 specific heat capacity of fluids 4.18 kJ kg−1 K−1
μl viscosity 8.87×10⁻⁴ kg m−1 s−1
X salinity 0.035 kg kg−1
2.1 Effects of salinity on the MHSZ
On the basis of the approximate steady state model given in section 1, the previous calculations[25] included only effects of various parameters such as the rates of energy flux qe, methane flux qm, and the water depth at the seafloor on the MHSZ and do not account for the influence of salinity on the MHSZ. We investigate ef-fects of salinity on the MGH system. By including salin-ity, the methane hydrate stability is a function of pres-sure and salinity, which is obtained by the regressed method from these data obtained[2] (see Appendix).
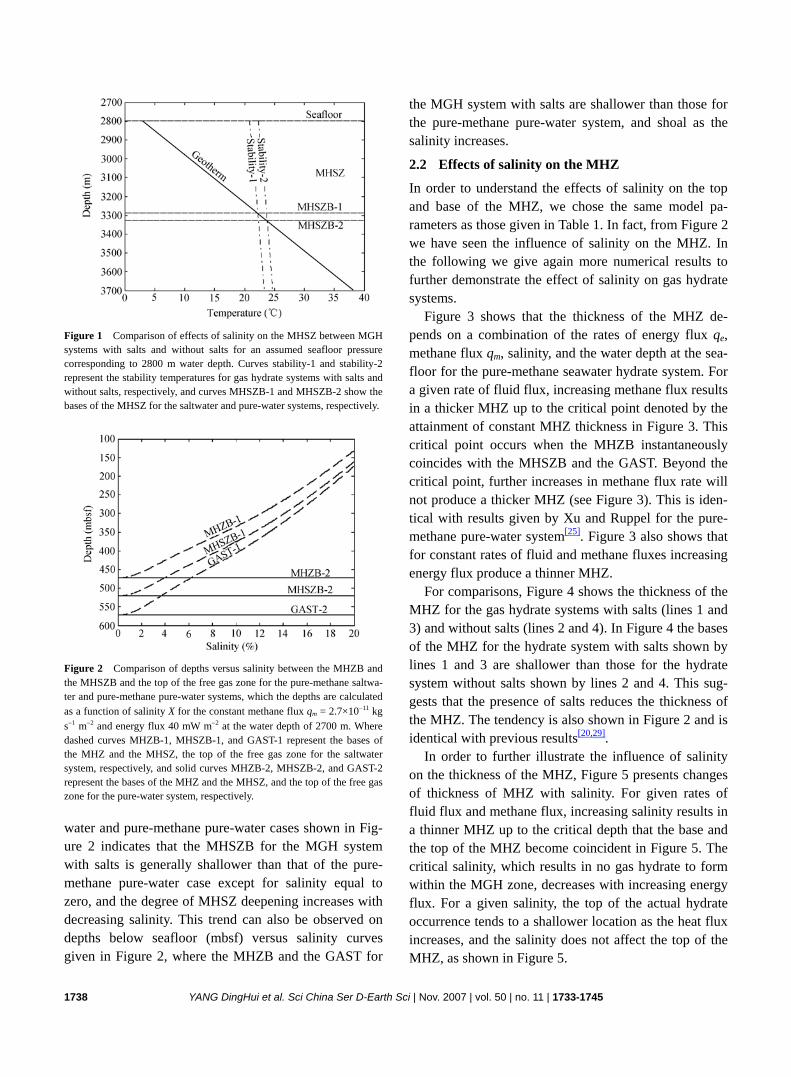
Effects of salinity are shown in Figure 1 using the constant salinity S = 0.035 kg/kg that is comparable to that of seawater. For comparison, the top and base of the MHSZ for the pure-water pure-methane case are also shown in Figure 1. Figure 1 shows that the MHSZB (MHSZB-1) for the pure-methane seawater case (Sta-biliy-1) is shallower than that base (MHSZB-2) for the pure-methane pure-water case (Stabillity-2), which is identical with previous results[20,30,36,37]. In other words, water in marine gas hydrate systems contains dissolved salts, which reduces the stability of gas hydrate. The shallower MHSZB results in the shallower MHZB in gas hydrate systems with salts (MHZB-1) compared with that in pure-methane pure-water systems (MHZB-2) (see Figure 2).
Figure 2 shows effects of salinity on the bases of MHSZ and MHZ, and the top of the free gas zone (GAST). Comparison between the pure-methane sea-
1738 YANG DingHui et al. Sci China Ser D-Earth Sci | Nov. 2007 | vol. 50 | no. 11 | 1733-1745
Figure 1 Comparison of effects of salinity on the MHSZ between MGH systems with salts and without salts for an assumed seafloor pressure corresponding to 2800 m water depth. Curves stability-1 and stability-2 represent the stability temperatures for gas hydrate systems with salts and without salts, respectively, and curves MHSZB-1 and MHSZB-2 show the bases of the MHSZ for the saltwater and pure-water systems, respectively.
Figure 2 Comparison of depths versus salinity between the MHZB and the MHSZB and the top of the free gas zone for the pure-methane saltwa-ter and pure-methane pure-water systems, which the depths are calculated as a function of salinity X for the constant methane flux qm = 2.7×10⁻¹¹ kg s−1 m−2 and energy flux 40 mW m−2 at the water depth of 2700 m. Where dashed curves MHZB-1, MHSZB-1, and GAST-1 represent the bases of the MHZ and the MHSZ, the top of the free gas zone for the saltwater system, respectively, and solid curves MHZB-2, MHSZB-2, and GAST-2 represent the bases of the MHZ and the MHSZ, and the top of the free gas zone for the pure-water system, respectively.
water and pure-methane pure-water cases shown in Fig-ure 2 indicates that the MHSZB for the MGH system with salts is generally shallower than that of the pure- methane pure-water case except for salinity equal to zero, and the degree of MHSZ deepening increases with decreasing salinity. This trend can also be observed on depths below seafloor (mbsf) versus salinity curves given in Figure 2, where the MHZB and the GAST for
the MGH system with salts are shallower than those for the pure-methane pure-water system, and shoal as the salinity increases.
2.2 Effects of salinity on the MHZ
In order to understand the effects of salinity on the top and base of the MHZ, we chose the same model pa-rameters as those given in Table 1. In fact, from Figure 2 we have seen the influence of salinity on the MHZ. In the following we give again more numerical results to further demonstrate the effect of salinity on gas hydrate systems.
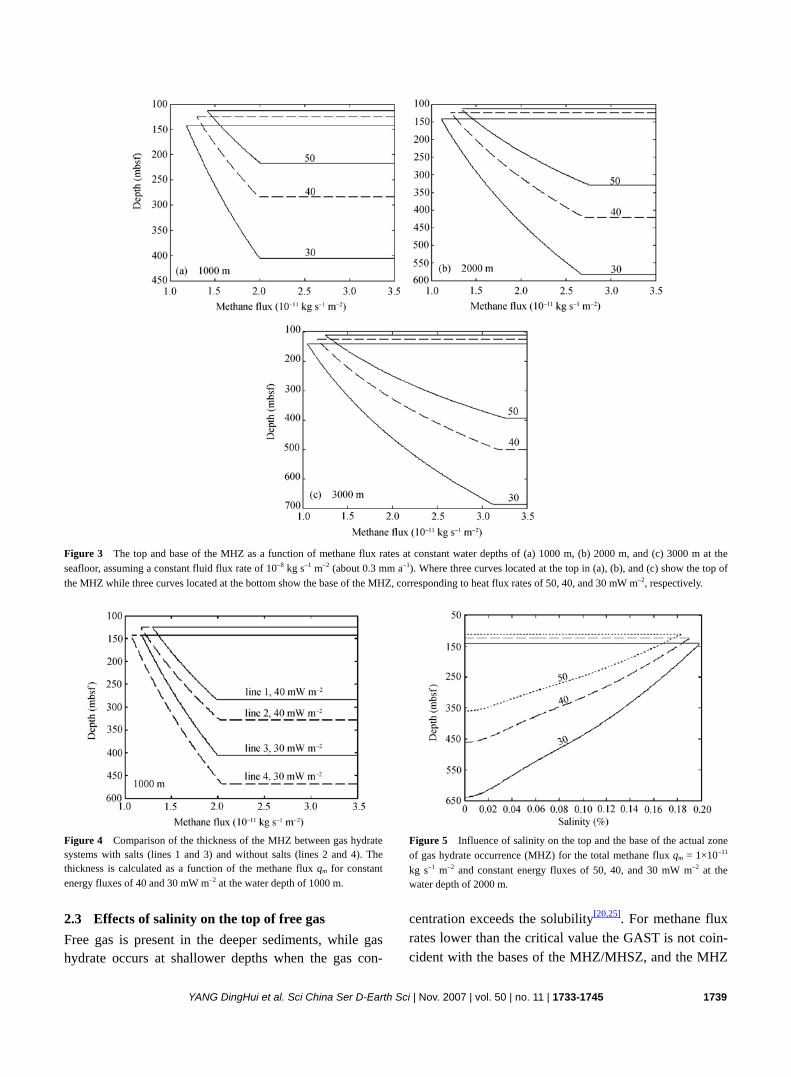
Figure 3 shows that the thickness of the MHZ de-pends on a combination of the rates of energy flux qe, methane flux qm, salinity, and the water depth at the sea-floor for the pure-methane seawater hydrate system. For a given rate of fluid flux, increasing methane flux results in a thicker MHZ up to the critical point denoted by the attainment of constant MHZ thickness in Figure 3. This critical point occurs when the MHZB instantaneously coincides with the MHSZB and the GAST. Beyond the critical point, further increases in methane flux rate will not produce a thicker MHZ (see Figure 3). This is iden-tical with results given by Xu and Ruppel for the pure- methane pure-water system[25]. Figure 3 also shows that for constant rates of fluid and methane fluxes increasing energy flux produce a thinner MHZ.
For comparisons, Figure 4 shows the thickness of the MHZ for the gas hydrate systems with salts (lines 1 and 3) and without salts (lines 2 and 4). In Figure 4 the bases of the MHZ for the hydrate system with salts shown by lines 1 and 3 are shallower than those for the hydrate system without salts shown by lines 2 and 4. This sug-gests that the presence of salts reduces the thickness of the MHZ. The tendency is also shown in Figure 2 and is identical with previous results[20,29].
In order to further illustrate the influence of salinity on the thickness of the MHZ, Figure 5 presents changes of thickness of MHZ with salinity. For given rates of fluid flux and methane flux, increasing salinity results in a thinner MHZ up to the critical depth that the base and the top of the MHZ become coincident in Figure 5. The critical salinity, which results in no gas hydrate to form within the MGH zone, decreases with increasing energy flux. For a given salinity, the top of the actual hydrate occurrence tends to a shallower location as the heat flux increases, and the salinity does not affect the top of the MHZ, as shown in Figure 5.
YANG DingHui et al. Sci China Ser D-Earth Sci | Nov. 2007 | vol. 50 | no. 11 | 1733-1745 1739
Figure 3 The top and base of the MHZ as a function of methane flux rates at constant water depths of (a) 1000 m, (b) 2000 m, and (c) 3000 m at the seafloor, assuming a constant fluid flux rate of 10−8 kg s−1 m−2 (about 0.3 mm a−1). Where three curves located at the top in (a), (b), and (c) show the top of the MHZ while three curves located at the bottom show the base of the MHZ, corresponding to heat flux rates of 50, 40, and 30 mW m−2, respectively.
Figure 4 Comparison of the thickness of the MHZ between gas hydrate systems with salts (lines 1 and 3) and without salts (lines 2 and 4). The thickness is calculated as a function of the methane flux qm for constant energy fluxes of 40 and 30 mW m−2 at the water depth of 1000 m.
Figure 5 Influence of salinity on the top and the base of the actual zone of gas hydrate occurrence (MHZ) for the total methane flux qm = 1×10⁻¹¹ kg s−1 m−2 and constant energy fluxes of 50, 40, and 30 mW m−2 at the water depth of 2000 m.
2.3 Effects of salinity on the top of free gas Free gas is present in the deeper sediments, while gas hydrate occurs at shallower depths when the gas con-
centration exceeds the solubility[20,25]. For methane flux rates lower than the critical value the GAST is not coin-cident with the bases of the MHZ/MHSZ, and the MHZ
1740 YANG DingHui et al. Sci China Ser D-Earth Sci | Nov. 2007 | vol. 50 | no. 11 | 1733-1745
is separated from the free gas zone by a layer of sedi-ment containing neither gas hydrate nor free gas[25]. Figure 2 has shown the relationships between the GAST and the bases of the MHZ/MHSZ. From Figure 2 we can see that the free gas zone exists deeper than both the MHZ and the MHSZ, and the GAST shoals gradually with the salinity increasing. We can also observe that the GAST for the pure-methane saltwater case is shallower than that of the pure-methane pure-water case except for the limit case of salinity equal to zero. In the following example presented in this subsection, we would like to use the same calculation method stated previously to investigate the effects of salinity on the GAST for dif-ferent energy fluxes.
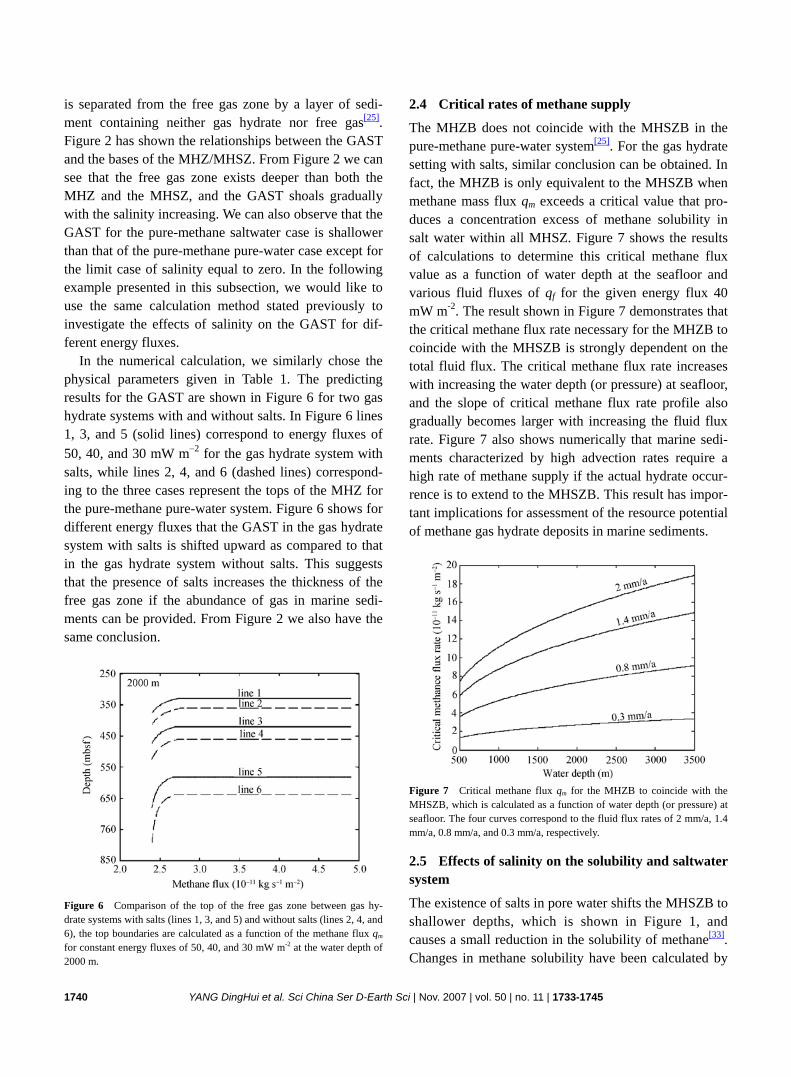
In the numerical calculation, we similarly chose the physical parameters given in Table 1. The predicting results for the GAST are shown in Figure 6 for two gas hydrate systems with and without salts. In Figure 6 lines 1, 3, and 5 (solid lines) correspond to energy fluxes of 50, 40, and 30 mW m−2 for the gas hydrate system with salts, while lines 2, 4, and 6 (dashed lines) correspond-ing to the three cases represent the tops of the MHZ for the pure-methane pure-water system. Figure 6 shows for different energy fluxes that the GAST in the gas hydrate system with salts is shifted upward as compared to that in the gas hydrate system without salts. This suggests that the presence of salts increases the thickness of the free gas zone if the abundance of gas in marine sedi-ments can be provided. From Figure 2 we also have the same conclusion.
Figure 6 Comparison of the top of the free gas zone between gas hy-drate systems with salts (lines 1, 3, and 5) and without salts (lines 2, 4, and 6), the top boundaries are calculated as a function of the methane flux qm for constant energy fluxes of 50, 40, and 30 mW m-2 at the water depth of 2000 m.
2.4 Critical rates of methane supply
The MHZB does not coincide with the MHSZB in the pure-methane pure-water system[25]. For the gas hydrate setting with salts, similar conclusion can be obtained. In fact, the MHZB is only equivalent to the MHSZB when methane mass flux qm exceeds a critical value that pro-duces a concentration excess of methane solubility in salt water within all MHSZ. Figure 7 shows the results of calculations to determine this critical methane flux value as a function of water depth at the seafloor and various fluid fluxes of qf for the given energy flux 40 mW m-2. The result shown in Figure 7 demonstrates that the critical methane flux rate necessary for the MHZB to coincide with the MHSZB is strongly dependent on the total fluid flux. The critical methane flux rate increases with increasing the water depth (or pressure) at seafloor, and the slope of critical methane flux rate profile also gradually becomes larger with increasing the fluid flux rate. Figure 7 also shows numerically that marine sedi-ments characterized by high advection rates require a high rate of methane supply if the actual hydrate occur-rence is to extend to the MHSZB. This result has impor-tant implications for assessment of the resource potential of methane gas hydrate deposits in marine sediments.
Figure 7 Critical methane flux qm for the MHZB to coincide with the MHSZB, which is calculated as a function of water depth (or pressure) at seafloor. The four curves correspond to the fluid flux rates of 2 mm/a, 1.4 mm/a, 0.8 mm/a, and 0.3 mm/a, respectively.
2.5 Effects of salinity on the solubility and saltwater system
The existence of salts in pore water shifts the MHSZB to shallower depths, which is shown in Figure 1, and causes a small reduction in the solubility of methane[33]. Changes in methane solubility have been calculated by
YANG DingHui et al. Sci China Ser D-Earth Sci | Nov. 2007 | vol. 50 | no. 11 | 1733-1745 1741
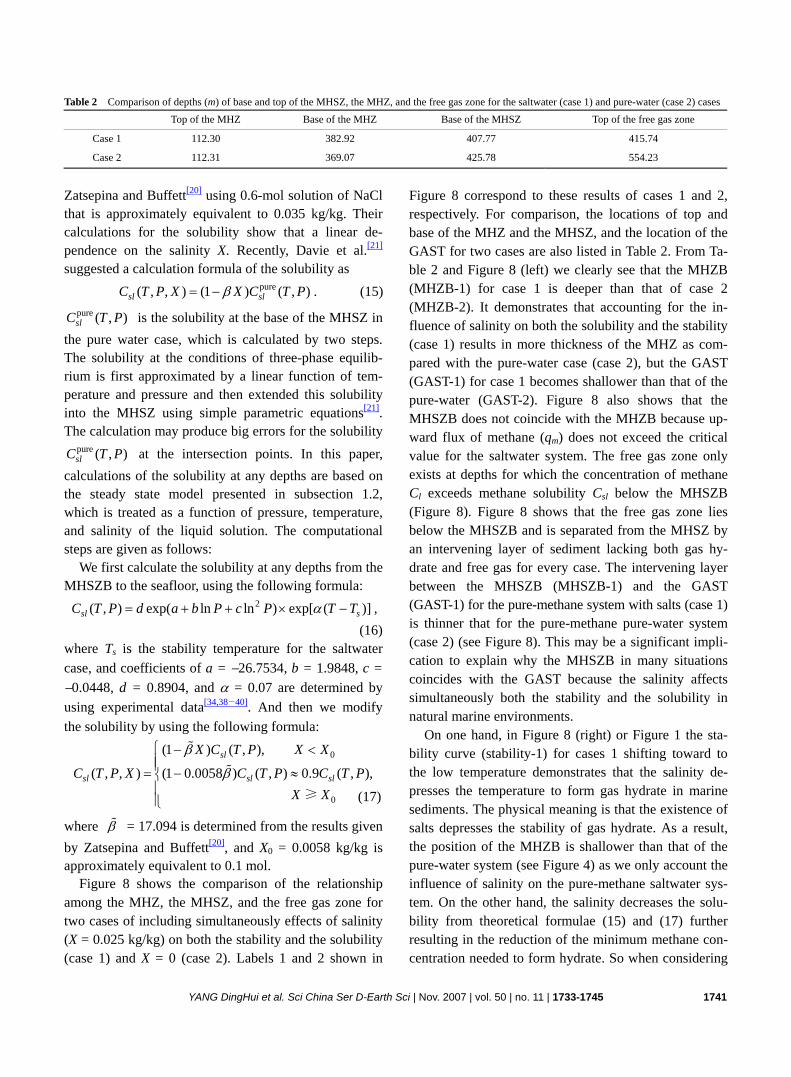
Table 2 Comparison of depths (m) of base and top of the MHSZ, the MHZ, and the free gas zone for the saltwater (case 1) and pure-water (case 2) cases Top of the MHZ Base of the MHZ Base of the MHSZ Top of the free gas zone
Case 1 112.30 382.92 407.77 415.74
Case 2 112.31 369.07 425.78 554.23
Zatsepina and Buffett[20] using 0.6-mol solution of NaCl that is approximately equivalent to 0.035 kg/kg. Their calculations for the solubility show that a linear de-pendence on the salinity X. Recently, Davie et al.[21] suggested a calculation formula of the solubility as pure( , , ) (1 ) ( , )sl slC T P X X C T Pβ= − . (15)
pure ( , )slC T P is the solubility at the base of the MHSZ in the pure water case, which is calculated by two steps. The solubility at the conditions of three-phase equilib-rium is first approximated by a linear function of tem-perature and pressure and then extended this solubility into the MHSZ using simple parametric equations[21]. The calculation may produce big errors for the solubility
pure ( , )slC T P at the intersection points. In this paper, calculations of the solubility at any depths are based on the steady state model presented in subsection 1.2, which is treated as a function of pressure, temperature, and salinity of the liquid solution. The computational steps are given as follows:
We first calculate the solubility at any depths from the MHSZB to the seafloor, using the following formula:
2( , ) exp( ln ln ) exp[ ( )]sl sC T P d a b P c P T Tα= + + × − , (16)
where Ts is the stability temperature for the saltwater case, and coefficients of a = −26.7534, b = 1.9848, c = −0.0448, d = 0.8904, and α = 0.07 are determined by using experimental data[34,38―40]. And then we modify the solubility by using the following formula:
0
0
(1 ) ( , ),
( , , ) (1 0.0058 ) ( , ) 0.9 ( , ),
sl
sl sl sl
X C T P X X
C T P X C T P C T PX X
β
β
⎧ − <⎪⎪= − ≈⎨⎪⎪⎩
%
%
≥
where β% = 17.094 is determined from the results given by Zatsepina and Buffett[20], and X0 = 0.0058 kg/kg is approximately equivalent to 0.1 mol.
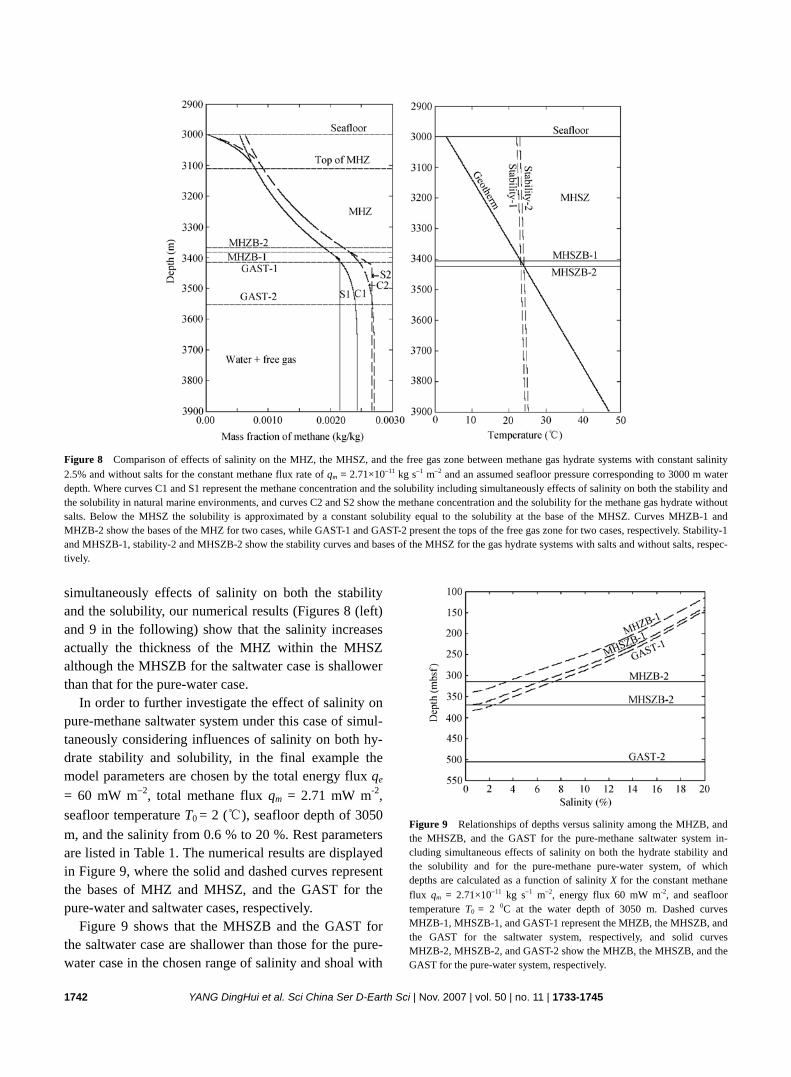
Figure 8 shows the comparison of the relationship among the MHZ, the MHSZ, and the free gas zone for two cases of including simultaneously effects of salinity (X = 0.025 kg/kg) on both the stability and the solubility (case 1) and X = 0 (case 2). Labels 1 and 2 shown in
Figure 8 correspond to these results of cases 1 and 2, respectively. For comparison, the locations of top and base of the MHZ and the MHSZ, and the location of the GAST for two cases are also listed in Table 2. From Ta-ble 2 and Figure 8 (left) we clearly see that the MHZB (MHZB-1) for case 1 is deeper than that of case 2 (MHZB-2). It demonstrates that accounting for the in-fluence of salinity on both the solubility and the stability (case 1) results in more thickness of the MHZ as com-pared with the pure-water case (case 2), but the GAST (GAST-1) for case 1 becomes shallower than that of the pure-water (GAST-2). Figure 8 also shows that the MHSZB does not coincide with the MHZB because up-ward flux of methane (qm) does not exceed the critical value for the saltwater system. The free gas zone only exists at depths for which the concentration of methane Cl exceeds methane solubility Csl below the MHSZB (Figure 8). Figure 8 shows that the free gas zone lies below the MHSZB and is separated from the MHSZ by an intervening layer of sediment lacking both gas hy-drate and free gas for every case. The intervening layer between the MHSZB (MHSZB-1) and the GAST (GAST-1) for the pure-methane system with salts (case 1) is thinner that for the pure-methane pure-water system (case 2) (see Figure 8). This may be a significant impli-cation to explain why the MHSZB in many situations coincides with the GAST because the salinity affects simultaneously both the stability and the solubility in natural marine environments.
On one hand, in Figure 8 (right) or Figure 1 the sta-bility curve (stability-1) for cases 1 shifting toward to the low temperature demonstrates that the salinity de-presses the temperature to form gas hydrate in marine sediments. The physical meaning is that the existence of salts depresses the stability of gas hydrate. As a result, the position of the MHZB is shallower than that of the pure-water system (see Figure 4) as we only account the influence of salinity on the pure-methane saltwater sys-tem. On the other hand, the salinity decreases the solu-bility from theoretical formulae (15) and (17) further resulting in the reduction of the minimum methane con- centration needed to form hydrate. So when considering
(17)
1742 YANG DingHui et al. Sci China Ser D-Earth Sci | Nov. 2007 | vol. 50 | no. 11 | 1733-1745
Figure 8 Comparison of effects of salinity on the MHZ, the MHSZ, and the free gas zone between methane gas hydrate systems with constant salinity 2.5% and without salts for the constant methane flux rate of qm = 2.71×10⁻¹¹ kg s−1 m−2 and an assumed seafloor pressure corresponding to 3000 m water depth. Where curves C1 and S1 represent the methane concentration and the solubility including simultaneously effects of salinity on both the stability and the solubility in natural marine environments, and curves C2 and S2 show the methane concentration and the solubility for the methane gas hydrate without salts. Below the MHSZ the solubility is approximated by a constant solubility equal to the solubility at the base of the MHSZ. Curves MHZB-1 and MHZB-2 show the bases of the MHZ for two cases, while GAST-1 and GAST-2 present the tops of the free gas zone for two cases, respectively. Stability-1 and MHSZB-1, stability-2 and MHSZB-2 show the stability curves and bases of the MHSZ for the gas hydrate systems with salts and without salts, respec-tively.
simultaneously effects of salinity on both the stability and the solubility, our numerical results (Figures 8 (left) and 9 in the following) show that the salinity increases actually the thickness of the MHZ within the MHSZ although the MHSZB for the saltwater case is shallower than that for the pure-water case.
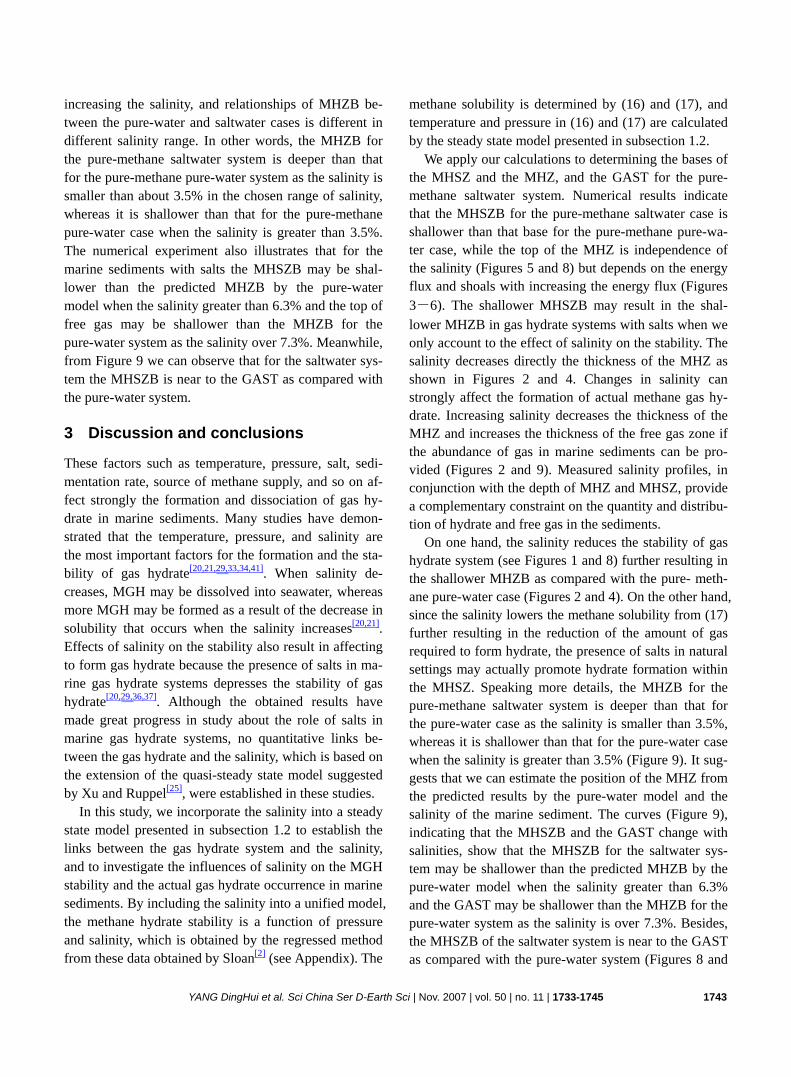
In order to further investigate the effect of salinity on pure-methane saltwater system under this case of simul-taneously considering influences of salinity on both hy-drate stability and solubility, in the final example the model parameters are chosen by the total energy flux qe = 60 mW m−2, total methane flux qm = 2.71 mW m-2, seafloor temperature T0 = 2 (℃), seafloor depth of 3050 m, and the salinity from 0.6 % to 20 %. Rest parameters are listed in Table 1. The numerical results are displayed in Figure 9, where the solid and dashed curves represent the bases of MHZ and MHSZ, and the GAST for the pure-water and saltwater cases, respectively.
Figure 9 shows that the MHSZB and the GAST for the saltwater case are shallower than those for the pure- water case in the chosen range of salinity and shoal with
Figure 9 Relationships of depths versus salinity among the MHZB, and the MHSZB, and the GAST for the pure-methane saltwater system in-cluding simultaneous effects of salinity on both the hydrate stability and the solubility and for the pure-methane pure-water system, of which depths are calculated as a function of salinity X for the constant methane flux qm = 2.71×10⁻¹¹ kg s−1 m−2, energy flux 60 mW m-2, and seafloor temperature T0 = 2 0C at the water depth of 3050 m. Dashed curves MHZB-1, MHSZB-1, and GAST-1 represent the MHZB, the MHSZB, and the GAST for the saltwater system, respectively, and solid curves MHZB-2, MHSZB-2, and GAST-2 show the MHZB, the MHSZB, and the GAST for the pure-water system, respectively.
YANG DingHui et al. Sci China Ser D-Earth Sci | Nov. 2007 | vol. 50 | no. 11 | 1733-1745 1743
increasing the salinity, and relationships of MHZB be- tween the pure-water and saltwater cases is different in different salinity range. In other words, the MHZB for the pure-methane saltwater system is deeper than that for the pure-methane pure-water system as the salinity is smaller than about 3.5% in the chosen range of salinity, whereas it is shallower than that for the pure-methane pure-water case when the salinity is greater than 3.5%. The numerical experiment also illustrates that for the marine sediments with salts the MHSZB may be shal-lower than the predicted MHZB by the pure-water model when the salinity greater than 6.3% and the top of free gas may be shallower than the MHZB for the pure-water system as the salinity over 7.3%. Meanwhile, from Figure 9 we can observe that for the saltwater sys-tem the MHSZB is near to the GAST as compared with the pure-water system.
3 Discussion and conclusions
These factors such as temperature, pressure, salt, sedi-mentation rate, source of methane supply, and so on af-fect strongly the formation and dissociation of gas hy-drate in marine sediments. Many studies have demon-strated that the temperature, pressure, and salinity are the most important factors for the formation and the sta-bility of gas hydrate[20,21,29,33,34,41]. When salinity de-creases, MGH may be dissolved into seawater, whereas more MGH may be formed as a result of the decrease in solubility that occurs when the salinity increases[20,21]. Effects of salinity on the stability also result in affecting to form gas hydrate because the presence of salts in ma-rine gas hydrate systems depresses the stability of gas hydrate[20,29,36,37]. Although the obtained results have made great progress in study about the role of salts in marine gas hydrate systems, no quantitative links be-tween the gas hydrate and the salinity, which is based on the extension of the quasi-steady state model suggested by Xu and Ruppel[25], were established in these studies.
In this study, we incorporate the salinity into a steady state model presented in subsection 1.2 to establish the links between the gas hydrate system and the salinity, and to investigate the influences of salinity on the MGH stability and the actual gas hydrate occurrence in marine sediments. By including the salinity into a unified model, the methane hydrate stability is a function of pressure and salinity, which is obtained by the regressed method from these data obtained by Sloan[2] (see Appendix). The
methane solubility is determined by (16) and (17), and temperature and pressure in (16) and (17) are calculated by the steady state model presented in subsection 1.2.
We apply our calculations to determining the bases of the MHSZ and the MHZ, and the GAST for the pure- methane saltwater system. Numerical results indicate that the MHSZB for the pure-methane saltwater case is shallower than that base for the pure-methane pure-wa- ter case, while the top of the MHZ is independence of the salinity (Figures 5 and 8) but depends on the energy flux and shoals with increasing the energy flux (Figures 3―6). The shallower MHSZB may result in the shal-lower MHZB in gas hydrate systems with salts when we only account to the effect of salinity on the stability. The salinity decreases directly the thickness of the MHZ as shown in Figures 2 and 4. Changes in salinity can strongly affect the formation of actual methane gas hy-drate. Increasing salinity decreases the thickness of the MHZ and increases the thickness of the free gas zone if the abundance of gas in marine sediments can be pro-vided (Figures 2 and 9). Measured salinity profiles, in conjunction with the depth of MHZ and MHSZ, provide a complementary constraint on the quantity and distribu-tion of hydrate and free gas in the sediments.
On one hand, the salinity reduces the stability of gas hydrate system (see Figures 1 and 8) further resulting in the shallower MHZB as compared with the pure- meth-ane pure-water case (Figures 2 and 4). On the other hand, since the salinity lowers the methane solubility from (17) further resulting in the reduction of the amount of gas required to form hydrate, the presence of salts in natural settings may actually promote hydrate formation within the MHSZ. Speaking more details, the MHZB for the pure-methane saltwater system is deeper than that for the pure-water case as the salinity is smaller than 3.5%, whereas it is shallower than that for the pure-water case when the salinity is greater than 3.5% (Figure 9). It sug-gests that we can estimate the position of the MHZ from the predicted results by the pure-water model and the salinity of the marine sediment. The curves (Figure 9), indicating that the MHSZB and the GAST change with salinities, show that the MHSZB for the saltwater sys-tem may be shallower than the predicted MHZB by the pure-water model when the salinity greater than 6.3% and the GAST may be shallower than the MHZB for the pure-water system as the salinity is over 7.3%. Besides, the MHSZB of the saltwater system is near to the GAST as compared with the pure-water system (Figures 8 and
1744 YANG DingHui et al. Sci China Ser D-Earth Sci | Nov. 2007 | vol. 50 | no. 11 | 1733-1745
9). This is why the GAST is near or equal to the bases of the MHSZ/MHZ in many practical marine sediments because there exists salt in real marine sediments and the salinity increases the MHZB and decreases the GAST.
Our numerical results also reveal an obvious explana-tion for the disparity in the depths to the MHZB, the MHSZB, and the GAST shown in Figures 8 and 9. When the methane solubility is a function of independ- ence of salinity treated approximately as Xu and Rup- pel[25], for certain methane flux rates a free gas zone could develop far below the MHSZB and be separated from the MHZB by a zone of marine sediments con- taining neither free gas nor gas hydrate. However, when incorporating the effect of salinity on the methane solu-bility into calculations of the solubility, we find that the thickness of the separated zone between the MHSZB and the GAST becomes thinner (see Figures 8 and 9).
Appendix: Stability function
When we consider the influence of salinity on the MGH system, the methane hydrate stability is treated as a function of pressure and salinity and is obtained by re-gressing from data obtained using the CSMHYD soft-ware[2] as follows: 2 3
stability ( ) ln ( ) ln ( ) lnT A X P B X P C X P= + + , (A1)
in which A(X) = 12.6223−60.66X+1078.90X2−11080.07X3
+61534.87X4−185885.18X5+231861.14X6, B(X) = −2.0780+32.43X−740.52X2+8506.69X3
−53994.43X4+175167.33X5-216507.56X6, C(X) = 0.3418−5.51X+154.32 X2−1985.04 X3
+13855.28 X4−46685.56 X5+58554.43 X6, where X denotes the salinity and P is pressure. If X = 0, then Tstability denotes the stability temperature (Tpw) for the pure water case.
1 Makogon Y F, Hydrates of hydrocarbons, Penn Well, Tulsa, Okla-
homa, USA, 1997, 1―21 2 Sloan E D Jr. Clathrate Hydrates of Natural Gases, 2nd ed, Revised
and Expandaed, Marcel Dekker, New York, 1990 3 Song H B. Geophysical Researches on Gas Hydrates (in Chinese).
Beijing: Ocean Press, 2003, 224―229 4 Kvenvolden K A. Potential effects of gas hydrate on human welfare.
In: Proceedings of National Academy of Science, USA, 1999, 96: 3420―3426[DOI]
5 Chen D F, Wang M C, Xia B. Formation condition and distribution prediction of gas hydrate in Qinghai-Tibet Plateau permafrost, Chin J Geophys (in Chinese), 2005, 48(1): 165―172
6 Nisbet E G, Piper D J W. Giant submarine landslides. Nature, 1998, 392: 329―330[DOI]
7 Bain S, Corfield R M, Norris R D. Mechanisms of climate warming at the end of the Paleocene. Science, 1999, 285: 724―727[DOI]
8 Song H B, Geng J H, Wang H K, et al. A preliminary study of gas hydrates in Dongsha region north of South China Sea. Chin J Geophys (in Chinese), 2001, 44(5): 687―695
9 Holbrook W S, Hoskins H, Wood W T, et al. Methane hydrate and free gas on the Blake Ridge from vertical seismic profiling. Science, 1996, 273: 1840―1843[DOI]
10 Dickens G R, Quinby-Hunt M S. Methane hydrate stability in pore water: A simple theoretical approach for geophysical applications. J Geophys Res, 1997, 102: 773―783[DOI]
11 Egeberg P K, Dickens G R. Thermodynamic and pore water halogen constraints on hydrate distribution at ODP Site 997 (Blake Ridge). Chem Geol, 1999, 153: 53―79[DOI]
12 Paull C K, Matsumoto R, Wallace P J, et al. Proceedings of the Ocean Drilling Program, Scientific Reports, College Station, Texas (Ocean
Drilling Program), 2000, 164: 1―459 13 Xu W, Lowell R P, Peltzer E T. Effect of seafloor temperature and
pressure variations on methane flux from a gas hydrate layer: Com-parison between current and Late Paleocene climate conditions. J Geophys Res, 2001, 106: 26413―26423[DOI]
14 Yu X G, Li J B, Gong J M, et al. Stable carbon and nitrogen isotopic composition of gas hydrate-bearing sediment from Hydrate Ridge, Cascadia Margin. Sci China Ser D-Earth Sci, 2006, 49(8): 872―880
15 Jiang G Q, Shi X Y, Zhang S H. Methane seeps, methane hydrate de-stabilization, and the late Neoproterozoic postglacial cap carbonates. Chin Sci Bull, 2006, 51(10): 1152―1173
16 Niu B H, Wen P F, Wen N, et al. Estimation of hydrate concentration based on AVO modeling of BSR. Chin J Geophys (in Chinese), 2006, 49(1): 143―152
17 Ruan A G, Li J B, Chu F Y, et al. AVO numerical simulation of gas hydrates reflectors beneath seafloor. Chin J Geophys (in Chinese), 2006, 49(6): 1826―1835
18 Trehu A M, Bohrmann G, Rack F R, et al. Proceedings of the Ocean Drilling Program, Initial Reports, College Station TX, 204, 2003
19 Ruppel C. Anomalously cold temperatures observed at the base of the gas hydrate stability zone on the US Atlantic passive margin. Geology, 1997, 25: 699―702[DOI]
20 Zatsepina O Y, Buffett B A. Thermodynamic conditions for the sta-bility of gas hydrate in the seafloor. J Geophys Res, 1998, 103: 24127―24139[DOI]
21 Davie M K, Zatsepina O Y, Buffett B A. Methane solubility in marine hydrate environments. Mar Geol, 2004, 203: 177―184[DOI]
22 Xu W. Modeling dynamic marine gas hydrate systems. Am Mineral, 2004, 89: 1271―1279
23 Chen D F, Cathles L M. On the thermal impact of gas venting and
YANG DingHui et al. Sci China Ser D-Earth Sci | Nov. 2007 | vol. 50 | no. 11 | 1733-1745 1745
hydrate crystallization. J Geophys Res, 2005, 110, B11204, doi: 10.1029/2004JB003533[DOI]
24 Collett T S. Well log evaluation of gas hydrate saturations. Trans SPWLA Annu Logging Symp, 39th, 1998, 1―14
25 Xu W, Ruppel C. Predicting the occurrence, distribution, and evolu-tion of methane gashydrate in porous marine sediments. J Geophys Res, 1999, 104: 5081―5095[DOI]
26 Davie M K, Buffett B A. A steady state model for marine hydrate formation: Constraints on methane supply from pore water sulfate profiles. J Geophys Res, 2003, 108(B10), 2495, doi:10.1029/2002 JB002300[DOI]
27 Menton P D, Parrish W R, Sloan E D. Effect of inhibitors on hydrate formation. Ind Eng Chem Proc Des Dev, 1981, 20: 399―401[DOI]
28 Dholabhai P D, Englezos P, Kalogerakis N, et al. Equilibrium condi-tions for methane hydrate formation in aqueous mixed electrolyte solutions. Can J Chem Eng, 1991, 69: 800―805
29 Dickens G R, Quinby-Hunt M S. Methane hydrate stability in sea-water. Geophys Res Lett, 1994, 21: 2115―2118[DOI]
30 Englezos P, Hall S. Phase equilibrium data on carbon dioxide hydrate in the presence of electrolytes, water soluble polymers and mont- morillonite. Can J Chem Eng, 1994, 72: 887―893
31 Dickens G R, Castillo M M, Wlakern J C. A blast of gas in the latest paleocene: simulating first order effects of massive dissociation of oceanic methane hydrate. Geology, 1997, 25(3): 259―262[DOI]
32 Hyndman R D, Spence G D. A seismic study of methane hydrate marine bottom simulating reflectors. J Geophys Res, 1992, 97: 6683―6698
33 Handa Y P. Effect of hydrostatic pressure and salinity on the stability of gas hydrates. J Phys Chem, 1990, 94: 2652―2657[DOI]
34 Servio P, Englezons P. Measurement of dissolved methane in water in equilibrium with its hydrate. J Chem Engineer Data, 2002, 47: 87―90[DOI]
35 Zatsepina O Y, Buffett B A. Phase equilibrium of gas hydrate: Im-plications for the formation of hydrate in the deep seafloor. Geophys Res Lett, 1997, 24: 1567―1570[DOI]
36 Englezos P, Bishnoi P R. Prediction of gas hydrate formation condi- tions in aqueous electrolyte solutions. AIChE J, 1988, 34: 1718―
1721[DOI] 37 Jager M D, Sloan E D. The effect of pressure on methane hydration in
pure water and sodium chloride solutions. Fluid Phase Equilibria, 2001, 185: 89―99[DOI]
38 Lekvam K, Bishnoi P R. Dissolution of methane in water at low temperature and intermediate pressure. Fluid Phase Equilibria, 1997, 131: 297―309[DOI]
39 Yang S O, Cho S H, Lee H, et al. Measurement and prediction of phase equilibria for water + methane in hydrate forming conditions. Fluid Phase Equilibria, 2001, 185: 53―63[DOI]
40 Sorensen H, Pedersen K S, Christensen P L. Modeling of gas solu-bility in brine. Organic Geochemistry, 2002, 33: 635―642[DOI]
41 Henry P, Thomas M, Clennell B M. Formation of natural gas hydrates in marine sediments 2: Thermodynamic calculations of stability con-ditions in porous sediments. J Geophys Res, 1999, 104: 23005―
23022[DOI]
Copyright © 2022 FDOKUMEN