
Guiding Light Counseling In Bolingbrook Illinois - Heartland ...
Upload
khangminh22Category
view
6download
0
Methane Guiding PrinciplesOutreach Programme
• Some attendees at this meeting may be competitors and should avoid even the appearance of impropriety. Every attendee has his or her own responsibility to ensure they do not discuss anything inappropriate under antitrust /competition law.
• Participants should not discuss anything that could affect market behavior in relation to products or services where they compete, such as:
• Pricing or pricing elements (including price differentials, margins, price changes, price mark-ups, discounts, allowances, rebates, commission rates, credit terms, price changes, etc.)
• Non-public plans or strategic intentions (including investments or divestments, expansion plans or market entry or exit, etc.).
• Which territories or end-customers we intend to sell products into/to.
• Market conditions for particular products.
• Intentions to enter into bids / tenders or discussions on the terms of a bid.
• Costs or elements thereof (including production or distribution costs, cost accounting formulae, methods of computing costs, individual company figures on sources of supply, inventories, sales etc.).
• Volume information related to production and sales.
• Intentions to deal or not to deal with certain suppliers or customers.
• If you feel uncomfortable at any point, please raise this to the course facilitator.
Antitrust law compliance reminder
2
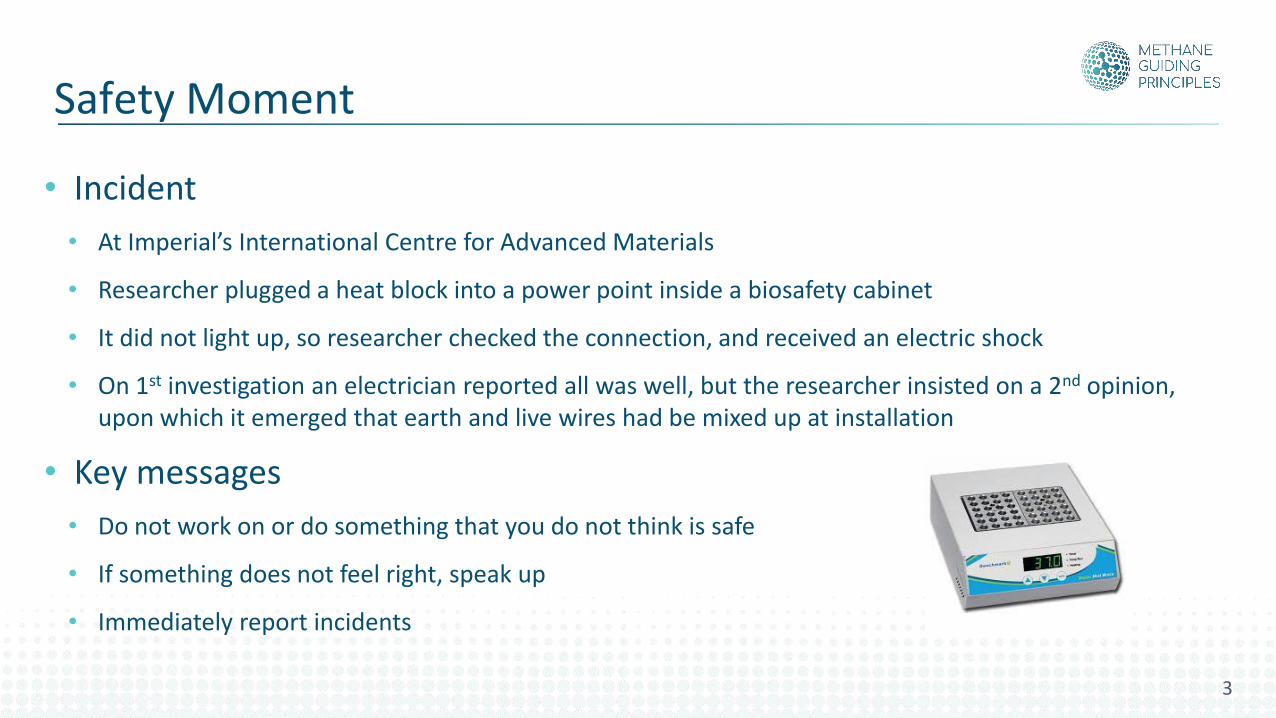
• Incident
• At Imperial’s International Centre for Advanced Materials
• Researcher plugged a heat block into a power point inside a biosafety cabinet
• It did not light up, so researcher checked the connection, and received an electric shock
• On 1st investigation an electrician reported all was well, but the researcher insisted on a 2nd opinion, upon which it emerged that earth and live wires had be mixed up at installation
• Key messages
• Do not work on or do something that you do not think is safe
• If something does not feel right, speak up
• Immediately report incidents
Safety Moment
3
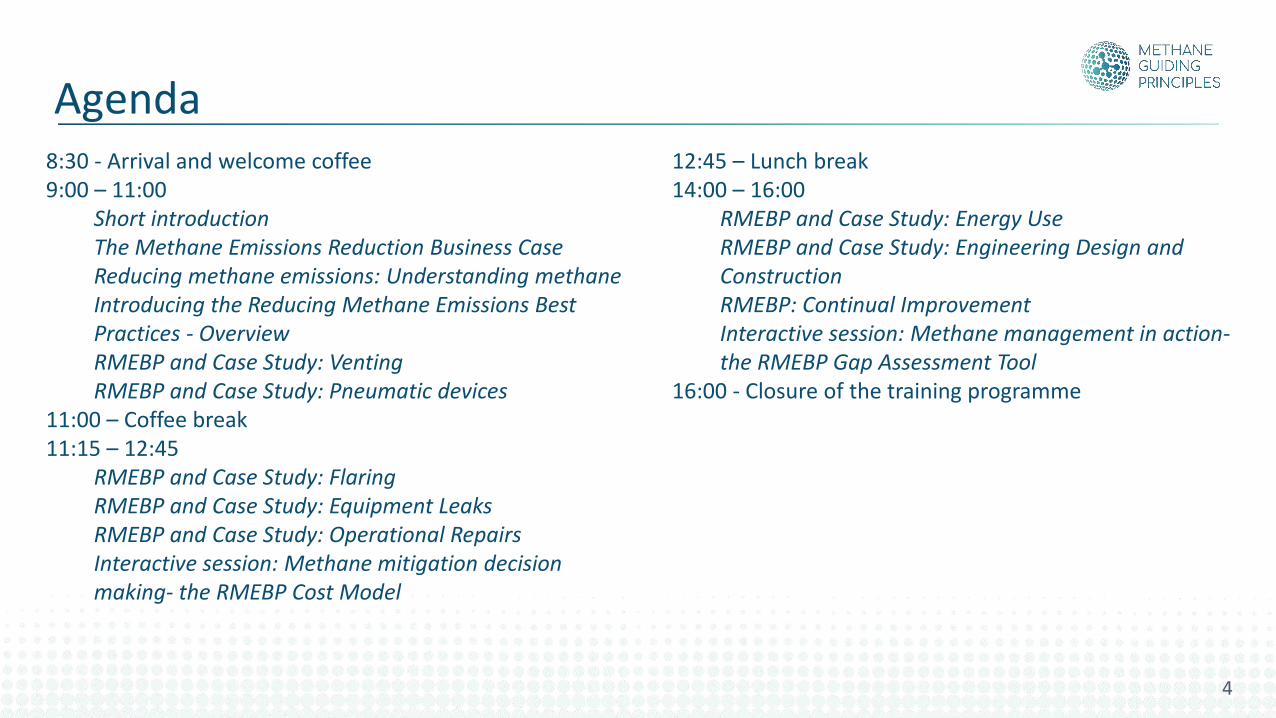
Agenda
4
8:30 - Arrival and welcome coffee 9:00 – 11:00
Short introduction The Methane Emissions Reduction Business Case Reducing methane emissions: Understanding methane Introducing the Reducing Methane Emissions Best Practices - Overview RMEBP and Case Study: Venting RMEBP and Case Study: Pneumatic devices
11:00 – Coffee break 11:15 – 12:45
RMEBP and Case Study: Flaring RMEBP and Case Study: Equipment Leaks RMEBP and Case Study: Operational Repairs Interactive session: Methane mitigation decision making- the RMEBP Cost Model
12:45 – Lunch break 14:00 – 16:00
RMEBP and Case Study: Energy Use RMEBP and Case Study: Engineering Design and Construction RMEBP: Continual Improvement Interactive session: Methane management in action-the RMEBP Gap Assessment Tool
16:00 - Closure of the training programme
An overview of the initiative
Methane Guiding Principles
• Providing access to energy, while addressing global climate change, is one of the greatest challenges of the 21st century.
• Methane is a potent greenhouse gas.
• A concerted, value-chain wide, industry response is needed.
Rationale for the Methane Guiding Principles
6
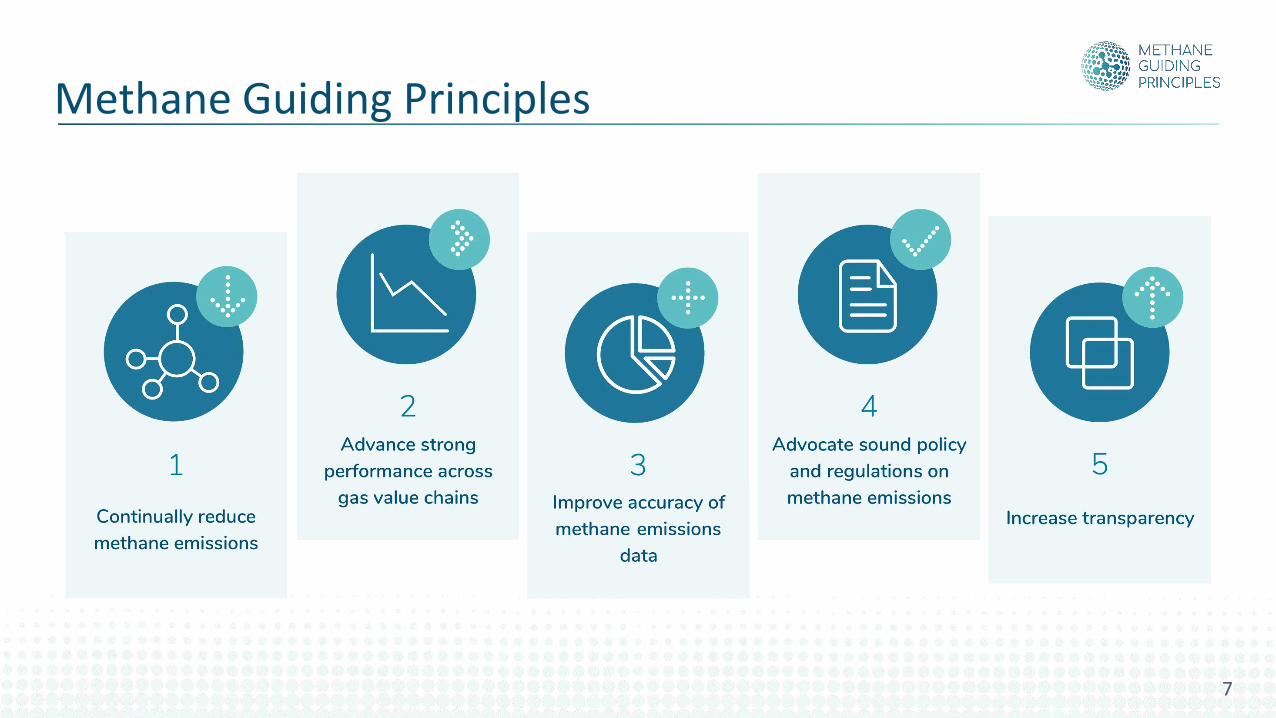
Methane Guiding Principles
7
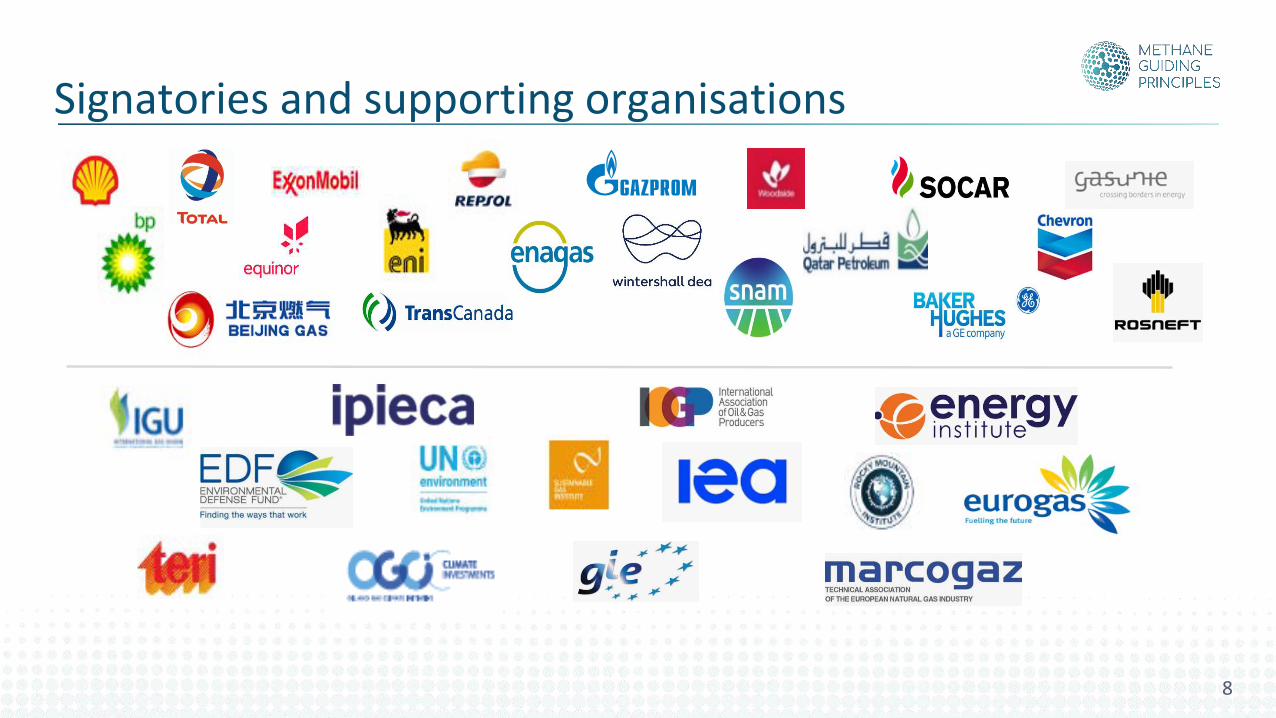
Signatories and supporting organisations
8
9
The Global Outreach Programme course content has been developed by researchers from the
Sustainable Gas Institute at Imperial College London, working independently through Imperial
Consultants - and funded by the Methane Guiding Principles partnership. The information included
is accurate to the best of the authors’ knowledge but does not necessarily reflect the views or
positions of all Signatories to or Supporting Organisations of the Methane Guiding Principles
partnership, and course participants will need to make their own evaluation of the information
provided. No warranty is given to course participants concerning the completeness or accuracy of
the information included in the course by Imperial Consultants, Sustainable Gas Institute, the
Methane Guiding Principles partnership or its Signatories or Supporting Organisations.
Global outreach programme disclaimer
Outreach Programme
Reducing Methane Emissions: The Business Case
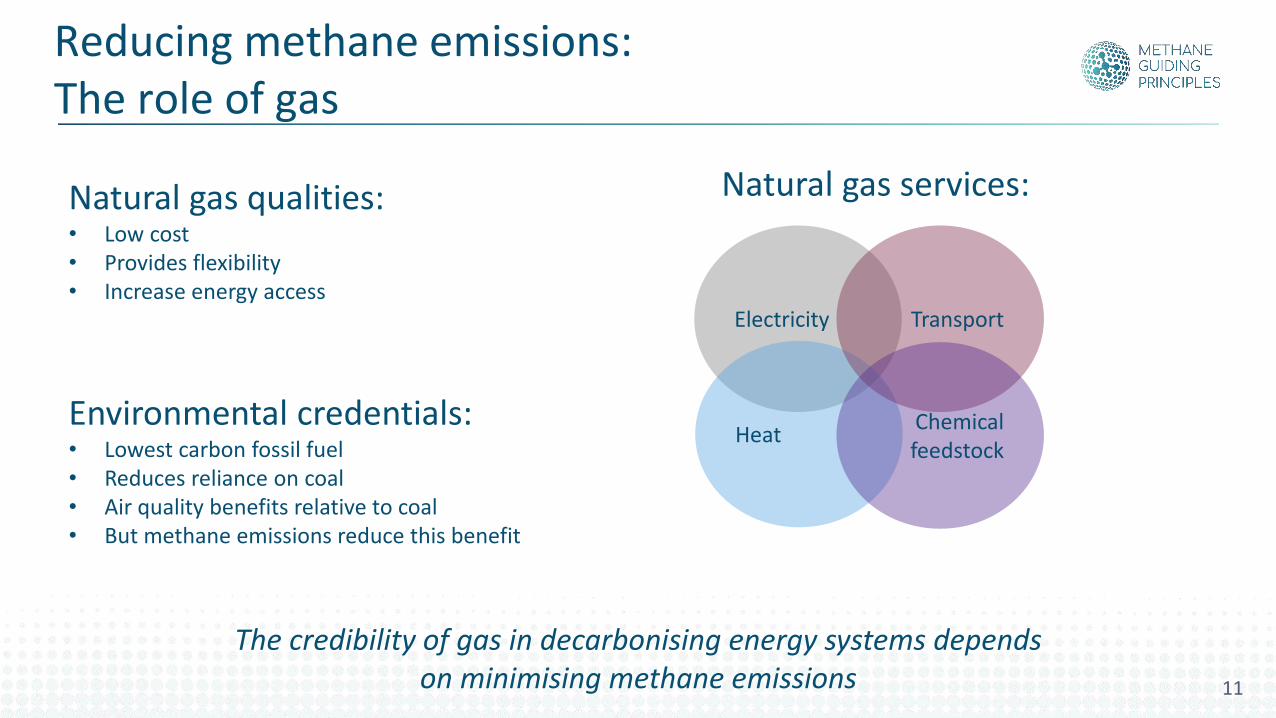
Natural gas services:
Reducing methane emissions:The role of gas
Natural gas qualities:• Low cost• Provides flexibility• Increase energy access
Environmental credentials:• Lowest carbon fossil fuel• Reduces reliance on coal• Air quality benefits relative to coal• But methane emissions reduce this benefit
The credibility of gas in decarbonising energy systems depends on minimising methane emissions
Electricity
Heat
Transport
Chemical feedstock
11
1. Climate change2. Safety3. Social licence4. Revenue
Reducing methane emissions: the business case
12
1. Climate change2. Safety3. Social licence4. Revenue
Reducing methane emissions: the business case
13
-20
0
20
40
60
80
100
120
1980 2000 2020 2040 2060 2080 2100
Net
CO
₂eq
em
issi
on
s (G
t C
O₂e
q./
yr)
Historical3.2 - 5.4 °C change2 - 3.7 °C change1.7 - 3.2 °C change0.9 - 2.3 °C change1.5 °C change
3.2 – 5.4°C
2 – 3.7°C
1.7 – 3.2°C
0.9 – 2.3°C~1.5°C
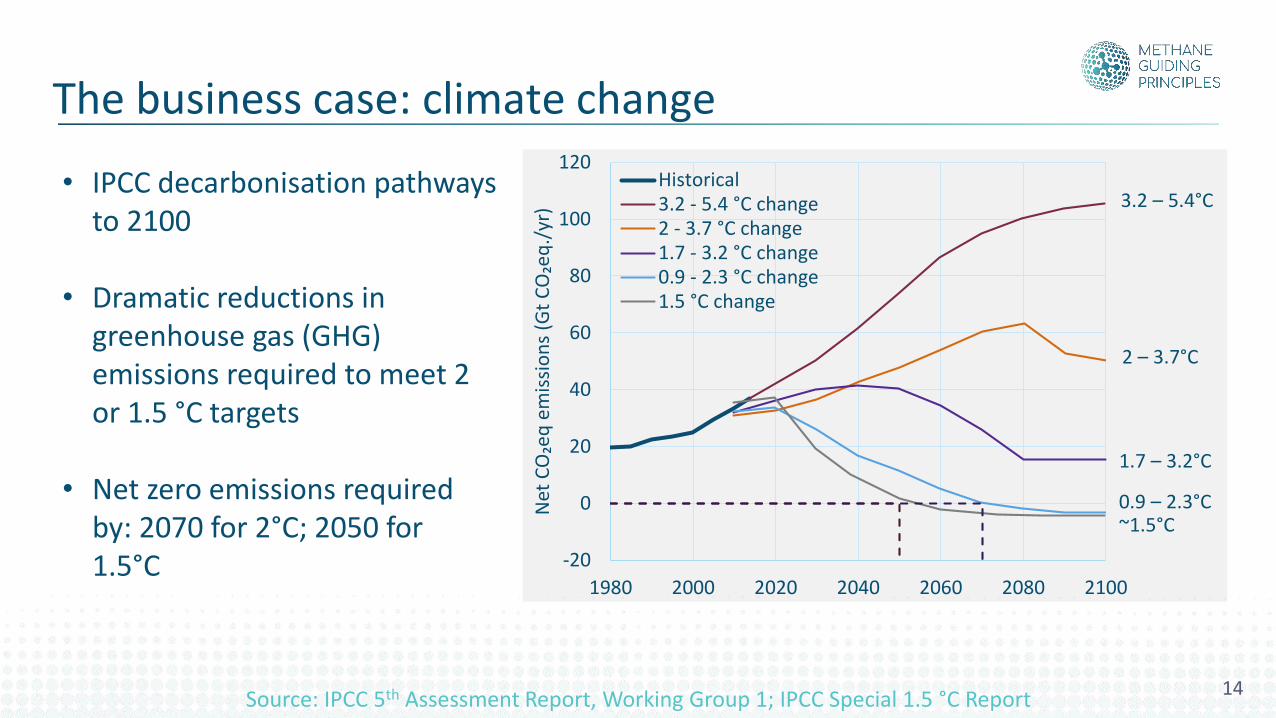
The business case: climate change
Source: IPCC 5th Assessment Report, Working Group 1; IPCC Special 1.5 °C Report
• IPCC decarbonisation pathways to 2100
• Dramatic reductions in greenhouse gas (GHG) emissions required to meet 2 or 1.5 °C targets
• Net zero emissions required by: 2070 for 2°C; 2050 for 1.5°C
14
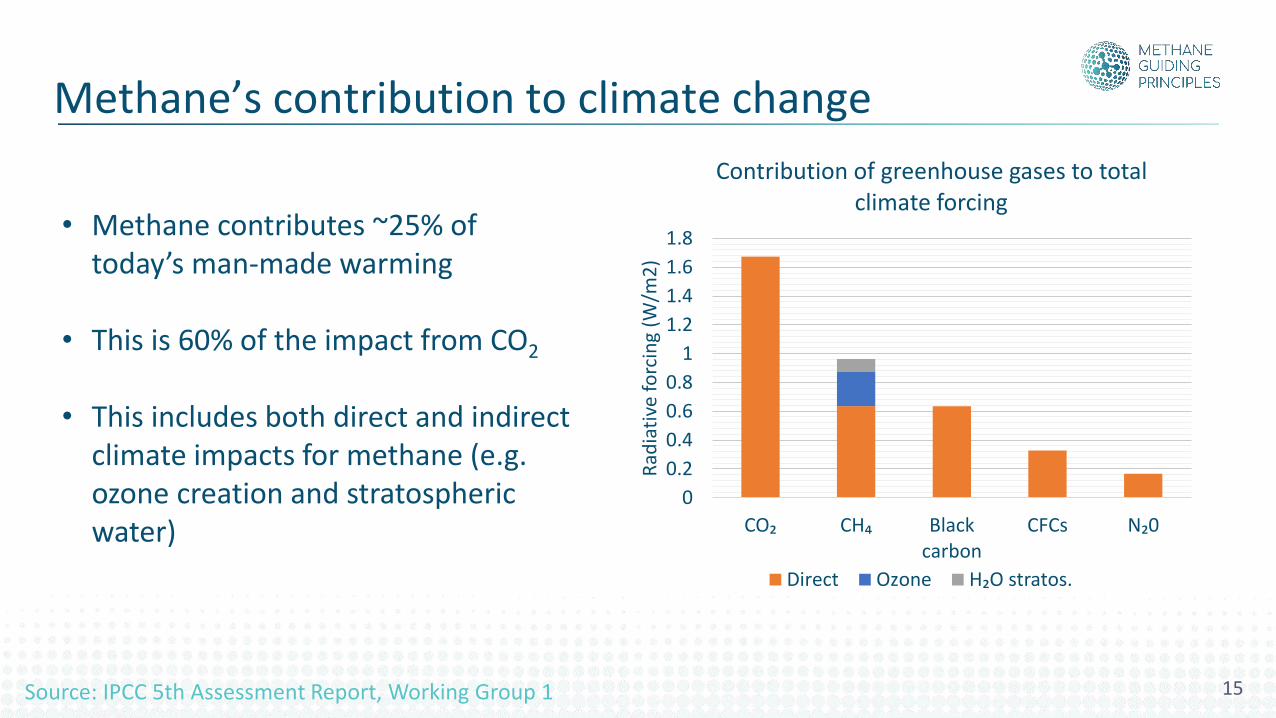
• Methane contributes ~25% of today’s man-made warming
• This is 60% of the impact from CO2
• This includes both direct and indirect climate impacts for methane (e.g. ozone creation and stratospheric water)
Methane’s contribution to climate change
Source: IPCC 5th Assessment Report, Working Group 1
0
0.2
0.4
0.6
0.8
1
1.2
1.4
1.6
1.8
CO₂ CH₄ Blackcarbon
CFCs N₂0
Rad
iati
ve f
orc
ing
(W/m
2)
Contribution of greenhouse gases to total climate forcing
Direct Ozone H₂O stratos.
15
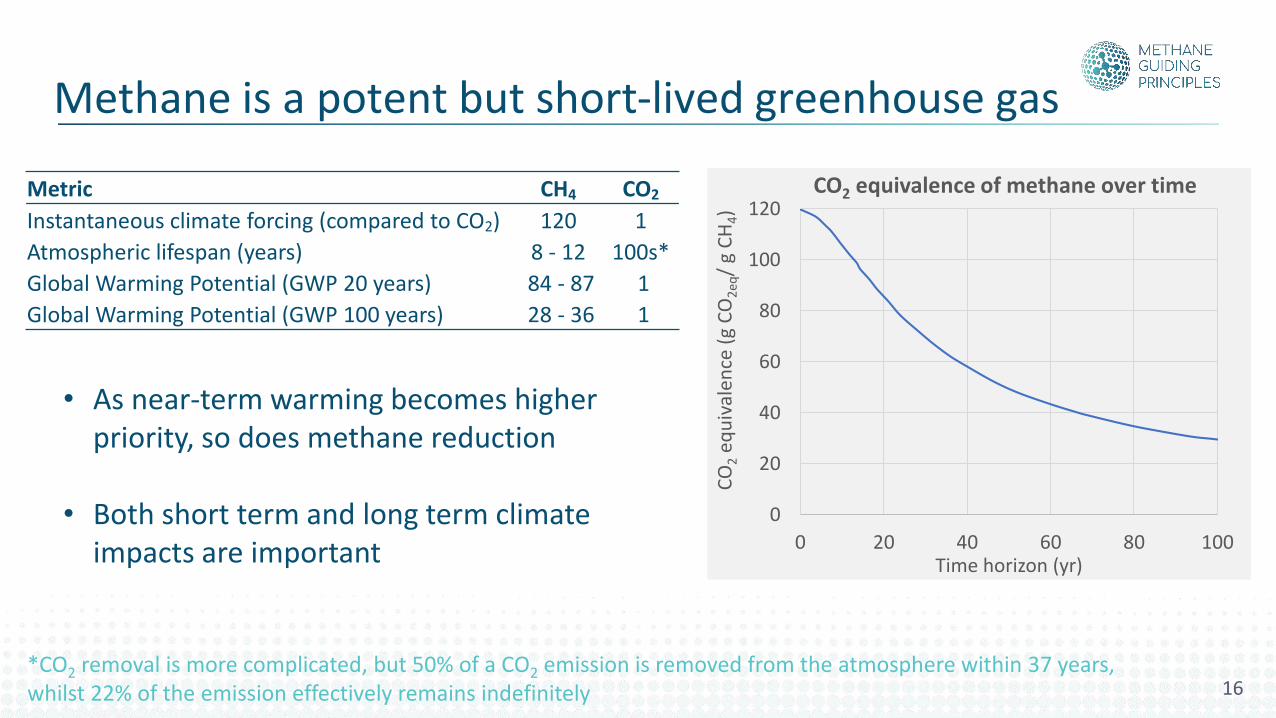
• As near-term warming becomes higher priority, so does methane reduction
• Both short term and long term climate impacts are important
Metric CH4 CO2
Instantaneous climate forcing (compared to CO2) 120 1
Atmospheric lifespan (years) 8 - 12 100s*
Global Warming Potential (GWP 20 years) 84 - 87 1
Global Warming Potential (GWP 100 years) 28 - 36 1
0
20
40
60
80
100
120
0 20 40 60 80 100
CO
2eq
uiv
alen
ce (
g C
O2
eq/
g C
H4)
Time horizon (yr)
CO2 equivalence of methane over time
*CO2 removal is more complicated, but 50% of a CO2 emission is removed from the atmosphere within 37 years, whilst 22% of the emission effectively remains indefinitely
Methane is a potent but short-lived greenhouse gas
16
Source: https://www.esrl.noaa.gov/gmd/ccgg/trends_ch4/
1600
1650
1700
1750
1800
1850
1900
1985 1995 2005 2015
Glo
bal
atm
osp
her
ic m
eth
ane
con
cen
trat
ion
(p
pb
)
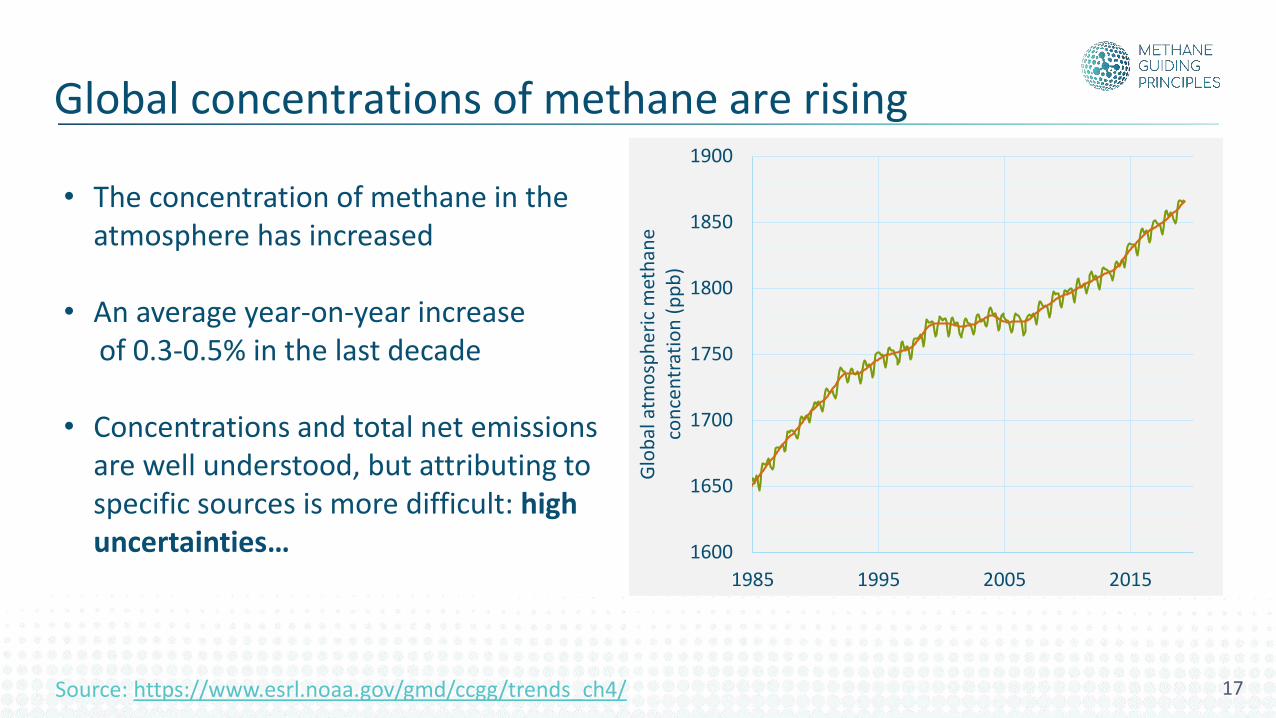
• The concentration of methane in the atmosphere has increased
• An average year-on-year increase of 0.3-0.5% in the last decade
• Concentrations and total net emissions are well understood, but attributing to specific sources is more difficult: high uncertainties…
Global concentrations of methane are rising
17
Source: Global Methane Budget www.globalcarbonproject.org/methanebudget/16/files/MethaneInfographic2016.png
Sources of methane emissions
18
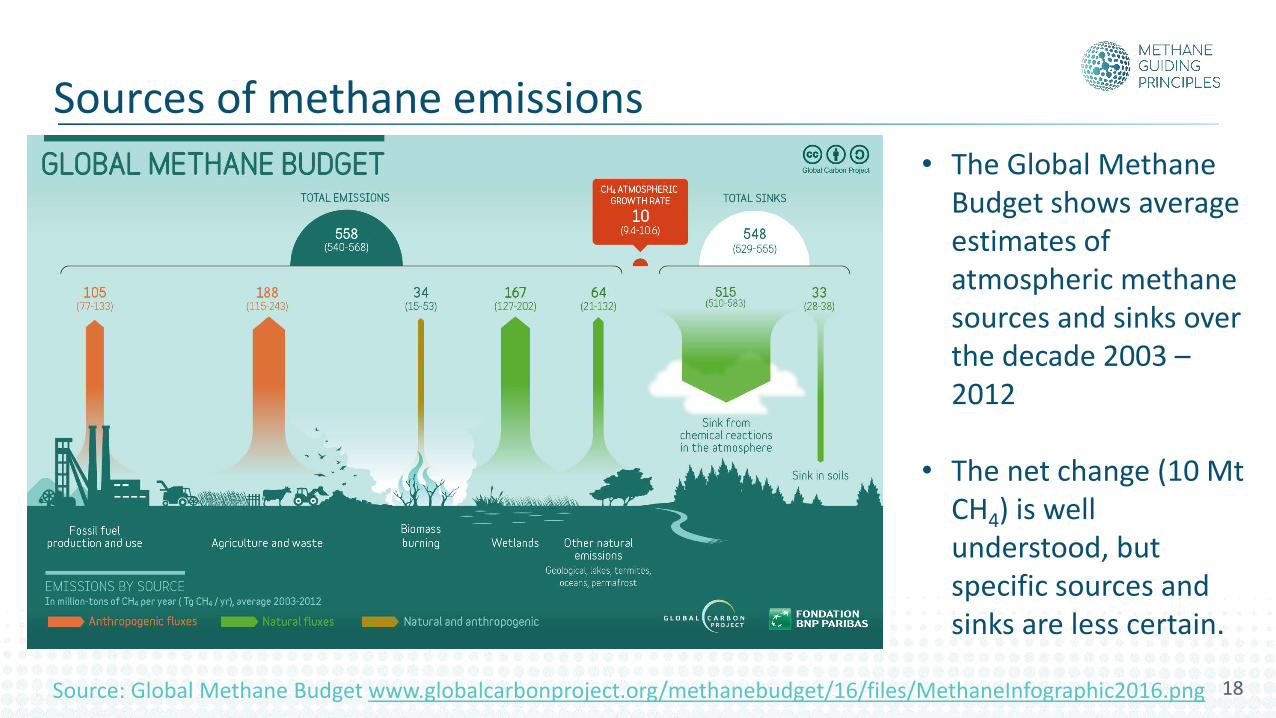
• The Global Methane Budget shows average estimates of atmospheric methane sources and sinks over the decade 2003 –2012
• The net change (10 Mt CH4) is well understood, but specific sources and sinks are less certain.
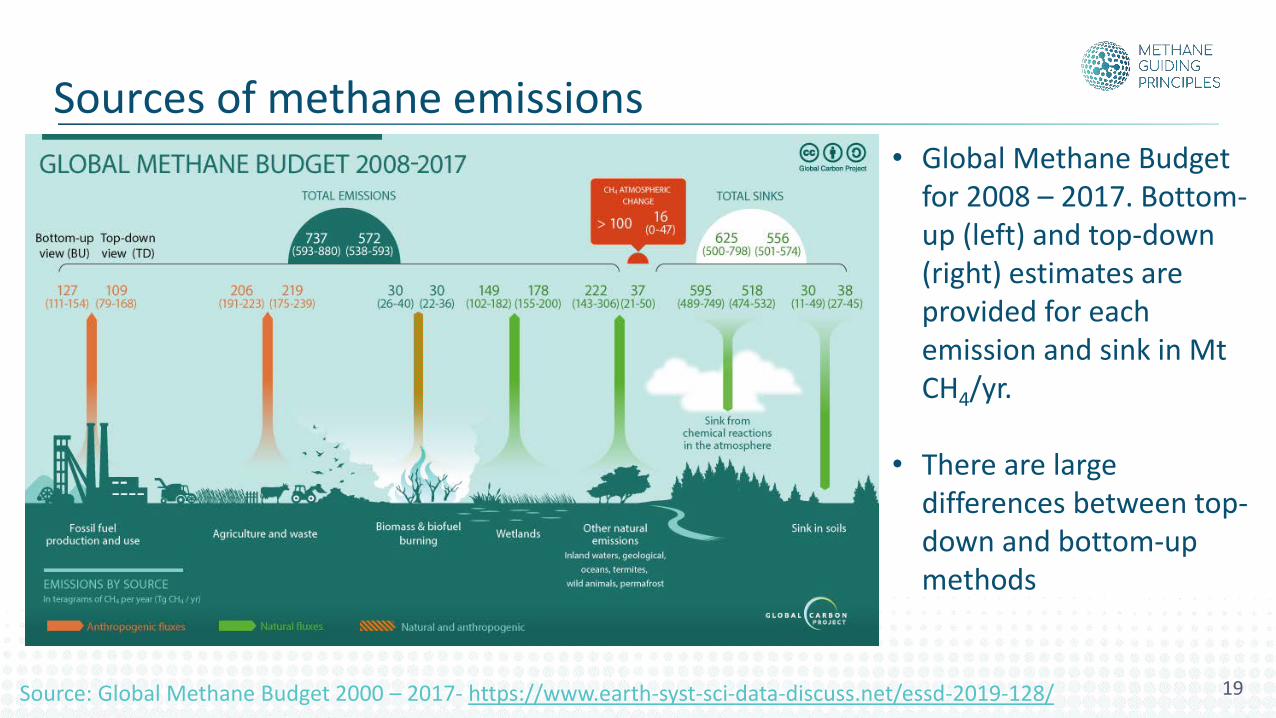
Sources of methane emissions• Global Methane Budget
for 2008 – 2017. Bottom-up (left) and top-down (right) estimates are provided for each emission and sink in Mt CH4/yr.
• There are large differences between top-down and bottom-up methods
Source: Global Methane Budget 2000 – 2017- https://www.earth-syst-sci-data-discuss.net/essd-2019-128/ 19
0%
20%
40%
60%
80%
100%
#1 #2 #3 #4 #5 #6 #7 #8Different estimates
The contribution to total methane emissions
Natural Agri and wasteBiomass & biofuel Fossil fuels
0
50
100
150
#3 #4 #5
An
nu
al e
mis
sio
ns
(Mt
met
han
e/yr
)
Different estimates
… Of the fossil fuels:
Coal Oil and gas
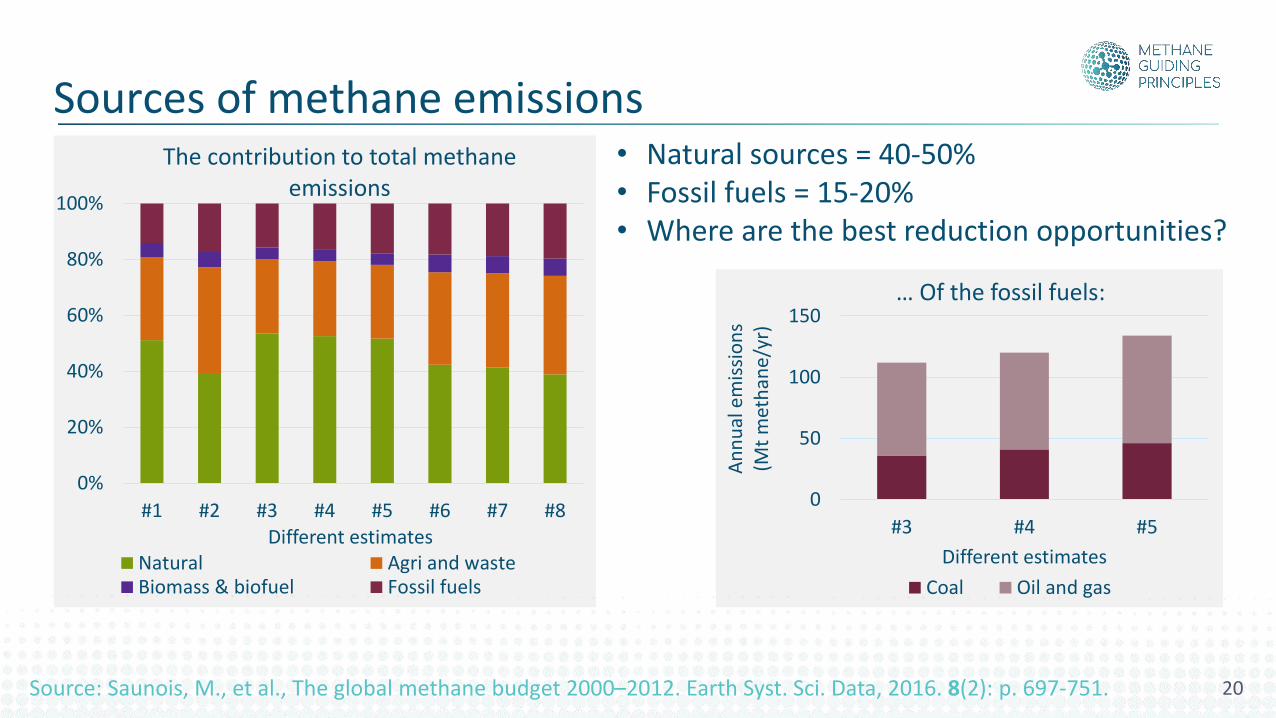
• Natural sources = 40-50%• Fossil fuels = 15-20%• Where are the best reduction opportunities?
Source: Saunois, M., et al., The global methane budget 2000–2012. Earth Syst. Sci. Data, 2016. 8(2): p. 697-751.
Sources of methane emissions
20
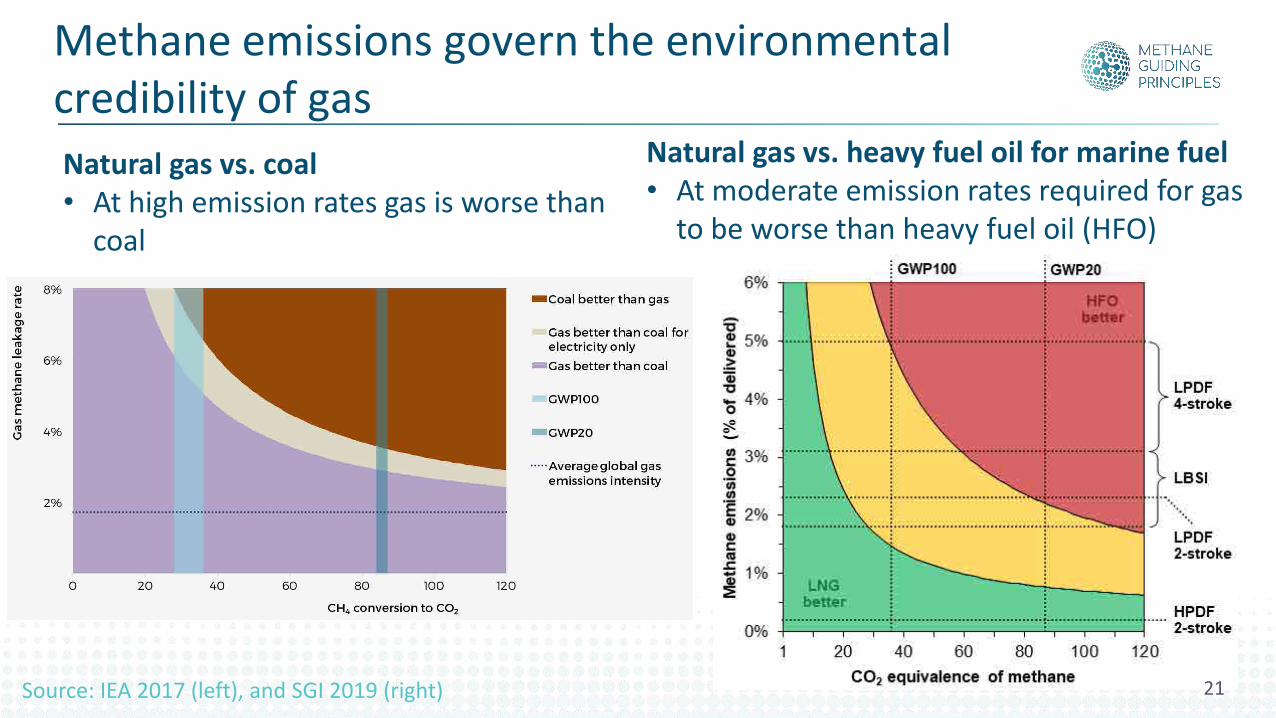
Methane emissions govern the environmental credibility of gas
Natural gas vs. coal• At high emission rates gas is worse than
coal
Natural gas vs. heavy fuel oil for marine fuel• At moderate emission rates required for gas
to be worse than heavy fuel oil (HFO)
Source: IEA 2017 (left), and SGI 2019 (right) 21

1. Climate change2. Safety3. Social licence4. Revenue
Reducing methane emissions: the business case
22
1. Climate change2. Safety3. Social licence4. Revenue
Reducing methane emissions: the business case
23
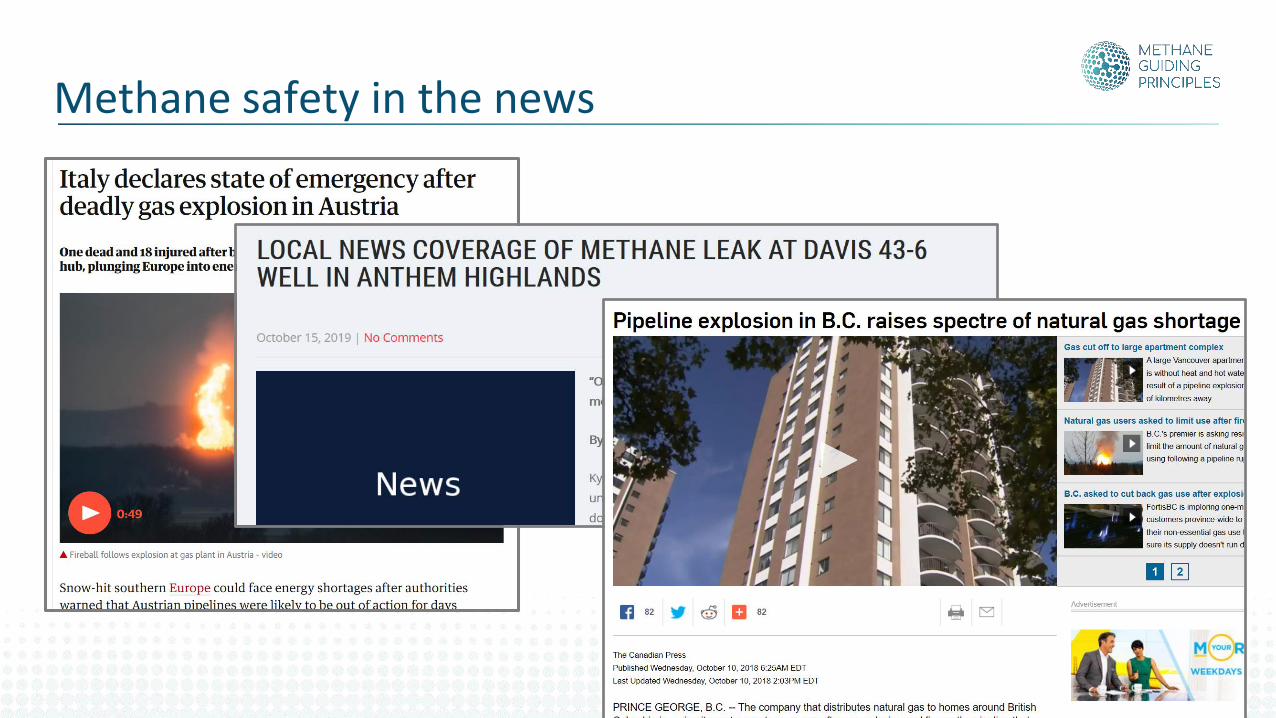
Methane safety in the news
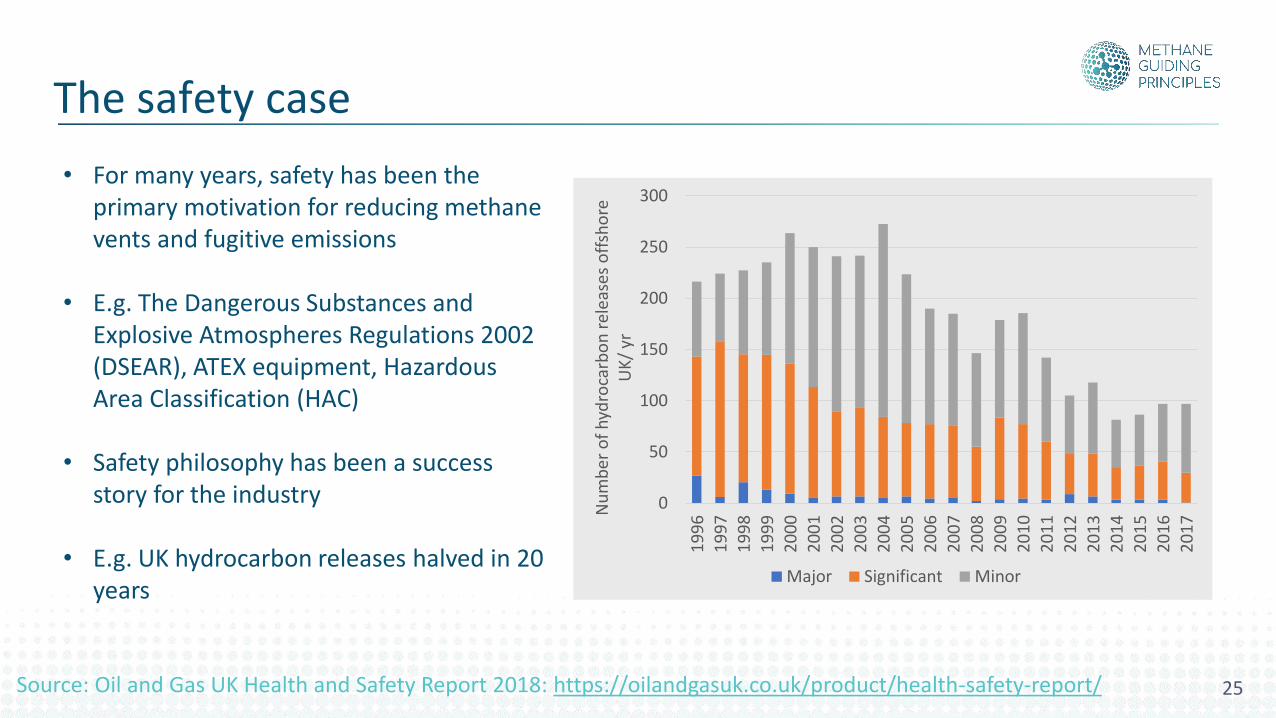
• For many years, safety has been the primary motivation for reducing methane vents and fugitive emissions
• E.g. The Dangerous Substances and Explosive Atmospheres Regulations 2002 (DSEAR), ATEX equipment, Hazardous Area Classification (HAC)
• Safety philosophy has been a success story for the industry
• E.g. UK hydrocarbon releases halved in 20 years
0
50
100
150
200
250
300
19
96
19
97
19
98
19
99
20
00
20
01
20
02
20
03
20
04
20
05
20
06
20
07
20
08
20
09
20
10
20
11
20
12
20
13
20
14
20
15
20
16
20
17N
um
ber
of
hyd
roca
rbo
n r
elea
ses
off
sho
re
UK
/ yr
Major Significant Minor
Source: Oil and Gas UK Health and Safety Report 2018: https://oilandgasuk.co.uk/product/health-safety-report/ 25
The safety case
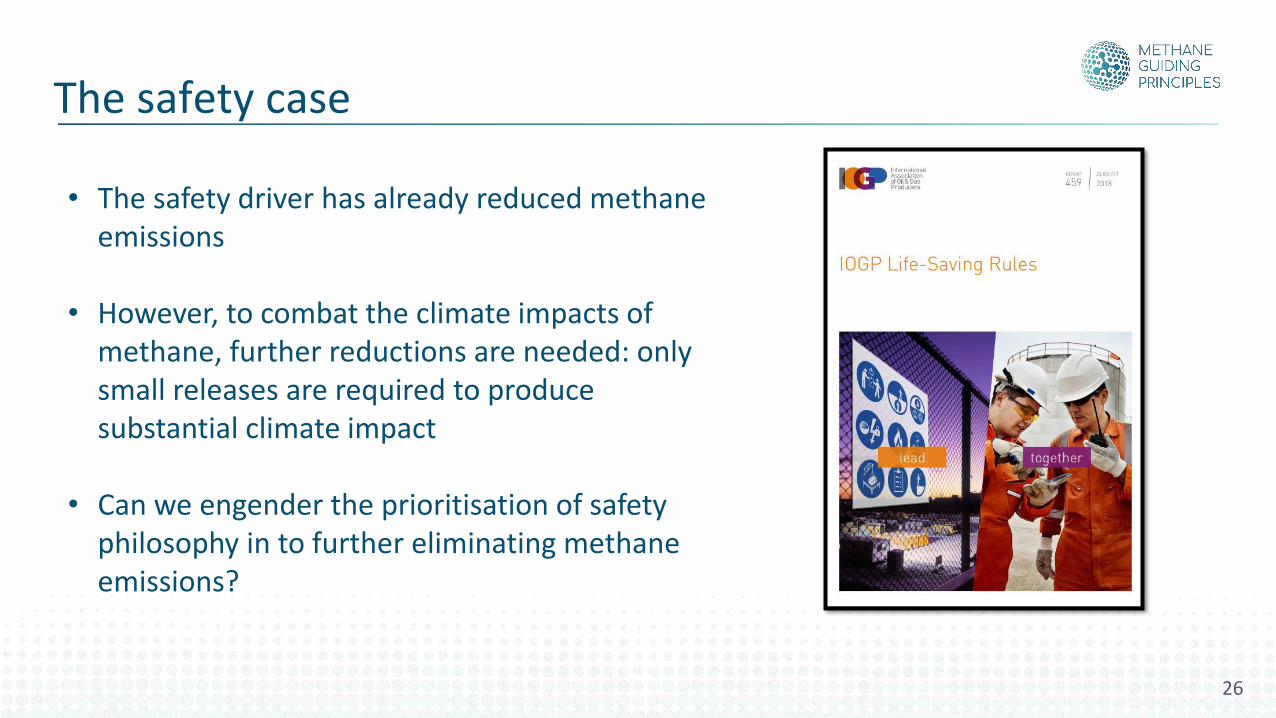
• The safety driver has already reduced methane emissions
• However, to combat the climate impacts of methane, further reductions are needed: only small releases are required to produce substantial climate impact
• Can we engender the prioritisation of safety philosophy in to further eliminating methane emissions?
The safety case
26
1. Climate change2. Safety3. Social licence4. Revenue
Reducing methane emissions: the business case
27
1. Climate change2. Safety3. Social licence4. Revenue
Reducing methane emissions: the business case
28
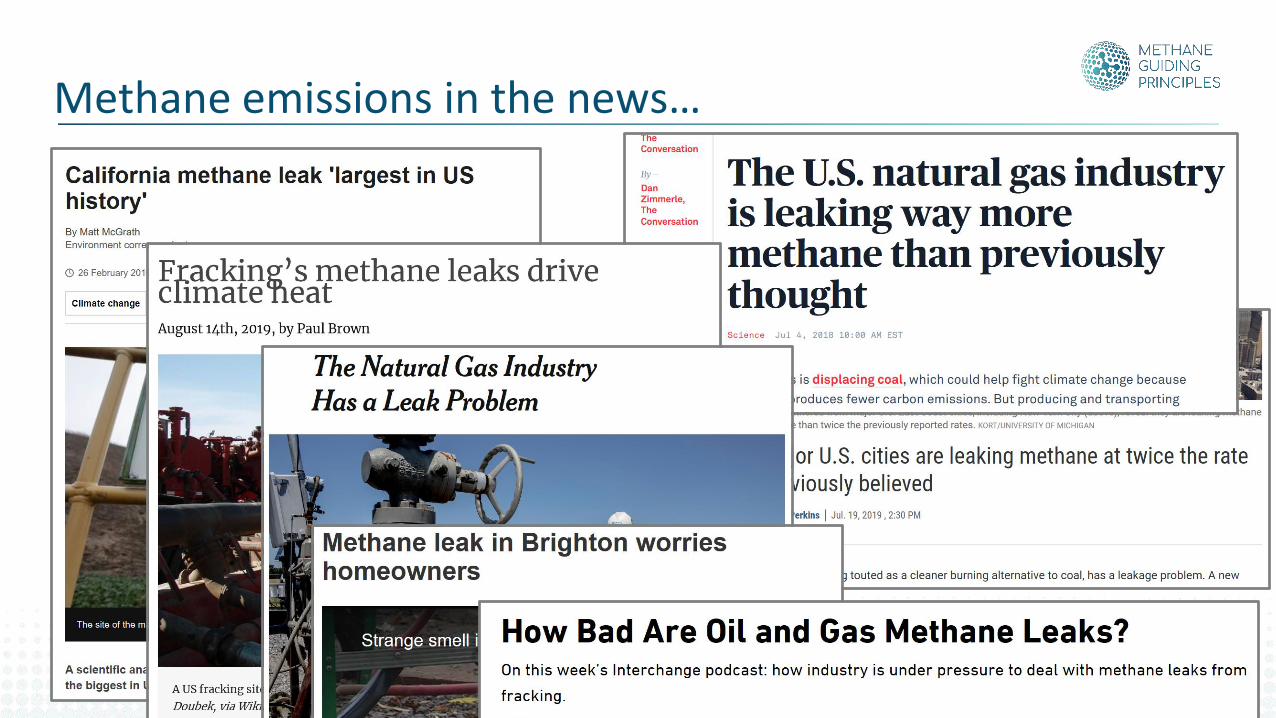
Methane emissions in the news…
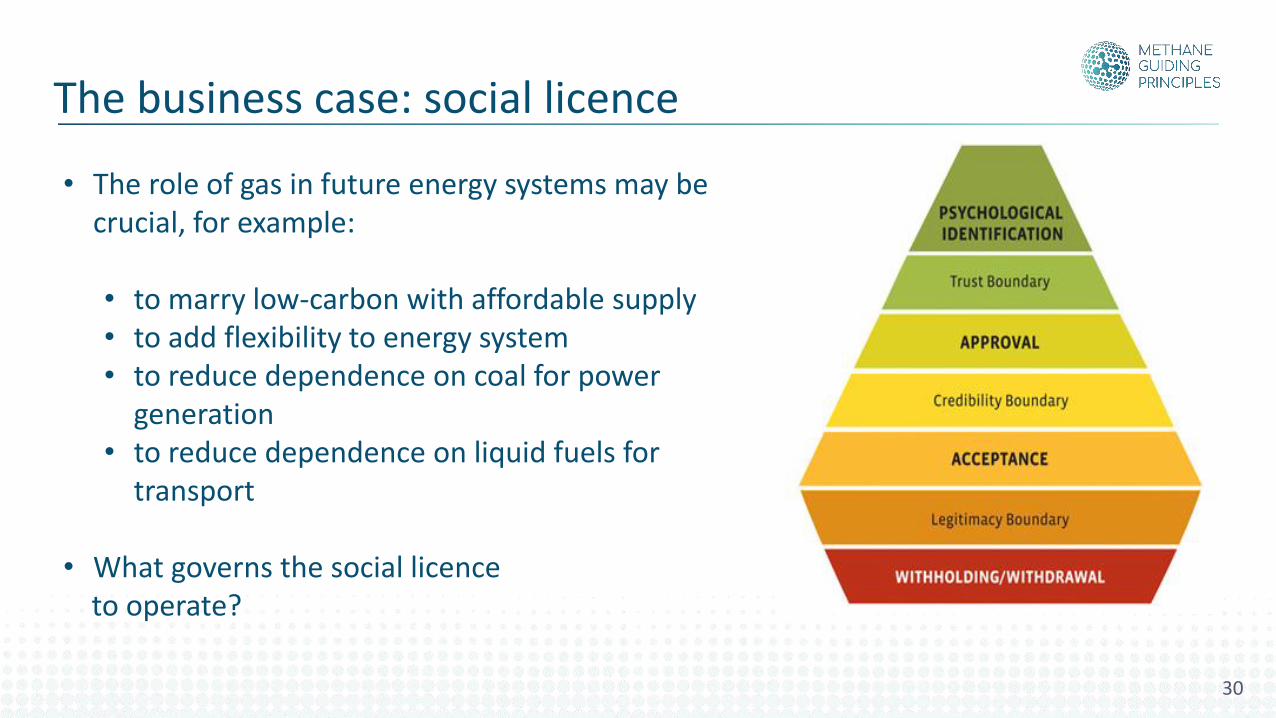
• The role of gas in future energy systems may be crucial, for example:
• to marry low-carbon with affordable supply• to add flexibility to energy system• to reduce dependence on coal for power
generation• to reduce dependence on liquid fuels for
transport
• What governs the social licence to operate?
30
The business case: social licence
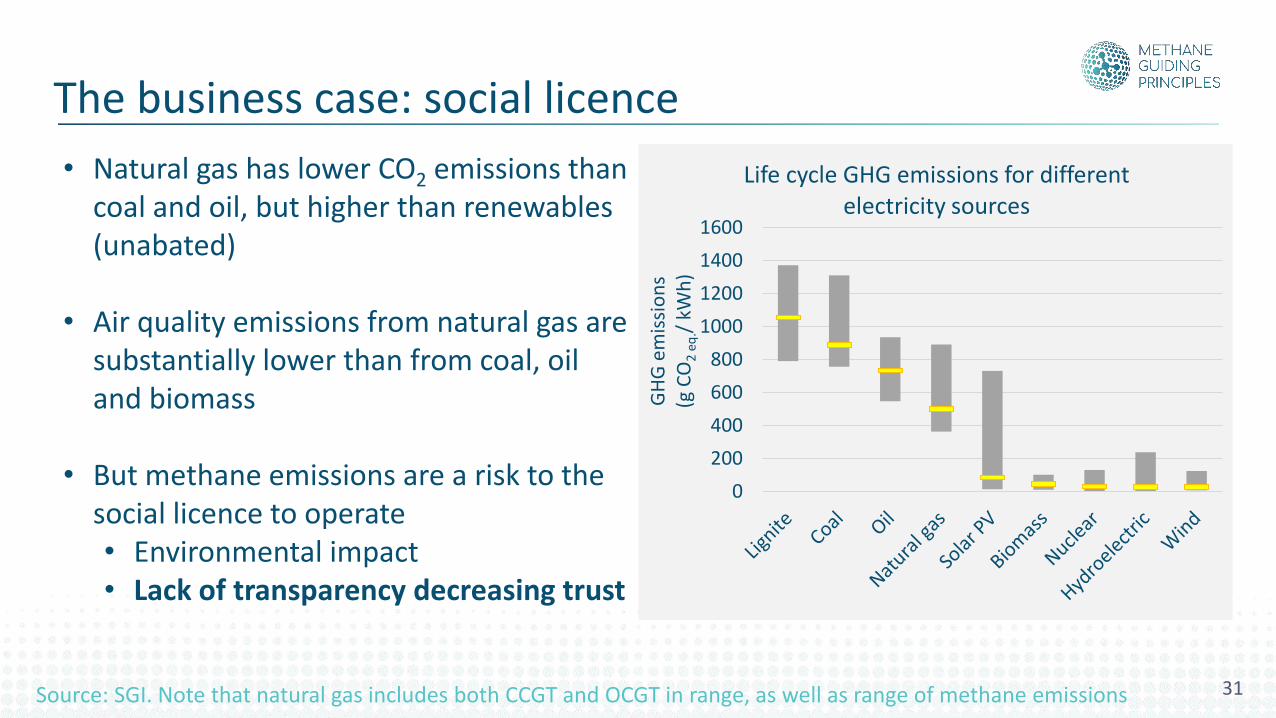
• Natural gas has lower CO2 emissions than coal and oil, but higher than renewables (unabated)
• Air quality emissions from natural gas are substantially lower than from coal, oil and biomass
• But methane emissions are a risk to the social licence to operate• Environmental impact• Lack of transparency decreasing trust
0
200
400
600
800
1000
1200
1400
1600
GH
G e
mis
sio
ns
(g C
O2
eq
./ k
Wh
)
Life cycle GHG emissions for different electricity sources
The business case: social licence
31Source: SGI. Note that natural gas includes both CCGT and OCGT in range, as well as range of methane emissions
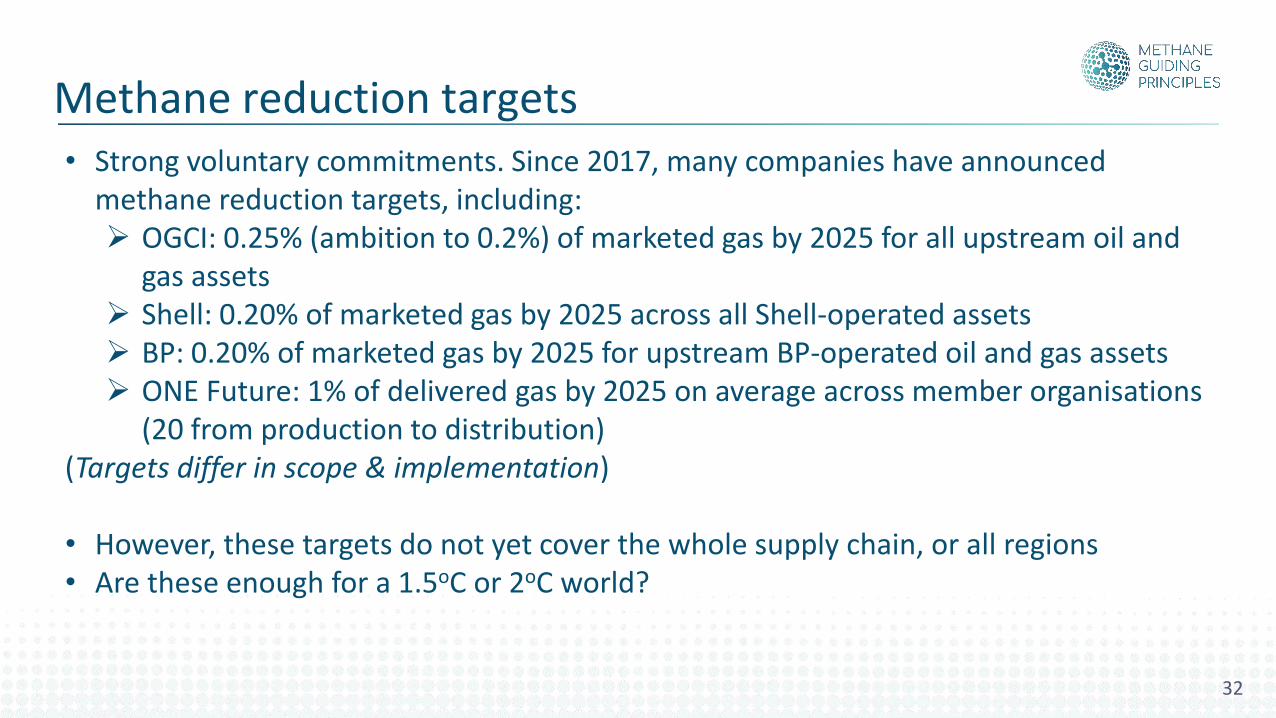
• Strong voluntary commitments. Since 2017, many companies have announced methane reduction targets, including: ➢ OGCI: 0.25% (ambition to 0.2%) of marketed gas by 2025 for all upstream oil and
gas assets➢ Shell: 0.20% of marketed gas by 2025 across all Shell-operated assets➢ BP: 0.20% of marketed gas by 2025 for upstream BP-operated oil and gas assets➢ ONE Future: 1% of delivered gas by 2025 on average across member organisations
(20 from production to distribution)(Targets differ in scope & implementation)
• However, these targets do not yet cover the whole supply chain, or all regions• Are these enough for a 1.5oC or 2oC world?
Methane reduction targets
32
UNFCCC(1992)
Kyoto(1997)
Natural Gas Star(c. 1995)
Norway methane
mandatory guide(2004)
Paris Agreement
(2015)
Global Methane Initiative
(2004)
UK Climate Change Act
(2008)
Australia GHG Act (2007)
OGCI intensity
target (2018)
Methane Guiding
Principles (2017)
CCAC OGMP(2014)
Mexico regs
(2018)
Canada Methane
regs (2020)
EU regs (???)
This is not an exhaustive list
One Future (2014)
US methane regs
(2016)
US EPA proposed amends(2019)
OGCI(2014)
33
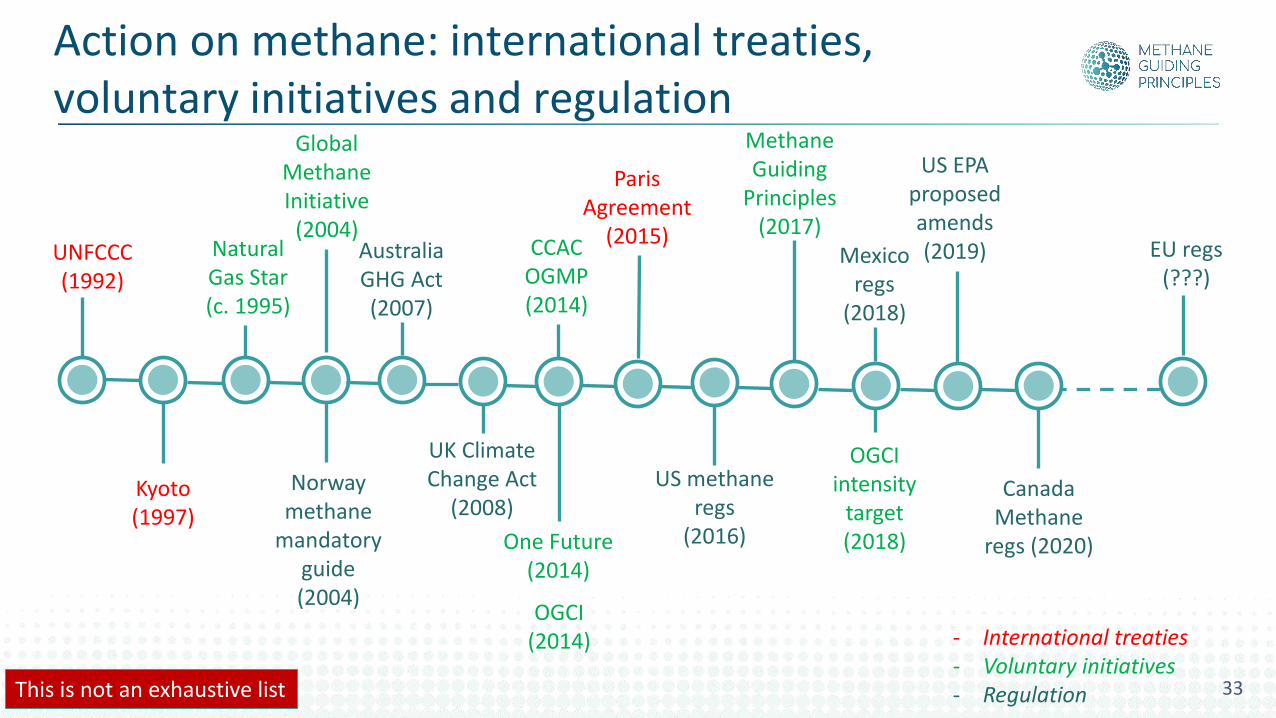
Action on methane: international treaties, voluntary initiatives and regulation
- International treaties- Voluntary initiatives- Regulation
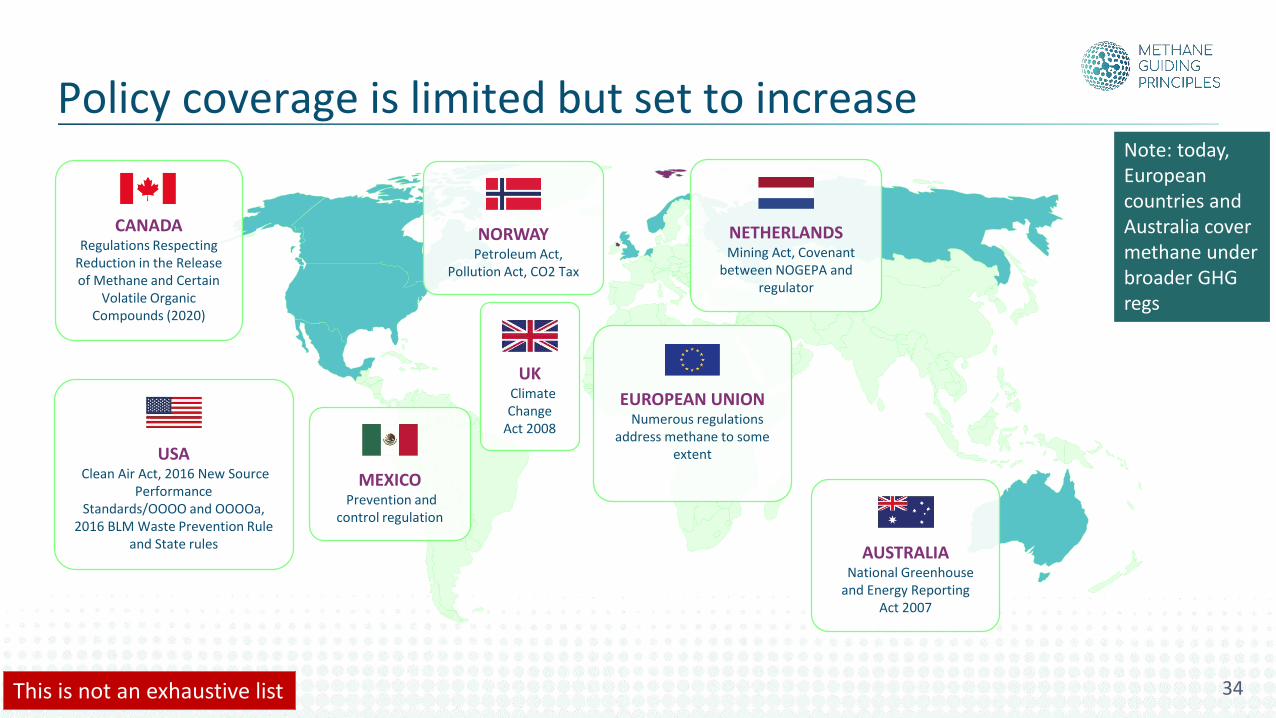
CANADARegulations Respecting
Reduction in the Release of Methane and Certain
Volatile Organic Compounds (2020)
USAClean Air Act, 2016 New Source
PerformanceStandards/OOOO and OOOOa,
2016 BLM Waste Prevention Rule and State rules
MEXICOPrevention and
control regulation
UKClimate Change
Act 2008
NETHERLANDSMining Act, Covenant
between NOGEPA and regulator
NORWAYPetroleum Act,
Pollution Act, CO2 Tax
AUSTRALIANational Greenhouse
and Energy ReportingAct 2007
EUROPEAN UNIONNumerous regulations
address methane to some extent
This is not an exhaustive list
Note: today, European countries and Australia cover methane under broader GHG regs
34
Policy coverage is limited but set to increase
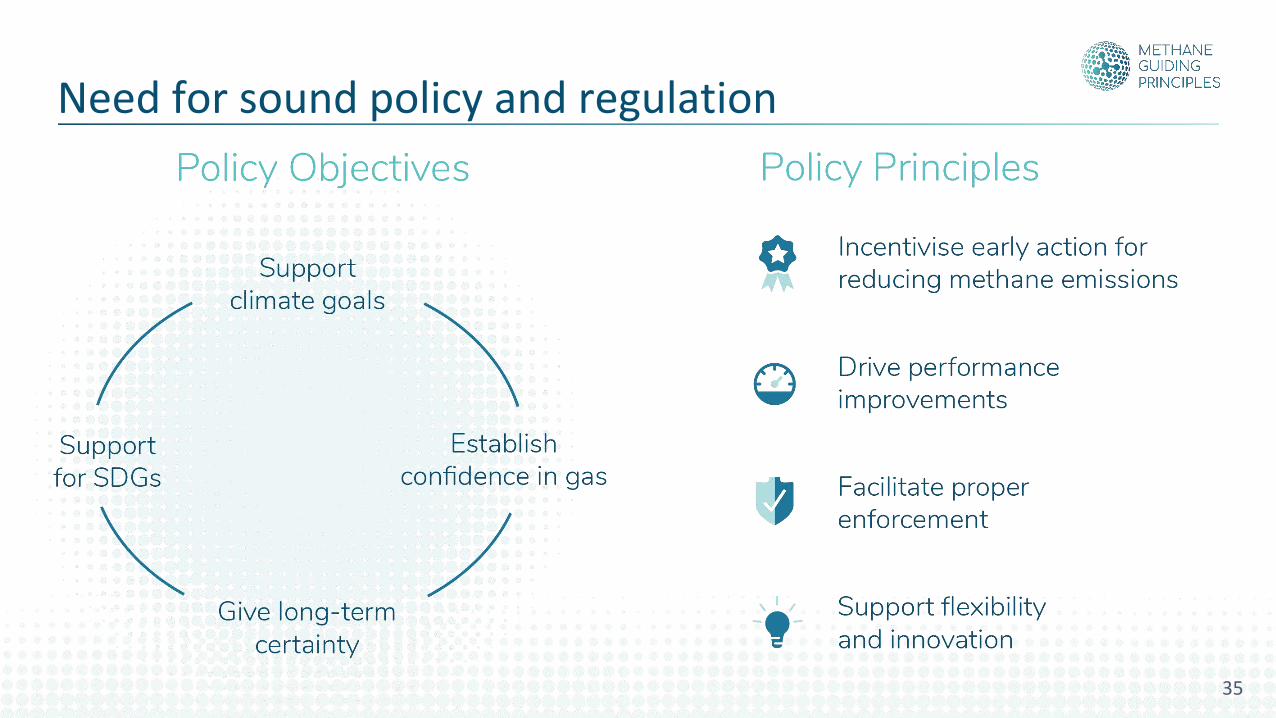
Need for sound policy and regulation
35
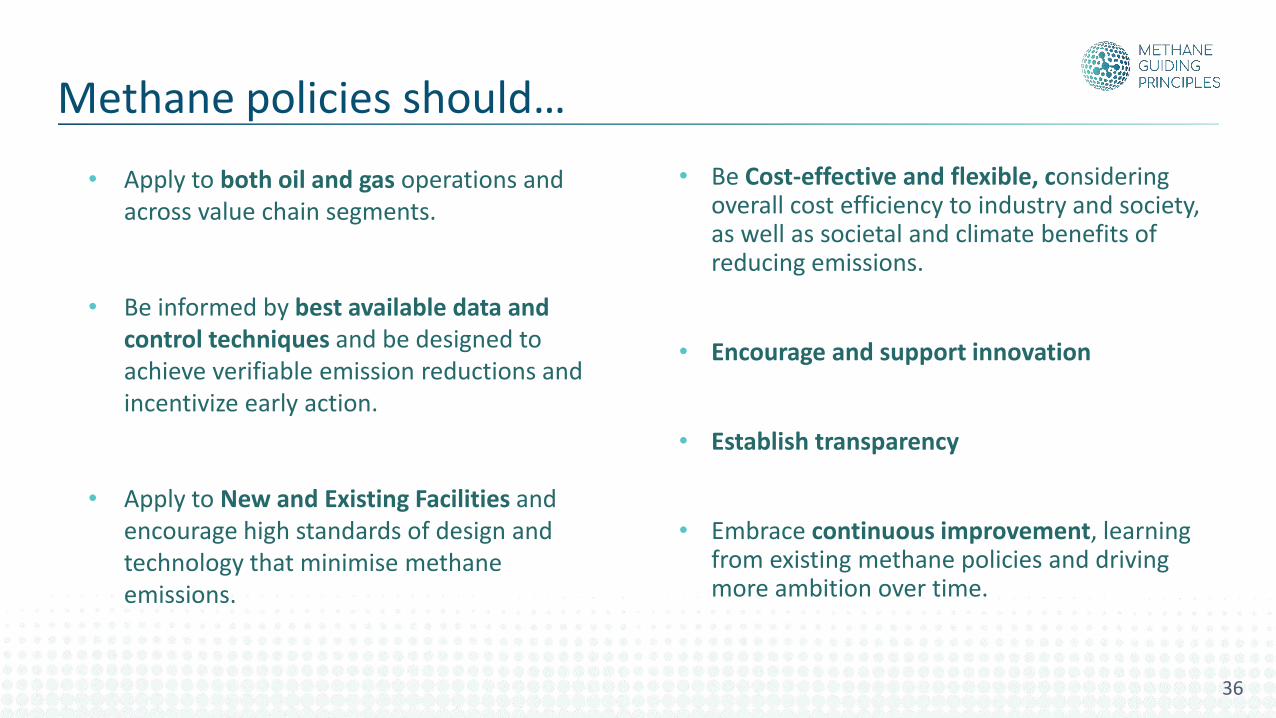
• Apply to both oil and gas operations and across value chain segments.
• Be informed by best available data and control techniques and be designed to achieve verifiable emission reductions and incentivize early action.
• Apply to New and Existing Facilities and encourage high standards of design and technology that minimise methane emissions.
• Be Cost-effective and flexible, considering overall cost efficiency to industry and society, as well as societal and climate benefits of reducing emissions.
• Encourage and support innovation
• Establish transparency
• Embrace continuous improvement, learning from existing methane policies and driving more ambition over time.
36
Methane policies should…
1. Climate change2. Safety3. Social licence4. Revenue
Reducing methane emissions: the business case
37
1. Climate change2. Safety3. Social licence4. Revenue
Reducing methane emissions: the business case
38
0.1
1
10
100
0% 1% 2% 3% 4% 5%R
enev
ue
lost
(b
illio
n U
SD)
Methane emissions (% of production)
Lost revenue for different levels of methane emissions
Global (3768 bcmproduction)
US (760 bcm production)
UK (42 bcm production)
global average
US emission
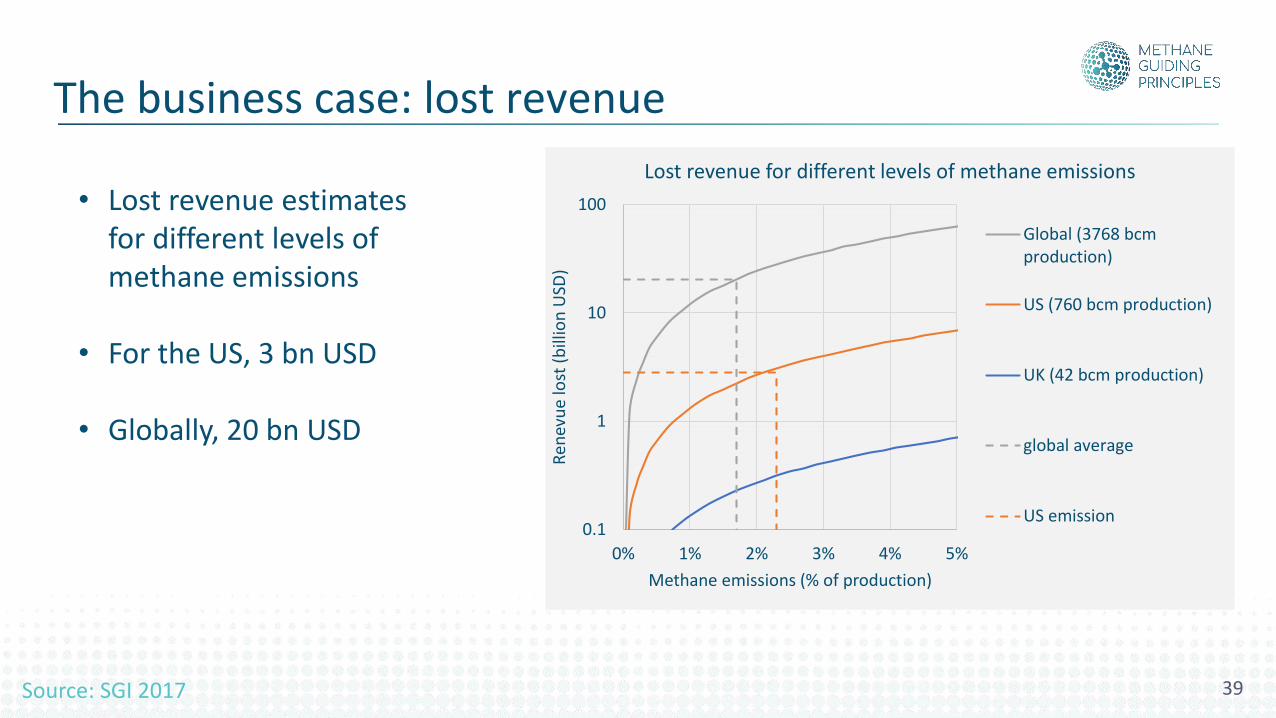
• Lost revenue estimates for different levels of methane emissions
• For the US, 3 bn USD
• Globally, 20 bn USD
The business case: lost revenue
39Source: SGI 2017
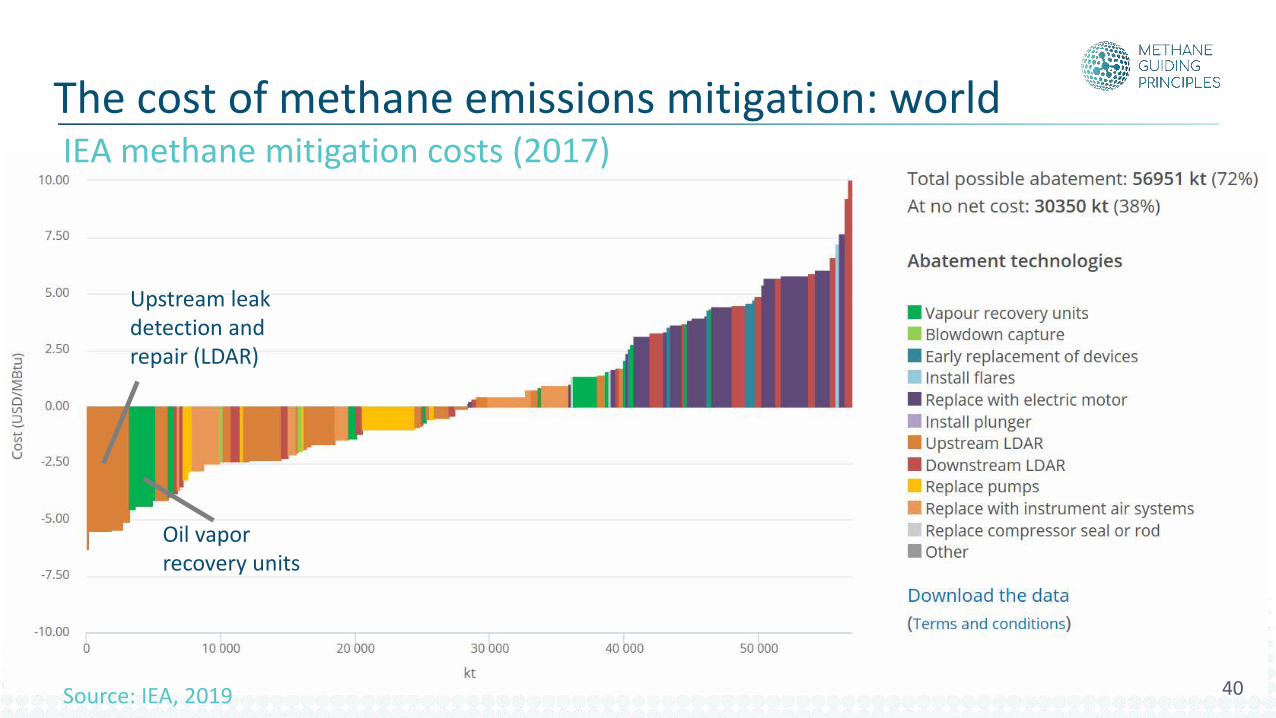
IEA methane mitigation costs (2017)
Source: IEA, 2019 40
Upstream leak detection and repair (LDAR)
Oil vapor recovery units
The cost of methane emissions mitigation: world
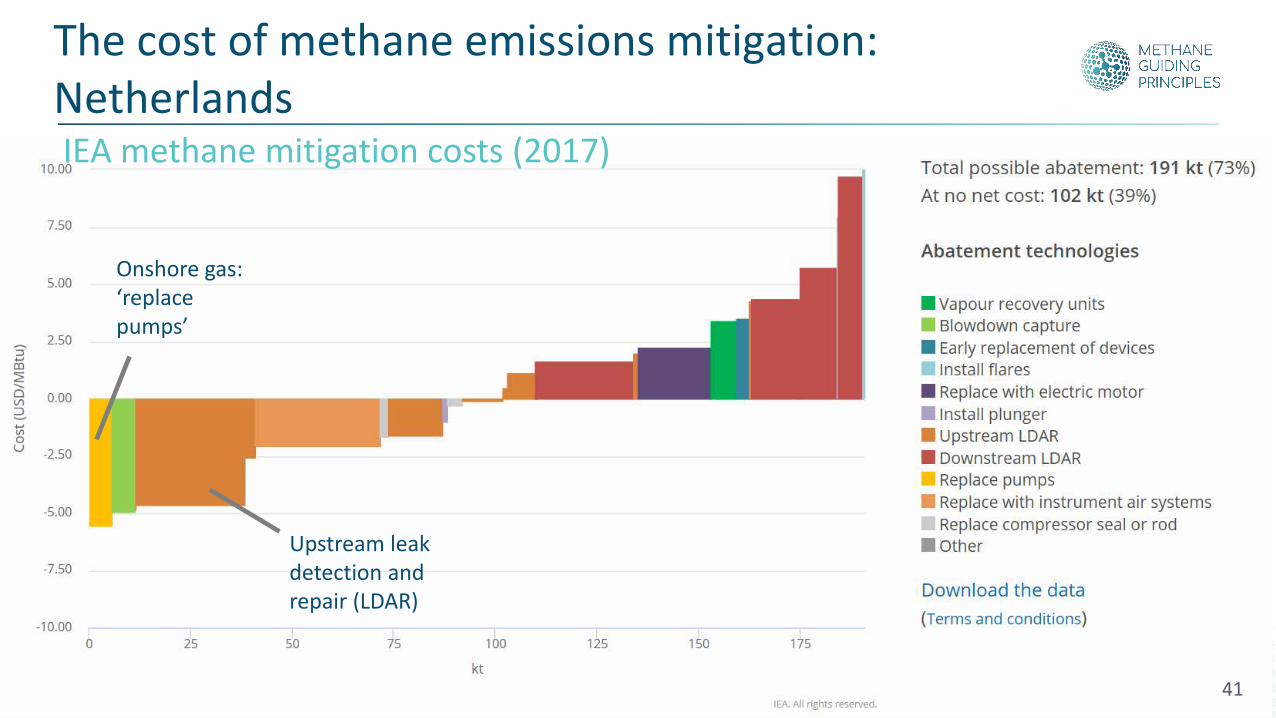
The cost of methane emissions mitigation: Netherlands
Onshore gas: ‘replace pumps’
Upstream leak detection and repair (LDAR)
41
IEA methane mitigation costs (2017)
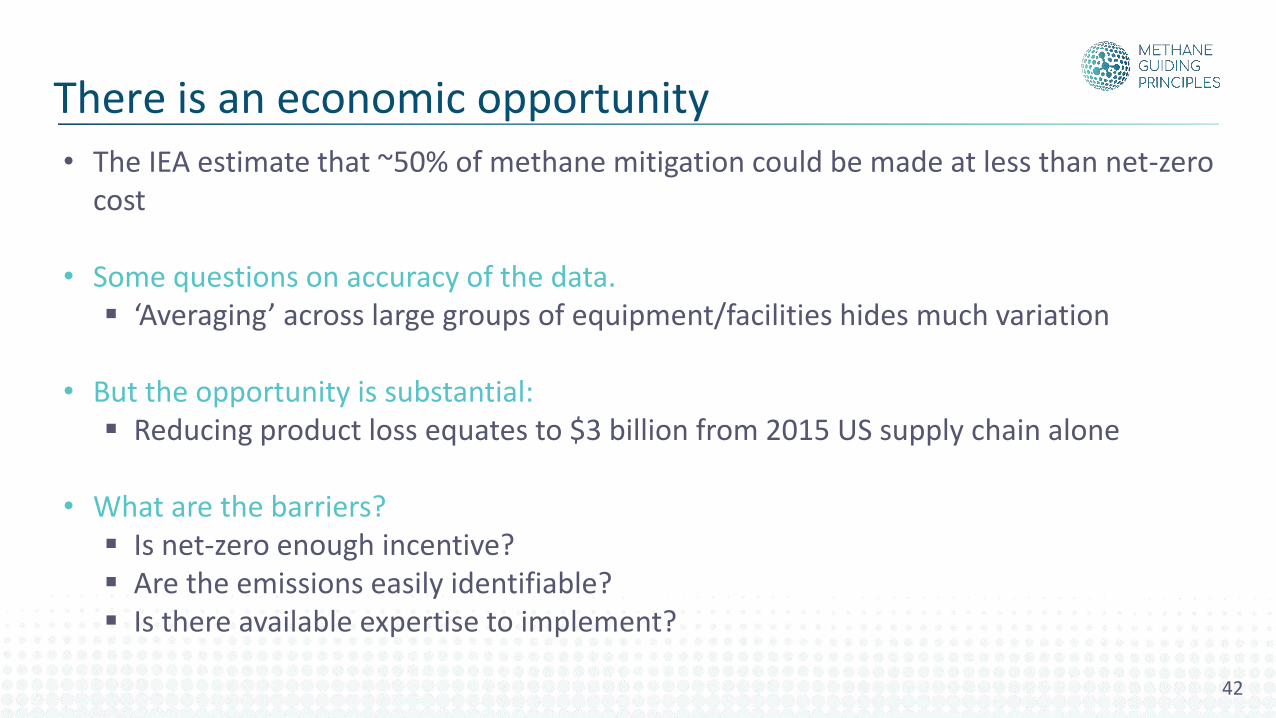
• The IEA estimate that ~50% of methane mitigation could be made at less than net-zero cost
• Some questions on accuracy of the data.▪ ‘Averaging’ across large groups of equipment/facilities hides much variation
• But the opportunity is substantial:▪ Reducing product loss equates to $3 billion from 2015 US supply chain alone
• What are the barriers?▪ Is net-zero enough incentive?▪ Are the emissions easily identifiable?▪ Is there available expertise to implement?
There is an economic opportunity
42

1. Climate changeReducing methane emissions is critical to meet climate targets and is an opportunity to slow down global warming.
2. SafetySafety prioritisation has already helped to reduce methane emissions across industry, but can we engender this philosophy to further reduce methane emissions?
3. Social licenceMethane management across the whole industry will help to maintain a social licence to operate and the continued role of gas in decarbonisation and improving air quality.
4. RevenueMethane emissions represent asset loss, where many emissions can be eliminated at zero cost or less, but barriers exist to investment in mitigation.
The business case: summary
43
Reflection point
Every organisation is different - how would you make the case for methane emissions reductions in yours?
44
Outreach programme
Reducing methane emissions: Understanding methane
Understanding methane emissions
Understanding methane emissions1. Sources of emissions from the oil and gas supply chain
2. The distribution: heavy tails and super-emitters
3. Estimation methods
46
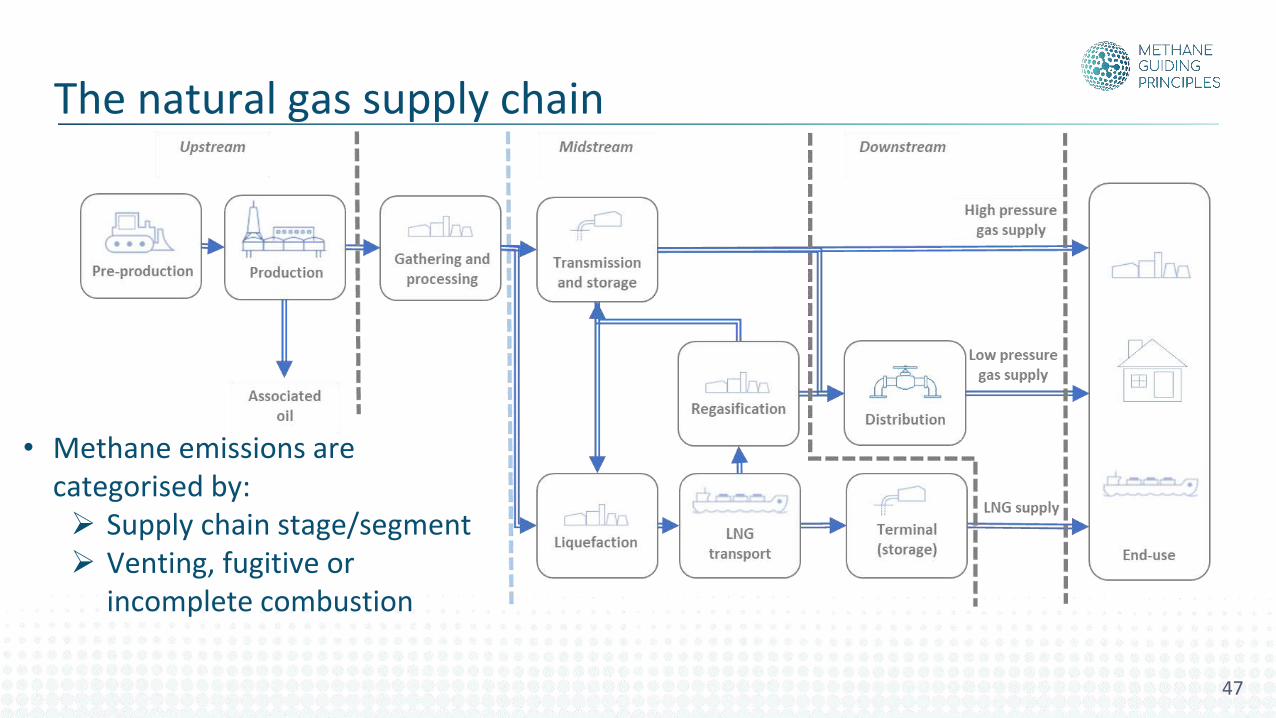
• Methane emissions are categorised by:➢ Supply chain stage/segment➢ Venting, fugitive or
incomplete combustion
The natural gas supply chain
47
Source: International Energy Agency, www.iea.org/weo/methane/database
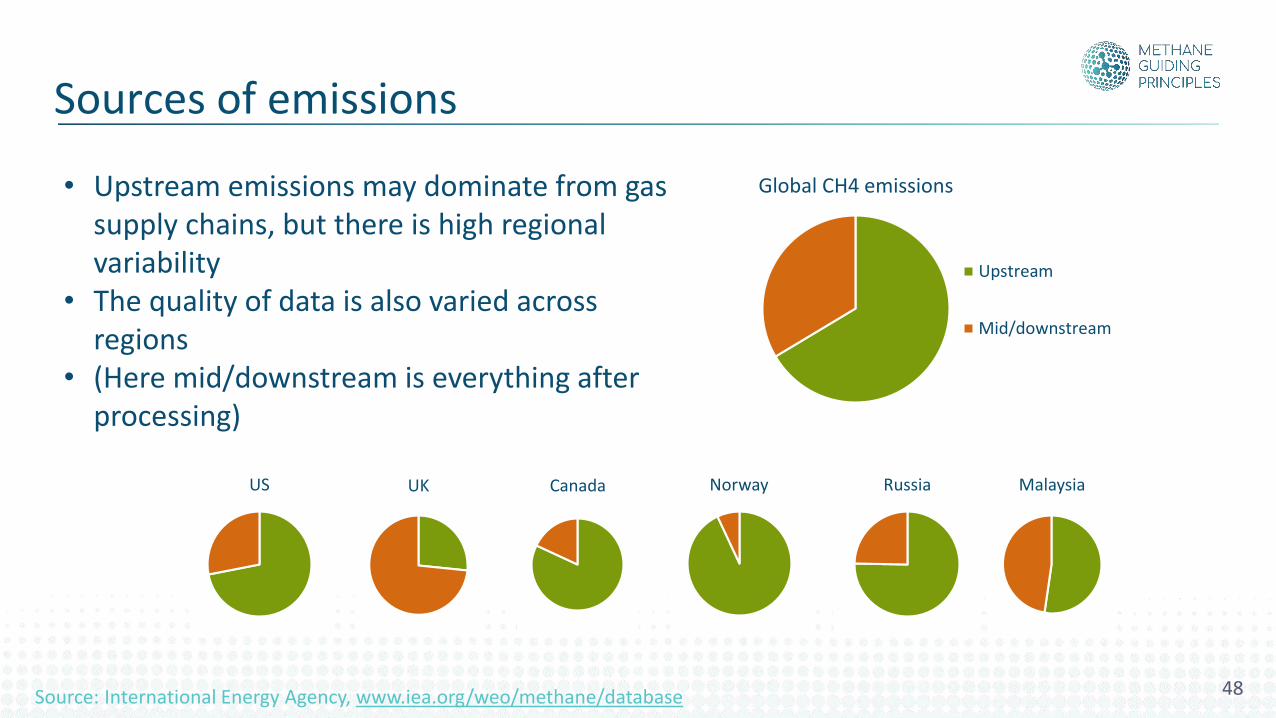
• Upstream emissions may dominate from gas supply chains, but there is high regional variability
• The quality of data is also varied across regions
• (Here mid/downstream is everything after processing)
Global CH4 emissions
Upstream
Mid/downstream
US UK Canada Norway Russia Malaysia
Sources of emissions
48
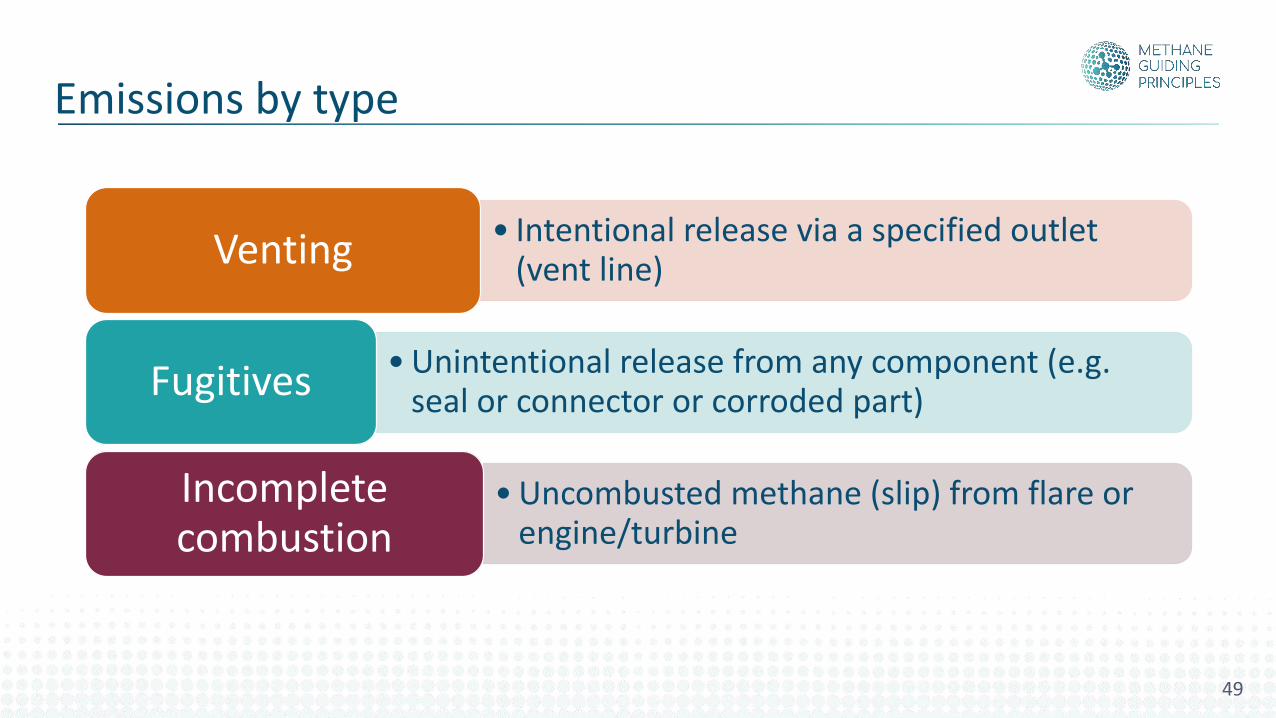
Emissions by type
• Intentional release via a specified outlet (vent line)Venting
• Unintentional release from any component (e.g. seal or connector or corroded part)Fugitives
• Uncombusted methane (slip) from flare or engine/turbine
Incomplete combustion
49
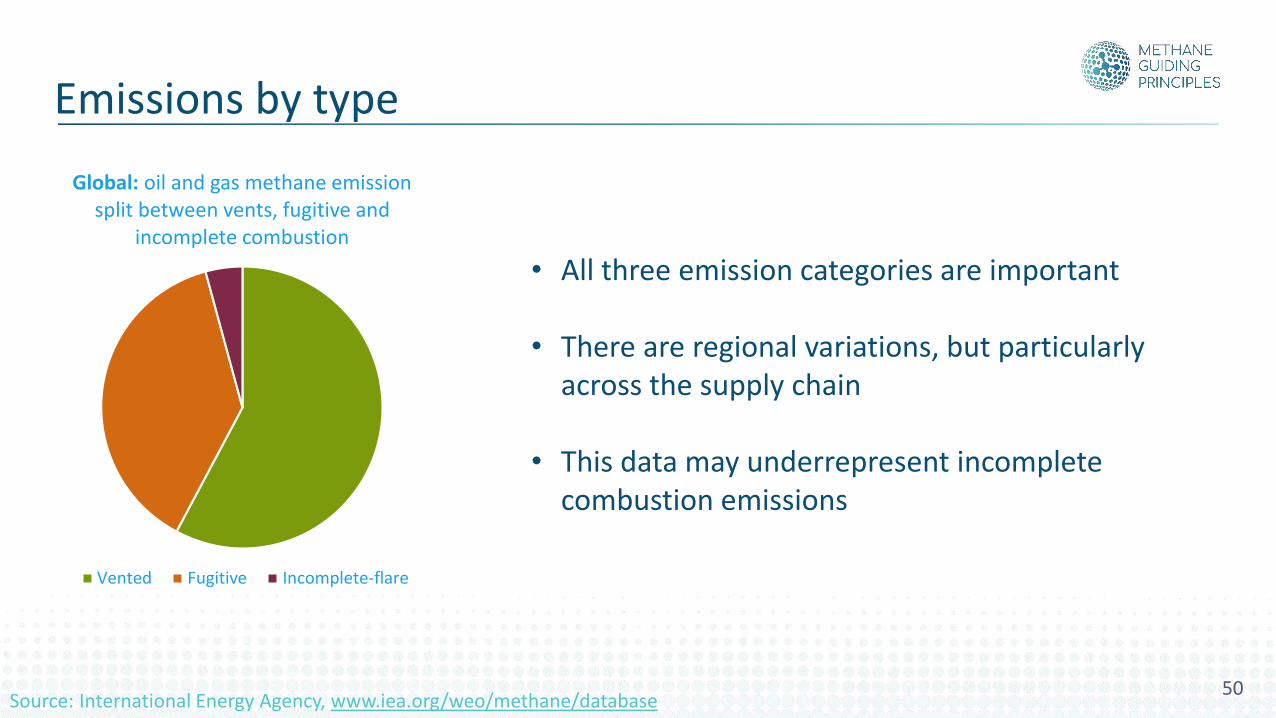
Emissions by type
Global: oil and gas methane emission split between vents, fugitive and
incomplete combustion
Vented Fugitive Incomplete-flare
Source: International Energy Agency, www.iea.org/weo/methane/database
• All three emission categories are important
• There are regional variations, but particularly across the supply chain
• This data may underrepresent incomplete combustion emissions
50
51
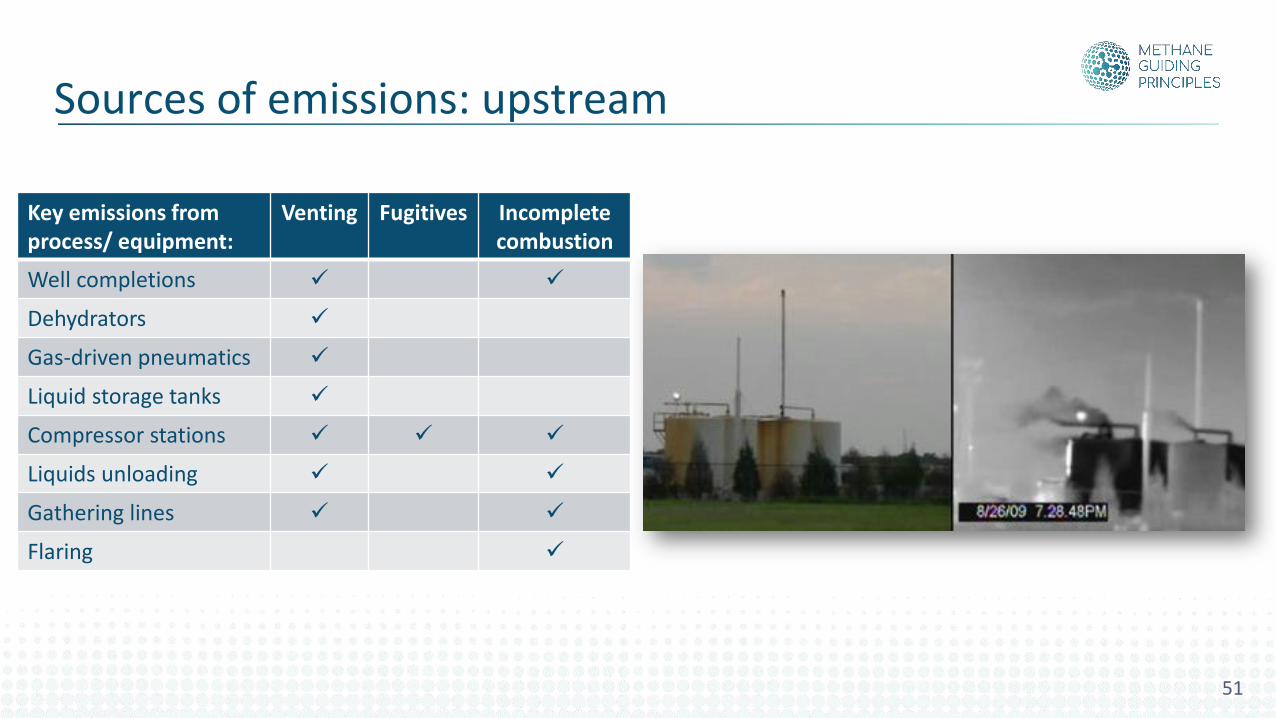
Sources of emissions: upstream
Key emissions from process/ equipment:
Venting Fugitives Incomplete combustion
Well completions ✓ ✓
Dehydrators ✓
Gas-driven pneumatics ✓
Liquid storage tanks ✓
Compressor stations ✓ ✓ ✓
Liquids unloading ✓ ✓
Gathering lines ✓ ✓
Flaring ✓
52
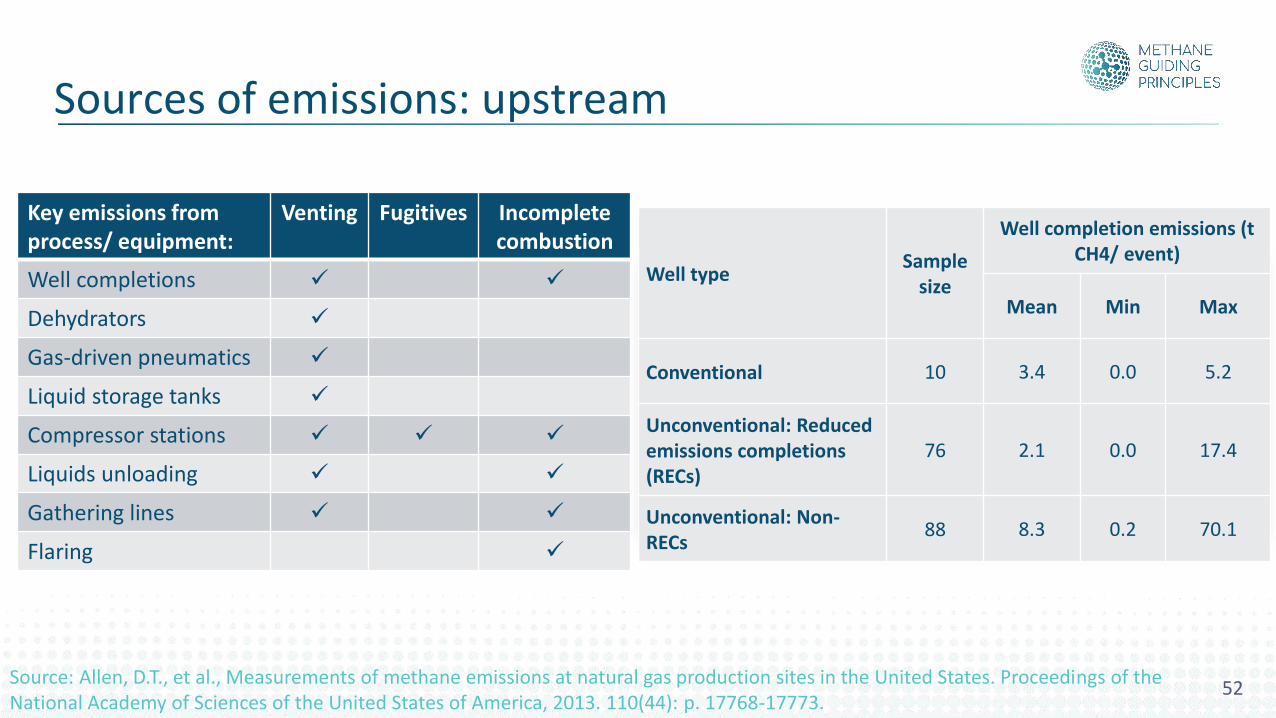
Sources of emissions: upstream
Key emissions from process/ equipment:
Venting Fugitives Incomplete combustion
Well completions ✓ ✓
Dehydrators ✓
Gas-driven pneumatics ✓
Liquid storage tanks ✓
Compressor stations ✓ ✓ ✓
Liquids unloading ✓ ✓
Gathering lines ✓ ✓
Flaring ✓
Well typeSample
size
Well completion emissions (t CH4/ event)
Mean Min Max
Conventional 10 3.4 0.0 5.2
Unconventional: Reduced emissions completions (RECs)
76 2.1 0.0 17.4
Unconventional: Non-RECs
88 8.3 0.2 70.1
Source: Allen, D.T., et al., Measurements of methane emissions at natural gas production sites in the United States. Proceedings of the National Academy of Sciences of the United States of America, 2013. 110(44): p. 17768-17773.
53
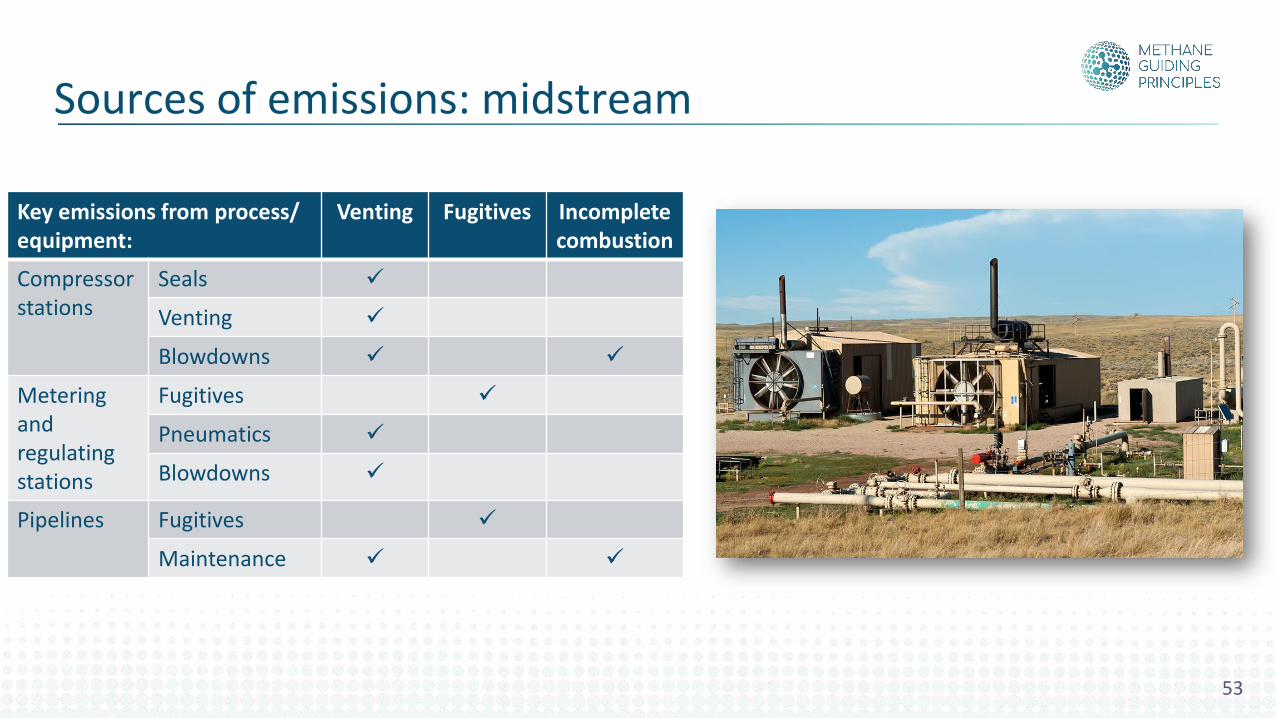
Sources of emissions: midstream
Key emissions from process/ equipment:
Venting Fugitives Incomplete combustion
Compressor stations
Seals ✓
Venting ✓
Blowdowns ✓ ✓
Metering and regulating stations
Fugitives ✓
Pneumatics ✓
Blowdowns ✓
Pipelines Fugitives ✓
Maintenance ✓ ✓
54
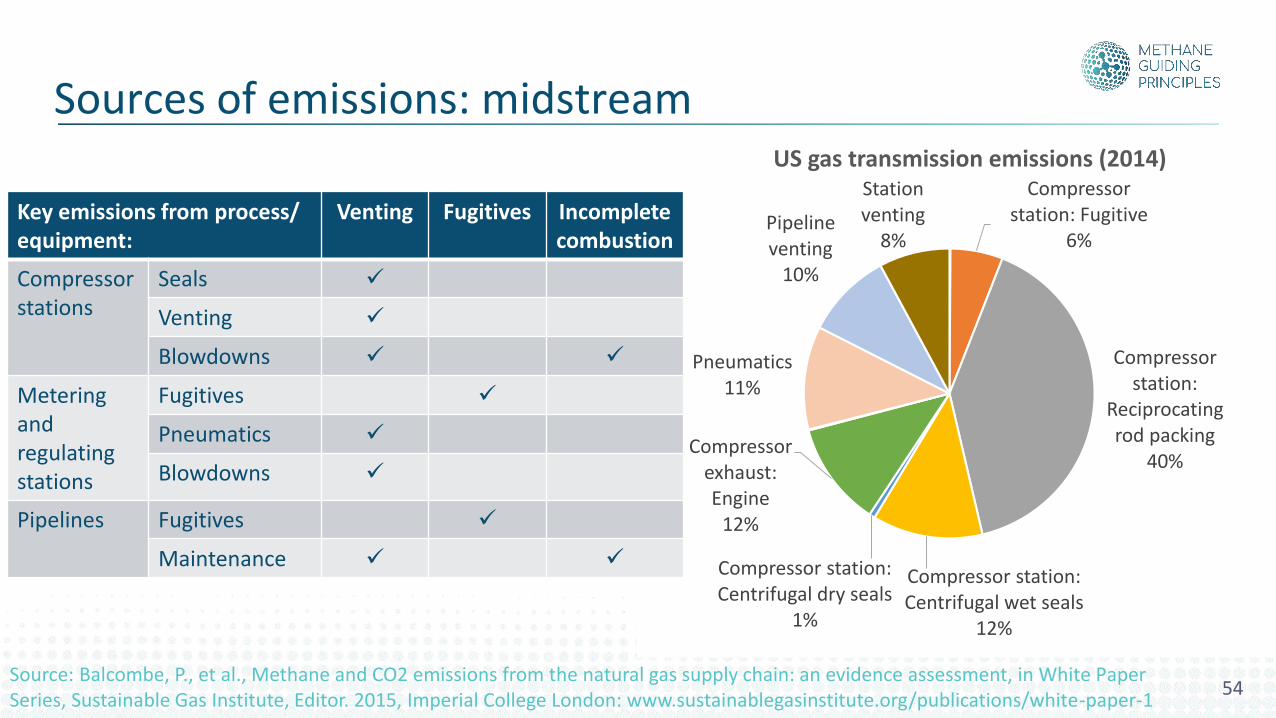
Sources of emissions: midstream
Source: Balcombe, P., et al., Methane and CO2 emissions from the natural gas supply chain: an evidence assessment, in White Paper Series, Sustainable Gas Institute, Editor. 2015, Imperial College London: www.sustainablegasinstitute.org/publications/white-paper-1
Compressor station: Fugitive
6%
Compressor station:
Reciprocating rod packing
40%
Compressor station: Centrifugal wet seals
12%
Compressor station: Centrifugal dry seals
1%
Compressor exhaust: Engine
12%
Pneumatics11%
Pipeline venting
10%
Station venting
8%
US gas transmission emissions (2014)
Key emissions from process/ equipment:
Venting Fugitives Incomplete combustion
Compressor stations
Seals ✓
Venting ✓
Blowdowns ✓ ✓
Metering and regulating stations
Fugitives ✓
Pneumatics ✓
Blowdowns ✓
Pipelines Fugitives ✓
Maintenance ✓ ✓
55
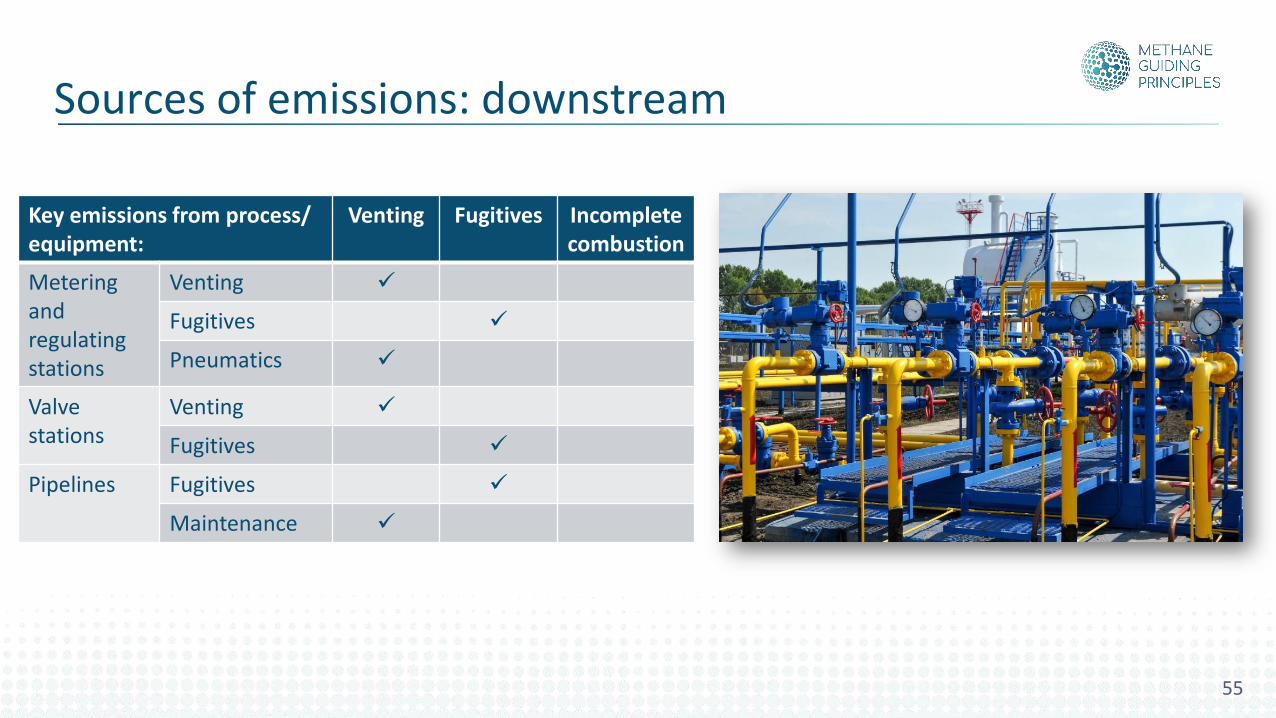
Sources of emissions: downstream
Key emissions from process/ equipment:
Venting Fugitives Incomplete combustion
Metering and regulating stations
Venting ✓
Fugitives ✓
Pneumatics ✓
Valve stations
Venting ✓
Fugitives ✓
Pipelines Fugitives ✓
Maintenance ✓
56
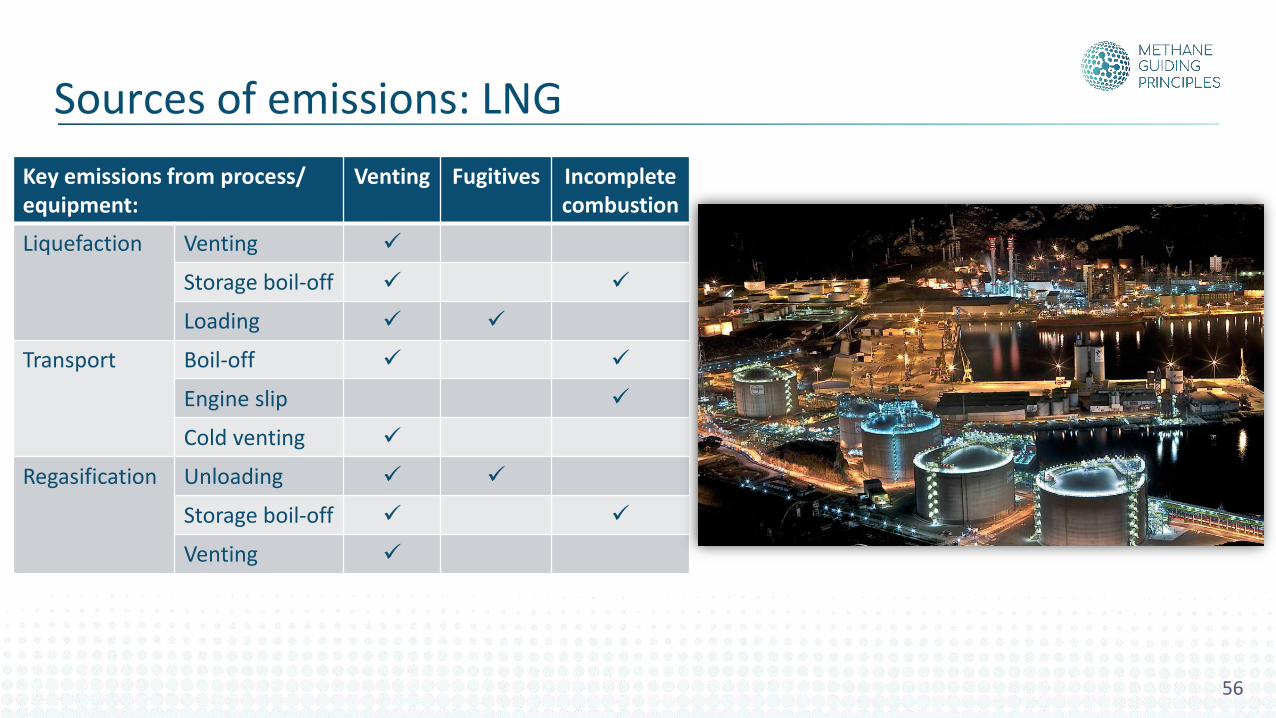
Sources of emissions: LNG
Key emissions from process/ equipment:
Venting Fugitives Incomplete combustion
Liquefaction Venting ✓
Storage boil-off ✓ ✓
Loading ✓ ✓
Transport Boil-off ✓ ✓
Engine slip ✓
Cold venting ✓
Regasification Unloading ✓ ✓
Storage boil-off ✓ ✓
Venting ✓
57
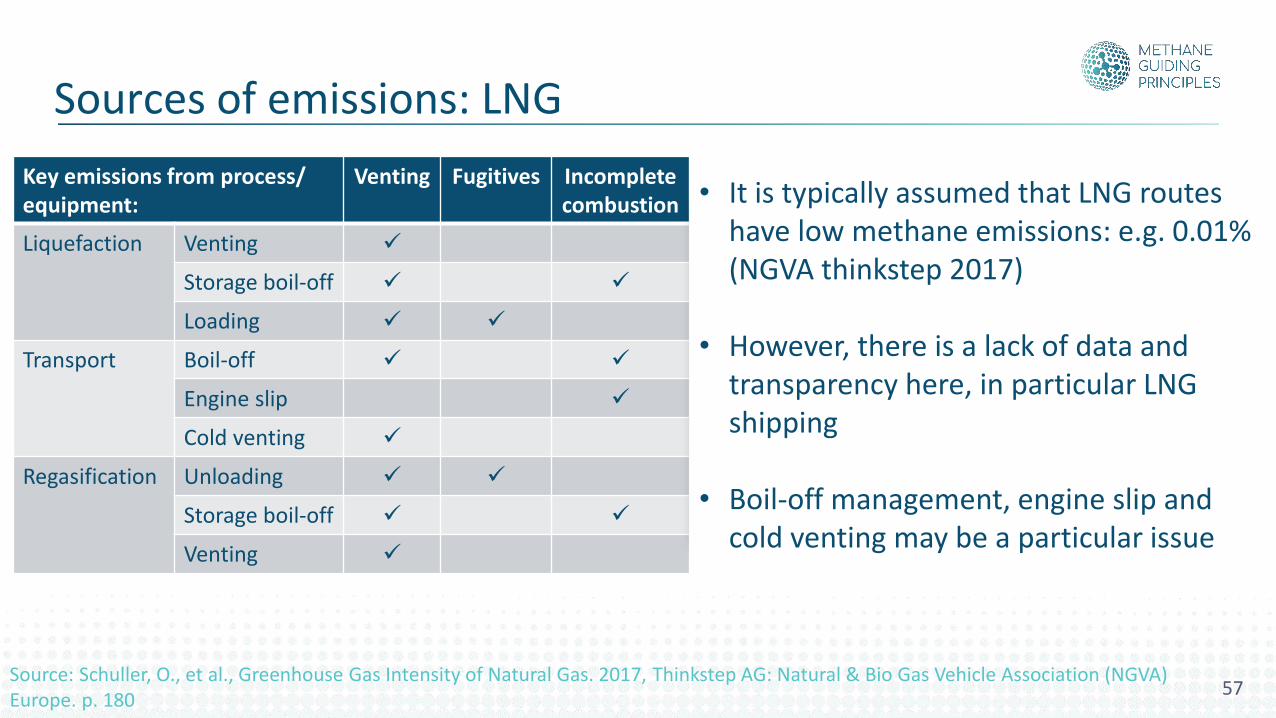
Sources of emissions: LNG
Key emissions from process/ equipment:
Venting Fugitives Incomplete combustion
Liquefaction Venting ✓
Storage boil-off ✓ ✓
Loading ✓ ✓
Transport Boil-off ✓ ✓
Engine slip ✓
Cold venting ✓
Regasification Unloading ✓ ✓
Storage boil-off ✓ ✓
Venting ✓
• It is typically assumed that LNG routes have low methane emissions: e.g. 0.01% (NGVA thinkstep 2017)
• However, there is a lack of data and transparency here, in particular LNG shipping
• Boil-off management, engine slip and cold venting may be a particular issue
Source: Schuller, O., et al., Greenhouse Gas Intensity of Natural Gas. 2017, Thinkstep AG: Natural & Bio Gas Vehicle Association (NGVA) Europe. p. 180
Understanding methane emissions
Understanding methane emissions1. Sources of emissions from the oil and gas supply chain
2. The distribution: heavy tails and super-emitters
3. Estimation methods
58
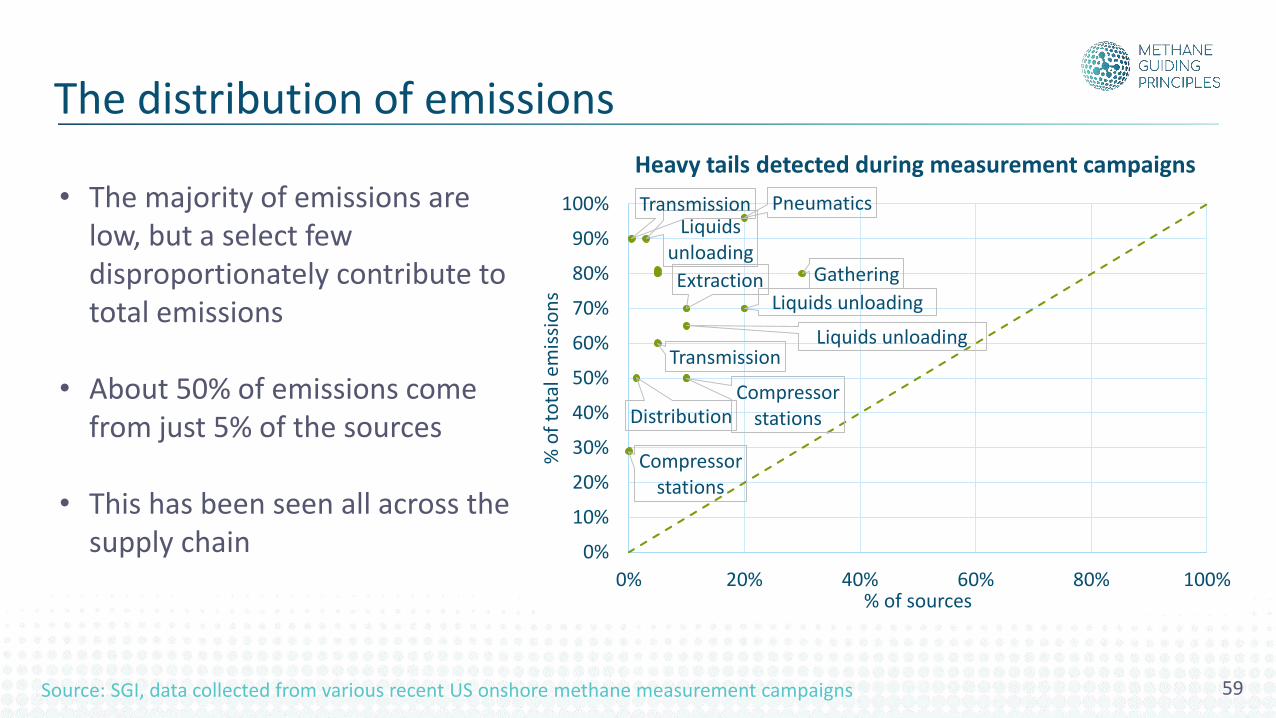
• The majority of emissions are low, but a select few disproportionately contribute to total emissions
• About 50% of emissions come from just 5% of the sources
• This has been seen all across the supply chain
Source: SGI, data collected from various recent US onshore methane measurement campaigns 59
The distribution of emissions
Gathering
Liquids unloading
Pneumatics
Extraction
Liquids unloading
Compressor stations
Liquids unloading
Distribution
Transmission
Compressor stations
Transmission
0%
10%
20%
30%
40%
50%
60%
70%
80%
90%
100%
0% 20% 40% 60% 80% 100%
% o
f to
tal e
mis
sio
ns
% of sources
Heavy tails detected during measurement campaigns
Where are the super emitters?
• Disproportionately large emitters have been identified everywhere they have been looked for, across all supply chain stages, regions, and processes
• Some key super emitters have been identified in these processes/equipment:
➢ well completions
➢ liquids unloading
➢ pneumatics
➢ liquid storage tanks
➢ compressor stations
➢ distribution pipeline
• One example: liquids unloading from Allen et al. 2015…
60
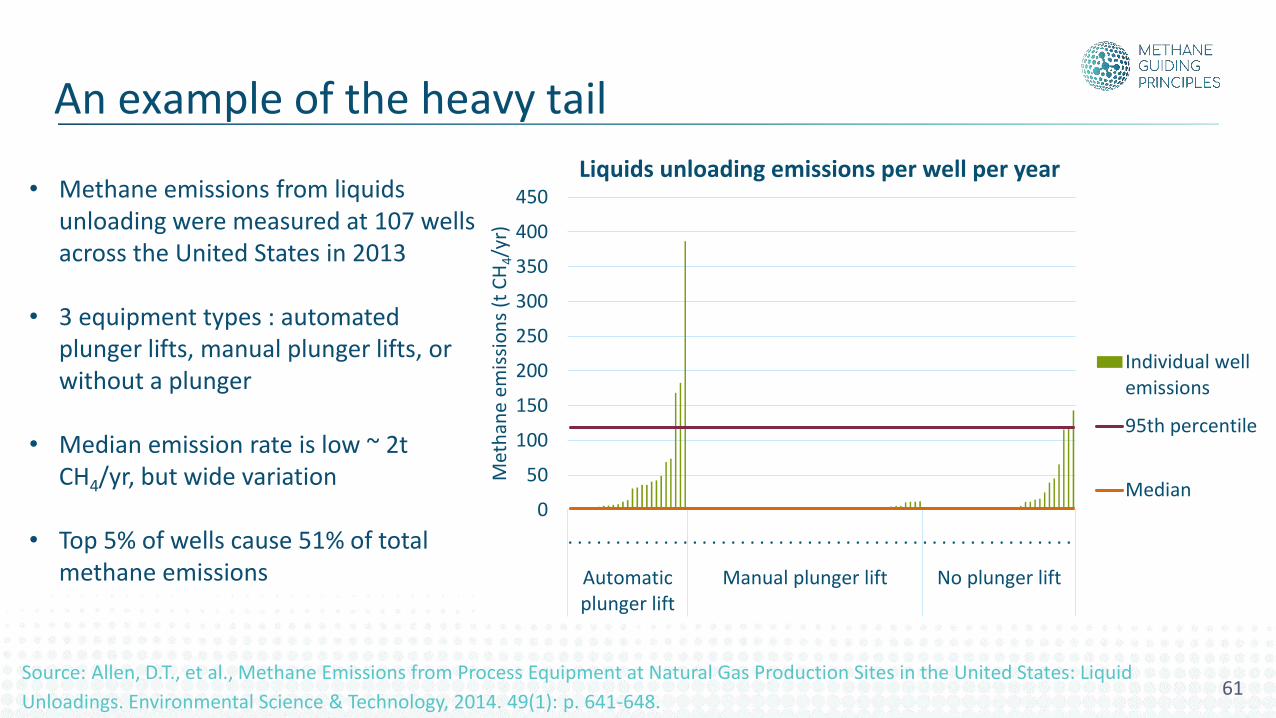
• Methane emissions from liquids unloading were measured at 107 wells across the United States in 2013
• 3 equipment types : automated plunger lifts, manual plunger lifts, or without a plunger
• Median emission rate is low ~ 2t CH4/yr, but wide variation
• Top 5% of wells cause 51% of total methane emissions
0
50
100
150
200
250
300
350
400
450
. . . . . . . . . . . . . . . . . . . . . . . . . . . . . . . . . . . . . . . . . . . . . . . . . . . . .
Automaticplunger lift
Manual plunger lift No plunger lift
Met
han
e em
issi
on
s (t
CH
4/y
r)
Liquids unloading emissions per well per year
Individual wellemissions
95th percentile
Median
Source: Allen, D.T., et al., Methane Emissions from Process Equipment at Natural Gas Production Sites in the United States: Liquid
Unloadings. Environmental Science & Technology, 2014. 49(1): p. 641-648.
An example of the heavy tail
61
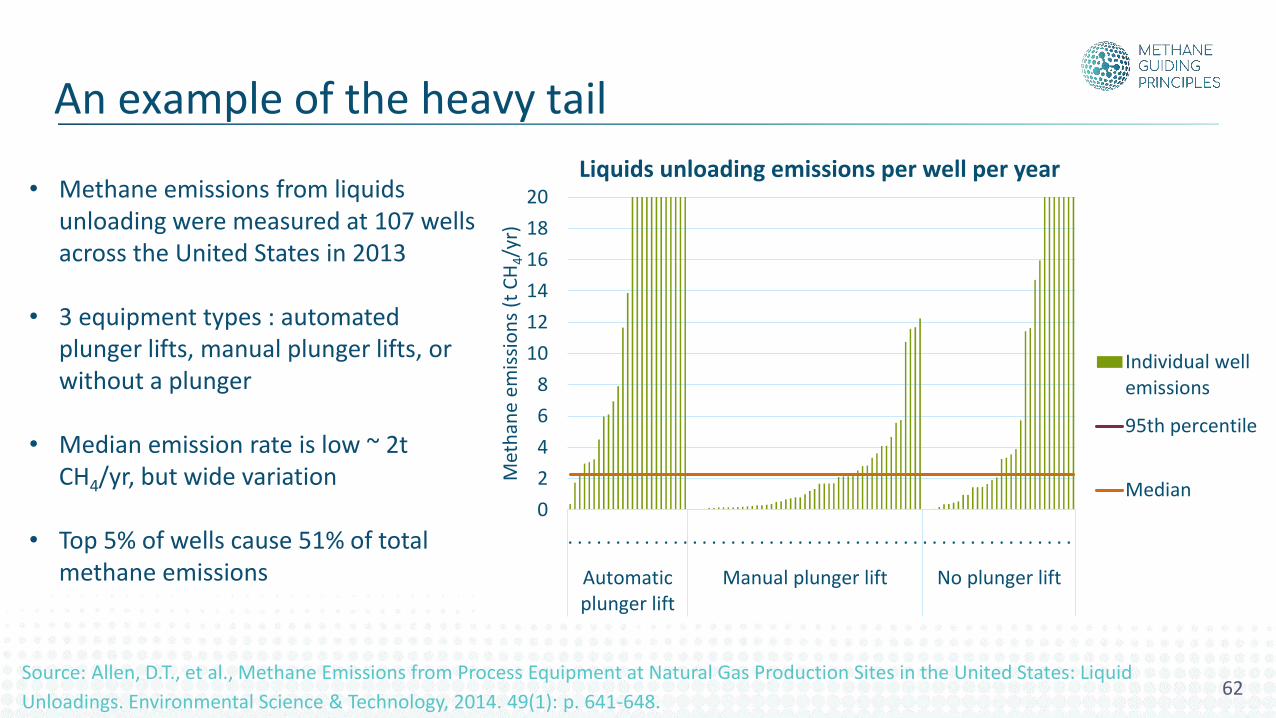
• Methane emissions from liquids unloading were measured at 107 wells across the United States in 2013
• 3 equipment types : automated plunger lifts, manual plunger lifts, or without a plunger
• Median emission rate is low ~ 2t CH4/yr, but wide variation
• Top 5% of wells cause 51% of total methane emissions
Source: Allen, D.T., et al., Methane Emissions from Process Equipment at Natural Gas Production Sites in the United States: Liquid
Unloadings. Environmental Science & Technology, 2014. 49(1): p. 641-648.
An example of the heavy tail
62
0
2
4
6
8
10
12
14
16
18
20
. . . . . . . . . . . . . . . . . . . . . . . . . . . . . . . . . . . . . . . . . . . . . . . . . . . . .
Automaticplunger lift
Manual plunger lift No plunger lift
Met
han
e em
issi
on
s (t
CH
4/y
r)
Liquids unloading emissions per well per year
Individual wellemissions
95th percentile
Median
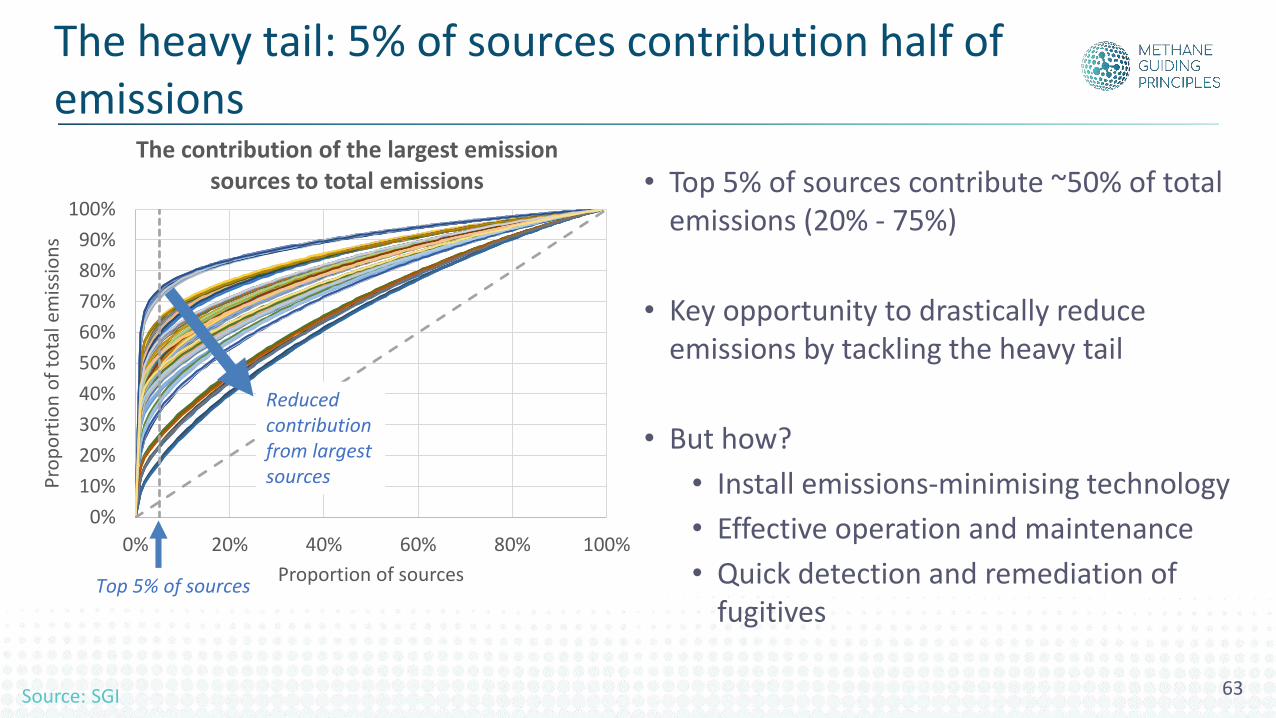
• Top 5% of sources contribute ~50% of total emissions (20% - 75%)
• Key opportunity to drastically reduce emissions by tackling the heavy tail
• But how?
• Install emissions-minimising technology
• Effective operation and maintenance
• Quick detection and remediation of fugitives
Source: SGI 63
The heavy tail: 5% of sources contribution half of emissions
0%
10%
20%
30%
40%
50%
60%
70%
80%
90%
100%
0% 20% 40% 60% 80% 100%
Pro
po
rtio
n o
f to
tal e
mis
sio
ns
Proportion of sources
The contribution of the largest emission sources to total emissions
Reduced contribution from largest sources
Top 5% of sources
Understanding methane emissions
Understanding methane emissions1. Sources of emissions from the oil and gas supply chain
2. The distribution: heavy tails and super-emitters
3. Estimation methods
64
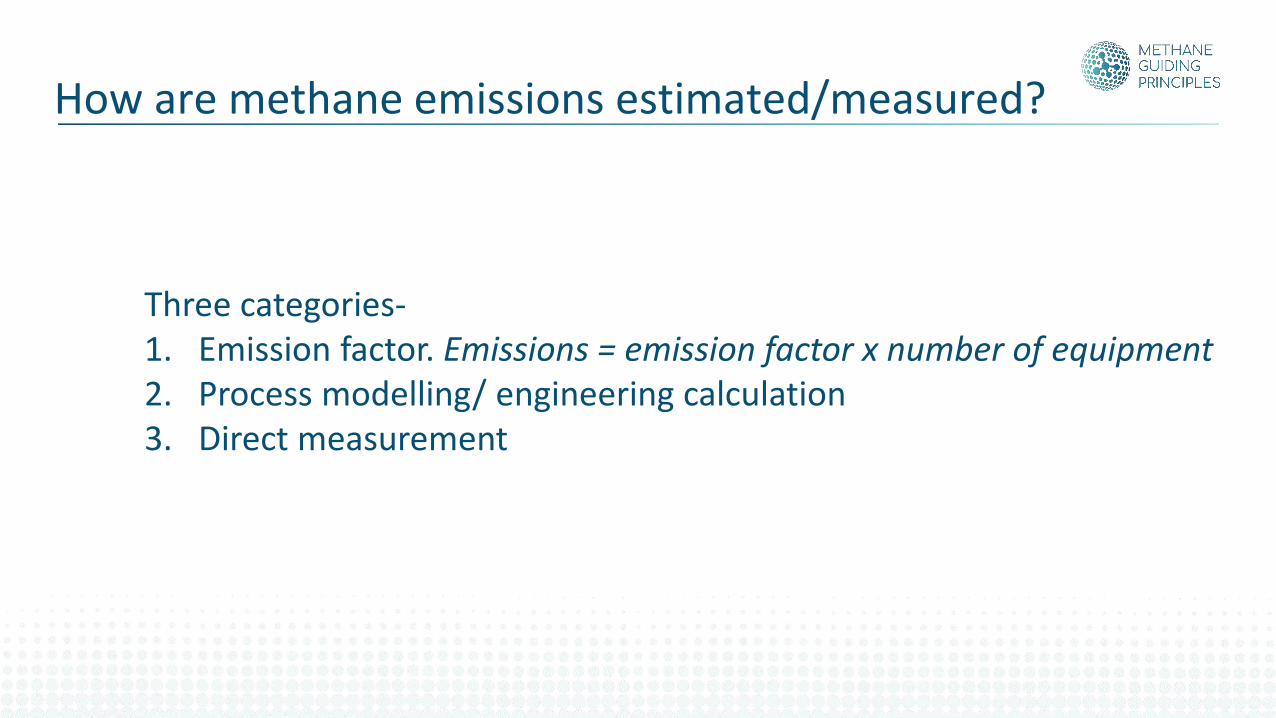
How are methane emissions estimated/measured?
Three categories-1. Emission factor. Emissions = emission factor x number of equipment2. Process modelling/ engineering calculation3. Direct measurement
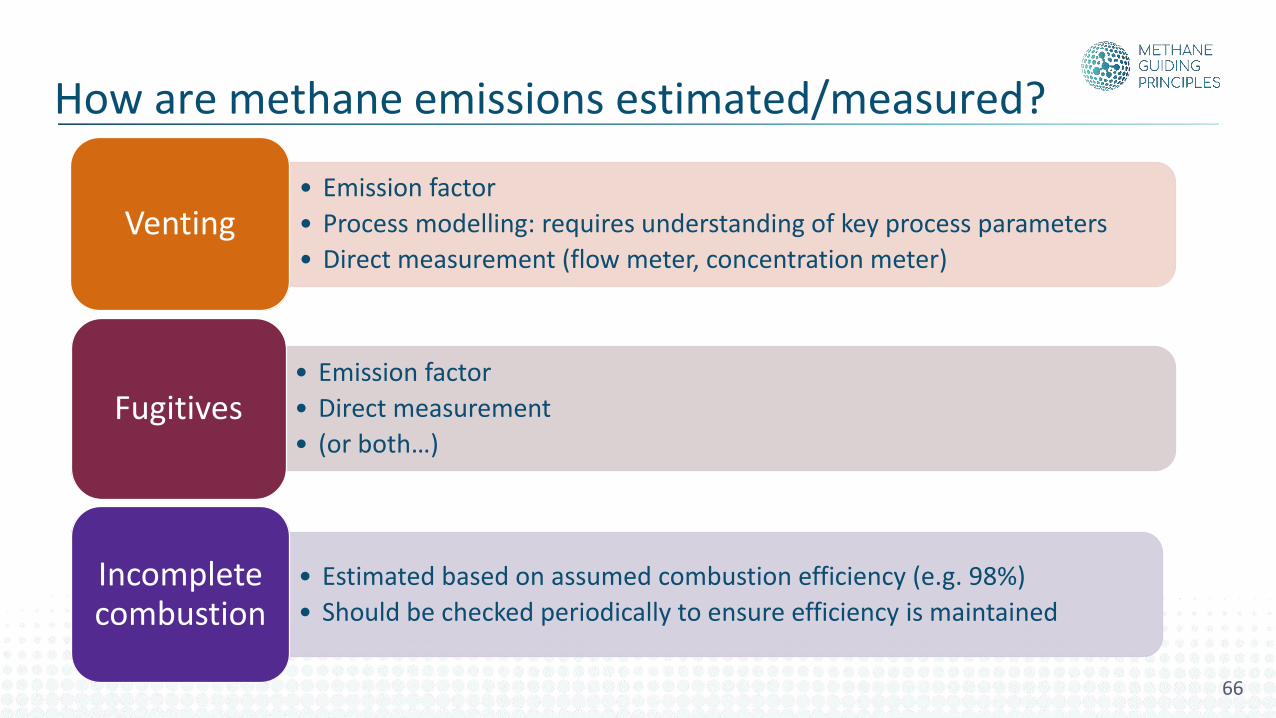
How are methane emissions estimated/measured?
• Emission factor
• Process modelling: requires understanding of key process parameters
• Direct measurement (flow meter, concentration meter)Venting
• Emission factor
• Direct measurement
• (or both…)Fugitives
• Estimated based on assumed combustion efficiency (e.g. 98%)
• Should be checked periodically to ensure efficiency is maintained
Incomplete combustion
66
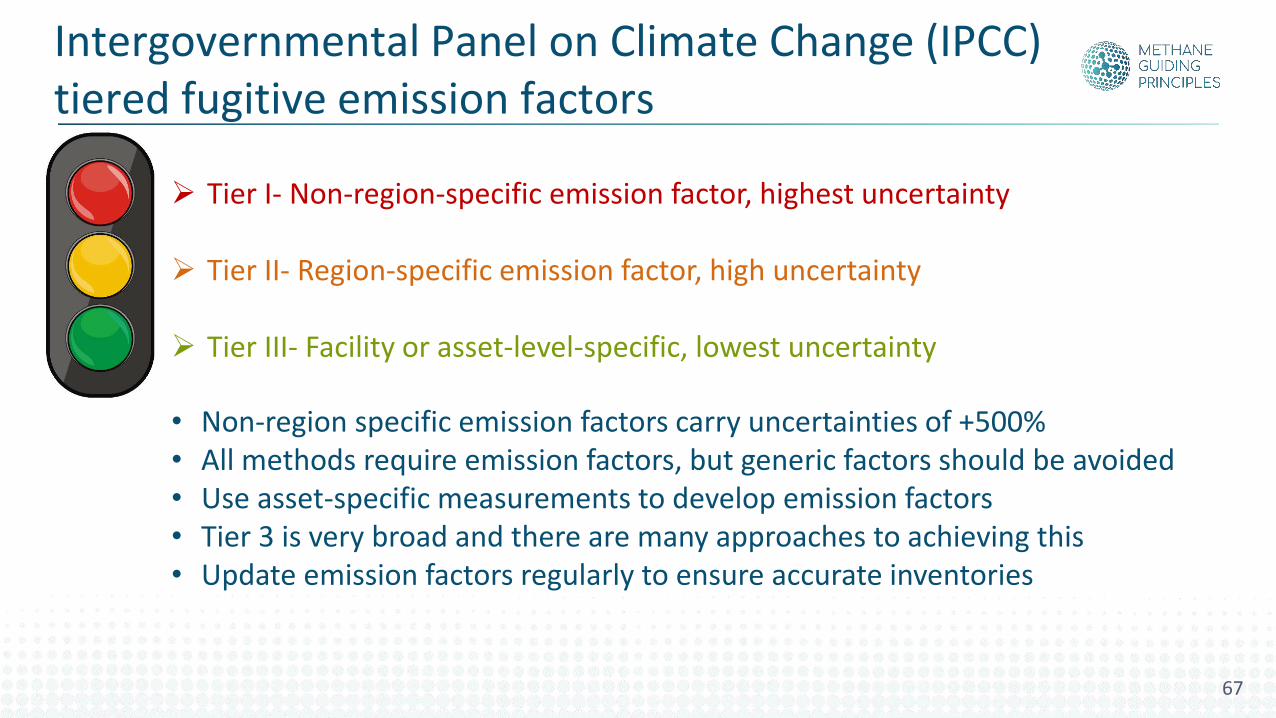
➢ Tier I- Non-region-specific emission factor, highest uncertainty
➢ Tier II- Region-specific emission factor, high uncertainty
➢ Tier III- Facility or asset-level-specific, lowest uncertainty
67
Intergovernmental Panel on Climate Change (IPCC) tiered fugitive emission factors
• Non-region specific emission factors carry uncertainties of +500%• All methods require emission factors, but generic factors should be avoided• Use asset-specific measurements to develop emission factors• Tier 3 is very broad and there are many approaches to achieving this • Update emission factors regularly to ensure accurate inventories
0
200
400
600
800
1000
1200
1400
1600
1 2 3 4 5 6 7 8 9 10 11 12 13 14 15 16 17
Co
mp
ress
or
stat
ion
met
han
e em
issi
on
s (t
CH
4/y
r)
Anonymised compressor stations
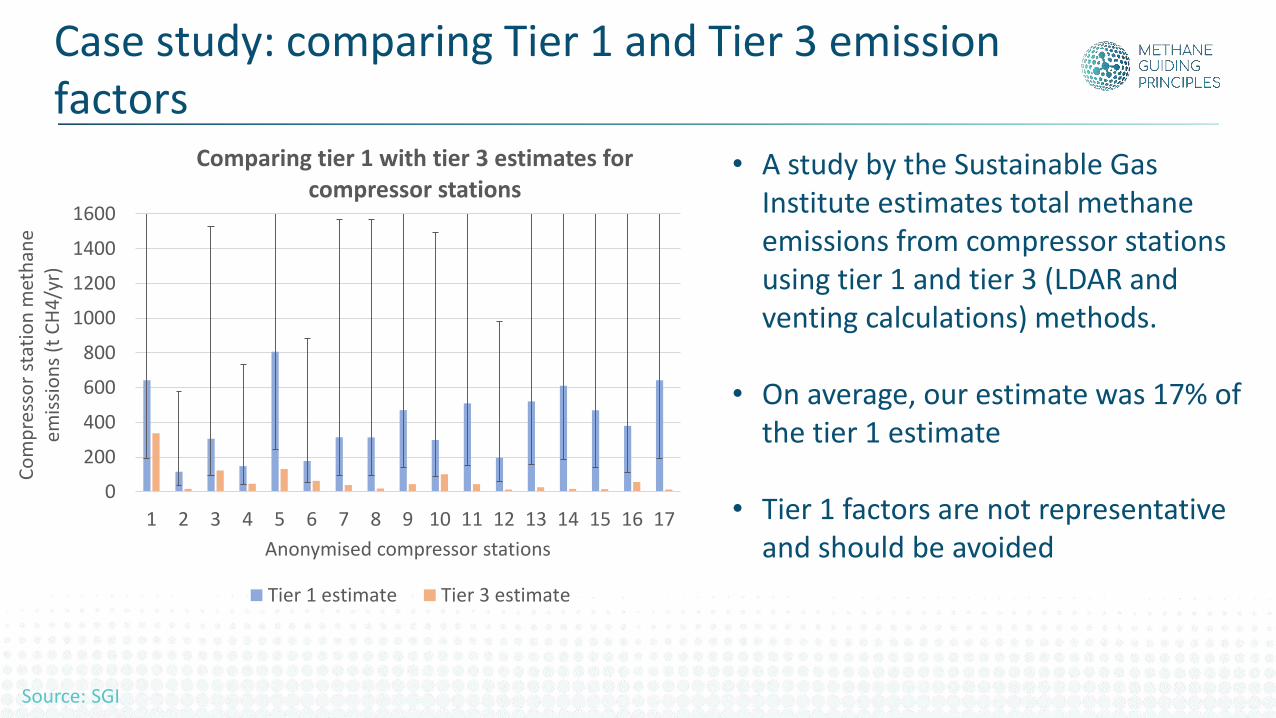
Comparing tier 1 with tier 3 estimates for compressor stations
Tier 1 estimate Tier 3 estimate
Case study: comparing Tier 1 and Tier 3 emission factors
• A study by the Sustainable Gas Institute estimates total methane emissions from compressor stations using tier 1 and tier 3 (LDAR and venting calculations) methods.
• On average, our estimate was 17% of the tier 1 estimate
• Tier 1 factors are not representative and should be avoided
Source: SGI
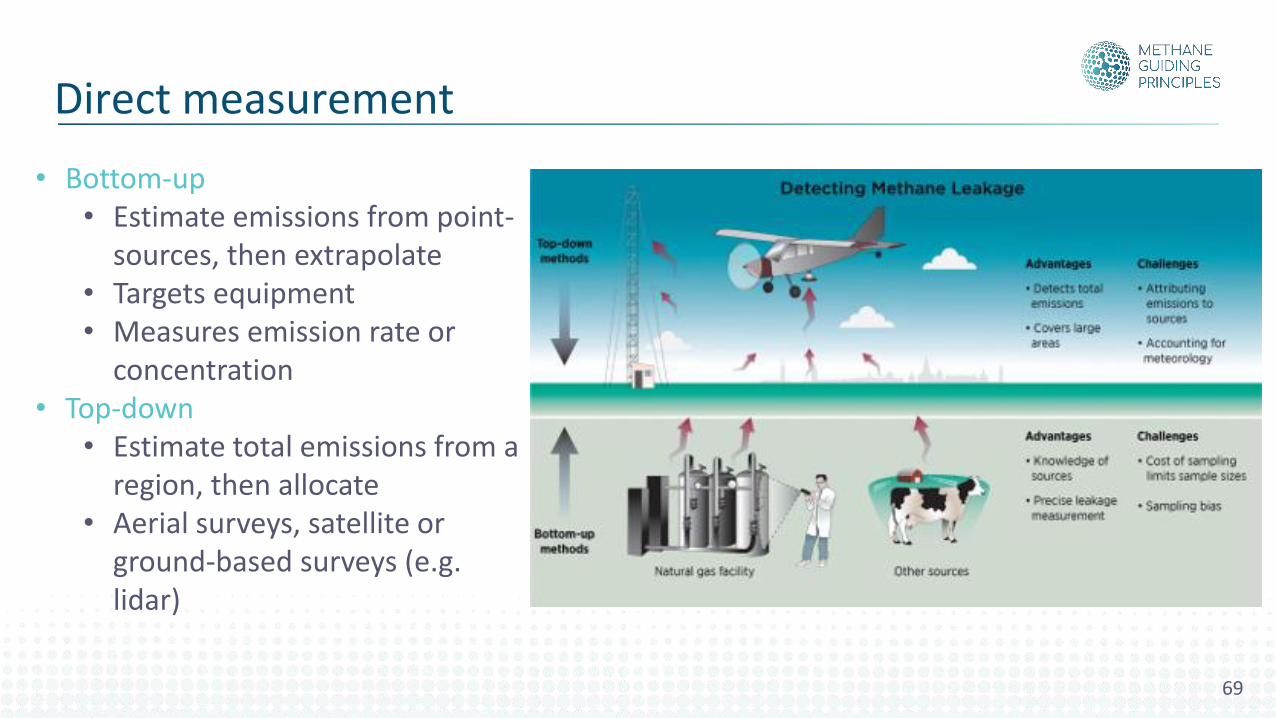
• Bottom-up• Estimate emissions from point-
sources, then extrapolate• Targets equipment• Measures emission rate or
concentration• Top-down
• Estimate total emissions from a region, then allocate
• Aerial surveys, satellite or ground-based surveys (e.g. lidar)
69
Direct measurement
Top-down:• Uncertainty in allocation of emissions• Equipment expense
Bottom-up: • High uncertainty in extrapolating• Less able to ensure heavy tail is accounted for• Labour-intensive
➢ Mixed-methods help improve both methods and reconcile differences➢ Most methods are periodic, not continuous➢ Future challenge: develop cost-effective frequent/continuous
monitoring to quickly identify super-emitters
70
Estimation methods: top-down vs. bottom-up
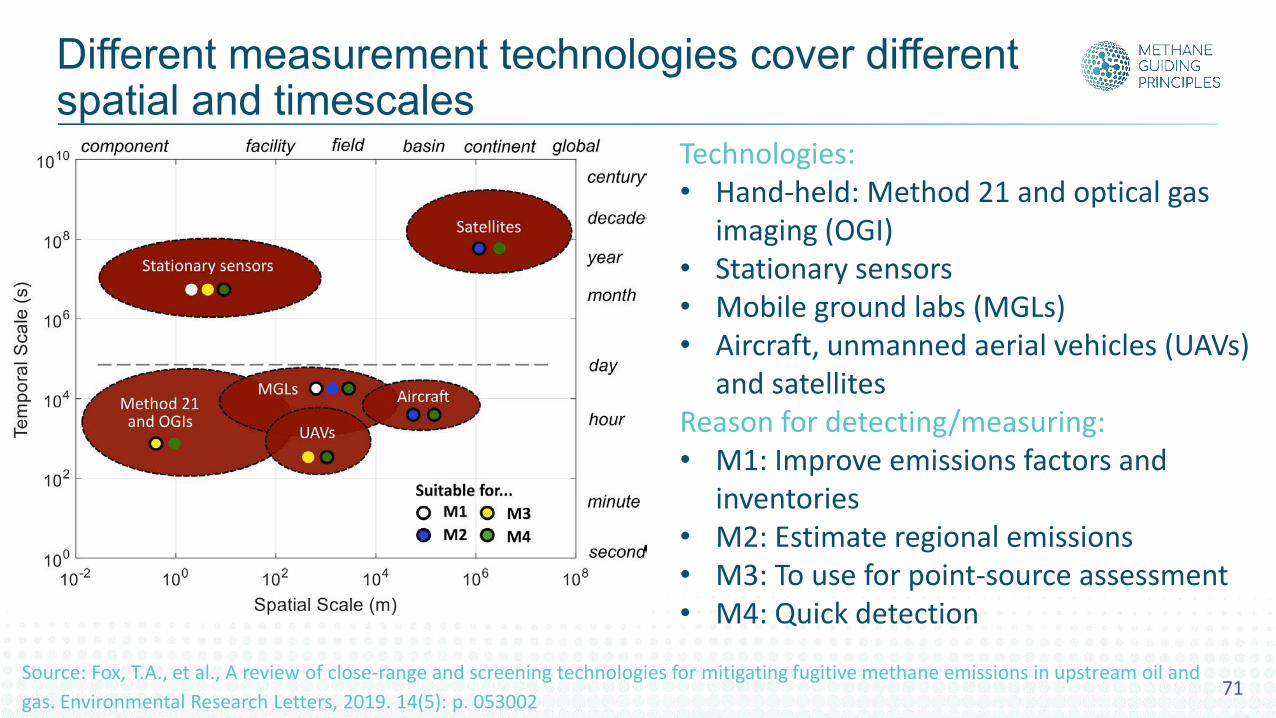
Different measurement technologies cover different spatial and timescales
Source: Fox, T.A., et al., A review of close-range and screening technologies for mitigating fugitive methane emissions in upstream oil and
gas. Environmental Research Letters, 2019. 14(5): p. 053002
Technologies:• Hand-held: Method 21 and optical gas
imaging (OGI)• Stationary sensors• Mobile ground labs (MGLs)• Aircraft, unmanned aerial vehicles (UAVs)
and satellitesReason for detecting/measuring:• M1: Improve emissions factors and
inventories• M2: Estimate regional emissions• M3: To use for point-source assessment• M4: Quick detection
71
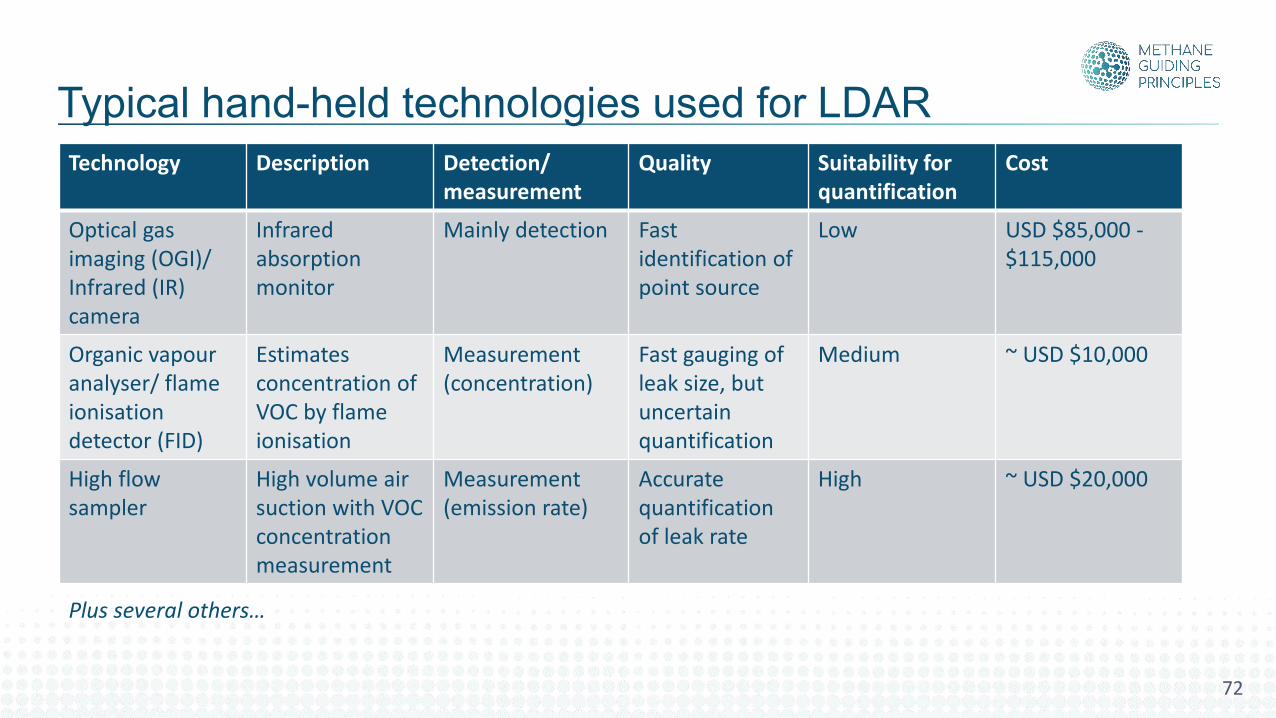
Typical hand-held technologies used for LDARTechnology Description Detection/
measurementQuality Suitability for
quantificationCost
Optical gas imaging (OGI)/ Infrared (IR) camera
Infrared absorption monitor
Mainly detection Fast identification of point source
Low USD $85,000 -$115,000
Organic vapour analyser/ flame ionisation detector (FID)
Estimates concentration of VOC by flame ionisation
Measurement (concentration)
Fast gauging of leak size, but uncertain quantification
Medium ~ USD $10,000
High flow sampler
High volume air suction with VOC concentration measurement
Measurement (emission rate)
Accurate quantification of leak rate
High ~ USD $20,000
Plus several others…
72
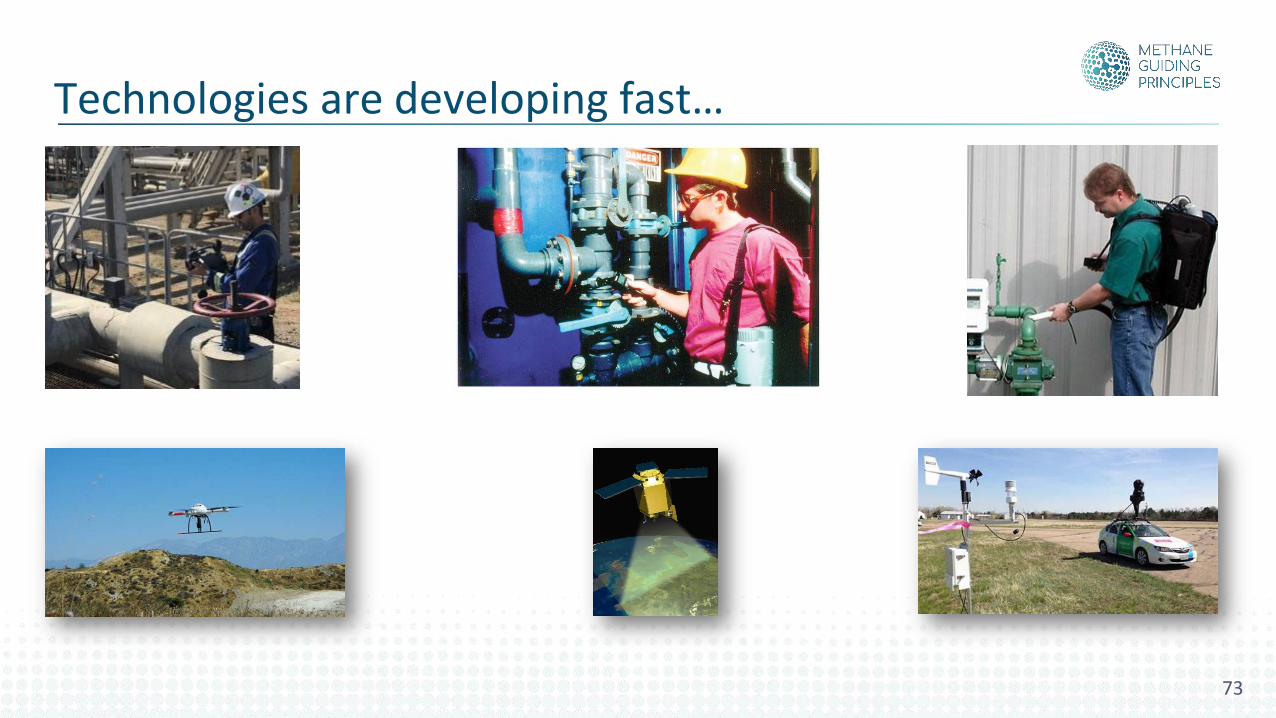
Technologies are developing fast…
73
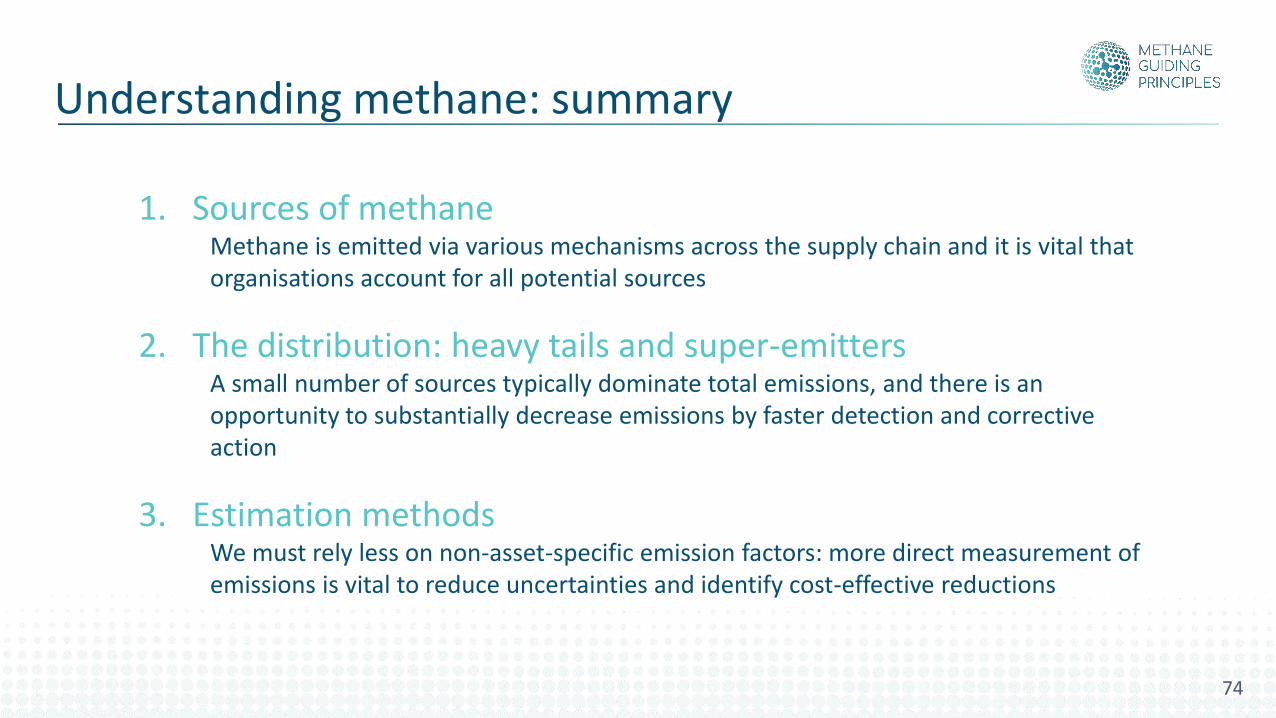
1. Sources of methaneMethane is emitted via various mechanisms across the supply chain and it is vital that organisations account for all potential sources
2. The distribution: heavy tails and super-emittersA small number of sources typically dominate total emissions, and there is an opportunity to substantially decrease emissions by faster detection and corrective action
3. Estimation methodsWe must rely less on non-asset-specific emission factors: more direct measurement of emissions is vital to reduce uncertainties and identify cost-effective reductions
74
Understanding methane: summary
What are the largest sources of methane emissions?
Activity• On your own device, please go to www.socrative.com• Go to login, then ‘student login’• Type in the Room Name: MGPMASTERCLASS
How does this map on to your organisation?
Activity• On your own device, please go to www.socrative.com• Go to login, then ‘student login’• Type in the Room Name: MGPMASTERCLASS
Reflection point
Every organisation and asset is different. In your asset, do you know your top 3 sources?
How do you measure/estimate them and what are the challenges there?

Outreach programme
Reducing methane emissions: Best Practices
• The Outreach Programme until now has focused on background and understanding of methane emissions and why they occur
• From now, the focus shifts to action and tools to use to direct effective methane reductions
• Here we introduce the Reducing Methane Emission Best Practice Guides, supplementing with real-world case studies of best practice implementation, as well as some tools to help assess your methane management plan and cost-effective mitigation options
It is time to act
80
Reducing Methane Emissions Best Practices
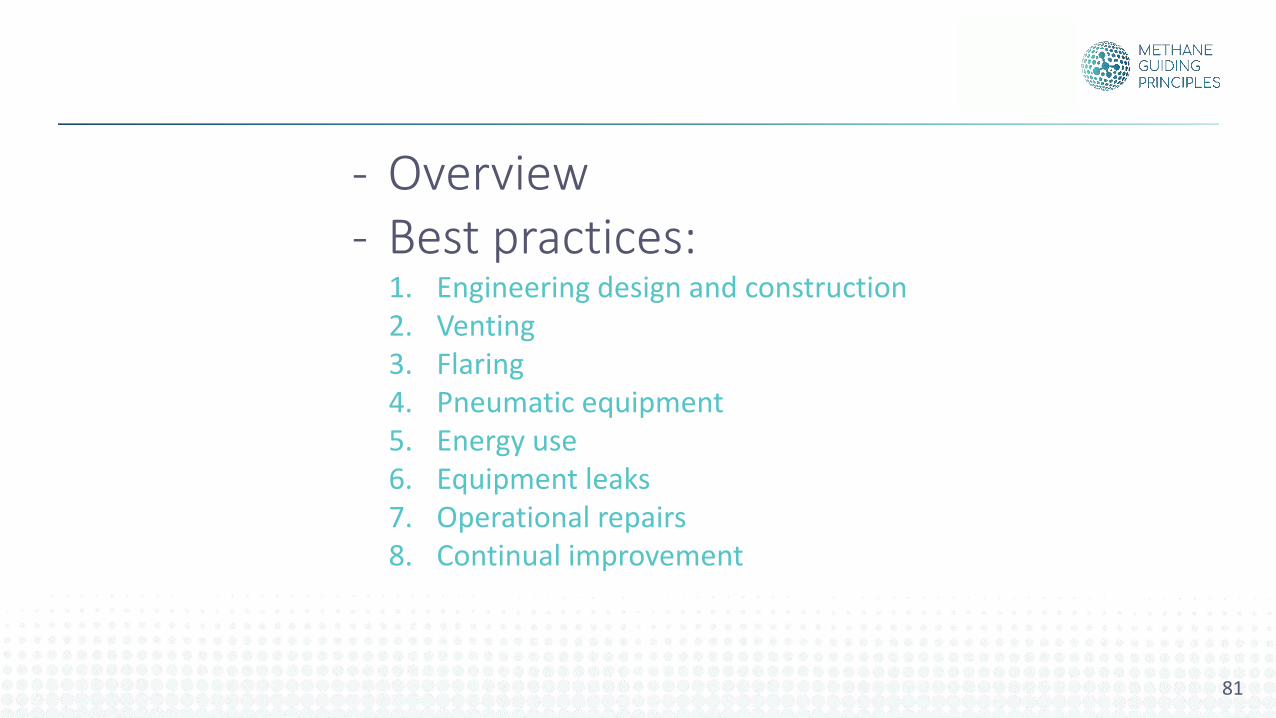
- Overview- Best practices:
1. Engineering design and construction2. Venting3. Flaring4. Pneumatic equipment5. Energy use6. Equipment leaks7. Operational repairs8. Continual improvement
81
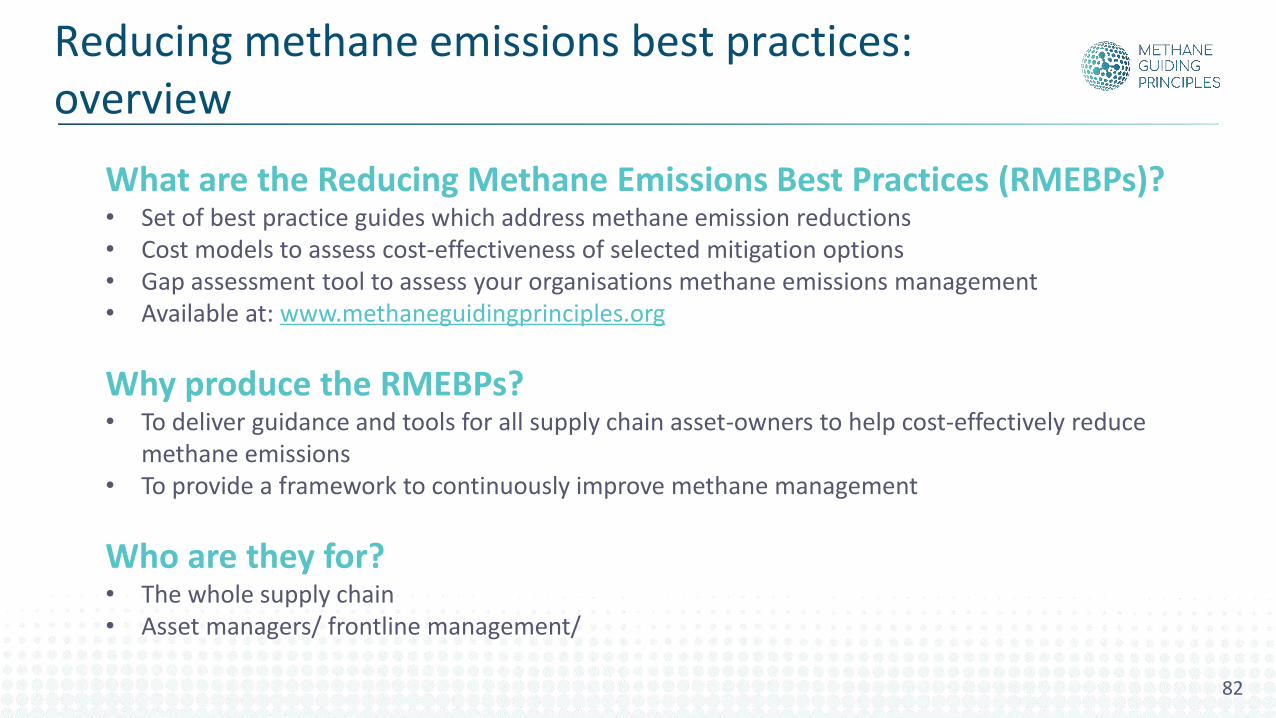
What are the Reducing Methane Emissions Best Practices (RMEBPs)?• Set of best practice guides which address methane emission reductions• Cost models to assess cost-effectiveness of selected mitigation options• Gap assessment tool to assess your organisations methane emissions management• Available at: www.methaneguidingprinciples.org
Why produce the RMEBPs?• To deliver guidance and tools for all supply chain asset-owners to help cost-effectively reduce
methane emissions• To provide a framework to continuously improve methane management
Who are they for?• The whole supply chain• Asset managers/ frontline management/
Reducing methane emissions best practices: overview
82
Best Practices Guide
SOURCES
Pn
eu
mat
ics/
co
ntr
ols
Tan
ks
Pip
elin
es
Co
mp
ress
ors
/ En
gin
es
Wel
ls
Equ
ipm
en
t Le
aks
Gly
col
Deh
ydra
tors
Mai
nte
nan
ce
Even
ts
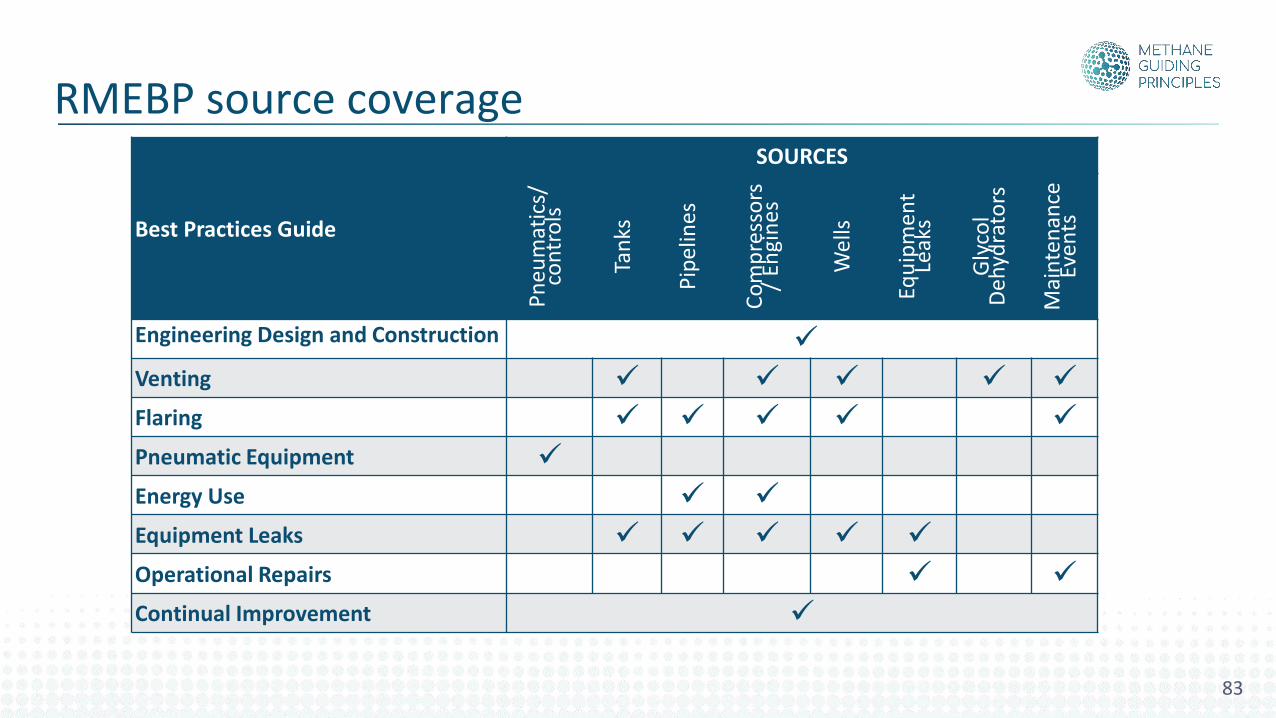
Engineering Design and Construction ✓
Venting ✓ ✓ ✓ ✓ ✓
Flaring ✓ ✓ ✓ ✓ ✓
Pneumatic Equipment ✓
Energy Use ✓ ✓
Equipment Leaks ✓ ✓ ✓ ✓ ✓
Operational Repairs ✓ ✓
Continual Improvement ✓
RMEBP source coverage
83

Reducing Methane Emissions Best Practices
Best practices:1. Venting2. Pneumatic equipment3. Flaring4. Equipment leaks5. Operational repairs6. Energy use7. Engineering design and construction8. Continual improvement
84
Reducing Methane Emissions Best Practices
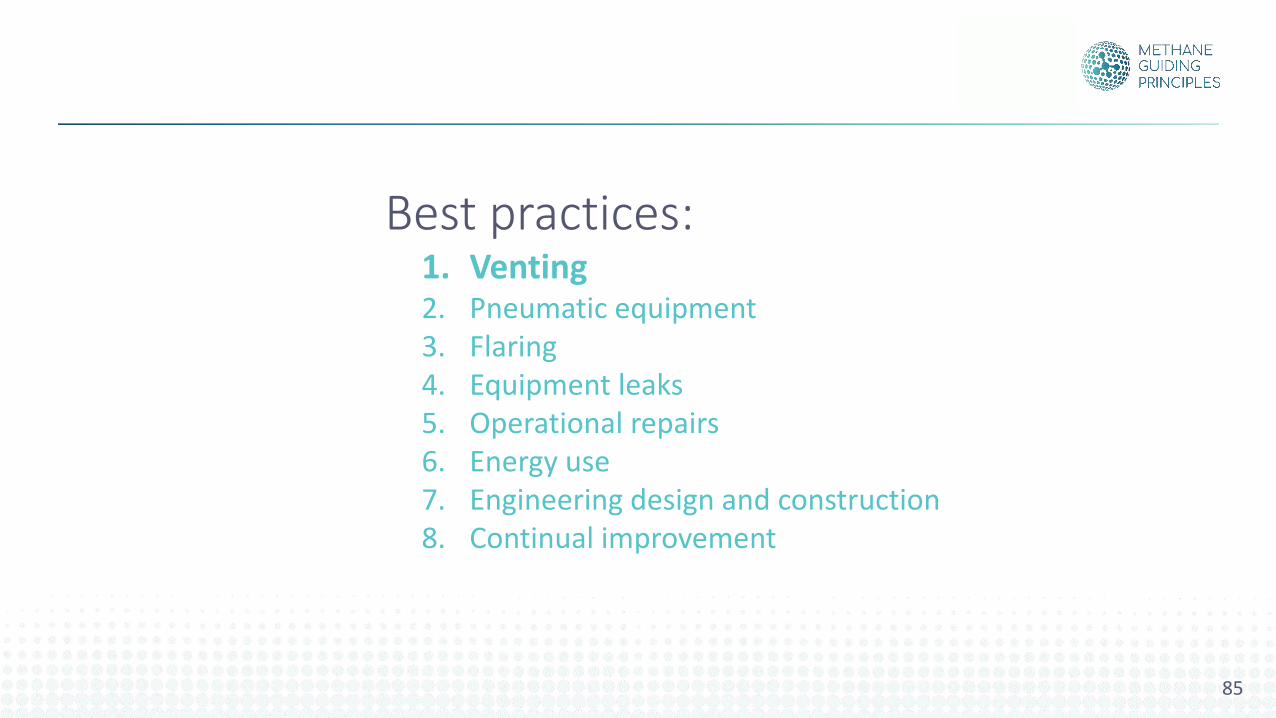
Best practices:1. Venting2. Pneumatic equipment3. Flaring4. Equipment leaks5. Operational repairs6. Energy use7. Engineering design and construction8. Continual improvement
85
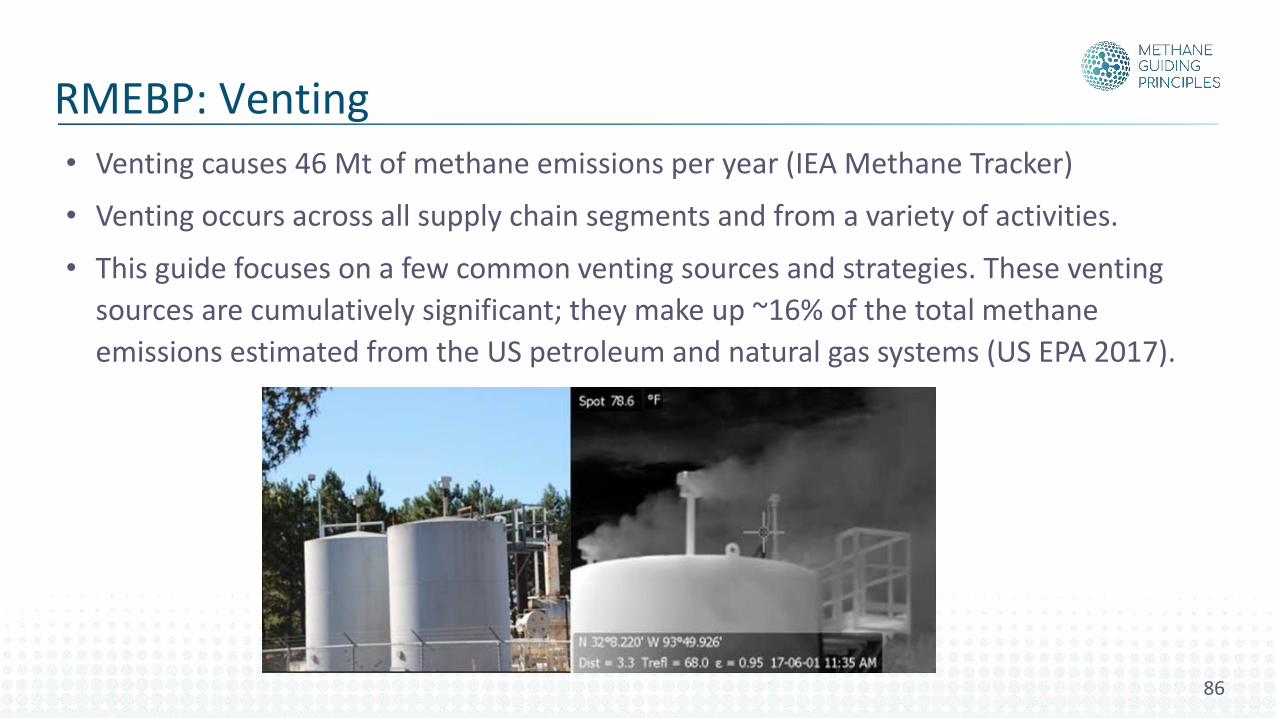
• Venting causes 46 Mt of methane emissions per year (IEA Methane Tracker)
• Venting occurs across all supply chain segments and from a variety of activities.
• This guide focuses on a few common venting sources and strategies. These venting
sources are cumulatively significant; they make up ~16% of the total methane
emissions estimated from the US petroleum and natural gas systems (US EPA 2017).
RMEBP: Venting
86
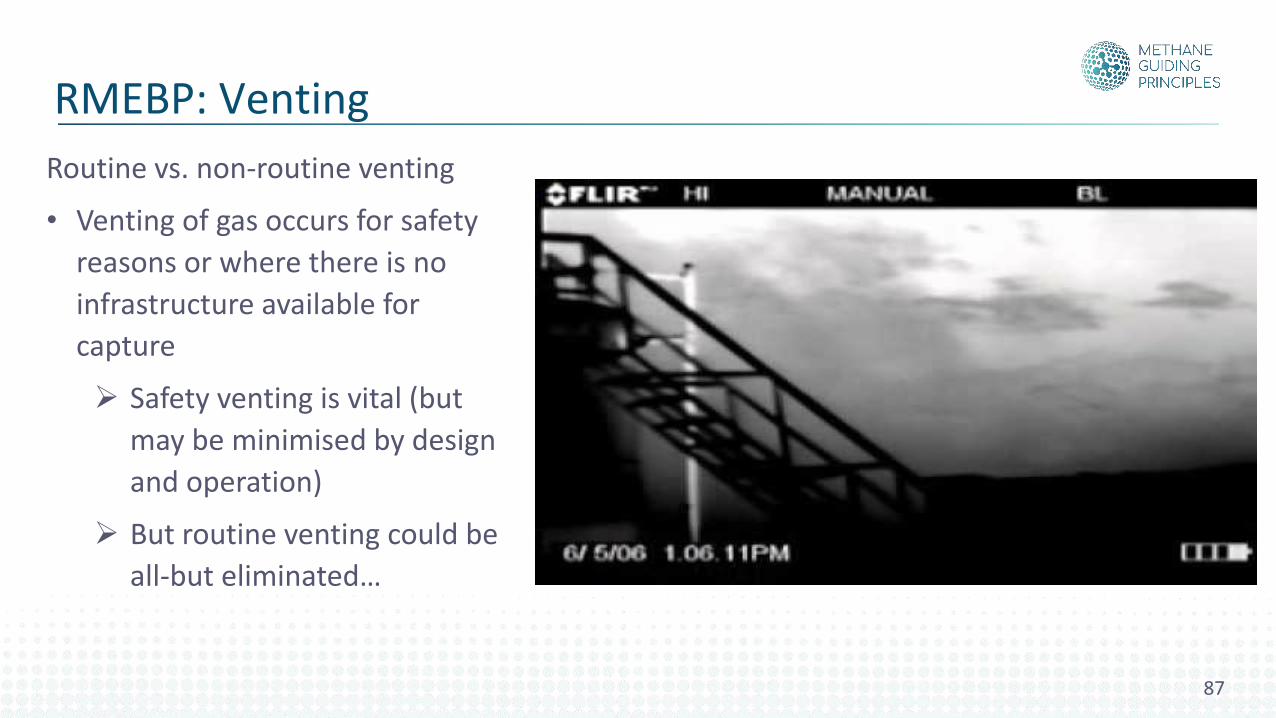
Routine vs. non-routine venting
• Venting of gas occurs for safety
reasons or where there is no
infrastructure available for
capture
➢ Safety venting is vital (but
may be minimised by design
and operation)
➢ But routine venting could be
all-but eliminated…
RMEBP: Venting
87
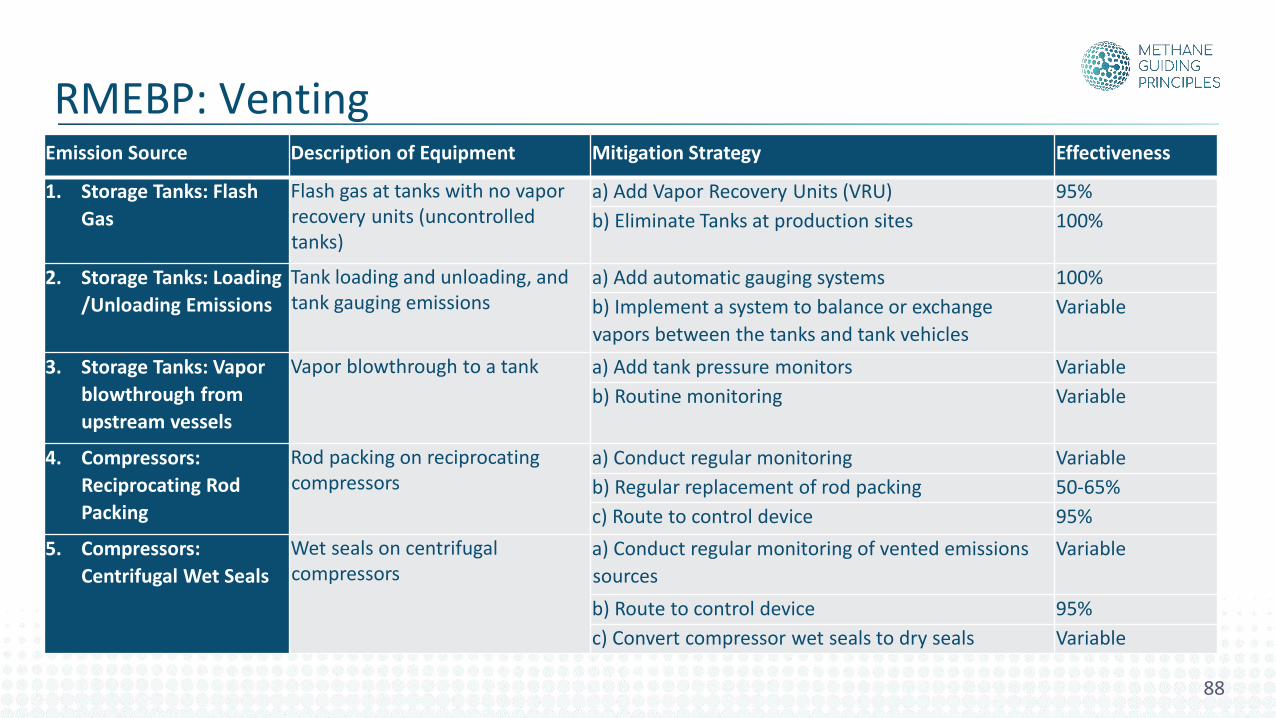
Emission Source Description of Equipment Mitigation Strategy Effectiveness
1. Storage Tanks: Flash
Gas
Flash gas at tanks with no vapor recovery units (uncontrolled tanks)
a) Add Vapor Recovery Units (VRU) 95%
b) Eliminate Tanks at production sites 100%
2. Storage Tanks: Loading
/Unloading Emissions
Tank loading and unloading, and tank gauging emissions
a) Add automatic gauging systems 100%
b) Implement a system to balance or exchange
vapors between the tanks and tank vehicles
Variable
3. Storage Tanks: Vapor
blowthrough from
upstream vessels
Vapor blowthrough to a tank a) Add tank pressure monitors Variable
b) Routine monitoring Variable
4. Compressors:
Reciprocating Rod
Packing
Rod packing on reciprocating compressors
a) Conduct regular monitoring Variable
b) Regular replacement of rod packing 50-65%
c) Route to control device 95%
5. Compressors:
Centrifugal Wet Seals
Wet seals on centrifugal compressors
a) Conduct regular monitoring of vented emissions
sources
Variable
b) Route to control device 95%
c) Convert compressor wet seals to dry seals Variable
RMEBP: Venting
88
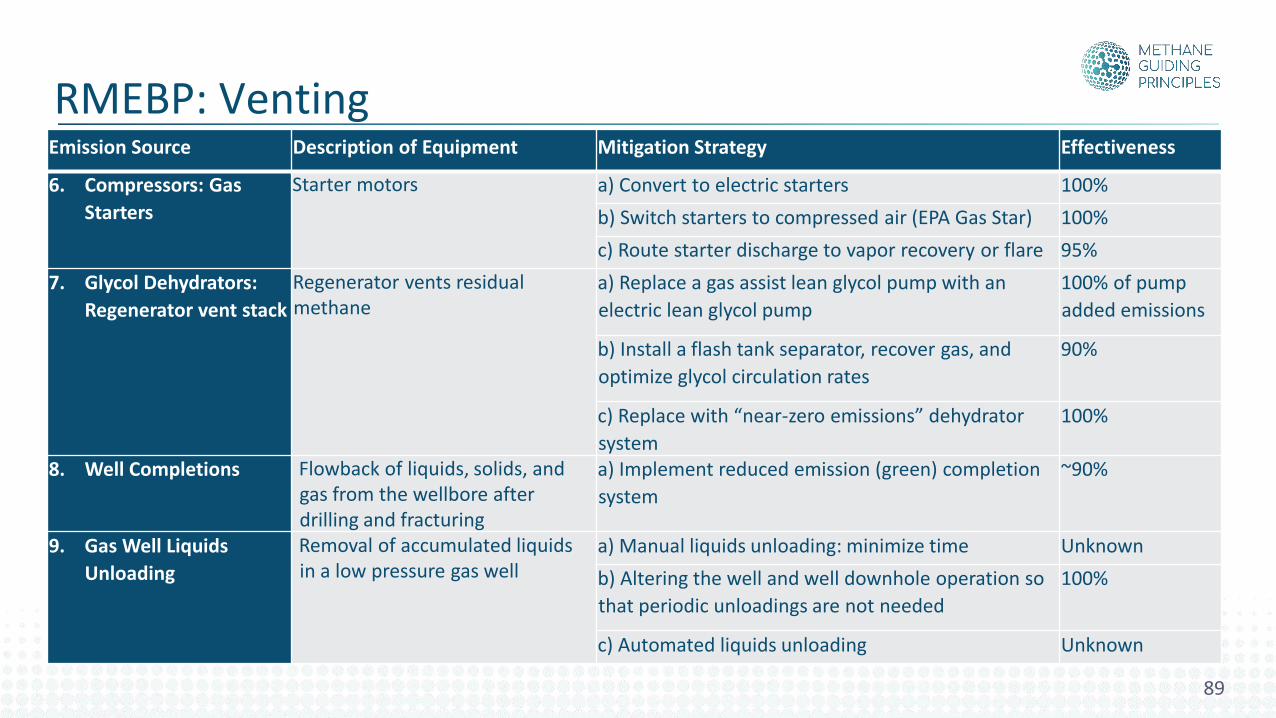
Emission Source Description of Equipment Mitigation Strategy Effectiveness
6. Compressors: Gas
Starters
Starter motors a) Convert to electric starters 100%
b) Switch starters to compressed air (EPA Gas Star) 100%
c) Route starter discharge to vapor recovery or flare 95%
7. Glycol Dehydrators:
Regenerator vent stack
Regenerator vents residual methane
a) Replace a gas assist lean glycol pump with an
electric lean glycol pump
100% of pump
added emissions
b) Install a flash tank separator, recover gas, and
optimize glycol circulation rates
90%
c) Replace with “near-zero emissions” dehydrator
system
100%
8. Well Completions Flowback of liquids, solids, and gas from the wellbore after drilling and fracturing
a) Implement reduced emission (green) completion
system
~90%
9. Gas Well Liquids
Unloading
Removal of accumulated liquids in a low pressure gas well
a) Manual liquids unloading: minimize time Unknown
b) Altering the well and well downhole operation so
that periodic unloadings are not needed
100%
c) Automated liquids unloading Unknown
RMEBP: Venting
89
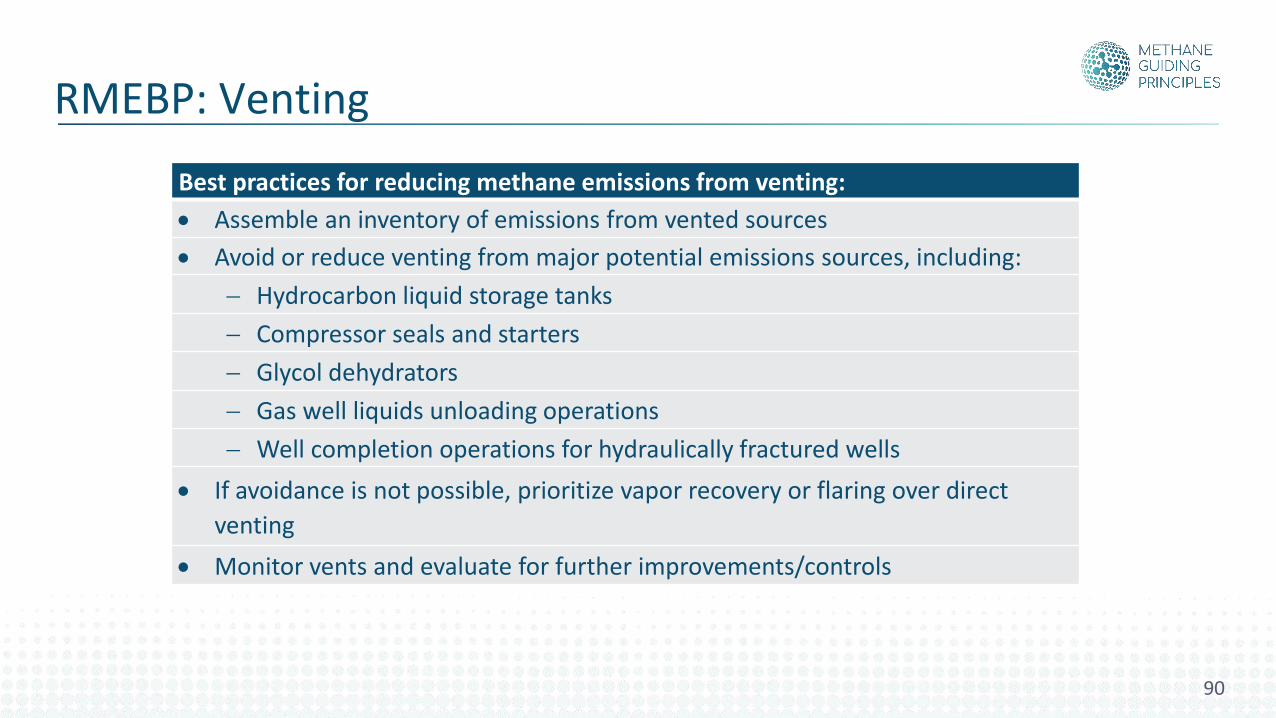
Best practices for reducing methane emissions from venting:
• Assemble an inventory of emissions from vented sources
• Avoid or reduce venting from major potential emissions sources, including:
− Hydrocarbon liquid storage tanks
− Compressor seals and starters
− Glycol dehydrators
− Gas well liquids unloading operations
− Well completion operations for hydraulically fractured wells
• If avoidance is not possible, prioritize vapor recovery or flaring over direct
venting
• Monitor vents and evaluate for further improvements/controls
RMEBP: Venting
90
Case Study. Socar: Utilisation of Associated Gas in Gunashli Oil Field
91
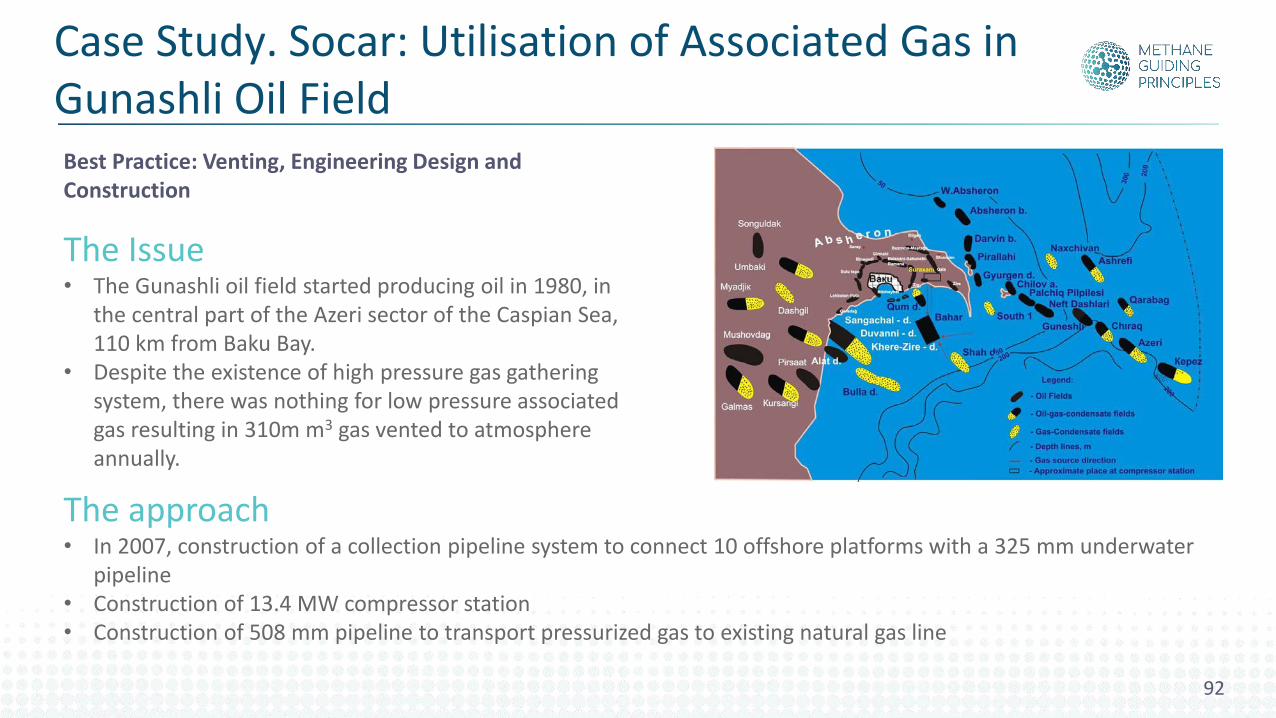
Best Practice: Venting, Engineering Design and Construction
The Issue• The Gunashli oil field started producing oil in 1980, in
the central part of the Azeri sector of the Caspian Sea, 110 km from Baku Bay.
• Despite the existence of high pressure gas gathering system, there was nothing for low pressure associated gas resulting in 310m m3 gas vented to atmosphere annually.
The approach• In 2007, construction of a collection pipeline system to connect 10 offshore platforms with a 325 mm underwater
pipeline• Construction of 13.4 MW compressor station• Construction of 508 mm pipeline to transport pressurized gas to existing natural gas line
Case Study. Socar: Utilisation of Associated Gas in Gunashli Oil Field
92
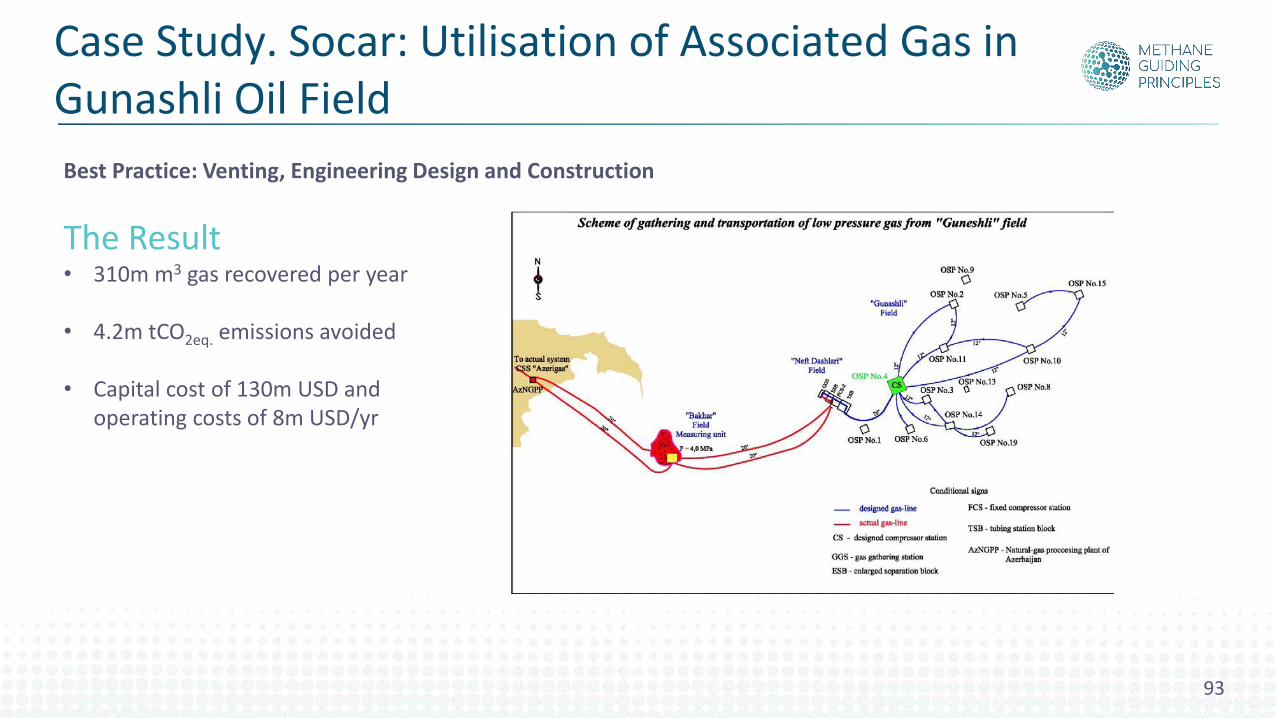
The Result• 310m m3 gas recovered per year
• 4.2m tCO2eq. emissions avoided
• Capital cost of 130m USD and operating costs of 8m USD/yr
Best Practice: Venting, Engineering Design and Construction
93
Case Study. Socar: Utilisation of Associated Gas in Gunashli Oil Field
Reducing Methane Emissions Best Practices
Best practices:1. Venting2. Pneumatic equipment3. Flaring4. Equipment leaks5. Operational repairs6. Energy use7. Engineering design and construction8. Continual improvement
94
Reducing Methane Emissions Best Practices
Best practices:1. Venting
2. Pneumatic equipment3. Flaring4. Equipment leaks5. Operational repairs6. Energy use7. Engineering design and construction8. Continual improvement
95
• Gas-driven pneumatic devices are typically used where electrical power is not
available.
• The two main types:
- Pneumatic controllers control levels, temperatures and pressures. The gas used
to drive the controller is continuously or intermittently vented.
- Pneumatic pumps are used to inject chemicals into wells and pipelines and for
glycol circulation for water separation. The natural gas may be vented as the
pump operates.
• Pneumatic devices is one of the largest sources of methane emissions in the United
States.
RMEBP: Pneumatic equipment
96
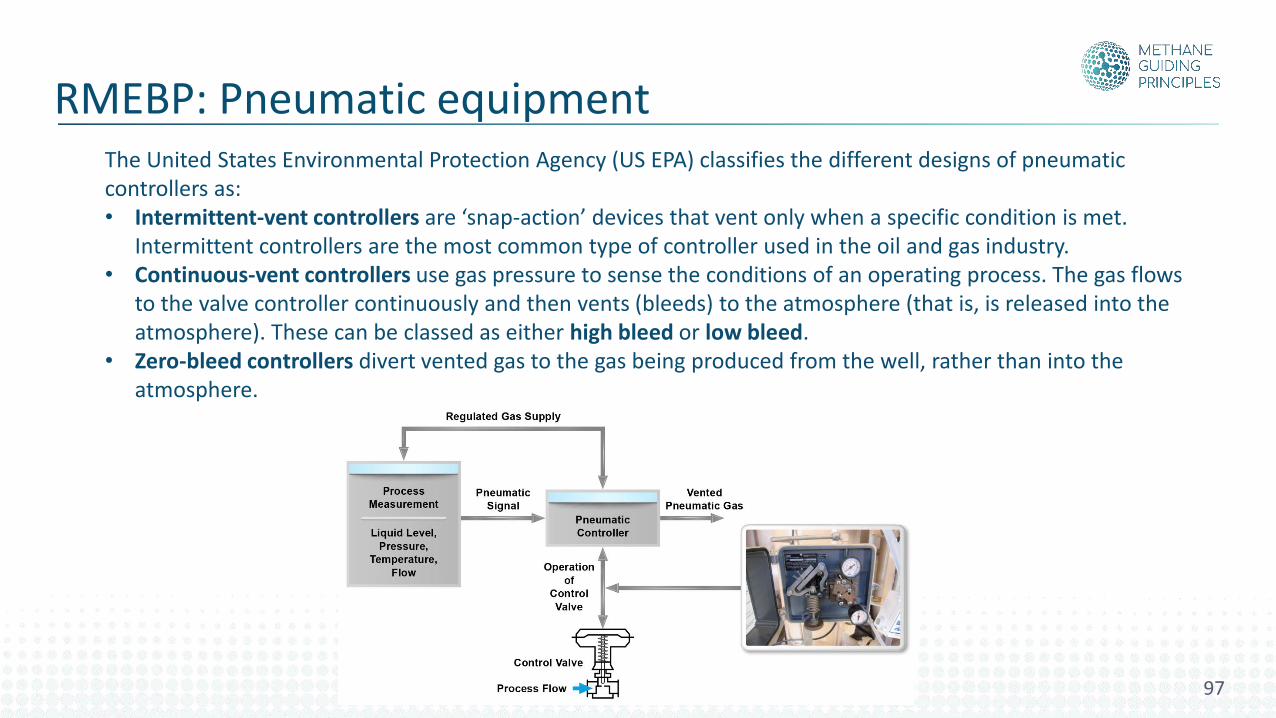
The United States Environmental Protection Agency (US EPA) classifies the different designs of pneumatic controllers as:• Intermittent-vent controllers are ‘snap‐action’ devices that vent only when a specific condition is met.
Intermittent controllers are the most common type of controller used in the oil and gas industry. • Continuous-vent controllers use gas pressure to sense the conditions of an operating process. The gas flows
to the valve controller continuously and then vents (bleeds) to the atmosphere (that is, is released into the atmosphere). These can be classed as either high bleed or low bleed.
• Zero-bleed controllers divert vented gas to the gas being produced from the well, rather than into the atmosphere.
RMEBP: Pneumatic equipment
97
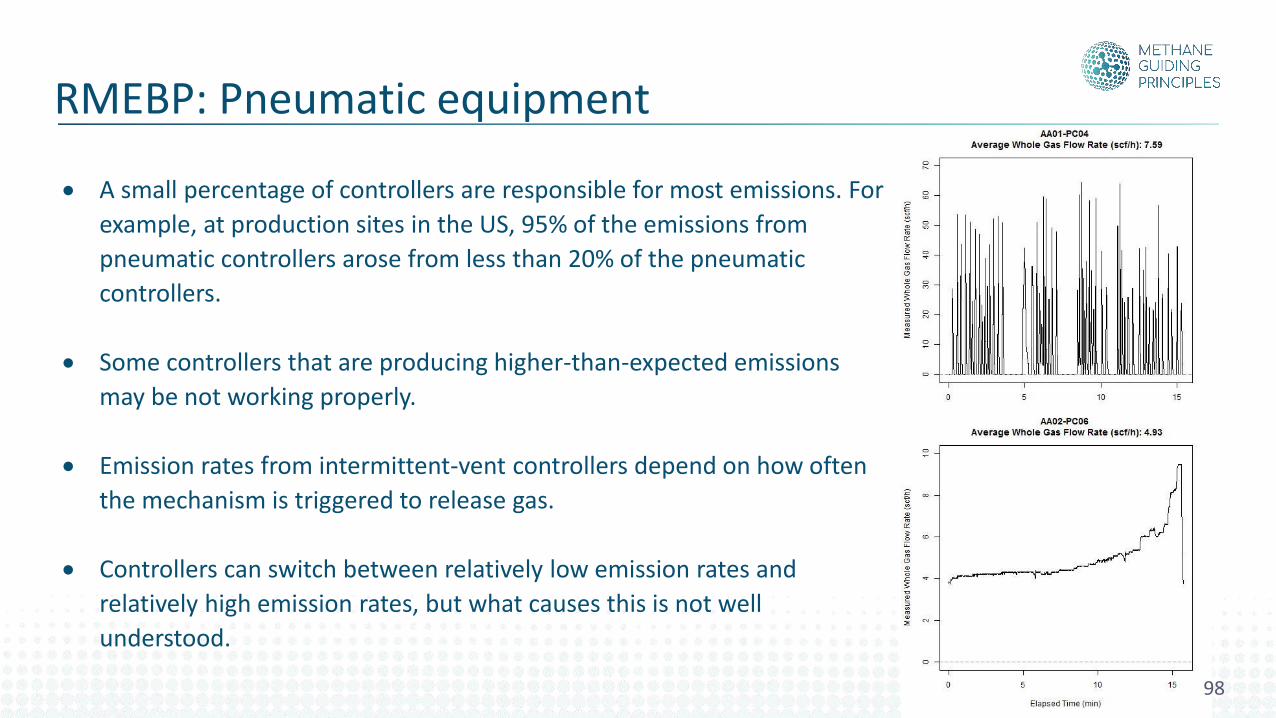
• A small percentage of controllers are responsible for most emissions. For
example, at production sites in the US, 95% of the emissions from
pneumatic controllers arose from less than 20% of the pneumatic
controllers.
• Some controllers that are producing higher-than-expected emissions
may be not working properly.
• Emission rates from intermittent-vent controllers depend on how often
the mechanism is triggered to release gas.
• Controllers can switch between relatively low emission rates and
relatively high emission rates, but what causes this is not well
understood.
RMEBP: Pneumatic equipment
98
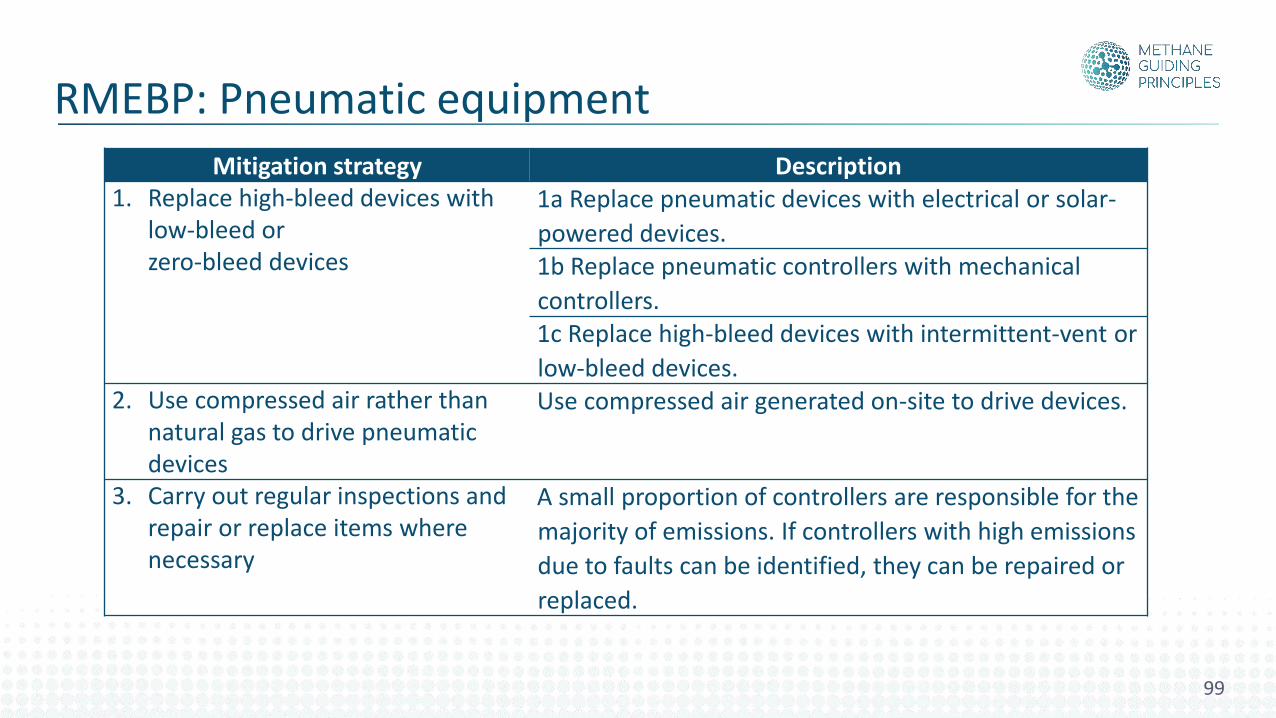
Mitigation strategy Description1. Replace high-bleed devices with
low-bleed or zero-bleed devices
1a Replace pneumatic devices with electrical or solar-
powered devices.1b Replace pneumatic controllers with mechanical
controllers.1c Replace high-bleed devices with intermittent-vent or
low-bleed devices. 2. Use compressed air rather than
natural gas to drive pneumatic devices
Use compressed air generated on-site to drive devices.
3. Carry out regular inspections and repair or replace items where necessary
A small proportion of controllers are responsible for the
majority of emissions. If controllers with high emissions
due to faults can be identified, they can be repaired or
replaced.
RMEBP: Pneumatic equipment
99
RMEBP: Pneumatic equipment
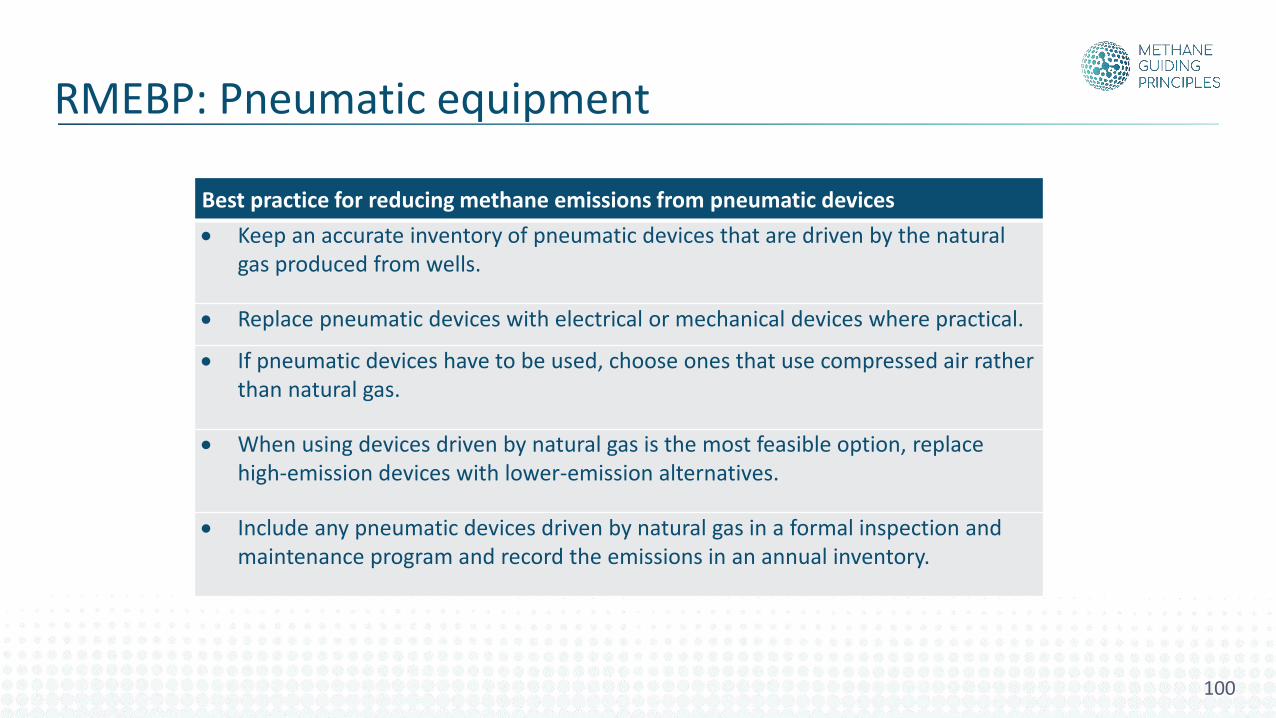
Best practice for reducing methane emissions from pneumatic devices
• Keep an accurate inventory of pneumatic devices that are driven by the natural gas produced from wells.
• Replace pneumatic devices with electrical or mechanical devices where practical.
• If pneumatic devices have to be used, choose ones that use compressed air rather than natural gas.
• When using devices driven by natural gas is the most feasible option, replace high-emission devices with lower-emission alternatives.
• Include any pneumatic devices driven by natural gas in a formal inspection and maintenance program and record the emissions in an annual inventory.
100
Case Study. Snam: Converting gas pneumatics to instrument air
101
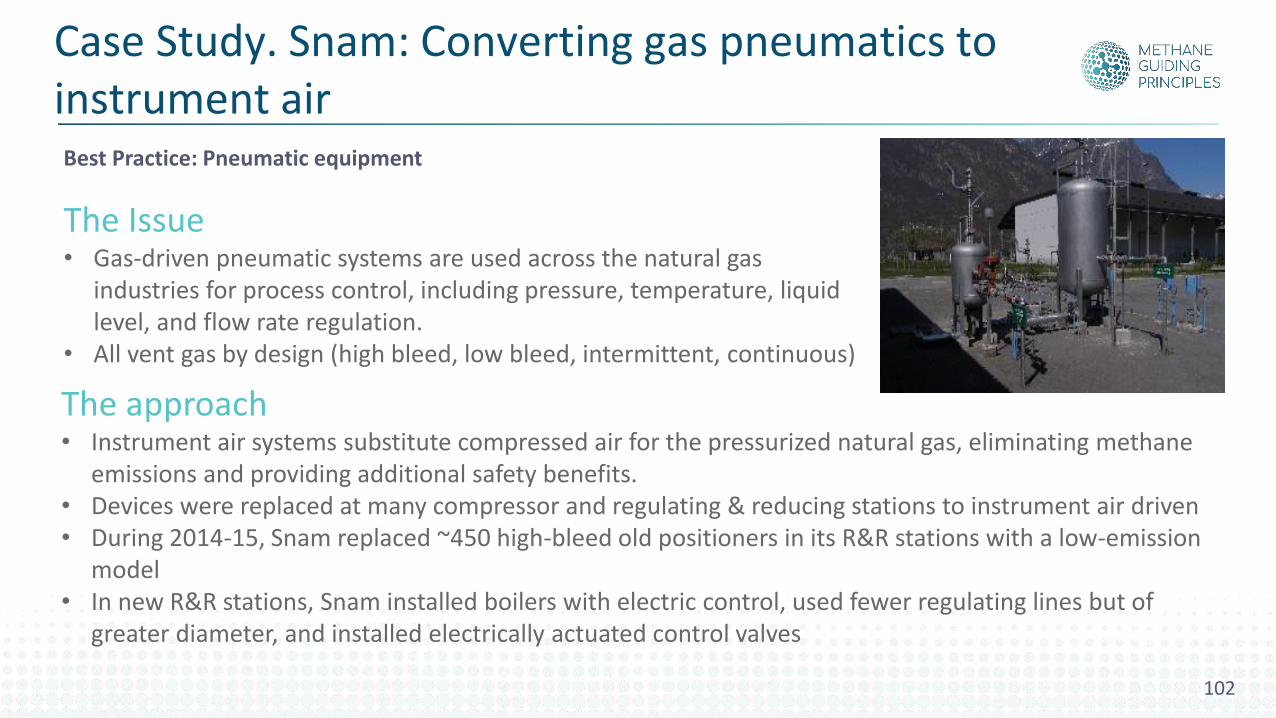
The Issue• Gas-driven pneumatic systems are used across the natural gas
industries for process control, including pressure, temperature, liquid level, and flow rate regulation.
• All vent gas by design (high bleed, low bleed, intermittent, continuous)
The approach• Instrument air systems substitute compressed air for the pressurized natural gas, eliminating methane
emissions and providing additional safety benefits. • Devices were replaced at many compressor and regulating & reducing stations to instrument air driven• During 2014-15, Snam replaced ~450 high-bleed old positioners in its R&R stations with a low-emission
model• In new R&R stations, Snam installed boilers with electric control, used fewer regulating lines but of
greater diameter, and installed electrically actuated control valves
Best Practice: Pneumatic equipment
Case Study. Snam: Converting gas pneumatics to instrument air
102
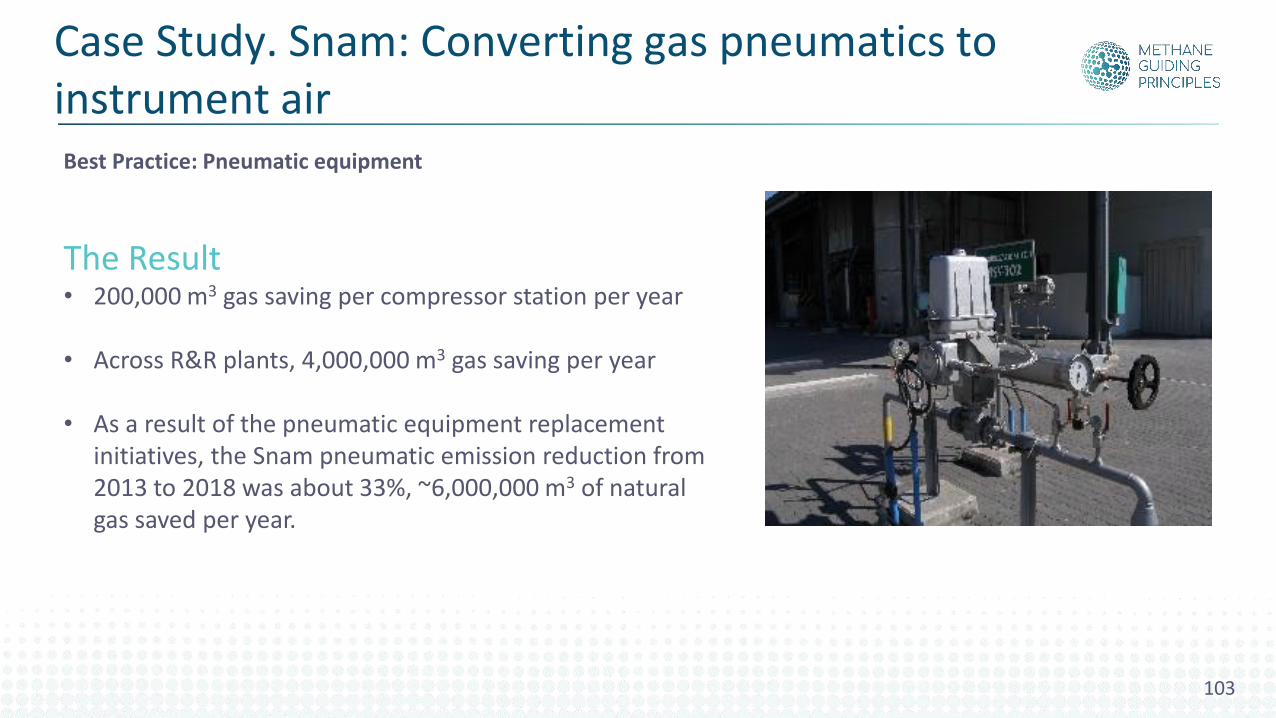
The Result• 200,000 m3 gas saving per compressor station per year
• Across R&R plants, 4,000,000 m3 gas saving per year
• As a result of the pneumatic equipment replacement initiatives, the Snam pneumatic emission reduction from 2013 to 2018 was about 33%, ~6,000,000 m3 of natural gas saved per year.
Best Practice: Pneumatic equipment
Case Study. Snam: Converting gas pneumatics to instrument air
103

Reducing Methane Emissions Best Practices
Best practices:1. Venting2. Pneumatic equipment3. Flaring4. Equipment leaks5. Operational repairs6. Energy use7. Engineering design and construction8. Continual improvement
104
Reducing Methane Emissions Best Practices
Best practices:1. Venting2. Pneumatic equipment
3. Flaring4. Equipment leaks5. Operational repairs6. Energy use7. Engineering design and construction8. Continual improvement
105
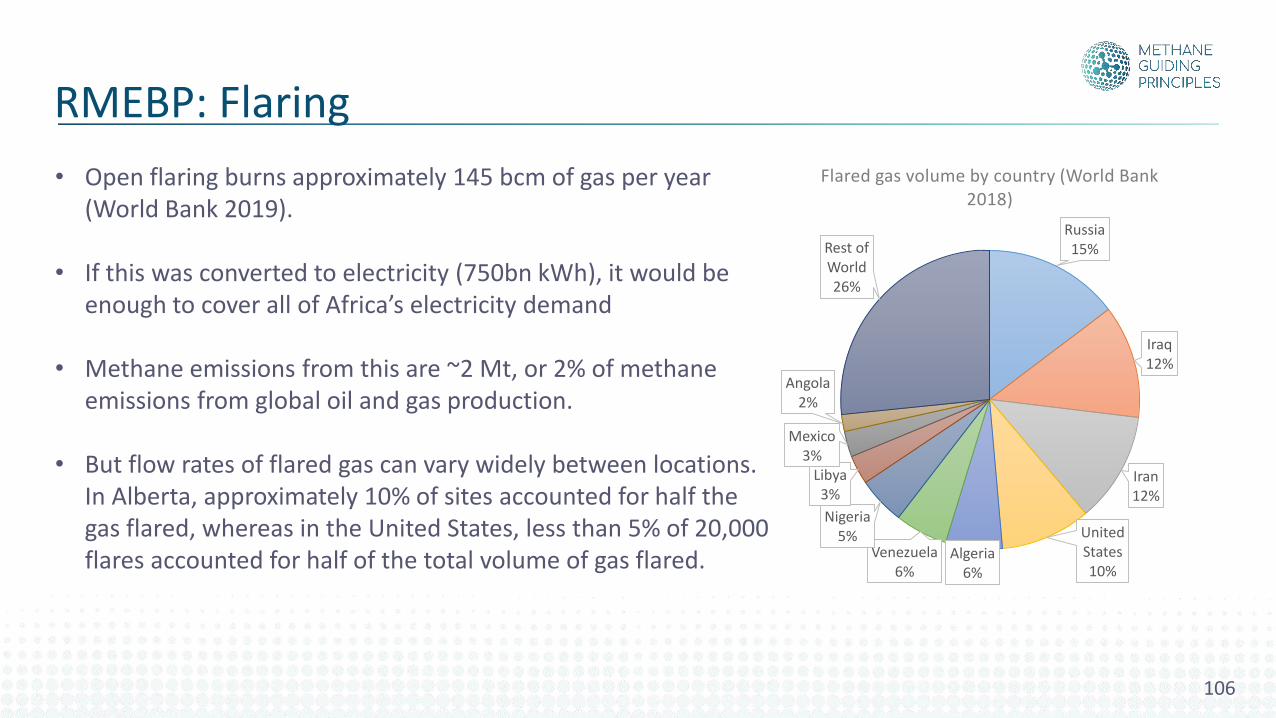
• Open flaring burns approximately 145 bcm of gas per year (World Bank 2019).
• If this was converted to electricity (750bn kWh), it would be enough to cover all of Africa’s electricity demand
• Methane emissions from this are ~2 Mt, or 2% of methane emissions from global oil and gas production.
• But flow rates of flared gas can vary widely between locations. In Alberta, approximately 10% of sites accounted for half the gas flared, whereas in the United States, less than 5% of 20,000 flares accounted for half of the total volume of gas flared.
RMEBP: Flaring
Russia15%
Iraq 12%
Iran12%
United States10%
Algeria6%
Venezuela6%
Nigeria5%
Libya3%
Mexico3%
Angola 2%
Rest of World26%
Flared gas volume by country (World Bank 2018)
106
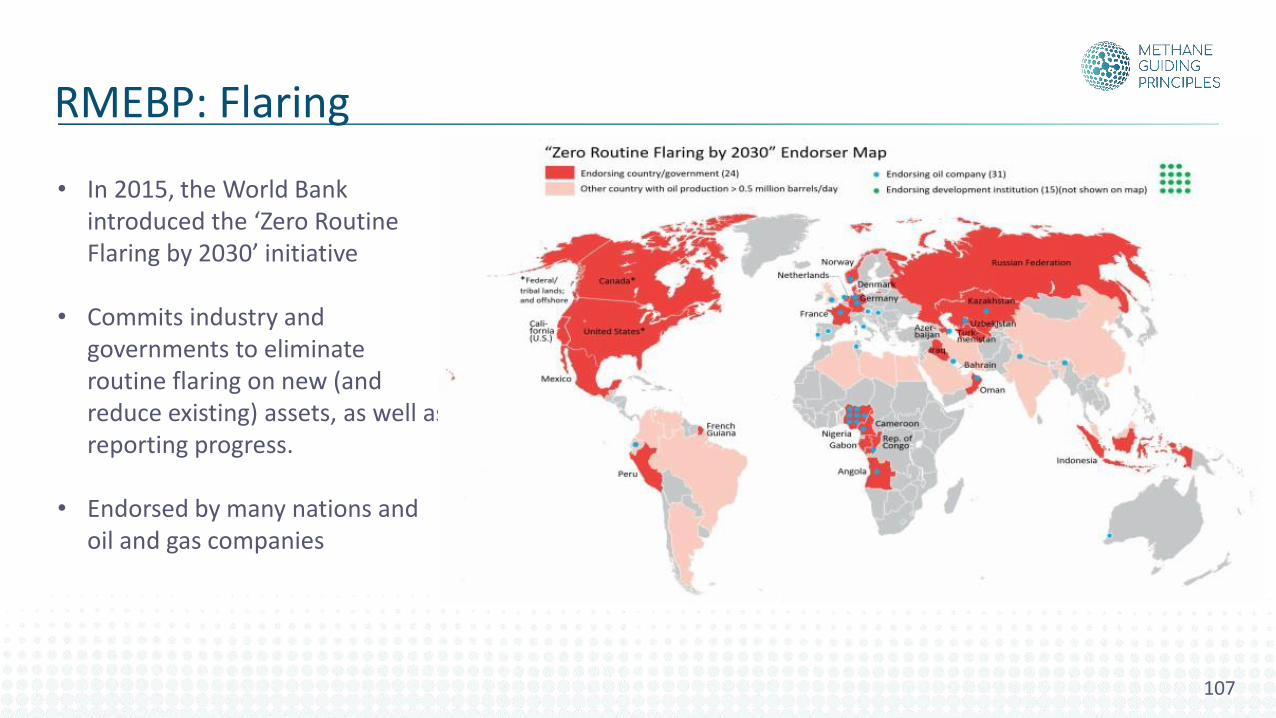
• In 2015, the World Bank introduced the ‘Zero Routine Flaring by 2030’ initiative
• Commits industry and governments to eliminate routine flaring on new (and reduce existing) assets, as well as reporting progress.
• Endorsed by many nations and oil and gas companies
RMEBP: Flaring
107
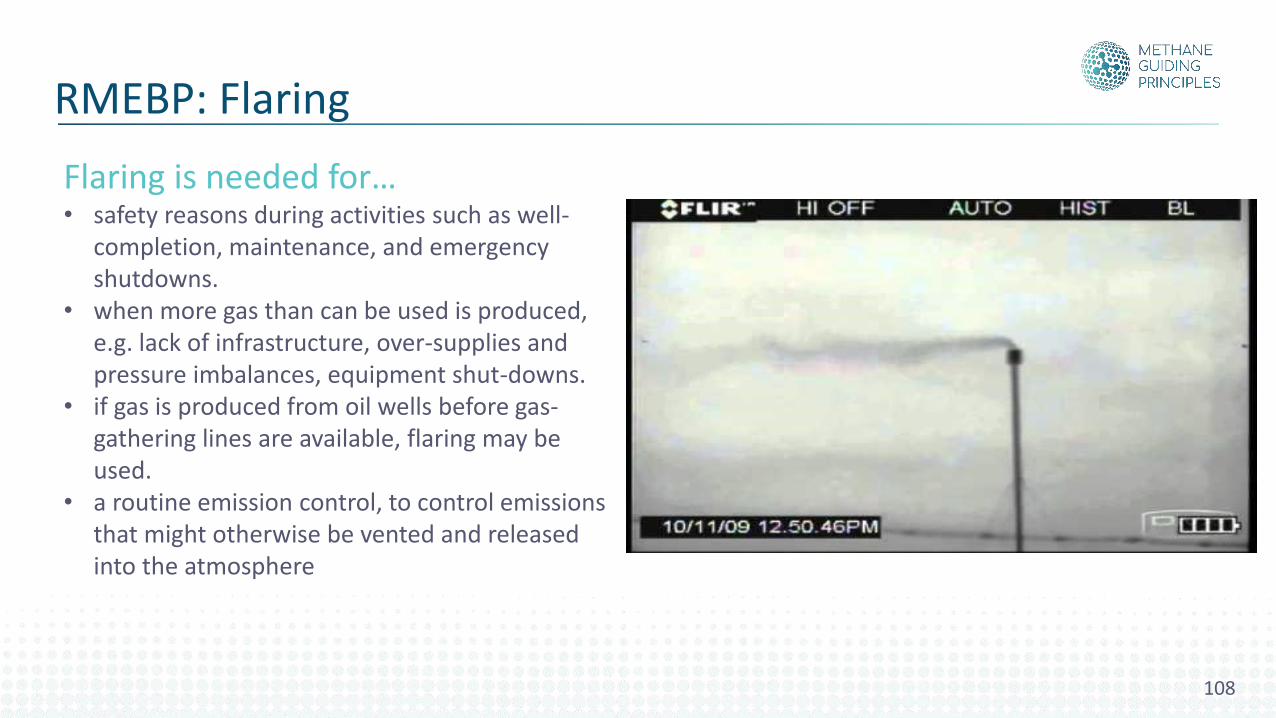
Flaring is needed for…• safety reasons during activities such as well-
completion, maintenance, and emergency shutdowns.
• when more gas than can be used is produced, e.g. lack of infrastructure, over-supplies and pressure imbalances, equipment shut-downs.
• if gas is produced from oil wells before gas-gathering lines are available, flaring may be used.
• a routine emission control, to control emissions that might otherwise be vented and released into the atmosphere
RMEBP: Flaring
108
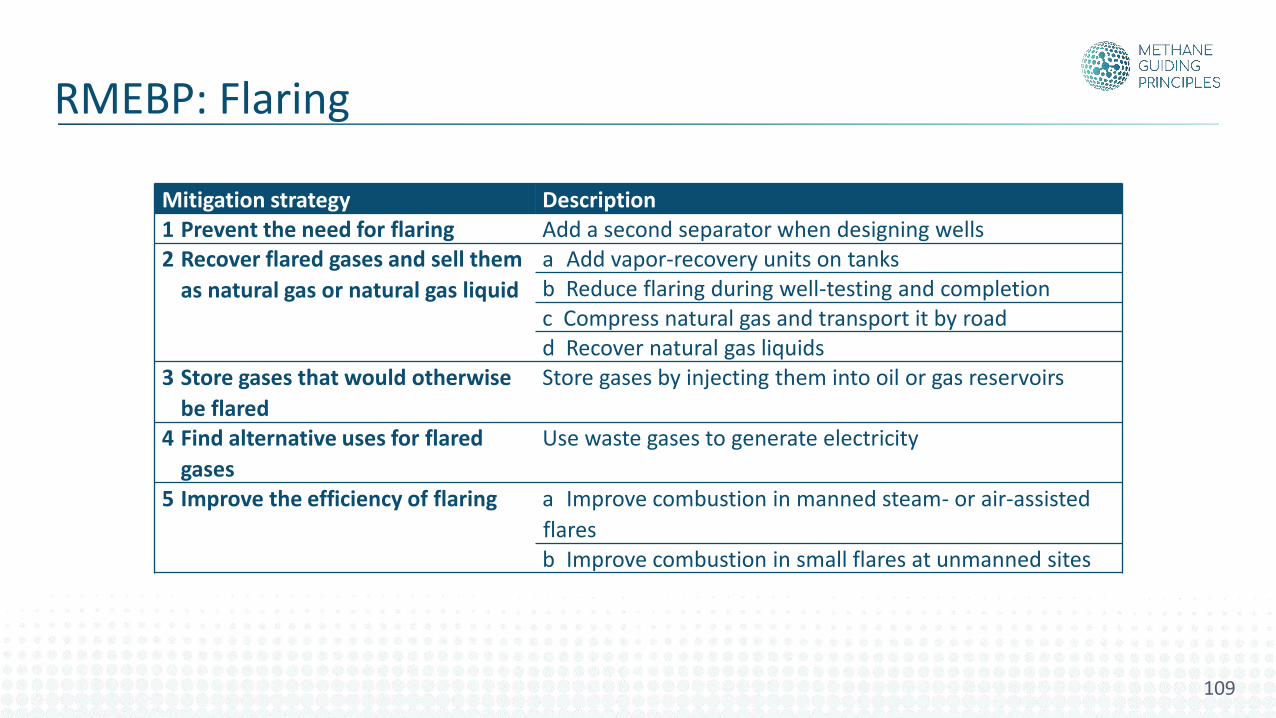
Mitigation strategy Description1 Prevent the need for flaring Add a second separator when designing wells2 Recover flared gases and sell them
as natural gas or natural gas liquid
a Add vapor-recovery units on tanksb Reduce flaring during well-testing and completionc Compress natural gas and transport it by roadd Recover natural gas liquids
3 Store gases that would otherwise
be flared
Store gases by injecting them into oil or gas reservoirs
4 Find alternative uses for flared
gases
Use waste gases to generate electricity
5 Improve the efficiency of flaring a Improve combustion in manned steam- or air-assisted
flaresb Improve combustion in small flares at unmanned sites
RMEBP: Flaring
109
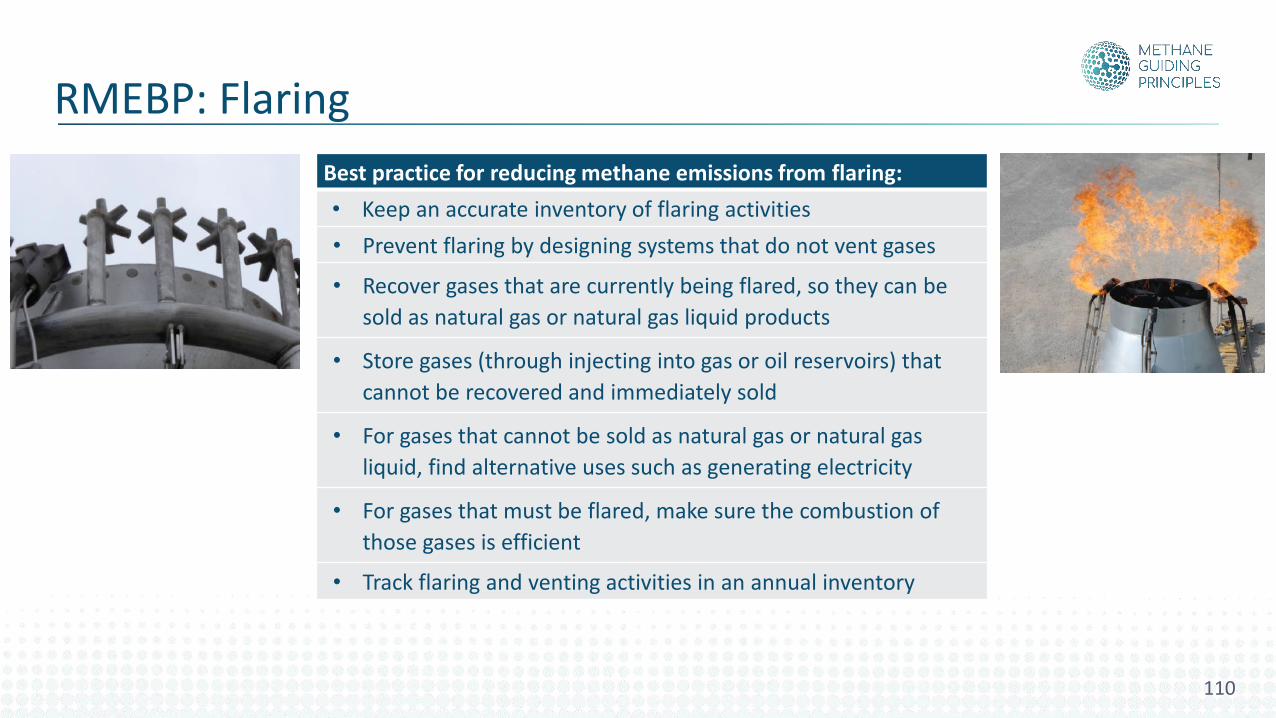
Best practice for reducing methane emissions from flaring:
• Keep an accurate inventory of flaring activities
• Prevent flaring by designing systems that do not vent gases
• Recover gases that are currently being flared, so they can be
sold as natural gas or natural gas liquid products
• Store gases (through injecting into gas or oil reservoirs) that
cannot be recovered and immediately sold
• For gases that cannot be sold as natural gas or natural gas
liquid, find alternative uses such as generating electricity
• For gases that must be flared, make sure the combustion of
those gases is efficient
• Track flaring and venting activities in an annual inventory
RMEBP: Flaring
110
Case Study.BP: Angola LNG flare reduction
111
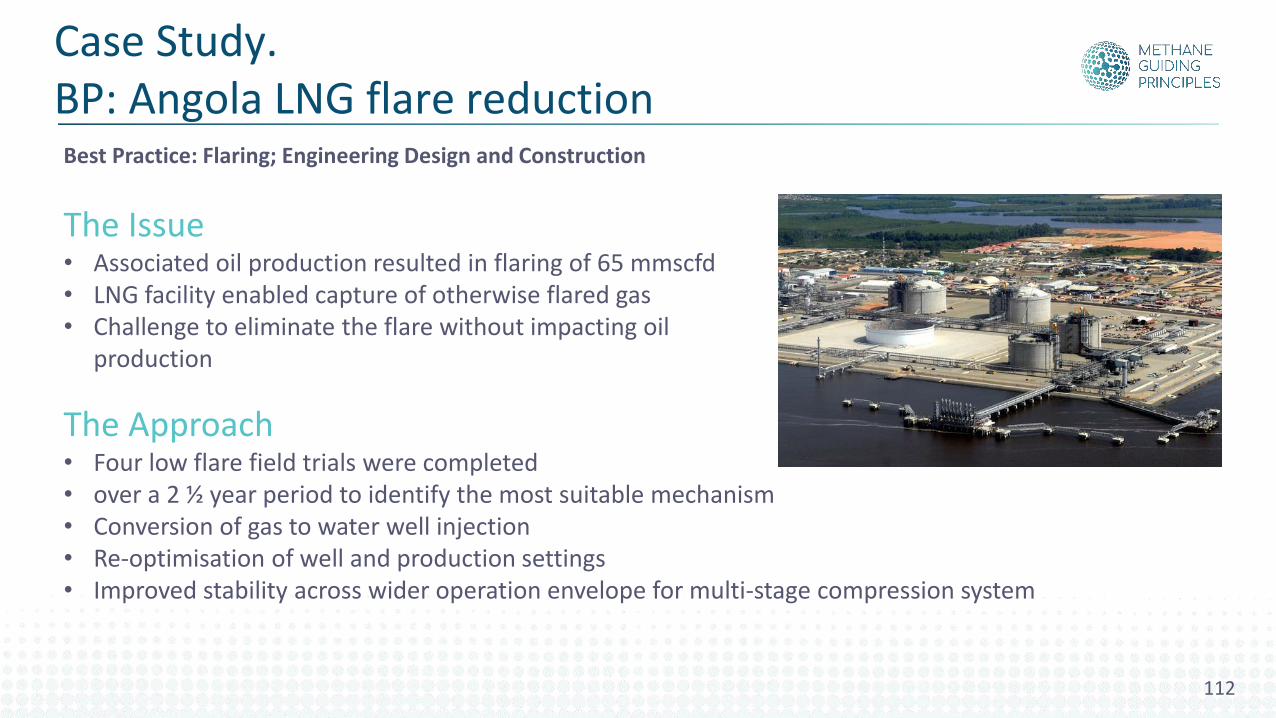
The Issue• Associated oil production resulted in flaring of 65 mmscfd• LNG facility enabled capture of otherwise flared gas• Challenge to eliminate the flare without impacting oil
production
Best Practice: Flaring; Engineering Design and Construction
The Approach• Four low flare field trials were completed • over a 2 ½ year period to identify the most suitable mechanism • Conversion of gas to water well injection• Re-optimisation of well and production settings• Improved stability across wider operation envelope for multi-stage compression system
Case Study.BP: Angola LNG flare reduction
112
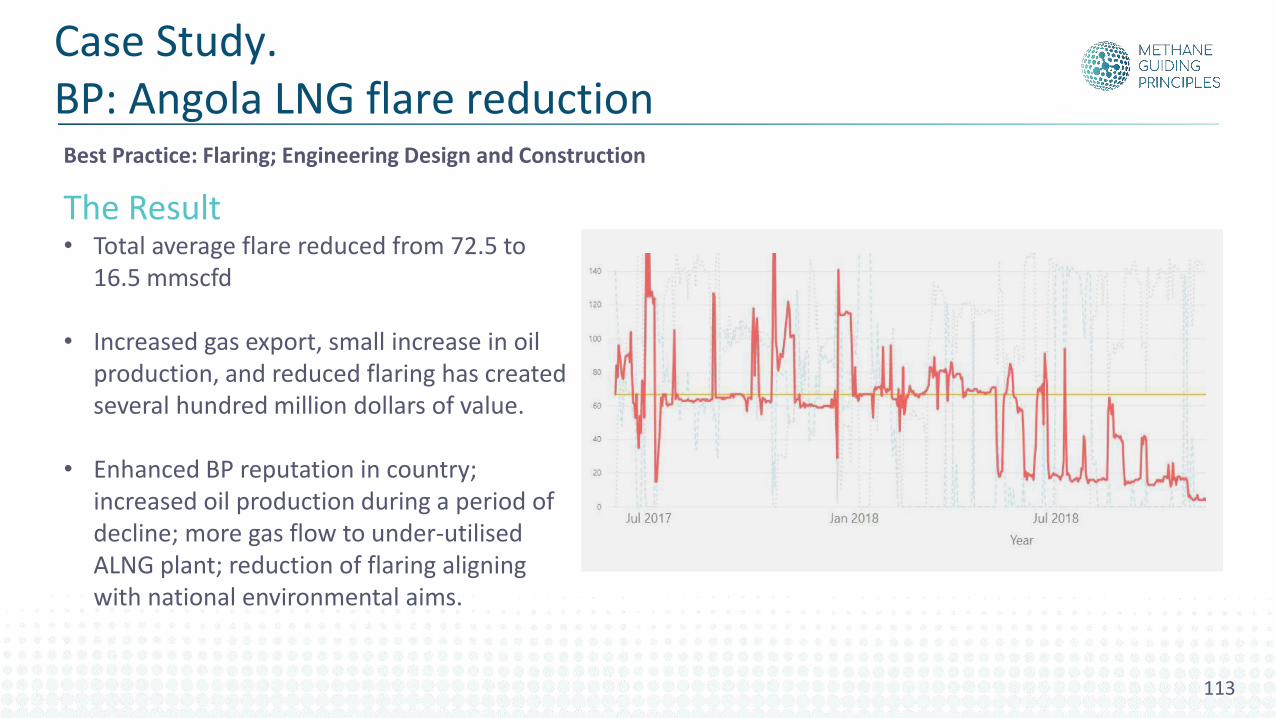
The Result• Total average flare reduced from 72.5 to
16.5 mmscfd
• Increased gas export, small increase in oil production, and reduced flaring has created several hundred million dollars of value.
• Enhanced BP reputation in country; increased oil production during a period of decline; more gas flow to under-utilised ALNG plant; reduction of flaring aligning with national environmental aims.
Best Practice: Flaring; Engineering Design and Construction
Case Study.BP: Angola LNG flare reduction
113
Reducing Methane Emissions Best Practices
Best practices:1. Venting2. Pneumatic equipment3. Flaring4. Equipment leaks5. Operational repairs6. Energy use7. Engineering design and construction8. Continual improvement
114
Reducing Methane Emissions Best Practices
Best practices:1. Venting2. Pneumatic equipment3. Flaring
4. Equipment leaks5. Operational repairs6. Energy use7. Engineering design and construction8. Continual improvement
115
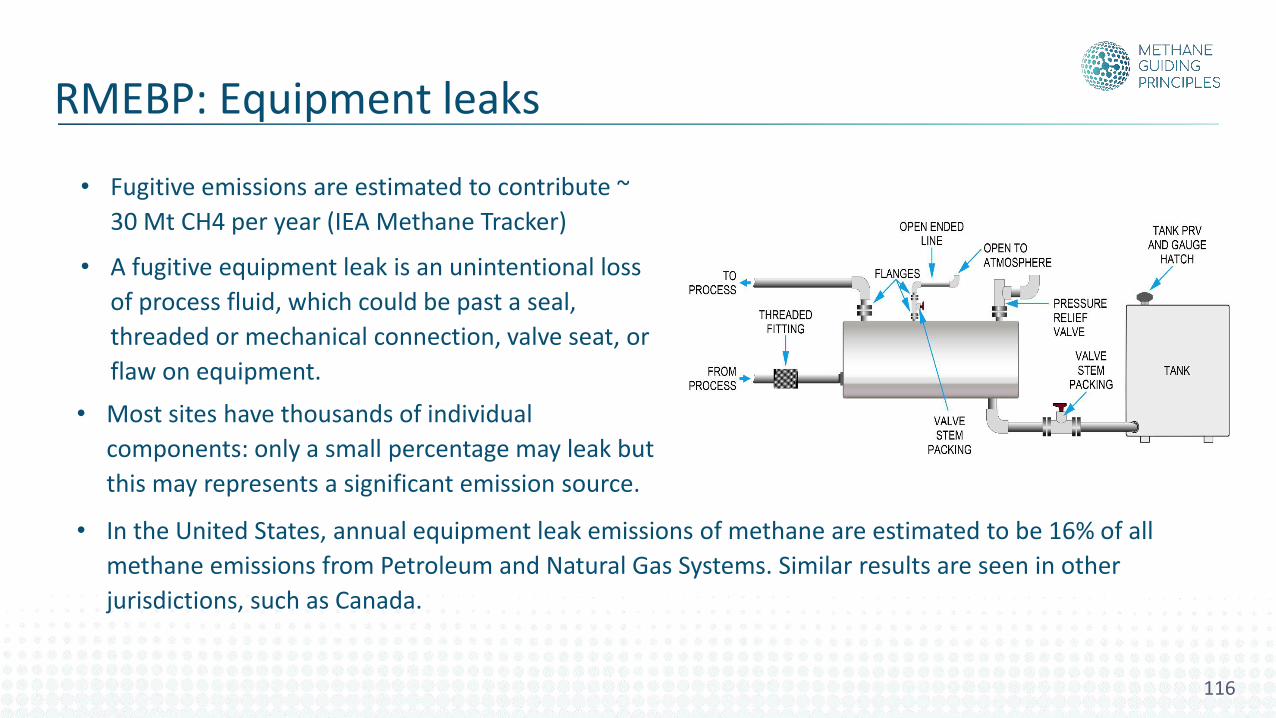
• Fugitive emissions are estimated to contribute ~
30 Mt CH4 per year (IEA Methane Tracker)
• A fugitive equipment leak is an unintentional loss
of process fluid, which could be past a seal,
threaded or mechanical connection, valve seat, or
flaw on equipment.
• Most sites have thousands of individual
components: only a small percentage may leak but
this may represents a significant emission source.
RMEBP: Equipment leaks
• In the United States, annual equipment leak emissions of methane are estimated to be 16% of all
methane emissions from Petroleum and Natural Gas Systems. Similar results are seen in other
jurisdictions, such as Canada.
116
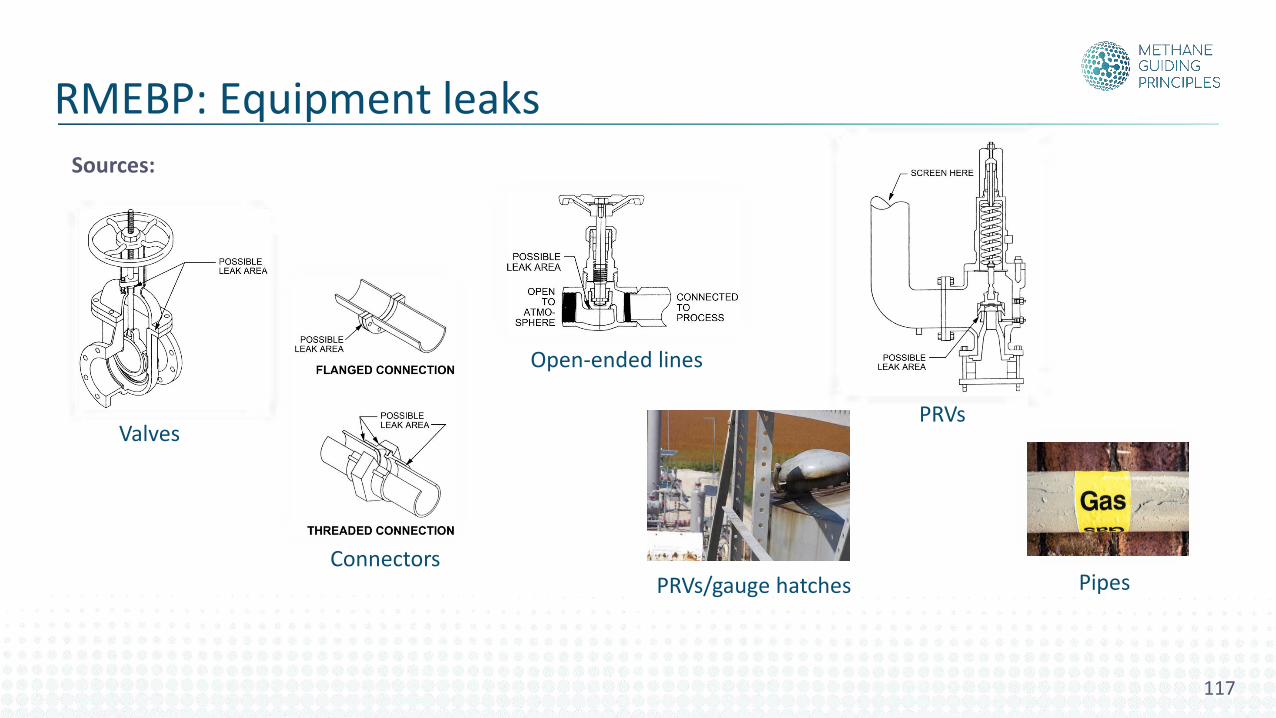
Sources:
RMEBP: Equipment leaks
PipesPRVs/gauge hatches
Open-ended lines
Connectors
PRVsValves
117
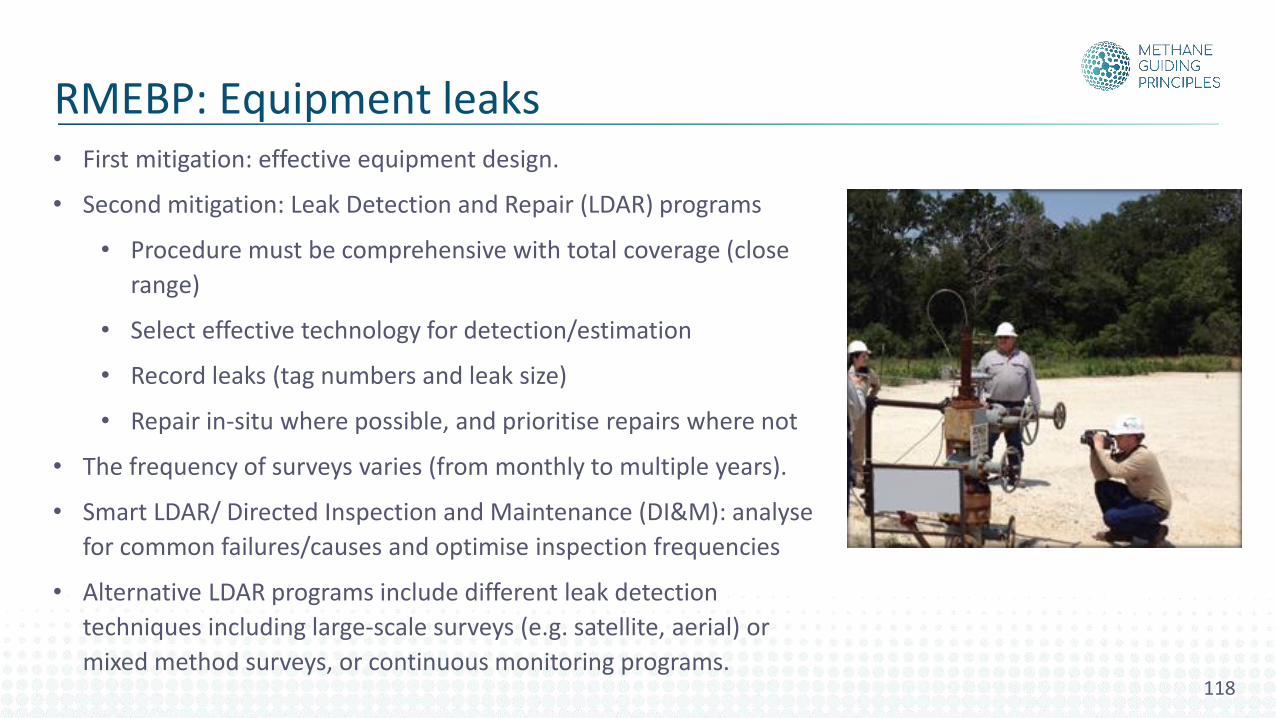
• First mitigation: effective equipment design.
• Second mitigation: Leak Detection and Repair (LDAR) programs
• Procedure must be comprehensive with total coverage (close
range)
• Select effective technology for detection/estimation
• Record leaks (tag numbers and leak size)
• Repair in-situ where possible, and prioritise repairs where not
• The frequency of surveys varies (from monthly to multiple years).
• Smart LDAR/ Directed Inspection and Maintenance (DI&M): analyse
for common failures/causes and optimise inspection frequencies
• Alternative LDAR programs include different leak detection
techniques including large-scale surveys (e.g. satellite, aerial) or
mixed method surveys, or continuous monitoring programs.
RMEBP: Equipment leaks
118
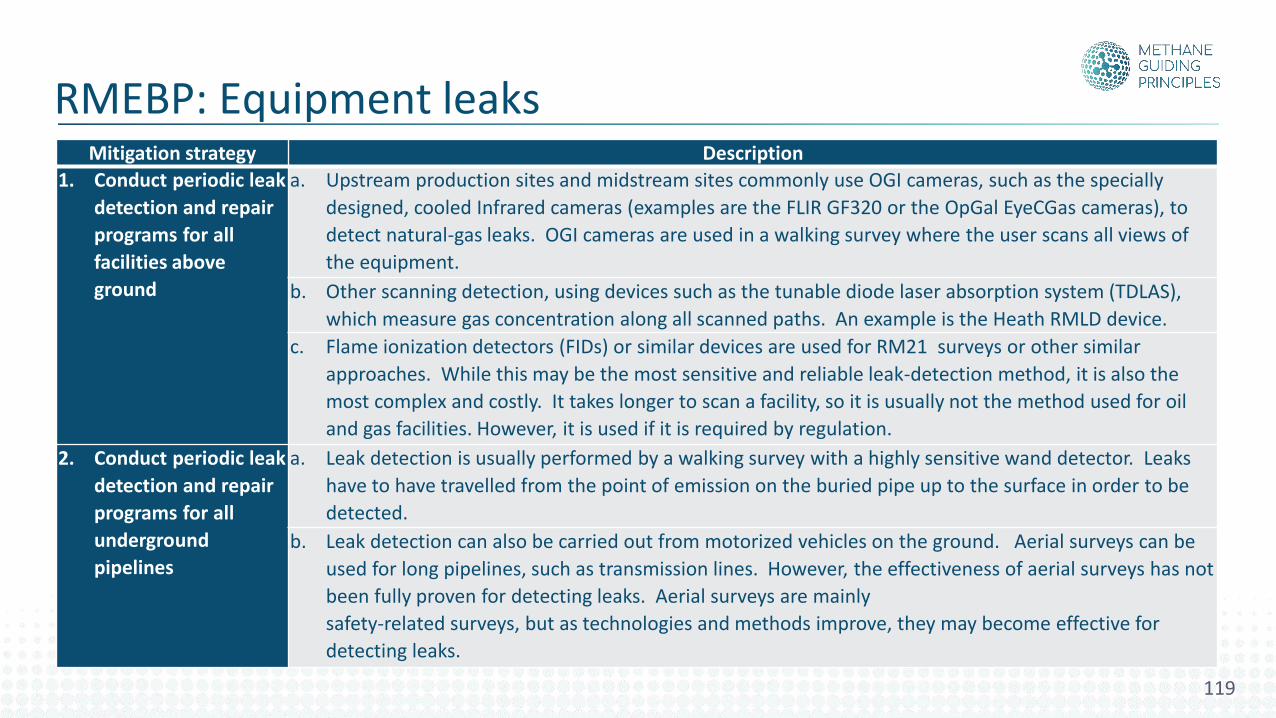
Mitigation strategy Description
1. Conduct periodic leak
detection and repair
programs for all
facilities above
ground
a. Upstream production sites and midstream sites commonly use OGI cameras, such as the specially
designed, cooled Infrared cameras (examples are the FLIR GF320 or the OpGal EyeCGas cameras), to
detect natural-gas leaks. OGI cameras are used in a walking survey where the user scans all views of
the equipment.
b. Other scanning detection, using devices such as the tunable diode laser absorption system (TDLAS),
which measure gas concentration along all scanned paths. An example is the Heath RMLD device.
c. Flame ionization detectors (FIDs) or similar devices are used for RM21 surveys or other similar
approaches. While this may be the most sensitive and reliable leak-detection method, it is also the
most complex and costly. It takes longer to scan a facility, so it is usually not the method used for oil
and gas facilities. However, it is used if it is required by regulation.
2. Conduct periodic leak
detection and repair
programs for all
underground
pipelines
a. Leak detection is usually performed by a walking survey with a highly sensitive wand detector. Leaks
have to have travelled from the point of emission on the buried pipe up to the surface in order to be
detected.
b. Leak detection can also be carried out from motorized vehicles on the ground. Aerial surveys can be
used for long pipelines, such as transmission lines. However, the effectiveness of aerial surveys has not
been fully proven for detecting leaks. Aerial surveys are mainly
safety-related surveys, but as technologies and methods improve, they may become effective for
detecting leaks.
RMEBP: Equipment leaks
119
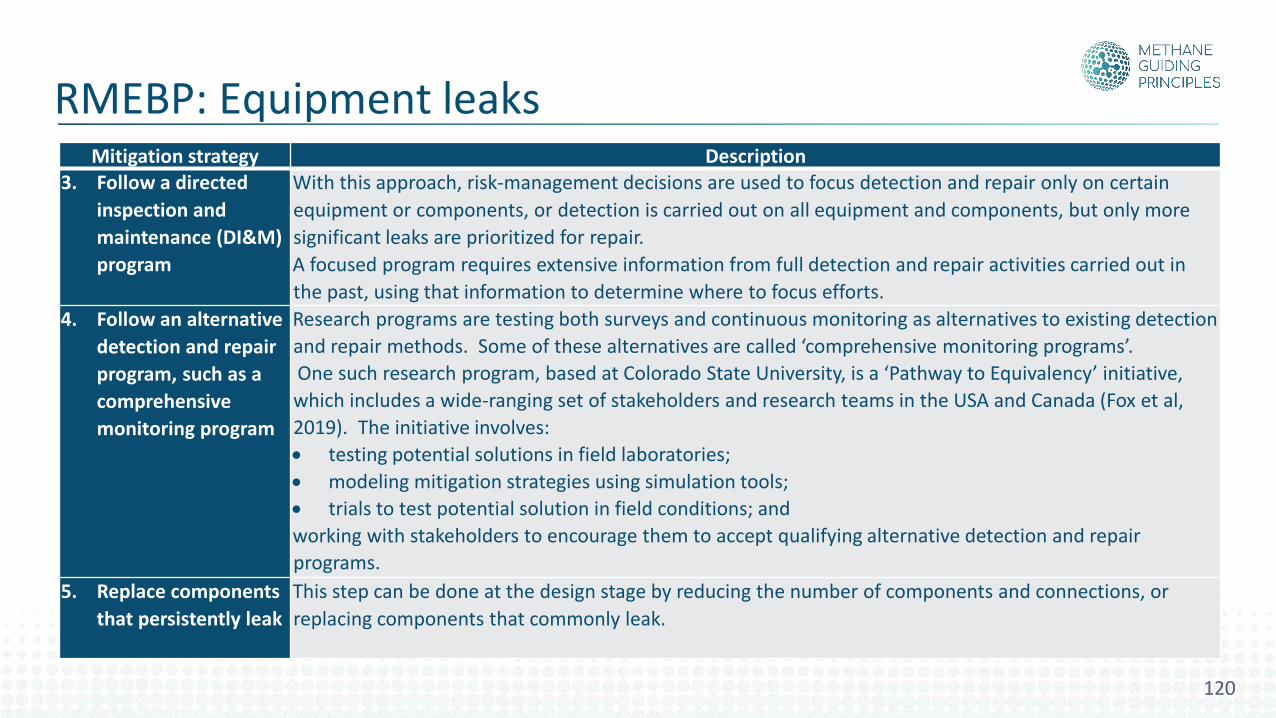
Mitigation strategy Description3. Follow a directed
inspection and
maintenance (DI&M)
program
With this approach, risk-management decisions are used to focus detection and repair only on certain
equipment or components, or detection is carried out on all equipment and components, but only more
significant leaks are prioritized for repair.
A focused program requires extensive information from full detection and repair activities carried out in
the past, using that information to determine where to focus efforts.
4. Follow an alternative
detection and repair
program, such as a
comprehensive
monitoring program
Research programs are testing both surveys and continuous monitoring as alternatives to existing detection
and repair methods. Some of these alternatives are called ‘comprehensive monitoring programs’.
One such research program, based at Colorado State University, is a ‘Pathway to Equivalency’ initiative,
which includes a wide-ranging set of stakeholders and research teams in the USA and Canada (Fox et al,
2019). The initiative involves:
• testing potential solutions in field laboratories;
• modeling mitigation strategies using simulation tools;
• trials to test potential solution in field conditions; and
working with stakeholders to encourage them to accept qualifying alternative detection and repair
programs.
5. Replace components
that persistently leak
This step can be done at the design stage by reducing the number of components and connections, or
replacing components that commonly leak.
RMEBP: Equipment leaks
120
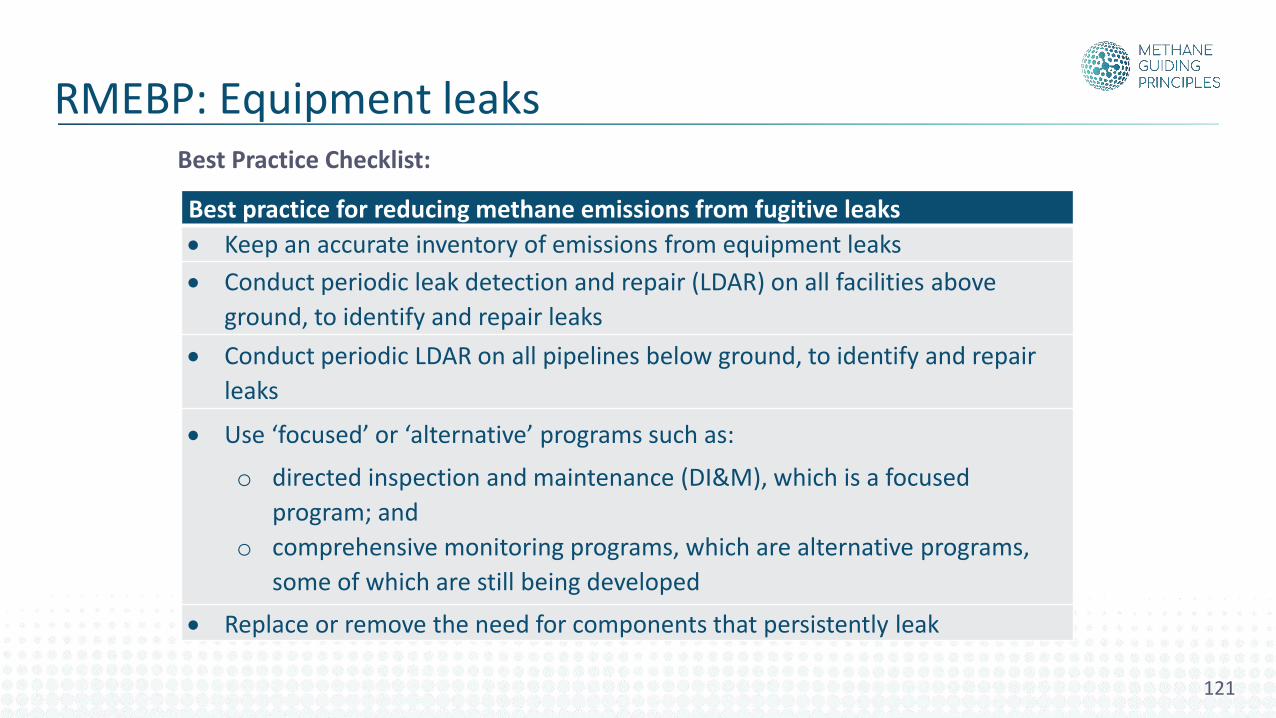
Best Practice Checklist:
RMEBP: Equipment leaks
Best practice for reducing methane emissions from fugitive leaks
• Keep an accurate inventory of emissions from equipment leaks
• Conduct periodic leak detection and repair (LDAR) on all facilities above
ground, to identify and repair leaks
• Conduct periodic LDAR on all pipelines below ground, to identify and repair
leaks
• Use ‘focused’ or ‘alternative’ programs such as:
o directed inspection and maintenance (DI&M), which is a focused
program; and
o comprehensive monitoring programs, which are alternative programs,
some of which are still being developed
• Replace or remove the need for components that persistently leak
121
Case Study. Equinor: Hammerfest LNG leak detection improvements
122
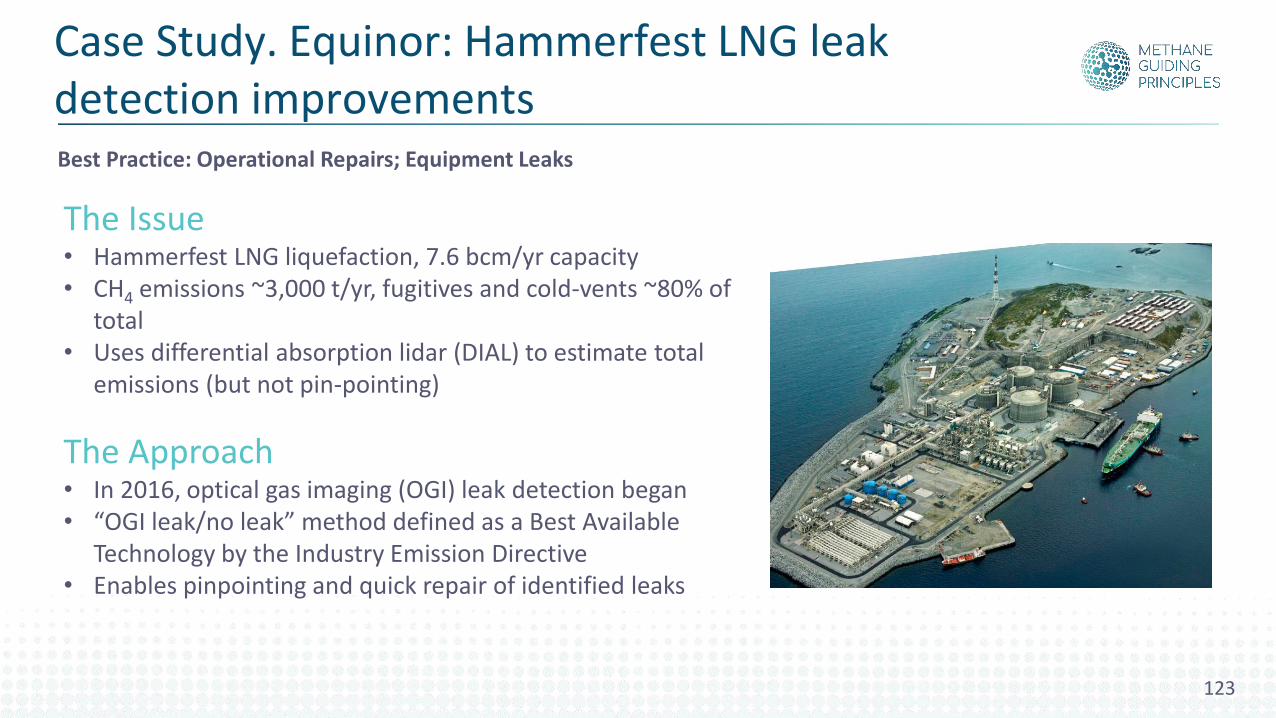
The Issue• Hammerfest LNG liquefaction, 7.6 bcm/yr capacity• CH4 emissions ~3,000 t/yr, fugitives and cold-vents ~80% of
total• Uses differential absorption lidar (DIAL) to estimate total
emissions (but not pin-pointing)
The Approach• In 2016, optical gas imaging (OGI) leak detection began• “OGI leak/no leak” method defined as a Best Available
Technology by the Industry Emission Directive• Enables pinpointing and quick repair of identified leaks
Best Practice: Operational Repairs; Equipment Leaks
Case Study. Equinor: Hammerfest LNG leak detection improvements
123
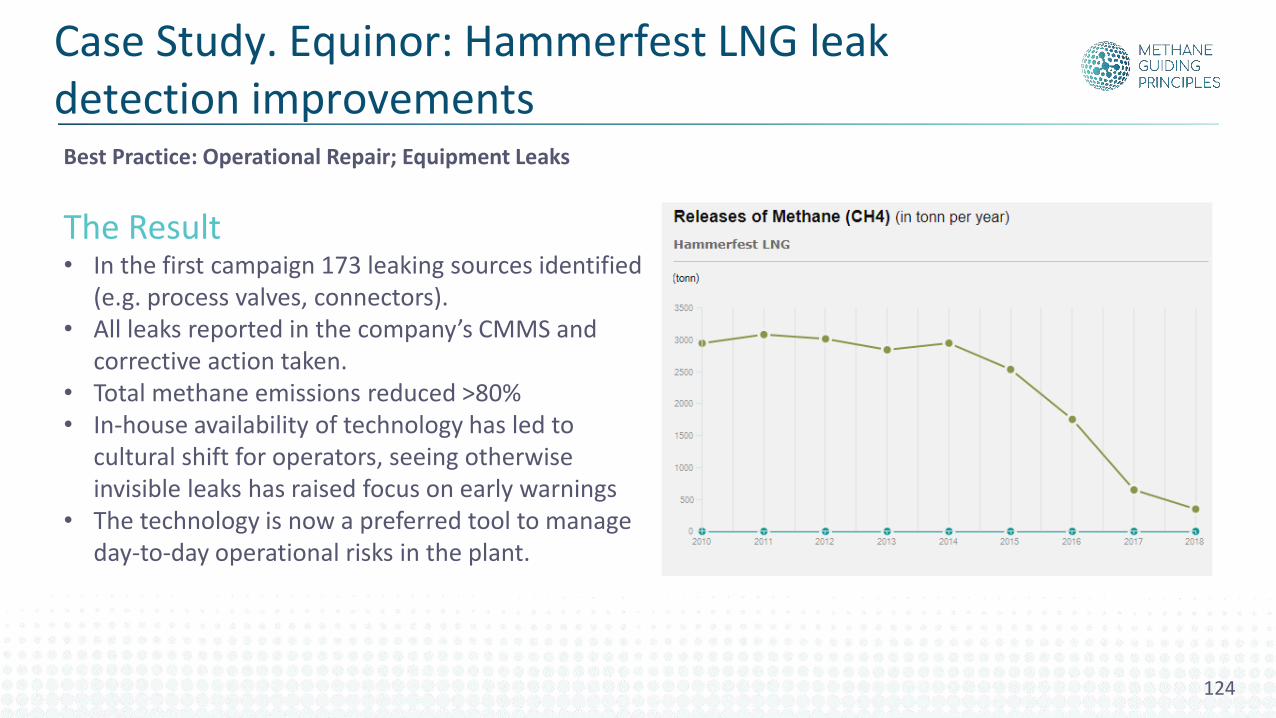
The Result• In the first campaign 173 leaking sources identified
(e.g. process valves, connectors). • All leaks reported in the company’s CMMS and
corrective action taken.• Total methane emissions reduced >80%• In-house availability of technology has led to
cultural shift for operators, seeing otherwise invisible leaks has raised focus on early warnings
• The technology is now a preferred tool to manage day-to-day operational risks in the plant.
Best Practice: Operational Repair; Equipment Leaks
Case Study. Equinor: Hammerfest LNG leak detection improvements
124

Reducing Methane Emissions Best Practices
Best practices:1. Venting2. Pneumatic equipment3. Flaring4. Equipment leaks5. Operational repairs6. Energy use7. Engineering design and construction8. Continual improvement
125
Reducing Methane Emissions Best Practices
Best practices:1. Venting2. Pneumatic equipment3. Flaring4. Equipment leaks
5. Operational repairs6. Energy use7. Engineering design and construction8. Continual improvement
126
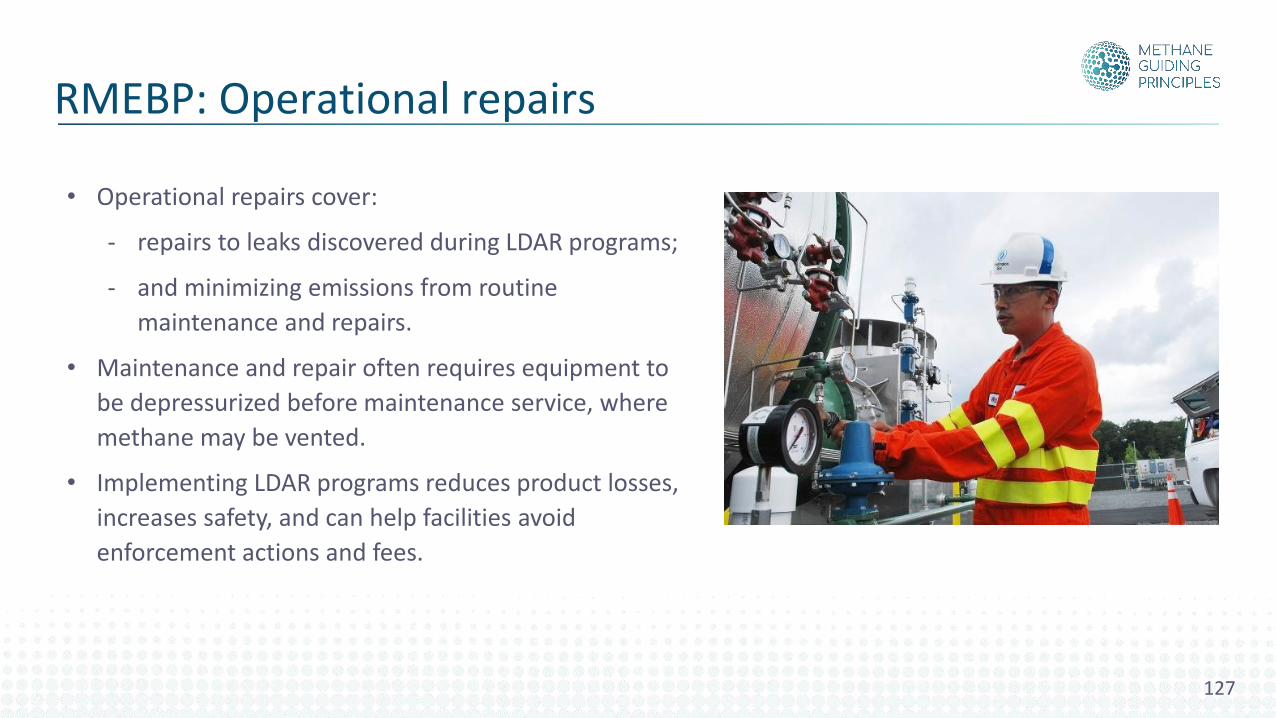
• Operational repairs cover:
- repairs to leaks discovered during LDAR programs;
- and minimizing emissions from routine
maintenance and repairs.
• Maintenance and repair often requires equipment to
be depressurized before maintenance service, where
methane may be vented.
• Implementing LDAR programs reduces product losses,
increases safety, and can help facilities avoid
enforcement actions and fees.
RMEBP: Operational repairs
127
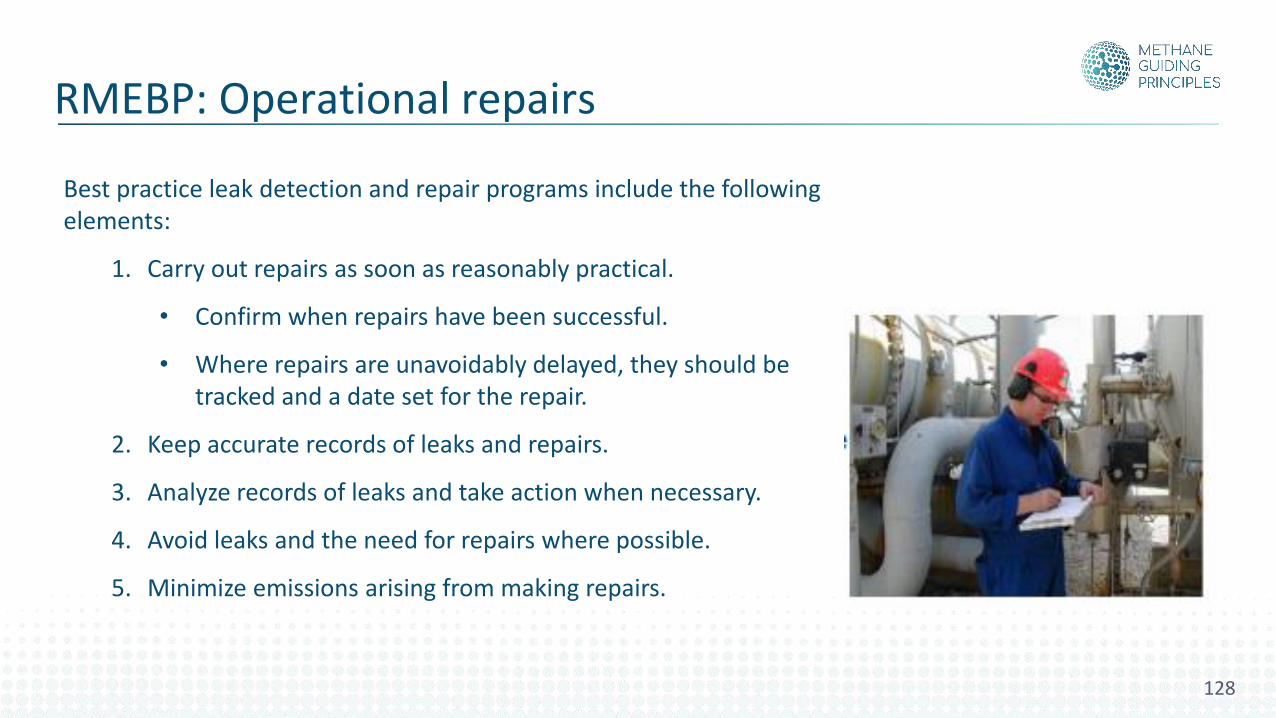
Best practice leak detection and repair programs include the following elements:
1. Carry out repairs as soon as reasonably practical.
• Confirm when repairs have been successful.
• Where repairs are unavoidably delayed, they should be tracked and a date set for the repair.
2. Keep accurate records of leaks and repairs.
3. Analyze records of leaks and take action when necessary.
4. Avoid leaks and the need for repairs where possible.
5. Minimize emissions arising from making repairs.
RMEBP: Operational repairs
128
To avoid emissions arising from traditional maintenance and repairs. • Make new connections to pipelines using hot taps, and so avoid the need to depressurize the
pipeline. • Use non-intrusive inspection, such as inline inspection tools, to avoid larger blowdowns for
inspections. • Look for opportunities to co-ordinate operational repairs and routine maintenance and repairs
to minimize the number of blowdowns.
To minimize emissions arising from traditional maintenance and repairs. • Plan for venting-reduction steps such as ‘pressure pumpdowns’ when large vessels and
pipelines need to be isolated and depressurized. • Minimize the volume that has to be handled. For some long pipelines, this could be careful
selection of where to isolate the line, or adding stops to isolate a smaller section of line. • Reduce emissions from pigging by recapturing the released gas using a vapor-recovery unit. • If venting cannot be avoided, consider flaring to reduce the emissions impact.
RMEBP: Operational repairs
129
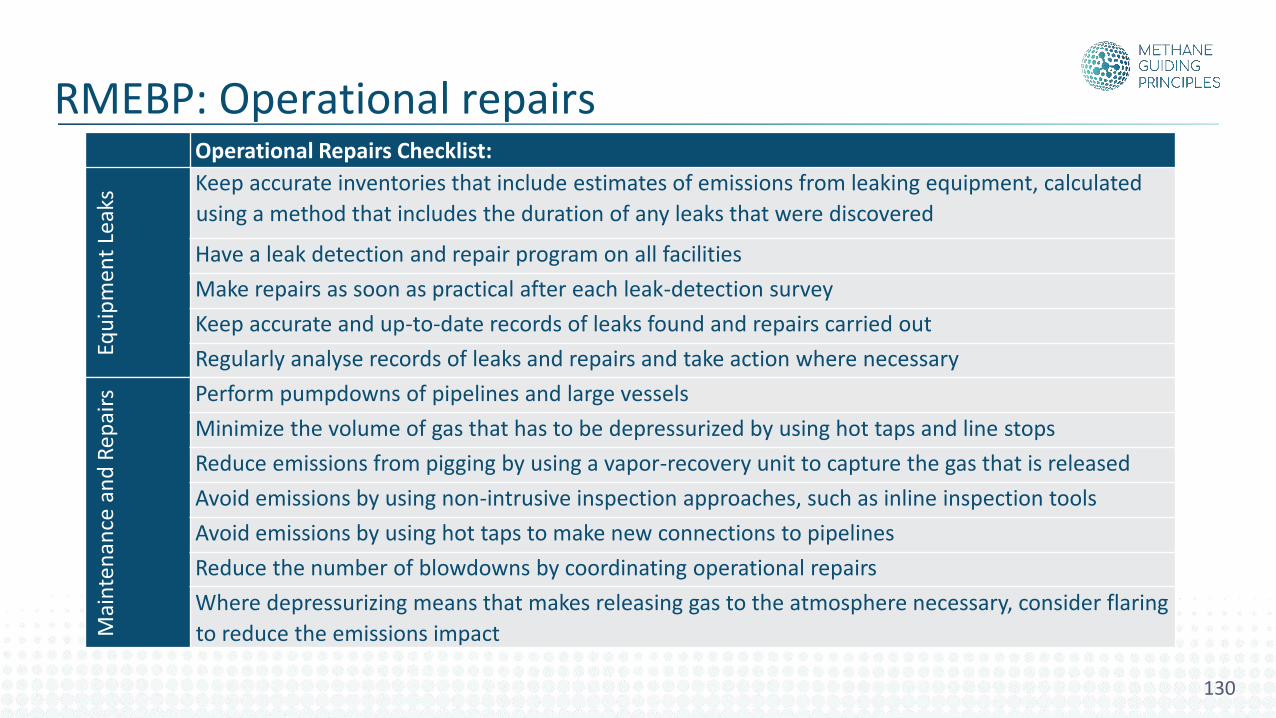
Operational Repairs Checklist:
Equ
ipm
en
t Le
aks Keep accurate inventories that include estimates of emissions from leaking equipment, calculated
using a method that includes the duration of any leaks that were discovered
Have a leak detection and repair program on all facilities
Make repairs as soon as practical after each leak-detection survey
Keep accurate and up-to-date records of leaks found and repairs carried out
Regularly analyse records of leaks and repairs and take action where necessary
Mai
nte
nan
ce a
nd
Rep
airs Perform pumpdowns of pipelines and large vessels
Minimize the volume of gas that has to be depressurized by using hot taps and line stops
Reduce emissions from pigging by using a vapor-recovery unit to capture the gas that is released
Avoid emissions by using non-intrusive inspection approaches, such as inline inspection tools
Avoid emissions by using hot taps to make new connections to pipelines
Reduce the number of blowdowns by coordinating operational repairs
Where depressurizing means that makes releasing gas to the atmosphere necessary, consider flaring
to reduce the emissions impact
RMEBP: Operational RepairsRMEBP: Operational repairs
130
131
Case study. Enagás: Fugitive emissions reduction, LDAR campaigns
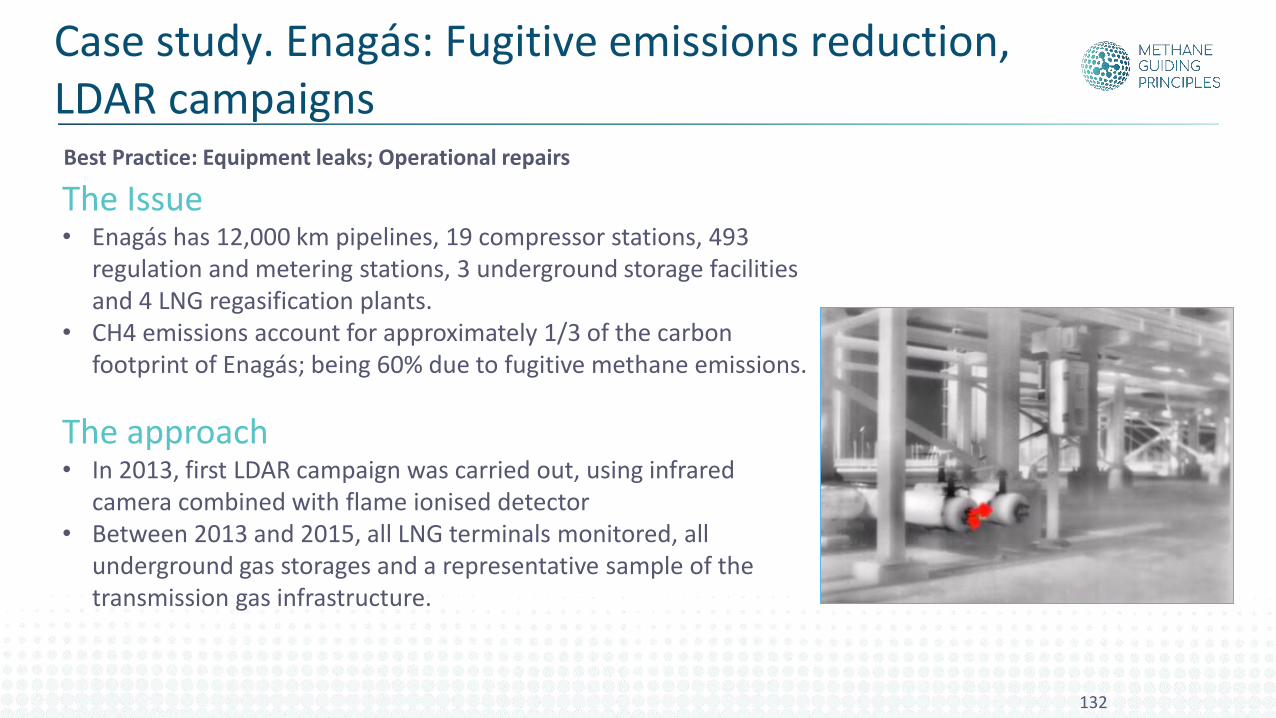
The Issue• Enagás has 12,000 km pipelines, 19 compressor stations, 493
regulation and metering stations, 3 underground storage facilities and 4 LNG regasification plants.
• CH4 emissions account for approximately 1/3 of the carbon footprint of Enagás; being 60% due to fugitive methane emissions.
The approach• In 2013, first LDAR campaign was carried out, using infrared
camera combined with flame ionised detector • Between 2013 and 2015, all LNG terminals monitored, all
underground gas storages and a representative sample of the transmission gas infrastructure.
132
Best Practice: Equipment leaks; Operational repairs
Case study. Enagás: Fugitive emissions reduction, LDAR campaigns
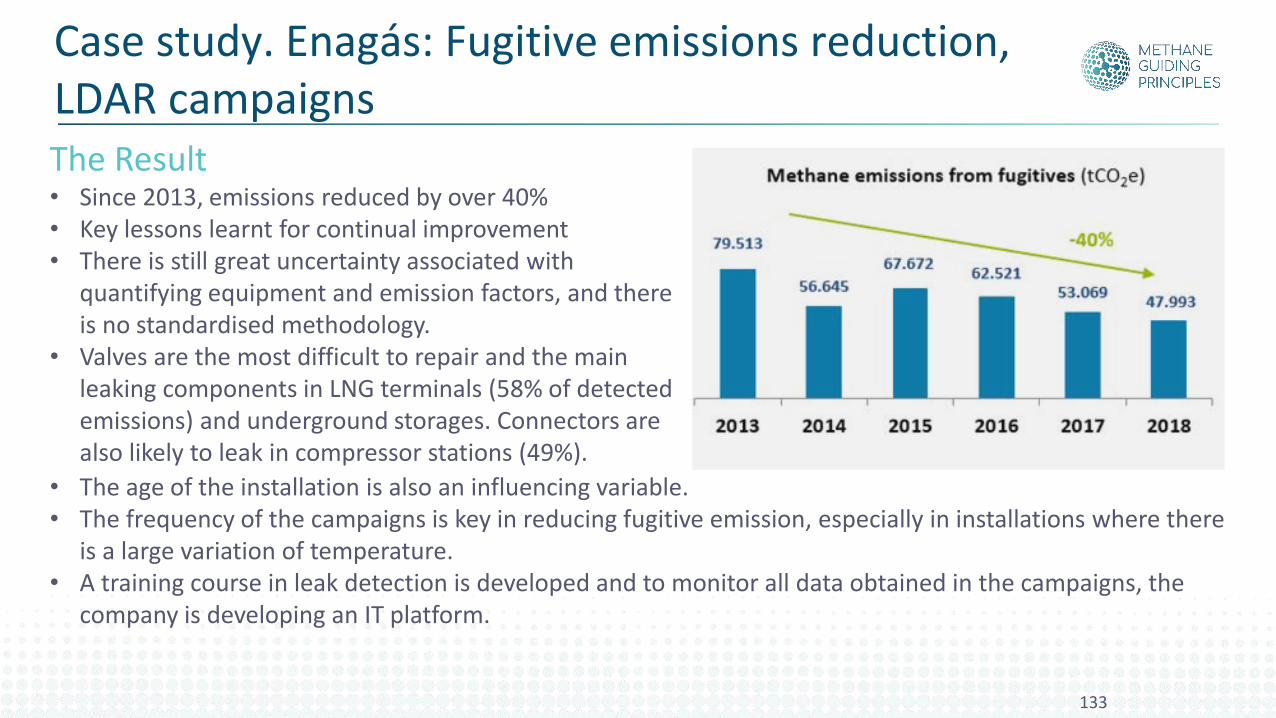
The Result• Since 2013, emissions reduced by over 40%• Key lessons learnt for continual improvement• There is still great uncertainty associated with
quantifying equipment and emission factors, and there is no standardised methodology.
• Valves are the most difficult to repair and the main leaking components in LNG terminals (58% of detected emissions) and underground storages. Connectors are also likely to leak in compressor stations (49%).
• The age of the installation is also an influencing variable.• The frequency of the campaigns is key in reducing fugitive emission, especially in installations where there
is a large variation of temperature. • A training course in leak detection is developed and to monitor all data obtained in the campaigns, the
company is developing an IT platform.
133
Case study. Enagás: Fugitive emissions reduction, LDAR campaigns
Reducing Methane Emissions Best Practices
Compressor station cost model…

Reducing Methane Emissions Best Practices
Best practices:1. Venting2. Pneumatic equipment3. Flaring4. Equipment leaks5. Operational repairs6. Energy use7. Engineering design and construction8. Continual improvement
136
Reducing Methane Emissions Best Practices
Best practices:1. Venting2. Pneumatic equipment3. Flaring4. Equipment leaks5. Operational repairs
6. Energy use7. Engineering design and construction8. Continual improvement
137
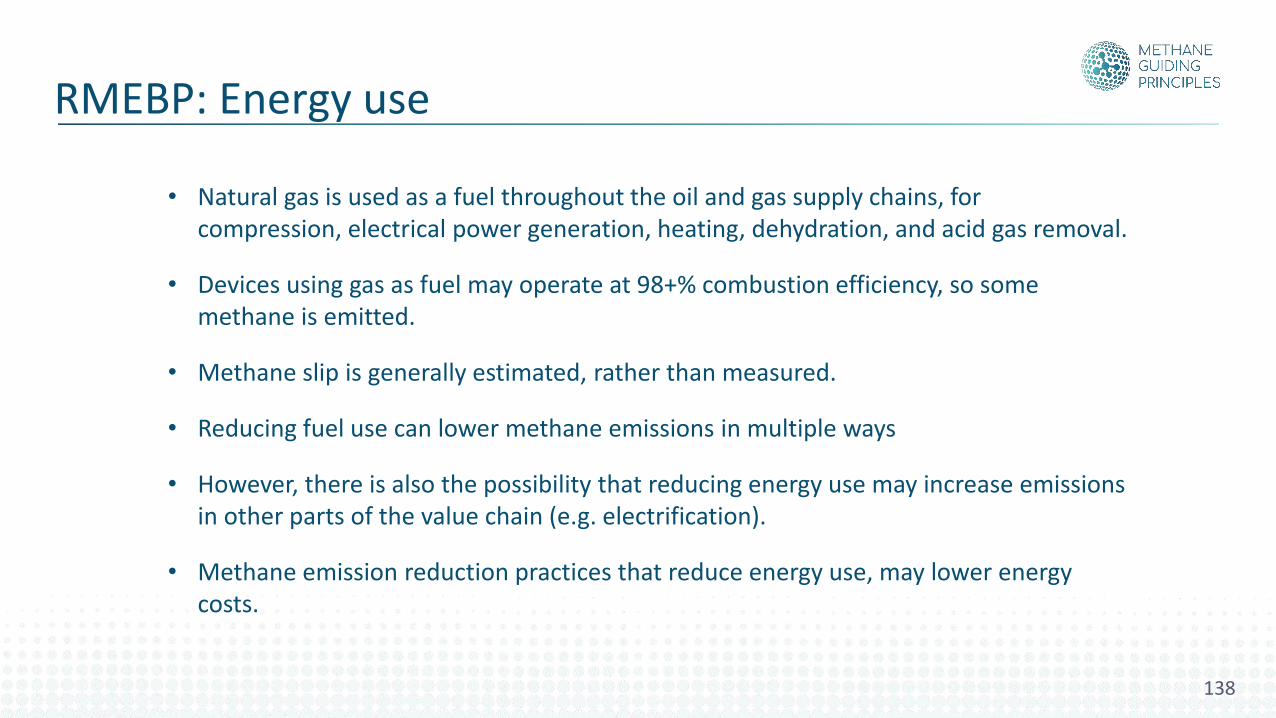
• Natural gas is used as a fuel throughout the oil and gas supply chains, for compression, electrical power generation, heating, dehydration, and acid gas removal.
• Devices using gas as fuel may operate at 98+% combustion efficiency, so some methane is emitted.
• Methane slip is generally estimated, rather than measured.
• Reducing fuel use can lower methane emissions in multiple ways
• However, there is also the possibility that reducing energy use may increase emissions in other parts of the value chain (e.g. electrification).
• Methane emission reduction practices that reduce energy use, may lower energy costs.
RMEBP: Energy use
138
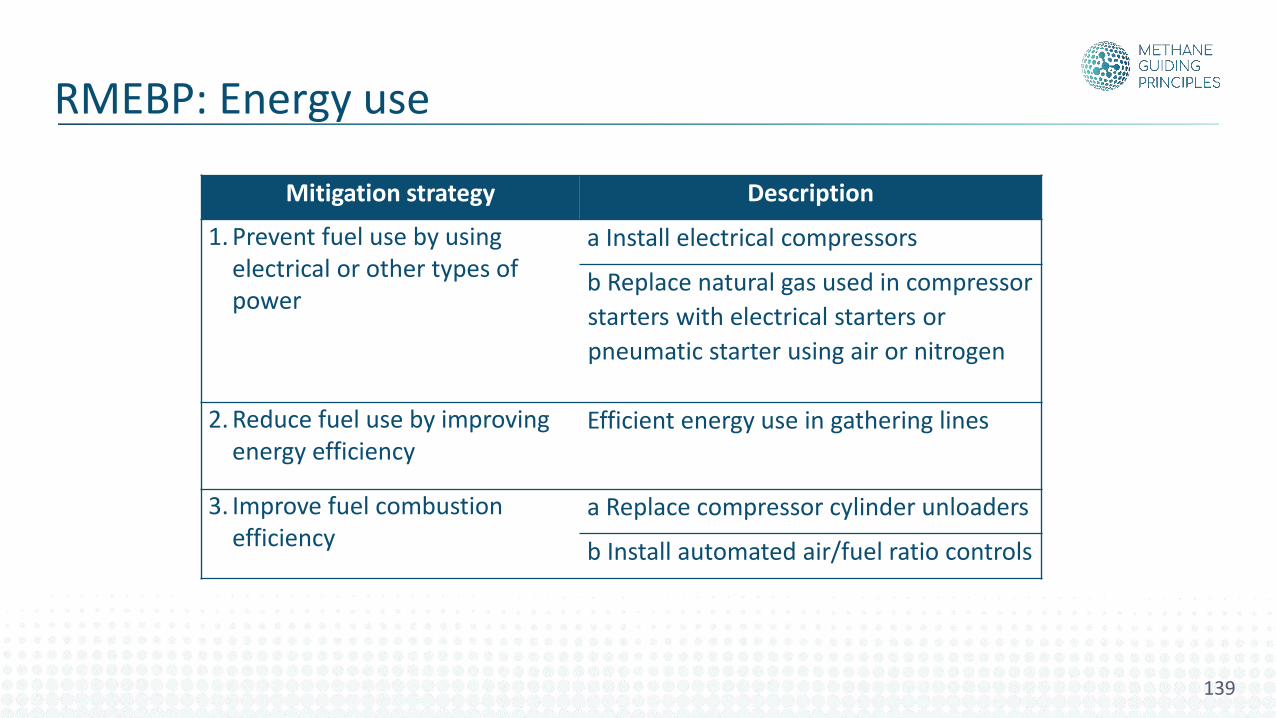
Mitigation strategy Description
1. Prevent fuel use by using electrical or other types of power
a Install electrical compressors
b Replace natural gas used in compressor
starters with electrical starters or
pneumatic starter using air or nitrogen
2. Reduce fuel use by improving energy efficiency
Efficient energy use in gathering lines
3. Improve fuel combustion efficiency
a Replace compressor cylinder unloaders
b Install automated air/fuel ratio controls
RMEBP: Energy use
139
RMEBP: Energy use
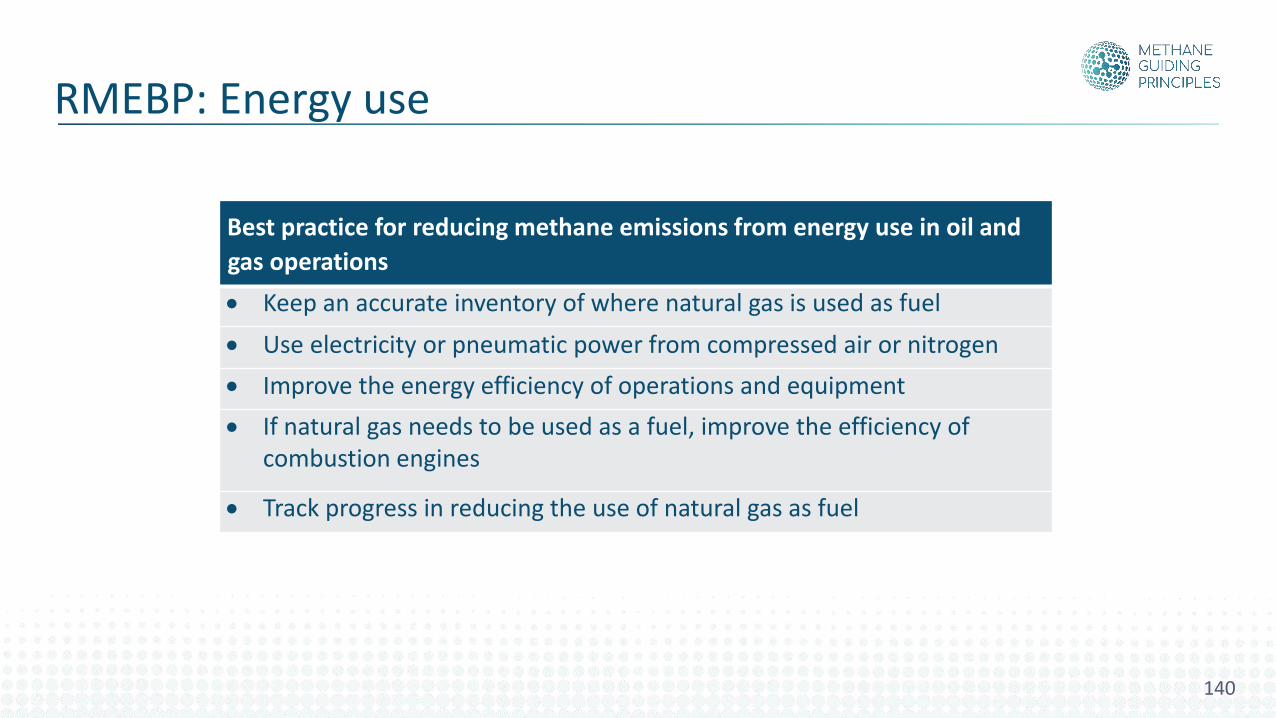
Best practice for reducing methane emissions from energy use in oil and
gas operations
• Keep an accurate inventory of where natural gas is used as fuel
• Use electricity or pneumatic power from compressed air or nitrogen
• Improve the energy efficiency of operations and equipment
• If natural gas needs to be used as a fuel, improve the efficiency of combustion engines
• Track progress in reducing the use of natural gas as fuel
140

Reducing Methane Emissions Best Practices
Best practices:1. Venting2. Pneumatic equipment3. Flaring4. Equipment leaks5. Operational repairs6. Energy use7. Engineering design and construction8. Continual improvement
141
Reducing Methane Emissions Best Practices
Best practices:1. Venting2. Pneumatic equipment3. Flaring4. Equipment leaks5. Operational repairs6. Energy use
7. Engineering design and construction8. Continual improvement
142
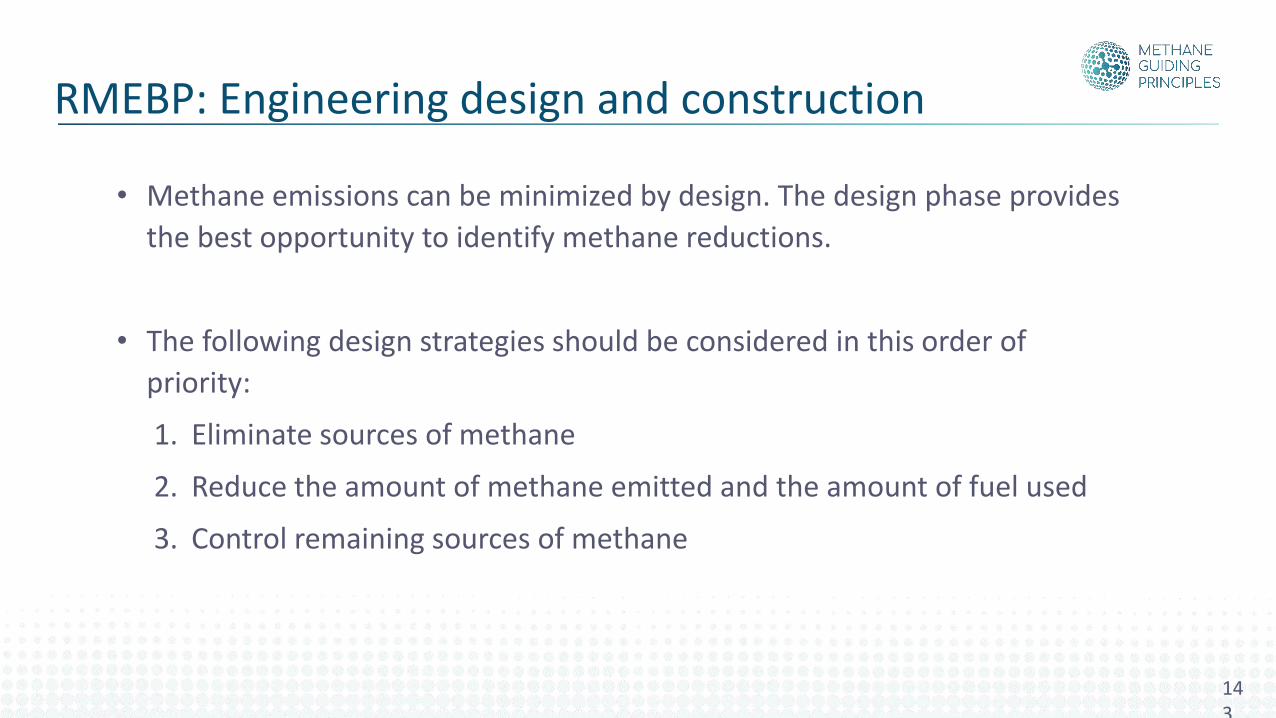
• Methane emissions can be minimized by design. The design phase provides
the best opportunity to identify methane reductions.
• The following design strategies should be considered in this order of
priority:
1. Eliminate sources of methane
2. Reduce the amount of methane emitted and the amount of fuel used
3. Control remaining sources of methane
RMEBP: Engineering design and construction
143
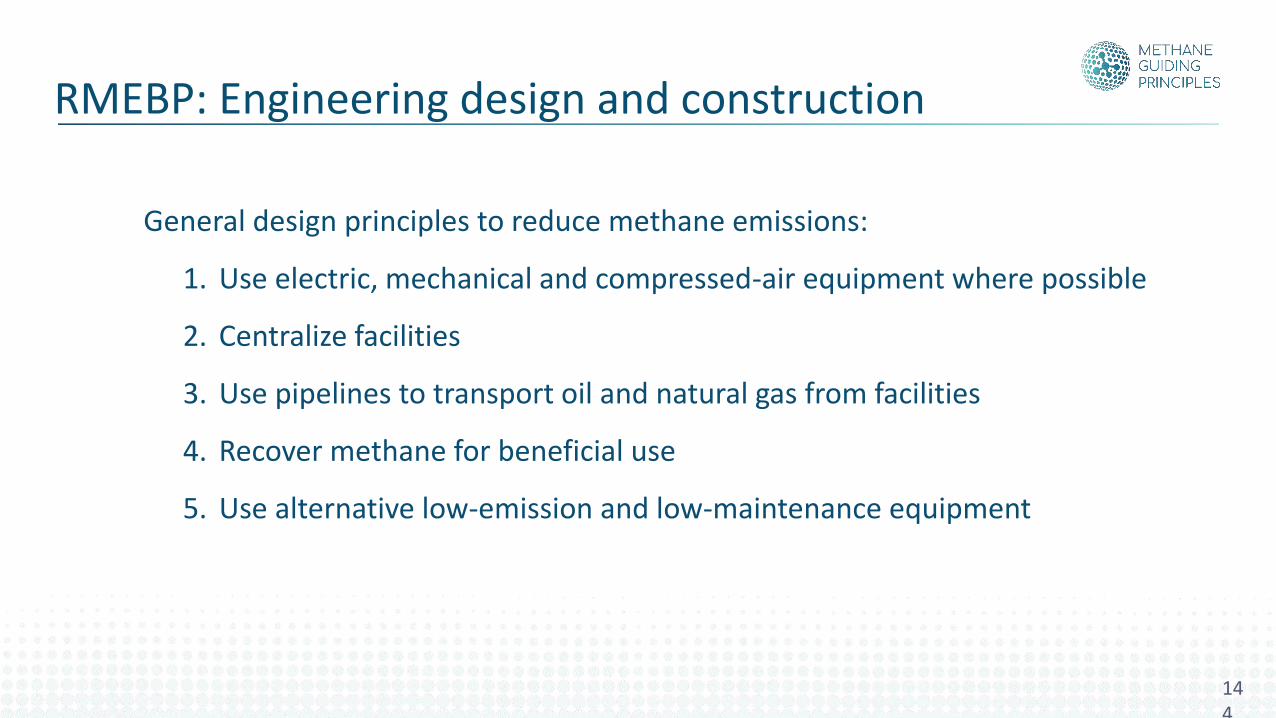
General design principles to reduce methane emissions:
1. Use electric, mechanical and compressed-air equipment where possible
2. Centralize facilities
3. Use pipelines to transport oil and natural gas from facilities
4. Recover methane for beneficial use
5. Use alternative low-emission and low-maintenance equipment
RMEBP: Engineering design and construction
144
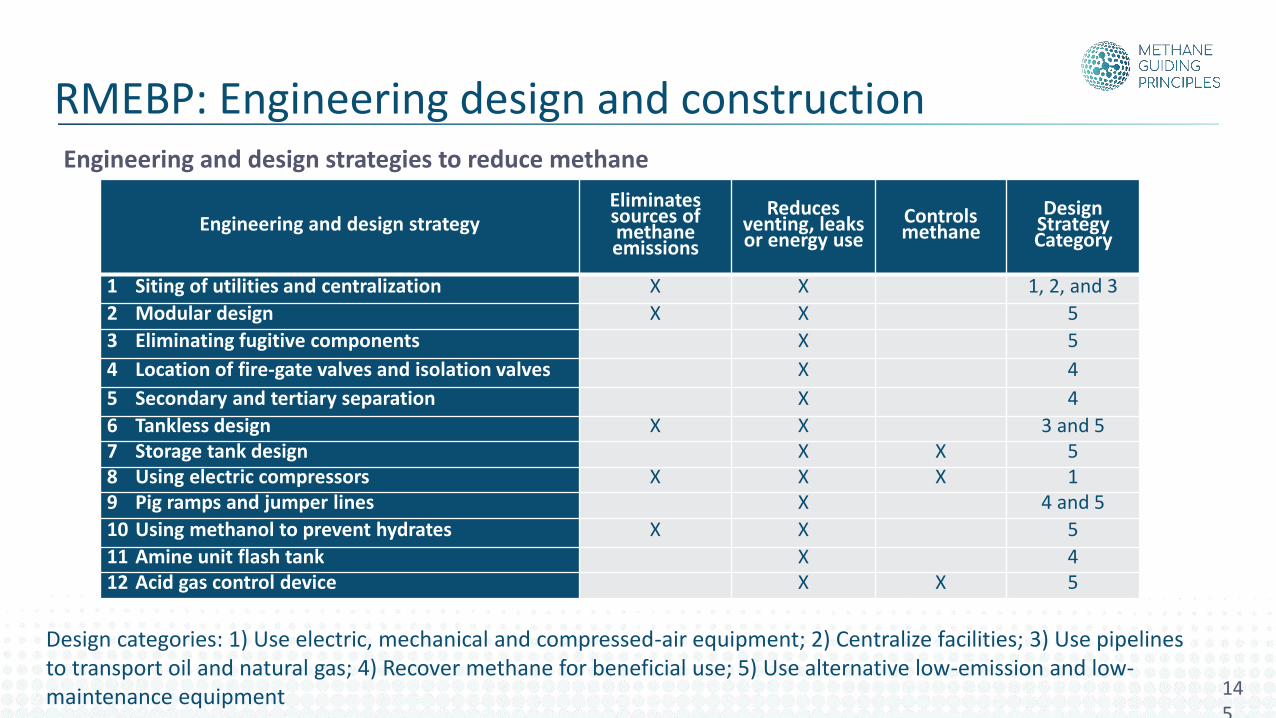
Engineering and design strategies to reduce methane
RMEBP: Engineering design and construction
145
Engineering and design strategy Eliminates sources of methane emissions
Reduces venting, leaks or energy use
Controls methane
Design Strategy Category
1 Siting of utilities and centralization X X 1, 2, and 3
2 Modular design X X 5
3 Eliminating fugitive components X 5
4 Location of fire-gate valves and isolation valves X 4
5 Secondary and tertiary separation X 4
6 Tankless design X X 3 and 57 Storage tank design X X 58 Using electric compressors X X X 19 Pig ramps and jumper lines X 4 and 5
10 Using methanol to prevent hydrates X X 5
11 Amine unit flash tank X 412 Acid gas control device X X 5
Design categories: 1) Use electric, mechanical and compressed-air equipment; 2) Centralize facilities; 3) Use pipelines to transport oil and natural gas; 4) Recover methane for beneficial use; 5) Use alternative low-emission and low-maintenance equipment
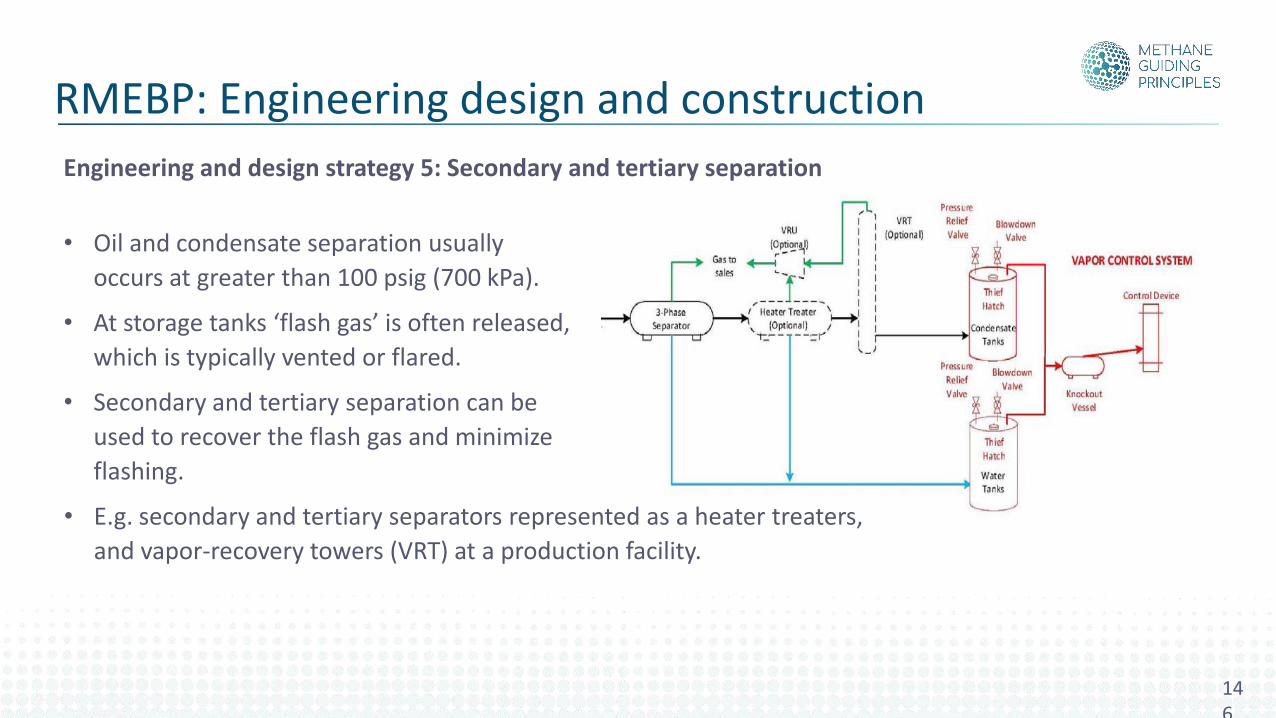
Engineering and design strategy 5: Secondary and tertiary separation
• Oil and condensate separation usually
occurs at greater than 100 psig (700 kPa).
• At storage tanks ‘flash gas’ is often released,
which is typically vented or flared.
• Secondary and tertiary separation can be
used to recover the flash gas and minimize
flashing.
• E.g. secondary and tertiary separators represented as a heater treaters,
and vapor-recovery towers (VRT) at a production facility.
RMEBP: Engineering design and construction
146
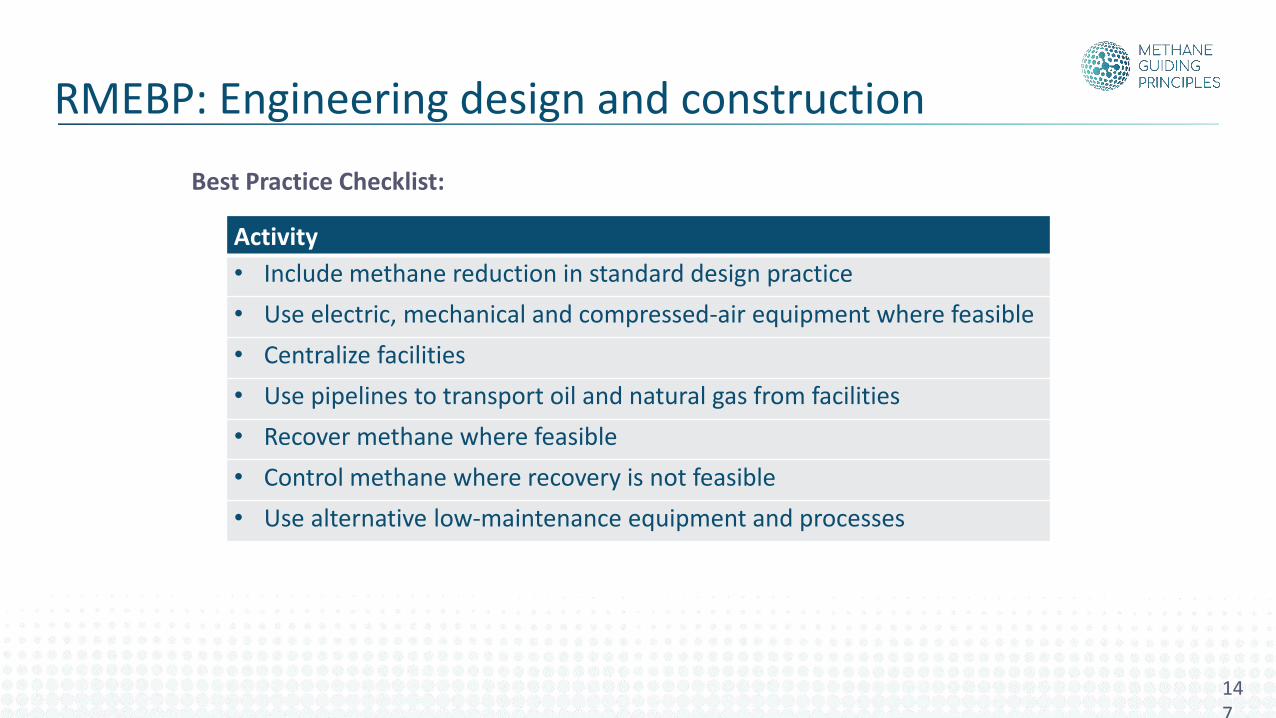
Activity
• Include methane reduction in standard design practice
• Use electric, mechanical and compressed-air equipment where feasible
• Centralize facilities
• Use pipelines to transport oil and natural gas from facilities
• Recover methane where feasible
• Control methane where recovery is not feasible
• Use alternative low-maintenance equipment and processes
Best Practice Checklist:
RMEBP: Engineering design and construction
147
Case Study. QP: Jetty Boil-off Gas Recovery Project
148
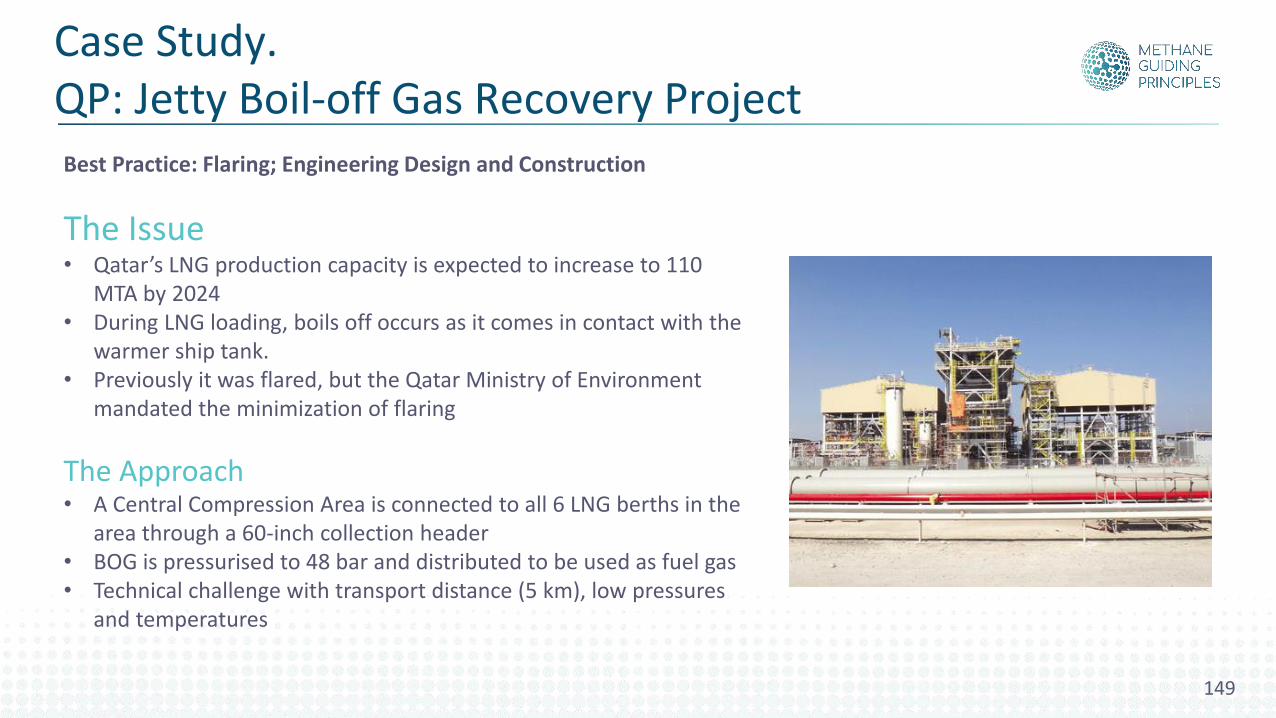
The Issue• Qatar’s LNG production capacity is expected to increase to 110
MTA by 2024• During LNG loading, boils off occurs as it comes in contact with the
warmer ship tank. • Previously it was flared, but the Qatar Ministry of Environment
mandated the minimization of flaring
The Approach• A Central Compression Area is connected to all 6 LNG berths in the
area through a 60-inch collection header• BOG is pressurised to 48 bar and distributed to be used as fuel gas• Technical challenge with transport distance (5 km), low pressures
and temperatures
Best Practice: Flaring; Engineering Design and Construction
Case Study. QP: Jetty Boil-off Gas Recovery Project
149
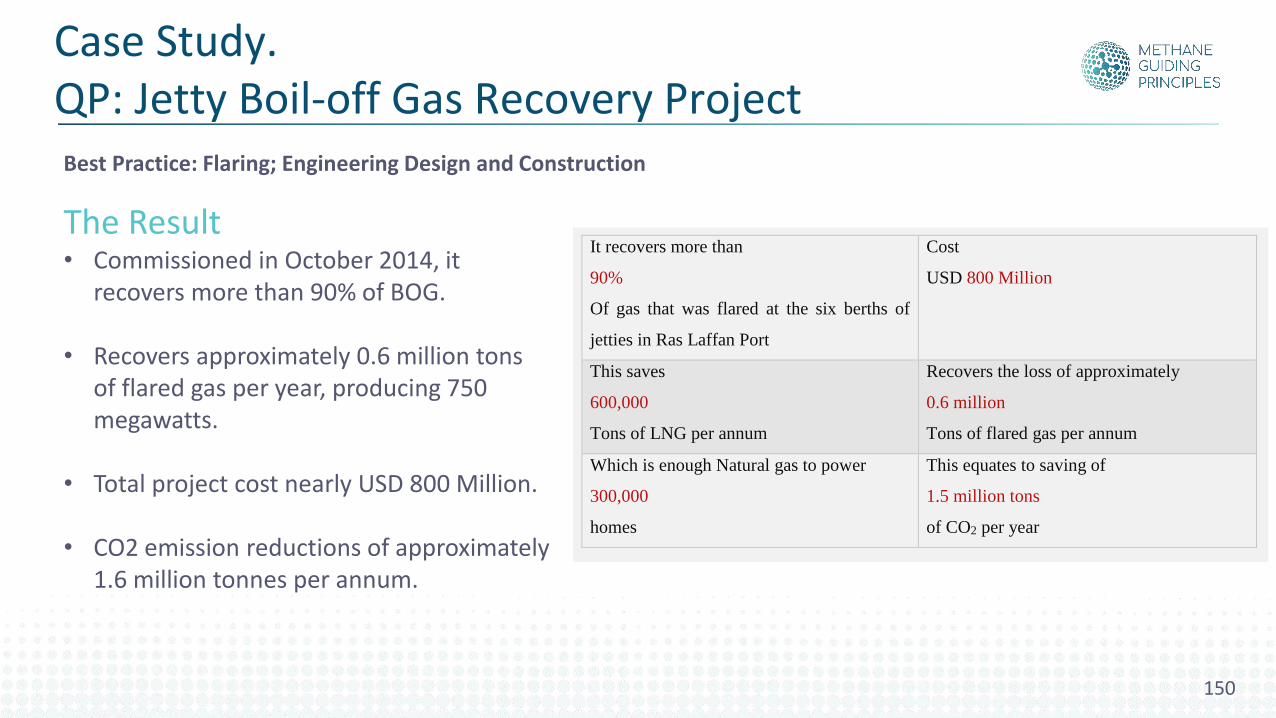
It recovers more than
90%
Of gas that was flared at the six berths of
jetties in Ras Laffan Port
Cost
USD 800 Million
This saves
600,000
Tons of LNG per annum
Recovers the loss of approximately
0.6 million
Tons of flared gas per annum
Which is enough Natural gas to power
300,000
homes
This equates to saving of
1.5 million tons
of CO2 per year
The Result• Commissioned in October 2014, it
recovers more than 90% of BOG.
• Recovers approximately 0.6 million tons of flared gas per year, producing 750 megawatts.
• Total project cost nearly USD 800 Million.
• CO2 emission reductions of approximately 1.6 million tonnes per annum.
Best Practice: Flaring; Engineering Design and Construction
Case Study. QP: Jetty Boil-off Gas Recovery Project
150
Gap assessment tool
What is it for• A simple excel tool asking you to rate your asset/organisation’s performance on
methane emissions management and continual improvement• A resource for asset managers to baseline methane management achievement and
identify improvement areas• A diagnostic tool to provide preliminary insights against current best practices• Uses the continual improvement plan-do-check-act categorisation
Where to find it• MGP webpage: www.methaneguidingprinciples.org/
Here’s what it looks like…
151

Gap assessment tool
Activity• To demonstrate the types of questions and opportunities for improvement, let’s
conduct a survey here…
• On your own device, please go to www.socrative.com• Go to login, then ‘student login’• Type in the Room Name: MGPMASTERCLASS
152

Reducing Methane Emissions Best Practices
Best practices:1. Venting2. Pneumatic equipment3. Flaring4. Equipment leaks5. Operational repairs6. Energy use7. Engineering design and construction8. Continual improvement
153
Reducing Methane Emissions Best Practices
Best practices:1. Venting2. Pneumatic equipment3. Flaring4. Equipment leaks5. Operational repairs6. Energy use7. Engineering design and construction
8. Continual improvement
154
• Methods to reduce methane emissions (mitigation) drive discrete reductions, but continual improvement of methane management is needed to maintain a company-wide culture of methane excellence.
• Continual improvement of methane management can lead to recognition for methane excellence and help improve the reputation and long-term acceptance of the asset, the organization and the oil and gas industry as a whole.
• The most important factor to achieving methane excellence is commitment from everyone – ranging from senior leadership to frontline employees.
RMEBP: Continual improvement
155
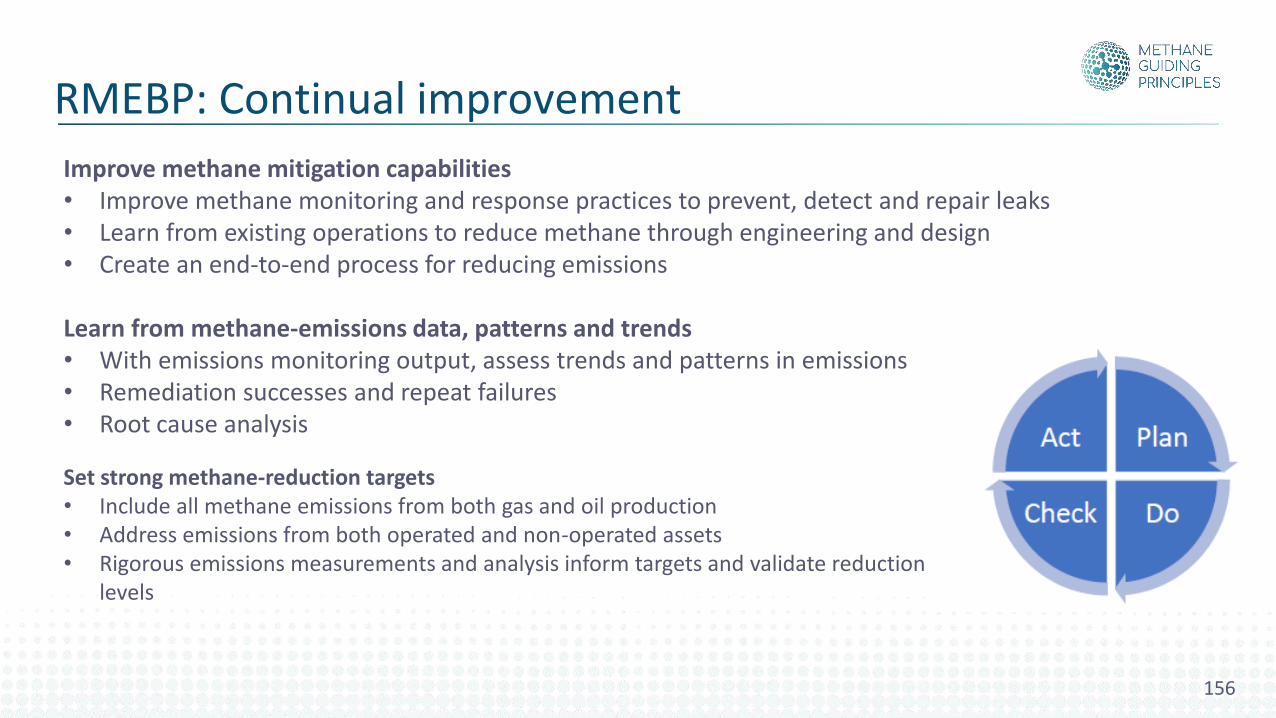
Improve methane mitigation capabilities• Improve methane monitoring and response practices to prevent, detect and repair leaks• Learn from existing operations to reduce methane through engineering and design• Create an end-to-end process for reducing emissions
Learn from methane-emissions data, patterns and trends• With emissions monitoring output, assess trends and patterns in emissions• Remediation successes and repeat failures• Root cause analysis
RMEBP: Continual improvement
Set strong methane-reduction targets• Include all methane emissions from both gas and oil production• Address emissions from both operated and non-operated assets• Rigorous emissions measurements and analysis inform targets and validate reduction
levels
156
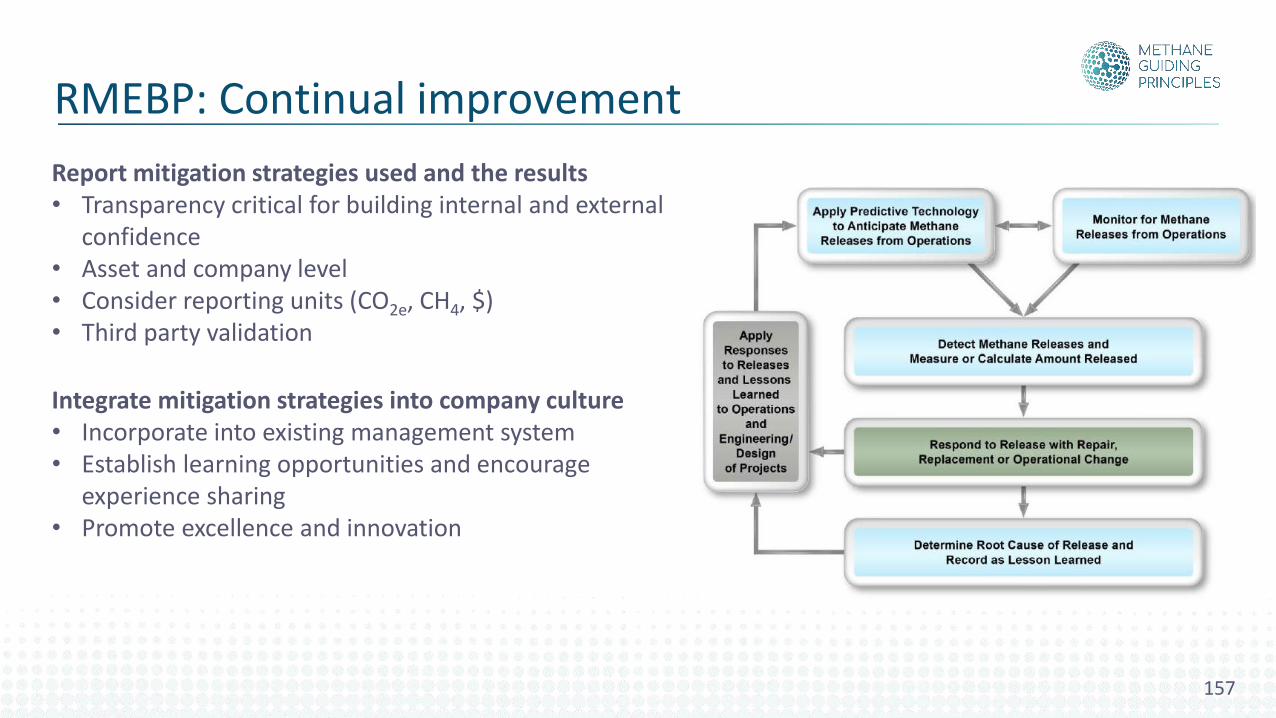
Report mitigation strategies used and the results• Transparency critical for building internal and external
confidence• Asset and company level• Consider reporting units (CO2e, CH4, $)• Third party validation
RMEBP: Continual improvement
Integrate mitigation strategies into company culture• Incorporate into existing management system• Establish learning opportunities and encourage
experience sharing• Promote excellence and innovation
157
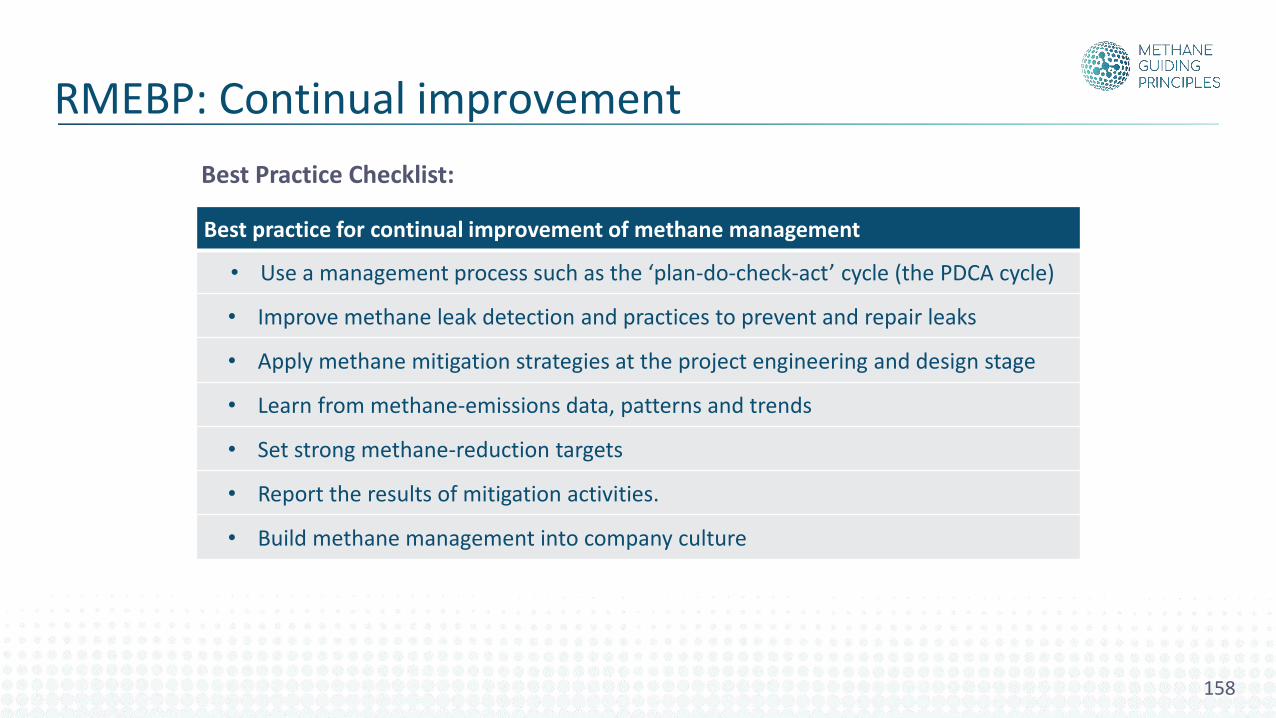
Best practice for continual improvement of methane management
• Use a management process such as the ‘plan-do-check-act’ cycle (the PDCA cycle)
• Improve methane leak detection and practices to prevent and repair leaks
• Apply methane mitigation strategies at the project engineering and design stage
• Learn from methane-emissions data, patterns and trends
• Set strong methane-reduction targets
• Report the results of mitigation activities.
• Build methane management into company culture
Best Practice Checklist:
RMEBP: Continual improvement
158
159
Case Study. TOTAL: Methane Emission Measurement Testing Facility
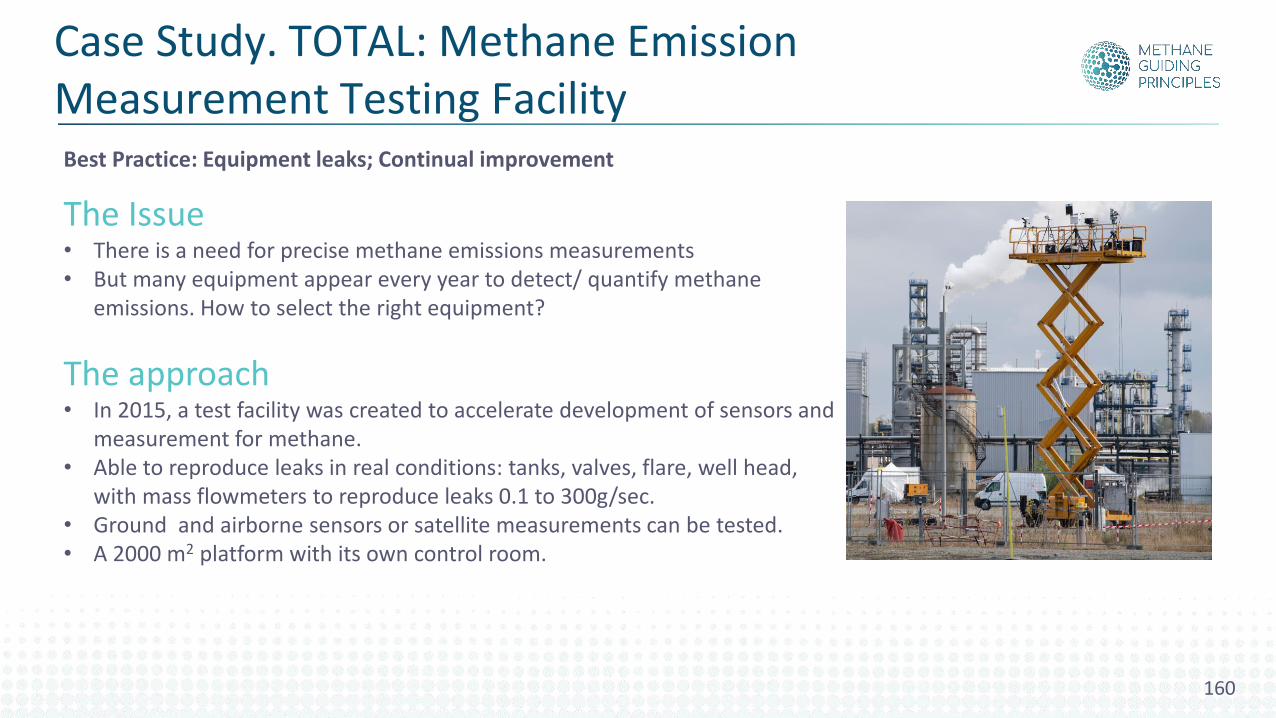
The Issue• There is a need for precise methane emissions measurements• But many equipment appear every year to detect/ quantify methane
emissions. How to select the right equipment?
The approach• In 2015, a test facility was created to accelerate development of sensors and
measurement for methane. • Able to reproduce leaks in real conditions: tanks, valves, flare, well head,
with mass flowmeters to reproduce leaks 0.1 to 300g/sec.• Ground and airborne sensors or satellite measurements can be tested.• A 2000 m2 platform with its own control room.
Best Practice: Equipment leaks; Continual improvement
Case Study. TOTAL: Methane Emission Measurement Testing Facility
160
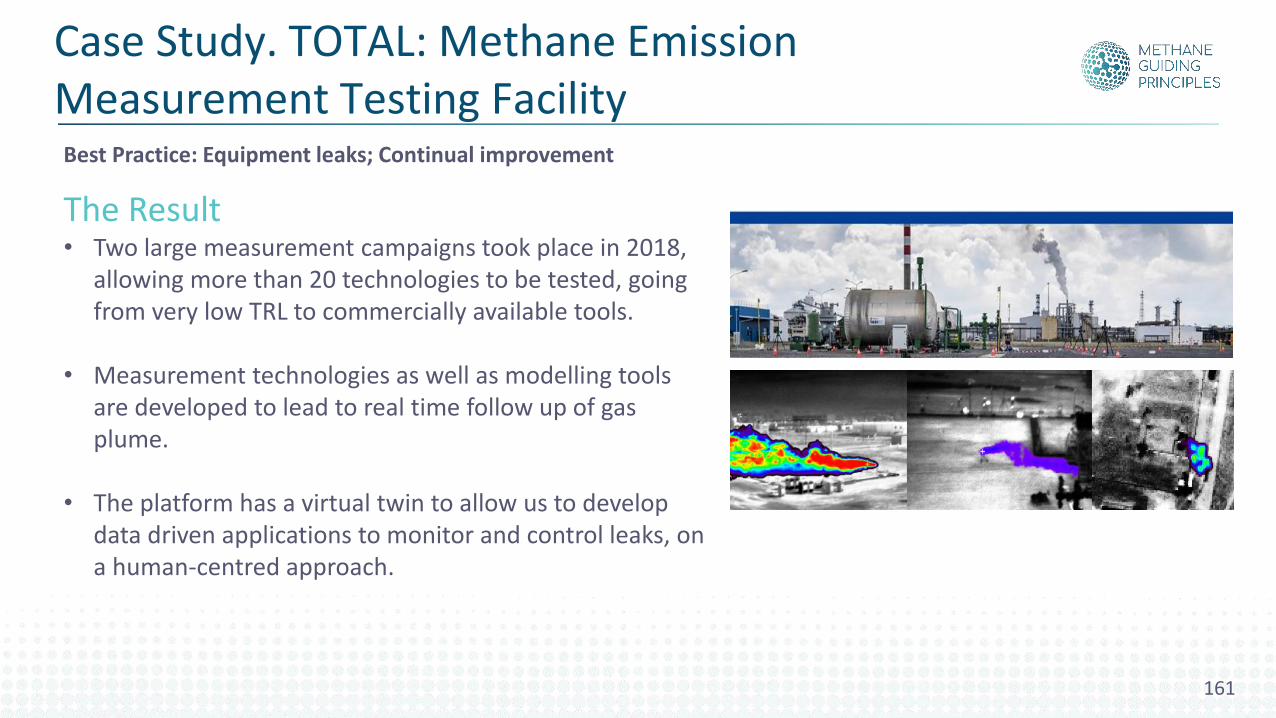
The Result• Two large measurement campaigns took place in 2018,
allowing more than 20 technologies to be tested, going from very low TRL to commercially available tools.
• Measurement technologies as well as modelling tools are developed to lead to real time follow up of gas plume.
• The platform has a virtual twin to allow us to develop data driven applications to monitor and control leaks, on a human-centred approach.
Best Practice: Equipment leaks; Continual improvement
Case Study. TOTAL: Methane Emission Measurement Testing Facility
161
Case Study. National Grid: Continuous monitoring of emissions
162
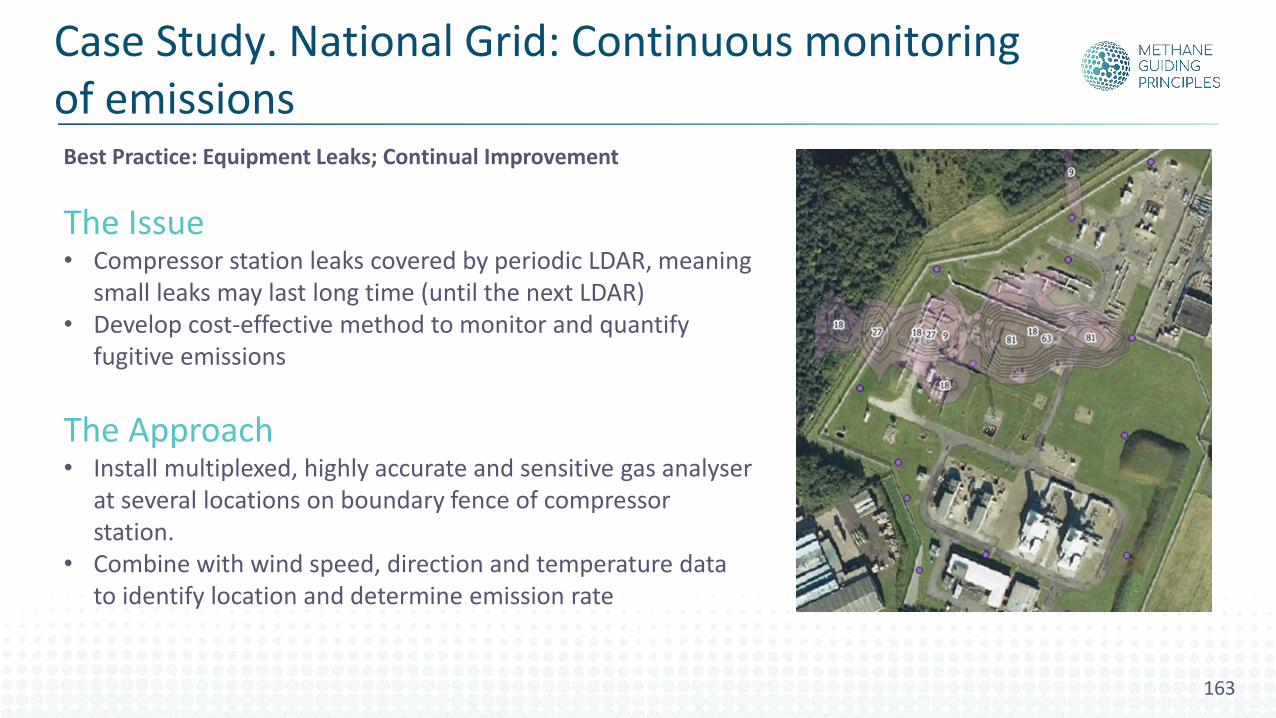
Best Practice: Equipment Leaks; Continual Improvement
The Issue• Compressor station leaks covered by periodic LDAR, meaning
small leaks may last long time (until the next LDAR)• Develop cost-effective method to monitor and quantify
fugitive emissions
The Approach• Install multiplexed, highly accurate and sensitive gas analyser
at several locations on boundary fence of compressor station.
• Combine with wind speed, direction and temperature data to identify location and determine emission rate
Case Study. National Grid: Continuous monitoring of emissions
163
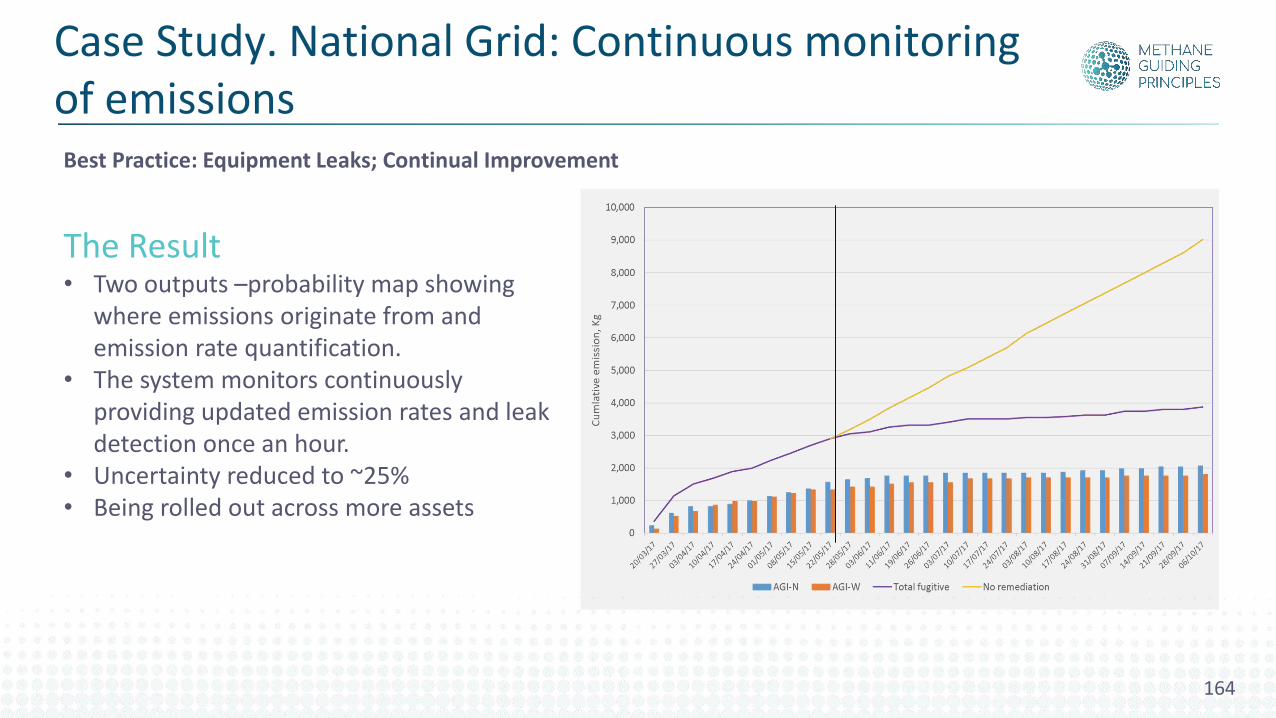
The Result• Two outputs –probability map showing
where emissions originate from and emission rate quantification.
• The system monitors continuously providing updated emission rates and leak detection once an hour.
• Uncertainty reduced to ~25%• Being rolled out across more assets
Best Practice: Equipment Leaks; Continual Improvement
Case Study. National Grid: Continuous monitoring of emissions
164
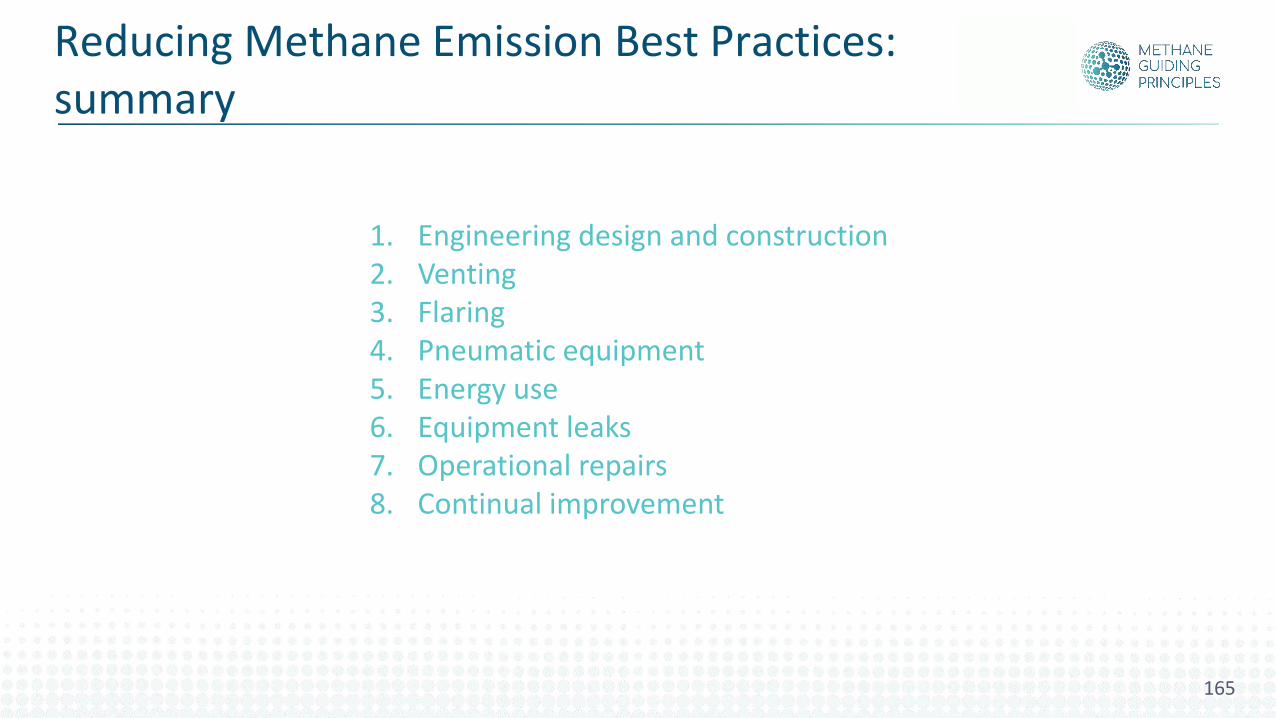
Reducing Methane Emissions Best Practices
1. Engineering design and construction2. Venting3. Flaring4. Pneumatic equipment5. Energy use6. Equipment leaks7. Operational repairs8. Continual improvement
Reducing Methane Emission Best Practices: summary
165
Outreach programme
Reducing methane emissions: Summary
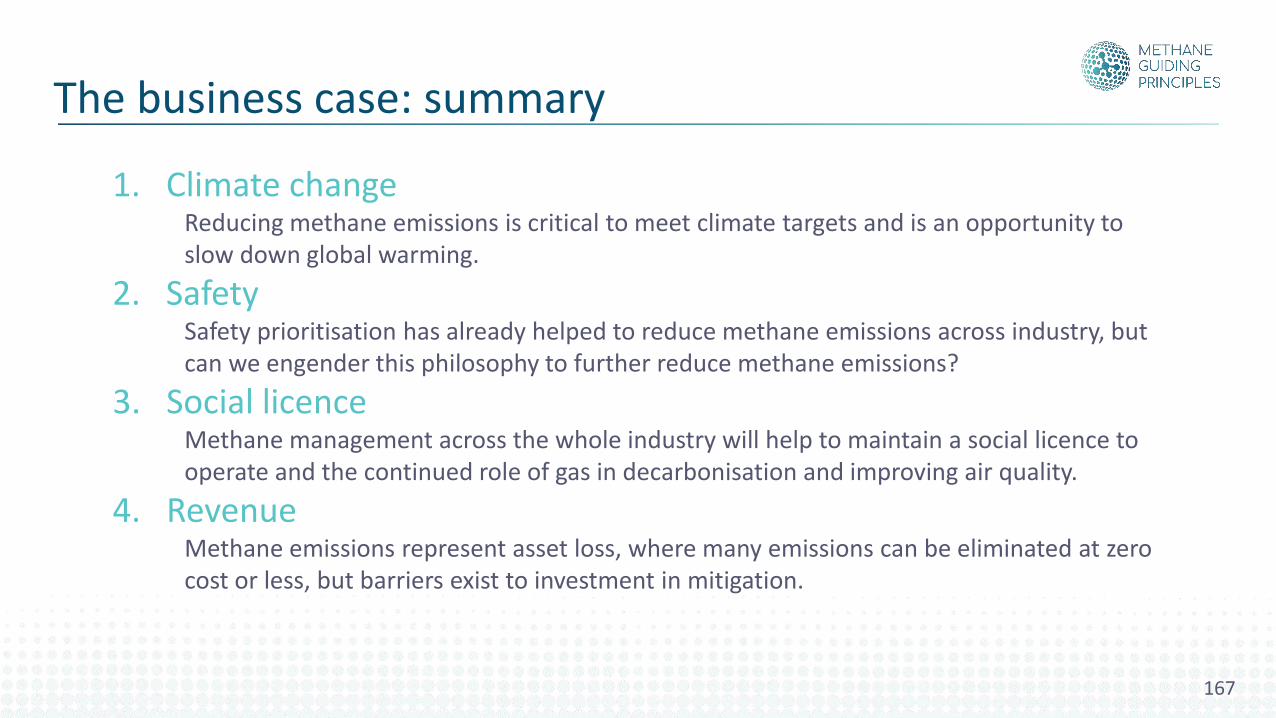
1. Climate changeReducing methane emissions is critical to meet climate targets and is an opportunity to slow down global warming.
2. SafetySafety prioritisation has already helped to reduce methane emissions across industry, but can we engender this philosophy to further reduce methane emissions?
3. Social licenceMethane management across the whole industry will help to maintain a social licence to operate and the continued role of gas in decarbonisation and improving air quality.
4. RevenueMethane emissions represent asset loss, where many emissions can be eliminated at zero cost or less, but barriers exist to investment in mitigation.
The business case: summary
167
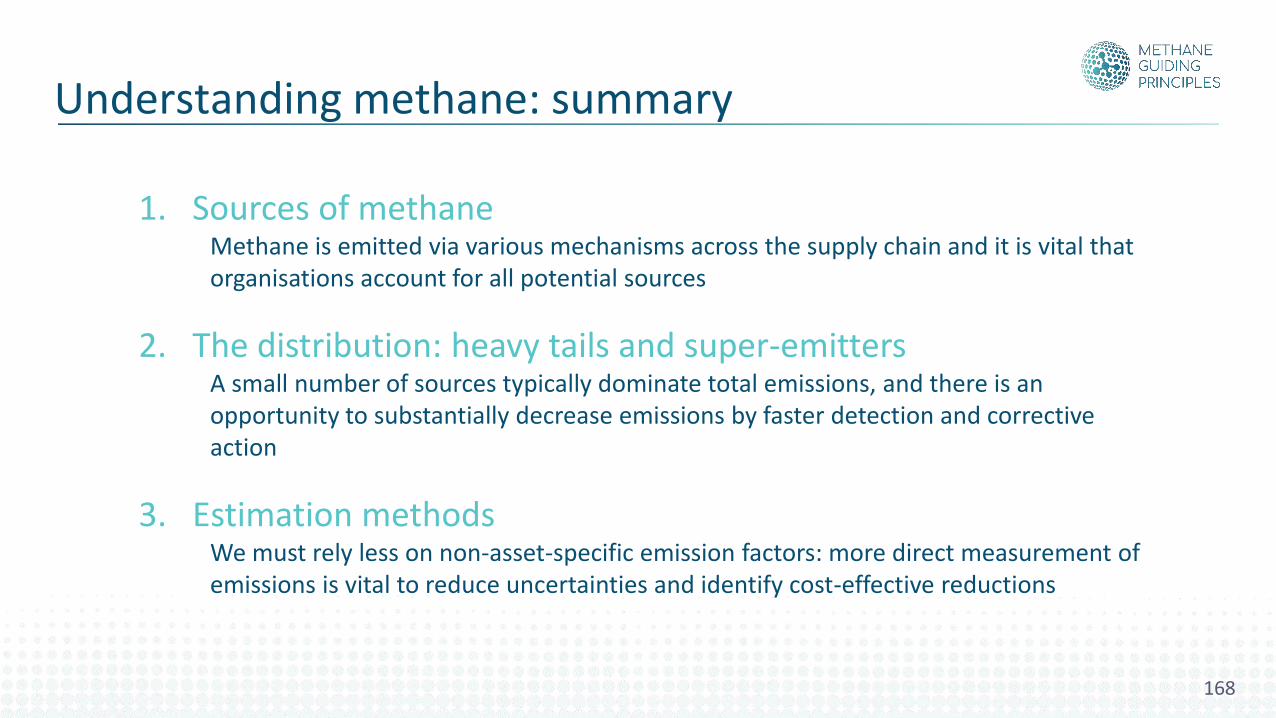
1. Sources of methaneMethane is emitted via various mechanisms across the supply chain and it is vital that organisations account for all potential sources
2. The distribution: heavy tails and super-emittersA small number of sources typically dominate total emissions, and there is an opportunity to substantially decrease emissions by faster detection and corrective action
3. Estimation methodsWe must rely less on non-asset-specific emission factors: more direct measurement of emissions is vital to reduce uncertainties and identify cost-effective reductions
Understanding methane: summary
168
Reducing Methane Emissions Best Practices
1. Engineering design and construction2. Venting3. Flaring4. Pneumatic equipment5. Energy use6. Equipment leaks7. Operational repairs8. Continual improvement
Reducing Methane Emission Best Practices: summary
169

For further details or feedback, please contact:
Dr Paul Balcombe [email protected]
Dr Adam Hawkes [email protected]
Copyright © 2022 FDOKUMEN