Assimilation of methane and inorganic carbon by microbial communities mediating the anaerobic...
153
Methane Oxidation and Carbon Assimilation in Marine Sediments Dissertation zur Erlangung des Doktorgrades der Naturwissenschaften dem Fachbereich Geowissenschaft der Universität Bremen vorgelegt von Gunter Wegener Bremen, März 2008
Transcript of Assimilation of methane and inorganic carbon by microbial communities mediating the anaerobic...

Methane Oxidation and Carbon Assimilation in Marine Sediments
Dissertation zur Erlangung des Doktorgrades der Naturwissenschaften
dem Fachbereich Geowissenschaft der Universität Bremen vorgelegt von
Gunter Wegener
Bremen, März 2008


There is a theory which states that if anybody ever discovers exactly the nature of
AOM, it will instantly disappear and be replaced by something even more bizarre and
inexplicable. There is another theory which states that this has already happened.
Freely adapted from Douglas Noel Adams (1952 – 2001)


Acknowledgments
I started my PhD training as a Geologist and had to become a combination of Biologist,
Biogeochemist, Organic Geochemist and Seaman. This metamorphosis required lots of
support – here is probably an incomplete list of the people I would like to thank for this
exciting transformation.
First of all, I would like to thank Prof. Antje Boetius and Prof. Kai-Uwe Hinrichs for
accepting me as PhD student and for their kind supervision and support in good times,
as well as in hard times. I also thank Tim Ferdelman and Sabine Kasten for joining my
PhD advisory committee. Acknowledgment goes to the Max Planck Society for funding
my project.
I appreciate the wisdom of Helge Niemann, Marcel Kuypers, and Thomas Holler for
fruitful discussions on various topics of my PhD. Thanks to Marcus Elvert, Xavier
Prieto, Florence Schubotz, and Julius Lipp for opening ‘their’ lab and teaching me
organic geochemistry.
Many thanks go to officemates and friends from MPI: Jan Fischer, Simone Boer, and
Enoma Omoregie. Thank you Friederike H., Janine F., Daniel S., Anna L., Phyllis L., Dr.
Alban, Frank W., and many others for standing me for four years.
Thanks to the ‘natives’: Aaron B., Casey H. and Andrew B. for editing my English.
Thanks to the excellent technicians of the Biogeochemistry Dept. and the kind
administration of MPIMM.
Last but not least, special thanks go to my parents and the rest of the family, who have
always supported my work, life, and goals throughout my PhD, as they have before.


Zusammenfassung
Zusammenfassung
Methan, ein starkes Treibhausgas, entsteht bei der mikrobiellen und thermogenen
Mineralisation von Biomasse unter anoxischen Bedingungen. Über diese Prozesse werden
im Meeresboden große Mengen des Methans akkumuliert. Dort liegt Methan entweder als
Gashydrat vor, ist im Porenwasser gelöst, oder nimmt den Porenraum als Gasphase ein.
Marine Methanemissionen sind jedoch nur für ca. 3% der atmosphärischen
Methanzufuhr verantwortlich, da der Kohlenwasserstoff im Sediment von einer
hocheffektiven Gemeinschaft aerober und anaerober Mikroorganismen oxidiert wird. Diese
Arbeit befasst sich mit der anaeroben Oxidation von Methan (AOM), die im Meeresboden
für ca. 80% des Methanabbaus verantwortlich ist. AOM wird von Konsortien
methanotropher Archaeen und sulfatereduzierenden Bakterien katalysiert, welche Methan
und Sulfat in syntrophen Reaktionen zu Karbonat und Sulfid umsetzen.
Im ersten Kapitel wird die Rolle von Methan im Kohlenstoffkreislauf sowie die
Quellen und Senken von Methan mit besonderer Berücksichtigung von AOM beschrieben.
Wichtige Erkenntnisse zur AOM und Methoden zur Erforschung dieses Phänomens,
insbesondere isotopengeochemische Ansätze, werden vermittelt.
Im zweiten Kapitel wird die Aktivität verschiedener Gasaustrittsstellen in der
Nordsee beschrieben. Aufgrund der relativ geringen Wassertiefe von 70 bis 150 Metern ist
die Methanlöslichkeit im sedimentären Porenwasser relativ gering. Der Methantransport
findet somit überwiegend in der Gasphase (in Form von Gasblasen) statt. Dabei wird ein
großer Teil des Methans nicht im Sediment oxidiert, sondern in die Wassersäule abgegeben.
Der kurze Transportweg zur Wasseroberfläche macht einen direkten Beitrag zum
atmosphärischen Methanhaushalt wahrscheinlich.
Zwei der aktivsten Gasaustritte, Gullfaks in der nördlichen Nordsee und
Tommeliten in der zentralen Nordsee, wurden zur geochemischen und mikrobiologischen
Charakterisierung ausgewählt. Die Methanaustritte von Gullfaks liegen in einer mächtigen
7

Methane Oxidation and Carbon Assimilation in Marine Sediments
glazialen Sandschicht. Die Gasaustritte sind in einem Bereich von ca. 0.5 km2 konzentriert,
in dessen Zentrum von 0.1 km2 ein teils dichter Bewuchs durch schwefeloxidierende
Bakterien (Beggiatoen) hohe Sulfidflüsse aus dem Sediment anzeigt. Die großen Sulfidmengen
entstehen bei der anaeroben Methanoxidation.
Methan steigt durch Risse in einem glazialen Mergel an die Oberfläche auf. Die
Methanaustritte beschränken sich so auf wenige kleinere Bereiche (<0.3 m2), die meist mit
dichten Matten sulfidoxidierender Bakterien bedeckt sind. Mit Hilfe eines Tauchroboters
wurden diese Bakterienmatten und die darunter liegenden Sedimente erstmals beprobt.
An den untersuchten Methanaustritten der Nordsee wurde im Unterschied zu vielen
Tiefsee-Methanaustritten keine chemosynthetische Fauna gefunden. Die hohen,
gezeitenbedingten Transportenergien verhindern offenbar die Besiedlung durch benthische
Organsimen. Jahreszeitlich schwankende und durchschnittlich höhere Temperaturen in der
Nordsee sind weitere Unterschiede zu Tiefsee-Methanaustritten. Die mikrobielle
Gemeinschaft der Methanquellen von Gullfaks und Tommeliten wurde mit Hilfe von
Lipidbiomarkeranalysen und molekularbiologischen Methoden beschrieben. Die gefundenen
Bakterien- und Archaeenbiomarker deuten auf eine Dominanz von anaeroben
Methanoxidierern, deren sulfatreduzierenden Partnerbakterien sowie sulfidoxidierenden
Bakterien in den Sedimenten hin. Im Durchschnitt sind die Kohlenstoff-Isotopenwerte der
Lipidbiomarker in den Methanaustrittssedimenten sehr niedrig, wobei insbesondere die
Archaeenbiomarker mit �13C-Werten bis -120‰ die deutlichsten Abreicherungen in der
Kohlenstoffisotopie zeigen. Die 13C-abgereicherten Biomarker zeigen die Aufnahme von
Kohlenstoff aus dem schon isotopisch leichten Methan und eine weitere starke
Fraktionierung während der Kohlenstofffixierung an. Die auf 16S-rRNA-Gensequenzierung
basierende Analyse der mikrobiellen Gemeinschaft zeigt, dass sich die Organismen der
Nordseemethanaustritte von denen der Tiefsee kaum unterscheiden. In den aktiven
8

Zusammenfassung
Sedimenten dominieren Anaerobe Methanoxidierer (ANME-2), die in Gemeinschaft mit
Sulfatreduzierern leben.
Im dritten Kapitel wird ein Durchflusssystem zur Untersuchung der anaeroben
Methanoxidation in Sedimenten vorgestellt. In der Durchflusszelle wird Sediment
permanent mit methangesättigtem anaeroben Medium durchströmt. Durch die Messung
von Methanzehrung und Sulfidbildung wurde die jeweilige Aktivität des Sediments ermittelt.
Bei gleichbleibenden Methankonzentrationen im Zufluss von ca. 2 mM wurden über
Monate konstante Methanoxidation gemessen. Ein merkliches Wachstum der
Bakterienpopulation erfolgte nicht, obwohl weder Methan noch Sulfat limitierend waren.
Auch in anderen Publikationen wurde oft von sehr geringen Wachstumsraten der anaeroben
Methanoxidierer berichtet. Ein Grund hierfür wird der besonders geringe Energiegewinn bei
der anaeroben Methanoxidation (�GR ~ -15 bis -40 kJ mol-1 CH4 Umsatz) sein, der zudem
von zwei Organismen geteilt werden muss. Aus diesem Grund werden für ein merkliches
Wachstum der mikrobiellen Population vermutlich Methankonzentrationen im Bereich
mehrerer Millimolar benötigt.
Methanotrophe Sedimente wurden über sechs Wochen mit methanfreiem Medium
durchströmt. Nach der Wiederaufnahme der Methanzufuhr wurden innerhalb weniger Tage
die vorherigen Methanoxidationsraten gemessen. Substratmangel über lange Zeit zu
tolerieren scheint eine wichtige Eigenschaft der methanoxidierenden Organismen zu sein,
um die in der Natur oftmals schwankenden Methankonzentrationen zu überleben. Für die
Umwelt zeigt es, dass die Mikroorganismen auch bei wechselnden Methanflüssen eine
Barriere für das aufsteigende Methan darstellen.
Im vierten Kapitel werden die Methoden der Lipidbiomarkeranalyse mit der
Isotopenmarkierung von Substraten kombiniert, um die Rolle anorganischen Kohlenstoffs
und Methans als Kohlenstoffquelle der methanoxidierenden Mikroorganismen zu
untersuchen. In den Archaeenlipiden wurden der Einbau von 13C-markierten Methans und
9

Methane Oxidation and Carbon Assimilation in Marine Sediments
anorganischen Kohlenstoffs in ungefähr gleichen Mengen beobachtet. Die
sulfatreduzierenden Bakterien nahmen hingegen ausschließlich 13C-markierten
anorganischen Kohlenstoff in ihre Lipide auf.
Die Ergebnisse der Isotopenmarkierungsversuche können die an Umweltproben
gemessenen sehr niedrigen Isotopien der Bakterienbiomarker (�13C bis ca. -100‰) und und
Archaeenlipide (�13C bis ca. -130‰) erklären. Archaeen bauen hauptsächlich stark 13C-
abgereichertes Methan und/ oder direkt aus Methan stammendes CO2 ein. Daneben sorgt
eine hohe Fraktionierung während der Kohlenstofffixierung für die extrem 13C-
abgereicherte Lipide. Die Sulfatreduzierer bauen ihre Biomasse aus CO2 auf, welches aus
dem leichter abgereicherten inorganischen Kohlenstoffpools des Porenwasser entstammt.
Die Ergebnisse zeigen, dass der Energietransfer zwischen den methanoxidierenden
Archaeen und den Sulfatreduzierern nicht auf Monomeren wie Acetat oder Format
beruhen. Wären diese Stoffe ein Intermediat, so müsste sich isotopisch markiertes Methan
auch in der Isotopensignatur der Biomarker der partizipierenden sulfatreduzierenden
Bakterien wiederfinden.
Aus den Labelingversuchen konnte eine Wachstumseffizienz ermittelt werden.
Unter unseren Versuchsbedingungen ist der Biomasseaufbau mit
Kohlenstoffaufnahmeeffizienz von nur 0,3% bis 1,3% äußerst gering. Diese einzigartig
niedrige Wachstumseffizienz lässt sich durch die extrem niedrigen Energiegewinn bei der
anaeroben Oxidation des Methans erklären.
Im letzten Kapitel werden die Ergebnisse der wissenschaftlichen Arbeit
zusammengefasst und im Kontext der bisherigen Forschungsarbeiten beschrieben. Zuletzt
wird ein Ausblick auf weitere Schritte der Erforschung des Kohlenstoffkreislaufs in der
anaeroben Methanoxidation gegeben. Einen Schwerpunkt bilden dabei Methoden der
Isotopenmarkierung.
10

Summary
Summary
Methane, a strong greenhouse gas, is produced by microbial fermentation of organic
matter under anoxic conditions and by thermal driven decay of organic matter. Both
biogenic and thermogenic methanogenesis lead to the accumulation of large quantities of
methane in the seafloor in the form of gas hydrate, dissolved in the pore water, and as gas
phase.
Despite the large methane content of the sediment, its contribution to water column
and atmospheric budgets is rather small (about 3%). This is because aerobic and anaerobic
microbes consume much of the seafloor methane. In this thesis I focus on the anaerobic
oxidation of methane (AOM), which is, in the marine context, responsible for about 80% of
methane consumption. AOM describes the microbially mediated consumption of methane
and sulfate with products carbonate and sulfide. The responsible microorganisms are
believed to consist of syntrophic consortia of methanotrophic archaea (ANME) and sulfate
reducing bacteria (SRB).
In Chapter I, I discuss methane as part of the marine carbon cycle, including it’s
sources and sinks, with the main emphasis on AOM. Important experimental methods,
including kinetics and growth determination isotope labeling approaches, are discussed in
detail in Chapter IV.
In Chapter II, I describe methane emissions at several shallow seep areas (<160m)
of the North Sea. Because of the shallow water (low pressure), methane solubility is low,
much lower than necessary for the formation of gas hydrates. This favors the transport of
methane in the gas phase, which limits the function of the microbial barrier and makes the
export of methane in the form of bubbles to the water column and atmosphere more likely.
The two most active seepage areas of the North Sea: Gullfaks in the Northern
North Sea, and Tommeliten in the center of this basin, were chosen for geochemical and
microbial characterization. The Gullfaks seep sites were situated on a deep sand layer,
11

Methane Oxidation and Carbon Assimilation in Marine Sediments
deposited within the last glacial maximum. Gas seepage was found in an area of 0.5 km2,
with the zone of highest seep activity, limited to an area of about 0.1 km2, marked by mats
of sulfide oxidizing bacteria, which are fueled by the high sulfide fluxes due to AOM activity
in the sediment layers centimeters below.
Methane seepage at Tommeliten has been studied for roughly 30 years. At
Tommeliten the seafloor consists of consolidated marls. Methane emissions to the water
column was limited to small, densely covered Beggiatoa patches of < 0.3 m2 , which were
spread over an area of about 0.1 km2. We sampled these patches for the first time using a
remotely operated vehicle (ROV).
Chemosynthetic fauna such as (e.g., tube worms and clams), which are often found
at deep-sea seeps, were not present at the North Sea sites. Presumably this was because of
the high, tidally induced water movement, which prevented settlement of benthic organisms.
Water temperatures of the North Sea are higher than in deep water sites and distinct
seasonal cycles were present.
Microbial communities at both seep sites were described using lipid biomarker
analyses and molecular tools (Fluorescence in situ hybridization (FISH) and 16S rDNA
based sequence libraries). The bacterial and archaeal biomarker compositions were typical
for seep sites. Biomarkers characteristic of ANMEs and their partner SRBs and sulfide
oxidizing bacteria were found. The mean carbon isotope composition of those lipids was
highly depleted, whereas lowest 13C-values were measured for the archaeal biomarker
archaeol and sn2-hydroxyarchaeol. This is due to the use of already substantially depleted
methane as carbon source and further fractionation during carbon assimilation.
Notwithstanding the highly different physical factors, the microbial communities at Gullfaks
and Tommeliten were very similar to that of the deep sea. The active seep areas were
dominated by methanotrophs of the ANME-2 cluster, living in syntrophy with different
sulfate reducing bacteria.
12

Summary
In Chapter III, a flow-through system for the investigation of AOM in sediments is
presented. Sediment columns were constantly percolated with methane saturated anaerobic
seawater. By measuring the differences in methane and sulfide concentrations between in-
and outflow, metabolic rates were determined. At constant conditions of about 2mM
methane in the inflow, no increases in AOM and sulfate reduction rates were measured over
more than 80 days, although neither methane nor sulfate were limiting. Extremely low
growth rates of methanotrophic communities were also observed in other studies. This
might be due to the extremely low energy yield of AOM (�GR ~15 to 40 kJ mol-1 CH4); a
yield which presumably has to be shared between the two organisms of the AOM
syntrophy. Additionally, carbon fixation (either reduction of CO2 or oxidation of methane)
is highly energy intense, therefore allowing only limited growth.
We found that methanotrophs are highly tolerant to starvation. After 6 weeks of
methane free percolation, methanotrophs resumed AOM at similar rates as before, when
methane was re-supplied. This behavior might be important in environments where
fluctuating methane supply predominates.
In Chapter IV the roles of inorganic carbon (DIC) and methane as carbon sources
for the microbial community performing AOM were examined. We combined the methods
of stable isotope probing (of 13C methane and 13C bicarbonate) with lipid biomarker analyses
and found carbon uptake of both labeled carbon sources into archaeal lipids. For archaea it
might be energetically favorable to combine the assimilation of both compounds, because
the combination of both carbon sources would reduce the input of reducing or oxidizing
power. The lipid biomarkers assigned to sulfate reducing bacteria, however, were exclusively
labeled by inorganic carbonate. In an additional experiment we found that this bacterial
inorganic carbon uptake strictly depends on the oxidation of methane, which shows the
tight metabolic relationship between archaea and sulfate reducing bacteria within the
consortia.
13

Methane Oxidation and Carbon Assimilation in Marine Sediments
Our results can explain the natural isotopic compositions of bacterial and archaeal
markers. With �13C value of down to -130‰, methanotrophic archaea have extremely
depleted carbon signatures. This is due to incorporation of already strongly depleted
methane and methane derived CO2 into their biomass and further fractionation in strongly
13C-discriminating fixation pathways. Sulfate reducers assimilate CO2 from the only slightly
depleted DIC of the pore water pool. Our results also help in understanding the syntrophic
relationship between the two organisms. As an example, partner-SRBs do not incorporate
carbon from methane, from which we can exclude organic monomers (e.g. acetate or
formate) as shuttled intermediate in AOM.
From the assimilation into lipids we were able to calculate carbon assimilation
efficiencies for the methanotrophic community, which were extraordinarily low with only
0.3% to 1.3%. This low growth yield must be due to the low energy yield of AOM.
In the last chapter, the results of this thesis are summarized and brought into the
context of prior work. At the end I include an outlook to the future of AOM research, with
a continued emphasis on isotope labeling methods.
14

Table of contents
Table of contents
Pages
Zusammenfassung
7 - 10
Summary
11 - 14
Chapter I
Introduction:
Methane in the Global and Marine Carbon Cycle
17 - 52
Chapter II
Biogeochemical Processes and Microbial Diversity of the Gullfaks
and Tommeliten Methane Seeps (Northern North Sea)
53 - 92
Chapter III
Short-Term Responses of Anaerobic Methane-Oxidizing
Microbial Communities from Submarine Cold Seeps to Variations
in Methane and Sulfate
93 - 110
Chapter IV
Assimilation of Methane and Inorganic Carbon by Microbial
Communities Mediating the Anaerobic Oxidation of Methane
111 – 136
Chapter V
Concluding Remarks and Perspectives
137 – 152
15

Methane Oxidation and Carbon Assimilation in Marine Sediments
16

Chapter I: Methane in the Marine and Global Carbon Cycle
Chapter I
Introduction:
Methane in the Global and Marine Carbon Cycle
Gunter Wegener
17
Methane Oxidation and Carbon Assimilation in Marine Sediments
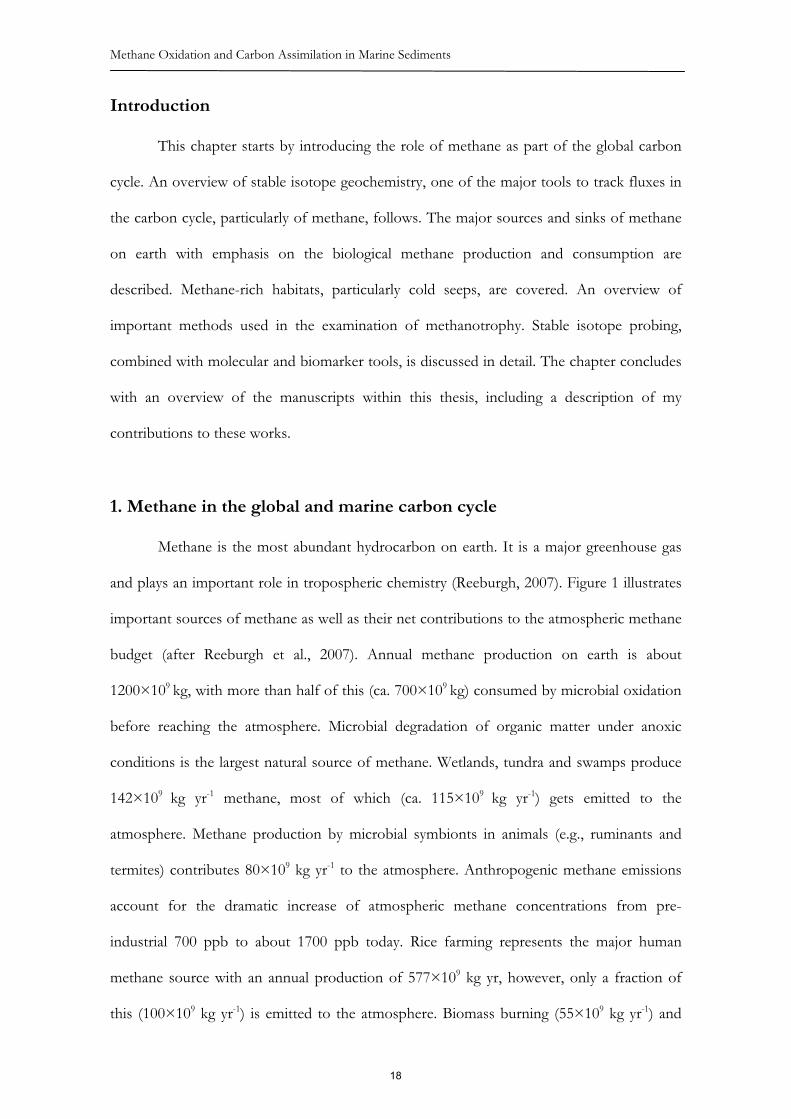
Introduction
This chapter starts by introducing the role of methane as part of the global carbon
cycle. An overview of stable isotope geochemistry, one of the major tools to track fluxes in
the carbon cycle, particularly of methane, follows. The major sources and sinks of methane
on earth with emphasis on the biological methane production and consumption are
described. Methane-rich habitats, particularly cold seeps, are covered. An overview of
important methods used in the examination of methanotrophy. Stable isotope probing,
combined with molecular and biomarker tools, is discussed in detail. The chapter concludes
with an overview of the manuscripts within this thesis, including a description of my
contributions to these works.
1. Methane in the global and marine carbon cycle
Methane is the most abundant hydrocarbon on earth. It is a major greenhouse gas
and plays an important role in tropospheric chemistry (Reeburgh, 2007). Figure 1 illustrates
important sources of methane as well as their net contributions to the atmospheric methane
budget (after Reeburgh et al., 2007). Annual methane production on earth is about
1200×109 kg, with more than half of this (ca. 700×109 kg) consumed by microbial oxidation
before reaching the atmosphere. Microbial degradation of organic matter under anoxic
conditions is the largest natural source of methane. Wetlands, tundra and swamps produce
142×109 kg yr-1 methane, most of which (ca. 115×109 kg yr-1) gets emitted to the
atmosphere. Methane production by microbial symbionts in animals (e.g., ruminants and
termites) contributes 80×109 kg yr-1 to the atmosphere. Anthropogenic methane emissions
account for the dramatic increase of atmospheric methane concentrations from pre-
industrial 700 ppb to about 1700 ppb today. Rice farming represents the major human
methane source with an annual production of 577×109 kg yr, however, only a fraction of
this (100×109 kg yr-1) is emitted to the atmosphere. Biomass burning (55×109 kg yr-1) and
18

Chapter I: Methane in the Marine and Global Carbon Cycle
fossil fuel and gas production (75×109 kg) also have a large impact on the atmospheric
methane budget.
Figure 1. Schematic presentation of the global methane budget. All numbers in 109 kg yr-1. Data from Hanson and Hanson, 1996; Nedwell, 1996; Reeburgh, 2007
Compared to marine primary production, which is 60000 ×109 kg C yr-1 (del Giorgio
and Duarte, 2002), the role of the oceans in the global methane budget is rather small, with
a production of 85 ×109 kg yr-1 and a net flux to the atmosphere of just 10×109 kg yr-1. The
vast majority of marine organic carbon gets mineralized aerobically in the upper water
column and only 1% is exported to the seafloor (Ducklow et al., 2001) where conditions
become anaerobic. In marine sediments this residual organic matter is further degraded by
microorganisms (fermented to monomers) and mineralized to CO2 using available electron
acceptors in order of decreasing energy yield: oxygen, nitrate, redox active metals such as
manganese (MnIV) and iron (FeIII), sulfate and CO2 (Fenchel and Jørgensen, 1977;
Jørgensen, 2006). Seawater concentration of sulfate exceeds other oxidants by orders of
magnitude, making sulfate reduction, coupled to the oxidation of a variety of monomeric
organic compounds (e.g. acetate and lactate, propionate, butyrate; Finke et al., 2007) of
particular relevance. Sulfate reduction is also coupled to anaerobic oxidation of methane
19

Methane Oxidation and Carbon Assimilation in Marine Sediments
(AOM). In presence of non-limiting sulfate concentrations, sulfate reducers outcompete
methanogens on the common substrates hydrogen and acetate because of much higher
energy yields when sulfate and not CO2 is used as terminal electron acceptor (Ward and
Winfrey, 1985; Widdel, 1988).
In absence of sulfate, methanogenesis based on microbial reduction of CO2 or
disproportionation of acetate is a major metabolic process in marine sediments (Capone and
Kiene, 1988; Nealson, 1997). About 5 to 10% of the marine organic matter reaching the
seafloor is mineralized via methanogenesis (Canfield, 1993; Hinrichs and Boetius, 2002;
Canfield et al., 2005). Residual organic matter, consisting mostly of highly complex
polycyclic hydrocarbons (not previously mineralized by marine microbes), is the major long
term carbon sink on earth. Deeper in sediments, temperatures between 50 and 180°C
mobilize this refractory organic matter, forming thermogenic methane and higher alkanes.
Biogenic and thermogenic methane accumulate in the seafloor, either dissolved in the pore
water, as a separate gas phase, or condensed as gas hydrates (Reeburgh, 2007). The amount
of hydrate-bound methane is vast, with estimates converging at 1 to 5×10¹⁵ m2 (0.7 to
3.6×10¹⁵ kg; Milkov, 2004 and references therein).
At even higher temperatures (e.g., ocean crust subduction zones) kerogen (organic
matter with high molecular weight which is insoluble in usual organic solvents) decays to
CO2 and hydrogen. This CO2 is then re-supplied to atmospheric carbon cycles via volcanic
and hydrothermal activity (Sano and Marty, 1995; de Leeuw et al., 2007).
2. Carbon isotope analysis as a tool in biogeochemistry
Most elements, including the main components of organic biomass C, H, N, S, and
O, are mixtures of atoms with different masses as a result of a variable number of neutrons.
Isotopes (from Greek ��� [iso] – equal, ����� [topos] – location [in the table of elements]) of
20

Chapter I: Methane in the Marine and Global Carbon Cycle
each element appear naturally in relatively fixed ratios. Deviations from those values are
expressed as �-notations [‰], which are defined in Eq. 1:
� �� � 10001 ���� referencesample RRX (1)
X is the usually less-abundant isotope of an element (e.g., 13C), and R is the corresponding
ratio of this isotope to its more abundant equivalent (e.g., 13C/12C). The � notation of the
sample is measured against a reference, which is Vienna PeeDee Belemnite limestone (V-PDB)
for carbon. Other reference materials are Canyon Diablo Meteorite (CDM) for sulfur,
(Vienna) standard mean ocean water (V-SMOW) for oxygen and hydrogen, and atmospheric
N2 for nitrogen.
Deviations from mean isotope ratios are caused by physical, chemical and
biological processes and reactions. A purely physical isotope fractionation effect is the
exchange between CO2 in the air and the dissolved inorganic carbon (DIC = CO32- + HCO3
-
+ H2CO3 + CO2) in water, which causes a 1‰ �13C-enrichment of oceanic DIC compared
to atmospheric CO2 (Mook and Tan, 1991). Plant biomass has about 20 to 25‰ lighter
�13C-values than atmospheric CO2 (Farquhar et al., 1989). This fractionation includes purely
physical effects such as CO2 uptake through stomatal pores and diffusion into the water
phase; these effects are small and cause a 1‰ to 2‰ discrimination in 13C (Farquhar et al.,
1989). In contrast, enzyme driven, biochemical carbon fixation pathways of the cells catalyze
a carbon isotope fractionation of about -20‰ (Rubisco pathway; Farquhar et al., 1989; Guy
et al., 1993).
The carbon isotope compositions of microbial biomass can reveal the organisms’
carbon sources and even the carbon fixation pathways they use. Heterotrophic bacteria have
only slightly lighter �13C-compositions than that of the carbon substrate they have
consumed (e.g., marine algae), having �13C-values of about -25 to -30‰ (Coffin et al., 1989).
Autotrophic microorganisms are typically more strongly �13C-depleted owing to their use of
highly fractionating carbon fixation pathways such as the acetyl-coenzyme A pathway which
21

Methane Oxidation and Carbon Assimilation in Marine Sediments
has �13C-discriminations reaching -47‰ in ammonium-oxidizing bacteria (Schouten et al.,
2004).
Stable isotope compositions of fossils and limestone, as well as lipid-derived
hydrocarbons, can be used to reconstruct carbon cycles and dominant redox processes
during earth’s history. Dickens (2003) examined development of the �13C-composition of
benthic foraminifera in the Tertiary. The rapid decline of the �13C-composition at the
PETM (Paleocene/Eocene temperature maximum) in foraminifera was explained by
massive methane emission during this time. Hayes and Waldbauer (2006) used the �13C-
composition of lipid-derived biomarkers to model the dominant biological redox processes
throughout early earth history. Elevated 13C-values in carbonate minerals were interpreted as
an indication of the importance of methanogenesis in the late Archaean (2,500 Mya).
Understanding the origin of present-day �13C-values of biomass, lipid biomarkers, methane
and DIC may help to reconstruct the evolution of life throughout earth history, the causes
of past and present climate changes as well as the functions of organisms.
3. Methane: Sources, sinks and isotope composition
Methane can be produced by biogenic fermentation and thermogenic degradation of
organic matter. Figure 2 shows isotope compositions for methane from these various
sources, which are explained in further detail below.
Methane sources
Methane formed independent of organic matter and microbial catalysis is defined as
abiogenic. Biogenic methane is formed by heat-induced decay of organic matter
22

Chapter I: Methane in the Marine and Global Carbon Cycle
(thermogenic methane) or by microbial reduction of CO2 and organic monomers (biogenic
methane).
Fig. 2. Carbon and hydrogen isotope composition of methane from different sources (Whiticar, 1999).
Abiogenic methane
Abiogenic methane is predominantly formed by alteration of fresh oceanic rocks,
such as is found at the East Pacific Rise (Welhan and Craig, 1977) and the Mid Atlantic
Ridge (Rona et al., 1992). It can also be formed from ophiolites (Abrajano et al., 1990) and
crystalline rocks such as those in the Canadian Shield (Sherwood Lollar et al., 2002). During
diagenesis of these rocks (e.g., conversion of olivine to serpentine) hydrogen is released
according to Eq. 2:
� �� � � �� � 2434523245.05.1 376 HOFeOHOSiMgOHSiOFeMg � (2)
Serpentinization is a strongly exothermic reaction involving heating of the rock material. At
temperatures above 300°C, CO2 and hydrogen react in a Fischer-Tropsch-like reaction on
the surface of catalysts such as iron or chromium according to Eq. 3 (Foustoukos and
Seyfried, 2004):
23

Methane Oxidation and Carbon Assimilation in Marine Sediments
� � OHHCn
HnmCO mnaqaq 222 21)2/(2 � (3)
Abiogenic methane is characterized by moderately depleted carbon and strongly
depleted hydrogen isotope compositions (�13C -34‰, �D < -400‰). Next to methane,
substantial amounts of C2+-compounds (ethane, propane, etc.) with inversely depleted
isotope compositions are produced (e.g. butane, �13C -37‰, �D ~ -250‰ ; Sherwood Lollar
et al., 2002). These isotope compositions have not been found in economically significant
hydrocarbon reservoirs, suggesting a relatively minor role for abiogenic methane production
in the global methane cycle (Sherwood Lollar et al., 2002). However, in local areas of sea
floor spreading such as the Lost City Hydrothermal field (off the Mid Atlantic Ridge),
abiogenic hydrogen or methane may be important microbial energy sources (Charlou et al.,
2002; Boetius, 2005; Kelley et al., 2005; Proskurowski et al., 2008).
Biogenic methane
The overwhelming majority of earth’s methane is formed via decay of organic
matter, which in marine environments is mainly plankton such as diatoms,
coccolithophorids and foraminifera. When oxygen, nitrate and sulfate are depleted,
methanogenic microorganisms utilize a limited number of fermentation products (mainly
hydrogen and acetate) according to Eq. 4 and Eq. 5, to form methane.
OHCHHCO kJmol24
13122 24
1
���� ����
2436
3
1
COCHCOOHCH kJmol ��� ����
(4)
(5).
In biogenic methanogenesis very few higher hydrocarbons are produced as byproducts,
which leads to characteristic C1/C2+ ratios of >>100 among biogenic hydrocarbon gases
(Whiticar et al., 1986; Whiticar, 1999).
Methane derived from carbonate reduction (Eq. 4) is highly �13C-depleted, having
values of -60 to -110‰ that arise due to a strong fractionation of -46 to -58‰ during CO2
24

Chapter I: Methane in the Marine and Global Carbon Cycle
reduction (values derived from pore water profiles (Galimov and Kvenvolden, 1983) and
Rayleigh experiments (Balabane et al., 1987; Krzycki et al., 1987; Whiticar, 1999)). Since
methanogenic archaea preferentially reduce 12CO2, the remaining DIC pool enriches in 13C,
which causes positive �13C-DIC-values in highly methanogenic sediments (Blair, 1998).
Hydrogen in methane derived from CO2-reduction has only moderately depleted �D-values.
Methanogenesis that proceeds via fermentation-type reactions (Eq. 5) is
characterized by 13C-fractionation between -22‰ (acetogenic methanogenesis) and -74‰
(methane derived from methanol reduction) between carbon source and product (Krzycki et
al., 1987). Usually, environmental limitation of fermented reactants prevents high
fractionation. Natural samples attributed to organoclastic methanogenesis have �13C-values
of -50‰ to -70‰. Hydrogen in methane produced from fermentation is highly depleted,
with �D-values of -200‰ to -400‰ (Whiticar, 1999).
Thermogenic methane
Thermogenic methane is formed by the heat-induced decay of organic matter.
Economically valuable oil and gas reservoirs are formed by this process (Tissot and Welte,
1984). Subduction- or sedimentation-driven subsidence of sediments leads to export of
refractory organic material (kerogen) into the deep subsurface. Temperatures rise following
ambient geothermal gradients, and at depths where temperatures exceed 50°C, kerogen
slowly releases gaseous and liquid hydrocarbons (Schoell, 1980; Tissot and Welte, 1984),
which in turn increase C:H ratios in the residual organic matter (an indicator of increasing
maturity). In the lower temperature range, gas mixtures with high amounts of ethane and
propane (i.e., wet gases; C2+ >5%) are released. With increasing maturity of the organic
matter, higher subsidence and increasing temperatures, dryer hydrocarbon gases with C2+
contents as low as 1% are produced (Schoell, 1980). Thermogenic methane typically has
only moderately depleted �13C-values between -55 and -35‰, whereas in general, increasing
25

Methane Oxidation and Carbon Assimilation in Marine Sediments
maturities are associated with less depleted carbon isotope compositions (Schoell, 1980).
Higher hydrocarbons (C2+) formed during thermogenic methanogenesis have less negative
�13C-values. Hydrogen isotopy of thermogenic gases can vary greatly, with �2D-values of
-375 to -100‰.
4. Methane consumption and isotope effects
Abiotic oxidation of methane
Within the troposphere and stratosphere, methane is naturally oxidized by
photochemical radical reactions. UV degradation of ozone leads to the formation of
hydroxyl radicals that attack methane, forming methyl radicals (Levy, 1971; Le Texier et al.,
1988; Lelieveld et al., 1998), which are ultimately oxidized to formaldehyde (Levy, 1971;
Grosjean, 1995). Annual photochemical methane oxidation is about 500×109 kg, resulting in
an average atmospheric lifetime for methane of 10 years (Crutzen, 1994). As a mixture of all
its source carbon isotope compositions, atmospheric methane has an intermediately
depleted �13C-value of -48‰. In contrast, hydrogen in atmospheric methane has a �D value
of -30‰, which is significantly less depleted than any of its source methane (Fig. 2). This
relatively high value is due to photochemically mediated exchange reactions between
hydrogen from methane and other atmospheric hydrogen pools (Whiticar, 1993).
Combustion represents another abiotic pathway for methane oxidation. Natural
petroleum gas fires are found in Azerbaijan (azer from Persian “fire”) where constant
methane seepage from deep fossil fuel sources causes the famous “eternal fires”. However,
the relevance of naturally occurring methane consuming fires is minor compared to human
gas extraction and burning of 1.5×10¹² kg of methane (United Nation Conference on Trade
and Development, UNCTAD; 2004; www.unctat.org/infocomm/anglais/
gas/market/htm#production).
26

Chapter I: Methane in the Marine and Global Carbon Cycle
Biogenic methane consumption
Aerobic methanotrophy. Two-thirds of the biogenic methane produced on earth is
consumed as an electron donor by aquatic methylotrophic microbes before escaping to the
atmosphere. In terrestrial habitats, such as swamps and rice paddies, aerobic methanotrophy
is the main methane sink (Hanson and Hanson, 1996; Reeburgh, 2007), whereas in marine
environments, aerobic methanotrophy contributes about 20% of the methane consumption
(Reeburgh, 2007). Additionally, methanotrophic bacteria are known to occur as symbionts
of fauna living at hydrocarbon seeps such as Bathymodiolus platifrons mussels (Barry et al.,
2002).
Aerobic methanotrophy can be described by the bulk formula (Eq. 6):
OHCOOCH kJmolG22
84224 22
10
����� ����� (6)
Methane carbon isotope fractionation factors for different inoculated
methanotrophic bacteria range from 1.0130 to 1.0252 (Coleman et al., 1981), resulting in a
shift in methane �13C from 10 to 20‰ after 50% methane consumption (Barker and Fritz,
1981). Considering hydrogen isotopes, Coleman et al. (1981) measured 8- to 14-fold higher
fractionation factors for deuterium. However, since aerobic methanotrophy is usually
limited to the top few millimeters of marine sediments (due to the low dissolved oxygen
concentrations found there), aerobic oxidation of methane is not recovered in highly
depleted carbon compositions in the DIC. Diffusive exchange between the pore water in
the methane oxidation zone and the water column blurs any isotope signal.
Anaerobic oxidation of methane (AOM). For decades, methanotrophy was
thought to be limited to oxic environments, as described above. However, marine pore
water data analyzed by Martens and Berner (1974) revealed simultaneous depletions of
methane and sulfate, which indicated the net AOM reaction (Eq. 7):
27
Methane Oxidation and Carbon Assimilation in Marine Sediments
OHHSHCOSOCH kJmolGR23
16244
10 ����� �� ���� � �
(7)
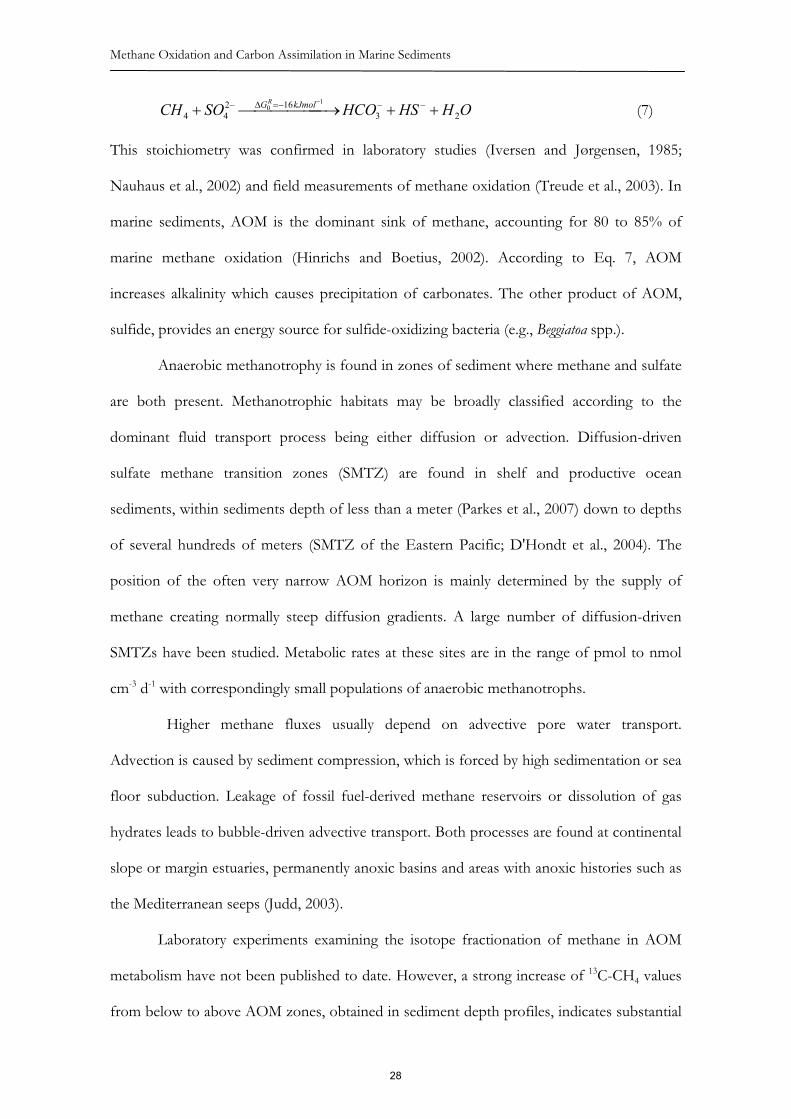
This stoichiometry was confirmed in laboratory studies (Iversen and Jørgensen, 1985;
Nauhaus et al., 2002) and field measurements of methane oxidation (Treude et al., 2003). In
marine sediments, AOM is the dominant sink of methane, accounting for 80 to 85% of
marine methane oxidation (Hinrichs and Boetius, 2002). According to Eq. 7, AOM
increases alkalinity which causes precipitation of carbonates. The other product of AOM,
sulfide, provides an energy source for sulfide-oxidizing bacteria (e.g., Beggiatoa spp.).
Anaerobic methanotrophy is found in zones of sediment where methane and sulfate
are both present. Methanotrophic habitats may be broadly classified according to the
dominant fluid transport process being either diffusion or advection. Diffusion-driven
sulfate methane transition zones (SMTZ) are found in shelf and productive ocean
sediments, within sediments depth of less than a meter (Parkes et al., 2007) down to depths
of several hundreds of meters (SMTZ of the Eastern Pacific; D'Hondt et al., 2004). The
position of the often very narrow AOM horizon is mainly determined by the supply of
methane creating normally steep diffusion gradients. A large number of diffusion-driven
SMTZs have been studied. Metabolic rates at these sites are in the range of pmol to nmol
cm-3 d-1 with correspondingly small populations of anaerobic methanotrophs.
Higher methane fluxes usually depend on advective pore water transport.
Advection is caused by sediment compression, which is forced by high sedimentation or sea
floor subduction. Leakage of fossil fuel-derived methane reservoirs or dissolution of gas
hydrates leads to bubble-driven advective transport. Both processes are found at continental
slope or margin estuaries, permanently anoxic basins and areas with anoxic histories such as
the Mediterranean seeps (Judd, 2003).
Laboratory experiments examining the isotope fractionation of methane in AOM
metabolism have not been published to date. However, a strong increase of 13C-CH4 values
from below to above AOM zones, obtained in sediment depth profiles, indicates substantial
28

Chapter I: Methane in the Marine and Global Carbon Cycle
discrimination of the heavy isotope during anaerobic methane consumption (Fig. 3;
Tsunogai et al., 2002; Werne et al., 2004). Corresponding 13C-carbon compositions of DIC
are depleted due to the transfer of methane isotope into DIC (Werne et al., 2004).
5. Key microorganisms in methane production and consumption and
their carbon composition
Modern 16S rRNA-based techniques (such as FISH (fluorescence in situ
hybridization) and full length gene sequencing) have identified many key organisms involved
in the majority of carbon mineralization processes. Lipid biomarker patterns have also been
shown to have phylogenetic relevance. Isotopic compositions of lipid biomarkers also
provide insight into microbial processes (Sinninghe Damste et al., 2002; Pancost and
Sinninghe Damste, 2003). Diagnostic lipid biomarker carbon signatures for organisms
performing methanogenesis and methanotrophy in methane rich habitats are summarized in
Fig. 3 and described in further detail below.
Methanogens. Methanogenesis is limited to archaea, and specifically to the key genera
Methanobacterium, Methanococcus and Methanosarcina within the Euryarchaeota (Balch et al.,
1979). Most methanogens are capable of CO2 reduction, whereas acetoclastic
methanogenesis, which is the main methane producing pathway in terrestrial habitats,
appears limited to the genus Methanosarcina Methanothrix and Methanosaeta. Formate, methanol
and methylamines are also reduced by methanogens, although those compounds seem to
have minor environmental relevance (Conrad et al., 2006). Most methanogens discovered to
date prefer moderate temperatures, but there are also hyperthermophilic genera, such as
Methanopyrus, which grow at temperatures up to 110°C (Kurr et al., 1991).
29

Methane Oxidation and Carbon Assimilation in Marine Sediments
Fig. 3. Schematic plot of isotope compositions of methane, inorganic carbon and lipid biomarker of the dominant microorganism at seep sites. Data from Biddle et al. (2006) (deep biosphere archaea); Galimov and Kvenvolden (1983) (fractionation while methane formation); Hinrichs and Boetius (2002) (methane, biomarker of ANME and partner-SRB lipids); Peters et al. (1978) (mean kerogen isotopy); Kinnaman et al. (2007) (carbon fractionation in aerobic methane consumption); and Werne et al. (2002) (typical 13C-composition of methane and carbonate and bacterial methanotrophs).
30

Chapter I: Methane in the Marine and Global Carbon Cycle
The lipid-derived biomarkers of methanogens are the isoprenoidal glycerol diethers
isoprenoidal glycerol ethers archaeol (2,3-di-O-phytanyl-sn-glycerol) and sn2-
hydroxyarchaeol (2-O-(3'-hydroxy-3',7', 11',15'-tetramethyl)hexadecyl-3-O-phytanyl-sn-
glycerol) as well as the branched hydrocarbon 2,6,10,15,19-pentamethylicosane (PMI) and
crocetane (Ohtsubo et al., 1993; Schouten et al., 1997). The biomass and lipid biomarker of
autotrophic methanogens have intermediately depleted carbon compositions (-30 to -60‰).
Their carbon source, CO2, is most often quite heavy, but assimilation of inorganically fixed
carbon involves strong isotope fractionation.
Methane oxidizing bacteria are present in all habitats where methane and oxygen
overlap (King, 1992; Knief et al., 2003). Methane-oxidizing bacteria (MOB) are either
Gammaproteobacteria (Type I-MOB) or Alphaproteobacteria (Type II-MOB). Type I-MOB (e.g.,
in Methylomonas, Methylomicrobium and Methylobacter) use the more efficient ribulose
monophosphate pathway (RMP) for carbon fixation, whereas Type II-MOB (e.g.
Methlyosinus and Methylocystis) perform carbon fixation via the serine pathway. The latter
requires additional ATP as a reducing agent for CO2. The higher energy demand of Type II
manifests in a lower growth yield and a minor ecological relevance of this group (Hanson
and Hanson, 1996). A dominance of Type-II-MOB was found in slightly acidic
environments and under nitrogen limitation (Hanson and Hanson, 1996; Jahnke et al.,
1999). Most MOB have a growth optimum between 25 and 35°C at neutral pHs. Growth of
both groups is limited to temperatures of 50°C. Recently, a third group of aerobic
methanotrophs, distantly related to the Verrucomicrobia, was discovered and have the ability
to perform aerobic methane oxidation under highly acidic conditions (down to pH 1),
however the ecological relevance of these extremophilic MOB has so far not been evaluated
(Dunfield et al., 2007).
31

Methane Oxidation and Carbon Assimilation in Marine Sediments
Half saturation constants (KM) for methane in aerobic methanotrophy are in the
range of 25-40 ppmv (i.e., 40-70 nM) for soil samples (Bender and Conrad, 1993), and as
high as 2 μM for a pure culture of Methylosinus (Jørgensen and Degn, 1983). Such low KM
values are due to the high efficiency of the methane monooxygenase enzyme, which
catalyzes the first step of methane assimilation in all aerobic methanogens.
Methanotrophic bacteria leave characteristic phospholipid-derived fatty acid patterns
(PLFAs) in sediments. Type I MOB predominantly produce monounsaturated C16
compounds such as C16:1�5t, C16:1�6c and C16:1�8c, whereas C18:1�8c is diagnostic for Type II
MOB (Guckert et al., 1991; Sundh et al., 1995; Hanson and Hanson, 1996). MOB biomass
usually has 13C-values of -30 to -80‰. The strong depletion is because MOB usually
consume already-depleted methane, and a further fractionation of about -30‰ occurs while
assimilating this methane into biomass (as measured for Methylococcus capsulate, Methylomonas
methanica, both Type I-M. using the RMP cycle (Summons et al., 1994)). Instead of
assimilated methane carbon isotopy, the hydrogen isotopy of methane does not substantially
impact the biomass �D composition, since in MOB methane-bound hydrogen is not
preserved during methane carbon assimilation (Sessions et al., 1999).
Anaerobic methanotrophs (ANMEs) and their partner SRBs. Three major
groups of methanotrophic archaea, ANME-1, -2 and -3, have been identified (Hinrichs et
al., 1999; Boetius et al., 2000; Niemann et al., 2006). ANME-1 are distantly related to
Methanosarcina and Methanomicrobiales (Hinrichs et al., 1999; Knittel et al., 2005) and appear as
single cells (Valentine, 2002; Knittel et al., 2005), filaments (Niemann et al., 2005), or
monospecies aggregates (Orphan et al., 2002). ANME-1 was found to dominate diffusion-
driven SMTZs (Niemann et al. 2005), and is a main organism in microbial mats of the Black
Sea (Michaelis et al., 2002; Knittel et al., 2005). The biomass at most highly active cold seeps
is dominated by aggregated methanotrophic consortia of ANME-2 or -3 and SRB. In these
32

Chapter I: Methane in the Marine and Global Carbon Cycle
settings archaea and their partner-SRB comprise up to 90% of the microbial biomass
(Knittel et al., 2005). ANME-2 belong to the order Methanosarcinales and are usually found in
consortia with SRB of the order Desulfosarcinales/Desulfococcuales (DSS) (Boetius et al., 2000;
Knittel et al., 2003, 2005). The recently discovered third group of anaerobic methanotrophs,
ANME-3, is most closely related to Methanococcoides and Methanolobus and is typically found in
aggregates with Desulfobulbus-like SRB (Niemann et al., 2006; Lösekann et al., 2007).
Methanogenic and methanotrophic archaea are both Euryarchaeota. Given this
phylogenetic overlap, it is not surprisingly that both groups have similar biomarker patterns.
Hence, typical lipid biomarkers of ANMEs are archaeol and sn2-hydroxyarchaeol, as well as
crocetane and PMIs and their unsaturated homologues (crocetenes and pentamethylicosenes
- PMI�), and a number of isoprenoidal glycerol dialkylglycerol tetraethers (GDGTs;
Niemann and Elvert, in press). In ANME-2 dominated sediments, sn2-hydroxyarchaeol:
archaeol ratios >3 as well as the presence of substantial amounts of crocetane were reported
(Nauhaus et al. 2007, Niemann and Elvert, in press). In contrast, distinct production of
PMI:4 and PMI:5 and dominance of archaeol to sn2-hydroxyarchaeol may be indicative of
ANME-1 dominated sediments (Blumenberg et al., 2004; Niemann and Elvert, in press).
ANME lipids characteristically have superlight carbon isotope compositions
(Hinrichs et al., 1999; Hinrichs et al., 2000; Orphan et al., 2001). Most reported �13C-values
of archaeol and hydroxyarchaeol are between -90‰ and -130‰ (Hinrichs et al., 1999;
Elvert et al., 2000; Orphan et al., 2001; Thiel et al., 2001), with a fairly constant methane
offset of -40‰ to -50‰ (Hinrichs and Boetius, 2002). This suggests that methane is the
direct carbon source comprising the biomass of anaerobic methanotrophs.
The consortial partner-SRBs partners produce a diverse lipid pattern of mainly
unsaturated fatty acids and isoprenoids. However, within those, C16:1�5 and
cy-(cyclopropane)C17:0�5,6, iso- and anteiso-C15:0 as well as some non-isoprenoidal mono- and
dialkyl- glycerol ethers (MAGEs, DAGEs) have taxonomic relevance (Niemann and Elvert,
33

Methane Oxidation and Carbon Assimilation in Marine Sediments
in press). All of these compounds were found with substantially depleted stable carbon
isotope compositions (e.g., �13C C16:1�5c of -75 to -96‰ and �13C C17:0�5,6 of -94 to -103‰ in
Hydrate Ridge seep sediments; Elvert et al., 2003), suggesting a tight coupling between
consortial SRB and methane oxidation (Orphan et al., 2001; Elvert et al., 2003). A relatively
constant offset of -40 to -50‰ between seep specific fatty acids and DIC carbon
composition was found, which may indicate autotrophic carbon assimilation by the seep
SRB (Hinrichs and Boetius, 2002).
6. Experimental investigation of Methane Oxidation
Apparent kinetics of methane oxidation
Since half saturation constants (KM) for methane in aerobic methanotrophy and
anaerobic methane oxidation are very different, different methods for KM determination
also need to be chosen. For aerobic methanotrophs, methane oxidation kinetics are typically
determined in open systems where a constant gas flow provides a defined methane-air
mixture (Bender and Conrad, 1993). An inline membrane mass spectrometer is used to
measure concentrations of methane and oxygen in the medium. Half saturation constants
for methane on the order of 20 to 50 ppmv for non-enriched soil samples (Bender and
Conrad, 1993), and up to 54,100 ppmv for cultures of Methylococcus (Carlsen et al., 1991)
were determined using this approach.
Half saturations of methane in AOM were estimated to be orders of magnitude
higher than for aerobic methanotrophy. To determine the response of AOM to methane
pressure far above one atmosphere, Nauhaus et al. (2002) incubated samples in hydrostatic
pressure chambers. The high methane levels made determination of relatively small methane
consumptions impossible, thus, changes in the concentration of produced sulfide were
34

Chapter I: Methane in the Marine and Global Carbon Cycle
measured. Within these incubations the authors measured no saturation of methane
dependent SR rate up to methane pressures of 1 MPa (~16mM).
Using a semi-continuous flow-through reactor, we tested the development of
methane consumption and sulfide oxidation in the low pressure range from 0 up to about
0.15 MPa. The advantage of the flow-through setup was its accommodation of repeated
measurements on the same sediments. This is possible since prior experiments have shown
that the methane oxidation capacity of the bacterial community, one established, stays
constant over longer time scales and can resist longer starving periods (see Chapter III).
Experimental investigation of growth and carbon assimilation in methanotrophy
Growth rates for methanotrophic bacteria are determined by incubating a pure
culture in a turbidostatic and oxystatic fermentation system supplying optimized or other
defined conditions. By monitoring exponentially increasing methane consumption rates in
the fermenter, growth rates up to 0.37 h-1 were determined for Methylococcus (Jørgensen and
Degn, 1983). Up to 1 g biomass was formed while oxidizing 1 g methane (Wilkinson et al.,
1974), which is equivalent to a carbon uptake efficiency of almost 50%.
Growth rate and growth yield determinations for anaerobic methanotrophs must
tackle very different challenges. Pure cultures of ANMEs do not exist. Hence, experiments
rely on natural enrichments of organisms from sediments of highly active seep areas
(Hydrate Ridge, Black Sea, etc.). Organisms performing AOM live at the lower limit of
energy yields for microbial growth and activity, growth rates are orders of magnitude lower
than for aerobic methanotrophs. Furthermore, factors that limit the growth of these
organisms are not known. The first results that were determined showed high half saturation
constants for methane that were in the range of several mM (Nauhaus et al., 2002), making
other experimental setups necessary.
35

Methane Oxidation and Carbon Assimilation in Marine Sediments
Subsequent growth experiments were performed in pressure incubations supplying
about 1MPa CH4 (Nauhaus et al., 2007). From an almost two-year long incubation growth
rates of 0.021 week-1 were calculated based on (fluorescence in situ hybridization (FISH)
counts and biomass weights. Based on sulfide concentration data, carbon assimilation
efficiencies of about 1% were measured.
Girguis et al. (2003) examined the dynamics of methanotrophic communities using
flow-through reactor incubations. Twenty-four weeks of percolation with methane-saturated
water did not result in significant changes to the composition of the microbial community in
seep sediments. However, in non-seep sediments, Girguis et al. (2005) were able to quickly
stimulate the growth of an AOM community. Using gene copy numbers, they calculated
growth rates of 0.17 week-1 for ANME-2, 0.22 week-1 for ANME-1 and 0.3 week-1 for
Desulfosarcina relatives. The difference of determined growth rates is so far not explainable.
An alternative way to determine growth efficiencies or carbon assimilation
efficiencies in anaerobic methanotrophy involves carbon stable isotope probing and lipid
biomarker analysis. Using stable isotope probing of methane, Blumenberg et al. (2005)
found assimilation of methane derived carbon into both archaeal and sulfate reducing
bacterial lipids. Based on the isotopic shift and metabolic activities, a carbon uptake of 1.9%
was calculated (Blumenberg et al., 2005). By combining radiotracer incubation, beta
microimaging and secondary ion mass spectrometry, Treude and coworkers (2007)
demonstrated also substantial uptake of inorganic carbon into methanotrophic biomass.
This indicates that carbon assimilation rates, based only on methane uptake, underestimate
the growth efficiency of AOM.
Chapter IV describes our calculations of carbon assimilation efficiencies, based on
results from parallel 13C-labeling of methane and DIC. To determine methane consumption
rates and to reduce the negative effect of rising product concentrations, we used a flow-
36

Chapter I: Methane in the Marine and Global Carbon Cycle
through column setup for the incubations. Seep sediments from Gullfaks, Hydrate Ridge
and Black Sea were used as inoculates in these experiments.
Radioactive and stable isotope probing (SIP) as tools to study the ecology of
methanotrophs
Carbon isotope probing can be used to trace metabolic activity and carbon
assimilation in sediments. To link metabolic activity to microbial diversity, labeling is
combined with a microbial identification tool, such as DNA or RNA sequencing, FISH, or
lipid biomarker analysis.
In DNA-SIP and RNA-SIP studies, a pure 13C-labeled potential carbon source is
added to a sample, usually in relatively high concentrations to support sufficient growth.
After incubation, nucleic DNA or RNA is extracted. The newly formed, heavy nucleic acids
are separated from the “old” non labeled DNA or RNA using ultracentrifugation (Morris et
al., 2002). Separated bands with heavy labeled DNA/RNA are then amplified by polymerase
chain reaction (PCR).
A general limit of RNA or DNA-SIP is the generation of sufficient labeled nucleic
acids, which limits either approach to fast growing organisms. Examples of successful
applications of DNA.SIP include the identification of aerobic methanol oxidizers
(Radajewski et al., 2000) and degraders of organic pollutants such as phenol, naphthalene
(Jeon et al., 2003; Padmanabhan et al., 2003) and the “ozone killer” methylchloride
(Borodina et al., 2005).
The combination of stable isotope probing with labeled nitrogen (15N; Cadisch et al.,
2005) and water (H218O; Schwartz, 2007) has extended the field of DNA-SIP. Both methods
are independent from the addition of labeled carbon sources.
The combination of SIP and RNA analysis can directly demonstrate gene expression
associated with the use of a carbon source (Manefield et al., 2002). For example, RNA-SIP
37

Methane Oxidation and Carbon Assimilation in Marine Sediments
has been successfully applied in the examination of propionate incorporation into rice field
microbiota (Lueders et al., 2004) and in the examination of PCP degradation (Mahmood et
al., 2005).
All RNA/DNA SIP studies to date have been performed with terrestrial aerobic
inoculates; similar studies for marine environments are lacking. Application of SIP
techniques in marine sediments have failed presumably due to the limited microbial growth
that occurs in these environments. This is especially true in the case of anaerobic
methanotrophy, where cell doubling times are the order of months to years (Nauhaus et al.,
2007).
MAR-FISH links microautoradiography (MAR) and FISH. Samples are incubated
with radiolabeled carbon sources, similarly as in SIP. Incubated samples are fixed and
simultaneously analyzed with FISH and microautoradiography (Lee et al., 1999). Few 14C
labeled compounds are commercially available, limiting this method to a few carbon
sources. MAR-FISH studies have been performed on aerobic methane-consuming cultures
(Stoecker et al., 2006), in addition to other studies where organic monomers such as acetate
were incorporated into biomass (Ginige et al., 2005).
Lipid biomarker-SIP, also known as PLFA-(phospholipid derived fatty acids)-
SIP combines carbon isotope labeling with lipid biomarker analysis. Lipid biomarker
patterns have taxonomic significance (Kaneda, 1991; Moore et al., 1994; Brocks and
Pearson, 2005) and the development of chromatography (combustion) isotope ratio mass
spectrometry (GC-(c)-IRMS) allows highly accurate isotope composition analysis of lipid
compounds (Hayes et al., 1990; Brenna et al., 1997). Using this combination, uptake of
minute carbon quantities into lipids can be determined. The limitation of this method is
making phylogenetic inferences from lipid derived carbon assimilation data; this is not
always possible, especially given the influences of environmental parameters such as
temperature, salinity and nutrient supply on microbial lipid patterns (Hazel, 1995; Nicolaus
38

Chapter I: Methane in the Marine and Global Carbon Cycle
et al., 2001). Parallel PLFA-SIP and DNA-SIP experiments that combine advantages of
both methods (sensitivity and quantification vs. specificity) as shown by Webster et al.
(2006) or Singh and Tate (2007) may offer the best way forward.
Successful applications of lipid biomarker-SIP began with pioneering work on
coastal North Sea sediments, where Boschker et al. (1998) examined the growth of sulfate-
reducing bacteria on certain substrates. Wuchter et al. (2003) showed mainly autotrophic
growth of Crenarchaeota in North Sea sediments. An in situ 13C-pulse-chase experiment by
Middleburg et al. (2000) followed inorganic carbon flow into algae and bacterial biomass.
Various studies have examined plant-microbe interactions using lipid biomarker-SIP
(Treonis et al., 2004; Prosser et al., 2006).
Lipid biomarker SIP with 13CH4 was applied by Deines et al. (2007) to track the
carbon flow from methane via methylotrophic bacteria into the larvae of Stictochironomus
pictulus, an abundant gnat species. Maxfield et al. (2006) and Singh and Tate (2007) described
activity of methanotrophic bacteria in fertilized farmland and forests soils, and documented
methane carbon flows in these systems.
Besides carbon isotopes, hydrogen isotope compositions of lipid biomarker can
also be analyzed by GC-IRMS. Deuterium labeling of styrene (vinyl benzene) was used by
Alexandrino et al. (2001) to investigate degradation and assimilation of this anthropogenic
compound by Pseudomonas spp. The deuterium label from styrene was recovered in strongly
deuterium labeled bacterial biomarkers.
The only prior stable carbon isotope labeling study focusing on anaerobic
methanotrophy was performed by Blumenberg et al. (2005) who examined the assimilation
of methane into biomass under anaerobic conditions. Chapter IV compares the carbon
incorporation of labeled methane and inorganic carbon into lipid biomarkers from archaea
and their partner SRBs. We incubated sediments from three seepage sites (Black Sea,
39

Methane Oxidation and Carbon Assimilation in Marine Sediments
Hydrate Ridge and Gullfaks) in a flow-through setup that was developed for anaerobic
experiments, and is described in Chapter III.
7. Structure and main objectives of the thesis
A dominant role in the carbon cycle has been attributed to the anaerobic oxidation
of methane (AOM). In marine environments AOM contributes between 80% and 85% of
the methane consumption. This PhD thesis combines the investigation of methanotrophic
habitats with laboratory studies that together focus on the biogeochemistry and physiology
of methanotrophic consortia. Chapter I reviews the current knowledge on methane
biogeochemistry and the molecular signatures of microorganisms involved in methane
production and consumption. Chapter II presents a study of microbial communities at
methane seeps at Gullfaks and Tommeliten (Northern and central North Sea) that applies
biogeochemical methods, lipid biomarker analysis and 16S rRNA-based molecular methods.
Chapter III describes a flow-through reactor and presents first results from incubations
using naturally enriched seep sediments from Gullfaks and other sites; it investigates the
short term response of anaerobic methane oxidizing communities to different methane and
sulfate concentrations. The flow-through setup was also used for experiments presented in
Chapter IV, which examines the relevance of methane and inorganic carbon as carbon
sources for microbial communities mediating AOM, work that combines stable isotope
probing with lipid biomarker analysis.
In summary, three research projects were performed to answer the following questions:
1. What are the geochemical and the biomarker patterns and the microbial
characteristics of coastal seep habitats, and how do they compare to deep sea
habitats?
40

Chapter I: Methane in the Marine and Global Carbon Cycle
2. How do changing availabilities of methane and sulfate influence the activity of
anaerobic methanotrophic communities?
3. What are the carbon sources for organisms performing AOM? How can we
integrate this knowledge into prior hypotheses on the functioning of AOM?
8. Publication outline
Biogeochemical Processes and Microbial Diversity of Gullfaks and Tommeliten
Methane Seeps (Northern North Sea)
G. Wegener, M. Shovitri, K. Knittel, H. Niemann, M. Hovland and A. Boetius
Online at Biogeosciences Discussions (review process for Biogeosciences Journal)
This study was performed in the EU project METROL (Methane flux control in ocean
margin sediments), which aims to describe the biological and geochemical controls of
methane fluxes. This study describes methane fluxes and the composition and distribution
of key microbial communities at various methane seepage systems in the North Sea.
Comparison of those shallow water sites to deep-sea seep systems forms part of this
manuscript.
Bathymetric measurements and sonar gas flare imaging were carried out as a service
by the company Innomar during five research cruises with R/V Heincke (HE 169, HE 180,
HE 208) and R/V Alkor (AL 267). Samples for microbiological and geochemical studies
were taken during HE 208 and AL 267 by G. Wegener and A. Boetius. Organic and
inorganic geochemical analyses were performed by G.Wegener. Molecular methods were
performed in by M Shovitri as part of her M.Sc. thesis, supervised by G. Wegener and K.
Knittel. The manuscript was written by G. Wegener with input from A. Boetius, K. Knittel
and H. Niemann.
41
Methane Oxidation and Carbon Assimilation in Marine Sediments
Short-Term Responses of Anaerobic Methane-Oxidizing Microbial Communities
from Submarine Cold Seeps to Variations in Methane and Sulfate
G. Wegener, T. Ferdelman and A. Boetius.
In preparation for submission to Biogeosciences Journal
Laboratory experiments on short-term responses of methane oxidation and sulfate
reduction were performed in a flow-through system ensuring stable conditions and non-
invasive sampling of pore waters. The flow-through setup was developed and operated by
G. Wegener. Sediment samples were obtained by G. Wegener (Gullfaks, HE 208); additional
samples were provided from earlier expeditions. All rate measurements and data analyses
were carried out by G. Wegener. Writing of the manuscript was done by G. Wegener with
input from T. Ferdelman and A. Boetius.
Assimilation of Methane and Inorganic Carbon by Microbial Communities
Mediating the Anaerobic Oxidation of Methane
Submitted to Environmental Microbiology
G. Wegener, H. Niemann, M. Elvert, K.-U. Hinrichs and A. Boetius
This study was undertaken to investigate methane and carbonate assimilation by
microorganisms mediating AOM. The project was initiated by G. Wegener, the setup was
developed and samples were taken by G. Wegener. Rate measurements and lipid biomarker
analyses were performed by G. Wegener with the help of H. Niemann and M. Elvert. Data
analysis was carried out by G. Wegener. The manuscript was written by G. Wegener with
input from H. Niemann, A. Boetius, K.-U. Hinrichs and M. Elvert.
42
Chapter I: Methane in the Marine and Global Carbon Cycle
References Abrajano, T.A., Sturchio, N.C., Kennedy, B.M., Lyon, G.L., Muehlenbachs, K. and Bohlke,
J.K. (1990) Geochemistry of reduced gas related to serpentinization of the Zambales ophiolite, Philippines. Appl. Geochem. Water-Rock Interactions Special Memorial Issue Ivan Barnes (1931-1989) 5: 625-630.
Alexandrino, M., Knief, C. and Lipski, A. (2001) Stable-isotope-based labeling of styrene-degrading microorganisms in biofilters. Appl. Environ. Microb. 67: 4796-4804.
Balabane, M., Galimov, E., Hermann, M. and Letolle, R. (1987) Hydrogen and carbon isotope fractionation during experimental production of bacterial methane. Org. Geochem. 11: 115-119.
Balch, W.E., Fox, G.E., Magrum, L.J., Woese, C.R. and Wolfe, R.S. (1979) Methanogens: reevaluation of a unique biological group. Microbiol. Mol. Biol. Rev. 43: 260-296.
Barker, J., and Fritz, P. (1981) Carbon isotope fractionation during microbial methane oxidation. Nature 293: 289-291.
Barry, J.P., Buck, K.R., Kochevar, R.K., Nelson, D.C., Fujiwara, Y., Goffredi, S.K. and Hashimoto, J. (2002) Methane-based symbiosis in a mussel, Bathymodiolus platifrons, from cold seeps in Sagami Bay, Japan. Invertebr. Biol. 121: 47-54.
Bender, M., and Conrad, R. (1993) Kinetics of methane oxidation in oxic soils. Chemosphere 26: 687-696.
Biddle, J.F., Lipp, J.S., Lever, M.A., Lloyd, K.G., Sørensen, K.B., Anderson, R. et al. (2006) Heterotrophic Archaea dominate sedimentary subsurface ecosystems off Peru. Proc. Natl. Acad. Sci. 103: 3846-3851.
Blair, N. (1998) The �13C of biogenic methane in marine sediments: the influence of Corg deposition rate. Chem. Geol. 152: 139-150.
Blumenberg, M., Seifert, R., Reitner, J., Pape, T. and Michaelis, W. (2004) Membrane lipid patterns typify distinct anaerobic methanotrophic consortia. Proc. Natl. Acad. Sci. 101: 11111-11116.
Blumenberg, M., Seifert, R., Nauhaus, K., Pape, T. and Michaelis, W. (2005) In Vitro Study of Lipid Biosynthesis in an Anaerobically Methane-Oxidizing Microbial Mat. Appl. Environ. Microb. 71: 4345-4351.
Boetius, A. (2005) Lost City Life. Science 307: 1420-1422.
Boetius, A., Ravenschlag, K., Schubert, C.J., Rickert, D., Widdel, F., Gieseke, A. et al. (2000) A marine microbial consortium apparently mediating anaerobic oxidation of methane. Nature 407: 623-626.
Borodina, E., Cox, M.J., McDonald, I.R. and Murrell, J.C. (2005) Use of DNA-stable isotope probing and functional gene probes to investigate the diversity of methyl chloride-utilizing bacteria in soil. Environ. Microbiol. 7: 1318-1328.
Boschker, H.T.S., Nold, S.C., Wellsbury, P., Bos, D., de Graaf, W., Pel, R. et al. (1998) Direct linking of microbial populations to specific biogeochemical processes by 13C-labelling of biomarkers. Nature 392: 801-805.
Brenna, J.T., Corso, T.N., Tobias, H.J. and Caimi, R.J. (1997) High-precision continuous-flow isotope ratio mass spectrometry. Mass Spectrom. Rev. 16: 227-258.
43

Methane Oxidation and Carbon Assimilation in Marine Sediments
Brocks, J.J. and Pearson, A. (2005) Building the biomarker tree of life. Rev.Mineral. Geochem. 59: 233-258.
Cadisch, G., Espana, M., Causey, Z., Richter, M., Shaw, E., Morgan, J.A.W. et al. (2005) Technical considerations for the use of 15N-DNA stable-isotope probing for functional microbial activity in soils. Rapid Commun. Mass Sp. 19: 1424-1428.
Canfield, D. (1993) Organic matter oxidation in marine sediments. Interactions of C, N, P and S biogeochemical cycles and global change. NATO ASI Series 14: 33–363.
Canfield, D., Kristensen, E. and Thamdrup, B. (2005) Aquatic Geomicrobiology. San Diego, California: Elsevier.
Capone, D.G. and Kiene, R.P. (1988) Comparison of microbial dynamics in marine and freshwater sediments: Contrasts in anaerobic carbon catabolism. Limnol: Oceanogr. 33: 725-749.
Carlsen, H., Jørgensen, L. and Degn, H. (1991) Inhibition by ammonia of methane utilization in Methylococcus capsulatus (Bath). Appl. Microbiol. Biot. 35: 124-127.
Charlou, J.L., Donval, J.P., Fouquet, Y., Jean-Baptiste, P. and Holm, N. (2002) Geochemistry of high H2 and CH4 vent fluids issuing from ultramafic rocks at the Rainbow hydrothermal field (36°14'N, MAR). Chem. Geol. 191: 345-359.
Coffin, R., Fry, B., Peterson, B. and Wright, R. (1989) Carbon isotopic compositions of estuarine bacteria. Limnol. Oceanogr. 34: 1305-1310.
Coleman, D., Risatti, J. and Schoell, J. (1981) Fractionation of carbon and hydrogen isotopes by methane-oxidizing bacteria. Geochim. Cosmochim. Ac. 45: 1033-1037.
Conrad, R., Erkel, C. and Liesack, W. (2006) Rice Cluster I methanogens, an important group of archaea producing greenhouse gas in soil. Curr. Opin. Biotech. 17: 262-267.
Crutzen, P.J. (1994) Global budgets for non-CO2 greenhouse gases. Environ. Monit. Assess. 31: 1-15.
de Leeuw, G.A.M., Hilton, D.R., Fischer, T.P. and Walker, J.A. (2007) The He-CO2 isotope and relative abundance characteristics of geothermal fluids in El Salvador and Honduras: New constraints on volatile mass balance of the Central American Volcanic Arc. Earth Planet. Sc. Lett. 258: 132-146.
Deines, P., Bodelier, P.L.E. and Eller, G. (2007) Methane-derived carbon flows through methane-oxidizing bacteria to higher trophic levels in aquatic systems. Environ. Microbiol. 9: 1126-1134.
del Giorgio, P.A. and Duarte, C.M. (2002) Respiration in the open ocean. Nature 420: 379-384.
D'Hondt, S., Jørgensen, B.B., Miller, D.J., Batzke, A., Blake, R., Cragg, B.A. et al. (2004) Distributions of microbial activities in deep subseafloor sediments. Science 306: 2216-2221.
Dickens, G.R. (2003) Rethinking the global carbon cycle with a large, dynamic and microbially mediated gas hydrate capacitor. Earth Planet. Sc. Lett. 213: 169-183.
Ducklow, H.W., Steinberg, D.K. and Buesseler, K.O. (2001) Upper ocean carbon export and the biological pump. Oceanography 14: 50-58.
Dunfield, P.F., Yuryev, A., Senin, P., Smirnova, A.V., Stott, M.B., Hou, S. et al. (2007) Methane oxidation by an extremely acidophilic bacterium of the phylum Verrucomicrobia. Nature 450: 879-882.
44

Chapter I: Methane in the Marine and Global Carbon Cycle
Elvert, M., Suess, E., Greinert, J. and Whiticar, M.J. (2000) Archaea mediating anaerobic methane oxidation in deep-sea sediments at cold seeps of the eastern Aleutian subduction zone. Org. Geochem. 31: 1175-1187.
Elvert, M., Boetius, A., Knittel, K. and Jørgensen, B.B. (2003) Characterization of specific membrane fatty acids as chemotaxonomic markers for sulfate-reducing bacteria involved in anaerobic oxidation of methane. Geomicrobiol. J. 20: 403-419.
Farquhar, G.D., Ehleringer, J.R. and Hubick, K.T. (1989) Carbon isotope discrimination and photosynthesis. Annu.Rev. Plant Phys. 40: 503-537.
Fenchel, T. and Jørgensen, B.B. (1977) Detritus food chains of aquatic ecosystems: The role of bacteria. In Advances in Microbial Ecology. Alexander, M. (ed). New York: Plenum Press, pp. 1-58.
Finke, N., Vandieken, V. and Jørgensen, B.B. (2007) Acetate, lactate, propionate, and isobutyrate as electron donors for iron and sulfate reduction in Arctic marine sediments, Svalbard. FEMS Microb. Ecol. 59: 10-22.
Foustoukos, D.I. and Seyfried, W.E., Jr. (2004) Hydrocarbons in hydrothermal vent fluids: The role of chromium-bearing catalysts. Science 304: 1002-1005.
Galimov, E.M. and Kvenvolden, K.A. (1983) Concentrations and carbon isotopic compositions of CH4 and CO: in gas from sediments of the Blake Outer Ridge, Deep Sea Drilling Project Leg 76. In Initial Reports DSDP. Washington, pp. 402-403.
Ginige, M.P., Keller, J. and Blackall, L.L. (2005) Investigation of an acetate-fed denitrifying microbial community by stable isotope probing, full-cycle rRNA analysis, and fluorescent in situ hybridization-microautoradiography. Appl. Environ. Microb. 71: 8683-8691.
Girguis, P.R., Cozen, A.E. and DeLong, E.F. (2005) Growth and population dynamics of anaerobic methane-oxidizing archaea and sulfate-reducing bacteria in a continuous-flow bioreactor. Appl. Environ. Microb. 71: 3725-3733.
Girguis, P.R., Orphan, V., Hallam, S. and DeLong, E.F. (2003) Growth and Methane Oxidation rates of anaerobic methanotrophic archaea in a continuous-flow bioreactor. Appl. Environ. Microb. 69: 5472-5482.
Grosjean, D. (1995) Atmospheric chemistry of biogenic hydrocarbons: Relevance to the Amazon. Quím. Nova, l8 (2): 184-2011.
Guckert, J.B., Ringelberg, D.B., White, D.C., Hanson, R.S. and Bratina, B.J. (1991) Membrane fatty acids as phenotypic markers in the polyphasic taxonomy of methylotrophs within the Proteobacteria. J. Gen. Microbiol. 137: 2631-2641.
Guy, R.D., Fogel, M.L. and Berry, J.A. (1993) Photosynthetic fractionation of the stable isotopes of oxygen and carbon. Plant Physiol. 101: 37-47.
Hanson, R.S. and Hanson, T.E. (1996) Methanotrophic bacteria. Microbiol. Rev. 60: 439-471.
Hayes, J.M. and Waldbauer, J.R. (2006) The carbon cycle and associated redox processes through time. Philos. T. Roy. Soc. B. 361: 931-950.
Hayes, J.M., Freemann, K.H., Popp, B.N. and Hoham, C.H. (1990) Compound-specific isotopic analyses: A novel tool for reconstruction of ancient biogeochemical processes. Org. Geochem. 16: 1115-1128.
Hazel, J.R. (1995) Thermal adaption in biological membranes. Is homeoviscous adaptation the explanation? Annu. Rev. Physiol. 57: 19-42.
45

Methane Oxidation and Carbon Assimilation in Marine Sediments
Hinrichs, K.-U., Hayes, J.M., Silva, S.P., Brewer, P.G. and DeLong, E.F. (1999) Methane-consuming archaebacteria in marine sediments. Nature 398: 802-805.
Hinrichs, K.-U., Summons, R.E., Orphan, V., Sylva, S.P. and Hayes, J.M. (2000) Molecular and isotopic analysis of anaerobic methane-oxidizing communities in marine sediments. Org. Geochem. 31: 1685-1701.
Hinrichs, K.-U. and Boetius, A. (2002) The anaerobic oxidation of methane: New insights in microbial ecology and biogeochemistry. In Ocean Margin Systems. Wefer, G., Billett, D., Hebbeln, D., Jørgensen, B.B., Schlüter, M. and van Weering, T. (eds). Berlin Heidelberg: Springer-Verlag, pp. 457-477.
Iversen, N. and Jørgensen, B.B. (1985) Anaerobic methane oxidation rates at the sulfate-methane transition in marine sediments from Kattegat and Skagerrak (Denmark). Limnol. Oceanogr. 30: 944-955.
Jahnke, L.L., Summons, R.E., Hope, J.M. and Des Marais, D.J. (1999) Carbon isotopic fractionation in lipids from methanotrophic bacteria II: the effects of physiology and environmental parameters on the biosynthesis and isotopic signatures of biomarkers. Geochim. Cosmochim. Ac. 63: 79-93.
Jeon, C.O., Park, W., Padmanabhan, P., DeRito, C., Snape, J.R. and Madsen, E.L. (2003) Discovery of a bacterium, with distinctive dioxygenase, that is responsible for in situ biodegradation in contaminated sediment. Proc. Natl. Acad. Sci. 100: 13591-13596.
Jørgensen, L. and Degn, H. (1983) Mass spectrometric measurements of methane and oxygen utilization by methanotrophic bacteria. FEMS Microbiol. Lett. 20: 331-335.
Jørgensen, B.B. (2006) Bacteria and marine biogeochemistry. In Marine Geochemistry. Schulz, H.D. and Zabel, M. (eds). Berlin, Heidelberg: Springer, pp. 169-206.
Judd, A.G. (2003) A global importance and context of methane escape from the seabed. Geo-Mar. Lett. 23: 147-154.
Kaneda, T. (1991) Iso- and anteiso-fatty acids in bacteria: biosynthesis, function, and taxonomic significance. Microbiol. Mol. Biol. Rev. 55: 288-302.
Kelley, D.S., Karson, J.A., Fruh-Green, G.L., Yoerger, D.R., Shank, T.M., Butterfield, D.A. et al. (2005) A serpentinite-hosted ecosystem: The Lost City hydrothermal field. Science 307: 1428-1434.
King, G.M. (1992) Ecological aspects of methane oxidation, a key determinant of global methane dynamics. Adv. Microb. Ecol. 12: 431-468.
Kinnaman, F.S., Valentine, D.L. and Tyler, S.C. (2007) Carbon and hydrogen isotope fractionation associated with the aerobic microbial oxidation of methane, ethane, propane and butane. Geochim. Cosmochim. Ac. 71: 271-283.
Knief, C., Lipski, A. and Dunfield, P.F. (2003) Diversity and activity of methanotrophic bacteria in different upland soils. Appl. Environ. Microb. 69: 6703-6714.
Knittel, K., Lösekann, T., Boetius, A., Kort, R. and Amann, R. (2005) Diversity and distribution of methanotrophic archaea at cold seeps. Appl. Environ. Microb. 71: 467-479.
Knittel, K., Boetius, A., Lemke, A., Eilers, H., Lochte, K., Pfannkuche, O. et al. (2003) Activity, distribution, and diversity of sulfate reducers and other bacteria in sediments above gas hydrate (Cascadia margin, Oregon). Geomicrobiol. J. 20: 269-294.
46
Chapter I: Methane in the Marine and Global Carbon Cycle
Krzycki, J.A., Kenealy, W.R., DeNiro, M.J. and Zeikus, J.G. (1987) Stable carbon isotope fractionation by Methanosarcina barkeri during methanogenesis from acetate, methanol, or carbon dioxide-hydrogen. Appl. Environ. Microb. 53: 2597-2599.
Kurr, M., Huber, R., König, H., Jannasch, H.W., Fricke, H., Trincone, A. et al. (1991) Methanopyrus kandleri, gen. and sp. nov. represents a novel group of hyperthermophilic methanogens, growing at 110°C. Arch. Microbiol. 156: 239-247.
Le Texier, H., Solomon, S. and Garcia, R.R. (1988) The role of molecular hydrogen and methane oxidation in the water vapour budget of the stratosphere. Quarterly Journal of the Royal Meteorological Society 114: 281-295.
Lee, N., Nielsen, P.H., Andreasen, K.H., Juretschko, S., Nielsen, J.L., Schleifer, K.-H. and Wagner, M. (1999) Combination of fluorescent in situ hybridization and microautoradiography---a new tool for structure-function analyses in microbial ecology. Appl. Environ. Microb. 65: 1289-1297.
Lelieveld, J., Crutzen, P.J. and Dentener, F.J. (1998) Changing concentration, lifetime and climate forcing of atmospheric methane. Tellus B 50: 128-150.
Levy, H. (1971) Normal Atmosphere: Large radical and formaldehyde concentrations predicted. Science 173: 141-143.
Lösekann, T., Knittel, K., Nadalig, T., Fuchs, B., Niemann, H., Boetius, A. and Amann, R. (2007) Diversity and abundance of aerobic and anaerobic methane oxidizers at the Haakon Mosby Mud Volcano, Barents Sea. Appl. Environ. Microb. 73: 3348-3362.
Lueders, T., Pommerenke, B. and Friedrich, M.W. (2004) Stable-isotope probing of microorganisms thriving at thermodynamic limits: Syntrophic propionate oxidation in flooded soil. Appl. Environ. Microb. 70: 5778–5786.
Mahmood, S., Paton, G.I. and Prosser, J.I. (2005) Cultivation-independent in situ molecular analysis of bacteria involved in degradation of pentachlorophenol in soil. Environ. Microbiol. 7: 1349-1360.
Manefield, M., Whiteley, A.S., Griffiths, R.I. and Bailey, M.J. (2002) RNA stable isotope probing, a novel means of linking microbial community function to phylogeny. Appl. Environ. Microb. 68: 5367-5373.
Maxfield, P.J., Hornibrook, E.R.C. and Evershed, R.P. (2006) Estimating high-affinity methanotrophic bacterial biomass, growth, and turnover in soil by phospholipid fatty acid 13C-labeling. Appl. Environ. Microb. 72: 3901-3907.
Michaelis, W., Seifert, R., Nauhaus, K., Treude, T., Thiel, V., Blumenberg, M. et al. (2002) Microbial reefs in the Black Sea fueled by anaerobic oxidation of methane. Science 297: 1013-1015.
Middleburg, J.J., Barranguet, C., Boschker, H.T.S., Herman, P.M.J., Moens, T. and Heip, C.H.R. (2000) The fate of intertidal microphytobenthos carbon: An in situ 13C-labeling study. Limnol. Oceanogr. 45: 1224-1234.
Milkov, A.V. (2004) Global estimates of hydrate-bound gas in marine sediments: how much is really out there? Earth-Sci. Rev. 66: 183-197.
Mook, W. and Tan, F. (1991) Stable carbon isotopes in rivers and estuaries. In Biogeochemistry of Major World Rivers. Degens, E.T., Kempe, S. and Richey, J.E. (eds): John Wiley & Sons Hoboken, NJ.382pp.
47

Methane Oxidation and Carbon Assimilation in Marine Sediments
Moore, L., Bourne, D. and Moore, W. (1994) Comparative distribution and taxonomic value of cellular fatty acids in thirty-three genera of anaerobic gram-negative bacilli. Int. J. Syst. Bacteriol. 44: 338-347.
Morris, S.A., Radajewski, S., Willison, T.W. and Murrell, J.C. (2002) Identification of the functionally active methanotroph population in a peat soil microcosm by stable-isotope probing. Appl. Environ. Microb. 68: 1446-1453.
Nauhaus, K., Boetius, A., Krüger, M. and Widdel, F. (2002) In vitro demonstration of anaerobic oxidation of methane coupled to sulphate reduction in sediments from a marine gas hydrate area. Environ. Microbiol. 4: 296-305.
Nauhaus, K., Albrecht, M., Elvert, M., Boetius, A. and Widdel, F. (2007) In vitro cell growth of marine archaeal-bacterial consortia during anaerobic oxidation of methane with sulfate. Environ. Microbiol. 9: 187-196.
Nealson, K. (1997) Sediment bacteria: Who's there, what are they doing, and what's new? Annu. Rev. Earth Planet. Sc. 25: 403-434.
Nedwell, D. (1996) Methane production and oxidation in soils and sediments. In Murrell, J.C. and Kelly, D P (eds): Microbiology of Atmospheric Trace Gases. Berlin, Germany. Springer
Nicolaus, B., Manca, M.C., Lama, L., Esposito, E. and Gambacorta, A. (2001) Lipid modulation by environmental stresses in two models of extremophiles isolated from Antarctica. Polar Biology 24: 1-8.
Niemann, H. and Elvert, M. (in press) Diagnostic lipid biomarker and stable carbon isotope signatures of microbial communities mediating the anaerobic oxidation of methane with sulphate. Org. Geochem. doi:10.1016/j.orggeochem.2007.11.003.
Niemann, H., Elvert, M., Hovland, M., Orcutt, B., Judd, A., Suck, I. et al. (2005) Methane emission and consumption at a North Sea gas seep (Tommeliten area). Biogeosciences 2: 335-351.
Niemann, H., Lösekann, T., de Beer, D., Elvert, M., Nadalig, T., Knittel, K. et al. (2006) Novel microbial communities of the Haakon Mosby mud volcano and their role as a methane sink. Nature 443: 854-858.
Ohtsubo, S., Kanno, M., Miyahara, H., Kohno, S., Koga, Y. and Miura, I. (1993) A sensitive method for quantification of aceticlastic methanogens and estimation of total methanogenic cells in natural environments based on an analysis of ether-linked glycerolipids. FEMS Microbiol. Ecol. 12: 39-50.
Orphan, V.J., House, C.H., Hinrichs, K.-U., McKeegan, K.D. and DeLong, E.F. (2001) Methane-consuming archaea revealed by directly coupled isotopic and phylogenetic analysis. Science 293: 484-487.
Orphan, V.J., House, C.H., Hinrichs, K.-U., McKeegan, K.D. and DeLong, E.F. (2002) Multiple archaeal groups mediate methane oxidation in anoxic cold seep sediments. Proc. Natl. Acad. Sci.: 072210299.
Padmanabhan, P., Padmanabhan, S., DeRito, C., Gray, A., Gannon, D., Snape, J.R. et al. (2003) Respiration of 13C-labeled substrates added to soil in the field and subsequent 16S rRNA gene analysis of 13C-labeled soil DNA. Appl. Environ. Microb. 69: 1614-1622.
Pancost, R.D. and Sinninghe Damste, J. (2003) Carbon isotopic compositions of prokaryotic lipids as tracers of carbon cycling in diverse settings. Chem. Geol. 195: 29-58.
48

Chapter I: Methane in the Marine and Global Carbon Cycle
Parkes, R.J., Cragg, B.A., Banning, N., Brock, F., Webster, G., Fry, J.C. et al. (2007) Biogeochemistry and biodiversity of methane cycling in subsurface marine sediments (Skagerrak, Denmark. Environ. Microbiol. 9: 1146-1161.
Peters, K.E., Sweeney, R.E. and Kaplan, I.R. (1978) Correlation of carbon and nitrogen stable isotope ratios in sedimentary organic matter. Limnol. Oceanogr. 23: 598-604.
Proskurowski, G., Lilley, M.D., Seewald, J.S., Fruh-Green, G.L., Olson, E.J., Lupton, J.E. et al. (2008) Abiogenic hydrocarbon production at Lost City Hydrothermal Field. Science 319: 604-607.
Prosser, J.I., Rangel-Castro, J.I. and Killham, K. (2006) Studying plant-microbe interactions using stable isotope technologies. Curr. Opin.Biotech. 17: 98-102.
Radajewski, S., Ineson, P., Parekh, N.R. and Murrell, J.C. (2000) Stable-isotope probing as a tool in microbial ecology. Nature 403: 646-649.
Reeburgh, W. (2007) Oceanic methane biogeochemistry. Chem Rev. 107: 486-513.
Rona, P.A., Bougault, H., Charlou, J.L., Appriou, P., Nelsen, T.A., Trefry, J.H. et al. (1992) Hydrothermal circulation, serpentinization, and degassing at a rift valley-fracture zone intersection; Mid-Atlantic Ridge near 15 degrees N, 45 degrees W. Geology 20: 783-786.
Sano, Y., and Marty, B. (1995) Origin of carbon in fumarolic gas from island arcs. Chem. Geol. 119: 265-274.
Schoell, M. (1980) The hydrogen and carbon isotopic composition of methane from natural gases of various origins. Geochim. Cosmochim. Ac. 44: 649-661.
Schouten, S., van der Maarel, M.J.E.C., Huber, R., and Damste, J.S.S. (1997) 2,6,10,15,19-Pentamethylicosenes in Methanolobus bombayensis, a marine methanogenic archaeon, and in Methanosarcina mazei. Org. Geochem. 26: 409-414.
Schouten, S., Strous, M., Kuypers, M.M.M., Rijpstra, W.I.C., Baas, M., Schubert, C.J. et al. (2004) Stable carbon isotopic fractionations associated with inorganic carbon fixation by anaerobic ammonium-oxidizing bacteria. Appl. Environ. Microb. 70: 3785-3788.
Schwartz, E. (2007) Characterization of growing microorganisms in soil by stable Isotope probing with H2
18O. Appl. Environ. Microb. 73: 2541-2546.
Sessions, A.L., Burgoyne, T.W., Schimmelmann, A. and Hayes, J.M. (1999) Fractionation of hydrogen isotopes in lipid biosynthesis. Org. Geochem. 30: 1193-1200.
Sherwood Lollar, B., Westgate, T.D., Ward, J.A., Slater, G.F. and Lacrampe-Couloume, G. (2002) Abiogenic formation of alkanes in the Earth's crust as a minor source for global hydrocarbon reservoirs. Nature 416: 522-524.
Singh, B.K. and Tate, K. (2007) Biochemical and molecular characterization of methanotrophs in soil from a pristine New Zealand beech forest. FEMS Microbiol. Lett. 275: 89-97.
Sinninghe Damste, J., Schouten, S., Hopmans, E.C., van Duin, A.C.T. and Geenevasen, J.A.J. (2002) Crenarchaeol: the characteristic core glycerol dibiphytanyl glycerol tetraether membrane lipid of cosmopolitan pelagic crenarchaeota. J. Lipid Res. 43: 1641-1651.
49
Methane Oxidation and Carbon Assimilation in Marine Sediments
Stoecker, K., Bendinger, B., Schöning, B., Nielsen, P.H., Nielsen, J.L., Baranyi, C. et al. (2006) From the cover: Cohn's Crenothrix is a filamentous methane oxidizer with an unusual methane monooxygenase. Proc Natl. Acad. Sci. 103: 2363-2367.
Summons, R.E., Jahnke, L.L. and Roksandic, Z. (1994) Carbon isotopic fractionation in lipids from methanotrophic bacteria: Relevance for interpretation of the geochemical record of biomarkers. Geochim. Cosmochim. Ac. 58: 2853-2863.
Sundh, I., Borga, P., Nilsson, M., and Svensson, B.H. (1995) Estimation of cell numbers of methanotrophic bacteria in boreal peatlands based on analysis of specific phospholipid fatty acids. FEMS Microbiol. Ecol. 18: 103-112.
Thiel, V., Peckmann, J., Richnow, H.H., Luth, U., Reitner, J. and Michaelis, W. (2001) Molecular signals for anaerobic methane ocidation in Black Sea seep carbonates and a microbial mat. Mar. Chem. 79: 97-112.
Tissot, B.P. and Welte, D.H. (1984) Petroleum formation and occurrence:. Berlin, Heidelberg, NewYork, Tokyo,: Springer-Verlag.
Treonis, A.M., Ostle, N.J., Stott, A.W., Primrose, R., Grayston, S.J. and Ineson, P. (2004) Identification of groups of metabolically-active rhizosphere microorganisms by stable isotope probing of PLFAs. Soil Biol. Biochem. 36: 533-537.
Treude, T., Orphan, V., Knittel, K., Gieseke, A., House, C. and Boetius, A. (2007) Consumption of methane and CO2 by methanotrophic microbial mats from gas seeps of the anoxic Black Sea. Appl. Environ. Microb. 73: 2271-2283.
Treude, T., Boetius, A., Knittel, K., Nauhaus, K., Elvert, M., Kruger, M. et al. (2003) Anaerobic oxidation of methane at Hydrate Ridge (OR). Geochim. Cosmochim. Ac. 67: A491-A491.
Tsunogai, U., Yoshida, N., and Gamo, T. (2002) Carbon isotopic evidence of methane oxidation through sulfate reduction in sediment beneath cold seep vents on the seafloor at Nankai Trough. Mar. Geol. 187: 145–160.
Valentine, D.L. (2002) Biogeochemistry and microbial ecology of methane oxidation in anoxic environments: a review. Anton Leeuw. J. Microb. 81: 271-282.
Ward, D.M. and Winfrey, M.R. (1985) Interactions between methanogenic and sulfate-reducing bacteria in sediments. In Advances in microbial ecology. Jannasch, H.W. and Williams, P.J.L. (eds). New York: Plenum Press, pp. 219-286.
Webster, G., Watt, L.C., Rinna, J., Fry, J.C., Evershed, R.P., Parkes, R.J. and Weightman, A.J. (2006) A comparison of stable-isotope probing of DNA and phospholipid fatty acids to study prokaryotic functional diversity in sulfate-reducing marine sediment enrichment slurries. Environ. Microbiol. 8: 1575-1589.
Welhan, J.A. and Craig, H. (1977) Methane and hydrogen in East Pacific Rise hydrothermal fluids. Geophys. Res. Lett. 6: 829-832.
Werne, J., Baas, M. and Damste, J. (2002) Molecular isotopic tracing of carbon flow and trophic relationships in a methane-supported benthic microbial community. Limnol. Oceanogr. 47: 1694-1701.
Werne, J.P., Haese, R.R., Zitter, T., Aloisi, G., Bouloubassi, I., Heijs, S.K. et al. (2004) Life at cold seeps: a synthesis of biogeochemical and ecological data from Kazan mud volcano, eastern Mediterranean Sea. Chem. Geol. 205: 367-390.
Whiticar, M. (1993) Stable isotopes and global budgets. Atmospheric Methane—Sources, Sinks, and Role in Environmental Change, NATO ASI Ser.: Global Environ. Change 1.
50

Chapter I: Methane in the Marine and Global Carbon Cycle
Whiticar, M.J. (1999) Carbon and hydrogen isotope systematics of bacterial formation and oxidation of methane. Chem. Geol. 161: 291-314.
Whiticar, M.J., Faber, E. and Schoell, M. (1986) Biogenic methane formation in marine and freshwater environments: CO2 reduction vs. acetate fermentation--Isotope evidence. Geochim. Cosmochim. Ac. 50: 693-709.
Widdel, F. (1988) Microbiology and ecology of sulfate- and sulfur-reducing bacteria. In Biology of anaerobic microorganisms. Zehnder, A.J.B. (ed). New York: John Wiley & Sons, Inc., p. 469–585.
Wilkinson, T., Topiwala, H., and Hamer, G. (1974) Interactions in a mixed bacterial population growing on methane in continuous culture. Biotec. Bioeng. 16: 41-59.
Wuchter, C., Schouten, S., Boschker, H.T.S., and Sinninghe Damste, J.S. (2003) Bicarbonate uptake by marine Crenarchaeota. FEMS Microbiol. Lett. 219: 203-207.
51

Methane Oxidation and Carbon Assimilation in Marine Sediments
52

Chapter II: Methane Seepage in the North Sea
Chapter II
Biogeochemical processes and microbial diversity of the
Gullfaks and Tommeliten methane seeps (Northern North Sea)
Gunter Wegener1*, Maya Shovitri1, Katrin Knittel1, Helge Niemann1,2,†, Martin
Hovland3, Antje Boetius1,2,4
1 Max Planck Institute for Marine Microbiology, Bremen, Germany 2 Alfred Wegener Institute for Polar and Marine Research, Bremerhaven, Germany
3 Statoil, Stavanger, Norway 4 Jacobs University Bremen, Bremen, Germany
Online on Biogeosciences Discussions
*Corresponding author: Gunter Wegener, Max Planck Institute for Marine Microbiology,
† present address: Institute for Environmental Geoscience, University of Basel,
Switzerland
53

Methane Oxidation and Carbon Assimilation in Marine Sediments
Abstract: Fluid-flow related seafloor structures and gas seeps were detected in the
North Sea in the 1970s and 1980s by acoustic sub-bottom profiling and oil rig
surveys. A variety of features like pockmarks, gas vents and authigenic carbonate
cements were found to be associated with sites of oil and gas exploration, indicating
a link between these surface structures and underlying deep hydrocarbon reservoirs.
In this study we performed acoustic surveys and videographic observation at
Gullfaks, Holene Trench, Tommeliten, Witch’s Hole and the giant pockmarks of the
UK Block 15/25, to investigate the occurrence and distribution of cold seep
ecosystems in the Northern North Sea. The most active gas seep sites, i.e. Gullfaks
and Tommeliten, were investigated in detail: at both sites gas bubbles escaped
continuously from small holes in the seabed to the water column, reaching the upper
mixed surface layer as indicated by acoustic images of the gas flares. At Gullfaks a
0.1 km² large gas emission site was detected on a flat sandy seabed, covered by
filamentous sulfide-oxidizing bacteria. At Tommeliten we found a patchy
distribution of small bacterial mats indicating sites of gas seepage. Here the seafloor
consists of layers of sand and stiff clay, and gas emission was observed from small
cracks in the seafloor. At both sites the anaerobic oxidation of methane (AOM)
coupled to sulfate reduction is the major source of sulfide. Molecular analyses
targeting specific lipid biomarkers and 16S rRNA gene sequences identified an
active microbial community dominated by sulfide-oxidizing and sulfate-reducing
bacteria (SRB) as well as methanotrophic bacteria and archaea. Carbon isotope
values of specific microbial fatty acids and alcohols were highly depleted, indicating
that the microbial community at both gas seeps incorporates methane or its
metabolites. The microbial community composition of both shallow seeps show
high similarities to the deep water seeps associated with gas hydrates such as
Hydrate Ridge or Eel River basin.
54

Chapter II: Methane Seepage in the North Sea
1. Introduction:
The North Sea is a marginal sea of the Atlantic on the European continental shelf.
Its sedimentary basin, especially the Western and Northern areas, hosts large gas and oil
fields which are exploited since the 1970s. Leaking methane reservoirs are a major source
for shallow gas accumulations and emission into the water column and atmosphere
(Hovland and Judd, 1988, Rehder et al., 1998; Judd and Hovland 2007). In the North Sea,
eruptive gas ebullition through impermeable seabed consisting of stiff glacial clays leads to
the formation of small craters at the seafloor, also known as pockmarks (Hovland and Judd,
1988). These pockmarks have diameters in the range of few to several hundred meters and
are widespread in gas and oil fields of the central and northern North Sea. Intensive
bathymetric and videographic surveys by the British Geological Survey and oil industry have
led to a good understanding of the distribution of these and other gas escape structures in
the North Sea (Judd and Hovland, 2007). As part of the 5th EU framework project
METROL “Methane fluxes in ocean margin sediments: microbiological and geochemical
control” we have studied the distribution, biogeochemistry and microbiology of gas seepage
in the North Sea, to identify potential sites of methane emission to the atmosphere, and to
better understand the functioning of the associated shallow water seep ecosystems.
Although methane is abundant in the seafloor, the oceans account for only 3 to 5%
of the global atmospheric methane flux (Reeburgh, 2007). Aerobic and anaerobic microbial
methane consumption almost completely control the gas flux into the water column and
atmosphere, except at sites of high fluid flow and free gas ebullition (Valentine and
Reeburgh, 2000). The anaerobic oxidation of methane with sulfate as terminal electron
acceptor is the dominant biogeochemical process in gassy sediments (Hinrichs and Boetius,
2002). Its net reaction can be described according to equation (1), but the underlying
biochemistry of this process remains unknown (Widdel et al., 2007).
OHHSHCOSOCH 23244 ��� ��� (1)
55

Methane Oxidation and Carbon Assimilation in Marine Sediments
Several phylogenetic clades of archaea related to the order Methanosarcinales were
identified as anaerobic methanotrophs by analyses of 16S rRNA gene sequences and of
stable isotope signatures of specific biomarkers (Hinrichs et al., 1999; Boetius et al., 2000;
Orphan et al., 2001b, Niemann et al., 2006). In most seep habitats archaea form consortia
with sulfate-reducing bacteria of the Desulfosarcina/Desulfococcus or Desulfobulbus groups
(Knittel et al., 2003; Niemann et al., 2006; Lösekann et al., 2007). These associations are
commonly attributed to obligate syntrophy, in which the archaeal partner activates and
metabolizes methane, providing an intermediate that is scavenged by the sulfate-reducing
partner (Nauhaus et al., 2002; 2007). Analyses of carbon isotopes in seep ecosystems have
shown a tight link between methane, the microbial consortia, authigenic carbonate
precipitates and higher trophic levels in the food web (Hovland et al., 1985; Ritger et al.,
1987, Hinrichs and Boetius, 2002; Hovland et al., 2002; Levin, 2005). Deep water gas seeps
often support an enormous biomass of free-living and symbiotic microbial life that is
nourished by the oxidation of methane and the product of its anaerobic oxidation, sulfide. A
prominent feature of such seeps are mat-forming chemoautotrophic bacteria using sulfide as
energy source, including Beggiatoa (Treude et al., 2003; Joye et al., 2004), and Arcobacter
(Omoregie et al., in review). Furthermore, authigenic carbonates related to anaerobic
oxidation of methane (AOM) are found at many seeps. The precipitation of these
carbonates is possibly related to an increase of pore water alkalinity due to AOM (Luff and
Wallmann, 2003). Carbonate outcrops attract a variety of hardground fauna like corals,
ophiurids, sponges and bivalves (Hovland and Risk, 2003, Niemann et al., 2005). Ultimately,
the carbonate precipitation associated with AOM can fill and seal gas escape conduits
(Hovland, 2002).
Biogeochemical research efforts on cold seeps during the last decade mainly focused
on deep water systems, especially those associated with gas hydrates. As a consequence,
much more is known about these systems than about shallow water seeps in estuaries and
56

Chapter II: Methane Seepage in the North Sea
shelf seas, despite their potential relevance for gas emission to the atmosphere. Specifically
in the Northern North Sea, where the water column is frequently mixed by storms, methane
emission from the seabed is likely to result in an export of this greenhouse gas to the
atmosphere. However, well constrained estimates of the methane flux from the seabed to
the atmosphere are still missing for the North Sea.
Here we investigated several pockmarks and potential sites of gas seepage of the
Northern North Sea. Sediments were sampled from sulfide oxidizing bacterial mats which
were associated with gas ebullition. Based on the concentration and carbon isotopy of
specific lipid biomarkers, as well as by 16S rRNA sequence analysis, we describe the
microbial communities of the two active shallow water seeps in the North Sea (Gullfaks and
Tommeliten). Furthermore, their phylogenetic and biogeochemical characteristics are
compared with those of known deep water cold seep communities to investigate whether
shallow and deep seeps are populated by different types of methanotrophs.
2. Material and methods
Sampling sites
Figure 1 gives an overview on the cold seep sites in the North Sea visited during the
METROL cruises (R/V Heincke cruises HE169, HE180, HE208 and R/V Alkor cruise
AL267; also see Tab. 1). For all investigated sites detailed background information was
obtained previously during extensive geological surveys including seismic and sonar
monitoring of seabed and water column features, as well as by videographic exploration
using towed cameras and ROVs (Hovland and Judd, 1988). Gas emissions at Tommeliten
and Gullfaks have been documented for a period over 25 years (Niemann et al., 2005, Judd
and Hovland, 2007).
Gullfaks is one of the four major Norwegian oil and gas fields, located in the
northeastern edge of the North Sea Plateau. The water depth in this area is ca. 140 m and
57
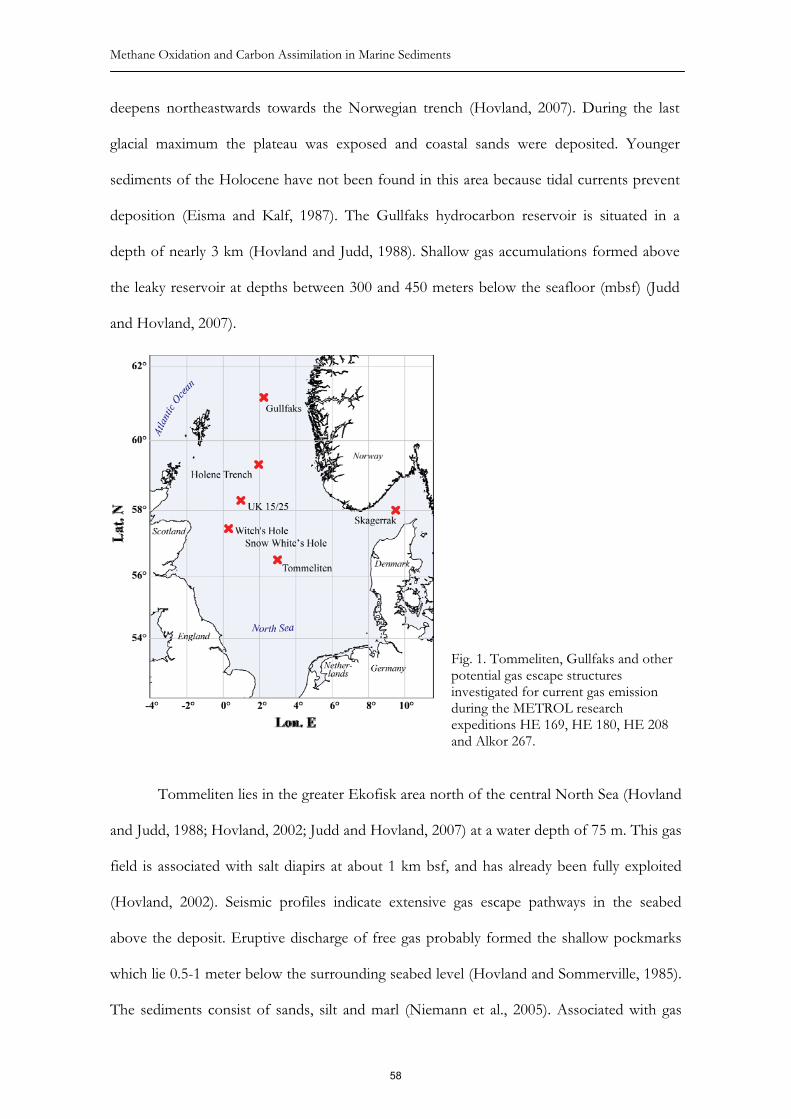
Methane Oxidation and Carbon Assimilation in Marine Sediments
deepens northeastwards towards the Norwegian trench (Hovland, 2007). During the last
glacial maximum the plateau was exposed and coastal sands were deposited. Younger
sediments of the Holocene have not been found in this area because tidal currents prevent
deposition (Eisma and Kalf, 1987). The Gullfaks hydrocarbon reservoir is situated in a
depth of nearly 3 km (Hovland and Judd, 1988). Shallow gas accumulations formed above
the leaky reservoir at depths between 300 and 450 meters below the seafloor (mbsf) (Judd
and Hovland, 2007).
Fig. 1. Tommeliten, Gullfaks and other potential gas escape structures investigated for current gas emission during the METROL research expeditions HE 169, HE 180, HE 208 and Alkor 267.
Tommeliten lies in the greater Ekofisk area north of the central North Sea (Hovland
and Judd, 1988; Hovland, 2002; Judd and Hovland, 2007) at a water depth of 75 m. This gas
field is associated with salt diapirs at about 1 km bsf, and has already been fully exploited
(Hovland, 2002). Seismic profiles indicate extensive gas escape pathways in the seabed
above the deposit. Eruptive discharge of free gas probably formed the shallow pockmarks
which lie 0.5-1 meter below the surrounding seabed level (Hovland and Sommerville, 1985).
The sediments consist of sands, silt and marl (Niemann et al., 2005). Associated with gas
58

Chapter II: Methane Seepage in the North Sea
leakage pathways are calcareous cements, some of which extend above the seafloor and
form reefs populated by diverse anthozoa and other hardground fauna (Hovland and Judd,
1988; Niemann et al., 2005). Acoustic turbidity indicated the presence of free gas in the
seabed in an area of about 0.12 km2. Sonar surveys revealed gas escape to the water column,
and accordingly, numerous gas seeps associated with whitish bacterial mats were observed
during ROV surveys (Hovland et al. 1993; Judd and Hovland, 2007, Niemann et al., 2005).
Gas seepage was confined to about 120 individual bubble streams in an area of 6500 m2. An
emission of 47g CH4 m-2 was estimated for this seepage area (Hovland et al., 1993). In the
vicinity of the gas vents, elevated methane concentrations and gas bubbles were found in the
seabed, at a sediment depth of 1-5 mbsf, associated with layers of carbonate precipitates and
cements (Niemann et al. 2005). These observations and biogeochemical rate measurements
indicate that most methane may be consumed in the seafloor, but that considerable gas
escape to the water column occurs through cracks and fissures (Niemann et al., 2005). The
carbon isotope signature of methane emitted from the seafloor of -45.6‰ indicates its
thermogenic origin (Hovland and Sommerville, 1985; Hovland and Judd, 1988).
Seafloor observations
During the cruises HE 169, HE 180, HE 208 and AL267 (Tab. 1), several seep
locations of the North Sea were visited (Fig. 1). Gas flares were detected using the sediment
echo sounder system SES-2000 provided by INNOMAR (Rostock, Germany). The emitter
induces two primary frequencies near 100 kHz to generate secondary bandwidths of 4 and
15 kHz. The long waves were used to visualize shallow sea floor structures and layering.
Water depth and gas flares were recorded with the 15 kHz spectrum, while sediment
features were observed with a 4 kHz spectrum. Several acoustic transects were evaluated to
quantify the gas flares and their extensions, and to localize the flare source at the seafloor.
Video observations were performed with the ROV Sprint (Alfred Wegener Institute for
59

Methane Oxidation and Carbon Assimilation in Marine Sediments
Polar and Marine Research, Bremerhaven; HE169), the towed camera system of the AWI
(HE180) or the MPI (Spy, Mariscope, Kiel; HE208), or via a remotely operating vehicle at
Tommeliten (ROV Cherokee, MARUM, Bremen; AL267).
Table 1. Visited gas escape structures and the presence of gas flares and methane-derived carbonates. The cruises took place in June 2002 (HE169), October 2002 (HE180), May 2004 (HE208), and eptember 2005 (AL267). n.a. – bottom observations were not available, #described in Judd and Hovland 2007 S
Structure Latitude Longitude Water depth Cruise gas escape authigenic carbonates
Gullfaks seep 61°10.40' 02°14.50' 150 m HE 169, HE 180, Al 267 HE208
yes no
Holene Trench 59°19.60' 01°57.60' 130 - 145 m HE 169 no yes# UK 15/25 pockmarks
58°17.00' 00°58.50' 155 - 170m HE 180, HE 208 yes yes
Witch's Hole 57°56.50' 00°23.30' 135 m HE 208 no yes# Snow White’s Hole
57°58.81' 00°23.30' 145 m HE 208 yes n.a.
Tommeliten 56°29.90' 02°59.80' 75 m HE 169, HE 180, AL267
yes yes
Skagerrak pockmarks
58°00.00' 09°40.00' 120 -150 m HE 208 no no#
Sediment sampling
At Gullfaks sediments were sampled in May 2004 (HE208) using a video-guided
multiple corer system (MUC; Octopus, Kiel). The samples were recovered from an area
densely covered with bacterial mats where gas ebullition was observed. The coarse sands
limited MUC penetration depth to max 30 centimeters. The highly permeable sands did not
allow vertical subsampling of the MUCs at high resolution, because porewater was lost
during subsampling.
The gas flare mapping and videographic observation at Tommeliten indicated an
area of gas emission, which consisted of a few small patches of bacterial mats with diameters
< 50 centimeters, spaced apart by 10-100 m, from most of which a single stream of gas
bubbles emerged. Sampling of these patchy gas vents was only possible with the ROV
Cherokee to which we mounted 3x 3.8cm diameter push cores. The cores were sampled in
3 cm intervals.
60

Chapter II: Methane Seepage in the North Sea
Sediment porosity, sulfate and methane concentrations were determined following
the METROL protocol (http://www.metrol.org/index.php?bereich=1). In situ methane
concentrations were calculated using PHREEQC, Version 2, US Geological Survey, 2007.
Samples for molecular, microbiological and biomarker analyses were processed as described
below.
Radiotracer based in vitro measurements of AOM and SR were performed in the home
laboratory. Sediment samples stored anoxically in wide mouth bottles with artificial,
anaerobic seawater medium (28 mM Sulfate, 30 mM carbonate, 1 mM sulfide, equilibrated at
a pH of 7.2; see also Widdel and Bak, 1992) were transferred into Hungate tubes, refilled
with medium and brought into equilibrium with one atmosphere of methane (Krüger et al.,
2005). Controls without methane addition were prepared to determine methane
independent SR. Rates were determined from replicate incubations (n �3). After one day of
equilibration, 35SO4 (50 kBq dissolved in 10μl water) for SR and 14CH4 (10 kBq dissolved in
50 μl water) for AOM were injected into the Hungate tubes through a butyl rubber septum.
Samples were incubated for 7 days at in situ temperatures (8°C). The reactions were stopped
by transferring the samples into zinc acetate and NaOH solution, respectively (Treude et al.,
2003). Further processing of AOM and SR samples was carried out as described previously
(Treude et al., 2003; Kallmeyer et al., 2004), respectively. Concentrations and activities of the
reactants (methane or sulfate) and the activities of the products (sulfide or carbonate) were
measured to determine AOM and SR rates according to the following formulas:
� �methaneatcarbonateaCHAOMrate
C
C
14
14
4
��
� (2),
06.1][ 4 ���
��
sedmaTOTtaTRISSOSRR (3),
61

Methane Oxidation and Carbon Assimilation in Marine Sediments
In equation (2) [CH4] is the concentration of methane, a14Cmethane and a14Ccarbonate the
activity of the reactant and the product of AOM (Treude et al., 2003). In equation 3, [SO4]
is the concentration of sulfate, aTRIS the activity of the total reduced inorganic sulfur, aTOT
is the total activity of sulfide and sulfate and t is the reaction time. The factor 1.06 accounts
for the discrimination of the heavier radio nucleotide 35S (Jørgensen and Fenchel, 1974).
Total organic carbon content (TOC) and carbon nitrogen ratios (C/N) were analyzed
from freeze-dried samples. Briefly, inorganic carbon (carbonate) was removed via HCl
acidification. Subsequently, 20 to 30 mg of homogenized samples were filled in zinc
cartridges and organic carbon and nitrogen was measured in a CNS analyzer (Carlo Erba
NA 1500 CNS analyzer).
Biomarker analyses. Lipid biomarker extraction from 10 - 17 g wet sediment was carried
out as described in detail elsewhere (Elvert et al., 2003). Briefly, defined concentrations of
cholestane, nonadecanol and nonadecanolic acid with known �13C-values were added to the
sediments prior to extraction as internal standards for hydrocarbons, alcohols and fatty
acids, respectively. Total lipids were extracted from the sediment by ultrasonification with
organic solvents of decreasing polarity. Esterified fatty acids were cleaved by saponification
with methanolic KOH solution. From this mixture, the neutral fraction (mainly
hydrocarbons and alcohols) was extracted with hexane. After subsequent acidification, fatty
acids were extracted with hexane. For analysis, fatty acids were methylated using BF3 in
methanol yielding fatty acid methyl esters (FAMES).
The neutral fraction was further separated into hydrocarbons, ketones and alcohols
on a SPE cartridge with solvents of increasing polarity (Niemann et al., 2005). The ketone
fraction was not further analyzed. Shortly before analyses alcohols were methylated to
trimethylsilyl (TMS) ethers using bis(trimethylsilyl)triflouracetamid (BSTFA). Concentration
62

Chapter II: Methane Seepage in the North Sea
and identity of single lipid compounds was determined by gas chromatography (GC) and
gas chromatography-mass spectrometry (GC-MS) analysis, respectively (Elvert et al., 2003,
2005; Niemann et al, 2005). Double bound positions of monoeonic fatty acids were
determined analyzing their dimethyl disulfide (DMDS) adducts according to Moss and
Labert-Faeir (1989). �13C-values of single lipid compounds were determined by GC-IRMS
analyses according to Elvert et al. (2003). Concentration and isotopic signatures of fatty acid
and alcohol were corrected for the additional carbon atoms added during derivatisation.
DNA extraction, PCR amplification and clone library construction. From both sites
DNA was extracted from 2 g of wet sediment (1-3 cm depth) using bio101 soil kit (Bio101,
La Jolla, California). Domain-specific primers were used to amplify almost full-length 16S
rRNA genes from the extracted chromosomal DNA by PCR. For Bacteria, primers GM3F
(Muyzer et al., 1995) and EUB1492 (Kane et al., 1993) were used, for Archaea, the primers
ARCH20F (Massana et al., 1997) and Uni1392 (Lane et al., 1985) were used. PCRs were
performed (30 cycles) and products purified as described previously (Ravenschlag et al.,
1999). DNA was ligated in the pGEM-T-Easy vector (Promega, Madison, WI) and
transformed into E. coli TOP10 cells (Invitrogen, Carlsbad, CA) following manufacturer’s
recommendation.
Sequencing and phylogenetic analysis. Sequencing was performed by Taq cycle
sequencing with a model ABI377 sequencer (Applied Biosystems). The presence of chimeric
sequences in the clone libraries was determined with the CHIMERA_CHECK program of
the Ribosomal Database Project II (Center for Microbial Ecology, Michigan State
University, http://rdp8.cme.msu.edu/cgis/chimera.cgi?su=SSU). Sequence data were
analyzed with the ARB software package (Ludwig et al., 2004). Phylogenetic trees were
calculated with the ODP 204 sequences from this project together with reference sequences,
63
Methane Oxidation and Carbon Assimilation in Marine Sediments
which were available in the EMBL, GenBank and DDJB databases by maximum-likelihood
and neighbor-joining analysis with different sets of filters.
Cell counts and CARD-FISH (Catalyzed reporter deposition - fluorescence in situ
hybridization). The fixation for total cell counts and CARD-FISH were performed on-
board directly after sampling. For both methods 2 ml of the sediment were added to 9ml of
2% formaldehyde artificial seawater solution, respectively. After fixation for two hours
CARD-FISH samples were washed three times with 1xPBS (10mM sodium phosphate
solution, 130 mM NaCl, adjusted to a pH of 7.2 by titration with Na2HPO4 or NaH2PO4)
and finally stored in 1:1 PBS:ethanol solution at -20°C until further processing. Samples for
total cell counts were stored in formalin at 4°C.
For the sandy samples the total cell count/CARD-FISH protocol were optimized to
separate the sands particles from the cells. Cells were dislodged from sediment grains and
brought into solution with the supernatant by sonicating each samples on ice for 2 min at
50W. This procedure was repeated four times and supernatants were combined. Total cell
numbers were determined from the supernatant using acridine orange direct counting
(AODC; Meyer-Reil, 1983).
CARD-FISH was performed following the protocol of Pernthaler (2002). The
sediment samples were brought to a final dilution of 1:2000 to 1:4000 and filtered onto
0.2μm GTTP filters (Millipore, Eschbonn, Germany). The probes used in this study (all
purchased from biomers.net GmbH, Ulm, Germany) were EUB 338 I-III specific for most
Bacteria (Amann et al., 1990; Daims et al., 1999), DSS658 specific for Desulfosarcina spp.,
Desulfococcus spp. and closely related clone sequences (Manz et al., 1998), Arch915 specific
for most Archaea (Stahl and Amann, 1991), and probes ANME1-350 (Boetius et al., 2000),
ANME2a-647, ANME2c-622 (Knittel et al., 2005) and ANME3-1249 (Niemann et al.,
2006) specific for ANME-1, -2a, -2c, and -3 archaeal cells, respectively. Cell
64

Chapter II: Methane Seepage in the North Sea
permeabilization and probe hybridization were performed according to the author’s
instructions. For reference cell numbers, samples were also stained with 4’6’-diamidino-2-
phenlyindole (DAPI) for 15minutes (1μg/ml) and washed with sterile filtered water and
ethanol for 60 and 30 seconds, respectively. Air-dried filters were imbedded in Citifluor
(Citifluor Ltd., Leicester, UK). Cells were counted using an epifluorescence microscope
(Axioplan, Zeiss, Germany). At least 1000 cells in randomly chosen fields were counted per
sample. To quantify aggregates of ANME-2a, -2c and -3 up to 250grids were counted under
400-fold magnification. Dual hybridizations for sulfate reducers (DSS) and archaea (ANME-
2a and -2c) were performed using different fluorescence dyes (cy3 and cy5) and images were
taken with a confocal laser scanning microscope (LSM510; Carl Zeiss, Jena, Germany).
3. Results and discussion
Distribution of active seeps in the Northern North Sea
The presence of gas flares indicating active methane seepage from the seabed was
detected at different fluid flow-related seafloor structures visited during the METROL
cruises. Large and abundant gas flares were found at Tommeliten, Gullfaks, Snow White’s
Hole and the giant pockmarks of UK block 15/25 (Fig. 1, 2; Tab. 1).
The pockmarks of UK Block 15/25, Snow White’s Hole and Witch’s Hole are part
of the Witch Ground formation, northwest of the Tommeliten seep area (Fig. 1, Hovland
and Judd, 1988). During our cruises (HE180 and HE208), most of the 5 giant (Scanner,
Scotia and Challenger formation) and two medium sized pockmarks of the UK Block 15/25
showed active seepage of methane from the deepest part of each depression (up to 17 m
below the surrounding seafloor; Fig. 2c). Hovland et al. (1993) estimated the average flux at
this location with 26 g CH4 m-2 yr-1. In the center of the pockmarks we also observed
carbonate outcrops which were populated with benthic organisms, mostly sea anemones.
Unfortunately we were not able to sample the surface and subsurface cements at the bottom
65
Methane Oxidation and Carbon Assimilation in Marine Sediments
of the steep pockmarks because the gravity corer and multiple corer could not penetrate.
The methane venting and the carbonate cements have been observed previously (Hovland
and Judd, 1988) and during all expeditions to this site, indicating that the UK 15/25
pockmarks may have been continuously emitting methane to the hydrosphere for at least
two decades. The gas flares at the UK 15/25 pockmarks reached up to 80 m below the sea
surface. In contrast to earlier observations (Hovland and Judd 1998), the Witch’s Hole
structure itself was presently dormant, but we found an active pockmark southwest of it,
which we named Snow White’s Hole (Fig. 2d). This structure emits a large gas flare
extending about 80 m from the seafloor. However sampling directly at the flare was not
possible most likely because of the presence of carbonate cements. Sampling in the vicinity
of the gas flare at the edge of the pockmark recovered only oxidized non-seep sediments.
The Holene Trench is an open channel of ca. 1 km width located on the Norwegian
Plateau in about 120 m water depth. Previous surveys showed an acoustic turbidity in the
top most 30 m of the surface sediments indicating gas charged sediments (Hovland and
Judd, 1988). During our survey, two places were found where the turbidity extends to the
surface of the sea floor, which could be related to active seep sites. However, during
HE-169 we could not find any traces for active seepage (Fig. 2b) and only beige, oxidized
clay sediments were recovered by multiple corer sampling. The western slope of the
Norwegian Trench hosts several pockmark-like structures, which do not show carbonate
outcrops (Hovland and Judd, 1988). Our survey during cruise HE-169 did not reveal any
traces of seepage and one grab sample recovered beige, oxidized sandy-silty sediments.
Previous surveys in the Skagerrak found several pockmarks with active gas escapes and
seepage related fauna (Dando et al., 1994; Rise et al., 1999). During HE-208 we did not
observe gas seepage from the positions reported in Dando et al. 1994 (Fig. 2f).
66
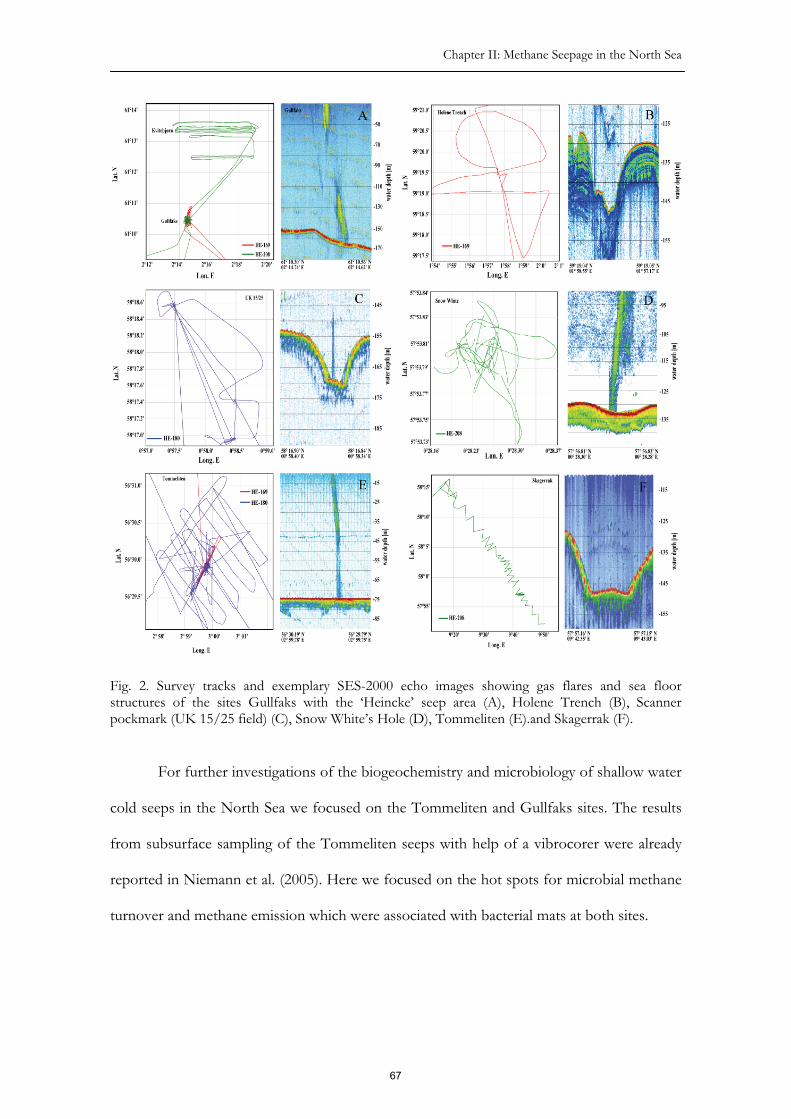
Chapter II: Methane Seepage in the North Sea
Fig. 2. Survey tracks and exemplary SES-2000 echo images showing gas flares and sea floor structures of the sites Gullfaks with the ‘Heincke’ seep area (A), Holene Trench (B), Scanner pockmark (UK 15/25 field) (C), Snow White’s Hole (D), Tommeliten (E).and Skagerrak (F).
For further investigations of the biogeochemistry and microbiology of shallow water
cold seeps in the North Sea we focused on the Tommeliten and Gullfaks sites. The results
from subsurface sampling of the Tommeliten seeps with help of a vibrocorer were already
reported in Niemann et al. (2005). Here we focused on the hot spots for microbial methane
turnover and methane emission which were associated with bacterial mats at both sites.
67
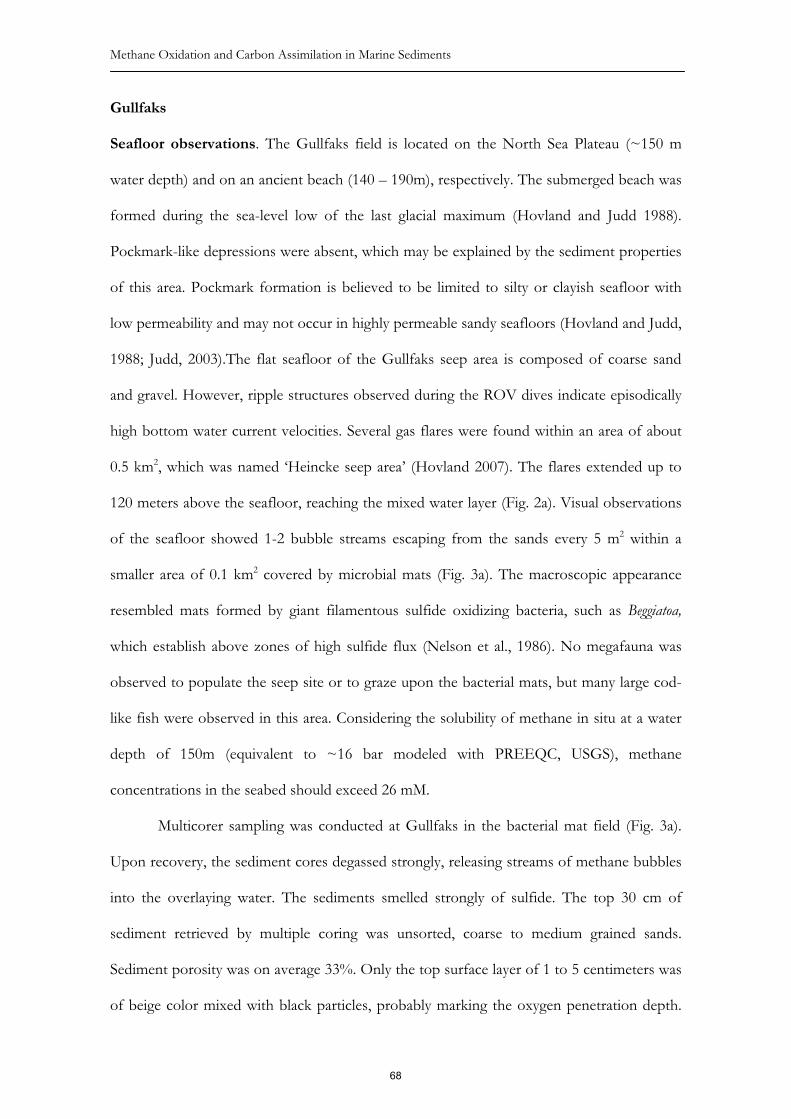
Methane Oxidation and Carbon Assimilation in Marine Sediments
Gullfaks
Seafloor observations. The Gullfaks field is located on the North Sea Plateau (~150 m
water depth) and on an ancient beach (140 – 190m), respectively. The submerged beach was
formed during the sea-level low of the last glacial maximum (Hovland and Judd 1988).
Pockmark-like depressions were absent, which may be explained by the sediment properties
of this area. Pockmark formation is believed to be limited to silty or clayish seafloor with
low permeability and may not occur in highly permeable sandy seafloors (Hovland and Judd,
1988; Judd, 2003).The flat seafloor of the Gullfaks seep area is composed of coarse sand
and gravel. However, ripple structures observed during the ROV dives indicate episodically
high bottom water current velocities. Several gas flares were found within an area of about
0.5 km2, which was named ‘Heincke seep area’ (Hovland 2007). The flares extended up to
120 meters above the seafloor, reaching the mixed water layer (Fig. 2a). Visual observations
of the seafloor showed 1-2 bubble streams escaping from the sands every 5 m2 within a
smaller area of 0.1 km2 covered by microbial mats (Fig. 3a). The macroscopic appearance
resembled mats formed by giant filamentous sulfide oxidizing bacteria, such as Beggiatoa,
which establish above zones of high sulfide flux (Nelson et al., 1986). No megafauna was
observed to populate the seep site or to graze upon the bacterial mats, but many large cod-
like fish were observed in this area. Considering the solubility of methane in situ at a water
depth of 150m (equivalent to ~16 bar modeled with PREEQC, USGS), methane
concentrations in the seabed should exceed 26 mM.
Multicorer sampling was conducted at Gullfaks in the bacterial mat field (Fig. 3a).
Upon recovery, the sediment cores degassed strongly, releasing streams of methane bubbles
into the overlaying water. The sediments smelled strongly of sulfide. The top 30 cm of
sediment retrieved by multiple coring was unsorted, coarse to medium grained sands.
Sediment porosity was on average 33%. Only the top surface layer of 1 to 5 centimeters was
of beige color mixed with black particles, probably marking the oxygen penetration depth.
68

Chapter II: Methane Seepage in the North Sea
The color shift to blackish sediments below indicated the change of redox conditions to
negative values and the presence of free sulfide and iron sulfide precipitations. Within the
gassy sediment abundant ferromagnetic minerals, probably magnetite or greigite, were
found, indicating a connection of methane and iron fluxes. Total organic carbon showed
average values of only 0.17%, indicating that the main source for the observed high sulfide
concentrations may be methane rather than deposited organic material.
Fig. 3a. Mats of giant sulfide-oxidizing bacteria covering coarse sands and pebbles at the Heincke seep area at Gullfaks (left panel). The mats coincide with the area of gas ebullition and cover an area of about 0.1 km2 (right panel). 3b. Bacterial mats of the Tommeliten gas seep. Left panel: Sampling of a mat patch with a diameter of about 30cm. Gas ebullition was observed during sampling. Right panel: Map showing the distribution of mats, gas flares and carbonates (after Niemann et al. 2005).
Microbial methane oxidation and sulfate reduction. From all six multicorer samples
retrieved from the mat covered area, methane oxidation and sulfate reduction rate
measurements were performed using replicate subsamples of the bulk sediments from the
top 25 cm. Methane oxidation rates ranged from 0.006 μmol g-1 to 0.18 μmol g-1 dry weight
69

Methane Oxidation and Carbon Assimilation in Marine Sediments
d-1 and sulfate reduction rates (SRR) from 0.05μmol g-1 to 0.3 μmol g-1 dry sediment d-1. In
control measurements without methane, SRR was negligible, indicating that methane was
the dominant electron donor for sulfate reduction. The integrated methane oxidation rates
averaged 12.5 mmol m-2 d-1 and the integrated SRR 18.5 mmol m-2 d-1. These are
comparatively high rates which fall within the range of other measurements from bacterial
mat covered seep sites like Hydrate Ridge (5.1 to 99 mmol m-2 d-1; (Treude et al., 2003) or
Haakon Mosby Mud Volcano (4.5 mmol m-2 d-1; (Niemann et al., 2006)). Using the mean
methane oxidation rate from our incubations, a methane consumption of 15 t yr-1 can be
roughly calculated for an area of 0.1 km2. Based on quantifications of single gas bubble
streams (Hovland et al., 1993) we estimated a gas flux to the water column of 76 t yr-1 for
this area, which means that the microbial filter could consume at least 16% of the total gas
flux. Of course, these are only rough estimates, as the gas streams may vary strongly in
intensity and methane content.
Biomarker and carbon isotope signatures. The 13C-carbon compositions of methane at
Gullfaks cover a range from -44.4‰ vs. PDB (Pee Dee Belemnite) at reservoir level (2,890
m below seafloor) to -70‰ at seafloor level (Judd and Hovland, 2007). The abundance of
specific biomarker lipids and their stable carbon isotope signatures were analyzed to reveal
the distribution of chemoautotrophic and methanotrophic microbial communities. The lipid
concentrations and isotopic signatures of the Gullfaks microbial communities (Core 766) are
shown in Table 2. In comparison to highly active seep sites such as Hydrate Ridge,
concentrations of lipid biomarkers at Gullfaks and Tommeliten were low.
In surface sediments of Gullfaks monounsaturated fatty acids were strongly
dominant. Although these fatty acids are produced by a wide range of gram negative
bacteria (Fang et al., 2005), their relative abundance can be used to trace specific microbial
groups. The measured ratio for C16:1�7c, C18:1�7c and C16:0 of 68:18:14 was close to the ratio of
70

Chapter II: Methane Seepage in the North Sea
73:18:9 previously reported for Beggiatoa filaments covering cold seep sediments of the Gulf
of Mexico (Zhang et al., 2005). The �13C-values of the FA C16:1�7c and C18:1�7c (-59 and -41‰,
respectively) extracted from the bacteria covered sands, indicate a substantial contribution
of autotrophic carbon fixation as previously found for several species of giant filamentous
sulfide oxidizers (Nelson and Jannasch, 1983; Nelson et al., 1986; Nelson et al., 1989). In
addition to signatures of sulfide oxidizing bacteria, substantial amount of diplopterol were
found. This hopanoid is synthesized by several aerobic bacteria including methanotrophs
(Rohmer et al., 1984). A methanotrophic origin of this biomarker at Gullfaks is likely
because of its highly depleted stable carbon composition (-84‰).
Table 2. Biomarker concentrations and their isotopic signatures in sediments from bacterial mat covered sands (Gullfaks Station 766), and sediments (Tommeliten Station 1274-K3) as well as from the subsurface SMTZ of Tommeliten (155 cm data by Niemann et al., 2005). n.d. = not detected; n.a. = not available.
Gullfaks Station 766 (0-10cm)
Tommeliten 1274-K3
(0-10cm)
Tommeliten Core 1904
155cm SMTZ
Compound μg gdw-1 � 13C VPDB μg gdw-1 � 13C
VPDB μg gdw-1 �13C VPDB
C14:0 1.27 -60 0.64 -30 0.15 -28 i-C15:0 0.61 -41 0.30 -35 0.06 -43 ai-C15:0 0.64 -42 0.43 -34 0.14 -43 C15:0 0.40 -48 0.22 -38 0.07 -37 C16:1�7c 24.04 -59 2.54 -38 0.02 -38 C16:1�5c 3.79 -77 0.39 -51 0.01 n.a. C16:0 6.17 -46 1.93 -32 0.60 -31 10Me-C16:0 0.45 -39 0.21 -33 0.02 n.a. i-C17:0 0.12 n.d. 0.06 -39 0.04 n.a. ai-C17:0 0.09 n.d. 0.07 -37 0.04 n.a. cy-C17:0 0.24 -97 0.27 -59 n.a. n.a. C17:0 0.16 -36 0.08 -29 0.04 n.a. isoprenFA-C19:0 0.38 -34 0.13 -27 n.a. n.a. C18:1�9c 0.91 -37 0.65 -26 0.27 n.a. C18:1�7c 6.65 -41 1.60 -45 0.06 -32 C18:0 0.35 -37 0.32 -30 0.35 -34 Diplopterol 0.43 -84 n.d. n.d. n.a. n.a. archaeol 0.05 -115 0.05 -86 0.47 -61 sn2-hydro.arch 0.16 -117 0.31 -90 0.08 -80
Characteristic lipids for seep associated sulfate reducing proteobacteria are C16:1�5c,
cy-C17: 0�5,6, (Blumenberg et al., 2004; Elvert et al., 2003; Niemann et al., 2005, Niemann and
71

Methane Oxidation and Carbon Assimilation in Marine Sediments
Elvert in press). We found a biomarker pattern with a clear dominance of C16:1�5c relative to
iC15:0 previously identified as a typical signature for populations of sulfate reducers
associated to ANME-2 and -3 dominated communities (Niemann and Elvert, in press).
Specifically the �13C-value of C16:1�5c, of -77‰ strongly indicates an incorporation of
methane-derived carbon. Previously, Niemann et al. (2006) reported an association of
Desulfobulbus related bacteria to ANME-3. We did not find the typical biomarker C17:1�6 of
this group, nor the related sequences in the Gullfaks sediments (Lösekann et al., 2007).
Instead, substantial amounts of the 13C-depleted FA cy-C17:0�5,6 (-97‰,) provides evidence
for a dominance of SRB of the Seep-SRB1 cluster associated with ANME-2 (Elvert et al.,
2003; Niemann et al., 2006, Niemann and Elvert in press). The fatty acids iso- and
anteiso-C15:0 were less depleted with isotope compositions of -41 to -42‰. From the
difference in the carbon isotope composition of these two groups of sulfate reducing
bacteria, it appears likely that a diverse community of sulfate reducers is present in the
Gullfaks sediments, of which only some are coupled to the anaerobic methanotrophs.
Several clades of ANME produce 13C-depleted archaeol and sn2-hydroxyarchaeol
which are used as biomarkers for AOM (Orphan et al., 2001a; Michaelis et al., 2002;
Blumenberg et al., 2004). At Gullfaks, sn2-hydroxyarchaeol was 2.2-2.9 fold more abundant
than archaeol, indicating the dominance of ANME-2 populations (Blumenberg et al., 2004;
Niemann and Elvert, in press). Both compounds were highly depleted in 13C, with �13C-
values of -115‰ and -117‰. Assuming that methane was the sole carbon source (13C-
methane ~-70‰ (Judd and Hovland, 2007) for the synthesis of archaeol and sn2-
hydroxyarchaeol, this is equivalent to a 13C-fractionation of -45 to -47‰. This is in the range
of isotope fractionation factors previously reported for anaerobic methanotrophic archaea
from different marine settings (Hinrichs and Boetius, 2002; Niemann and Elvert, in press).
72

Chapter II: Methane Seepage in the North Sea
Microbial diversity and community composition based on 16S rRNA gene analyses.
The bacterial 16S rRNA gene library from the gassy sands at Gullfaks comprised 69 gene
sequences and was clearly dominated by microorganisms associated with seep ecosystems.
We found different groups of sulfate-reducing bacteria and thiotrophic as well as
methylotrophic bacteria (Tab. 3, Fig. 4). 15 sequences belonged to relatives of sulfur-
oxidizing symbiotic Gammaproteobacteria usually hosted by different marine worms or
mussels. No closely related sequences of filamentous sulfide oxidizers were found, although
these were visually present in the sample from which DNA was extracted. Sequences related
to methylotrophic bacteria (Methylomonas and Methylophaga relatives) were also abundant (6
sequences) matching our results from the biomarker studies. We found 10 sequences of
Deltaproteobacteria, which were all related to SRB of the Desulfosarcina/Desulfococcus group
(Seep-SRB-1), which is the partner of ANME-1 and -2 (Knittel et al., 2003). 19 clones were
related to the cluster of Cytophaga – Flavobacterium – Bacteriodetes (CFB) which is a diverse
group of bacteria commonly found in the plankton and sediment involved in the
degradation of complex organic matter, but which also occur at cold seep ecosystems
(Knittel et al., 2003).
The archaeal 16S rRNA sequence library was strongly dominated by Euryarchaeota
sequences. Sixty three of 69 analyzed clones were affiliated with ANME-2a (Tab. 3, Fig. 5),
the most common group of anaerobic methane oxidizers in gas hydrate bearing
environments (Knittel et al., 2005). The ANME-2a clones were highly similar to sequences
from other seep sites (Fig. 5), e.g. the Santa Barbara Basin Orphan et al., 2001a), Hydrate
Ridge (Knittel et al., 2005), the Gulf of Mexico seeps (Mills et al., 2003), and a Pacific
carbon dioxide seep (Inagaki et al., 2006). Sequences related to other groups performing
AOM, such as ANME-1, -2c, -3, were not found in our library. The only other
euryarchaeotal sequence belonged to the Marine Benthic Group D.
73

Methane Oxidation and Carbon Assimilation in Marine Sediments
Table 3. Overview of bacterial and archaeal 16S rRNA gene libraries and number of clones retrieved for the individual phylogenetic groups. Gullfaks (HE208, MUC766, 0-10 cm); Tommeliten (Bacterial patch 4-6cm, AL267 1274 K3-2) and Tommeliten deep SMTZ sulfate methane transition zone (HE180 1904, 160cm, Niemann et al., 2005).
Gullfaks Tommeliten (bact. patch)
Tommeliten (deep SMTZ)
Bacteria Alphaproteobacteria 1 1 Gammaproteobacteria Methylomonas 4 Methylophaga 2 Rel. of sulfur-oxidizing symbionts 15 Thioalkalivibrio, Thioploca rel. 18 Oceanospirillales 1 Deltaproteobacteria Seep-SRB1 1 3 51 Seep-SRB2 3 Seep-SRB3 3 Seep-SRB4 1 Desulfobacterium aniline rel. 4 3 4 Desulfobacterium rel. 1 2 Desulfobulbus rel. 1 29 Myxobacteriales rel. 12 Desulfuromonas rel. 1 Epsilonproteobacteria 3 2 Spirochaeta 1 Cytophaga/Flavobacterium/Bacteriodetes 19 4 3 Planctomycetales 3 4 Verrucomicrobia Victivalliaceae 3 1 36 Nitrospira 1 6 Holophaga/Acidobacterium 4 10 Nitrospina 2 OP11 1 Actinobacteria 2 7 Firmicutes Desulfotomaculum rel. 3 1 Thermomicrobia 4 Cyanobacteria 1 unaffiliated 4 5 3 Total bacterial clones analyzed 69 107 117
Archaea Euryarchaeota ANME-1 17 16 ANME-2a 63 ANME-2c 83 Marine Benthic Group D 1 1 Methanococcoides 1 Crenarchaeota Marine Benthic Group B 3 1 Marine Group 1 2 Total archaeal clones analyzed 69 102 17
74

Chapter II: Methane Seepage in the North Sea
Tabl
e4.
Insit
uqu
antif
icat
ion
of d
iffer
ent m
icro
bial
grou
psus
ing
CARD
-FIS
H.T
hesp
ecifi
c pr
obes
used
forC
ARD
-FIS
Har
e lis
ted
inM
ater
ials &
Met
hods
.n.
a., n
otan
alyze
d;*
pres
ent,
but n
otco
unta
ble
Bacte
ria(s
ingl
ece
lls)
Arch
aea(
singl
ece
lls)
Agg
rega
tes
Dep
th(c
m)
Tota
lsin
gle
cell
coun
ts(T
CC)
(109
cm-1
)Ba
cter
ia%
ofTC
CD
SS%
.TCC
Arc
haea
%TC
CA
NM
E-1
%TC
CA
NM
E-2
a%
TCC
AN
ME
-2c
%TC
CA
NM
E3
%TC
C
AN
ME
-2a-
aggr
egat
es(1
06cm
-3)
AN
ME
-2c-
aggr
egat
es(1
06cm
-3)
AN
ME
3-ag
greg
ates
(106
cm-3
)
Gul
lfaks
766
0-10
7.9
468
12<
0.1
22
05.
68.
4n.
a.10
-20
3.0
3712
10<
0.1
12
04.
84.
8n.
a.20
-30
0.85
397
n.a.
0.5
0<
10
00
n.a.
Gul
lfaks
771
0-10
6.7
5018
8<
0.1
<1
<1
06.
60.
4n.
a.10
-20
3.6
2629
8<
0.1
0.9
<0.
50
0.8
0.4
n.a.
20-3
01.
329
3116
<0.
10
00
0.6
0n.
a.
Tom
mel
iten
1274
-K1
0-3
469
2510
<1
<1
2<
0.5
1.0
00
Tom
mel
iten
1274
-K2
0-3
774
204
12
21
1.1
00
Tom
mel
iten
1274
-K3
0-3
671
2813
21
01
1.6
0*
3-6
480
287
n.a.
<0.
10
52.
70
*6-
103
9134
44
<0.
10
20.
90
*
75
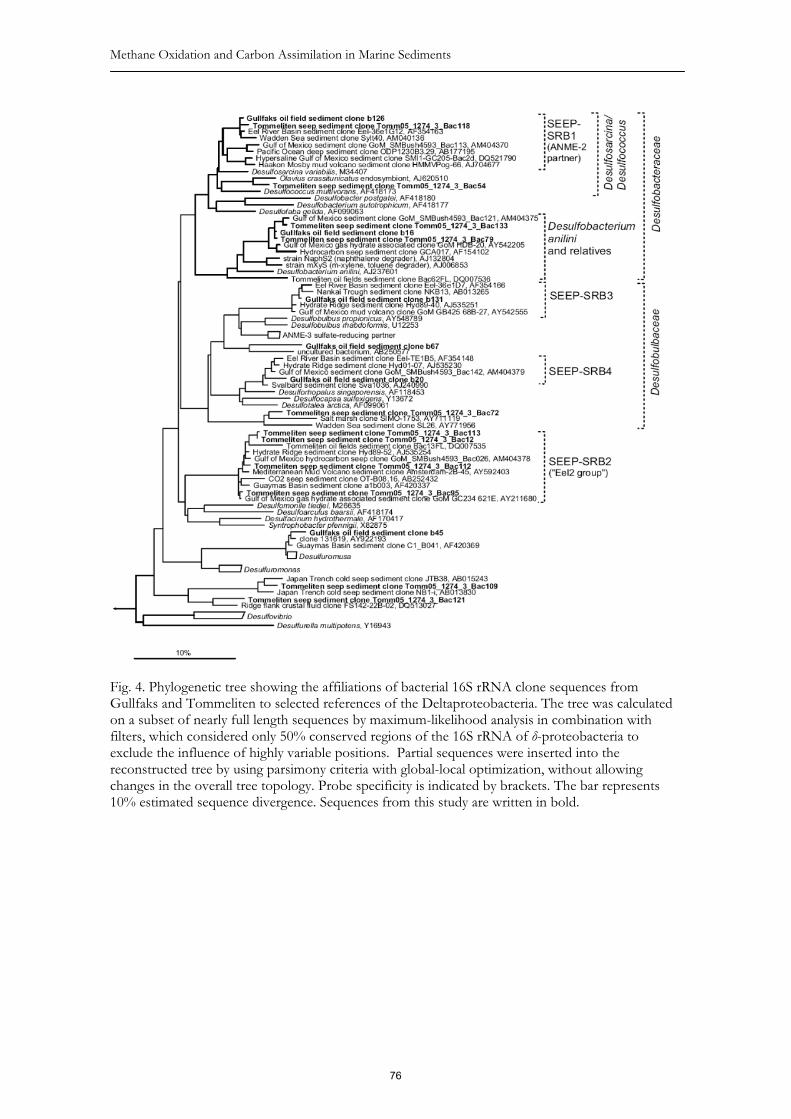
Methane Oxidation and Carbon Assimilation in Marine Sediments
Fig. 4. Phylogenetic tree showing the affiliations of bacterial 16S rRNA clone sequences from Gullfaks and Tommeliten to selected references of the Deltaproteobacteria. The tree was calculated on a subset of nearly full length sequences by maximum-likelihood analysis in combination with filters, which considered only 50% conserved regions of the 16S rRNA of -proteobacteria to exclude the influence of highly variable positions. Partial sequences were inserted into the reconstructed tree by using parsimony criteria with global-local optimization, without allowing changes in the overall tree topology. Probe specificity is indicated by brackets. The bar represents 10% estimated sequence divergence. Sequences from this study are written in bold.
76

Chapter II: Methane Seepage in the North Sea
Fig. 5. Phylogenetic tree showing the affiliations of archaeal 16S rRNA gene sequences retrieved from sediments underlying the microbial mats of Gullfaks and Tommeliten to selected references of the domain Archaea. Besides cultivated organisms, at least one representative per phylogenetic group of all previously published clone sequences from methane-rich sites is included as references. The tree was constructed by using maximum-likelihood analysis in combination with filters excluding highly variable positions. Partial sequences were inserted into the reconstructed tree by using parsimony criteria with global-local optimization, without allowing changes in the overall tree topology. Probe specificity is indicated by brackets. The bar represents 10% estimated sequence divergence. Sequences from this study are written in bold.
Five clones belonged to the phylum Crenarchaeota including three clones of the
Marine Benthic Group B which is regularly found at seeps (Knittel et al., 2005). The
biogeochemical function of members of both archaeal marine benthic groups has not been
identified yet. A study based on isotopic composition of lipid biomarkers suggests that
subsurface Crenarchaeota of the Marine Benthic Group B could be heterotrophic, although
they are commonly associated with methane sulfate transition zones (Biddle et al., 2006).
Total cell numbers in surface sediments at Gullfaks were quite high with 6.7×10⁹
and 7.9×10⁹ single cells ml-1 sediment in the uppermost 10 cm at station 771 and 766,
77

Methane Oxidation and Carbon Assimilation in Marine Sediments
respectively (Tab. 4). These cell numbers are higher than previously reported for non-seep
sandy sediments (Llobet-Brossa et al., 1998; Wieringa et al., 2000; Rusch et al., 2001, 2003)
and underline the stimulating effect of methane seepage on the microbial community
inhabiting sands. The only other published cell counts from methane percolated sands
showed numbers similar to those found at Gullfaks (Ishii et al., 2004). At a depth of
20-30 cm cell numbers decreased considerably to 0.85×10⁹ and 1.3×10⁹ cells ml-1, indicating
that the peak of microbial activity is in the upper 10 cm. The ratio of bacterial and archaeal
cells were quantified by CARD-FISH. Bacteria comprised 29-50% and Archaea 8-16% of the
DAPI stained cells. We found relatively high numbers of ANME 2a- and ANME 2c- cell
aggregates; however, they did not reach the size and abundance of deep sea sites such as
Hydrate Ridge (Nauhaus et al., 2002, 2007; Knittel et al., 2005). ANME-2a cells were
clustering in dense, typically spherical aggregates associated with sulfate reducing bacteria in
diameters of up to 10 μm (Fig. 6). ANME-2c cells were detected in less dense, small
aggregates. The highest counts of ANME aggregates (8.4×10⁶ ANME-2c aggregates at
station 766, 6.6×10⁶ ANME-2a-aggregates at 771) and ANME single cells (1.6×10⁸ cells
ml-1) were also found in the top 10 cm, matching the distribution of total cell numbers. The
abundance of methanotrophic microorganisms strongly decreased with depth, providing
evidence for a near surface peak of AOM activity. This may indicate that the highest
availability of both methane and sulfate as main energy source is generally found in the
surface sediment horizon. Interestingly, this horizon is likely to experience temporary
flushing with oxygenated bottom waters, as indicated by the observed ripple structures on
the seafloor, which are presumably caused by high bottom water currents. This should have
a negative effect on the anaerobic microbial communities. However, it is possible that the
high upward advection of gas may restrict the downward diffusion of oxygenated bottom
waters at the seep site.
78

Chapter II: Methane Seepage in the North Sea
The Gullfaks seep is the first site at which abundant single cells of ANME-2a and
ANME-2c were detected. Previously, only ANME-1 (Orphan et al., 2002; Niemann et al.,
2005) and ANME-3 (Lösekann et al., 2007) were found as single cells. Monospecific
ANME-2a or ANME-2c aggregates have been previously reported from Eckernförder Bay
(Treude et al, 2005) and Eel River Basin (Orphan et al., 2002). ANME-2 cells aggregates
without bacterial partner were also found to dominate specific regions of a microbial mat
from the Black Sea (Treude et al., 2007).
Tommeliten seeps
Seafloor observations. The Tommeliten seep site lies at 75 m water depth and is
part of the greater Ekofisk area of the Norwegian Block 1/9. In this area, the sedimentary
rocks host a now exploited hydrocarbon reservoir. This reservoir is pierced by a salt diapir
at about 1 km depth below the sea floor, and disturbances on seismic profiles indicate that
free gas migrates to the sea floor (Hovland and Judd, 1988; Hovland, 2002). Within an area
of 0.5 km2 at the Tommeliten site we observed several gas flares, which extended from the
seafloor to the sea surface (Fig. 2f). Many of these flares were concentrated in a small area of
about 0.06 km2, which we assume to be the centre of the subsurface gas escape pathway.
The distribution of the gas flares in 2005 (AL 267) was similar to the observations made in
2002 (HE180; Niemann et al., 2005). Previous expeditions to the Tommeliten seepage area
used remotely operated vehicles (ROVs) for bottom observations and sampling, and
documented streams of single methane bubbles of thermogenic origin (�13C -45.6‰), small
patches of microbial mats and methane derived authigenic carbonates outcropping at the sea
floor (Hovland and Sommerville, 1985; Hovland and Judd, 1988; Trasher et al., 1996;
Niemann et al., 2005).
79

Methane Oxidation and Carbon Assimilation in Marine Sediments
Fig. 6: Dual hybridizations with fluorescently labeled rRNA targeting oligonucleotide probes. a) Consortia of ANME 2a/DSS from Gullfaks (probes ANME2a-647 [red] and DSS658 [green]); b) Consortia of ANME2c/DSS from Tommeliten (probes ANME2c-622 [red] and DSS-658 [green]) .
Our observations by ROV in 2005 confirmed that most gas flares originated from
small holes (1-5 cm diameter) in the seafloor emitting single streams of bubbles. They were
associated with small patches of bacterial mats (30-50 cm in diameter, Fig. 3b). We sampled
three cores from such bacterial mats. The recovered sediments below the mats were highly
gassy and consisted of fine sands. In contrast, sediments a few meters away from the gas
flares consisted of consolidated, hardly permeable marls enclosing layers of unsorted silt and
sands above carbonate cements (Niemann et al., 2005). Accordingly, gas migration from the
subsurface to the seabed may be limited to sandy horizons between the impermeable clays,
and the gas bubbling may further erode the fine grain fraction. Upon recovery, the cores
from these sediments continued to release methane gas as verified by GC measurements.
This indicates a high in situ gas pressure in the seabed. At a water depth of 75 m the
equilibrium methane concentrations in the interstitial waters in the direct vicinity of the gas
ebullition sites could be around 12 mM.
80

Chapter II: Methane Seepage in the North Sea
Methane and sulfate turnover. The sample from a black patch from which gas
escape was observed was composed of silty sediments, and contained little TOC with 0.22
to 0.32% w/w. Due to the small amount of recovered sediment, we could not measure
AOM and SR rates. It can be assumed that the rates are locally very high due to the
saturation with gas and the flux of sulfate from overlying bottom water into the bubble sites.
However, for the subsurface sulfate methane transitions zones (SMTZ) associated with the
gas-migration pathways at Tommeliten, Niemann et al. (2005) showed low AOM and SR
rates of a few nmol cm-3 d-1, resulting in ca 50 g CH4 m-2 yr-1, or 0.3 t yr-1 for the whole seep
area of ca. 6500 m2. In comparison, the gas ebullition from the same site was estimated with
47 g CH4 m-2 yr-1 (Hovland et al., 1993) suggesting a 50% efficiency of the microbial filter
against methane. The higher methane consumption efficiency compared to Gullfaks could
be due to the impermeable nature of the Tommeliten sediments allowing only for few gas
leakage pathways.
Biomarker and carbon isotope composition. Similar to surface sediments at
Gullfaks, monounsaturated fatty acids were also the dominant biomarker fraction in the
surface sediments from the Tommeliten gas vents (Tab. 2). However, concentrations of
these and other bacteria lipids were lower in comparison to the mat-covered sands at
Gullfaks. The fatty acid distribution suggests the presence of sulfide oxidizing bacteria, but
the ratio of C16:1�7c to C18:1�7c to C16:0 (42: 32: 26) indicated a lower contribution to total
bacterial biomass than in the Gullfaks sands.
In comparison to the Gullfaks seeps, the sediments from the Tommeliten gas vents
contained similar amounts of archaeol but even more sn2-hydroxyarchaeol, indicating the
dominance of ANME-2 populations. Both archaeol and sn2-hydroxyarchaeol were less
depleted than at Gullfaks with �13C-values of -86‰ and -90‰. However, considering the
heavier isotope composition of the source methane at Tommeliten (�13C CH4 -46‰
81

Methane Oxidation and Carbon Assimilation in Marine Sediments
Hovland 2002), a stable carbon isotope fractionation of the lipid biomass relative to source
methane of more than 40‰ typical for AOM and comparable to that at Gullfaks was found.
The specific biomarkers for SRB associated with AOM such as C16:1�5c, i-C15:0, and
cy-C17:0 were similar in ratio but less abundant than at Gullfaks. The �13C-values of C16:1�5c
and cy-C17:0 were relatively depleted with -51‰ and -59‰, respectively, whereas ai-C15:0
showed a substantially less depleted �13C-value of -34‰. Interestingly, the surface seep
sediments at Tommeliten resembled the biomarker signatures in the authigenic carbonate
outcrops, but differed substantially from subsurface sediments (Niemann et al., 2005). In the
deep SMTZ Niemann et al. (2005) found a dominance of ANME-1 communities as
indicated by the dominance of archaeol over hydroxyarchaeol and a typical fatty acid pattern
typical for sulfate reducing partners of ANME-1 (Blumenberg et al. 2004; Niemann and
Elvert, in press; Niemann et al., 2005). These results correlated with 16S rRNA and FISH
analyses (Niemann et al., 2005). We conclude that ANME-1 could be better adapted to the
low energy conditions characteristic for deep sulfate methane transition zones, whereas
ANME-2 dominates the advection driven highly active surface zones as already observed in
some deep water seeps (Knittel et al., 2005).
Microbial diversity and community composition based on 16S rRNA gene analyses.
Similar to Gullfaks, the bacterial 16S rRNA gene sequence library (Tab. 3.) and the
selected sequences in the phylogenetic tree (Fig. 4) obtained from sediments of Tommeliten
showed a relatively high diversity of sulfate reducing bacteria including relatives of the
uncultured Seep-SRB1 (ANME-2 partners), Seep-SRB2 (Eel2), and of Desulfobacterium anilini.
Seep-SRB2 organisms have been retrieved from nearly all seep sediments (e.g. Knittel et al.,
2003; Lösekann et al., 2007; Mills et al., 2005; Orphan et al., 2001b). However, their function
remains unknown since no isolates are available. Desulfobacterium anilini relatives have been
shown to oxidize different aromatic hydrocarbons such as naphthalene or xylene and could
82

Chapter II: Methane Seepage in the North Sea
also have a function in hydrocarbon degradation at this site (for an overview see Widdel et
al., 2007). Also a high number of clones related to Desulfobulbus were found. In cold seep
sediments of the Haakon Mosby mud volcano (Barents Sea), the SRB community was
dominated by such relatives of Desulfobulbus, which formed aggregates with anaerobic
methanotrophs of the ANME-3 cluster (Niemann et al., 2006, Lösekann et al., 2007). Single
ANME-3 cells and a few aggregates occurred in the Tommeliten cold seep sediments, but
their abundance was too low to analyze the potential bacterial partners.
As predicted by the biomarker signatures, the archaeal gene sequence library of
Tommeliten contained mainly relatives of ANME-1 and ANME-2c (Fig. 5). These were
most closely related to sequences retrieved from gas hydrate bearing sediments such as the
Eel River Basin, Hydrate Ridge, and the Gulf of Mexico. ANME-2a sequences were not
represented in the clone library, although ANME-2a aggregates were detected by CARD-
FISH (see below).
Cell counts in the cores 1274 K1 to K3 ranged from 4.1 to 5.8×10⁹ cells ml-1 in the
top layer of sediment and hence were comparable to the cell numbers at Gullfaks. With
depth, cell numbers decreased to 3.0×10⁹ cell ml-1 (6-10cm). Quantification with CARD-
FISH indicated the presence of ANME-2a, ANME-2c and low numbers of ANME-3 single
cells and aggregates. Sulfate reducing bacteria were highly abundant comprising up to one
third of total single cells.
Hence, the microbial communities in gassy sediments below thiotrophic mats of
both seep sites in the North Sea were dominated by anaerobic methanotrophs of the
ANME-2 cluster, and their partner sulfate reducing bacteria. At Tommeliten, the AOM
community in the mat covered surface sediments resembled more that of the Gullfaks seep
and of the Tommeliten authigenic carbonates than that of the subsurface SMTZ community
(Niemann et al., 2005). The microbial communities also comprised sequences from other
microorganisms typically occurring in methane rich deep-water seep ecosystems such as the
83

Methane Oxidation and Carbon Assimilation in Marine Sediments
crenarchaeotal Marine Benthic Group B. Gene libraries and CARD-FISH counts indicated
also differences between Gullfaks and Tommeliten AOM communities – such as the
dominance of the ANME 2a cluster in Gullfaks cold seep sediments and the dominance of
ANME 2c at Tommeliten, which may be a result of the different geological and hydrological
features of both sites.
The North Sea seeps in comparison to deep water cold seeps
At the shallow water seeps of the Northern North Sea, methane emission from deep
reservoirs has been observed for more than 20 years. The habitats investigated here are
characterized by locally high advection of gaseous methane and ebullition of gas bubbles to
the hydrosphere. Both Tommeliten and Gullfaks likely contribute to methane emission to
the atmosphere as indicated by gas flares reaching to the upper mixed water layers. It would
be an important future task to attempt quantification of gas emission to the atmosphere by
monitoring flares and methane concentrations in the flares and the overlying surface waters.
In the interstitial porewaters of the Tommeliten and Gullfaks seeps, dissolved
methane can reach concentrations of 12 mM and 25 mM, respectively. The highly
permeable sands at Gullfaks allow the migration of gas bubbles through the sediment,
leading to a relatively large seep area populated by methanotrophs and thiotrophs. The high
upward advection of gas may restrict the downward diffusion of oxygenated bottom waters
below a few cm, protecting the anaerobic methanotrophic communities, which showed very
high activities in the top 10 cm. In contrast, the compact silty sands of Tommeliten allow
gas migration only through small cracks in the seafloor sediments, restricting the distribution
of methanotrophs and thiotrophs to small patches around the gas vents. Phylogenetic
analysis of Deltaproteobacteria and Euryarchaeota at Gullfaks and Tommeliten indicate a high
similarity of these to sequences from deep water seep sites, such as Hydrate Ridge (Boetius
84

Chapter II: Methane Seepage in the North Sea
et al., 2000; Knittel et al., 2003; Knittel et al., 2005), Eel River Basin (Orphan et al., 2001b)
or Guyamas Basin (Teske et al., 2002).
The concentrations of most of the AOM specific biomarker were about one order
of magnitude lower at the investigated sites compared to deep water seep ecosystems such
as Hydrate Ridge (Elvert et al., 2003) and Haakon Mosby Mud Volcano (Niemann et al.,
2006). This finding was reflected in the low number of ANME aggregates of around 106 cm-
3. In deep water cold seeps such as Hydrate Ridge, Haakon Mosby and Eel River Basin,
ANME aggregate numbers reach 108, comprising a large fraction of the total microbial
biomass (>90%) (Knittel et al., 2005). A reason for this difference in ANME biomass could
be the higher availability of dissolved methane in deep water seeps due to the increased
solubility of methane at high hydrostatic pressures. Previous experiments indicate that AOM
rates and the energy yield available for growth are higher at elevated methane concentrations
(Nauhaus et al., 2002; 2007), which may support higher biomasses of AOM consortia. A
second explanation for lower aggregate sizes in the North Sea may be the high bottom water
currents causing relocation of particles, as well as sporadic oxygen influx into the sandy
sediments. The only shallow water seeps known with higher biomass of ANME are the
conspicuous methanotrophic microbial reefs of the Black Sea (Blumenberg et al., 2004;
Treude et al., 2005). These lie in permanently anoxic waters and are hence protected from
grazing.
4. Conclusions
Several gas seepages were mapped during the METROL cruises with R/V Heincke
and Alkor. From these, we chose the two most active and accessible seepage areas,
Tommeliten and Gullfaks, for detailed surveys using geochemical and molecular tools. At
Gullfaks a seepage area of about 0.1 km2 was characterized by a high density of gas vents
and extensive coverage by thiotrophic bacterial mats. At Tommeliten gas vents were less
85

Methane Oxidation and Carbon Assimilation in Marine Sediments
dense and the bacterial mat covered areas were limited to small patches around small holes
in the seafloor emitting gas. The different permeability of the seabed at both seep sites could
explain the observed differences in the efficiency of the microbial filter against methane.
From both sites considerable amounts of methane are emitted, some of which may reach
the atmosphere as indicated by large gas flares reaching the upper mixed water layers.
Specific biomarker and carbon isotope compositions, as well as 16S rDNA gene sequences
and fluorescence in situ hybridization of specific microbial groups indicated that the
bacterial mat covered sediments were populated by active communities of ANME-2 and
their sulfate reducing partner bacteria. Archaeal biomarkers were about 40 to 50‰ depleted
in 13C relative to the carbon source methane. Specific fatty acids of sulfate reducers involved
in AOM were also considerably depleted in 13C indicating that they partially assimilate
methane derived carbon. The 16S rRNA based gene libraries of both sites mostly included
sequences from known groups of deep water cold seep microorganisms, indicating that
water depth or other oceanographic conditions may not be limiting the dispersal of these
groups. In contrast, distinct differences were found between the microbial community in the
mat covered surface sediments (dominated by ANME-2) to those of the subsurface sulfate
methane transition zone at Tommeliten (dominated by ANME-1), suggesting that different
energy availabilities may select for different methanotrophic communities.
Acknowledgements
This study was conducted as part of the METROL project (http://www.metrol.org)
of the 5th framework program of the European Commission (EVK-3-CT-2002-00080). We
thank captain, crew and shipboard scientists of R/V Heincke cruise HE-169 HE-180 and
HE-208 and R/V Alkor cruise AL-267 for their excellent support of work at sea. We thank
Gert Wendt, Jens Wunderlich (INNOMAR), Julian Gutt, Ingrid Vöge (AWI), Frank
86

Chapter II: Methane Seepage in the North Sea
Wenzhöfer, Marc Viehweger, Viola Beier, Tomas Wilkop, Imke Busse (MPI), Nico Nowald
(MARUM) as well as Regina Usbeck, Werner Dimmler, Steffen Gauger (FIELAX) for
technical support and laboratory work, and Alan Judd for important information on seep
structures of the North Sea.
References
Amann, R.I., Krumholz, L. and Stahl, D.A.: Fluorescent-oligonucleotide probing of whole cells for determinative, phylogenetic, and environmental studies in microbiology. J. Bacteriol., 172(2), 762-770, 1990.
Biddle, J.F., Lipp, J.S., Lever, M.A., Lloyd, K.G., Sørensen, K.B., Anderson, R., Fredricks, H.F., Elvert, M., Kelly, T.J., Schrag, D.P., Sogin, M.L., Brenchley, J.E., Teske, A., House, C.H., and Hinrichs, K.U.: Heterotrophic archaea dominate sedimentary subsurface ecosystems off Peru. Proc. Natl. Acad. Sci., 103(10), 3846-3851, 2006.
Blumenberg, M., Seifert, R., Reitner, J., Pape, T. and Michaelis, W.: Membrane lipid patterns typify distinct anaerobic methanotrophic consortia. Proc. Natl. Acad. Sci., 101(30), 11111-11116, 2004.
Boetius, A. Ravenschlag, K., Schubert, C.J., Rickert, D. Widdel, F., Gieseke, A., Amann, R., Jørgensen, B.B., Witte, U. and Pfannkuche, O.: A marine microbial consortium apparently mediating anaerobic oxidation of methane. Nature, 407, 623-626, 2000.
Daims, H., Bruhl, A., Amann, R., Schleifer, K.H. and Wagner, M.: The domain-specific probe EUB338 is insufficient for the detection of all bacteria: Development and evaluation of a more comprehensive probe set. Syst. Appl. Microbiol., 22(3), 434-444, 1999.
Dando, P.R., Bussmann, I., Niven, S.J., O’Hara, S.C.M, Schmaljohann, R. and Taylor, L.J.: A methane seep area in the Skagerrak, the habitat of the pogonophore Siboglinum poseidoni and the bivalve mollusc Thyasira sarsi. Mar. Ecol. Prog. Ser., 107. 157–167, 1994.
Eisma, D. and Kalf, J.: Dispersal, concentration and deposition of suspended matter in the North Sea. J. Geol. Soc. London, 144(1), 161-178, 1987.
Elvert, M., Boetius, A., Knittel, K. and Jørgensen, B.B.: Characterization of specific membrane fatty acids as chemotaxonomic markers for sulfate-reducing bacteria involved in anaerobic oxidation of methane. Geomicrobiol. J., 20(4), 403-419, 2003.
Elvert, M., Hopmans, E. C., Treude, T., Boetius, A. and Suess, E.: Spatial variations of methanotrophic consortia at cold methane seeps: implications from a high-resolution molecular and isotopic approach. Geobiology, 3(3), 195-209, 2005.
Fang, J., Shizuka, A., Kato, C. and Schouten, S.: Microbial diversity of cold-seep sediments in Sagami Bay, Japan, as determined by 16S rRNA gene and lipid analyses. FEMS Microbiol. Ecol., 57(3), 429–441, 2005.
Hinrichs, K.-U., Hayes, J.M., Silva, S.P., Brewer, P.G. and DeLong, E.F.: Methane-consuming archaebacteria in marine sediments. Nature, 398, 802-805, 1999.
87

Methane Oxidation and Carbon Assimilation in Marine Sediments
Hinrichs, K.-U. and Boetius, A.: The anaerobic oxidation of methane: New insights in microbial ecology and biogeochemistry. In: Wefer, G., Billett, D. and Hebbeln, D. (eds.), Ocean Margin Systems. Springer-Verlag, Berlin Heidelberg, pp. 457-477, 2002.
Hovland, M.: On the self-sealing nature of marine seeps. Cont. Shelf. Res., 22(16), 2387-2394, 2002.
Hovland, M.: Discovery of prolific natural methane seeps at Gullfaks, northern North Sea. Geo-Mar. Lett., 27(2), 197-201, 2007.
Hovland, M., Gardner, J.V. and Judd, A.G.: The significance of pockmarks to understanding fluid flow processes and geohazards. Geofluids, 2(2), 127-136, 2002.
Hovland, M. and Judd, A.G.: Seabed pockmarks and seepages. Graham and Trotham, London, 293 pp., 1988.
Hovland, M., Judd, A.G., Burke Jr., R.A.,. The global flux of methane from shallow submarine sediments. Chemosphere, 26(1-4), 559-578, 1993.
Hovland, M. and Risk, M.: Do Norwegian deep-water coral reefs rely on seeping fluids? Mar. Geol., 198(1-2), 83-96, 2003.
Hovland, M. and Sommerville, J.H.: Characteristics of two natural gas seepages in the North Sea. Mar. Petrol. Geol., (2): 319-326, 1985.
Inagaki, F., Kuypers, M. M. M., Tsunogai, U., Ishibashi, J., Nakamura, K. Treude, T., Ohkubo, S., Nakaseama, M., Gena, K., Chiba, H., Hirayama, H., Nunoura, T., Takai, K., Jørgensen, B. B., Horikoshi, K. and Boetius, A.: Microbial community in a sediment-hosted CO2 lake of the southern Okinawa Trough hydrothermal system. Proc. Natl. Acad. Sci., 103(38), 14164-14169, 2006.
Ishii, K., Mussmann, M., MacGregor, B.J. and Amann, R.: An improved fluorescence in situ hybridization protocol for the identification of bacteria and archaea in marine sediments. FEMS Microbiol. Ecol., 50(3), 203-212, 2004
Jørgensen, B.B. and Fenchel, T.: The sulfur cycle of a marine sediment model system. Mar. Biol., 24(3), 189-201., 1974.
Joye, S.B., Boetius, A., Orcutt, B.N., Montoya, J.P., Schulz, H.N., Erickson, M.J., Lugo S.: The anaerobic oxidation of methane and sulfate reduction in sediments from Gulf of Mexico cold seeps. Chem. Geol., 205, 219-238, 2004.
Judd, A.G.: A global importance and context of methane escape from the seabed. Geo-Mar. Lett., 23, 147-154, 2003.
Judd, A. and Hovland, M.: Seabed Fluid Flow: The impact on geology, biology and the marine environment. Cambridge University Press, 492 pp., 2007.
Kallmeyer, J., Ferdelman, T.G., Weber, A., Fossing, H. and Jørgensen, B.B.: A cold chromium distillation procedure for radiolabeled sulfide applied to sulfate reduction measurements. Limnol. Oceanogr. Meth., 2, 171-180, 2004.
Kane, M.D., Poulsen, L.K. and Stahl, D.A.: Monitoring the enrichment and isolation of sulfate-reducing bacteria by using oligonucleotide hybridization probes designed from environmentally derived 16S rRNA sequences. Appl. Environ. Microb., 59, 682-686, 1993.
Knittel, K., Boetius, A., Lemke, A., Eilers, H., Lochte, K., Pfannkuche, O., Linke, P. and Amann, R.: Activity, distribution, and diversity of sulfate reducers and other bacteria
88

Chapter II: Methane Seepage in the North Sea
in sediments above gas hydrate (Cascadia margin, Oregon). Geomicrobiol. J., 20(4), 269-294, 2003.
Knittel, K., Lösekann, T., Boetius, A., Kort, R. and Amann, R.: Diversity and distribution of methanotrophic archaea at cold seeps. Appl. Environ. Microb., 71(1), 467-479, 2005.
Lane, D.J. Pace, B., Olsen, G. J., Stahl, D. A., Sogin, M. L. and Pace, N. R.: Rapid Determination of 16S ribosomal RNA sequences for phylogenetic analyses. Proc. Natl. Acad. Sci., 82(20), 6955-6959, 1985.
Levin, L.A.: Ecology of cold seep sediments: Interactions of fauna with flow, chemistry and microbes. In: R.N. Gibson, R.J.A. Atkinson and J.D.M. Gordon (eds.), Oceanography and Marine Biology: An Annual Review. Taylor & Francis. 1-46, 2005.
Llobet-Brossa, E., Rossello-Mora, R. and Amann, R.: Microbial community composition of Wadden Sea sediments as revealed by fluorescence in situ hybridization. Appl. Environ. Microb., 64(7) 2691-2696, 1998.
Lösekann, T., Knittel, K., Nadalig, T., Fuchs, B. Niemann, H., Boetius, A. and Amann, R.: Diversity and abundance of aerobic and anaerobic methane oxidizers at the Haakon Mosby Mud Volcano, Barents Sea. Appl. Environ. Microb., 73(10), 3348-3362, 2007.
Ludwig, W. Strunk, O., Westram, R., Richter, L., Meier, H., Yadhukumar, Buchner, A., Lai, T., Steppi, S., Jobb, G., Forster, W., Brettske, I., Gerber, S., Ginhart, A. W., Gross, O., Grumann, S., Hermann, S., Jost, R., Konig, A., Liss, T., Lussmann, R., May, M., Nonhoff, B., Reichel, B., Strehlow, R., Stamatakis, A., Stuckmann, N., Vilbig, A., Lenke, M., Ludwig, T., Bode, A., Schleifer, K.-H.: ARB: A software environment for sequence data. Nucl. Acids Res., 32(4), 1363-1371, 2004.
Luff, R. and Wallmann, K.: Fluid flow, methane fluxes, carbonate precipitation and biogeochemical turnover in gas hydrate-bearing sediments at Hydrate Ridge, Cascadia Margin: Numerical modeling and mass balances. Geochim. Cosmochim. Ac., 67(18), 3403-3421, 2003.
Manz, W., Eisenbrecher, M., Neu, T.R. and Szewzyk, U.: Abundance and spatial organization of gram-negative sulfate-reducing bacteria in activated sludge investigated by in situ probing with specific 16S rRNA targeted oligonucleotides. FEMS Microbiol. Ecol., 25, 43-61, 1998.
Massana, R., Murray, A., Preston, C. and DeLong, E.: Vertical distribution and phylogenetic characterization of marine planktonic Archaea in the Santa Barbara Channel. Appl. Environ. Microb., 63(1), 50-56, 1997.
Meyer-Reil, L.-A.: Benthic response to sedimentation events during autumn to spring at a shallow water station in the Western Kiel Bight. Mar. Biol., 77(3), 247-256, 1983.
Mills, H.J., Hodges, C., Wilson, K., MacDonald, I.R. and Sobecky, P.A.: Microbial diversity in sediments associated with surface-breaching gas hydrate mounds in the Gulf of Mexico. FEMS Microbiol. Ecol., 46(1), 39-52, 2003.
Mills, H.J., Martinez, R.J., Story, S. and Sobecky, P.A.: Characterization of microbial community structure in Gulf of Mexico gas hydrates: Comparative analysis of DNA- and RNA-derived clone libraries. Appl. Environ. Microb., 71(6): 3235-3247, 2005.
Moss, C.W. and Lambert-Fair, M.A.: Location of double bonds in monounsaturated fatty acids of Campylobacter cryaerophila with dimethyl disulfide derivatives and
89

Methane Oxidation and Carbon Assimilation in Marine Sediments
combined gas chromatography-mass spectrometry. J. Clin. Microbiol., 27(7), 1467-1470, 1989.
Muyzer, G., Teske, A., Wirsen, C.O. and Jannasch, H.W.: Phylogenetic relationships of Thiomicrospira species and their identification in deep-sea hydrothermal vent samples by denaturing gradient gel electrophoresis of 16S rDNA fragments. Arch. Microbiol., 164(3), 165-172, 1995.
Nauhaus, K., Boetius, A., Krüger, M. and Widdel, F.: In vitro demonstration of anaerobic oxidation of methane coupled to sulphate reduction in sediments from a marine gas hydrate area. Environ. Microbiol., 4(5), 296-305, 2002.
Nauhaus, K., Albrecht, M., Elvert, M., Boetius, A. and Widdel, F.: In vitro cell growth of marine archaeal-bacterial consortia during anaerobic oxidation of methane with sulfate. Environ. Microbiol., 9(1), 187-196, 2007.
Nelson, D.C. and Jannasch, H.W.: Chemoautotrophic growth of a marine Beggiatoa in sulfide-gradient cultures. Arch. Microbiol., 136(4), 262-269, 1983.
Nelson, D.C., Jørgensen, B.B. and Revsbech, N.P.:. Growth pattern and yield of a chemoautotrophic Beggiatoa sp. in oxygen-sulfide microgradients. Appl. Environ. Microb., 52(2): 225-233, 1986.
Nelson, D.C., Wirsen, C.O. and Jannasch, H.W.: Characterization of large, autotrophic Beggiatoa spp. abundant at hydrothermal vents of the Guaymas Basin. Appl. Environ. Microb., 55(11): 2909-2917, 1989.
Niemann, H. and Elvert, M., Diagnostic lipid biomarker and stable carbon isotope signatures of microbial communities mediating the anaerobic oxidation of methane with sulphate. Chem. Geol., in press: doi: 10.1016/j.orggeochem.2007.11.006.
Niemann, H., Elvert, M., Hovland, M., Orcutt, B., Judd, A., Suck, I., Gutt, J., Joye, S., Damm, E., K. Finster, K. and Boetius, A.: Methane emission and consumption at a North Sea gas seep (Tommeliten area). Biogeosciences, 2(4): 335-351, 2005.
Niemann, H., Lösekann, T., de Beer, D., Elvert, M., Nadalig, T., Knittel, K., Amann, R., Sauter, E. J., Schlüter, M., Klages, M., Foucher, J. P. and Boetius, A.: Novel microbial communities of the Haakon Mosby mud volcano and their role as a methane sink. Nature, 443(7113): 854-858, 2006.
Omoregie, E., Niemann, H., Masterlerz, V. de Lange, G., Stadnitskaia, A., Foucher, J.P. and Boetius: A. Anaerobic oxidation of methane and sulfate reduction at cold seeps in the Eastern Mediterranean sea Mar. Geol., in review.
Orphan, V.J., Hinrichs, K.-U., Ussler, W., Paull, C. K., Taylor, L. T., Sylva, S. P., Hayes, J. M. and Delong, E. F.: Comparative analysis of methane-oxidizing archaea and sulfate-reducing bacteria in anoxic marine sediments. Appl. Environ. Microb., 67(4): 1922-1934, 2001a.
Orphan, V.J., House, C.H., Hinrichs, K.-U., McKeegan, K.D. and DeLong, E.F.: Methane-consuming archaea revealed by directly coupled isotopic and phylogenetic analysis. Science, 293(5529): 484-487, 2001b.
Orphan, V.J., House, C.H., Hinrichs, K.-U., McKeegan, K.D. and DeLong, E.F.: Multiple archaeal groups mediate methane oxidation in anoxic cold seep sediments. Proc. Natl. Acad. Sci., 99(11): 7663-7668. 2002.
90

Chapter II: Methane Seepage in the North Sea
Pernthaler, A., Pernthaler, J. and Amann, R.: Fluorescence in situ hybridization and catalyzed reporter deposition for the identification of marine bacteria. Appl Environ. Microb., 68(6): 3094-3101, 2002.
Ravenschlag, K., Sahm, K., Pernthaler, J. and Amann, R.: High bacterial diversity in permanently cold marine sediments. Appl. Environ. Microb., 65(9): 3982-3989, 1999.
Reeburgh, W.: Oceanic methane biogeochemistry. Chem. Rev., 107(2): 486-513, 2007.
Rehder, G., Keir, R.S., Suess, E. and Pohlmann, T.: The multiple sources and patterns of methane in North Sea waters. Aquat. Geochem., 4(3): 403-427, 1998.
Rise, L., Saettem, J., Fanavoll, S., Thorsnes, T., Ottesen, D. and Boe, R.: Sea-bed pockmarks related to fluid migration from Mesozoic bedrock strata in the Skagerrak offshore Norway. Mar. Petrol. Geol., 16(7): 619-631, 1999.
Ritger, S., Carson, B. and Suess, E.: Methane-derived authigenic carbonates formed by subduction-induced pore-water expulsion along the Oregon/ Washington margin. Geol. Soc. Am. Bull., 98(2): 147-156, 1987.
Rohmer, M., Bouvier-Nave, P. and Ourisson, G.: Distribution of hopanoid triterpenes in prokaryotes. Microbiology, 30(55): 1137-1150, 1984.
Rusch, A., Forster, S. and Huettel, M.: Bacteria, diatoms and detritus in an intertidal sandflat subject to advective transport across the water-sediment interface. Biogeochemistry, 55(1): 1-27, 2001.
Rusch, A., Huettel, M., Reimers, C.E., Taghon, G.L. and Fuller, C.M.: Activity and distribution of bacterial populations in Middle Atlantic Bight shelf sands. FEMS Microbiol. Ecol., 44(1): 89-100, 2003.
Stahl, D.A. and Amann, R.: Development and application of nucleic acid probes. In: E. Stackebrandt and M. Goodfellow (eds.), Nucleic Acid Techniques in Bacterial Systematics. John Wiley&Sons Ltd., Chichester, UK, 205-248, 1991.
Teske, A., Hinrichs, K. U., Edgcomb, V., de Vera Gomez, A., Kysela, D., Sylva, S. P., Sogin, M. L. and Jannasch, H. W. Microbial diversity of hydrothermal sediments in the Guaymas Basin: Evidence for anaerobic methanotrophic communities. Appl. Environ. Microb., 68(4): 1994-2007, 2002.
Trasher, J., Fleet, A.J., Hay, S.J., Hovland, M. and Düpenbecker, S.: Understanding geology as the key to using seepage in exploration: spectrum of seepage styles. In: D. Schumacher and M.A. Abrams (eds.), Hydrocarbon migration and its near-surface expression. AAPG Memoir, 223-241, 1996.
Treude, T., Boetius, A., Knittel, K., Nauhaus, K., Elvert, M., Krüger, M., Lösekann, T., Wallmann, K., Jørgensen, B. B., Widdel, F. and Amman, R.: Anaerobic oxidation of methane at Hydrate Ridge (OR). Geochim. Cosmochim. Ac., 67(18): 491-491, 2003.
Treude, T., Knittel, K., Blumenberg, M., Seifert, R. and Boetius, A.: Subsurface microbial methanotrophic mats in the Black Sea. Appl. Environ. Microb., 71(10): 6375-6378, 2005.
Treude, T., Krüger, M., Boetius, A. and Jørgensen, B. B.: Environmental control on anaerobic oxidation of methane in the gassy sediments of Eckernfoerde Bay (German Baltic). Limnol. Oceanogr. 50(6): 1771-1786, 2005.
91

Methane Oxidation and Carbon Assimilation in Marine Sediments
Valentine, D.L. and Reeburgh, W.S.: New perspectives on anaerobic methane oxidation. Environ. Microbiol., 2(5): 477-487, 2000.
Widdel, F. and Bak, F.: Gram-negative mesophilic sulfate-reducing bacteria. In: T.H. Balows A, Dworkin M, Harder W, Schleifer KH (ed.), The prokaryotes. Springer, Berlin Heidelberg New York, 3352-3378, 1992.
Widdel, F., Musat, F., Knittel, K. and Galushko, A.: Anaerobic degradation of hydrocarbons with sulphate as electron acceptor. In: L.L. Barton and W.A. Hamilton (eds), Sulphate-reducing bacteria: environmental and engineered systems. Cambridge University Press, Cambridge, United Kingdom. 265-304, 2007.
Wieringa, E.B.A., Overmann, J. and Cypionka, H.: Detection of abundant sulphate-reducing bacteria in marine oxic sediment layers by a combined cultivation and molecular approach. Environ. Microbiol., 2(4): 417-427, 2000.
Zhang, C.L. Huang, Z., Cantu, J., Pancost, R. D., Brigmon, R. L., Lyons, T. W. and Sassen, R.: Lipid biomarkers and carbon isotope signatures of a microbial (Beggiatoa) mat associated with gas hydrates in the Gulf of Mexico. Appl. Environ. Microb., 71(4): 2106-2112, 2005.
92

Chapter III: Responses of AOM to Variations in Methane and Sulfate
Chapter III
Short-Term Responses of Anaerobic Methane-Oxidizing
Microbial Communities from Submarine Cold Seeps to
Variations in Methane and Sulfate
Gunter Wegener1,*, Timothy G. Ferdelman and Antje Boetius1,2,3
1 Max Planck Institute for Marine Microbiology, Bremen, Germany 2 Alfred Wegener Institute for Polar and Marine Research, Bremerhaven, Germany
3 Jacobs University Bremen, Bremen, Germany
*Corresponding author: Gunter Wegener, Max Planck Institute for Marine Microbiology,
In preparation for submission to Biogeosciences Journal
93

Methane Oxidation and Carbon Assimilation in Marine Sediments
Abstract: A major role in global methane fluxes has been attributed to the process
of anaerobic oxidation of methane, which is performed by consortia of
methanotrophic archaea and sulfate reducing bacteria. An important question
remains how these very slow growing microorganisms with generation times of 3-7
months respond to natural variations in methane fluxes at cold seeps. Here, we used
an experimental flow-through column system filled with cold seep sediments
naturally enriched in methanotrophic communities, to test their response to short-
term variations in methane and sulfate fluxes. At stable methane and sulfate
concentrations of ~2 mM and 28 mM, respectively, we measured constant rates of
anaerobic oxidation of methane (AOM) and sulfide production (SR) during up to
160 days of incubation. When percolated with methane free media, the anaerobic
methanotrophs ceased to oxidize methane and to produce sulfide. After a starvation
phase of 40 days, the addition of methane restored former AOM and SR rates
immediately. At methane concentrations between 0-2.3 mM we measured a linear
correlation between methane availability, AOM and SR. At constant fluid flow
rates of 30 m yr-1, ca. 50% of the methane was consumed by the ANME population.
In contrast, reducing the sulfate concentration from 28 to 1 mM, only a 35%
decrease in AOM and SR was observed. The marine anaerobic methanotrophs
(ANME) appear to be capable to consume substantial amounts of methane rising
from the subsurface seabed to the hydrosphere over a wide range of fluxes of
methane and sulfate.
1. Introduction
Between 5 to 10% of the organic matter deposited on the seafloor is converted to
methane by a sequence of microbial processes in which methane production is the terminal
94

Chapter III: Responses of AOM to Variations in Methane and Sulfate
degradation step (Canfield, 1993, Canfield et al., 2005). The dissolved concentrations of
methane in the ocean range from a few nM in seawater to about hundred mM in hydrate-
bearing subsurface sediments (Reeburgh, 2007). With about 4×10¹⁵ m3 methane, submarine
gas hydrates bind more methane than all other reservoirs on earth (Milkov, 2004). However
methane emission is rather low, contributing an estimated 3-5% of the atmospheric methane
budget. This is due to the consumption of methane by anaerobic and aerobic
microorganisms in the seabed which represent an effective filter against this potential
greenhouse gas (Reeburgh, 1996; 2007).
The principles and regulation of aerobic methane consumption are well understood
(reviews: Hanson and Hanson, 1996; Trotsenko and Khmelenina, 2005). Due to the limited
penetration of oxygen into the seabed, AOM is considered the globally more relevant sink
for methane in the ocean (Hinrichs and Boetius, 2002; and literature therein). The net
reaction for AOM with sulfate is:
OHHSHCOSOCH 23244 ��� ��� (R 1)
This process is performed by consortia of methanotrophic archaea and sulfate reducing
bacteria (Boetius et al., 2000; Orphan et al., 2001). Unfortunately, the detailed reaction
pathways have not been fully understood.
Sedimentary methane oxidation rates range from a few pmol cm-3 day-1 in diffusion
driven deep sulfate methane transition zones (e.g., Blake Ridge; Wellsbury et al., 2000) up to
3 μmol cm-3 day-1 at cold seeps of Hydrate Ridge (Treude et al., 2003), and up to
10 μmol cm-3- day-1 in the methanotrophic microbial mats of the Black Sea (Treude et al.,
2007). In vitro incubation studies with enriched ANME communities showed that AOM
rates predominantly depend on methane concentrations, and suggested extraordinary high
apparent methane half-saturation constants (kM-values) in the range of several mM
(Nauhaus et al., 2002; 2005; 2007).
95

Methane Oxidation and Carbon Assimilation in Marine Sediments
First budgets for total methane fluxes, including microbial oxidation, at cold seep
systems were calculated for Hydrate Ridge (Cascadia margin; Boetius and Suess 2004) and
the Haakon Mosby Mud Volcano (Barents Sea; Niemann et al., 2006). At fluid flow rates of
10-250 cm yr-1, microbial methane oxidation removed about 50% of total methane flux in
the sulfate penetrated surface sediments. In the transition from high to low fluid flow rates,
the efficiency of the microbial filter increased at both sites, until no methane emission from
the seabed was measured and all methane was consumed within the seabed (e.g. Acharax
fields at Hydrate Ridge, Pogonophora fields, HMMV). Less is known about the control of
AOM by sulfate fluxes. The apparent kinetics of AOM with regard to concentrations of
methane and sulfate in the natural range are not yet known, but field data indicate that
AOM decreases at sulfate concentrations < 1mM. The most significant problem in
constraining budgets of methane emission at cold seeps is the lack of quantitative in situ
methods to measure gaseous and dissolved methane emission to the hydrosphere, as well as
subsurface transport processes of methane and sulfate. In addition, cold seeps show an
extreme spatial and temporal variation in gas ebullition and fluid flow (Tryon et al., 2002;
Sauter et al., 2006). It is not known how the slow growing methanotrophs respond to
variations in methane and sulfate supply.
Here we used continuous flow-through incubation of sediments from different cold
seep ecosystems to test the response of ANME communities to short-term (2-40 days)
variations in methane and sulfate fluxes. Flow-through reactors have been used previously
for the study of growth patterns of ANME communities (Girguis et al., 2003; 2005). Our
main questions were 1) how does the availability of methane and sulfate influence AOM, 2)
what is the efficiency of the ANME communities in consuming methane at high fluid flow
rates, 3) does the community retain its activity after starvation periods.
96

Chapter III: Responses of AOM to Variations in Methane and Sulfate
2. Material and Methods:
Sediments from the Gullfaks (Heincke seep area, Hovland, 2007) in the northern
North Sea (61°10.44’ N, 2°14.65’ E, 150 m water depth) were sampled on Heincke cruise
208 in May 2004 using TV-guided multicorer. The sandy sediments were widely covered
with mats of sulfide oxidizing bacteria which indicate the area of strong methane based
sulfate reduction below the mats. The recovered sediments were highly permeable, and
consisted of medium to coarse grained sands. For the incubations we sampled the blackish
sediment horizon between 2 and 15 cm, omitting the oxic top layer. Methane consumption
rates, measured in in vitro incubations (using 14C-labeled methane according to Krüger et al.,
2005), were on average 0.15 μmol g-1 day-1. Molecular analyses showed that the
methanotrophic community was dominated by consortia of ANME-2a and -2c and their
sulfate reducing partner bacteria of the Desulfosarciana/ Desulfococcus cluster (Wegener et al.,
2008).
Hydrate Ridge sediment (44°34.20’ N, 125°08.77’ E; 776 m water depth) was
retrieved on Sonne cruise SO165-2 in 2002 via push core sampling. The seafloor was
covered with Beggiatoa indicating a high flux of sulfide from AOM (Treude et al., 2003).
Black Sea sediment was obtained from the Dniepr basin (44°46.41’ N, 31°58.20’ E,
326 m water depth) on R/V Poseidon cruise 317/3 in 2004 by pushcoring with the
submersible JAGO. Samples were taken from the direct vicinity of a methane seep;
degassing of methane during recovery and authigenic carbonate precipitates indicated a high
AOM activity in the recovered sediments (Treude et al., 2005).
After recovery, all sediments were immediately transferred to gas tight Duran bottles
and supplied with sulfate reducer medium (Widdel and Bak, 1992) as well as a methane
headspace. Seawater medium was repeatedly replaced with new medium when sulfide
97

Methane Oxidation and Carbon Assimilation in Marine Sediments
concentrations exceeded 20 mM. All further handling of sediment was performed in an
anaerobic glove box.
The flow-through setup. Sediments were filled into glass columns onto glass frits.
(Ochs Glasgerätebau, Bovenden, Germany) (Fig.1). In the first setup columns with a
diameter of 40 mm were filled with sediments from Gullfaks to a height of 120 mm (total
volume 151 ml, ca. 250 gram dry weight (gdw)). In the second setup, columns with a
diameter of 40 mm were filled with different sediments to a height of 50 mm (total volume
63 ml), including inoculates from Gullfaks (sandy sediments, 95 gdw), Black Sea and
Hydrate Ridge (clay sediments, 25 gdw). All concentrations and rates were normalized to dry
weight of sediment.
Fig. 1. Flow-through system with the sediment column (A), medium reservoir (B) and the peristaltic pump (C). System pressure is stabilized via a second medium reservoir (D) which is pressurized by nitrogen (F). Sampling was done in inflow (F) and outflow (G).
98
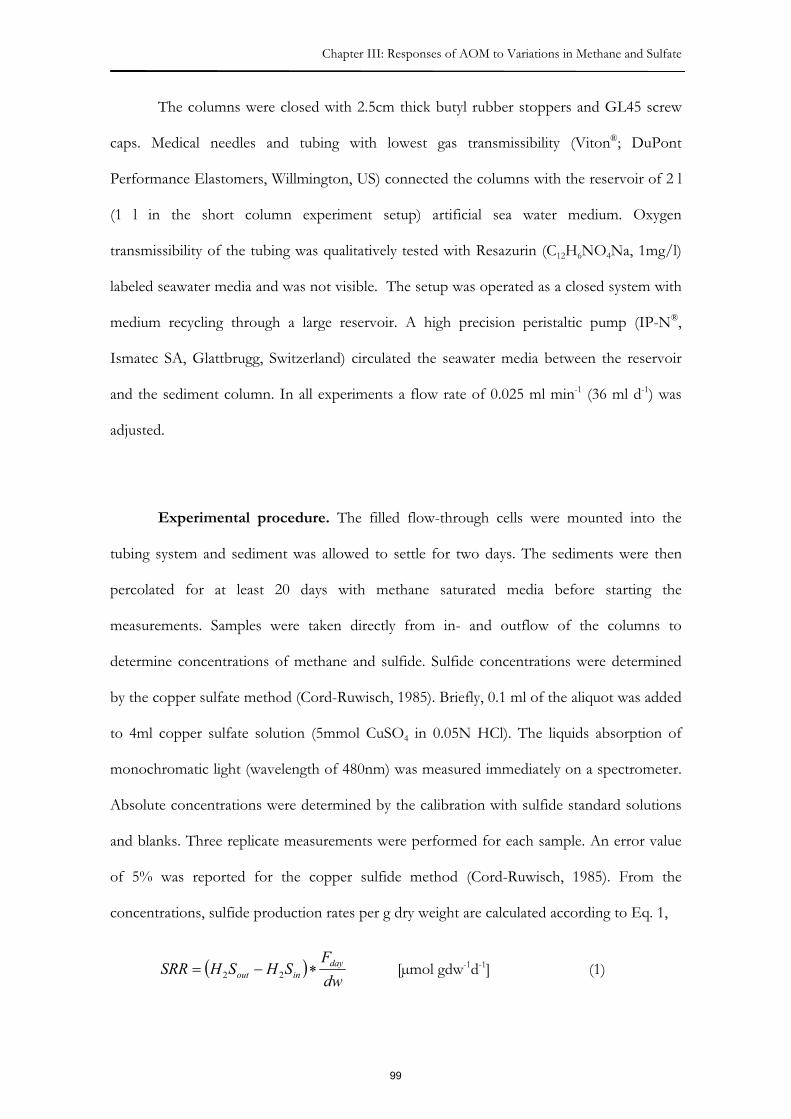
Chapter III: Responses of AOM to Variations in Methane and Sulfate
The columns were closed with 2.5cm thick butyl rubber stoppers and GL45 screw
caps. Medical needles and tubing with lowest gas transmissibility (Viton®; DuPont
Performance Elastomers, Willmington, US) connected the columns with the reservoir of 2 l
(1 l in the short column experiment setup) artificial sea water medium. Oxygen
transmissibility of the tubing was qualitatively tested with Resazurin (C12H6NO4Na, 1mg/l)
labeled seawater media and was not visible. The setup was operated as a closed system with
medium recycling through a large reservoir. A high precision peristaltic pump (IP-N®,
Ismatec SA, Glattbrugg, Switzerland) circulated the seawater media between the reservoir
and the sediment column. In all experiments a flow rate of 0.025 ml min-1 (36 ml d-1) was
adjusted.
Experimental procedure. The filled flow-through cells were mounted into the
tubing system and sediment was allowed to settle for two days. The sediments were then
percolated for at least 20 days with methane saturated media before starting the
measurements. Samples were taken directly from in- and outflow of the columns to
determine concentrations of methane and sulfide. Sulfide concentrations were determined
by the copper sulfate method (Cord-Ruwisch, 1985). Briefly, 0.1 ml of the aliquot was added
to 4ml copper sulfate solution (5mmol CuSO4 in 0.05N HCl). The liquids absorption of
monochromatic light (wavelength of 480nm) was measured immediately on a spectrometer.
Absolute concentrations were determined by the calibration with sulfide standard solutions
and blanks. Three replicate measurements were performed for each sample. An error value
of 5% was reported for the copper sulfide method (Cord-Ruwisch, 1985). From the
concentrations, sulfide production rates per g dry weight are calculated according to Eq. 1,
� �dwF
SHSHSRR dayinout ��� 22 [μmol gdw-1d-1] (1)
99

Methane Oxidation and Carbon Assimilation in Marine Sediments
with the concentrations of H2S (μM) in the out- and inflow, the volume of percolated media
per day (ml day-1, Fday) and the dry weight (gdw). We assume that sulfide production is
equivalent to sulfate reduction (SR). However, in all experiments we observed a consistent
offset between sulfide production and methane oxidation in the presence of methane. The
difference between sulfide production and methane oxidation is most likely due to a
contamination of the methane gas with another electron donor (e.g. carbon monoxide),
because background sulfide production without methane was as low as 0.01 μmol gdw-1
day-1. This low background cannot explain the offset between SR and AOM of ca.
0.07 μmol gdw-1 day-1 arising from saturation of the medium with methane.
For methane concentrations, subsamples of 0.5ml media were added into gas tight
6ml exetainers filled with 0.5ml NaOH. Methane concentrations were determined from the
100μl headspace triplicates using a GC-FID (Hewlett Packard 5890A, equipped with
Porapak-Q column, 6ft, 0.125', Agilent Technologies, Sta. Clara, CA), which was calibrated
with methane standards. The AOM rate is calculated according to Eq. 2
AOM � CH4 in �CH4 out�Fdaydw
[μmol gdw-1d-1] (2)
with the methane concentrations of the in- and the outflow (CH4 in/ out), the flow rate per day
Fday as well as the dry weight dw of the sediment in the column. Sulfate concentrations were
measured using nonsuppressed ion chromatography according to according to Ferdelman et
al. (1997).
3. Results and Discussion
The first task in the series of experiments was to reach stable conditions in the two
different flow-through setups with long and short columns, both with regard to between
column comparisons and temporal evolution. In the experiment using five replicate long
100

Chapter III: Responses of AOM to Variations in Methane and Sulfate
columns, Gullfaks sediments were percolated for more than 100 days with constant
methane concentrations of around 1.6 mM. The flow rate was 36 ml d-1, (32 m yr-1), and the
passage time for the medium entering at the bottom of the column (inflow) to the outflow
was 36 hours. A fluid flow velocity of 30 m yr-1 is at the higher end of transport rates at cold
seep ecosystems and was previously observed e.g. in active settings like those above gas
hydrate at stability limits (Linke et al., 1994; Torres et al., 2002).
Fig 2 shows the results for one replicate column of Gullfaks seep sediments. Both
sulfide production and methane oxidation were relatively stable. Methane oxidation was on
average 0.16 ± 0.04 μmol per gram dry weight (gdw) -1. The offset between sulfide
production and methane oxidation in the experiments of ca 30% was consistently observed
when medium was saturated with methane, which was most likely contaminated with
another electron donor such as carbon monoxide or higher hydrocarbons.
Fig. 2. Comparison of methane oxidation and sulfide production in a long term continuous flow through experiment. The data shown are from one of five similar replicates (Gullfaks seep sediments). a) The development of methane and b) sulfide (inflow concentration (filled circles) and outflow concentrations (open circles) as well as c) the calculated methane oxidation (grey bars) and sulfide production rates (black bars).
101
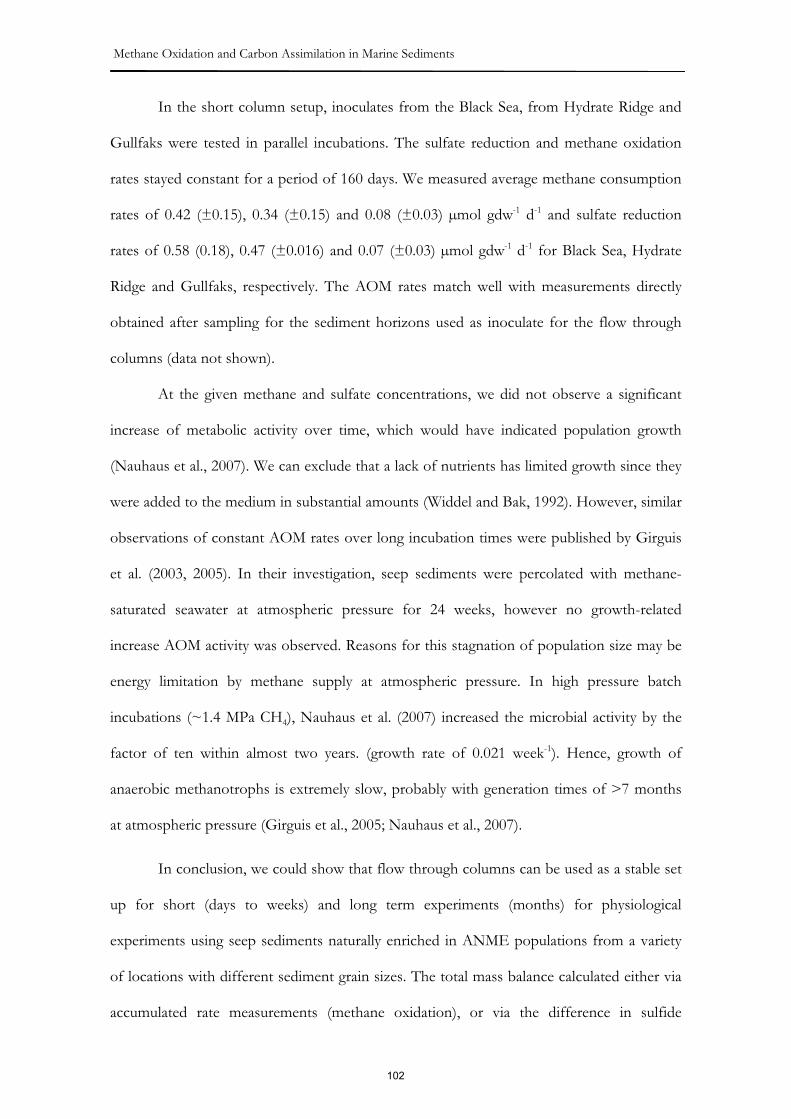
Methane Oxidation and Carbon Assimilation in Marine Sediments
In the short column setup, inoculates from the Black Sea, from Hydrate Ridge and
Gullfaks were tested in parallel incubations. The sulfate reduction and methane oxidation
rates stayed constant for a period of 160 days. We measured average methane consumption
rates of 0.42 (±0.15), 0.34 (±0.15) and 0.08 (±0.03) μmol gdw-1 d-1 and sulfate reduction
rates of 0.58 (0.18), 0.47 (±0.016) and 0.07 (±0.03) μmol gdw-1 d-1 for Black Sea, Hydrate
Ridge and Gullfaks, respectively. The AOM rates match well with measurements directly
obtained after sampling for the sediment horizons used as inoculate for the flow through
columns (data not shown).
At the given methane and sulfate concentrations, we did not observe a significant
increase of metabolic activity over time, which would have indicated population growth
(Nauhaus et al., 2007). We can exclude that a lack of nutrients has limited growth since they
were added to the medium in substantial amounts (Widdel and Bak, 1992). However, similar
observations of constant AOM rates over long incubation times were published by Girguis
et al. (2003, 2005). In their investigation, seep sediments were percolated with methane-
saturated seawater at atmospheric pressure for 24 weeks, however no growth-related
increase AOM activity was observed. Reasons for this stagnation of population size may be
energy limitation by methane supply at atmospheric pressure. In high pressure batch
incubations (~1.4 MPa CH4), Nauhaus et al. (2007) increased the microbial activity by the
factor of ten within almost two years. (growth rate of 0.021 week-1). Hence, growth of
anaerobic methanotrophs is extremely slow, probably with generation times of >7 months
at atmospheric pressure (Girguis et al., 2005; Nauhaus et al., 2007).
In conclusion, we could show that flow through columns can be used as a stable set
up for short (days to weeks) and long term experiments (months) for physiological
experiments using seep sediments naturally enriched in ANME populations from a variety
of locations with different sediment grain sizes. The total mass balance calculated either via
accumulated rate measurements (methane oxidation), or via the difference in sulfide
102

Chapter III: Responses of AOM to Variations in Methane and Sulfate
concentrations in the reservoir at beginning and end of the experiments match rather well
(ca 15 μmol H2S gdw-1 sediment in 83 days).
Reaction of SR and methane consumption to a methane pulse.
The results of a 40 days methane pulse experiment are presented in Fig. 3. We only
show the results of one column (C1) filled with sediments from Gullfaks, the other 4
replicate columns with Gullfaks sediments gave similar results. The columns were run for
120 days at 2 mM methane and 28 mM sulfate, before methane was removed for 36 days
(Fig 3a). After
Fig. 3. Changing activities of a methanotrophic community in response to a methane pulse. a) Methane concentrations, b) sulfide concentrations. Filled circles represent the measurements at the inflow and open circles those at the outflow; c) the resulting methane oxidation rates and d) sulfide production.
36 days of starvation, methane concentration in the medium was increased to 2 mM within
2 days. The outflow showed increasing sulfide concentrations immediately after methane
103
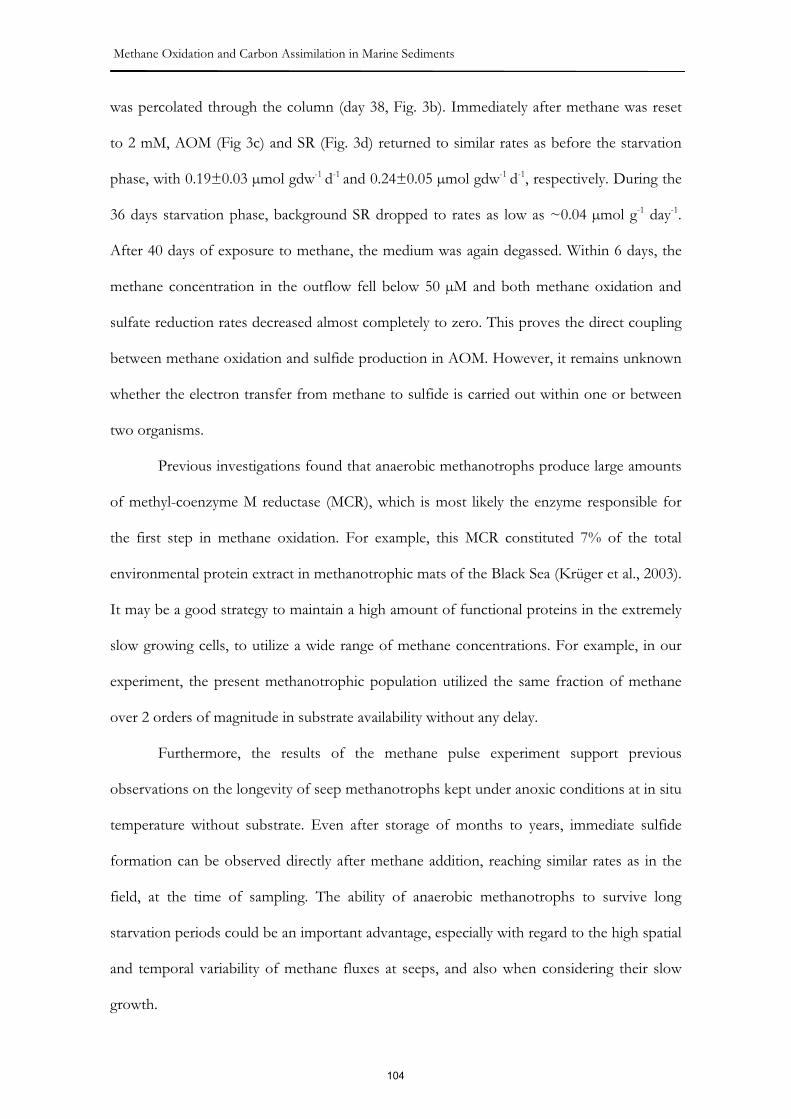
Methane Oxidation and Carbon Assimilation in Marine Sediments
was percolated through the column (day 38, Fig. 3b). Immediately after methane was reset
to 2 mM, AOM (Fig 3c) and SR (Fig. 3d) returned to similar rates as before the starvation
phase, with 0.19±0.03 μmol gdw-1 d-1 and 0.24±0.05 μmol gdw-1 d-1, respectively. During the
36 days starvation phase, background SR dropped to rates as low as ~0.04 μmol g-1 day-1.
After 40 days of exposure to methane, the medium was again degassed. Within 6 days, the
methane concentration in the outflow fell below 50 μM and both methane oxidation and
sulfate reduction rates decreased almost completely to zero. This proves the direct coupling
between methane oxidation and sulfide production in AOM. However, it remains unknown
whether the electron transfer from methane to sulfide is carried out within one or between
two organisms.
Previous investigations found that anaerobic methanotrophs produce large amounts
of methyl-coenzyme M reductase (MCR), which is most likely the enzyme responsible for
the first step in methane oxidation. For example, this MCR constituted 7% of the total
environmental protein extract in methanotrophic mats of the Black Sea (Krüger et al., 2003).
It may be a good strategy to maintain a high amount of functional proteins in the extremely
slow growing cells, to utilize a wide range of methane concentrations. For example, in our
experiment, the present methanotrophic population utilized the same fraction of methane
over 2 orders of magnitude in substrate availability without any delay.
Furthermore, the results of the methane pulse experiment support previous
observations on the longevity of seep methanotrophs kept under anoxic conditions at in situ
temperature without substrate. Even after storage of months to years, immediate sulfide
formation can be observed directly after methane addition, reaching similar rates as in the
field, at the time of sampling. The ability of anaerobic methanotrophs to survive long
starvation periods could be an important advantage, especially with regard to the high spatial
and temporal variability of methane fluxes at seeps, and also when considering their slow
growth.
104

Chapter III: Responses of AOM to Variations in Methane and Sulfate
Sulfate reduction and methane oxidation at different methane and sulfate
concentrations.
At the low energy yield of AOM, efficient use of the natural range of methane and
sulfate concentrations is critical to the anaerobic methanotrophs. In nature, AOM is often
limited to a narrow zone where methane and sulfate overlap (SMTZ), in which both
reactants show very low concentrations. At seeps, methane concentrations and fluxes may
be extremely high, but very often sulfate is depleted within the top few cm, and its
penetration from the overlying bottom water can be suppressed by high upward fluxes of
sulfate free subsurface fluids (Niemann et al., 2006). Previous environmental observations
suggested a strong dependence of AOM rates on the fluxes of sulfate (Treude et al., 2003).
To examine the kinetic effect of AOM reactant availability, we incubated two replicate
columns from Gullfaks with a series of different methane and sulfate concentrations. After
an adjustment time of � 8 days for each concentration, three to five measurements of
methane and sulfide concentrations were performed within about ten days. Figure 4 and 5
show AOM and SR rates at different concentrations of methane and sulfate and constant
flow velocities of 30 m yr-1.
In Fig. 4 the metabolic activities without methane and at different methane
concentrations between 0.3 and 2.3 mM are plotted. In the absence of methane, a
background sulfide production of about 0.02 μmol gdw-1 d-1 was determined. Sulfide
production increased to 0.17 μmol gdw-1 d-1 at 1.35 mM CH4 and to 0.21 μmol gdw-1 day-1 at
methane concentrations of 2.3 M. Methane oxidation followed the trend of sulfate reduction
with rates of 0.02, 0.10, 0.17 μmol gdw-1 day-1 at 0.33 mM, 1.35 mM and 2.3 mM CH4,
respectively. The relation between methane concentration and methane consumption as well
as sulfide production was linear in this range. The 20-30% offset between SR and AOM is
explained as above.
105

Methane Oxidation and Carbon Assimilation in Marine Sediments
A methane saturation effect (indicated by a declining slope) was not observed in our
experiments, which suggests AOM KM-values beyond 2 mM. Nauhaus et al. (2002) observed
a linear relationship between methane oxidation and sulfide production below methane
pressures of 0.1 MPa (about 1.5 mM), and suggested a high methane KM in the range of
several mM for AOM and methane-fueled SR. In comparison, for hydrogenotrophic sulfate
reduction, half saturation constants for H2 are as low as 141 Pa (~1 μmol; Lovley et al.,
1982), but the energy yield of this process is orders of magnitudes higher than in AOM. The
high half saturation constant for methane in AOM may be due to predicted reverse
operation of the methanogenic methyl-coenzyme M reductase, producing a methyl radical as
a first step in AOM (Krüger et al., 2003; Hallam et al., 2004; Shima and Thauer, 2005).
Fig. 4. Effect of different methane concentrations on rates of methane oxidation (open symbols) and sulfate reduction (filled symbols). Data are shown for two replicate columns marked as circles (C1) and triangles (C2)
The influence of sulfate concentration on the oxidation of methane was examined
by percolating two other replicate columns with reduced seawater medium containing 28, 3,
2 and 1 mM sulfate (Fig. 5). Within the tested low sulfate concentrations from 3 to 1 mM a
weak decline of metabolic rates was determined. However the scattering within the data was
quite strong. We conclude that the half saturation for sulfate in methanotrophy is below the
examined concentrations, around 0.5 mM. In comparison, organoclastic sulfate reducers
show half saturation constants between 70 μM (Desulfovibrio salexigens) and 200 μM
(Desulfobacter postgatei) (Ingvorsen and Joergensen, 1984; Ingvorsen et al., 1984). These sulfate
reducers have different strategies to achieve low kM-values; e.g. Desulfovibrio desulfuricans
106
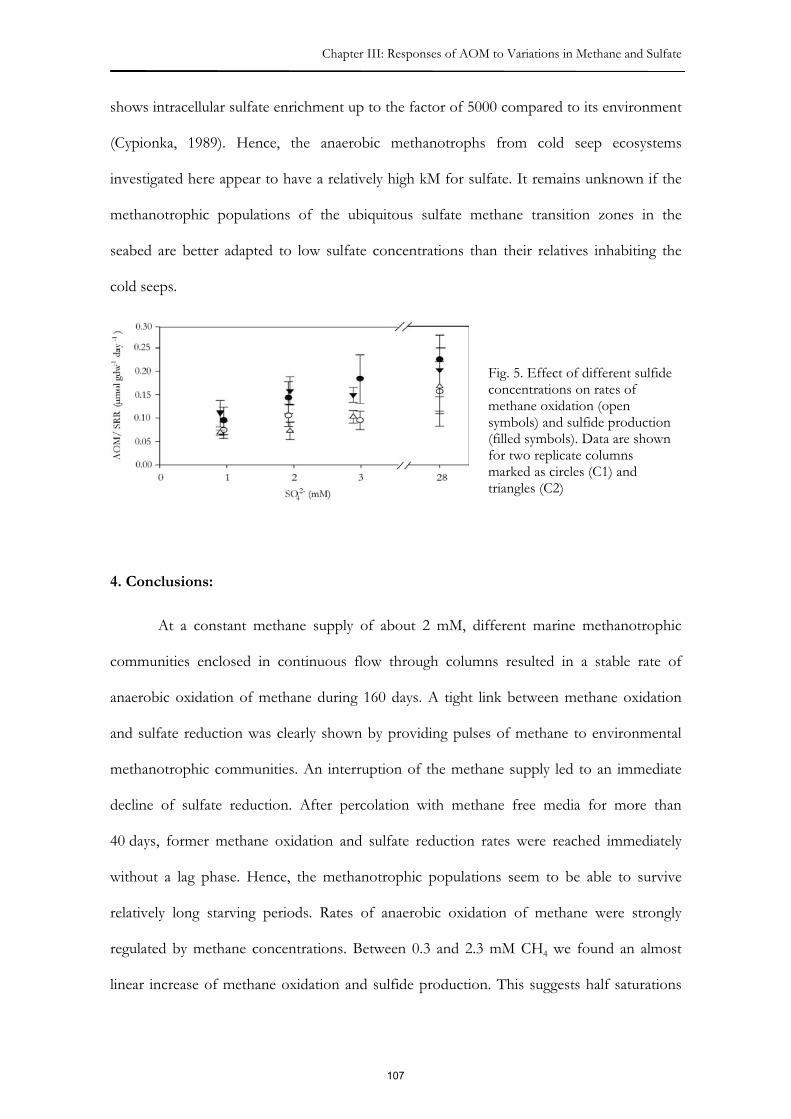
Chapter III: Responses of AOM to Variations in Methane and Sulfate
shows intracellular sulfate enrichment up to the factor of 5000 compared to its environment
(Cypionka, 1989). Hence, the anaerobic methanotrophs from cold seep ecosystems
investigated here appear to have a relatively high kM for sulfate. It remains unknown if the
methanotrophic populations of the ubiquitous sulfate methane transition zones in the
seabed are better adapted to low sulfate concentrations than their relatives inhabiting the
cold seeps.
Fig. 5. Effect of different sulfide concentrations on rates of methane oxidation (open symbols) and sulfide production (filled symbols). Data are shown for two replicate columns marked as circles (C1) and triangles (C2)
4. Conclusions:
At a constant methane supply of about 2 mM, different marine methanotrophic
communities enclosed in continuous flow through columns resulted in a stable rate of
anaerobic oxidation of methane during 160 days. A tight link between methane oxidation
and sulfate reduction was clearly shown by providing pulses of methane to environmental
methanotrophic communities. An interruption of the methane supply led to an immediate
decline of sulfate reduction. After percolation with methane free media for more than
40 days, former methane oxidation and sulfate reduction rates were reached immediately
without a lag phase. Hence, the methanotrophic populations seem to be able to survive
relatively long starving periods. Rates of anaerobic oxidation of methane were strongly
regulated by methane concentrations. Between 0.3 and 2.3 mM CH4 we found an almost
linear increase of methane oxidation and sulfide production. This suggests half saturations
107

Methane Oxidation and Carbon Assimilation in Marine Sediments
(kM values) for methane of several mM in AOM. Sulfate concentrations below 3 mM
decreased methane oxidation rates, the kM for sulfate is estimated at around 0.5 mM.
Apparently, the high level of functional proteins maintained by the anaerobic
methanotrophs allows for immediate responses to a wide range of concentrations of both
electron donor and acceptor in the anaerobic oxidation of methane.
References
Boetius, A., and Suess, E.: Hydrate Ridge: a natural laboratory for the study of microbial life fueled by methane from near-surface gas hydrates. Chem. Geol., 205: 291-310, 2004.
Boetius, A. Ravenschlag, K., Schubert, C. J., Rickert, D., Widdel, F., Gieseke, A., Amann, R., Jørgensen, B.B., Witte, U. and Pfannkuche, O.: A marine microbial consortium apparently mediating anaerobic oxidation of methane. Nature, 407: 623-626, 2000.
Canfield, D. (1993) Organic matter oxidation in marine sediments. Interactions of C, N, P and S biogeochemical cycles and global change. NATO ASI Series, 14: 33–363.
Canfield, D., Kristensen, E. and Thamdrup, B. Aquatic Geomicrobiology. San Diego, California: Elsevier, 656pp, 2005.
Cord-Ruwisch, R.: A quick method for the determination of dissolved and precipitated sulfides in cultures of sulfate-reducing bacteria. Microbiol. Meth., 4(1): 33-36, 1985.
Cypionka, H.: Characterization of sulfate transport in Desulfovibrio desulfuricans. Arch. Microbiol., 152(3): 237-243, 1989.
Ferdelman, T. G., Lee, C., Pantoja, S., Harder, J., Bebout, B. M. and Fossing, H.: Sulfate reduction and methanogenesis in a Thioploca-dominated sediment off the coast of Chile. Geochim. Cosmochim Ac., 61(15): 3065-3079, 1997.
Girguis, P. R., Cozen, A. E. and DeLong, E. F.: Growth and population dynamics of anaerobic methane-oxidizing archaea and sulfate-reducing bacteria in a continuous-flow bioreactor. Appl. Environ. Microb., 71(7): 3725-3733, 2005.
Girguis, P. R., Orphan, V., Hallam, S. and DeLong, E. F.: Growth and methane oxidation rates of anaerobic methanotrophic archaea in a continuous-flow bioreactor. Appl. Environ. Microb., 69(9): 5472-5482, 2003.
Hallam, S. J., Putnam, N., Preston, C. M., Detter, J. C., Rokhsar, D., Richardson, P. M. and DeLong, E. F.: Reverse methanogenesis: Testing the hypothesis with environmental genomics. Science 305(5689): 1457-1462, 2004.
Hanson, R. S. and Hanson, T. E.: Methanotrophic bacteria. Microbiol. Rev., 60: 439-471, 1996.
Hovland, M.: Discovery of prolific natural methane seeps at Gullfaks, northern North Sea. Geo-Mar. Lett. 27: 197-201, 2007.
108

Chapter III: Responses of AOM to Variations in Methane and Sulfate
Ingvorsen, K. and Joergensen, B.B.: Kinetics of sulfate uptake by freshwater and marine species of Desulfovibrio. Arch .Microbiol., 139: 61-66, 1984.
Ingvorsen, K., Zehnder, A.J.B. and Jørgensen, B.B.: Kinetics of sulfate and acetate uptake by Desulfobacter postgatei. Appl. Environ. Microb., 47: 403-408, 1984.
Krüger, M., Anke Meyerdieks, A., Glöckner, F.O., Amann, R., Widdel, F., Kube, M., Reinhardt, R., Kahnt, J., Böcher, R., Thauer, R. K. And Shima, S.: A conspicuous nickel protein in microbial mats that oxidize methane anaerobically. Nature, 426: 878-881, 2003.
Krüger, M. Treude, T., Wolters, H., Nauhaus, K. and Boetius, A.: Microbial methane turnover in different marine habitats. Palaeogeogr. Palaeocl., 227(1-3): 6-17, 2005.
Linke, P., Suess, E., Torres, M., Martens, V., Rugh, W. D., Ziebis, W., Kulm, L. D.: In situ measurement of fluid flow from cold seeps at active continental margins. Deep-Sea Res., 41: 721–739, 1994
Lovley, D. R., Dwyer, D. F. and Klug, M. J.: Kinetic analysis of competition between sulfate reducers and methanogens for hydrogen in sediments. Appl. Environ. Microbiol., 43(6): 1379-1379, 1982.
Milkov, A.V.: Global estimates of hydrate-bound gas in marine sediments: how much is really out there? Earth-Sci. Rev., 66(3-4): 183-197, 2004.
Nauhaus, K., Albrecht, M., Elvert, M., Boetius, A. and Widdel, F.: In vitro cell growth of marine archaeal-bacterial consortia during anaerobic oxidation of methane with sulfate. Environ. Microbiol., 9(1): 187-196, 2007.
Nauhaus, K., Boetius, A., Krüger, M. and Widdel, F.: In vitro demonstration of anaerobic oxidation of methane coupled to sulphate reduction in sediments from a marine gas hydrate area. Environ. Microbiol., 4(5): 296-305, 2002.
Nauhaus, K., Treude, T., Boetius, A. and Kruger, M.: Environmental regulation of the anaerobic oxidation of methane: a comparison of ANME-I and ANME-II communities. Environ. Microbiol., 7(1): 98-106, 2005.
Niemann, H., Lösekann, T., de Beer, D., Elvert, M., Nadalig, T., Knittel, K., Amann, R., Sauter, E. J., Schlüter, M., Klages, M., Foucher, J. P. and Boetius, A.: Novel microbial communities of the Haakon Mosby mud volcano and their role as a methane sink. Nature, 443(7113): 854-858, 2006.
Orphan, V.J., House, C.H., Hinrichs, K.-U., McKeegan, K.D. and DeLong, E.F. Methane-consuming archaea revealed by directly coupled isotopic and phylogenetic analysis. Science, 293(5529): 484-487, 2001.
Reeburgh, W. S.: Oceanic methane biogeochemistry. Chem. Rev., 107(2): 486-513, 2007.
Reeburgh, W.S.: 'Soft spots' in the global methane budget. In: M.E. Lidstrom and F.R. Tabita (Editors), Microbial Growth on C1 Compounds. Kluwer, Dordrecht, pp. 334–342, 1996.
Shima, S., and Thauer, R. (2005) Methyl-coenzyme M reductase and the anaerobic oxidation of methane in methanotrophic Archaea. Curr. Opin. Microbiol., 8: 643-648.
Sauter, E., Muyakshin, S., Charlou, J., Schlüter, M., Boetius, A., Jerosch, K. et al. Methane discharge from a deep-sea submarine mud volcano into the upper water column by gas hydrate-coated methane bubbles. Earth Planet. Sc. Lett., 243: 354-365, 2006.
109

Methane Oxidation and Carbon Assimilation in Marine Sediments
Torres, M. E., McManus, J., Hammond, D. E., de Angelis, M. A., Heeschen, K.U., Colbert, S. L., Tryon, M. D., Brown, K. M. and Suess, E.: Fluid and chemical fluxes in and out of sediments hosting methane hydrate deposits on Hydrate Ridge, OR, I: Hydrological provinces. Earth Planet. Sc. Lett. 201: 525-540, 2002.
Treude, T., Boetius, A., Knittel, K., Wallmann, K. and Jorgensen, B. B.: Anaerobic oxidation of methane above gas hydrates at Hydrate Ridge, NE Pacific Ocean. Mar. Ecol.-Prog. Ser., 264: 1-14, 2003.
Treude, T., Knittel, K., Blumenberg, M., Seifert, R. and Boetius, A.: Subsurface microbial methanotrophic mats in the Black Sea. Appl. Environ. Microb., 71(10): 6375-6378, 2005.
Treude, T., Orphan, V., Knittel, K., Gieseke, A., House, C. and Boetius, A. Consumption of methane and CO2 by methanotrophic microbial mats from gas seeps of the anoxic Black Sea. Appl. Environ. Microb. 73: 2271-2283, 2007.
Trotsenko, Y.A. and Khmelenina, V.N.: Aerobic methanotrophic bacteria of cold ecosystems. FEMS Microbiol. Ecol., 53(1): 15-26, 2005.
Tryon, M.D., Brown, K.M., and Torres, M.E.: Fluid and chemical flux in and out of sediments hosting methane hydrate deposits on Hydrate Ridge, OR, II: Hydrological processes. Earth Planet. Sc. Lett., 201: 541-557, 2002
Wegener, G., Shovitri, M., Knittel, K., Niemann, H., Hovland, M. and Boetius, A.: Biogeochemical processes and microbial diversity of the Gullfaks and Tommeliten methane seeps (Northern North Sea). Biogeosciences Discuss., 5: 971-1015, www.biogeosciences-discuss.net/5/971/2008/, 2008.
Wellsbury, P., Goodman, K., Cragg, A. and Parkes, R.J.: 36. The geomicrobiology of deep marine sediments from Blake Ridge containing methane hydrate (site 994, 995 and 997) Proceedings of the Ocean Drilling Program. Scientific results. 164: 379-391, 2000.
Widdel, F. and Bak, F., Gram-negative mesophilic sulfate-reducing bacteria. In: T.H. Balows A, Dworkin M, Harder W, Schleifer KH (Editor), The prokaryotes. Springer, Berlin Heidelberg New York, pp. 3352-3378, 1992.
110

Chapter IV: Methane and Inorganic Carbon Assimilation in Anaerobic Methanotrophy
Chapter IV
Assimilation of Methane and Inorganic Carbon by Microbial
Communities Mediating the Anaerobic Oxidation of Methane
Gunter Wegener1*, Helge Niemann1#, Marcus Elvert2, Kai-Uwe Hinrichs2 and Antje
Boetius1,3,4
1Max Planck Institute for Marine Microbiology, Celsiusstr. 1, 28359 Bremen, Germany. 2Research Center Ocean Margins, University of Bremen, Leobener Str., 28359 Bremen,
Germany 3Jacobs University Bremen gGmbH, Campusring 1, 28759 Bremen, Germany
4Alfred Wegener Institute for Polar and Marine Research,27515 Bremerhaven, Germany
#Present address: Institute for Environmental Geosciences, University of Basel, Bernoullistr. 30, 4056 Basel, Switzerland
111
Methane Oxidation and Carbon Assimilation in Marine Sediments Abstract: The anaerobic oxidation of methane (AOM) is a major sink for methane on
Earth and is performed by consortia of methanotrophic archaea (ANME) and sulfate
reducing bacteria (SRB). Here we present a comparative study using in vitro stable
isotope probing to examine methane and carbon dioxide assimilation into microbial
biomass. Three sediment types comprising different methane-oxidizing
communities (ANME-1 and -2 mixture from the Black Sea, ANME-2a from Hydrate
Ridge and ANME-2c from the Gullfaks oil field) were incubated in replicate flow-
through systems with methane-enriched anaerobic seawater medium for 5-6 months
amended with either 13CH4 or H13CO3-. In all three sediment types methane was
anaerobically oxidized in a 1:1 stoichiometric ratio compared to sulfate reduction.
Similar amounts of 13CH4 or 13CO2 were assimilated into characteristic archaeal
lipids, indicating a direct assimilation of both carbon sources into ANME biomass.
Specific bacterial fatty acids assigned to the partner SRB were almost exclusively
labeled by 13CO2, but only in the presence of methane as energy source and not
during control incubations without methane. This indicates an autotrophic growth
of the ANME-associated SRB and supports previous hypotheses of an electron
shuttle between the consortium partners. Carbon assimilation efficiencies of the
methanotrophic consortia were low, with only 0.25-1.3 mol% of the methane
oxidized.
Introduction:
Methane is an important greenhouse gas. In spite of the high production rates and
large reservoirs of methane in marine sediments, the oceans contribute only little to the
atmospheric budget (Judd et al., 2002; Reeburgh, 2007). This is because the microbially
mediated anaerobic oxidation of methane (AOM), with sulfate as the terminal electron
112

Chapter IV: Methane and Inorganic Carbon Assimilation in Anaerobic Methanotrophy
acceptor, removes the largest fraction of methane before it can reach the hydrosphere and
atmosphere (Martens and Berner, 1974; Reeburgh, 1976; Iversen and Jørgensen, 1985;
Hinrichs and Boetius, 2002).
Marine AOM is mediated by archaea in consortium with sulfate reducing bacteria
(SRB) (Boetius et al., 2000; Hinrichs et al., 2000; Orphan et al., 2001a; Knittel et al., 2005).
The three known phylogenetic groups of marine anaerobic methanotrophs (ANME-1, -2,
and -3) are distantly related to methanogens of the order Methanosarcinales and
Methanomicrobiales (Hinrichs et al., 1999; Boetius et al., 2000; Orphan et al., 2002; Knittel et
al., 2005; Niemann et al., 2006; Lösekann et al., 2007). The known sulfate reducing partners
of the of ANME-1 and -2 groups belong to the Desulfosarcina/Desulfococcus (DSS) group
(Boetius et al., 2000; Orphan et al., 2001b; Michaelis et al., 2002; Knittel et al., 2003),
whereas ANME-3 was recently found in association with SRB related to the Desulfobulbus
cluster (Niemann et al., 2006; Lösekann et al., 2007). These consortia of anaerobic
methanotrophic microorganisms dominate microbial biomass and biogeochemical processes
at shallow and deep water cold seeps, in gas hydrate environments, and in ubiquitous
methane sulfate transition zones of the sediments (Knittel et al., 2005).
Today, none of the methanotrophic consortia have been obtained in pure culture,
and physiological studies have relied on in vitro experimentation with sediment samples
naturally enriched in methanotrophic communities (Nauhaus et al. 2002, 2005, 2007; Girguis
et al. 2003, 2005; Blumenberg et al. 2005; Moran et al., 2008). In addition to their 16S rRNA
gene-based phylogenetic classification, each of these groups can be recognized according to
profiles of specific 13C-depleted lipid biomarkers (Hinrichs and Boetius 2002; Blumenberg et
al. 2004; Niemann and Elvert in press). A direct evidence for this link was provided by the
combination of fluorescence in situ hybridization with secondary ion mass spectrometry
(FISH-SIMS; Orphan et al. 2001a). To further investigate the relation between
concentrations, ratios and �13C-values of specific microbial lipids to the distribution of
113

Methane Oxidation and Carbon Assimilation in Marine Sediments active methanotrophic communities, three approaches have been used previously: (1) the
correlation of lipids with cell counts in field samples (Boetius et al. 2000; Elvert et al., 2003,
2005; Orcutt et al., 2005; Niemann et al. 2006), (2) the in vitro growth of ANME consortia
with subsequent lipid analysis of the biomass yield (Nauhaus et al. 2007); (3) lipid analysis
coupled to stable isotope probing of an active methanotrophic microbial mat (Blumenberg
et al. 2005). Among the archaeal lipids, 13C-depleted archaeol and hydroxyarchaeol as well as
crocetane and penthamethylicosane have been repeatedly shown to correlate with the
presence of different active ANME consortia (Blumenberg et al. 2004; Nauhaus et al. 2007;
Niemann and Elvert, in press). Among the bacterial lipids, several types of ester linked fatty
acids (e.g. C16:1�5c; cy(cyclopropane)C17:0�5,6) and abundances of monoalkyl and dialkyl
glycerol ethers have been suggested as specific biomarkers for partner SRB of
methanotrophic consortia (Hinrichs et al., 2000; Elvert et al. 2003; Blumenberg et al. 2004;
Nauhaus et al. 2007; Niemann and Elvert, in press).
In the present study, we aimed at investigating the assimilation of methane and
inorganic carbon as by members of methanotrophic communities using stable isotope
probing of their lipid biomarkers. For this in vitro experiment, we used flow-through
reactors, which showed constantly high rates of sulfate-driven AOM when filled with
sediment slurries naturally enriched in methanotrophic communities from three different
cold seep sites in the Black Sea (BS), at Hydrate Ridge (HR) and Gullfaks (GF). The main
advantage of flow-through reactors is the option to monitor the concentration of the
reactants and end products of AOM (i.e. sulfide and bicarbonate), dilute products of AOM
in a large medium pool, and to provide relatively high growth rates at comparatively low
methane partial pressures (Girguis et al. 2005). Based on results from previous experiments
with highly enriched ANME-2/DSS and ANME-1/DSS communities (Nauhaus et al. 2002,
2005, 2007), we tested the following hypotheses: (1) ANME cell biomass is formed by
assimilation of both methane and CO2 (2) the syntrophic sulfate reducing partners are
114

Chapter IV: Methane and Inorganic Carbon Assimilation in Anaerobic Methanotrophy
autotrophs; (3) different AOM communities show different lipid patterns, but the
stoichiometry of methane and inorganic carbon assimilation is similar.
Results
Biogeochemical rate measurements
Replicate sediment samples naturally enriched in AOM communities from cold
seeps of the BS, HR and GF were incubated at methane concentrations of 1.8-2.2 mM in
flow-through reactors. The experiments started with a sulfide inflow concentration of about
1 mM. During incubation, the sulfide concentration did not exceed 4 mM in all six flow-
through reactors. All inoculates showed relatively stable rates of sulfate reduction and
methane oxidation, calculated from the difference from inflow and outflow sulfide and
methane concentrations. In incubations with 13C-methane, average rates of SR and AOM
were 0.58 and 0.42 μmol per gram dry weight (gdw-1) (BS), 0.47 and 0.34 μmol gdw-1 (HR),
and 0.07 and 0.08 μmol gdw-1 (GF), respectively. Similar SR and AOM rates were calculated
for the bicarbonate labeling experiment using unlabeled methane with 0.58 and 0.53 μmol
gdw-1 (BS), 0.73 and 0.57 μmol gdw-1 (HR) and 0.06 and 0.07 μmol gdw-1 (GF), respectively.
Concentrations and carbon isotopic compositions of fatty acids and isoprenoidal glycerol diethers
Table 1 shows the average concentrations of selected bacterial and archaeal
biomarkers in the three different sediment slurries used for the flow reactors. No substantial
changes of lipid concentrations were observed. At BS, saturated fatty acids (FAs) comprised
almost 80% of the FAs (C14:0-C18:0), followed by their �7-derivatives with 17%. At HR and
GF, saturated FAs comprised 21% and 47%, respectively, and monounsaturated FAs
accounted for 45% and 35%, respectively. In all three inoculates substantial amounts of
C16:1�5, ai- and i-C15:0 FAs acids as well as archaeol and hydroxyarchaeol were present with
characteristically 13C-depleted carbon isotopic compositions. Table 1 shows the �13C-values
115

Methane Oxidation and Carbon Assimilation in Marine Sediments of these compounds at the beginning of the experiment, as well as after inoculation with
13C-labeled methane and 13C-labeled bicarbonate. Ta
ble
1.Co
ncen
tratio
ns,
relat
ive
dist
ribut
ion
and
carb
oniso
topi
cco
mpo
sitio
nsof
selec
ted
com
poun
dsat
the
begi
nnin
gof
the
expe
rimen
tand
afte
r13 C
-labe
ling
with
met
hane
(159
days
)and
inor
gani
cca
rbon
(IC)
(176
days
);T1
and
T2no
tsho
wn
here
;#da
tafr
omT2
(T3
�13 C
-valu
esno
tava
ilabl
e).�
13C
valu
es v
s.V
PDB
.
Bla
ckSe
aH
ydra
teR
idge
Gu
llfak
sCo
ncen
tratio
n13
Cat
T3Co
ncen
tratio
n�1
3 Cat
T3Co
ncen
tratio
n�1
3 Cat
T3
Bac
teri
alF
A
μggd
w-1
%St
art
�13 C
CH4
ICμg
gdw
-1%
Star
t�1
3 CCH
4IC
μggd
w-1
%St
art
�13 C
CH4
IC
C14:
022
.519
.4-2
6-2
8-1
71.
755.
2-3
9-1
714
10.
156.
3-6
4-2
413
59i-C
15:0
3.1
2.7
-39
-33
-60.
993.
0-5
4-4
8-7
0.08
3.3
-63
-35
450
ai-C1
5:0
5.9
5.1
-48
-33
201.
574.
7-6
1-4
3-1
0.14
5.9
-63
-30
259
C16:
1�7c
8.7
7.5
-42
-18
201
7.11
21.3
-35
-27
151
0.38
15.9
-47
-31
653
C16:
1�5c
3.1
2.7
-54
-18
208
3.18
9.5
-63
935
40.
3615
.1-9
1-1
320
06C1
6:0
46.9
40.1
-28
-21
-19
4.22
12.6
-39
-21
650.
5523
.0-2
5-2
266
8cy
C17:
0�5,
62.
11.
8-5
4-5
70.
441.
3-9
9-7
758
0.02
0.8
-88
C18:
1�7c
8.7
7.5
-64
-39
140
3.91
11.7
-41
-51
-80.
093.
8-2
7-2
464
8C1
8:0
11.9
10.3
-27
-28
-25
1.28
3.8
-37
-21
-30
0.43
18.0
-25
-27
53
Arc
hae
alL
.A
rcha
eol
1.0
0.9
-102
-47
-45
3.33
10.0
-108
-28
-20.
052.
1-1
15-3
0#54
3Sn
2-hy
drox
yarc
h1.
81.
6-1
05-5
4-4
75.
6516
.9-1
21-7
0-4
10.
145.
9-1
24-8
3#51
7
116
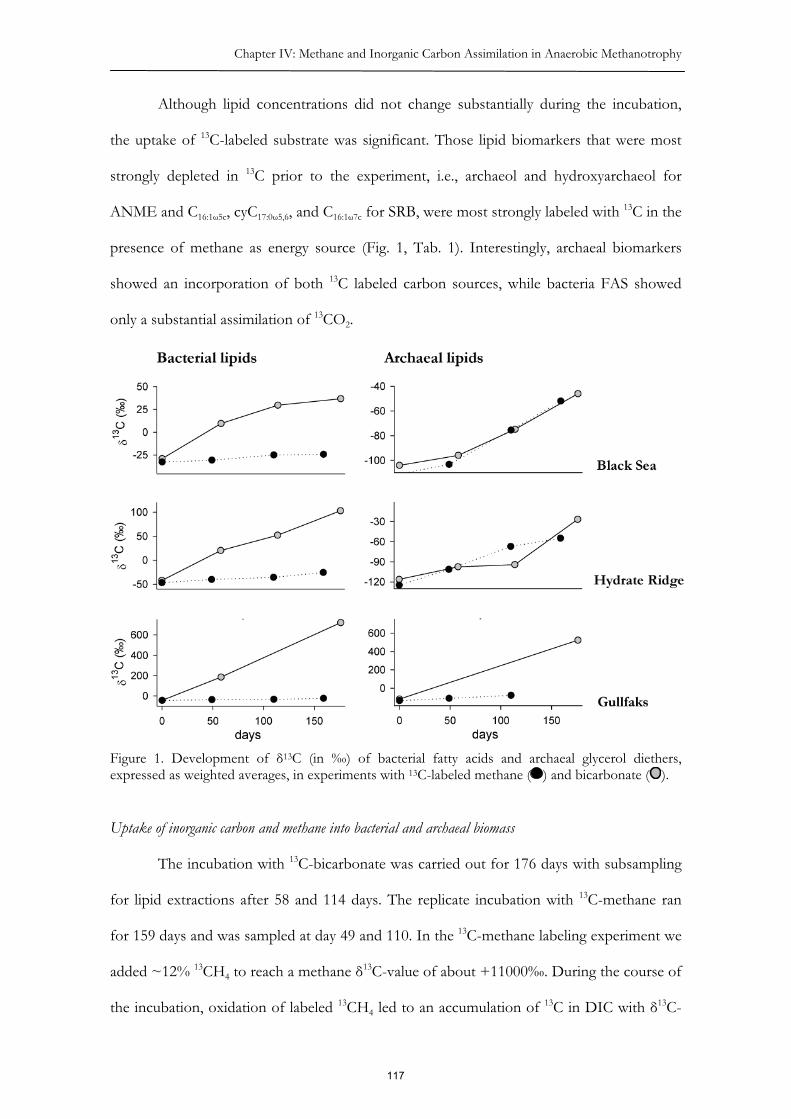
Chapter IV: Methane and Inorganic Carbon Assimilation in Anaerobic Methanotrophy
Although lipid concentrations did not change substantially during the incubation,
the uptake of 13C-labeled substrate was significant. Those lipid biomarkers that were most
strongly depleted in 13C prior to the experiment, i.e., archaeol and hydroxyarchaeol for
ANME and C16:1�5c, cyC17:0�5,6, and C16:1�7c for SRB, were most strongly labeled with 13C in the
presence of methane as energy source (Fig. 1, Tab. 1). Interestingly, archaeal biomarkers
showed an incorporation of both 13C labeled carbon sources, while bacteria FAS showed
only a substantial assimilation of 13CO2.
Figure 1. Development of �13C (in ‰) of bacterial fatty acids and archaeal glycerol diethers, expressed as weighted averages, in experiments with 13C-labeled methane ( ) and bicarbonate ( ).
Uptake of inorganic carbon and methane into bacterial and archaeal biomass
The incubation with 13C-bicarbonate was carried out for 176 days with subsampling
for lipid extractions after 58 and 114 days. The replicate incubation with 13C-methane ran
for 159 days and was sampled at day 49 and 110. In the 13C-methane labeling experiment we
added ~12% 13CH4 to reach a methane �13C-value of about +11000‰. During the course of
the incubation, oxidation of labeled 13CH4 led to an accumulation of 13C in DIC with �13C-
117

Methane Oxidation and Carbon Assimilation in Marine Sediments values reaching +900‰ at the end of the experiment. This may have caused a small
proportion of indirect labeling of lipids by methane-derived DIC. For the 13C-inorganic
carbon labeling experiment, 11% of labeled bicarbonate was added, resulting via carbonate
equilibrium in a �13C of ~+10000‰ in the whole carbonate pool including CO2. Figure 1
shows the development of the mean isotopic compositions of bacterial and archaeal lipids
over time in the incubations with 13C-methane and 13C-bicarbonate. The carbon
isotopic compositions and concentrations of individual lipids (Table 1) were used to
calculate the weighted mean isotopy of both archaeal and bacterial lipids as follows: �C13
� ���
� �n
iLDnLDsumLDn CconcConcC
1
1313 */ (1)
Here, concLDn is the concentration of the individual lipids, �13CLDn the isotopic composition
of these compounds and concLDsum the summed concentration of the quantified lipids, i.e.
glycerol diethers (archaea) and fatty acids (bacteria), respectively.
A continuous carbon isotopic change to more positive �13C-values was measured in
all incubations, indicating a transfer of added 13C into lipid biosynthesis by the
methanotrophic communities. However, in the three inoculates amended with 13C-methane,
only minor changes in �13C of bacterial FAs were observed (��13C�FAs T0-T3 +9‰ (BS);
+21‰ (HR) and +24‰ (GF)). In contrast, 13C-bicarbonate labeling led to a much stronger
13C-incorporation into FAs. Isotopic changes between the start and end of the incubation
were ��13C�FAs T0-T3 +65‰ for BS, +145‰ for HR and +763‰ for the GF inoculate.
The ��13C �T0-T3 of archaeal lipids showed a different pattern. In the BS slurry,
labeling with 13C-methane or 13C-bicarbonate resulted in similar isotopic changes of +59‰
and +58‰, respectively. Likewise, methane and bicarbonate labeling led to a similar 13C
incorporation (��13C +70‰ and +91‰, respectively) in HR slurries. These values indicate
that the archaeal communities assimilate both carbon sources in a ratio of about 1:1. From
the GF slurries, only two measurements of archaeol derivatives were successful, because
118

Chapter IV: Methane and Inorganic Carbon Assimilation in Anaerobic Methanotrophy
overall concentrations were very low (Table 1). However, these results differ from those
found for BS and HR slurries, showing incorporation of 13C-methane to 13C-bicarbonate
with a ratio of about 1:10. The reason for the much higher bicarbonate incorporation in GF
slurries is not clear, but could be related to differences in the specific types of anaerobic
methanotrophs present (Table 3).
Figure 2 (left panel) shows the relative change in carbon isotopic compositions
(��13C) of individual biomarker lipids from the start to the end of the experiment for all
Figure 2. Left panel: Carbon isotopic change of individual fatty acids and archaeal glycerol diethers after incubation with 13C-labeled bicarbonate for 176 days (grey) and 13C-labeled methane for 159 days (black) in Black Sea, Hydrate Ridge and Gullfaks sediment slurries. Right panel: Carbon assimilation into biomarker lipids based on carbon isotopic changes during the course of the experiment. replicate incubations amended with 13C-methane or 13C-bicarbonate. The strongest label
incorporation resulted from the 13C-bicarbonate amendments. However, the incorporation
of label was different for each FA. Highest changes in the carbon isotopy were found for
119

Methane Oxidation and Carbon Assimilation in Marine Sediments C16:1�5c with ��13C-values of +247‰ (BS), +418‰ (HR) and +2097‰ (GF). But also C16:1�7c
(HR, GF, BS), C14:0 (HR, GF) and cyC17:0�5,6 (HR) were highly labeled. Except for C14:0, these
FAs are usually associated with ANME-2 dominated microbial communities (Hinrichs et al.,
2000; Orphan et al., 2001a; Elvert et al., 2003; Niemann and Elvert, in press). Intermediate
changes were found for C16:0, but also for i-C15:0 and ai-C15:0. In all three samples, the lowest
carbon isotopic change was found for C18:0.
Since carbon was mainly assimilated from the inorganic carbon pool (q.v. Table 1,
Fig. 1), the uptake into individual FAs during incubation times (�CLD) (Fig. 2, right panels)
were calculated as follows:
LDCarb
13LD
13
LD concC�C���C �� (2)
where ��13CLD is the isotopic change of the individual lipid as a result of carbonate labeling,
�13CDIC the isotopic composition of inorganic carbon in the medium (~ +10,000‰) and
concLD the concentration of the individual lipids. Considering the above results, we assumed
a mixed carbon assimilation of 1:1 of CO2 and methane for the archaeal lipids, and hence
multiplied �CLD by two for the calculation of carbon assimilation by ANME.
Samples from GF and HR showed a very similar carbon assimilation pattern.
Highest carbon uptake was measured for C16:1w5c (71 and 125 ng C gdw-1), followed by
C16:1w7c (25 and 121 ng C gdw-1). Intermediate uptake was found for the saturated fatty acids
C14:0 and C16:0. In the BS inoculate, highest uptake was found for C16:1w7c (192 ng gdw-1) and
C18:1w7c (154 ng gdw-1), followed by C16:1w5c (75 ng gdw-1). In all sediments, almost no carbon
uptake was found for C18:0. The calculated carbon uptake into archaeol and hydroxyarchaeol
was overall lower with 10 and 20 ng gdw-1 (BS), 68 and 93 ng gdw-1 (HR) and 8 and 19 ng
gdw-1 (GF).
120

Chapter IV: Methane and Inorganic Carbon Assimilation in Anaerobic Methanotrophy
Dependence of inorganic carbon assimilation on methane as energy source.
The dependence of inorganic carbon assimilation into microbial lipids on methane
as energy source was tested in an additional batch experiment. Under a methane atmosphere
of 3.1 mM, high SR rates of 0.8 μmol gdw-1 d-1 were measured for BS and HR sediments. In
contrast, low SR rates (0.07 and 0.02 μmol gdw-1 d-1, respectively) were determined in
methane-free control samples. Due to material limitation, a less active GF inoculate was
used, which reached SR rates of only 0.05 μmol gdw-1 d-1 with methane, and 0.02 μmol gdw-1
d-1 in the control experiment with N2/CO2.
Table 2 shows the carbon isotopic change of selected fatty acids and archaeol
derivatives after 50 days of incubation with a 13C enriched carbonate pool (�13C
~ + 10,000‰). In all three incubations with methane, high isotopic shifts in AOM-specific
Table 2. Assimilation of inorganic carbon by methanotrophic communities with and without methane as energy source. Sediment slurries from Black Sea, Hydrate Ridge and Gullfaks were incubated for 50 days with labeled bicarbonate �13C ~+10000‰.
Black Sea Hydrate Ridge Gullfaks
��13C (‰) ��13C (‰) ��13C(‰)
Bacterial lipids + CH4 Control + CH4 control + CH4 Control
C14:0 6 -1 446 6 212 77 i-C15:0 7 4 9 10 151 13
Ai-C15:0 25 1 23 -4 51 29 C16:1�7c 116 7 155 69 59 3 C16:1�5c 226 10 836 7 614 45
C16:0 13 -1 150 45 52 7 cyC17:0�5,6 76 -2 203 11 159 14
isoprenFA19:0 21 1 -5 C18:1�7c 163 2 61 44 11 -1
C18:0 18 -3 8 6 11 16
Archaeal lipids
Archaeol 37 34 106 38 40 5 sn2-hydroxyarch 16 23 99 24 1 6
fatty acids were observed, indicating de novo synthesis of microbial lipids. Especially C16:1�5c
showed a high carbon uptake with �13C +225‰ (BS), +836‰ (HR) and +614‰ (GF).
Other highly labeled compounds were cyC17:0�5,6, C14:0, C16:1�7c and C16:1�7c. In the control
experiment without methane, the incorporation of 13C-label was orders of magnitudes lower
121
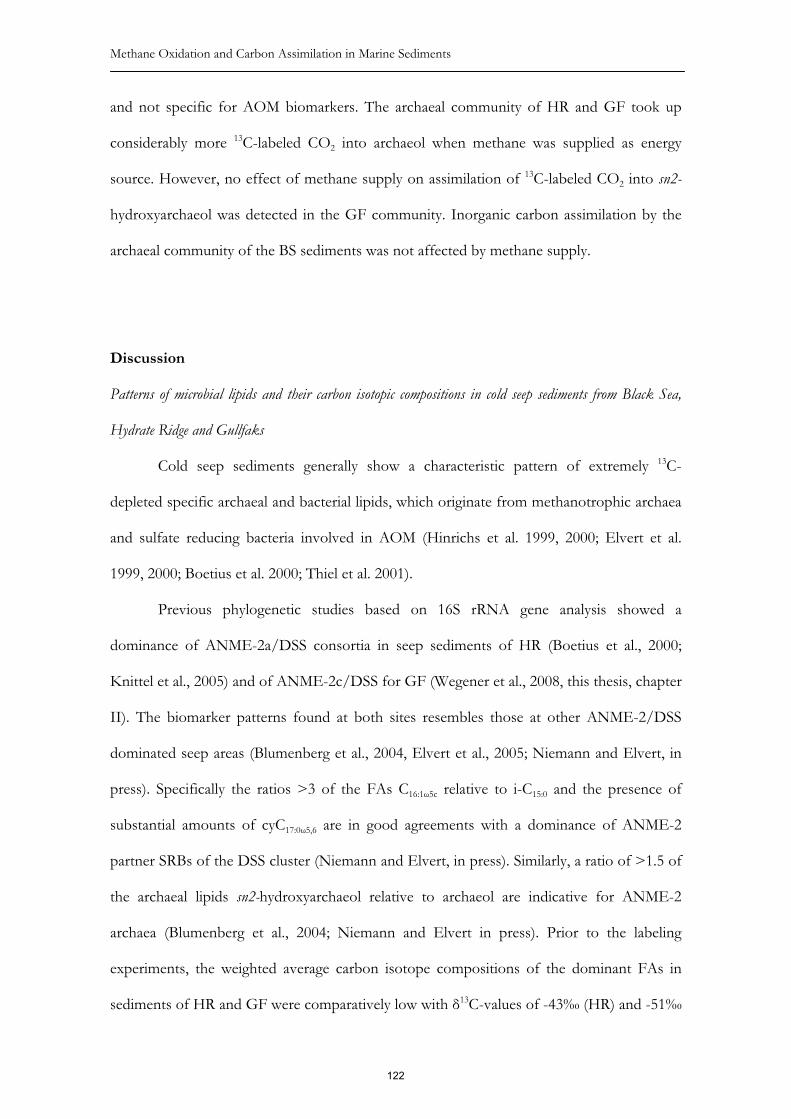
Methane Oxidation and Carbon Assimilation in Marine Sediments and not specific for AOM biomarkers. The archaeal community of HR and GF took up
considerably more 13C-labeled CO2 into archaeol when methane was supplied as energy
source. However, no effect of methane supply on assimilation of 13C-labeled CO2 into sn2-
hydroxyarchaeol was detected in the GF community. Inorganic carbon assimilation by the
archaeal community of the BS sediments was not affected by methane supply.
Discussion
Patterns of microbial lipids and their carbon isotopic compositions in cold seep sediments from Black Sea,
Hydrate Ridge and Gullfaks
Cold seep sediments generally show a characteristic pattern of extremely 13C-
depleted specific archaeal and bacterial lipids, which originate from methanotrophic archaea
and sulfate reducing bacteria involved in AOM (Hinrichs et al. 1999, 2000; Elvert et al.
1999, 2000; Boetius et al. 2000; Thiel et al. 2001).
Previous phylogenetic studies based on 16S rRNA gene analysis showed a
dominance of ANME-2a/DSS consortia in seep sediments of HR (Boetius et al., 2000;
Knittel et al., 2005) and of ANME-2c/DSS for GF (Wegener et al., 2008, this thesis, chapter
II). The biomarker patterns found at both sites resembles those at other ANME-2/DSS
dominated seep areas (Blumenberg et al., 2004, Elvert et al., 2005; Niemann and Elvert, in
press). Specifically the ratios >3 of the FAs C16:1�5c relative to i-C15:0 and the presence of
substantial amounts of cyC17:0�5,6 are in good agreements with a dominance of ANME-2
partner SRBs of the DSS cluster (Niemann and Elvert, in press). Similarly, a ratio of >1.5 of
the archaeal lipids sn2-hydroxyarchaeol relative to archaeol are indicative for ANME-2
archaea (Blumenberg et al., 2004; Niemann and Elvert in press). Prior to the labeling
experiments, the weighted average carbon isotope compositions of the dominant FAs in
sediments of HR and GF were comparatively low with �13C-values of -43‰ (HR) and -51‰
122

Chapter IV: Methane and Inorganic Carbon Assimilation in Anaerobic Methanotrophy
(GF). Typical biomarkers of bacteria associated with AOM communities such as the FAs i-
C15:0, ai-C15:0, C16:1�5 and cyC17:0�5,6 as well as the archaeal compounds archaeol and sn2-
hydroxyarchaeol showed highly depleted �13C-values (Tab. 1). Also more common lipids
such as the ubiquitous FAs C16:1�7c and C18:1�7c showed relatively negative �13C-values,
indicating a substantial uptake of methane-derived carbon by the microbial community.
The BS biomarker pattern strongly deviated from that of the other two sites.
Saturated fatty acids like C16:0, C14:0 and C18:0 accounted for almost 70% of the extracted fatty
acids. Monounsaturated fatty acids represent only about 20% of the fatty acid fraction. The
Seep-SRB specific FAs a- and ai-C15:0 for C16:1�5c and cyC17:0�5,6 account for 0% of the total
FAs analyzed. With a weighted mean FA �13C-value of -32‰, the FA fraction was only
slightly depleted compared to marine non-seep FAs. The sediments of the Dniepr cold
seeps used here showed a higher proportion of ANME-2 over ANME-1, and a large ratio of
diverse unidentified bacteria (Arnds, unpublished data). A comparably high contribution of
ANME-2 and associated SRB partner is also reflected in the biomarker pattern as shown by
high rations of sn2-hydroxyarchaeol relative to archaeol (1.8) and the presence of substantial
amounts of cyC17:0�5,6. (Blumenberg et al., 2004; Niemann and Elvert, in press).
Carbon assimilation by microorganisms performing AOM
The very low �13C-values of lipids from archaea and SRB involved in AOM have
been explained by the assimilation of 13C-depleted methane carbon associated with a strong
carbon isotopic fractionation during methane uptake into biomass (Hinrichs et al., 1999;
Elvert et al. 1999; Pancost et al. 2000; Thiel et al. 2001; Orphan et al., 2001a). Archaeol and
hydroxyarchaeol of anaerobic methanotrophs are depleted in 13C by around -50‰ relative to
methane as carbon source (Hinrichs and Boetius, 2002; Niemann and Elvert, in press).
Similar isotopic relationships were found for the investigated microbial communities from
HR and GF (Table. 1; �13C-CH4 at HR -64.5‰ to -67.5‰ (Kastner et al., 1998); �13C-CH4 at
123

Methane Oxidation and Carbon Assimilation in Marine Sediments GF: -73.9‰ (Hovland, 2007)). Assuming an archaeal biomass composition of C4H8O2N
(Harder and van Dijken, 1975), Nauhaus et al. (2007) suggested an approximately equal
incorporation of methane and CO2 by archaeal methanotrophs, simply because microbial
biomass is more oxidized relative to methane according to eq. 3.
(3). � HOHNOHCNHCOCH 814881517 2284424
The observed change in the isotopic composition by labeling both carbon sources,
methane and inorganic carbon, could be explained by the stoichiometry shown in this
formula. Additionally an assimilation of both carbon sources would reduce the energy
demands of CO2 reduction, which would be in particular favorable for ANMEs as they
operate at minimal energy yields (Hoehler et al., 1994). However, it is also possible that the
ANME assimilate only CO2 similar to the phylogenetically related autotrophic methanogens
(Sprott, 1993). Although our flow-through setup effectively dilutes 13C-labeled bicarbonate
produced from 13C-methane oxidation, the oxidation of methane and the assimilation of
methane-derived CO2 could be coupled within the cell.
Like their archaeal partners, SRB involved in AOM have strongly depleted lipid
biomarkers (Table 1), suggesting that they directly assimilate methane or indirectly as a
methane-derived carbon intermediate. Hinrichs and Boetius (2002) pointed out that specific
archaeal and bacterial lipid biomarker show relatively constant isotopic offsets to methane
and porewater DIC, suggesting autotrophic carbon fixation as possible explanation for the
carbon isotopic difference between archaeal and SRB biomarker lipids. Published �13C-
values of seep porewater DIC are rare, however the isotope compositions of authigenic
carbonates corresponds to the isotopic composition of pore water DIC while precipitation.
The offset between carbonate precipitates and the biomass or lipid biomarker of the SEEP-
SRBs is about -40 to -50‰ (Hinrichs et al., 2000; Orphan et al., 2002; Hinrichs and Boetius,
2002), which is in agreement with carbon fractionation by autotrophic SRB using the acetyl-
124

Chapter IV: Methane and Inorganic Carbon Assimilation in Anaerobic Methanotrophy
CoA-carbon monoxide dehydrogenase pathway (Preuß et al. 1989; Londry and Des Marais,
2003; Londry et al., 2004). Our data from stable isotope probing using 13C-labelled methane
and bicarbonate confirm that CO2 is the main carbon source of the partner SRB involved in
AOM and that direct methane uptake or uptake of methane-derived organic intermediates is
not significant in lipid biosynthesis of syntrophic SRB involved in AOM.
Carbon assimilation efficiency of methanotrophic communities
As indicated above, we can assume an autotrophic CO2 uptake by the partner SRB
and a mixed uptake of methane and CO2 by the methanotrophic archaea. Hence, we can use
carbon isotope compositional changes of lipid biomarkers to calculate yield and growth
efficiency of the methanotrophic communities according to eq. 2.
For the relation between specific lipid biomarker and cell biomass, we used data
from a two-year pressure incubation with HR sediments by Nauhaus et al. (2007). During
their experiment, a yield of 23 mg C of consortia biomass corresponded to a yield of 0.7 mg
of the FA C16:1w5c. For our HR sediment incubations of 176 days with labeled bicarbonate,
we calculated an increase of 0.13 μg C16:1�5c per gram sediment. Using the biomass/lipid
ratios from Nauhaus et al. (2007), this corresponds to an increase in methanotrophic
consortia biomass of 4.1 mg C gdw-1. A similar calculation resulted in values of 0.5 for C14:0,
0.3 for archaeol, and 1.3 μmol C gdw-1 for hydroxyarchaeol, as carbon biomass yield of the
methanotrophic community. Similarly, we calculated carbon incorporation yields between
0.1 and 1.4 for BS and 0.1 to 1.1 μmol gdw-1 for GF inoculate. These estimates have to be
considered as rough approximations, as lipid/biomass ratio may be variable across different
populations and environmental conditions.
During six months of incubation of HR sediments, 60 μmol C gdw-1 of methane
were oxidized, of which, based on the yield of C16:1�5c, 0.4 μmol C gdw-1 were assimilated
into biomass, corresponding to a carbon assimilation efficiency of 0.6%. This value is
125

Methane Oxidation and Carbon Assimilation in Marine Sediments slightly lower than that found by Nauhaus et al. (2007). The higher methane pressure
applied by these authors has likely resulted in higher growth yields due to more favorable
thermodynamic conditions. Using the same approach, we calculated a carbon uptake
efficiency of 1.3% for GF and only 0.3% for the BS inoculate. As previously suggested (e.g.,
Bian et al. 2001), the remarkably low growth rate and carbon assimilation efficiency of
ANMEs and their syntrophic partners likely reflects the low energy yield of AOM, especially
when considering the high energy demand of autotrophic growth.
Metabolic relations between methanotrophic archaea and sulfate reducing bacteria
Previous studies combining lipid biomarker analyses and microscopy suggested a
syntrophic interaction between the archaeal methanotrophs and the SRB (Boetius et al.,
2000; Orphan et al. 2001a; Niemann et al., 2006; Nauhaus et al. 2007). No known cultivated
sulfate reducing bacteria or sulfate reducing archaea (i.e., Archaeoglobus fulgidus) are capable of
using methane as sole electron donor. The coupling of methane oxidation to sulfate
reduction likely involves a transfer of electrons from methanotrophic archaea to SRB. Here
we found evidence for an AOM-dependent uptake of inorganic carbon into fatty acids of
partner SRB. In contrast, we found no evidence of a significant assimilation of methane, or
a direct intermediate thereof, by the SRB. This finding excludes methane-derived
intermediates such as formate, acetate, methanol, or methylamines as carbon source, as well
as heterotrophic growth on ANME biomass. However, our experiments do not exclude that
these potential intermediates are used as energy sources, although it seems unlikely that such
intermediates would only serve in catabolic and not in anabolic processes. As an energy
source for the energetically expensive autotrophic fixation of CO2, an electron transfer by
membrane bound redox shuttles or a potential transduction via cytochromes seems most
likely. Hydrogen transfer was previously excluded by other physiological experiments
(Nauhaus et al. 2002; 2005; Moran et al., 2008). Based on chemical equilibrium calculations,
126

Chapter IV: Methane and Inorganic Carbon Assimilation in Anaerobic Methanotrophy
Widdel and Rabus (2001) postulated an electric potential for electron shuttles of -0.25 to -
0.29 Volts. They proposed potential candidates such as the cofactor methanophenazine
(estimated mid-point potential close to -0.255 V). The direct transport via cell membrane
connections would avoid the diffusion loss of electron acceptors. Electron transfer from
cells to solid minerals is known from iron reducing bacteria such as Geobacter (Bond et al.,
2002; Bond and Lovley, 2003). These organisms use cell membrane cytochromes and
nanowires to connect between cell and mineral (Mehta et al., 2005). Similar mechanisms
may be used in the coupling of methane oxidation and sulfate reduction. Experiments using
electrodes as alternatively electron acceptor might be promising in examining the metabolic
connection within the AOM consortia.
Conclusions:
Anaerobic methanotrophic communities from three different cold seep sites
incorporated methane-derived carbon into lipid membranes, when provided with methane
as the sole energy source. We estimated that 0.25-1.3% of the total methane oxidized was
assimilated into bulk methanotrophic biomass. Archaeal lipids showed a direct uptake of
13C-labeled methane in a 1:1 ratio to CO2. In the presence of methane as sole energy source,
fatty acids from the syntrophic SRB were labeled with 13CO2 but not with 13C-methane,
indicating an autotrophic life style of the SRB. We did not find evidence for a direct uptake
of methane-derived carbon by SRB. This supports previous hypotheses of an electron
transfer via redox active electron shuttles between the archaeal and bacterial partners in
AOM.
127

Methane Oxidation and Carbon Assimilation in Marine Sediments Experimental procedures
Set up of flow through reactors
Preincubated sediment slurries from three different cold seep habitats, namely BS
(1), HR (2) and GF (3) (for details, see Table 3) were used in the flow-through incubations.
The BS sediment was sampled with the submersible JAGO in the vicinity of an active
carbonate chimney. The sediments from HR as well as GF were retrieved by multiple corer
sampling from
Table. 3: Origin and characterization of the inoculated seep sediments from the Black Sea, Hydrate Ridge and Gullfaks oil field.
Black Sea Hydrate Ridge Gullfaks
Expedition R/V Poseidon Pos217/3
R/V Sonne cruise SO165-2
R/V Heincke HE208
Sampling 2004 2002 2004
Location 44°46.413’ N 031°58.201’ E
44°34.203' N 125°08.771’ W
61°28.860' N 002°40.500' E
Area Dniepr NE-Pacific Northern North Sea
Water depth 326m 776m 150m
Sediment type clay with authigenic carbonates clay medium grained
sand Methanotrophic community Mixed ANME-1/2 ANME-2a
dominated ANME-2c dominated
Reference Arnds (unpublished) Knittel et al., 2005 Wegener et al.,
2008
mats of thiotrophic bacteria (Beggiatoa sp.). All three seep habitats were sulfide rich (>5 mM)
and characterized by high methane-driven sulfate reduction. The clayish sediments from the
BS were not covered by thiotrophic mats because bottom waters of the BS are devoid of O2
and NO3- (Murray et al., 1991).
Sediment samples from three different seep habitats were transferred to Duran
bottles and kept under an anoxic methane atmosphere on a rolling table at temperatures of
4°C until use in flow through incubations. All processing of sediment slurries was
performed in an anaerobic glove box to avoid contact with oxygen. The columns were filled
128

Chapter IV: Methane and Inorganic Carbon Assimilation in Anaerobic Methanotrophy
with sediment slurries diluted ~ 1:2 with sulfate reducer medium (Widdel and Bak, 1992),
except for the coarse sandy sediments from GF which were used at in situ density.
A semi-continuous flow-through system was set up according to Figure 3. Sediment
slurries were filled in glass cylinders onto glass frits. Columns were filled completely with
anaerobic seawater medium (0.5 mM H2S, 28 mM SO42- and 30 mM HCO3
-, enriched with
sulfate reducer vitamins, rare elements; according to Widdel and Bak, 1992). Anaerobic
medium was used for the circulation between reservoirs and replicate sediment columns.
This setup preserved stable conditions and ensured the dilution of reaction products,
primarily methane based bicarbonate, in a large DIC pool. For the methane enrichment, the
headspace of the reservoir was filled with 0.15 MPa methane:CO2 mixture (96:4), keeping a
Figure 3. Simplified flow-through setup used for the carbon incorporation experiments with the sediment column (left) supplied with circulating medium from a reservoir (right).
methane concentration of about 2mM in the column inflow and a pH of 7.2. Gas-tight
material (Viton®, DuPont Performance Elastomers, Willmington, US; and Tygon® HC,
Saint-Gobain Performance Plastics Corporation, Akron, US) was used for all tubing to
avoid contamination with oxygen or a loss of methane or CO2. Resazurin (NaC12H6NO4)
was added to the medium as oxygen indicator. Metabolic activity was measured as changes
129

Methane Oxidation and Carbon Assimilation in Marine Sediments in the methane and sulfide concentrations of the in- and outflowing medium, respectively.
Methane concentrations were measured from NaOH fixed water samples (0.5 ml) by gas
chromatography (Hewlett Packard, 5890A with flame ionization detector, details Treude et
al., 2003). Sulfide was determined using copper sulfate method from 0.1 ml triplicates
(Cord-Ruwisch, 1985).
Labeling with 13C-methane and -bicarbonate
Two replicate flow-through columns were set up from each of the three sediment
slurries. In one experiment, the inorganic carbon pool of the reservoir medium was labeled
with 11% 13C-bicarbonate (calculated �13C ~+10000‰). In the other experiment, the
methane atmosphere of the reservoir headspace was labeled with about 12% 13C-methane
(�13C ~+11000‰; measured on GC-IRMS - Thermo Finnigan, Delta V Advantage). The
flow through columns of both experiments were subsampled three times within a time span
of 176 (�13C-HCO3- incubations) and 159 days (�13C-methane incubations) for lipid
biomarker analyses. The loss of sediment in each column due to subsampling (~ 8 g / 20g
dry weight per sampling) was taken into account in the calculation of metabolic activities.
As a control experiment, the assimilation of 13CO2 was compared in a batch incubation
of a subsample of the three sediment slurries with 10% 13C-labeled bicarbonate in the total
bicarbonate pool and in the presence of methane (0.25 MPa ~ 3.1 mM) or N2/CO2 in the
headspace of the reaction vessels. The experiment was carried out incubating duplicates of 7
g (BS and HR) and 20 g sediment (GF) dry weight in 100 ml of sulfate reducer medium
(Widdel and Bak, 1992) in 250-ml Duran bottles filled closed with butyl stoppers.
Extraction and derivatization of lipids
Lipid extraction was carried out according to previously described methods (Elvert
et al., 2003; Niemann et al., 2005). Briefly, total lipid extracts (TLE) were obtained by
130

Chapter IV: Methane and Inorganic Carbon Assimilation in Anaerobic Methanotrophy
suspending and sonicating wet sediments in organic solvents of decreasing polarity. Internal
standards (n-nonadecanol and n-nonadecanoic acid) of known concentration and carbon
isotopic composition were added prior to extraction. TLEs were saponified with methanolic
KOH-solution (6%). After extraction of the neutral fraction from this mixture, FAs were
methylated using BF3 (14%) in methanol, yielding fatty acid methyl esters (FAMEs). Double
bound positions of monoeoic FAs were determined by analyzing the dimethyl disulfide
(DMDS) adducts of FAs according to a previous published method (Moss and Lambert-
Fair, 1989).
Lipid analyses
FAs and archaeal glycerol diethers were quantified by gas chromatography-flame
ionization detection (GC-FID), identified by gas chromatography-mass spectrometry (GC-
MS, ThermoFinnigan, San Jose, CA), and their stable carbon isotopic compositions were
determined by gas chromatography-combustion isotope ratio mass spectrometry (GC-
IRMS). Instrument specifications and operation modes of the GC-FID and GC-MS systems
can be found in Elvert et al. (2003) with modifications made by Niemann et al. (2006). For
GC-IRMS measurements, a Finnigan Delta plus IRMS was used, connected via a Finnigan
Combustion Interface III to a HP 6890 Series GC, equipped with a VF-5ms column (30 m,
ID 0.25mm, film thickness 0.25 μm; Varian, Palo Alto, US). Selected samples were
measured twice to control reproducibility. Standard deviations for replicate lipid analysis
were on average 10%. Stable carbon isotope ratios of lipid compounds are given in the �-
notation against Vienna PeeDee Belemnite (V-PDB) with a precision of 1‰.
Acknowledgements
We thank the shipboard crews and scientific parties of the expeditions Pos 217/3, SO
165-2 and HE 208 for help with work at sea. Special thanks go to Tina Treude and Nina
131

Methane Oxidation and Carbon Assimilation in Marine Sediments Knab for providing the samples from HR and BS, and Christian Deusner and his students
for maintaining active sediment slurries. We thank Marcel Kuypers, Gaute Lavik,
Gabriele Klockgether and Xavier Prieto for support with the organic geochemistry
analyses in the MPI and RCOM labs. This study was supported by the DFG research
center RCOM (Research Center Ocean Margins) and the Max Planck Society, by the 5th
EU framework project METROL (EVK-3-CT-2002-00080) and the R&D-Program
GEOTECHNOLOGIEN project MUMM II (03G0608C) funded by the German Ministry
of Education and Research (BMBF) and German Research Foundation (DFG). This is
publication RCOM publication No. XX.
References Bian, L., Hinrichs, K.-U., Xie, T., Brassell, S.C., Iversen, N., Fossing, H. et al. (2001) Algal
and archaeal polyisoprenoids in a recent marine sediment: Molecular isotopic evidence for anaerobic oxidation of methane, Geochem Geophys Geosyst 2(1).
Blumenberg, M., Seifert, R., Nauhaus, K., Pape, T. and Michaelis, W. (2005) In vitro study of lipid Biosynthesis in an anaerobically methane-oxidizing microbial mat. Appl Environ Microb 71: 4345-4351.
Blumenberg, M., Seifert, R., Reitner, J., Pape, T., and Michaelis, W. (2004) Membrane lipid patterns typify distinct anaerobic methanotrophic consortia. Proc Natl Acad Sci 101: 11111-11116.
Boetius, A., Ravenschlag, K., Schubert, C.J., Rickert, D., Widdel, F., Gieseke, A. et al. (2000) A marine microbial consortium apparently mediating anaerobic oxidation of methane. Nature 407: 623-626.
Bond, D.R. and Lovley, D.R. (2003) Electricity production by Geobacter sulfurreducens attached to electrodes. Appl Environ Microb 69: 1548-1555.
Bond, D.R., Holmes, D.E., Tender, L.M., and Lovley, D.R. (2002) Electrode-reducing microorganisms that harvest energy from marine sediments. Science 295: 483-485.
Cord-Ruwisch, R. (1985) A quick method for the determination of dissolved and precipitated sulfides in cultures of sulfate-reducing bacteria. J Microbiol Meth 4(1): 33-36.
Elvert, M., Hopmans, E.C., Treude, T., Boetius, A., Suess, E., (2005). Spatial variations of methanotrophic consortia at cold methane seeps: implications from a high-resolution molecular and isotopic approach. Geobiology 3: 195-209.
Elvert, M., Boetius, A., Knittel, K., and Jørgensen, B.B. (2003) Characterization of Specific membrane fatty acids as chemotaxonomic markers for sulfate-reducing bacteria involved in anaerobic oxidation of methane. Geomicrobiol J 20: 403-419.
132

Chapter IV: Methane and Inorganic Carbon Assimilation in Anaerobic Methanotrophy
Elvert, M., Suess, E. and Whiticar, M.J. (1999) Anaerobic methane oxidation associated with marine gas hydrates: superlight C-isotopes from saturated and unsaturated C 20 and C 25 irregular isoprenoids. Naturwissenschaften 86(6): 295-300.
Elvert, M., Suess, E., Greinert, J., and Whiticar, M.J. (2000) Archaea mediating anaerobic methane oxidation in deep-sea sediments at cold seeps of the eastern Aleutian subduction zone Org Geochem 31(11): 1175-1187.
Girguis, P.R., Cozen, A.E. and DeLong, E.F. (2005) Growth and Population Dynamics of anaerobic methane-oxidizing archaea and sulfate-reducing bacteria in a continuous-flow bioreactor. Appl Environ Microb 71(7): 3725-3733.
Girguis, P.R., Orphan, V., Hallam, S. and DeLong, E.F. (2003) Growth and Methane oxidation rates of anaerobic methanotrophic archaea in a continuous-flow bioreactor. Appl Environ Microb 69(9): 5472-5482.
Harder, W., and van Dijken, J.P. (1975) Theoretical considerations on the relation between energy production and growth of methane-utilizing bacteria. In Microbial Production and Utilization of Gases. Schlegel, H.G., Gottschalk, G., and Pfennig, N. (eds). Göttingen, Germany: Goltze, p. 403–418.
Hinrichs, K.-U. and Boetius, A. (2002) The anaerobic oxidation of methane: New insights in microbial ecology and biogeochemistry. In Ocean Margin Systems. Wefer, G., Billett, D., Hebbeln, D., Jørgensen, B.B., Schlüter, M., and van Weering, T. (eds). Berlin Heidelberg: Springer-Verlag, pp. 457-477.
Hinrichs, K.-U., Hayes, J.M., Silva, S.P., Brewer, P.G., and DeLong, E.F. (1999) Methane-consuming archaebacteria in marine sediments. Nature 398: 802-805.
Hinrichs, K.-U., Summons, R.E., Orphan, V., Sylva, S.P., and Hayes, J.M. (2000) Molecular and isotopic analysis of anaerobic methane-oxidizing communities in marine sediments. Org Geochem 31: 1685-1701.
Hoehler, T.M., Alperin, M.J., Albert, D.B. and Martens, C.S. (1994) Field and laboratory studies of methane oxidation in an anoxic marine sediment: Evidence for a methanogen-sulfate reducer consortium. Global Biogeochem Cycles 8(4): 451-464.
Iversen, N., and Jorgensen, B.B. (1985) Anaerobic methane oxidation rates at the sulfate-methane transition in marine sediments from Kattegat and Skagerrak (Denmark). Limnol Oceanogr 30: 944-955.
Judd, A. G., Hovland, M., Dimitrov, L. I., Garcia Gil, S. and Jukes V. (2002) The geological methane budget at Continental Margins and its influence on climate change. Geofluids 2(2), 109-126.
Kastner, M., Kvenvolden, K.A. and Lorenson, T.D. (1998) Chemistry, isotopic composition and origin of a methane-hydrogen sulfide hydrate at the Cascadia subduction zone. Earth Planet Sc Lett 156(3-4): 173-183,
Knittel, K., Boetius, A., Lemke, A., Eilers, H., Lochte, K., Pfannkuche, O. et al. (2003) Activity, distribution, and diversity of sulfate reducers and other bacteria in sediments above gas hydrate (Cascadia margin, Oregon). Geomicrobiol J 20: 269-294
Knittel, K., Lösekann, T., Boetius, A., Kort, R., and Amann, R. (2005) Diversity and distribution of methanotrophic archaea at cold seeps. Appl Environ Microb 71: 467-479..
Londry, K.L., and Des Marais, D.J. (2003) Stable carbon isotope fractionation by sulfate-reducing bacteria. Appl Environ Microb 69: 2942-2949.
133

Methane Oxidation and Carbon Assimilation in Marine Sediments Londry, K.L., Jahnke, L.L. and Des Marais, D.J. (2004) Stable carbon isotope Ratios of lipid
biomarkers of sulfate-reducing bacteria. Appl Environ Microb 70: 745-751.
Lösekann, T., Knittel, K., Nadalig, T., Fuchs, B., Niemann, H., Boetius, A. and Amann, R. (2007) Diversity and abundance of aerobic and anaerobic methane oxidizers at the Haakon Mosby Mud Volcano, Barents Sea. Appl Environ Microb 73: 3348-3362.
Martens, C.S. and Berner, R.A. (1974) Methane production in the interstitial waters of sulfate-depleted marine sediments. Science 185: 1167 - 1169.
Mehta, T., Coppi, M.V., Childers, S.E. and Lovley, D.R. (2005) Outer Membrane c-Type Cytochromes Required for Fe(III) and Mn(IV) Oxide Reduction in Geobacter sulfurreducens. Appl Environ Microb 71: 8634-8641.
Michaelis, W., Seifert, R., Nauhaus, K., Treude, T., Thiel, V., Blumenberg, M. et al. (2002) Microbial reefs in the Black Sea fueled by anaerobic oxidation of methane. Science 297: 1013-1015.
Moran, J.J., Beal, E.J., Vrentas, J.M., Orphan, V.J., Freeman, K.H. and House, C.H. (2008) Methyl sulfides as intermediates in the anaerobic oxidation of methane. Environ Microbiol 10(1): 162-173.
Moss, C.W. and Lambert-Fair, M.A. (1989) Location of double bonds in monounsaturated fatty acids of Campylobacter cryaerophila with dimethyl disulfide derivatives and combined gas chromatography-mass spectrometry. J Clin Microbiol 27: 1467-1470.
Murray, J.W., Top, Z. and Ozsoy, E. (1991) Hydrographic Properties and Ventilation of the Black Sea. Deep-Sea Res DESRAY 38: 663-S689.
Nauhaus, K., Albrecht, M., Elvert, M., Boetius, A., and Widdel, F. (2007) In vitro cell growth of marine archaeal-bacterial consortia during anaerobic oxidation of methane with sulfate. Environ Microbiol 9(1): 187-196.
Nauhaus, K., Boetius, A., Krüger, M., and Widdel, F. (2002) In vitro demonstration of anaerobic oxidation of methane coupled to sulphate reduction in sediments from a marine gas hydrate area. Environ Microbiol 4(5): 296-305.
Nauhaus, K., Treude, T., Boetius, A. and Krüger, M. (2005) Environmental regulation of the anaerobic oxidation of methane: a comparison of ANME-I and ANME-II communities. Environ Microbiol 7(1): 98-106.
Niemann, H., and Elvert, M. (in press) Diagnostic lipid biomarker and stable carbon isotope signatures of microbial communities mediating the anaerobic oxidation of methane with sulphate. Organic Geochemistry, doi: 10.1016/j.orggeochem.2007.11.006
Niemann, H., Elvert, M., Hovland, M., Orcutt, B., Judd, A., Suck, I. et al. (2005) Methane emission and consumption at a North Sea gas seep (Tommeliten area). Biogeosciences 2: 335-351.
Niemann, H., Lösekann, T., de Beer, D., Elvert, M., Nadalig, T., Knittel, K. et al. (2006) Novel microbial communities of the Haakon Mosby mud volcano and their role as a methane sink. Nature 443: 854-858.
Orcutt, B., Boetius, A., Elvert, M., Samarkin, V. and Joye, S.B. (2005) Molecular biogeochemistry of sulfate reduction, methanogenesis and the anaerobic oxidation of methane at Gulf of Mexico cold seeps. Geochim Cosmochim Ac 69: 4267-4281.
134

Chapter IV: Methane and Inorganic Carbon Assimilation in Anaerobic Methanotrophy
Orphan, V.J., Hinrichs, K.-U., Ussler, W., III, Paull, C.K., Taylor, L.T., Sylva, S.P. et al. (2001b) Comparative analysis of methane-oxidizing archaea and sulfate-reducing bacteria in anoxic marine sediments. Appl Environ Microb 67: 1922-1934.
Orphan, V.J., House, C.H., Hinrichs, K.-U., McKeegan, K.D., and DeLong, E.F. (2001a) Methane-Consuming Archaea Revealed by Directly Coupled Isotopic and Phylogenetic Analysis. Science 293: 484-487.
Orphan, V.J., House, C.H., Hinrichs, K.-U., McKeegan, K.D., and DeLong, E.F. (2002) Multiple archaeal groups mediate methane oxidation in anoxic cold seep sediments. Proc Natl Acad Sci 99(11): 7663-7668.
Pancost, R., Damsté, J., de Lint, S., van der Maarel, M. and Gottschal, J. (2000) Biomarker evidence for widespread anaerobic methane oxidation in Mediterranean sediments by a consortium of methanogenic archaea and bacteria. Appl Environ Microb 66(3): 1126.
Preuß, A., Schauder, R. and Fuchs, G. (1989) Carbon isotope fractionation by autotrophic bacteria with three different CO2 fixation pathways. Z. Naturforsch. C 44, 397-402.
Reeburgh, W.S. (1976) Methane consumption in Cariaco Trench waters and sediments. Earth Planet Sc Lett 28(3): 337-344.
Reeburgh, W. (2007) Oceanic methane biogeochemistry. Chem Rev 107: 486-513.
Sprott, G., Ekiel, I. and Patel, G. (1993) Metabolic pathways in Methanococcus jannaschii and other methanogenic bacteria. Appl Environ Microb 59(4): 1092-1098.
Stadnitskaia, A., Muyzer, G., Abbas, B. Coolen, M.J.L., opmans, E.C, Baas, M. et al. (2005) Biomarker and 16S rDNA evidence for anaerobic oxidation of methane and related carbonate precipitation in deep-sea mud volcanoes of the Sorokin Trough, Black Sea. Mar Geol 217 (1-2):67-96.
Teske, A., Hinrichs, K.U., Edgcomb, V., de Vera Gomez, A.., Kysela, D., Sylva, S.P. et al., (2002) Microbial diversity of hydrothermal sediments in the Guaymas Basin: evidence for anaerobic methanotrophic communities. Appl Environ Microb 68(4): 1994-2007.
Thiel, V., Peckmann, J., Richnow, H.H., Luth, U., Reitner, J. and Michaelis, W. (2001) Molecular signals for anaerobic methane oxidation in Black Sea seep carbonates and a microbial mat. Mar Chem 79: 97-112.
Treude, T., A. Boetius, Knittel, K., Wallmann, K., Jorgensen, B.B. (2003) Anaerobic oxidation of methane above gas hydrates at Hydrate Ridge, NE Pacific Ocean. Mar Ecol Prog Ser 264: 1-14.
Treude, T., Knittel, K., Blumenberg, M., Seifert, R., and Boetius, A. (2005) Subsurface microbial methanotrophic mats in the Black Sea. Appl Environ Microb 71: 6375-6378.
Wegener, G., Shovitri, M. Knittel, K., Niemann, H. Hovland, M. and Boetius, A. (2008) methane seeps (Northern North Sea) Biogeochemical processes and microbial diversity of the Gullfaks and Tommeliten. Biogeosciences discuss. 5, 971–1015, www.biogeosciences-discuss.net/5/971/2008/.
Widdel, F., and Bak, F. (1992) Gram-negative mesophilic sulfate-reducing bacteria. In The prokaryotes. Balows A, T.H., Dworkin M, Harder W, Schleifer KH (ed). Berlin Heidelberg New York: Springer, pp. 3352-3378.
Widdel, F., and Rabus, R. (2001) Anaerobic biodegradation of saturated and aromatic hydrocarbons. Curr Opin Biotech 12: 259–276.
135

Methane Oxidation and Carbon Assimilation in Marine Sediments
136

Chapter V: Concluding Remarks and Perspectives
Chapter V
Concluding Remarks and Perspectives
Gunter Wegener
137

Methane Oxidation and Carbon Assimilation in Marine Sediments
Conclusions
My doctoral thesis investigated anaerobic oxidation of methane (AOM) with a focus
on the microbial ecology of shallow methane seep habitats, the physiology of AOM and the
determination of carbon sources used by the organisms performing AOM.
In the first research manuscript of this thesis I presented our results on gas
emissions, biogeochemistry and molecular ecology of several seepage areas in the North
Sea, which we studied during 5 research cruises. Prior research on the ecology of methane
rich habitats mainly focused on deep-sea cold seeps, such as Eel River Basin (Hinrichs et al.,
1999; Orphan et al., 2002; Levin, 2005), Hydrate Ridge (Boetius et al., 2000; Knittel et al.,
2003; Knittel et al., 2005) and Haakon Mosby Mud Volcano (Niemann et al., 2006;
Lösekann et al., 2007), or seepage sites in the Gulf of Mexico (Orcutt et al., 2004; Orcutt et
al., 2005). Studies on shallow water seep sites are rare (e.g., Santa Barbara hydrocarbon
seeps (Montagna et al., 1986), and Skagerrak seeps (Dando et al., 1994)).
In the North Sea shallow gas accumulations, mostly sourced by leakage from deep
thermogenic reservoirs, are common. Above several of these shallow gas accumulations we
detected gas flares in the water column. Gas hydrate formation is not possible in the
shallow sea because of low gas solubility at low pressure, therefore, gas flux in the North
Sea seepage sites is due to quickly rising bubbles. Hence, the microbial barrier to methane
loss to hydrosphere is less effective in these areas compared to deep sea seep areas, where
free gas is rare. From rate measurements and bubble stream counts, we estimate that less
than 20% of the rising methane was oxidized within the sediment of Gullfaks. This
methane consumption is even less efficient than that estimated for the Beggiatoa fields of
Haakon Mosby (~40%; Niemann et al., 2006), where methane oxidation efficiency is
reduced by high pore water velocities, which prevent the intrusion of sulfate into the
sediment. This highlights the particular relevance of shallow seep sites to the marine and
global methane budget.
138
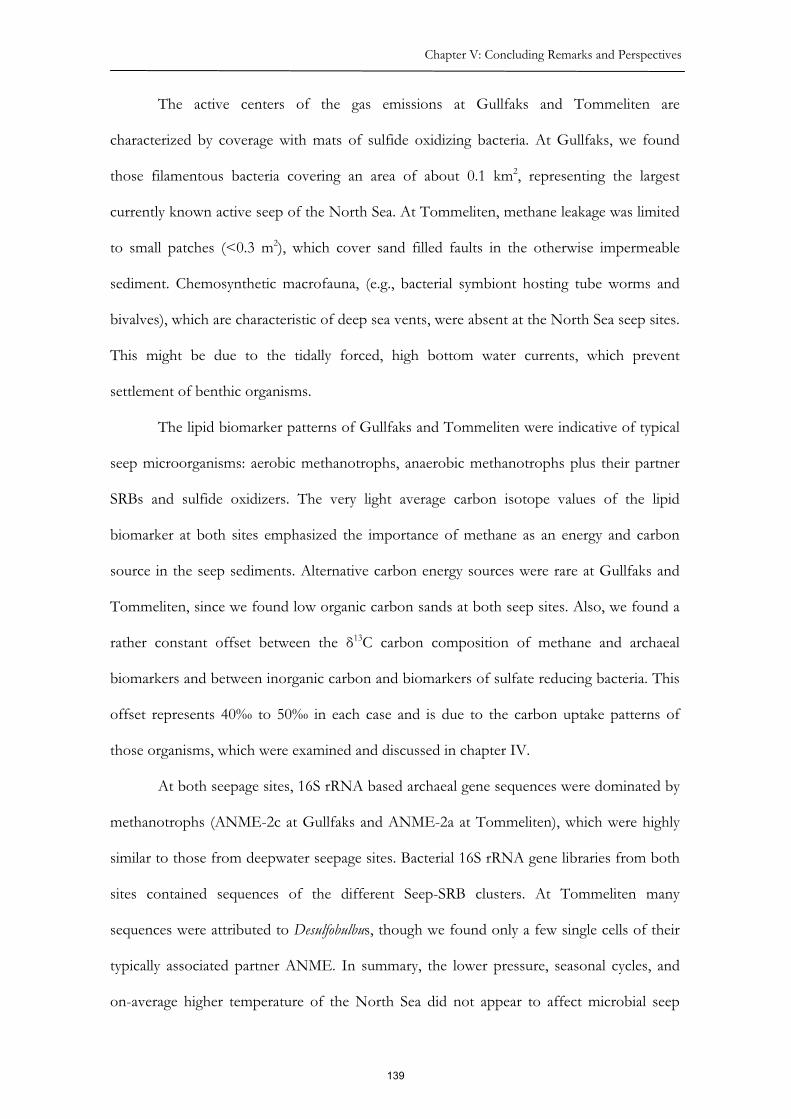
Chapter V: Concluding Remarks and Perspectives
The active centers of the gas emissions at Gullfaks and Tommeliten are
characterized by coverage with mats of sulfide oxidizing bacteria. At Gullfaks, we found
those filamentous bacteria covering an area of about 0.1 km2, representing the largest
currently known active seep of the North Sea. At Tommeliten, methane leakage was limited
to small patches (<0.3 m2), which cover sand filled faults in the otherwise impermeable
sediment. Chemosynthetic macrofauna, (e.g., bacterial symbiont hosting tube worms and
bivalves), which are characteristic of deep sea vents, were absent at the North Sea seep sites.
This might be due to the tidally forced, high bottom water currents, which prevent
settlement of benthic organisms.
The lipid biomarker patterns of Gullfaks and Tommeliten were indicative of typical
seep microorganisms: aerobic methanotrophs, anaerobic methanotrophs plus their partner
SRBs and sulfide oxidizers. The very light average carbon isotope values of the lipid
biomarker at both sites emphasized the importance of methane as an energy and carbon
source in the seep sediments. Alternative carbon energy sources were rare at Gullfaks and
Tommeliten, since we found low organic carbon sands at both seep sites. Also, we found a
rather constant offset between the �13C carbon composition of methane and archaeal
biomarkers and between inorganic carbon and biomarkers of sulfate reducing bacteria. This
offset represents 40‰ to 50‰ in each case and is due to the carbon uptake patterns of
those organisms, which were examined and discussed in chapter IV.
At both seepage sites, 16S rRNA based archaeal gene sequences were dominated by
methanotrophs (ANME-2c at Gullfaks and ANME-2a at Tommeliten), which were highly
similar to those from deepwater seepage sites. Bacterial 16S rRNA gene libraries from both
sites contained sequences of the different Seep-SRB clusters. At Tommeliten many
sequences were attributed to Desulfobulbus, though we found only a few single cells of their
typically associated partner ANME. In summary, the lower pressure, seasonal cycles, and
on-average higher temperature of the North Sea did not appear to affect microbial seep
139
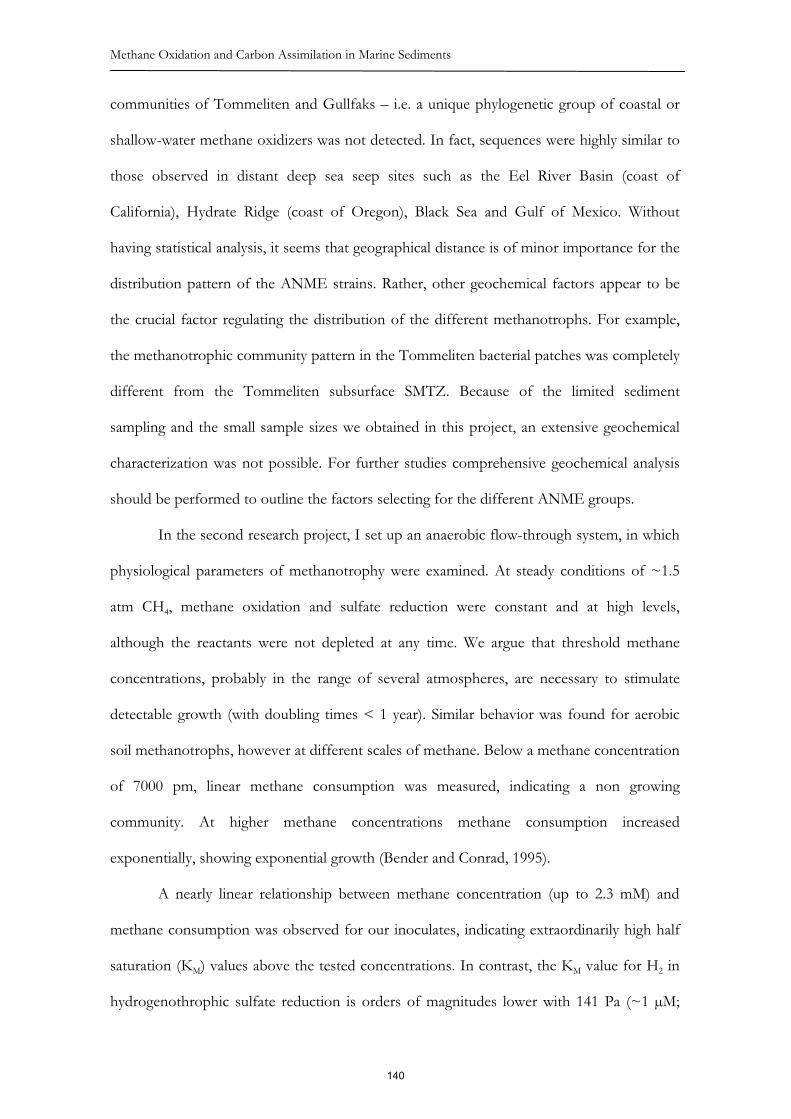
Methane Oxidation and Carbon Assimilation in Marine Sediments
communities of Tommeliten and Gullfaks – i.e. a unique phylogenetic group of coastal or
shallow-water methane oxidizers was not detected. In fact, sequences were highly similar to
those observed in distant deep sea seep sites such as the Eel River Basin (coast of
California), Hydrate Ridge (coast of Oregon), Black Sea and Gulf of Mexico. Without
having statistical analysis, it seems that geographical distance is of minor importance for the
distribution pattern of the ANME strains. Rather, other geochemical factors appear to be
the crucial factor regulating the distribution of the different methanotrophs. For example,
the methanotrophic community pattern in the Tommeliten bacterial patches was completely
different from the Tommeliten subsurface SMTZ. Because of the limited sediment
sampling and the small sample sizes we obtained in this project, an extensive geochemical
characterization was not possible. For further studies comprehensive geochemical analysis
should be performed to outline the factors selecting for the different ANME groups.
In the second research project, I set up an anaerobic flow-through system, in which
physiological parameters of methanotrophy were examined. At steady conditions of ~1.5
atm CH4, methane oxidation and sulfate reduction were constant and at high levels,
although the reactants were not depleted at any time. We argue that threshold methane
concentrations, probably in the range of several atmospheres, are necessary to stimulate
detectable growth (with doubling times < 1 year). Similar behavior was found for aerobic
soil methanotrophs, however at different scales of methane. Below a methane concentration
of 7000 pm, linear methane consumption was measured, indicating a non growing
community. At higher methane concentrations methane consumption increased
exponentially, showing exponential growth (Bender and Conrad, 1995).
A nearly linear relationship between methane concentration (up to 2.3 mM) and
methane consumption was observed for our inoculates, indicating extraordinarily high half
saturation (KM) values above the tested concentrations. In contrast, the KM value for H2 in
hydrogenothrophic sulfate reduction is orders of magnitudes lower with 141 Pa (~1 μM;
140
Chapter V: Concluding Remarks and Perspectives
Lovley et al., 1982). The high KM values are due to enzymes catalysis of methane activation.
These enzymes are very similar to those which efficiently catalyze the final step of
methanogenesis (Krüger et al., 2003). Hence, catalyses with this enzyme package in the
reverse direction must be of restricted efficiency.
Future growth and half saturation experiments should be performed over wide
methane ranges (the upper limit is determined by gas hydrate stability) to cover
environmentally possible conditions. Recently, a high pressure flow-through setup was
developed which successfully reproduced high methane consumption rates (Deusner,
unpublished). This setup combines the advantages of large methane pressure ranges with
constant low AOM product concentrations. Further kinetic studies, especially those
examining the KM values of methane should be performed using this setup. Preferentially,
enrichments with a clear dominance of a single ANME strain should be tested, since
different strains have shown different growth characteristics (Holler, unpublished).
In the third research project we focused on the role of methane and CO2 as carbon
sources for microorganisms performing AOM. With a combination of stable isotope
probing and lipid biomarker isotope analyses, even low-level carbon assimilation into
biomass was detectable. This was necessary as prior growth experiments indicated
extremely low carbon assimilation rates during AOM (Girguis et al., 2003, 2005; Niemann et
al., 2006).
We inoculated sediments from three well-described seep areas (Hydrate Ridge,
Black Sea, Gullfaks) with 13C labeled methane or 13C labeled bicarbonate for approx. 6
months. For all inoculates we observed that lipids attributed to sulfate reducing bacteria
were almost exclusively labeled by inorganic carbon. In an additional experiment we showed
clearly that the inorganic carbon fixation by the SRB is strictly methane oxidation
dependent. In contrast, methanotrophic archaea showed similar carbon assimilation from
141

Methane Oxidation and Carbon Assimilation in Marine Sediments
both carbon sources. These results suggest that methanotrophic archaea combines both
carbon sources to form biomass whereas the partner SRB is autotrophic.
The observed carbon assimilation patterns explain the carbon isotope relationship
between carbon sources and lipid derived biomarker found in active AOM zones. For lipids
derived from SRB, constant offsets relative to carbonate are due to inorganic carbonate
assimilation. The carbon in archaeal lipids derives to about 50‰ from methane, which is, in
natural sediments, expressed in extremely 13C depleted carbon compositions.
We argue that the reductive acetyl-CoA-carbon monoxide dehydrogenase pathway
(CODH; also known as Wood-Ljungdahl pathway; Morton et al., 1991) is the anabolic
pathway of the consortial SRB. The CODH pathway catalyzes carbon fixation in many
other sulfate reducing bacteria (Preuß et al., 1989) and also shows the highest carbon
fractionation known for autotrophy (Londry and Des Marais, 2003; Londry et al., 2004).
It is likely that ANMEs also use the CODH-pathway, as this is true for most other
Euryarchaeota, especially methanogens (Bhatnagar et al., 1991; Thauer, 1998; Lindahl and
Chang, 2001). In metagenome surveys Meyerdierks et al. (2005) found several ORFs (open
reading frames) encoding for the CODH pathway. If this is true, carbon monoxide uptake
and direct incorporation of acetate into the cell biomass must also be possible as previously
demonstrated for methanogens (Sprott et al., 1993). Facultative uptake of acetate may also
explain the less depleted carbon isotope compositions of archaeal biomarkers in less active
methane seep areas.
The formation of biomass using the CODH pathway could explain the observed
direct incorporation of methane into ANME biomass. In methanogens carbon fixation
using CODH it involves the formation of methyl groups by CO2 reduction (fig. 1).
Methanotrophic archaea might able to shuttle methyl groups directly from their catabolic
pathway which presumably starts with the methylization of methane catalyzed by a methyl-
CoA-reductase (MCR) catalyzed radical reaction (Krüger et al., 2003).
142
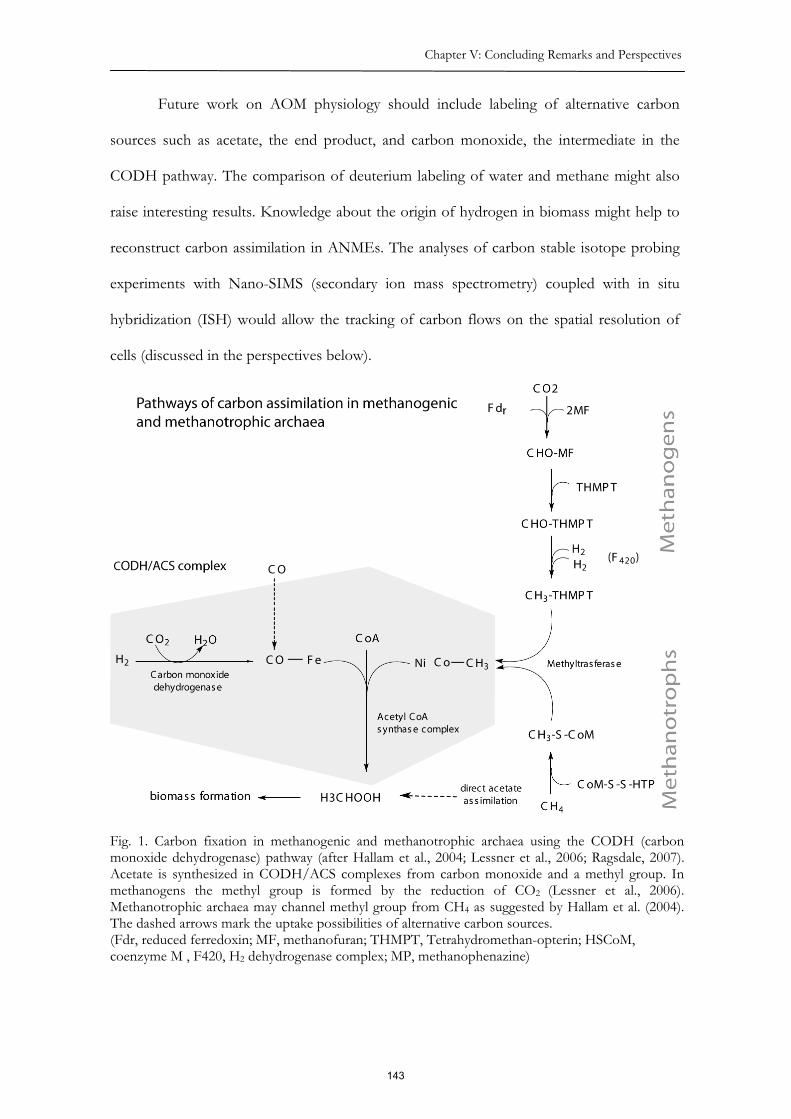
Chapter V: Concluding Remarks and Perspectives
Future work on AOM physiology should include labeling of alternative carbon
sources such as acetate, the end product, and carbon monoxide, the intermediate in the
CODH pathway. The comparison of deuterium labeling of water and methane might also
raise interesting results. Knowledge about the origin of hydrogen in biomass might help to
reconstruct carbon assimilation in ANMEs. The analyses of carbon stable isotope probing
experiments with Nano-SIMS (secondary ion mass spectrometry) coupled with in situ
hybridization (ISH) would allow the tracking of carbon flows on the spatial resolution of
cells (discussed in the perspectives below).
Fig. 1. Carbon fixation in methanogenic and methanotrophic archaea using the CODH (carbon monoxide dehydrogenase) pathway (after Hallam et al., 2004; Lessner et al., 2006; Ragsdale, 2007). Acetate is synthesized in CODH/ACS complexes from carbon monoxide and a methyl group. In methanogens the methyl group is formed by the reduction of CO2 (Lessner et al., 2006). Methanotrophic archaea may channel methyl group from CH4 as suggested by Hallam et al. (2004). The dashed arrows mark the uptake possibilities of alternative carbon sources. (Fdr, reduced ferredoxin; MF, methanofuran; THMPT, Tetrahydromethan-opterin; HSCoM, coenzyme M , F420, H2 dehydrogenase complex; MP, methanophenazine)
143

Methane Oxidation and Carbon Assimilation in Marine Sediments
We calculated carbon assimilation efficiency into microbial biomass of 0.3% to
1.3% (mol% organic carbon/ mol carbon oxidized) in AOM. This is consistent with earlier
studies of Nauhaus et al. (2007) who calculated, based on enrichment attempts, carbon
uptake efficiency of about 1%. The extremely low carbon uptake efficiencies of AOM
demonstrate the challenge of enriching anaerobic methanotrophs. In comparison, slow
growing methanogens show carbon uptake efficiencies of ~5% (acetogenic M; Weimer,
1978) to ~7.5% (CO2-reduction; Lupton and Zeikos, 1984).
Our results indicate that the transfer of organic intermediates such as formate,
acetate or methylamine between ANME and SRB is unlikely, as the use of those
compounds in catabolism, but not anabolism, would be energetically counterproductive.
Additionally, previous experiments also excluded hydrogen as an intermediate (SRB do not
instantly oxidize hydrogen (Nauhaus et al., 2002), and methane consumption was not
inhibited by hydrogen addition (results not shown)). Furthermore, extracellular redox
shuttles have been tested, but did not influence methanotrophy (Basen and Holler,
unpublished). Hence, direct electron transfer seems to be the most likely mechanism for the
connection between sulfate reducers and methanotrophic archaea. Terminal electron
transfer to solid metal phases is known in the iron reducer Geobacter, which uses outer
membrane cytochromes (Mehta et al., 2005) or nanowires (Reguera et al., 2005) to directly
transfer electrons to mineral surfaces. Reguera and coworkers speculate that electron
transfer through nanowires is also possible for cell-cell interactions, which could include
AOM. Electron transfer between methanotrophic archaea and sulfate reducing bacteria
would present novel way of tight syntrophy between organisms. Experiments examining
extracellular electron transfer are in progress. Basen and coworkers try to describe the
potential terminal electron transfer from ANMEs to bacterial sulfate reducers by charged
electrodes (see below).
144

Chapter V: Concluding Remarks and Perspectives
Perspectives: Stable isotope probing in AOM research.
Research on AOM has progressed significant within the last few years. However,
the metabolic relationship within the consortia, carbon flows into the consortia, and the
accompanied stable isotope pattern of the consortial biomass are not fully understood.
Stable isotope probing has strong potential to contribute to this topic. Some interesting
experimental possibilities are cited here and described in detail below:
� Acetate labeling to test an alternative carbon source for organisms performing
AOM
� Hydrogen labeling of water and methane to distinguish archaeal carbon sources in
methanotrophic aggregates
� Combination of stable isotope labeling and electron transfer to electrodes to
describe the electron transfer gap
� Nano-SIMS, ISH and SIP (stable isotope probing) combination to describe carbon
source assimilation on phylogenetic levels
Acetate incorporation into archaeal biomass.
Acetate is not the primary energy source for methanotrophic archaea, but might be
assimilated as an alternative carbon source if present. Acetate incorporation would
potentially save energy for those organisms living on substrates with extremely low energy
yields. Heterotrophic growth is widespread in the Kingdom Euryarchaeota, even in CO2-
reducing methanogens. Acetate uptake might also explain the different carbon isotope
patterns of the different ANME groups. As a carbon source acetate might explain the
preferential growth of one or other archaeal groups of archaea in methanotrophic
environments. To unravel this question I recommend lipid biomarker studies that compare
13C based carbon uptake on acetate, methane and carbonate.
145

Methane Oxidation and Carbon Assimilation in Marine Sediments
Hydrogen labeling of water and methane to test autotrophy.
In our carbon source labeling study, we demonstrated mixed incorporation of
methane and carbonate into the archaeal biomass at a ratio of 1:1. This is consistent with a
redox state equilibration of both compounds to organic biomass (Nauhaus et al., 2007).
However, the measured carbon source assimilation might also be an artifact of autotrophic
CO2 fixation, since DIC is a product of AOM.
To determine the pathways of carbon fixation, parallel incubations of anaerobic
methanotrophs while labeling deuterium of methane and water might be a promising
approach. If the archaea incorporate methane-derived methyl groups into biomass (as
indicated by our results, and illustrated in fig. 1), then a deuterium labeling signal in the
biomass should be predominantly found while D-labeling of methane. If, in contrast, the
archaeal methanotroph fixes only CO2, the deuterium labeling of methane will not be
recovered in the archaeal biomass (lipids).
Closing the electron transfer gap. Combining stable isotope labeling with electron
transfer to electrodes
Numerous studies have proposed that AOM is performed in a tight syntrophic
coupling of archaeal methane oxidation and bacterial sulfate reduction. However, the
electron sharing mechanism is not understood; in fact, most theoretically possible energy-
sharing mechanisms have been excluded (Nauhaus et al., 2002; Wegener unpublished).
Hence, extra-cellular electron transfer, performed via cytochromes or nanowires is the most
likely mechanism to couple the metabolism of ANME and SRB. Extra-cellular electron
transfer has been described in the last decade for several organisms, including Geobacter spp.,
which generates ATP by using solid phase iron oxides as the terminal electron acceptor.
These organisms create microanodes which transfer the electrons from the cell directly to
the minerals. It is also possible to harvest energy from Geobacteraceae (fuel cell) or let these
146

Chapter V: Concluding Remarks and Perspectives
organisms grow providing a positively charged electrode as the sole electron acceptor (Bond
et al., 2002). A similar mechanism is conceivable for methanotrophic consortia. The
incubation of AOM enrichments without sulfate but with a cathode providing an electric
potential, suitable for electron transfer, is a promising approach to investigate this theory.
Currently a setup is in use to test this theory. This could also be combined with lipid isotope
probing experiments in combination with lipid biomarker analyses or NanoSIMS (discussed
below) to show activity and carbon uptake of archaeal methanotrophs decoupled from
sulfate reducing bacteria.
New technologies: The combination of Nano-SIMS, ISH and SIP
The coupling of in situ oligonucleotide hybridization and secondary ion mass
spectrometry (SIMS) has been demonstrated as a powerful tool for resolving the origin and
spatial distribution of isotopic signals on the AOM-aggregate level (Orphan et al., 2001).
The recent further development to Nano-SIMS enhances the resolution of this method to
the cell and sub-cell level. In combination with in situ oligonucleotide labeling this can be a
new powerful tool, to link identity and carbon or nutrient uptake into microorganisms
(Kuypers and Jørgensen, 2007). Instead of a fluorescent dye, oligonuclides are labeled with
rare halogen ions or radionucleotides, whose mass can be detected via SIMS. Although a
name for this new method combination does not exist yet, this approach has a huge
potential for helping to understand carbon flows within the organism. Coupling of SIMS
with 16S rRNA-based oligonucleotide methods can resolve carbon or other elemental
uptake by cells at defined phylogenetic levels as recently shown in pioneering work by Li et
al. (2008). For mixed cell cultures Li and coworkers showed preferred uptake of glucose
(13C-labeled) and ammonium (15N-labeled) into Escherichia coli cells
In AOM research the final goals of this new method are: determination of carbon
sources in different, phylogenetically defined methanotrophic organisms, clarification of
147

Methane Oxidation and Carbon Assimilation in Marine Sediments
metabolic relationship within the consortia and finally, the determination of factors for the
different environmental ANME/SRB associations.
References:
Bender, M. and Conrad, R. (1995) Effect of methane concentrations and soil conditions on the induction of methane oxidation activity. Soil Biol. Biochem.27:1517–1527.
Bhatnagar, L., Jain, M. and Zeikus, J. (1991) Methanogenic bacteria. Variation in autotrophic Life, Academic Press, NY: 251–270.
Boetius, A., Ravenschlag, K., Schubert, C.J., Rickert, D., Widdel, F., Gieseke, A. et al. (2000) A marine microbial consortium apparently mediating anaerobic oxidation of methane. Nature 407: 623-626.
Dando, P.R., Bussmann, I., Niven, S.J., O’Hara, S.C.M., Schmaljohann, R. and Taylor, L.J. (1994) A methane seep area in the Skagerrak, the habitat of the pogonophore Siboglinum poseidoni and the bivalve mollusc Thyasira sarsi. Mar. Ecol. Prog. Ser. 107: 157–167.
Girguis, P.R., Cozen, A.E. and DeLong, E.F. (2005) Growth and population dynamics of anaerobic methane-oxidizing archaea and sulfate-reducing bacteria in a continuous-flow bioreactor. Appl. Environ. Microb. 71: 3725-3733.
Girguis, P.R., Orphan, V., Hallam, S. and DeLong, E.F. (2003) Growth and methane oxidation rates of anaerobic methanotrophic archaea in a continuous-flow bioreactor. Appl. Environ. Microb. 69: 5472-5482.
Hallam, S.J., Putnam, N., Preston, C.M., Detter, J.C., Rokhsar, D., Richardson, P.M. and DeLong, E.F. (2004) Reverse methanogenesis: Testing the hypothesis with environmental genomics. Science 305: 1457-1462.
Hinrichs, K.-U., Hayes, J.M., Silva, S.P., Brewer, P.G. and DeLong, E.F. (1999) Methane-consuming archaebacteria in marine sediments. Nature 398: 802-805.
Knittel, K., Lösekann, T., Boetius, A., Kort, R. and Amann, R. (2005) Diversity and distribution of methanotrophic archaea at cold seeps. Appl. Environ. Microb. 71: 467-479.
Knittel, K., Boetius, A., Lemke, A., Eilers, H., Lochte, K., Pfannkuche, O. et al. (2003) Activity, distribution, and diversity of sulfate reducers and other bacteria in sediments above gas hydrate (Cascadia margin, Oregon). Geomicrobiol. J. 20: 269-294.
Krüger, M., Meyerdieks, A., Glöckner, F.O., Amann, R., Widdel, F., Kube, M. et al. (2003) A conspicuous nickel protein in microbial mats that oxidize methane anaerobically. Nature 426: 878-881.
Kuypers, M.M.M. and Jørgensen, B.B. (2007) The future of single-cell environmental microbiology. Environ. Microbiol. 9: 6-7.
Lessner, D.J., Li, L., Li, Q., Rejtar, T., Andreev, V.P., Reichlen, M. et al. (2006) An unconventional pathway for reduction of CO2 to methane in CO-grown
148

Chapter V: Concluding Remarks and Perspectives
Methanosarcina acetivorans revealed by proteomics. Proc. Natl. Acad. Sci. 103: 17921-17926.
Levin, L.A. (2005) Ecology of cold seep sediments: Interactions of fauna with flow, chemistry and microbes. In Oceanography and Marine Biology: An Annual Review. Gibson, R.N., Atkinson, R.J.A. and Gordon, J.D.M. (eds): Taylor & Francis, pp. 1-46.
Li, T., Wu, T.-D., Mazeas, L., Toffin, L., Guerquin-Kern, J.-L., Leblon, G. and Bouchez, T. (2008) Simultaneous analysis of microbial identity and function using NanoSIMS. Environ. Microbiol. 10: 580-588.
Lindahl, P. and Chang, B. (2001) The evolution of acetyl-CoA synthase. Origins Life Evol. B. 31: 403-434.
Londry, K.L. and Des Marais, D.J. (2003) Stable carbon isotope fractionation by sulfate-reducing bacteria. Appl. Environ. Microbiol. 69: 2942-2949.
Londry, K.L., Jahnke, L.L. and Des Marais, D.J. (2004) Stable carbon isotope ratios of lipid biomarkers of sulfate-reducing bacteria. Appl. Environ. Microb. 70: 745-751.
Lösekann, T., Knittel, K., Nadalig, T., Fuchs, B., Niemann, H., Boetius, A. and Amann, R. (2007) Diversity and abundance of aerobic and anaerobic methane oxidizers at the Haakon Mosby Mud Volcano, Barents Sea. Appl. Environ. Microb. 73: 3348-3362.
Lovley, D.R., Dwyer, D.F. and Klug, M.J. (1982) Kinetic analysis of competition between sulfate reducers and methanogens for hydrogen in sediments. Appl Environ. Microbiol. 43: 1379-1379.
Mehta, T., Coppi, M.V., Childers, S.E. and Lovley, D.R. (2005) Outer membrane c-type cytochromes required for Fe(III) and Mn(IV) oxide reduction in Geobacter sulfurreducens. Appl. Environ. Microb. 71: 8634-8641.
Meyerdierks, A., Kube, M., Lombardot, T., Knittel, K., Bauer, M., Glöckner, F.O. et al. (2005) Insights into the genomes of archaea mediating the anaerobic oxidation of methane. Environ. Microbiol. 7: 1937-1951.
Montagna, P.A., Bauer, J.E., Prieto, M.C., Hardin, D. and Spies, R.B. (1986) Benthic metabolism in a natural coastal petroleum seep. Mar. Ecol. Prog. Ser. 34: 31-40.
Morton, T., Runquist, J., Ragsdale, S., Shanmugasundaram, T., Wood, H. and Ljungdahl, L. (1991) The primary structure of the subunits of carbon monoxide dehydrogenase/acetyl-CoA synthase from Clostridium thermoaceticum. J. Biol. Chem. 266: 23824-23828.
Nauhaus, K., Boetius, A., Krüger, M. and Widdel, F. (2002) In vitro demonstration of anaerobic oxidation of methane coupled to sulphate reduction in sediments from a marine gas hydrate area. Environ. Microbiol. 4: 296-305.
Nauhaus, K., Albrecht, M., Elvert, M., Boetius, A. and Widdel, F. (2007) In vitro cell growth of marine archaeal-bacterial consortia during anaerobic oxidation of methane with sulfate. Environ. Microbiol. 9: 187-196.
Niemann, H., Lösekann, T., de Beer, D., Elvert, M., Nadalig, T., Knittel, K. et al. (2006) Novel microbial communities of the Haakon Mosby mud volcano and their role as a methane sink. Nature 443: 854-858.
Orcutt, B., Boetius, A., Elvert, M., Samarkin, V. and Joye, S.B. (2005) Molecular biogeochemistry of sulfate reduction, methanogenesis and the anaerobic oxidation of methane at Gulf of Mexico cold seeps. Geochim. Cosmochim. Ac. 69: 4267-4281.
149
Methane Oxidation and Carbon Assimilation in Marine Sediments
Orcutt, B.N., Boetius, A., Lugo, S.K., MacDonald, I.R., Samarkin, V.A. and Joye, S.B. (2004) Life at the edge of methane ice: microbial cycling of carbon and sulfur in Gulf of Mexico gas hydrates. Chem. Geol. 205: 239-251.
Orphan, V.J., House, C.H., Hinrichs, K.-U., McKeegan, K.D. and DeLong, E.F. (2002) Multiple archaeal groups mediate methane oxidation in anoxic cold seep sediments. Proc. Natl. Acad. Sci. 99(11), 7663-7668. .
Preuß, A., Schauder, R. and Fuchs, G. (1989) Carbon isotope fractionation by autotrophic bacteria with three different CO 2 fixation pathways. Z. Naturforsch. 44: 397–402.
Ragsdale, S.W. (2007) Nickel and the carbon cycle. J. Inorg. Biochem. 101: 1657-1666.
Reguera, G., McCarthy, K.D., Mehta, T., Nicoll, J.S., Tuominen, M.T. and Lovley, D.R. (2005) Extracellular electron transfer via microbial nanowires. Nature 435: 1098-1101.
Sprott, G., Ekiel, I. and Patel, G. (1993) Metabolic pathways in Methanococcus jannaschii and other methanogenic bacteria. Appl. Environ. Microb. 59: 1092.
Thauer, R. (1998) Biochemistry of methanogenesis: A tribute to Marjory Stephenson. 1998 Marjory Stephenson Prize Lecture. Microbiology 144: 2377-2406.
150

Field experiences and presentations
Field Experience Mar. 2006 RV SONNE Cruise, SO191-2 IfM-GEOMAR (COMET/MUMM)
Investigation of new methane driven habitats on the New Zealand continental margin using biogeochemical and microbiological methods
Apr. 2006 RV METEOR/ROV QUEST Cruise M67/2b, RCOM Bremen
Quantification of microbial activity in different habitats of the Campeche Asphalt Volcano sulfate reduction measurements by “In situ incubation (Insinc)”
Nov. 2005 RV Heincke Cruise HE 242, BGR Hannover. (DFG project RE 2424/1-1
‘Nordsee’) Mapping of potential seep structures in the North Sea. Sept. 2005 RV Alkor Cruise AL267: (MUMM test cruise)
Microbial turnover at North Sea seep sites Tommeliten and Gullfaks, Organic geochemistry, biogeochemistry and microbial ecology, sea floor mapping
May 2004 RV Heincke Cruise HE208
Investigation of microbial communities at different seep sitesof the North Sea with emphasis on Gullfaks seep (METROL)
Presentation List Oral presentation: G.Wegener, H. Niemann, M. Elvert, K.-U. Hinrichs, & A. Boetius (2008)
Assimilation of methane and inorganic carbon by microbial communities mediating the anaerobic oxidation of methane. AMO-meeting, Aselage, Germany.
Oral presentation: G. Wegener, H. Niemann, M. Elvert, K.-U. Hinrichs, & A. Boetius
(2007): The combination of isotope labeling and biomarker analyses to trace carbon flows in anaerobic methanotrophy. Geologische Vereiningung
Oral presentation: G. Wegener, M. Bowles, J. Felden, F. Wenzhöfer, F. Schubotz, K.-U.
Hinrichs, M. Zabel, G. Bohrmann and A.Boetius. (2007) Microbial activity associated with asphalt volcanism at the Campeche Knolls, Gulf of Mexico (Results from research cruise Meteor M67/2b), Goldschmidt Conference, Cologne, Germany
Oral presentation: G. Wegener, H. Niemann, M. Elvert & A. Boetius: (2007) Which
microorganisms benefit from methane oxidation in seep sediments: Tracing carbon sources by isotope labeling experiments. EGU, Vienna, Austria
Poster presentation: G. Wegener, M. Shovitri, H. Niemann, K. Knittel, M. Hovland, A.
Boetius (2007) Active methane seepage in the North Sea: Gullfaks and Tommeliten, EGU, Vienna, Austria
Poster presentation: Gunter Wegener, M. Shovitri, H. Niemann, K. Knittel, M. Hovland, A.
Boetius (2007) Active methane seepage in the North Sea: Gullfaks and Tommeliten, EGU, Vienna, Austria
151

Methane Oxidation and Carbon Assimilation in Marine Sediments
Oral presentation: G. Wegener (2007) Methane based ecosystems in the deep sea. Auckland University of Technology. Host: Dr. Lindsey Zemke-White
Poster presentation: G. Wegener, M. Shovitri, H. Niemann, M. Hovland, G. Wendt, A.
Boetius (2005) Gullfaks seep area: Anaerobic oxidation of methane in marine sediments. EGU, Vienna, Austria
Oral Presentation: G. Wegener (2005): Life without oxygen. Max Planck PhD Earth Science
Seminar. Jena, Germany
152
Erklärung gemäß § 6 Abs. 5 der Promotionsordnung der Universität Bremen für
die mathematischen, natur- und ingenieurwissenschaftlichen Fachbereiche
Hiermit erkläre ich, dass ich die vorliegende Arbeit
- ohne unerlaubte, fremde Hilfe angefertigt habe
- keine anderen, als die von mir im Text angegebenen Quellen und Hilfsmittel benutzt habe,
- die den benutzten Werken wörtlich oder inhaltlich entnommenen Stellen als solche
kenntlich gemacht habe.
Bremen, 19. März 2008
Gunter Wegener
153