Employment Assimilation of Immigrants - Evidence from Finland
21
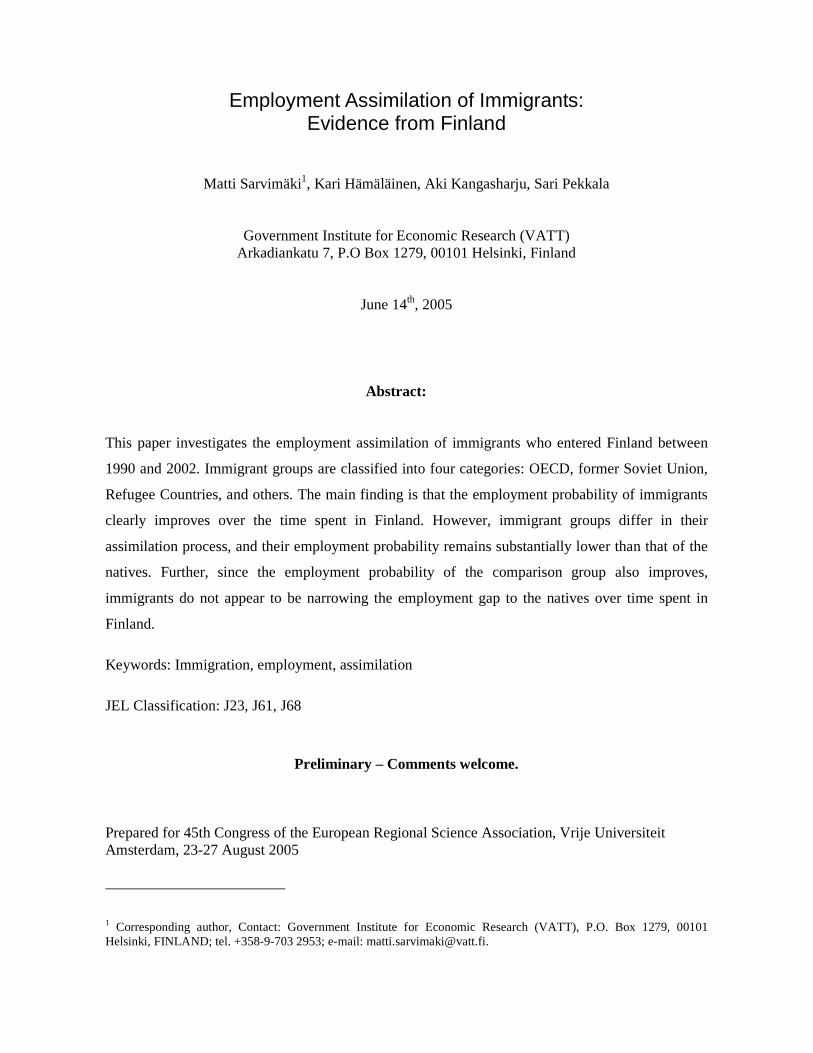
Employment Assimilation of Immigrants: Evidence from Finland Matti Sarvimäki 1 , Kari Hämäläinen, Aki Kangasharju, Sari Pekkala Government Institute for Economic Research (VATT) Arkadiankatu 7, P.O Box 1279, 00101 Helsinki, Finland June 14 th , 2005 Abstract: This paper investigates the employment assimilation of immigrants who entered Finland between 1990 and 2002. Immigrant groups are classified into four categories: OECD, former Soviet Union, Refugee Countries, and others. The main finding is that the employment probability of immigrants clearly improves over the time spent in Finland. However, immigrant groups differ in their assimilation process, and their employment probability remains substantially lower than that of the natives. Further, since the employment probability of the comparison group also improves, immigrants do not appear to be narrowing the employment gap to the natives over time spent in Finland. Keywords: Immigration, employment, assimilation JEL Classification: J23, J61, J68 Preliminary – Comments welcome. Prepared for 45th Congress of the European Regional Science Association, Vrije Universiteit Amsterdam, 23-27 August 2005 1 Corresponding author, Contact: Government Institute for Economic Research (VATT), P.O. Box 1279, 00101 Helsinki, FINLAND; tel. +358-9-703 2953; e-mail: [email protected].
-
Upload
independent -
Category
Documents
-
view
4 -
download
0
Transcript of Employment Assimilation of Immigrants - Evidence from Finland
Employment Assimilation of Immigrants: Evidence from Finland
Matti Sarvimäki1, Kari Hämäläinen, Aki Kangasharju, Sari Pekkala
Government Institute for Economic Research (VATT) Arkadiankatu 7, P.O Box 1279, 00101 Helsinki, Finland
June 14th, 2005
Abstract:
This paper investigates the employment assimilation of immigrants who entered Finland between
1990 and 2002. Immigrant groups are classified into four categories: OECD, former Soviet Union,
Refugee Countries, and others. The main finding is that the employment probability of immigrants
clearly improves over the time spent in Finland. However, immigrant groups differ in their
assimilation process, and their employment probability remains substantially lower than that of the
natives. Further, since the employment probability of the comparison group also improves,
immigrants do not appear to be narrowing the employment gap to the natives over time spent in
Finland.
Keywords: Immigration, employment, assimilation
JEL Classification: J23, J61, J68
Preliminary – Comments welcome.
Prepared for 45th Congress of the European Regional Science Association, Vrije Universiteit Amsterdam, 23-27 August 2005
1 Corresponding author, Contact: Government Institute for Economic Research (VATT), P.O. Box 1279, 00101 Helsinki, FINLAND; tel. +358-9-703 2953; e-mail: [email protected].
2
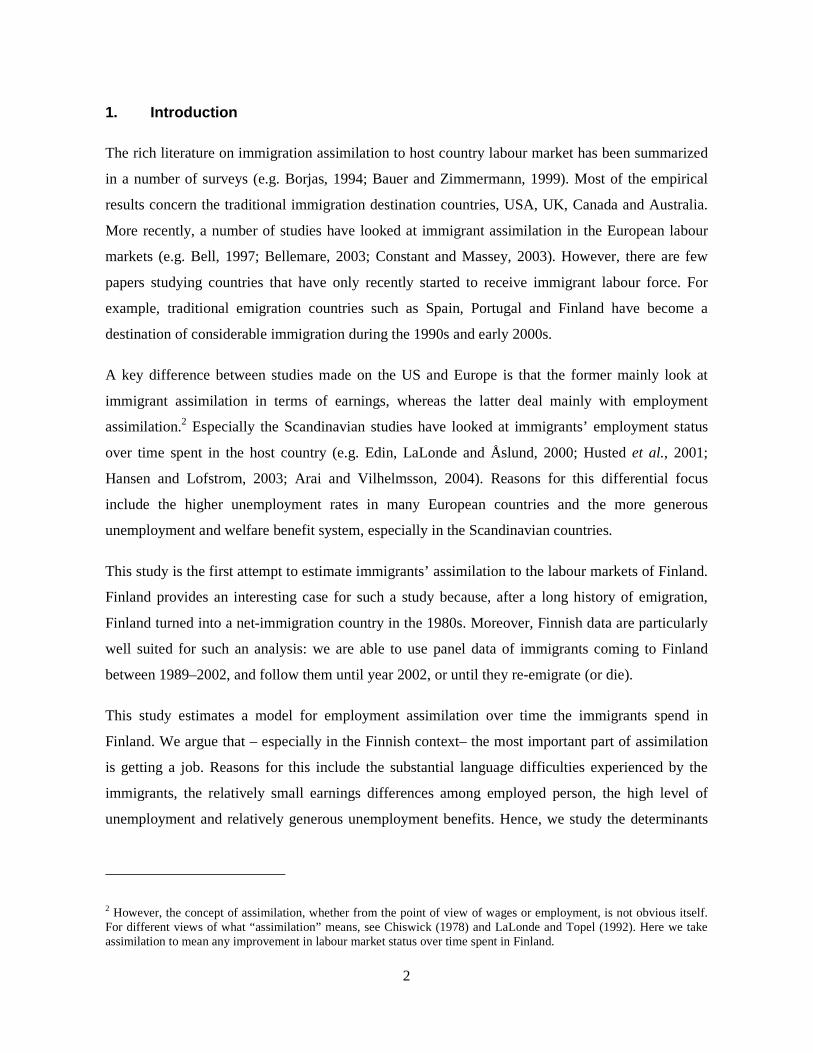
1. Introduction
The rich literature on immigration assimilation to host country labour market has been summarized
in a number of surveys (e.g. Borjas, 1994; Bauer and Zimmermann, 1999). Most of the empirical
results concern the traditional immigration destination countries, USA, UK, Canada and Australia.
More recently, a number of studies have looked at immigrant assimilation in the European labour
markets (e.g. Bell, 1997; Bellemare, 2003; Constant and Massey, 2003). However, there are few
papers studying countries that have only recently started to receive immigrant labour force. For
example, traditional emigration countries such as Spain, Portugal and Finland have become a
destination of considerable immigration during the 1990s and early 2000s.
A key difference between studies made on the US and Europe is that the former mainly look at
immigrant assimilation in terms of earnings, whereas the latter deal mainly with employment
assimilation.2 Especially the Scandinavian studies have looked at immigrants’ employment status
over time spent in the host country (e.g. Edin, LaLonde and Åslund, 2000; Husted et al., 2001;
Hansen and Lofstrom, 2003; Arai and Vilhelmsson, 2004). Reasons for this differential focus
include the higher unemployment rates in many European countries and the more generous
unemployment and welfare benefit system, especially in the Scandinavian countries.
This study is the first attempt to estimate immigrants’ assimilation to the labour markets of Finland.
Finland provides an interesting case for such a study because, after a long history of emigration,
Finland turned into a net-immigration country in the 1980s. Moreover, Finnish data are particularly
well suited for such an analysis: we are able to use panel data of immigrants coming to Finland
between 1989–2002, and follow them until year 2002, or until they re-emigrate (or die).
This study estimates a model for employment assimilation over time the immigrants spend in
Finland. We argue that – especially in the Finnish context– the most important part of assimilation
is getting a job. Reasons for this include the substantial language difficulties experienced by the
immigrants, the relatively small earnings differences among employed person, the high level of
unemployment and relatively generous unemployment benefits. Hence, we study the determinants
2 However, the concept of assimilation, whether from the point of view of wages or employment, is not obvious itself. For different views of what “assimilation” means, see Chiswick (1978) and LaLonde and Topel (1992). Here we take assimilation to mean any improvement in labour market status over time spent in Finland.
3
of being employed: in particular, the time spent in Finland and the differences in assimilation
patterns across immigrant groups.
We find that the employment probability of immigrants clearly improves over the time spent in
Finland. However, immigrant groups differ widely in their assimilation process, and their
employment probability stays substantially lower than that of the natives. Further, since the
employment probability of the comparison group also improves, immigrants do not appear to be
narrowing the employment gap to natives over time spent in Finland.
The questions studied in this paper have considerable policy relevance. First, they have direct
implications for immigration policy, the focus of which is currently being reconsidered. Second,
understanding the costs and benefits of immigration to the host country public sector is of primary
importance when considering economic migration as a mechanism for increasing labour supply.
Further, during the next decades, most industrial countries will face serious challenges due to their
aging populations, and it has often been argued that one potential solution to the shrinking
population may be provided by immigration.
The second part of this paper discusses Finnish immigration law, and introduces immigration as a
historical and economic phenomenon in Finland. Third section presents our empirical strategy and
the econometric model. In the fourth section, the data set is described, while the actual analyses are
presented in the fifth section. Section six concludes the paper with some policy implications.
2. Background: Immigration to Finland
Immigration patterns represent one of the major differences between Finland and other Nordic
countries. Historically, Finland has been a country of emigration, immigrants having mostly
consisted of return migrants and their foreign-born children and spouses. The most intense
emigration period followed the launch of the common Nordic Labour Market in 1954. During the
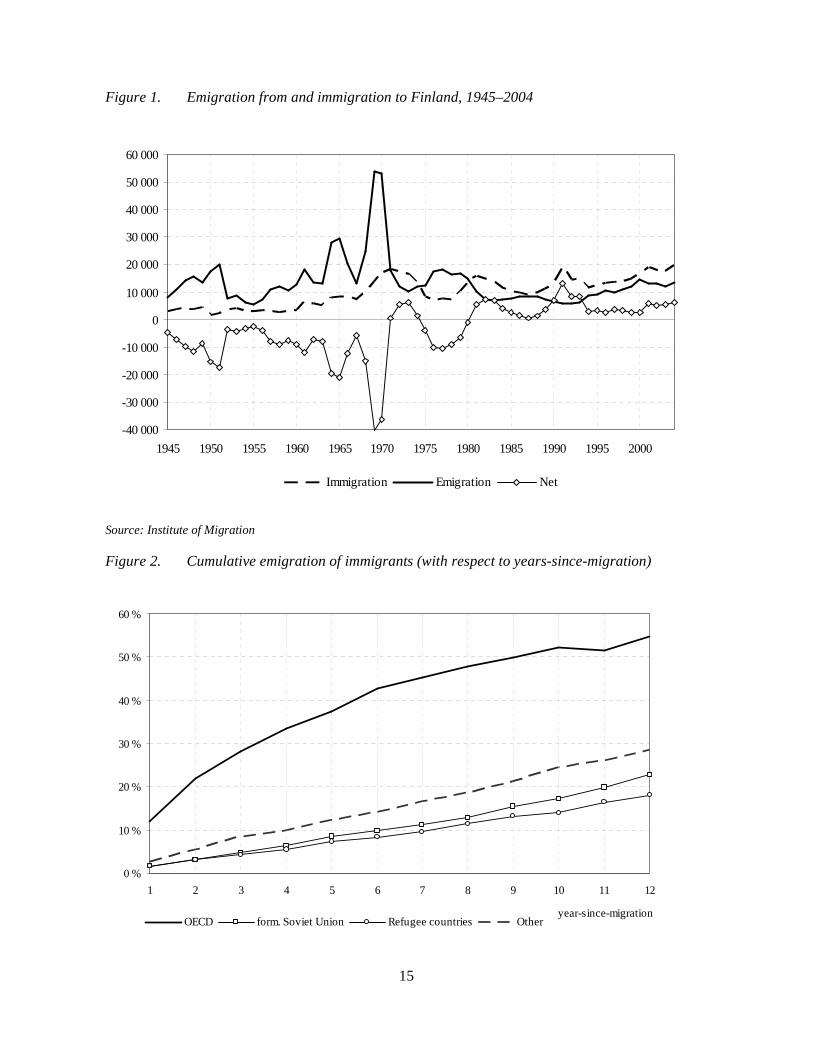
next 14 years roughly six percent of Finnish population emigrated to Sweden (see figure 1). This
pattern of emigration and return migration changed in the early 1990s, as three new immigrant
groups emerged: labour migrants, Soviet-born return migrants and refugees. As a result, the non-
Finnish speaking population almost doubled in ten years to its current level of 2.2 percent of total
population. Currently, immigration represents just over 40 percent of the total annual population
growth.
4
Unfortunately, our data do not allow the separation of labour and family migration from each other.
Even thought the importance of labour migration has increased, it is likely that family migration has
dominated labour migration for two reasons. First, Finland experienced a severe recession in the
early 1990s. The unemployment rate of the natives soared to over 20 percent of which level it has
decreased only gradually. The labour market situation of immigrants was far graver, the
unemployment rate of foreign citizens peaking at 58 percent in 1995. Even now the unemployment
rate of immigrants is almost 40 percent. Second, Finland’s policy towards labour migration has
been very restrictive. The Finnish law still gives citizens of EU/EEA prioritised access to the vacant
posts in Finland. In practice this means that the labour administration evaluates whether suitable
work force is available in EU/EEA “in a reasonable time” for any particular vacant post before
work permit is granted for immigrants outside EU.
The most dramatic change, however, was the dissolution of the Soviet Union that changed the
nature of return migration by increasing the immigration of ethnic-Finns residing in the former
Soviet Union and Estonians. Ethnic-Finns were granted the right to return in 1990. Yet, as the
evaluation of their Finnish ancestry was based on Soviet documents3, it is uncertain whether ethnic-
Finns differ from other Russian immigrants in terms of assimilation process. For example, the
Ministry of Labour (1998) reports that in the age group of 24-years or younger, only two percent of
the Soviet-born ethnic-Finns have good or excellent Finnish language skills. When it comes to
Estonians, it is likely that they have an above-average assimilation capacity owing to the lingual and
cultural proximity to Finland. All together, individuals born in the former Soviet Union made up
approximately 40 percent of Finland’s immigrant population in 2003.
Finally, the number of refugees seeking asylum from Finland increased considerably in the early
1990s. The numbers have remained quite small owing to restrictive asylum and refugee policy.
Regardless of this, the refugees and their family members make up approximately 20 percent of all
immigrants. The largest refugee groups have arrived from Somalia, former Yugoslavia, Iraq and
Iran.
3 The requirement is that either (at least) one of the grandparents was a Finnish citizen or (at least) one parent or two grandparents were ethnic-Finns according to the Soviet documents. Since October 2003, also passing a Finnish language test has been required.
5
3. Empirical model
The analyses reported in this study are based on register data. Even though register data are free
from any recall bias they rely on information collected by the authorities of the host country. This
typically results in data sets that are fairly limited on pre-immigration information, which makes
comparisons of the economic success of immigrants from different origin countries difficult.
Missing information on, say, education that immigrants have acquired in an origin country will be
reflected in assimilation measures provided that there are differences in pre-immigration education
across origin countries. Fortunately, this data limitation can be overcome if one has access to panel
data, as we have, since pre-immigration factors are time-invariant when examining the labour
market possibilities of immigrants in their new homeland.
To construct a model for the progress of immigrants’ employment in time, let the underlying
response variable be *ity which measures the ith individual’s propensity to be employed in period t.
This latent variable is related to observed differences among cross-sectional units as
(1) ititiit uxzay +++= ''0* βλ , i = 1, … , N, t = 1, … , T,
where the propensity variable is related to time-invariant variables, zi, and time-varying variables,
xit. Time-invariant variables include a dummy indicator for having a Finnish spouse at the end of
immigration year and the regional unemployment rate at the year of immigration. Time-varying
variables control for observable differences in individual characteristics, a spouse’s characteristics
and an individual having a Finnish degree of upper level or tertiary education4. Time-varying
explanatory variables also include the set of dummy variables indicating the years spent in Finland.
In a usual manner, the parameter estimates of years-since-migration variables are interpreted as
measuring assimilation. It should be noted, however, that the model includes also other explanatory
variables that are connected to the process of assimilation, such as having obtained an educational
degree in Finland. In this case, the years-since-migration dummies reflect assimilation arising from
other factors connected with the time spent in Finland, such as language fluency, the accumulation
4 The data include some information on education acquired outside Finland but this information enters the registers only if an immigrant applies for recognition of her foreign education or becomes unemployed. The usual case for foreign education becoming registered is via unemployment agencies so this particular piece of information is available only for a non-randomly selected sample of immigrants. For this reason, estimations include only Finnish educational degrees obtained after a period of study in Finland. Unfortunately, the data do not allow us to make this distinction for spouse’s education.
6
of knowledge on the functioning of labour markets etc. In what follows, we take a closer look at
changes in employment possibilities of immigrants arising from time spent in Finland and from
other observable factors.
To incorporate unobserved heterogeneity into analyses, the composite error term, uit, is separated
into an individual-specific, time-invariant unobserved effect, αi, and an iid random term, εit, as
(2) uit = αi + εit.
This specification allows observationally identical individuals to have different probabilities of
employment. Accordingly, the labour market career of an immigrant may differ systematically from
the average behaviour of a similar immigrant owing to pre-immigration factors. This intuitively
appealing extension comes with the cost. Since the unobserved heterogeneity persists over time, the
composite error term, uit, is correlated across cross-section units in time even if the error terms εit
are purely random. Obviously, this correlation has to be taken into account when constructing the
empirical model.
Unlike in linear models, the estimation of unknown parameters presented in equation (1) and αi is
not asymptotically independent (Hsiao, 1991). For this reason, there is no easy way to eliminate the
individual-specific effect in the context of fixed-effects. An attractive alternative is to treat the
individual heterogeneity effect, αi, as randomly distributed in the population. The specification of
distributions as ),0(~ 2ασα INi and ),0(~ 2
εσε INit , together with the assumptions that αi and εit
are independent of each other and of the explanatory variables, leads to the random effects probit
model, first discussed in Heckman and Willis (1976) . Another appealing feature of random effects
formulation is that it produces parameter estimates also for observed, time-invariant factors that are
important when examining the impact of economic and personal factors at the time of immigration
on further employment possibilities.
An additional issue that arises in the random effects probit model is that the parameter estimates are
biased if unobserved heterogeneity is correlated with observed heterogeneity. Chamberlain (1984)
suggested that a potential dependence can be allowed by specifying a distribution for αi conditional
on the leads and lags of time-varying explanatory variables. The drawback with this is, however,
that the number of parameters to be estimated increases substantially. An alternative is provided by
Mundlak (1978), allowing unobserved and observed heterogeneity to be mutually dependent via the
means of time-varying explanatory variables as
7
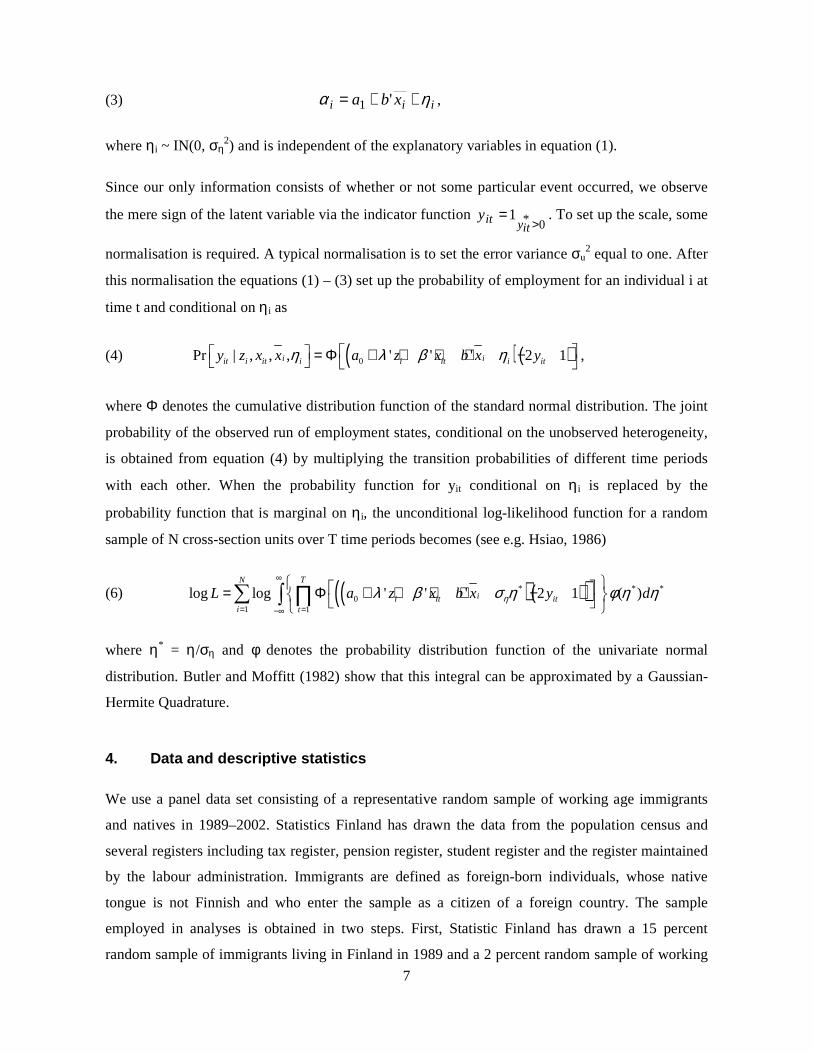
(3) iii xba ηα ++= '1 ,
where ηi ~ IN(0, ση2) and is independent of the explanatory variables in equation (1).
Since our only information consists of whether or not some particular event occurred, we observe
the mere sign of the latent variable via the indicator function 0*1
>=
ityity . To set up the scale, some
normalisation is required. A typical normalisation is to set the error variance σu2 equal to one. After
this normalisation the equations (1) – (3) set up the probability of employment for an individual i at
time t and conditional on ηi as
(4) ( )( )0Pr | , , , ' ' ' 2 1i iit i it i i it i ity z x x a z x b x yη λ β η = Φ + + + + − ,
where Φ denotes the cumulative distribution function of the standard normal distribution. The joint
probability of the observed run of employment states, conditional on the unobserved heterogeneity,
is obtained from equation (4) by multiplying the transition probabilities of different time periods
with each other. When the probability function for yit conditional on ηi is replaced by the
probability function that is marginal on ηi, the unconditional log-likelihood function for a random
sample of N cross-section units over T time periods becomes (see e.g. Hsiao, 1986)
(6) ( )( )( )* * *0
1 1
log log ' ' ' 2 1 ( )TN
ii it iti t
L a z x b x y dηλ β σ η φ η η∞
= =−∞
= Φ + + + + − ∑ ∏∫
where η* = η/ση and φ denotes the probability distribution function of the univariate normal
distribution. Butler and Moffitt (1982) show that this integral can be approximated by a Gaussian-
Hermite Quadrature.
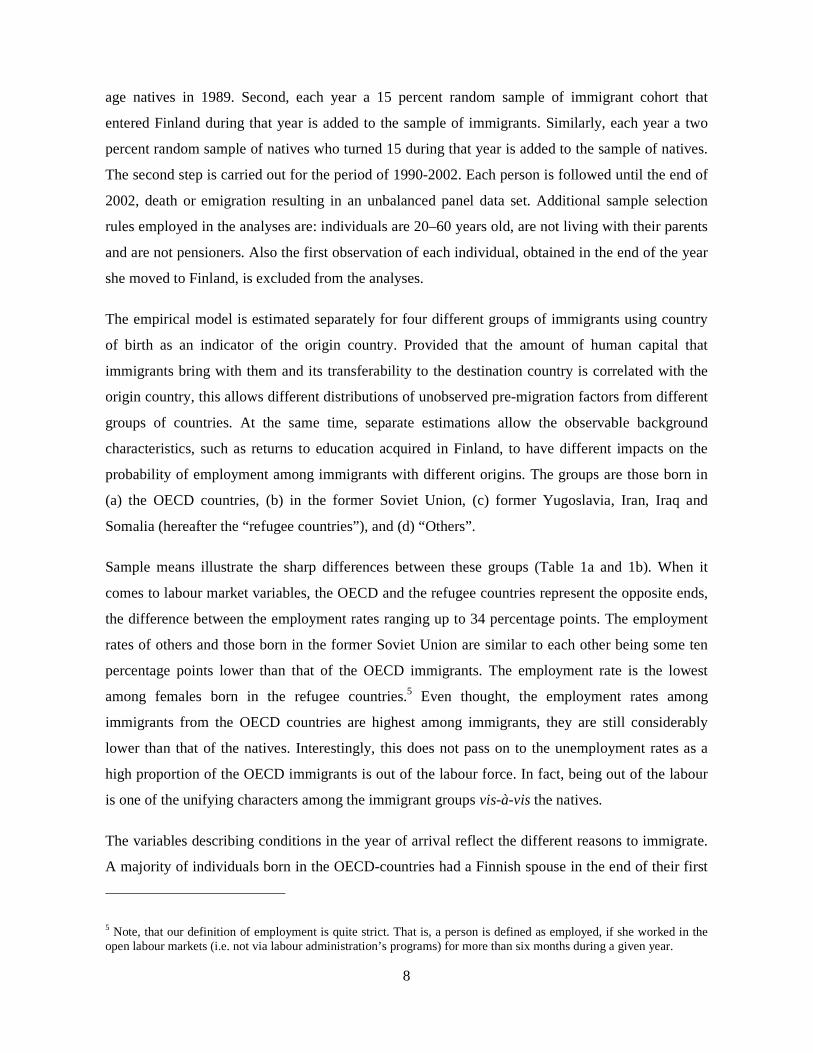
4. Data and descriptive statistics
We use a panel data set consisting of a representative random sample of working age immigrants
and natives in 1989–2002. Statistics Finland has drawn the data from the population census and
several registers including tax register, pension register, student register and the register maintained
by the labour administration. Immigrants are defined as foreign-born individuals, whose native
tongue is not Finnish and who enter the sample as a citizen of a foreign country. The sample
employed in analyses is obtained in two steps. First, Statistic Finland has drawn a 15 percent
random sample of immigrants living in Finland in 1989 and a 2 percent random sample of working
8
age natives in 1989. Second, each year a 15 percent random sample of immigrant cohort that
entered Finland during that year is added to the sample of immigrants. Similarly, each year a two
percent random sample of natives who turned 15 during that year is added to the sample of natives.
The second step is carried out for the period of 1990-2002. Each person is followed until the end of
2002, death or emigration resulting in an unbalanced panel data set. Additional sample selection
rules employed in the analyses are: individuals are 20–60 years old, are not living with their parents
and are not pensioners. Also the first observation of each individual, obtained in the end of the year
she moved to Finland, is excluded from the analyses.
The empirical model is estimated separately for four different groups of immigrants using country
of birth as an indicator of the origin country. Provided that the amount of human capital that
immigrants bring with them and its transferability to the destination country is correlated with the
origin country, this allows different distributions of unobserved pre-migration factors from different
groups of countries. At the same time, separate estimations allow the observable background
characteristics, such as returns to education acquired in Finland, to have different impacts on the
probability of employment among immigrants with different origins. The groups are those born in
(a) the OECD countries, (b) in the former Soviet Union, (c) former Yugoslavia, Iran, Iraq and
Somalia (hereafter the “refugee countries”), and (d) “Others”.
Sample means illustrate the sharp differences between these groups (Table 1a and 1b). When it
comes to labour market variables, the OECD and the refugee countries represent the opposite ends,
the difference between the employment rates ranging up to 34 percentage points. The employment
rates of others and those born in the former Soviet Union are similar to each other being some ten
percentage points lower than that of the OECD immigrants. The employment rate is the lowest
among females born in the refugee countries.5 Even thought, the employment rates among
immigrants from the OECD countries are highest among immigrants, they are still considerably
lower than that of the natives. Interestingly, this does not pass on to the unemployment rates as a
high proportion of the OECD immigrants is out of the labour force. In fact, being out of the labour
is one of the unifying characters among the immigrant groups vis-à-vis the natives.
The variables describing conditions in the year of arrival reflect the different reasons to immigrate.
A majority of individuals born in the OECD-countries had a Finnish spouse in the end of their first
5 Note, that our definition of employment is quite strict. That is, a person is defined as employed, if she worked in the open labour markets (i.e. not via labour administration’s programs) for more than six months during a given year.
9
year in Finland, which implies that they immigrated predominantly for family reasons. The same is
true for over 40 percent of females born in the former Soviet Union and of those in the group
“Other”. The differences in the other time-invariant variable – regional unemployment rate in the
year of arrival – arise from the timing of immigration: major flows of refugees and immigrants from
the former Soviet Union entered Finland during the recession of the early 1990s.
Other significant differences concern family variables and the region of residence. First thing to
notice is that immigrants from refugee countries have more children than other groups. This is
partly due to their lower average age, but even after controlling the impact of age, they have
approximately 0.7 children under 18 years old more than the other groups. The share of single
mothers is highest among those born in the refugee countries or Soviet Union and lowest among the
OECD-born. Finally, while about a quarter of natives live in Uusimaa (the capital region), it hosts
over half of Finland’s immigrant population.
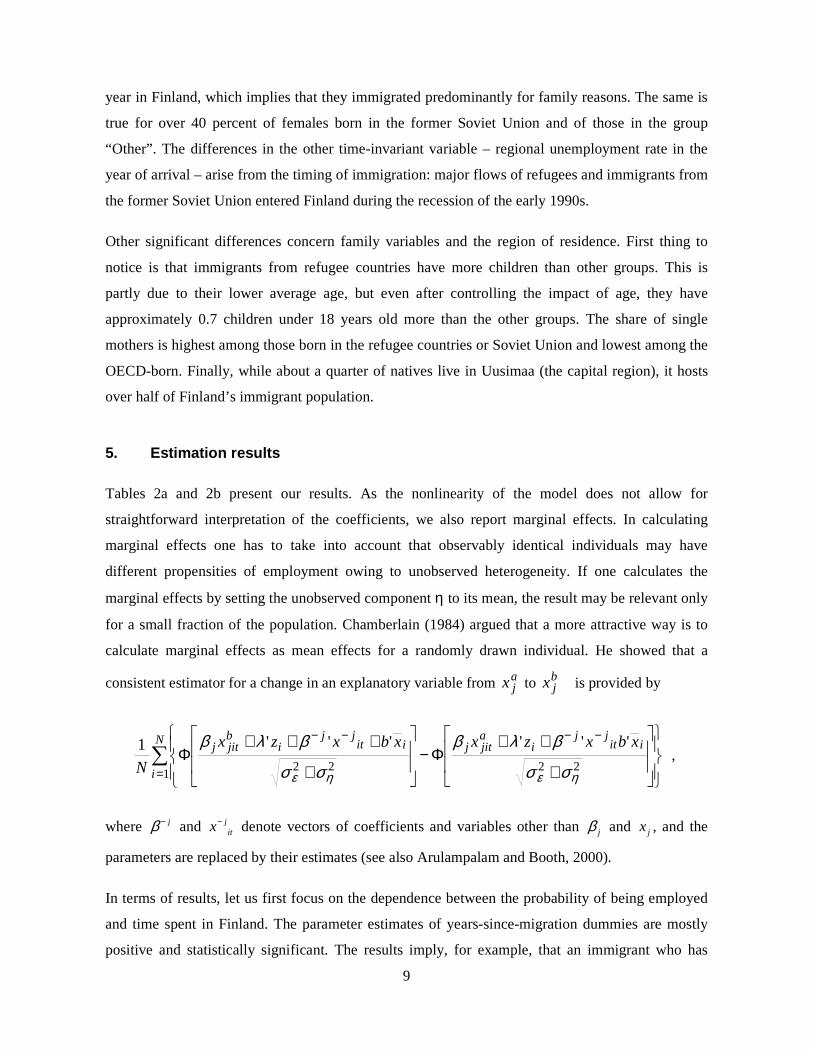
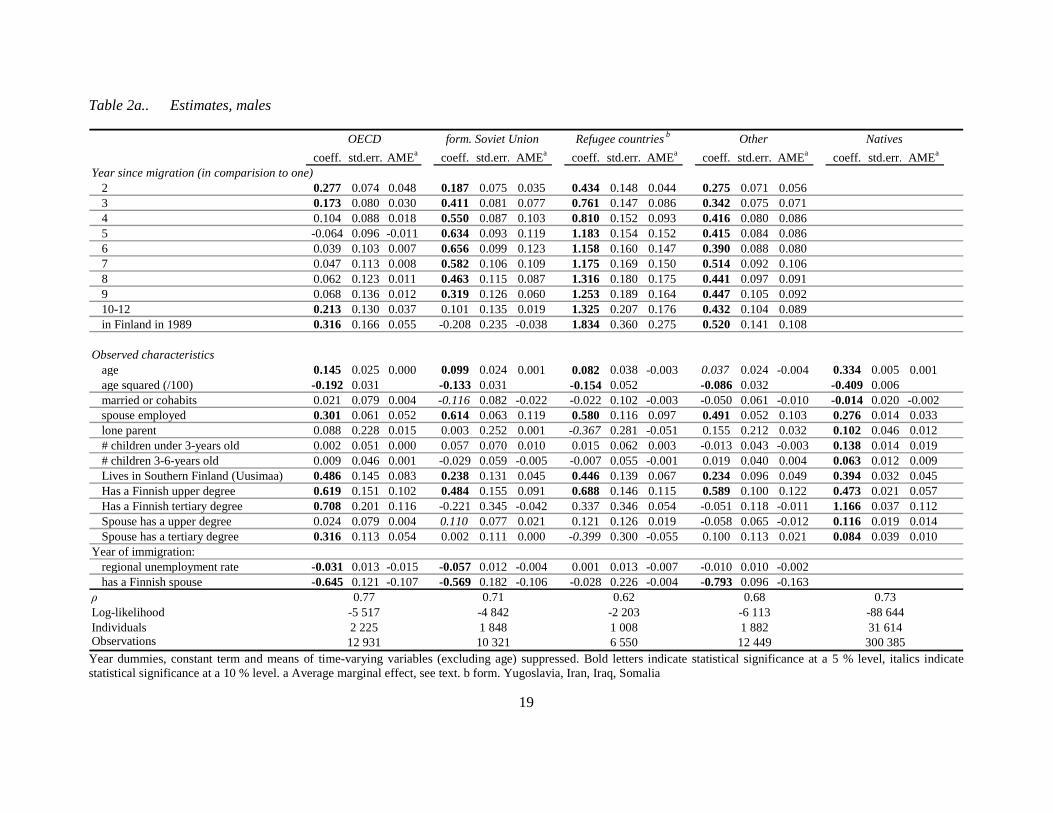
5. Estimation results
Tables 2a and 2b present our results. As the nonlinearity of the model does not allow for
straightforward interpretation of the coefficients, we also report marginal effects. In calculating
marginal effects one has to take into account that observably identical individuals may have
different propensities of employment owing to unobserved heterogeneity. If one calculates the
marginal effects by setting the unobserved component η to its mean, the result may be relevant only
for a small fraction of the population. Chamberlain (1984) argued that a more attractive way is to
calculate marginal effects as mean effects for a randomly drawn individual. He showed that a
consistent estimator for a change in an explanatory variable from ajx to b
jx is provided by
∑=
−−−−
+
++Φ−
+
+++Φ
N
i
iitjj
iajitjiit
jji
bjitj xbxzxxbxzx
N 12222
''''''1
ηεηε σσ
βλβ
σσ
βλβ ,
where jβ − and jitx− denote vectors of coefficients and variables other than jβ and jx , and the
parameters are replaced by their estimates (see also Arulampalam and Booth, 2000).
In terms of results, let us first focus on the dependence between the probability of being employed
and time spent in Finland. The parameter estimates of years-since-migration dummies are mostly
positive and statistically significant. The results imply, for example, that an immigrant who has
10
stayed in Finland for seven years has a 10–17 percentage points higher probability of being
employed than an otherwise similar immigrant who has just arrived in Finland. Immigrants born in
the OECD-countries are an exception to this rule. In this group the parameter estimates of years-
since-migration dummies are found to be insignificant, or even negative. One explanation is that
this group is likely to have a good knowledge concerning Finnish culture and the functioning of
labour markets already in the time of immigrating. Another possible explanation is non-randomness
of return migration. If those with the highest (lowest) assimilation ability leave Finland after a few
years, the estimates for years-since-migration will be biased downwards (upwards) for dummies
indicating longer time in the host country. The concern is most severe among OECD immigrants as
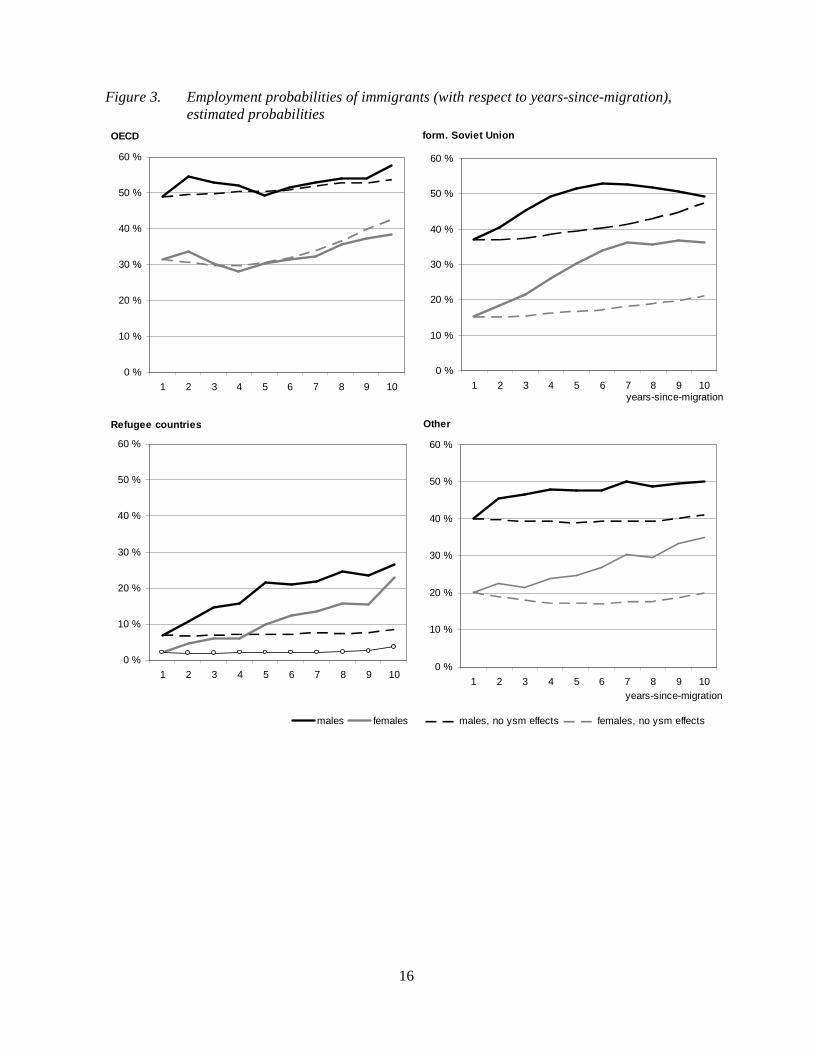
they are by far more likely than others to leave Finland after a few years (Figure 2). A closer
investigation of this issue is left for further research.
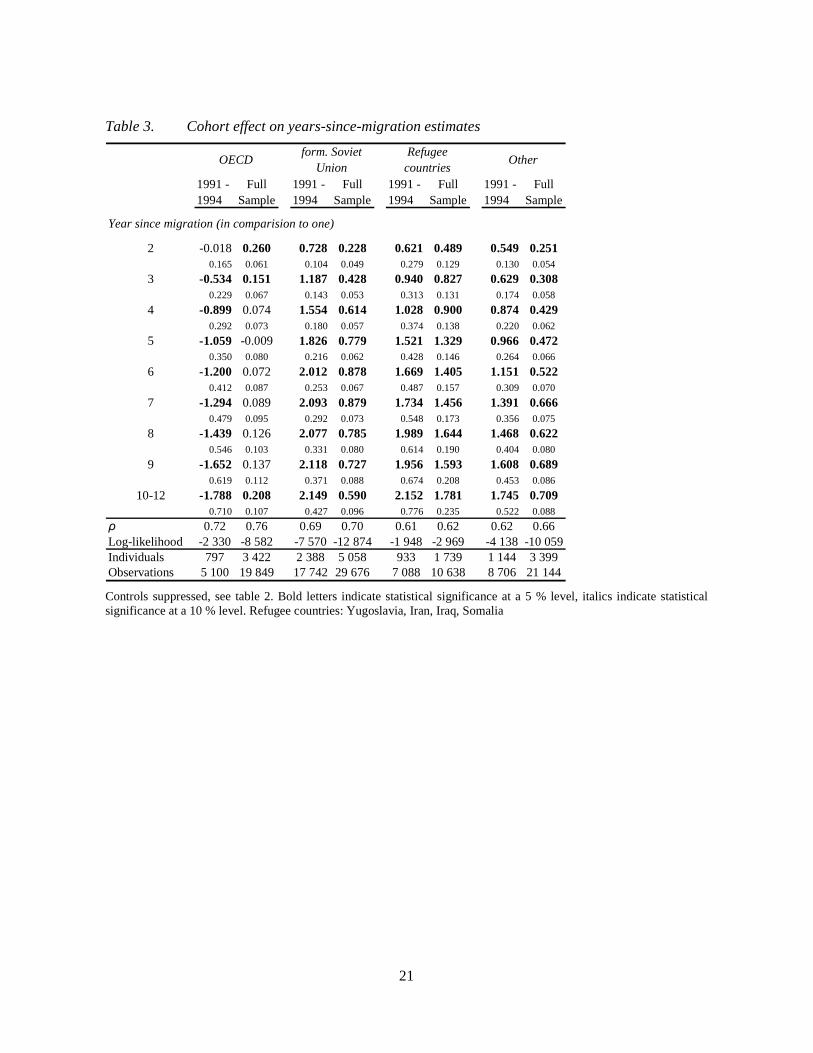
For immigrants from Russia and Estonia the parameter estimates of the years-since-migration
dummies peak after six to seven years after which they start to decline. A decline is more
pronounced in the case of men, the parameter estimates turning to insignificance after 9 years. This
finding is likely to reflect the institutional changes that took place in the late 1980s and early 1990s.
That is, for the first time in seven decades relatively large number of individuals born in the former
Soviet Union, most notably the ethnic-Finns, were able to immigrate to Finland. As a result a large
share of immigrants from the former Soviet Union immigrated in 1990–1994, i.e. in a period of
severe recession. If the recession lowered the assimilation capacity of these individuals or if these
cohorts were of lesser quality in terms of potential for labour market success compared to those who
immigrated during the subsequent boom of late 1990s, it will be reflected in the estimates for the
years-since-migration dummies. It should be noted that when the model is estimated separately for
the 1991–1994 cohort, the decline of the years-since-migration parameters disappears (see table 3).
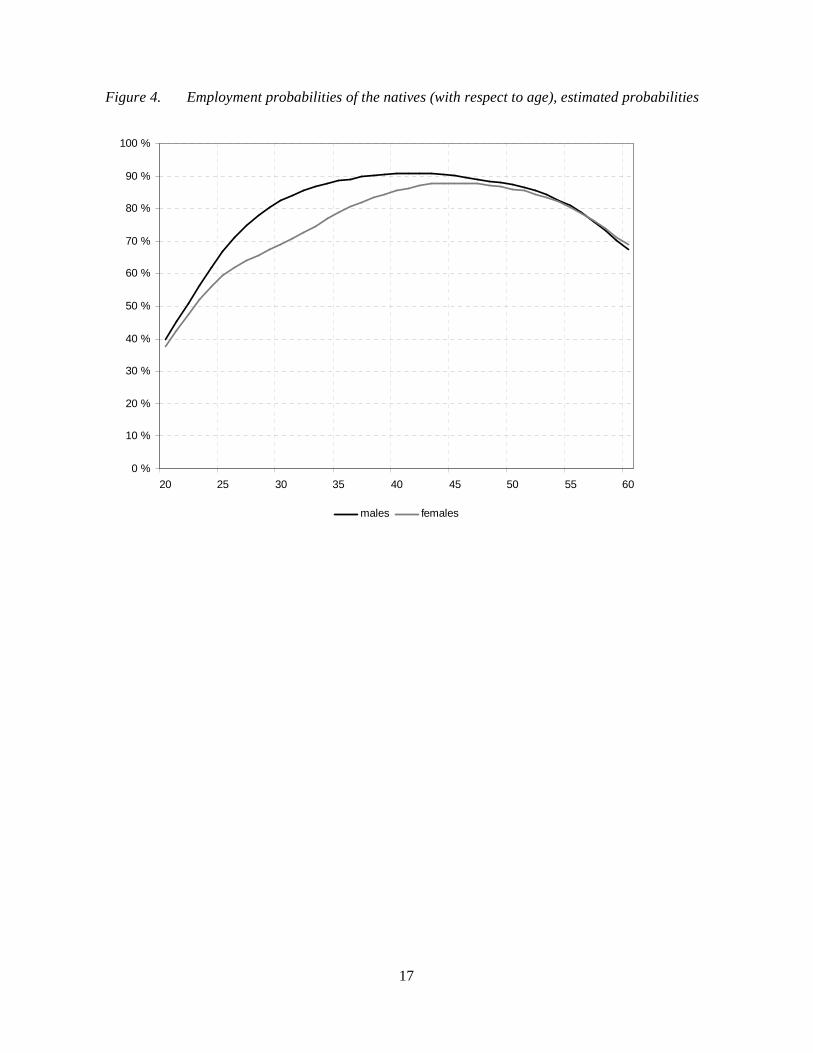
The virtue of estimating the model for several immigrant groups is well illustrated in Figure 3,
which describes the evolution of employment probabilities over time spent in Finland. The bold line
is obtained by calculating the probability of being employed for each observation (controlling for
business cycle), and taking averages. Findings indicate that males are more likely than females to be
employed regardless of the source country or years-since-migration. The employment probability
during the first year in Finland ranges from almost fifty percent for a male born in an OECD-
country to two percent for refugee females. Furthermore, time spent in Finland increases the
employment probability for all groups. The rise is the largest among males and females immigrants
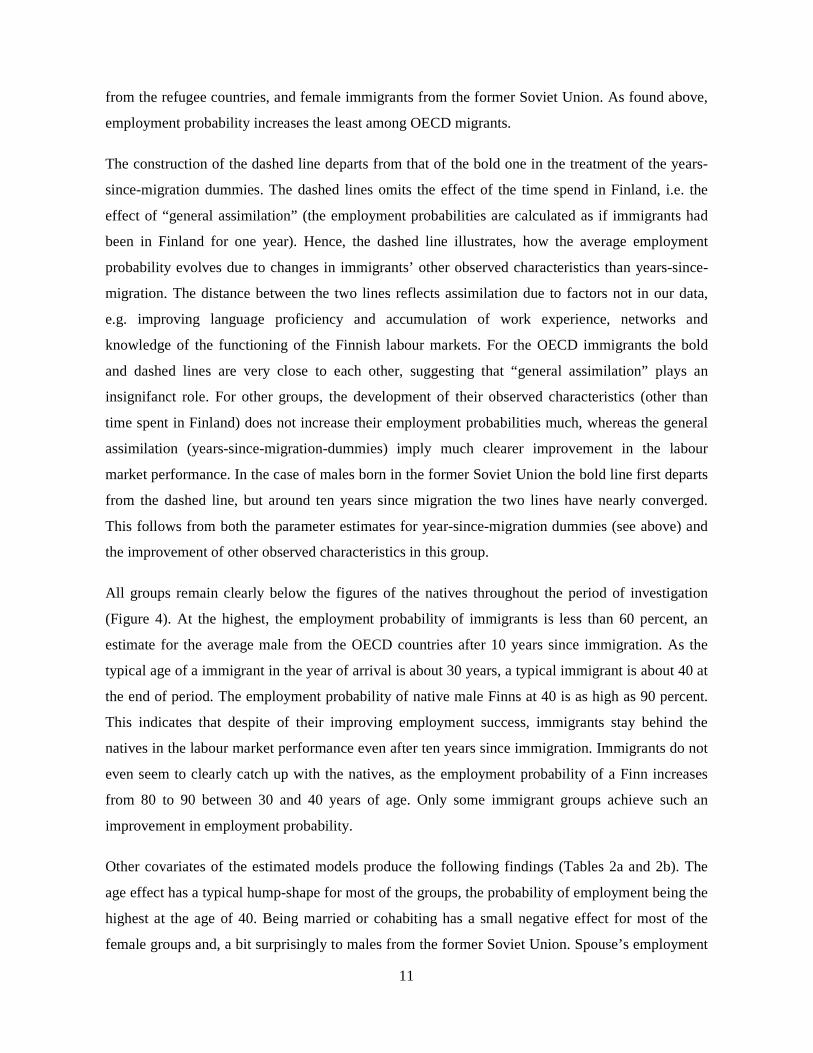
11
from the refugee countries, and female immigrants from the former Soviet Union. As found above,
employment probability increases the least among OECD migrants.
The construction of the dashed line departs from that of the bold one in the treatment of the years-
since-migration dummies. The dashed lines omits the effect of the time spend in Finland, i.e. the
effect of “general assimilation” (the employment probabilities are calculated as if immigrants had
been in Finland for one year). Hence, the dashed line illustrates, how the average employment
probability evolves due to changes in immigrants’ other observed characteristics than years-since-
migration. The distance between the two lines reflects assimilation due to factors not in our data,
e.g. improving language proficiency and accumulation of work experience, networks and
knowledge of the functioning of the Finnish labour markets. For the OECD immigrants the bold
and dashed lines are very close to each other, suggesting that “general assimilation” plays an
insignifanct role. For other groups, the development of their observed characteristics (other than
time spent in Finland) does not increase their employment probabilities much, whereas the general
assimilation (years-since-migration-dummies) imply much clearer improvement in the labour
market performance. In the case of males born in the former Soviet Union the bold line first departs
from the dashed line, but around ten years since migration the two lines have nearly converged.
This follows from both the parameter estimates for year-since-migration dummies (see above) and
the improvement of other observed characteristics in this group.
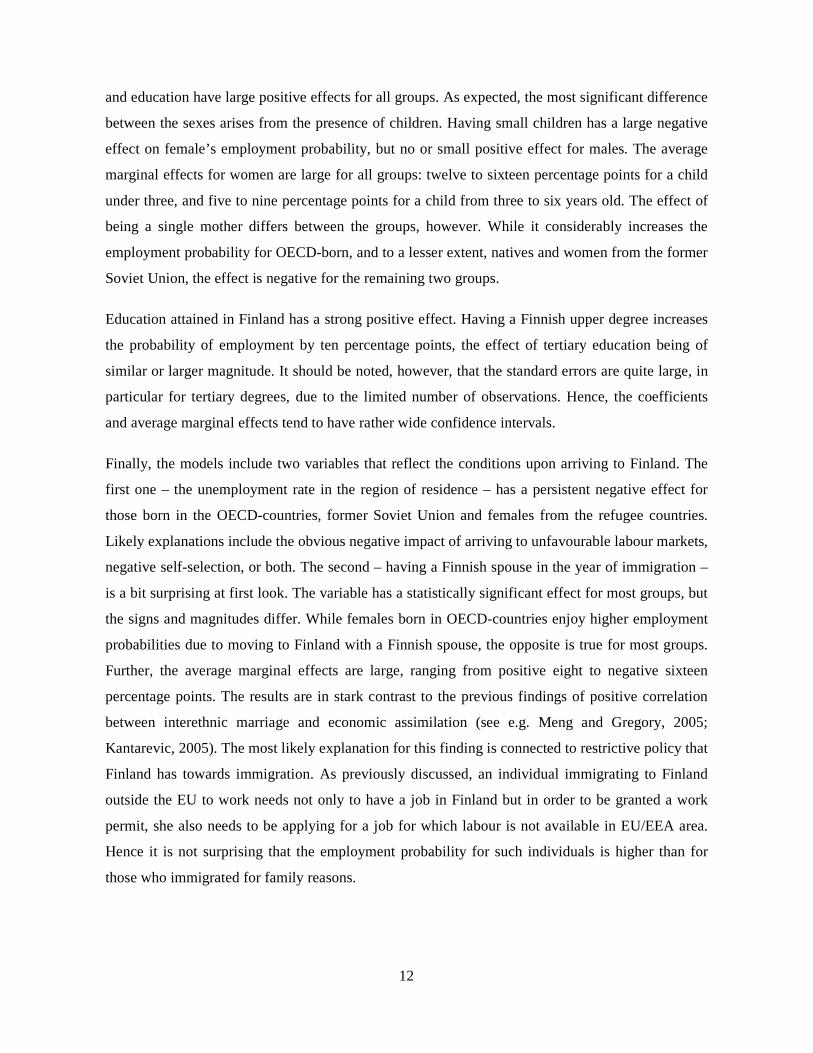
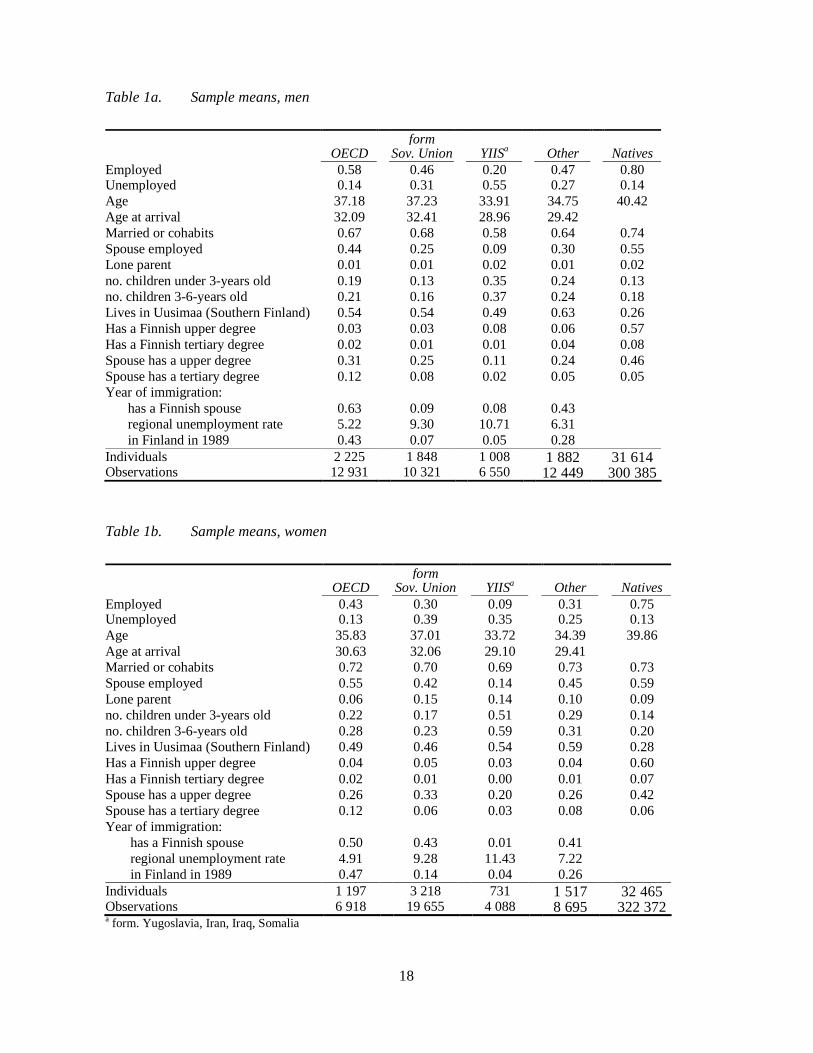
All groups remain clearly below the figures of the natives throughout the period of investigation
(Figure 4). At the highest, the employment probability of immigrants is less than 60 percent, an
estimate for the average male from the OECD countries after 10 years since immigration. As the
typical age of a immigrant in the year of arrival is about 30 years, a typical immigrant is about 40 at
the end of period. The employment probability of native male Finns at 40 is as high as 90 percent.
This indicates that despite of their improving employment success, immigrants stay behind the
natives in the labour market performance even after ten years since immigration. Immigrants do not
even seem to clearly catch up with the natives, as the employment probability of a Finn increases
from 80 to 90 between 30 and 40 years of age. Only some immigrant groups achieve such an
improvement in employment probability.
Other covariates of the estimated models produce the following findings (Tables 2a and 2b). The
age effect has a typical hump-shape for most of the groups, the probability of employment being the
highest at the age of 40. Being married or cohabiting has a small negative effect for most of the
female groups and, a bit surprisingly to males from the former Soviet Union. Spouse’s employment
12
and education have large positive effects for all groups. As expected, the most significant difference
between the sexes arises from the presence of children. Having small children has a large negative
effect on female’s employment probability, but no or small positive effect for males. The average
marginal effects for women are large for all groups: twelve to sixteen percentage points for a child
under three, and five to nine percentage points for a child from three to six years old. The effect of
being a single mother differs between the groups, however. While it considerably increases the
employment probability for OECD-born, and to a lesser extent, natives and women from the former
Soviet Union, the effect is negative for the remaining two groups.
Education attained in Finland has a strong positive effect. Having a Finnish upper degree increases
the probability of employment by ten percentage points, the effect of tertiary education being of
similar or larger magnitude. It should be noted, however, that the standard errors are quite large, in
particular for tertiary degrees, due to the limited number of observations. Hence, the coefficients
and average marginal effects tend to have rather wide confidence intervals.
Finally, the models include two variables that reflect the conditions upon arriving to Finland. The
first one – the unemployment rate in the region of residence – has a persistent negative effect for
those born in the OECD-countries, former Soviet Union and females from the refugee countries.
Likely explanations include the obvious negative impact of arriving to unfavourable labour markets,
negative self-selection, or both. The second – having a Finnish spouse in the year of immigration –
is a bit surprising at first look. The variable has a statistically significant effect for most groups, but
the signs and magnitudes differ. While females born in OECD-countries enjoy higher employment
probabilities due to moving to Finland with a Finnish spouse, the opposite is true for most groups.
Further, the average marginal effects are large, ranging from positive eight to negative sixteen
percentage points. The results are in stark contrast to the previous findings of positive correlation
between interethnic marriage and economic assimilation (see e.g. Meng and Gregory, 2005;
Kantarevic, 2005). The most likely explanation for this finding is connected to restrictive policy that
Finland has towards immigration. As previously discussed, an individual immigrating to Finland
outside the EU to work needs not only to have a job in Finland but in order to be granted a work
permit, she also needs to be applying for a job for which labour is not available in EU/EEA area.
Hence it is not surprising that the employment probability for such individuals is higher than for
those who immigrated for family reasons.
13
6. Concluding remarks
This paper investigated the employment assimilation of immigrants who entered Finland between
1990 and 2002. Immigrant groups were classified into four categories: OECD, former Soviet Union,
Refugee Countries, and others. Our main finding is that the employment probability of immigrants
clearly improves over time spent in Finland. However, immigrant groups differ in their assimilation
process, and their employment probability stays substantially lower than that of the natives’ even
after ten years. Further, as employment probability of the comparison group improves over time,
immigrants do not appear to be closing the employment gap to the natives over the time spent in
Finland.
Males from the OECD were found to be the most successful group of immigrants: their
employment probability ranges between 50 and 60 percent during the ten first years since
immigration. Immigrants from the refugee countries have the poorest performance throughout the
period. However, their employment probability rises from less than 10 percent in the first year up to
more than 20 percent in the tenth year.
The results presented here have important policy implications. First, the major differences between
native Finns and immigrants consist of the low labour force participation rate and continually
below-average employment rate of the immigrants. Hence, creating policy measures to improve the
labour market assimilation of immigrants is of primary importance. Related to this, further studies
are necessary to understand the mechanisms behind assimilation. Particularly in the Finnish context,
language proficiency might be of major importance. Further objectives for research include the
effect of non-random re-emigration on the estimated assimilation profile, and assimilation from the
point of view of earnings.
References
Arai and Vilhelmsson (2004) Immigrants’ and natives’ unemployment risk: Productivity differentials or discrimination, Industrial Relations, 43, 3, 690-698.
Arulampalam, W. and Booth, A.L. (2000), Union Status of Young Men in Britain: A Decade of Change, Journal of Applied Econometrics, 15, 289-310.
Bauer and Zimmermann (1999) Assessment of Possible Migration Pressure and its Labour Market Impact Following EU Enlargement to Central and Eastern Europe, IZA research Reports no.3.
Bell (1997) The Performance of Immigrants in the United Kingdom: Evidence from the GHS, Economic Journal, 107, 333-344.
14
Bellemare (2003) Economic Assimilation and Outmigration of Immigrants in West-Germany, Tilburg University, CentER Discussion Paper No. 65.
Borjas (1994) The economics of immigration, Journal of Economic Literature, 32, 4, 1667-1717.
Butler, J.S. and Moffitt, R. (1982), A Computationally Efficient Quadrature Procedure for the One-Factor Multinomial Probit model, Econometrica, 50, 761-764.
Chamberlain G. (1984), Panel Data, in Griliches, Z. and Intriligator, M.D. (eds.) Handbook of Econometrics, vol. 2, North-Holland, Amsterdam.
Chiswick (1978) The Effect of Americanization on the Earnings of Foreign-born Men, Journal of Political Economy, 86, 5, 897-921.
Constant and Massey (2003) Self-Selection, Earnings, and Out-Migration: A Longitudinal Study of Immigrants to Germany, Journal of Population Economics, 16, 631-653.
Edin, LaLonde and Åslund (2000) Emigration of Immigrants and Measures of Immigrant Assimilation: Evidence from Sweden, Swedish Economic Policy Review, 7, 2, 163-204.
Hansen and Lofstrom (2003) Immigrant Assimilation and Welfare Participation: Do Immigrants Assimilate Into or Out-of Welfare?, Journal of Human Resources, 38, 1, 74-98.
Heckman, J.J. and Willis, R. (1976), Estimation of a Stochastic Model of Reproduction: An Econometric Approach, in Terleckyj, N. Household Production and Consumption, NBER, New York
Hsiao, C. (1986), Analysis of Panel Data, Cambridge University Press, Cambridge.
Hsiao, C. (1991), Logit and Probit Models, in Matyas, L. and Sevestre, P. (eds.) The Econometrics of Panel Data, Kluwer Academic Publishers, Dordrecht.
Husted, L., H. S. Nielsen, M. Rosholm and N. Smith (2001), Employment and Wage Assimilation of Male First Generation Immigrants in Denmark. International Journal of Manpower 22: 39-68
Kantarevic J. (2005): Interethnic Marriages and Economic Assimilation of Immigrants. IZA Working Papers series. No. 1142.
LaLonde and Topel (1992) The Assimilation of Immigrants in the U S Labor Market, In G. J. Borjas and R. B. Freeman (eds.), Immigration and the work force: Economic consequences for the United States and source areas. Chicago and London: University of Chicago Press, 67-92.
Meng and Gregory (2005): Intermarriage and the Economic Assimilation of Immigrants. Journal of Labor Economics 23:135–174
Ministry of Labour (1998). Inkerinsuomalaisten maahanmuutto Suomeen 1990-luvulla. Työministeri Liisa Jaakonsaaren Eduskunnan ulkasiainvaliokunnalle 9.12.1998 antama Suomen hallituksen selonteko.
Mundlak, Y. (1978), On the Pooling of Time Series and Cross-section Data, Econometrica, 46, 69-85.
15
Figure 1. Emigration from and immigration to Finland, 1945–2004
-40 000
-30 000
-20 000
-10 000
0
10 000
20 000
30 000
40 000
50 000
60 000
1945 1950 1955 1960 1965 1970 1975 1980 1985 1990 1995 2000
Immigration Emigration Net
Source: Institute of Migration
Figure 2. Cumulative emigration of immigrants (with respect to years-since-migration)
0 %
10 %
20 %
30 %
40 %
50 %
60 %
1 2 3 4 5 6 7 8 9 10 11 12
year-since-migrationOECD form. Soviet Union Refugee countries Other
16
Figure 3. Employment probabilities of immigrants (with respect to years-since-migration), estimated probabilities
OECD
0 %
10 %
20 %
30 %
40 %
50 %
60 %
1 2 3 4 5 6 7 8 9 10
form. Soviet Union
0 %
10 %
20 %
30 %
40 %
50 %
60 %
1 2 3 4 5 6 7 8 9 10years-since-migration
Refugee countries
0 %
10 %
20 %
30 %
40 %
50 %
60 %
1 2 3 4 5 6 7 8 9 10
males females
Other
0 %
10 %
20 %
30 %
40 %
50 %
60 %
1 2 3 4 5 6 7 8 9 10years-since-migration
males, no ysm effects females, no ysm effects
17
Figure 4. Employment probabilities of the natives (with respect to age), estimated probabilities
0 %
10 %
20 %
30 %
40 %
50 %
60 %
70 %
80 %
90 %
100 %
20 25 30 35 40 45 50 55 60
males females
18
Table 1a. Sample means, men
form OECD Sov. Union YIISa Other Natives Employed 0.58 0.46 0.20 0.47 0.80 Unemployed 0.14 0.31 0.55 0.27 0.14 Age 37.18 37.23 33.91 34.75 40.42 Age at arrival 32.09 32.41 28.96 29.42 Married or cohabits 0.67 0.68 0.58 0.64 0.74 Spouse employed 0.44 0.25 0.09 0.30 0.55 Lone parent 0.01 0.01 0.02 0.01 0.02 no. children under 3-years old 0.19 0.13 0.35 0.24 0.13 no. children 3-6-years old 0.21 0.16 0.37 0.24 0.18 Lives in Uusimaa (Southern Finland) 0.54 0.54 0.49 0.63 0.26 Has a Finnish upper degree 0.03 0.03 0.08 0.06 0.57 Has a Finnish tertiary degree 0.02 0.01 0.01 0.04 0.08 Spouse has a upper degree 0.31 0.25 0.11 0.24 0.46 Spouse has a tertiary degree 0.12 0.08 0.02 0.05 0.05 Year of immigration:
has a Finnish spouse 0.63 0.09 0.08 0.43 regional unemployment rate 5.22 9.30 10.71 6.31 in Finland in 1989 0.43 0.07 0.05 0.28
Individuals 2 225 1 848 1 008 1 882 31 614 Observations 12 931 10 321 6 550 12 449 300 385
Table 1b. Sample means, women
form OECD Sov. Union YIISa Other Natives Employed 0.43 0.30 0.09 0.31 0.75 Unemployed 0.13 0.39 0.35 0.25 0.13 Age 35.83 37.01 33.72 34.39 39.86 Age at arrival 30.63 32.06 29.10 29.41 Married or cohabits 0.72 0.70 0.69 0.73 0.73 Spouse employed 0.55 0.42 0.14 0.45 0.59 Lone parent 0.06 0.15 0.14 0.10 0.09 no. children under 3-years old 0.22 0.17 0.51 0.29 0.14 no. children 3-6-years old 0.28 0.23 0.59 0.31 0.20 Lives in Uusimaa (Southern Finland) 0.49 0.46 0.54 0.59 0.28 Has a Finnish upper degree 0.04 0.05 0.03 0.04 0.60 Has a Finnish tertiary degree 0.02 0.01 0.00 0.01 0.07 Spouse has a upper degree 0.26 0.33 0.20 0.26 0.42 Spouse has a tertiary degree 0.12 0.06 0.03 0.08 0.06 Year of immigration:
has a Finnish spouse 0.50 0.43 0.01 0.41 regional unemployment rate 4.91 9.28 11.43 7.22 in Finland in 1989 0.47 0.14 0.04 0.26
Individuals 1 197 3 218 731 1 517 32 465 Observations 6 918 19 655 4 088 8 695 322 372 a form. Yugoslavia, Iran, Iraq, Somalia
19
Table 2a.. Estimates, males
OECD Other Natives
coeff. std.err.AMEa coeff. std.err. AMEa coeff. std.err. AMEa coeff. std.err. AMEa coeff. std.err. AMEa
Year since migration (in comparision to one)2 0.277 0.074 0.048 0.187 0.075 0.035 0.434 0.148 0.044 0.275 0.071 0.0563 0.173 0.080 0.030 0.411 0.081 0.077 0.761 0.147 0.086 0.342 0.075 0.0714 0.104 0.088 0.018 0.550 0.087 0.103 0.810 0.152 0.093 0.416 0.080 0.0865 -0.064 0.096 -0.011 0.634 0.093 0.119 1.183 0.154 0.152 0.415 0.084 0.0866 0.039 0.103 0.007 0.656 0.099 0.123 1.158 0.160 0.147 0.390 0.088 0.0807 0.047 0.113 0.008 0.582 0.106 0.109 1.175 0.169 0.150 0.514 0.092 0.1068 0.062 0.123 0.011 0.463 0.115 0.087 1.316 0.180 0.175 0.441 0.097 0.0919 0.068 0.136 0.012 0.319 0.126 0.060 1.253 0.189 0.164 0.447 0.105 0.09210-12 0.213 0.130 0.037 0.101 0.135 0.019 1.325 0.207 0.176 0.432 0.104 0.089in Finland in 1989 0.316 0.166 0.055 -0.208 0.235 -0.038 1.834 0.360 0.275 0.520 0.141 0.108
Observed characteristicsage 0.145 0.025 0.000 0.099 0.024 0.001 0.082 0.038 -0.003 0.037 0.024 -0.004 0.334 0.005 0.001age squared (/100) -0.192 0.031 -0.133 0.031 -0.154 0.052 -0.086 0.032 -0.409 0.006married or cohabits 0.021 0.079 0.004 -0.116 0.082 -0.022 -0.022 0.102 -0.003 -0.050 0.061 -0.010 -0.014 0.020 -0.002spouse employed 0.301 0.061 0.052 0.614 0.063 0.119 0.580 0.116 0.097 0.491 0.052 0.103 0.276 0.014 0.033lone parent 0.088 0.228 0.015 0.003 0.252 0.001 -0.367 0.281 -0.051 0.155 0.212 0.032 0.102 0.046 0.012# children under 3-years old 0.002 0.051 0.000 0.057 0.070 0.010 0.015 0.062 0.003 -0.013 0.043 -0.003 0.138 0.014 0.019# children 3-6-years old 0.009 0.046 0.001 -0.029 0.059 -0.005 -0.007 0.055 -0.001 0.019 0.040 0.004 0.063 0.012 0.009Lives in Southern Finland (Uusimaa) 0.486 0.145 0.083 0.238 0.131 0.045 0.446 0.139 0.067 0.234 0.096 0.049 0.394 0.032 0.045Has a Finnish upper degree 0.619 0.151 0.102 0.484 0.155 0.091 0.688 0.146 0.115 0.589 0.100 0.122 0.473 0.021 0.057Has a Finnish tertiary degree 0.708 0.201 0.116 -0.221 0.345 -0.042 0.337 0.346 0.054 -0.051 0.118 -0.011 1.166 0.037 0.112Spouse has a upper degree 0.024 0.079 0.004 0.110 0.077 0.021 0.121 0.126 0.019 -0.058 0.065 -0.012 0.116 0.019 0.014Spouse has a tertiary degree 0.316 0.113 0.054 0.002 0.111 0.000 -0.399 0.300 -0.055 0.100 0.113 0.021 0.084 0.039 0.010
Year of immigration:regional unemployment rate -0.031 0.013 -0.015 -0.057 0.012 -0.004 0.001 0.013 -0.007 -0.010 0.010 -0.002has a Finnish spouse -0.645 0.121 -0.107 -0.569 0.182 -0.106 -0.028 0.226 -0.004 -0.793 0.096 -0.163
ρ
Log-likelihoodIndividualsObservations
Refugee countriesb
300 38512 931 10 321 6 550 12 449
-88 6442 225 1 848 1 008 1 882 31 614-5 517 -4 842 -2 203 -6 1130.77 0.71 0.62 0.68 0.73
form. Soviet Union
Year dummies, constant term and means of time-varying variables (excluding age) suppressed. Bold letters indicate statistical significance at a 5 % level, italics indicate statistical significance at a 10 % level. a Average marginal effect, see text. b form. Yugoslavia, Iran, Iraq, Somalia

20
Table 2b. Estimates, females
OECD Other Natives
coeff. std.err.AMEa coeff. std.err. AMEa coeff. std.err. AMEa coeff. std.err. AMEa coeff. std.err. AMEa
Year since migration (in comparision to one)2 0.194 0.109 0.033 0.271 0.065 0.039 0.715 0.279 0.031 0.227 0.086 0.0363 0.026 0.122 0.004 0.449 0.068 0.066 0.968 0.288 0.047 0.229 0.093 0.0364 -0.120 0.134 -0.020 0.672 0.071 0.104 0.990 0.294 0.048 0.426 0.098 0.0705 -0.036 0.145 -0.006 0.890 0.074 0.142 1.474 0.294 0.087 0.476 0.105 0.0796 -0.023 0.161 -0.004 1.035 0.076 0.169 1.720 0.303 0.111 0.608 0.111 0.1047 -0.102 0.171 -0.017 1.079 0.080 0.177 1.800 0.311 0.120 0.754 0.119 0.1328 -0.043 0.183 -0.007 0.996 0.085 0.161 1.978 0.326 0.140 0.712 0.127 0.1249 -0.135 0.193 -0.023 0.987 0.091 0.160 1.828 0.344 0.123 0.824 0.135 0.14610-12 -0.246 0.182 -0.041 0.875 0.095 0.139 2.083 0.370 0.153 0.824 0.133 0.146in Finland in 1989 -0.128 0.222 -0.022 0.672 0.149 0.104 1.473 0.522 0.087 1.127 0.176 0.208
Observed characteristicsage 0.057 0.034 0.002 0.076 0.020 -0.001 0.062 0.065 -0.003 0.036 0.028 -0.003 0.305 0.004 0.003age squared (/100) -0.062 0.044 -0.115 0.026 -0.127 0.087 -0.079 0.038 -0.342 0.005married or cohabits -0.069 0.136 -0.012 -0.086 0.076 -0.015 -0.354 0.234 -0.031 -0.254 0.100 -0.047 -0.068 0.021 -0.010spouse employed 0.646 0.097 0.112 0.376 0.046 0.065 0.227 0.163 0.020 0.541 0.070 0.102 0.278 0.014 0.041lone parent 0.563 0.161 0.097 0.118 0.081 0.020 -0.525 0.296 -0.040 -0.350 0.125 -0.062 0.094 0.022 0.014# children under 3-years old -0.796 0.069 -0.132 -0.888 0.053 -0.149 -0.761 0.151 -0.122 -0.785 0.060 -0.158 -0.759 0.010 -0.119# children 3-6-years old -0.299 0.054 -0.049 -0.289 0.042 -0.049 -0.301 0.114 -0.048 -0.464 0.052 -0.093 -0.288 0.009 -0.045Lives in Southern Finland (Uusimaa) 0.659 0.199 0.110 0.324 0.091 0.055 0.479 0.428 0.040 0.122 0.133 0.022 0.499 0.028 0.070Has a Finnish upper degree 0.494 0.177 0.085 0.524 0.092 0.093 1.091 0.277 0.118 0.498 0.150 0.097 0.598 0.017 0.090Has a Finnish tertiary degree 0.791 0.240 0.136 1.043 0.201 0.194 0.825 0.559 0.085 0.393 0.201 0.076 1.337 0.032 0.157Spouse has a upper degree 0.257 0.116 0.044 0.080 0.058 0.014 0.549 0.194 0.051 -0.051 0.087 -0.009 0.030 0.018 0.004Spouse has a tertiary degree 0.264 0.141 0.045 0.424 0.102 0.075 0.363 0.360 0.033 -0.151 0.121 -0.027 -0.073 0.032 -0.011
Year of immigration:regional unemployment rate -0.093 0.018 -0.015 -0.024 0.009 -0.004 -0.044 0.020 -0.007 -0.011 0.012 -0.002has a Finnish spouse 0.488 0.154 0.084 -0.271 0.075 -0.045 1.077 0.587 0.117 -0.092 0.103 -0.017
ρ
Log-likelihoodIndividualsObservations
0.76
form. Soviet Union Refugee countriesb
0.730.640.640.68
322 372
-725-8 011-2 934
6 918 19 655 4 088 8 695
-3 786 -114 8871 197 3 218 731 1 517 32 465
Year dummies, constant term and means of time-varying variables (excluding age) suppressed. Bold letters indicate statistical significance at a 5 % level, italics indicate statistical significance at a 10 % level. a Average marginal effect, see text. b form. Yugoslavia, Iran, Iraq, Somalia
21
Table 3. Cohort effect on years-since-migration estimates
1991 - 1994
Full Sample
1991 - 1994
Full Sample
1991 - 1994
Full Sample
1991 - 1994
Full Sample
Year since migration (in comparision to one)
2 -0.018 0.260 0.728 0.228 0.621 0.489 0.549 0.2510.165 0.061 0.104 0.049 0.279 0.129 0.130 0.054
3 -0.534 0.151 1.187 0.428 0.940 0.827 0.629 0.3080.229 0.067 0.143 0.053 0.313 0.131 0.174 0.058
4 -0.899 0.074 1.554 0.614 1.028 0.900 0.874 0.4290.292 0.073 0.180 0.057 0.374 0.138 0.220 0.062
5 -1.059 -0.009 1.826 0.779 1.521 1.329 0.966 0.4720.350 0.080 0.216 0.062 0.428 0.146 0.264 0.066
6 -1.200 0.072 2.012 0.878 1.669 1.405 1.151 0.5220.412 0.087 0.253 0.067 0.487 0.157 0.309 0.070
7 -1.294 0.089 2.093 0.879 1.734 1.456 1.391 0.6660.479 0.095 0.292 0.073 0.548 0.173 0.356 0.075
8 -1.439 0.126 2.077 0.785 1.989 1.644 1.468 0.6220.546 0.103 0.331 0.080 0.614 0.190 0.404 0.080
9 -1.652 0.137 2.118 0.727 1.956 1.593 1.608 0.6890.619 0.112 0.371 0.088 0.674 0.208 0.453 0.086
10-12 -1.788 0.208 2.149 0.590 2.152 1.781 1.745 0.7090.710 0.107 0.427 0.096 0.776 0.235 0.522 0.088
ρ 0.72 0.76 0.69 0.70 0.61 0.62 0.62 0.66Log-likelihood -2 330 -8 582 -7 570 -12 874 -1 948 -2 969-4 138 -10 059Individuals 797 3 422 2 388 5 058 933 1 739 1 144 3 399Observations 5 100 19 849 17 742 29 676 7 088 10 638 8 706 21 144
Refugee countries
Otherform. Soviet
UnionOECD
Controls suppressed, see table 2. Bold letters indicate statistical significance at a 5 % level, italics indicate statistical significance at a 10 % level. Refugee countries: Yugoslavia, Iran, Iraq, Somalia