
legislative mandates guiding the greater yellowstone network
468
Vital Signs Monitoring Plan • 1 The legislative mandates and directives guiding the I&M Program, and the GRYN in particular, can be divided into several sections: 1) legislative acts; 2) Executive Orders; 3) NPS management policies and directives; and 4) enabling legislation specific to the network parks. General legislative acts guiding the I&M Program include the National Park Service Organic Act of 1916 and the National Parks Omnibus Management Act of 1998, which led to the creation of the Natural Resource Challenge in 2000. Many specific legislative acts, such as the Geothermal Steam Act, guide the protection and/ or monitoring of certain natural resources within park boundaries. The directives system, including Executive Orders, (issued by the President of the United States) and Director’s Orders (issued by Associate Directors of the National Park Service), is designed to provide NPS management and staff with clear and continuously updated information on NPS policy and required and/or recom- mended actions. The enabling legislation of an individual park provides insight into the natural and cultural resources and resource values for which it was created to preserve. Along with national legislation, policy and guidance, a park’s enabling legislation provides justifi- cation and, in some cases, specific guidance for the direction and emphasis of resource management programs, including inventory and monitoring. The Government Performance and Results Act (GPRA) is par- ticularly important because of its central role in agency operations and its relationship to the monitoring program. GRPA requires that the NPS set goals for strategic and annual performance plans and report results. In 2001 the National Park Service developed a na- tional strategic plan identifying key goals to be met. The following legislation, policy and executive guidance all have an important and direct bearing on the development and implementation of natural resource monitoring in the national parks. Relevant federal legal mandates and specific natural re- source GPRA goals relevant to GRYN parks are summarized in the following table. APPENDIX I: LEGISLATIVE MANDATES GUIDING THE GREATER YELLOWSTONE NETWORK Legislative Acts Summary content National Park Service Organic Act (16 U.S.C. § 1-4 [2000]) This Act created the National Park Service within the U.S. Department of the Interior and gave it jurisdiction over parks, monuments, and reservations acquired by the U.S. government for the purpose of wilderness conservation and public enjoyment. “The service thus established shall promote and regulate the use of the Federal areas known as national parks, monuments, and reservations hereinafter specified by such means and measures as conform to the fundamental purposes of the said parks, monuments, and measures as conform to the fundamental purposes of the said parks, monuments, and reservations, which purpose is to conserve the scenery and the natural and historic objects and the wildlife therein and to provide for the enjoyment of the same in such manner and by such means as will leave them unimpaired for the enjoyment of future generations” (16 U.S.C. § 1 [2000]). National Park System General Authorities Act of 1970 (16 U.S.C. § 1a-1 – 1a-7 [2000]) The General Authorities Act amends the Organic Act to unite individual parks into the ‘National Park System’. The act states that areas of the National Park System, “though distinct in character, are united through their inter-related purposes and resources into one national park system as cumulative expressions of a single national heritage; that individually and collectively, these areas derive increased national dignity and recognition of their superb environmental quality through their inclusion jointly with each other in one national park system preserved and managed for the benefit and inspiration of all the people of the United States…” (16 U.S.C. § 1a-1 [2000]).
-
Upload
khangminh22 -
Category
Documents
-
view
0 -
download
0
Transcript of legislative mandates guiding the greater yellowstone network

Vital Signs Monitoring Plan • 1
The legislative mandates and directives guiding the I&M Program,
and the GRYN in particular, can be divided into several sections: 1)
legislative acts; 2) Executive Orders; 3) NPS management policies
and directives; and 4) enabling legislation specific to the network
parks.
General legislative acts guiding the I&M Program include the
National Park Service Organic Act of 1916 and the National Parks
Omnibus Management Act of 1998, which led to the creation of
the Natural Resource Challenge in 2000. Many specific legislative
acts, such as the Geothermal Steam Act, guide the protection and/
or monitoring of certain natural resources within park boundaries.
The directives system, including Executive Orders, (issued by
the President of the United States) and Director’s Orders (issued
by Associate Directors of the National Park Service), is designed
to provide NPS management and staff with clear and continuously
updated information on NPS policy and required and/or recom-
mended actions.
The enabling legislation of an individual park provides insight
into the natural and cultural resources and resource values for
which it was created to preserve. Along with national legislation,
policy and guidance, a park’s enabling legislation provides justifi-
cation and, in some cases, specific guidance for the direction and
emphasis of resource management programs, including inventory
and monitoring.
The Government Performance and Results Act (GPRA) is par-
ticularly important because of its central role in agency operations
and its relationship to the monitoring program. GRPA requires that
the NPS set goals for strategic and annual performance plans and
report results. In 2001 the National Park Service developed a na-
tional strategic plan identifying key goals to be met.
The following legislation, policy and executive guidance all
have an important and direct bearing on the development and
implementation of natural resource monitoring in the national
parks. Relevant federal legal mandates and specific natural re-
source GPRA goals relevant to GRYN parks are summarized in the
following table.
APPENDIX I : LEGISLATIVE MANDATES GUIDING
THE GREATER YELLOWSTONE NETWORK
Legislative Acts Summary content
National Park Service Organic Act (16 U.S.C. § 1-4 [2000])
This Act created the National Park Service within the U.S. Department of the Interior and gave it jurisdiction over parks, monuments, and reservations acquired by the U.S. government for the purpose of wilderness conservation and public enjoyment. “The service thus established shall promote and regulate the use of the Federal areas known as national parks, monuments, and reservations hereinafter specified by such means and measures as conform to the fundamental purposes of the said parks, monuments, and measures as conform to the fundamental purposes of the said parks, monuments, and reservations, which purpose is to conserve the scenery and the natural and historic objects and the wildlife therein and to provide for the enjoyment of the same in such manner and by such means as will leave them unimpaired for the enjoyment of future generations” (16 U.S.C. § 1 [2000]).
National Park System General AuthoritiesAct of 1970(16 U.S.C. § 1a-1 – 1a-7 [2000])
The General Authorities Act amends the Organic Act to unite individual parks into the ‘National Park System’. The act states that areas of the National Park System, “though distinct in character, are united through their inter-related purposes and resources into one national park system as cumulative expressions of a single national heritage; that individually and collectively, these areas derive increased national dignity and recognition of their superb environmental quality through their inclusion jointly with each other in one national park system preserved and managed for the benefit and inspiration of all the people of the United States…” (16 U.S.C. § 1a-1 [2000]).
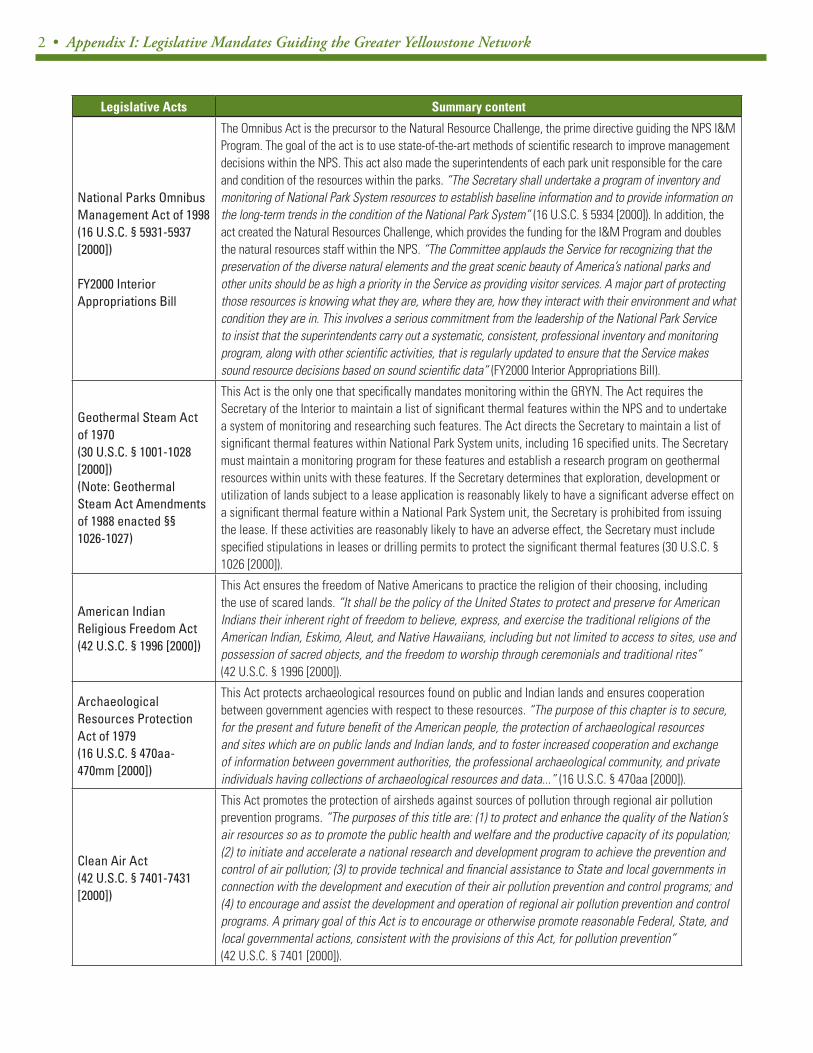
2 • Appendix I: Legislative Mandates Guiding the Greater Yellowstone Network
Legislative Acts Summary content
National Parks Omnibus Management Act of 1998(16 U.S.C. § 5931-5937 [2000])
FY2000 Interior Appropriations Bill
The Omnibus Act is the precursor to the Natural Resource Challenge, the prime directive guiding the NPS I&M Program. The goal of the act is to use state-of-the-art methods of scientific research to improve management decisions within the NPS. This act also made the superintendents of each park unit responsible for the care and condition of the resources within the parks. “The Secretary shall undertake a program of inventory and monitoring of National Park System resources to establish baseline information and to provide information on the long-term trends in the condition of the National Park System” (16 U.S.C. § 5934 [2000]). In addition, the act created the Natural Resources Challenge, which provides the funding for the I&M Program and doubles the natural resources staff within the NPS. “The Committee applauds the Service for recognizing that the preservation of the diverse natural elements and the great scenic beauty of America’s national parks and other units should be as high a priority in the Service as providing visitor services. A major part of protecting those resources is knowing what they are, where they are, how they interact with their environment and what condition they are in. This involves a serious commitment from the leadership of the National Park Service to insist that the superintendents carry out a systematic, consistent, professional inventory and monitoring program, along with other scientific activities, that is regularly updated to ensure that the Service makes sound resource decisions based on sound scientific data” (FY2000 Interior Appropriations Bill).
Geothermal Steam Act of 1970(30 U.S.C. § 1001-1028 [2000])(Note: Geothermal Steam Act Amendments of 1988 enacted §§ 1026-1027)
This Act is the only one that specifically mandates monitoring within the GRYN. The Act requires the Secretary of the Interior to maintain a list of significant thermal features within the NPS and to undertake a system of monitoring and researching such features. The Act directs the Secretary to maintain a list of significant thermal features within National Park System units, including 16 specified units. The Secretary must maintain a monitoring program for these features and establish a research program on geothermal resources within units with these features. If the Secretary determines that exploration, development or utilization of lands subject to a lease application is reasonably likely to have a significant adverse effect on a significant thermal feature within a National Park System unit, the Secretary is prohibited from issuing the lease. If these activities are reasonably likely to have an adverse effect, the Secretary must include specified stipulations in leases or drilling permits to protect the significant thermal features (30 U.S.C. § 1026 [2000]).
American Indian Religious Freedom Act(42 U.S.C. § 1996 [2000])
This Act ensures the freedom of Native Americans to practice the religion of their choosing, including the use of scared lands. “It shall be the policy of the United States to protect and preserve for American Indians their inherent right of freedom to believe, express, and exercise the traditional religions of the American Indian, Eskimo, Aleut, and Native Hawaiians, including but not limited to access to sites, use and possession of sacred objects, and the freedom to worship through ceremonials and traditional rites” (42 U.S.C. § 1996 [2000]).
Archaeological Resources Protection Act of 1979(16 U.S.C. § 470aa-470mm [2000])
This Act protects archaeological resources found on public and Indian lands and ensures cooperation between government agencies with respect to these resources. “The purpose of this chapter is to secure, for the present and future benefit of the American people, the protection of archaeological resources and sites which are on public lands and Indian lands, and to foster increased cooperation and exchange of information between government authorities, the professional archaeological community, and private individuals having collections of archaeological resources and data...” (16 U.S.C. § 470aa [2000]).
Clean Air Act(42 U.S.C. § 7401-7431 [2000])
This Act promotes the protection of airsheds against sources of pollution through regional air pollution prevention programs. “The purposes of this title are: (1) to protect and enhance the quality of the Nation’s air resources so as to promote the public health and welfare and the productive capacity of its population; (2) to initiate and accelerate a national research and development program to achieve the prevention and control of air pollution; (3) to provide technical and financial assistance to State and local governments in connection with the development and execution of their air pollution prevention and control programs; and (4) to encourage and assist the development and operation of regional air pollution prevention and control programs. A primary goal of this Act is to encourage or otherwise promote reasonable Federal, State, and local governmental actions, consistent with the provisions of this Act, for pollution prevention” (42 U.S.C. § 7401 [2000]).
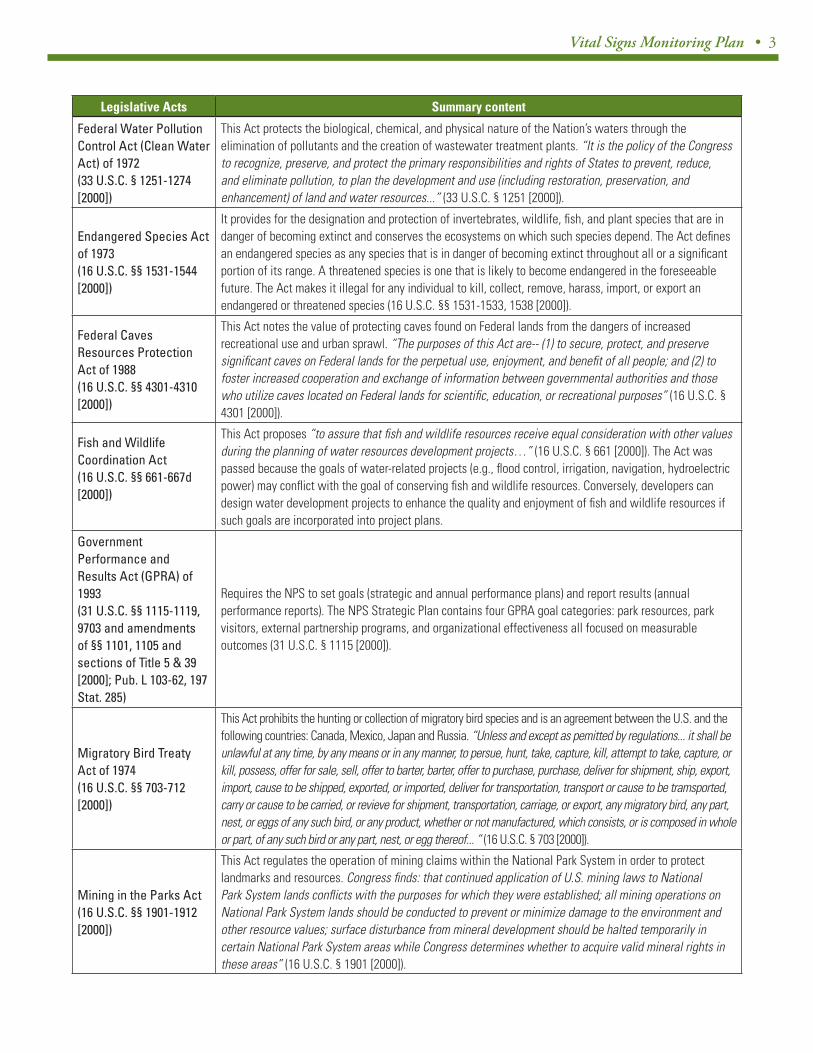
Vital Signs Monitoring Plan • 3
Legislative Acts Summary content
Federal Water Pollution Control Act (Clean Water Act) of 1972(33 U.S.C. § 1251-1274 [2000])
This Act protects the biological, chemical, and physical nature of the Nation’s waters through the elimination of pollutants and the creation of wastewater treatment plants. “It is the policy of the Congress to recognize, preserve, and protect the primary responsibilities and rights of States to prevent, reduce, and eliminate pollution, to plan the development and use (including restoration, preservation, and enhancement) of land and water resources...” (33 U.S.C. § 1251 [2000]).
Endangered Species Act of 1973(16 U.S.C. §§ 1531-1544 [2000])
It provides for the designation and protection of invertebrates, wildlife, fish, and plant species that are in danger of becoming extinct and conserves the ecosystems on which such species depend. The Act defines an endangered species as any species that is in danger of becoming extinct throughout all or a significant portion of its range. A threatened species is one that is likely to become endangered in the foreseeable future. The Act makes it illegal for any individual to kill, collect, remove, harass, import, or export an endangered or threatened species (16 U.S.C. §§ 1531-1533, 1538 [2000]).
Federal Caves Resources Protection Act of 1988(16 U.S.C. §§ 4301-4310 [2000])
This Act notes the value of protecting caves found on Federal lands from the dangers of increased recreational use and urban sprawl. “The purposes of this Act are-- (1) to secure, protect, and preserve significant caves on Federal lands for the perpetual use, enjoyment, and benefit of all people; and (2) to foster increased cooperation and exchange of information between governmental authorities and those who utilize caves located on Federal lands for scientific, education, or recreational purposes” (16 U.S.C. § 4301 [2000]).
Fish and Wildlife Coordination Act(16 U.S.C. §§ 661-667d [2000])
This Act proposes “to assure that fish and wildlife resources receive equal consideration with other values during the planning of water resources development projects…” (16 U.S.C. § 661 [2000]). The Act was passed because the goals of water-related projects (e.g., flood control, irrigation, navigation, hydroelectric power) may conflict with the goal of conserving fish and wildlife resources. Conversely, developers can design water development projects to enhance the quality and enjoyment of fish and wildlife resources if such goals are incorporated into project plans.
Government Performance and Results Act (GPRA) of 1993(31 U.S.C. §§ 1115-1119, 9703 and amendments of §§ 1101, 1105 and sections of Title 5 & 39 [2000]; Pub. L 103-62, 197 Stat. 285)
Requires the NPS to set goals (strategic and annual performance plans) and report results (annual performance reports). The NPS Strategic Plan contains four GPRA goal categories: park resources, park visitors, external partnership programs, and organizational effectiveness all focused on measurable outcomes (31 U.S.C. § 1115 [2000]).
Migratory Bird Treaty Act of 1974(16 U.S.C. §§ 703-712 [2000])
This Act prohibits the hunting or collection of migratory bird species and is an agreement between the U.S. and the following countries: Canada, Mexico, Japan and Russia. “Unless and except as pemitted by regulations... it shall be unlawful at any time, by any means or in any manner, to persue, hunt, take, capture, kill, attempt to take, capture, or kill, possess, offer for sale, sell, offer to barter, barter, offer to purchase, purchase, deliver for shipment, ship, export, import, cause to be shipped, exported, or imported, deliver for transportation, transport or cause to be tramsported, carry or cause to be carried, or revieve for shipment, transportation, carriage, or export, any migratory bird, any part, nest, or eggs of any such bird, or any product, whether or not manufactured, which consists, or is composed in whole or part, of any such bird or any part, nest, or egg thereof... “ (16 U.S.C. § 703 [2000]).
Mining in the Parks Act(16 U.S.C. §§ 1901-1912 [2000])
This Act regulates the operation of mining claims within the National Park System in order to protect landmarks and resources. Congress finds: that continued application of U.S. mining laws to National Park System lands conflicts with the purposes for which they were established; all mining operations on National Park System lands should be conducted to prevent or minimize damage to the environment and other resource values; surface disturbance from mineral development should be halted temporarily in certain National Park System areas while Congress determines whether to acquire valid mineral rights in these areas” (16 U.S.C. § 1901 [2000]).
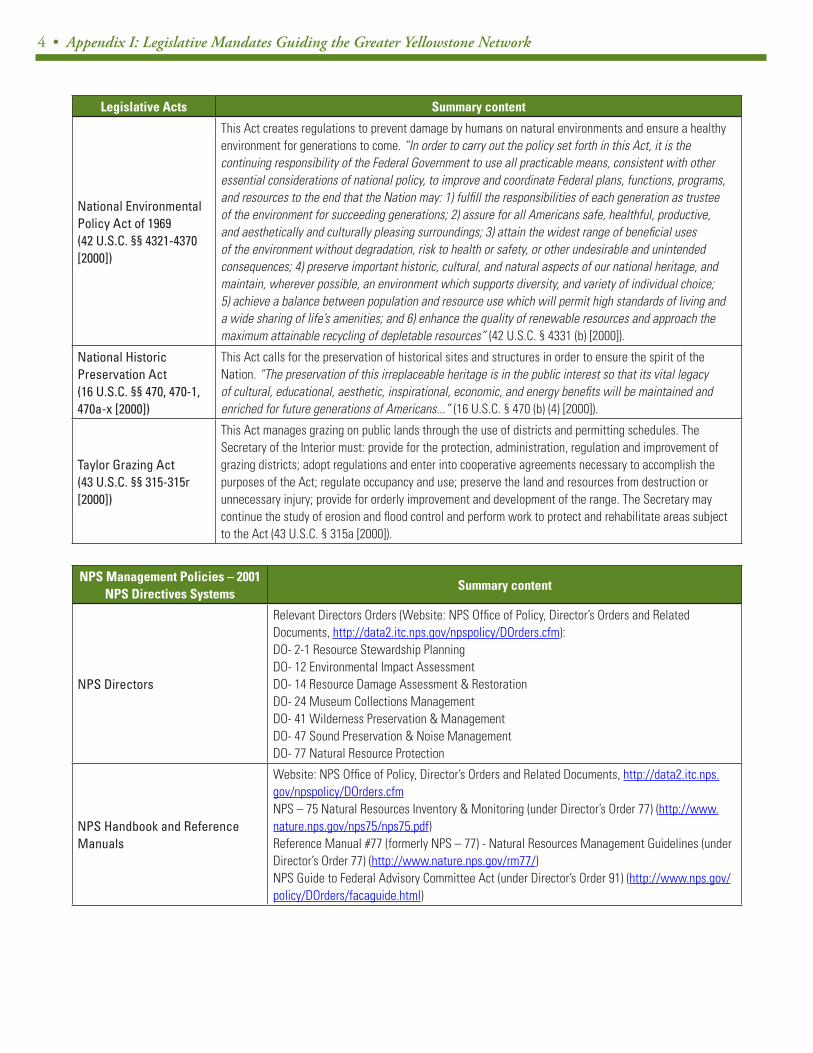
4 • Appendix I: Legislative Mandates Guiding the Greater Yellowstone Network
Legislative Acts Summary content
National Environmental Policy Act of 1969(42 U.S.C. §§ 4321-4370 [2000])
This Act creates regulations to prevent damage by humans on natural environments and ensure a healthy environment for generations to come. “In order to carry out the policy set forth in this Act, it is the continuing responsibility of the Federal Government to use all practicable means, consistent with other essential considerations of national policy, to improve and coordinate Federal plans, functions, programs, and resources to the end that the Nation may: 1) fulfill the responsibilities of each generation as trustee of the environment for succeeding generations; 2) assure for all Americans safe, healthful, productive, and aesthetically and culturally pleasing surroundings; 3) attain the widest range of beneficial uses of the environment without degradation, risk to health or safety, or other undesirable and unintended consequences; 4) preserve important historic, cultural, and natural aspects of our national heritage, and maintain, wherever possible, an environment which supports diversity, and variety of individual choice; 5) achieve a balance between population and resource use which will permit high standards of living and a wide sharing of life’s amenities; and 6) enhance the quality of renewable resources and approach the maximum attainable recycling of depletable resources” (42 U.S.C. § 4331 (b) [2000]).
National Historic Preservation Act(16 U.S.C. §§ 470, 470-1, 470a-x [2000])
This Act calls for the preservation of historical sites and structures in order to ensure the spirit of the Nation. “The preservation of this irreplaceable heritage is in the public interest so that its vital legacy of cultural, educational, aesthetic, inspirational, economic, and energy benefits will be maintained and enriched for future generations of Americans...” (16 U.S.C. § 470 (b) (4) [2000]).
Taylor Grazing Act(43 U.S.C. §§ 315-315r [2000])
This Act manages grazing on public lands through the use of districts and permitting schedules. The Secretary of the Interior must: provide for the protection, administration, regulation and improvement of grazing districts; adopt regulations and enter into cooperative agreements necessary to accomplish the purposes of the Act; regulate occupancy and use; preserve the land and resources from destruction or unnecessary injury; provide for orderly improvement and development of the range. The Secretary may continue the study of erosion and flood control and perform work to protect and rehabilitate areas subject to the Act (43 U.S.C. § 315a [2000]).
NPS Management Policies – 2001 NPS Directives Systems
Summary content
NPS Directors
Relevant Directors Orders (Website: NPS Office of Policy, Director’s Orders and Related Documents, http://data2.itc.nps.gov/npspolicy/DOrders.cfm):DO- 2-1 Resource Stewardship PlanningDO- 12 Environmental Impact Assessment DO- 14 Resource Damage Assessment & RestorationDO- 24 Museum Collections Management DO- 41 Wilderness Preservation & ManagementDO- 47 Sound Preservation & Noise ManagementDO- 77 Natural Resource Protection
NPS Handbook and Reference Manuals
Website: NPS Office of Policy, Director’s Orders and Related Documents, http://data2.itc.nps.gov/npspolicy/DOrders.cfmNPS – 75 Natural Resources Inventory & Monitoring (under Director’s Order 77) (http://www.nature.nps.gov/nps75/nps75.pdf)Reference Manual #77 (formerly NPS – 77) - Natural Resources Management Guidelines (under Director’s Order 77) (http://www.nature.nps.gov/rm77/)NPS Guide to Federal Advisory Committee Act (under Director’s Order 91) (http://www.nps.gov/policy/DOrders/facaguide.html)
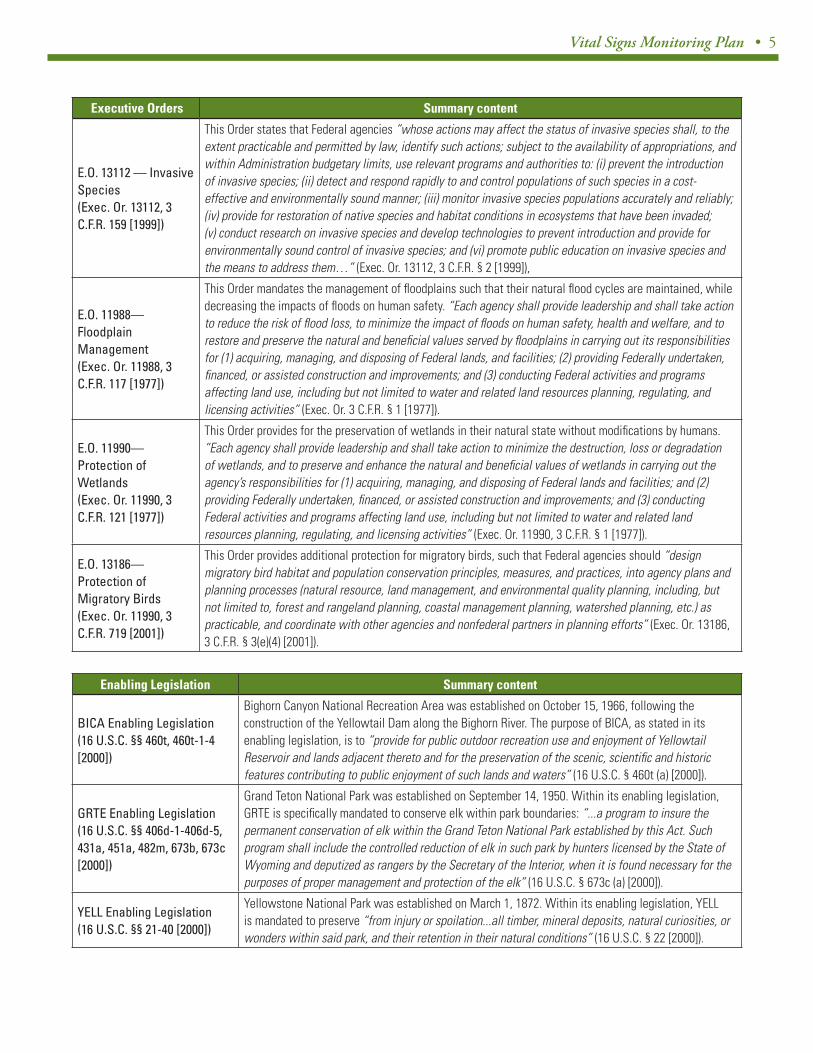
Vital Signs Monitoring Plan • 5
Executive Orders Summary content
E.O. 13112 — Invasive Species(Exec. Or. 13112, 3 C.F.R. 159 [1999])
This Order states that Federal agencies “whose actions may affect the status of invasive species shall, to the extent practicable and permitted by law, identify such actions; subject to the availability of appropriations, and within Administration budgetary limits, use relevant programs and authorities to: (i) prevent the introduction of invasive species; (ii) detect and respond rapidly to and control populations of such species in a cost-effective and environmentally sound manner; (iii) monitor invasive species populations accurately and reliably; (iv) provide for restoration of native species and habitat conditions in ecosystems that have been invaded; (v) conduct research on invasive species and develop technologies to prevent introduction and provide for environmentally sound control of invasive species; and (vi) promote public education on invasive species and the means to address them…” (Exec. Or. 13112, 3 C.F.R. § 2 [1999]),
E.O. 11988—Floodplain Management(Exec. Or. 11988, 3 C.F.R. 117 [1977])
This Order mandates the management of floodplains such that their natural flood cycles are maintained, while decreasing the impacts of floods on human safety. “Each agency shall provide leadership and shall take action to reduce the risk of flood loss, to minimize the impact of floods on human safety, health and welfare, and to restore and preserve the natural and beneficial values served by floodplains in carrying out its responsibilities for (1) acquiring, managing, and disposing of Federal lands, and facilities; (2) providing Federally undertaken, financed, or assisted construction and improvements; and (3) conducting Federal activities and programs affecting land use, including but not limited to water and related land resources planning, regulating, and licensing activities” (Exec. Or. 3 C.F.R. § 1 [1977]).
E.O. 11990—Protection of Wetlands(Exec. Or. 11990, 3 C.F.R. 121 [1977])
This Order provides for the preservation of wetlands in their natural state without modifications by humans. “Each agency shall provide leadership and shall take action to minimize the destruction, loss or degradation of wetlands, and to preserve and enhance the natural and beneficial values of wetlands in carrying out the agency’s responsibilities for (1) acquiring, managing, and disposing of Federal lands and facilities; and (2) providing Federally undertaken, financed, or assisted construction and improvements; and (3) conducting Federal activities and programs affecting land use, including but not limited to water and related land resources planning, regulating, and licensing activities” (Exec. Or. 11990, 3 C.F.R. § 1 [1977]).
E.O. 13186—Protection of Migratory Birds(Exec. Or. 11990, 3 C.F.R. 719 [2001])
This Order provides additional protection for migratory birds, such that Federal agencies should “design migratory bird habitat and population conservation principles, measures, and practices, into agency plans and planning processes (natural resource, land management, and environmental quality planning, including, but not limited to, forest and rangeland planning, coastal management planning, watershed planning, etc.) as practicable, and coordinate with other agencies and nonfederal partners in planning efforts” (Exec. Or. 13186, 3 C.F.R. § 3(e)(4) [2001]).
Enabling Legislation Summary content
BICA Enabling Legislation(16 U.S.C. §§ 460t, 460t-1-4 [2000])
Bighorn Canyon National Recreation Area was established on October 15, 1966, following the construction of the Yellowtail Dam along the Bighorn River. The purpose of BICA, as stated in its enabling legislation, is to “provide for public outdoor recreation use and enjoyment of Yellowtail Reservoir and lands adjacent thereto and for the preservation of the scenic, scientific and historic features contributing to public enjoyment of such lands and waters” (16 U.S.C. § 460t (a) [2000]).
GRTE Enabling Legislation(16 U.S.C. §§ 406d-1-406d-5, 431a, 451a, 482m, 673b, 673c [2000])
Grand Teton National Park was established on September 14, 1950. Within its enabling legislation, GRTE is specifically mandated to conserve elk within park boundaries: “...a program to insure the permanent conservation of elk within the Grand Teton National Park established by this Act. Such program shall include the controlled reduction of elk in such park by hunters licensed by the State of Wyoming and deputized as rangers by the Secretary of the Interior, when it is found necessary for the purposes of proper management and protection of the elk” (16 U.S.C. § 673c (a) [2000]).
YELL Enabling Legislation(16 U.S.C. §§ 21-40 [2000])
Yellowstone National Park was established on March 1, 1872. Within its enabling legislation, YELL is mandated to preserve “from injury or spoilation...all timber, mineral deposits, natural curiosities, or wonders within said park, and their retention in their natural conditions” (16 U.S.C. § 22 [2000]).
6 • Appendix I: Legislative Mandates Guiding the Greater Yellowstone Network
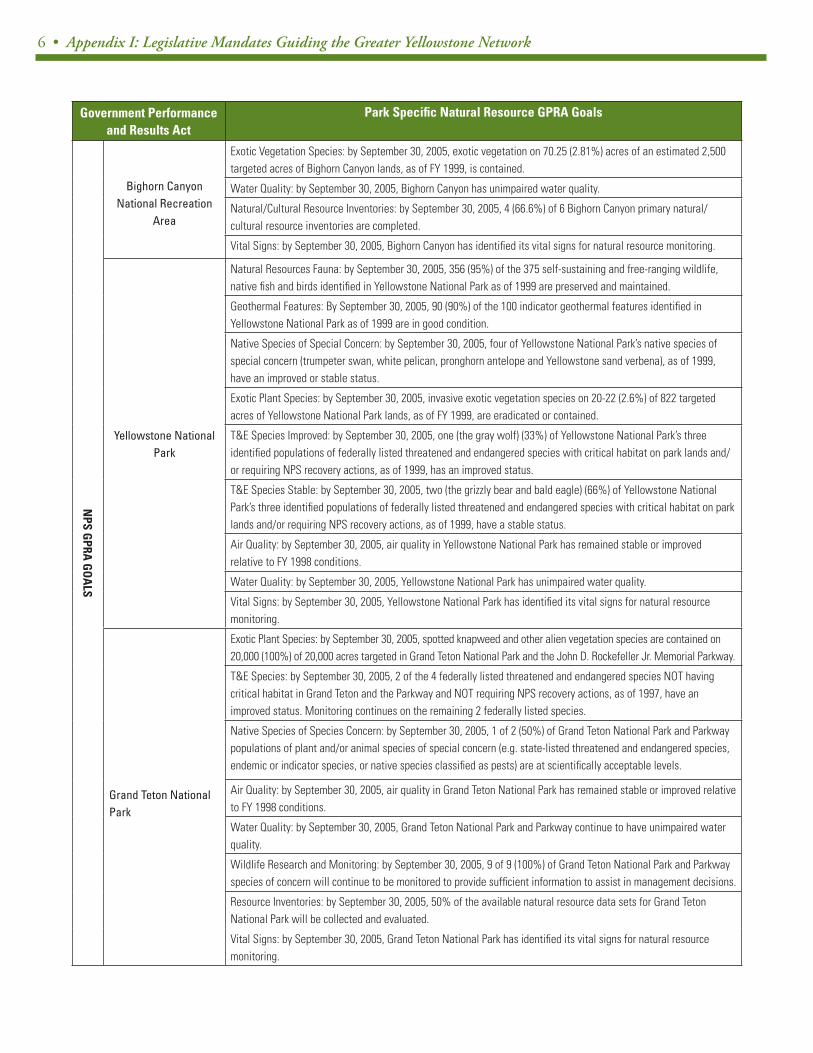
Government Performance and Results Act
Park Specific Natural Resource GPRA Goals
NPS G
PRA G
OA
LS
Bighorn Canyon National Recreation
Area
Exotic Vegetation Species: by September 30, 2005, exotic vegetation on 70.25 (2.81%) acres of an estimated 2,500 targeted acres of Bighorn Canyon lands, as of FY 1999, is contained.
Water Quality: by September 30, 2005, Bighorn Canyon has unimpaired water quality.
Natural/Cultural Resource Inventories: by September 30, 2005, 4 (66.6%) of 6 Bighorn Canyon primary natural/cultural resource inventories are completed.
Vital Signs: by September 30, 2005, Bighorn Canyon has identified its vital signs for natural resource monitoring.
Yellowstone National Park
Natural Resources Fauna: by September 30, 2005, 356 (95%) of the 375 self-sustaining and free-ranging wildlife, native fish and birds identified in Yellowstone National Park as of 1999 are preserved and maintained.
Geothermal Features: By September 30, 2005, 90 (90%) of the 100 indicator geothermal features identified in Yellowstone National Park as of 1999 are in good condition.
Native Species of Special Concern: by September 30, 2005, four of Yellowstone National Park’s native species of special concern (trumpeter swan, white pelican, pronghorn antelope and Yellowstone sand verbena), as of 1999, have an improved or stable status.
Exotic Plant Species: by September 30, 2005, invasive exotic vegetation species on 20-22 (2.6%) of 822 targeted acres of Yellowstone National Park lands, as of FY 1999, are eradicated or contained.
T&E Species Improved: by September 30, 2005, one (the gray wolf) (33%) of Yellowstone National Park’s three identified populations of federally listed threatened and endangered species with critical habitat on park lands and/or requiring NPS recovery actions, as of 1999, has an improved status.
T&E Species Stable: by September 30, 2005, two (the grizzly bear and bald eagle) (66%) of Yellowstone National Park’s three identified populations of federally listed threatened and endangered species with critical habitat on park lands and/or requiring NPS recovery actions, as of 1999, have a stable status.
Air Quality: by September 30, 2005, air quality in Yellowstone National Park has remained stable or improved relative to FY 1998 conditions.
Water Quality: by September 30, 2005, Yellowstone National Park has unimpaired water quality.
Vital Signs: by September 30, 2005, Yellowstone National Park has identified its vital signs for natural resource monitoring.
Grand Teton National Park
Exotic Plant Species: by September 30, 2005, spotted knapweed and other alien vegetation species are contained on 20,000 (100%) of 20,000 acres targeted in Grand Teton National Park and the John D. Rockefeller Jr. Memorial Parkway.
T&E Species: by September 30, 2005, 2 of the 4 federally listed threatened and endangered species NOT having critical habitat in Grand Teton and the Parkway and NOT requiring NPS recovery actions, as of 1997, have an improved status. Monitoring continues on the remaining 2 federally listed species.
Native Species of Species Concern: by September 30, 2005, 1 of 2 (50%) of Grand Teton National Park and Parkway populations of plant and/or animal species of special concern (e.g. state-listed threatened and endangered species, endemic or indicator species, or native species classified as pests) are at scientifically acceptable levels.
Air Quality: by September 30, 2005, air quality in Grand Teton National Park has remained stable or improved relative to FY 1998 conditions.
Water Quality: by September 30, 2005, Grand Teton National Park and Parkway continue to have unimpaired water quality.
Wildlife Research and Monitoring: by September 30, 2005, 9 of 9 (100%) of Grand Teton National Park and Parkway species of concern will continue to be monitored to provide sufficient information to assist in management decisions.
Resource Inventories: by September 30, 2005, 50% of the available natural resource data sets for Grand Teton National Park will be collected and evaluated.
Vital Signs: by September 30, 2005, Grand Teton National Park has identified its vital signs for natural resource monitoring.

Vital Signs Monitoring Plan • 1
APPENDIX II:
CURRENT MONITORING IN THE GREATER YELLOWSTONE NETWORK
PARKS AND SURROUNDING LANDSCAPES

2 • Appendix II: Current Monitoring
Table of Contents AIR AND CLIMATE ................................................................................................................... 4
AIR QUALITY ............................................................................................................................... 4 Atmospheric Deposition Monitoring....................................................................................... 4 Oversnow emissions................................................................................................................ 5 Ozone ...................................................................................................................................... 5 Visibility Monitoring............................................................................................................... 5
WEATHER .................................................................................................................................... 6 Climate.................................................................................................................................... 6
GEOLOGY AND SOILS ............................................................................................................. 7 GEOMORPHOLOGY ....................................................................................................................... 7
Stream Sediment Transport..................................................................................................... 7 Glaciers................................................................................................................................... 7
SUBSURFACE GEOLOGIC PROCESSES ........................................................................................... 8 Seismic Activity Monitoring.................................................................................................... 8 Chloride Flux Monitoring....................................................................................................... 9 Geothermal Feature Monitoring............................................................................................. 9
WATER ....................................................................................................................................... 10
Water Chemistry ................................................................................................................... 10 Water temperature ................................................................................................................ 13
HYDROLOGY.............................................................................................................................. 13 Streamflow ............................................................................................................................ 13 Lake and Reservoir elevation................................................................................................ 15
BIOLOGICAL INTEGRITY .................................................................................................... 15 INVASIVE SPECIES...................................................................................................................... 15
Invasive Plants ...................................................................................................................... 15 INFESTATIONS AND DISEASE...................................................................................................... 16
Forest Insect and Disease Monitoring.................................................................................. 16 VERTEBRATE DISEASE............................................................................................................... 16 FOCAL SPECIES OR COMMUNITIES ............................................................................................. 21
Aspen..................................................................................................................................... 21 Riparian Monitoring ............................................................................................................. 21 Canada Lynx ......................................................................................................................... 22 Black Bears (Ursus americanus) .......................................................................................... 22 Cougars (Puma [Felis] concolor) ........................................................................................ 23 Ungulates .............................................................................................................................. 23
AT-RISK BIOTA .......................................................................................................................... 23 Bald Eagles ........................................................................................................................... 23 Grizzly Bears......................................................................................................................... 25 Gray Wolves.......................................................................................................................... 27
ECOSYSTEM PATTERN AND PROCESSES ....................................................................... 28

Vital Signs Monitoring Plan • 3
FIRE ........................................................................................................................................... 28 Fire........................................................................................................................................ 28
LAND USE AND COVER ............................................................................................................... 28 Land Cover............................................................................................................................ 28
LAND USE .................................................................................................................................. 29 SOUNDSCAPES............................................................................................................................ 29
Soundscape Monitoring ........................................................................................................ 29

4 • Appendix II: Current Monitoring
Air and Climate
AIR QUALITY
Atmospheric Deposition Monitoring
Atmospheric deposition monitoring is ongoing in YELL through two major programs: the National Atmospheric Deposition Program/National Trends Network (NADP/NTN) and the Clean Air Status and Trends Network (CASTNET). NADP is a multi-agency (including federal, state and local) approach to monitoring the chemistry of wet deposition throughout the country at over 200 sites (NADP 2004). The NADP/NTN program currently operates one station at Tower Falls in Yellowstone National Park Data collected from this site can be downloaded from: http://nadp.sws.uiuc.edu/sites/siteinfo.asp?id=WY08&net=NTN and includes information on daily, weekly, seasonal and annual totals and trends for the site (NADP 2004). NADP also operates a Mercury Deposition Network (NADP/MDN) that collects information on weekly total mercury concentrations in precipitation, as well as seasonal and annual mercury flux. An MDN station was started at Yellowstone Lake in February 2002 and moved to Tower in 2004. All available data can be downloaded from the following website: http://nadp.sws.uiuc.edu/sites/siteinfo.asp?id=WY07&net=MDN. The U.S. Geological Survey, along with the National Park Service-Air Resources Division, U.S. Forest Service and other agencies jointly operate the Rocky Mountain Snowpack Chemistry Network to determine the quality of precipitation and to identify sources of atmospherically deposited pollution. The RMS was created to augment NADP/NTN stations at high elevations (Nanus et al. 2003) and includes sites in Grand Teton and in Yellowstone (Ingersoll et al. 2001). The results of the first 5 years are summarized in a report by Ingersoll et al. (2001) available at http://water.usgs.gov/pubs/of/2001/ofr01-466. As part of the Clean Air Status and Trends Network program (CASTNET [EPA 2004]), the U.S. Environmental Protection Agency (EPA) has been monitoring atmospheric deposition in YNP since 1996. CASTNET is a joint venture between EPA and the National Park Service-Air Resources Division that operates over 70 dry acidic deposition sites throughout the U.S. These sites provide hourly data on ozone levels and weekly information on the concentration of sulfate, nitrate, ammonium, sulfur dioxide and nitric acid (EPA 2004). This EPA monitoring focuses on dry deposition at one site near Lake Village and data from this site can be downloaded at: http://www.epa.gov/castnet/sites/yel408.html. Literature Cited EPA (Environmental Protection Agency), 2004. Overview of CASTNET Program. Available at: http://www.epa.gov/castnet/overview.html. Ingersoll GP, Turk JT, Mast MA, Clow DW, Campbell DH, Bailey ZC. 2001. Rocky Mountain Snowpack Chemistry Network: History, Methods, and the Importance of Monitoring Mountain Ecosystems. U.S Geological Survey Open File Report 01-466, 14 p.
Vital Signs Monitoring Plan • 5
Nanus L, Campbell DH, Ingersoll GP, Clow DW, Mast MA. 2003. Atmospheric deposition maps for the Rocky Mountains. Atmospheric Environment 37: 4881–4892. National Atmospheric Deposition Program (NADP). 2004. NADP history and overview. <http://nadp.sws.uiuc.edu/nadpoverview.asp>. Accessed 2004 Jul 15.
Oversnow emissions
Yellowstone National Park funded an air pollutant ‘emission’ study in 2003 as part of the park’s ongoing efforts to monitor air quality and other park resources to assess the impacts of winter use. The study collected over 200 air samples from 21 sites throughout Yellowstone from February 12-16, 2003, using well-recognized methods accepted by the Environmental Protection Agency. Scientists at University of New Hampshire measured approximately 85 different Volatile Organic Compounds (VOCs) including benzene and toluene, as well as carbon monoxide and methane. The study is available at: www.nps.gov/yell/technical/planning/winteruse/plan/.
Ozone
Historic Monitoring Passive ozone monitoring was conducted from1995 through 2004 to determine ozone exposure levels. Data collected from this site can be downloaded from: http://www2.nature.nps.gov/air/studies/passives.htm. Passive ozone monitoring is an inexpensive method that involves exposing the passive sampler to ozone on a weekly basis during the “ozone season” from May to September. After exposure, the sampler is retrieved and mailed to a contract lab for analysis. The passive ozone monitoring program was supervised and funded by the NPS-ARD and was discontinued in 2004.
Visibility Monitoring
Visibility monitoring is ongoing in Yellowstone and Grand Teton National Parks as part of the Interagency Monitoring of Protected Visual Environments (IMPROVE) program. IMPROVE is composed of members from federal, state and regional agencies and has the common goal of providing information to protect visual environments under the Clean Air Act of 1977 (IMPROVE 2004). The program was initiated in 1985 to protect visibility in Class I airsheds in 156 national parks and wilderness areas. The objectives of the IMPROVE program are: “to establish current visibility and aerosol conditions in mandatory class I areas; to identify chemical species and emission sources responsible for existing man-made visibility impairment; to document long-term trends for assessing progress towards the national visibility goal; and with the enactment of the Regional Haze Rule, to provide regional haze monitoring representing all visibility protected federal Class I areas where practical” (IMPROVE 2004). The website can be accessed at: http://vista.cira.colostate.edu/improve/Overview/Overview.htm and contains downloadable data (including aerosol, light extinction and scatter, and scenes) at: http://vista.cira.colostate.edu/improve/Data/data.htm.
6 • Appendix II: Current Monitoring
Literature Cited Interagency Monitoring of Protected Visual Environments (IMPROVE). 2004. Overview of IMPROVE and visibility. <http://vista.cira.colostate.edu/improve/Overview/Overview.htm>. Accessed 2004 Jul 14.
WEATHER
Climate
Climate monitoring is currently occurring in all three park units of the GRYN. Gray (2005) prepared a monitoring protocol for the network that defines the climate metrics of interest, the frequency of measurements and reporting units. Climate monitoring stations found within the parks of the GRYN include: the National Climatic Data Center (NCDC) climate stations found in Yellowstone and Grand Teton and north of Bighorn Canyon; the National Weather Service remote automated weather station (RAWS) in all parks; and Natural Resources Conservation Service Snotel and Snowcourse sites in Yellowstone and Grand Teton (Selkowitz 2003) and the Climate Reference Network station in Grand Teton. Much of this climate data is available online through the following Web sites (Gray pers. comm.):
• the Western Regional Climate Center provides detailed climate summaries for stations in the Western U.S. at: http://www.wrcc.dri.edu/climsum.html
• the National Oceanic and Atmospheric Administration NCDC provides access to hourly, daily and monthly climate data, and information on extreme events, at: http://www.ncdc.noaa.gov/oa/climate/climatedata.html
• select National Weather Service and cooperator station hourly climate data can be accessed through: http://www.ncdc.noaa.gov/oa/climate/climatedata.html#HOURLY at the following website for daily observations: http://hurricane.ncdc.noaa.gov/pls/plclimprod/poemain.accessrouter?datasetabbv=SOD and at the following website for monthly observations: http://hurricane.ncdc.noaa.gov/pls/plclimprod/somdmain.somdwrapper?datasetabbv=TD3220
• daily observation from the U.S. Historical Climatology Network can be accessed through: http://www.ncdc.noaa.gov/oa/climate/research/ushcn/daily.html and monthly observations can be accessed through: http://www.ncdc.noaa.gov/oa/climate/research/ushcn/ushcn.html. The HCN concentrates on providing long-duration, high-quality datasets (therefore, length of records may be shorter than with other services). HCN stations within the GRYN include Mammoth Hot Springs (Yellowstone) and Lake (Yellowstone).
• data from RAWS stations can be accessed through: http://www.met.utah.edu/jhorel/html/mesonet/
• data from the Climate Reference Network: http://www.ncdc.noaa.gov/crn/hourly. The Climate Reference Network (CRN) station at GRTE, which was established in 2004, is funded by the National Oceanic and Atmospheric Administration (NOAA) and NCDC. The primary goal of the CRN is to provide future long-term, high-quality observations of surface air temperature and precipitation that can be coupled to past long-term observations for the detection
Vital Signs Monitoring Plan • 7
and attribution of present and future climate change. Measures include air temperature, precipitation, solar radiation, wind speed, ground surface temperature and relative humidity. Literature Cited Gray ST. 2005. Climate Monitoring protocols for the Greater Yellowstone Network: Bighorn Canyon National Recreation Area, Grand Teton National Park (including J.D. Rockefeller, Jr. Memorial Parkway), and Yellowstone National Park. Draft Version 1. June 2005. National Park Service, Greater Yellowstone Network. 46 pp. plus appendices. Selkowitz D. 2003. Compilation and analysis of climate data in the Greater Yellowstone Ecosystem/Bighorn Canyon Area: completed products, problems encountered and recommendations for the future final report to the Greater Yellowstone/Bighorn Canyon Vital Signs Network. Greater Yellowstone Inventory and Monitoring Network, National Park Service, Bozeman, MT. 5 pp.
Geology and Soils
GEOMORPHOLOGY
Stream Sediment Transport
Historic monitoring Bed sediment was monitored as part of the USGS National Water-Quality Assessment (NAWQA) program. Bed sediment was sampled throughout the Yellowstone River Basin in 1998, specifically on the Bighorn River at Kane, Soda Butte Creek at park boundary, Yellowstone River at lake outlet and on the Yellowstone River at Corwin Springs (O’Ney and McCloskey 2004). These NAWQA stations are co-located with USGS gaging stations. Information on the NAWQA program and data retrievals can be found on the USGS NAWQA website by visiting http://wy.water.usgs.gov/YELL/htms/data.htm. Literature Cited O'Ney SE and McCloskey K, eds. 2004. Water quality monitoring plan, phase II report. National Park Service, Greater Yellowstone Network, Bozeman , MT. 51 pp. plus appendices.
Glaciers
Glacier and snowfield monitoring has focused primarily on synoptic studies at GRTE. In particular, estimates of summer and winter mass balance have been combined with remote sensing data to track the dynamics of key glaciers in the Teton Range (e.g., Elder et al. 1994). Related modeling experiments have also produced forecasts for the response of GRTE glaciers to future climate variability and change (e.g., Plummer and Cecil 2005). Plummer MA and Cecil LD. 2005. Simulated response of two Wyoming glaciers to projected climate change. Proc. of the 1st Annual MTNCLIM Meeting, March 2005, Pray, Montana.

8 • Appendix II: Current Monitoring
Elder K, Fullerton S, Tonnessen K. 1994. Winter mass balance measurements on Teton Glacier, Grand Teton National Park. Park Science 14:11-13.
SUBSURFACE GEOLOGIC PROCESSES
Seismic Activity Monitoring
Seismic activity has been monitored in Yellowstone since 1973 (USGS [Pitt 1987]). In 2001, the Yellowstone Volcano Observatory (YVO), a joint venture among the USGS, Yellowstone National Park and the University of Utah, was created as part of the USGS Volcano Hazards Program in an effort to facilitate collaborative monitoring and research of geologic processes associated with the Yellowstone volcano (Olliff 2002). Dr. Jake Lowenstern of the USGS is Scientist-in-Charge of YVO, with coordination from scientists Dr. Bob Smith of the University of Utah and Dr. Hank Heasler of Yellowstone National Park (YVO 2004). Real-time data available on the YVO website include: earthquake data, such as live seismographs, earthquake catalogs (including maps) and a recent history of earthquakes in the area; GPS deformation data, which shows coordinates of spatial variations in the ground due to “magma and hydrothermal transport and fault motions related to earthquakes”; and hydrologic data gathered by the USGS, which includes chloride flux, stream discharge, water temperature and streamflow data (YVO 2004). These data can be accessed at: http://volcanoes.usgs.gov/yvo/monitoring.html. The University of Utah Seismograph Stations (UUSS) Network maintains the following types of monitoring stations in the Yellowstone Seismic Network: 17 short-period, vertical-component, analog telemetry; 2 short-period, three-component, analog telemetry; 2 broadband, three-component, analog telemetry; 1 broadband, three-component, digital telemetry. Funding for the UUSS is mostly provided by the USGS (95%) with some contribution from the National Park Service (5% [UUSS 2004]). Live seismographs from the Yellowstone Seismic Network can be seen at: http://www.seis.utah.edu/helicorder/heli/yellowstone/index.html. Meanwhile, current volcano activity reports can be accessed at the following website: http://volcanoes.usgs.gov/yvo/activity.html. In order to better understand the geophysical processes at work in GRTE, a number of research and monitoring projects are taking place in the park. Three seismic monitoring stations and one continuously recording GPS receiver are currently in place at GRTE. Real-time data from the seismic monitoring network are available online as indicated for YELL with similar cooperation from the USGS and the University of Utah. Research projects related to geophysical processes include: studying the historic return time of earthquakes on the Teton fault, investigating the intermountain seismic belt as a system, and synthesizing monitoring data in hopes of improving earthquake prediction. As the West-wide Earthscope/Plate Boundary Observatory (PBO) project proceeds, GRTE and YELL may host 1-2 additional GPS units. The Earthscope Web site is found at: http://www.earthscope.org/pbo/index.shtml. Literature Cited Olliff T. 2002. Monitoring volcanic and earthquake unrest in Yellowstone. Pages 24-25 in Natural Resources year in Review 2001. J Selleck, ed. National Park Service, Natural Resource Stewardship and Science. WSO-NRID. 70 pp.
Vital Signs Monitoring Plan • 9
Pitt AM. 1987. Catalog of earthquakes in the Yellowstone Park-Hebgen lake Region, Wyoming, Montana, and Idaho, for the years 1973 to 1981. U.S. Department of the Interior, U.S. Geological Survey, Washington, DC. University of Utah Seismograph Stations (UUSS). 2004. More about UUSS. <http://www.seis.utah.edu/behind/behind.shtml>. Accessed 2004 Jun 14. Yellowstone Volcano Observatory (YVO). 2004. Volcano monitoring at Yellowstone National Park. <http://volcanoes.usgs.gov/yvo/monitoring.html>. Accessed 2004 Jun 14.
Chloride Flux Monitoring
In addition to monitoring seismic activity and geothermal features directly, Yellowstone also monitors proxies for geothermal activity, including groundwater temperature and chloride flux. High-temperature wells have been drilled throughout Yellowstone for research purposes, starting in 1931, and now consist of fifteen, with the majority drilled in the late 1960s (Heasler et al. 2003). The Yellowstone Spatial Analysis Center updated the inventory of these wells—many of them deteriorating due to hot, acidic geothermal water—in 2002 (Heasler et al. 2003). While they have been used for research purposes—particularly for understanding the impacts of geothermal development outside the park on park resources—there is currently no ongoing, long-term monitoring of groundwater temperature in these wells. Understanding groundwater temperature should give insights into the interaction between groundwater and geothermally influenced waters in the hydrologic system of Yellowstone (Heasler et al. 2003). Chloride flux, in contrast, has been monitored for almost two decades in the Fall, Snake, Madison and Yellowstone Rivers (Heasler et al. 2003). Chloride flux is used as an estimator of heat flow and geothermal activity, and approximately 94% of the chloride in Yellowstone’s waters is thought to be from magmatic origin (Norton and Friedman 1985). According to Heasler et al. (2003), “water samples for chloride analysis are collected 28 times a year at river gauging stations: monthly during the winter at low flow, biweekly during the early spring and fall, and weekly during spring runoff.” Analyses of these data have shown a 10% decrease in chloride flux over the past 19 years, which may be due to deflation of the caldera (Heasler et al. 2003). Literature Cited Heasler H, Jaworowski C, Susong D. 2003. A geothermal monitoring plan for Yellowstone National Park. National Park Service, Yellowstone National Park, Mammoth Hot Springs, Wyoming. 23 pp. Norton D, Friedman I. 1985. Chloride flux out of Yellowstone National Park: Journal of Volcanology and Geothermal Research, v. 26, p. 231-250.
Geothermal Feature Monitoring
Monitoring of geothermal features in Yellowstone has been performed in the past when personnel and funds were available. Monitoring has been mostly qualitative in nature and can be found in various Yellowstone National Park archives, internal reports and notebooks (Heasler et
10 • Appendix II: Current Monitoring
al. 2003). An inventory of over 7,000 geothermal features was compiled by the YELL Spatial Analysis Center from 1999-2003; this represents only 60-70% of the total features contained within the park (Heasler et al. 2003). Monitoring of geothermal features generally takes one of two forms, depending on the location of the feature and available funding: features may be monitored in-depth, including collecting data on “temperature, flow, chemistry of water and gases (major anions, cations, metals, trace elements, isotopes, etc.) and spatial extent (using techniques such as photographic surveying methods),” or they may be monitored using remote sensing techniques (Heasler et al. 2003). Yellowstone National Park is currently obtaining funding for in-depth monitoring and remote sensing to be included in the plan for monitoring geothermal resources in the park (Heasler et al. 2003). However, in addition to the informal monitoring of geothermal features, data collection on eruption intervals is ongoing at the Old Faithful Geyser by park interpretive staff, and a volunteer monitors vandalism to features in the Upper, Midway and Lower Basins (Jean et al. 2003). A list of geyser activity—updated in 2002 and including the interval between eruptions and the height of the eruption—can be found at the following website: http://www.nps.gov/yell/nature/geothermal/ycr/activity.html. USGS researchers completed mapping the bottom of Yellowstone Lake in summer 2003 using multibeam sonar imaging and seismic mapping. This mapping revealed an “inflated plain” that rises 100 feet from the lake bottom and is about 2,000 feet long (YVO 2004). While this bulge could possibly lead to a hydrothermal explosion, indications from recent monitoring suggest that this is unlikely in the near future (YVO 2004). The Yellowstone Volcano Observatory is monitoring the temperature of the hydrothermal vents and conducting an assessment of the geologic hazards in Yellowstone National Park (YVO 2004). Literature Cited Heasler H, Jaworowski C, Susong D. 2003. Geothermal monitoring plan for Yellowstone National Park. National Park Service, Yellowstone National Park, Mammoth Hot Springs, Wyoming. 23 pp. Jean C, Bischke SD, Schrag AM. 2003. Greater Yellowstone Inventory and Monitoring Network Vital Signs Monitoring Plan: Phase II Report, September 30, 2003. National Park Service, Greater Yellowstone Network, Bozeman, MT. 99 pp. plus appendices. Yellowstone Volcano Observatory (YVO). 2004. Frequently asked questions about recent findings at Yellowstone Lake. <http://volcanoes.usgs.gov/yvo/new.html>. Accessed 2004 Jul 14.
Water
Water Chemistry
Historic monitoring efforts Water quality monitoring in the GRYN parks has taken place for several decades. Most monitoring is done as synoptic studies of limited duration (e.g., the EPA EMAP program (2000-2003). The USGS National Water Quality Assessment (NAWQA) program established eight water quality monitoring stations in or near the network parks between 1998 and 2001; these stations are included in the Yellowstone River Basin and upper Snake River Basin study units, both of which were scheduled for the second assessment cycle during this decade (USGS 2001);
Vital Signs Monitoring Plan • 11
however, the focus and sample locations may change, depending on agency goals. At Yellowstone, NAWQA parameters measured included: biological parameters, nutrients, organics, major inorganics, minor and trace elements, physical properties, radio-chemicals and sediment (O'Ney and McCloskey 2004). There were two NAWQA stations in GRTE, Flagg Ranch established in the early 1990’s and one at Moose, established in 1996. Parameters measured quarterly included: water temperature, pH, dissolved oxygen, specific conductivity, nutrients and suspended sediment (O'Ney and McCloskey 2004). These parameters were also measured at the NAWQA stations located in or adjacent to Bighorn Canyon NRA. In additional, fecal coliforms were monitored on the Bighorn River at Kane and on the Shoshone River near Lovell (O'Ney and McCloskey 2004) during the NAWQA assessment. Refer to USGS Web site http://water.usgs.gov/nawqa/constituents/ for detailed descriptions of parameters measured by the NAWQA protocols. Surface water quality data retrievals from six of the EPA's national databases served as the basis for the Baseline Water Quality Data Inventory and Analysis Reports completed for YELL, GRTE and BICA by the Servicewide Inventory and Monitoring Program and the Water Resources Division (National Park Service 1994, 1998b, 2001). These data were later acquired and analyzed for state water quality exceedances by Woods and Corbin (2003a, 2003b, 2003c). Knauf and Williams acquired and analyzed seven data sets for Soda Butte Creek (2005), dating from 1987 to 2001; these data were submitted to EPA for submission to the EPA STORET database. In 2004 the GRYN prepared a phase II Water Quality Monitoring Plan (O'Ney and McCloskey 2004) to address overall water quality goals, background information and conceptual models for water quality monitoring in the GRYN. These reports are located on the GRYN Web page http://www.nature.nps.gov/im/units/gryn/index.shtml. Current monitoring effort The following section describes water quality monitoring currently being done by the YELL aquatics section in YELL and by park staff at GRTE. See also sections on geothermal and streamflow monitoring for more information on other water-related monitoring. Both YELL and GRTE have ongoing water quality monitoring within their boundaries. At the USGS gaging station at Moose (GRTE), there is a real-time, continuous monitor for water temperature, pH, dissolved oxygen and specific conductivity. Also in GRTE, approximately 20 groundwater wells adjacent to sewage ponds and leach fields within park boundaries are presently being monitored once a year for basic water quality parameters, fecals and nutrients to comply with the requirements of Wyoming Department of Environmental Quality. Additionally, Snake River Pit ground water levels are monitored on a biweekly basis from wells installed by the USGS in 1997 (O'Ney and McCloskey 2004). Testing for fecal coliform, including DNA source tracking of E. coli, to determine the mammalian source of coliforms, began in 1996 in selected backcountry streams and has continued to date (O'Ney and McCloskey 2004). A long-term water quality monitoring program was started in YELL in 2002 and includes nineteen fixed sites; twelve of these stations are located on rivers and streams and seven are located on Yellowstone Lake. Field measurements include: pH, dissolved oxygen, specific conductance, temperature and turbidity; samples are collected for total suspended solids (TSS) and volatile suspended solids. Sampling takes place at two-week intervals during the spring,
12 • Appendix II: Current Monitoring
summer and fall and monthly during the winter (December, January and February). On Yellowstone Lake, monitoring stations were established at four historic sampling stations (Koel et al. 2004), with sampling taking place between May and October (during ice-free periods). Two additional sampling sites on the southern arms of Yellowstone Lake were added in 2003 for a total of seven stations on the lake. In 2005 the GRYN began monitoring water bodies identified as water quality impaired: Soda Butte Creek and the Bighorn River in Montana and the Shoshone River in Wyoming. The Regulatory Water Quality Monitoring Protocol for the Greater Yellowstone Network (O’Ney 2005) establishes the standing operating procedures for measuring core parameters and discharge plus dissolved and total metals in water and metals in sediment (on Soda Butte Creek), nutrients (on the Bighorn River) and E.coli and fecal coliforms (on the Shoshone River). Macroinvertebrates are also monitored at least once a year at each of these three stations. Literature Cited Knauf M, Williams MW. 2004. Soda Butte Creek and Reese Creek: Vital Signs Monitoring Program, Final Report. National Park Service, Greater Yellowstone Network, Bozeman, MT. 29 pp. plus appendices. Koel TM, Arnold JL, Bigelow PD, Doepke PD, Ertel BD and Mahony DL. 2004. Yellowstone Fisheries & Aquatic Sciences: Annual Report, 2003. National Park Service, Yellowstone Center for Resources, Yellowstone National Park, Wyoming, YCR-NR-2004-03. National Park Service. 1994. Baseline Water Quality Data Inventory and Analysis. Yellowstone National Park. Technical Report NPS/NRWRD/NRTR-94/22. National Park Service. 1998b. Baseline Water Quality Data Inventory and Analysis. Bighorn Canyon National Recreation Area. Technical Report NPS/NRWRD/NRTR-98/164. National Park Service. 2001. Baseline Water Quality Data Inventory and Analysis. Grand Teton National Park. Technical Report NPS/NRWRD/NRTR-2000/260. O'Ney SE and McCloskey K, eds. 2004. Water quality monitoring plan, phase II report. National Park Service, Greater Yellowstone Network, Bozeman , MT. 51 pp. plus appendices. O'Ney SE. 2005. Regulatory water quality monitoring protocol. Version 1.0. Bozeman (MT): National Park Service, Greater Yellowstone Network. 35 pp. plus appendices. United State Geological Survey, 2001. The National Water – Quality Assessment Program – Entering a new decade of investigations. USGS Fact Sheet 071-01. July 2001. 6 pp. Woods SW, Corbin J. 2003a. Vital signs water quality monitoring for the Greater Yellowstone Network: Bighorn Canyon National Recreation Area: Final Technical Report, July 2003. National Park Service. Greater Yellowstone Network, Bozeman, MT.
Vital Signs Monitoring Plan • 13
Woods SW, Corbin J. 2003b. Vital signs water quality monitoring for the Greater Yellowstone Network: Grand Teton National Park: Final Technical Report, August 2003. National Park Service. Greater Yellowstone Network, Bozeman, MT. Woods SW, Corbin J. 2003c. Vital signs water quality monitoring for the Greater Yellowstone Network: Yellowstone National Park: Final Technical Report, September 2003. National Park Service. Greater Yellowstone Network, Bozeman, MT.
Water temperature
Continuous water temperature is currently being monitored by the USGS at gaging stations on the Gibbon, Firehole and Snake River (at Moose) and on Soda Butte and Tantalus Creeks. In addition, the YELL geothermal monitoring program has an extensive network of temperature loggers scattered throughout the park.
HYDROLOGY
Streamflow
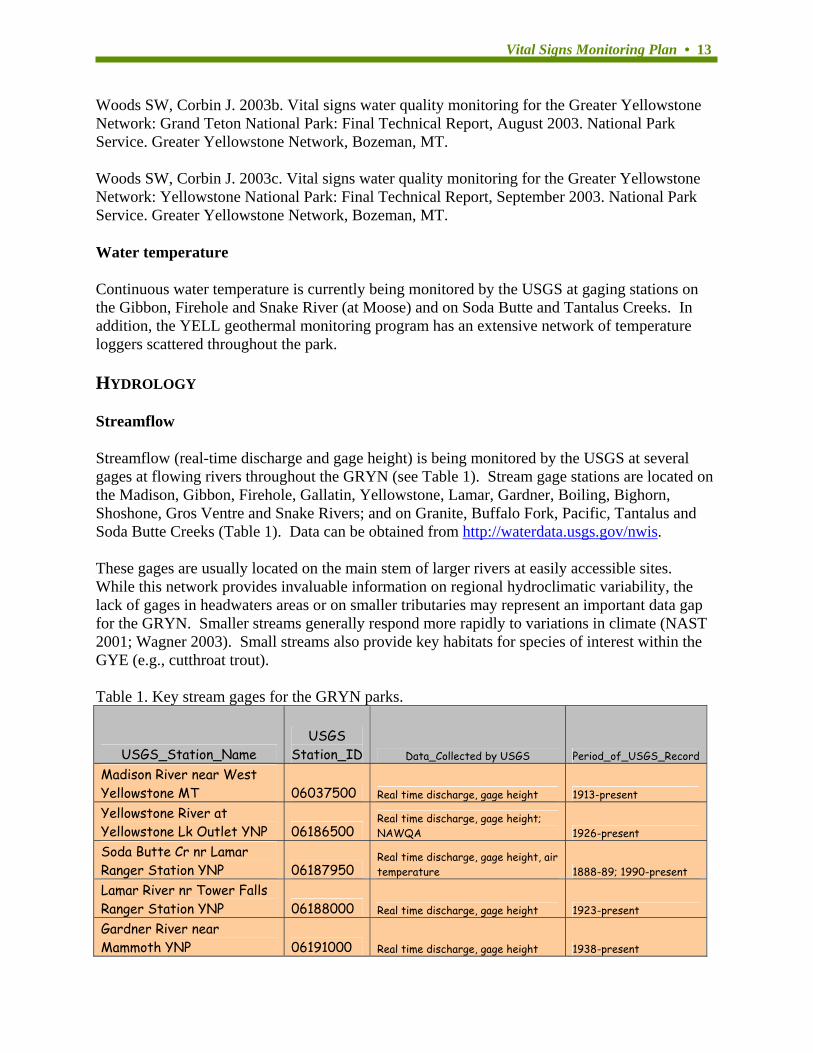
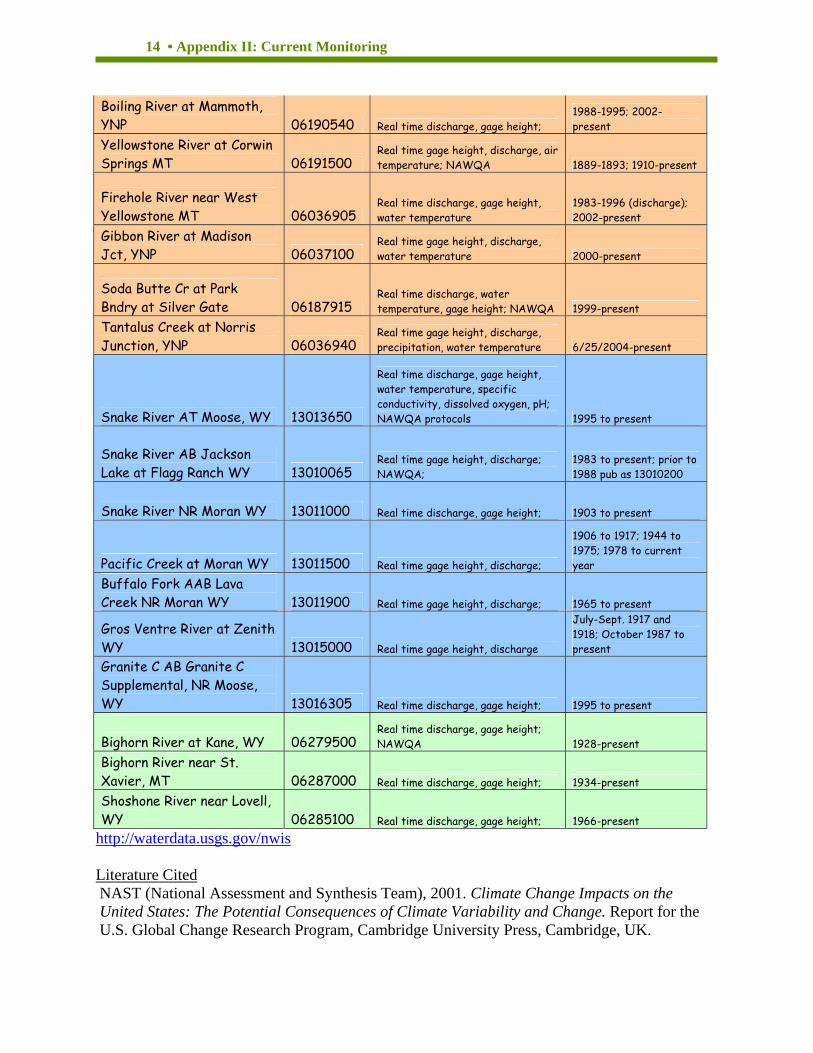
Streamflow (real-time discharge and gage height) is being monitored by the USGS at several gages at flowing rivers throughout the GRYN (see Table 1). Stream gage stations are located on the Madison, Gibbon, Firehole, Gallatin, Yellowstone, Lamar, Gardner, Boiling, Bighorn, Shoshone, Gros Ventre and Snake Rivers; and on Granite, Buffalo Fork, Pacific, Tantalus and Soda Butte Creeks (Table 1). Data can be obtained from http://waterdata.usgs.gov/nwis. These gages are usually located on the main stem of larger rivers at easily accessible sites. While this network provides invaluable information on regional hydroclimatic variability, the lack of gages in headwaters areas or on smaller tributaries may represent an important data gap for the GRYN. Smaller streams generally respond more rapidly to variations in climate (NAST 2001; Wagner 2003). Small streams also provide key habitats for species of interest within the GYE (e.g., cutthroat trout). Table 1. Key stream gages for the GRYN parks.
USGS_Station_Name USGS
Station_ID Data_Collected by USGS Period_of_USGS_Record
Madison River near West Yellowstone MT 06037500 Real time discharge, gage height 1913-present
Yellowstone River at Yellowstone Lk Outlet YNP 06186500
Real time discharge, gage height; NAWQA 1926-present
Soda Butte Cr nr Lamar Ranger Station YNP 06187950
Real time discharge, gage height, air temperature 1888-89; 1990-present
Lamar River nr Tower Falls Ranger Station YNP 06188000 Real time discharge, gage height 1923-present
Gardner River near Mammoth YNP 06191000 Real time discharge, gage height 1938-present
14 • Appendix II: Current Monitoring
Boiling River at Mammoth, YNP 06190540 Real time discharge, gage height;
1988-1995; 2002-present
Yellowstone River at Corwin Springs MT 06191500
Real time gage height, discharge, air temperature; NAWQA 1889-1893; 1910-present
Firehole River near West Yellowstone MT 06036905
Real time discharge, gage height, water temperature
1983-1996 (discharge); 2002-present
Gibbon River at Madison Jct, YNP 06037100
Real time gage height, discharge, water temperature 2000-present
Soda Butte Cr at Park Bndry at Silver Gate 06187915
Real time discharge, water temperature, gage height; NAWQA 1999-present
Tantalus Creek at Norris Junction, YNP 06036940
Real time gage height, discharge, precipitation, water temperature 6/25/2004-present
Snake River AT Moose, WY 13013650
Real time discharge, gage height, water temperature, specific conductivity, dissolved oxygen, pH; NAWQA protocols 1995 to present
Snake River AB Jackson Lake at Flagg Ranch WY 13010065
Real time gage height, discharge; NAWQA;
1983 to present; prior to 1988 pub as 13010200
Snake River NR Moran WY 13011000 Real time discharge, gage height; 1903 to present
Pacific Creek at Moran WY 13011500 Real time gage height, discharge;
1906 to 1917; 1944 to 1975; 1978 to current year
Buffalo Fork AAB Lava Creek NR Moran WY 13011900 Real time gage height, discharge; 1965 to present
Gros Ventre River at Zenith WY 13015000 Real time gage height, discharge
July-Sept. 1917 and 1918; October 1987 to present
Granite C AB Granite C Supplemental, NR Moose, WY 13016305 Real time discharge, gage height; 1995 to present
Bighorn River at Kane, WY 06279500 Real time discharge, gage height; NAWQA 1928-present
Bighorn River near St. Xavier, MT 06287000 Real time discharge, gage height; 1934-present
Shoshone River near Lovell, WY 06285100 Real time discharge, gage height; 1966-present
http://waterdata.usgs.gov/nwis Literature Cited NAST (National Assessment and Synthesis Team), 2001. Climate Change Impacts on the United States: The Potential Consequences of Climate Variability and Change. Report for the U.S. Global Change Research Program, Cambridge University Press, Cambridge, UK.
Vital Signs Monitoring Plan • 15
Wagner FH. (ed.), 2003. Rocky Mountain/Great Basin Regional Climate Change Assessment. A Report of the Rocky Mountain/Great Basin Regional Assessment Team for the U.S. Global Change Research Program. Utah State University, Logan, UT.
Lake and Reservoir elevation
The Bureau of Reclamation also continuously monitors the lake levels of Bighorn and Jackson Lakes. Data for Jackson Lake Reservoir may be found at: http://www.usbr.gov/pn/hydromet/burtea.cfm . Data for Bighorn Lake may be found at: http://www.usbr.gov/gp/htbin/hydromet_teacup?BH.
Biological Integrity
INVASIVE SPECIES
Invasive Plants
Invasive plant monitoring is largely taking place through repeat inventories across the network. At Bighorn Canyon NRA, a subset of high priority invasive plants have been mapped or inventoried (via transects) in all management areas. Major paved roads are treated several times a year for invasive plants followed by informal walk-through surveys to monitor treatment effectiveness. Walkthrough effectiveness surveys are also conducted at other significant weed treatment areas within the NRA (Pickett, pers. comm. 2004). At Grand Teton NP nearly all invasive plant species have been mapped throughout the Park using a variety of survey methods. A few infestations (orange hawkweed, Dyer’s woad, sulphur cinquefoil) that have been treated through mechanical (e.g. hand pulling, mowing) or chemical means are being monitored for treatment effectiveness. Several biological exotic plant control agents have been released in the Park over the last 9 years, and long-term monitoring transects have been installed on all release sites (Haynes and Janssen, pers, comm., 2004). At Yellowstone annual monitoring of high priority invasive plant species along roads and in developed areas began in the early 1990’s (Olliff and others 2001). Informal walk-through surveys are conducted along roadsides to monitor population trends as well as treatment effectiveness. Infestations are classified by density classes (low, medium, high). Opportunistic surveys for exotic plants are also conducted in other areas of YELL by backcountry Rangers (Renkin, pers. comm. 2004). In addition, Dalmatian toadflax was surveyed and monitored in the Mammoth Hot Springs area in the mid-1970’s. References: Haynes, Steve. Telephone conversation with: Elizabeth Crowe. 2004, Jun 30. Janssen, Eric. Telephone conversation with: Elizabeth Crowe. 2004, Jul 8.
16 • Appendix II: Current Monitoring
Olliff T, Renkin R, McClure C, Miller P, Price D, Reinhart D, Whipple J. 2001. Managing a complex exotic vegetation management program in Yellowstone National Park. Western North American Naturalist 61(3):347-358. Pickett, Bill. Telephone conversation with: Elizabeth Crowe. 2004, Jul 7. Renkin, Roy. Telephone conversation with: Elizabeth Crowe. 2004, Jul 7.
INFESTATIONS AND DISEASE
Forest Insect and Disease Monitoring
Forest pest insects and diseases in the Greater Yellowstone Ecosystem are monitored by the Forest Health Protection (FHP) program (web address: http://www.fs.fed.us/foresthealth/), which is part of the State and Private Forestry section of the USDA-Forest Service. This program monitors long-term health, insects and pathogens by conducting low-elevation aerial surveys on all federal and state forested lands (Harris pers. comm.). The GYE is completely surveyed approximately every three years. More frequent surveys, however, are conducted in areas of high priority, and YELL has been surveyed in 2002, 2003 and 2004. Outbreaks and expansions of forest insect pests and diseases detected in the aerial surveys are mapped and reported to state and Federal forest management agencies (e.g. NPS, U.S. Forest Service, Wyoming Dept. of Forestry). Some ground surveys are also conducted by FHP entomologists and pathologists to follow up on severe infestations. FHP does not survey BICA currently, but does monitor the nearby Custer and Bighorn National Forests. Reports on forest insect and diseases conditions are released yearly. Regional reports can be found at (http://www.fs.fed.us/foresthealth/current_conditions.shtml) and state reports can be found at (http://www.na.fs.fed.us/spfo/fhm/fhh/fhmusamap.htm). Transects to survey for the presence of blister rust in whitebark pine throughout YELL were placed in 1957 and have been monitored as recently as 1995 (Kendall and Keane 2001). In 2004 protocols for future whitebark pine monitoring are being piloted in YELL and surrounding national forests (see Whitebark Pine Monitoring Plan and Protocols).
Literature Cited Kendall KC, Keane RE. 2001. Whitebark pine decline: infection, mortality, and population trends. Pp. 221-242 in Tomback DF, Arno SF, Keane RE (eds.), Whitebark pine communities: ecology and restoration. Island Press. Washington, D.C.
VERTEBRATE DISEASE
Numerous diseases are known to affect – or have the potential to affect – vertebrates living or migrating through the GRYN parks and, thus, current vertebrate disease monitoring efforts involve several state and federal agencies. USFWS and NPS scientists monitor brucellosis and numerous other pathogens in the Jackson bison and elk herds that range between the National Elk Refuge (NER) and GRTE. Some of this monitoring is in conjunction with Wyoming Game

Vital Signs Monitoring Plan • 17
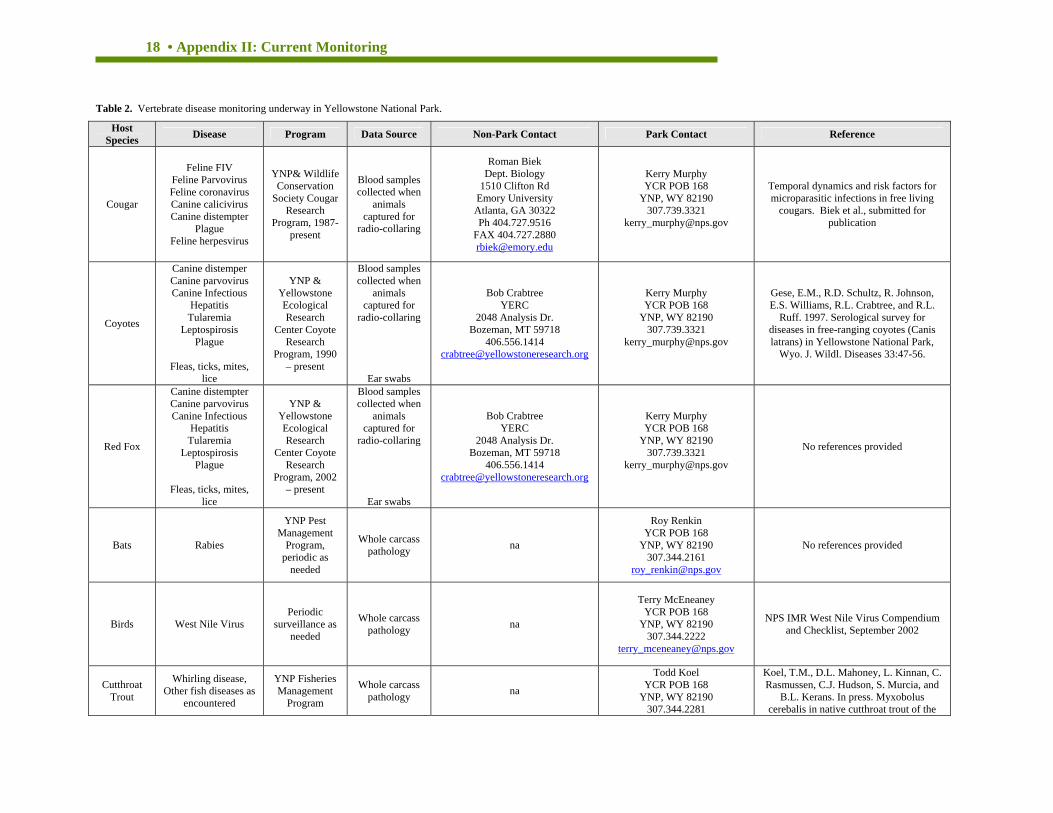
and Fish, which also surveys for Chronic Wasting Disease. The Jackson elk herd has been included in that surveillance since 2001. At BICA the USGS recently completed a three-year mortality study of bighorn sheep that included a blood sampling for disease. The work was in response to a 1995 bighorn sheep decline that appeared consistent with disease propagation. The work, which did find evidence of Pasturella pneumonia, is complete with no current plans to extend into a regular monitoring program. In YELL, disease monitoring is done by the Bison Ecology and Management Program, the Yellowstone Ungulate Program, the Wolf Recovery Program and the Fisheries Management Program and through partnerships and research activities of the Wildlife Conservation Society and the Yellowstone Ecological Research Center. Table 2 summarizes vertebrate disease monitoring underway in YELL.
18 • Appendix II: Current Monitoring
Table 2. Vertebrate disease monitoring underway in Yellowstone National Park.
Host Species Disease Program Data Source Non-Park Contact Park Contact Reference
Cougar
Feline FIV Feline Parvovirus Feline coronavirus Canine calicivirus Canine distempter
Plague Feline herpesvirus
YNP& Wildlife Conservation
Society Cougar Research
Program, 1987- present
Blood samples collected when
animals captured for
radio-collaring
Roman Biek Dept. Biology
1510 Clifton Rd Emory University Atlanta, GA 30322 Ph 404.727.9516
FAX 404.727.2880 [email protected]
Kerry Murphy YCR POB 168
YNP, WY 82190 307.739.3321
Temporal dynamics and risk factors for microparasitic infections in free living
cougars. Biek et al., submitted for publication
Coyotes
Canine distemper Canine parvovirus Canine Infectious
Hepatitis Tularemia
Leptospirosis Plague
Fleas, ticks, mites,
lice
YNP & Yellowstone Ecological Research
Center Coyote Research
Program, 1990 – present
Blood samples collected when
animals captured for
radio-collaring
Ear swabs
Bob Crabtree YERC
2048 Analysis Dr. Bozeman, MT 59718
406.556.1414 [email protected]
Kerry Murphy YCR POB 168
YNP, WY 82190 307.739.3321
Gese, E.M., R.D. Schultz, R. Johnson, E.S. Williams, R.L. Crabtree, and R.L.
Ruff. 1997. Serological survey for diseases in free-ranging coyotes (Canis latrans) in Yellowstone National Park,
Wyo. J. Wildl. Diseases 33:47-56.
Red Fox
Canine distempter Canine parvovirus Canine Infectious
Hepatitis Tularemia
Leptospirosis Plague
Fleas, ticks, mites,
lice
YNP & Yellowstone Ecological Research
Center Coyote Research
Program, 2002 – present
Blood samples collected when
animals captured for
radio-collaring
Ear swabs
Bob Crabtree YERC
2048 Analysis Dr. Bozeman, MT 59718
406.556.1414 [email protected]
Kerry Murphy YCR POB 168
YNP, WY 82190 307.739.3321
No references provided
Bats Rabies
YNP Pest Management
Program, periodic as
needed
Whole carcass pathology na
Roy Renkin YCR POB 168
YNP, WY 82190 307.344.2161
No references provided
Birds West Nile Virus Periodic
surveillance as needed
Whole carcass pathology na
Terry McEneaney YCR POB 168
YNP, WY 82190 307.344.2222
NPS IMR West Nile Virus Compendium and Checklist, September 2002
Cutthroat Trout
Whirling disease, Other fish diseases as
encountered
YNP Fisheries Management
Program
Whole carcass pathology na
Todd Koel YCR POB 168
YNP, WY 82190 307.344.2281
Koel, T.M., D.L. Mahoney, L. Kinnan, C. Rasmussen, C.J. Hudson, S. Murcia, and
B.L. Kerans. In press. Myxobolus cerebalis in native cutthroat trout of the
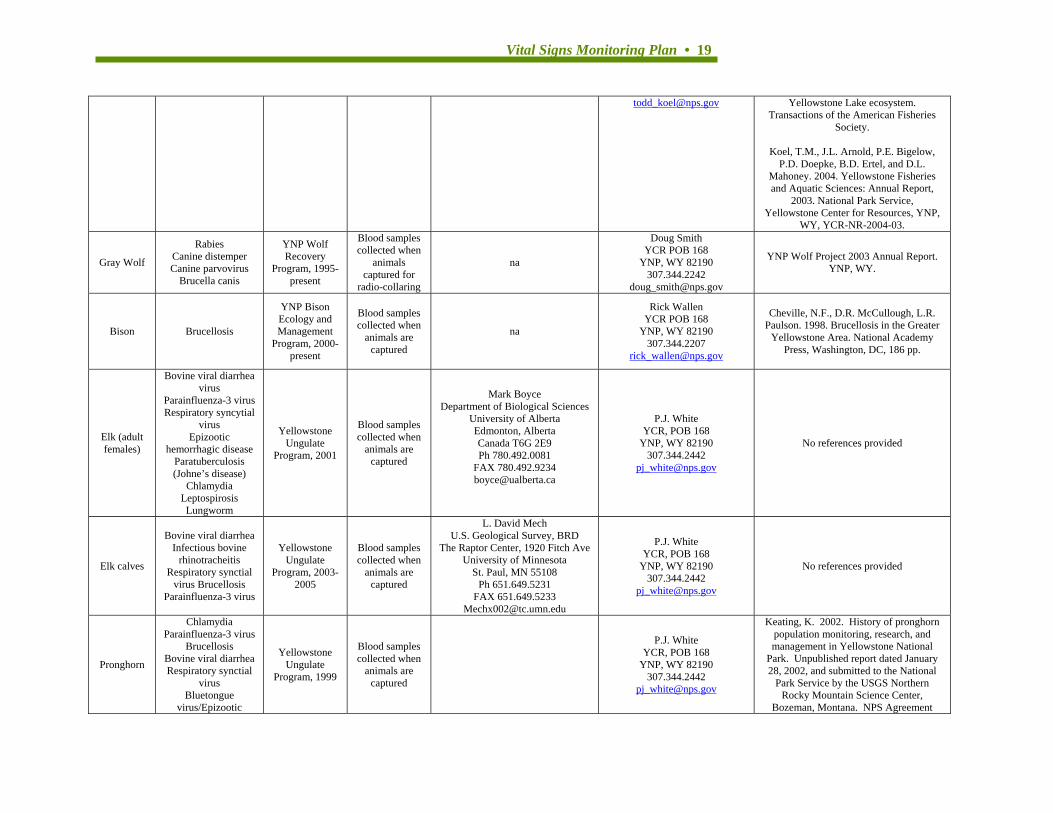
Vital Signs Monitoring Plan • 19
[email protected] Yellowstone Lake ecosystem. Transactions of the American Fisheries
Society.
Koel, T.M., J.L. Arnold, P.E. Bigelow, P.D. Doepke, B.D. Ertel, and D.L.
Mahoney. 2004. Yellowstone Fisheries and Aquatic Sciences: Annual Report,
2003. National Park Service, Yellowstone Center for Resources, YNP,
WY, YCR-NR-2004-03.
Gray Wolf
Rabies Canine distemper Canine parvovirus
Brucella canis
YNP Wolf Recovery
Program, 1995- present
Blood samples collected when
animals captured for
radio-collaring
na
Doug Smith YCR POB 168
YNP, WY 82190 307.344.2242
YNP Wolf Project 2003 Annual Report. YNP, WY.
Bison Brucellosis
YNP Bison Ecology and Management
Program, 2000-present
Blood samples collected when
animals are captured
na
Rick Wallen YCR POB 168
YNP, WY 82190 307.344.2207
Cheville, N.F., D.R. McCullough, L.R. Paulson. 1998. Brucellosis in the Greater
Yellowstone Area. National Academy Press, Washington, DC, 186 pp.
Elk (adult females)
Bovine viral diarrhea virus
Parainfluenza-3 virus Respiratory syncytial
virus Epizootic
hemorrhagic disease Paratuberculosis (Johne’s disease)
Chlamydia Leptospirosis Lungworm
Yellowstone Ungulate
Program, 2001
Blood samples collected when
animals are captured
Mark Boyce Department of Biological Sciences
University of Alberta Edmonton, Alberta Canada T6G 2E9 Ph 780.492.0081
FAX 780.492.9234 [email protected]
P.J. White YCR, POB 168
YNP, WY 82190 307.344.2442
No references provided
Elk calves
Bovine viral diarrhea Infectious bovine
rhinotracheitis Respiratory synctial
virus Brucellosis Parainfluenza-3 virus
Yellowstone Ungulate
Program, 2003-2005
Blood samples collected when
animals are captured
L. David Mech U.S. Geological Survey, BRD
The Raptor Center, 1920 Fitch Ave University of Minnesota
St. Paul, MN 55108 Ph 651.649.5231
FAX 651.649.5233 [email protected]
P.J. White YCR, POB 168
YNP, WY 82190 307.344.2442
No references provided
Pronghorn
Chlamydia Parainfluenza-3 virus
Brucellosis Bovine viral diarrhea Respiratory synctial
virus Bluetongue
virus/Epizootic
Yellowstone Ungulate
Program, 1999
Blood samples collected when
animals are captured
P.J. White YCR, POB 168
YNP, WY 82190 307.344.2442
Keating, K. 2002. History of pronghorn population monitoring, research, and management in Yellowstone National
Park. Unpublished report dated January 28, 2002, and submitted to the National
Park Service by the USGS Northern Rocky Mountain Science Center,
Bozeman, Montana. NPS Agreement

20 • Appendix II: Current Monitoring
hemorrhagic disease virus
Paratuberculosis (Johne’s disease)
Leptospirosis
#1443-IA-1248-01-006.
Bighorn Sheep Lungworm
Yellowstone Ungulate
Program, 2004
Fecal samples collected during
winter on Mt. Everts
P.J. White YCR, POB 168
YNP, WY 82190 307.344.2442
No references provided
Vital Signs Monitoring Plan • 21
FOCAL SPECIES OR COMMUNITIES
Aspen
Following the fires of 1988, Roy Renkin and Don Despain established 15 aspen seedling monitoring sites in various habitats in the northern half of the park (Renkin and Despain 1996). Other long-term aspen monitoring transects (112 in total) were established in 1999 and re-read in 2001 to study landscape-level trends in aspen dynamics, especially with regard to the effect of wolves on elk browsing behavior (Ripple et al. 2001). These transects were scheduled to be re-surveyed in 2004 (Renkin pers. comm.). In GRTE and BICA no monitoring of aspen is currently being conducted. Literature Cited Renkin R, Despain DG. 1996. Notes on postfire aspen seedling establishment. In: Greenlee JM, editor. Second biennial conference on the Greater Yellowstone Ecosystem; 1993, September; Yellowstone National Park. International Association of Wildland Fire. p 105-106. Ripple WJ, Larsen EJ, Renkin RA, Smith DW. 2001. Trophic cascades among wolves, elk and aspen on Yellowstone National Park’s northern range. Biological Conservation 102: 227-234.
Riparian Monitoring
In Yellowstone National Park, ungulate exclosures constructed from 1957-62 have provided opportunities for long-term vegetation monitoring of vascular plants and riparian communities. Past monitoring has involved repeat photography, rather than site measurements, as a monitoring tool (Kay 1990, Meagher and Houston 1998). Transects installed in willow communities between 1985-1987 have been monitored periodically (Singer 1996, Singer et al. 1994). Another cycle of monitoring these transects started in 2003 and will continue until 2007. A new set of monitoring transects in willow communities are being installed in 2004. The focus of all current willow monitoring is use by ungulates, especially how the reintroduced wolf population has affected ungulate browse behavior. No long-term monitoring of riparian vegetation is currently occurring in BICA or GRTE. A thesis project carried out in 1988 examined changes in riparian vegetation composition along the Bighorn River with BICA from 1938-1986 (Akashi 1988). Literature Cited Akashi Y. 1988. Major Vegetation Types Found in the Bighorn River Floodplain Study Area in Bighorn Canyon NRA [MSc thesis]. Laramie: University of Wyoming. 245 p. Kay CE. 1990. Yellowstone's northern elk herd: a critical evaluation of the "natural regulation" paradigm [dissertation]. Logan: Utah State University. 490 p. Meagher MM, Houston DB. 1998. Yellowstone and the biology of time: photographs across a century. Norman, OK: University of Oklahoma Press. 287 p.
22 • Appendix II: Current Monitoring
Singer FJ. 1996. Differences between willow communities browsed by elk and communities protected for 32 years in Yellowstone National Park. In: Singer FJ, editor. Effects of Grazing by Wild Ungulates in Yellowstone National Park. Denver, CO: U.S. Department of Interior, National Park Service. p 279-290. Singer FJ, Mark LC, Cates RC. 1994. Ungulate herbivory of willows on Yellowstone's northern winter range. Journal of Range Management 47:435-443.
Canada Lynx
In March 2000, the USFWS listed the Canada lynx as a threatened species (USFWS 2000). Canada lynx were listed as threatened due to the inadequacy of forest plans to provide for protection of the ecological needs of lynx. National forest and park resource management plans have been amended, and a strategy is now in place for the conservation of lynx and their habitat. Threats include loss of connectivity between isolated ecosystems supporting lynx, incidental mortality during otherwise lawful trapping, hunting and snaring of other animals, and human encroachment on wildlands (USFWS 2003). An inventory of Canada lynx in Yellowstone National Park was completed in 2004. Using a variety of survey methods, Canada lynx adults and kittens were detected in the park, with most detections occurring in an area near Yellowstone Lake that supports forests with dense understory vegetation (Murphy et al. 2004). It was concluded that the Canada lynx suffers from reduced population viability in the park, probably because the park represents the limit of its range (Murphy et al. 2004). GRTE has completed a three-year study in collaboration with the Wildlife Conservation Society to determine (a) the status of lynx in the park, and (b) the activity of their primary prey, snowshoe hares. Results from these efforts will provide information for the determination of coarse-scale habitat requirements and, ultimately, what role Grand Teton plays in the overall conservation of lynx.
Black Bears (Ursus americanus)
Black bears occupy much of the same habitat as grizzly bears, although black bears tend to prefer areas that are closer to human occupation and at low- to mid-elevations (IGBST 2004). While previous work on black bears in the GYE has been limited to ground telemetry and home-range estimations, the IGBST has begun to monitor black bear demographics in YELL and GRTE to provide supplemental information to their grizzly bear monitoring efforts. This monitoring should lead to a better understanding of black bear habitat use, competition with grizzly bears and other predators, such as wolves, for limited food resources, and interactions with humans (IGBST 2004). To determine how black bears use the ecosystem, the IGBST collars randomly captured bears and locates them during grizzly bear telemetry flights. In addition, given ample time, the team visits feeding sites on the ground and collects data on vegetation and site characteristics (IGBST 2004).
Vital Signs Monitoring Plan • 23
Yellowstone National Park tracks bear management activities and posts annual updates on the following website: http://www.nps.gov/yell/nature/animals/bear/grizzlyup.html. The site contains information on numbers of sightings and signs reported by visitors and staff, first and last observation dates, bears that were captured, moved or euthanized, mortalities and food availability. Bear sightings reports are also posted every few weeks on the following website: http://www.nps.gov/yell/nature/animals/bear/index.htm.
Cougars (Puma [Felis] concolor)
After being nearly eliminated in the GYE in the early 20th century, the number of cougars in northern Yellowstone has fluctuated between 14 and 23 since 1987 (Ruth 2004). Cougar ecology has been monitored in two phases—one before and one after the reintroduction of wolves in Yellowstone—by the Hornocker Wildlife Institute, now part of the Wildlife Conservation Society, and in conjunction with the Yellowstone Wolf Project and the Interagency Grizzly Bear Study Team (Ruth 2004). The goals of this monitoring include understanding the following: cougar movement; habitat use in relation to wolves and bears; cougar demographics; predation rates of cougars, as well as cougar predation on other animals; denning data, including litter sizes and sex ratios; and genetic and disease analyses. Thus far, 65 adults, subadults and kittens have been radio collared and are monitored in an area of northern Yellowstone that corresponds with the ranges of 3-5 wolf packs (Ruth 2004). Literature Cited Interagency Grizzly Bear Study Team (IGBST). 2004. Black bear demographics in Yellowstone and Grand Teton National Parks: their interrelationship to other carnivores, habitats and humans. <http://www.nrmsc.usgs.gov/projects/igbst_BB.htm>. Accessed 2004 Jul 13. Ruth TK. 2004. Ghost of the Rockies: the Yellowstone cougar project. Yellowstone Science 12(1): 13-17.
Ungulates
Under construction!!!
AT-RISK BIOTA
Bald Eagles
Significant increases in population numbers caused the USFWS to downlist the bald eagle from endangered to threatened in 1995 (McEneaney 2004). When the eagle was originally chosen as the national symbol in 1782, some 100,000 nesting pairs of bald eagles resided in the continental United States. By 1963, their numbers were down to 417 pairs (USFWS 1999). A loss of nesting habitat, coupled with the use of DDT and other organochlorines, which caused thinning of egg shells and decreased nesting success, lead to the decline in bald eagle populations (USFWS 1999). Captive breeding programs, reintroduction efforts, nest site protection and law enforcement helped in the recovery effort (USFWS 1999).

24 • Appendix II: Current Monitoring
Although the eagle has now been downlisted, populations in the Great Lakes region and the desert southwest are still threatened by heavy metal contamination and habitat destruction, respectively (McEneaney 2004). In addition to the protection afforded by the Endangered Species Act, the bald eagle is also protected under the Bald and Golden Eagle Protection Act and the Migratory Bird Treaty Act (USFWS 1999). Yellowstone National Park publishes an annual report documenting the population status, territorial occupancy and nest productivity of the bald eagle. Bald eagle monitoring has been ongoing in Grand Teton National Park since the 1970s, including ground surveys for nests and monitoring reproductive status at historical nests (Wolff 2003). Bald eagle nests south of Bighorn Canyon National Recreation Area are currently monitored by Wyoming Game and Fish and the Bureau of Land Management (D. Saville pers. comm.). This monitoring is mostly within the boundaries of the Yellowtail Wildlife Habitat Area, but also extends approximately 0.5 miles into BICA boundaries (B. Pickett pers. comm.). Please see Appendix III for links to reports and information on monitoring by the Greater Yellowstone Coordinating Committee outside the parks. The Yellowstone National Park Bird Report began as a quarterly document and became an annual report in 1996. The reports can be accessed at the following website: http://www.nps.gov/yell/nature/animals/birds/birdreports.htm. In the 2003 Yellowstone Annual Bird Report, 32 active nests produced 24 fledged eaglets—the highest number in recorded history (McEneaney 2004). While the 1988 fires have not yet proved to be a detriment to bald eagle populations, falling trees may lead to nest failure and territory changes in the future (McEneaney 2004). Much of the monitoring information on bald eagle status in GRTE, including nesting status, number of nestlings, and fledgling success, has not been recorded in approximately 30% of known nests due to staffing constraints in the past few years. In 2001, Science and Resource Management at GRTE identified eight historical nests and one new nest during a helicopter survey funded by the GRYN. GPS coordinates for nest sites were taken and will be used for monitoring in the future (Wolff 2003). The Greater Yellowstone Bald Eagle Working Group, a subcommittee of the Greater Yellowstone Coordinating Committee, is comprised of participants from the following organizations: Yellowstone and Grand Teton National Parks, Caribou-Targhee National Forest, Bridger-Teton National Forest, Gallatin National Forest, USFS Regional T&E staff, Red Rock Lakes National Wildlife Refuge, Montana Fish, Wildlife and Parks, Idaho Fish and Game, Wyoming Game and Fish, USFWS consultation biologists, University of Wyoming, Montana State University, BLM, private industry and Bureau of Reclamation. The Bald Eagle Working Group began in 1981 and met twice annually from 1982 to 1995 with the goal to create management goals and objectives and facilitate research and cooperation with respect to bald eagles in the Greater Yellowstone Area (GYCC 2003). The subcommittee produced a management plan for bald eagles in the GYA in 1983, which was subsequently updated in 1995, when the bald eagle was downlisted to threatened. This management plan is likely to be used as a “Conservation and Monitoring Plan” for the bald eagle if it is removed from the threatened
Vital Signs Monitoring Plan • 25
species list (GYCC 2003). As of 2004, Bob Oakleaf of the Wyoming Game and Fish Department in Cheyenne was the chair of the subcommittee (GYCC 2003). Literature Cited Greater Yellowstone Coordinating Committee. 2003. Summary of subcommittees/working groups. McEneaney T. 2004. Yellowstone bird report 2003. National Park Service, Yellowstone Center for Resources, Yellowstone National Park, Wyoming, YCR–NR–2003–01. U.S. Fish and Wildlife Service (USFWS). 1999. The bald eagle is back! President Clinton announces proposal to remove our national symbol from endangered species list. <http://news.fws.gov/NewsReleases/R9/A11C3CEE-AC20-11D4-A179009027B6B5D3.html>. Accessed 2004 Jun 7. Wolff S. 2003. Bald eagle and sage grouse inventory update 2001-2003. National Park Service, Grand Teton National Park, Moose, Wyoming. 4 pp.
Grizzly Bears
Grizzly bears were listed as threatened under the Endangered Species Act on July 28, 1975 (USFWS 1993). At the time of listing, they occupied only 2% of their original range in the continental United States and numbered 800 to 1,000 individuals in five or six populations (USFWS 1993). After listing, work began on the recovery plan for the species, which was approved on January 29, 1982, with revisions made in 1993 (USFWS 1993). The primary threats to grizzly bear populations are loss of habitat due to fragmentation, and adverse bear-human interactions, which leads to the destruction of “nuisance” bears (USFWS 1993). Human encroachment into grizzly habitat is a major threat because of the bears’ very large home ranges that cover 309-537 square miles for females and 813-2,075 square miles for males (YELL 2004a). In an effort to provide information to assist with long-term management of grizzly bears in the GYE, the Interagency Grizzly Bear Study Team (IGBST) was formed in 1973. This team has representatives from the following agencies: U.S. Geological Survey, National Park Service, U.S. Forest Service, U.S. Fish and Wildlife Service, Idaho Department of Fish and Game, Montana Fish, Wildlife and Parks, and the Wyoming Game and Fish Department. The IGBST is responsible for: “conduct[ing] both short- and long-term research projects addressing information needs for bear management; monitor[ing] the bear population, including status and trend, numbers, reproduction, and mortality; monitor[ing] grizzly bear habitats, foods and impacts of humans; and provid[ing] technical support to agencies and other groups responsible for the immediate and long-term management of grizzly bears in the GYE” (Schwartz and Moody 2004). For further information on recovery goals, the IGBST and bear management activities in YELL, please consult Appendix III. This recovery plan delineated a recovery area in the Greater Yellowstone Ecosystem that includes all or most of the following federal land units: Yellowstone National Park, Grand Teton
26 • Appendix II: Current Monitoring
National Park, John D. Rockefeller, Jr. Memorial Parkway, Bridger-Teton National Forest, Shoshone National Forest, Gallatin National Forest, Caribou-Targhee National Forest, Custer National Forest, Beaverhead-Deer Lodge National Forest, and state, private and Bureau of Land Management lands in Idaho, Montana and Wyoming (YELL 2004). Main recovery goals for the grizzly bear include: “1) average 15 adult females with cubs of the year inside the recovery zone and within a 10-mile area surrounding the recovery zone; 2) females with young occupy 16 of 18 recovery zones and no two adjacent areas shall be unoccupied; 3) known human-caused mortality is below 4% of the population estimate based on the most recent three-year sum of females with cubs minus known adult female deaths. In addition, no more than 30% of the known human-caused mortality shall be females. These mortality limits cannot be exceeded during any two consecutive years” (YELL 2004). The IGBST website is at: http://www.nrmsc.usgs.gov/research/igbst-home.htm. An annual report is published (and available on the website) that summarizes findings from monitoring and research throughout the year. IGBST captures and collars a number of bears each year that they radio monitor throughout the year in order to track denning activity, mortality, occupancy and reproduction. Also important to understanding the ecology of grizzly bears is research on food sources, including ungulates, cutthroat trout, whitebark pine seeds, army cutworm moths and other insects, as well as their interactions with humans and the correlation between these interactions and the availability of natural food sources (IGBST 2004). In 2003, the Interagency Conservation Strategy Team—made up of representatives from NPS, USFS, USFWS, IGBST, Idaho Department of Fish and Game, Montana Fish, Wildlife and Parks and the Wyoming Department of Game and Fish—published the final Conservation Strategy for the grizzly bear in the Greater Yellowstone Ecosystem, which would go into effect if the bear is delisted in the future (USFS 2003). Yellowstone National Park tracks bear management activities and posts annual updates on the following website: http://www.nps.gov/yell/nature/animals/bear/grizzlyup.html. The site contains information on numbers of sightings and signs reported by visitors and staff, first and last observation dates, bears that were captured, moved or euthanized, mortalities and food availability. Bear sightings reports are also posted every few weeks on the following website: http://www.nps.gov/yell/nature/animals/bear/index.htm. Literature Cited Interagency Grizzly Bear Study Team (IGBST). 2004. Yellowstone grizzly bear investigations: annual report of the Interagency Grizzly Bear Study Team, 2003. CC Schwartz and MA Haroldson, eds. U.S. Geological Survey, Bozeman, MT. 64 pp. plus appendices. U.S. Fish and Wildlife Service (USFWS). 2003. U.S. Fish and Wildlife Service finds that Canada lynx should remain listed as threatened in lower 48. <http://news.fws.gov/NewsReleases/R6/560B1008-2E34-4321-B5E1508B05545815.html>. Accessed 2003 Aug 27.
Vital Signs Monitoring Plan • 27
Yellowstone National Park (YELL). 2004. Yellowstone resources and issues 2004. National Park Service, Yellowstone National Park, Division of Interpretation, Mammoth Hot Springs, WY. 191 pp.
Gray Wolves
Although listed as a non-essential, experimental species under the final U.S. Fish and Wildlife Service (USFWS 1994) ruling, national parks are directed to manage wolves as a threatened species under Section 10(j) of the Endangered Species Act. In Yellowstone, wolves have been monitored since their reintroduction in 1995 and 1996; this monitoring includes information on population dispersal, distribution, reproduction, mortality and predation of ungulates (Smith et al. 2003). After their 70-year absence from Jackson Hole, gray wolves returned to Grand Teton National Park in the fall of 1998, when two groups from the Yellowstone reintroduction appeared. Most of the monitoring ongoing outside of Yellowstone National Park is lead by USFWS and USFS staff and consists of censusing, monitoring of reproduction and mortalities, and movement and dispersal patterns (USFWS et al. 2004). Science and Resource Management personnel at Grand Teton locate radio-collared wolves using aerial surveys and conduct ground-based observations of packs in the region from May through September (GRTE 2004). Please see Appendix III for links to reports and further information on monitoring outside the parks. The Yellowstone Wolf Project team publishes an annual report documenting population status, pack summaries, wolf management, and research and public education efforts related to wolves in the GYE (Smith et al. 2003). This report is available through the Yellowstone National Park website at http://www.nps.gov/yell/nature/animals/wolf/wolfup.html. The U.S. Fish and Wildlife Service, Nez Perce Tribe, National Park Service and USDA Wildlife Service collaborate on a Rocky Mountain Wolf Recovery Annual Report, available at http://westerngraywolf.fws.gov/annualreports.htm (USFWS et al. 2004). This report covers wolf populations found in three recovery areas: the northwest Montana recovery area, the Greater Yellowstone recovery area and the central Idaho recovery area, and includes information on current ongoing research and monitoring efforts in the recovery areas (USFWS et al. 2004). Wolves in the northwest Montana recovery area are classified as threatened as of 2004, with wolves in the other two recovery areas classified as non-essential experimental populations (USFWS 2004). Additionally, the USFWS publishes a weekly wolf update that can be accessed at http://westerngraywolf.fws.gov/index.htm. This report gives detailed information about specific wolf monitoring, ongoing research and management information. Information on packs located within Grand Teton National Park can be found in both the Yellowstone Wolf Project Annual Report and the Rocky Mountain Wolf Recovery Annual Report. Literature Cited
28 • Appendix II: Current Monitoring
Smith DW, Stahler DR, Guernsey DS. 2003. Yellowstone Wolf Project: Annual Report, 2002. National Park Service, Yellowstone Center for Resources, Yellowstone National Park, Wyoming, YCR-NR-2003-04. U.S. Fish and Wildlife Service (USFWS), Nez Perce Tribe, National Park Service and USDA Wildlife Services. 2004. Rocky Mountain Wolf Recovery 2003 Annual Report. T. Meier, ed. USFWS, Ecological Services, 100 N Park, Suite 320, Helena MT. 65 pp.
Ecosystem Pattern and Processes
FIRE
Fire
The National Park Service Fire Effects Program provides scientific information to help evaluate prescribed fire management. Fire effects monitoring takes place at all three network parks with GRTE crews helping in BICA. At GRTE, a fire effects crew maintains a network of permanent vegetation monitoring plots in the park and surrounding Bridger-Teton National Forest. The plots follow protocols outlined in the NPS Fire Monitoring Handbook (NPS 2001) Literature Cited National Park Service. 2001. Fire Monitoring Handbook. Boise (ID) National Interagency Fire Center. 274 pp.
LAND USE AND COVER
Land Cover
Derived from the early to mid-1990s Landsat Thematic Mapper satellite data, the National Land Cover Data (NLCD) is a 21-class land cover classification scheme applied consistently over the United States. The spatial resolution of the data is 30 meters and mapped in the Albers Conic Equal Area projection, NAD 83. The NLCD are provided on a state-by-state basis. The state data sets were cut out from larger "regional" data sets that are mosaics of Landsat TM scenes. More detailed information on this dataset and the Land Cover Characterization Program can be found at http://landcover.usgs.gov/. The base data set for this project was leaves-off Landsat TM data, nominal-1992 acquisitions. Development of the 1992 NLCD was started in 1995, and the goal to develop a global 1km land cover characteristics database, was met in 1997. The next-generation product, the 2001 NLCD database, is being compiled across all 50 states and Puerto Rico as a cooperative mapping effort of the MRLC 2001 Consortium. This land-cover database is created using mapping zones and contains standardized land cover components useful for a variety of applications. Zones 21, 22, and 29 that include the parks of the Greater Yellowstone Network are less than 10% complete for the 2001 NLCD (as of July 2004). All of the available data for this and the 1992 NLCD project can be viewed online at http://gisdata.usgs.net/website/MRLC/.
Vital Signs Monitoring Plan • 29
The Thematic Mapper multi-band mosaics were processed using an unsupervised clustering algorithm. Both leaves-off and leaves-on data sets were analyzed. The resulting clusters were then labeled using aerial photography and ground observations. Clusters that represented more than one land-cover category were also identified and, using various ancillary data sets, models developed to split the confused clusters into the correct land-cover categories. Literature Cited: USGS. 2004 National Land Cover Dataset, Product Description. USGS website.
(http://landcover.usgs.gov/prodescription.asp.) Accessed 7/2/2004.
LAND USE
Under construction!!
SOUNDSCAPES
Soundscape Monitoring
Winter Soundscapes are being monitored in Yellowstone and Grand Teton National Parks to determine of management thresholds selected in the final Record of Decision for the Winter Use Plan are being met. A secondary objective is to collect baseline acoustic data for park-wide Soundscape management. The primary concern is human noise created by motorized recreational vehicles. Winter recreational use zones have been delineated and assigned threshold standards for maximum decibel levels and maximum audibility (percent of time sound is audible) for human-created sounds. Monitoring of sound in the different recreation management zones began during the 2003-2004 winter use season (December-March) (Burson 2003; Burson pers. comm.). In GRTE an additional concern is noise emanating from the international airport located within the park boundary. Year-round monitoring began in 2003 with the installation of instrumentation to measure sound at four locations surrounding the airport. Information will be gathered about the audibility and decibel levels of aircraft and other sound sources. In addition, one year-round sound monitor is installed on Signal Mountain in GRTE (Burson 2003). Literature Cited Burson S. 2003. Soundscape Research in Grand Teton National Park 2003-2004. November 18, 2003. National Park Service, Grand Teton National Park, Moose, WY. 9 pp.
Vital Signs Monitoring Plan • 1
Conceptual models developed during Phase I and Phase II are presented in the following appendix.
P H A S E IEcosystem Conceptual Models for Bighorn Canyon National Recreation Area, Grand Teton
National Park, and Yellowstone National Park . . . . . . . . . . . . . . . . . . . . . . . . . . . . . . . . . . . . . . . . . 2
Table of Contents 2
Bighorn Canyon National Recreation Area . . . . . . . . . . . . . . . . . . . . . . . . . . . . . . . . . . . . . . . . . . . . . . . . . . . 3
Grand Teton National Park . . . . . . . . . . . . . . . . . . . . . . . . . . . . . . . . . . . . . . . . . . . . . . . . . . . . . . . . . . . . . . 10
Yellowstone National Park . . . . . . . . . . . . . . . . . . . . . . . . . . . . . . . . . . . . . . . . . . . . . . . . . . . . . . . . . . . . . . 20
P H A S E I IConceptual Models for Dominant Vegetation, Aquatic and Geothermal Ecosystems
in Bighorn Canyon National Recreation Area, Grand Teton National Park, and Yellowstone National Park . . . . . . . . . . . . . . . . . . . . . . . . . . . . . . . . . . . . . . . . . . . . . . . . . . . . . . 28
Table of Contents 28
Aquatic Ecosystem Narrative Conceptual Model . . . . . . . . . . . . . . . . . . . . . . . . . . . . . . . . . . . . . . . . . . . . 30
Alpine-Timberline Ecosystem Narrative Conceptual Model . . . . . . . . . . . . . . . . . . . . . . . . . . . . . . . . . . . . 37
Aspen Ecosystem Narrative Conceptual Model . . . . . . . . . . . . . . . . . . . . . . . . . . . . . . . . . . . . . . . . . . . . . . 47
Dry Woodland Ecosystem Narrative Conceptual Model . . . . . . . . . . . . . . . . . . . . . . . . . . . . . . . . . . . . . . . 56
Geothermal Ecosystem Narrative Conceptual Model . . . . . . . . . . . . . . . . . . . . . . . . . . . . . . . . . . . . . . . . . 59
Grassland Ecosystem Narrative Conceptual Model . . . . . . . . . . . . . . . . . . . . . . . . . . . . . . . . . . . . . . . . . . . 63
Shrubland Ecosystem Narrative Conceptual Model . . . . . . . . . . . . . . . . . . . . . . . . . . . . . . . . . . . . . . . . . . . 72
Lodgepole Pine Ecosystem Narrative Conceptual Model . . . . . . . . . . . . . . . . . . . . . . . . . . . . . . . . . . . . . . 75
Mixed Conifer Ecosystem Narrative Conceptual Model . . . . . . . . . . . . . . . . . . . . . . . . . . . . . . . . . . . . . . . 80
Ponderosa Pine Ecosystem Narrative Conceptual Model . . . . . . . . . . . . . . . . . . . . . . . . . . . . . . . . . . . . . . 86
Whitebark Pine Ecosystem Narrative Conceptual Model . . . . . . . . . . . . . . . . . . . . . . . . . . . . . . . . . . . . . . . 90
Riparian/Riverine Ecosystem Narrative Conceptual Model . . . . . . . . . . . . . . . . . . . . . . . . . . . . . . . . . . . . . 95
Wetland Ecosystem Narrative Conceptual Model . . . . . . . . . . . . . . . . . . . . . . . . . . . . . . . . . . . . . . . . . . . 108
APPENDIX I I I : CONCEPTUAL MODELS
2 • Appendix III: Conceptual Models
Ecosystem Conceptual Models for Bighorn Canyon National Recreation Area,
Grand Teton National Park, and Yellowstone National ParkDuncan PattenDuncan Patten11 and Denine Schmitz and Denine Schmitz11
1Big Sky Institute
Montana State University
Bozeman, MT 59717
Table of ContentsBighorn Canyon National Recreation Area . . . . . . . . . . . . . . . . . . . . . . . . . . . . . . . . . . . . . . . . . . . . . . . . . . . 3
Grand Teton National Park . . . . . . . . . . . . . . . . . . . . . . . . . . . . . . . . . . . . . . . . . . . . . . . . . . . . . . . . . . . . . . 10
Yellowstone National Park . . . . . . . . . . . . . . . . . . . . . . . . . . . . . . . . . . . . . . . . . . . . . . . . . . . . . . . . . . . . . . 20
Figures for Bighorn Canyon National Recreation Area
BICA Figure 1 Bighorn Canyon NRA overview model. . . . . . . . . . . . . . . . . . . . . . . . . . . . . . . . . . . . . . . . . 5BICA Figure 2 General conceptual model. . . . . . . . . . . . . . . . . . . . . . . . . . . . . . . . . . . . . . . . . . . . . . . . . . 6BICA Figure 3 Upland vegetation system model. . . . . . . . . . . . . . . . . . . . . . . . . . . . . . . . . . . . . . . . . . . . 7BICA Figure 3a Upland vegetation time/space model. . . . . . . . . . . . . . . . . . . . . . . . . . . . . . . . . . . . . . . . . . 8BICA Figure 4 Water related resources model. . . . . . . . . . . . . . . . . . . . . . . . . . . . . . . . . . . . . . . . . . . . . . 9
Figures for Grand Teton National Park
GTNP Figure 1 Grand Teton system overview model. . . . . . . . . . . . . . . . . . . . . . . . . . . . . . . . . . . . . . . . . 11GTNP Figure 2 Complex system model. . . . . . . . . . . . . . . . . . . . . . . . . . . . . . . . . . . . . . . . . . . . . . . . . . . . 12GTNP Figure 3 Upland ungulate model. . . . . . . . . . . . . . . . . . . . . . . . . . . . . . . . . . . . . . . . . . . . . . . . . . . . 13GTNP Figure 4 Medium predators & herbivores sub-model. . . . . . . . . . . . . . . . . . . . . . . . . . . . . . . . . . . . 14GTNP Figure 5 Bird sub-model. . . . . . . . . . . . . . . . . . . . . . . . . . . . . . . . . . . . . . . . . . . . . . . . . . . . . . . . . . 15GTNP Figure 6 Water related model. . . . . . . . . . . . . . . . . . . . . . . . . . . . . . . . . . . . . . . . . . . . . . . . . . . . . . 16GTNP Figure 6a Water resource time/space model. . . . . . . . . . . . . . . . . . . . . . . . . . . . . . . . . . . . . . . . . . . 17GTNP Figure 7 Riverine model. . . . . . . . . . . . . . . . . . . . . . . . . . . . . . . . . . . . . . . . . . . . . . . . . . . . . . . . . . 18GTNP Figure 8 Wetlands model. . . . . . . . . . . . . . . . . . . . . . . . . . . . . . . . . . . . . . . . . . . . . . . . . . . . . . . . . 19
Figures for Yellowstone National Park
YNP Figure 1 Park overview model. . . . . . . . . . . . . . . . . . . . . . . . . . . . . . . . . . . . . . . . . . . . . . . . . . . . . . 21YNP Figure 2 Complex system model. . . . . . . . . . . . . . . . . . . . . . . . . . . . . . . . . . . . . . . . . . . . . . . . . . . . 22YNP Figure 3 Elk sub-model. . . . . . . . . . . . . . . . . . . . . . . . . . . . . . . . . . . . . . . . . . . . . . . . . . . . . . . . . . . 23YNP Figure 3 Aspen sub-model. . . . . . . . . . . . . . . . . . . . . . . . . . . . . . . . . . . . . . . . . . . . . . . . . . . . . . . . 24YNP Figure 4a Aspen communities time/space model . . . . . . . . . . . . . . . . . . . . . . . . . . . . . . . . . . . . . . 25YNP Figure 5 Riparian and wetland sub-model. . . . . . . . . . . . . . . . . . . . . . . . . . . . . . . . . . . . . . . . . . . . 26YNP Figure 6 Erosion/sediment transport sub-model. . . . . . . . . . . . . . . . . . . . . . . . . . . . . . . . . . . . . . . 27
Vital Signs Monitoring Plan • 3
I N T RO D U C T I O N Adaptive management within the national parks requires an un-
derstanding of the complexity of the natural and human systems
that interact in these areas. Adaptive management includes several
important processes that produce information and understanding
of the system enabling decision makers to proceed in an informed
fashion. Although adaptive management is basically a way of
“learning while doing”, it is necessary to describe the interactive
nature of the system being managed and monitored which leads to
further management steps.
Important procedures needed within an adaptive management
framework include (a) development of conceptual models of the
system as well as issues and processes within the system, (b) iden-
tification of important issues and uncertainties, (c) development of
research and programs to understand the uncertainties and to ad-
dress issues, and (d) development of long-term monitoring programs
that will assist assessment of management decisions and under-
standing of research outcomes.
The National Park Service has undertaken a program to identify
“vital signs” or indicators of important changing conditions within
the parks. Information from monitoring these indicators will be used
to develop management decisions within an adaptive management
framework. In a sense, vital signs or indicators are selected to be
“the canary in the mine”, forewarning managers of changes in im-
portant ecosystem parameters prior to these parameters, or related
processes, reaching some critical threshold stage.
The conceptual models developed in this part of the vital signs
program will be used to better understand the ecosystems of con-
cern and to help guide those who will be selecting appropriate vital
signs. These models have been developed based on the authors’
understanding of the literature and the systems, and in consultation
with scientists at the different parks. Consequently, this report does
not include a literature review on which the models are based.
Rather than develop a single conceptual model to represent all of
the important processes within the parks, we have chosen to develop
a nest of models including (a) a general and simple overview model of
the whole system, (b) a complex interactive system model for the whole
system, (c) a set of sub-models relating to particular components or is-
sues within each park, many potentially overlapping in stressors and/or
indicators, and (d) temporal/spatial models of stressors, processes and
outcomes to be used to help identify the importance of time and space
in selection of vital signs or indicators for monitoring the system.
The temporal/spatial (time/space) models have been developed
for only a few ecosystem sub-models. Three time/space models
are presented in this report representing different aspects of the
ecosystems. One is associated with the Bighorn Canyon uplands,
one with the Grand Teton National Park water-related system, and
one with the Yellowstone National Park aspen communities. The
shaded area within the time/space models (100 years and 100-500
km2) represents a temporal and spatial monitoring scope to be used
to identify parameters that may likely be useful for monitoring. The
line for each parameter is at the greatest time period in which that
parameter functions; however, this means that the parameter may
also be functioning in time frames much shorter than where the line
falls and possibly as short as a year or less. The discussion about
the time/space models is limited to a few comments on how the
models might be used to select indicators.
In the ecosystem sub-models, drivers are represented in rectangles,
stressors in ovals, processes in diamonds, outcomes in hexagons and
indicators (possible vital signs) in parallelograms. The process poly-
gon (diamond) may represent a set of interactions or a small internal
sub-models. These internal process sub-models are not presented in
this report, but rather, the statement “dynamics” within many dia-
mond polygons often implies more than a simple process.
This project has developed conceptual models for Bighorn Can-
yon National Recreation Area, Grand Teton National Park, and Yel-
lowstone National Park. The latter two parks are adjacent and thus
share many similar attributes and issues, while Bighorn Canyon is
in an arid region and quite separate from the other parks. Although
the conceptual model development process was similar, the models
are quite different with the exception of the general systems model
for Yellowstone and Grand Teton. In some cases, models address-
ing similar issues between parks are quite different because the
importance of drivers or stressors of the ecosystem or attribute of
concern are different.
B I G H O R N C A N Y O N N AT I O N A L R E C R E AT I O N A R E ABighorn Canyon National Recreation Area (BICA) was established
in response to recreational potentials related to Bighorn Canyon
reservoir. Uplands associated with the reservoir were also included.
These arid uplands encompassed part of a wild horse range, and
supported a population of bighorn sheep. Conceptual model devel-
opment for BICA had to consider both the water related components

4 • Appendix III: Conceptual Models
of the system as well as the uplands.
An important aspect of understanding the BICA systems is an
understanding of the external influences on the park. Unlike Yellow-
stone National Park and Grand Teton National Park, BICA is greatly
influenced by activities in the surrounding and upstream water-
sheds, especially those factors that influence quality and quantity
of inputs to the reservoir.
The simple overview model of BICA (BICA Figure 1) shows the
linkages among the major attributes of the system. Internally within
BICA geology and climate drive biological and hydrological aspects.
Various biotic components respond to these attributes, for example,
herbivore response to vegetation and aquatic biota response to
streams and reservoirs. Of significance, as pointed out above, are
the external influences on streams and the reservoir.
Bighorn Canyon NRA General Conceptual Model The general conceptual model of the whole BICA system (BICA Fig-
ure 2) expands on the simple model showing details of the factors
that control the system and the interactions among the internal and
external attributes. External inputs relate directly to hydrological
controls upstream of BICA and use of the external watersheds, for
example, grazing and agriculture. The internal interactions show up-
land processes tied to vegetation and influencing factors, and reser-
voir processes and inputs. Although this model shows a complexity
of interactions, the sub-models that follow show greater detail.
BIGHORN CANYON NRA SUB-MODELSTwo sub-models were developed for BICA. One presents the upland
system, and the other the water-related system.
UPLAND VEGETATION SUB-MODELThe upland system model (BICA Figure 3) shows the factors that
drive vegetation and how the vegetation change. The indicators or
potential vital signs of vegetation change include parameters of the
different vegetation community types (e.g., grasses/forbs, shrubs/
cacti, forest). Invasion of exotic plants and the increase of juniper
stands in the upland may be of concern. Also, animals associated
with the vegetation types may also be possible indicators of unac-
ceptable change in the upland of BICA. This sub-model presents
possible metrics that might be measure for each indicator.
Upland Vegetation Time/Space Model The time/space model for upland vegetation in Bighorn Canyon
NRA (BICA Figure 3a) has three stressors, two within the monitor-
ing scope time limits but extending beyond the spatial limits while
the third (topographic aspect) relates to geological time and space.
Except for climatic changes, the stressors relate directly to the pres-
ence of wild horses, a stressor that should probably continue to be
monitored. Most of the outcomes also are with a monitoring time
frame that would make indicators associated with these outcomes
logical ones to consider. Change in herbaceous vegetation is short-
term and may lead to a logical single indicator.
WATER-RELATED SUB-MODEL The water-related sub-model for BICA (BICA Figure 4) shows both wa-
ter-related issues relative to streams and the reservoir, and riparian
and spring related parameters. Similar stressors influence these dif-
ferent groups which include human activities in the upland and on the
reservoir as well as upland land uses and changes. Changing climate
and altered hydrology from within and outside the park also play a
role in influencing the water-related attributes of BICA. Consequently,
the model shows that possible indicators of water-related issues in-
clude parameters tied to streams, reservoir, springs, riparian areas
and recreation. Selecting among these many potential water-related
parameters will require a close evaluation of their interactions.
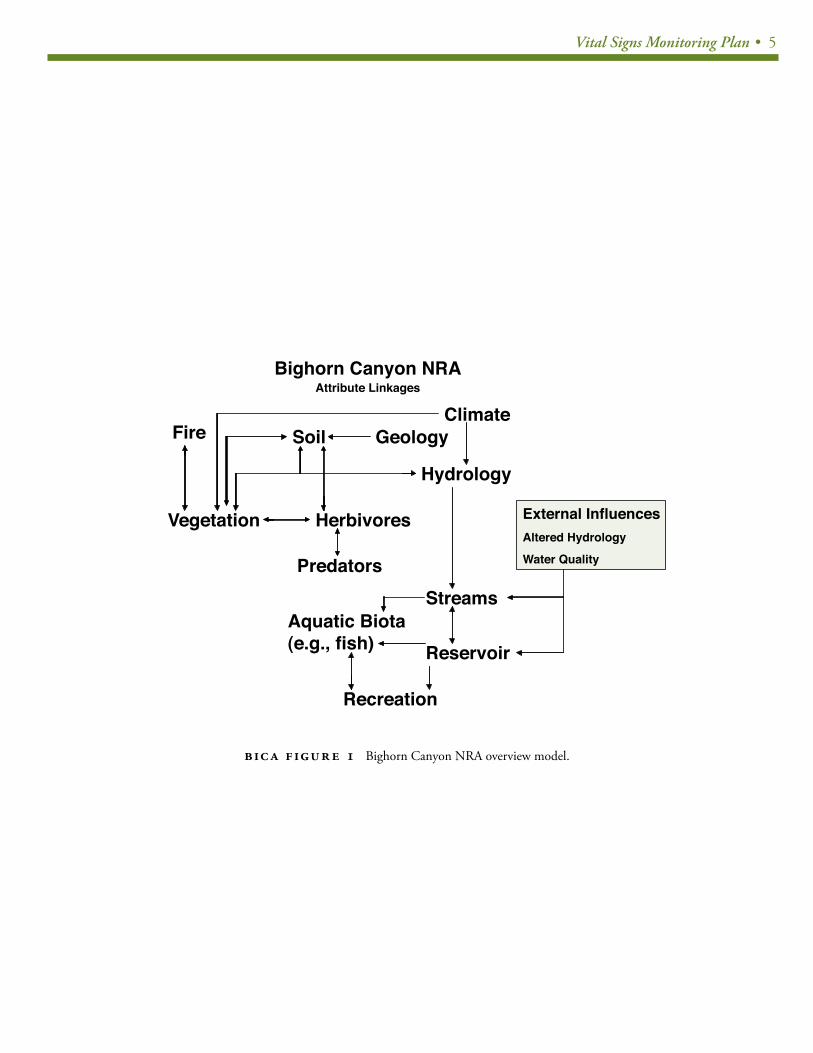
Vital Signs Monitoring Plan • 5
ClimateGeology
Herbivores
Predators
Vegetation
Hydrology
Bighorn Canyon NRA
Streams
SoilFire
Aquatic Biota (e.g., fish)
External InfluencesAltered Hydrology
Water Quality
Reservoir
Recreation
Attribute Linkages
BIC A F IGUR E 1 Bighorn Canyon NRA overview model.
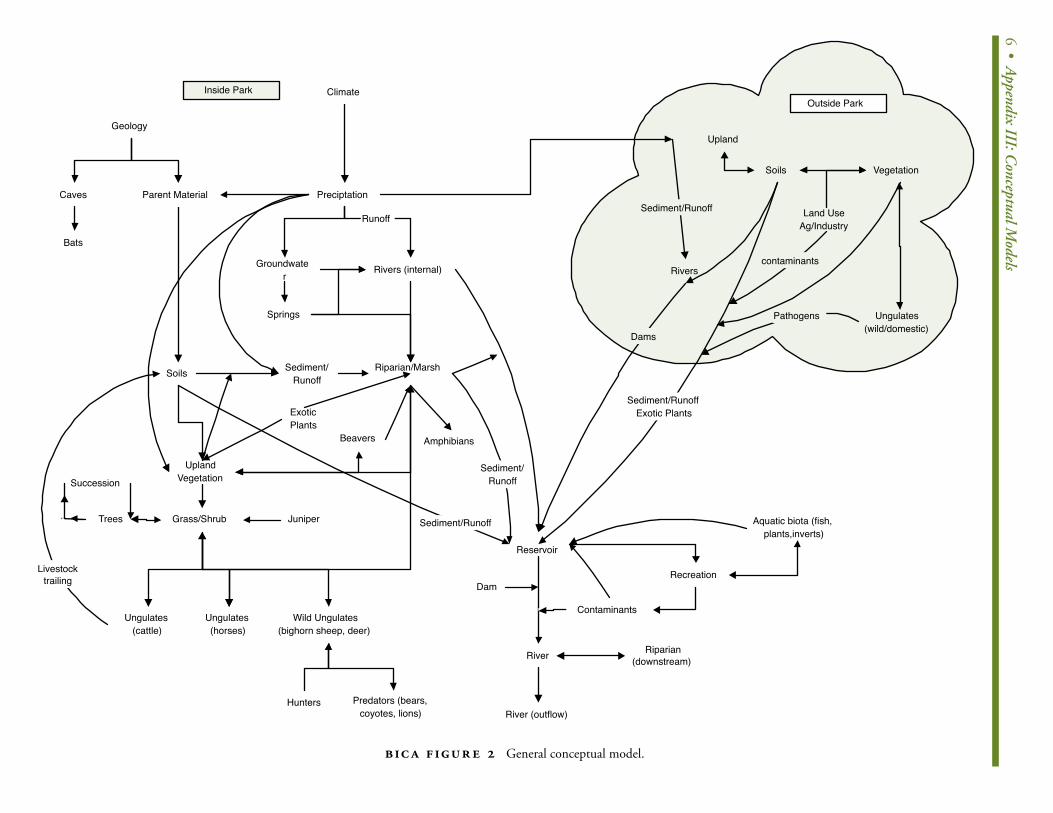
6 • Appendix III: Conceptual M
odels
Inside Park
Geology
Caves
Bats
Parent Material
Soils
UplandVegetation
Grass/Shrub
Ungulates(cattle)
Preciptation
ExoticPlants
Wild Ungulates(bighorn sheep, deer)
Hunters Predators (bears,coyotes, lions)
Runoff
Rivers (internal)
Riparian/MarshSediment/Runoff
Beavers
Reservoir
River
River (outflow)
Riparian(downstream)
Contaminants
Aquatic biota (fish,plants,inverts)
Amphibians
DamRecreation
Rivers
Dams
Soils
Upland
Sediment/Runoff Land UseAg/Industry
Vegetation
Sediment/RunoffExotic Plants
Ungulates(wild/domestic)
Pathogens
Outside Park
Ungulates(horses)
Groundwater
Springs
Sediment/Runoff
Climate
Sediment/Runoff
Livestocktrailing
Trees
Succession
contaminants
Juniper
BIC A F IGUR E 2 General conceptual model.
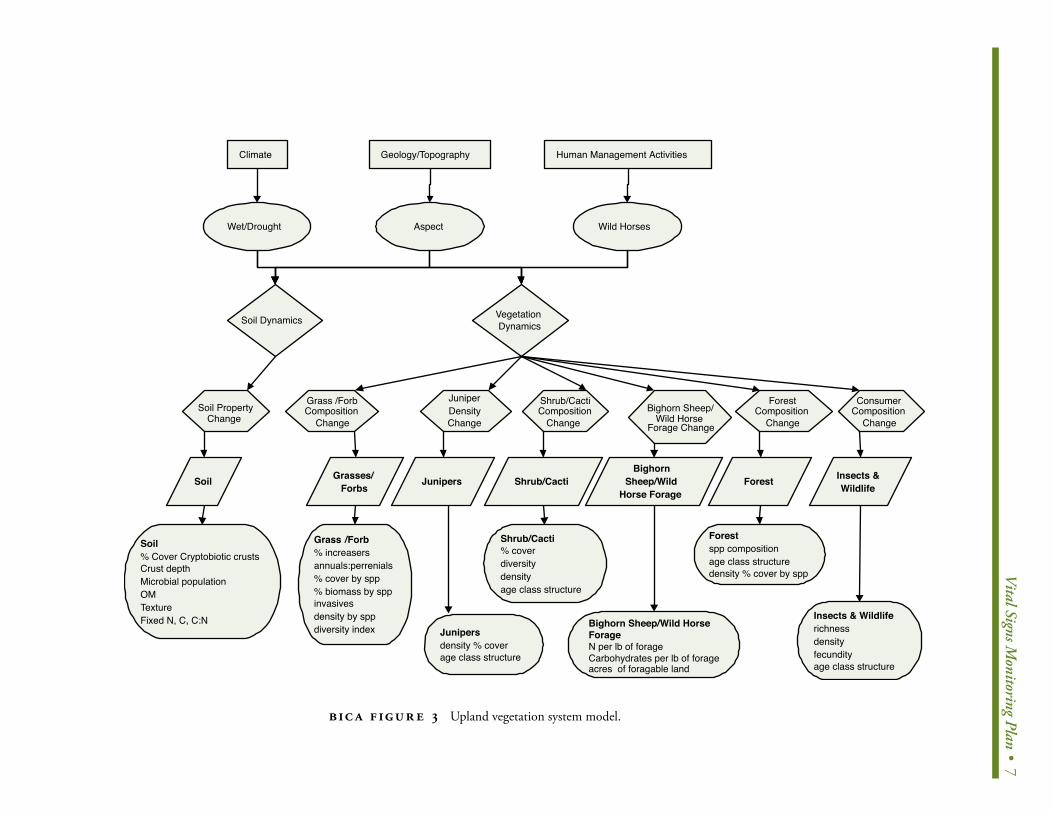
V
ital Signs Monitoring Plan • 7
Forestspp compositionage class structuredensity % cover by spp
JunipersGrasses/Forbs
Bighorn CanyonUpland Vegetation
Geology/Topography Human Management ActivitiesClimate
Wet/Drought Wild HorsesAspect
Grass /ForbComposition
Change
JuniperDensityChange
Shrub/CactiComposition
ChangeSoil Property
Change
ForestComposition
Change
VegetationDynamicsSoil Dynamics
Shrub/CactiSoil Forest
Grass /Forb% increasersannuals:perrenials% cover by spp% biomass by sppinvasivesdensity by sppdiversity index Junipers
density % coverage class structure
Shrub/Cacti% coverdiversitydensityage class structure
Soil% Cover Cryptobiotic crustsCrust depthMicrobial populationOMTextureFixed N, C, C:N
Bighorn Sheep/Wild Horse
Forage Change
BighornSheep/Wild
Horse Forage
Bighorn Sheep/Wild HorseForageN per lb of forageCarbohydrates per lb of forageacres of foragable land
ConsumerComposition
Change
Insects &Wildlife
Insects & Wildliferichnessdensityfecundityage class structure
BIC A F IGUR E 3 Upland vegetation system model.
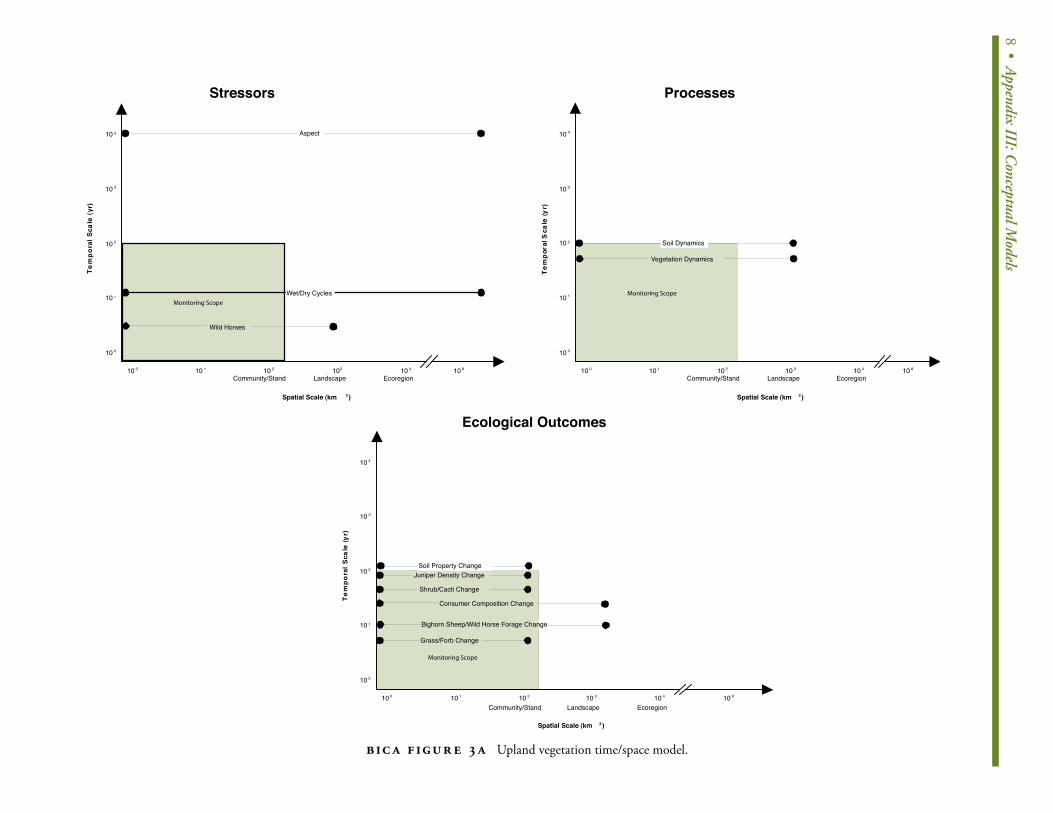
8 • Appendix III: Conceptual M
odelsBighorn Canyon Upland Vegetation Time/Space Model
����������������
Stressors
Wet/Dry Cycles
10 0 10 1 10 2 103 10 4 10 8
Community/Stand Landscape Ecoregion
Spatial Scale (km 2 )
10 4
10 3
10 2
10 1
10 0
Tem
pora
l Sca
le (y
r)
Aspect
Wild Horses
����������������
10 0 10 1 10 2 10 3 10 4 10 8
Community/Stand Landscape Ecoregion
Spatial Scale (km 2 )
10 4
10 3
10 2
10 1
10 0
Tem
pora
l Sca
le (y
r)
Processes
Vegetation Dynamics
Soil Dynamics
����������������
10 0 10 1 10 2 10 3 10 4 10 8
Community/Stand Landscape Ecoregion
Spatial Scale (km 2 )
10 4
10 3
10 2
10 1
10 0
Tem
pora
l Sca
le (y
r)
Ecological Outcomes
Soil Property Change
Bighorn Sheep/Wild Horse Forage Change
Grass/Forb Change
Shrub/Cacti Change
Juniper Density Change
Consumer Composition Change
BIC A F IGUR E 3A Upland vegetation time/space model.
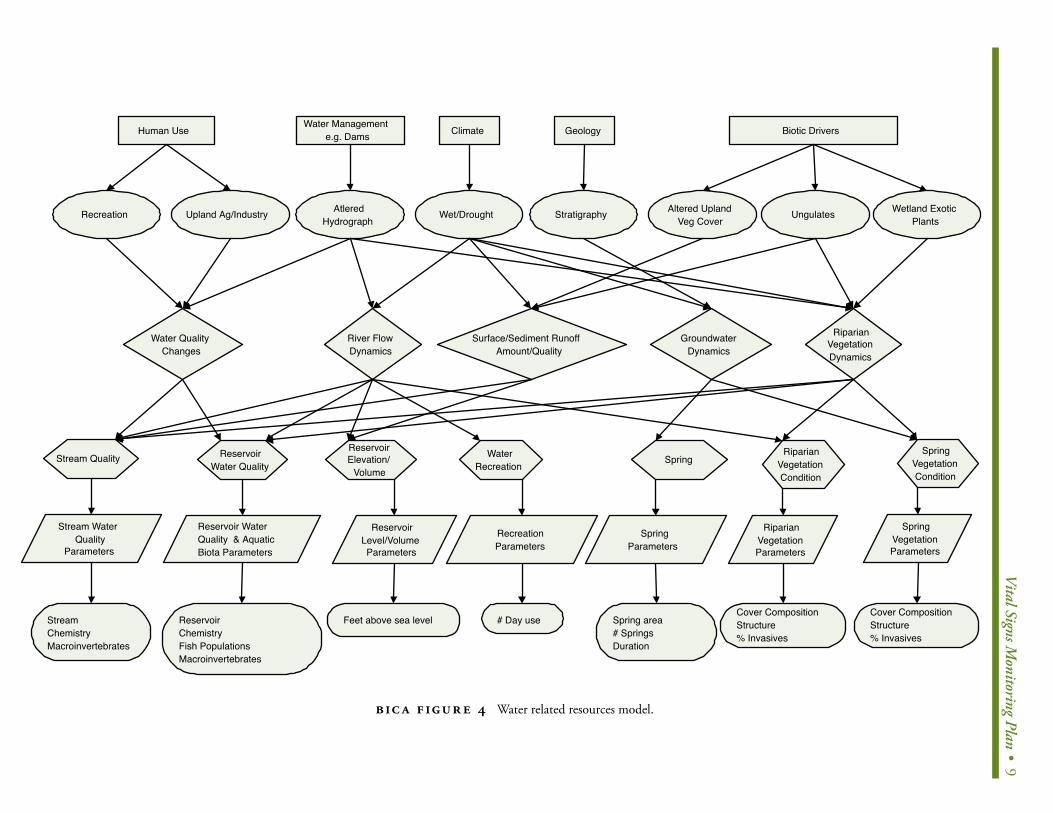
V
ital Signs Monitoring Plan • 9
Bighorn CanyonWater Related Resources
Human Use Climate
Wet/DroughtUpland Ag/Industry
RiparianVegetationCondition
RiparianVegetationDynamics
River FlowDynamics
Water QualityChanges
RiparianVegetationParameters
Cover CompositionStructure% Invasives
Biotic Drivers
UngulatesAltered UplandVeg Cover
Recreation AtleredHydrograph
WaterRecreation
Feet above sea level
Stream WaterQuality
Parameters
StreamChemistryMacroinvertebrates
Reservoir WaterQuality & AquaticBiota Parameters
ReservoirChemistryFish PopulationsMacroinvertebrates
RecreationParameters
ReservoirElevation/
Volume
ReservoirLevel/VolumeParameters
# Day use
Stream Quality ReservoirWater Quality
Water Managemente.g. Dams
Wetland ExoticPlants
Surface/Sediment RunoffAmount/Quality
GroundwaterDynamics
Spring
SpringParameters
Spring area# SpringsDuration
Geology
Stratigraphy
SpringVegetationCondition
SpringVegetationParameters
Cover CompositionStructure% Invasives
BIC A F IGUR E 4 Water related resources model.
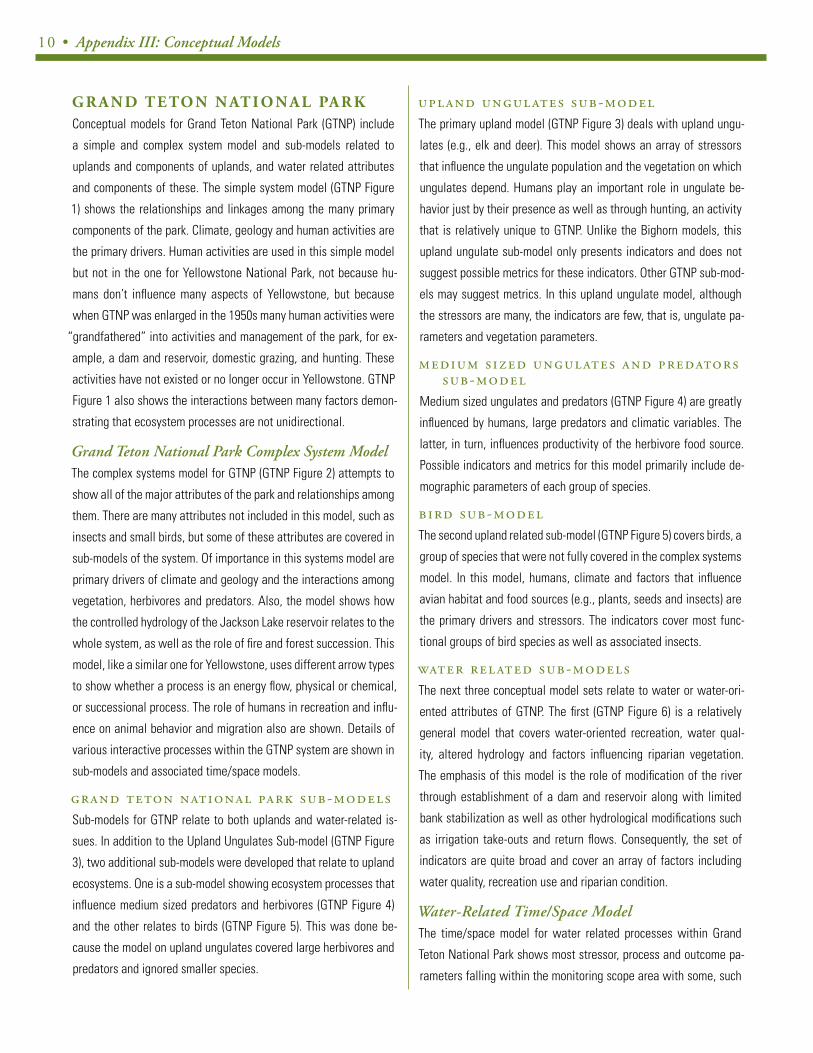
10 • Appendix III: Conceptual Models
G R A N D T E TO N N AT I O N A L PA R KConceptual models for Grand Teton National Park (GTNP) include
a simple and complex system model and sub-models related to
uplands and components of uplands, and water related attributes
and components of these. The simple system model (GTNP Figure
1) shows the relationships and linkages among the many primary
components of the park. Climate, geology and human activities are
the primary drivers. Human activities are used in this simple model
but not in the one for Yellowstone National Park, not because hu-
mans don’t influence many aspects of Yellowstone, but because
when GTNP was enlarged in the 1950s many human activities were
“grandfathered” into activities and management of the park, for ex-
ample, a dam and reservoir, domestic grazing, and hunting. These
activities have not existed or no longer occur in Yellowstone. GTNP
Figure 1 also shows the interactions between many factors demon-
strating that ecosystem processes are not unidirectional.
Grand Teton National Park Complex System ModelThe complex systems model for GTNP (GTNP Figure 2) attempts to
show all of the major attributes of the park and relationships among
them. There are many attributes not included in this model, such as
insects and small birds, but some of these attributes are covered in
sub-models of the system. Of importance in this systems model are
primary drivers of climate and geology and the interactions among
vegetation, herbivores and predators. Also, the model shows how
the controlled hydrology of the Jackson Lake reservoir relates to the
whole system, as well as the role of fire and forest succession. This
model, like a similar one for Yellowstone, uses different arrow types
to show whether a process is an energy flow, physical or chemical,
or successional process. The role of humans in recreation and influ-
ence on animal behavior and migration also are shown. Details of
various interactive processes within the GTNP system are shown in
sub-models and associated time/space models.
GRAND TETON NATIONAL PARK SUB-MODELSSub-models for GTNP relate to both uplands and water-related is-
sues. In addition to the Upland Ungulates Sub-model (GTNP Figure
3), two additional sub-models were developed that relate to upland
ecosystems. One is a sub-model showing ecosystem processes that
influence medium sized predators and herbivores (GTNP Figure 4)
and the other relates to birds (GTNP Figure 5). This was done be-
cause the model on upland ungulates covered large herbivores and
predators and ignored smaller species.
UPLAND UNGULATES SUB-MODELThe primary upland model (GTNP Figure 3) deals with upland ungu-
lates (e.g., elk and deer). This model shows an array of stressors
that influence the ungulate population and the vegetation on which
ungulates depend. Humans play an important role in ungulate be-
havior just by their presence as well as through hunting, an activity
that is relatively unique to GTNP. Unlike the Bighorn models, this
upland ungulate sub-model only presents indicators and does not
suggest possible metrics for these indicators. Other GTNP sub-mod-
els may suggest metrics. In this upland ungulate model, although
the stressors are many, the indicators are few, that is, ungulate pa-
rameters and vegetation parameters.
MEDIUM SIZED UNGULATES AND PREDATORS SUB-MODEL
Medium sized ungulates and predators (GTNP Figure 4) are greatly
influenced by humans, large predators and climatic variables. The
latter, in turn, influences productivity of the herbivore food source.
Possible indicators and metrics for this model primarily include de-
mographic parameters of each group of species.
BIRD SUB-MODELThe second upland related sub-model (GTNP Figure 5) covers birds, a
group of species that were not fully covered in the complex systems
model. In this model, humans, climate and factors that influence
avian habitat and food sources (e.g., plants, seeds and insects) are
the primary drivers and stressors. The indicators cover most func-
tional groups of bird species as well as associated insects.
WATER RELATED SUB-MODELSThe next three conceptual model sets relate to water or water-ori-
ented attributes of GTNP. The first (GTNP Figure 6) is a relatively
general model that covers water-oriented recreation, water qual-
ity, altered hydrology and factors influencing riparian vegetation.
The emphasis of this model is the role of modification of the river
through establishment of a dam and reservoir along with limited
bank stabilization as well as other hydrological modifications such
as irrigation take-outs and return flows. Consequently, the set of
indicators are quite broad and cover an array of factors including
water quality, recreation use and riparian condition.
Water-Related Time/Space ModelThe time/space model for water related processes within Grand
Teton National Park shows most stressor, process and outcome pa-
rameters falling within the monitoring scope area with some, such

Vital Signs Monitoring Plan • 11
as climatic factors, falling outside the area spatially. This does not
mean these should not be considered for measurement, but rather
their importance relates to the whole park but still may be impor-
tant parameters to consider for measuring or monitoring. Several
outcome parameters are short-term and relate to hydrological condi-
tions, conditions that may have logical indicators for long-term moni-
toring, but that which require regular short-term measurements.
RIVERINE SUB-MODELThe second water-related model (GTNP Figure 7) relates to the river-
ine system of GTNP and emphasizes hydrological, fluvial and riparian
processes. There are some similar drivers, stressors and indicators
as the prior model (GTNP Figure 6), but the indicators of this model
relate to the river and not the reservoir. Many of the processes lead
to riparian vegetation and thus one might assume that riparian veg-
etation in these water-related models may be an important indicator.
Other indicators such as exotic plants and river geomorphology may
also rise to the surface as important, across-the-board indicators.
WETLANDS SUB-MODELWetlands are often considered sites of high biodiversity. Conse-
quently, the third of the water-related conceptual models deals with
wetlands within GTNP (GTNP Figure 8). Many factors influence pro-
cesses that create or maintain wetlands such as climate, humans,
predators on beavers, and wetland plant herbivores. These all, in
some way, eventually influence the condition of the several different
wetland types in GTNP (i.e., potholes, willow communities, beaver
dam wetlands, and herbaceous wetlands). Indicators of wetlands
are not exclusively habitat oriented, such as vegetation parameters,
but also include important species that use the habitat. For this rea-
son, important indicators of wetlands may include amphibians and
birds that may exclusively depend on these habitats.
ClimateGeology
Herbivores
Predators
Vegetation
Hydrology
Teton National Park
Streams and Lakes
SoilFire
Aquatic Biota (fish)
Human Mgt/Activities
GT NP F IGUR E 1 Grand Teton system overview model.
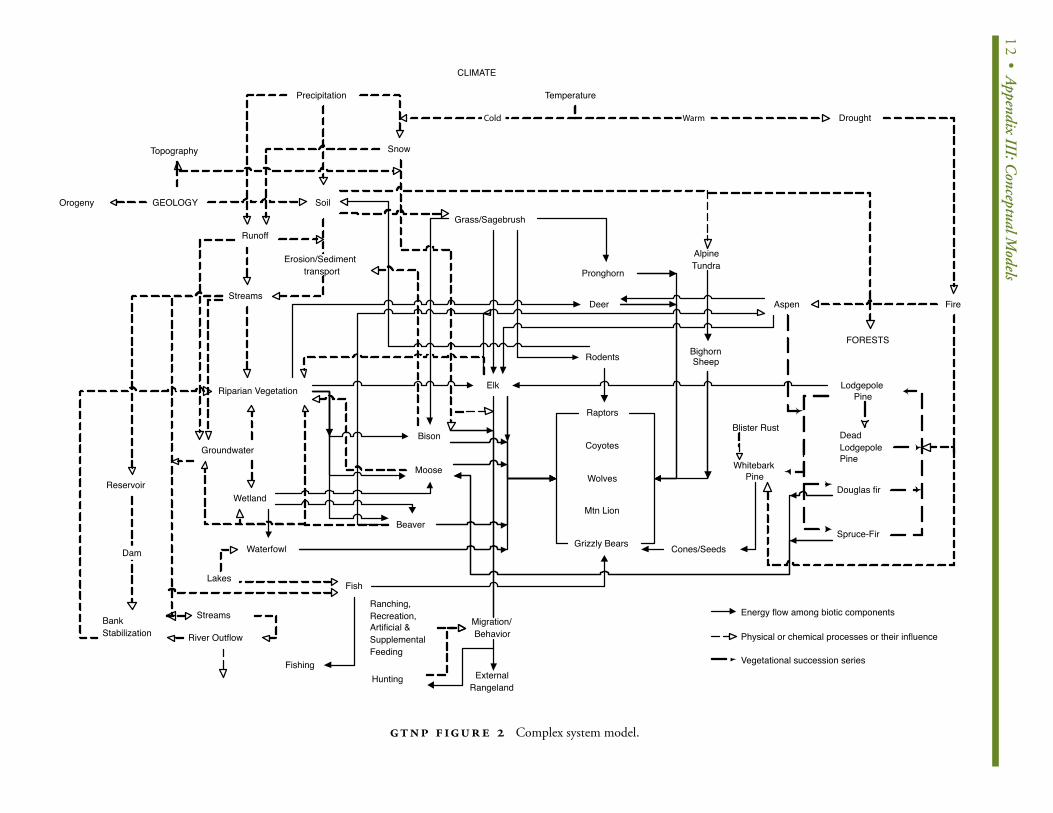
12• Appendix III: C
onceptual Models
CLIMATE
Precipitation Temperature
Snow
GEOLOGY
Topography
Streams
Soil
Erosion/Sedimenttransport
Riparian Vegetation
Groundwater
Wetland
RunoffGrass/Sagebrush
Elk
Bison
Moose
Beaver
Waterfowl
Lakes
Reservoir
BighornSheep
Pronghorn
Deer
Rodents
Coyotes
Wolves
Mtn Lion
Grizzly Bears
Raptors
AlpineTundra
FORESTS
Aspen
LodgepolePine
WhitebarkPine
DeadLodgepolePine
Douglas fir
Spruce-Fir
Fire
Fish
FishingHunting External
Rangeland
���� Drought����
Migration/Behavior
Cones/Seeds
Blister Rust
Energy flow among biotic components
Physical or chemical processes or their influence
Vegetational succession series
Ranching,Recreation,Artificial &SupplementalFeeding
Orogeny
BankStabilization
GRAND TETON NATIONAL PARK
Streams
River Outflow
Dam
GT NP F IGUR E 2 Complex system model.
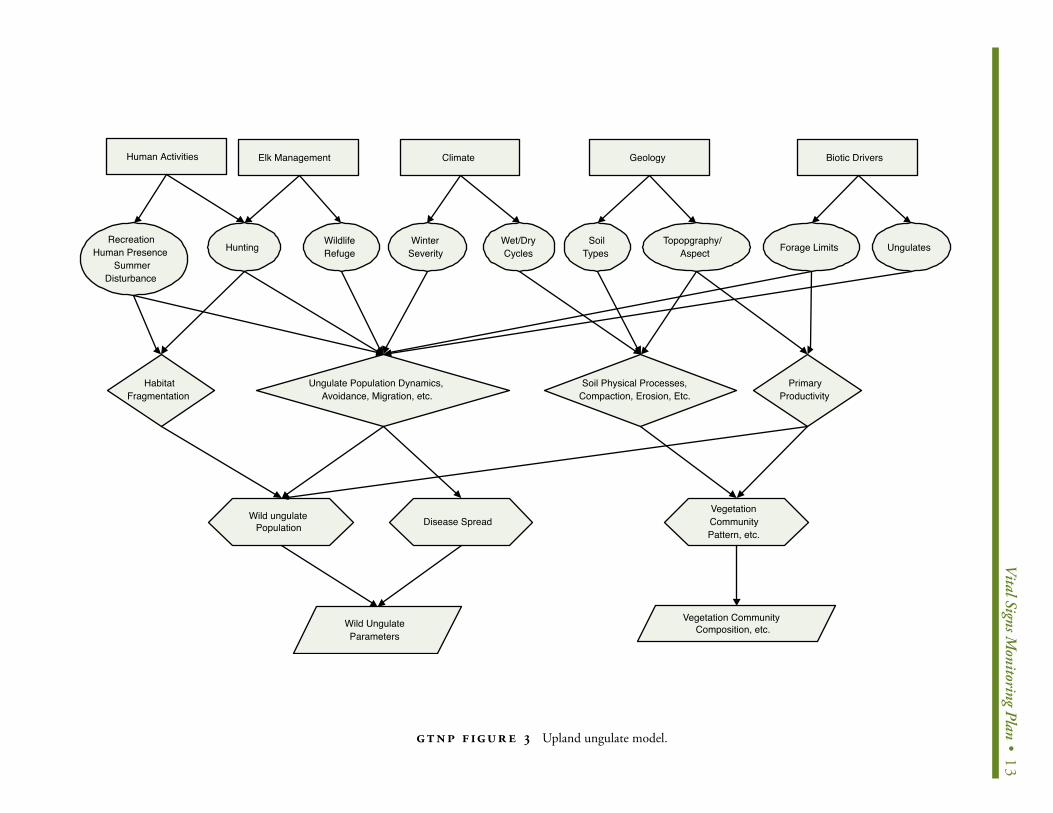
V
ital Signs Monitoring Plan • 13
Teton National ParkUpland Ungulates
RecreationHuman Presence
SummerDisturbance
HabitatFragmentation
Wild ungulatePopulation
Human Activities
Wild UngulateParameters
Elk Management Climate Geology Biotic Drivers
HuntingWildlifeRefuge
Wet/DryCycles
WinterSeverity
SoilTypes
Topopgraphy/Aspect UngulatesForage Limits
Ungulate Population Dynamics,Avoidance, Migration, etc.
Soil Physical Processes,Compaction, Erosion, Etc.
PrimaryProductivity
Disease SpreadVegetationCommunityPattern, etc.
Vegetation CommunityComposition, etc.
GT NP F IGUR E 3 Upland ungulate model.
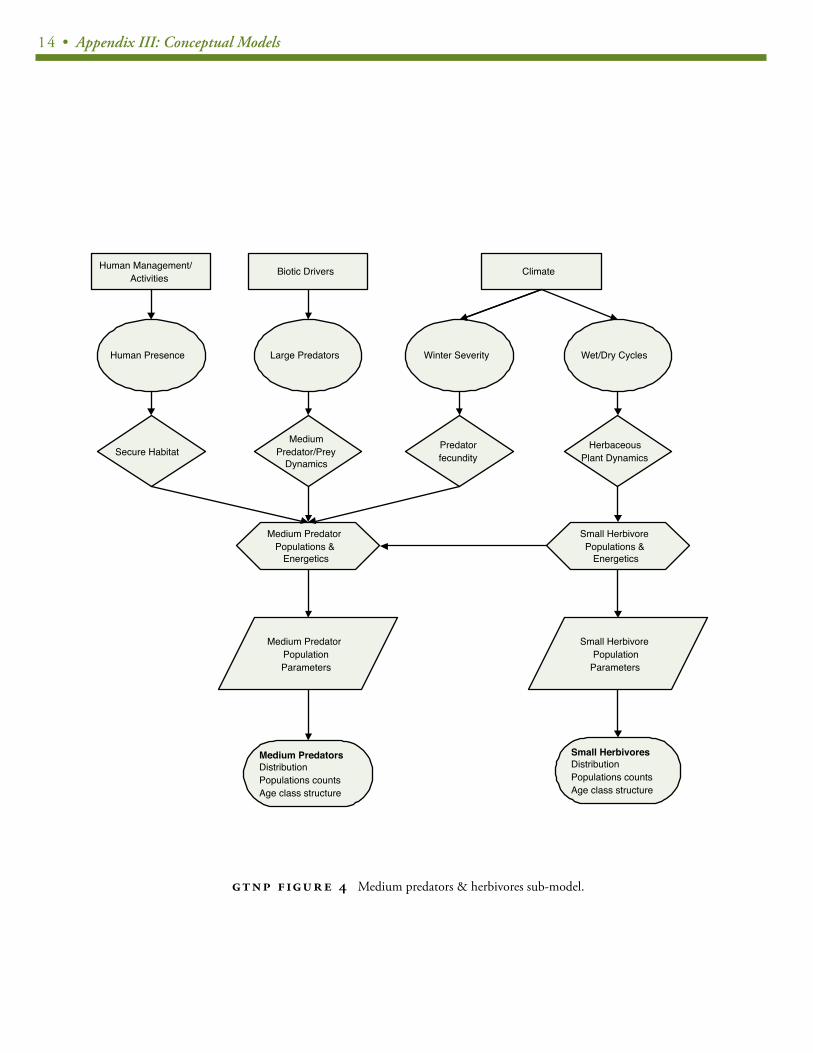
14 • Appendix III: Conceptual Models
Teton National ParkMedium Predators & Herbivores
Human Management/Activities
ClimateBiotic Drivers
Human Presence Winter Severity Wet/Dry CyclesLarge Predators
Secure HabitatHerbaceous
Plant DynamicsPredatorfecundity
MediumPredator/Prey
Dynamics
Medium PredatorPopulations &
Energetics
Small HerbivorePopulations &
Energetics
Medium PredatorPopulationParameters
Small HerbivorePopulation
Parameters
Medium PredatorsDistributionPopulations countsAge class structure
Small HerbivoresDistributionPopulations countsAge class structure
GT NP F IGUR E 4 Medium predators & herbivores sub-model.
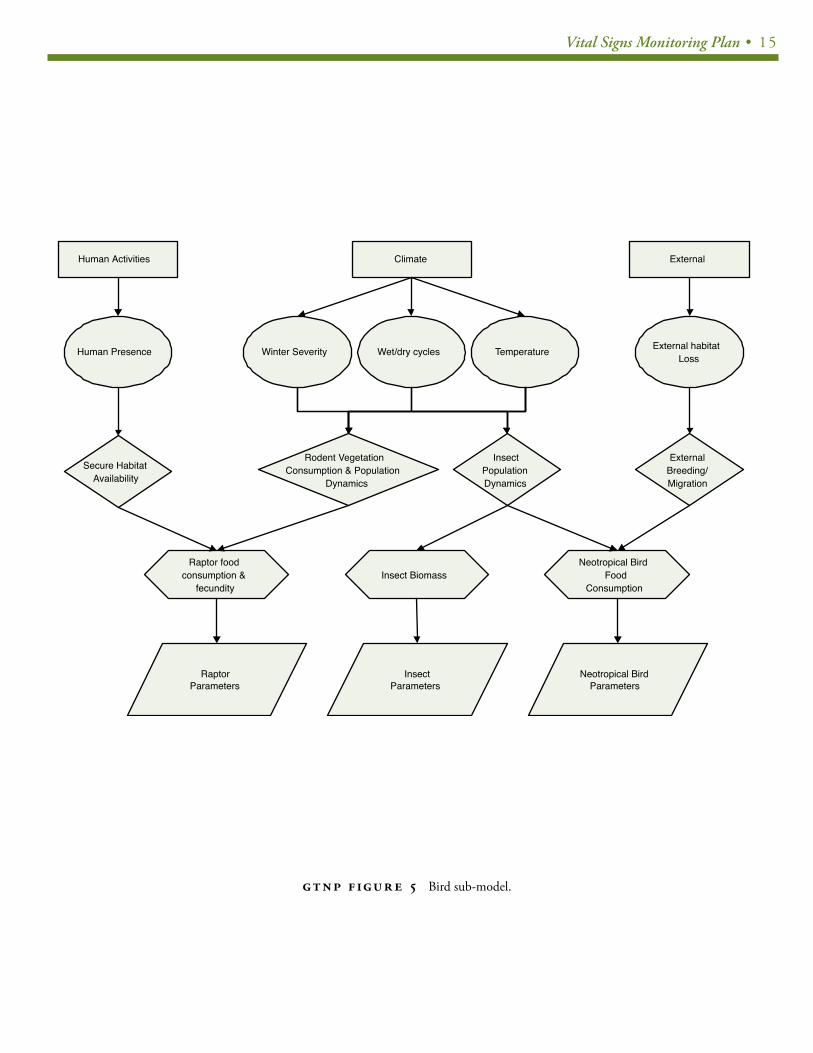
Vital Signs Monitoring Plan • 15
Teton National ParkBirds
Human Presence
Secure HabitatAvailability
Raptor foodconsumption &
fecundity
Human Activities
RaptorParameters
Climate External
Winter Severity Wet/dry cycles Temperature External habitatLoss
Rodent VegetationConsumption & Population
Dynamics
InsectPopulationDynamics
ExternalBreeding/Migration
Insect BiomassNeotropical Bird
FoodConsumption
InsectParameters
Neotropical BirdParameters
GT NP F IGUR E 5 Bird sub-model.

16• Appendix III: C
onceptual Models
Teton National ParkWater Related
Recreation
Water QualityDynamics
StreamQuality
Human Activities
StreamChemistry
Macroinverts
Water Management/Dams Climate Parent Material
IrrigationStructures
BankStabilization
AlteredHydrograph Wet/Dry Cycles
Altered SoilChemistry/
Texture
Altered RiverDynamics Surface Runoff Groundwater Riparian Veg
DynamicsSedimentTransport
ReservoirQuality
ReservoirElevation/
Volume
WaterRecreation
RiparianVegetation
Elevation Use #'sRiparian Vegetationstructure, cover, etc.
ReservoirChemistry
Macroinverts
GT NP F IGUR E 6 Water related model.
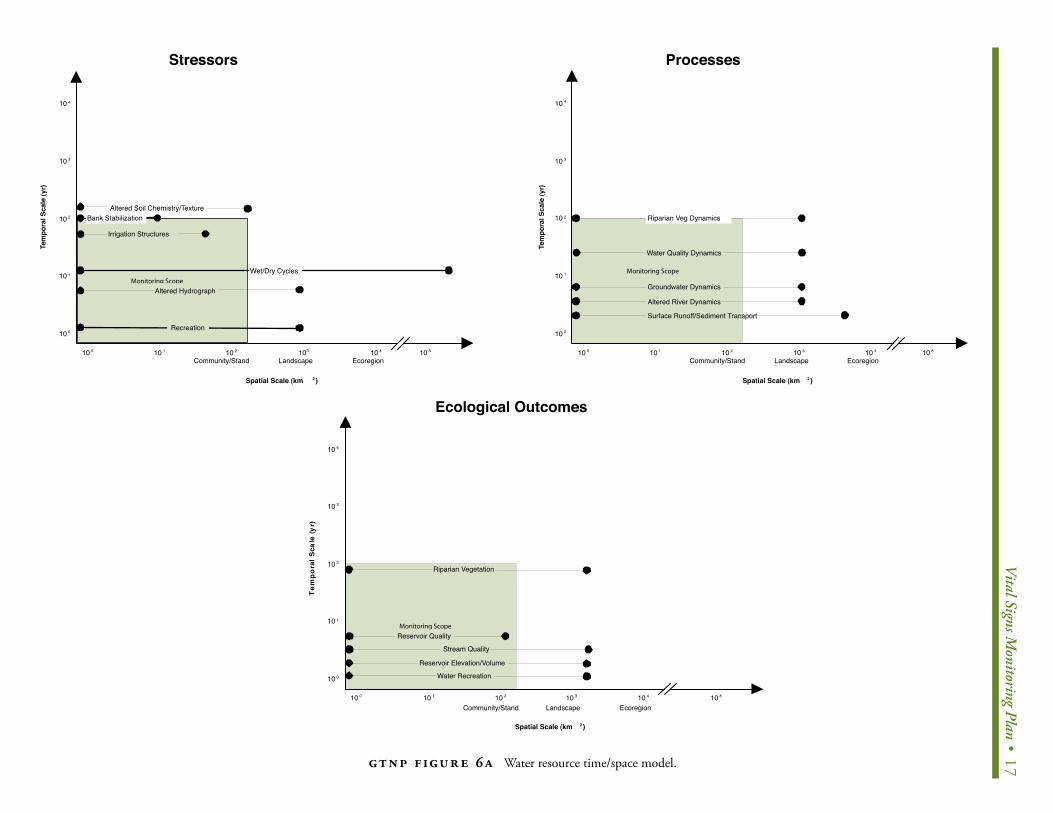
V
ital Signs Monitoring Plan • 17
Teton National ParkWater Related Resources
Time/Space Model
����������������
Stressors
Wet/Dry Cycles
Bank Stabilization
Recreation
10 0 10 1 10 2 103 10 4 10 8
Community/Stand Landscape Ecoregion
Spatial Scale (km 2 )
10 4
10 3
10 2
10 1
10 0
Irrigation Structures
Altered Hydrograph
Altered Soil Chemistry/Texture
����������������
10 0 10 1 10 2 10 3 10 4 10 8
Community/Stand Landscape Ecoregion
Spatial Scale (km 2 )
10 4
10 3
10 2
10 1
10 0
Tem
pora
l Sca
le (y
r)
Tem
pora
l Sca
le (y
r)
Processes
Water Quality Dynamics
Altered River Dynamics
Surface Runoff/Sediment Transport
Groundwater Dynamics
Riparian Veg Dynamics
����������������
10 0 10 1 10 2 10 3 10 4 10 8
Community/Stand Landscape Ecoregion
Spatial Scale (km 2 )
10 4
10 3
10 2
10 1
10 0
Tem
pora
l Sca
le (y
r)
Ecological Outcomes
Reservoir Quality
Stream Quality
Reservoir Elevation/Volume
Water Recreation
Riparian Vegetation
GT NP F IGUR E 6A Water resource time/space model.

18• Appendix III: C
onceptual Models
Teton National ParkRiverine
Human Activities
Recreation
Physical ImpactsStreambank & River
Use
Riverine Wildlife
Wildlife SpeciesAttributes
Elk ManagementWater/River
Management Climate Biotic Drivers
Refuge AlteredHydrograph
BankStabilization We/Dry Cycles Ungulates Exotic Plants
UngulatePopulation
LevelsRiver Dynamics
RiparianVegetationDynamics
Ungulateforaging River Transport
ChannelGeomorphology
Stream FlowsRecreation RiparianVegetation
RiverGeomorphologic
Conditions
HydrologicalParameters
RiverineRecreational
Uses
Riparian VegetationStructure
Cover
AquaticBiota
GroundwaterDynamics
GroundwaterLevels
GT NP F IGUR E 7 Riverine model.
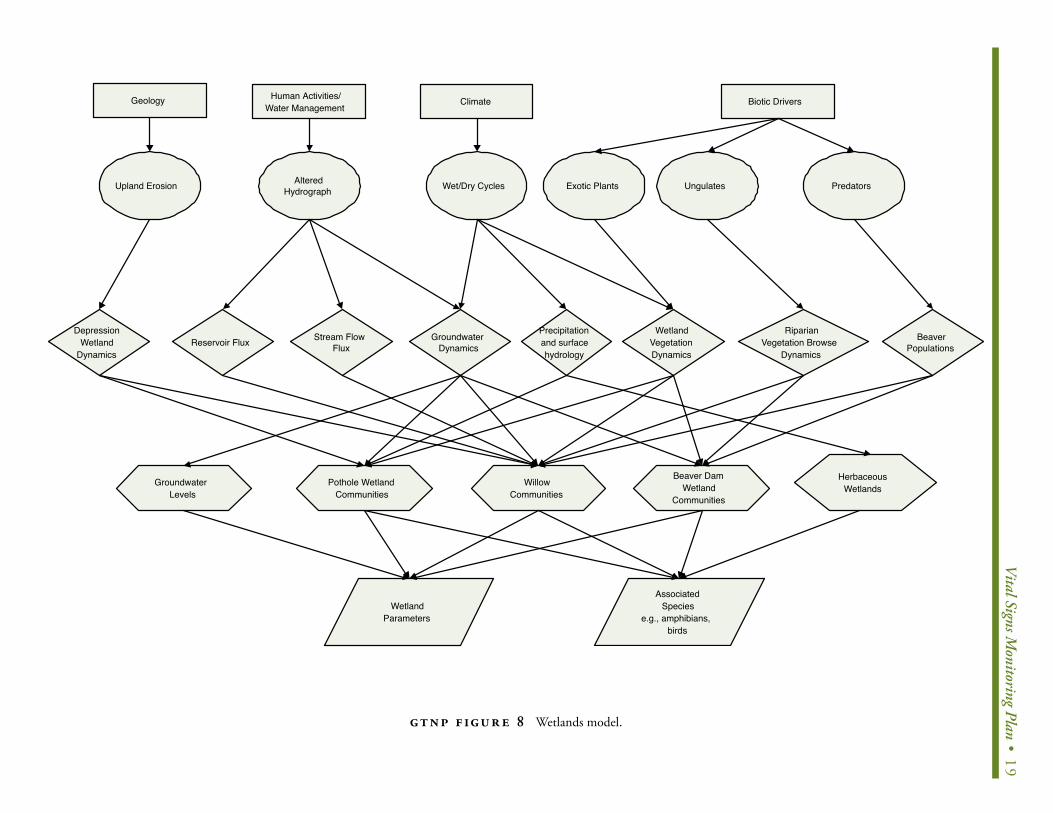
V
ital Signs Monitoring Plan • 19
Teton National ParkWetlands
Upland Erosion
DepressionWetland
Dynamics
Pothole WetlandCommunities
WetlandParameters
Human Activities/Water Management
Climate Biotic DriversGeology
AlteredHydrograph Wet/Dry Cycles Ungulates Predators
Reservoir Flux Stream FlowFlux
GroundwaterDynamics
RiparianVegetation Browse
Dynamics
BeaverPopulations
WillowCommunities
Beaver DamWetland
Communities
Exotic Plants
WetlandVegetationDynamics
GroundwaterLevels
HerbaceousWetlands
AssociatedSpecies
e.g., amphibians,birds
Precipitationand surfacehydrology
GT NP F IGUR E 8 Wetlands model.
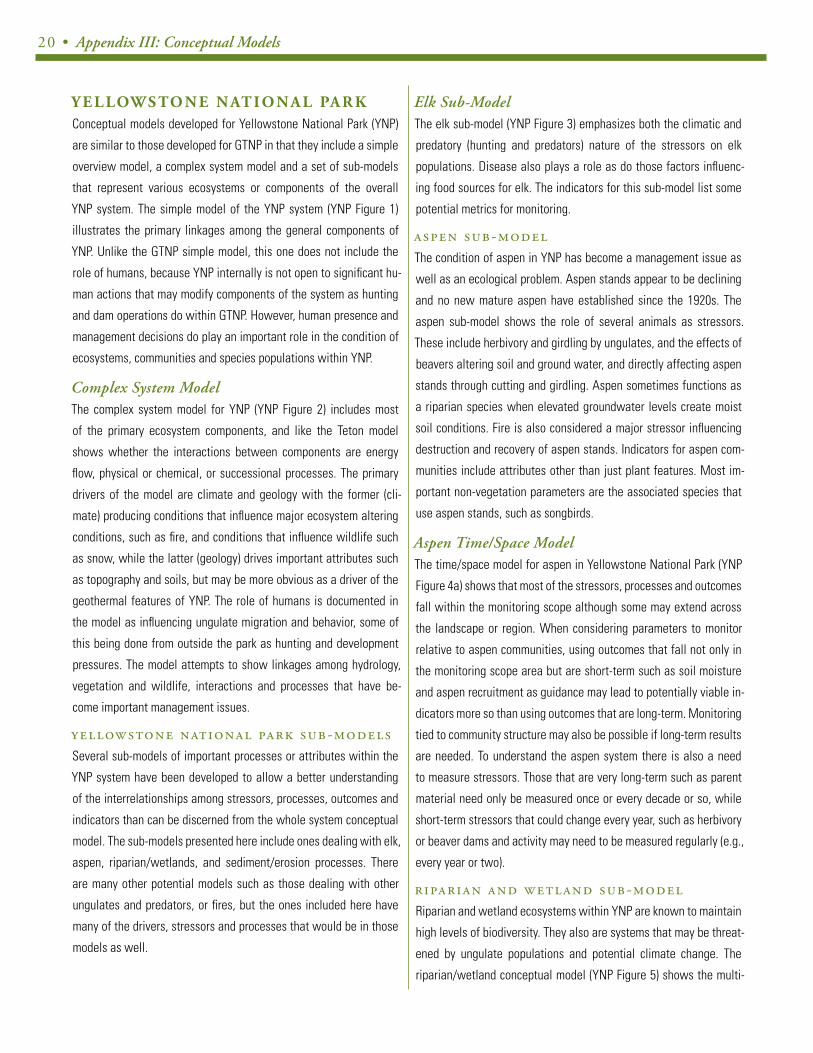
20 • Appendix III: Conceptual Models
Y E L LOW S TO N E N AT I O N A L PA R KConceptual models developed for Yellowstone National Park (YNP)
are similar to those developed for GTNP in that they include a simple
overview model, a complex system model and a set of sub-models
that represent various ecosystems or components of the overall
YNP system. The simple model of the YNP system (YNP Figure 1)
illustrates the primary linkages among the general components of
YNP. Unlike the GTNP simple model, this one does not include the
role of humans, because YNP internally is not open to significant hu-
man actions that may modify components of the system as hunting
and dam operations do within GTNP. However, human presence and
management decisions do play an important role in the condition of
ecosystems, communities and species populations within YNP.
Complex System ModelThe complex system model for YNP (YNP Figure 2) includes most
of the primary ecosystem components, and like the Teton model
shows whether the interactions between components are energy
flow, physical or chemical, or successional processes. The primary
drivers of the model are climate and geology with the former (cli-
mate) producing conditions that influence major ecosystem altering
conditions, such as fire, and conditions that influence wildlife such
as snow, while the latter (geology) drives important attributes such
as topography and soils, but may be more obvious as a driver of the
geothermal features of YNP. The role of humans is documented in
the model as influencing ungulate migration and behavior, some of
this being done from outside the park as hunting and development
pressures. The model attempts to show linkages among hydrology,
vegetation and wildlife, interactions and processes that have be-
come important management issues.
YELLOWSTONE NATIONAL PARK SUB-MODELSSeveral sub-models of important processes or attributes within the
YNP system have been developed to allow a better understanding
of the interrelationships among stressors, processes, outcomes and
indicators than can be discerned from the whole system conceptual
model. The sub-models presented here include ones dealing with elk,
aspen, riparian/wetlands, and sediment/erosion processes. There
are many other potential models such as those dealing with other
ungulates and predators, or fires, but the ones included here have
many of the drivers, stressors and processes that would be in those
models as well.
Elk Sub-ModelThe elk sub-model (YNP Figure 3) emphasizes both the climatic and
predatory (hunting and predators) nature of the stressors on elk
populations. Disease also plays a role as do those factors influenc-
ing food sources for elk. The indicators for this sub-model list some
potential metrics for monitoring.
ASPEN SUB-MODELThe condition of aspen in YNP has become a management issue as
well as an ecological problem. Aspen stands appear to be declining
and no new mature aspen have established since the 1920s. The
aspen sub-model shows the role of several animals as stressors.
These include herbivory and girdling by ungulates, and the effects of
beavers altering soil and ground water, and directly affecting aspen
stands through cutting and girdling. Aspen sometimes functions as
a riparian species when elevated groundwater levels create moist
soil conditions. Fire is also considered a major stressor influencing
destruction and recovery of aspen stands. Indicators for aspen com-
munities include attributes other than just plant features. Most im-
portant non-vegetation parameters are the associated species that
use aspen stands, such as songbirds.
Aspen Time/Space ModelThe time/space model for aspen in Yellowstone National Park (YNP
Figure 4a) shows that most of the stressors, processes and outcomes
fall within the monitoring scope although some may extend across
the landscape or region. When considering parameters to monitor
relative to aspen communities, using outcomes that fall not only in
the monitoring scope area but are short-term such as soil moisture
and aspen recruitment as guidance may lead to potentially viable in-
dicators more so than using outcomes that are long-term. Monitoring
tied to community structure may also be possible if long-term results
are needed. To understand the aspen system there is also a need
to measure stressors. Those that are very long-term such as parent
material need only be measured once or every decade or so, while
short-term stressors that could change every year, such as herbivory
or beaver dams and activity may need to be measured regularly (e.g.,
every year or two).
RIPARIAN AND WETLAND SUB-MODELRiparian and wetland ecosystems within YNP are known to maintain
high levels of biodiversity. They also are systems that may be threat-
ened by ungulate populations and potential climate change. The
riparian/wetland conceptual model (YNP Figure 5) shows the multi-

Vital Signs Monitoring Plan • 21
tude of drivers and stressors that influence these systems. The many
processes that result from these stressors demonstrate the complex
interactive nature of systems that interface between aquatic and
terrestrial environments. Indicators of the condition of riparian/wet-
land ecosystems should include, not only vegetation conditions, but
those species that use these ecosystems as habitat. In several cases,
these associated species, for example amphibians, have been found
to be very sensitive to environmental change.
EROSION AND SEDIMENT TRANSPORT SUB-MODELThe final sub-model for the YNP ecosystem illustrates the complex
processes of erosion and sediment transport (YNP Figure 6). The
important drivers and stressors in this model include more physi-
cal processes than biological processes. The role of some biologi-
cal components of the ecosystem, such as physical alteration of
soil surfaces and vegetation structure by large herbivores, also may
greatly influence the physical processes. Sediment loss from the
land is a natural process but can be accelerated by many ecosystem
components that are acting outside their historic range of variability.
Consequently, the influence of sediment transport and deposition not
only affects streams and depression areas but species that may de-
pend on these systems. For this reason, the model includes spawn-
ing habitat in rivers. It doesn’t include other animals that may be
associated with wetland depressions because these are included in
the riparian/wetland model. This is just one example of the overlap
among the sub-models.
Yellowstone National ParkMajor Element Linkages
Climate
Geology
Hydrology
Soil
VegetationHerbivores
Predators
Aquatic Biota(fish)
Streams &Lakes
Geothermal
Fire
Y NP F IGUR E 1 Park overview model.
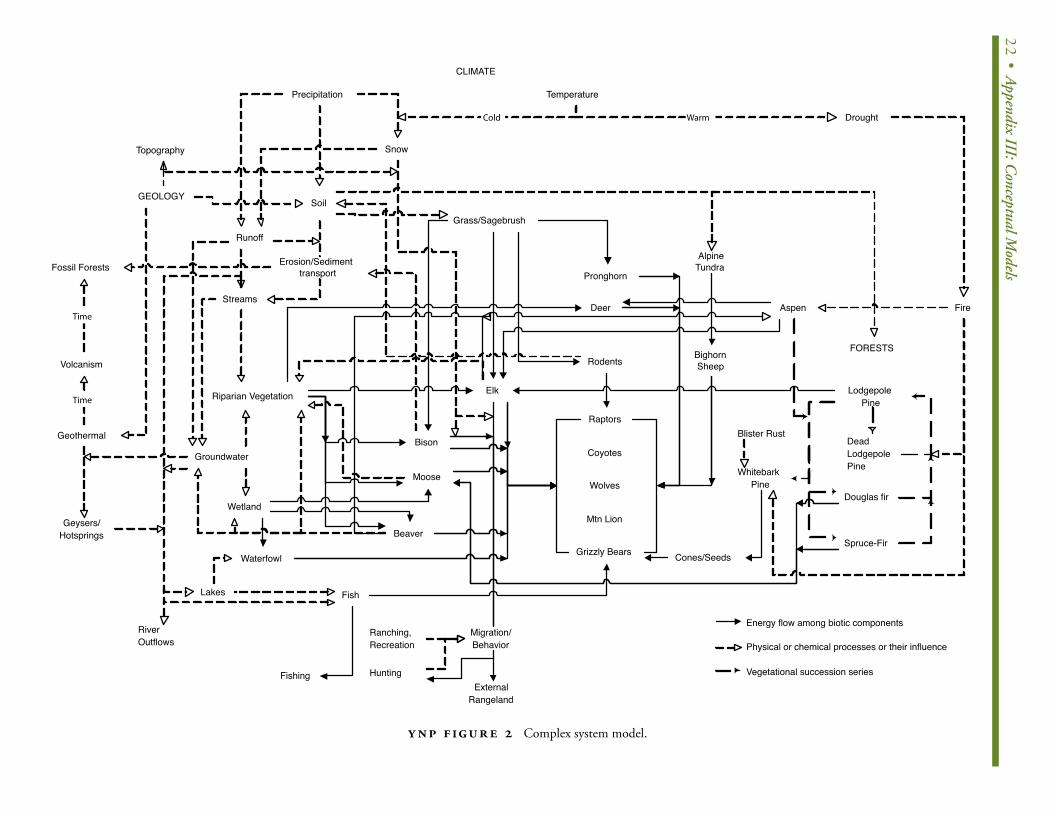
22• Appendix III: C
onceptual Models
YELLOWSTONE NATIONAL PARK
CLIMATE
Precipitation Temperature
Snow
GEOLOGY
Fossil Forests
Volcanism
Geothermal
Geysers/Hotsprings
����
����
Topography
Streams
Soil
Erosion/Sedimenttransport
Riparian Vegetation
Groundwater
Wetland
Runoff
Grass/Sagebrush
Elk
Bison
Moose
Beaver
Waterfowl
Lakes
RiverOutflows
BighornSheep
Pronghorn
Deer
Rodents
Coyotes
Wolves
Mtn Lion
Grizzly Bears
Raptors
AlpineTundra
FORESTS
Aspen
LodgepolePine
WhitebarkPine
DeadLodgepolePine
Douglas fir
Spruce-Fir
Fire
Fish
Fishing HuntingExternal
Rangeland
���� Drought����
Migration/Behavior
Cones/Seeds
Blister Rust
Energy flow among biotic components
Physical or chemical processes or their influence
Vegetational succession series
Ranching,Recreation
Y NP F IGUR E 2 Complex system model.
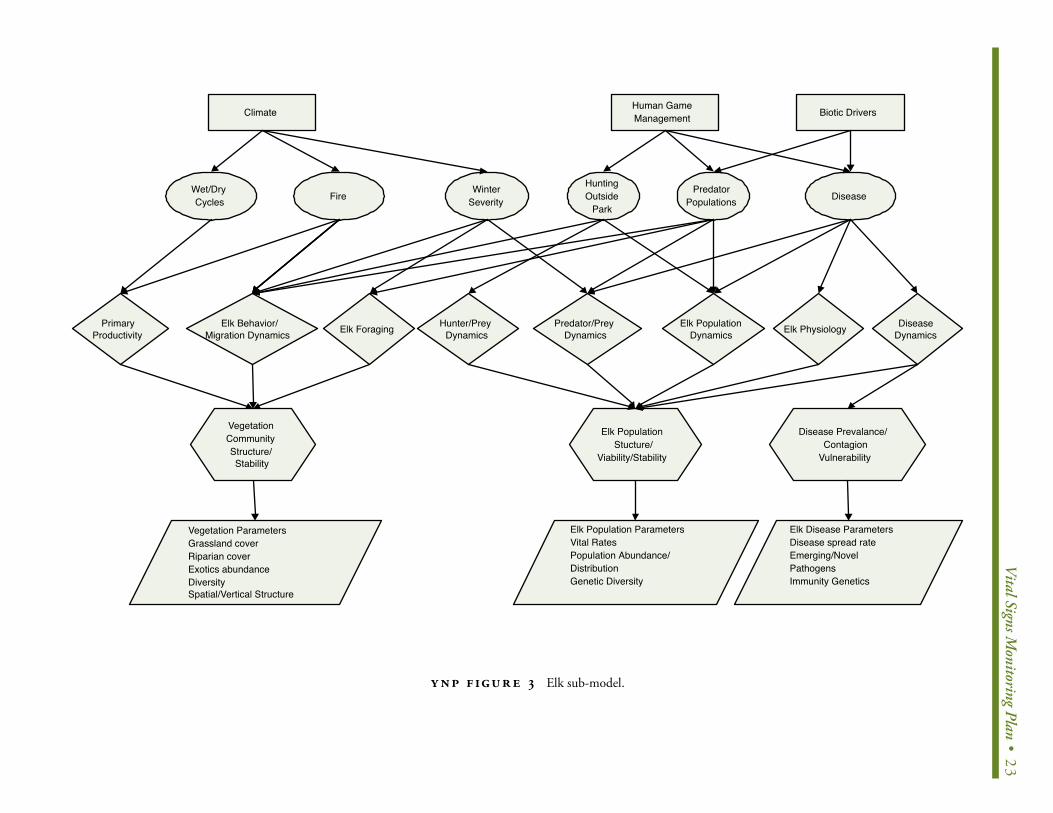
V
ital Signs Monitoring Plan • 23
Yellowstone National ParkElk
ClimateHuman GameManagement
WinterSeverity
HuntingOutside
Park
PredatorPopulations Disease
PrimaryProductivity
VegetationCommunityStructure/Stability
Vegetation ParametersGrassland coverRiparian coverExotics abundanceDiversitySpatial/Vertical Structure
Wet/DryCycles Fire
Biotic Drivers
Elk Behavior/Migration Dynamics Elk Foraging Hunter/Prey
DynamicsPredator/Prey
DynamicsElk Population
Dynamics Elk Physiology
Elk PopulationStucture/
Viability/Stability
Disease Prevalance/Contagion
Vulnerability
Elk Population ParametersVital RatesPopulation Abundance/DistributionGenetic Diversity
Elk Disease ParametersDisease spread rateEmerging/NovelPathogensImmunity Genetics
DiseaseDynamics
Y NP F IGUR E 3 Elk sub-model.
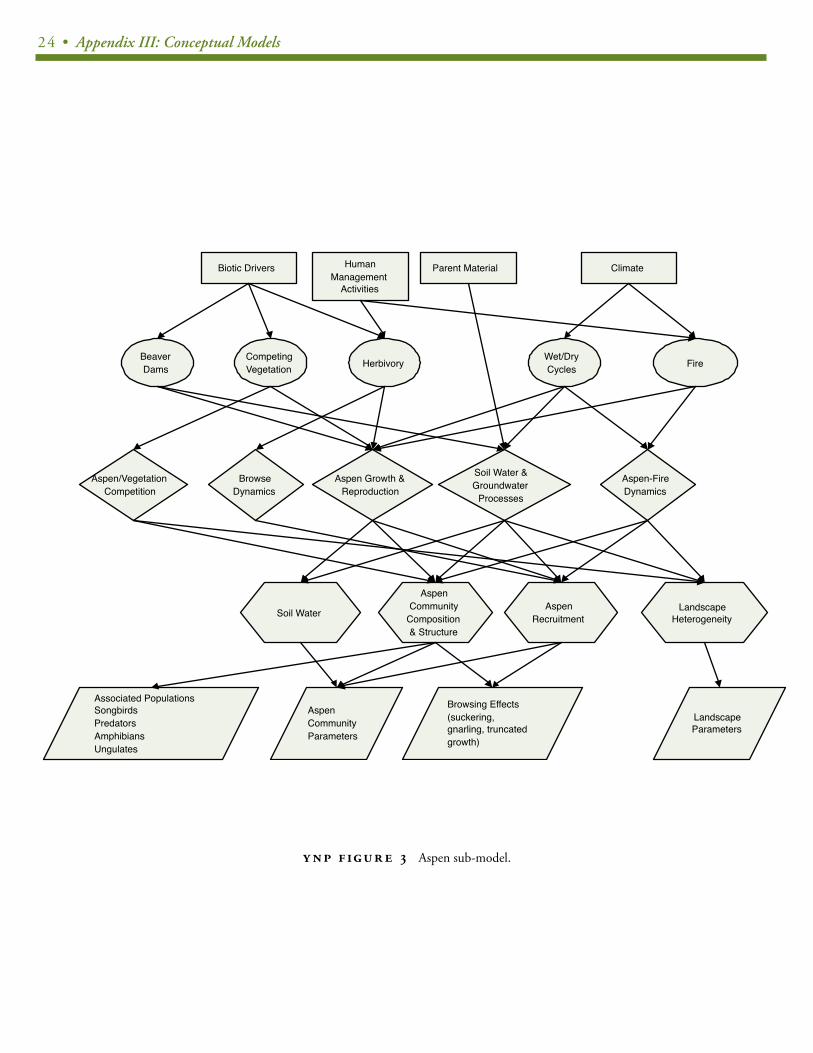
24 • Appendix III: Conceptual Models
Yellowstone National ParkAspen Communities
Herbivory
ClimateBiotic Drivers
Fire
Aspen Growth &Reproduction
Aspen-FireDynamics
Wet/DryCycles
Soil Water
Soil Water &Groundwater
Processes
HumanManagement
Activities
AspenCommunity
Composition& Structure
Parent Material
LandscapeHeterogeneity
AspenRecruitment
BeaverDams
CompetingVegetation
Aspen/VegetationCompetition
BrowseDynamics
AspenCommunityParameters
Associated PopulationsSongbirdsPredatorsAmphibiansUngulates
LandscapeParameters
Browsing Effects(suckering,gnarling, truncatedgrowth)
Y NP F IGUR E 3 Aspen sub-model.
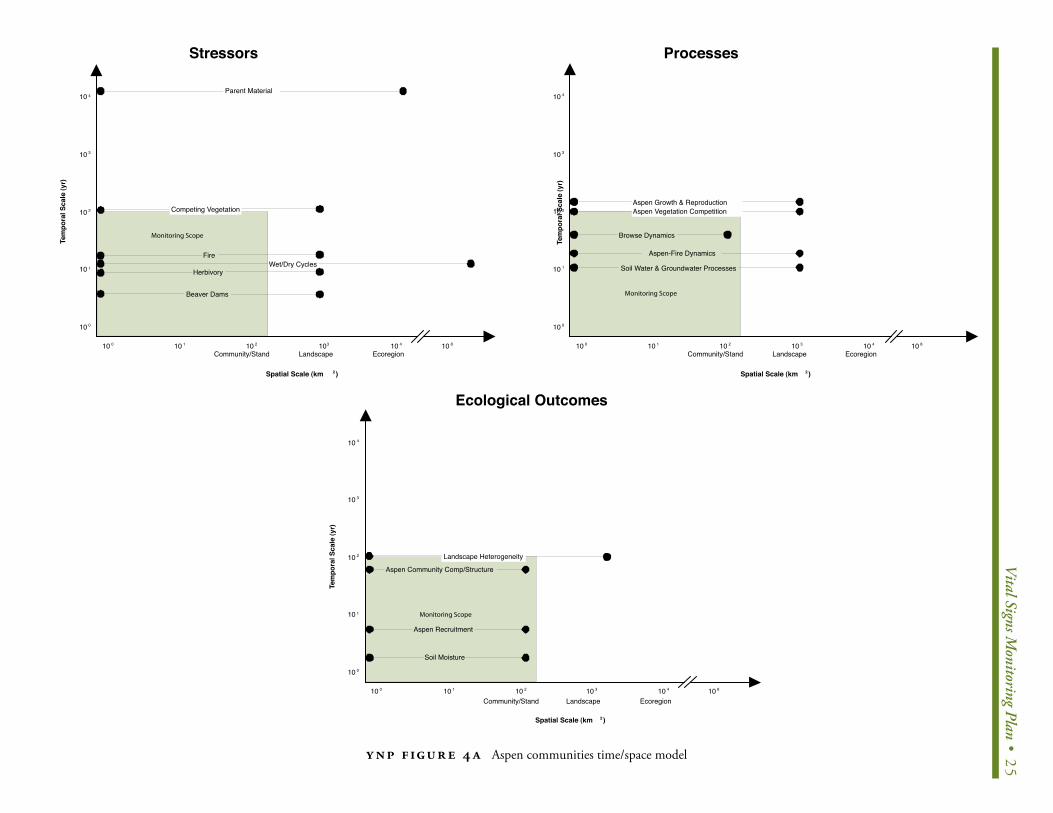
V
ital Signs Monitoring Plan • 25
Yellowstone National ParkAspen CommunitiesTime/Space Model
����������������
10 0 10 1 10 2 10 3 10 4 10 8
Community/Stand Landscape Ecoregion
Spatial Scale (km 2 )
10 4
10 3
10 2
10 1
10 0
Tem
pora
l Sca
le (y
r)
Processes
Aspen Vegetation Competition
Browse Dynamics
Aspen Growth & Reproduction
Soil Water & Groundwater Processes
Aspen-Fire Dynamics
����������������
10 0 10 1 10 2 10 3 10 4 10 8
Community/Stand Landscape Ecoregion
Spatial Scale (km 2 )
10 4
10 3
10 2
10 1
10 0
Tem
pora
l Sca
le (y
r)
Ecological Outcomes
Aspen Community Comp/Structure
Landscape Heterogeneity
Aspen Recruitment
Soil Moisture
����������������
Stressors
Wet/Dry Cycles
Beaver Dams
10 4
10 3
10 2
10 1
10 0
Tem
pora
l Sca
le (y
r)
Competing Vegetation
Herbivory
Parent Material
Fire
10 0 10 1 10 2 103 10 4 10 8
Community/Stand Landscape Ecoregion
Spatial Scale (km 2 )
Y NP F IGUR E 4 A Aspen communities time/space model
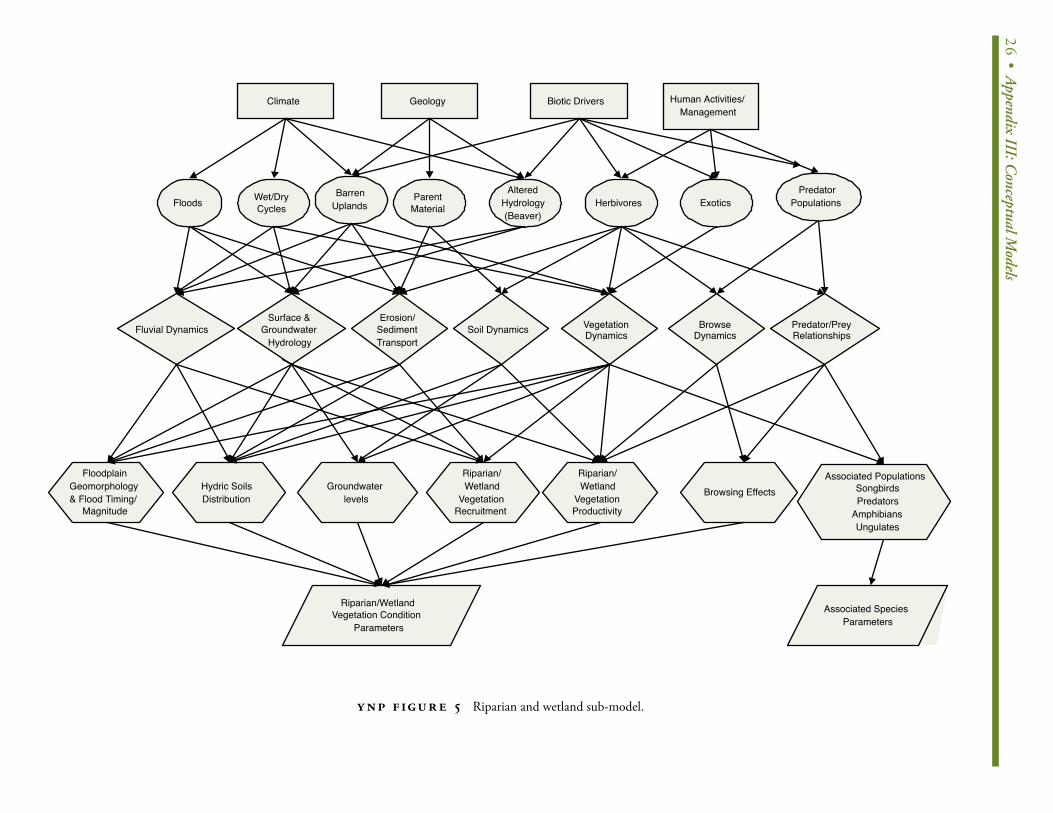
26• Appendix III: C
onceptual Models
Yellowstone National ParkRiparian/Wetland Areas
Herbivores
Climate Biotic Drivers
VegetationDynamicsFluvial Dynamics Soil Dynamics
Wet/DryCycles
Riparian/Wetland
VegetationProductivity
Predator/PreyRelationships
Groundwaterlevels
FloodplainGeomorphology& Flood Timing/
Magnitude
Human Activities/Management
Associated PopulationsSongbirdsPredators
AmphibiansUngulates
Geology
ParentMaterial
Riparian/Wetland
VegetationRecruitment
Hydric SoilsDistribution
AlteredHydrology(Beaver)
Surface &Groundwater
Hydrology
ExoticsBarren
Uplands
BrowseDynamics
Erosion/SedimentTransport
Browsing Effects
PredatorPopulations
Riparian/WetlandVegetation Condition
Parameters
Associated SpeciesParameters
Floods
Y NP F IGUR E 5 Riparian and wetland sub-model.
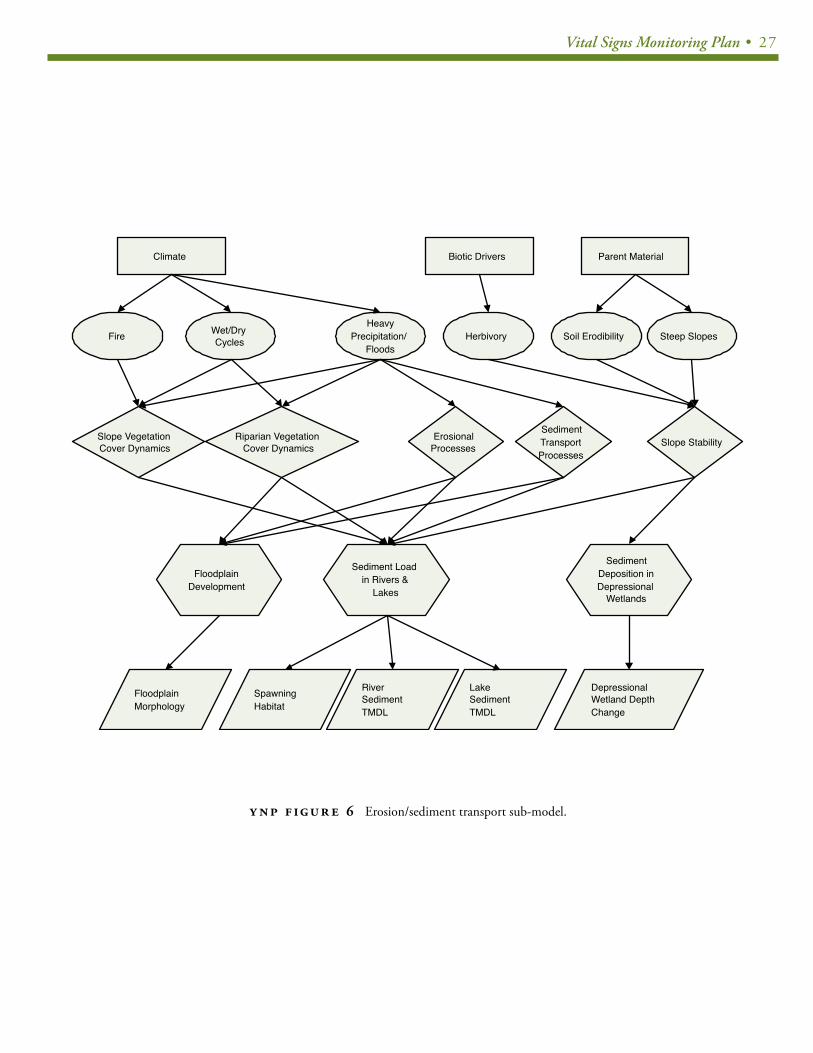
Vital Signs Monitoring Plan • 27
Slope VegetationCover Dynamics
FloodplainDevelopment
FloodplainMorphology
Climate
Fire
Yellowstone National ParkErosion/Sediment Transport
Biotic Drivers Parent Material
Herbivory Soil Erodibility Steep SlopesHeavy
Precipitation/Floods
Wet/DryCycles
Riparian VegetationCover Dynamics
ErosionalProcesses
SedimentTransportProcesses
Slope Stability
Sediment Loadin Rivers &
Lakes
SedimentDeposition inDepressional
Wetlands
SpawningHabitat
RiverSedimentTMDL
LakeSedimentTMDL
DepressionalWetland DepthChange
Y NP F IGUR E 6 Erosion/sediment transport sub-model.
28 • Appendix III: Conceptual Models
1 Yellowstone Center for Resources Yellowstone National Park Mammoth, WY 82190
2 Dept of Botany University of Wyoming Laramie, WY 82071
3 Big Sky Institute Montana State University Bozeman, MT 59717
4 Dept of Zoology University of Wyoming Laramie, WY 82071
5 Greater Yellowstone Network Montana State University Bozeman, MT 59717
Conceptual Models for Dominant Vegetation, Aquatic and Geothermal Ecosystems
in Bighorn Canyon National Recreation Area, Grand Teton National Park, and Yellowstone National Park
Glenn PlumbGlenn Plumb11, Dan Tinker, Dan Tinker22, Duncan Patten, Duncan Patten33, Bob Hall, Bob Hall44, Cheryl Jaworowski, Cheryl Jaworowski11, Henry Heasler, Henry Heasler11 and Cathie Jean and Cathie Jean55
Table of ContentsAquatic Ecosystem Narrative Conceptual Model . . . . . . . . . . . . . . . . . . . . . . . . . . . . . . . . . . . . . . . . . . . . 30
Alpine-Timberline Ecosystem Narrative Conceptual Model . . . . . . . . . . . . . . . . . . . . . . . . . . . . . . . . . . . . 37
Aspen Ecosystem Narrative Conceptual Model . . . . . . . . . . . . . . . . . . . . . . . . . . . . . . . . . . . . . . . . . . . . . . 47
Dry Woodland Ecosystem Narrative Conceptual Model . . . . . . . . . . . . . . . . . . . . . . . . . . . . . . . . . . . . . . . 56
Geothermal Ecosystem Narrative Conceptual Model . . . . . . . . . . . . . . . . . . . . . . . . . . . . . . . . . . . . . . . . . 59
Grassland Ecosystem Narrative Conceptual Model . . . . . . . . . . . . . . . . . . . . . . . . . . . . . . . . . . . . . . . . . . . 63
Shrubland Ecosystem Narrative Conceptual Model . . . . . . . . . . . . . . . . . . . . . . . . . . . . . . . . . . . . . . . . . . . 72
Lodgepole Pine Ecosystem Narrative Conceptual Model . . . . . . . . . . . . . . . . . . . . . . . . . . . . . . . . . . . . . . 75
Mixed Conifer Ecosystem Narrative Conceptual Model . . . . . . . . . . . . . . . . . . . . . . . . . . . . . . . . . . . . . . . 80
Ponderosa Pine Ecosystem Narrative Conceptual Model . . . . . . . . . . . . . . . . . . . . . . . . . . . . . . . . . . . . . . 86
Whitebark Pine Ecosystem Narrative Conceptual Model . . . . . . . . . . . . . . . . . . . . . . . . . . . . . . . . . . . . . . . 90
Riparian/Riverine Ecosystem Narrative Conceptual Model . . . . . . . . . . . . . . . . . . . . . . . . . . . . . . . . . . . . . 95
Wetland Ecosystem Narrative Conceptual Model . . . . . . . . . . . . . . . . . . . . . . . . . . . . . . . . . . . . . . . . . . . 108
Tables and Figures
Figure 1 Lake model. . . . . . . . . . . . . . . . . . . . . . . . . . . . . . . . . . . . . . . . . . . . . . . . . . . . . . . . . . . . . . . . . . . . . . . . 35
Figure 2 River model. . . . . . . . . . . . . . . . . . . . . . . . . . . . . . . . . . . . . . . . . . . . . . . . . . . . . . . . . . . . . . . . . . . . . . . . 36
Figure 3 General alpine model. . . . . . . . . . . . . . . . . . . . . . . . . . . . . . . . . . . . . . . . . . . . . . . . . . . . . . . . . . . . . . . . 43
Figure 6 Alpine vegetation submodel. . . . . . . . . . . . . . . . . . . . . . . . . . . . . . . . . . . . . . . . . . . . . . . . . . . . . . . . . . 44
Figure 4 Alpine soil frost dynamics submodel. . . . . . . . . . . . . . . . . . . . . . . . . . . . . . . . . . . . . . . . . . . . . . . . . . . . 44
Figure 5 Alpine scree slope dynamics submodel. . . . . . . . . . . . . . . . . . . . . . . . . . . . . . . . . . . . . . . . . . . . . . . . . 44
Figure 7 General alpine timberline model. . . . . . . . . . . . . . . . . . . . . . . . . . . . . . . . . . . . . . . . . . . . . . . . . . . . . . . 45
Figure 8 Alpine timberline elevation submodel. . . . . . . . . . . . . . . . . . . . . . . . . . . . . . . . . . . . . . . . . . . . . . . . . . 46

Vital Signs Monitoring Plan • 29
Figure 9 Alpine woody vegetation dynamics submodel. . . . . . . . . . . . . . . . . . . . . . . . . . . . . . . . . . . . . . . . . . . . 46
Figure 10 General aspen model. . . . . . . . . . . . . . . . . . . . . . . . . . . . . . . . . . . . . . . . . . . . . . . . . . . . . . . . . . . . . . . . 51
Figure 11 Aspen growth and reproduction submodel. . . . . . . . . . . . . . . . . . . . . . . . . . . . . . . . . . . . . . . . . . . . . . . 52
Figure 12 Aspen soil and groundwater processes submodel. . . . . . . . . . . . . . . . . . . . . . . . . . . . . . . . . . . . . . . . 53
Figure 13 Aspen fire dynamics submodel. . . . . . . . . . . . . . . . . . . . . . . . . . . . . . . . . . . . . . . . . . . . . . . . . . . . . . . . 54
Figure 14 Aspen vegetation composition submodel. . . . . . . . . . . . . . . . . . . . . . . . . . . . . . . . . . . . . . . . . . . . . . . . 54
Figure 15 Aspen browse dynamics submodel. . . . . . . . . . . . . . . . . . . . . . . . . . . . . . . . . . . . . . . . . . . . . . . . . . . . . 55
Figure 16 Dry woodland model. . . . . . . . . . . . . . . . . . . . . . . . . . . . . . . . . . . . . . . . . . . . . . . . . . . . . . . . . . . . . . . . . 58
Figure 17 Geothermal model. . . . . . . . . . . . . . . . . . . . . . . . . . . . . . . . . . . . . . . . . . . . . . . . . . . . . . . . . . . . . . . . . . 62
Figure 18 Grassland model. . . . . . . . . . . . . . . . . . . . . . . . . . . . . . . . . . . . . . . . . . . . . . . . . . . . . . . . . . . . . . . . . . . . 70
Figure 19 Grassland net primary productivity submodel (adapted from Briggs 1998). . . . . . . . . . . . . . . . . . . . . 71
Figure 20 Shrubland model. . . . . . . . . . . . . . . . . . . . . . . . . . . . . . . . . . . . . . . . . . . . . . . . . . . . . . . . . . . . . . . . . . . . 74
Figure 21 Lodgepole model. . . . . . . . . . . . . . . . . . . . . . . . . . . . . . . . . . . . . . . . . . . . . . . . . . . . . . . . . . . . . . . . . . . . 79
Figure 22 Mixed conifer model. . . . . . . . . . . . . . . . . . . . . . . . . . . . . . . . . . . . . . . . . . . . . . . . . . . . . . . . . . . . . . . . . 85
Figure 23 Ponderosa pine model. . . . . . . . . . . . . . . . . . . . . . . . . . . . . . . . . . . . . . . . . . . . . . . . . . . . . . . . . . . . . . . 89
Figure 24 Whitebark pine model. . . . . . . . . . . . . . . . . . . . . . . . . . . . . . . . . . . . . . . . . . . . . . . . . . . . . . . . . . . . . . . 94
Table 1 Riverine/Riparian Ecosystems. Environmental threats for each ecosystem type by HUC unit. 101
Figure 25 General riparian model. . . . . . . . . . . . . . . . . . . . . . . . . . . . . . . . . . . . . . . . . . . . . . . . . . . . . . . . . . . . . . 105
Figure 26 Riparian vegetation dynamics submodel. . . . . . . . . . . . . . . . . . . . . . . . . . . . . . . . . . . . . . . . . . . . . . . 106
Figure 27 Riparian fluvial geomorphology dynamics submodel. . . . . . . . . . . . . . . . . . . . . . . . . . . . . . . . . . . . . . 107
Figure 28 Riparian herbivory dynamics submodel. . . . . . . . . . . . . . . . . . . . . . . . . . . . . . . . . . . . . . . . . . . . . . . . . 107
Figure 29 General wetland model. . . . . . . . . . . . . . . . . . . . . . . . . . . . . . . . . . . . . . . . . . . . . . . . . . . . . . . . . . . . . 112
Figure 30 Wetland hydrology dynamics submodel. . . . . . . . . . . . . . . . . . . . . . . . . . . . . . . . . . . . . . . . . . . . . . . . 113
Figure 31 Wetland vegetation dynamics submodel. . . . . . . . . . . . . . . . . . . . . . . . . . . . . . . . . . . . . . . . . . . . . . . 114
Figure 32 Wetland beaver population dynamics submodel. . . . . . . . . . . . . . . . . . . . . . . . . . . . . . . . . . . . . . . . . 114
Figure 33 Depressional wetland dynamics submodel. . . . . . . . . . . . . . . . . . . . . . . . . . . . . . . . . . . . . . . . . . . . . 114
30 • Appendix III: Conceptual Models
AQUAT I C E C O S Y S T E M N A R R AT I V E C O N C E P T UA L M O D E L
(author: Bob Hall)(author: Bob Hall)
The GRYN contains a diverse group of lakes, both natural and human-
made. There are numerous glacier-carved lakes in high alpine areas
of the Teton Range, and several large lakes formed from tectonic pro-
cesses. Bighorn Canyon contains a large impoundment, and the top 8
m of Jackson Lake is regulated by a dam at its outlet. The large lakes
contain substantial biological and economic resources. For example,
Yellowstone lake has the largest population of Yellowstone cutthroat
trout (Onchorhyncus clarki bouvieri) (Gresswell and Varley 1988).
These lakes are used extensively for recreation, such as boating and
fishing. Bighorn and Jackson Lake are used for water storage.
River ecosystems are equally diverse in the GRYN. Rivers ranges
from large lake outlets (e.g. Snake and Yellowstone rivers, to many
high-mountain streams, and geothermally influenced rivers in the
Madison drainage and South Boundary area of YNP. High variation
in groundwater source, parent material, and topography lead to high
variation in the types of streams within GRYN. In terms of ecosystems
functions such as whole stream metabolism and nitrogen processing,
streams within GTNP are more variable than 11 streams within differ-
ent biomes ranging from the tropics to Alaska (Hall and Tank 2003).
In this narrative I will only consider the aquatic part of rivers as the
riparian section is covered elsewhere, though stressors to streams and
lakes can come from habitat damage to the riparian zone.
DriversLakes are formed by exogenous processes (glacial scour, plate
movement, dams, differential cooling of lava in the case of Yellow-
stone lake), and these processes shape the morphometry of the lake
which, in turn will determine most aspects of its function. Climate
plays a large role in temperature, hydrology and mixing regime of
lakes. Human activities can affect lakes by altering hydrology, cli-
mate, nutrient load and biotic assemblages. Drivers for rivers are
similar to those for lakes, except with the fundamental difference
that rivers morphology is a function of the hydrology (driven by cli-
mate) of the river and geology of the drainage basin as channel struc-
ture changes through time. Changes in climate will affect hydrology
and temperature of rivers, and humans can strongly impact rivers by
altering hydrology, geomorphology and biotic assemblages.
Stressors and impacts to ecological processes
A. TEMPERATURE: Climate change may be an important stress to Yellowstone ecosys-
tems over the long term. Lakes can be used as bellwethers of cli-
mate changes and will likely be affected by global climate change.
Long term records of ice-out on lakes suggest warming of lakes
(Likens 2000, Magnuson 2000) and effects of climate change in the
watershed, e.g. increased fire frequency, may alter lake dynamics
(Schindler et al. 1996). Increasing temperature will affect biota of
rivers directly, e.g. by limiting distribution of coldwater species (Ra-
hel et al. 1996). Alternatively increased temperature could provide
for faster growth rates of fish in rivers and lakes, including invasive
lake trout (Hill and Magnuson 1990), which may change predator-
prey dynamics in lakes.
B. WATER LEVEL AND RIVER HYDROLOGY: Lakes that are hydrologically managed (e.g. Jackson Lake, Bighorn
lake) will have fluctuating water levels that can potentially lake
food webs and ecosystem function. Lakes are linked to their shore-
line and receive a fraction of their energy inputs from allochthonous
inputs, coarse woody debris which provides habitat, and may con-
trol terrestrial predator interactions (Schindler and Scheuerell 2002).
Changing water level may decrease allochthonous inputs and may
limit access of the lake by terrestrial predators (e.g. otters).
Rivers can by altered hydrologically from dam operations (e.g.
Snake River), which can alter biotic assemblages (Stanford and Ward
1989). Water removal for irrigation can reduce instream flows and
flood peaks in the summer, (e.g. Gros Ventre River, Bighorn River, Sho-
shone River, and Spread Creek). Additionally climate change may al-
ter stream hydrology (Poff 2002) which will affect all aspects of river
ecosystem function (Meyer et al. 1999, Firth and Fisher 1992) ranging
from food web interactions (Power et al. 1995) to nutrient cycling.
C. SEDIMENTATION AND GEOMORPHOLOGY: An important stress, covered in the riparian narrative.
D. SOLUTE CONCENTRATIONS:Solutes include all dissolved solids in water, which strongly affect
lake ecosystems. Drought and fire change cation import to lakes (e.g.
Schindler et al. 1996). High mountain lakes may be subject to acidifi-
cation if they are poorly buffered; however western mountains tend
to have lower acid inputs than Northeastern US Mountains. In the
Snowy Range, SE Wyoming, despite low acid-neutralizing capacity
of lakes, acidification is not yet evident because pH of precipitation
is higher than that in the Eastern US (Reuss et al. 1995).
Vital Signs Monitoring Plan • 31
E. NUTRIENT LOADING: Eutrophication from excess nutrients is a pervasive stress on many
lakes and rivers in the US by increasing primary production, changing
biotic assemblages and lowering water clarity; estimating the effects
of this eutrophication has a long history (Smith 1998). Local devel-
opment and atmospheric deposition can cause nutrient loading even
in large mountain lakes such as Lake Tahoe. For example, increased
N loading to Lake Tahoe has increased primary production and de-
creased water clarity (Goldman 1988). The effect of excess nutrients
to rivers is much less well known; experimentally increased P load-
ing to a tundra river increased primary productivity, moss biomass
and secondary production (Peterson et al. 1993). Phosphorus is often
considered the limiting nutrient for lakes and streams, however it is
now recognized that nitrogen often limits production as well (Elser et
al. 1990). Nitrogen is most likely to be the limiting nutrient for most
lake ecosystems within the GRYN; almost all streams in GTNP are N
limited (J. L. Tank and R. O. Hall unpublished data). Planktonic algae
responded greatly to N additions in experimental bioassays show-
ing that N was primarily limiting in Yellowstone and Jackson lakes
(Interlandi and Kilham 1998), thus we suggest that N will be a more
important pollutant than P in the GRYN.
In the West, there are areas with high N loading from atmo-
spheric deposition, particularly near cities and areas downwind
from power plants or intensive agriculture Fenn et al. 2003b). Loch
Vale in Rocky Mountain National Park receives 3-5 kg N ha-1 y-1,
(Baron et al. 2000), and this N has been implicated in changing the
phytoplankton assemblages in these lakes (Wolfe et al. 2001). Lakes
in the GRYN are fairly low-nutrient (Interlandi et al. 1999) thus they
are likely to respond to small increases in nutrients similarly to Ta-
hoe. Indeed, eastern Idaho and the Teton Range are projected to
have high rates of N deposition (Fenn et al. 2003b). Primary sources
would most likely be atmospheric deposition or from local inputs
from towns and settlements within the parks. High mountain lakes
could be most susceptible because they can receive high N loads
from atmospheric deposition, and many lakes in the west have high
nitrate concentrations (Fenn et al. 2003a), although there are almost
no data represented in their paper from western Wyoming, despite
have large high elevation areas with crystalline bedrock that is poten-
tially susceptible to increased nitrate loading.. Although N deposition
rates are low in areas far from cities (e.g. west slope of Colorado
Rockies, Baron et al. 2000), deposition could increase as NOx emis-
sions and local development increases (see Vitousek et al. 1997).
Rivers upstream of Bighorn canyon run through agricultural ar-
eas a have elevated nutrient loads ands N and P (Water Resources
Division, National Park Service1998), which might contribute to the
eutrophic nature of Bighorn Lake (Lee and Jones 1981).
F. EXOTIC SPECIES : Exotic species are one of the most pervasive environmental prob-
lems in the US and the GRYN has received some well-publicized
invasions that can potentially alter aquatic ecosystems. Lake trout
(Savelinus namaycush) have invaded Yellowstone Lake and may
lower native cutthroat trout populations (Stapp and Hayward 2002a,
Ruzyicki et al. 2003) and may extend to predators outside the lake
(Stapp and Hayward 2002b). Lake trout can consume 14% of juve-
nile cutthroat trout (Onchorhyncus clarki) populations per year, even
when numbers are controlled by gill-netting. Whirling disease has
also invaded rivers in Yellowstone which may impact cutthroat trout
populations (Ruzyicki et al. 2003). New Zealand mud snails (Potamo-
pyrgus antipodarum) have invaded many rivers in the GRYN and are
likely having severe impacts. In Polecat Creek, New Zealand mud
snails constitute 90% of invertebrate biomass, and represent the
largest fluxes in the nitrogen cycle (Hall et al. in review). Secondary
production of mud snails in Polecat Creek is one of the highest rates
ever recorded for an aquatic invertebrate (Hall et al. in preparation).
It is not likely that these will be the last invasions, as Simberloff
and Von Holle (1999) suggest that invasions beget more invasions;
evidence in the Great Lakes suggests that this hypothesis is true, as
the invasion rate is increasing non-linearly (Ricciardi 2001).
Potential IndicatorsIndicators can be integrative assessments of biological condition
(Karr 1981, 1999) (i.e. looking for the effect). Measuring biotic con-
dition is important because it represent the impact that managers
and visitors to the parks care about: Are there fish to catch? Is there
wildlife to observe? Is the lake clear? Also, biota can indicate mul-
tiple stressors and often provide better information on change than
hard-to measure-stressors (such as episodic pollution events (Karr
1999). Alternatively we can examine the stressor itself. Measur-
ing changes in the stressor (if possible) is important for 2 reasons:
One is that it may be possible to detect change in the stressor long
before there is an impact to ecological processes. For example, N
inputs or temperature may increase before the biotic assemblage
responds. Invasion of an animal to a new ecosystem can be detect-
ed more easily than the impact to native populations or ecosystem
32 • Appendix III: Conceptual Models
processes. The other reason is that measuring the stressor may help
to understand causes of observed biological changes. If lake clarity
decreases concomitantly with nutrient loading, then increased nu-
trients are a strong causal hypothesis for this biological change.
a. Nitrogen inputsJustification: Atmospheric nitrogen input is a stressor that, if
high enough, could increase primary production in lakes and
streams. Given that most N loading to Yellowstone and Teton
Parks is via atmospheric inputs (as opposed to urbanization or
agriculture), measurement of nitrogen concentrations in pre-
cipitation may detect early changes to these inputs. There are
few NADP sites in the GRYN and the one in Yellowstone is a
low elevation where concentration and of nitrate and volume
of precipitation are expected to be low. There are few high-el-
evation sites for N deposition in the intermountain west (Fenn
et al. 2003b), thus inputs on N and changes of those inputs are
relatively unknown for the GRYN.
Examples of specific measures: Annual wet and dry deposition of
N at a few high and mid elevation sites within the GRYN.
b. Nitrogen concentrations in aquatic ecosystemsJustification: Atmospheric nitrogen input is a stressor that, if high
enough, could increase primary production in lakes and streams.
High alpine watershed lose most of their nitrogen during snow-
melt (e. g. Reuss et al. 1995), and losses are proportional to inputs
(Williams et al. 1996), despite processing of N in the shallow soils.
Stream monitoring can detect long-term trends in deposition (Lik-
ens et al. 1996), and may provide a means to detect watershed-
level response to N additions (Williams et al. 1996).
Examples of specific measures: Temporal sampling of stream
water N throughout the year in Teton Range streams, Bighorn
River and Lake and possibly some Yellowstone rivers. Surveys
of N concentrations in lakes.
c. Water TemperatureJustification: Global climate change may increase temperatures of
lakes and streams which may alter animal habitat and interac-
tions. Additionally, geologic change (e.g. earthquake in Firehole
River basin) may alter groundwater inputs with corresponding
temperature changes in rivers. Measurement of temperature
may be able to detect these changes which can be linked to
any biological changes.
Examples of specific measures: Hourly recording of temperature
in lake epilimnia and rivers via inexpensive recording thermom-
eters. Ice out dates for major lakes.
d. Surface hydrologyJustification: Hydrology of lakes and rivers in the GRYN can change
from direct human modification (e.g. impoundments, water ab-
straction) or via changes in climate (Meyer et al. 1999). This
monitoring is already occurring for several of the rivers in
GRYN, e.g. Snake, Bighorn, Madison, Yellowstone, and 2 of
the lakes, Jackson and Bighorn.
Specific measures: Lake water level and large river discharge.
e. River morphology and habitat assessment (as specified in riparian narrative)
f. Algal species composition and biomassJustification: Increased nutrients of changes to the food web (e.g.
Carpenter et al. 1985) may change algal biomass, water clar-
ity and species composition. Research in Yellowstone Lakes has
shown that diatom species compositions predictably respond to
slight changes nutrients according to their physiology (Interlandi
et al. 1999) and these changes in assemblages may be sensitive
indicators to nutrient inputs and associated climate change (Kil-
ham et al. 1996). Algal species in high-elevation lakes can also
signal changes in nutrient concentrations (Wolfe et al. 2001).
Specific measures: Chlorophyll a concentrations of algae in lakes.
Secchi disk measurements (a measure of water clarity). Algal
(mostly diatoms and some cyanobacteria) assemblage structure.
g. Cutthroat trout responses to exotic predators.Justification: Exotic lake trout and whirling disease can potentially
lower densities of native Yellowstone cutthroat trout in Yel-
lowstone Lake; these effects may cascade to streams and
predators outside of the lake (Stapp and Hayward 2002).
Specific measures: Long-term quantification of Yellowstone cut-
throat trout density, age structure, spawning and recruitment
in Yellowstone Lake and its tributaries.
h. River invertebrate assemblages. Justification: Stream invertebrate assemblages may change in re-
sponse to exotic species, sedimentation, nutrient load or pred-
ator population change. Stream invertebrates are often used
as measures of water quality (Karr 1999) and is the current
approach used by the state of Wyoming for water quality anal-
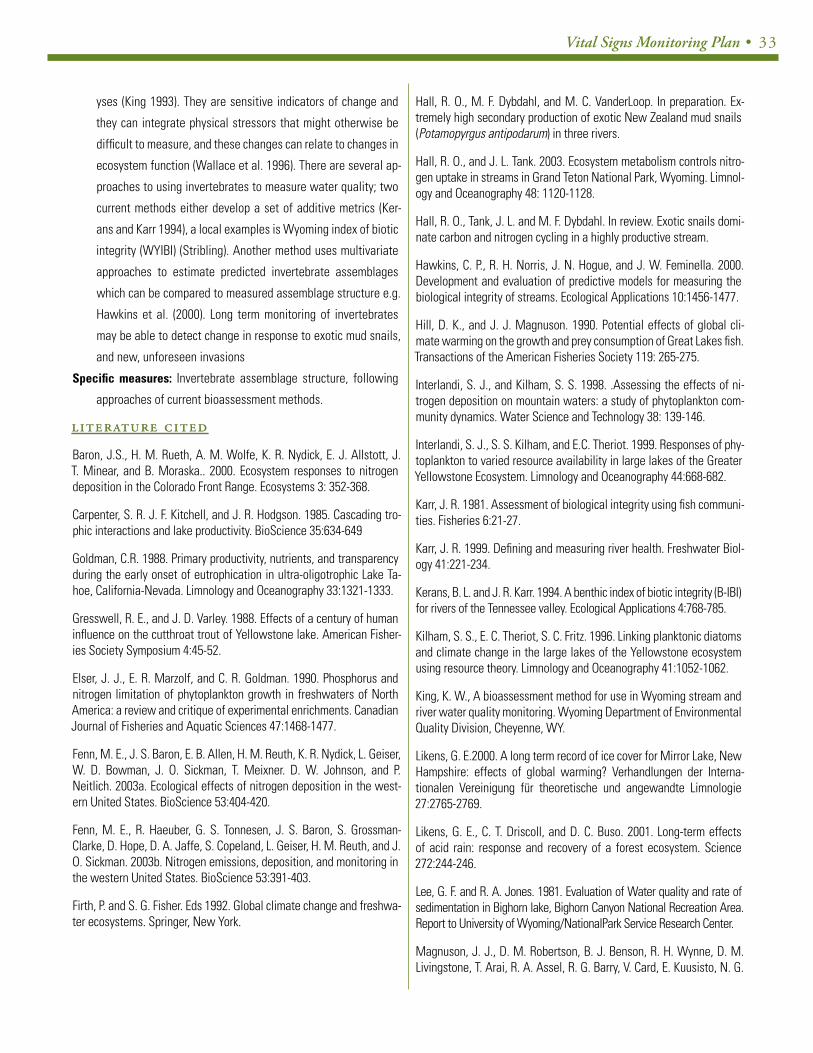
Vital Signs Monitoring Plan • 33
yses (King 1993). They are sensitive indicators of change and
they can integrate physical stressors that might otherwise be
difficult to measure, and these changes can relate to changes in
ecosystem function (Wallace et al. 1996). There are several ap-
proaches to using invertebrates to measure water quality; two
current methods either develop a set of additive metrics (Ker-
ans and Karr 1994), a local examples is Wyoming index of biotic
integrity (WYIBI) (Stribling). Another method uses multivariate
approaches to estimate predicted invertebrate assemblages
which can be compared to measured assemblage structure e.g.
Hawkins et al. (2000). Long term monitoring of invertebrates
may be able to detect change in response to exotic mud snails,
and new, unforeseen invasions
Specific measures: Invertebrate assemblage structure, following
approaches of current bioassessment methods.
LITERATURE CITEDLITERATURE CITED
Baron, J.S., H. M. Rueth, A. M. Wolfe, K. R. Nydick, E. J. Allstott, J. T. Minear, and B. Moraska.. 2000. Ecosystem responses to nitrogen deposition in the Colorado Front Range. Ecosystems 3: 352-368.
Carpenter, S. R. J. F. Kitchell, and J. R. Hodgson. 1985. Cascading tro-phic interactions and lake productivity. BioScience 35:634-649
Goldman, C.R. 1988. Primary productivity, nutrients, and transparency during the early onset of eutrophication in ultra-oligotrophic Lake Ta-hoe, California-Nevada. Limnology and Oceanography 33:1321-1333.
Gresswell, R. E., and J. D. Varley. 1988. Effects of a century of human influence on the cutthroat trout of Yellowstone lake. American Fisher-ies Society Symposium 4:45-52.
Elser, J. J., E. R. Marzolf, and C. R. Goldman. 1990. Phosphorus and nitrogen limitation of phytoplankton growth in freshwaters of North America: a review and critique of experimental enrichments. Canadian Journal of Fisheries and Aquatic Sciences 47:1468-1477.
Fenn, M. E., J. S. Baron, E. B. Allen, H. M. Reuth, K. R. Nydick, L. Geiser, W. D. Bowman, J. O. Sickman, T. Meixner. D. W. Johnson, and P. Neitlich. 2003a. Ecological effects of nitrogen deposition in the west-ern United States. BioScience 53:404-420.
Fenn, M. E., R. Haeuber, G. S. Tonnesen, J. S. Baron, S. Grossman-Clarke, D. Hope, D. A. Jaffe, S. Copeland, L. Geiser, H. M. Reuth, and J. O. Sickman. 2003b. Nitrogen emissions, deposition, and monitoring in the western United States. BioScience 53:391-403.
Firth, P. and S. G. Fisher. Eds 1992. Global climate change and freshwa-ter ecosystems. Springer, New York.
Hall, R. O., M. F. Dybdahl, and M. C. VanderLoop. In preparation. Ex-tremely high secondary production of exotic New Zealand mud snails (Potamopyrgus antipodarum) in three rivers.
Hall, R. O., and J. L. Tank. 2003. Ecosystem metabolism controls nitro-gen uptake in streams in Grand Teton National Park, Wyoming. Limnol-ogy and Oceanography 48: 1120-1128.
Hall, R. O., Tank, J. L. and M. F. Dybdahl. In review. Exotic snails domi-nate carbon and nitrogen cycling in a highly productive stream.
Hawkins, C. P., R. H. Norris, J. N. Hogue, and J. W. Feminella. 2000. Development and evaluation of predictive models for measuring the biological integrity of streams. Ecological Applications 10:1456-1477.
Hill, D. K., and J. J. Magnuson. 1990. Potential effects of global cli-mate warming on the growth and prey consumption of Great Lakes fish. Transactions of the American Fisheries Society 119: 265-275.
Interlandi, S. J., and Kilham, S. S. 1998. .Assessing the effects of ni-trogen deposition on mountain waters: a study of phytoplankton com-munity dynamics. Water Science and Technology 38: 139-146.
Interlandi, S. J., S. S. Kilham, and E.C. Theriot. 1999. Responses of phy-toplankton to varied resource availability in large lakes of the Greater Yellowstone Ecosystem. Limnology and Oceanography 44:668-682.
Karr, J. R. 1981. Assessment of biological integrity using fish communi-ties. Fisheries 6:21-27.
Karr, J. R. 1999. Defining and measuring river health. Freshwater Biol-ogy 41:221-234.
Kerans, B. L. and J. R. Karr. 1994. A benthic index of biotic integrity (B-IBI) for rivers of the Tennessee valley. Ecological Applications 4:768-785.
Kilham, S. S., E. C. Theriot, S. C. Fritz. 1996. Linking planktonic diatoms and climate change in the large lakes of the Yellowstone ecosystem using resource theory. Limnology and Oceanography 41:1052-1062.
King, K. W., A bioassessment method for use in Wyoming stream and river water quality monitoring. Wyoming Department of Environmental Quality Division, Cheyenne, WY.
Likens, G. E.2000. A long term record of ice cover for Mirror Lake, New Hampshire: effects of global warming? Verhandlungen der Interna-tionalen Vereinigung für theoretische und angewandte Limnologie 27:2765-2769.
Likens, G. E., C. T. Driscoll, and D. C. Buso. 2001. Long-term effects of acid rain: response and recovery of a forest ecosystem. Science 272:244-246.
Lee, G. F. and R. A. Jones. 1981. Evaluation of Water quality and rate of sedimentation in Bighorn lake, Bighorn Canyon National Recreation Area. Report to University of Wyoming/NationalPark Service Research Center.
Magnuson, J. J., D. M. Robertson, B. J. Benson, R. H. Wynne, D. M. Livingstone, T. Arai, R. A. Assel, R. G. Barry, V. Card, E. Kuusisto, N. G.
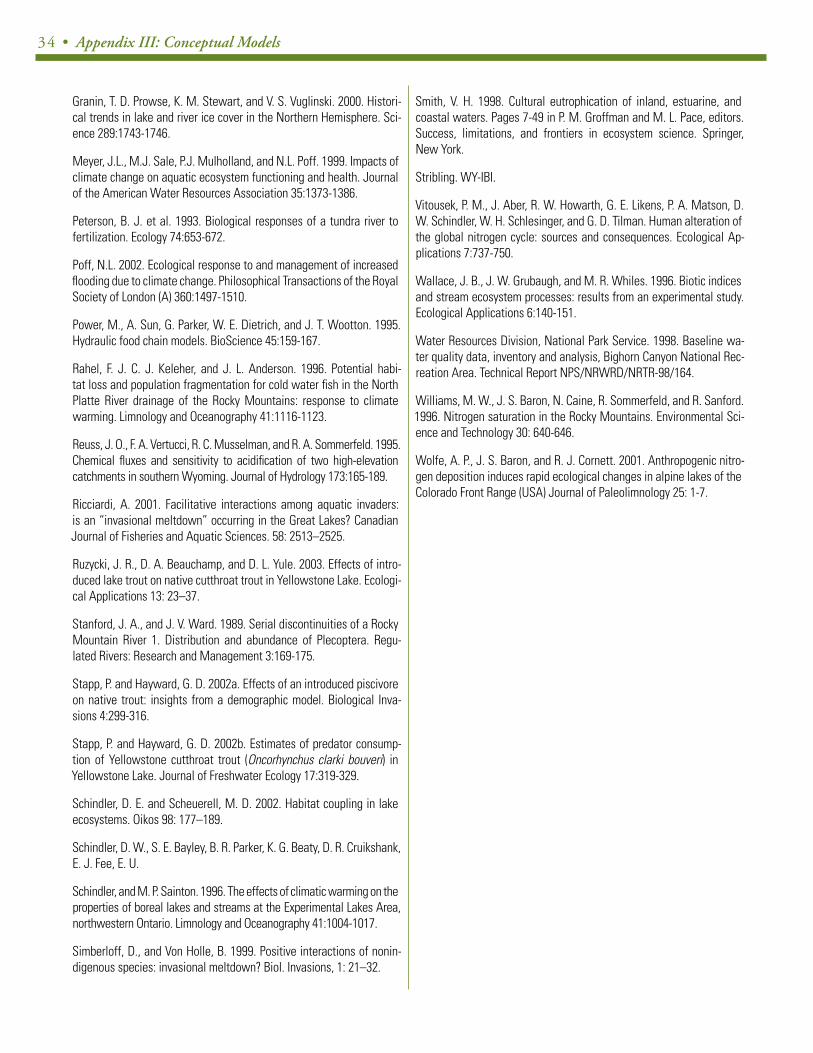
34 • Appendix III: Conceptual Models
Granin, T. D. Prowse, K. M. Stewart, and V. S. Vuglinski. 2000. Histori-cal trends in lake and river ice cover in the Northern Hemisphere. Sci-ence 289:1743-1746.
Meyer, J.L., M.J. Sale, P.J. Mulholland, and N.L. Poff. 1999. Impacts of climate change on aquatic ecosystem functioning and health. Journal of the American Water Resources Association 35:1373-1386.
Peterson, B. J. et al. 1993. Biological responses of a tundra river to fertilization. Ecology 74:653-672.
Poff, N.L. 2002. Ecological response to and management of increased flooding due to climate change. Philosophical Transactions of the Royal Society of London (A) 360:1497-1510.
Power, M., A. Sun, G. Parker, W. E. Dietrich, and J. T. Wootton. 1995. Hydraulic food chain models. BioScience 45:159-167.
Rahel, F. J. C. J. Keleher, and J. L. Anderson. 1996. Potential habi-tat loss and population fragmentation for cold water fish in the North Platte River drainage of the Rocky Mountains: response to climate warming. Limnology and Oceanography 41:1116-1123.
Reuss, J. O., F. A. Vertucci, R. C. Musselman, and R. A. Sommerfeld. 1995. Chemical fluxes and sensitivity to acidification of two high-elevation catchments in southern Wyoming. Journal of Hydrology 173:165-189.
Ricciardi, A. 2001. Facilitative interactions among aquatic invaders: is an “invasional meltdown” occurring in the Great Lakes? Canadian Journal of Fisheries and Aquatic Sciences. 58: 2513–2525.
Ruzycki, J. R., D. A. Beauchamp, and D. L. Yule. 2003. Effects of intro-duced lake trout on native cutthroat trout in Yellowstone Lake. Ecologi-cal Applications 13: 23–37.
Stanford, J. A., and J. V. Ward. 1989. Serial discontinuities of a Rocky Mountain River 1. Distribution and abundance of Plecoptera. Regu-lated Rivers: Research and Management 3:169-175.
Stapp, P. and Hayward, G. D. 2002a. Effects of an introduced piscivore on native trout: insights from a demographic model. Biological Inva-sions 4:299-316.
Stapp, P. and Hayward, G. D. 2002b. Estimates of predator consump-tion of Yellowstone cutthroat trout (Oncorhynchus clarki bouveri) in Yellowstone Lake. Journal of Freshwater Ecology 17:319-329.
Schindler, D. E. and Scheuerell, M. D. 2002. Habitat coupling in lake ecosystems. Oikos 98: 177–189.
Schindler, D. W., S. E. Bayley, B. R. Parker, K. G. Beaty, D. R. Cruikshank, E. J. Fee, E. U.
Schindler, and M. P. Sainton. 1996. The effects of climatic warming on the properties of boreal lakes and streams at the Experimental Lakes Area, northwestern Ontario. Limnology and Oceanography 41:1004-1017.
Simberloff, D., and Von Holle, B. 1999. Positive interactions of nonin-digenous species: invasional meltdown? Biol. Invasions, 1: 21–32.
Smith, V. H. 1998. Cultural eutrophication of inland, estuarine, and coastal waters. Pages 7-49 in P. M. Groffman and M. L. Pace, editors. Success, limitations, and frontiers in ecosystem science. Springer, New York.
Stribling. WY-IBI.
Vitousek, P. M., J. Aber, R. W. Howarth, G. E. Likens, P. A. Matson, D. W. Schindler, W. H. Schlesinger, and G. D. Tilman. Human alteration of the global nitrogen cycle: sources and consequences. Ecological Ap-plications 7:737-750.
Wallace, J. B., J. W. Grubaugh, and M. R. Whiles. 1996. Biotic indices and stream ecosystem processes: results from an experimental study. Ecological Applications 6:140-151.
Water Resources Division, National Park Service. 1998. Baseline wa-ter quality data, inventory and analysis, Bighorn Canyon National Rec-reation Area. Technical Report NPS/NRWRD/NRTR-98/164.
Williams, M. W., J. S. Baron, N. Caine, R. Sommerfeld, and R. Sanford. 1996. Nitrogen saturation in the Rocky Mountains. Environmental Sci-ence and Technology 30: 640-646.
Wolfe, A. P., J. S. Baron, and R. J. Cornett. 2001. Anthropogenic nitro-gen deposition induces rapid ecological changes in alpine lakes of the Colorado Front Range (USA) Journal of Paleolimnology 25: 1-7.
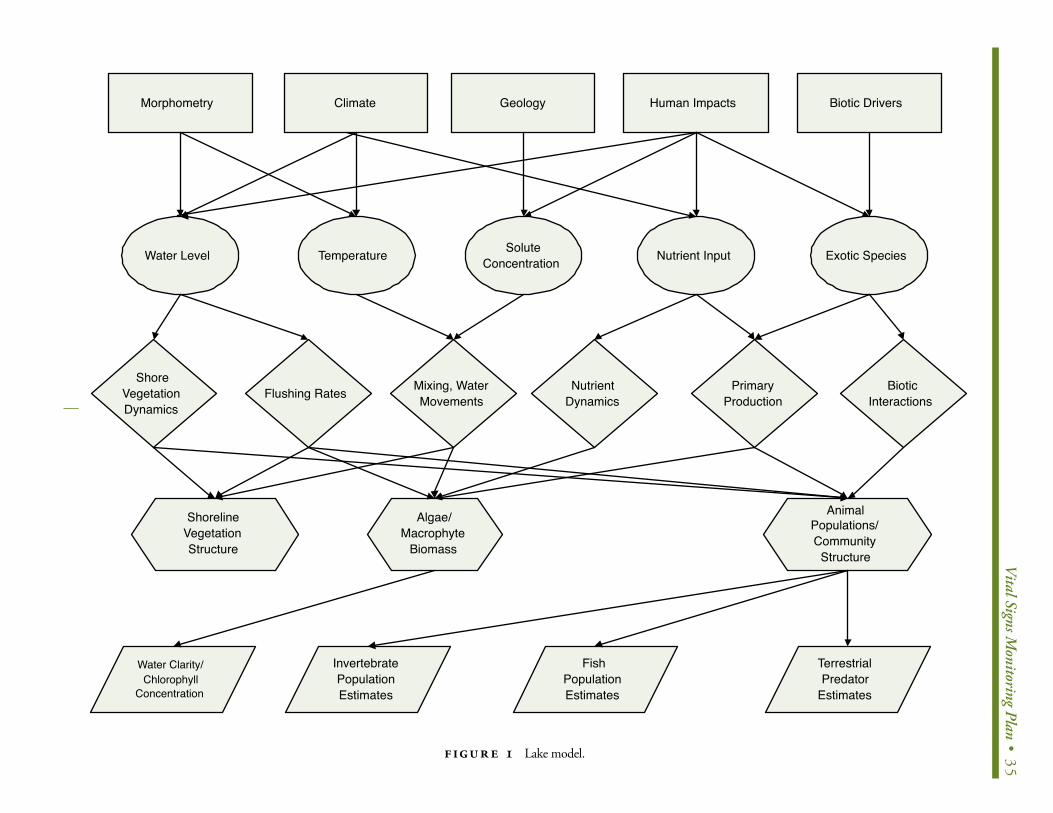
V
ital Signs Monitoring Plan • 35
Morphometry Biotic DriversHuman ImpactsGeologyClimate
Water Level Exotic SpeciesNutrient InputSoluteConcentrationTemperature
ShoreVegetationDynamics
NutrientDynamics
PrimaryProduction
BioticInteractions
Mixing, WaterMovementsFlushing Rates
ShorelineVegetationStructure
AnimalPopulations/Community
Structure
Algae/Macrophyte
Biomass
Water Clarity/Chlorophyll
Concentration
TerrestrialPredator
Estimates
FishPopulationEstimates
InvertebratePopulationEstimates
FIGUR E 1 Lake model.
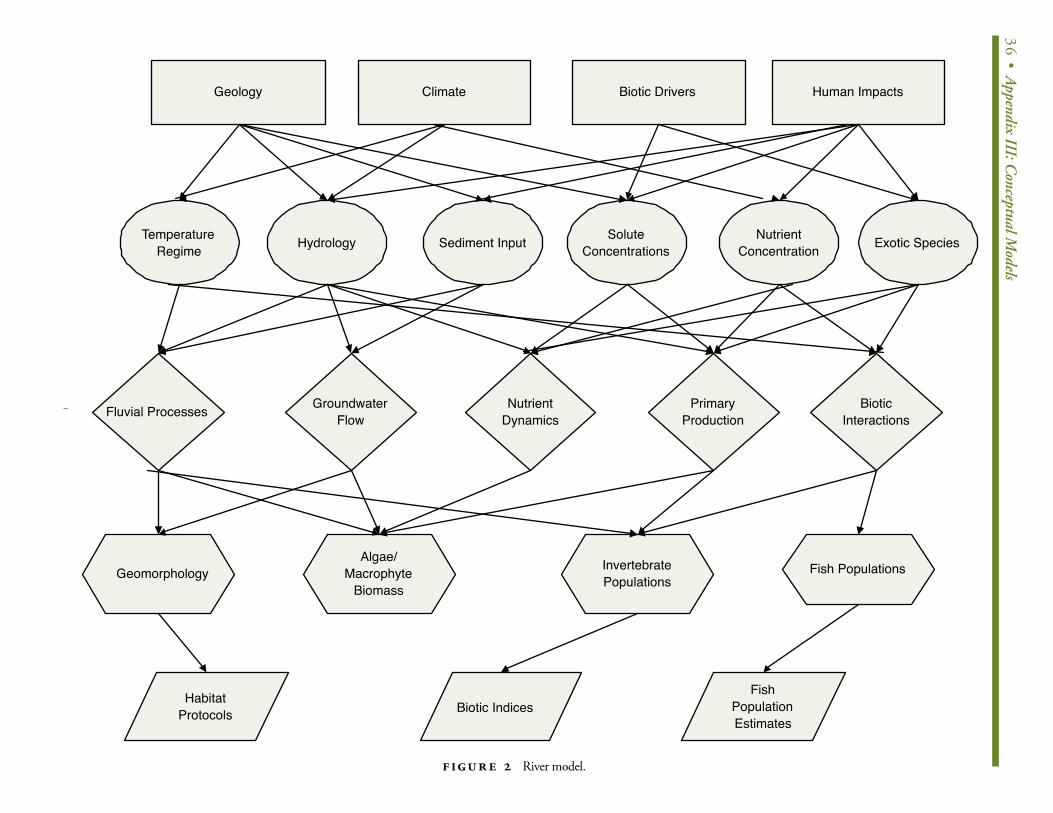
36• Appendix III: C
onceptual Models
Geology Human ImpactsBiotic DriversClimate
TemperatureRegime Exotic SpeciesNutrient
ConcentrationSolute
ConcentrationsSediment InputHydrology
Fluvial Processes NutrientDynamics
PrimaryProduction
BioticInteractions
GroundwaterFlow
Geomorphology Fish PopulationsInvertebratePopulations
Algae/Macrophyte
Biomass
HabitatProtocols
FishPopulationEstimates
Biotic Indices
FIGUR E 2 River model.
Vital Signs Monitoring Plan • 37
ALPINE-TIMBERLINE ECOSYSTEM NARRATIVE CONCEPTUAL MODEL
(author: Duncan Patten)(author: Duncan Patten)
Although the alpine and timberline ecosystems are closely linked,
they represent quite different sets of dynamic processes which result
in potentially different indicators. Consequently, to understand these
systems and model them to address possible indicators (vital signs),
they are treated in many of the discussions below and in conceptual
models (Figures 3 and 7) as separate, but interrelated, systems.
The alpine ecosystem is one of the smallest in area within the
GRYN. It occurs only at high elevations on summits, slopes and ridg-
es above the local timberline (Billings 1988). The environments of the
alpine ecosystem often are extreme with intense radiation, cold tem-
peratures and wide temperature fluxes, extreme wind velocities, thin
air, and often long-lasting snow and ice. Substrates in the alpine may
be barren, rocky outcrops which create highly exposed environments,
while other areas may have well developed soils, or substrates that
are constantly being altered by frost action. Consequently, plants
that survive in these extremes tend to grow near the ground, often in
mats but also as isolated plants. Their productivity results from the
combined stress of alpine environments (Scott and Billings 1964).
The sharpest environmental gradient in mountains is the ecotone
between alpine and forest, the timberline zone. This ecotone is
broadly defined as the upper limit of trees, a response to environ-
mental stress (White 1996). It is related to the declining amount of
biologically useful thermal energy with summer temperatures dictat-
ing the length of the growing season (Billings 1974). Physical fac-
tors such as weather, temperatures, snowdrifts, and soil conditions
control whether woody forest species will establish and survive at
high elevations. Trees growing at timberline grow at the same rate
as several hundred meters below timberline (Paulsen et al. 2000),
although isolated trees above the extensive timberline ecotone may
have very slow growth, in part, because of foliage loss to wind and
other factors. Treeline vegetation is sensitive to many environmental
factors. Over a half century period, Klasner and Fagre (2002) saw
changes in timberline forests in Glacier National Park with forests
below the timberline becoming more dense and krummholz (twisted
wood) stands becoming fragmented near trails.
Drivers and Related StressorsExtreme environments of the alpine and timberline areas are com-
mon elements in these two systems allowing a combined discussion
of the drivers. The drivers fall into five major categories: climate, ge-
ology, fire, human activities and biotic factors.
Climatic drivers or natural stressors are the most obvious set of
parameters controlling processes at high elevations in the GRYN. At
high elevations several factors become limiting and dominate physi-
ological and growth processes of organisms (Tranquillini 1979). Tem-
perature extremes with wide fluctuations play an important role both
for organism survival but also physical processes. High radiation lev-
els at high elevations can cause the ground surface to heat up dur-
ing the day followed by rapid nighttime cooling. Extreme cold tem-
peratures dictate physiological processes and are considered one of
the primary causes of timberline, that is, only plants with metabolic
systems that can function at very cold temperatures during the short
alpine growing season can grow at these elevations. Temperature
extremes may function synergistically with other natural stressors to
create even more extreme conditions. For example, wind combined
with low temperatures may limit high elevation forest growth.
Wind is a constant force in the alpine environment. It may cause
alpine temperatures to become more extreme by breaking down the
boundary layer formed on physical and biological surfaces. Conse-
quently, low temperatures become more “penetrating” and poten-
tial for freezing increases, while daytime highs on ground and other
surfaces may be far above ambient temperatures. Wind may bring
warmer temperatures from lower elevations to the alpine. Wind also
drives ice and snow which scour and abrade surfaces and plant tis-
sues, and causes snow to accumulate. Snow drifts often do not melt
until well into the alpine growing season limiting early phonological
stages of alpine plants.
The thin air at high elevations results in two different environ-
mental drivers. Thin air allows a greater amount of solar radiation,
especially in the ultraviolet (UV). UV-B can differ by a whole order of
magnitude between a dry environment at sea-level and high alpine
environments (Caldwell et al. 1980). Alpine plants have adapted to
high UV by either absorbing it in the epidermis or reflecting it off
leaves or other plant parts. Thin air also means lower partial pres-
sure of gases, CO2 being the one of concern. Low CO2 levels control
photosynthetic rates, and yet, photosynthetic efficiency of alpine
plants is often greater than low-elevation plants tested within the
same low CO2 atmosphere.
Drought is a climatic factor that can influence both composition
of alpine plant communities and timberline. Alpine zones range from
38 • Appendix III: Conceptual Models
very wet to dry. Both extremes may produce conditions with low water
availability, however, moisture gradients do create concomitant veg-
etation gradients in the alpine zone (Oberbauer and Billings 1981).
Fire is not a common driver in alpine ecosystems; however, in the
past it was common in GRYN forests and thus played a role in modi-
fying timberline forests. Forest fires in the montane and subalpine
forests often reached to timberline destroying living timberline trees,
or burning dead and down trees at that elevation zone. Evidence of
the location of timberline may have been destroyed or reduced by
fires reaching timberline. Remains of burned trees are used to deter-
mine extent of timberline forests. Dendrochronological techniques
are used to date remnants of timberline forests allowing establish-
ment of dates of forest encroachment into the alpine or withdrawal
from alpine/timberline ecotones.
Disease is a natural occurrence in most ecosystems; however,
disease and insect infestations, although cyclical, can alter the
structure of alpine and timberline vegetation. Several types of coni-
fer insect infestations and diseases have altered timberline forests,
for example, bark beetle and bud worm. The cyclical nature of these
diseases and infestations do not permanently alter the forest as it
normally recovers at the end of the cycle.
High elevation ecosystems are permanently under environmental
stress as environments at these elevations do not allow robust veg-
etation development, either in the alpine or at timberline. Climate,
geology, fire, human activities and biotic factors all play a role in
creating stressful conditions. Here the term stressful applies not
only to the normal extremes at these elevations but also to changing
environments that may be natural or of human origin.
Climate and the resulting local weather conditions constantly influ-
ence alpine and timberline ecosystems. Many of these conditions are
discussed above; however, long-term climatic cycles may ameliorate
timberline environments and allow trees to grow at higher elevations.
On the other hand, long-term colder and drier conditions may play a
reverse role and cause the forest line to retreat in elevation. Recent
human influence of the world climate may influence these long-term
climatic patterns and indirectly alter “normal” timberline fluctuations.
Climate models may allow predictions of possible climate change and
thus concomitant changes in timberline elevations.
Short-term warm/cold cycles, sometimes only 24 hours long, may
cause disruption of wet alpine soils, resulting in churning of soil parti-
cles and instability of the substrate. These disturbance can form small,
fine soil “frost boils”, extensive “rock nets”, and solifluction terraces
(Johnson and Billings 1962). Climatic changes that might prevent short-
term freeze/thaw cycles, or extend the period between a thaw and
freeze period, may alter the extent of frost action soils and greatly
change the types of alpine vegetation establishing in these areas.
High elevations have thin air, consequently, the partial pressure
of photosynthetic gases (i.e., CO2) is low resulting in the need for
photosynthetically efficient plants. Reduced CO2 may not be consid-
ered a stressor as it is normal in the alpine zone, however, human
caused increases of atmospheric CO2 may result in reduced need for
photosynthetic efficient plants and possible changes in alpine plant
communities. Also, timberline trees may produce more growth under
an increased CO2 environment and better withstand the extreme en-
vironmental gradient at the alpine/timberline ecotone.
Wind also is a normal part of the alpine/timberline environment
(Hadley and Smith 1986). . Climate models do not predict local wind
patterns or velocities, but it is probable that with climate change,
including changes in temperature gradients, wind patterns and ve-
locities could change.
High elevations are known for high levels of radiation and the mag-
nitude of UV is discussed above. However, human caused reduction
in stratospheric ozone has increased the amount of UV entering the
earth’s atmosphere. Consequently, elevations that already receive
high levels of UV can be expected to have increasing UV levels which
will directly affect most biotic functions and survival of high eleva-
tion organisms. Eventual UV resistant adaptations may develop but
this type of evolutionary process is long-term and plant community
changes may take place before UV resistant adaptation does.
Fire has been mentioned as a normal part of forest dynamics
directly influencing the timberline forest stands. However, fire sup-
pression has modified the occurrence and extent of fires in the GRYN
area directly changing an important timberline environmental fac-
tor. Reduced fires or possibly more extensive wildfires resulting from
long-term fire suppression and fuel build up must be considered an
environmental stressor of timberline forests even if fires are a nor-
mal part of forest dynamics.
Topography, that is, slope aspect and angle, is a relatively stable
part of the alpine environment. Some changes occur under frost ac-
tion solifluction (soil surface movement), but stability is the norm.
It is included here as a stressor because at high elevations small
changes in topography alter the extremes of the environment. Thus,
plants growing in the shelter of an organic mound, or behind a rock
in the alpine zone cannot grow out in an exposed location. The very
Vital Signs Monitoring Plan • 39
limitations created by topography can be stressful to alpine plants.
Alpine vegetation is one of the most sensitive vegetation types
in the Rocky Mountains (Billings 1973). It grows only in sheltered
areas or on deeper soils that have existed for some time. Its sensitiv-
ity to external physical stress is illustrated recently by the loss of
alpine communities in areas where there is high human use (Cole
and Monz 2002). Human trampling loosens the plant surface, espe-
cially cushions or mats, making it susceptible to wind scour (Hartley
1976, Jackson 1998). National parks have put in trails with off-trail
foot traffic excluded with the hope of protecting alpine plant com-
munities in heavy human use areas. Increasing human use can only
exacerbate human impacts.
Grazing (wild and domestic) alters composition of alpine areas
through plant consumption and trampling. In the GRYN parks, grazing
is limited to wild animals, but adjacent alpine areas (e.g., Beartooth
Plateau) shows evidence of long-term erosion and trail development
where domestic livestock have grazed. Although this is not as significant
a stressor as some of the climatic factors, it works synergistically with
other factors in the alteration of the alpine vegetation community.
Introduction of exotic plants in the alpine/timberline zone does
not play as important a role in vegetation community modification
as found in lower elevation zones. However, care should be taken
to avoid introduction of exotic species, especially where trails and
roads have been established in these high-elevations.
Disease is evident in all biotic communities of the GRYN. In al-
pine/timberline areas disease can be found in timberline forests, and
in high elevation ungulate populations. White pine blister rust has
become a disease of concern in the high elevation forests of the
GRYN. Whitebark pine, a timberline species, has become infected
over the past several decades (Kendall and Keane 2001). Although
the magnitude of the disease is less in the GRYN than in areas like
Glacier National Park, it still has potential of eliminating or greatly
reducing the whitebark pine community, thus eliminating whitebark
pine seeds, a primary food source for grizzly bear. Disease in the
alpine community, although probably present, does not have the po-
tential yet of greatly altering that community.
Processes, Outcomes and IndicatorsInteraction of several stressors influence alpine and timberline pro-
cesses (Figures 3 and 7). These interactions can be represented in
several process submodels which explain in greater detail how fac-
tors influence each other.
A. ALPINE ZONE PROCESSES , OUTCOMES, AND INDICATORS
1. Soil frost dynamics.
Interaction of temperature changes and soil moisture greatly modi-
fies areas of the alpine zone through cyropedogenic processes (John-
son and Billings 1962). Cryopedogenic or soil frost action causes
water to shrink and expand thus moving soil particles around. In
some cases these processes are limited to small areas called “frost
boils” where larger soil particles are pushed outward. These frost
churned soils create instable locations that often prevent establish-
ment of vegetation and long-term stability of the alpine vegetation
community. Soil frost action can also sort larger rocks creating what
are called “rock nets” or “rock polygons” in the alpine zone. In this
case, sod may develop between the rocks and dense alpine plan
communities establish. Alpine soils on steeper slopes my form “so-
lifluction terraces” when the soil frost action expands the wet soils
and gradually moves them down slope. These terraces are usually
covered with alpine vegetation.
2. Scree slope dynamics.
Many alpine and subalpine slopes are steep and relatively unstable.
These scree and fellfield slopes often cannot support vegetation, al-
though in some cases pockets of alpine herbs or shrubs may find suf-
ficiently stable sites to establish (Griggs 1956). Again, thaw-freeze
action can maintain instability of these slopes.
3. Alpine vegetation dynamics.
Alpine plant communities are a product of all of the factors (and
stressors) that influence the mountain plant communities found
above timberline. Winds, high UV, wide temperature fluctuations,
human and animal use, disease and introduced species all play a
role, but the magnitude of that role varies. If future climatic changes
reduce the potential for thaw-freeze actions, then those plants de-
pendent on disturbed soils may decline. Increased human and animal
activities in the alpine zone will also alter the vegetation composi-
tion of alpine communities. Consequently, plant species composition
of in the alpine zone becomes a measure of the synergistic effects
of all of the stressors.
The primary outcome of the several process models is vegetation
composition and cover and shows the importance of environmental
stress on plant communities (Kammer and Mohl 2002). Scree slopes
and greatly altered frost action areas will have little vegetation cover,
while alpine areas with well developed soils may have a continuous,
40 • Appendix III: Conceptual Models
dense plant cover. Changes in these vegetation characteristics in
response to environmental stresses thus becomes indicators of the
influence of these stressors on the alpine zone.
B. TIMBERLINE PROCESSES , OUTCOMES AND INDICATORS
1. Timberline elevation dynamics.
Timberline, that is the elevation location of the ecotone between
forest and alpine vegetation, has fluctuated over the past millen-
nia (Carrera et al. 1991). The fluctuation is mostly driven by climatic
factors, warmer or cooler climates, and/or wetter or drier climates
(Hessl and Baker 1997). Human induced climate change may cause
a rise in the elevation of timberline, if warmer is expected. Although
this change is slow, evidence of past location of timberline can be
found in presence of remnants of trees well up in the alpine zone.
Dating of these trees can establish the time when forests occurred
at higher elevations (Graumlich 1991, 1994). Establishment of a long-
term record of timberline fluctuations may be a useful indicator of
natural and human-induced influence on timberline forests.
2. Timberline woody plant dynamics.
Composition of timberline forests varies according to the combined
influence of those factors that limit forest species from advancing
upwards on a mountain. For example, protective structures such as
rocks and coarse stable soils may allow forest species to establish
at high elevations. Lack of these conditions may prevent forests
from establishing higher, unless climatic factors ameliorate. Fire
and disease have recently become more important factors in modify-
ing timberline forest location and composition. If white pine blister
rust mostly eliminates whitebark pine, then timberline forests will
be primarily spruce and fir, or may be reduced to dead and dying
trees above the subalpine forest. Extensive fires, a result of forest
fire suppression, may also reach into the timberline forest destroying
the existing trees. Recovery from fires then will be a result of ability
of timberline tree species to regain their normal elevation location,
a process that is difficult because of the extreme environments at
these elevations. Consequently, the composition of the timberline
forest, a product of natural and human activities, may be a good
indicator of changes occurring within the GRYN regions parks.
3. Alpine/Treeline Potential Indicators
The ecosystems that compose alpine and timberline areas have
developed in extreme environments. Wind, cold and thin air char-
acterize the extremes that control these ecosystems, and yet, hu-
man activities also have influenced their present state. Changing
environments, both natural and human caused, may alter the future
conditions of alpine and timberline zones. Consequently, the indica-
tors selected for the vital signs program will give a warning of the
gradual changes these ecosystems may have as a changing local
and global environment alters the drivers that form these sensitive,
high elevation ecosystems.
a. Timberline forest densities and healthResource Monitored: Timberline forest, including large trees such
as whitebark pine, and krummholz stands in exposed and pro-
tected areas.
Justification: Timberline in the Rocky Mountains, as in most temper-
ate-zone mountains, has fluctuated in elevation over the past
millennia. Changes in the elevation of timberline occur slowly;
however, the actual elevation should be monitored (see another
indicator). The forest trees and woody plants near timberline be-
gin to show new recruitment at higher elevations, or decline in
forest stature long before the actual timberline change stables
for some time. Timberline is dynamic, and yet there are periods
when it appears to be stable allowing long-term monitoring of
forest conditions at or near timberline to show possible pre-
cursor forest modification prior to solid evidence of timberline
change. Recently, introduced diseases (e.g., white pine blister
rust) have initiated more rapid changes in timberline forest
health. For this reason alone, timberline forests should be part
of a long-term monitoring program.
Comment: The long-term dynamic nature of timberline and the varia-
tion of forest types require that any sampling of forest condi-
tion at or near timberline must include the variability of forest
structure. Measurement of health of krummholz stands is quite
different than measurement of health of high elevation white-
bark pine stands.
Example of specific measurements for indicator: In randomly se-
lected, representative timberline zones in the GRYN area, sam-
pling transects within and just above the forest, and randomly
selected krummholz patches should be monitored on a regular
basis (e.g., 2-5 years). Forest transects will measure the density
of living and dead trees and the condition (e.g., percent canopy
dead). The cover and ratio of dead to living canopy should be
measured in the krummholz patches.
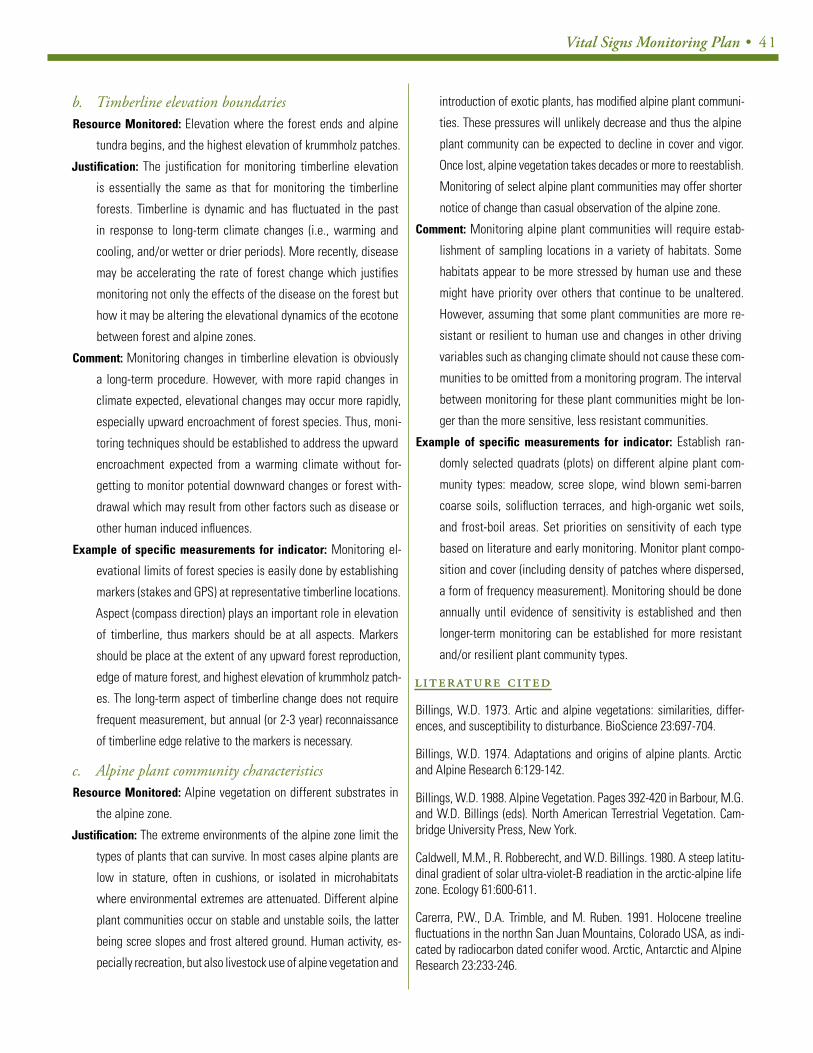
Vital Signs Monitoring Plan • 41
b. Timberline elevation boundariesResource Monitored: Elevation where the forest ends and alpine
tundra begins, and the highest elevation of krummholz patches.
Justification: The justification for monitoring timberline elevation
is essentially the same as that for monitoring the timberline
forests. Timberline is dynamic and has fluctuated in the past
in response to long-term climate changes (i.e., warming and
cooling, and/or wetter or drier periods). More recently, disease
may be accelerating the rate of forest change which justifies
monitoring not only the effects of the disease on the forest but
how it may be altering the elevational dynamics of the ecotone
between forest and alpine zones.
Comment: Monitoring changes in timberline elevation is obviously
a long-term procedure. However, with more rapid changes in
climate expected, elevational changes may occur more rapidly,
especially upward encroachment of forest species. Thus, moni-
toring techniques should be established to address the upward
encroachment expected from a warming climate without for-
getting to monitor potential downward changes or forest with-
drawal which may result from other factors such as disease or
other human induced influences.
Example of specific measurements for indicator: Monitoring el-
evational limits of forest species is easily done by establishing
markers (stakes and GPS) at representative timberline locations.
Aspect (compass direction) plays an important role in elevation
of timberline, thus markers should be at all aspects. Markers
should be place at the extent of any upward forest reproduction,
edge of mature forest, and highest elevation of krummholz patch-
es. The long-term aspect of timberline change does not require
frequent measurement, but annual (or 2-3 year) reconnaissance
of timberline edge relative to the markers is necessary.
c. Alpine plant community characteristicsResource Monitored: Alpine vegetation on different substrates in
the alpine zone.
Justification: The extreme environments of the alpine zone limit the
types of plants that can survive. In most cases alpine plants are
low in stature, often in cushions, or isolated in microhabitats
where environmental extremes are attenuated. Different alpine
plant communities occur on stable and unstable soils, the latter
being scree slopes and frost altered ground. Human activity, es-
pecially recreation, but also livestock use of alpine vegetation and
introduction of exotic plants, has modified alpine plant communi-
ties. These pressures will unlikely decrease and thus the alpine
plant community can be expected to decline in cover and vigor.
Once lost, alpine vegetation takes decades or more to reestablish.
Monitoring of select alpine plant communities may offer shorter
notice of change than casual observation of the alpine zone.
Comment: Monitoring alpine plant communities will require estab-
lishment of sampling locations in a variety of habitats. Some
habitats appear to be more stressed by human use and these
might have priority over others that continue to be unaltered.
However, assuming that some plant communities are more re-
sistant or resilient to human use and changes in other driving
variables such as changing climate should not cause these com-
munities to be omitted from a monitoring program. The interval
between monitoring for these plant communities might be lon-
ger than the more sensitive, less resistant communities.
Example of specific measurements for indicator: Establish ran-
domly selected quadrats (plots) on different alpine plant com-
munity types: meadow, scree slope, wind blown semi-barren
coarse soils, solifluction terraces, and high-organic wet soils,
and frost-boil areas. Set priorities on sensitivity of each type
based on literature and early monitoring. Monitor plant compo-
sition and cover (including density of patches where dispersed,
a form of frequency measurement). Monitoring should be done
annually until evidence of sensitivity is established and then
longer-term monitoring can be established for more resistant
and/or resilient plant community types.
LITERATURE CITEDLITERATURE CITED
Billings, W.D. 1973. Artic and alpine vegetations: similarities, differ-ences, and susceptibility to disturbance. BioScience 23:697-704.
Billings, W.D. 1974. Adaptations and origins of alpine plants. Arctic and Alpine Research 6:129-142.
Billings, W.D. 1988. Alpine Vegetation. Pages 392-420 in Barbour, M.G. and W.D. Billings (eds). North American Terrestrial Vegetation. Cam-bridge University Press, New York.
Caldwell, M.M., R. Robberecht, and W.D. Billings. 1980. A steep latitu-dinal gradient of solar ultra-violet-B readiation in the arctic-alpine life zone. Ecology 61:600-611.
Carerra, P.W., D.A. Trimble, and M. Ruben. 1991. Holocene treeline fluctuations in the northn San Juan Mountains, Colorado USA, as indi-cated by radiocarbon dated conifer wood. Arctic, Antarctic and Alpine Research 23:233-246.

42 • Appendix III: Conceptual Models
Cole, D.N. and C.A. Monz. 2002. Trampling disturbance of high-eleva-tion vegetation, Wind River Mountains, Wyoming, USA. Arctic, Antarc-tic and Alpine Research 34:365-376.
Graumlich, L.J. 1991. High-latitude tree-ring data: records of climatic change and ecological response. In G. Weller, C.L. Wilson, and B.A.B. Severin, eds., International Conference on the Role of the Polar Re-gions in Global Change, Geophysical Institute, University of Alaska, Fairbanks, Alaska, pp. 565-569.
Graumlich, L.J. 1994. Long-term vegetation change in mountain en-vironments: Paleoecological insights into modern vegetation dynam-ics. In Mountain Environments in Changing Climates, M. Beniston, ed., Routledge, London, pp. 167-179.
Griggs, R.F. 1956. Competition and succession on a Rocky Mountain fellfield. Ecology 37:8-20.
Hadley, J.L, and W.K. Smith. 1986. Wind effects on needles of timber-line conifers: Seasonal influence on mortality. Ecology 67:12-19.
Hartley, E.A. 1976. Man’s effects on the stability of alpine and subal-pine vegetation in Glacier National Park, Montana. Ph.D. dissertation, Duke University, Durham, N.C.
Hessl, A. and W.L. Baker. 1997. Spruce and fir regeneration and cli-mate in the forest-tundra ecotone of Rocky Mountain National Park, Colorado, USA. Arctic, Antarctic and Alpine Research 29:173-183.
Jackson, P.L. 1998. Spatial changes in alpine treeline vegetation pat-terns along hiking trails in Glacier National Park, Montana. M.S. The-sis. Oregon State University.
Johnson, P.L. and W.D. Billings. 1962. The alpine vegetation of the Beartooth Plateau in relation to cryopedogenic processes and patterns. Ecol. Monographs 32:105-135.
Kammer, P.M. and A Mohl. 2002. Factors controlling species richness in alpine plant communities: an assessment of the importance of stress and disturbance. Arctic, Antarctic and Alpine Research 34:398-407.
Kendall, K.C. and R.E. Keane. 2001. Whitebark pine decline: infection,mortality, and population trends. Pp 221-242 in D.F Tomback, S.F. Arno and R.E. Keane (eds). Whitebark Pine Communities: Ecology and Restoration. Island Press, Washington, DC
Klasner, F.L. and D.B. Fagre. 2002. A half century of change in alpine treeline patterns at Glacier National Park, Montana, USA. Arctic, Ant-arctic and Alpine Research 34:49-56.
Oberbauer, S.F. and W.D. Billings. 1981. Drought tolerance and water use by plants along an alpine topographic gradient. Oecologia 50:325-331.
Paulsen, J., U.M Weber, and C. Korner. 2000. Tree growth near treeline: abrupt or gradual reduction with altitude. Arctic, Antarctic and Alpine Research 32: 14-20).
.Scott, D. and W.D. Billings. 1964. Effects of environmental factors on standing crop and productivity of an alpine tundra. Ecol. Monographs. 34:243-270.
Tranquillini, W. 1979. Physiological ecology of the alpine timberline. Springer-Verlag, New York.
White, H. 1996. Ecological processes in the timberline ecotone. Web site www.connix.com/~harry/treeline.htm.

V
ital Signs Monitoring Plan • 43
Climate Geology Human Activity Biotic
Soil Frost Dynamics Scree Slope Dynamics Alpine Vegetation Dynamics
Exotic PlantsGrazingRecreationalTrampling Disease
Unstable SlopeVegetation
Alpine VegetationComposition
Alpine Meadow, Screeand Talus slope plantspecies composition,
density and cover(includes exotics)
WindTopography
(slope aspectand angle)
Short-term Hot/Cold Cycles and
SnowAccumulation
ReducedStratospheric
Ozone/Increasing UV
Radiation
CO2 PartialPressure
FIGUR E 3 General alpine model.
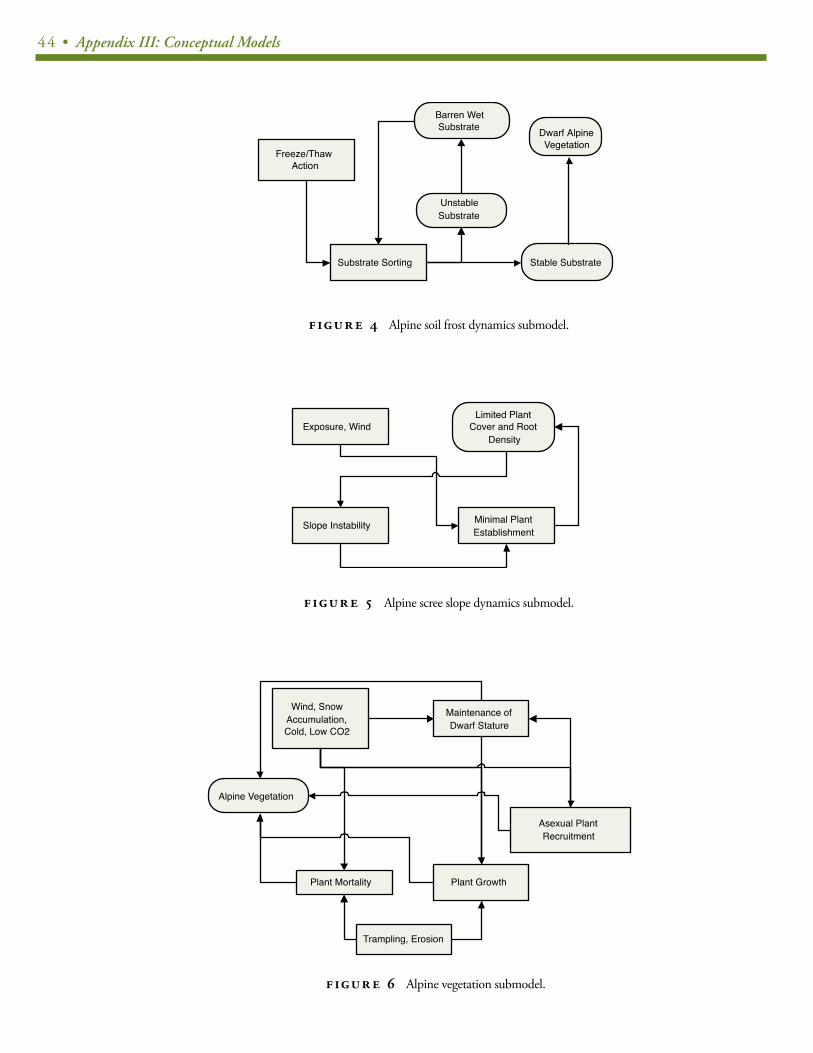
44 • Appendix III: Conceptual Models
Substrate Sorting
Freeze/ThawAction
Stable Substrate
Barren WetSubstrate Dwarf Alpine
Vegetation
UnstableSubstrate
FIGUR E 4 Alpine soil frost dynamics submodel.
Exposure, Wind
Slope Instability Minimal PlantEstablishment
Limited PlantCover and Root
Density
FIGUR E 5 Alpine scree slope dynamics submodel.
Wind, SnowAccumulation,Cold, Low CO2
Asexual PlantRecruitment
Maintenance ofDwarf Stature
Plant Growth
Trampling, Erosion
Plant Mortality
Alpine Vegetation
Alpine TimberlineAlpine Vegetation Submodel
FIGUR E 6 Alpine vegetation submodel.
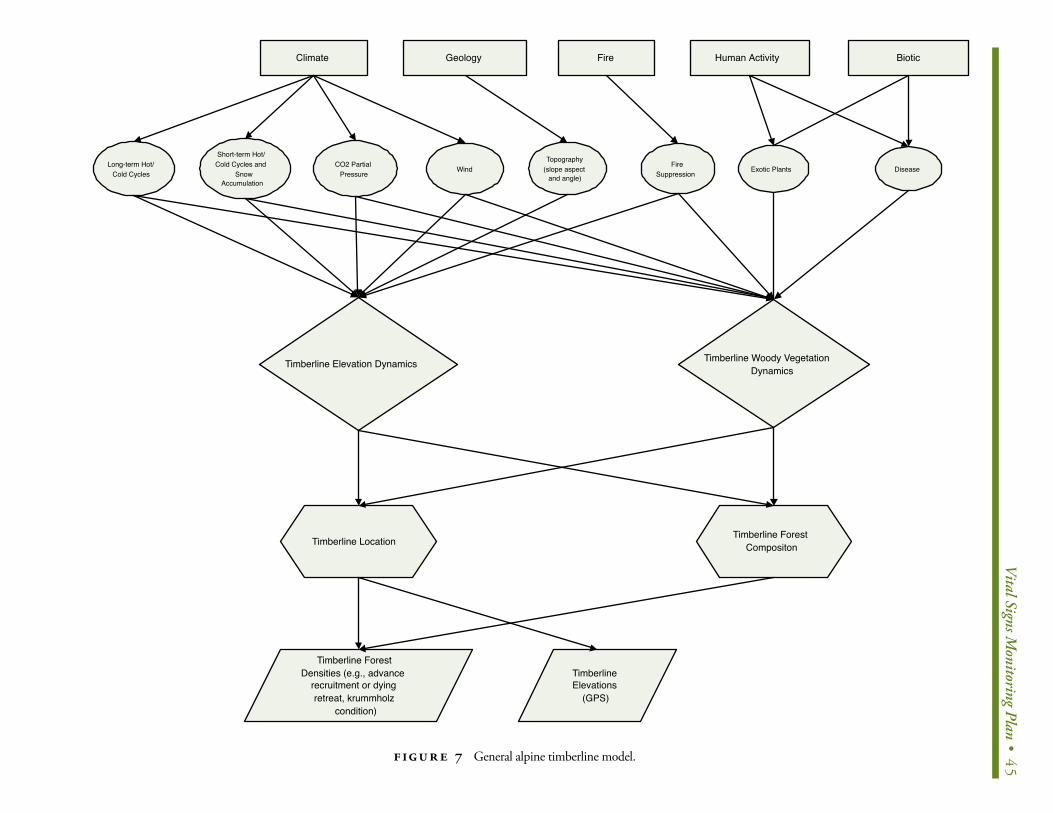
V
ital Signs Monitoring Plan • 45
Climate Geology Human Activity Biotic
Timberline Woody VegetationDynamics
Exotic Plants Disease
Timberline Location
Timberline ForestDensities (e.g., advance
recruitment or dyingretreat, krummholz
condition)
TimberlineElevations
(GPS)
Timberline ForestCompositon
WindLong-term Hot/Cold Cycles
Topography(slope aspect
and angle)
Timberline Elevation Dynamics
Short-term Hot/Cold Cycles and
SnowAccumulation
CO2 PartialPressure
Fire
FireSuppression
FIGUR E 7 General alpine timberline model.
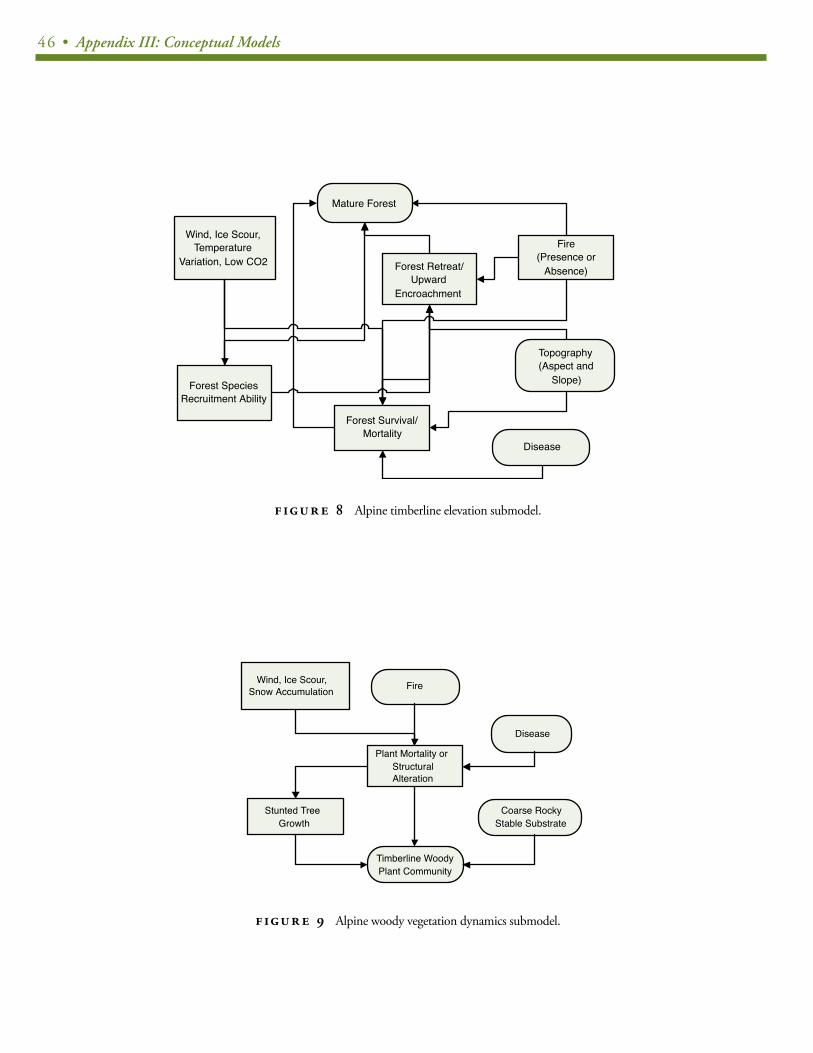
46 • Appendix III: Conceptual Models
Wind, Ice Scour,Temperature
Variation, Low CO2 Forest Retreat/Upward
Encroachment
Forest SpeciesRecruitment Ability
Forest Survival/Mortality
Fire(Presence or
Absence)
Mature Forest
Disease
Topography(Aspect and
Slope)
FIGUR E 9 Alpine woody vegetation dynamics submodel.
Wind, Ice Scour,Snow Accumulation
Stunted TreeGrowth
Plant Mortality orStructuralAlteration
Timberline WoodyPlant Community
Coarse RockyStable Substrate
Disease
Fire
FIGUR E 8 Alpine timberline elevation submodel.
Vital Signs Monitoring Plan • 47
ASPEN ECOSYSTEM NARRATIVE C O N C E P T UA L M O D E L
(authors: Duncan Patten and Dan Tinker)(authors: Duncan Patten and Dan Tinker)
Overview of Aspen Ecosystems
A. GENERAL CHARACTERISTICS OF ASPEN ECOSYSTEMS
Aspen (Populus tremuloides) is an important component of land-
scapes in the Greater Yellowstone Ecosystem (GYE), but is absent
or rare in the Bighorn Canyon region (Knight et al. 1987). Notably,
aspen is the only native upland deciduous tree found in Yellowstone
National Park (YNP). Aspen stands play important ecological roles,
supporting high numbers and diversity of breeding birds (DeByle
1985) and providing critical habitat and an important source of forage
for summer and winter browsing ungulates (Olmsted 1979). Aspen
stands throughout the GYE appear to have been declining through
the 20th century and the causes and consequences of this apparent
decline have caused considerable discussion (Schier 1975, Olmstead
1979, Bartos and Hinds 1985, Boyce 1989, Kay 1990, Bartos et al.
1994, Romme et al. 1995, Baker et al. 1997). In the northern range of
YNP, aspen occurs in relatively small stands and is associated with
more mesic conditions. However, aspen stands in the GYE are often
not as complex or robust as stands in the mid-intermountain regions
of Utah and Colorado (Mueggler 1988).
In the Rocky Mountain region and in the GYE, aspen is primar-
ily a clonal species which reproduces almost exclusively via root
sprouting and produces stands composed of stems from only one or
a few genetic individuals (Barnes 1966, McDonough 1985, Tuskan et
al. 1996). Aspen most commonly regenerates by means of vegeta-
tive sprouting from the root system following disturbances such as
fire that kills the mature trees (See also Aspen-Fire Dynamics Sub-
model). These shoots grow rapidly and rely upon the root system of
the parental tree for growth for the first 25 years (Zahner and DeByle
1965). However, rare episodes of seedling recruitment sometimes
occur (Jelinski and Cheliak 1992), including widespread establish-
ment of aspen seedlings in the GYE following the 1988 fires (Kay
1993, Romme et al. 1997, Stevens et al. 1999).
Aspen, like most Populus species, is recognized as a preferential
browse species for ungulates during the growing season and even
in winter (Olmstead 1979). In fact, in many parts of the GYE, elk
commonly browse nearly all root sprouts present in aspen stands
(Romme et al. 1995, Larsen and Ripple 1999). Several studies have
suggested that elk browsing is the primary cause for the lack of as-
pen regeneration in the GYE (Beetle 1974, 1979, Krebill 1972, Kay
1990, Bartos et al. 1994).
B. F IRE EFFECTS IN ASPEN ECOSYSTEMSFire is the primary disturbance agent in aspen forests of the GRYE,
where large, infrequent, stand-replacing fires dominate the fire re-
gime, and human efforts at fire suppression have historically had
little effect (Romme and Despain 1989). Because of its ability to re-
sprout following disturbance (See Aspen-Fire Dynamics Submodel),
fire often facilitates secondary succession and the reestablishment
of aspen. However, these stands are often eventually dominated by
lodgepole pine, Engelmann spruce, or subalpine fir after several de-
cades. Fire suppression in the GRYE may lead to a reduction in the
abundance and vigor of many of the aspen stands (Knight 1994).
Conceptual Model Development
A. DRIVERSClimate, working with soils and topography, creates appropriate site
conditions for establishment and/or maintenance of aspen commu-
nities. Aspen communities are found in mesic sites and may be in
riparian locations. Climate of the GRYE is characterized by long, cold
winters, and cool, dry summers. Much of the precipitation falls in the
form of snow and summers may be dry. Winter snowpack melts rap-
idly in May and June, wetting low areas and recharging groundwa-
ter which provides much of the water available for growth of aspen.
Seasonal drought, such as were experienced during the summer of
1988, may exert considerable influence on soil and fuel moisture, as
well as fire regimes which influence the presence of aspen.
Soils across GRYN area are diverse, a product of highly variable
parent materials. For example, soils across much of YNP are mostly
volcanic in origin, while glacial outwash and older Precambrian ma-
terial dominates the Grand Teton landscape (Knight 1994). In Yel-
lowstone, two different parent materials, derived from underlying
bedrock, determine the soil characteristics. Differences in these par-
ent materials lead to variation in soil texture, and therefore, water
holding capacity, as well as nutrient supply and availability (see Soil
and Ground Water Processes Submodel).
Fire is also an important driver in aspen ecosystems, and the man-
agement of prescribed fires and wildfires may greatly influence many
natural ecosystem processes. Aspen reproduction may be closely
aligned with fire dynamics (see Aspen-Fire Dynamics Submodel).
48 • Appendix III: Conceptual Models
Aspen is susceptible to several biotic drivers. The Browse Dynam-
ics Submodel illustrates how large ungulate herds, as well as domes-
tic animals in surrounding national forests, may utilize aspen shoots
and suckers for forage. Management policies of the ungulates may
influence the magnitude of impacts of herbivory. Other biotic drivers
include such phenomena as beaver dams, competition from vegeta-
tion (See Aspen/Vegetation Submodel), and insect herbivory. These
drivers may directly and indirectly affect many ecological processes
in aspen ecosystems as described below.
B. STRESSORS AND ECOLOGICAL RESPONSESBeaver dams may affect aspen growth and establishment through
herbivory and tree removal, as well as influencing availability of soil
and ground water, important components of mesic sites selected by
aspen. Herbivory of aspen sprouts and bark stripping by ungulates,
often the result of limited forage during severe winters, may greatly
reduce long-term establishment of mature aspen stands (Kay 1997).
Similarly, reduction in vigor of adult and sprout aspen is possible as
a result plant competition and of other forms of herbivory.
Wildfire affects many aspects of these ecosystems, including
both the volatization and creation of essential nutrients from the
organic materials combusted or consumed by fire (Knight et al. 1991).
Fires managed for fuel reduction or wildfires that are allowed to burn
will alter availability of aspen for forage, but also stimulate aspen
reproduction, both sexual and asexual.
Droughts, and other forms of wet and dry climatic cycles, affect
aspen systems directly through alteration of surface and ground
water processes, and the concomitant effects on plant growth and
reproduction (See Aspen Growth and Reproduction Submodel). Indi-
rectly, such climatic events may alter the establishment and survival
of aspen through impacts on natural fire dynamics.
C. INDICATORSMany non-vegetative components of aspen communities are impor-
tant indicators of community structure and function. The presence,
or relative abundance of some of the associated populations of
faunal assemblages such as songbirds, amphibians, or ungulates,
may serve as indicators of community integrity by their use of aspen
stands. The absence of some of these assemblages may represent a
decline in community health. Population estimates of selected ma-
jor taxa such as birds or ungulates, as well as measures of stand
use through behavioral studies, are useful measures for monitoring
these assemblages.
The structure and function of aspen communities is important for
understanding the condition of many aspen stands. For example, as-
pen may function as riparian species when elevated groundwater
levels create moist soil conditions. In drier areas, the size and abun-
dance of aspen sprouts and seedlings, which are rare, may serve
as indicators of future stand development. Given the abundance
and impact of large herbivores, and the rarity of establishment by
seed, aspen seedlings or sprouts that survive to heights greater than
browsing abilities of ungulates could signify significant recruitment
into new or mature stands.
Measuring browsing effects by both large and small herbivores
within mature aspen stands, as well as on new seedlings, provides
a quantitative assessment of impacts on aspen such as truncated
growth. These measures may also indicate the likelihood that root
sprouts and suckers or new seedlings will be recruited into an adult
growth form. Other browsing effects such as gnarling of mature
trees may quantify browsing pressure within specific stands.
Landscape-scale parameters such as the spatial pattern of aspen
stands across the GRYE, helps quantify and characterize heterogene-
ity in landscape structure, which influences many important ecosys-
tem functions. In addition, topographic and elevational analyses may
identify potential sites for future aspen recruitment by delineating
more potentially moist sites from drier sites.
1. Associated Animal PopulationsResource Monitored: Faunal community structure
Justification: Many non-vegetative components of aspen com-
munities are important indicators of community structure and
function. These components intimately occupy niches within
the aspen community and thus may change as the aspen com-
munity changes. The presence, or relative abundance of some
of the associated populations or faunal assemblages such as
songbirds, amphibians, or insects, may serve as indicators of
community integrity by their use of aspen stands. The absence
of some of these assemblages may represent a change or de-
cline in aspen community health.
Example of Specific Measurements of this Indicator: Population
estimates of selected major taxa such as birds, as well as mea-
sures of their use of particular stand structural niches.
2. Aspen community parametersResource Monitored: Ecosystem structure and function.
Justification: Aspen may function as riparian species when elevat-
Vital Signs Monitoring Plan • 49
ed groundwater levels create moist soil conditions. In addition,
the size and abundance of aspen sprouts and seedlings, which
are rare, may serve as indicators of future stand development.
Given the abundance and impact of large herbivores, and the
rarity of establishment by seed, aspen seedlings or sprouts that
survive to heights greater than browsing abilities of ungulates
could signify significant recruitment into new or mature stands.
Example of Specific Measurements of this Indicator: Belt transect
or quadrat estimates of sprout or seedling presence and size. As-
sociated measurements should include, soil moisture measure-
ments and community descriptions through plant surveys.
3. Browsing EffectsResource Monitored: Ecosystem structure
Justification: Measuring browsing effects by both large and small
herbivores within mature aspen stands, as well as on new seed-
lings, provides a quantitative assessment of impacts on aspen
such as truncated growth. These measures may also indicate
the likelihood that root sprouts and suckers or new seedlings
will be recruited into an adult growth form. Other browsing ef-
fects such as gnarling of mature trees may quantify browsing
pressure within specific stands.
Example of Specific Measurements of this Indicator: Repeated mea-
sures of sprout and seedling heights within a given stand or plot.
An alternative metric would be repeated measurements of percent
browsing on representatively selected sprouts and seedlings.
4. Landscape parametersResource Monitored: Ecosystem structure and function.
Justification: The spatial pattern of aspen stands across the Greater
Yellowstone landscape influences many important ecosystem
functions. In addition, topographic and elevational analyses
may identify potential sites for future aspen recruitment by de-
lineating moist sites from drier sites.
Example of Specific Measurements of this Indicator: Metrics
commonly quantified using landscape description software
(FRAGSTATS) and GIS. Vegetative cover most common base
map used.
LITERATURE CITED LITERATURE CITED
Baker, W. L., J. A. Munroe and A. E. Hessl. 1997. The effects of elk on aspen in the winter range of Rocky Mountain National Park. Ecography 20:155-165.
Barnes, B.V. 1966. The clonal growth habit of American aspens. Ecol-ogy 47:439-447.
Bartos, D.L., and W.F. Mueggler. 1981. Early succession in aspen com-munities following fire in western Wyoming. Journal of Range Man-agement 34:315-318.
Bartos, D. L., J. K. Brown, and G. D. Booth. 1994. Twelve years biomass response in aspen communities following fire. Journal of Range Man-agement 47:79-83.
Beetle, A.A. 1974. Range survey in Teton County, Wyoming. Part IV. Quaking aspen. University of Wyoming Agricultural Experiment Sta-tion SM 27, 28 p.
Beetle, A.A. 1979. Jackson Hole elk herd: a summary after 25 years of study. Pages 259-262 in: Boyce, M.S., and L.D. Hayden-Wing (editors), North American elk: ecology, behavior, and management. University of Wyoming, Laramie.
Boyce, M. S. 1989. The Jackson elk herd: intensive wildlife manage-ment in North America. Cambridge University Press, New York.
DeByle, N.V. 1985. Animal impacts. Pages 115-123 in: DeByle, N.V., and R.P. Winokur (editors), Aspen: ecology and management in the western United States. USDA Forest Service General Technical Report RM-119.
Hinds, T.E. 1985. Diseases. Pages 87-114 in N.V. DeByle and R.P. Win-okur, editors. Aspen: ecology and management in the western United States. USDA Forest Service, Rocky Mountain Forest and Range Ex-periment Station, General Technical Report RM-119.
Jelinkski, D.E. and W.M. Cheliak. 1992. Genetic diversity and spatial subdivision of Populus tremuloides (Salicaceae) in a heterogeneous landscape. American Journal of Botany 79:728-736.
Kay, C.E. 1990. Yellowstone Northern Elk Herd: a critical evaluation of the natural regulation paradigm. Dissertation, Utah State University, Logan Utah, 490 pp.
Kay, C.E. 1993. Aspen seedlings in recently burned areas of Grand Teton and Yellowstone National Parks. Northwest Science 67:94-104.
Kay, C.E. 1997. Is Aspen Doomed? Journal of Forestry 95: 4-11.
Knight, D.H. 1994. Mountains and plains: The ecology of Wyoming landscapes. Yale University Press, New Haven.
Knight, D.H., G.P. Jones, Y. Akashi, and R.W. Myers. 1987. Vegetation Ecology in the Bighorn Canyon National Recreation Area: Wyoming and Montana. University of Wyoming – National Park Service Re-search Center, Moran, WY. Final Report.
Knight, D.H., J.B. Yavitt, and G.D. Joyce. 1991. Water and nitrogen outflow from lodgepole pine forest after two levels of tree mortality. Forest Ecol. Mgmt. 46: 215-225.

50 • Appendix III: Conceptual Models
Krebill, R.G. 1972. Mortality of aspen on the Gros Ventre elk winter range. USDA Forest Service Research Paper INT-129.
Larsen, E.J. and W.J. Ripple. 1999. Remote sensing of aspen change in northern Yellowstone National Park. Pages xxx-xxx in H. J. Harlow and M. Harlow, editors. 21st Annual Report, University of Wyoming-National Park Service Research Center, Laramie, Wyoming.
McDonough, W.T. 1985. Sexual reproduction, seeds and seedlings. Pages 25-33 In N. V. DeByle and R. P. Winokus (eds). Aspen: ecology and management in the western United States. USDA Forest Service Gen. Tech. Rep. RM-119, Fort Collins, Colorado.
Olmstead, C.E.1979. The ecology of aspen with reference to utilization by large herbivores in Rocky Mountain National Park. Pages 89-97 in: M.S. Boyce and L. D. Hayden-Wing (editors), North American elk: ecol-ogy, behavior, and management. University of Wyoming, Laramie.
Romme, W.H., and D.G. Despain. 1989. Historical perspective on the Yellowstone fires of 1988. BioScience 39: 695-699.
Romme, W.H., M.G. Turner, L.L. Wallace, and J. Walker. 1995. Aspen, elk, and fire in northern Yellowstone National Park. Ecology 76: 2097-2106.
Romme, W.H., M.G. Turner, R.H. Gardner, W.W. Hargrove, G.A. Tuskan, D.G. Despain and R.Renkin. 1997. A rare episode of sexual reproduc-tion in aspen (Populus tremuloides Michx.) following the 1988 Yellow-stone fires. Natural Areas Journal 17: 17-25.
Schier, G.A. 1975. Deterioration of aspen clones in the middle Rocky Mountains. USDA Forest Service Research Paper INT-170.
Stevens, M.T., M.G. Turner, G.A. Tuskan, W.H. Romme, and D.M. Waller. 1999. Genetic variation in postfire aspen seedlings in Yellow-stone National Park. Molecular Ecology 8: 1769-1780.
Tuskan, G.A., K.E. Francis, S.L. Russ, M.G. Turner, and W.H. Romme. 1996. RAPD markers reveal diversity within and among clonal and seedling stands of aspen in Yellowstone National Park, U.S.A. Cana-dian Journal of Forest Research 26:2088-2098.
Zahner, R. and N.V. DeByle. 1965. Effect of pruning the parent root on growth of aspen suckers. Ecology 46:373-375.
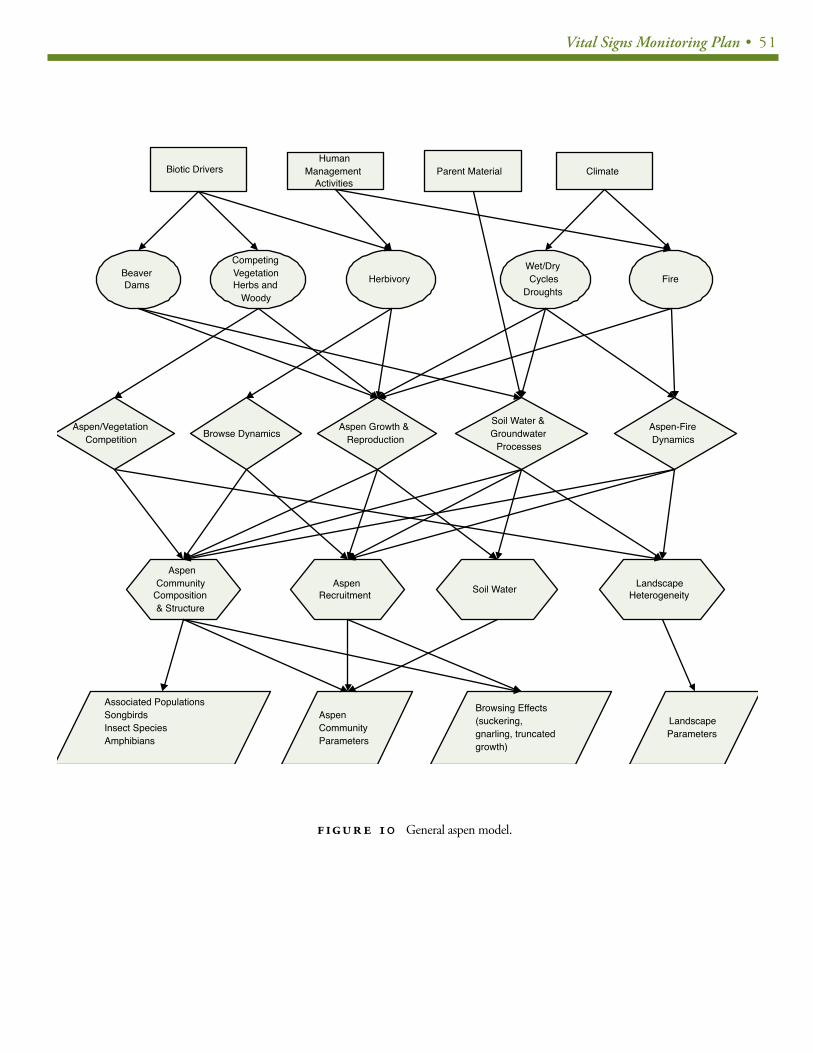
Vital Signs Monitoring Plan • 51
Aspen Communities
Herbivory
ClimateBiotic Drivers
Fire
Aspen Growth &Reproduction
Aspen-FireDynamics
Wet/DryCycles
Droughts
Soil Water
Soil Water &Groundwater
Processes
HumanManagement
Activities
AspenCommunity
Composition& Structure
Parent Material
LandscapeHeterogeneity
AspenRecruitment
BeaverDams
CompetingVegetationHerbs and
Woody
Aspen/VegetationCompetition Browse Dynamics
AspenCommunityParameters
Associated PopulationsSongbirdsInsect SpeciesAmphibians
LandscapeParameters
Browsing Effects(suckering,gnarling, truncatedgrowth)
FIGUR E 10 General aspen model.
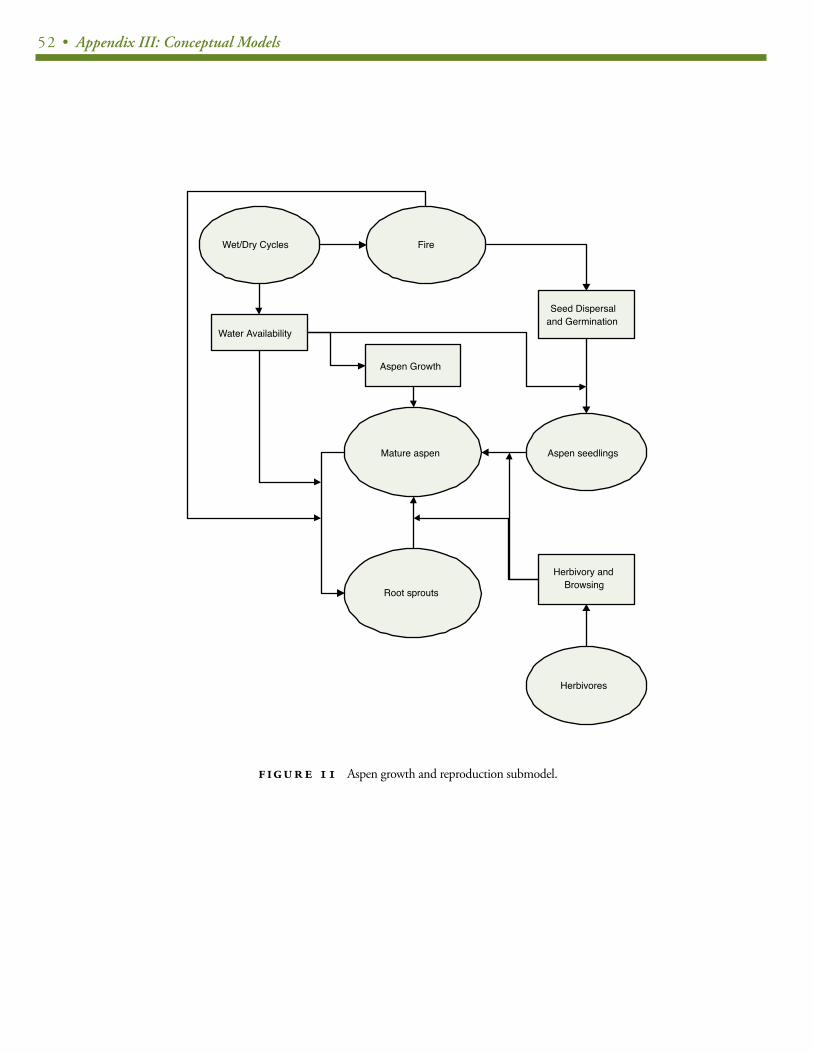
52 • Appendix III: Conceptual Models
Mature aspen
Root sprouts
Aspen seedlings
Herbivory andBrowsing
Herbivores
FireWet/Dry Cycles
Seed Dispersaland Germination
Water Availability
Aspen Growth
FIGUR E 11 Aspen growth and reproduction submodel.
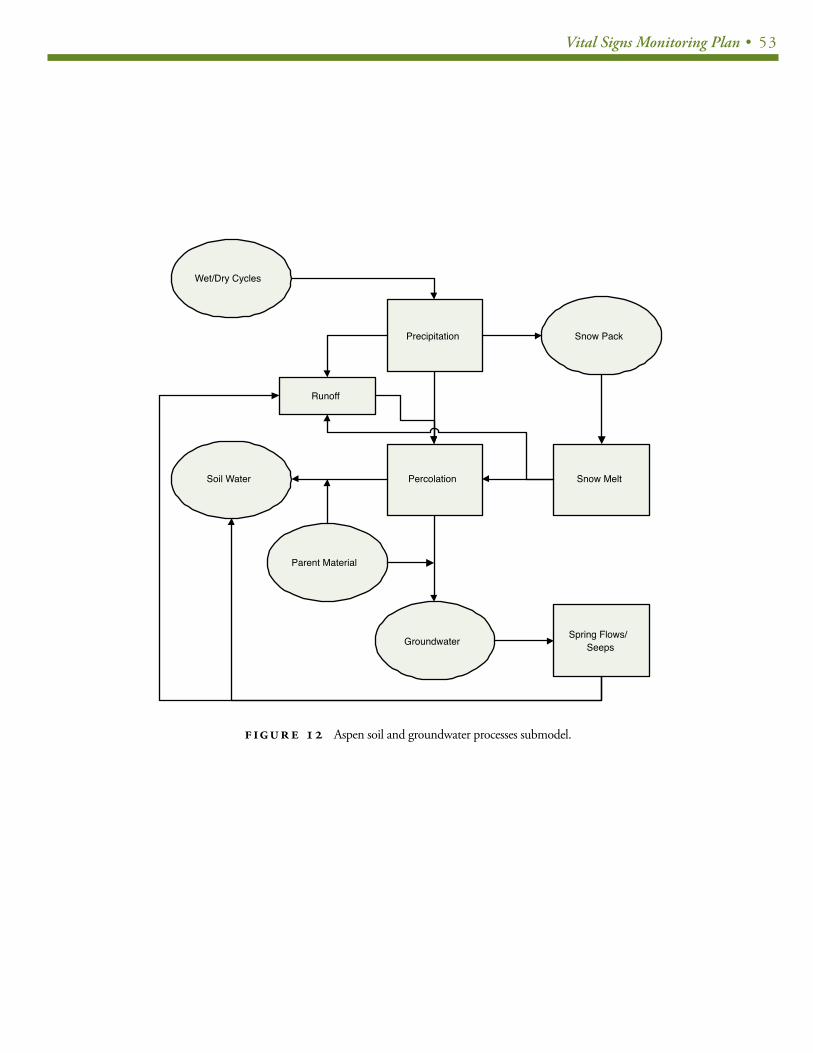
Vital Signs Monitoring Plan • 53
FIGUR E 12 Aspen soil and groundwater processes submodel.
Soil Water
Groundwater
Wet/Dry Cycles
Precipitation
Percolation
Parent Material
Spring Flows/Seeps
Snow Pack
Snow Melt
Runoff
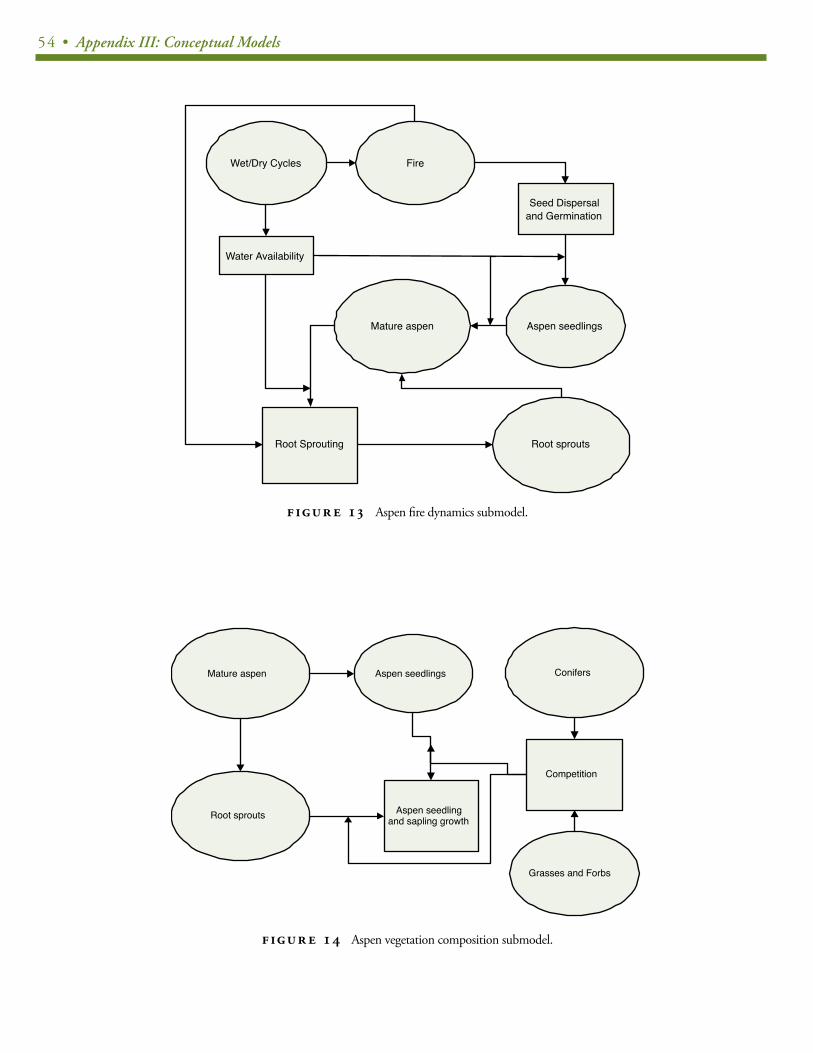
54 • Appendix III: Conceptual Models
Mature aspen
Root sprouts
Aspen seedlings Conifers
Grasses and Forbs
Aspen seedlingand sapling growth
Competition
FIGUR E 14 Aspen vegetation composition submodel.
Mature aspen
Root sprouts
Aspen seedlings
FireWet/Dry Cycles
Seed Dispersaland Germination
Water Availability
Root Sprouting
FIGUR E 13 Aspen fire dynamics submodel.

Vital Signs Monitoring Plan • 55
Mature aspen
Root sprouts
Aspen seedlings
Herbivory andBrowsing Ungulates
Beaver Insects
FIGUR E 15 Aspen browse dynamics submodel.

56 • Appendix III: Conceptual Models
D RY WO O D L A N D E C O S Y S T E M N A R R AT I V E C O N C E P T UA L M O D E L
(author: Cathie Jean)(author: Cathie Jean)
Dry Woodlands are a characteristic feature of Bighorn Canyon
National Recreation Area (BICA), occupying 40% of the land area
(Knight et al. 1987) between 1127–1545m elevation. Dry woodlands
in the Wyoming Basin are found on shallow, coarse-textured rocky
sites on fractured bedrock (Wight and Fisser 1968). This environment
has an inverse texture effect; roots penetrate deep in the fractured
bedrock to underground water sources.
Knight et al. (1987) divide the dry woodlands into three types,
mountain mahogany shrublands (Cercocarpus ledifolius), juniper
woodlands (Juniperus osteosperma) and juniper / mountain mahog-
any woodlands based solely on the abundance of dominant species.
Although the authors were unable to determine any environment
differences that could distinguish a juniper site from a mountain ma-
hogany site, the latter is more usually found on stepper, more barren
sites. All three types of woodlands are present on a variety of geo-
logic substrates (Knight et al. 1987). The dry woodland ecosystem as
described here also includes stands of limber pine (Pinus flexilis) and
Rocky Mountain juniper (Juniperus scopulorum).
The juniper zone is often considered low value but, nevertheless,
it is an important component of the range complex by providing for-
age and shelter for wild game. The dry woodland ecosystem is im-
portant wildlife habitat for bighorn sheep (Ovis canadenis) mule deer
(Odocoileus hemionus) and feral horses (Equus caballus). Dry wood-
lands provide thermal cover for wildlife, although a dense woodland
cover is a barrier to bighorn sheep as sheep are more secure in open
habitats where they can see predators.
Bighorn sheep reintroduction efforts in the Bighorn and Pryor
Mountains and surrounding areas by the Wyoming Department of
Game and Fish and subsequent dispersal from translocations have
resulted in the Bighorn Canyon bighorn sheep population (Sloan 1995
as cited in Gudorf et al. 1996). These sheep occupy areas adjacent
and within the dry woodland ecosystem.
DriversDry woodlands were formally restricted to rocky – fire free settings –
largely controlled by geology and topographic position. Modern dis-
tribution of juniper species is traditionally attributed to overgrazing
and fire suppression, however historic invasions could also mark the
current progress of continued migration resulting from climate fluc-
tuation (Betancourt 1987).
Drought in combination of fire suppression and grazing favor an
increase in juniper cover and invasion into new sites. Grass and
shrublands are vulnerable to juniper invasion, especially where her-
bivory results in a decrease of palatable plants which can lead to an
increase of woody species or where herbivory results in the redistri-
bution of fine fuels (Waugh 1986 as cited in Knight et al 1987) and
a subsequent change in burn patterns. Fire suppression can acceler-
ate succession grassland or shrublands to woodlands in two ways:
directly preventing mortality in young, more easily burned juniper
stands and indirectly by favoring the development of shrublands that
serve as nurse plants for juniper seedling survival (Wright et al 1979).
Once juniper is established, it is self-perpetuating as it competes
well for available light, water and nutrients.
Stressors and Ecological Responses
A. F IRE SUPPRESSION AND GRAZING: Fire suppression and grazing of palatable plants can lead to an in-
crease in juniper cover and invasion of juniper into grassland and
shrublands. This phenomenon is documented throughout the west-
ern states (see Burkhardt and Tisdale 1976). Furthermore, grasses are
reduced due to juniper invasion (Jameson 66, 70 as cited in Knight et
al 1987) and quality forage habitat for Bighorn Sheep and other wild-
life is diminished. Low forage availability creates a need for Bighorn
Sheep to forage further from escape terrain, thus increasing suscep-
tibility to predators. Juniper leaf litter is high in phytotoxic chemicals
(Jameson, 66, 70 as cited in Knight et al 1987) and this may further
restrict available forage.
B. HUMAN ACTIVITIES AND LAND MANAGEMENT: The decline and elimination of bighorn sheep from most of their his-
torical range (Buechner 1960 as cited in Gudorf et al 1996), during
the past century is believed to be attributed to human activities and
land management practices that alter bighorn sheep habitat (Gudorf
et al 1996). The steep, rugged escape terrain in Bighorn Canyon and
its tributaries are a critical feature of bighorn sheep habitat. The
openness of plant communities, or horizontal visibility, is fundamen-
tal determinant of bighorn sheep habitat quality (Gudorf et al 1996).
Natural succession of dry woodlands into these habitats will make
them increasingly less suitable for bighorn sheep as the thicker veg-
etation will obscure visibility and reduce forage availability.
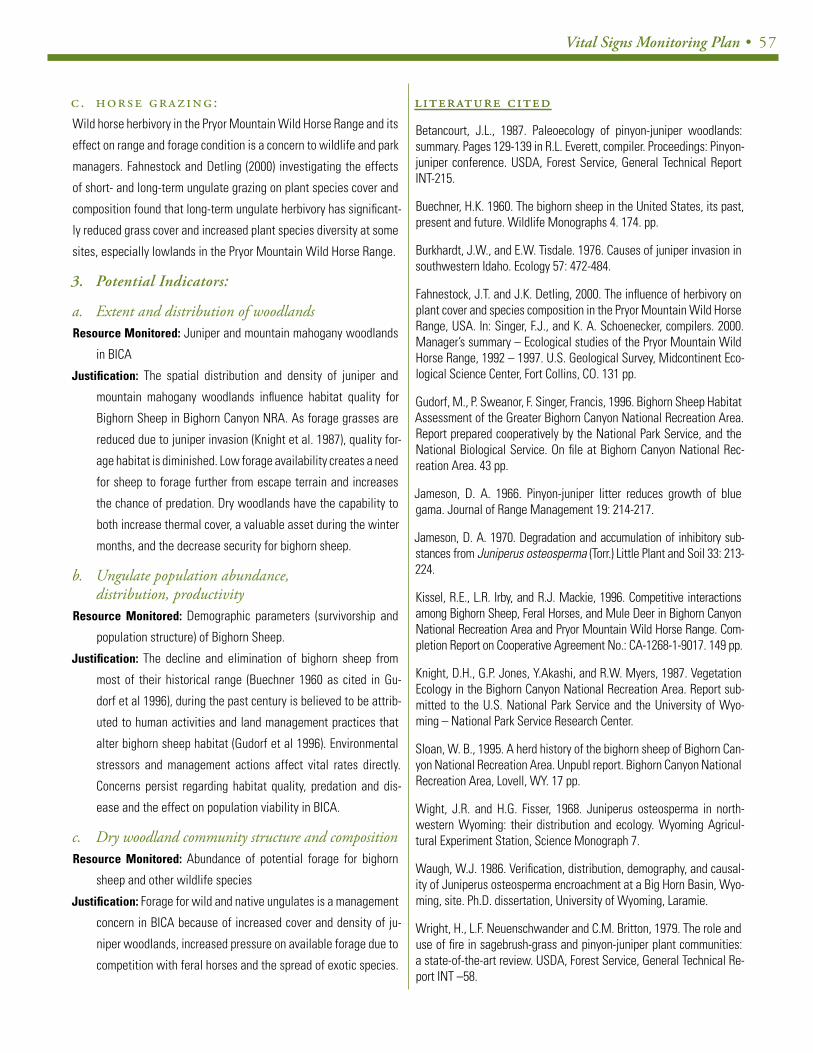
Vital Signs Monitoring Plan • 57
C. HORSE GRAZING: Wild horse herbivory in the Pryor Mountain Wild Horse Range and its
effect on range and forage condition is a concern to wildlife and park
managers. Fahnestock and Detling (2000) investigating the effects
of short- and long-term ungulate grazing on plant species cover and
composition found that long-term ungulate herbivory has significant-
ly reduced grass cover and increased plant species diversity at some
sites, especially lowlands in the Pryor Mountain Wild Horse Range.
3. Potential Indicators:
a. Extent and distribution of woodlandsResource Monitored: Juniper and mountain mahogany woodlands
in BICA
Justification: The spatial distribution and density of juniper and
mountain mahogany woodlands influence habitat quality for
Bighorn Sheep in Bighorn Canyon NRA. As forage grasses are
reduced due to juniper invasion (Knight et al. 1987), quality for-
age habitat is diminished. Low forage availability creates a need
for sheep to forage further from escape terrain and increases
the chance of predation. Dry woodlands have the capability to
both increase thermal cover, a valuable asset during the winter
months, and the decrease security for bighorn sheep.
b. Ungulate population abundance, distribution, productivity
Resource Monitored: Demographic parameters (survivorship and
population structure) of Bighorn Sheep.
Justification: The decline and elimination of bighorn sheep from
most of their historical range (Buechner 1960 as cited in Gu-
dorf et al 1996), during the past century is believed to be attrib-
uted to human activities and land management practices that
alter bighorn sheep habitat (Gudorf et al 1996). Environmental
stressors and management actions affect vital rates directly.
Concerns persist regarding habitat quality, predation and dis-
ease and the effect on population viability in BICA.
c. Dry woodland community structure and compositionResource Monitored: Abundance of potential forage for bighorn
sheep and other wildlife species
Justification: Forage for wild and native ungulates is a management
concern in BICA because of increased cover and density of ju-
niper woodlands, increased pressure on available forage due to
competition with feral horses and the spread of exotic species.
LITERATURE CITEDLITERATURE CITED
Betancourt, J.L., 1987. Paleoecology of pinyon-juniper woodlands: summary. Pages 129-139 in R.L. Everett, compiler. Proceedings: Pinyon-juniper conference. USDA, Forest Service, General Technical Report INT-215.
Buechner, H.K. 1960. The bighorn sheep in the United States, its past, present and future. Wildlife Monographs 4. 174. pp.
Burkhardt, J.W., and E.W. Tisdale. 1976. Causes of juniper invasion in southwestern Idaho. Ecology 57: 472-484.
Fahnestock, J.T. and J.K. Detling, 2000. The influence of herbivory on plant cover and species composition in the Pryor Mountain Wild Horse Range, USA. In: Singer, F.J., and K. A. Schoenecker, compilers. 2000. Manager’s summary – Ecological studies of the Pryor Mountain Wild Horse Range, 1992 – 1997. U.S. Geological Survey, Midcontinent Eco-logical Science Center, Fort Collins, CO. 131 pp.
Gudorf, M., P. Sweanor, F. Singer, Francis, 1996. Bighorn Sheep Habitat Assessment of the Greater Bighorn Canyon National Recreation Area. Report prepared cooperatively by the National Park Service, and the National Biological Service. On file at Bighorn Canyon National Rec-reation Area. 43 pp.
Jameson, D. A. 1966. Pinyon-juniper litter reduces growth of blue gama. Journal of Range Management 19: 214-217.
Jameson, D. A. 1970. Degradation and accumulation of inhibitory sub-stances from Juniperus osteosperma (Torr.) Little Plant and Soil 33: 213-224.
Kissel, R.E., L.R. Irby, and R.J. Mackie, 1996. Competitive interactions among Bighorn Sheep, Feral Horses, and Mule Deer in Bighorn Canyon National Recreation Area and Pryor Mountain Wild Horse Range. Com-pletion Report on Cooperative Agreement No.: CA-1268-1-9017. 149 pp.
Knight, D.H., G.P. Jones, Y.Akashi, and R.W. Myers, 1987. Vegetation Ecology in the Bighorn Canyon National Recreation Area. Report sub-mitted to the U.S. National Park Service and the University of Wyo-ming – National Park Service Research Center.
Sloan, W. B., 1995. A herd history of the bighorn sheep of Bighorn Can-yon National Recreation Area. Unpubl report. Bighorn Canyon National Recreation Area, Lovell, WY. 17 pp.
Wight, J.R. and H.G. Fisser, 1968. Juniperus osteosperma in north-western Wyoming: their distribution and ecology. Wyoming Agricul-tural Experiment Station, Science Monograph 7.
Waugh, W.J. 1986. Verification, distribution, demography, and causal-ity of Juniperus osteosperma encroachment at a Big Horn Basin, Wyo-ming, site. Ph.D. dissertation, University of Wyoming, Laramie.
Wright, H., L.F. Neuenschwander and C.M. Britton, 1979. The role and use of fire in sagebrush-grass and pinyon-juniper plant communities: a state-of-the-art review. USDA, Forest Service, General Technical Re-port INT –58.
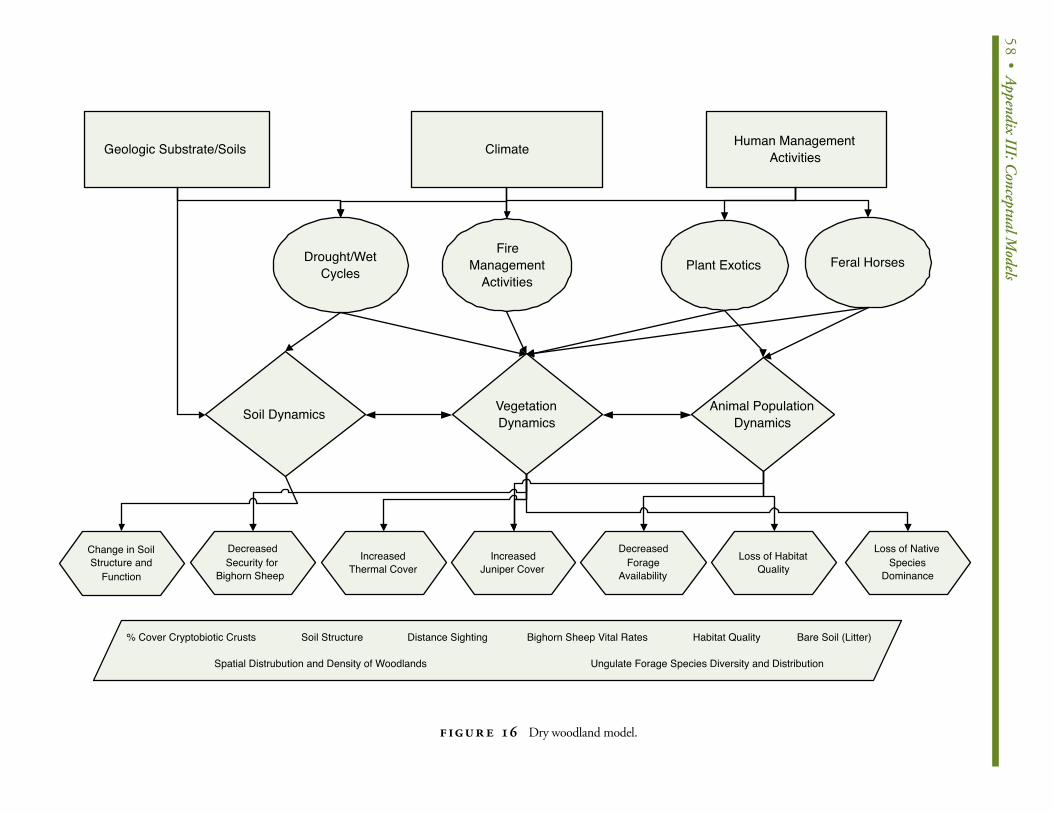
58• Appendix III: C
onceptual Models
Geologic Substrate/Soils Climate Human ManagementActivities
Drought/WetCycles Plant Exotics Feral Horses
FireManagement
Activities
Soil Dynamics VegetationDynamics
Animal PopulationDynamics
Change in SoilStructure and
Function
Loss of NativeSpecies
Dominance
Loss of HabitatQuality
DecreasedForage
Availability
IncreasedJuniper Cover
IncreasedThermal Cover
DecreasedSecurity for
Bighorn Sheep
% Cover Cryptobiotic Crusts
Ungulate Forage Species Diversity and DistributionSpatial Distrubution and Density of Woodlands
Bighorn Sheep Vital RatesDistance Sighting Habitat QualitySoil Structure Bare Soil (Litter)
FIGUR E 16 Dry woodland model.
Vital Signs Monitoring Plan • 59
G E OT H E R M A L E C O S Y S T E M N A R R AT I V E C O N C E P T UA L M O D E L
(authors: Hank Heasler and Cheryl Jaworowski)(authors: Hank Heasler and Cheryl Jaworowski)
In this paper, we present two conceptual models: a geologic con-
ceptual model and a vital signs conceptual model. The geologic con-
ceptual model of Yellowstone’s geothermal system and processes is
well understood. Among geologists, it is standard practice to draw
schematic or geologic cross sections of the Earth that summarize
geologic knowledge and earth processes. In geologic cross sections
or schematic diagrams, the bottom of the diagram shows the deep-
est portion of the Earth and the top of the diagram represents the
Earth’ surface. In contrast, the vital signs conceptual model places
Yellowstone’s magma chamber (deepest portion of the Earth) at the
top of the diagram as the driver for the model. We inverted the well-
accepted geologic conceptual model of Yellowstone and generated
a vital signs conceptual model that integrates with ecological con-
ceptual models of Yellowstone.
Geological Conceptual ModelThe geologic conceptual model of Yellowstone’s geothermal system
is well documented (Fournier and others, 1994; Smith and Siegel,
2000; White and others 1975). A partially molten (10-30% molten)
magma chamber (45 by 30 miles wide and 3-8 miles deep) exists
beneath Yellowstone National Park (Smith and Siegal, 2000). The
magma chamber beneath Yellowstone National Park is in contact
with a self-sealing high temperature and high concentration brine
(See Figure 17). The brine exits in a porous rock layer between 1.5
to 3 miles deep. This tectonically sensitive brine may leak geother-
mal fluids to a high temperature reservoir. Geothermal fluids from
the high temperature (~350°C) reservoir may discharge directly to
the surface as hydrothermal features with unusual chemistry such
as Beryl Springs. Or fluids from the high temperature reservoir may
first discharge to medium temperature reservoirs (~250°C) and sub-
sequently to the Earth’s surface as neutral chloride springs. Medium
temperature reservoirs may discharge fluids (water or gases) to low
temperature (~150°C) reservoirs. Low temperature reservoirs may
discharge fluids (water or gases) to the Earth’s surface and form acid
sulfate springs. Precipitation of silica and zeolites along fractures
provides a self-sealing mechanism. The competing effects of a self-
sealing mechanism and earthquakes control the upflow of geother-
mal fluids to reservoirs.
Acid sulfate thermal springs, neutral chloride thermal springs,
mud pots, paint pots geysers, or fumaroles exist where there is an
appropriate combination of water chemistry, plumbing, heat, and hy-
drology. Neutral chloride springs represent unrestricted discharge of
thermal waters from reservoirs. Above the local water table where
there is more heat than water, steam vents to the surface forming
fumaroles. At the Earth’s surface, oxidation of H2S will form acid
sulfate springs. Additionally, acidic waters will cause chemical de-
composition of the bedrock, generate clay minerals and form mud
pots or paint pots (with ferric-oxides). A key to understanding the
geochemistry of thermal waters in the Upper Geyser Basin is knowl-
edge of dissolved gases such as CO2 (Fournier and others, 1994). In
the Upper Geyser Basin, the amount of boiling (no boiling to maxi-
mum boiling) in the intermediate reservoirs determines the chemi-
cal composition of thermal waters in the shallow, low temperature
reservoirs and ultimately the geochemistry of thermal springs at the
Earth’s surface. Annual, generally widespread changes in thermal
features in the Norris Geyser Basin are the result of changes in the
potentiometric surface of cold water adjacent to or interconnected
with the hydrothermal system (Fournier and others, 2002). Thus, to
understand short-term cyclical and catastrophic changes as well as
long-term changes that may be natural or anthropogenic to the Yel-
lowstone hydrothermal system both cold ground water and hydro-
thermal systems the must be monitored and assessed.
Rainfall and snowmelt (meteoric waters) from the Earth’s surface
may recharge fluids in the low temperature, medium temperature
or high temperature reservoirs. The amount of meteoric waters en-
tering the various subsurface reservoirs depends upon the amount
of precipitation falling over the Yellowstone National Park. During
times of glaciation, the balance between meteoric waters entering
subsurface reservoirs and fluids from the magma chamber changes.
During the last glacial maximum (Pinedale), geochemical evidence
indicates that cold-water recharge entered the hydrothermal system
(Fournier and others, 1994). As the glaciers melted, fluid flow re-
versed and became a hydrothermal system dominated by discharge.
Changes in the magma chamber itself also affect the release of geo-
thermal waters and gases. Thus, monitoring hydrothermal waters in
Yellowstone’s geyser basins will yield information about the mixing
of fluids and the health of the geothermal system.
60 • Appendix III: Conceptual Models
Vital Signs Conceptual Model
A. THE DRIVER: YELLOWSTONE’S MAGMA CHAMBER
Yellowstone’s magma chamber is the ultimate geophysical driver of the
vital signs conceptual model (See Figure 27). Geothermal fluids convect
towards the surface via fracture systems that are self-sealing and tec-
tonically sensitive. Geothermal fluids from deep, intermediate and shal-
low depths mix and interact with meteoric waters and eventually are
discharged as hydrothermal features in Yellowstone’s geyser basins.
B. STRESSORSPrecipitation, climate change, volcanic activity, earthquakes and hu-
man activity affect thermal feature chemistry, thermal feature extent,
hydrothermal fluids, and thermal feature temperature. Yellowstone
National Park has two distinct climates within YNP (Despain, 1987)
and YNP is located near the boundary between regional atmospheric
flow patterns. Depending upon where this boundary is located the
annual climate and precipitation may be above or below normal pre-
cipitation in different areas of the park. Climate and weather (pre-
cipitation) directly influence the amount of “cold” meteoric waters
in thermal areas. Earthquakes and volcanic activity can rejuvenate
thermal features by opening new pathways for fluids or close exist-
ing thermal pathways. Human activities such as geothermal devel-
opment, oil & gas exploration, the drilling and production of water
wells or vandalism may affect the fluid flow of thermal features.
C. EFFECTSStressors affect changes in the chemistry of thermal features, extent
of thermal features, fluid flow, and temperature of thermal features.
D. OUTCOMESAcid sulfate thermal springs, neutral chloride thermal springs, mud
pots, geysers, fumaroles and heated ground are consequences of
Yellowstone’s magma chamber and its stressors.
Measures or Vital Signs
The following vital signs are measures of Yellowstone’s geothermal
systems: chloride flux, the temperature of well waters, water levels
in wells, the spatial extent of features, and the heat flux.
E. VITAL S IGNS
1. Chloride FluxOver 94% of the chloride in waters originating in Yellowstone is of
magmatic origin (Norton and Friedman, 1985). A study of variations
in chloride flux can be used to establish a baseline for measuring the
interaction of the deep geothermal waters with the surficial geother-
mal system. In addition, chloride flux baseline information may be
used to assess any future adverse impacts on the Park’s thermal fea-
tures that may be caused by commercial development of geothermal
energy, gas, oil and groundwater adjacent to the Park.
Resource Monitored: Thermal Features (mud pots, geysers, fumaroles,
neutral chloride thermal springs and acid sulfate thermal springs)
Justification: The chloride flux method for estimating geothermal
activity in YNP has been extensively peer reviewed, accepted,
and published (Fournier and others, 1976, Norton and Fried-
man, 1985; Friedman and Norton, 1990; Norton and Friedman,
1991; and Friedman and others, 1993). In addition, 19 years of
chloride flux data exists for Yellowstone’s major rivers-the Fall,
Madison, Snake, and Yellowstone.
2. Heat FluxYellowstone’s heat flux has been estimated using the chloride flux
method, airborne sensors and satellite images. Increased heat flux
in an area may indicate changes in subsurface hydrothermal activity.
Additionally, warm ground affects the health of vegetation, migra-
tion of animals, and safety of park visitors.
Resource Monitored: Heated Ground
Justification: The chloride flux method for estimating heat flux in
YNP has been extensively peer reviewed, accepted, and pub-
lished (Fournier and others, 1976, Norton and Friedman, 1985;
Friedman and Norton, 1990; Norton and Friedman, 1991; and
Friedman and others, 1993). Remote sensing is a cost-efficient
method to map and monitor heated ground. In the early days of
remote sensing, Haze (1971) estimated heat flow and geother-
mal resources. In 2002, Watson and others used Landsat 7 sen-
sors to estimate ground that was snow-free or minimal snow
cover due to thermal activity. In the winter and spring, animals
make use of thermal areas with minimal snow cover. In 2002,
thermal airborne sensors were flown over the Mammoth-Nor-
ris corridor. Mapping new areas of heated ground and yearly
changes in the heated ground can assist with maintenance of
roads and visitor safety.
3. Temperature of Water in Wells In Yellowstone National Park, water can come from several sources:
a high temperature, deep reservoir (~350°C), medium temperature,
intermediate depth reservoirs (~250°C), or low temperature, shallow
reservoirs (~150°C). Water from the high temperature reservoir di-
Vital Signs Monitoring Plan • 61
rectly connected to the magma chamber may be discharged as the
unique thermal feature known as Beryl Springs. Water from medium
temperature reservoirs may be directly discharged to the surface and
form neutral chloride thermal features or flow to low temperature
reservoirs. Water from the low temperature reservoirs may be di-
rectly discharged to the surface and form acid sulfate springs.
Resource Monitored: Groundwater system associated with thermal
features
Justification: In Yellowstone, human activities such as road con-
struction can adversely impact unique thermal features such
as Beryl Springs or the many neutral chloride and acid sulfate
springs. Potential threats outside of Yellowstone (geothermal
development, oil and gas development, groundwater develop-
ment) may also affect Yellowstone’s thermal features.
4. Water Level in WellsWater levels in wells respond to variations in climate, precipitation,
geothermal development or development of petroleum resources ad-
jacent to the Yellowstone National Park. Monitoring of water levels
in wells will capture changes in the groundwater system. Compari-
son of water levels with meteorological data, seismic data, ground
deformation or recent earthquakes will aid in distinguishing natural
changes in thermal features from climatic change or human causes
(geothermal, oil or gas wells outside of Yellowstone).
Resource Monitored: Groundwater system associated with thermal
features
Justification: Comparison of water levels in wells will aid in dis-
tinguishing natural changes in thermal features from climatic
change or human causes (geothermal development, oil or gas
wells, groundwater development).
5. Spatial Extent of Thermal FeaturesGeologists use various visible, infrared, and microwave sensors to
map surficial deposits, flow structures in lava flows, faults, fractures,
ash flows, basalts, rhyolites, andesites, and allow lithologic discrimi-
nation of sedimentary rocks. Additionally, visible, infrared, thermal
and microwave sensors (AVIRIS, TIMS, LANDSAT and RADAR) can
detect subsidence, predict movements of animals, discriminate be-
tween healthy versus stressed vegetation, map active hot springs,
map hydrothermal mineralization, and generate detailed mineral
maps of specific areas (Dzurisin and others, Evans, 1988; 1990; Ko-
kaly and others 1998; Kokaly and others 1999; Kruse, 1997, Shafer,
1998; Wicks and others, 1998).
Resource Monitored: Thermal features (mud pots, geysers, fumaroles,
neutral chloride thermal springs and acid sulfate thermal springs)
Justification: Remote sensing technologies are a cost-efficient
method of mapping and monitoring the spatial extent of ther-
mal features. Change detection maps of thermal features can
aid the assessment of natural changes versus human-caused
changes of thermal areas. Maps derived from remote sensing
technologies have applications to geology, hydrology, geobiolo-
gy, archeology, and ecology. Additionally, these colorful images
can be used by park interpreters to educate visitors and by park
managers to inform politicians or other resource managers.
F. SUMMARYWe propose to monitor the following vital signs as indicators of the
thermal activity and integrity of Yellowstone’s geothermal areas: (1)
chloride flux, (2) the temperature of water wells, (3) water levels in
wells, (4) the spatial extent of thermal features, and (5) heat flux.
A more complete discussion of methodology proposed for moni-
toring Yellowstone National Park’s geothermal resources can be
found in the draft version of “A Geothermal Monitoring Plan for Yel-
lowstone National Park”, March 2003 by H. Heasler, C. Jaworowski,
and D. Susong.
LITERATURE CITEDLITERATURE CITED
Despain, D.G., 1987, The two climates of Yellowstone National Park: Proceedings. Montana. Academy of Science, 47, p. 11-20.
Dzurisin, D., Savage, J., and Fournier, R., 1990, Recent Crustal Subsid-ence at the Yellowstone Caldera: Journal of Geophysical Research, 98, p. 4993-5001. (SAR)
Fournier, R.O., Christiansen, R.L., Hutchinson, R.A., and Pierce, K.L., 1994, A Field Trip Guide to Yellowstone National Park, Wyoming, Mon-tana, and Idaho-Volcanic, Hydrothermal and Glacial Activity in the Re-gion: U.S. Geological Survey Bulletin 2099, 46 p.
Fournier, R.O., White, D.D., and Truesdell, A.H., 1976, Convective heat flow in Yellowstone National Park, Proceedings U.N. Symposium on the Development and Uses of Geothermal Resources, San Francisco, CA, v. 1, p. 731-739.
Fournier, R.O., Weltman, D., Counce C., White, L.D., and Janik, C.J., 2002, Results of weekly chemical and isotopic monitoring of selected springs in Norris Geyser Basin, Yellowstone National Park during June-September, 1995: U.S. Geological Survey Open-File Report 02-344, 49 p.
Friedman, I., 1994, Possible effect of geothermal development on Yel-lowstone National Park. GSA Today p. 291-299.

62 • Appendix III: Conceptual Models
Friedman, I., Norton, D. R., Hutchinson, R. A., 1988, Monitoring of ther-mal activity in southwest Yellowstone National Park, Open-File Report 88-532.
Friedman, I., and Norton, D. R., 1990, Anomalous chloride flux dis-charges from Yellowstone National Park, Journal of Volcanology and Geothermal Research, p. 225-234.
Friedman, I., and Norton, D. R. Is Yellowstone losing its steam?: Chlo-ride flux out of Yellowstone National Park. Chapter in USGS Prof. Paper, in prep.
Hamilton, W.L. 1987, Water level records used to evaluate deforma-tion within the Yellowstone caldera, Yellowstone National Park: Jour-nal of Volcanology and Geothermal Research, 31, p. 205-215.
Haze, H., 1971, Surface heat flow studies for remote sensing of geothermal resources in Proceedings of the 7th International Symposium on Remote Sensing of the Environment, V.I, 17-21 May 1971, p.23-242.
Kruse, F.A., 1997, Characterization of Active Hot Springs Environments Using Multispectral and Hyperspectral Remote Sensing, in Proceedings for Twelfth International Conference and Workshops on Applied Geologic
Remote Sensing, November 17-18, 1997, Denver CO, V.I, p. 214-221.
Norton, D. R. and Friedman, I., 1985, Chloride flux out of Yellowstone National Park: Journal of Volcanology and Geothermal Research, v. 26, p. 231-250.
Norton, D. R., Friedman, I., Mohrman, J., and Hutchinson, R. A., 1989, Monitoring of thermal activity in the northern part of Yellowstone Na-tional Park, Open File Report 89-211.
Smith, Robert B. and Siegel, L.J., 2000, Windows into the Earth-The Geologic Story of Yellowstone and Grand Teton National Parks: Oxford University Press, 242 p.
Wicks, Jr., C., Thatcher, W., and Dzurisin, 1998, Migration of fluids be-neath Yellowstone caldera inferred from satellite radar interferometry: Science, v. 282, p. 458-462.
White D.E., Fournier, R.O., Muffler, LJ.P., and Truesdell, A.H.,1975, Physical results of research drilling in thermal areas of Yellowstone National Park, Wyoming: U.S. Geological Survey Professional Paper 892, 70 p.
Magma Chamber
Precipitation Human ActivitiesWater,
Geothermal, Oilor Gas Wells
Climate ChangeGroundDeformationEarthquakesVolcanism
Changes in ThermalFeature Chemistry
Changes in ThermalFeature Extent
Changes in ThermalFeature Water Flow
Changes in ThermalFeature Temperature
Acid SulfateThermal Springs Geysers Heated GroundFumarolesMud PotsNeutral Chloride
Thermal Springs
Chloride Flux Heat FluxSpatial Extent ofFeatures
Water Levels inWells
Temperature ofWater in Wells
FIGUR E 17 Geothermal model.
Vital Signs Monitoring Plan • 63
G R A S S L A N D E C O S Y S T E M N A R R AT I V E C O N C E P T UA L M O D E L
(author: Glenn Plumb)(author: Glenn Plumb)
Grass plants evolved between seventy to eighty million years ago with
adaptations that allow them to survive under intense and frequent
disturbances including tremendous removal of living phytomass (e.g.
fire and herbivory) and drought. Grasses often grow in vast concen-
trations, most often in semi-arid climates (Brown 1985) with a fairly
uniform and continuous cover. Grasslands are the largest of the four
major natural vegetation formations covering the planet (Gould 1968)
and have certain characteristics in common, including a rolling to flat
topography with precipitation between ten and 40 inches per year
distributed unevenly with seasonal peaks followed by extended pe-
riods of drought (Sims 1988). Historically, grasslands covered up to
800 million ha in North America (Kuchler 1964) and still remain the
largest native biome covering approximately 125 million ha (USFS
1980). Although most grasslands were historically located on exten-
sive plains, relatively small pockets of mountain grasslands and grass-
land-forest combinations occur in the western coniferous forests (Sims
1988). Grasslands are dominated by grasses and grass-like plants (e.g.
Cyperaceae) with particular grassland’s biomass dominated by fewer
than 6 species (Coupland 1974). Yet, typically grasses contribute less
than 20% of the total vegetative species richness to a grassland com-
munity. Forbs (non-grass-like herbs) are seasonally important along
with dwarf shrubs and occasional trees (Coupland 1979). Grassland
plants invest carbohydrates in structural development early in the
growing season when moisture is adequate and thus during succes-
sive drought, grassland plants can utilize stored labile carbohydrates,
decrease dark respiration and maintain gas-exchange process under
stressed water potentials. Nutrient uptake is rapid when moisture is
available and at these times, plants are most palatable and tolerant of
herbivory with removal of phytomass often stimulating increased rates
of photosynthesis by the remaining tissues and intercalary meristems
of grasses permitting growth after herbivory (Risser 1985). Under peri-
odic drought stress grassland plats close stomata with extensive leave
curling to reduce water loss (Risser 1985).
Conceptual Model Development
1. DRIVERSThe climate of the GRYN parks is characterized by long, cold winters
and cool, dry summers with much precipitation occurring as snow-
pack that melts rapidly April – June, depending on elevation pro-
viding much of the water available for annual growth in mountain
grasslands. Snowpack generally begins to accumulate in October
and November, reaches maximum in early to mid-April. Due to late-
winter rates of accumulation, the annual snowpack can become iso-
thermic before peak accumulation and thus melts rapidly beginning
in May to July depending on elevation. Despain (1990) describes
two major local climatic types as a valley type with peak precipita-
tion coming in the spring and a mountain type with peak precipita-
tion in the winter. Merrill and Boyce (1996) evidenced that mountain
grassland seasonal biomass production was more correlated with
climate and snowpack controls that the total number of herbivores
occupying the grassland.
Soils of grasslands often differ markedly from those soils found
under forest canopy due to variation in underlying depositional origins
and the differences in soil formation processes unique to vegetation
types (Coupland 1979). In grasslands, leaching is often limited due
to general aridity and so grassland soils are often more basic with
organic matter distributed throughout the soil profile. While many
grassland soils are derived from glacial and associated outwash
sand and gravel parent materials, the GRYN mountain grasslands
are also heavily influenced by volcanic rhyolitic and andecitic parent
materials (Despain 1990). The GRYN parks are also influenced by
glacial depositional/windblown loess that was strongly influenced
by the distribution and duration of glacial icecaps (Despain 1990).
2. STRESSORS AND ECOLOGICAL RESPONSESFrank and McNaughton (1992) examined the interactive roles of large
animal herbivory and drought on mountain grasslands and found that
although the process of aboveground net primary productivity, large
herbivore consumption and dung deposition varied widely among dif-
ferent grassland sites, grassland production and consumption, and
consumption and dung deposition were positively correlated across
sites. Despite the evidenced role of herbivory and dung deposition in
controlling site-level production, they also concluded that climate is
the principal driving variable of ecosystem processes and that direct
and indirect effects of single-season drought will persist for several
years after the event. Frank and McNaughton (1993) concluded that
in the absence of drought, herbivory at the site level can result in a
compensatory growth response and hence stimulate mountain grass-
land productivity due in part that the migratory behavior of native
ungulates tracks young, high quality forage as it varies temporally
64 • Appendix III: Conceptual Models
and spatial along an elevational gradient across these ecosystems.
The nutrient dynamics of mountain grasslands that support abundant
migratory large-body sized wildlife are generally poorly understood
(Frank et al. 1994), but evidence from Yellowstone National Park sug-
gests that grazers are important component of mountain grassland N
budgets with 1) landscape position and soil water affecting nutrient
dynamics, 2) annual mineralization positively associated with soil
N content, 3) the proportion of soil N mineralized negatively corre-
lated to soil C/N, and 4) rates of nitrogen mineralization higher in
mountain grasslands than in other temperate grassland ecosystems,
possibly due to grazers promoting N cycling.
Detling (1998) reviewed the effects of mammalian herbivores on
GRYN park grassland plant species composition, biomass, productivity
and nitrogen cycling and concluded that patch dynamics controlled by
local small mammal soil disturbances, fire, grazing, and urine/dung de-
position underpinned temporal and spatial variability in grazing inten-
sity and facilitated N mineralization and persistence of grassland com-
munities. The role of fire in mountain grasslands was also examined
by Norland et al. (1996) who concluded that forage biomass decreased
where moderate soil heating occurred, forage quality (N and digestibil-
ity) increased, herbivore diets and habitat use patterns did not change,
but that large herbivore use of riparian shrubs did increase. Simulation
model experiments by Turner et al. (1994) explored the effects of fire
size, fire pattern and winter severity on large herbivore foraging and
population dynamics on a mountain grassland. Although, fire pattern
(clumped vs fragmented) and winter severity seemed to control tempo-
ral and spatial variation in grassland foraging and habitat use patterns,
the interactions between fire scale and grassland spatial patterns sug-
gest that fire size along is not sufficient to predict grassland response
and ungulate survival. A review of ecological stressors and responses
in a mountain grassland in northern Yellowstone National Park (YNP
1997) concluded that 1) large ungulate herds and intensive grazing did
not appear to be affecting native or Alpha diversity (Singer 1996), 2)
there is no consistent effects of large animal grazing on forbs (Coughe-
nour et al. 1995, Reardon 1996), 3) soil bulk densities were higher on
grazed areas (Lane 1990, Lane and Montagne 1996) and soil mois-
ture levels were unaffected by grazing (Lane 1990, Coughenour 1991,
Singer and Harter 1996), 4) accumulated organic litter was greater in
ungrazed sites and exposed bare ground was higher in grazed areas
(Frank 1990, Singer 1996), and 5) mountain grassland root biomass and
nitrogen exhibited no responses to grazing (Merrill et all 1994).
3. INDICATORSGrasslands of the GRYN are characterized generally by montane
communities dominated by varying levels of perennial C4 graminoids,
C3 graminoids, forbs and dwarf or small shrubs with local sites of-
ten dominated by either C4 or C3 graminoids. There are few if any
sites that would be characterized as true short or mixed grass prairie.
Aboveground vegetative biomass production is a cumulative process
within a single growing season, with peak biomass roughly equiva-
lent to Annual Net Primary Production (Briggs and Knapp 1995). In
these montane systems, peak vegetative biomass production occurs
dependent on elevation and aspect controls on soil temperature
and precipitation regimes. Grassland annual aboveground vegeta-
tive biomass production responds directly to a suite of intra- and
inter-annual primary stressors including grazing (e.g. herbivory), fire,
drought, snowpack, and in some circumstances trampling by hoofed
medium and large herbivores, and directly reflects the primary photo-
synthetic capacity that can be quantified across multiple spatial and
temporal scales. Although climate has been described as the primary
driving variable of montane grassland processes (McNaughton and
Frank 1992), each park has qualitative and quantitative models to
partition the interactive effects of these multiple primary stressors.
Extra-normal variation in grassland vegetative biomass capacity will
be a direct response indicator of both short and long term stressor
effects. Multiple factors can control and limit ANPP at larger scales
in grasslands including fire, climatic variability, and various activities
by herbivores, with soil nitrogen and water limitations often operat-
ing at local scales. Knapp et al. (1998) suggest that these scale-de-
pendent controls on ANPP underpin patterns of temporal switching
among limiting resources that results in non-equilibrium behaviors in
which transient periods occur where no resources are limiting. Thus,
ANPP becomes a reliable predictive ecological indicator only with
long-term records and a non-equilibrium perspective.
In GRYN montane grassland communities, vegetative biomass
production is underpinned by temperature and soil moisture avail-
ability that are generally controlled temporally by delayed onset of
the growing season according to increasing elevation. Onset and
timing of herbivory of the annual increment of primary vegetative
production by large and medium sized herbivores is generally syn-
chronized with onset of seasonal “growth pulse” of green-up as it
moves from winter ranges to higher elevation summer ranges. Mi-
gratory native GRYN herbivores (e.g. elk, bison) often utilize the initial
green-up phase but move to higher elevations prior to onset of plant
Vital Signs Monitoring Plan • 65
reproduction. Non-migratory GRYN herbivores (e.g. wild horses) will
sustain utilization of montane grasslands until current annual growth
or residual cover is depleted. Frank (1990) showed that seasonal uti-
lization of montane grasslands could stimulate total annual produc-
tions beyond levels of ungrazed sites. Thus, offtake as a measure of
the amount of annual vegetative growth increment that is removed
by these native large and medium sized herbivores can serve as a
variably important stressor on the resiliency of montane grasslands.
Although, short-term interannual variation in vegetation offtake can
be explained by inherent variability of climate and herbivory interac-
tions, long-term trends and patterns of montane grassland resiliency
can be inferred from measures of offtake as an integrative indicator
of whether there are immediate or long-term concerns for residual
effects of overgrazing of these systems. Unlike fire or climatic influ-
ences that can generate some levels of uniform grassland vegetation
responses, seasonal grazing of montane grasslands can generate
patchy heterogeneity. Overlaid on these patterns of heterogeneity
are heterogeneous patterns of trampling, urine and dung deposition
and the issues of patchy compensation and even overcompensation
by grazed plants. Thus, although annual temporal and spatial pat-
terns of offtake can be variable, long-term measurements of offtake
can be an important integrative ecological indicator of grassland non-
equilibrium dynamics.
The availability and cycling of nutrients, especially N, is a primary
controlling stressor on grassland community structure and function,
and in turn are directly affected by variation in ecosystem processes
such as vegetation production and decomposition (Blair et al. 1998).
Variation in N availability can determine and limit productivity, spe-
cies composition, and plant physiological responses to disturbances
and rates of litter decomposition. Additionally, N cycling processes
can be directly altered by human activities such as prescribed fire
and external influences such as climate and topography (Turner
1997). Thus, long-term measurements of N cycling processes and
outcomes can provide the basis for evaluating the role of natural
or anthropogenic stressors on ecosystem function, small and large
scale redistribution or transport of N between summer and winter
ranges, grassland plant and animal communities, and abiotic eco-
system characteristics such as soil chemistry. In GRYN parks there
are important and sizeable large and medium body-sized herbivore
populations that are very important components of nitrogen cycle
processes and outcomes. In addition to local defoliation processes
and outcomes, redistribution of N through urine and feces, these
herbivores play an important role in stimulating patterns of aboveg-
round and belowground production. They also contribute to nutrient
cycling through the return of carcasses to these systems. Despite
these important processes, N limitation is not a universal feature of
montane grasslands and that its relative importance can vary with
influences of fire, grazing, elevation, topography and precipitation
regimes. This loose coupling of relationships is due to the potential
for the direct influences of these same variables under variable en-
vironmental and management regimes. Thus N cycling process and
outcomes reinforce the viewpoint that montane grasslands operate
as a nonequilibrium system in which the relative importance of N
varies in space and time (Knapp and Seastadt 1998).
The native species richness of montane grasslands are often
characterized by a matrix of widely distributed, temporally stable,
and abundant “core” species, a second tier of localized, less abun-
dant, and temporally dynamic and somewhat unpredictable “satel-
lite” species (subdominant graminoids and forbs). The exotic species
richness of montane grasslands often follows a two-tiered similar
pattern with species such as timothy, smooth brome, bluegrass and
annual bromes dominating some landscapes while other montane
grassland landscapes include only few subdominant exotic forbs.
These “satellite” species suggest a subdominant role for non-equi-
librium dynamics in the persistence of native montane grassland
community abundance and distribution. By contrast, the spatial and
temporal stability of the “core” species richness suggests a certain
dominant equilibrium dynamic to native montane grassland com-
munity abundance and distribution. Still, although there can be a
dominant equilibrium matrix of montane grassland species, these
systems are far from static and can be disrupted severely by the
emergence of dominant exotic species described above. Indeed, the
increasing presence of exotic species, described above, has greatly
altered some GRYN grassland communities. Thus, long-term mea-
sures of native and exotic species abundance and distribution can
serve as an important integrative ecological indicator to asses the
interplay between equilibrium and nonequilibrium processes that
regulate montane grassland plant species persistence and coexis-
tence. For this vital sign to be useful, GRYN parks will need robust
models of the relationship between montane grassland condition
and exotic species presence and resultant effects on broader eco-
logical processes and outcomes.
Research from a variety of grassland types indicates that there are
important mechanisms by which the dominant disturbance regimes
66 • Appendix III: Conceptual Models
(e.g. fire, grazing, drought, trampling, wallowing) can have important
interactive effects on the emergent spatial and temporal patterns
of populations and communities of grassland small mammals, birds
and insects. Variation in scale-dependent effects on abundance and
distribution of taxon can be attributed to variation in food and/or
habitat requirements (generalist versus specialist), differences
in vagility (e.g. flying versus walking), differences in life span (an-
nual vs. perennial) and combinations of these factors. Additionally,
population-level mechanisms that underpin fire- or grazing- induced
dynamics on animal populations or communities are taxon- and spe-
cies-specific. For example, many species of grasshoppers overwinter
as eggs in soil and are mobile as adults and spring conditions may be
independent of grasshopper abundance, whereas sedentary insect
species that are above ground during fires can suffer catastrophic
mortality (Fay and Samenus 1993). Thus there exists opportunity to
identify taxon that are relatively tightly coupled to key ecosystem
stressors and that when coupled to measures of grassland produc-
tion and offtake could serve as key integrative ecological indicators.
There is some evidence that grassland small mammals, birds and
insects conform to Hanski’s (1982) core-satellite hypothesis wherein
these communities are characterized by several abundant, widely
distributed, and relatively stable species, accompanied by a larger
number of rare, localized, and dynamically variable species. Thus,
the temporally variable patterns in species abundance, distribution
and diversity are influenced strongly by changes in the distribution
and abundance of rare species. Climate and topographic influences
can also control spatial and temporal heterogeneity in montane
grassland animal populations and communities. Hence, the spatial
and temporal variation in population abundance and community
structure require multifactoral explanations (Kaufmann et al. 1998)
and may make single-limitation explanations for population and
community dynamics unrealistic (Belovsky and Joern 1995).
a. Grassland Annual Net Primary Productivity – ANPP (e.g. Aboveground Vegetation Production, Photosynthetic Capacity)
Justification: Grasslands of the GRYN are characterized generally by
montane communities dominated by varying levels of perennial
C4 graminoids, C3 graminoids, forbs and dwarf or small shrubs
with local sites often dominated by either C4 or C3 graminoids.
There are few if any sites that would be characterized as true
short or mixed grass prairie. Aboveground vegetative biomass
production is a cumulative process within a single growing sea-
son, with peak biomass roughly equivalent to Annual Net Primary
Production (Briggs and Knapp 1995). In these montane systems,
peak vegetative biomass production occurs dependent on eleva-
tion and aspect controls on soil temperature and precipitation
regimes. Grassland annual aboveground vegetative biomass
production responds directly to a suite of intra- and inter-annual
primary stressors including grazing (e.g. herbivory), fire, drought,
snowpack, and in some circumstances trampling by hoofed me-
dium and large herbivores, and directly reflects the primary pho-
tosynthetic capacity that can be quantified across multiple spatial
and temporal scales. Although climate has been described as the
primary driving variable of montane grassland processes (Mc-
Naughton and Frank 1992), each park has qualitative and quanti-
tative models to partition the interactive effects of these multiple
primary stressors. Extra-normal variation in grassland vegetative
biomass capacity will be a direct response indicator of both short
and long term stressor effects.
Comment: Multiple factors can control and limit ANPP at larger
scales in grasslands including fire, climatic variability, and
various activities by herbivores, with soil nitrogen and water
limitations often operating at local scales. Knapp et al. (1998)
suggest that these scale-dependent controls on ANPP underpin
patterns of temporal switching among limiting resources that
results in non-equilibrium behaviors in which transient periods
occur where no resources are limiting. Thus, ANPP becomes a
reliable predictive ecological indicator only with long-term re-
cords and a non-equilibrium perspective.
b. Grassland Vegetation Annual Offtake (e.g. Current year growth utilization by primary consumers)
Justification: In GRYN montane grassland communities, vegetative
biomass production is underpinned by temperature and soil
moisture availability that are generally controlled temporally by
delayed onset of the growing season according to increasing el-
evation. Onset and timing of herbivory of the annual increment
of primary vegetative production by large and medium sized
herbivores is generally synchronized with onset of seasonal
“growth pulse” of green-up as it moves from winter ranges to
higher elevation summer ranges. Migratory native GRYN herbi-
vores (e.g. elk, bison) often utilize the initial green-up phase but
move to higher elevations prior to onset of plant reproduction.
Vital Signs Monitoring Plan • 67
Non-migratory GRYN herbivores (e.g. wild horses) will sustain
utilization of montane grasslands until current annual growth or
residual cover is depleted. Frank (1990) showed that seasonal
utilization of montane grasslands could stimulate total annual
productions beyond levels of ungrazed sites. Thus, offtake as
a measure of the amount of annual vegetative growth incre-
ment that is removed by these native large and medium sized
herbivores can serve as a variably important stressor on the
resiliency of montane grasslands. Although, short-term interan-
nual variation in vegetation offtake can be explained by inher-
ent variability of climate and herbivory interactions, long-term
trends and patterns of montane grassland resiliency can be
inferred from measures of offtake as an integrative indicator of
whether there are immediate or long-term concerns for residual
effects of overgrazing of these systems.
Comment: Unlike fire or climatic influences that can generate some
levels of uniform grassland vegetation responses, seasonal
grazing of montane grasslands can generate patchy heteroge-
neity. Overlaid on these patterns of heterogeneity are hetero-
geneous patterns of trampling, urine and dung deposition and
the issues of patchy compensation and even overcompensation
by grazed plants. Thus, although annual temporal and spatial
patterns of offtake can be variable, long-term measurements of
offtake can be an important integrative ecological indicator of
grassland non-equilibrium dynamics.
c. Grassland Nitrogen (e.g. availability, inputs, loss and associated processes)
Justification: The availability and cycling of nutrients, especially N,
is a primary controlling stressor on grassland community struc-
ture and function, and in turn are directly affected by variation
in ecosystem processes such as vegetation production and de-
composition (Blair et al. 1998). Variation in N availability can de-
termine and limit productivity, species composition, and plant
physiological responses to disturbances and rates of litter de-
composition. Additionally, N cycling processes can be directly
altered by human activities such as prescribed fire and external
influences such as climate and topography (Turner 1997). Thus,
long-term measurements of N cycling processes and outcomes
can provide the basis for evaluating the role of natural or an-
thropogenic stressors on ecosystem function, small and large
scale redistribution or transport of N between summer and
winter ranges, grassland plant and animal communities, and
abiotic ecosystem characteristics such as soil chemistry.
Comment: In GRYN parks there are important and sizeable large and
medium body-sized herbivore populations that are very impor-
tant components of nitrogen cycle processes and outcomes. In
addition to local defoliation processes and outcomes, redistri-
bution of N through urine and feces, these herbivores play an
important role in stimulating patterns of aboveground and be-
lowground production. They also contribute to nutrient cycling
through the return of carcasses to these systems. Despite these
important processes, N limitation is not a universal feature of
montane grasslands and that its relative importance can vary
with influences of fire, grazing, elevation, topography and pre-
cipitation regimes. This loose coupling of relationships is due
to the potential for the direct influences of these same vari-
ables under variable environmental and management regimes.
Thus N cycling process and outcomes reinforce the viewpoint
that montane grasslands operate as a nonequilibrium system
in which the relative importance of N varies in space and time
(Knapp and Seastadt 1998).
d. Grassland Vegetation Community Structure (Patterns of abundance and distribution)
Justification: The native species richness of montane grasslands
are often characterized by a matrix of widely distributed, tem-
porally stable, and abundant “core” species, a second tier of lo-
calized, less abundant, and temporally dynamic and somewhat
unpredictable “satellite” species (subdominant graminoids and
forbs). The exotic species richness of montane grasslands often
follows a two-tiered similar pattern with species such as timo-
thy, smooth brome, bluegrass and annual bromes dominating
some landscapes while other montane grassland landscapes
include only few subdominant exotic forbs. These “satellite”
species suggest a subdominant role for non-equilibrium dynam-
ics in the persistence of native montane grassland community
abundance and distribution. By contrast, the spatial and tempo-
ral stability of the “core” species richness suggests a certain
dominant equilibrium dynamic to native montane grassland
community abundance and distribution. Still, although there can
be a dominant equilibrium matrix of montane grassland species,
these systems are far from static and can be disrupted severely
by the emergence of dominant exotic species described above.
68 • Appendix III: Conceptual Models
Indeed, the increasing presence of exotic species, described
above, has greatly altered some GRYN grassland communities.
Thus, long-term measures of native and exotic species abun-
dance and distribution can serve as an important integrative
ecological indicator to asses the interplay between equilibrium
and nonequilibrium processes that regulate montane grassland
plant species persistence and coexistence.
Comment: For this vital sign to be useful, GRYN parks will need
robust models of the relationship between montane grassland
condition and exotic species presence and resultant effects on
broader ecological processes and outcomes.
e. Grassland Insect and Vertebrate Community StructureJustification: Research from a variety of grassland types indicates that
there are important mechanisms by which the dominant distur-
bance regimes (e.g. fire, grazing, drought, trampling, wallowing)
can have important interactive effects on the emergent spatial and
temporal patterns of populations and communities of grassland
small mammals, birds and insects. Variation in scale-dependent
effects on abundance and distribution of taxon can be attributed
to variation in food and/or habitat requirements (generalist versus
specialist), differences in vagility (e.g. flying versus walking), differ-
ences in life span (annual vs. perennial) and combinations of these
factors. Additionally, population-level mechanisms that underpin
fire- or grazing- induced dynamics on animal populations or com-
munities are taxon- and species-specific. For example, many spe-
cies of grasshoppers overwinter as eggs in soil and are mobile as
adults and spring conditions may be independent of grasshopper
abundance. Sedentary insect species that are above ground dur-
ing fires can suffer catastrophic mortality (Fay and Samenus 1993).
Thus there exists opportunity to identify taxon that are relatively
tightly coupled to key ecosystem stressors and that when coupled
to measures of grassland production and offtake could serve as key
integrative ecological indicators.
Comment: There is some evidence that grassland small mammals,
birds and insects conform to Hanski’s (1982) core-satellite hy-
pothesis wherein these communities are characterized by sev-
eral abundant, widely distributed, and relatively stable species,
accompanied by a larger number of rare, localized, and dynami-
cally variable species. Thus, the temporally variable patterns
in species abundance, distribution and diversity are influenced
strongly by changes in the distribution and abundance of rare
species. Climate and topographic influences can also control
spatial and temporal heterogeneity in montane grassland ani-
mal populations and communities. Hence, the spatial and tem-
poral variation in population abundance and community struc-
ture require multifactoral explanations (Kaufmann et al. 1998)
and may make single-limitation explanations for population and
community dynamics unrealistic (Belovsky and Joern 1995).
LITERATURE CITEDLITERATURE CITED
Belovsky, G.E. and A. Joern. 1995. The dominance of different regulat-ing factors on rangeland grasshoppers. Pp. 359-386 in N. Cappuccino and P.W. Price, editors, Population dynamics: new approaches and syn-thesis. Academic Press, San Diego, California, USA.
Brown, L. 1985. Grasslands. The Audubon Society Nature Guides. Al-fred Knopf, New York.
Blair, J.M., T.R. Seastadt, C.W. Rice, and R.A. Rambundo. 1998. Ter-restrial nutrient cycling in tallgrass prairie. Pp. 222-243, In: Grassland Dynamics: Long-term ecological research in tallgrass prairie. Eds. A.K. Knapp, J.M. Briggs, D.C Hartnett, S.L. Collins. LTER Oxford Press, New York.
Briggs, J.M. and A.K. Knapp. 1995. Interannual variability in primary production in tallgrass prairie: climate, soil moisture, topographic po-sition, and fire as determinants of aboveground biomass. American Journal of Botany 82:1024-1030.
Briggs, J.M. 1998. A landscape perspective of patterns and processes. In: Grassland Dynamics: Long-term ecological research in tallgrass prairie. Eds. A.K. Knapp, J.M. Briggs, D.C Hartnett, S.L. Collins. LTER Oxford Press, New York.
Coughenour, M.B. 1991. Biomass and nitrogen responses to grazing of upland steppe on Yellowstone’s northern winter range. Journal of Applied Ecology 28:71-82.
Coughenour, M.B., F.J. Singer and J. Reardon. 1996. The Parker Tran-sects revisited – long term herbaceous vegetation trends on Yellow-stone’s northern winter range. Pp. 13-28. In: F.J. Singer, ed., Effects of grazing by wild ungulates in Yellowstone National Park. Tech. Reprt NPS/NRYELL/NRTR/96-01, NPS, Natural Resource Information Divi-sion, Denver.
Coupland, R.T. 1979. Grassland ecosystems of the world: analysis of grassland and their uses. Cambridge University Press.
Despain, D.G. 1990. Yellowstone Vegetation: Consequences of envi-ronment and history in a natural setting. Roberts Rinehart Publishers, Boulder, CO.
Detlinig, J.K. 1998. Mammalian herbivores: ecosystem-level effects in two grassland national parks. Wildlife Society Bulletin 26:438-448.
Fay, P.A. and R.W. Samenus. 1993. Gall wasp (Hymenoptera: Cynipdae)
Vital Signs Monitoring Plan • 69
mortality in a spring tallgrass prairie fire. Environmental Entomology 22:1333-1337.
Frank, D.A. 1990. Interactive ecology of plants, large mammalian her-bivores, and drought in Yellowstone National Park. Ph.D. Thesis, Syra-cuse University, 126 pp.
Frank, D.A. and S.J. McNaughton.1992. The ecology of plants, large mammalian herbivores, and drought in Yellowstone National Park. Ecology 73:2043-2058.
Frank, D.A. and S.J. McNaughton. 1993. Evidence for the promotion of aboveground grassland production by native large herbivores in Yel-lowstone National Park. Oecologia 96:157-161.
Frank, D.A., R.S. Inouye, N. Huntly, G.W. Minshall, J.E. Anderson. 1994. The biogeochemistry of a north-termperate grassland with native un-gulates: Nitrogen Dynamics in Yellowstone National Park. Biogeo-chemistry 26:163-188.
Gould, F.W. 1968. Grassland systematics. McGraw-Hill, New York.
Hanski, I. 1982. Dynamics of regional distribution: the core and sat-telite species hypothesis. Oikos 38:210-221.
Kaufmann, G.A., D.W. Kaufmann, and E.J. Finck. 1988. Influence of fire and topography on habitat selection by Peromyscus maniculatus and Reithrodontomys megalotis in ungrazed tallgrass prairie. Journal of Mammology 69:342-352.
Kaufmann, D.W., G.A. Kaufmann, P.A. Fay, J.L. Zimmerman, E.W. Edwards. 1998. Disturbance, diversity, and species interactions in tallgrass prairie. Pp. 140-158 In: Grassland Dynamics: Long-term eco-logical research in tallgrass prairie. Eds. A.K. Knapp, J.M. Briggs, D.C Hartnett, S.L. Collins. LTER Oxford Press, New York.
Knapp, A.K. and T.R. Seastadt. 1998. Introduction: Grasslands, Konza Prairie, and Long-term Ecological Research. Pp. 3-18. In: Grassland Dynamics: Long-term ecological research in tallgrass prairie. Eds. A.K. Knapp, J.M. Briggs, D.C Hartnett, S.L. Collins. LTER Oxford Press, New York.
Knapp, A.K, J.M. Briggs, J.M. Blair, and C.L. Turner. 1998. Patterns and controls of aboveground net primary production in tallgrass prairie. Pp. 193-221. In: Grassland Dynamics: Long-term ecological research in tallgrass prairie. Eds. A.K. Knapp, J.M. Briggs, D.C Hartnett, S.L. Col-lins. LTER Oxford Press, New York.
Kuchler, A.W. 1964. Potential natural vegetation of the conterminous United States. American Geographical Society special publication 36.
Lane, J. 1990. Characterization and comparison of soils inside and outside of grazing exclosures on Yellowstone National Park’s north-ern winter range. M.S. Thesis, Montana State University, Bozeman, 124pp.
Lane, J. and C. Montagne. 1996. Characterization of soils from graz-ing exclosures and adjacent areas in northern Yellowstone National Park. Pp. 63-72, In: F.J. Singer, ed., Effects of grazing by wild ungulates
in Yellowstone National Park. Tech. Reprt NPS/NRYELL/NRTR/96-01, NPS, Natural Resource Information Division, Denver.
Merrill, E., N.L. Stanton, and J.C. Hak. 1994. Responses of bluebunch wheatgrass, Idaho fescue, and nematodes to ungulate grazing in Yel-lowstone National Park. Oikos 69:231-240.
Merrill, E. and M.S. Boyce. 1996. Summer range and elk population dynamics in Yellowstone National Park. Pp. 313-318, In: F.J. Singer, ed., Effects of grazing by wild ungulates in Yellowstone National Park. Tech. Reprt NPS/NRYELL/NRTR/96-01, NPS, Natural Resource Infor-mation Division, Denver.
Norland, J.E., F.J. Singer and L. Mack. 1996. Effects of Yellowstone fires of 1988 on elk habitats. Ecological Implications of Fire in Greater Yellowstone [need rest of citation].
Reardon, J. 1996. Changes in grazed and protected plant communities in Yellowstone National Park. Pp. 115-126, In: F.J. Singer, ed., Effects of grazing by wild ungulates in Yellowstone National Park. Tech. Reprt NPS/NRYELL/NRTR/96-01, NPS, Natural Resource Information Divi-sion, Denver.
Risser, P.G. 1985. Grasslands. Pp. 232-256, In: B.F. Chabot and H.A. Mooney, eds. Physiological ecology of North American plant commu-nities. Chapman and Hall, New York.
Sims, P.L. 1988. Grasslands. Pp. 265-286, In: M.G. Barbour and W.D. Billings, eds. North American Terrestrial Vegetation. Cambridge Univ. Press, New York.
Singer, F.J. and M. Harter. 1996. Comparative effects or elk herbivory and 1988 fires on northern Yellowstone National Park grasslands. Eco-logical Applications 6:185-199.
Singer, F.J. 1996. Effects of grazing by ungulates on upland bunchgrass communities of the northern range of Yellowstone National Park. Pp. 127-138, In: F.J. Singer, ed., Effects of grazing by wild ungulates in Yel-lowstone National Park. Tech. Reprt NPS/NRYELL/NRTR/96-01, NPS, Natural Resource Information Division, Denver.
Tuner, M.G., Y.Wu, L.L. Wallace, W.H. Romme, and A. Brenkert. 1994. Simulating winter interactions among ungulates, vegetation, and fire in northern Yellowstone Park. Ecological Application 4:472-496.
Turner 1997 [need citation]
U.S. Forest Service. 1980. An assessment of the forest and rangeland situation in the United States. USDA Publication FS-345.
Yellowstone National Park. 1997.Yellowstone’s northern range: com-plexity and change in a wildland ecosystem. National Park Service, Mammoth Hot Springs, Wyoming.
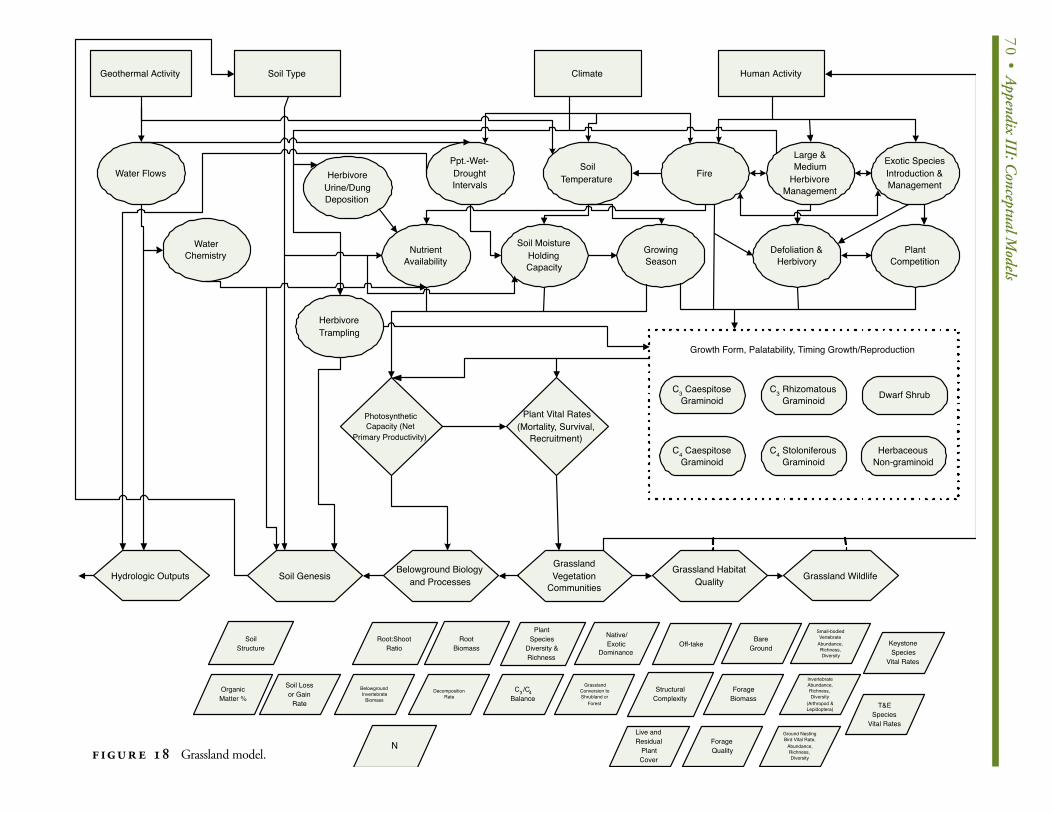
70• Appendix III: C
onceptual Models
Geothermal Activity Soil Type Climate Human Activity
Water Flows
HerbivoreTrampling
NutrientAvailability
Fire
PlantCompetition
Ppt.-Wet-DroughtIntervals
GrowingSeason
WaterChemistry
Exotic SpeciesIntroduction &Management
Defoliation &Herbivory
Soil MoistureHoldingCapacity
Large &Medium
HerbivoreManagement
SoilTemperatureHerbivore
Urine/DungDeposition
PhotosyntheticCapacity (Net
Primary Productivity)
Plant Vital Rates(Mortality, Survival,
Recruitment)
Hydrologic Outputs Grassland WildlifeGrassland Habitat
Quality
GrasslandVegetation
Communities
Belowground Biologyand ProcessesSoil Genesis
SoilStructure
RootBiomass
BelowgroundInvertebrate
Biomass
Root:ShootRatio
Soil Lossor Gain
Rate
N
OrganicMatter %
KeystoneSpecies
Vital Rates
Ground NestingBird Vital Rate,
Abundance,Richness,Diversity
InvertebrateAbundance,Richness,Diversity
(Arthropod &Lepidoptera)
Small-bodiedVertebrate
Abundance,Richness,Diversity
ForageQuality
ForageBiomass
BareGround
Live andResidual
PlantCover
StructuralComplexity
GrasslandConversion toShrubland or
Forest
Native/Exotic
Dominance
C3/C4Balance
PlantSpecies
Diversity &Richness
DecompositionRate
T&ESpecies
Vital Rates
Off-take
Growth Form, Palatability, Timing Growth/Reproduction
C3 CaespitoseGraminoid
C4 CaespitoseGraminoid
C4 StoloniferousGraminoid
HerbaceousNon-graminoid
Dwarf ShrubC3 RhizomatousGraminoid
FIGUR E 18 Grassland model.
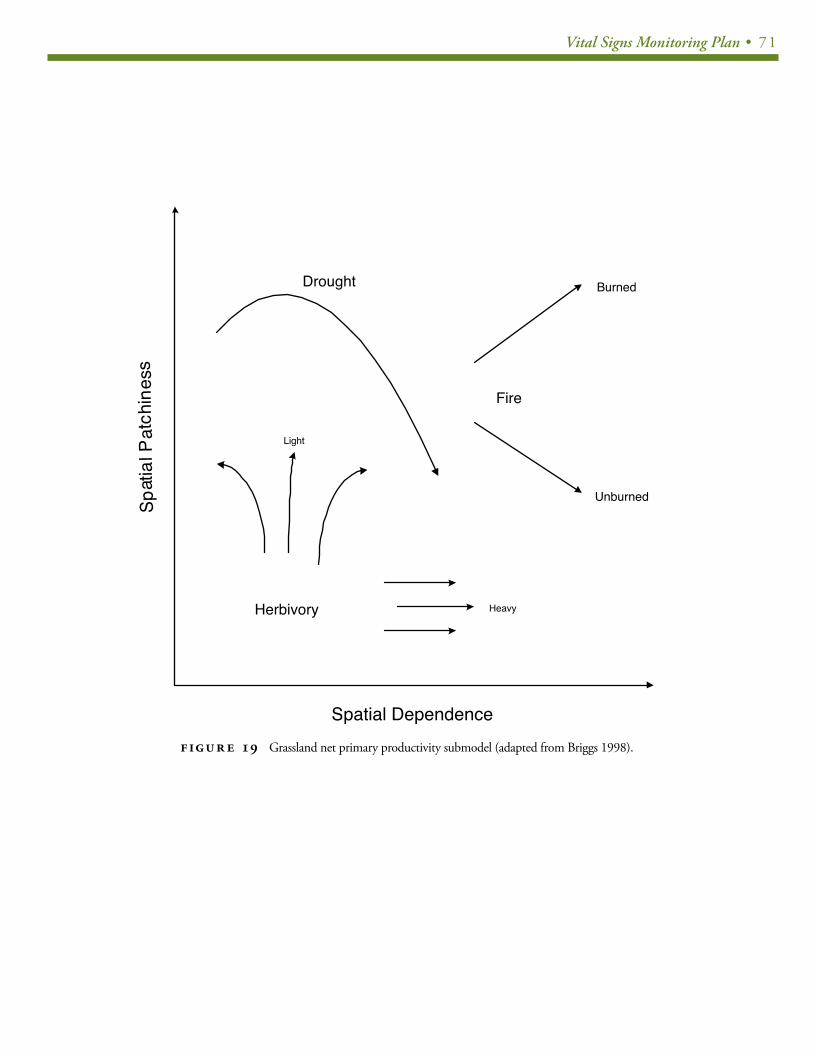
Vital Signs Monitoring Plan • 71
Spatial Dependence
Spat
ial P
atch
ines
s
Herbivory
Drought Burned
Unburned
Fire
Adapted from ��������������������������������������������������������������������������������������������������������������������������������������������������������������������������������������������������������������������
Light
Heavy
FIGUR E 19 Grassland net primary productivity submodel (adapted from Briggs 1998).
72 • Appendix III: Conceptual Models
S H RU B L A N D E C O S Y S T E M N A R R AT I V E CO N C E P T UA L M O D E L
(author: Glenn Plumb)(author: Glenn Plumb)
Many shrubland communities area characterized by a matrix of shrub
growth forms and interspaces that may be occupied by variable lev-
els of native graminoids and herbaceous non-graminoid cover. The
floristic composition of shrubland interspace communities can be
heavily controlled by moisture competition and allelopathy. The
natural evolutionary resilience of shrubland communities can be al-
tered under severe disturbance regimes such as fire in fire-intolerant
communities or excessive grazing/trampling by large herbivores. The
natural resilience of shrubland communities can be further stressed
by the introduction of aggressive exotic plant species into these
interspaces. Foremost among these aggressive exotics is Bromus
tectorum that can, by virtue of completing its annual growth cycle
by early summer, outcompete native C3 or C4 graminoids through
moisture competition. This continuous fine fuel layer can then facili-
tate increased fire frequency and intensity, reducing fire-intolerant
shrub species, resulting in reduced soil organic matter and nutrient
pools and a spiral of downward ecosystem degradation. Shrubland
interspaces are often characterized by either a microcryptic crust
dominated by mosses, lichens, and algae between the perennials
or abundant exposed mineral soil surface between the perennials.
Excessive grazing or trampling of microcryptic crusts can predispose
shrubland communities to invasion by aggressive exotic species.
Thus, for shrubland exotic species to serve as a meaningful ecologi-
cal indicator, there needs to be relatively strong models that predict
the interactive relationships between natural system resilience, ex-
cessive disturbance, and the ecology of exotic species.
Woody, lignified or partially lignified shrubs provide food or feed-
ing sites, security, and breeding areas for aboveground and below-
ground small vertebrates and insects in montane shrubland com-
munities. Research from a variety of shrubland types indicates that
there are important mechanisms by which the dominant disturbance
regimes (e.g. fire, grazing, drought, trampling, wallowing) can have
important interactive effects on the emergent spatial and temporal
patterns of populations and communities of small mammals, birds
and insects. Variation in scale-dependent effects on abundance and
distribution of taxon can be attributed to variation in food and/or
habitat requirements (generalist versus specialist), differences in va-
gility (e.g. flying versus walking), differences in life span (annual vs.
perennial) and combinations of these factors. Additionally, popula-
tion-level mechanisms that underpin fire- or grazing- induced dynam-
ics on animal populations or communities are often taxon- and spe-
cies-specific. For example, many species of grasshoppers overwinter
as eggs in soil and are mobile as adults and spring conditions may be
independent of grasshopper abundance, whereas sedentary insect
species that are above ground during fires can suffer catastrophic
mortality (Fay and Samenus 1993). Thus there exists opportunity to
identify taxon that are relatively tightly coupled to key ecosystem
stressors and serve as key integrative ecological indicators. There
is some evidence that shrubland small mammals, birds and insects
conform to Hanski’s (1982) core-satellite hypothesis wherein these
communities are characterized by several abundant, widely distrib-
uted, and relatively stable species, accompanied by a larger num-
ber of rare, localized, and dynamically variable species. Thus, the
temporally variable patterns in species abundance, distribution and
diversity are influenced strongly by changes in the distribution and
abundance of rare species. Climate and topographic influences can
also control spatial and temporal heterogeneity in montane shru-
bland animal populations and communities. Hence, the spatial and
temporal variation in population abundance and community struc-
ture require multifactoral explanations (Kaufmann et al. 1998) and
may make single-limitation explanations for population and commu-
nity dynamics unrealistic (Belovsky and Joern 1995).
In montane shrublands primary production is segregated into
patches of relatively high (undershrub) and low (interspace) long-
term response and it follows that nutrient cycling will be aniso-
tropic. As shrubs or shrub patches accumulate under-canopy litter,
nutrient pools will also collect there. These spatial patterns occur
because of absorption of nutrients that extend beyond plant crown
area, N fixation by the plant or associate symbiotic organisms and
net import of N by fauna using shrubs for nesting, resting, roosting,
feeding or burrowing, and deposition of litter and soil by wind and
water. Thus, long-term measurements of N cycling processes and
outcomes can provide the basis for evaluating the role of natural
or anthropogenic stressors on ecosystem function, small and large
scale redistribution or transport of N between summer and winter
ranges, shrubland plant and animal communities, and abiotic eco-
system characteristics such as soil chemistry. In GRYN parks there
are important and sizeable large and medium body-sized herbivore
populations that are very important components of nitrogen cycle
processes and outcomes. In addition to local defoliation processes
Vital Signs Monitoring Plan • 73
and outcomes, redistribution of N through urine and feces, these
herbivores play an important role in stimulating patterns of aboveg-
round and belowground production. They also contribute to nutrient
cycling through the return of carcasses to these systems. Despite
these important processes, N limitation is not a universal feature of
montane shrublands and that its relative importance can vary with
influences of fire, grazing, elevation, topography and precipitation
regimes. This loose coupling of relationships is due to the potential
for the direct influences of these same variables under variable en-
vironmental and management regimes. Thus N cycling process and
outcomes reinforce the viewpoint that montane shrublands might
operate as a nonequilibrium system in which the relative importance
of N varies in space and time.
Adequate vegetation cover is one of the most critical aspects of
any watershed ecosystem in terms of upland water infiltration and
sediment yields. The natural evolutionary vegetal cover resilience
of shrubland communities can be altered under severe disturbance
regimes such as fire in fire-intolerant communities or excessive graz-
ing/trampling by large herbivores. The natural resilience of shrubland
community vegetal cover can be further stressed by the introduction
of aggressive exotic plant species. Alteration and loss of shrubland
understory vegetal cover will increase overall soil erosion processes
and outcomes. Montane shrubland communities with moderate to
steep slopes will be most stable where shrub roots permeate soils
to the geologic parent material. A diverse cover of both deep-rooted
shrubs and shallow-rooted shrubs will serve to minimize soil erosion
processes and outcomes. Thus, measures of soil erosion processes
and outcomes can be strongly indicative of important declines in veg-
etal cover and the interactive processes that underpin such declines.
Not all shrubs provide a positive feedback to erosional processes.
Some shrubs have chemicals in their foliage or litter that can lead
to hydrophobic soil surfaces resulting in less infiltration and xerifica-
tion of microsites. Indeed, not all erosional processes and outcomes
should be seen as outside the natural range of variability for mon-
tane shrubland communities. Cupped interspace depressions arising
from differential erosion (aggregation, infiltration, growth and soil
genesis) have been occurring at the microsite level for extended in-
tervals in shrubland communities.
Some structural characteristics of montane shrublands can be
coupled closely with spatial organization of growth forms and the
interplay of ecosystem functional attributes that center around en-
ergy flow and nutrient and water cycles. The primary character in-
volved in shrublands is that of dispersion (West 1989) that underpins
the aggregation and deviation from random spatial arrangement.
The vertical and horizontal structures of a variety of shrublands
are remarkably similar across relatively undisturbed examples. In
sagebrush steppe, shrubs have a cover of 10%-80%, depending on
site and successional status (West 1988) with a herbaceous stra-
tum that can reach 30-40 cm during the growing season. On many
sagebrush steppe sites, cover usually exceeds 80% and can exceed
200%. Measures of shrubland cover and vertical or horizontal struc-
ture can track the tendency for stable shrubland community structure
and function. Thus, measurable deviation in these parameters could
provide a relatively rapid integrative assessment of shrubland com-
munity stability. Shrub non-random aggregation can serve as the grit
starting a pearl (Vasek and Lund 1980), the nucleus of successional
change and ecosystem development (West 1989) that leads towards
system stabilization.

74 • Appendix III: Conceptual Models
Soil Type Climate Human Activity
HerbivoreTrampling
NutrientAvailability
Fire
PlantCompetition
Ppt.-Wet-DroughtIntervals
GrowingSeason
Exotic SpeciesIntroduction &Management
Defoliation &Herbivory
Soil MoistureHoldingCapacity
Large &Medium
HerbivoreManagement
SoilTemperatureHerbivore
Urine/DungDeposition
PhotosyntheticCapacity (Net
Primary Productivity)
Plant Vital Rates(Mortality, Survival,
Recruitment)
Shrubland WildlifeShrubland HabitatQuality
ShrublandVegetation
Communities
Belowground Biologyand ProcessesSoil Genesis
SoilStructure
RootBiomass
BelowgroundInvertebrate
Biomass
Root:ShootRatio
Soil Lossor Gain
Rate
N
OrganicMatter %
KeystoneSpecies
Vital Rates
Ground NestingBird Vital Rate,
Abundance,Richness,Diversity
InvertebrateAbundance,Richness,Diversity
(Arthropod &Lepidoptera)
Small-bodiedVertebrate
Abundance,Richness,Diversity
ForageQuality
ForageBiomass
BareGround
Live andResidual
PlantCover
StructuralComplexity
ShrublandConversion toGrassland or
Forest
Native/Exotic
Dominance
PlantSpecies
Diversity &Richness
DecompositionRate
T&ESpecies
Vital Rates
Off-take
Growth Form, Palatability, Timing Growth/Reproduction
Cryptophytes
Dwarf ShrubLow ShrubHigh ShrubC 3 or C4 Dicots
Ligno-stemSucculents
StemSucculentsHemixylesHoloxyles
PhanerophytesChamaephytesHemicryptophytes
FIGUR E 20 Shrubland model.
Vital Signs Monitoring Plan • 75
LO D G E P O L E P I N E E C O S Y S T E M N A R R AT I V E C O N C E P T UA L M O D E L
(author: Dan Tinker)(author: Dan Tinker)
Lodgepole pine (Pinus contorta var. latifolia) is the most common
tree in the northern Rockies, especially in northern Wyoming. These
montane forests range from 1,800-3,200 m in elevation in the GRYE.
Although commonly described as a seral, or pioneer species that of-
ten gives way to Engelmann spruce (Picea engelmanii) and subalpine
fir (Abies lasiocarpa) during later stages of succession, climax stands
of lodgepole pine may be found on very dry and nutrient-poor sites,
where other tree species are unable to survive (Moir 1969; Despain
1983; Lotan and Perry 1983). Lodgepole pine usually forms relatively
young, even-aged stands as a result of regeneration following se-
vere fires (see below), but older, uneven-aged stands may exist at
higher elevations where fire frequency is low (Despain 1990).
Fire is the primary disturbance agent in lodgepole pine forests of
the GRYE. Large, infrequent, stand-replacing fires dominate the fire
regime, and human efforts at fire suppression have historically had
little effect (Romme and Despain 1989). Lodgepole is a fire-adapted
species, rather than fire-resistant, due to its relatively thin bark and the
production of serotinous cones. These serotinous cones remain closed
at maturity, and only open to release their seeds when exposed to very
high temperatures, such as fires will create (Lotan 1975). Following
stand-replacing fires, seedlings establish quickly, usually within two
years, creating new stands where post-fire seedling density may vary
by six orders of magnitude (Turner et al. In review).
Conceptual Model Development
A. DRIVERSThe parent materials for soils across the subalpine plateaus of YNP,
where lodgepole pine dominates the vegetation, are mostly volcanic
in origin. Two different parent materials, derived from underlying
bedrock, determine the soil characteristics in Yellowstone. Rhyolitic
soils are found most often on drier sites, and are typically very nutri-
ent limited. Andesitic soils are relatively more fertile, and often oc-
cur at higher elevations (Despain 1990). Differences in these parent
materials is responsible for soil texture, and therefore, water holding
capacity, as well as nutrient supply and availability. Rhyolitic soils
are more sandy while andesitic soils contain much more clay (De-
spain 1990). Calcium is ten times more abundant in soils derived
from andesite (Despain 1990).
Yellowstone’s climate is characterized by long, cold winters, and
cool, dry summers. Most of the precipitation falls in the form of snow.
Winter Snowpack melts rapidly in May and June, providing much of
the water available for growth in lodgepole pine forests. In addition,
periods of seasonal drought, such as were experienced during the
summer of 1988, may exert considerable influence on soil and fuel
moisture, as well as fire regimes.
Topography on the subalpine plateaus in Yellowstone is quite
varied. Much of the landscape is dominated by gently rolling hills,
however, steep canyons and mountains may break up the continuous
nature of the plateaus. Topographic effects on snow accumulation
and on the spread of natural disturbances such as fire or exotic spe-
cies may be significant.
Biotic drivers such as insects, plant pathogens and disease, and
herbivory by both ungulates and insects may directly and indirectly
affect many ecological processes in lodgepole pine ecosystems. As
more fully described below in the section on Stressors, these biotic
drivers can lead to extensive episodes of tree mortality, which can
affect critical processes such as coarse woody debris accumulation
and net primary productivity.
Given the importance of fire in lodgepole pine ecosystems, the
management of prescribed fires and wildfires may greatly influence
many natural ecosystem processes. For example, large, intense
crown fires may help control episodic outbreaks of Mountain Pine
Beetle by burning entire stands where significant outbreaks have
occurred. Many of the indirect effects of fire suppression will be
discussed below in subsequent sections.
B. STRESSORS AND ECOLOGICAL RESPONSESDrought, snowpack, and windstorms, all driven by weather and cli-
mate, affect many important ecosystem processes. Drought will af-
fect soil moisture during the growing season, thereby affecting plant
development and primary productivity, as well as forage abundance.
Reduced soil moisture may also reduce nutrient supplies by a reduc-
tion in microbial activities such as decomposition and mineralization
(Litton et al in press). Snowpack is the single largest contributor to
soil moisture, and therefore water and nutrient availability during
the growing season. Windstorms may cause large blowdowns, such
as the 6,000-ha event that occurred in the Teton Wilderness in 1987.
These events directly affect forest and landscape structure through
widespread tree mortality and creation and accumulation of large
quantities of coarse woody debris (CWD). Large areas of uprooted
76 • Appendix III: Conceptual Models
trees may also allow for the invasion of new plant species, and may
also affect the growth rates of the new and existing species.
Biotic stressors, primarily insects and plant pathogens, have
important effects in lodgepole pine forest ecosystems (Romme et
al. 1986; Veblen et al 1991). Openings may be created in the forest
canopy through tree mortality, which can result in increases in un-
derstory vegetation production (Knight 1994). Plant parasites, such
as dwarf mistletoe and comandra blister rust, are also common in
these forests. Mistletoe may reduce tree growth or even result in
tree death, and has been labeled the most important problem in
lodgepole pine forests (Knight 1994). The native mountain pine bee-
tle is present at low population levels most of the time (Brown 1975;
Baker and Veblen 1990), but periodic outbreaks, such as occurred
during the 1970s in YNP, resulting in the death of thousands of trees
(Despain 1990). This, in turn, also leads to changes in CWD biomass
and distribution, plant species composition and productivity, and fuel
availability, as well as broad-scale changes in landscape patterns
(Romme et al. 1986). Herbivory, both by insects and ungulates, may
reduce plant cover and may result in the mortality of young seedlings
and saplings (Houston 1982; Singer et al. 1989).
Abiotic stressors such as wildfire, and human-induced changes
to the ecosystem via management impacts can also alter ecological
characteristics of lodgepole systems. Wildfire affects many aspects
of these ecosystems, including both the volatization and creation
of essential nutrients from the organic materials combusted or con-
sumed by fire (Knight et al. 1991). Wildfire directly kills many trees
during severe surface or crown fires, which results in significant ad-
ditions to the CWD biomass of these forests (Tinker and Knight 2000).
Notably, fire regimes seem to be the controlling mechanism for the
production of serotinous cones (see section on fire regime), which is
the most important predictor of postfire seedling density, and there-
fore productivity (Tinker et al. 1994; Turner et al. 1997; Turner et al. in
review). Also, fire clearly can eliminate plant cover, but also provides
new substrate for rapid reestablishment of residual plants (Turner et
al. 1997). If fire suppression efforts are successful, this will obviously
result in a reduction of tree mortality and CWD accumulation, and
may allow for the build-up of high levels of woody fuels.
C. INDICATORSThe vegetation dynamics of lodgepole pine ecosystems are fairly well-
understood (Turner et al. 1997) and the composition of the forest plant
community composition, as well as the proportions of exotic and na-
tive species, could provide an excellent index of ecosystem structure
and function. Similarly, plant species diversity, and the historic range
of variability in this measure, will also allow for relatively straightfor-
ward assessment of ecosystem stability. The amount and distribution
of forest floor litter and coarse woody debris are critical for key forest
floor ecosystem processes such as decomposition and mineralization
(Tinker and Knight 2000), and are directly linked to the availability and
loss of essential nutrients from the soil (Knight 1994). All of these indi-
cators are easily measured, and reflect the potential for the ecosystem
to maintain long-term site productivity. Similarly, an excellent measure
of potential ecosystem productivity is leaf area index, or LAI, which is
the square meters of leaf area per square meter of forest floor). LAI is
highly correlated with aboveground net primary productivity (ANPP) as
well as evapotranspiration, and is routinely estimated through the use
of remotely sensed data. Finally, landscape structure and forest stand
age structure are also easily quantified through the use of geographic
information systems and software designed to characterize landscape
structure (McGarigal and Marks 1995). The historic range of variability
in landscape structure has been recently described for portions of the
Greater Yellowstone Ecosystem (Tinker et al, in press) and monitoring
landscape heterogeneity may provide a much needed broad-scale as-
sessment with which to compliment the finer, stand-level metrics.
1. Plant community compositionResource Monitored: Flora – plant species presence and abundance
Justification: Lodgepole pine communities are relatively uniform sys-
tems (Knight 1994). Departures from the natural range of variability
in community composition may indicate structural and functional
changes in the ecosystem resulting from natural perturbations such
as drought, fire, or windstorm, or human-caused disturbances or
alterations such as non-prescribed fire or fire management (Pickett
1976). Vegetative reproduction following disturbance is the most
common mechanism for plant reestablishment (Anderson and
Romme 1991) and departures from this contribution may indicate
considerable degradation of the seed bank.
Comment: This indicator is relatively well-understood and may
therefore be most useful when attempting to evaluate current
ecosystem conditions.
Example of Specific Measurements of this Indicator: Total spe-
cies present and estimate of percent cover of each in relation
to expected species present within the community. Common
measures include quadrat and relevé methods.
Vital Signs Monitoring Plan • 77
2. Plant species diversityResource Monitored: Flora - Biodiversity
Justification: High species diversity may maintain ecosystem stability
through redundancy of the ecological roles of different species.
Comment: This is a very easy indicator to measure and has much
public appeal, and is likely a priority of many agencies.
Example of Specific Measurements of this Indicator: Common
measures include quadrat and relevé methods.
3. Forest floor litter and coarse woody debris (CWD)Resource Monitored: Ecosystem structure - forest floor structure;
ecosystem processes
Justification: Forest floor litter and coarse woody debris play im-
portant ecological roles in lodgepole pine systems (Tinker and
Knight 2000). CWD may provide habitat for many organisms
(Harmon et al. 1986), and many decomposers such as bacteria
and fungi derive energy and nutrients from decaying forest floor
materials (Frankland et al. 1982). CWD and litter are also impor-
tant inputs to soil organic matter (Edmonds 1991).
Comment: Lodgepole pine systems are often nitrogen- and nutrient-
limited. Forest floor litter and CWD provide critical raw organic
material for decomposition and mineralization processes.
Example of Specific Measurements of this Indicator: Litter depth
and biomass; CWD biomass and percent cover. Common mea-
sures include line intercept method for CWD percent cover, pla-
nar intercept for CWD biomass, and randomly placed measures
of litter depth, with subsamples for dry weight.
4. Landscape structure and heterogeneity Resource Monitored: Landscape structure – patchiness, fragmen-
tation, core habitat, patch edge density
Justification: The spatial pattern of lodgepole pine landscapes influ-
ences many important ecosystem functions such as habitat use
and foraging patterns (Pearson 1993; Turner et al. 1994), nu-
trient movement (Peterjohn and Corell 1984), and disturbance
dynamics (Turner 1987).
Comment: Disturbance is now considered an integral part of lodge-
pole pine ecosystems. Various disturbance types such as fire,
insect outbreaks, windstorms, and earthquakes may signifi-
cantly alter landscape structure in these ecosystems. This, in
turn, will likely influence future processes such as net primary
productivity, animal movement, forage availability, and habitat.
Example of Specific Measurements of this Indicator: Metrics
commonly quantified using landscape description software and
GIS, such as FRAGSTATS (McGarigal and Marks 1995) or r.le
(Baker and Cai 1992) programs; vegetative cover most common
base map used.
5. Leaf area index (LAI)Resource Monitored: Ecosystem structure and function - primary
productivity
Justification: Leaf area index is highly correlated with net primary
productivity, a critical ecosystem process that describes the
accumulation of biomass over some time period. Productivity
reflects many current conditions within ecosystems such as
climatic trends. Leaf area index is relatively easy to measure
with today’s remote sensing technology and, given its strong
relationship to primary productivity
Comment: Because of its relationship with aboveground net primary
productivity, estimates of LAI provide maximum information
about the productivity of the ecosystem with a single measure.
Leaf area index is also a good surrogate for photosynthetic ca-
pacity (greenness)
Example of Specific Measurements of this Indicator: Remotely
sensed data such as NDVI (Normalized Difference Vegetation
Index) may be used. These data are inexpensive and are pub-
lished on a regular basis.
LITERATURE CITEDLITERATURE CITED
Baker, W.L., and T.T. Veblen. 1990. Spruce beetles and fires in the nine-teenth-century subalpine forests of western Colorado, USA. Arct. Alp. Res. 22: 65-80.
Brown, J.K. 1975. Fire cycles and community dynamics in lodgepole pine forests. In D.M. Baumgartner, ed., Management of lodgepole pine ecosystems, pp 429-56. Washington State Univ. Coop. Ext. Ser., Pull-man, Washington.
Despain, D.G. 1983. Nonpyrogenous climax lodgepole pine communi-ties in Yellowstone National Park. Ecol. 64: 231-234.
Despain, D.G. 1990. Yellowstone vegetation: consequences of environ-ment and history in a natural setting. Roberts Rinehart, Boulder, CO.
Houston, D.B. 1982. The northern Yellowstone Elk: Ecology and Man-agement. MacMillan, New York.
Knight, D.H., J.B. Yavitt, and G.D. Joyce. 1991. Water and nitrogen outflow from lodgepole pine forest after two levels of tree mortality. Forest Ecol. Mgmt. 46: 215-225.
Knight, D.H. 1994. Mountains and plains: The ecology of Wyoming landscapes. Yale University Press, New Haven.
78 • Appendix III: Conceptual Models
Litton, C.M., M.G. Ryan, D.B. Tinker, and D.H. Knight. Below- and aboveground biomass in young post-fire lodgepole pine forests of con-trasting tree density. In press. Can. J. For. Res.
Lotan, J.E. 1975. The role of cone serotiny in lodgepole pine forests. In D.M. Baumgartner, ed., Management of lodgepole pine ecosystems, pp 429-56. Washington State Univ. Coop. Ext. Ser., Pullman, Wash-ington.
Lotan, J.E., and D.A. Perry. 1983. Ecology and regeneration of lodge-pole pine. U.S. Dept. Agric. Handb. 606.
McGarigal, K., and B.J. Marks. 1995. FRAGSTATS: Spatial pattern analysis program for quantifying landscape structure. Pacific North-west Research Station, U.S. Department of Agriculture Forest Service, General Technical Report, PNW-GTR-351, Portland, OR, 123 pp.
Moir, W.H. 1969. The lodgepole pine zone in Colorado. Am. Midl. Nat. 81: 87-98.
Romme, W.H., D.H. Knight, and J.B. Yavitt. 1986. Mountain pine beetle outbreaks in the Rocky Mountains: Regulators of primary productivity? Am. Nat. 127: 484-494.
Romme, W.H., and D.G. Despain. 1989. Historical perspective on the Yellowstone fires of 1988. BioScience 39: 695-699.
Singer, F.J., W. Schreier, J. Oppenheim, and E.O. Garton. 1989. Drought, fires, and large mammals. Bioscience 39: 716-722.
Tinker, D.B. and D.H. Knight. 2000. Coarse Woody Debris Following Fire and Logging in Wyoming Lodgepole Pine Forests. Ecosystems 3: 472-483.
Tinker, D.B., W.H. Romme, W.W. Hargrove, R.G. Gardner and M.G. Turner. 1994. Landscape-scale heterogeneity in lodgepole pine sero-tiny. Can. J. For. Res. 24: 897-903.
Tinker, D.B., W.H. Romme, and D.G. Despain. Historic range of vari-ability in landscape structure in subalpine forests of the Greater Yel-lowstone Area. In press. Landscape Ecology.
Turner, M.G., W.H. Romme, R.H.Gardner, and W.W. Hargrove. 1997. Effects of fire size and pattern on early succession in Yellowstone Na-tional Park. Ecological Monographs 67(4): 411-433.
Turner, M.G., Tinker, D.B., Romme, W.H., and Kashian, D.M. Landscape patterns of sapling density, leaf area, and aboveground primary pro-duction in postfire lodgepole pine forests, Yellowstone National Park. Ecosystems. Submitted.
Veblen, T.T., K.S. Hadley, M.S. Reid, and A.J. Rebertus. 1991. The re-sponse of subalpine forests to spruce beetle outbreaks in Colorado. Ecology 72: 213-231.
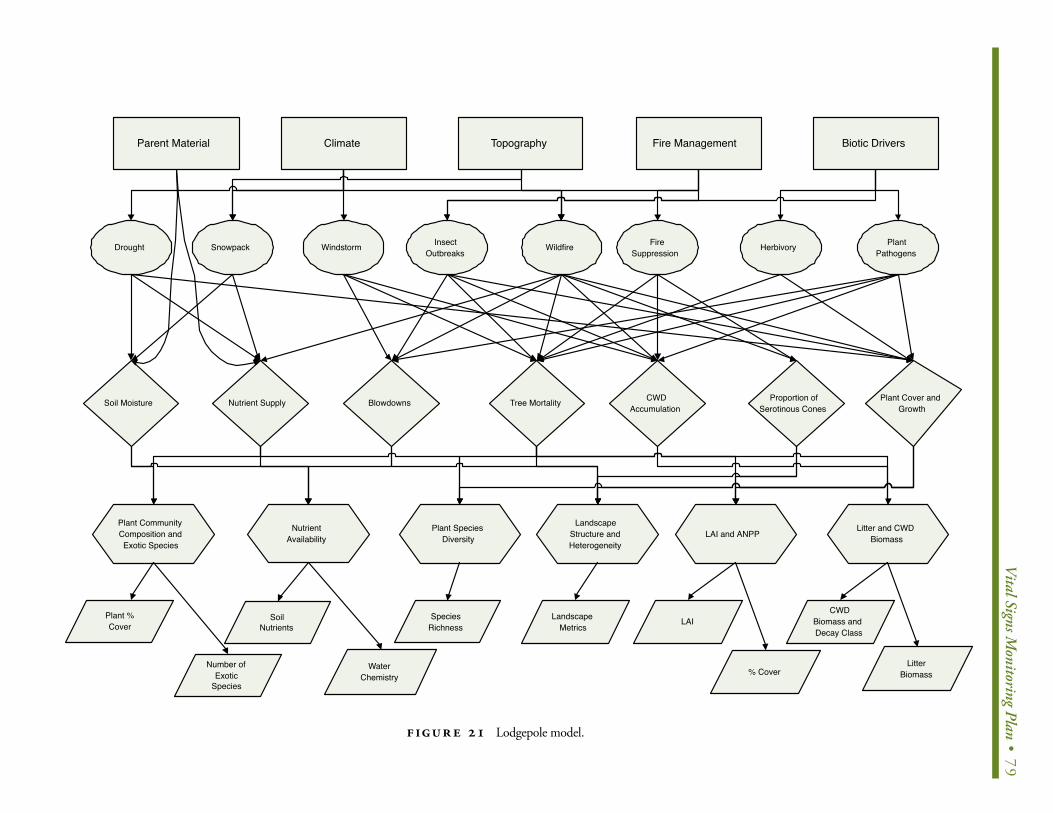
V
ital Signs Monitoring Plan • 79
Parent Material Biotic DriversFire ManagementTopographyClimate
Drought PlantPathogens
HerbivoryFireSuppression
WildfireInsectOutbreaks
WindstormSnowpack
Soil Moisture Plant Cover andGrowth
Proportion ofSerotinous Cones
CWDAccumulation
Tree MortalityBlowdownsNutrient Supply
Plant CommunityComposition andExotic Species
Litter and CWDBiomassLAI and ANPP
LandscapeStructure andHeterogeneity
Plant SpeciesDiversity
NutrientAvailability
Plant %Cover
LandscapeMetrics
SpeciesRichness
WaterChemistry
SoilNutrients
Number ofExotic
Species
LitterBiomass
CWDBiomass andDecay Class
% Cover
LAI
FIGUR E 21 Lodgepole model.
80 • Appendix III: Conceptual Models
M I X E D C O N I F E R E C O S Y S T E M N A R R AT I V E C O N C E P T UA L M O D E L
(author: Dan Tinker)(author: Dan Tinker)
For the purposes of this document, mixed conifer forests are con-
sidered to be forest types that are dominated by species other than
lodgepole pine (Pinus contorta var. latifolia) or aspen (Populus tremu-
loides). This would include primarily Douglas-fir (Pseudotsuga menzie-
sii) forests and spruce-fir (Engelmann spruce (Picea engelmanii) and
subalpine fir (Abies lasiocarpa)) forests. Notably, all of these forest
types may contain some component of the other, and may also con-
tain individuals of limber pine (Pinus flexilis) lodgepole pine or aspen;
however, in many areas, Douglas-fir forests occur at lower eleva-
tions than lodgepole pine forests, and spruce-fir forests are typically
found to occur at higher elevations than lodgepole pine (Peet 2000).
These montane forests are relatively ubiquitous in the GRYE, and
range from 1,800-3,200 m in elevation. In BICA, mixed conifer forests
are found primarily on the eastern slopes of East Pryor Mountain, in
the western portion of the Bighorn Canyon Recreation Area.
Fire regimes are quite different between Douglas-fir forests and
spruce-fir forests, and are addressed separately here. Douglas-fir
trees produce very thick bark, enabling individual trees to survive
many surface fires (Veblen and Lorenz 1986). Crown fires also oc-
cur periodically in Douglas-fir forests, and fire return intervals have
been estimated from 20-25 years in northern areas of Yellowstone
National Park (Houston 1973) up to 60 years in northwest Montana
(Arno and Gruell 1986). Because spruce-fir forests are often the cli-
max condition of stands that began as lodgepole pine, fire return in-
tervals for spruce-fir forests are more similar to lodgepole pine, and
may be even longer than 100-300 years at higher elevations where
spruce and fir dominate the forest composition (Knight 1994).
Conceptual Model DevelopmentMany of the drivers, stressors, and ecological responses in mixed co-
nifer forests are similar to those in lodgepole pine forests, because
of the coexistence of many of the species.
A. DRIVERSYellowstone’s climate is characterized by long, cold winters, and cool,
dry summers. Most of the precipitation falls in the form of snow. Winter
Snowpack melts rapidly in May and June, providing much of the water
available for growth in lodgepole pine forests. In addition, periods of
seasonal drought, such as were experienced during the summer of 1988,
may exert considerable influence on soil and fuel moisture, as well as
fire regimes. Precipitation in BICA is quite variable, with the northern end
of the Area receiving over 19 inches of precipitation per year, while the
drier southern end receives, on average, only slightly more than seven
inches per year (Knight et al. 1987). The climate is relatively more cool
and moist at higher elevations, where mixed conifer forests occur. Be-
cause of its effects on precipitation, growing season, and tree mortality
in both the GRYE and the BICA, elevation is also an important factor in
determining the occurrence of wildfires.
Given the importance of fire in mixed conifer ecosystems, the
management of prescribed fires and wildfires may greatly influence
many natural ecosystem processes. For example, large, intense
crown fires may help control episodic outbreaks of Mountain Pine
Beetle by burning entire stands where significant outbreaks have
occurred. Many of the indirect effects of fire suppression will be
discussed below in subsequent sections.
Biotic drivers such as insects, plant pathogens and disease, and
herbivory by both ungulates and insects may directly and indirectly
affect many ecological processes in mixed conifer ecosystems. As
more fully described below in the section on Stressors, these biotic
drivers can lead to extensive episodes of tree mortality, which can
affect critical processes such as coarse woody debris accumulation,
changes in plant species composition, and net primary productivity.
The parent materials for soils across much of the Greater Yellowstone
Area are largely volcanic in origin. Two different parent materials, derived
from underlying bedrock, determine the soil characteristics in Yellowstone.
Rhyolitic soils are found most often on drier sites, and are typically very nu-
trient limited. Andesitic soils are relatively more fertile, and often occur at
higher elevations (Despain 1990). Differences in these parent materials is
responsible for soil texture, and therefore, water holding capacity, as well as
nutrient supply and availability. Rhyolitic soils are more sandy while andes-
itic soils contain much more clay (Despain 1990). Calcium is ten times more
abundant in soils derived from andesite (Despain 1990).
In the BICA, mixed conifer forests on East Pryor Mountain occur primar-
ily on shallow soils, where fractured bedrock reservoirs may serve as water
sources during an otherwise dry growing season (Knight et al. 1987).
B. STRESSORS AND ECOLOGICAL RESPONSESDrought, snowpack, and windstorms, all driven by weather and climate,
affect many important ecosystem processes. Drought will affect soil
moisture during the growing season, thereby affecting plant develop-
ment and primary productivity, as well as forage abundance. Reduced
Vital Signs Monitoring Plan • 81
soil moisture may also reduce nutrient supplies by a reduction in microbi-
al activities such as decomposition and mineralization (Litton et al. 2003).
Snowpack is the single largest contributor to soil moisture, and therefore
water and nutrient availability during the growing season. Windstorms
may cause large blowdowns, such as the 6,000-ha event that occurred
in the Teton Wilderness in 1987. These events directly affect forest and
landscape structure through widespread tree mortality and creation and
accumulation of large quantities of coarse woody debris (CWD) and
standing dead trees. Large areas of uprooted trees may also allow for
the invasion of new plant species, and may also affect the growth rates
of the new and existing species.
Abiotic stressors such as wildfire and human-induced changes to the
ecosystem via management impacts can also alter ecological charac-
teristics of mixed conifer forest systems. Wildfire affects many aspects
of these ecosystems, including both the volatization and creation of es-
sential nutrients from the organic materials combusted or consumed by
fire (Knight et al. 1991). Wildfire directly kills many trees during severe
surface or crown fires, which results in significant additions to the CWD
biomass of these forests (Tinker and Knight 2000). Also, fire clearly can
eliminate existing plant cover, but also provides new substrate for rapid
reestablishment of residual plants, as well as the establishment of seral
species such as aspen and lodgepole pine (Turner et al. 1997). If fire sup-
pression efforts are successful, this will obviously result in a reduction of
tree mortality and CWD accumulation, and may allow for the build-up of
high levels of woody fuels.
Biotic stressors, primarily insects and plant pathogens, have impor-
tant effects in mixed conifer forest ecosystems (Romme et al. 1986; Ve-
blen et al 1991). Openings may be created in the forest canopy through
tree mortality, which can result in increases in understory vegetation
production (Knight 1994). Plant parasites, such as dwarf mistletoe and
comandra blister rust, are also common in many of these forests. The na-
tive mountain pine beetle is present at low population levels most of the
time (Brown 1975; Baker and Veblen 1990), but periodic outbreaks, such
as occurred during the 1970s in YNP, resulting in the death of thousands
of trees (Despain 1990). This, in turn, also leads to changes in CWD bio-
mass and distribution, plant species composition and productivity, and
fuel availability, as well as broad-scale changes in landscape patterns
(Romme et al. 1986). Herbivory, both by insects and ungulates, may re-
duce plant cover and may result in the mortality of young seedlings and
saplings (Houston 1982; Singer et al. 1989).
Nutrient availability can be important for determining the propor-
tions of spruce and fir in many mixed conifer forests. On sites where
nutrients are limiting, as is common on many of the drier sites at lower
elevations in the GRYE, lodgepole pine may be the only coniferous tree
that is able to survive; on more nutrient rich sites, spruce and fir will
generally be more abundant in mature forests (Peet 2000).
C. INDICATORS Departures from the natural range of variability in plant community
composition in mixed conifer ecosystems may indicate structural and
functional changes in the ecosystem resulting from natural perturba-
tions such as drought, fire, or windstorm, or human-caused distur-
bances or alterations such as non-prescribed fire or fire management
(Pickett 1976). Vegetative reproduction following disturbance is the
most common mechanism for herbaceous and shrubby plant reestab-
lishment, as well as invasion by exotic species (Anderson and Romme
1991) and departures from this contribution may indicate consider-
able degradation of the seed bank. High population levels of spruce
beetle or budworms within a stand may indicate that a stand has rela-
tively low growth rates, which is often indicative of low vigor. Spruce
beetles typically attack older stands that contain a high proportion of
Engelmann spruce in the canopy. If stand-replacing fires are reduced
through fire suppression, these older, senescent stands may facilitate
increases in beetle population numbers. The density of standing dead
trees, or snags, is an indicator of the amount of chronic, baseline mor-
tality occurring within a stand, or across the landscape, and can help
predict areas where beetle infestations may increase. Forest floor lit-
ter and coarse woody debris play important ecological roles in mixed
conifer systems (Tinker and Knight 2000). CWD may provide habitat
for many organisms (Harmon et al. 1986), and many decomposers
such as bacteria and fungi derive energy and nutrients from decay-
ing forest floor materials (Frankland et al. 1982). CWD and litter are
also important inputs to soil organic matter (Edmonds 1991). Mixed
conifer systems in the Greater Yellowstone Ecosystem and in BICA are
often nitrogen- and nutrient-limited. Forest floor litter and CWD pro-
vide critical raw organic material for decomposition and mineralization
processes. The heterogeneity of mixed conifer landscapes influences
many important ecosystem functions such as habitat use and foraging
patterns (Pearson 1993; Turner et al. 1994), nutrient movement (Peter-
john and Corell 1984), and disturbance dynamics (Turner 1987). Distur-
bance is now considered an integral part of mixed conifer ecosystems.
Various disturbance types such as fire, insect outbreaks, windstorms,
and earthquakes may significantly alter landscape structure in these
ecosystems. This, in turn, will likely influence future processes such
82 • Appendix III: Conceptual Models
as net primary productivity, animal movement, forage availability, and
habitat. Along with landscape metrics, an understanding of the age
structures of the mixed conifer forests provides insights into the long-
term effects of fire suppression, grazing, and other human influences
within the ecosystem.
1. Plant community composition and exotic speciesResource Monitored: Flora – plant species presence and abundance
Justification: Departures from the natural range of variability in com-
munity composition in mixed conifer ecosystems may indicate
structural and functional changes in the ecosystem resulting
from natural perturbations such as drought, fire, or windstorm,
or human-caused disturbances or alterations such as non-pre-
scribed fire or fire management (Pickett 1976). Vegetative repro-
duction following disturbance is the most common mechanism
for herbaceous and shrubby plant reestablishment (Anderson
and Romme 1991) and departures from this contribution may
indicate considerable degradation of the seed bank.
Comment: This indicator is relatively well-understood and may
therefore be most useful when attempting to evaluate current
ecosystem conditions.
Example of Specific Measurements of this Indicator: Total spe-
cies present and estimate of percent cover of each in relation
to expected species present within the community. Common
measures include quadrat and relevé methods.
2. Beetle and budworm population levelsResource Monitored: Insect fauna
Justification: High population levels of spruce beetle within a stand
may indicate that a stand has relatively low growth rates, which
is often indicative of low vigor.
Comment: Spruce beetles typically attack older stands that contain
a high proportion of Engelmann spruce in the canopy. If stand-
replacing fires are reduced through fire suppression, these older,
senescent stands may facilitate increases in beetle population
numbers.
Example of Specific Measurements of this Indicator: Surveys of
actual numbers through the use of insect traps, or surveys of
beetle evidence within a stand, which may serve as a proxy of
beetle populations.
3. Understory Plant species diversityResource Monitored: Flora – Biodiversity
Justification: High species diversity may maintain ecosystem stability
through redundancy of the ecological roles of different species.
Comment: This is a very easy indicator to measure and has much
public appeal, and is likely a priority of many agencies.
Example of Specific Measurements of this Indicator: Common
measures include quadrat and relevé methods.
4. Snag DensityResource Monitored: Ecosystem Structure
Justification: This measure is an indicator of the amount of chronic,
baseline mortality occurring within a stand, or across the land-
scape, and can help predict areas where beetle infestations
may increase.
Example of Specific Measurements of this Indicator: Common
measures include belt transect, quadrat, and relevé methods.
5. Forest floor litter and coarse woody debris (CWD)Resource Monitored: Ecosystem structure - forest floor structure;
ecosystem processes
Justification: Forest floor litter and coarse woody debris play impor-
tant ecological roles in mixed conifer systems (Tinker and Knight
2000). CWD may provide habitat for many organisms (Harmon
et al. 1986), and many decomposers such as bacteria and fungi
derive energy and nutrients from decaying forest floor materials
(Frankland et al. 1982). CWD and litter are also important inputs
to soil organic matter (Edmonds 1991).
Comment: Mixed conifer systems in the Greater Yellowstone Eco-
system are often nitrogen- and nutrient-limited. Forest floor
litter and CWD provide critical raw organic material for decom-
position and mineralization processes.
Example of Specific Measurements of this Indicator: Litter depth
and biomass; CWD biomass and percent cover. Common mea-
sures include line intercept method for CWD percent cover, pla-
nar intercept for CWD biomass, and randomly placed measures
of litter depth, with subsamples for dry weight.
6. Landscape structure and heterogeneity Resource Monitored: Landscape structure – patchiness, fragmen-
tation, core habitat, patch edge density
Justification: The spatial pattern of mixed conifer landscapes influences
many important ecosystem functions such as habitat use and forag-
ing patterns (Pearson 1993; Turner et al. 1994), nutrient movement
(Peterjohn and Corell 1984), and disturbance dynamics (Turner 1987).
Vital Signs Monitoring Plan • 83
Comment: Disturbance is now considered an integral part of mixed
conifer ecosystems. Various disturbance types such as fire, in-
sect outbreaks, windstorms, and earthquakes may significantly
alter landscape structure in these ecosystems. This, in turn, will
likely influence future processes such as net primary productiv-
ity, animal movement, forage availability, and habitat.
Example of Specific Measurements of this Indicator: Metrics
commonly quantified using landscape description software and
GIS, such as FRAGSTATS (McGarigal and Marks 1995) or r.le
(Baker and Cai 1992) programs; vegetative cover most common
base map used.
7. Age structure of forestResource Monitored: Ecosystem structure
Justification: Along with landscape metrics, an understanding of
the age structures of the mixed conifer forests provides insights
into the long-term effects of fire suppression, grazing, and other
human influences within the ecosystem.
Example of Specific Measurements of this Indicator: Age deter-
mination using tree increment borers to estimate the age of
dominant trees within a stand.
LITERATURE CITEDLITERATURE CITED
Anderson J.E. and W.H. Romme. 1991. Initial floristics in lodgepole pine (Pinus contorta) forests following the 1988 Yellowstone fires. In-ternational Journal of Wildland Fire 1: 119-124.
Arno, S.F., and G.E. Gruell. 1986. Douglas fir encroachment into mountain grasslands in southwestern Montana. J. Range Mgmt. 39: 272-276.
Baker, W.L., and T.T. Veblen. 1990. Spruce beetles and fires in the nine-teenth-century subalpine forests of western Colorado, USA. Arct. Alp. Res. 22: 65-80.
Brown, J.K. 1975. Fire cycles and community dynamics in lodgepole pine forests. In D.M. Baumgartner, ed., Management of lodgepole pine ecosystems, pp 429-56. Washington State Univ. Coop. Ext. Ser., Pull-man, Washington.
Despain, D.G. 1990. Yellowstone vegetation: consequences of environ-ment and history in a natural setting. Roberts Rinehart, Boulder, CO.
Edmonds, R.L. 1991. Organic matter decomposition in western United States forests. Pages 118-128 in Harvey and Neuenschwander, eds. Proceedings - Management and productivity of western-montane for-est soils. USDA, Forest Service General Technical Report INT-280.
Frankland, J.C., J.N. Hedger, and M.J. Swift. 1982. Decomposer ba-sidiomycetes: their biology and ecology. Cambridge University Press, London.
Harmon, M.E., J.F. Franklin, F.J. Swanson, P. Sollins, S.V. Gregory, J.D. Lattin, N.H. Anderson, S.P. Cline, N.G. Aumen, J.R. Sedel, G.W. Lien-daemper, K. Cromack, Jr., and K.W. Cummins. 1986. Ecology of coarse woody debris in temperate ecosystems. Adv. Ecol. Res. 15: 133-302.
Houston, D.B. 1973. Wildfires in northern Yellowstone National Park. Ecology 54: 1111-1117.
Houston, D.B. 1982. The northern Yellowstone Elk: Ecology and Man-agement. MacMillan, New York.
Knight, D.H., G.P. Jones, Y. Akashi, and R.W. Myers. 1987. Vegetation Ecology in the Bighorn Canyon National Recreation Area: Wyoming and Montana. University of Wyoming – National Park Service Re-search Center, Moran, WY. Final Report.
Knight, D.H., J.B. Yavitt, and G.D. Joyce. 1991. Water and nitrogen outflow from lodgepole pine forest after two levels of tree mortality. Forest Ecol. Mgmt. 46: 215-225.
Knight, D.H. 1994. Mountains and plains: The ecology of Wyoming landscapes. Yale University Press, New Haven.
Litton, C.M., M.G. Ryan, D.B. Tinker, and D.H. Knight. 2003. Below- and aboveground biomass in young post-fire lodgepole pine forests of con-trasting tree density. Can. J. For. Res. 33:351-363.
Pearson, S.M. 1993. The spatial extent and relative influence of land-scape-level factors on wintering bird populations. Landscape Ecology 8: 3-18.
Peet, R.K. 2000. Forests and meadows of the Rocky Mountains. In: M. G. Barbour and W.D. Billings, eds., North American Terrestrial Vegeta-tion, Second Ed., pp. 75-121. Cambridge Univ. Press, New York.
Peterjohn, W.T., and D.L. Corell. 1984. Nutrient dynamics in an agricul-tural watershed: observations on the role of a riparian forest. Ecology 65: 1466-1475.
Pickett, S.T.A. 1976. Succession: an evolutionary interpretation. Ameri-can Naturalist 110: 107-119.
Romme, W.H., D.H. Knight, and J.B. Yavitt. 1986. Mountain pine beetle outbreaks in the Rocky Mountains: Regulators of primary productivity? Am. Nat. 127: 484-494.
Singer, F.J., W. Schreier, J. Oppenheim, and E.O. Garton. 1989. Drought, fires, and large mammals. Bioscience 39: 716-722.
Tinker, D.B. and D.H. Knight. 2000. Coarse Woody Debris Following Fire and Logging in Wyoming Lodgepole Pine Forests. Ecosystems 3: 472-483.
Turner, M.G., editor. 1987. Landscape heterogeneity and disturbance. Springer-Verlag, New York, USA.
Turner, M.G., W.H. Romme, R.H.Gardner, and W.W. Hargrove. 1997. Effects of fire size and pattern on early succession in Yellowstone Na-tional Park. Ecological Monographs 67(4): 411-433.

84 • Appendix III: Conceptual Models
Turner, M.G., Y. Wu, W.H. Romme, L.L. Wallace, and A. Brenkert. 1994. Simulating winter interactions between ungulates, vegetation and fire in northern Yellowstone Park. Ecological Applications 4: 472-496.
Veblen, T.T., K.S. Hadley, M.S. Reid, and A.J. Rebertus. 1991. The re-sponse of subalpine forests to spruce beetle outbreaks in Colorado. Ecology 72: 213-231.
Veblen, T.T., and D.C. Lorenz. 1986. Anthropogenic disturbance and re-covery patterns in Montana forests, Colorado Front Range. Phys. Geog. 7: 1-24.

V
ital Signs Monitoring Plan • 85
Climate andPrecipitation Biotic DriversFire and
Fire ManagementElevation
Drought NutrientAvailability
InsectOutbreaks
PlantPathogens
FireSuppression
WildfiresWindstorms
andBlowdowns
AbundantStanding-Dead
Trees
Accumulation ofWoody Fuels
Increase inSpruce-Fir
ComponentTree Mortality
Reduction inUnderstory Plant
Diversity
Establishments ofLodgepole Pine or
Aspen in Understory
Plant %Cover
LandscapeMetrics
CWD andLitter Biomass
Number ofExotic
Species
Snag Densityand SpeciesComposition
Beetle andBudworm
Inventories
PlantCommunity
Compositionand Exotic
Species
Age Structureof Forest
LandscapeStructure andHeterogeneity
CWD andLitter
BiomassSnag Density
UnderstoryPlant Species
Diversity
Beetle andBudworm
PopulationLevels
Geology and ParentMaterial
Forest AgeStructure
Measurements
FIGUR E 22 Mixed conifer model.
86 • Appendix III: Conceptual Models
P O N D E RO S A P I N E E C O S Y S T E M N A R R AT I V E C O N C E P T UA L M O D E L
(author: Dan Tinker)(author: Dan Tinker)
Ponderosa pine woodlands occur only along the fringes of the east-
ern Rocky Mountains (Peet 2000) and, specifically within the GRYE,
only in the Bighorn Canyon Recreation Area. These relatively open
community types do not occur in the mountains of western Wyoming
in GTNP or YNP, but exist on lower elevation sites where summer pre-
cipitation is higher and the growing season is longer (Knight 1994).
The importance of ample summer precipitation for the establishment
and maintenance of Ponderosa pine woodlands is illustrated by its
absence in the southern portion of the BICA, where summer pre-
cipitation is ~30% of that of the more mesic northern portions of the
Area, where it is currently found. Many Ponderosa pine woodlands
in the Western U.S. have undergone dramatic transformation as a
result of successful fire suppression and the introduction of graz-
ing by domestic cattle (Peet 2000). This often results in a change to
more of a true forest condition, rather than a woodland, or savannah
physiognomy. Mechanisms for this shift are thought to be either a
reduction in the density of grasses (Savage and Swetnam 1990) or
increased establishment of seedlings following fires (Marr 1961).
While many Ponderosa pine communities of the southwestern
U.S. have experienced frequent, low-intensity fires that often limit
regeneration, pine woodlands in more northerly latitudes such as in
BICA may have evolved with longer fire-return intervals, on the order
of 25-40 years (Rowdabaugh 1978; Laven et al 1980).
Conceptual Model Development
A. DRIVERSThe climate of the BICA area is often described as temperate and
semi-arid. As noted earlier, the occurrence of critical summer precip-
itation limits the distribution of ponderosa pine to the more northern
areas of the Area, where annual precipitation averages 49 cm; ap-
proximately two-thirds of this falls during spring and early summer,
and the rest as snow (Knight et al. 1987).
Given the importance of fire in ponderosa pine ecosystems, the
management of prescribed fires and wildfires can dramatically influ-
ence tree regeneration, as well as many other natural ecosystem
processes. Some of the indirect effects of fire suppression will be
discussed below in subsequent sections.
The biotic drivers may, in the case of BICA, be among the most
important in the development, maintenance, or loss of ponderosa
pine woodlands. Biotic drivers such as insects, plant pathogens and
disease, and cattle grazing may directly or indirectly affect many
ecological processes in ponderosa pine ecosystems. As more fully
described below in the section on Stressors, these biotic drivers
can lead to extensive episodes of tree mortality or creation of dense
doghair stands, both of which can affect critical processes such as
coarse woody debris accumulation and stand density.
B. STRESSORS AND ECOLOGICAL RESPONSESAs previously mentioned, summer precipitation, and its effect on
soil moisture, is very important for the establishment and growth
of ponderosa pine (Knight 1994). Successive drought years may re-
sult in the mortality of mature trees and particularly seedlings, even
though young trees are somewhat drought resistant (Wellner 1970).
Many human activities, including fire suppression, introduction of
exotic plant species, and grazing by domestic cattle currently affect
many aspects of ponderosa pine woodlands in BICA. For example,
because historic frequent fires normally reduce the number of new
seedlings that establish, elimination of these fires during the last
century allows for the development of dense, doghair stands of pon-
derosa pine, which creates additional woody fuels for more severe
crown fires (Knight 1994). Livestock or wild horse grazing may also
improve conditions for seedling establishment through the removal
of plant competition. Further, as mature trees die or are killed by pine
beetles or other plant pathogens, invasion by exotic plant species
may inhibit the germination and establishment of replacement trees,
causing a shift in plant community composition and tree density. The
pine beetle outbreaks may occur during years of inadequate precipi-
tation, when mature trees are unable to produce sufficient resins to
defend against beetle infestation (Knight 1994).
C. INDICATORSPonderosa pine is very sensitive to soil moisture availability. As an
example, it is conspicuously absent from the southern end of the
Bighorn Canyon, where summer rainfall is quite low, but is relatively
abundant at similar elevations in the northern end of the canyon,
where summer precipitation is much higher (Knight 1994). Ponderosa
pine is also sensitive to cold pockets, such as collect in some drain-
ages. However, many drainages in Bighorn Canyon contain ponder-
osa pine, where soil moisture availability is higher than surrounding
uplands. Many ponderosa pine forests have dramatically increased
in stand density as a result of fire suppression (Covington and Moore
Vital Signs Monitoring Plan • 87
1994). This is thought to be a significant departure from more park-
like stand structure characteristic of pre-European settlement. If fire
suppression continues, stand densities may continue to increase, re-
sulting in an increased susceptibility to intense, stand-replacing fires.
Exotic species composition and abundance is a critical issue in these
ecosystems. Many ponderosa pines, especially in riparian areas and
in drainages, are being eliminated in Bighorn Canyon by the invasion
of exotic species such as tamarisk and Russian olive (Laura Gianakos,
personal communication; personal observation, 2003). The propor-
tion of standing dead trees serves as an indicator of both the sus-
ceptibility to intense, stand-replacing fires, which is not the typical
fire regime for most ponderosa pine stands, as well as a response
variable to mountain pine beetle infestation. The suppression of fire
may allow mortality from beetle outbreaks to increase, as well as
increase the risk of severe fires.
1. Soil MoistureResource Monitored: Ecosystem structure and function.
Justification: Ponderosa pine is very sensitive to soil moisture
availability. As an example, it is conspicuously absent from the
southern end of the Bighorn Canyon, where summer rainfall
is quite low, but is relatively abundant at similar elevations in
the northern end of the canyon, where summer precipitation is
much higher (Knight 1994).
Comment: Ponderosa pine is also sensitive to cold pockets, such as
collect in some drainages. However, many drainages in Bighorn
Canyon contain ponderosa pine, where soil moisture availabil-
ity is higher than surrounding uplands.
Example of Specific Measurements of this Indicator: Seasonal
soil moisture monitoring.
2. Stand DensityResource Monitored: Ecosystem structure and function.
Justification: Many ponderosa pine forests have dramatically in-
creased in density as a result of fire suppression (Covington and
Moore 1994). This is thought to be a significant departure from
more park-like stand structure characteristic of pre-European
settlement.
Comment: If fire suppression continues, stand densities may con-
tinue to increase, resulting in an increased susceptibility to in-
tense, stand-replacing fires.
Example of Specific Measurements of this Indicator: Belt transect
measures of stand density, or other quadrat or plot measurements.
3. Exotic species composition and abundanceResource Monitored: Flora – species composition and abundance.
Justification: Many ponderosa pines, especially in riparian areas
and in drainages, are being eliminated in Bighorn Canyon by the
invasion of exotic species such as tamarisk and Russian olive
(personal observation, 2003).
Example of Specific Measurements of this Indicator: Plant spe-
cies surveys and percent cover estimates using quadrats.
4. Proportion of standing dead treesResource Monitored: Ecosystem structure and function.
Justification: This serves as an indicator of both the susceptibility
to intense, stand-replacing fires, which is not the typical fire
regime for most ponderosa pine stands, as well as a response
variable to mountain pine beetle infestation. The suppression of
fire may allow mortality from beetle outbreaks to increase, as
well as increase the risk of severe fires.
Example of Specific Measurements of this Indicator: Belt tran-
sects or other quadrat methods for quantifying density of live
and dead trees.
LITERATURE CITEDLITERATURE CITED
Covington, W.W., and M.M. Moore. 1994. Southwestern ponderosa forest structure and resource conditions: changes since Euro-American settlement. Journal of Forestry 92: 39-47.
Knight, D.H., G.P. Jones, Y. Akashi, and R.W. Myers. 1987. Vegetation Ecology in the Bighorn Canyon National Recreation Area: Wyoming and Montana. University of Wyoming – National Park Service Re-search Center, Moran, WY. Final Report.
Knight, D.H. 1994. Mountains and Plains: the ecology of Wyoming landscapes. Yale University Press, New Haven. 338 pp.
Laven, R.D., P.N. Omi, J.G. Wyant, and A.S. Pinkerton. 1980. Interpreta-tion of fire scar data from a ponderosa pine ecosystem in the central Rocky Mountains, Colorado, pp. 46-49 In: M.A. Stokes and J.H. Diet-erich, eds., Proceedings of the fire history workshop, Oct. 20-24, 1980, Tucson, Arizona. USDA Forest Service, Gen. Tech. Report RM-81.
Marr, J.W. 1961. Ecosystems of the east slope of the Front Range in Colorado. University of Colorado Stud., Biol. 8.
Peet, R.K. 2000. Forests and meadows of the Rocky Mountains. In: M. G. Barbour and W.D. Billings, eds., North American Terrestrial Vegeta-tion, Second Ed., pp. 75-121. Cambridge Univ. Press, New York.
Rowdabaugh, K.M. 1978. The role of fire in the ponderosa pine-mixed conifer ecosystems. Master’s thesis, Colorado State University, Fort Collins, CO.

88 • Appendix III: Conceptual Models
Savage, M., and T.W. Swetnam. 1990. Early 19th-centure fire decline following sheep pasturing in a Navajo ponderosa pine forest. Ecology 71: 2374-2378.
Wellner, C.A. 1970. Regeneration problems in the Northern Rocky Mountains. In: Regeneration of ponderosa pine: symposium proceed-ings, p. 5-11. Sch. For., Oregon State University, Corvallis, OR, Sept 11-12, 1969.
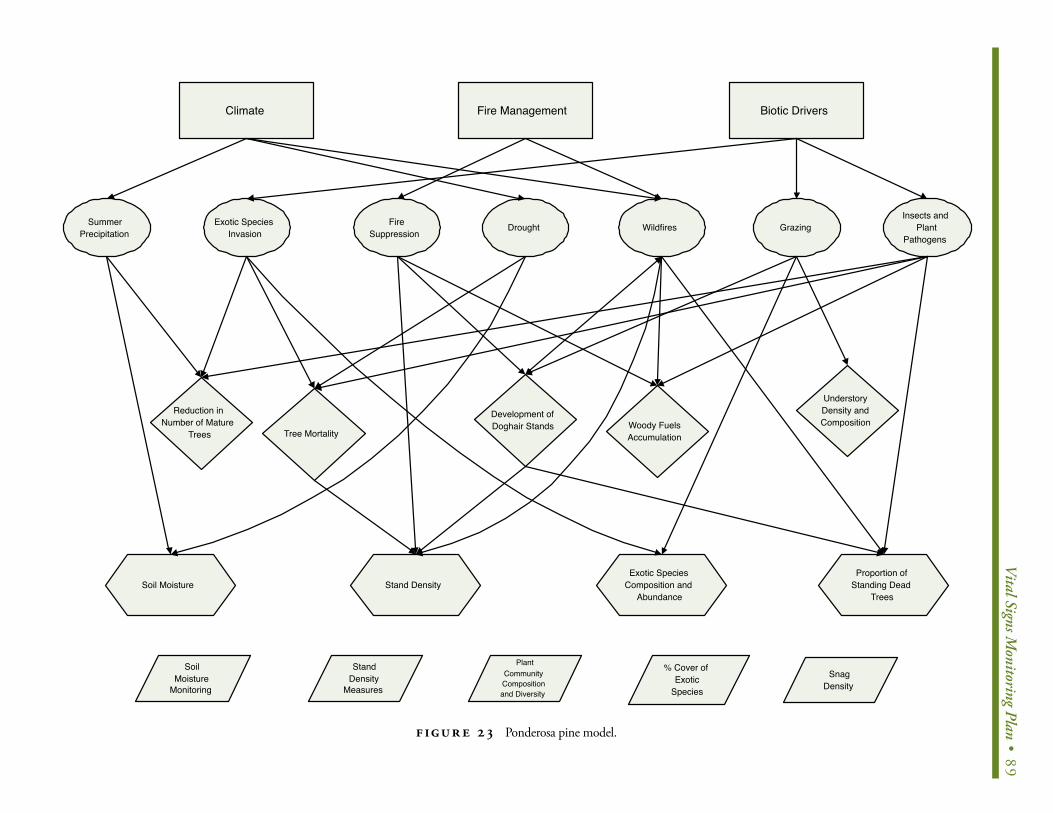
V
ital Signs Monitoring Plan • 89
Biotic DriversFire ManagementClimate
SummerPrecipitation
Insects andPlant
PathogensGrazingWildfiresDroughtFire
SuppressionExotic Species
Invasion
Reduction inNumber of Mature
Trees
UnderstoryDensity andCompositionWoody Fuels
Accumulation
Development ofDoghair Stands
Tree Mortality
Soil MoistureProportion of
Standing DeadTrees
Exotic SpeciesComposition and
AbundanceStand Density
SoilMoisture
MonitoringSnag
Density
% Cover ofExotic
Species
PlantCommunityCompositionand Diversity
StandDensity
Measures
FIGUR E 23 Ponderosa pine model.
90 • Appendix III: Conceptual Models
W H I T E B A R K P I N E E C O S Y S T E M N A R R AT I V E C O N C E P T UA L M O D E L
(author: Dan Tinker)(author: Dan Tinker)
Whitebark pine (Pinus albicaulis Elgelm.) is a high-elevation tree of
the Northern Rocky Mountains, forming open woodlands on rela-
tively xeric slopes (Arno and Hammerly 1977). Whitebark pine is a
member of the white pine group (Pinus subgenus Haploxylon), which
also contains limber pine, and does not typically form continuous,
closed stands characteristic of other montane forest species of the
Northern Rockies (Peet 2000). Regeneration of whitebark pine occurs
almost solely via seed dispersal by the Clark’s Nutcracker (Hutchins
and Lanner 1982). The birds will cache multiple seeds together in
open areas, often in recently burned forests, and unclaimed caches
will germinate and grow in the absence of shade and competition
(Tomback et al. 1990). This form of avian dispersal of seeds often
results in the germination and establishment of multi-stemmed trees
(Furnier et al. 1987). The relatively large seeds serve as an impor-
tant food source for at least 110 species of animals, including grizzly
bears and red squirrels (Tomback 1989).
Following intense fires in lodgepole or spruce-fir stands, whitebark
pine may act as a seral species, but is more typically found as a climax
species, since seedling establishment often ceases with the establish-
ment of more shade-tolerant species such as Engelmann spruce and
subalpine fir (Schuster et al. 1995). It is relatively abundant across the
subalpine plateaus of YNP, but only comprises about 2% of the vegeta-
tion in GTNP (Greater Yellowstone Coordinating Committee 1987).
Because of higher elevations, lower fuel accumulations, and
much bare ground below the canopy, whitebark pine ecosystems
burn less frequently than other Rocky Mountain conifers (Peet 2000).
Depending on the location and site conditions, presettlement fire
return intervals ranged from 30-300 years (Morgan et al. 1995).
Conceptual Model Development
A. DRIVERSMoisture and temperature are the two factors that largely control the
occurrence of different habitat types in the region (Despain 1990). The
climate of the Greater Yellowstone Area is characterized by long, cold
winters, and cool, dry summers. Most of the precipitation falls in the
form of snow. Winter Snowpack melts rapidly in May and June, pro-
viding much of the water available for growth in high elevation white-
bark pine forests. In addition, periods of seasonal drought, such as
were experienced during the summer of 1988, may exert considerable
influence on soil and fuel moisture, as well as fire regimes.
Biotic drivers such as plant competition, insects, and plant patho-
gens and disease, particularly white pine blister rust may directly
and indirectly affect many ecological processes in whitebark pine
ecosystems. As more fully described below in the section on Stress-
ors, these biotic drivers can lead to extensive episodes of tree mor-
tality, which can affect critical processes such as coarse woody de-
bris accumulation and net primary productivity.
Given the importance of fire in lodgepole pine ecosystems, the
management of prescribed fires and wildfires may greatly influence
many natural ecosystem processes. For example, large, intense
crown fires may help control episodic outbreaks of Mountain Pine
Beetle by burning entire stands where significant outbreaks have
occurred. Many of the indirect effects of fire suppression will be
discussed below in subsequent sections.
As mentioned earlier, the regeneration of whitebark pine occurs
almost solely via seed dispersal by the Clark’s Nutcracker (Hutchins
and Lanner 1982). The birds will cache multiple seeds together in
open areas, often in recently burned forests, and unclaimed caches
will germinate and grow in the absence of shade and competition
(Tomback et al. 1990).
B. STRESSORS AND ECOLOGICAL RESPONSESWildfire and management-related changes to the ecosystem such
as fire suppression can also affect whitebark pine systems. Wildfire
affects many aspects of these ecosystems, including both the volati-
zation and creation of essential nutrients from the organic materials
combusted or consumed by fire (Knight et al. 1991). Wildfire directly
kills many trees during severe surface or crown fires, which results
in significant additions to the CWD biomass of these forests (Tinker
and Knight 2000). Also, fire clearly can eliminate plant cover, but
also provides new substrate for rapid reestablishment of residual
plants (Turner et al. 1997). If fire suppression efforts are successful,
this will obviously result in a reduction of tree mortality and CWD
accumulation, and may allow for the build-up of high levels of woody
fuels (Keane 2001). In addition, removing fire from these systems
may result in increases in late successional forest and replacement
of whitebark pine by more shade-tolerant species such as subalpine
fir and Engelmann spruce (Arno and Hoff 1990, Keane et al. 1994).
Drought and wind, snow, and ice abrasion, all driven by weather
and climate, affect many important ecosystem processes. Drought
Vital Signs Monitoring Plan • 91
will affect soil moisture during the growing season, thereby affect-
ing plant development and primary productivity, as well as forage
abundance. Reduced soil moisture may also reduce nutrient supplies
by a reduction in microbial activities such as decomposition and
mineralization (Litton et al. 2003). Snowpack is the single largest
contributor to soil moisture, and therefore water and nutrient avail-
ability during the growing season. Because many whitebark pine
communities occur at higher elevations, where growing conditions
are often quite harsh, abrasion from wind, snow and ice can affect
tree growth and vigor, or in extreme conditions, may result in the
mortality of individual trees.
Biotic stressors have also accelerated the successional process in
many whitebark pine forests, largely through epidemic outbreaks of
the exotic white pine blister rust and native mountain pine beetles
(Keane 2001). Other plant parasites, such as dwarf mistletoe is also
common in these forests. The native mountain pine beetle is present
at low population levels most of the time (Brown 1975; Baker and
Veblen 1990), but periodic outbreaks, such as occurred during the
1970s in YNP, may result in the death of numerous trees (Despain
1990). This, in turn, can also leads to changes in runoff and erosion
in high-elevation stands, along with an increase in establishment
of other tree species such as Engelmann spruce and subalpine fir
(Keane et al. 1994; Arno 1986).
C. ECOLOGICAL INDICATORSClark’s Nutcracker abundance is critical for the regeneration of white-
bark pine, which occurs almost solely via seed dispersal by the Clark’s
Nutcracker (Hutchins and Lanner 1982). The birds will cache multiple
seeds together in open areas, often in recently burned forests, and
unclaimed caches will germinate and grow in the absence of shade
and competition (Tomback et al. 1990). Following intense fires in
lodgepole or spruce-fir stands, whitebark pine may act as a seral
species, establishing in the newly burned forest floor, where cached
seeds distributed by Clark’s Nutcrackers can germinate and establish
in the absence of competition (Tomback et al. 1993). The burned for-
est seedbed availability is therefore very important for the germina-
tion and establishment of new whitebark pine seedlings. Whitebark
pine is considered a “keystone” species for upper elevation areas
in the Greater Yellowstone Ecosystem (Tomback et al. 2001), and
the monitoring of the density of high-elevation whitebark pine trees
is likely a good indicator of population trends. Further, because of
fire suppression and recent outbreaks of Mountain Pine Beetle and
White Pine Blister Rust, whitebark pine is thought to be declining
throughout the GYE (Tomback et al. 2001). Fire exclusion may have
reduced fire frequency in many high elevation forests of the GYE, and
consequently, the abundance of replacement tree species such as
subalpine fir and Engelmann spruce may be another excellent indica-
tor of population trends in whitebark pine (Arno 1986; Keane et al.
1994). The production of whitebark pine cones, and therefore seeds,
is critical as forage for both Clark’s Nutcrackers and Grizzly bears, as
well as for the reestablishment of whitebark pine at both high and
low elevations (Tomback et al. 2001). In addition, reduction of cone
production can be an early indicator of infection by White Pine Blis-
ter Rust, which often kills cone-bearing branches prior to killing the
entire tree (Tomback et al. 2001). Cone production in whitebark pine
does not occur until trees reach the age of 20-30 years (Krugman
and Jenkinson 1974). A significant reduction in cone – and therefore
seed – production could represent a major shift in age classes at
higher elevations. White pine blister rust is an exotic plant patho-
gen that only infects five-needle pines such as whitebark or limber
pine (Tomback et al. 2001). In some areas of the Rocky Mountains,
whitebark pine mortality has reached 90 percent (Keane et al. 1994).
Monitoring of blister rust abundance and spread may help identify
newly-developed strains of the organism, such as drought-tolerant
strains that could accelerate the spread of the rust (Tomback et al.
2001). Finally, Whitebark pine in the Greater Yellowstone Ecosystem
is a major food source for grizzly bears, which primarily forage on
pine squirrel middens (Mattson et al. 1991) during the fall of the
year. During years of low cone and seed production, grizzly bears will
forage at lower elevations, searching for alternative sources of food.
This low elevation foraging by grizzly bears in autumn can serve as
a surrogate for estimates of annual cone and seed production. Griz-
zly bear foraging at lower elevations has historically resulted in in-
creases in management actions, i.e., trapping and relocating, as well
as increases in bear mortality (Mattson et al. 1992).
1. Clark’s Nutcracker AbundanceResource Monitored: Fauna – Seed disperser
Justification: Regeneration of whitebark pine occurs almost solely
via seed dispersal by the Clark’s Nutcracker (Hutchins and Lan-
ner 1982). The birds will cache multiple seeds together in open
areas, often in recently burned forests, and unclaimed caches
will germinate and grow in the absence of shade and competi-
tion (Tomback et al. 1990).

92 • Appendix III: Conceptual Models
Comment: This indicator is relatively well-understood and may
therefore be most useful when attempting to evaluate future
establishment of whitebark pine.
Example of Specific Measurements of this Indicator: Census
measures of Clark’s Nutcrackers could include simple counts or
nesting successes.
2. Burned forest seedbed availabilityResource Monitored: Ecosystem structure and function.
Justification: Following intense fires in lodgepole or spruce-fir
stands, whitebark pine may act as a seral species, establishing
in the newly burned forest floor, where cached seeds distrib-
uted by Clark’s Nutcrackers can germinate and establish in the
absence of competition (Tomback et al. 1993).
Comment: Fire suppression may reduce the amount of available
seedbed for whitebark pine establishment, especially at lower
elevations, where it acts as a seral species.
Example of Specific Measurements of this Indicator: Landscape
analysis using Geographic Information Systems to annually
map the locations and extent of fires within the ecosystem.
3. Low elevation foraging by grizzly bears in autumnResource Monitored: Fauna – forage and behavior.
Justification: Whitebark pine in the Greater Yellowstone Ecosystem
is a major food source for grizzly bears, which primarily forage
on pine squirrel middens (Mattson et al. 1991) during the fall of
the year. During years of low cone and seed production, grizzly
bears will forage at lower elevations, searching for alternative
sources of food. This presence at lower elevations can serve as
a surrogate for estimates of annual cone and seed production.
Comment: Grizzly bear foraging at lower elevations has historically
resulted in increases in management actions, i.e., trapping and
relocating, as well as increases in bear mortality (Mattson et
al. 1992).
Example of Specific Measurements of this Indicator: Monitoring
grizzly bear movements and foraging habits during late summer
and early fall using radio-collared bears and GIS.
4. Density of high-elevation whitebark pine trees Resource Monitored: Flora – species abundance and density.
Justification: Whitebark pine is considered a “keystone” species for
upper elevation areas in the Greater Yellowstone Ecosystem
(Tomback et al. 2001).
Comment: Because of fire suppression and recent outbreaks of
Mountain Pine Beetle and White Pine Blister Rust, whitebark
pine is thought to be declining throughout the GYE (Tomback
et al. 2001).
Example of Specific Measurements of this Indicator: Repeated
measures of whitebark pine stand densities at high elevations
using belt transects or remotely sensed data.
5. Abundance of replacement tree speciesResource Monitored: Ecosystem structure and function
Justification: Fire exclusion has reduced fire frequency in many
high elevation forests of the GYE, and consequently, it is being
replaced by shade-tolerant species such as subalpine fir and
Engelmann spruce (Arno 1986; Keane et al. 1994).
Example of Specific Measurements of this Indicator: Repeated
measures of high elevation community composition using belt
transect surveys or remotely sensed data.
6. Whitebark pine cone productionResource Monitored: Flora – regeneration and food source.
Justification: The production of whitebark pine cones, and there-
fore seeds, is critical as forage for both Clark’s Nutcrackers and
Grizzly bears, as well as for the reestablishment of whitebark
pine at both high and low elevations (Tomback et al. 2001). In
addition, reduction of cone production can be an early indicator
of infection by White Pine Blister Rust, which often kills cone-
bearing branches prior to killing the entire tree (Tomback et al.
2001).
Comment: Cone production in whitebark pine does not occur until
trees reach the age of 20-30 years (Krugman and Jenkinson
1974). A significant reduction in cone – and therefore seed
– production could represent a major shift in age classes at
higher elevations.
Example of Specific Measurements of this Indicator: Repeated
measures of stand-level cone production.
7. Blister Rust abundance and spreadResource Monitored: Ecosystem structure and function – plant
pathogens.
Justification: White pine blister rust is an exotic plant pathogen that only
infects five-needle pines such as whitebark or limber pine (Tomback
et al. 2001). In some areas of the Rocky Mountains, whitebark pine
mortality has reached 90 percent (Keane et al. 1994).
Vital Signs Monitoring Plan • 93
Comment: Monitoring of blister rust abundance and spread may
help identify newly-developed strains of the organism, such as
drought-tolerant strains that could accelerate the spread of the
rust (Tomback et al. 2001).
Example of Specific Measurements of this Indicator: Repeated
collections and analysis of samples of infected branches or
trees.
LITERATURE CITEDLITERATURE CITED
Arno, S.F. 1986. Whitebark pine cone crops – a diminishing source of wildlife food? Western Journal of Applied Forestry 1: 92-94.
Arno, S.F., and Hammerly, R.P. 1977. Northwest Trees. Seattle: The Mountaineers.
Arno, S.F., and Hoff, R. 1990. Pinus albicaulis Engelm. Whitebark pine. In: Burns, R.M., Honkala, B.H., tech. cords. Silvics of North America. Vol. 1: Conifers. Ag. Handbk. 654. Washington, DC: USDA Forest Ser-vice: 268-279.
Baker, W.L., and T.T. Veblen. 1990. Spruce beetles and fires in the nine-teenth-century subalpine forests of western Colorado, USA. Arct. Alp. Res. 22: 65-80.
Brown, J.K. 1975. Fire cycles and community dynamics in whitebark pine forests. In D.M. Baumgartner, ed., Management of whitebark pine ecosystems, pp 429-56. Washington State Univ. Coop. Ext. Ser., Pullman, Washington.
Despain, D.G. 1990. Yellowstone vegetation: consequences of environ-ment and history in a natural setting. Roberts Rinehart, Boulder, CO.
Furnier, G.R., Knowles, P., Clyde, M.A., and Dancik, B.P. 1987. Effects of avian seed dispersal on the genetic structure of whitebark pine popu-lations. Evolution 41: 607-612.
Greater Yellowstone Coordinating Committee. 1987. The Greater Yel-lowstone Area: An aggregation of national park and national forest management plans, Greater Yellowstone Coordinating Committee, map supplement 22.
Hutchins, H.E., and Lanner, R.M. 1982. The central role of Clark’s nut-cracker in the dispersal and establishment of whitebark pine. Oecolo-gia 55: 192-201.
Keane, R.E. 2001. Can the fire-dependent whitebark pine be saved? Fire Management Today 61: 0194-214X.
Keane, R.E., P. Morgan, and J.P. Manakis. 1994. Landscape assessment of the decline of whitebark pine (Pinus albicaulis) in the bob Marshall Wilderness Complex, Montana, USA. Northwest Science 68: 213-229.
Knight, D.H., J.B. Yavitt, and G.D. Joyce. 1991. Water and nitrogen outflow from whitebark pine forest after two levels of tree mortality. Forest Ecol. Mgmt. 46: 215-225.
Litton, C.M., M.G. Ryan, D.B. Tinker, and D.H. Knight. Below- and aboveground biomass in young post-fire whitebark pine forests of con-trasting tree density. Can. J. For. Res. 33:351-363.
Mattson, D.J., B.M. Blanchard, and R.R. Knight. 1991. Food habits of Yellowstone grizzly bears, 1977-1987. Canadian Journal of Zoology 69: 1619-1629.
Mattson, D.J., B.M. Blanchard, and R.R. Knight. 1992. Yellowstone grizzly bear mortality, human habituation, and whitebark pine seed crops. Journal of Wildlife Management 56: 432-442.
Morgan, P., S.C. Buntin, R.E. Keane, and S.F. Arena. 1995, pp. 136-141 In: Proceedings – International workshop on subalpine stone pines and their environment: the status of our knowledge. USDA Forest Service GTR INT-309.
Peet, R.K. 2000. Forests and meadows of the Rocky Mountains. Pp 75-121 In: North American Terrestrial Vegetation, M.G. Barbour and W.D. Billings, eds. Cambridge University Press, New York.
Schuster, W.S.F., Mitton, J.B., Uamaguchi, D.K., and Woodhouse, C.A. 1995. A comparison of limber pine (Pinus flexilus) ages at lower and upper treeline sites east of the continental divide in Colorado. Ameri-can Midland Naturalist 133: 101-111.
Tinker, D.B. and D.H. Knight. 2000. Coarse Woody Debris Following Fire and Logging in Wyoming Whitebark Pine Forests. Ecosystems 3: 472-483.
Tomback, D.F. 1989. The broken circle: fire, birds and whitebark pine. In: Walsh, T., ed. Wilderness and wildfire. Misc. Pub. 50, Missoula, MT: University of Montana, School of Forestry, Montana Forest and Range Experiment Station. 14-17.
Tomback, D.F., Hoffman, L.A., and Sund, S.K. 1990. Coevolution of whitebark pine and nutcrackers: implications for forest regeneration. In: Schmidt, W.C., McDonald, K.J., comps. Proceedings-Symposium on Whitebark pine ecosystems: Ecology and Management of a High Mountain Resource; 29-31 March 1989, Bozeman, MT. Gen. Tech. Rep. INT-270. Ogden, UT. USDA For. Serv., Intermountain Research Station: 118-130.
Turner, M.G., W.H. Romme, R.H.Gardner, and W.W. Hargrove. 1997. Effects of fire size and pattern on early succession in Yellowstone Na-tional Park. Ecological Monographs 67(4): 411-433.

94• Appendix III: C
onceptual Models
Fire Management Clarkís NutcrackersBiotic DriversClimate andPrecipitation
Wildfire Other PlantPathogens
Mountain PineBeetle
White PineBlister Rust
PlantCompetition
Wind, Snowand Ice
Abrasion
FireSuppression
Increase in LateSuccessional
Forest
Seed Dispersaland SeedlingEstablishment
Tree Growth andVigor
Replacement byShade-TolerantTree Species
Runoff andErosion
Tree MortalityWoody FuelsAccumulation
ClarkísNutcrackerMonitoring
Blister RustSurveys
Estimates ofCone and
SeedProduction
RepeatedMeasures of
StandConditions
MonitoringGrizzly Bear
ForagingHabits
GIS Analysis ofAnnual Burned
Acreage
ClarkísNutcrackerAbundance
Blister RustAbundanceand Spread
WhitebarkPine ConeProduction
Abundance ofReplacementTree Species
Density ofHigh-ElevationWhitebark Pine
Trees
Low-ElevationForaging by
Grizzly Bearsin Autumn
BurnedForest
SeedbedAvailability
FIGUR E 24 Whitebark pine model.
Vital Signs Monitoring Plan • 95
R I PA R I A N / R I V E R I N E E C O S Y S T E M N A R R AT I V E C O N C E P T UA L M O D E L
(author: Duncan Patten)(author: Duncan Patten)
IntroductionRiverine systems often include terrestrial habitat: riparian ecosys-
tems, stream-edge wetlands and nearly-barren sediment deposits;
and aquatic habitats. This discussion of riverine systems is limited to
the terrestrial ecosystems. Riparian and edge-wetlands are grouped
as riparian ecosystems. Riparian ecosystems, the transition from
stream to upland, occupy a very small part of the landscape, often
less than 1 %, and yet play an important role in stream dynamics,
wildlife ecology, and biodiversity. (Naiman et al., 1993; Naiman and
Decamps, 1997; Patten, 1998). In most cases riparian ecosystems oc-
cur on alluvial sediment deposits where the hydrological connection
between river and alluvial groundwater supplement water available
from precipitation (Gregory et al., 1991). Riparian ecosystems offer
many ecological services and functions. These services and functions
are closely related to the structure, composition and abundance of
the riparian vegetation and its location within the landscape. Ripar-
ian ecosystems not only influence hydrologic and geomorphic pro-
cesses, but are driven by these processes as well. This synergistic
relationship between riparian vegetation and hydrogeomorphic
phenomena complicates the understanding of riparian response to
human activities. One important function of riparian systems is that
of habitat for a wide variety of organisms. In semi-arid regions over
75% of animals species use riparian ecosystems for all or part of
their life cycle (Brinson et al. 1981; Kondolf et al. 1996). Because
of close affinity with various characteristics of riparian ecosystems,
avian community composition often is used as a surrogate for condi-
tion of riparian systems (Anderson et al. 1983; Hunter et al. 1987).
The occurrence of most riparian communities in the Greater Yel-
lowstone Network (GRYN) parks results from recruitment and survival
of obligate riparian plant species in response to seasonal hydrological
events, variation in groundwater depth, and availability of favorable
fluvial geomorphic surfaces. For example, most cottonwood species
recruit along streams on bare moist surfaces during the declining limb
of spring high flows (Friedman et al., 1995; Scott et al., 1997; Strom-
berg et al., 1997). Willow species may follow a similar pattern but
tend to spread clonally. Survival of these woody riparian species is de-
pendent on maintenance of a high alluvial water table and avoidance
of scour events such as floods and ice flows. Mortality, or inability to
survive following recruitment, may result from a water table lowered
below those tolerated by young or maturing plants (Rood and Ma-
honey, 1995). Other factors, especially those human controlled, also
play a role in riparian decline throughout the West.
Landscape Diversity The parks represented in the GRYN (i.e., Yellowstone, Grand Teton
and Big Horn) have heterogeneous landscapes ranging from moun-
tains to broad valleys and deep canyons. Consequently, streams and
rivers flowing from the mountains transect a diverse geomorphology
that creates steep gradients through shallow-bedrock narrow valleys
as well as low-gradient, broad valleys with deep alluvial. Throughout
this region, variability in valley morphology directly influences the ex-
tent and type of riparian communities (Patten, 1998). Streams flow-
ing through broad valleys with low gradients may be lined by woody
and/or herbaceous riparian vegetation. If the water table is shal-
low, wetland herbaceous plants (e.g., sedges and wetland grasses)
may extend for some distance from the river creating fens in some
areas. These wetland areas often are devoid of woody species be-
cause the herbaceous cover may prevent establishment of willows,
cottonwoods or other woody plants. Willows (Salix spp.) and some-
times cottonwoods (Populus spp.) may occur near the stream where
floods enhance their recruitment. Once established, these species
may spread asexually and expand within the floodplain often occur-
ring away from the stream as it migrates across the floodplain. Steep
gradient mountain streams may have riparian communities of mixed
willows and conifers but cottonwoods may occur on suitable sites at
lower elevations. Other woody species such as dogwood (Cornus spp.)
and alder (Alnus spp.) also occur along these higher gradient streams.
Elevational differences also may influence riparian composi-
tion and structure. High elevation streams may not support large
woody species such as cottonwood for physiological reasons. Alpine
streams only support wetland herbaceous species or, occasionally,
dwarf willows. Shrub willows and alders may be common along
upper elevation streams sometimes mixed with stream-side conifer
communities. With decreasing elevation, low stature riparian woody
vegetation gives way to, or mixes with deciduous tree species. The
gradient in the northern Rockies and represented in some of the
GRYN parks goes from cottonwood/willow forests at lower eleva-
tions through alder/willow communities to spruce/aspen communi-
ties into alpine wetlands.
96 • Appendix III: Conceptual Models
Common Features Structural similarities of riparian communities occur across the GRYN
because they are related to successional dynamics which are driven by
common fluvial-geomorphic processes. For example, point-bars, chan-
nel margin, and island deposits provide exposed sediment that supports
young riparian plants along meandering and braided rivers throughout
the region. Also, sediment accumulation on terraces accompanies ag-
ing of riparian vegetation and establishment of later successional spe-
cies. Cottonwood species found along streams from different regions
have been shown to have similar recruitment requirements (Bradley and
Smith, 1986; Scott et al., 1996, 1997; Shafroth et al., 1995; Stromberg et
al., 1997; Auble and Scott, 1998; Rood and Kalischuk, 1998; Shafroth et
al., 1998). For example, recruitment of cottonwood and associated ripar-
ian species is most often tied to hydrological events (i.e., high flows) oc-
curring during the period of seed dispersal. The timing and cause of these
events may differ throughout the region, but early succession woody
riparian species (e.g., cottonwood and willow) respond the same way
to high flow, recruiting new seedlings on the receding limb of the high
flow event. The year of recruitment may be delayed along GRYN Rivers
because snow melt floods may extend beyond the seed dispersal pe-
riod, and recruitment occurs during high flows in succeeding years. Other
species, for example, shrubby cinquefoil (Potentilla fruticosa) and water
birch (Betula glandulosa) are also found in the riparian zone responding
to other factors such as very moist soil or snow bank accumulation.
Patterns of riparian communities along elevation gradients and
geomorphic gradients are similar throughout most of the GRYN. This
region is arid to semi-arid thus availability of water and similarity
of riparian vegetation structure allow ready transfer of information
developed in one area to another.
Drivers or Forcing Functions of Riparian Systems Hydrological factors controlling riparian processes may be quite dif-
ferent between the mountainous, headwater parks of Yellowstone
and Grand Teton, and Big Horn Canyon NRA. Snow and ice may play
a predominant role in the Yellowstone and Grand Teton while storm
events on the arid landscape of Big Horn may be the primary hydro-
logical driver. Snowmelt in the headwater parks creates a reliable hy-
drographic peak while erratic storms and controlled mainstem flows
produce uncertain hydrographs in Big Horn. Recruitment of many
riparian species is triggered by or coincides with the spring snow-
melt peak which occurs in May to June (Scott et al., 1993). However,
the peak may extend beyond seed dispersal causing recruitment to
be delayed by a year if peak flows of the succeeding year are suf-
ficiently high. If insufficient, recruitment may be delayed further.
Heavy local storms may have greater impacts on stream flows in
Big Horn than Yellowstone or Grand Teton. Less vegetative cover at
Big Horn may result in flash floods in mountainous low order streams.
Recruitment of spring seed-dispersal species such as cottonwood
and willow is usually most successful when high spring flows that
trigger riparian recruitment are followed by a relatively dry summer,
and/or absence of large floods during the next year or two (Stromberg
et al., 1991). Predicting future stream flows might allow projection of
changes in riparian vegetation (Auble et al. 1994 Non-native species
such as tamarisk (Tamarix ramosissima), Russian olive (Elaeagnus
angustifolia), and many noxious weeds disperse seeds over long pe-
riods and thus take advantage of summer storms (Stromberg, 1998).
Riparian ecosystems of GRYN region may occasionally be scoured
by flash floods but some are regularly affected by ice formation. Ice
forms on the surface of rivers in the northern Rockies during extreme
cold periods. During ice drives, ice may be elevated and scours the
bank often well above levels of spring floods (Smith, 1980). Ice scour
damages existing trees, removes riparian vegetation, forms new
channels and controls the elevation of successful riparian recruit-
ment (Johnson, 1994; Scott et al., 1997).
Geomorphic influences in the GRYN region may effect how suc-
cessful recruitment might be for riparian species. Many riparian spe-
cies require bare moist soil for recruitment (Stromberg et al., 1991;
Scott et al., 1996). Many rivers of the north Rockies have gravel- or
cobble-lined channels; however, fine sediment in these rivers may be
held in overbank ice in winter and deposited in spring where riparian
recruitment may occur. Fine sediments also are deposited within the
interstices on the cobble and gravel bars.
River geomorphology, especially on smaller streams, is often
controlled or altered by beaver activity (Naiman et al. 1986). Rela-
tively permanent beaver dam structures collect sediment, altering
sediment delivery downstream, and elevate local groundwater, en-
hancing growth and survival of most riparian species (Johnston and
Naiman 1987). When beaver dam sites are active, beavers may alter
the surrounding woody vegetation, harvesting and felling stream-
side trees and shrubs (Hall 1960). Eventual abandonment of beaver
dam sites results in floodplains covered in fine sediments and a veg-
etational successional process that leads towards the vegetation
that occurred prior to beaver arrival.
Vital Signs Monitoring Plan • 97
Environmental Stressors
A. HYDROLOGICAL STRESSORS. Factors that have created and maintained riparian systems within the
GRYN parks are changing. Most changes are tied to water and chan-
nel management, land use, ungulate management, and introduction
of non-native species. Throughout the region, rivers have been man-
aged to produce water for irrigation, generate hydroelectric power,
and for flood control. This is especially true in Grand Teton and Big
Horn parks. In Grand Teton NP the Snake River is dammed at Jackson
Lake, retaining irrigation water to be used during the growing season
downstream in Idaho. Short reaches of the Snake River channel are
also stabilized within GTNP. In BICA, the Big Horn River is dammed
both upstream of the park and within the park. Dams and their im-
poundments have greatly altered downstream ecosystems (Ligon et
al., 1995; Dynesius and Nilsson 1994; Collier, et al., 1996; Shafroth,
et al. 2002). They impound spring floods that normally would scour
channels, deposit sediment, and produce riparian vegetation along
the high water zone (e.g., Johnson, 1991). Dam releases to satisfy
downstream water uses, exemplified by operation of Buffalo Bill and
Boysen dams upstream of BICA and the Jackson Lake dam, often do
not coincide with normal high flow periods for the river, eliminating
recruitment enhancing high flows and often producing scouring sum-
mer flows (Fenner et al., 1985; Rood and Mahoney, 1990, 1995; John-
son, 1992; Dominick and O=Neill, 1998; Mahoney and Rood, 1998).
Reduction of peak flows though may result in widespread narrowing
of channels resulting in riparian vegetation establishment in areas
that once were active channels (Johnson, 1994, 1998; Friedman et
al., 1996, 1997, 1998; Shafroth et al., 1998). Even when dams allow
normal flows for recruitment and maintenance of riparian species,
the river below the dam may carry little sediment, material important
for creation of recruitment sites (Scott et al., 1997).
Stream diversion for irrigated agriculture may reduce surface
flows or effect local floodplain vegetation. Several irrigation take out
channels on tributaries of the Snake River within Grand Teton NP
may be modifying the adjacent riparian communities. Grand Teton
NP still has remnants of past agricultural uses within those areas of
the park added in the 1950s. Where agriculture existed near rivers,
removal of floodplain vegetation may still be evident as the flood-
plains recover. Recreational use of riparian areas has been found
to leave them vulnerable to over-use and degradation (Johnson and
Carothers, 1982). Although limits on use of streamside areas may
occur in some of the GRYN parks, BICA is established as a recre-
ation area and potential heavy use along the Big Horn Lake margins
may have deleterious effects. Effects of campers and day hikers on
riparian vegetation along small mountain streams often are locally
evident in Yellowstone and Grand Teton NPs.
B. BIOLOGICAL STRESSORS. Ungulate grazing in riparian areas may disrupt the reproductive cycle
of riparian trees such as cottonwoods, whose broad-leaved seedlings
and saplings are extremely desirable forage. Removal of reproduc-
tive shoots also diminishes reproductive potential of willows (Kay
1994). Heavy ungulate use, both wild and domestic, of floodplains
and riparian areas may greatly reduce riparian ground cover, desta-
bilize streambanks, and increase sediment loads to streams (Patten
1968, Armour et al., 1991; Elmore, 1992; NRC 2002). Wild ungulate
use in areas of Yellowstone NP, for example, the northern range, and
Grand Teton NP, has altered the cover and structure of the riparian
community (Singer et al. 1994, Singer 1996, Keigley 1997).
Beaver activity, although a normal component of riverine ecosys-
tems in the GRYN parks, under specific conditions may be considered
an ecosystem stressor. While beavers usually alter streams when
occupying dam sites, or modify riparian vegetation whether housed
in ponds behind dams or in stream banks, their absence may result
in water table declines and associated long-term alteration or loss
of riparian vegetation. Conversely, over-population of beavers in any
reach of a river may cause major alterations of riparian vegetation
through excessive harvesting of riparian woody plants. Several areas
of the GRYN, for example, streams in the northern range of YNP, once
supported extensive beaver populations but these are now absent
(Bailey 1930, Wright and Thompson 1935, Jonas 1955). Also, con-
tinued beaver trapping outside the parks maintained low populations.
Recently, however, beaver populations have dramatically increased in
several areas of the GRYN parks. This recovery may ultimately result
in “over-population” of beavers in some areas because many areas
that once were suitable for beaver habitat in the region are no longer
suitable for beaver population expansion because of unacceptable
consequences of beaver activities in most areas of human habitation.
C. NON-NATIVE SPECIES AS STRESSORS. Introduction of non-native species has greatly altered the west’s ripar-
ian ecosystems and has become a major management issue in all three
GRYN parks. Grazing and altered hydrology often favor the survival of
introduced species (e.g., tamarisk) and allows thriving non-natives to
98 • Appendix III: Conceptual Models
displace native species. Russian-olive and tamarisk are two non-native
species that have greatly altered western riparian communities (Brock,
1984; Shafroth et al., 1995). Not only have they altered the communities
they have invaded, they are difficult to remove. For example, tamarisk
can repeatedly resprout after fire, cutting, or browsing, and it survives in
very wet, very dry, or very salty soils (Gladwin and Roelle, 1998; Smith et
al., 1998). An example of major tamarisk invasion in these parks is the
exposed lake bed in BICA where the Big Horn River enters the park. Here
tamarisk has developed a dense cover of young invasive woody plants.
Extended inundation may be the only way to eliminate this extensive
stand of tamarisk. Herbaceous non-natives are also becoming prevalent
in many riparian areas creating dense ground cover that competes with
native species, increases fuel for fires, and may be enhanced by graz-
ing (Stromberg and Chew, 1997). All the parks are now contending with
increasing cover of non-native herbaceous plants. This has become a
sufficiently important issue that the Biennial Science Conference in Yel-
lowstone NP in 2001 (ref) emphasized this issue.
D. CLIMATE FLUCTUATION AS A STRESSOR. Climatic fluctuations over the past century have resulted in changes
in local watershed hydrology which directly affect the condition of
riverine and riparian systems. Long-term droughts not only reduce
stream flows but diminish groundwater supplies, lowering water
tables which are critical sources of water for riparian phreatophytic
plants (Stromberg et al. 1996, Shafroth et al. 2000). Human acceler-
ated climate change may create more erratic climatic fluctuations
and could potentially produce extended droughts, much longer than
that of the 1930s and similar to the 30-50 year droughts of 300 years
ago. Riparian communities within the GRYN parks will respond
relatively quickly to extended drought periods, reducing cover to
only those areas that can maintain a shallow water table. These
areas will be immediately adjacent to shallow bedrock streams and
along margins of larger rivers where low flows may support alluvial
groundwater. Climatic change and drought in the northern Rockies
region will affect all three GRYN parks. Vegetation that is dependent
on supplemental water, such as riparian vegetation, may be more
altered by these changing conditions than upland vegetation.
E. CUMULATIVE EFFECTS OF STRESSORS. Riparian ecosystem condition reflects the cumulative effects of all
activities that influence watershed hydrology and thus may be an
important indicator of changing environmental conditions within the
GRYN parks. Multiple resource uses on mountains and in valleys
have modified the quantity and quality of water entering rivers. This
is true for BICA, as the headwaters of the Big Horn River are used
for many forms of resource extraction, ranching and agriculture of-
ten with release of stream contaminants. Sometimes the results of
land use can be subtle, while in other cases, downstream impacts
on riparian ecosystems can be dramatic. Timber harvest may result
in larger and flashier floods which carry increased sediment. Leav-
ing a buffer zone may help reduce sedimentation rates and provide
for continued ecological interactions between streams and riparian
vegetation (Kauffman, 1988).
Application to Greater Yellowstone Network ParksRiverine and riparian systems within the three GRYN parks are in-
fluenced by many of the same stressors. The conceptual models
illustrate the linkages between the many stressors (Figures 25-28).
Although there may be many stressors that influence riverine and
riparian systems in the parks, the conceptual model applies only a
few that are known to potentially significantly alter these systems.
As discussed above, stressors that influence riparian systems and
that should be addressed in any inventory and monitoring program
include (1) altered hydrology, (2) altered channel morphology, (3) cli-
matic changes, especially droughts, (4) ungulate utilization of the
riparian zone, (5) exotic plants, and (6) recreation. The discussion
illustrates the importance of these stressors to each park but does
not apply them specifically to park units. The importance to a park
depends on extent and magnitude of a particular stressor. For ex-
ample, altered hydrology is not a primary stressor in Yellowstone
NP, but it plays and important role along the mainstem of the Snake
River in Grand Teton NP, and is the primary stressor for the main
water course and lake in BICA. Ungulates, on the other hand, may
not be important in BICA along the river and lake, but are important
locally in YNP and GTNP. BICA, on the other hand, may have ungulate
herbivory issues in the uplands.
The conceptual model(s) show linkages among stressor and how
they relate to dynamics of components of the riverine/riparian eco-
system. Following the flow of connected processes, it is possible to
end up with a limited set of potential indicators that, if monitored,
will offer evidence of changing watershed and river conditions with-
in each park.
Each park has been geographically divided into watershed units
(HUC units) for the purpose of addressing variability across the
landscape of the parks. Within the GRYN parks there are several
Vital Signs Monitoring Plan • 99
riparian vegetation community types, some may occur in all parks
while others may be specific to one or two parks, a consequence
of geographic and environmental diversity. Table 1 presents riparian
community types that occur within GRYN parks and identifies within
HUC unit for each park those environmental threats or stressors that
potentially may have an impact on long-term survival and condition
of the riparian community. Eight different riparian vegetation com-
munity types are presented. Some of these relate to seral stages
in riparian vegetation development and maturation, for example,
gravel bar/river edge riparian communities up to mature cottonwood
communities. Some riparian communities also relate to geographic
locations, such as large river margins, lake shores, small mountain
streams, or broad valley wetted-sediment deposits. The list of ripar-
ian community types is simplified for application to the whole GRYN.
If expanded based on diversity within community type, the variability
would create hundreds of types. For example, twenty four species of
willow are found in the northern range of YNP and these produce a
diverse set of willow communities based upon diverse environmen-
tal drivers (YNP 1997).
To allow comparisons across community types, a brief description
follows:
A. Gravel bar/edge wetlands: this community type is found on
point bars and the edges of rivers where flood disturbance is
frequent. In most cases the vegetation cover includes herba-
ceous pioneer species, but young woody riparian species like
Salix exigua and Populus spp. may also be present. In most
cases the vegetation cover is sparse.
B. Herbaceous meadow: the community type may occur in broad
alluvial valleys where the river is downcut and few woody
plants are present. Herbaceous species are predominantly wet-
land sedge and grass species. Wetland forbs also may be pres-
ent.
C. Willow/shrub: this is a diverse community because of the po-
tential number of willows that may be present throughout the
GRYN. The community is dominated by shrub willows and oc-
curs on the edge of streams, adjacent floodplains, and wet allu-
vial flats and along seeps where groundwater is shallow. Some
may be short willows (e.g., wolf willow), while some willow/
shrub communities have tall willows (e.g., xxx). Other shrubs
may be present with willows such as alder (Alnus spp.) in moist
areas or shrubby cinquefoil (Potentilla fruticosa) in drier areas.
In most cases, except where heavy browsing has reduced cover,
aerial cover of this community is high.
D. Cottonwood: this community type, usually found in mid to
lower elevations within the GRYN, is dominated by mature cot-
tonwoods and may have some cottonwood recruitment under
the canopy or in adjacent floodplain and point bar areas. There
is little understory of other woody plants. This type of commu-
nity may be found in areas with heavy browsing pressure, or in
relatively sterile gravel or cobbled areas where cottonwood has
established and has resisted scour when it occurs, but other
woody plants either never established or were scoured away
by high magnitude floods.
E. Cottonwood/willow/shrub: this community type found in mid
to lower elevations in GRYN represents a mature cottonwood
community with a well established understory of shrubs, often
willows, and herbaceous ground cover. These usually are undis-
turbed sites with no deficiency of shallow groundwater.
F. Conifer/willow/shrub: this community type is more typically
found along mid to higher elevation streams that have limited
overbank scour. The conifer overstory represents mesic upland
species growing near the stream, whereas willow and shrubs
such as alder are more typically riparian and phreatophytic.
G. Lake shore: this community type could be represented by sev-
eral of those above but also may include true wetlands where
saturated sediment occurs along the lake margin. Willows may
grow along stable lake shores whereas gravel bar type com-
munities may be common along fluctuating lakes. Mid to higher
elevation lakes may have conifer communities growing along
the shoreline.
H. Riparian exotics (dominant): this community type occurs in
highly disturbed areas or where hydrological controls are greatly
altered from the norm. Nearly pure stands of tamarisk represent
this type of community which often occurs in moist sediment
upstream and at tributaries mouths of lakes with fluctuating
levels. Altered downstream hydrology below dams also often
creates riparian communities dominated by extensive stands of
exotic species. Communities dominated by herbaceous exotic
species (often noxious weeds) may occur on floodplain areas
following a high magnitude, overbank, scouring flood.
Stressors that play an important part in each park differ, except
perhaps for climate change and drought stress. Riparian communities
in YNP, especially in the northern range, are greatly influenced by un-
gulate herbivory. GTNP has altered hydrology of the Snake River as a
100 • Appendix III: Conceptual Models
major issue, but it also has herbivory problems along some streams
within the park. Primary stressors of riparian condition in BICA are
altered hydrology and invasion of non-native riparian species. Table 1
summarizes the similarities and differences among the parks and the
HUC units within the parks. Because riverine/riparian systems are lin-
ear and cover only a small percentage of the landscape, comparisons
by watershed units within each park may be difficult; however, dif-
ferent conditions within each watershed, especially if they are some
distance apart, might allow identification of different responses of
riparian communities to similar environmental stressors.
Potential Indicators Several indicators related to riverine and riparian ecosystems can
be identified from the conceptual model and the discussion above.
Some indicators may be stressors or other non-“outcome” param-
eters, but the best may be an outcome parameter that functions as
an integrator of several processes.
a. Riparian condition is one indicator, in actuality an index, that
includes several riparian community parameters and channel
geomorphic parameters. Riparian ecosystems are integrators
of hydrogeomorphic conditions as well as local land use pro-
cesses. Riparian condition includes metrics of horizontal and
vertical vegetation structure, vegetation diversity and channel
stability. The U.S. Forest Service and BLM have developed an
index, Proper Functioning Condition (PFC), that attempts to ad-
dress these parameters but it is subjective and includes little
biological information. A modified version of PFC may be an
appropriate index to use for “riparian condition”.
b. Channel geomorphological metrics may also be a useful indica-
tor of the condition of riverine and riparian systems. The ratio
of channel width to depth and channel sinuosity in relation to
floodplain type can be combined to develop a channel index
that would indicate whether the channel is be changed from the
“expected” geomorphic conditions.
c. Riparian avian community structure may be used as an indicator
of riparian condition. Species diversity of riparian avian com-
munities, including presence and/or absence of certain spe-
cies that have been identified as species commonly found in
“healthy” or “degraded” riparian vegetation, can be used as a
surrogate of riparian condition, including linear connectivity of
riparian patches along a river.
d. A biological stressor, exotic plants, may also be a useful indica-
tor of riparian vegetation condition. Increasing presence of exotic
plant species has greatly altered many riparian systems in the
West. A degraded riparian community may be altered primar-
ily because of the presence of exotic species. If a relationship
between altered condition and abundance of exotic species can
be established, cover and diversity of exotic plant species in the
riparian zone may be a useful long-term indicator.
e. Aquatic biota, that is macroinvertebrates and/or fish populations,
often indicate the geomorphology of a channel, the bedload ma-
terials, flow velocities at various stages as well as water quality.
For general riverine and riparian conditions, aquatic biota may not
be the best indicator, but if a combination of physical and chemi-
cal qualities need to be evaluated, aquatic biota may be a useful
indicator. This indicator applies more to the river or lake systems of
the GRYN parks and is discussed in more detail in that section.
Measurement of any of the above indicators would be done at ran-
domly selected locations along reaches of rivers of interest. For lakes
shores, randomly selected locations along a shore would be used in
place of reach locations along a river. For the various parks, rivers of
different sizes (orders) would be identified and long-term monitoring
stations would be established.
8. ADDITIONAL INFORMATION ON POSSIBLE INDICATORS
Riparian ecosystems occur as the result of several environmental fac-
tors, hydrology being primary. However, new stressors such as heavy
browsing, changes in beaver populations, introduction of exotic plants
and recreation have become important in the health of overall distribu-
tion and condition of riparian communities. Because some of the “new”
stressors have played a significant role in altering riparian communi-
ties, they may be important indicators, offering evidence of potential
changes in the riparian communities of the GRYN area.
a. Riparian Condition.Resource Monitored: Riparian vegetation structure and channel
stability.
Justification: Riparian ecosystems, although a small part of the GRYN
area landscape, support some of the greatest biodiversity. Chang-
es in the health or condition of riparian communities will directly
influence the assemblage of animal species found in the parks of
the GRYN. Consequently, it is imperative that riparian condition
(health) be included in a long-term monitoring program. Riparian
condition is an indicator, in actuality an index, that includes sev-
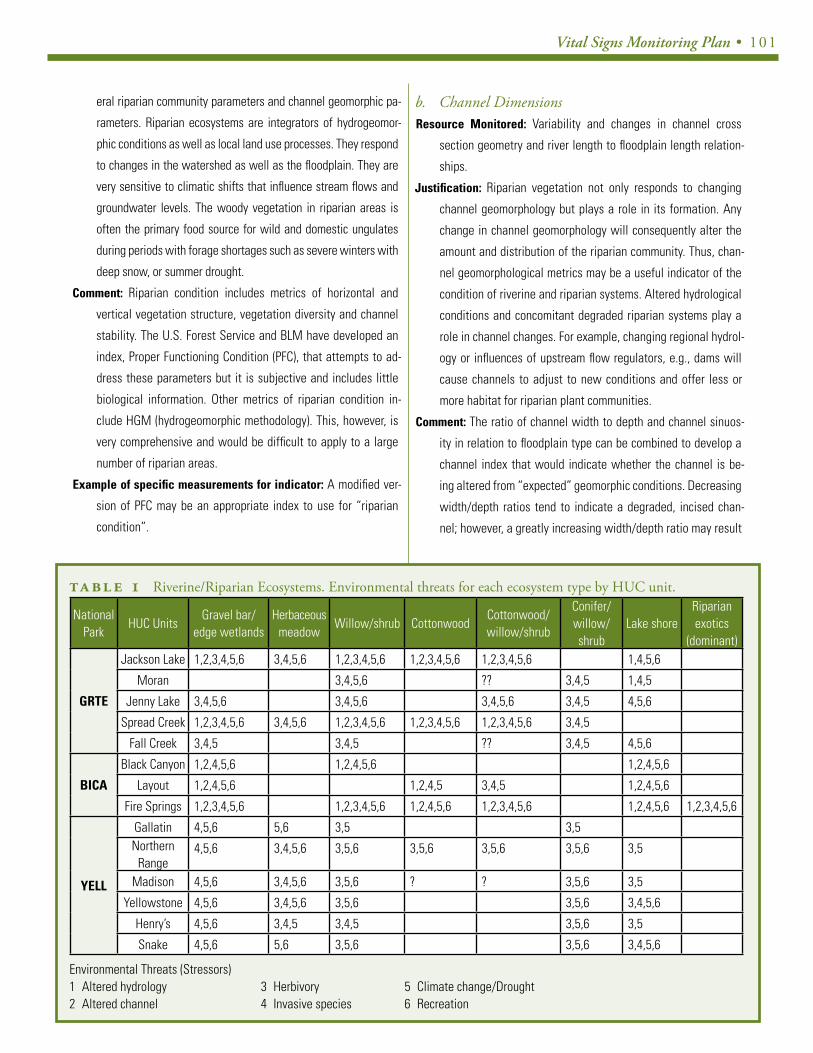
Vital Signs Monitoring Plan • 101
eral riparian community parameters and channel geomorphic pa-
rameters. Riparian ecosystems are integrators of hydrogeomor-
phic conditions as well as local land use processes. They respond
to changes in the watershed as well as the floodplain. They are
very sensitive to climatic shifts that influence stream flows and
groundwater levels. The woody vegetation in riparian areas is
often the primary food source for wild and domestic ungulates
during periods with forage shortages such as severe winters with
deep snow, or summer drought.
Comment: Riparian condition includes metrics of horizontal and
vertical vegetation structure, vegetation diversity and channel
stability. The U.S. Forest Service and BLM have developed an
index, Proper Functioning Condition (PFC), that attempts to ad-
dress these parameters but it is subjective and includes little
biological information. Other metrics of riparian condition in-
clude HGM (hydrogeomorphic methodology). This, however, is
very comprehensive and would be difficult to apply to a large
number of riparian areas.
Example of specific measurements for indicator: A modified ver-
sion of PFC may be an appropriate index to use for “riparian
condition”.
b. Channel DimensionsResource Monitored: Variability and changes in channel cross
section geometry and river length to floodplain length relation-
ships.
Justification: Riparian vegetation not only responds to changing
channel geomorphology but plays a role in its formation. Any
change in channel geomorphology will consequently alter the
amount and distribution of the riparian community. Thus, chan-
nel geomorphological metrics may be a useful indicator of the
condition of riverine and riparian systems. Altered hydrological
conditions and concomitant degraded riparian systems play a
role in channel changes. For example, changing regional hydrol-
ogy or influences of upstream flow regulators, e.g., dams will
cause channels to adjust to new conditions and offer less or
more habitat for riparian plant communities.
Comment: The ratio of channel width to depth and channel sinuos-
ity in relation to floodplain type can be combined to develop a
channel index that would indicate whether the channel is be-
ing altered from “expected” geomorphic conditions. Decreasing
width/depth ratios tend to indicate a degraded, incised chan-
nel; however, a greatly increasing width/depth ratio may result
TA BLE 1 Riverine/Riparian Ecosystems. Environmental threats for each ecosystem type by HUC unit.
National Park
HUC UnitsGravel bar/
edge wetlandsHerbaceous
meadowWillow/shrub Cottonwood
Cottonwood/willow/shrub
Conifer/willow/shrub
Lake shoreRiparian exotics
(dominant)
GRTE
Jackson Lake 1,2,3,4,5,6 3,4,5,6 1,2,3,4,5,6 1,2,3,4,5,6 1,2,3,4,5,6 1,4,5,6
Moran 3,4,5,6 ?? 3,4,5 1,4,5
Jenny Lake 3,4,5,6 3,4,5,6 3,4,5,6 3,4,5 4,5,6
Spread Creek 1,2,3,4,5,6 3,4,5,6 1,2,3,4,5,6 1,2,3,4,5,6 1,2,3,4,5,6 3,4,5
Fall Creek 3,4,5 3,4,5 ?? 3,4,5 4,5,6
BICA
Black Canyon 1,2,4,5,6 1,2,4,5,6 1,2,4,5,6
Layout 1,2,4,5,6 1,2,4,5 3,4,5 1,2,4,5,6
Fire Springs 1,2,3,4,5,6 1,2,3,4,5,6 1,2,4,5,6 1,2,3,4,5,6 1,2,4,5,6 1,2,3,4,5,6
YELL
Gallatin 4,5,6 5,6 3,5 3,5Northern
Range4,5,6 3,4,5,6 3,5,6 3,5,6 3,5,6 3,5,6 3,5
Madison 4,5,6 3,4,5,6 3,5,6 ? ? 3,5,6 3,5
Yellowstone 4,5,6 3,4,5,6 3,5,6 3,5,6 3,4,5,6
Henry’s 4,5,6 3,4,5 3,4,5 3,5,6 3,5
Snake 4,5,6 5,6 3,5,6 3,5,6 3,4,5,6
Environmental Threats (Stressors) 1 Altered hydrology 3 Herbivory 5 Climate change/Drought2 Altered channel 4 Invasive species 6 Recreation

102 • Appendix III: Conceptual Models
from excessive bank destabilization by ungulate use.
Example of specific measurements for indicator: Width-depth ra-
tios at selected reach types along rivers of different sizes, along
with geographic measurements of river sinuosity can be com-
bined to offer an “index” metric for channel dimensions. Just
the width-depth ratio on selected reaches may be satisfactory.
c. Riparian wildlife species. Resource Monitored: Abundance of potential indicator wildlife/
avian species.
Justification: Riparian avian community structure may be used as a
wildlife species indicator of riparian condition. Species diver-
sity of riparian avian communities, including presence and/or
absence of certain species that have been identified as species
commonly found in “healthy” or “degraded” riparian vegetation,
can be used as a surrogate of riparian condition, including lin-
ear connectivity of riparian patches along a river.
Comment: Many studies have used presence and abundance of resi-
dent birds at select times of the year to demonstrate potential
sources and sinks of avian populations. Riparian communities
are usually the source of birds and thus any changes or loss of
bird species and/or population composition may be an impor-
tant indicator of riparian condition.
Example of specific measurements for indicator: Presence and
abundance measurements taken within specific sized plots for
10 minutes at a number of sites along selected reaches of rivers
of concern can be used as the metric for this indicator.
d. Exotic plants.Resource Monitored: Exotic plant component of riparian plant com-
munity.
Justification: One of the biological stressors in the riparian con-
ceptual model, exotic plants, may also be a useful indicator
of riparian vegetation condition. Increasing presence of exotic
plant species has greatly altered many riparian systems in the
West. A degraded riparian community may be altered primar-
ily because of the presence of exotic species. If a relationship
between altered condition and abundance of exotic species can
be established, cover and diversity of exotic plant species in the
riparian zone may be a useful long-term indicator.
Comment: For this indicator to be useful, a relationship between
riparian condition and exotic plant presence, especially for her-
baceous species, needs to be established. Recent literature ad-
dresses increasing exotic plant presence in riparian areas, but a
statistical connection between presence and riparian degrada-
tion is not well developed.
Example of specific measurements for indicator: The metric
would be percentage cover of specific exotic species within
riparian vegetation. This will only be useful if that percentage
can be related to reduced function of the riparian area. This
percentage should be determined by establishing permanent
transects in selected representative riparian areas within the
three GRYN parks. The transects will be used to sample woody
vegetation, while small quadrats (e.g., 1x1 m plots) along the
transects will be used to sample herbaceous vegetation.
LITERATURE CITEDLITERATURE CITED
Anderson, B.W., R.D. Ohmart, and J. Rice. 1983. Avian and vegeta-tion community structure and their seasonal relationships in the lower Colorado River Valley. Condor 85:392-405.
Armour, C.L., D.A. Doff, and W. Elmore, 1991. Effects of Livestock Graz-ing on Riparian and Stream Ecosystems. Fisheries (Bethesda, MD) 16:7-11.
Auble, G.T., J.M. Friedman, and M.L. Scott, 1994. Relating Riparian Vegetation to Present and Future Streamflow. Ecological Applications 4:544-554.
Auble, G.T. and M.L. Scott, 1998, Fluvial Disturbance Patches and Cot-tonwood Recruitment Along the Upper Missouri River, Montana. Wet-lands 18:446-456.
Bailey, V. 1930. Animal Life of Yellowstone National Park. Springfield, Illinois: Charles C. Tomas. 241 pp.
Bradley, C.E. and D.G. Smith. 1986. Plains Cottonwood Recruitment and Survival on a Prairie Meandering River Floodplain, Milk River, Southern Alberta and Northen Montana. Canadian Journal of Botany 64:1433-1442.
Brinson, M.M., B.L. Swift, R.C. Plantico, and J.S. Barclay. 1981. Ripari-an ecosystems: their ecology and status. U.S. Fish and Wildlife Service Biological Services Program, Washington, D.C. USA FWS/OBS-81/17.
Brock, J.H. 1984. Tamarix spp. (salt cedar), an Invasive Exotic Woody Plant in Arid and Semi-Arid Riparian Habitats of Western USA. In: Ecology and Management of Invasive Riverside Plants.L. de Wall, L. Child, P. Wade, and J. Brock (editors). John Wiley and Sons, New York, NY, USA. pp. 27-44.
Collier, M., R.H. Webb and J.C. Schmidt, 1996. Dams and Rivers: A Primer on the Downstream Effects of Dams. U.S. Geological Survey Circular 1126. Tucson, Arizona. 94 pp.
Vital Signs Monitoring Plan • 103
Dominick, D.S. and M.P. O=Neill, 1998. Effects of Flow Augmentation on Stream Channel Morphology and Riparian Vegetation: Upper Ar-kansas River Basin, Colorado. Wetlands 18: 591-607.
Dynesius, M. and C. Nilsson. 1994. Fragmentation and flow regula-tion of river systems in the northern third of the world. Science 26:753-762.
Elmore, W., 1992. Riparian Responses to Grazing Practices. In: Wa-tershed Management: Balancing Sustainability and Environmental Change, R.B. Naiman (editor). Springer-Verlag, New York, NY, USA, pp. 442-457.
Fenner, P., W.W. Brady and D.R. Patton, 1985. Effects of Regulated Wa-ter Flows on Regeneration of Fremont Cottonwood. Journal of Range Management 38:135-138.
Friedman, J.M., W.R. Osterkamp and W.M. Lewis, Jr., 1996. Chan-nel Narrowing and Vegetation Development Following a Great Plains Flood. Ecology 77:2167-2181.
Friedman, J.M., W.R. Osterkamp, M.L. Scott and G.T. Auble, 1998. Downstream Effects of Dams on Channel Geometry and Bottomland Vegetation: Regional Patterns in the Great Plains. Wetlands 18:619-633.
Friedman, J.M. , M.L. Scott and G.T. Auble, 1997. Water Management and Cottonwood Forest Dynamics Along Prairie Streams. In: Ecology and Conservation of Great Plains Vertebrates. F. Knopf and F. Samson (editors). Ecological Studies 125. Springer-Verlag, New York, NY, USA. pp. 49-71.
Gladwin, D.N. and J.E. Roelle, 1998. Survival of Plains Cottonwood (Populus deltoides subsp. monilifera) and Salt Cedar (Tamarix ramosis-sima) Seedlings in Response to Flooding. Wetlands 18:669-674.
Gregory, S.V., F.J. Swanson, W.A. McKee and K.W. Cummins, 1991. An Ecosystem Perspective of Riparian Zones. Bioscience 41: 540-551.
Hall, J.G. 1960. Wilow and aspen in the ecology of beaver on Sagehen Creek, California. Ecology 41:484-494.
Hunter, W.C., B.S. Anderson, and R.D. Ohmart. 1987. Avian community structure changes in a mature floodplain forest after extensive flood-ing. J. Wildlife Management 51:495-502.
Johnson, R.R., 1991. Historic Changes in Vegetation Along the Colo-rado River in the Grand Canyon. In: Colorado River Ecology and Man-agement, National Research Council. National Academy Press, Wash-ington, DC, USA. pp. 178-206.
Johnson, R.R. and S.W. Carothers, 1982. Riparian Habitats and Recre-ation: Interrelationships in the Southwest and Rocky Mountain Region. U.S. Forest Service, Rocky Mountain Forest and Range Experiment Sta-tion, Fort Collins, CO, USA. Eisenhower Consortium Bulletin 12:1-31.
Johnson, W.C., 1992. Dams and Riparian Forests: Case Study from the Upper Missouri River. Rivers 3:229-242.
Johnson, W.C., 1994. Woodland Expansion in the Platt River, Nebraska: Patterns and Causes. Ecological Monographs 64:45-84.
Johnson, W.C., 1998. Adjustment of Riparian Vegetation to River Regu-lation in the Great Plains, USA. Wetlands 18:608-618.
Johnston, C.A., and R.J. Naiman. 1987. Boundary dynamics at the aquatic-terrestrial interface: The influence of beaver and geomorphol-ogy. Landscape Ecology :47-57.
Jonas, R.J. 1955. A Population and Ecological Study of the Beaver (Castor Canadensis) in Yellowstone National Park. M.S Thesis. Univer-sity of Idaho. 193 pp.
Kauffman, J.B., 1988. The Status of Riparian Habitats in Pacific North-west Forests. In: Streamside Management: Riparian Wildlife and For-estry Interactions, K.J. Raedeke (editor). Institute of Forest Resources, University of Washington, Seattle, WA, USA. Contribution 59. pp. 45-55.
Kay, C.E. 1994. The Impact of Native Ungulates and Beaver on Ripar-ian Communities in the Intermountain West. Natural Resources and Environmental Issues 1:23-44.
Keigley, R.B. 1997. An Increase in Herbivory of Cottonwoods in Yel-lowstone National Park. Northwest Science 71:127-136.
Kondolf, G.M., R. Kattlemann, M. Embury, and D.C. Erman. 1996. Sta-tus of riparian habitat. In Sierra Nevada Ecosystem Porject: Final Re-port to Congress. Center for Water Wildlands Research, University of California, Davis, CA, USA.
Ligon, F.K., W.E. Dietrich and W.J. Trush , 1995. Downstream Ecological Effects of Dams, a Geomorphic Perspective. Bioscience 45:183-192.
Mahoney, J.M. and S.B. Rood, 1998. Streamflow Requirements for Cottonwood Seedling Recruitment--a Quantitative Model. Wetlands 18:634-645.
Naiman, R.J., J.M. Melillo and J.E. Hobbie. 1986. Ecosystem altera-tion of boreal forest streams by beaver (Castor Canadensis). Ecology 67:11254-1269.
Naiman, R.J. and H.Decamps, 1997. The Ecology of Interfaces: Ripar-ian Zones. Annual Review of Ecology and Systematics 28:621-658.
Naiman, R.J., H. Decamps and M. Pollock, 1993. The Role of Riparian Corridors in Maintaining Regional Biodiversity. Ecological Applications 3:209-212.
NRC (National Research Council). 2002. Ecological Dynamics on Yel-lowstone’s Northern Range. National Academy Press, Washington, D.C.
Patten, D.T. 1968. Dynamics of the Shrub Continuum Along the Galla-tin River in Yellowstone National Park. Ecology 49:1107-1112.
Patten, D.T., 1998. Riparian Ecosystems of Semi-Arid North America: Diversity and Human Impacts. Wetlands 18:498-512.
104 • Appendix III: Conceptual Models
Rood, S.B. and A.R. Kalishchuk, 1998. Cottonwood Seedling Recruit-ment Following the Flood of the Century of the Oldman River, Alberta, Canada. Wetlands 18:57-570.
Rood, S.B. and J.M. Mahoney, 1995. River Damming and Riparian Cot-tonwoods Along the Marias River, Montana. Rivers 5: 195-207.
Rood, S.B. and J.M. Mahoney, 1990. Collapse of Riparian Poplar For-ests Downstream from Dams in Western Prairies: Probable Causes and Prospects for Mitigation. Environmental Management 14:451-464.
Scott, M.L., G.T. Auble and J.M. Friedman, 1997. Flood Dependency of Cottonwood Establishment Along the Missouri River, Montana. Eco-logical Applications 7:677-690.
Scott, M.L., J.M. Friedman and G.T. Auble, 1996. Fluvial Process and the Establishment of Bottomland Trees. Geomorphology 14:327-339.
Scott, M.L., M.A. Wondzell and G.T. Auble. 1993. Hydrograph charac-teristics relevant to the establishment and growth of western riparian vegetation. In: Proceedings of the thirteenth annual American Geo-physical Union Hydrology Days, H.J. Morel-Seytoux (editor). Hydrology Days Publications, Atherton, CA, USA. pp. 237-246.
Shafroth, P.B., G.T. Auble and M.L. Scott, 1995. Germination and Estab-lishment of the Native Plains Cottonwood (Populus deltoides Marshall subsp. monilifera) and the Exotic Russian-Olive (Elaeagnus angustifo-lia L.). Conservation Biology 9:1169-1175.
Shafroth, P.B., G.T. Auble, J.C. Stromberg and D.T. Patten, 1998. Estab-lishment of Woody Riparian Vegetation in Relation to Annual Patterns of Streamflow, Bill Williams River, Arizona. Wetlands 18:577-590.
Shafroth, P.B., J.C. Stromberg and D.T. Patten, 2000. Woody Riparian Vegetation Response to Different Alluvial Water Table Regimes. West-ern North American Naturalist 60:66-76.
Shafroth, P.B.. J.C. Stromberg and D.T. Patten. 2002. Riparian Vegeta-tion Response to Altered Disturbance and Stress Regimes. Ecological Applications 12:1-7-123.
Singer, F.J. 1996. Differences Between Willow Communtieis Browsed by Elk and Communtieis Protected for 32 Years in Yellowstone Na-tionla Park. Pp. 279-290 in Effects of Grazing by Wild Ungulates in Yellowstone National Park, F.G. Singer (ed.) Tech Rep. NPS/NRYELL/NRTR/96-01. US. Dept. of Interior, National Park Service, Denver, CO.
Singer, F.J., L.C. Mark, and R.C. Cates. 1994. Ungulate Herbivory of Willows on Yellowstone’s Northern Winter Range. J. Range Manage-ment 47:435-443.
Smith, D., 1980. River Ice Processes: Thresholds and Geomorphic Ef-fects in Northern and Mountain Rivers. In: Thresholds in Geomorphol-ogy, D.R. Coats and J.D. Vitek (editors). Allen and Unwin, Boston, MA, USA. pp. 323-343.
Smith, S.D., D.A. Devitt, A. Sala, J.R. Cleverly and D.E. Busch, 1998. Water Relations of Riparian Plants from Warm Desert Regions: Veg-etation Water Sources, Effects of Streamflow Diversion and Invasion
of Tamarix ramosissima. Wetlands 18:687-696.
Stromberg, J.C., 1998. Edaphic and Vegetational Characteristics of Salt Cedar (Tamarix spp.) Stands Along a Free-Flowing, Arid-Region River. Wetlands 18:675-686.
Stromberg, J.C. and M.K. Chew, 1997. Herbaceous Exotics in Arizona=s Riparian Ecosystems. Desert Plants 13:11-17.
Stromberg, J.C., J. Fry and D.T. Patten, 1997. Marsh Development Af-ter Large Floods in an Alluvial, Arid-Land River. Wetlands 17:292-300.
Stromberg, J.C., D.T. Patten and BD. Richter, 1991. Flood Flows and Dynamics of Sonoran Riparian Forests. Rivers 2:221-223.
Stromberg, J.C., R. Tiller and B. Richter, 1996. Effects of Groundwater Decline on Riparian Vegetation of Semiarid Regions: The San Pedro, Arizona. Ecological Applications 6:1133-131.
Wright, G.H. and B.H. Thompson. 1935. Fauna of the National Parks of the United States. Fauna Series No. 2. Washington, DC: U.S. National Park Service. 142 pp.
YNP (Yellowstone National Park). 1997. Yellowstone’s Northern Range: Complexity and Change in a Wildland Ecosystem. National Park Ser-vice, Mammoth Hot Springs, WY.
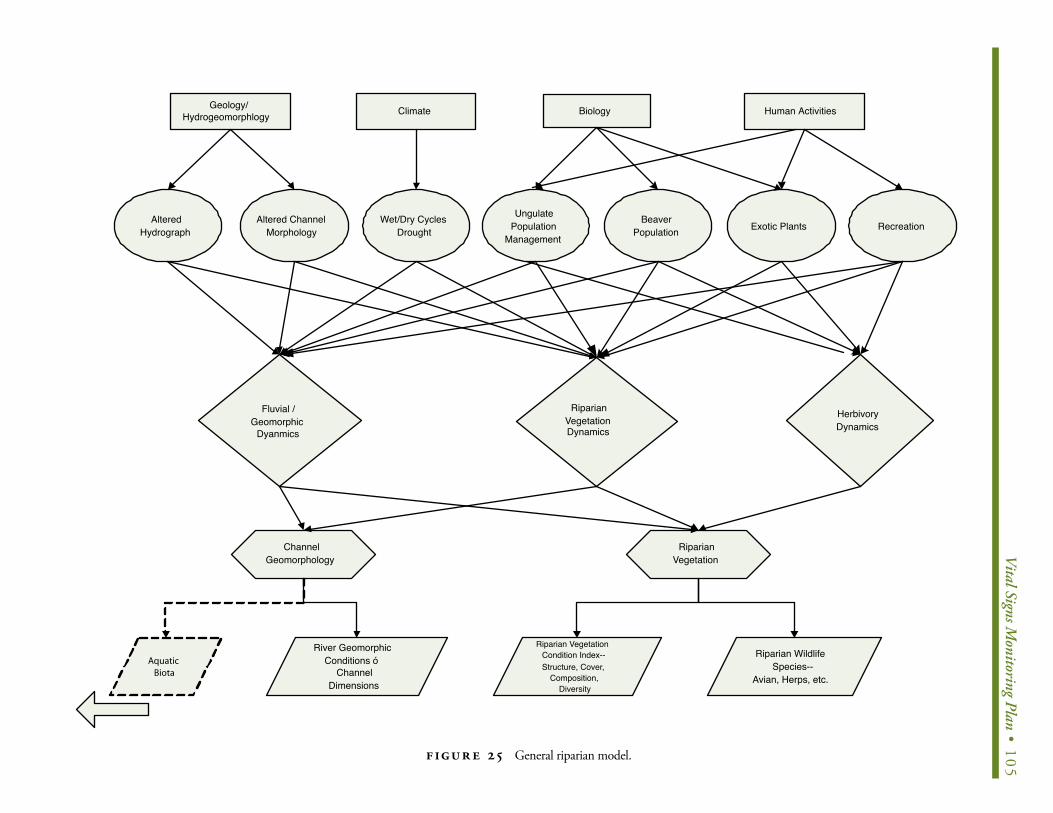
V
ital Signs Monitoring Plan • 105
Human Activities
Recreation
Riparian WildlifeSpecies--
Avian, Herps, etc.
Geology/Hydrogeomorphlogy Climate Biology
AlteredHydrograph
Altered ChannelMorphology
Wet/Dry CyclesDrought
UngulatePopulation
ManagementExotic Plants
ChannelGeomorphology
RiparianVegetation
River GeomorphicConditions ó
ChannelDimensions
Riparian VegetationCondition Index--Structure, Cover,
Composition,Diversity
������������
BeaverPopulation
Fluvial /Geomorphic
Dyanmics
RiparianVegetationDynamics
HerbivoryDynamics
FIGUR E 25 General riparian model.

106 • Appendix III: Conceptual Models
Erosion
Runoff (FlowMagnitude)
SedimentTransport
Recruitment SiteEstablishment
Exotic Plants(Invasion)
RecreationalActivity andDisturbance
Erosion
SedimentDeposition and
Plant Burial
Mature RiparianVegetation
VegetationMaturation
Beaver
ShallowGroundwater
Woody PlantRecruitment
Flow Timing
Immature RiparianVegetation
Herbivory
Ungulates,Insects, etc.
FIGUR E 26 Riparian vegetation dynamics submodel.
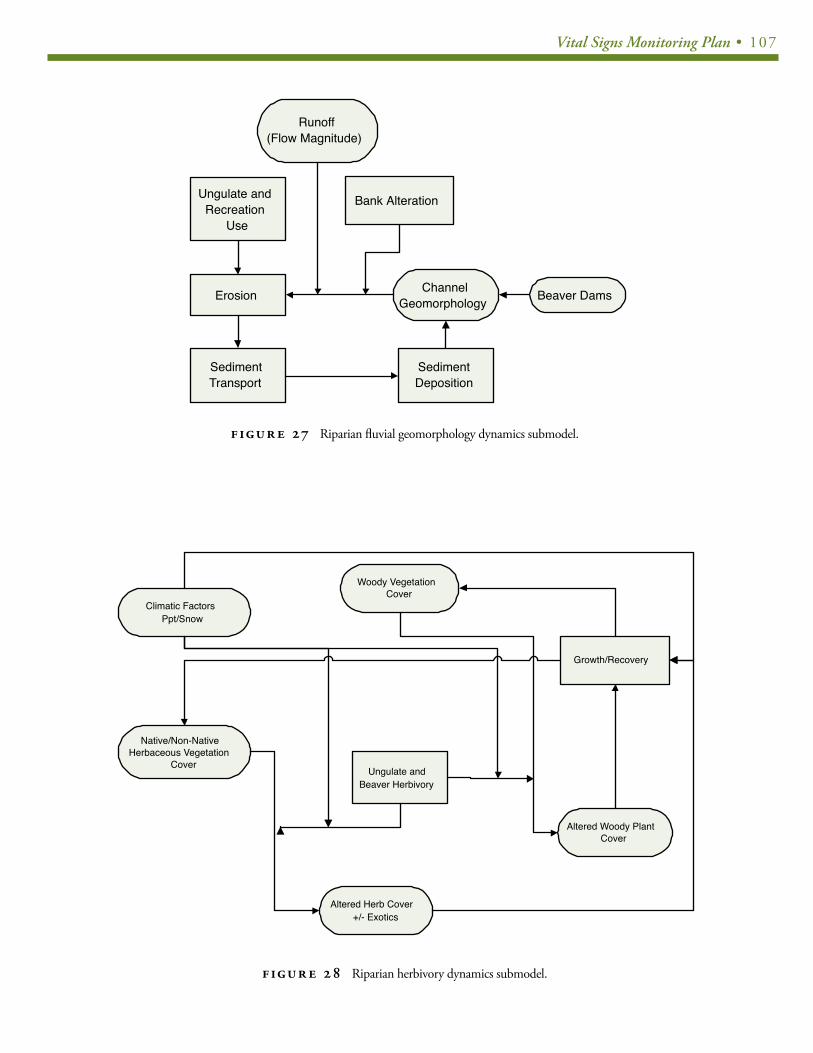
Vital Signs Monitoring Plan • 107
ChannelGeomorphology Beaver Dams
Runoff(Flow Magnitude)
Ungulate andRecreation
Use
Erosion
SedimentTransport
SedimentDeposition
Bank Alteration
FIGUR E 27 Riparian fluvial geomorphology dynamics submodel.
Climatic FactorsPpt/Snow
Woody VegetationCover
Native/Non-NativeHerbaceous Vegetation
Cover
Altered Herb Cover +/- Exotics
Altered Woody PlantCover
Growth/Recovery
Ungulate andBeaver Herbivory
FIGUR E 28 Riparian herbivory dynamics submodel.
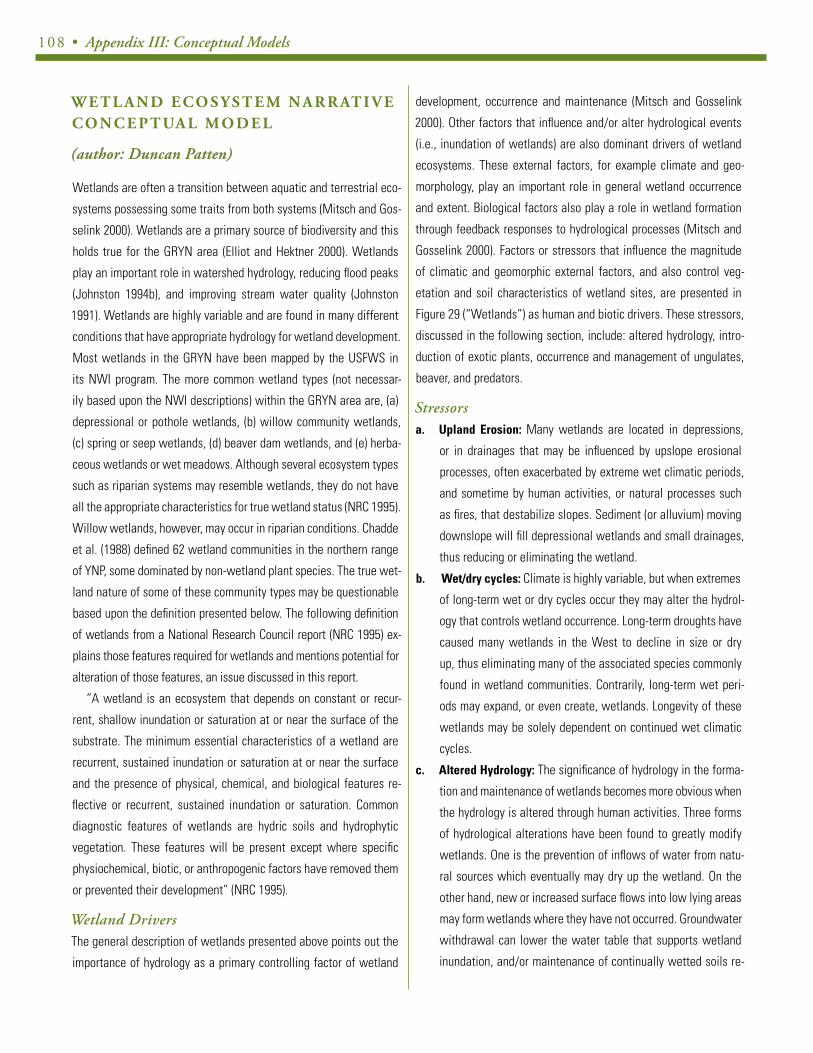
108 • Appendix III: Conceptual Models
W E T L A N D E C O S Y S T E M N A R R AT I V E C O N C E P T UA L M O D E L
(author: Duncan Patten)(author: Duncan Patten)
Wetlands are often a transition between aquatic and terrestrial eco-
systems possessing some traits from both systems (Mitsch and Gos-
selink 2000). Wetlands are a primary source of biodiversity and this
holds true for the GRYN area (Elliot and Hektner 2000). Wetlands
play an important role in watershed hydrology, reducing flood peaks
(Johnston 1994b), and improving stream water quality (Johnston
1991). Wetlands are highly variable and are found in many different
conditions that have appropriate hydrology for wetland development.
Most wetlands in the GRYN have been mapped by the USFWS in
its NWI program. The more common wetland types (not necessar-
ily based upon the NWI descriptions) within the GRYN area are, (a)
depressional or pothole wetlands, (b) willow community wetlands,
(c) spring or seep wetlands, (d) beaver dam wetlands, and (e) herba-
ceous wetlands or wet meadows. Although several ecosystem types
such as riparian systems may resemble wetlands, they do not have
all the appropriate characteristics for true wetland status (NRC 1995).
Willow wetlands, however, may occur in riparian conditions. Chadde
et al. (1988) defined 62 wetland communities in the northern range
of YNP, some dominated by non-wetland plant species. The true wet-
land nature of some of these community types may be questionable
based upon the definition presented below. The following definition
of wetlands from a National Research Council report (NRC 1995) ex-
plains those features required for wetlands and mentions potential for
alteration of those features, an issue discussed in this report.
“A wetland is an ecosystem that depends on constant or recur-
rent, shallow inundation or saturation at or near the surface of the
substrate. The minimum essential characteristics of a wetland are
recurrent, sustained inundation or saturation at or near the surface
and the presence of physical, chemical, and biological features re-
flective or recurrent, sustained inundation or saturation. Common
diagnostic features of wetlands are hydric soils and hydrophytic
vegetation. These features will be present except where specific
physiochemical, biotic, or anthropogenic factors have removed them
or prevented their development” (NRC 1995).
Wetland DriversThe general description of wetlands presented above points out the
importance of hydrology as a primary controlling factor of wetland
development, occurrence and maintenance (Mitsch and Gosselink
2000). Other factors that influence and/or alter hydrological events
(i.e., inundation of wetlands) are also dominant drivers of wetland
ecosystems. These external factors, for example climate and geo-
morphology, play an important role in general wetland occurrence
and extent. Biological factors also play a role in wetland formation
through feedback responses to hydrological processes (Mitsch and
Gosselink 2000). Factors or stressors that influence the magnitude
of climatic and geomorphic external factors, and also control veg-
etation and soil characteristics of wetland sites, are presented in
Figure 29 (“Wetlands”) as human and biotic drivers. These stressors,
discussed in the following section, include: altered hydrology, intro-
duction of exotic plants, occurrence and management of ungulates,
beaver, and predators.
Stressors a. Upland Erosion: Many wetlands are located in depressions,
or in drainages that may be influenced by upslope erosional
processes, often exacerbated by extreme wet climatic periods,
and sometime by human activities, or natural processes such
as fires, that destabilize slopes. Sediment (or alluvium) moving
downslope will fill depressional wetlands and small drainages,
thus reducing or eliminating the wetland.
b. Wet/dry cycles: Climate is highly variable, but when extremes
of long-term wet or dry cycles occur they may alter the hydrol-
ogy that controls wetland occurrence. Long-term droughts have
caused many wetlands in the West to decline in size or dry
up, thus eliminating many of the associated species commonly
found in wetland communities. Contrarily, long-term wet peri-
ods may expand, or even create, wetlands. Longevity of these
wetlands may be solely dependent on continued wet climatic
cycles.
c. Altered Hydrology: The significance of hydrology in the forma-
tion and maintenance of wetlands becomes more obvious when
the hydrology is altered through human activities. Three forms
of hydrological alterations have been found to greatly modify
wetlands. One is the prevention of inflows of water from natu-
ral sources which eventually may dry up the wetland. On the
other hand, new or increased surface flows into low lying areas
may form wetlands where they have not occurred. Groundwater
withdrawal can lower the water table that supports wetland
inundation, and/or maintenance of continually wetted soils re-
Vital Signs Monitoring Plan • 109
sulting in wetland losses. Groundwater decline is not always
related to human activities as long-term droughts may result
in decreased water percolation to groundwater and thus reduc-
tion of wetland ecosystems that are supported by a shallow
water table or spring activity.
d. Biological Stressors: Plants and animals may modify wetland
composition, structure and diversity.
e. Exotic plants: Throughout the country, exotic plants have been
introduced into every kind of ecosystem. Wetland plants from
other continents are found in wetlands in the U.S.A., and plants
from other locations may also migrate by human means into
areas where they are not native. Consequently, many of the
wetlands within the GRYN region no longer have the pristine
plant community composition from the past. Exotic plants may
out-compete with native plants resulting in highly modified
wetland communities.
f. Ungulates: Native ungulates may play a role in modification of
wetlands. High density ungulate populations may alter vegeta-
tion composition or modify the geomorphic setting of wetlands.
Management of ungulates plays a role in numbers and loca-
tions of ungulate herds.
g. Beaver: Beaver, once very common in the GRYN and then
scarce, is making a comeback in some areas of GRYN. Beaver
can alter flowing streams and create wetlands, especially on
secondary channels of large rivers, and small creeks (Johnston
1994a). In many parts of the West, beaver once created strings
of wetlands where rivers now occur. Reintroduction of beaver
may eventually increase the extent of wetlands within the
GRYN in the future.
h. Predators: Coyotes, wolves and other predators may indirectly
play a role in wetland development and extent by controlling
ungulates and beavers. Lack of predators becomes a wetland
stressor because of their role in influencing the herbivores that
modify wetlands.
Processes The interaction of several stressors within the context of a functional
wetland will result in a modified wetland as briefly discussed under
“stressors”. However, the ecological processes (diamonds) in Figure 29
(“Wetlands”) that potentially lead to indicators may be a complex set
of interactions which result in modifications to wetlands. None of the
stressors act alone on existing wetlands, or in the creation of wetlands.
a. Depressional Wetland Dynamics: Probably the simplest of
the submodels developed to show dynamics of interactions
of stressors is that related to filling of depressional wetlands.
Precipitation and erosional processes interact to create and
reduce wetlands. Alluvium washed into depressional wetlands,
in time, may reduce or eradicate wetlands in its path. Although
depressional wetlands may not be the most common in the
GRYN, they do occur and several studies have shown rates of
sediment deposition in these (Ref.). These studies may be inter-
preted to illustrate the possible increase in deposition rates in
the depressional wetlands (and ponds) in GRYN resulting from
high rangeland utilization by ungulates in wetland watersheds
and adjacent to depressional areas.
b. Hydrological Dynamics: As the primary driver of wetlands, hy-
drology and those factors that influence it, play an important
role in extent of wetlands within the GRYN area. The amount
of precipitation, a function of wet/dry cycles, is the primary
controlling variable within the hydrological dynamics of the
landscape that includes wetlands. The fate of precipitation,
that is, what factors control its input to wetlands, becomes of
prime importance in understanding wetland dynamics in GRYN.
Figure 30 illustrates the complexity of the flow of water from
precipitation to wetlands. Some water runs off into streams,
lakes and human controlled or beaver created reservoirs. Some
percolates into the ground and emerges as springs. Eventually,
to form wetlands, these water sources must create standing
water long enough to form hydric soils and allow wetland veg-
etation to establish.
c. Wetland Vegetation Dynamics: The presence of wetland veg-
etation is one of the three properties that define a wetland. The
other two are duration of inundation and presence of hydric
soils. If appropriate wetland physical conditions exist, wet-
land vegetation will establish. Altered hydrology may enhance
wetland vegetation establishment if the hydrological changes
create periods of inundation, or prevent wetland formation if
the changes reduce or eliminate inundation periods. Wetland
vegetation structure and cover may be altered by herbivory by
ungulates, beaver and other wetland herbivores. Wetland plant
species composition is being altered by presence of introduced,
exotic plants throughout the country, the GRYN being no excep-
tion.
d. Beaver Population Dynamics: Beaver play a role as herbi-
110 • Appendix III: Conceptual Models
vores, often altering the structure and cover of wetland plants
(discussed above); however, the role of beaver may be more
significant in the formation of physical conditions that form,
and occasionally destroy, wetlands (Naiman 1988). Thus, the
abundance and distribution of beaver in the GRYN area are im-
portant factors in presence (and demise) of wetlands. Beaver
populations appear to be increasing in the GRYN area, some
naturally and some through reintroduction. This increase, if not
controlled by predators and humans, may eventually result in
greater extent of wetlands.
Outcomes and IndicatorsWithin the GRYN area there are several wetland types that result
from the interaction of natural hydrogeomorphic processes with
stressors that control or alter features of the wetlands (i.e., hy-
drology, soils and vegetation). These wetland types, mentioned in
wetland descriptions earlier in this discussion are (a) depressional
or pothole wetlands, (b) willow community wetlands, , (c) spring or
seep wetlands, (d) beaver dam wetlands, and (e) herbaceous wet-
lands or wet meadows. Each wetland type has its own unique set of
characteristics, a consequence of all of the drivers and stressors cre-
ating it, however, some basic parameters or metrics are common to
all. These include the fundamental structure and composition of the
wetlands, and the associated species. Obviously, vegetation com-
position may be primarily woody or herbaceous, but metrics such
as cover or species composition can be used as indicators for all
wetland types.
Another set of wetland parameters that may also be used as in-
dicators relates to the status of wetland associated species, such as
birds and amphibians. Both of these species assemblages have been
found to be useful indicators of wetland status.
1. Wetland Vegetation ParametersResource Monitored: Plant species composition, cover, abundance,
or diversity for each wetland type (i.e., depression, willow,
spring, beaver dam, and herbaceous wetlands).
Justification: The high biological diversity of wetlands is found in
the plant community as well as associated animal communities
and populations. The plant community is the foundation of the
wetland ecosystem. It responds to the hydrological events that
create inundation and hydric soils. Wetland plants, especially
obligate wetland plants, are limited to wetland physical condi-
tions. Consequently, plant associations in wetlands change in
response to the magnitude of stressors that may alter the influ-
ence of hydrology or ability of the plants to establish and grow
in wetland conditions. These changes, when determined in dif-
ferent types of wetlands will, over time, signal both short-term
and long-term local and regional wetland changes.
Comment: Abundance is a term often applied to quantification of
some ecosystem or community parameter. Because wetlands
plant communities tend to be dense, estimates of cover of in-
dividual species may be the best metric to use. Cover classes
(e.g., 1-5) may be appropriate. Sampling vegetation cover at
representative wetlands of each type, when present, will pro-
duce data on increasing or decreasing cover of individual spe-
cies and the whole community. This type of sampling will also
produce data on community composition and species diversity.
Example of specific measurements for indicator: An example of
a sampling scheme for determining species and total commu-
nity cover, as well as species composition might be a series of
random quadrats within a grid placed on the selected repre-
sentative wetland, or stratified portion of the wetland if it is
large. If the wetland has large woody species (e.g., willows),
nested quadrats should be used (i.e., large (4x4 m) for woody
and small (1x1 m) for herbaceous). The grid should be perma-
nently marked to allow continued sampling of the same area of
the wetland. Resampling (e.g., every 10 years) should be part of
the long-term monitoring program.
2. Wetland associated speciesResource Monitored: Abundance of associated animal species (e.g.,
amphibians, birds, small mammals, etc.) in each wetland type
(i.e., depression, willow, spring, beaver dam, and herbaceous
wetlands).
Justification: Wetlands sustain a high diversity of associated spe-
cies including, for example, birds, amphibians, small mammals,
insects, etc. The abundance or presence of these species and/
or the aggregate of these species (aka community) often act as
surrogates for the condition or health of the wetland. Within a
functional group, like birds, a change in composition of species
from wetland specialists to generalists may indicate a change
in food sources such as seeds and insects. In this way, the bird
assemblage may be an easier metric to measure than compre-
hensive vegetation samples.
Comment: Avian (bird) species assemblages have been widely used
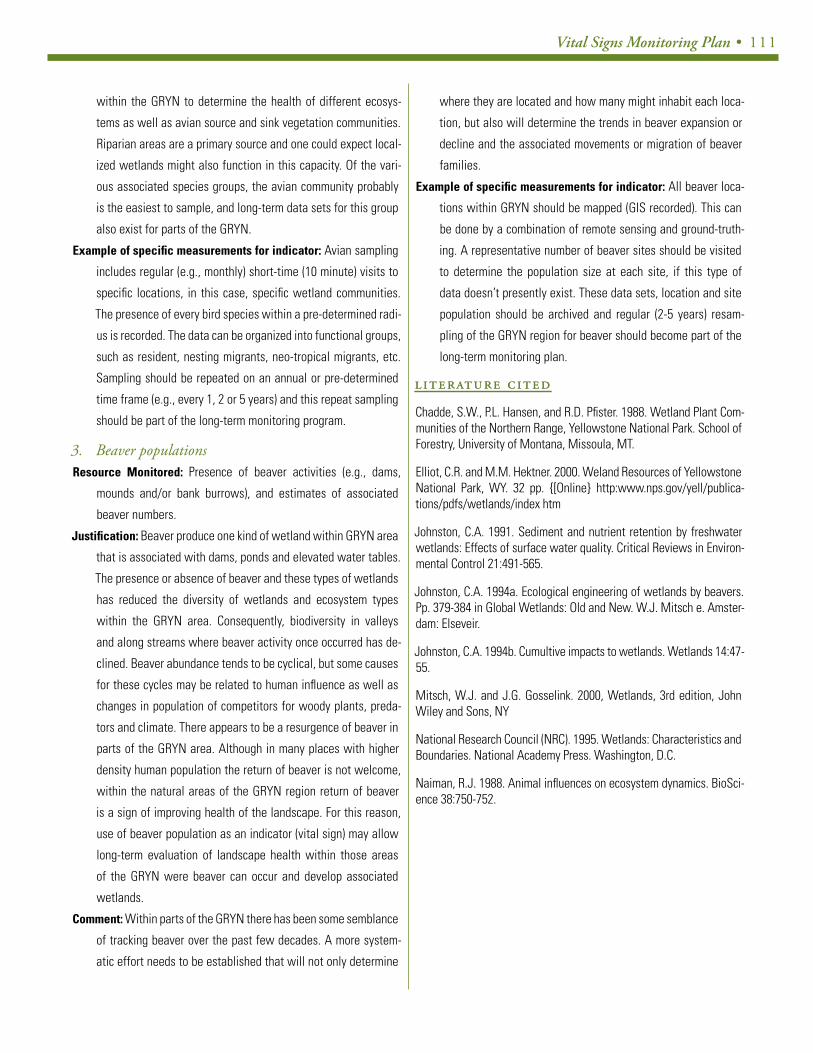
Vital Signs Monitoring Plan • 111
within the GRYN to determine the health of different ecosys-
tems as well as avian source and sink vegetation communities.
Riparian areas are a primary source and one could expect local-
ized wetlands might also function in this capacity. Of the vari-
ous associated species groups, the avian community probably
is the easiest to sample, and long-term data sets for this group
also exist for parts of the GRYN.
Example of specific measurements for indicator: Avian sampling
includes regular (e.g., monthly) short-time (10 minute) visits to
specific locations, in this case, specific wetland communities.
The presence of every bird species within a pre-determined radi-
us is recorded. The data can be organized into functional groups,
such as resident, nesting migrants, neo-tropical migrants, etc.
Sampling should be repeated on an annual or pre-determined
time frame (e.g., every 1, 2 or 5 years) and this repeat sampling
should be part of the long-term monitoring program.
3. Beaver populationsResource Monitored: Presence of beaver activities (e.g., dams,
mounds and/or bank burrows), and estimates of associated
beaver numbers.
Justification: Beaver produce one kind of wetland within GRYN area
that is associated with dams, ponds and elevated water tables.
The presence or absence of beaver and these types of wetlands
has reduced the diversity of wetlands and ecosystem types
within the GRYN area. Consequently, biodiversity in valleys
and along streams where beaver activity once occurred has de-
clined. Beaver abundance tends to be cyclical, but some causes
for these cycles may be related to human influence as well as
changes in population of competitors for woody plants, preda-
tors and climate. There appears to be a resurgence of beaver in
parts of the GRYN area. Although in many places with higher
density human population the return of beaver is not welcome,
within the natural areas of the GRYN region return of beaver
is a sign of improving health of the landscape. For this reason,
use of beaver population as an indicator (vital sign) may allow
long-term evaluation of landscape health within those areas
of the GRYN were beaver can occur and develop associated
wetlands.
Comment: Within parts of the GRYN there has been some semblance
of tracking beaver over the past few decades. A more system-
atic effort needs to be established that will not only determine
where they are located and how many might inhabit each loca-
tion, but also will determine the trends in beaver expansion or
decline and the associated movements or migration of beaver
families.
Example of specific measurements for indicator: All beaver loca-
tions within GRYN should be mapped (GIS recorded). This can
be done by a combination of remote sensing and ground-truth-
ing. A representative number of beaver sites should be visited
to determine the population size at each site, if this type of
data doesn’t presently exist. These data sets, location and site
population should be archived and regular (2-5 years) resam-
pling of the GRYN region for beaver should become part of the
long-term monitoring plan.
LITERATURE CITEDLITERATURE CITED
Chadde, S.W., P.L. Hansen, and R.D. Pfister. 1988. Wetland Plant Com-munities of the Northern Range, Yellowstone National Park. School of Forestry, University of Montana, Missoula, MT.
Elliot, C.R. and M.M. Hektner. 2000. Weland Resources of Yellowstone National Park, WY. 32 pp. {[Online} http:www.nps.gov/yell/publica-tions/pdfs/wetlands/index htm
Johnston, C.A. 1991. Sediment and nutrient retention by freshwater wetlands: Effects of surface water quality. Critical Reviews in Environ-mental Control 21:491-565.
Johnston, C.A. 1994a. Ecological engineering of wetlands by beavers. Pp. 379-384 in Global Wetlands: Old and New. W.J. Mitsch e. Amster-dam: Elseveir.
Johnston, C.A. 1994b. Cumultive impacts to wetlands. Wetlands 14:47-55.
Mitsch, W.J. and J.G. Gosselink. 2000, Wetlands, 3rd edition, John Wiley and Sons, NY
National Research Council (NRC). 1995. Wetlands: Characteristics and Boundaries. National Academy Press. Washington, D.C.
Naiman, R.J. 1988. Animal influences on ecosystem dynamics. BioSci-ence 38:750-752.
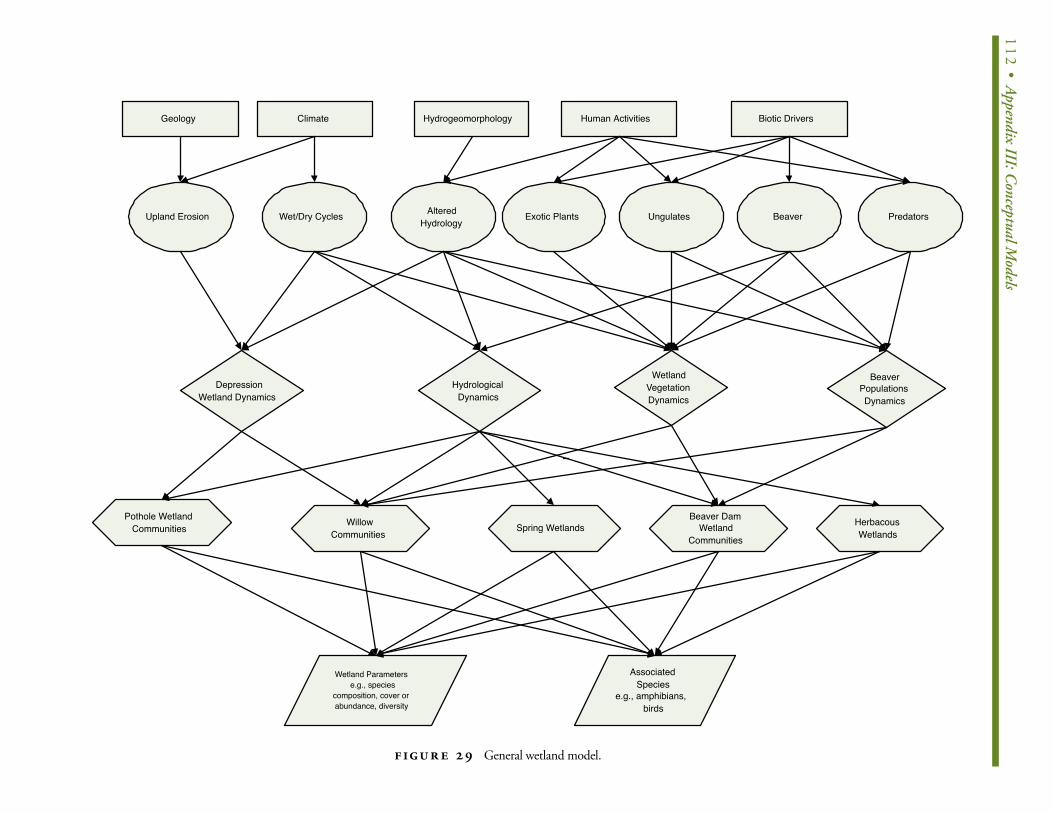
112 • Appendix III: Conceptual M
odels
Upland Erosion
DepressionWetland Dynamics
Pothole WetlandCommunities
Wetland Parameterse.g., species
composition, cover orabundance, diversity
HydrogeomorphologyClimate Biotic DriversGeology
AlteredHydrology
Wet/Dry Cycles Ungulates Predators
HydrologicalDynamics
WetlandVegetationDynamics
BeaverPopulationsDynamics
WillowCommunities
Beaver DamWetland
Communities
HerbacousWetlands
AssociatedSpecies
e.g., amphibians,birds
Beaver
Spring Wetlands
Human Activities
Exotic Plants
FIGUR E 29 General wetland model.
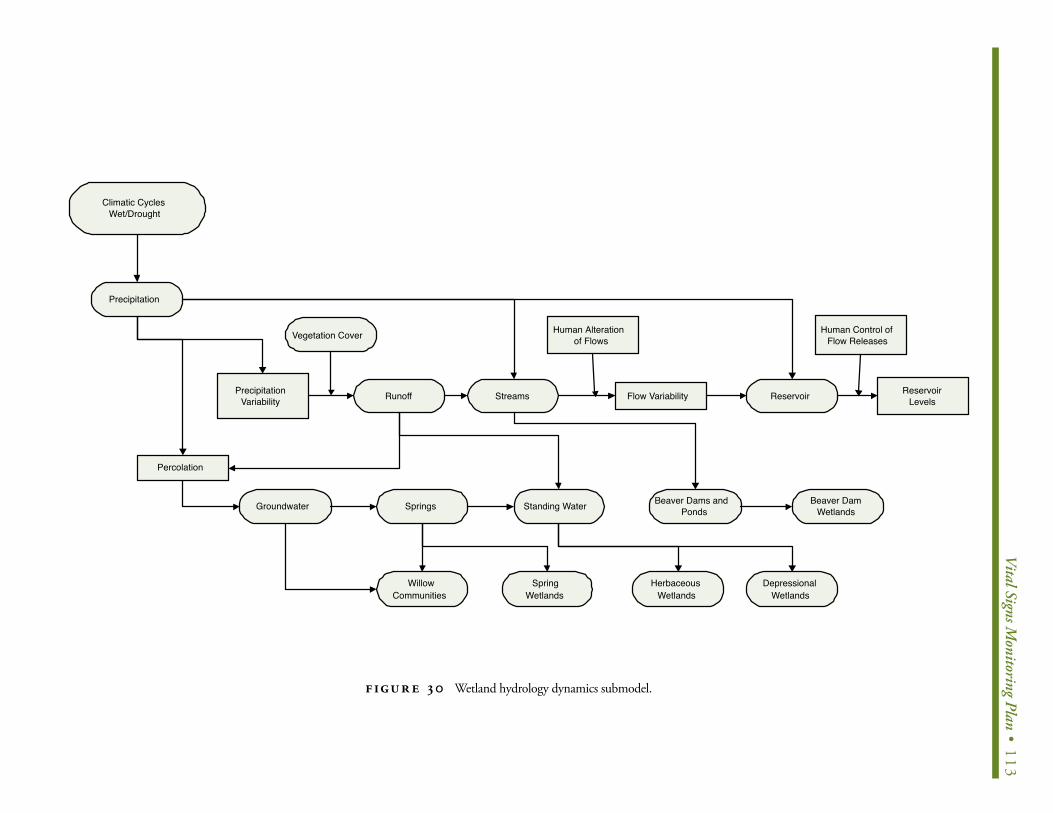
V
ital Signs Monitoring Plan • 113
Climatic CyclesWet/Drought
Precipitation
PrecipitationVariability Runoff Streams Flow Variability
Groundwater Springs
Percolation
Reservoir ReservoirLevels
Vegetation Cover Human Alterationof Flows
Human Control ofFlow Releases
Beaver Dams andPonds
Beaver DamWetlands
WillowCommunities
Standing Water
HerbaceousWetlands
DepressionalWetlands
SpringWetlands
FIGUR E 30 Wetland hydrology dynamics submodel.
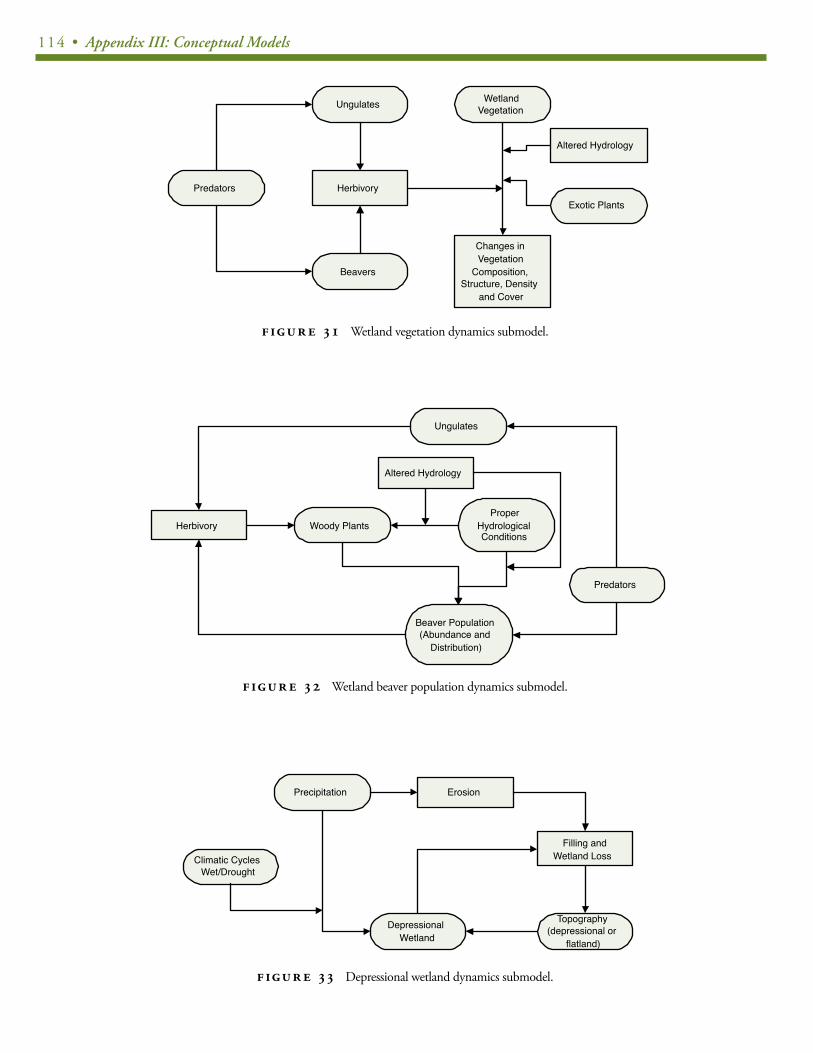
114 • Appendix III: Conceptual Models
Ungulates WetlandVegetation
Changes inVegetation
Composition,Structure, Density
and Cover
Beavers
HerbivoryPredatorsExotic Plants
Altered Hydrology
FIGUR E 31 Wetland vegetation dynamics submodel.
Woody Plants
Beaver Population(Abundance and
Distribution)
Predators
Ungulates
HerbivoryProper
HydrologicalConditions
Altered Hydrology
FIGUR E 32 Wetland beaver population dynamics submodel.
Erosion
Filling andWetland Loss
Precipitation
Topography(depressional or
flatland)
Climatic CyclesWet/Drought
DepressionalWetland
FIGUR E 33 Depressional wetland dynamics submodel.
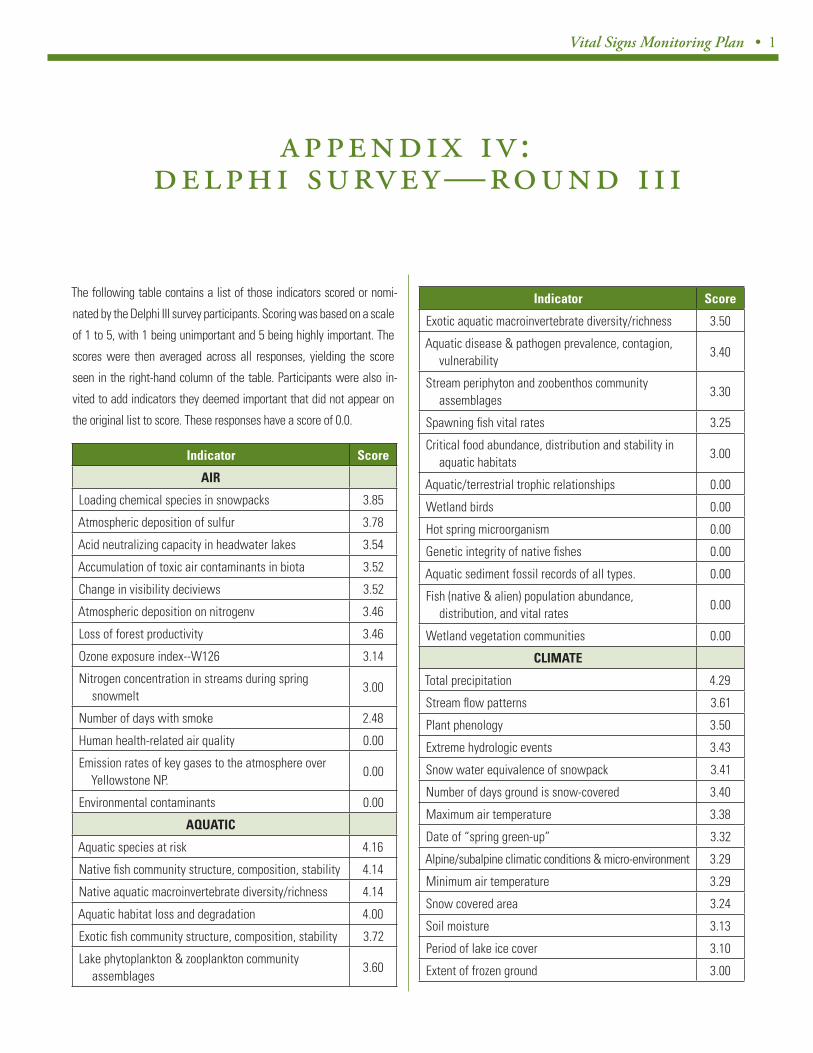
Vital Signs Monitoring Plan • 1
The following table contains a list of those indicators scored or nomi-
nated by the Delphi III survey participants. Scoring was based on a scale
of 1 to 5, with 1 being unimportant and 5 being highly important. The
scores were then averaged across all responses, yielding the score
seen in the right-hand column of the table. Participants were also in-
vited to add indicators they deemed important that did not appear on
the original list to score. These responses have a score of 0.0.
Indicator Score
AIR
Loading chemical species in snowpacks 3.85
Atmospheric deposition of sulfur 3.78
Acid neutralizing capacity in headwater lakes 3.54
Accumulation of toxic air contaminants in biota 3.52
Change in visibility deciviews 3.52
Atmospheric deposition on nitrogenv 3.46
Loss of forest productivity 3.46
Ozone exposure index--W126 3.14
Nitrogen concentration in streams during spring snowmelt
3.00
Number of days with smoke 2.48
Human health-related air quality 0.00
Emission rates of key gases to the atmosphere over Yellowstone NP.
0.00
Environmental contaminants 0.00
AQUATIC
Aquatic species at risk 4.16
Native fish community structure, composition, stability 4.14
Native aquatic macroinvertebrate diversity/richness 4.14
Aquatic habitat loss and degradation 4.00
Exotic fish community structure, composition, stability 3.72
Lake phytoplankton & zooplankton community assemblages
3.60
Indicator Score
Exotic aquatic macroinvertebrate diversity/richness 3.50
Aquatic disease & pathogen prevalence, contagion, vulnerability
3.40
Stream periphyton and zoobenthos community assemblages
3.30
Spawning fish vital rates 3.25
Critical food abundance, distribution and stability in aquatic habitats
3.00
Aquatic/terrestrial trophic relationships 0.00
Wetland birds 0.00
Hot spring microorganism 0.00
Genetic integrity of native fishes 0.00
Aquatic sediment fossil records of all types. 0.00
Fish (native & alien) population abundance, distribution, and vital rates
0.00
Wetland vegetation communities 0.00
CLIMATE
Total precipitation 4.29
Stream flow patterns 3.61
Plant phenology 3.50
Extreme hydrologic events 3.43
Snow water equivalence of snowpack 3.41
Number of days ground is snow-covered 3.40
Maximum air temperature 3.38
Date of “spring green-up” 3.32
Alpine/subalpine climatic conditions & micro-environment 3.29
Minimum air temperature 3.29
Snow covered area 3.24
Soil moisture 3.13
Period of lake ice cover 3.10
Extent of frozen ground 3.00
APPENDIX IV: DELPHI SURVEY—ROUND I I I
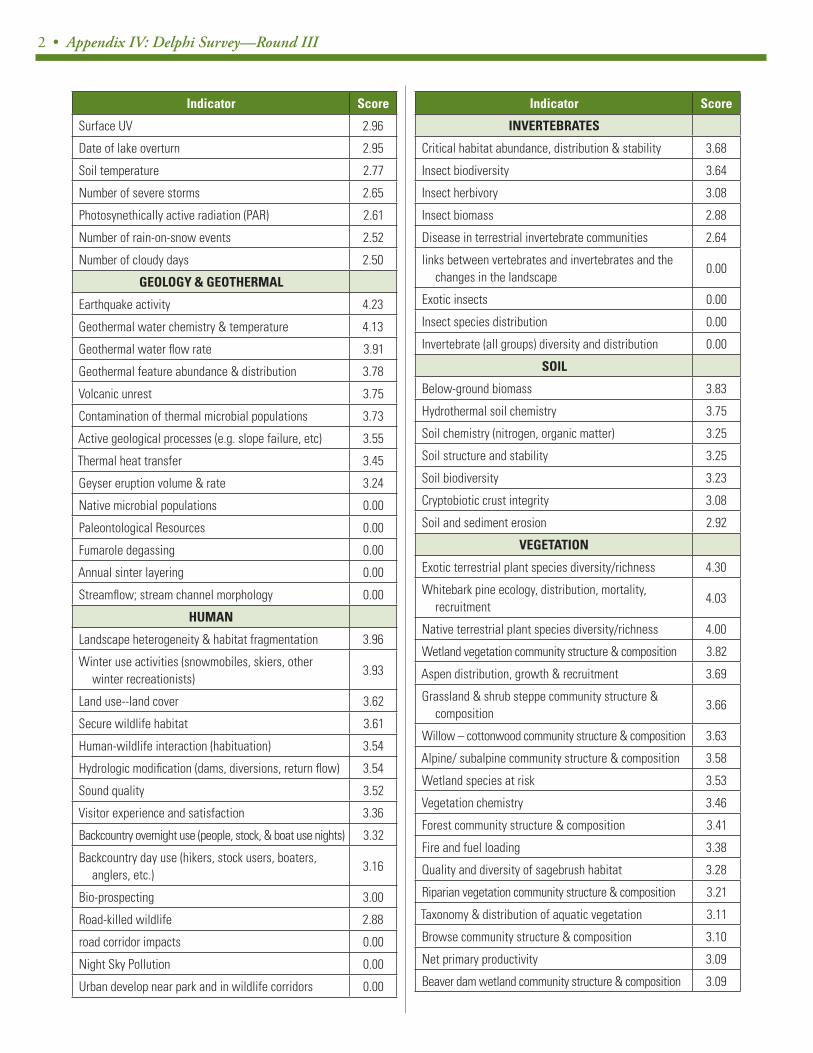
2 • Appendix IV: Delphi Survey—Round III
Indicator Score
Surface UV 2.96
Date of lake overturn 2.95
Soil temperature 2.77
Number of severe storms 2.65
Photosynethically active radiation (PAR) 2.61
Number of rain-on-snow events 2.52
Number of cloudy days 2.50
GEOLOGY & GEOTHERMAL
Earthquake activity 4.23
Geothermal water chemistry & temperature 4.13
Geothermal water flow rate 3.91
Geothermal feature abundance & distribution 3.78
Volcanic unrest 3.75
Contamination of thermal microbial populations 3.73
Active geological processes (e.g. slope failure, etc) 3.55
Thermal heat transfer 3.45
Geyser eruption volume & rate 3.24
Native microbial populations 0.00
Paleontological Resources 0.00
Fumarole degassing 0.00
Annual sinter layering 0.00
Streamflow; stream channel morphology 0.00
HUMAN
Landscape heterogeneity & habitat fragmentation 3.96
Winter use activities (snowmobiles, skiers, other winter recreationists)
3.93
Land use--land cover 3.62
Secure wildlife habitat 3.61
Human-wildlife interaction (habituation) 3.54
Hydrologic modification (dams, diversions, return flow) 3.54
Sound quality 3.52
Visitor experience and satisfaction 3.36
Backcountry overnight use (people, stock, & boat use nights) 3.32
Backcountry day use (hikers, stock users, boaters, anglers, etc.)
3.16
Bio-prospecting 3.00
Road-killed wildlife 2.88
road corridor impacts 0.00
Night Sky Pollution 0.00
Urban develop near park and in wildlife corridors 0.00
Indicator Score
INVERTEBRATES
Critical habitat abundance, distribution & stability 3.68
Insect biodiversity 3.64
Insect herbivory 3.08
Insect biomass 2.88
Disease in terrestrial invertebrate communities 2.64
links between vertebrates and invertebrates and the changes in the landscape
0.00
Exotic insects 0.00
Insect species distribution 0.00
Invertebrate (all groups) diversity and distribution 0.00
SOIL
Below-ground biomass 3.83
Hydrothermal soil chemistry 3.75
Soil chemistry (nitrogen, organic matter) 3.25
Soil structure and stability 3.25
Soil biodiversity 3.23
Cryptobiotic crust integrity 3.08
Soil and sediment erosion 2.92
VEGETATION
Exotic terrestrial plant species diversity/richness 4.30
Whitebark pine ecology, distribution, mortality, recruitment
4.03
Native terrestrial plant species diversity/richness 4.00
Wetland vegetation community structure & composition 3.82
Aspen distribution, growth & recruitment 3.69
Grassland & shrub steppe community structure & composition
3.66
Willow – cottonwood community structure & composition 3.63
Alpine/ subalpine community structure & composition 3.58
Wetland species at risk 3.53
Vegetation chemistry 3.46
Forest community structure & composition 3.41
Fire and fuel loading 3.38
Quality and diversity of sagebrush habitat 3.28
Riparian vegetation community structure & composition 3.21
Taxonomy & distribution of aquatic vegetation 3.11
Browse community structure & composition 3.10
Net primary productivity 3.09
Beaver dam wetland community structure & composition 3.09

Vital Signs Monitoring Plan • 3
Indicator Score
Desert shrub community structure and composition 3.00
Stream bank stability 2.97
Tree line elevation 2.92
Floodplain development 2.90
Sediment deposition in depressional wetlands 2.58
Juniper community structure & composition 2.56
Impacts of livestock grazing 0.00
Bryophytes 0.00
Distribution of exotic plant diseases 0.00
Bark beetle trends 0.00
Impacts of browsing by ungulates 0.00
Demographics of selected plants 0.00
Cushion plant community species richness and diversity 0.00
Lichen abundance and distribution 0.00
Area occupied by rare or declining plant community types 0.00
Plant disease trends 0.00

4 • Appendix IV: Delphi Survey—Round III
Vital Signs Monitoring Plan • 1
APPENDIX V: VITAL SIGNS MONITORING WORKSHOP REPORT
REPORT OF
THE NATIONAL PARK SERVICE
GREATER YELLOWSTONE INVENTORY AND MONITORING NETWORK: VITAL SIGNS MONITORING WORKSHOP
MAY 6-8, 2003
Strand Union Building, Montana State University
Bozeman, Montana
CATHIE JEAN Program Manager
ANNE SCHRAG
Communications Director
Forestry Sciences Laboratory Montana State University
1648 S. 7th Avenue Bozeman, Montana 59717
http://www.nature.nps.gov/im/units/gryn/index.shtml

2 • Appendix V: Vital Signs Monitoring Workshop Report
TABLE OF CONTENTS
TABLE OF CONTENTS ............................................................................................................. 2
EXECUTIVE SUMMARY .......................................................................................................... 3
OVERVIEW OF THE GRYN ..................................................................................................... 4 GRYN BACKGROUND INFORMATION .......................................................................................... 4 PURPOSE OF THE VITAL SIGNS MONITORING WORKSHOP ............................................................... 5 WORKSHOP PLANNING TEAM ...................................................................................................... 6 THE FUTURE: WHERE DO WE GO FROM HERE? ............................................................................. 7
VITAL SIGNS MONITORING WORKSHOP-DAY 1 ............................................................ 8 OBJECTIVES ................................................................................................................................. 8 PRESENTATIONS........................................................................................................................... 8
Introduction to the National Park Service Inventory & Monitoring Program....................... 8 GRYN Vital Signs Monitoring Plan ........................................................................................ 8 Variability in Natural Systems and Monitoring Considerations ............................................ 9 The Role of Conceptual Models in Choosing Vital Signs ....................................................... 9
EVENING CONCEPTUAL MODEL SOCIAL HOUR.......................................................................... 10
VITAL SIGNS MONITORING WORKSHOP-DAY 2 .......................................................... 11 OBJECTIVES ............................................................................................................................... 11 BREAKOUT GROUP SESSIONS..................................................................................................... 11
Overall comments about the process and/or selection criteria ............................................ 14 Specific comments about the process and/or selection criteria............................................ 14 Concerns with the interpretation of the selection criteria .................................................... 15 Concerns with the wording of the selection criteria............................................................. 15 Comments recorded by breakout groups regarding the selection criteria ........................... 16
VITAL SIGNS MONITORING WORKSHOP-DAY 3 .......................................................... 17 OBJECTIVES ............................................................................................................................... 17 PRESENTATIONS, BREAKOUT GROUP EXERCISES AND COMMENTS............................................ 17
Presentation of the ranked list of vital signs......................................................................... 17 Comments.............................................................................................................................. 17 Breakout group exercise ....................................................................................................... 18 Comments.............................................................................................................................. 19
CONCLUSIONS ......................................................................................................................... 20
ACKNOWLEDGEMENTS ....................................................................................................... 21
Vital Signs Monitoring Plan • 3
EXECUTIVE SUMMARY This report summarizes the events of the Vital Signs Monitoring Workshop hosted by the Greater Yellowstone Inventory and Monitoring Network (GRYN) May 6-8, 2003 at the Strand Union Building on the campus of Montana State University, Bozeman, Montana. This workshop is part of the extensive process used to select vital signs to be included in the GRYN Vital Signs Monitoring Plan. The overall goal of the meeting was to apply priority setting to a list of proposed candidate vital signs to be monitored as a means for determining the long-term ecosystem health of the parks of the GRYN. Throughout the workshop, participants also undertook the task of peer review of the ecosystem conceptual models and the decision support system created by the GRYN workshop planning team. (Please see Appendix A for the complete workshop agenda.) The first day of the workshop was designed to create a shared knowledge and understanding of the National Inventory and Monitoring (I&M) Program, the GRYN and the process by which the workshop planning team developed the list of proposed candidate vital signs used throughout the Vital Signs Monitoring Workshop. The goals of the National I&M Program were explained to the participants, as was the need to create a comprehensive and integrative program. Because of time and budgetary constraints, prioritization of vital signs is fundamental, and the primary objective of this workshop was to use experts’ knowledge to undertake one step of the prioritization process. Participants were informed that choices they made during this workshop did not constitute a final list of vital signs to be monitored by the GRYN, but that their decisions would be used by the GRYN staff and Technical Planning Committee to make recommendations to the Board of Directors for final approval in August 2003. During the second day of the workshop, participants were divided into resource-based breakout groups as follows: air quality and climate (joint group), geology and geothermal (joint group), aquatics and water quality (joint group), human use, invertebrates, terrestrial vegetation, terrestrial vertebrates. Using a list of proposed candidate vital signs and information such as the justification given through the conceptual model process or the Delphi survey process and proposed metrics, the breakout groups used a worksheet to evaluate each candidate vital sign using a predetermined set of desirable characteristics. The completion of these worksheets required current knowledge about the ecological relevance, response variability, management relevance, feasibility of implementation, interpretation and utility of the proposed vital sign. (Please see Appendix B for the complete set of selection criteria.) These data were given to the workshop data manager and entered into the decision support system Access database in real time to produce a ranked list of candidate vital signs. (Please see Appendix I for the ranked list of candidate vital signs.) On the third day of the workshop, participants were given the opportunity to evaluate the ranked list of candidate vital signs and give overall comments. Comments are given in more detail in the body of this report. Participants then engaged in an exercise to determine the spatial and temporal scales within which data about each candidate vital sign could be collected or evaluated. The results of this exercise will be used to evaluate the utility of the vital signs throughout various spatial and temporal scales. This information will be used to summarize the spatial sampling design for the parks.
4 • Appendix V: Vital Signs Monitoring Workshop Report
OVERVIEW OF THE GRYN GRYN Background Information The Mission of the National Park Service (NPS) is “to conserve unimpaired the natural and cultural resources and values of the national park system for the enjoyment of this and future generations”. To uphold this goal, the NPS created the Natural Resource Challenge in 2000 to encourage National Parks to focus on the preservation of the nation’s natural heritage through science, natural resource inventories and expanded resource monitoring and management. This Challenge was legally guided by the National Parks Omnibus Management Act of 1998. Through the Natural Resource Challenge, the 265 parks of the NPS were placed into seven regions and, subsequently, organized into thirty-two Inventory and Monitoring Networks, based on geographic and ecological similarities. The overarching goal of the Networks can be summarized by the following quote from the NPS Advisory Board in July 2001: “A sophisticated knowledge of resources and their condition is essential. The Service must gain this knowledge through extensive collaboration with other agencies and academia, and its findings must be communicated to the public. For it is the broader public that will decide the fate of these resources”. The goals of the Networks are:
• To inventory the natural resources and park ecosystems under NPS stewardship; • To determine their nature and status; • To monitor park ecosystems to better understand their dynamic nature and condition; • To provide reference points for comparisons with other altered environments; • To integrate natural resources inventory and monitoring information into NPS planning,
management and decision-making. The Greater Yellowstone Area (GYA) encompasses 18 million acres in three states—Montana, Wyoming and Idaho. Six National Forests and three National Wildlife Refuges lie within this area. Known as one of the largest intact natural areas in the contiguous United States, it has an enormous variety of vegetative communities that boast stable grizzly bear populations, trumpeter swan wintering grounds, free-ranging bison and the largest elk herd in North America. However, because of its wild nature, the GYA is attracting widespread development, in turn creating new disturbances to flora and fauna. The GRYN encompasses the GYA, which consists of four National Park Service protected areas: Bighorn Canyon National Recreation Area (BICA), Grand Teton National Park (GRTE), John D. Rockefeller Memorial Parkway (JODR) and Yellowstone National Park (YELL). The GRYN was approved by a charter in 2001 and consists of a Board of Directors, Technical Planning Committee, Science Committee and GRYN staff. The Board of Directors (BOD) is comprised of the park superintendents (or his/her appointee) from each of the three GRYN parks and the Research Coordinator for the Rocky Mountains-Cooperative Ecosystems Studies Unit. The BOD directs the GRYN and provides oversight, as well as approving budgets, work plans and the final monitoring plan. The Technical Planning Committee (TPC) is responsible for strategic decisions, such as writing work plans, identifying subject experts as scientific advisors and providing the GRYN with current data and methodologies being used by the parks. A representative from each park sits on the TPC, as well as the Inventory and Monitoring (I&M) Program Manager and the Research Coordinator for the Rocky Mountains-Cooperative

Vital Signs Monitoring Plan • 5
Ecosystems Studies Unit. Members of the Science Committee (SC) are chosen from regional universities and other scientific agencies. The role of the SC is to provide scientific background, suggestions and review that will be used to choose vital signs and to assist in the creation of sampling designs and protocols. The GRYN staff consists of a Program Manager, Cartographic Technician, Communications Director and Writer/Editor, all of whom are based at the Forestry Sciences Lab at Montana State University in Bozeman, Montana and are hosted by the USGS-Northern Rocky Mountain Science Center. In addition, Bighorn Canyon National Recreation Area houses a GRYN ecologist and Grand Teton National Park hosts a GRYN hydrologist. The positions of Data Manager and Quantitative Ecologist, both to be based in Bozeman, will be filled in 2003. The GRYN is focusing its efforts in three primary areas: data management, inventories and long-term monitoring. Because monitoring vital signs is one of the primary goals of the GRYN, the selection of these vital signs and how best to measure them is an integral part of the success of the program. In order to assure a secure scientific backing, the GRYN formed partnerships with universities, non-profits and park personnel. In 2001 the GRYN joined with the University of Idaho-College of Natural Resources to conduct an internet-based survey of park personnel, university faculty, environmental groups and other agencies. This “Delphi” survey process consisted of three rounds of questioning meant to identify and rank the most important ecosystem components, conditions and processes. Over 100 individuals responded to this survey. In addition to the Delphi surveys, the GRYN took on the task of developing conceptual ecosystem models to understand the complex nature of the interactions between ecosystem components. These conceptual models are being used to better understand the ecosystems under study and provide solid scientific information based in literature as well as to help guide those who will choose the vital signs for monitoring. The models show drivers, stressors, ecological responses, outcomes and indicators that will warn managers of ecosystem changes. Along with the Delphi survey and conceptual models, the GRYN has completed a literature review and park-specific workshops. The literature review allows the GRYN quick access to a variety of pertinent scientific studies that have been performed in the GYA and, specifically, in the GRYN parks. The GRYN also hosted park-specific workshops, preceding the Vital Signs Monitoring Workshop, where park managers were given the opportunity to peer review the conceptual models and selection criteria used by the GRYN during the Vital Signs Monitoring Workshop. (Workshop reports from the park-specific workshops are available upon request.) Purpose of the Vital Signs Monitoring Workshop The list of vital signs to be monitored by the GRYN will be approved by the Board of Directors in August 2003. In order to narrow down an extensive list of possible indicators to a manageable few that will become the final list, the GRYN, under guidance from the National I&M Program, hosted the Vital Signs Monitoring Workshop. The goal of this workshop was to assemble subject-area experts to give guidance on which proposed candidate vital signs they believed were most beneficial to the GRYN in keeping with the Service-wide Network goals set forth by the NPS. In order to complete these tasks, the workshop planning team created a list of thirteen
6 • Appendix V: Vital Signs Monitoring Workshop Report
selection criteria—a set of yes/no questions to be answered by workshop participants, with space provided for helpful comments corresponding to the criteria. (Please see Appendix H for the complete table of comments.) The selection criteria were developed to determine which of the candidate vital signs contained those desirable characteristics that were deemed important through a literature review and peer review during the park-specific workshops prior to the Vital Signs Monitoring Workshop. The selection criteria worksheets were completed by the participants and then entered into the decision support system Access database the afternoon and evening of the second day of the workshop. This allowed the workshop planning team to present the results to the participants during the third day of the workshop, allowing for comment by the participants on both the process and results. Approximately 150 individuals were invited from a variety of government, non-government, academic and non-profit organizations, with fifty-six attending. Organizations represented include: Yellowstone National Park, Grand Teton National Park, Bighorn Canyon National Recreation Area, Rocky Mountains-Cooperative Ecosystems Studies Unit, National Park Service-Air Resources Division, U.S. Geological Survey-Water Resources Division, U.S. Geological Survey-Northern Rocky Mountain Science Center, Environmental Protection Agency, Greater Yellowstone Coordinating Committee, U.S. Forest Service, Wyoming Game and Fish, Snowcap Hydrology, Yellowstone Ecological Research Center, Montana Natural Heritage Program, Montana State University, Montana State University-Big Sky Institute, Idaho State University, Iowa State University, University of Oregon, University of Montana, University of Wyoming and the Wyoming Natural Diversity Database. For a complete list of participants and contact information, please see Appendix C. Workshop Planning Team The workshop planning team consisted of a group of individuals who helped create the concept behind the Vital Signs Monitoring Workshop, establish workshop goals, generate useful selection criteria and produce a decision support system database. Cathie Jean, Program Manager for the GRYN, was the leader of workshop planning and implementation. Tom Olliff, Chief of Resources at Yellowstone National Park and a member of the TPC, was an integral part of the vital signs selection process and provided helpful critique. Glenn Plumb, Supervisory Wildlife Biologist at Yellowstone National Park, was the author of the selection criteria, ranking process and development of narrative and schematic conceptual models. Ann Rodman, Supervisory GIS Specialist at Yellowstone National Park and a member of the TPC, created the version of the decision support system Access database used during the workshop and provided oversight during data entry and analysis. Duncan Patten, Research Professor at Montana State University, was instrumental in the conceptual model design, as well as author of many individual models and narratives. Bob Hall, Assistant Professor at the University of Wyoming, was the aquatics conceptual model author. Dan Tinker, Assistant Professor at the University of Wyoming, authored many of the terrestrial vegetation conceptual models. Anne Schrag, Communications Director for the GRYN, provided logistical support during the workshop and prepared this workshop report.
Vital Signs Monitoring Plan • 7
The Future: Where do we go from here? After completion of the Vital Signs Monitoring Workshop, the GRYN will work closely with the TPC to choose and recommend vital signs for BOD approval. The GRYN will begin this process by hosting the Technical Planning Committee Vital Signs Selection Meeting at Mammoth Hot Springs, Yellowstone National Park, in June 2003. During this meeting, the GRYN staff and Technical Planning Committee members will choose candidate vital signs to submit to the Board of Directors for approval. In order to select the appropriate vital signs for monitoring, they will have at their disposal a conceptual framework for the proposed vital signs, the ranked list of vital signs from the Vital Signs Monitoring Workshop and technical notes on highly ranked vital signs from all resource areas. After the vital signs selection has occurred, the Board of Directors will have final approval during an August 2003 meeting at Lake, Yellowstone National Park. Following this meeting, the GRYN will submit its Phase II Report in September 2003, outlining the process it took to choose the selected vital signs, including literature review, the Delphi survey, conceptual models and the workshop series. During the following year, 2004, the GRYN will undertake extensive research efforts to develop monitoring objectives and protocols that will be included in the Phase III Report, to be submitted in December 2004, along with the Draft Vital Signs Monitoring Plan for peer review. The final Vital Signs Monitoring Plan will be submitted in December 2005.

8 • Appendix V: Vital Signs Monitoring Workshop Report
VITAL SIGNS MONITORING WORKSHOP-DAY 1 Objectives The objectives of the first day of the Vital Signs Monitoring Workshop were as follows: • To create a shared understanding of the NPS I&M Program and the Greater Yellowstone
Network • To inform participants of the process used to identify candidate vital signs • To create an informal, open-forum discussion of the posted conceptual models as part of an
evening social hour Presentations In order to accomplish these objectives, several presenters were asked to share information about the part of the workshop planning process with which they were involved. To open the meeting, Tom Olliff, Chief of Resources at Yellowstone National Park, shared the sentiment that this is a historic time in the life of the NPS with respect to a shift in focus from scenery management to natural resources management.
Introduction to the National Park Service Inventory & Monitoring Program Steve Fancy, National I&M Program Coordinator This introduction was followed by a presentation by Steve Fancy, National I&M Coordinator, about the national program perspective. He referred to the Natural Resource Challenge, which provides the funding for the I&M Program, as a “wave of change”, giving true meaning to the phrase “science for parks, parks for science”. The Challenge doubles the natural resource staff in the NPS. According to Fancy, goals of long-term monitoring include providing an early warning of change in order to eliminate non-action due to a lack of knowledge and resources. In addition, the I&M Networks are tasked with identifying what kinds of changes are acceptable, meanwhile focusing on the most significant ecological indicators because of time and money constraints. Fancy also focused on the need for partnerships between Networks and universities and other agencies, all the while keeping the information obtained through inventories and monitoring useful for many different divisions within the parks. The creation of Networks will allow for professional staff to design, implement and communicate the results of the I&M program throughout the Network parks.
GRYN Vital Signs Monitoring Plan Cathie Jean, GRYN Program Manager Cathie Jean, Program Manager for the GRYN, gave an overview of the GRYN, including the GRYN parks, operating procedures and budget estimates. Jean gave an overview of the process leading to the list of proposed candidate vital signs. The Delphi Internet survey consisted of
Vital Signs Monitoring Plan • 9
three rounds of questions, with the third round including a ranking of indicator importance. One value of such a survey was the independent thinking that took place because participants were dispersed through time and space. However, this process also lacks statistical power. Ecosystem conceptual models were then created to show the most important components and linkages in key ecosystems throughout the parks of the GRYN and are backed by scientific literature. Jean then emphasized the importance of the process the participants would undergo during day two, and encouraged recording any comments that classify or justify answers given on the selection criteria worksheets.
Variability in Natural Systems and Monitoring Considerations Duncan Patten, Research Professor, Montana State University The focus of Duncan Patten’s presentation was the application of historic range of variability to ecosystem management and monitoring. This presentation was requested, in part, to give participants a frame of reference for some of the selection criteria that dealt with the natural range of variability of certain proposed candidate vital signs. According to Patten, the historic range of variability helps in understanding the dynamic nature of ecosystems. In order to consider past conditions, one must include both natural and human-induced impacts, such as climate change, invasive species, etc. One method of evaluating the historic range of variability is through repeat photography, which gives a good representation of historic changes, as well as showing temporal and spatial variability, but also requires interpretation. Patten left participants with the question of whether the historic range of variability is a useful tool for monitoring at a variety of scales, as well as the question of “what do we do?” when the desired future condition does not match the historic range of variability or the present condition does match the historic range of variability.
The Role of Conceptual Models in Choosing Vital Signs Glenn Plumb, Supervisory Wildlife Biologist, Yellowstone National Park Duncan Patten, Research Professor, Montana State University Dan Tinker, Assistant Professor, University of Wyoming Bob Hall, Assistant Professor, University of Wyoming Glenn Plumb, Supervisory Wildlife Biologist at Yellowstone National Park, was on detail with the GRYN during the winter of 2002-2003 with the specific task of helping to create a defensible vital signs selection process. Plumb went about this task by using graphic conceptual models as “problem solving vehicles” that illustrate the linkages among key environmental drivers, stressors, ecological effects, outcomes and measurable parameters that serve as ecological response signals. According to Plumb, the GRYN conceptual model formula was based off of work done in the Everglades, wherein eight steps were taken to create useful conceptual models that lead the GRYN to a list of vital signs to monitor. These steps include: 1) considering the spatial, temporal and ecological scales and boundaries; 2) identifying important elements of ecosystem structure and function; 3) identifying sources of anthropogenic or natural stressors of concern; 4) describing stressor mechanisms and routes of exposure or linkage; 5) identifying ecological receptors and at-risk components; 6) identifying ecological endpoints; 7) developing

10 • Appendix V: Vital Signs Monitoring Workshop Report
stress-effects causal pathways; and 8) identifying a particular structural framework for the graphics. Plumb stressed that the conceptual models designed for the GRYN were not meant to be complete ecosystems, rather to identify components of the systems that are often not considered, but are more informative than many other parts of the system that are easily recognized and used. Following this presentation, Duncan Patten, Dan Tinker and Bob Hall, three of the five conceptual model authors for the GRYN, gave brief presentations on chosen models, in order to guide participants through this part of the process used to identify proposed candidate vital signs. A complete set of draft conceptual models presented at the workshop can be found in Appendix D. Evening Conceptual Model Social Hour On the evening of day one of the workshop, participants were invited to a social in which the draft conceptual models were displayed for peer review. Conceptual model authors contributed fifteen total models focusing on the following systems: lake, river, dry woodland, lodgepole pine, ponderosa pine, whitebark pine, mixed conifer, aspen, alpine and timberline (joint), riparian, wetland, shrubland, grassland, geothermal and Yellowstone National Park. These models were reproduced in 36”x 42” poster size at the social and participants were encouraged to discuss questions, concerns and comments with the authors and to “mark up” the posters with changes they believed would make the posters more informative or inclusive of important ecosystem processes. Dan Tinker, terrestrial systems model author, received many excellent and helpful comments during this time and thought that the social atmosphere was helpful. According to Bob Hall, aquatics conceptual model author, the peer review received during this social hour was very helpful, especially since the social occurred almost directly after the presentation of the models. Therefore, many participants came with questions or ideas already formulated and ready for discussion.

Vital Signs Monitoring Plan • 11
VITAL SIGNS MONITORING WORKSHOP-DAY 2 Objectives The objectives for the second day of the Vital Signs Monitoring Workshop were as follows: • To apply the selection criteria from the decision support system to each candidate vital sign
in the topic area and provide results to the decision support system manager by 5:00 pm • To document comments related to the scoring decisions that will be incorporated into a report
for the Technical Committee and Science Committee Breakout Group Sessions Participants were directed to breakout rooms (one group per room, except for very small groups) and given the task of completing the selection criteria worksheet(s) for each vital sign assigned to that group. The number of assigned candidate vital signs ranged widely, from fifty-four in the terrestrial vegetation group to seven in the invertebrate group. However, the number of experts in each group also varied, from thirteen in the terrestrial vegetation group to three in both the invertebrate and human-use groups. In fact, the terrestrial vegetation group proved to be too large and, thus, was split into two groups after the lunch break in order to facilitate the scoring process. Although the terrestrial vertebrate group was also quite large, the group members had fewer candidate vital signs to score than the vegetation group. In addition, the vertebrate group found it helpful to designate threshold values from the beginning of the process in order to answer the criteria as efficiently as possible. The complete list of breakout group members can be found in Appendix E. Each group was assigned a group moderator—usually the author of the conceptual model(s) that best applied to that breakout group. In addition, two professional facilitators were on hand throughout the three-day conference to answer questions about the consensus process and to guide groups whose assignments proved difficult. The groups were to use the following process to complete the selection criteria worksheets (please see Appendix F for a complete list of proposed candidate vital signs and Appendix B as a reference for the selection criteria worksheets):
• Decide on the appropriate name for the proposed candidate vital sign. The group could choose to:
o keep the current candidate vital sign name o change the candidate vital sign name to be more informative o lump the candidate vital sign with another vital sign o split the candidate vital sign into multiple (two or more) new vital signs
• Choose the parks in which the candidate vital sign occurs or applies • Answer each selection criteria by filling in the “yes” or “no” bubble on the worksheet • Add comments that refer to one of the following:
o the specific selection criteria statements o the broad topic group of selection criteria (i.e. “management relevance”) o the vital sign as a whole
12 • Appendix V: Vital Signs Monitoring Workshop Report
To aid the groups in using the selection criteria, the workshop planning team composed a short, descriptive phrase to better explain each of the statements. These explanations, along with the vital signs information, the schematic conceptual models, the narrative conceptual models and some appendices offering information specific to the selection criteria were included in breakout group notebooks. One notebook was given to each group. The vital signs information contained in this notebook was extremely lengthy and, therefore, is not included in full in this report. An example follows and the entire report is available upon request: Channel dimensions Unique ID: AqHa_123 Primary Resource: Aquatic Habitats Secondary: Rivers and Streams
Why is this an important Vital Sign? Riparian vegetation not only responds to changing channel geomorphology but plays a role in its formation. Any change in channel geomorphology will consequently alter the amount and distribution of the riparian community. Thus, channel geomorphological metrics may be a useful indicator of the condition of riverine and riparian systems. Altered hydrological conditions and concomitant degraded riparian systems play a role in channel changes. For example, changing regional hydrology or influences of upstream flow regulators, e.g., dams, will cause channels to adjust to new conditions and offer less or more habitat for riparian plant communities. The ratio of channel width to depth and channel sinuosity in relation to floodplain type can be combined to develop a channel index that would indicate whether the channel is being altered from expected geomorphic conditions. Decreasing width/depth ratios tend to indicate a degraded, incised channel; however, a greatly increasing width/depth ratio may result from excessive bank destabilization by ungulate use. Metrics: Variability and changes in channel cross section geometry and river length to floodplain length relationships. The expanded explanations of the selection criteria and the appendices can be found in Appendix G of this report. In order to decide on an appropriate name for the proposed candidate vital sign, the group generally went through much discussion. Many of the original candidate vital sign names did not seem as informative as possible to group members. This process occurred simultaneously with the lumping and splitting of vital signs. Obviously, the freedom to create new vital signs from those given was important for participants. This liberty also allowed the participants to feel more comfortable with the candidate vital sign name than if they had been limited to using those provided through the Delphi survey and conceptual models. However, one overall problem with the candidate vital sign names occurred when participants noted that some candidate vital signs were very specific (i.e. specific taxa), while others were broad (i.e. group of taxa, such as small-bodied mammals). Many times a potential vital sign would be a better indicator if its name were more descriptive (i.e. specific butterfly species instead of overall insect biodiversity). As was seen in earlier park-specific workshops, vital signs about which people know little or are perplexed tend to rank in the middle, whereas those vital signs about which people know a lot (possibly because they are more specific) tend to rank either very high or very low, depending on the circumstance. The next step in the worksheet process was to choose in which parks the candidate vital sign occurs or applies. Many times the candidate vital sign applied to all three parks. However,

Vital Signs Monitoring Plan • 13
occasionally the candidate vital sign would not apply in one or two parks. This occurred more often with Bighorn Canyon in the area of geothermal features and terrestrial vegetation. However, often Bighorn Canyon had candidate vital signs in which it was the only park that a species or community occurs or specific measurement applies. This outcome was expected by the workshop planning team. The workshop planning team put much thought into the structure of the selection criteria and the possible ways of quantifying a response that is, in actuality, qualitative by nature. Originally designed as a coarse and fine filter criteria wherein participants would choose how many statements they agreed with (thus giving a specific “score” such as low, medium or high that corresponded with a number), the selection criteria evolved to become a set of thirteen “yes/no” questions based upon extensive literature review and National I&M Program guidance as to what makes a “good” ecological indicator. These thirteen questions were placed into five broader categories, including ecological relevance, response variability, management relevance, feasibility of implementation and interpretation and utility. By making the answers to these questions binary in nature, the workshop planning team believed that they would provide a way in which participants could complete the task on time and eliminate debates about semantics. As the “yes/no” answers were entered into the Access database, the database was programmed to convert and calculate the scores as follows:
• For those broad topic areas that contained only two questions (i.e. ecological relevance):
o two “yes” answers=1.0 score o one “yes” answer and one “no” answer=0.5 score o two “no” answers=0 score
• For those broad topic areas that contained three questions (i.e. response variability): o three “yes” answers=1.0 score o two “yes” answers and one “no” answer=0.6 score o one “yes” answer and two “no” answers=0.3 score o three “no” answers=0 score
In addition to this scoring method, the workshop planning team decided on a weighting scheme for the broad topic areas. The scheme was decided upon after input from the park-specific workshops on which broad topic areas participants felt were most important in creating a useful indicator of ecosystem health. These weights were then multiplied by the broad topic area scores (explained above) to create the final score. The weights chosen were as follows:
• Ecological relevance=25% • Response variability=25% • Management relevance=20% • Feasibility of implementation=15% • Interpretation and utility=15%
Another aspect of the decision of which candidate vital signs to monitor includes the responsibility of National Parks to monitor those resources whose protection is required by law. Therefore, information on the legal relevance is included in the Access database in the form of which piece of legislation requires the protection of specific resources. After much debate

14 • Appendix V: Vital Signs Monitoring Workshop Report
throughout the park-specific workshops, the workshop planning team decided to omit this criteria as a decision to be made by the expert participants who attended the workshop. Although the workshop planning team made every effort to insure that sufficient explanations of the selection criteria and background information were provided to the participants, the process of ranking the candidate vital signs still produced questions and concerns. Because many comments were shared between group members and not formally recorded, what follows is a rough summary of major topic areas of discussion.
Overall comments about the process and/or selection criteria • Many individuals felt that there was a need to separate the drivers and stressors from the
response variables in order to fairly evaluate them as candidate vital signs. Also, there was much discussion about incorporating both types of candidate vital signs to create a comprehensive monitoring plan.
• One conceptual model author noted that, while lumping and splitting certainly was helpful in some circumstances, occasionally, when a vital sign was split, it lost its relevance with respect to why it was originally nominated. For example, when “riparian associated animal species” is split into specific taxa vital signs, the importance of the community structure that made it a good indicator of riparian ecosystem health is lost.
• One participant felt that narratives accompanying the conceptual models would have proven helpful. Although the narratives contributed by the conceptual model authors were provided in the notebooks, along with the vital signs justification statements, the workshop planning team did not set aside specific time to review them or notify the participants of their existence. Sending these materials ahead of time would have allowed participants to review their contents and come with any prepared questions.
• Many participants felt it would have been helpful to do a “trial run” of a few vital signs in order to alert them of potential difficulties with the selection criteria. This did occur, to some extent, at the park-specific workshops, wherein participants were given the opportunity to progress step-wise through the selection criteria, alerting the workshop planning team of potential difficulties. These suggestions were then incorporated into the final selection criteria presented to the Vital Signs Monitoring Workshop participants.
• One participant observed that a particular candidate vital sign could be both affected by some driver or stressor and also be a driver or stressor for another vital sign.
• A moderator noted that the overall response to the list of proposed candidate vital signs was very positive.
Specific comments about the process and/or selection criteria • The terrestrial vertebrates group mentioned that vertebrate and invertebrate monitoring
should be stratified by habitat. In addition, this group added that the candidate vital sign “native species richness” caused more discussion and differences of opinion than any other candidate vital sign and, therefore, they feel it should be re-evaluated.
Vital Signs Monitoring Plan • 15
• One individual felt that the sagebrush community that constitutes an important part of Grand Teton National Park was overlooked.
Concerns with the interpretation of the selection criteria • Many groups created a “threshold level” for agreement with a specific selection criterion. In
some cases, this threshold level was inconsistent among candidate vital signs. • Many of the groups felt that particular criteria were not specific enough in their original
wording to be assigned a “yes” or “no” answer definitively. Therefore, groups had to go through a decision process in order to define what “yes” or “no” meant in these cases. Hopefully, in addition, the groups also recorded this reasoning in the comment section of the worksheet.
• Although the workshop planning team made a best effort to include park managers in each of the breakout groups, many groups still did not feel comfortable answering the management relevance criteria without further assistance. Many groups felt that someone with complete knowledge of the business plan standards, enabling legislation, GPRA goals, etc. should go through their answers and check them against these management standards.
• There was much disagreement about how long a “long-term dataset” had to be. Groups obviously defined “long-term” differently depending upon what types of data they were evaluating.
• Although participants were asked not to take into account whether or not another agency is currently monitoring a specific proposed candidate vital sign, one group chose to rank highly those candidate vital signs that are already being monitored. This group also had the task of evaluating many stressors to the environment; thus, changing the application of the selection criteria. The effects of this ranking method are not yet fully understood, but will certainly be taken into account by those making the final decisions about which vital signs should be monitored. This also brings up the fact that this ranking is not the sole determinant of which vital signs will be monitored by the GRYN. Many other factors will be evaluated.
• Some groups also mentioned that whether or not a candidate vital sign was “cost prohibitive” was not specific and, therefore, required the use of intuition in the ranking process.
• The air quality/climate group moderator noted that it is virtually impossible to distinguish between natural variation and human-induced variation, which was one of the selection criteria.
• The natural versus human-induced criterion also raised questions because of the circular relationship between human and natural drivers.
Concerns with the wording of the selection criteria • The aquatics group moderator felt that the criterion concerning the candidate vital sign’s
helpfulness in identifying the causal mechanism of an ecological response was difficult to interpret. In addition, he noted that the criterion concerning low statistical power and variability was complicated because these two things were not thought to be the same and that it overlapped with the question concerning natural versus human-induced variation.

16 • Appendix V: Vital Signs Monitoring Workshop Report
• There was some confusion as to the meaning of scales with respect to ecological organization. One participant felt that the use of levels would have been more clear.
• Adjectives used in the selection criteria to qualify statements (such as “helpful”) were often difficult for participants to interpret.
• Some groups had difficulty with the definition of “high” and “low” with respect to natural variability and, therefore, this definition was generally used inconsistently within and among breakout groups.
Comments recorded by breakout groups regarding the selection criteria The breakout groups were asked to record any comments that qualified their answer to a specific statement and/or a set of statements, such as “management relevance”. These comments usually concerned why a certain park was not included in the applicable parks section or why the candidate vital sign was difficult to evaluate, given the selection criteria. Because many comments were recorded, resulting in a multiple-page report, a complete list of these comments is contained in Appendix H instead of in the body of this report.
Vital Signs Monitoring Plan • 17
VITAL SIGNS MONITORING WORKSHOP-DAY 3 Objectives The objectives of the third day of the Vital Signs Monitoring Workshop were as follows: • To present the results of the breakout groups’ decisions on ranked list of vital signs • To discuss options for organizing, into logical groups, vital signs whose data are generally
collected simultaneously or, when combined, are more useful for interpreting results. • Using a full suite of vital signs, to build a conceptual framework that integrates the diversity
of spatial and temporal scales across the GRYN Presentations, Breakout Group Exercises and Comments Each participant was given a copy of the entire ranked list of candidate vital signs by score. Although many different kinds of reports could be produced and were discussed by the workshop planning team beforehand, an executive decision was made to distribute the ranked list by overall score. Many participants immediately voiced frustration with those candidate vital signs that ranked high and wanted to see the ranked list by resource area. This outcome was somewhat expected by the workshop planning team. A report listing the candidate vital signs by park and then by resource area was quickly produced and distributed. The distribution of this list was followed by a short presentation and comment section before participants were asked to participate in a breakout group exercise.
Presentation of the ranked list of vital signs Cathie Jean, GRYN Program Manager Cathie Jean congratulated the group on a job well done and commented on how nice it would have been to have one person contribute that one indicator that could tell us everything. Jean mentioned that the group did an excellent job of “cleaning up” the original list of proposed candidate vital signs by subsuming ninety candidate vital signs and adding twenty-one. Jean pointed out that nineteen vital signs received a “perfect” score, meaning that they met all of the selection criteria. She also pointed out that some groups interpreted the selection criteria differently and that this would be taken into consideration when choosing the final vital signs list. She reminded the participants that this ranked list was not the final list of vital signs to be monitored by the GRYN, but rather a tool to use in choosing the final vital signs. A complete ranked list of the candidate vital signs can be found in Appendix I of this report.
Comments Many participants felt the need to share comments about the ranked list with the group as a whole. These comments were valuable in understanding the limitations of this exercise. The comments are summarized below:
18 • Appendix V: Vital Signs Monitoring Workshop Report
• Participants felt that the candidate vital signs needed to be ranked relative to the other
candidate vital signs in their resource areas. Participants were concerned that the GRYN would choose to monitor only those highly ranked vital signs without consideration of choosing a broad suite from many different resource areas.
• Participants felt it may be useful to have time to reconsider the candidate vital signs from their breakout group, as some believed that the scoring changed throughout the day and, thus, affected the overall result. Many groups who were rushed to finish by 5pm believed that those candidate vital signs scored later in the day could possibly have received better scores than they normally would have and believed that time for recalibration could have helped.
• Participants once again recognized the unevenness in specificity of the candidate vital signs. According to many experts, this caused an unevenness in scoring as well.
• Some participants included comments of papers that could be important and helpful in choosing vital signs. These included papers by Tom Hoeskstra of the Inventory and Monitoring Institute and the EPA’s EMAP website.
• Concerns arose about the difference between vital signs that are drivers and those that are response variables.
• A comment was made that the vertebrate group did not look at specific habitat types, while the vegetation group did. This comment also follows that statement given by the vertebrate group on day two that vertebrate monitoring should be stratified by habitat.
• A participant brought up the fact that many of the highly ranked vital signs overlap, while also impacting other candidate vital signs.
• Someone also mentioned that there are many long-term datasets available, and a monitoring program should focus on what data can be used from these long-term datasets, even though they were not originally created to monitor the chosen candidate vital signs.
• Integration was a key component of many comments. Most participants felt that in order to have a comprehensive program, the GRYN must concentrate on integration both with other agencies as well as integrating the chosen vital signs into a coherent whole, including knowledge of the basic drivers of the systems.
Breakout group exercise Options for organizing highly ranked vital signs into a coherent monitoring program In order to bring some closure to the meeting, the workshop planning team devised a short exercise focusing on the creation of a conceptual framework that explains the spatial and temporal scales on which the candidate vital signs operate. To do this, the participants were asked to form into the same breakout groups that they had used during day two and were given overheads with a blank template of spatial and temporal scales. Participants were given the opportunity to draw the spatial and temporal scale of the candidate vital signs that they had ranked highly during day two on the overhead and to watch for aggregations of candidate vital signs along these given scales. Reproductions of the results of this exercise are contained in Appendix J of this report. Overall comments about the exercise follow.

Vital Signs Monitoring Plan • 19
Comments • While some candidate vital signs may be sampled at a small scale, the effects of the results of
this sampling can be amplified; thus, the candidate vital sign will have a wider applicability. • The geology/geothermal group had to rescale the axes, as they were given a template made
for ecological processes. • The aquatics group also rescaled the axes to make the template more useful. A question was
posed to the aquatics group about whether or not yearly changes in algal production is a reasonable way to assess nitrogen inputs. The answer given was that changes in diatom populations can be detected in time scales even shorter than one year.
• The air quality/climate group qualified the answers given by commenting that they focused on the measurement period and that the effects would be seen throughout the range of spatial and temporal scales given.
• One comment was made that the U.S. Forest Service starts monitoring with aerial detection and then “fills in” with groundwork.
• A participant commented that some vital signs will be good at detecting small-scale changes rather quickly, while others will be better at detecting changes across multiple scales. A mixture of these types of vital signs could produce the desired result of a comprehensive monitoring program.
• Someone also commented on the difficulty in integrating human-caused change with the vast array of natural variation one finds within ecosystems. The question was posed as to whether the monitoring program should be looking at human impacts or having the ecosystems unimpaired for future generations. In order to accomplish this, goals and objectives need to be set; then, the monitoring objectives that the GRYN establishes can define a meaningful level of change and how best to detect such a change.

20 • Appendix V: Vital Signs Monitoring Workshop Report
CONCLUSIONS In conclusion, the Vital Signs Monitoring Workshop hosted by the GRYN was a success. Although participants had concerns with the wording and interpretation of the selection criteria, as well as the ranked list of candidate vital signs, the workshop planning team agreed that creating a framework that allowed a large group of experts to come together and offer knowledge and insight into the proposed list of vital signs was extremely useful and productive. The participants successfully applied an objective set of criteria to a long list of proposed candidate vital signs. The criteria used were a balance of complex ideas and a simplified ranking system. Because of among-group variations in interpretation of the criteria, the results are best reviewed within groups. In order to aid future Networks with their vital signs scoping workshops, the GRYN has developed a short list of lessons learned from the Vital Signs Monitoring Workshop: • Doing a “trial run” of the selection criteria and a proposed candidate vital sign will help
everyone involved to understand the depth of knowledge and consideration that is needed to answer the given questions
• Sending out information that will be used during the workshop would be helpful to those who have time for preparatory work
• Spending time deciding on the level of specificity for the candidate vital signs names and tailoring the names to this level before the workshop could eliminate some of the confusion seen at the GRYN workshop
• Making sure that participants are given a chance to review the schematic and narrative conceptual models beforehand would allow for a greater understanding of the process as well as give participants a chance to express concerns with the results of these processes with the model authors
• The first and second weeks of May are generally poor times to invite academic and agency scientists to travel for a meeting
• Given more time, many of these concerns would probably have been addressed by the GRYN.
Despite the set-backs, the GRYN now has a defensible list of candidate vital signs based on sound scientific advise from experts in many different fields from which it can take on the task of creating a comprehensive and integrative monitoring program. By all accounts, the participants who took part in this process, although frustrated at times, were always forthcoming with helpful comments about the process and the specific candidate vital signs, as well as having a high level of respect and praise for their colleagues in this exercise. The outcome of this meeting will be of particular interest to those Networks that are just beginning this process. The workshop planning team and the staff of the GRYN expresses a wealth of gratitude toward all who participated and hopes that everyone will stay tuned for our next steps!

Vital Signs Monitoring Plan • 21
ACKNOWLEDGEMENTS The Greater Yellowstone Inventory and Monitoring Network wishes to extend a sincere thank you to those who made this workshop possible. The USGS-Northern Rocky Mountain Science Center is the campus host for the GRYN and, therefore, serves a central role in the GRYN’s ability to use campus resources. A partnership through the Big Sky Institute at Montana State University allowed us to provide refreshments for guests through MSU Catering. We would like to thank the MSU Foundation for allowing us the use of their Great Room for our evening social. We would like to express our gratitude for the facilitation services provided by Michele Tae (throughout the workshop series) and Nancy Budge (for this workshop). Peggy Herzog was the scribe for the workshop series. A big thanks goes out to Chad Jacobson, Cartographic Technician for the GRYN, who became the interim data manager for the duration of the conference. Finally, many thanks to the GRYN’s student employee, Sarah Stehn, who was extremely helpful in the days before the workshop, as well as aiding Chad with the data entry during the evening on day two of the workshop.

22 • Appendix V: Vital Signs Monitoring Workshop Report
APPENDICES-TABLE OF CONTENTS
APPENDIX A-WORKSHOP AGENDA .................................................................................. 23
APPENDIX B-SELECTION CRITERIA WORKSHEET ..................................................... 26
APPENDIX C-WORKSHOP PARTICIPANT LIST.............................................................. 27
APPENDIX D-SCHEMATIC ECOSYSTEM CONCEPTUAL MODELS........................... 35
APPENDIX E-BREAKOUT GROUP MEMBERS................................................................. 59
APPENDIX F-COMPLETE LIST OF PROPOSED CANDIDATE VITAL SIGNS........... 61
APPENDIX G-SELECTION CRITERIA EXPLANATIONS AND APPENDICES ........... 67
APPENDIX H-CANDIDATE VITAL SIGNS SCORING COMMENTS............................. 80
APPENDIX I-RANKED LIST OF CANDIDATE VITAL SIGNS BY RESOURCE AREA..................................................................................................................................................... 100
APPENDIX J-SPATIO-TEMPORAL MODELS.................................................................. 105

Vital Signs Monitoring Plan • 23
APPENDIX A-WORKSHOP AGENDA
Greater Yellowstone Network Vital Signs Monitoring Workshop Agenda
May 6-8, 2003 Ballroom C, Strand Union Building
Montana State University
Overall Workshop Objective:
To apply priority setting to a list of vital signs to be monitored as a means for determining the long-term ecosystem health of the parks of the Greater Yellowstone Network
May 6
Day 1 Objectives:
1. To create a shared understanding of the NPS I&M Program and the Greater Yellowstone Network
2. To inform participants of the process used to identify candidate vital signs 3. To create an informal, open-forum discussion of the posted conceptual models as part of
an evening social hour 12:30 Participants Arrive, Joseph May Ballroom C, Strand Union Building Sign-in/registration
1:00 Welcome, Opening Comments Tom Olliff, Chief of Resources, Yellowstone National Park 1:10 Statement of Meeting Goals and Agenda Review Cathie Jean, Program Manager, Greater Yellowstone Network 1:25 Introduction to the National Park Service Inventory & Monitoring Program Steve Fancy, National I&M Program Coordinator Greater Yellowstone Network Vital Signs Monitoring Plan Cathie Jean, Program Manager, Greater Yellowstone I&M Network 2:00 Variability in Natural Systems and Monitoring Considerations Duncan Patten, Research Professor, Montana State University 2:30 Break 2:45 The Role of Conceptual Models in Choosing Vital Signs

24 • Appendix V: Vital Signs Monitoring Workshop Report
Overview of Conceptual Models, Glenn Plumb, Supervisory Wildlife Biologist, Yellowstone National Park
Riparian and Wetland Ecosystem Model, Duncan Patten, Research Professor, Montana State University
Terrestrial Ecosystem Model, Dan Tinker, Assistant Professor, University of Wyoming
Aquatic Ecosystem Model, Bob Hall, Assistant Professor, University of Wyoming
3:45 Workshop Objectives and Instructions Michele Tae, facilitator
Breakout group objectives Explanation of Selection Criteria Roles of Moderators, Facilitators and Participants Participant Assignments and Meeting Locations
5:00 Adjourn 6:30 **Social Hour**, MSU Alumni Foundation, 1501 S. 11th Ave.
**Participants are encouraged to critique the conceptual models and discuss candidate vital signs with the authors of the conceptual models.
May 7
Day 2 Objectives:
1. To apply the selection criteria from the decision support system to each candidate vital
sign in the topic area and provide results to the decision support system manager by 5:00 pm
2. To document comments related to the scoring decisions that will be incorporated into a report for the Technical Committee and Science Committee
8:00 Groups Convene *Please use the attached map of the Strand Union Building and breakout group
room assignments to find your breakout room for the day. 12:00 Luncheon, Joseph May Ballroom C, Strand Union Building 5:00 Adjourn

Vital Signs Monitoring Plan • 25
May 8
Day 3 Objectives:
1. To present the results of the breakout groups’ decisions on ranked list of vital signs 2. To discuss options for organizing, into logical groups, vital signs whose data are
generally collected simultaneously or, when combined, are more useful for interpreting results.
3. Using a full suite of vital signs, to build a conceptual framework that integrates the diversity of spatial and temporal scales across the network.
8:00 Groups Convene, Joseph May Ballroom C, Strand Union Building Welcome and Comments Michele Tae, facilitator 8:15 Presentation of the Ranked List of Vital Signs Cathie Jean, Program Manager 8:30 Part 1 Integration Exercise: Options for Organizing Highly Ranked Vital
Signs into Logical Groups Michele Tae, facilitator Glenn Plumb, Supervisory Wildlife Biologist, Yellowstone National Park 9:45 Break ** For those participants whose flights depart around noon or 1pm, a shuttle will
be leaving from the Strand Union Building to take you to the airport following break.
10:00 Part 2 Integration Exercise: Building a Conceptual Framework that
Integrates a Full Suite of Vital Signs 11:15 Results of Conceptual Framework Exercise: Michele Tae, facilitator Glenn Plumb, Supervisory Wildlife Biologist, Yellowstone National Park 11:45 Wrap-up and adjournment ** For those participants with flights later in the afternoon, a shuttle will be leaving from the Strand Union Building to take you to the airport at noon.

26 • Appendix V: Vital Signs Monitoring Workshop Report
APPENDIX B-SELECTION CRITERIA WORKSHEET VITAL SIGN: PRIMARY RESOURCE: Secondary Resource:
VITAL SIGN CRITERIA Yes
Ecological Relevance
• The candidate vital sign has high ecological importance with a demonstrated linkage between the vital sign and the ecological structure or function that it is supposed to represent, based on a conceptual model and/or supporting ecological literature
• The candidate vital sign provides relevant information
that is applicable to multiple scales of ecological organization
Response Variability
• The candidate vital sign responds to ecosystem stressors in a predictable manner with known statistical power
• The candidate vital sign is anticipatory and is sensitive
enough to stressors to provide an early warning of change • The candidate vital sign has low natural variability and
has high signal-to-noise ratio (e.g. low error)
Management Relevance The candidate vital sign is stated in specific park management
goals, GPRA goals, or Business Plan standards. There is a demonstrated, direct application of candidate vital
sign measurement data to current key management decisions or for evaluating past management decisions
Feasibility of Implementation
• The candidate vital sign’s cost of measurement is not prohibitive
• Impacts of measuring the candidate vital sign meet NPS
standards • The candidate vital sign is relatively easy to measure and
has measurable results that are repeatable with different personnel
Interpretation and Utility
• The response of the candidate vital sign can be distinguished between natural variation and anthropogenic impact-induced variation
• The candidate vital sign is helpful in identifying the
causal mechanism of an ecological response • Historic databases and baseline conditions for the
candidate vital sign are already known
Parks that this Vital Sign applies to:
YELL GRTE BICA
No Comments

Vital Signs Monitoring Plan • 27
APPENDIX C-WORKSHOP PARTICIPANT LIST Jeff Arnold Yellowstone National Park 307-344-2285 P.O. Box 168 [email protected] Yellowstone National Park, WY 82190 Myron Brooks USGS-Water Resources Division 307-778-2931 2617 E. Lincoln Way, Suite B [email protected] Cheyenne, WY 82001 Nancy Budge Facilitator 208-424-8814 5110 S. Surprise Way, Unit 202 [email protected] Boise, ID 83716 Dan Burgette Grand Teton National Park 307-739-3334 P.O. Drawer 170 [email protected] Moose, WY 83012 Stephen Corn USGS-Northern Rocky Mountain Science Center 406-542-4191 Missoula Field Station [email protected] Aldo Leopold Wilderness Research Institute 790 E. Beckwith P.O. Box 8089 Missoula, MT 59807 Bob Crabtree Yellowstone Ecological Research Center 406-582-0447 P.O. Box 6640 [email protected] Bozeman, MT 59771 Scott Creel Montana State University 406-994-7033 Ecology Department [email protected] Bozeman, MT 59715 Elizabeth Crowe Montana Natural Heritage Program [email protected]
28 • Appendix V: Vital Signs Monitoring Workshop Report
Diane Debinski Iowa State University 515-294-2460 Natural Resources Ecology and Management Department [email protected] 124 Science II Ames, IA 50011 Don Despain USGS-Northern Rocky Mountain Science Center 406-994-7257 P.O. Box 173492 [email protected] Bozeman, MT 59717 Steve Fancy NPS-National I&M Coordinator 970-225-3571 1201 Oak Ridge Drive, Suite 200 [email protected] Fort Collins, CO 80525 Phil Farnes Snowcap Hydrology 406-994-3002 Box 691 [email protected] Bozeman, MT 54771 Laura Gianakos GRYN/Bighorn Canyon NRA 307-548-2251 20 Highway 14A East [email protected] Lovell, WY 82431 Peter Gogan USGS-Northern Rocky Mountain Science Center 406-994-6989 P.O. Box 173492 [email protected] Bozeman, MT 59717 Lisa Graumlich Montana State University-Big Sky Institute 406-994-5320 P.O. Box 173490 [email protected] Bozeman, MT 59717 Bob Hall University of Wyoming 307-766-2877 Department of Zoology and Physiology [email protected] Biosciences Building 408 Laramie, WY 82071
Vital Signs Monitoring Plan • 29
Steve Haynes Grand Teton National Park 307-739-3486 P.O. Drawer 170 [email protected] Moose, WY 83012 Henry Heasler Yellowstone National Park 307-344-2441 P.O. Box 168 [email protected] Yellowstone National Park, WY 82190 Mary Hektner Yellowstone National Park 307-344-2151 P.O. Box 168 [email protected] Yellowstone National Park, WY 82190 Peggy Herzog Commonthread Incorporated 208-383-9616 1802 Ridgecrest Drive [email protected] Boise, ID 83712 Bill Inskeep Montana State University-Thermal Biology Institute 406-994-5077 P.O. Box 173142 [email protected] Bozeman, MT 59717 Michael Ivie Montana State University 406-994-4610 Department of Entomology [email protected] P.O. Box 173020 Bozeman, MT 59717 Richard Jachowski USGS-Northern Rocky Mountain Science Center 406-994-5304 P.O. Box 173492 [email protected] Bozeman, MT 59717 Chad Jacobson GRYN 406-994-4124 Forestry Sciences Lab [email protected] 1648 S. 7th Ave. Bozeman, MT 59717

30 • Appendix V: Vital Signs Monitoring Workshop Report
Cathie Jean GRYN 406-994-7530 Forestry Sciences Lab [email protected] 1648 S. 7th Ave. Bozeman, MT 59717 Doug Keniath Wyoming Natural Diversity Database 307-766-3013 P.O. Box 3381 [email protected] University of Wyoming Laramie, WY 82071 Todd Koel Yellowstone National Park 307-344-2281 P.O. Box 168 [email protected] Yellowstone National Park, WY 82190 Tina Laidlaw EPA 406-457-5016 Federal Building [email protected] 10 W. 15th St., Suite 3200 Helena, MT 59626 Mary Maj Greater Yellowstone Coordinating Committee 406-522-8575 P.O. Box 130 [email protected] Bozeman, MT 59771 Mary Manning U.S. Forest Service 406-329-3304 200 E. Broadway [email protected] P.O. Box 7669 Missoula, MT 59807 Alisa Mast USGS-Water Resources Division 303-236-4882 (ext. 314) Denver Federal Center [email protected] P.O. Box 25046 Denver, CO 80225
Vital Signs Monitoring Plan • 31
Bruce Maxwell Montana State University 406-994-5717 Land Resources and Environmental Sciences [email protected] P.O. Box 173120 Bozeman, MT 59717 Brian McGlynn Montana State University 406-994-7690 Land Resources and Environmental Sciences [email protected] Watershed Hydrology Laboratory P.O. Box 173120 Bozeman, MT 59717 Leora Nanus USGS-Water Resources Division 303-236-4882 (ext. 250) Denver Federal Center [email protected] P.O. Box 25046 Denver, CO 80225 D. Kirk Nordstrom USGS 303-541-3037 3215 Marine St. [email protected] Boulder, CO 80303 Tom Olliff Yellowstone National Park 307-344-2513 P.O. Box 168 [email protected] Yellowstone National Park, WY 82190 Sue O’Ney GRYN/Grand Teton National Park 307-739-3666 P.O. Drawer 170 Susan_O’[email protected] Moose, WY 83012 Susan Patla Wyoming Game and Fish 307-739-8560 (ext. 229) P.O. Box 67 [email protected] Jackson, WY 83001 Duncan Patten Montana State University-Big Sky Institute 406-582-0594 P.O. Box 173490 [email protected] Bozeman, MT 59717 Chuck Peterson
32 • Appendix V: Vital Signs Monitoring Workshop Report
Idaho State University 208-282-3922 Biological Sciences [email protected] Campus Box 8007 Pocatello, ID 83209 Ken Pierce USGS-Northern Rocky Mountain Science Center 406-994-5085 P.O. Box 173492 [email protected] Bozeman, MT 59717 Glenn Plumb Yellowstone National Park 307-344-2225 P.O. Box 168 [email protected] Yellowstone National Park, WY 82190 Ellen Porter NPS-Air Resources Division 303-969-2617 P.O. Box 25287 [email protected] Denver, CO 80225 Roy Renkin Yellowstone National Park 307-344-2161 P.O. Box 168 [email protected] Yellowstone National Park, WY 82190 Lisa Rew Montana State University 406-994-7966 Land Resources and Environmental Sciences [email protected] P.O. Box 173120 Bozeman, MT 59717 Ann Rodman Yellowstone National Park 307-344-2216 P. O. Box 168 [email protected] Yellowstone National Park, WY 82190 Anne Schrag GRYN 406-556-7162 Forestry Sciences Lab [email protected] 1648 S. 7th Ave. Bozeman, MT 59717
Vital Signs Monitoring Plan • 33
Michele Tae commonthread incorporated 208-383-9616 1802 Ridgecrest Drive [email protected] Boise, ID 83712 Dan Tinker University of Wyoming 307-766-4967 Department of Botany [email protected] Aven Nelson Building 202 Laramie, WY 82071 Kathy Tonnessen Rocky Mountains-Cooperative Ecosystems Studies Unit 406-243-4449 School of Forestry [email protected] University of Montana Missoula, MT 59812 John Varley Yellowstone National Park 307-344-2203 P.O. Box 168 [email protected] Yellowstone National Park, WY 82190 Jennifer Whipple Yellowstone National Park 307-344-2226 P.O. Box 168 [email protected] Yellowstone National Park, WY 82190 Cathy Whitlock University of Oregon 541-346-4566 Department of Geography [email protected] Eugene, OR 97403 Susan Wolff Grand Teton National Park 307-739-3464 P.O. Drawer 170 [email protected] Moose, WY 83012 Scott Woods University of Montana 406-243-5257 School of Forestry [email protected] Missoula, MT 59812

34 • Appendix V: Vital Signs Monitoring Workshop Report
Alexander Zale Montana State University 406-994-2380 Montana Cooperative Fisheries Research Unit [email protected] P.O. Box 173460 Bozeman, MT 59717
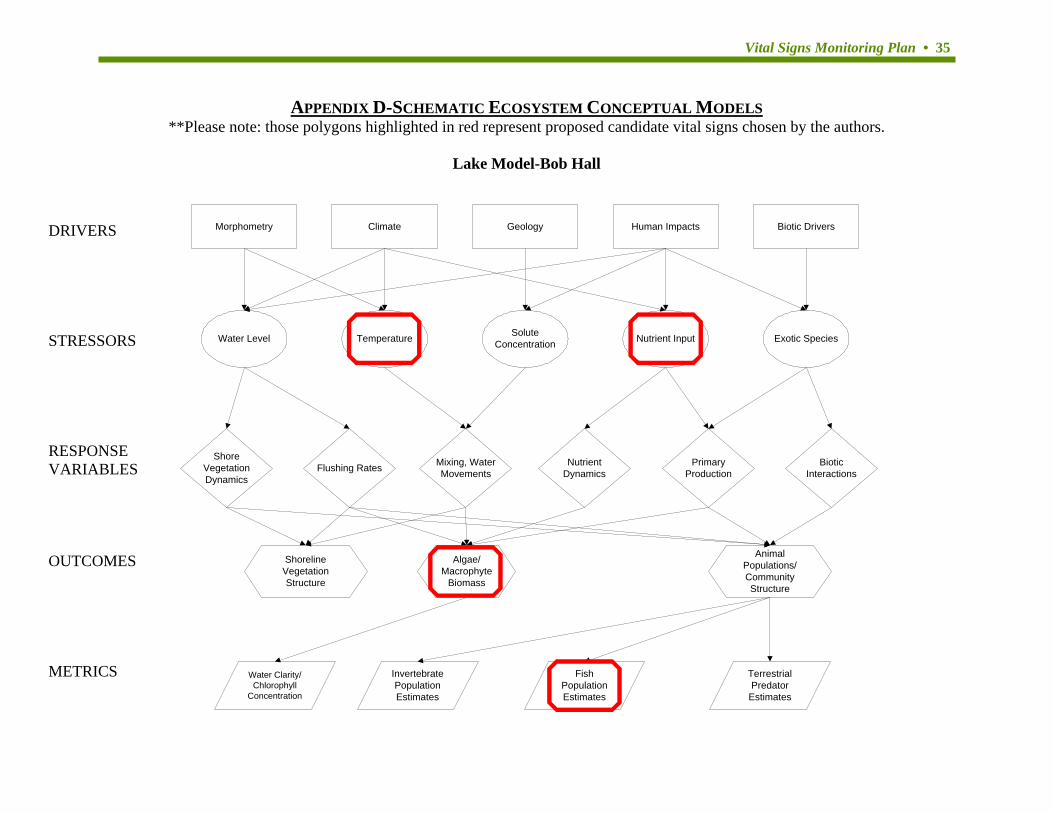
Vital Signs Monitoring Plan • 35
APPENDIX D-SCHEMATIC ECOSYSTEM CONCEPTUAL MODELS **Please note: those polygons highlighted in red represent proposed candidate vital signs chosen by the authors.
Lake Model-Bob Hall
DRIVERS STRESSORS RESPONSE VARIABLES OUTCOMES METRICS
Morphometry Biotic DriversHuman ImpactsGeologyClimate
Water Level Exotic SpeciesNutrient InputSoluteConcentrationTemperature
ShoreVegetationDynamics
NutrientDynamics
PrimaryProduction
BioticInteractions
Mixing, WaterMovementsFlushing Rates
ShorelineVegetationStructure
AnimalPopulations/CommunityStructure
Algae/Macrophyte
Biomass
Water Clarity/Chlorophyll
Concentration
TerrestrialPredator
Estimates
FishPopulationEstimates
InvertebratePopulationEstimates
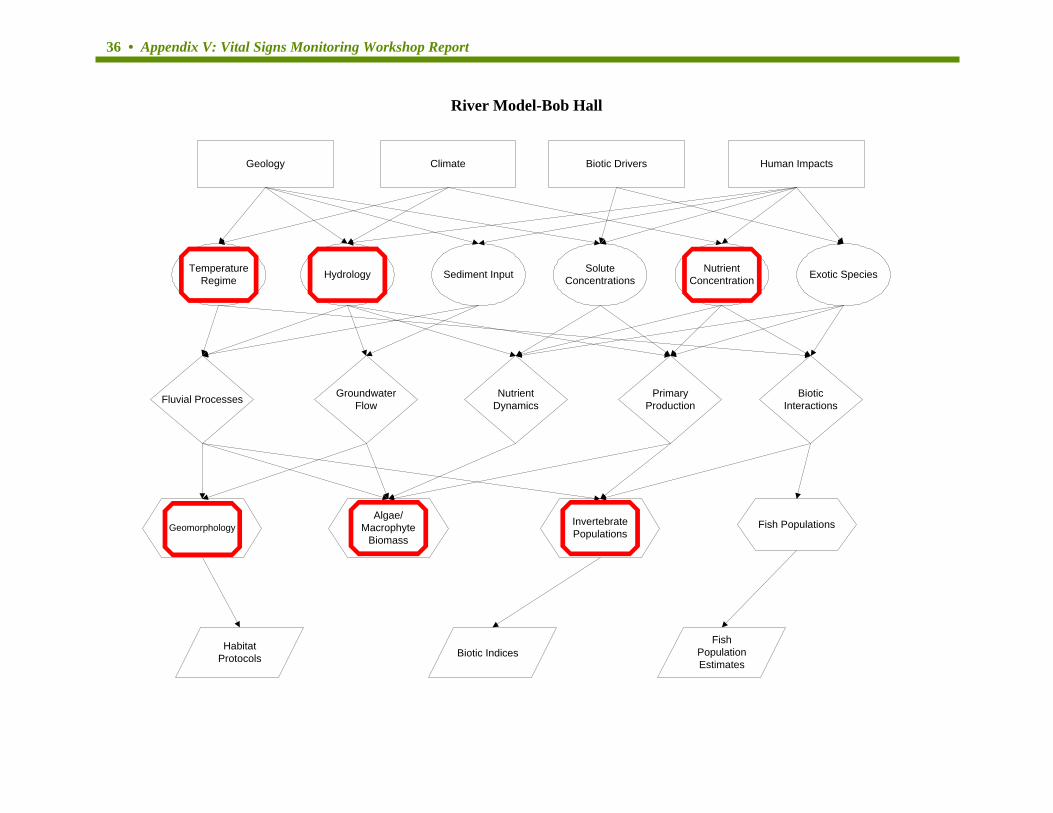
36 • Appendix V: Vital Signs Monitoring Workshop Report
River Model-Bob Hall
Geology Human ImpactsBiotic DriversClimate
TemperatureRegime Exotic SpeciesNutrient
ConcentrationSolute
ConcentrationsSediment InputHydrology
Fluvial Processes NutrientDynamics
PrimaryProduction
BioticInteractions
GroundwaterFlow
Geomorphology Fish PopulationsInvertebratePopulations
Algae/Macrophyte
Biomass
HabitatProtocols
FishPopulationEstimates
Biotic Indices
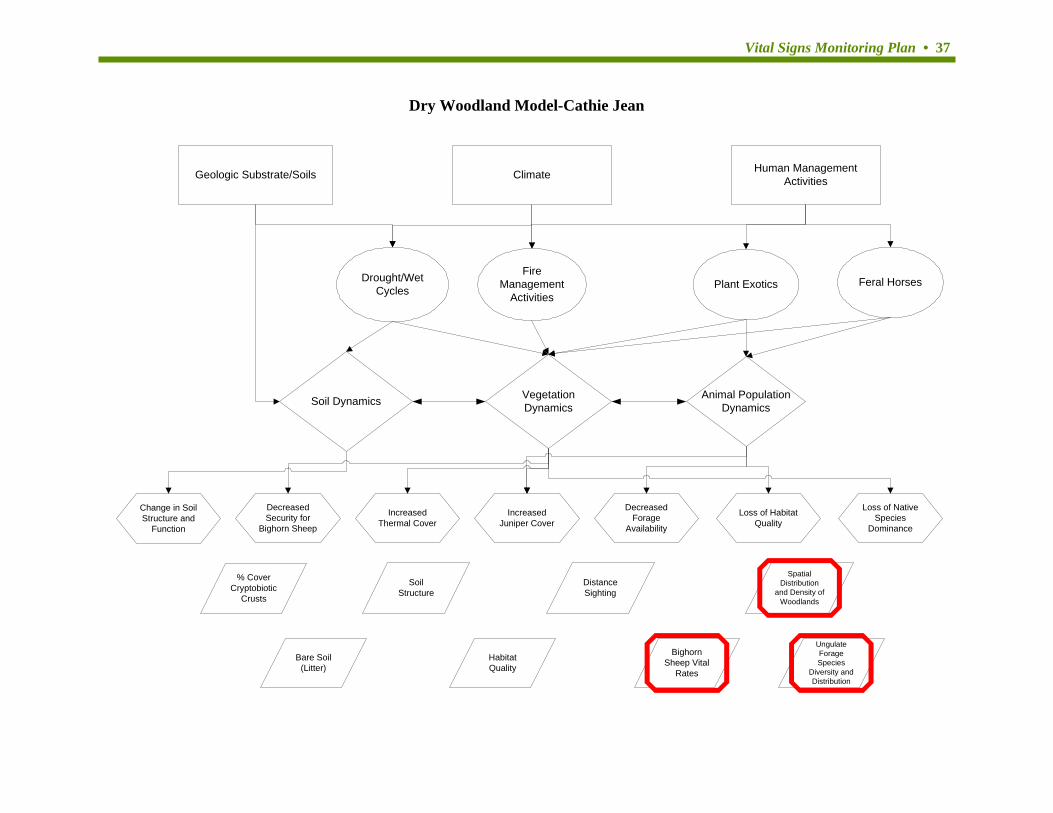
Vital Signs Monitoring Plan • 37
Dry Woodland Model-Cathie Jean
Geologic Substrate/Soils Clim
ate Human ManagementActivities
Drought/WetCycles Plant Exotics Feral Horses
Fi
reManagement
Activities
Soil Dynamics VegetationDynamics
Animal PopulationDynamics
Change in SoilStructure and
Function
Loss of NativeSpecies
Dominance
Loss of HabitatQuality
DecreasedForage
Availability
Incre sedJuniper Cover
a
IncreasedThermal Cover
DecreasedSecurity for
Bighorn Sheep
% CoverCryptobiotic
Crusts
UngulateForageSpecies
Diversity andDistribution
SpatialDistribution
and Density ofWoodlands
BighornSheep Vital
Rates
DistanceSighting
HabitatQuality
SoilStructure
Bare Soil(Litter)
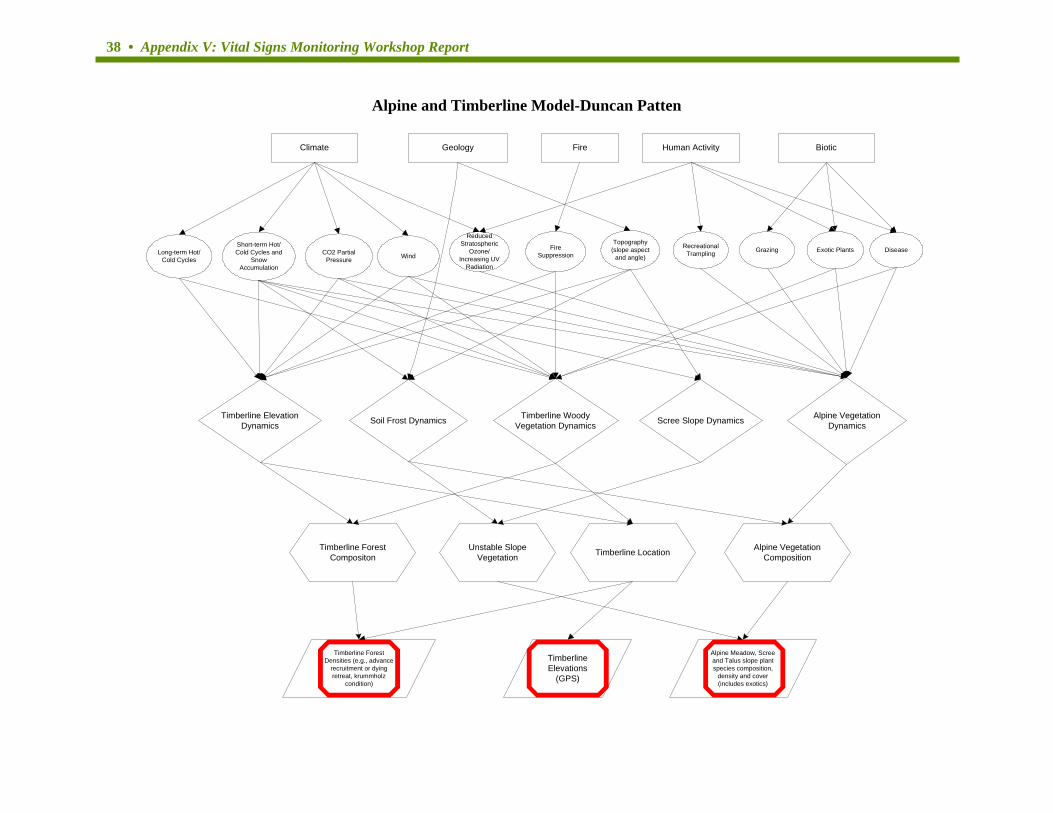
38 • Appendix V: Vital Signs Monitoring Workshop Report
Alpine and Timberline Model-Duncan Patten Climate Geology Human Activity Biotic
Soil Frost Dynamics Scree Slope Dynamics Alpine VegetationDynamics
Timberline WoodyVegetation Dynamics
Exotic PlantsGrazingRecreationalTrampling Disease
Unstable SlopeVegetation Timberline Location Alpine Vegetation
Composition
Timberline ForestDensities (e.g., advance
recruitment or dyingretreat, krummholz
condition)
TimberlineElevations
(GPS)
Alpine Meadow, Screeand Talus slope plantspecies composition,
density and cover(includes exotics)
Timberline ForestCompositon
WindLong-term Hot/Cold Cycles
Topography(slope aspect
and angle)
Timberline ElevationDynamics
Short-term Hot/Cold Cycles and
SnowAccumulation
ReducedStratospheric
Ozone/Increasing UV
Radiation
CO2 PartialPressure
Fire
FireSuppression
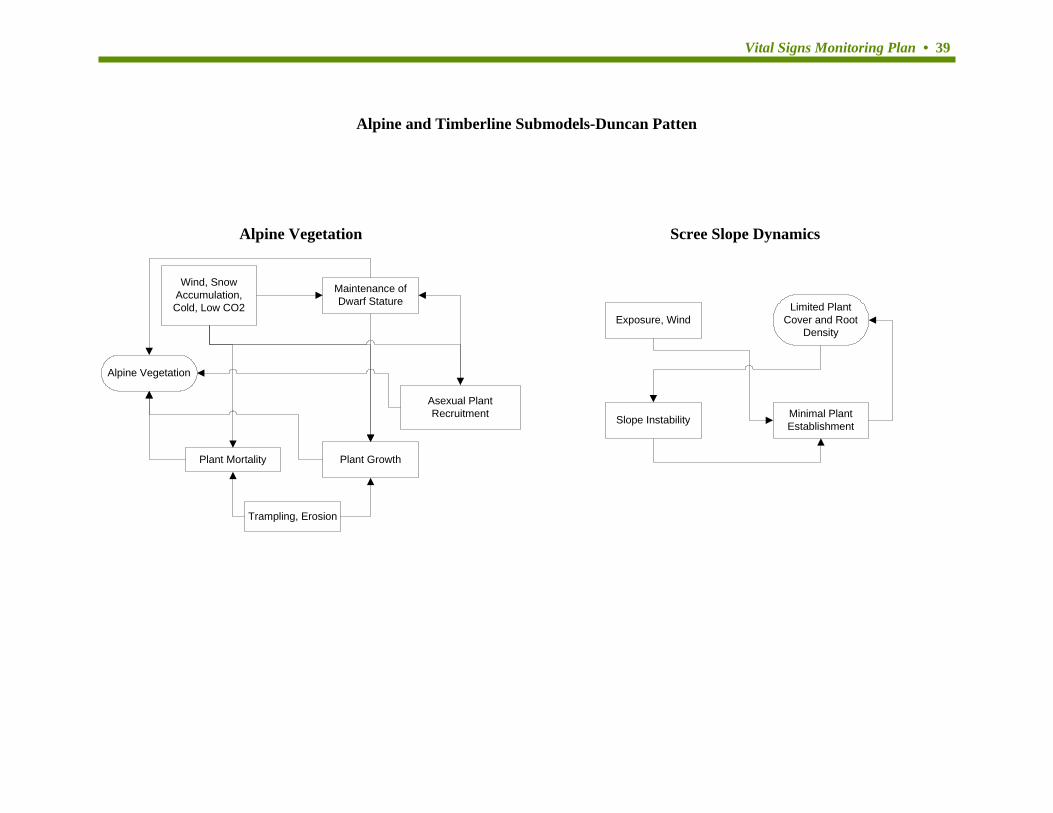
Vital Signs Monitoring Plan • 39
Alpine and Timberline Submodels-Duncan Patten
Alpine Vegetation Scree Slope Dynamics
Wind, SnowAccumulation,Cold, Low CO2
Asexual PlantRecruitment
Maintenance ofDwarf Stature
Plant Growth
Trampling, Erosion
Plant Mortality
Alpine Vegetation
Exposure, Wind
Slope Instability Minimal PlantEstablishment
Limited PlantCover and Root
Density
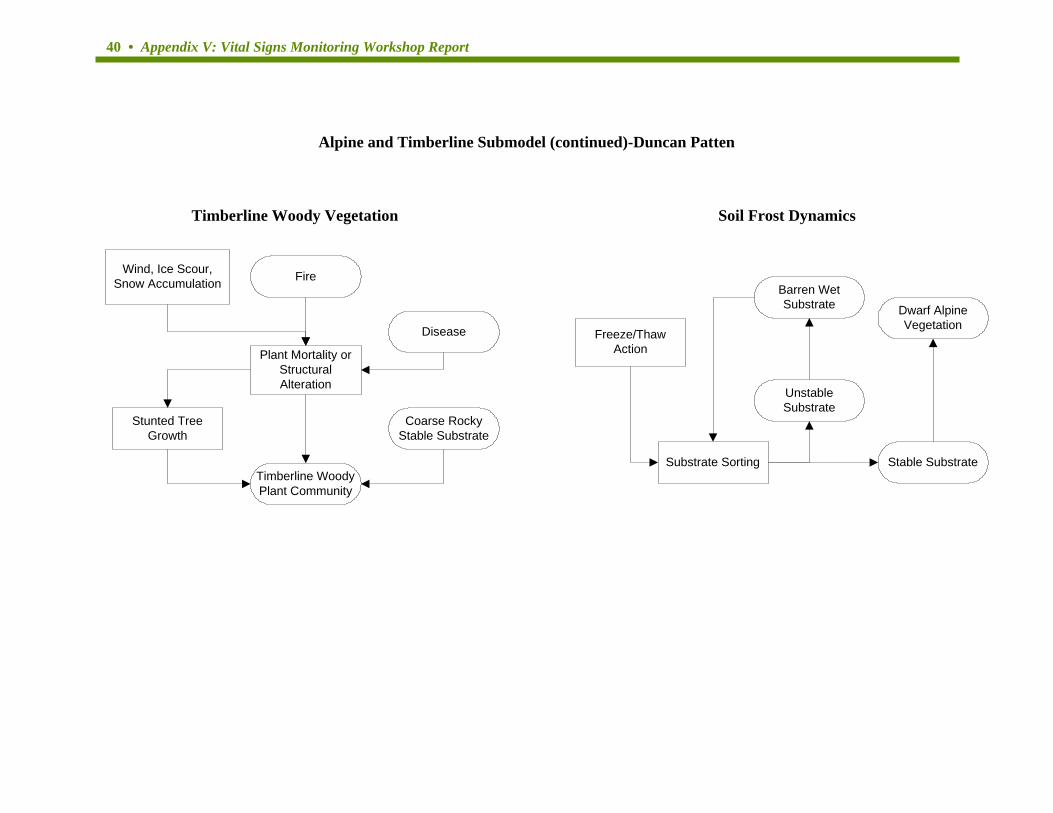
40 • Appendix V: Vital Signs Monitoring Workshop Report
Alpine and Timberline Submodel (continued)-Duncan Patten
Timberline Woody Vegetation Soil Frost Dynamics
Wind, Ice Scour,Snow Accumulation
Stunted TreeGrowth
Plant Mortality orStructuralAlteration
Timberline WoodyPlant Community
Coarse RockyStable Substrate
Disease
Fire
Substrate Sorting
Freeze/ThawAction
Stable Substrate
Barren WetSubstrate Dwarf Alpine
Vegetation
UnstableSubstrate
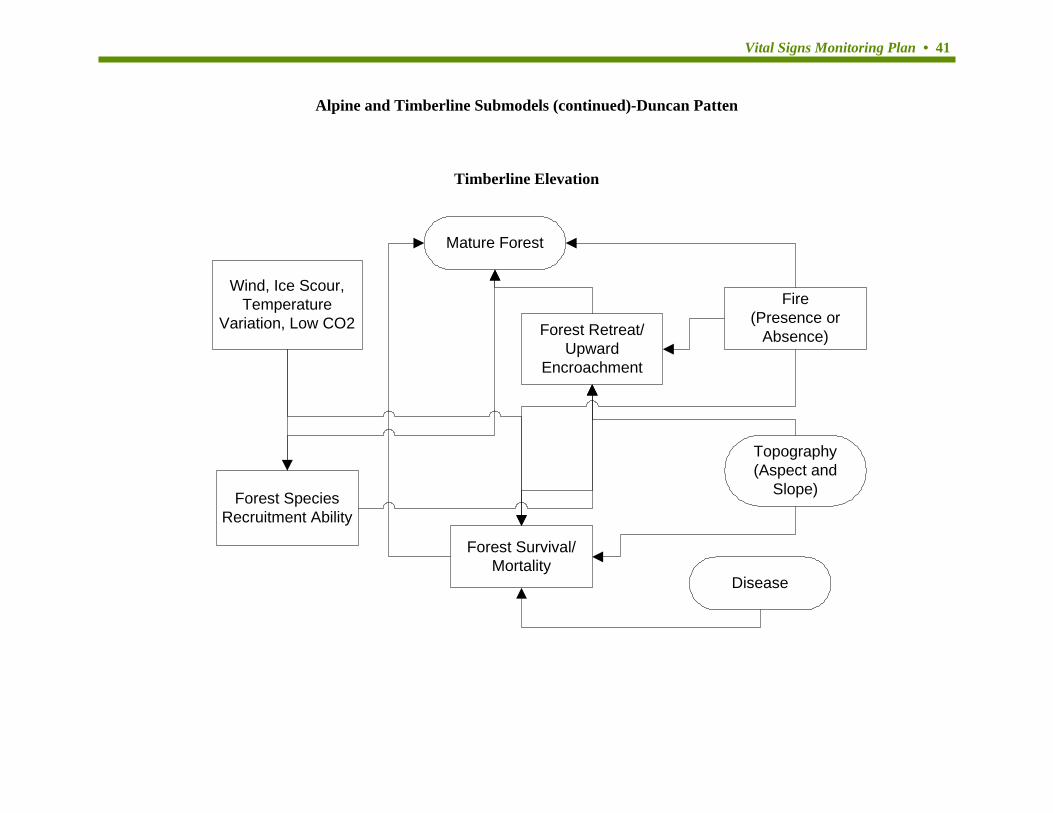
Vital Signs Monitoring Plan • 41
Alpine and Timberline Submodels (continued)-Duncan Patten
Timberline Elevation
Wind, Ice Scour,Temperature
Variation, Low CO2 Forest Retreat/Upward
Encroachment
Forest SpeciesRecruitment Ability
Forest Survival/Mortality
Fire(Presence or
Absence)
Mature Forest
Disease
Topography(Aspect and
Slope)
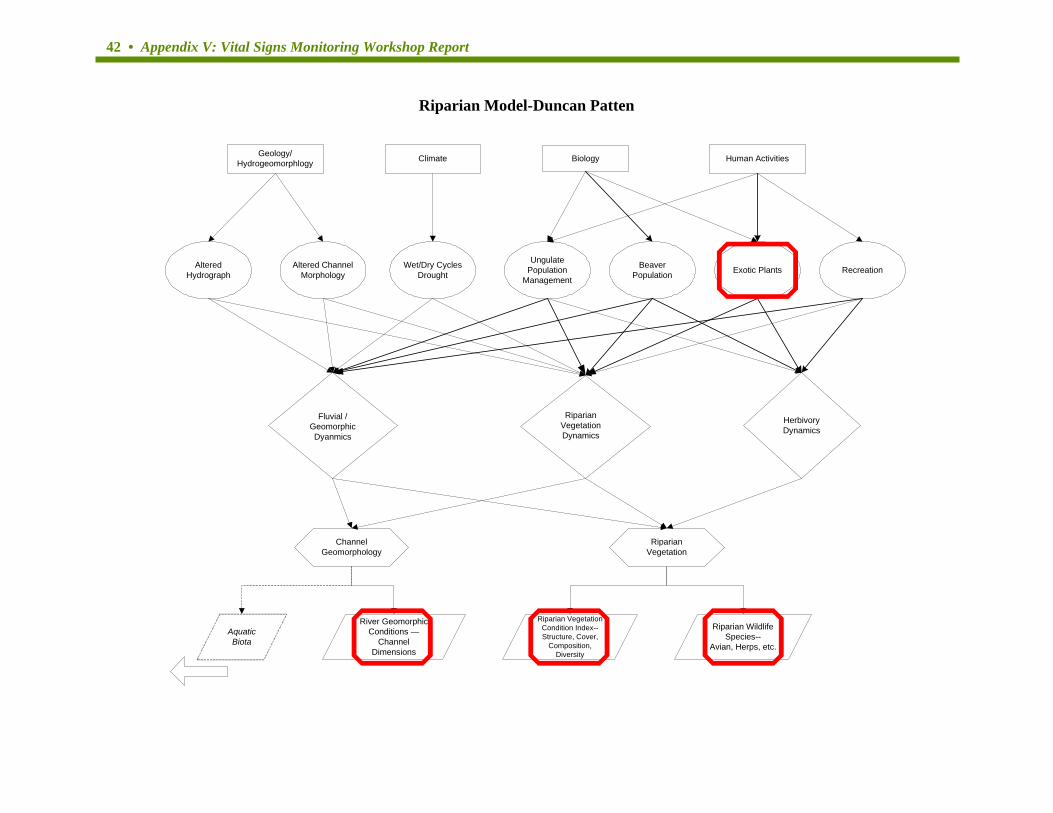
42 • Appendix V: Vital Signs Monitoring Workshop Report
Riparian Model-Duncan Patten
Human Activities
Recreation
Riparian WildlifeSpecies--
Avian, Herps, etc.
Geology/Hydrogeomorphlogy Climate Biology
AlteredHydrograph
Altered ChannelMorphology
Wet/Dry CyclesDrought
UngulatePopulation
ManagementExotic Plants
ChannelGeomorphology
RiparianVegetation
River GeomorphicConditions —
ChannelDimensions
Riparian VegetationCondition Index--Structure, Cover,
Composition,Diversity
AquaticBiota
BeaverPopulation
Fluvial /GeomorphicDyanmics
RiparianVegetationDynamics
HerbivoryDynamics
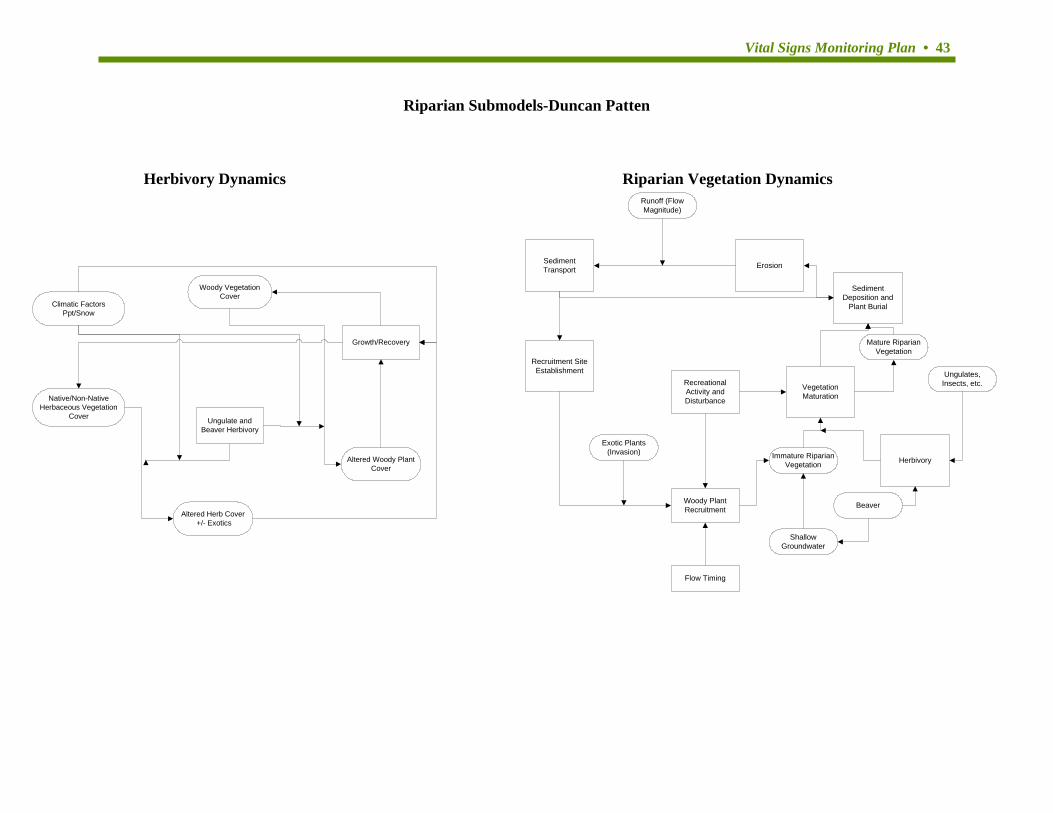
Vital Signs Monitoring Plan • 43
Riparian Submodels-Duncan Patten
Herbivory Dynamics Riparian Vegetation Dynamics
Erosion
Runoff (FlowMagnitude)
SedimentTransport
Recruitment SiteEstablishment
Exotic Plants(Invasion)
RecreationalActivity andDisturbance
Erosion
SedimentDeposition and
Plant Burial
Mature RiparianVegetation
VegetationMaturation
Beaver
ShallowGroundwater
Woody PlantRecruitment
Flow Timing
Immature RiparianVegetation Herbivory
Ungulates,Insects, etc.
Climatic FactorsPpt/Snow
Woody VegetationCover
Native/Non-NativeHerbaceous Vegetation
Cover
Altered Herb Cover +/- Exotics
Altered Woody PlantCover
Growth/Recovery
Ungulate andBeaver Herbivory

44 • Appendix V: Vital Signs Monitoring Workshop Report
Riparian Submodels (continued)-Duncan Patten
Fluvial Geomorphology Dynamics
ChannelGeomorphology Beaver Dams
Runoff(Flow Magnitude)
Ungulate andRecreation
Use
Erosion
SedimentTransport
SedimentDeposition
Bank Alteration

Vital Signs Monitoring Plan • 45
Wetland Model-Duncan Patten
Upland Erosion
DepressionWetland Dynamics
Pothole WetlandCommunities
Wetland Parameterse.g., species
composition, cover orabundance, diversity
HydrogeomorphologyClimate Biotic DriversGeology
AlteredHydrologyWet/Dry Cycles Ungulates Predators
HydrologicalDynamics
WetlandVegetationDynamics
BeaverPopulationsDynamics
WillowCommunities
Beaver DamWetland
Communities
HerbacousWetlands
AssociatedSpecies
e.g., amphibians,birds
Beaver
Spring Wetlands
Human Activities
Exotic Plants
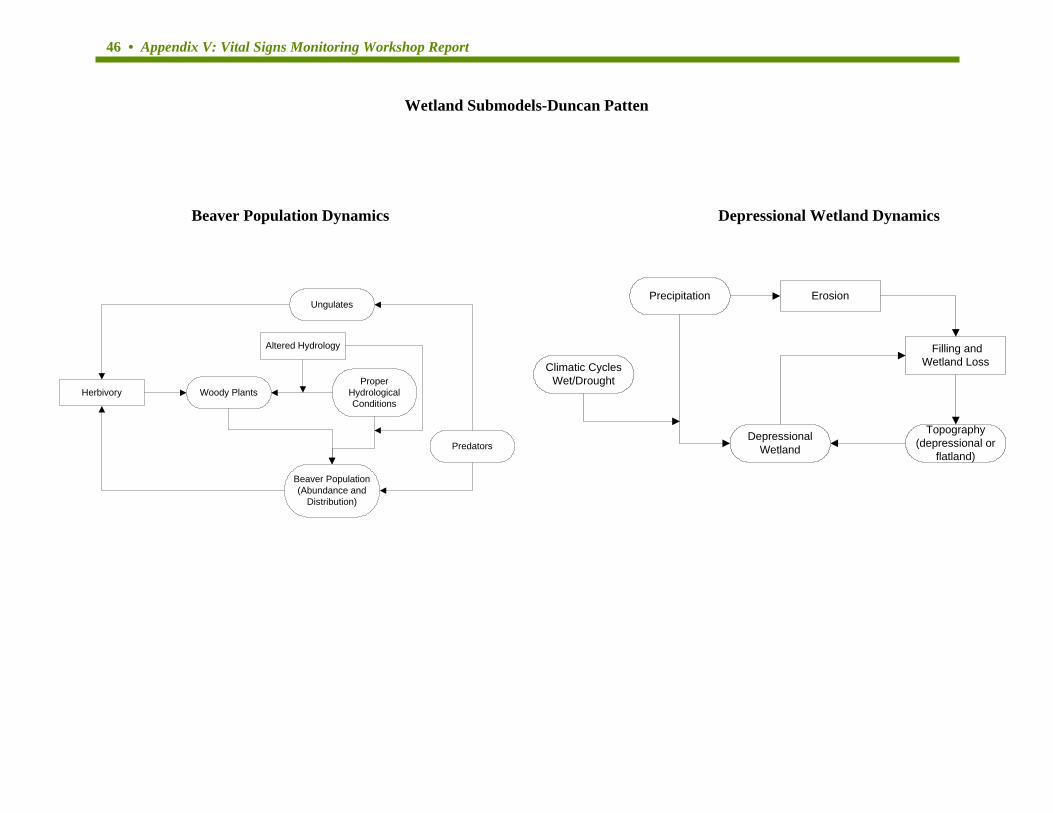
46 • Appendix V: Vital Signs Monitoring Workshop Report
Wetland Submodels-Duncan Patten
Beaver Population Dynamics Depressional Wetland Dynamics
Erosion
Filling andWetland Loss
Precipitation
Topography(depressional or
flatland)
Climatic CyclesWet/Drought
DepressionalWetland
Woody Plants
Beaver Population(Abundance and
Distribution)
Predators
Ungulates
HerbivoryProper
HydrologicalConditions
Altered Hydrology
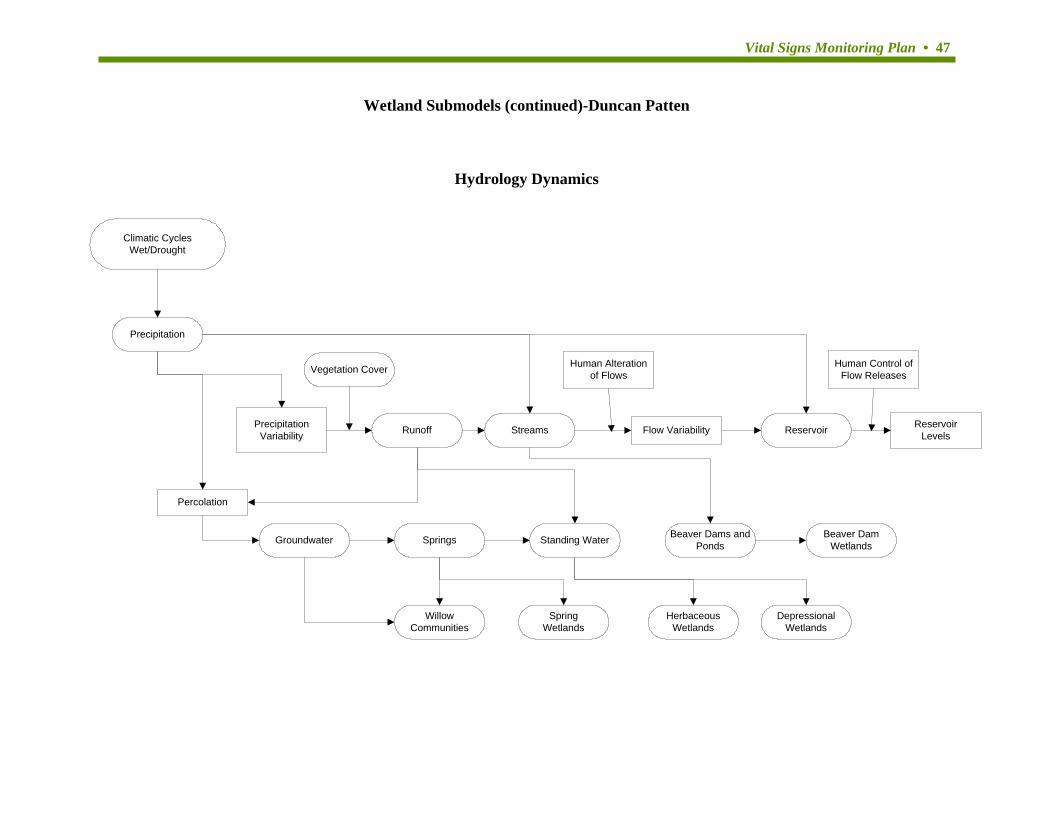
Vital Signs Monitoring Plan • 47
Wetland Submodels (continued)-Duncan Patten
Hydrology Dynamics
Climatic CyclesWet/Drought
Precipitation
PrecipitationVariability Runoff Streams Flow Variability
Groundwater Springs
Percolation
Reservoir ReservoirLevels
Vegetation Cover Human Alterationof Flows
Human Control ofFlow Releases
Beaver Dams andPonds
Beaver DamWetlands
WillowCommunities
Standing Water
HerbaceousWetlands
DepressionalWetlands
SpringWetlands
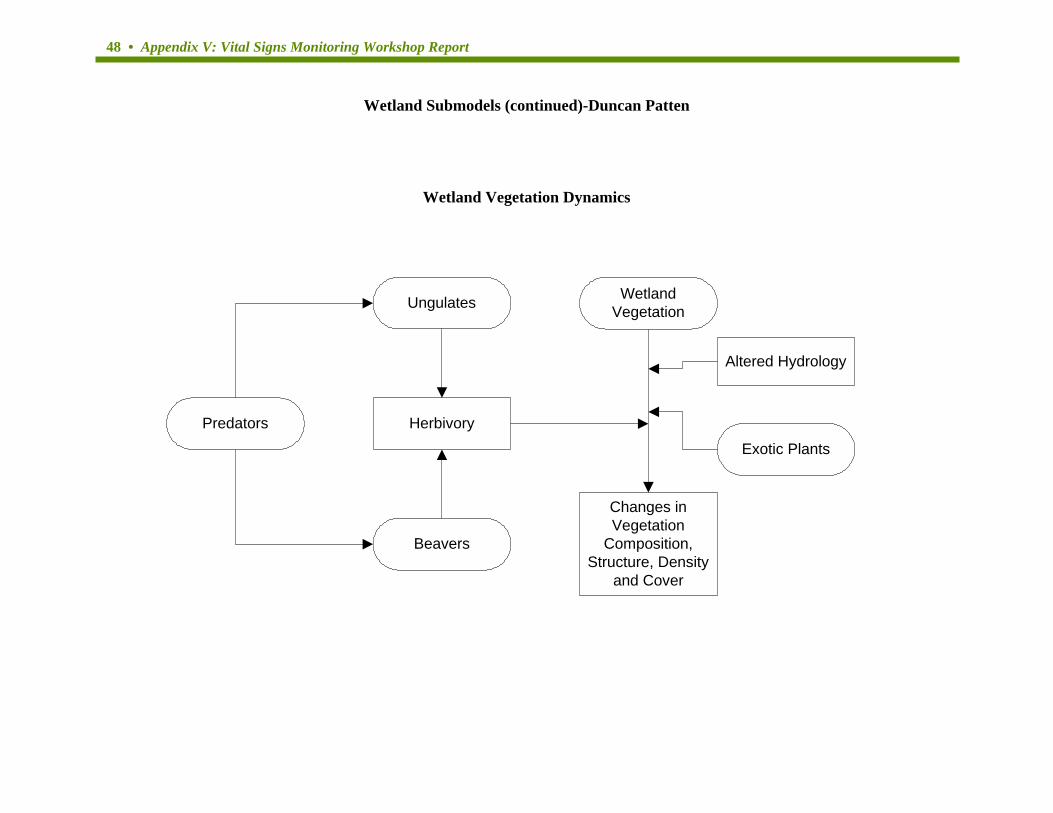
48 • Appendix V: Vital Signs Monitoring Workshop Report
Wetland Submodels (continued)-Duncan Patten
Wetland Vegetation Dynamics
Ungulates WetlandVegetation
Changes inVegetation
Composition,Structure, Density
and Cover
Beavers
HerbivoryPredators
Exotic Plants
Altered Hydrology
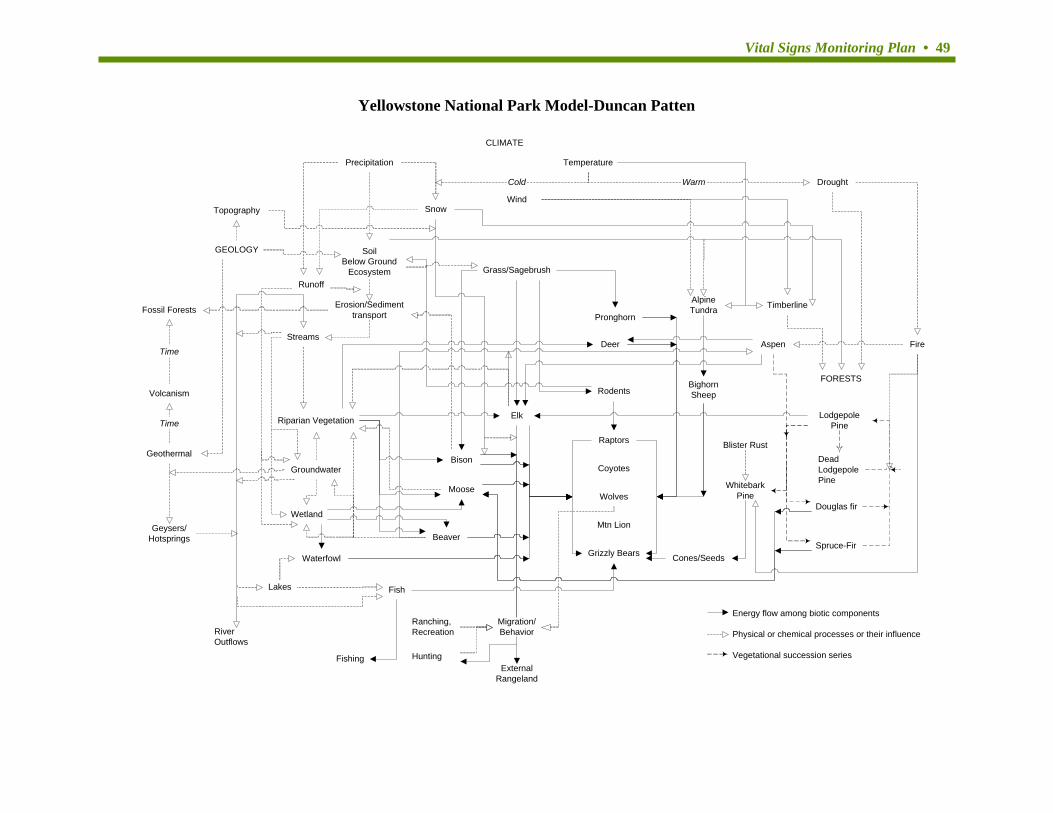
Vital Signs Monitoring Plan • 49
Yellowstone National Park Model-Duncan Patten CLIMATE
Precipitation Temperature
Snow
GEOLOGY
Fossil Forests
Volcanism
Geothermal
Geysers/Hotsprings
Time
Time
Topography
Streams
SoilBelow Ground
Ecosystem
Erosion/Sedimenttransport
Riparian Vegetation
Groundwater
Wetland
Runoff
Grass/Sagebrush
Elk
Bison
Moose
Beaver
Waterfowl
Lakes
RiverOutflows
BighornSheep
Pronghorn
Deer
Rodents
Coyotes
Wolves
Mtn Lion
Grizzly Bears
Raptors
AlpineTundra
FORESTS
Aspen
LodgepolePine
WhitebarkPine
DeadLodgepolePine
Douglas fir
Spruce-Fir
Fire
Fish
Fishing HuntingExternal
Rangeland
Cold DroughtWarm
Migration/Behavior
Cones/Seeds
Blister Rust
Energy flow among biotic components
Physical or chemical processes or their influence
Vegetational succession series
Ranching,Recreation
Timberline
Wind
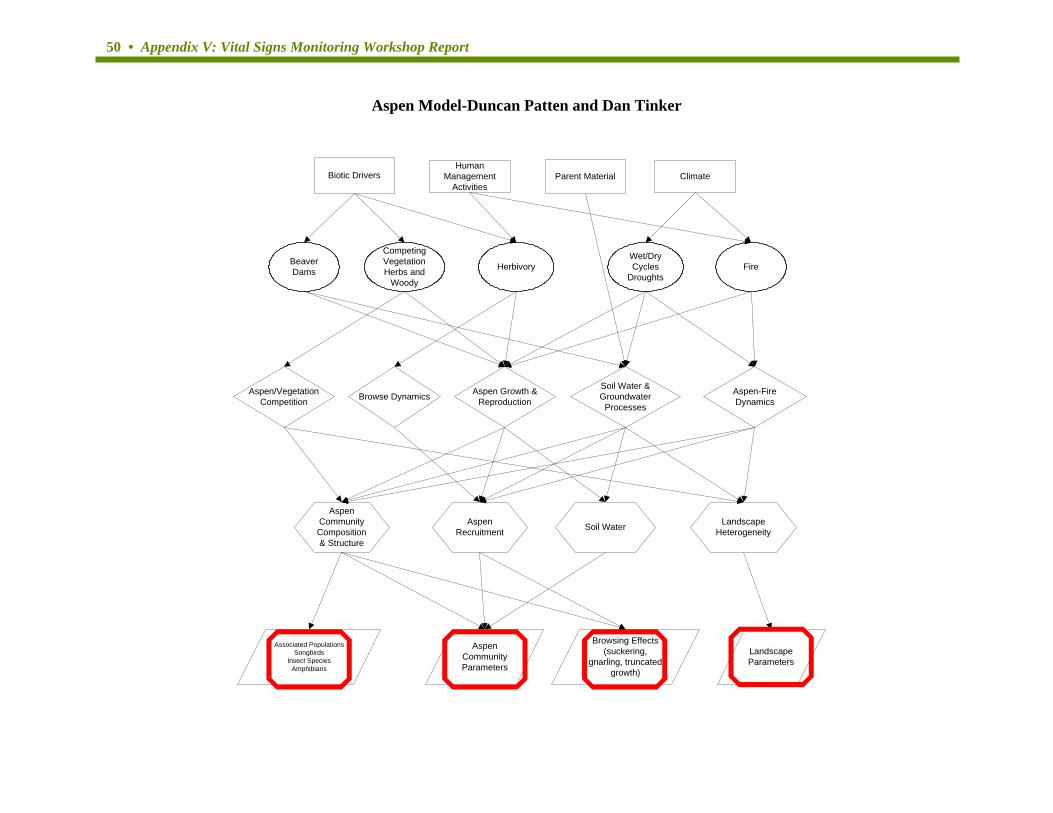
50 • Appendix V: Vital Signs Monitoring Workshop Report
Aspen Model-Duncan Patten and Dan Tinker
Herbivory
ClimateBiotic Drivers
Fire
Aspen Growth &Reproduction
Aspen-FireDynamics
Wet/DryCycles
Droughts
Soil Water
Soil Water &Groundwater
Processes
HumanManagement
Activities
AspenCommunityComposition& Structure
Parent Material
LandscapeHeterogeneity
AspenRecruitment
BeaverDams
CompetingVegetationHerbs and
Woody
Aspen/VegetationCompetition Browse Dynamics
AspenCommunityParameters
Associated PopulationsSongbirds
Insect SpeciesAmphibians
LandscapeParameters
Browsing Effects(suckering,
gnarling, truncatedgrowth)
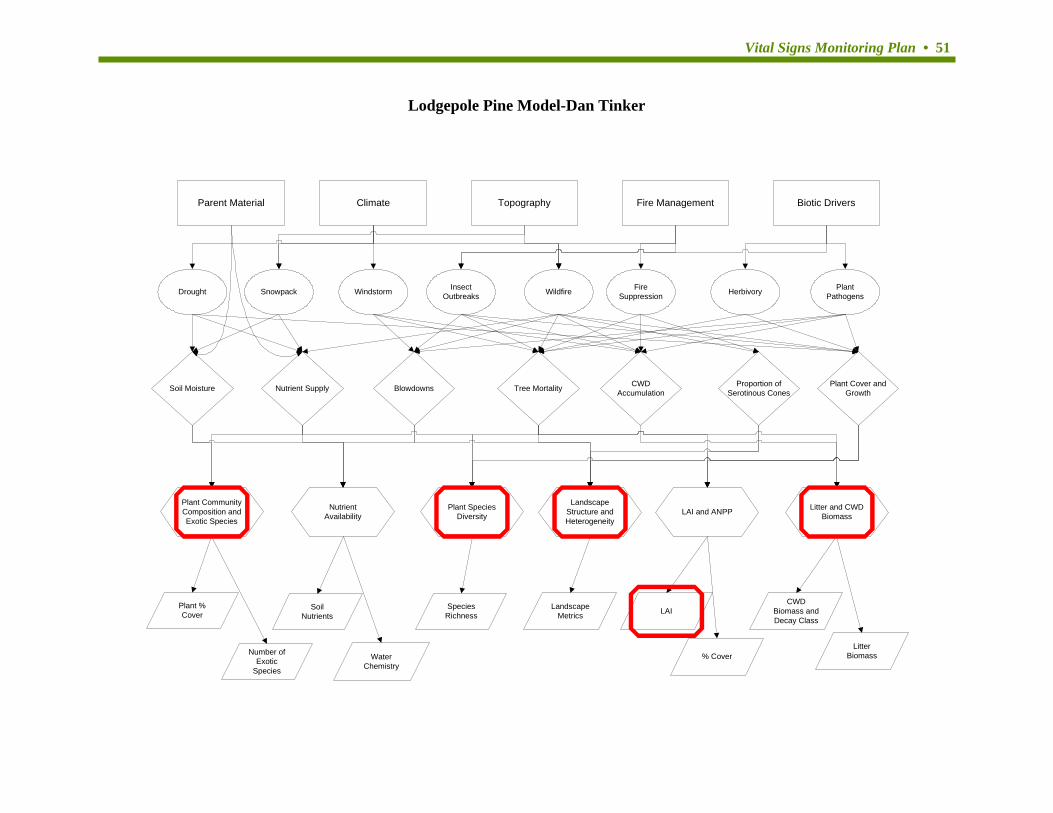
Vital Signs Monitoring Plan • 51
Lodgepole Pine Model-Dan Tinker
Parent Material Biotic DriversFire ManagementTopographyClimate
Drought PlantPathogensHerbivoryFire
SuppressionWildfireInsectOutbreaksWindstormSnowpack
Soil Moisture Plant Cover andGrowth
Proportion ofSerotinous Cones
CWDAccumulationTree MortalityBlowdownsNutrient Supply
Plant CommunityComposition andExotic Species
Litter and CWDBiomassLAI and ANPP
LandscapeStructure andHeterogeneity
Plant SpeciesDiversity
NutrientAvailability
Plant %Cover
LandscapeMetrics
SpeciesRichness
WaterChemistry
SoilNutrients
Number ofExotic
Species
LitterBiomass
CWDBiomass andDecay Class
% Cover
LAI
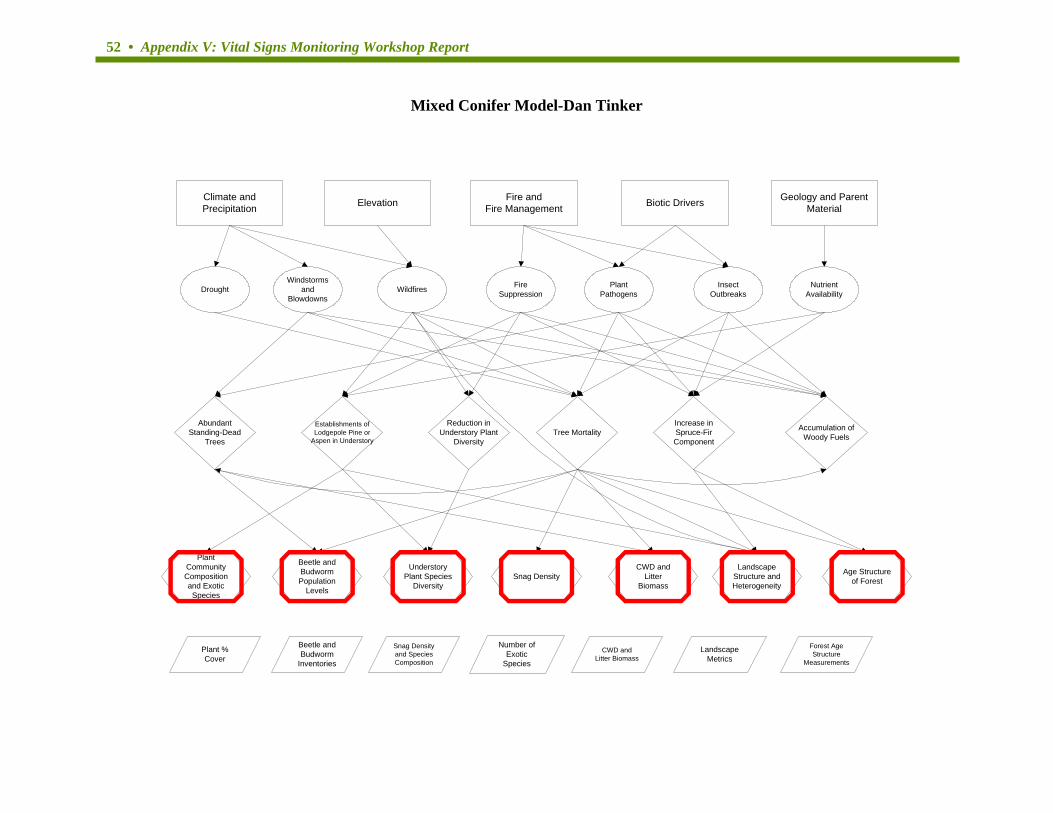
52 • Appendix V: Vital Signs Monitoring Workshop Report
Mixed Conifer Model-Dan Tinker
Climate andPrecipitation Biotic DriversFire and
Fire ManagementElevation
Drought NutrientAvailability
InsectOutbreaks
PlantPathogens
FireSuppressionWildfires
Windstormsand
Blowdowns
AbundantStanding-Dead
Trees
Accumulation ofWoody Fuels
Increase inSpruce-FirComponent
Tree MortalityReduction in
Understory PlantDiversity
Establishments ofLodgepole Pine or
Aspen in Understory
Plant %Cover
LandscapeMetrics
CWD andLitter Biomass
Number ofExotic
Species
Snag Densityand SpeciesComposition
Beetle andBudworm
Inventories
PlantCommunityCompositionand ExoticSpecies
Age Structureof Forest
LandscapeStructure andHeterogeneity
CWD andLitter
BiomassSnag Density
UnderstoryPlant Species
Diversity
Beetle andBudwormPopulation
Levels
Geology and ParentMaterial
Forest AgeStructure
Measurements
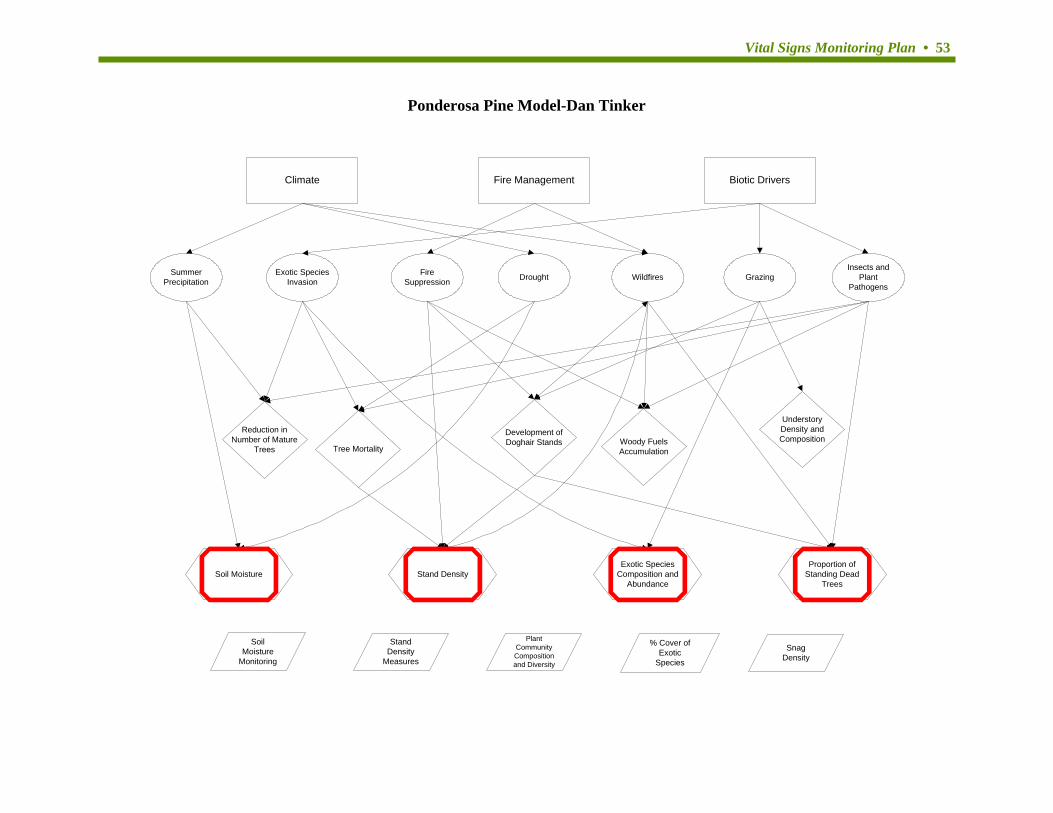
Vital Signs Monitoring Plan • 53
Ponderosa Pine Model-Dan Tinker
Biotic DriversFire ManagementClimate
SummerPrecipitation
Insects andPlant
PathogensGrazingWildfiresDroughtFire
SuppressionExotic Species
Invasion
Reduction inNumber of Mature
Trees
UnderstoryDensity andCompositionWoody Fuels
Accumulation
Development ofDoghair Stands
Tree Mortality
Soil MoistureProportion of
Standing DeadTrees
Exotic SpeciesComposition and
AbundanceStand Density
SoilMoisture
MonitoringSnag
Density
% Cover ofExotic
Species
PlantCommunityCompositionand Diversity
StandDensity
Measures
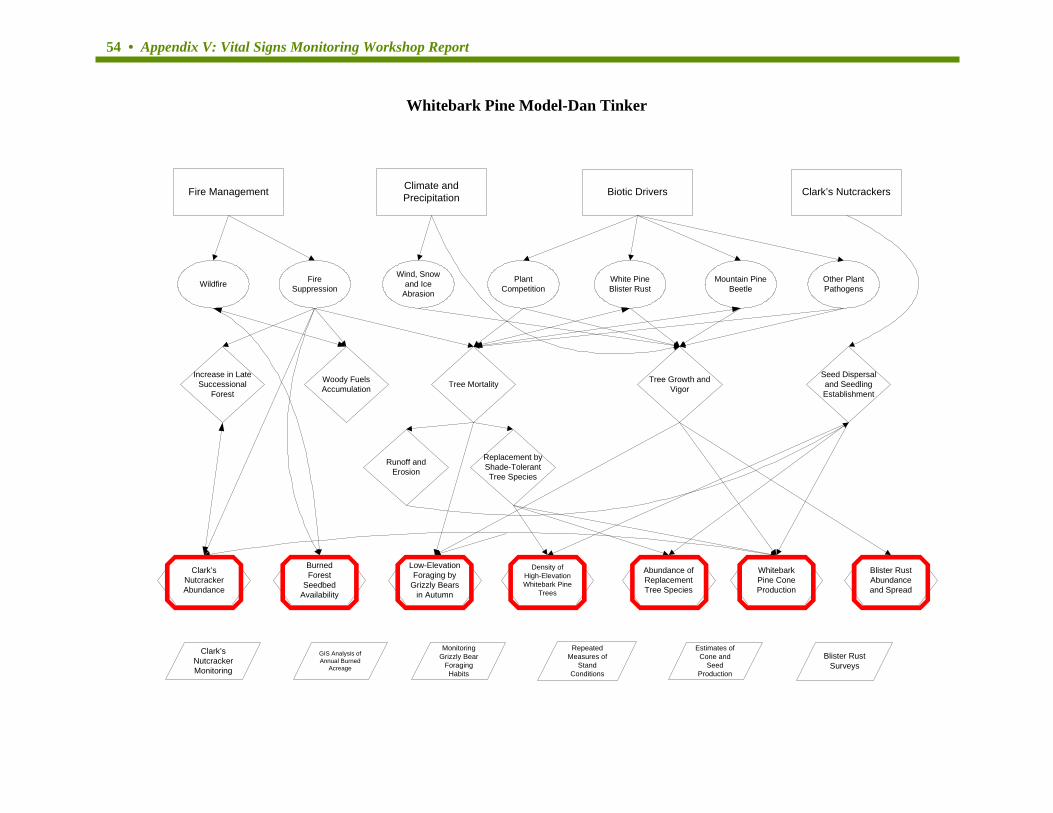
54 • Appendix V: Vital Signs Monitoring Workshop Report
Whitebark Pine Model-Dan Tinker
Fire Management Clark’s NutcrackersBiotic DriversClimate andPrecipitation
Wildfire Other PlantPathogens
Mountain PineBeetle
White PineBlister Rust
PlantCompetition
Wind, Snowand Ice
Abrasion
FireSuppression
Increase in LateSuccessional
Forest
Seed Dispersaland SeedlingEstablishment
Tree Growth andVigor
Replacement byShade-TolerantTree Species
Runoff andErosion
Tree MortalityWoody FuelsAccumulation
Clark’sNutcrackerMonitoring
Blister RustSurveys
Estimates ofCone and
SeedProduction
RepeatedMeasures of
StandConditions
MonitoringGrizzly Bear
ForagingHabits
GIS Analysis ofAnnual Burned
Acreage
Clark’sNutcrackerAbundance
Blister RustAbundanceand Spread
WhitebarkPine ConeProduction
Abundance ofReplacementTree Species
Density ofHigh-ElevationWhitebark Pine
Trees
Low-ElevationForaging by
Grizzly Bearsin Autumn
BurnedForest
SeedbedAvailability

Vital Signs Monitoring Plan • 55
Grassland Model-Glenn Plumb
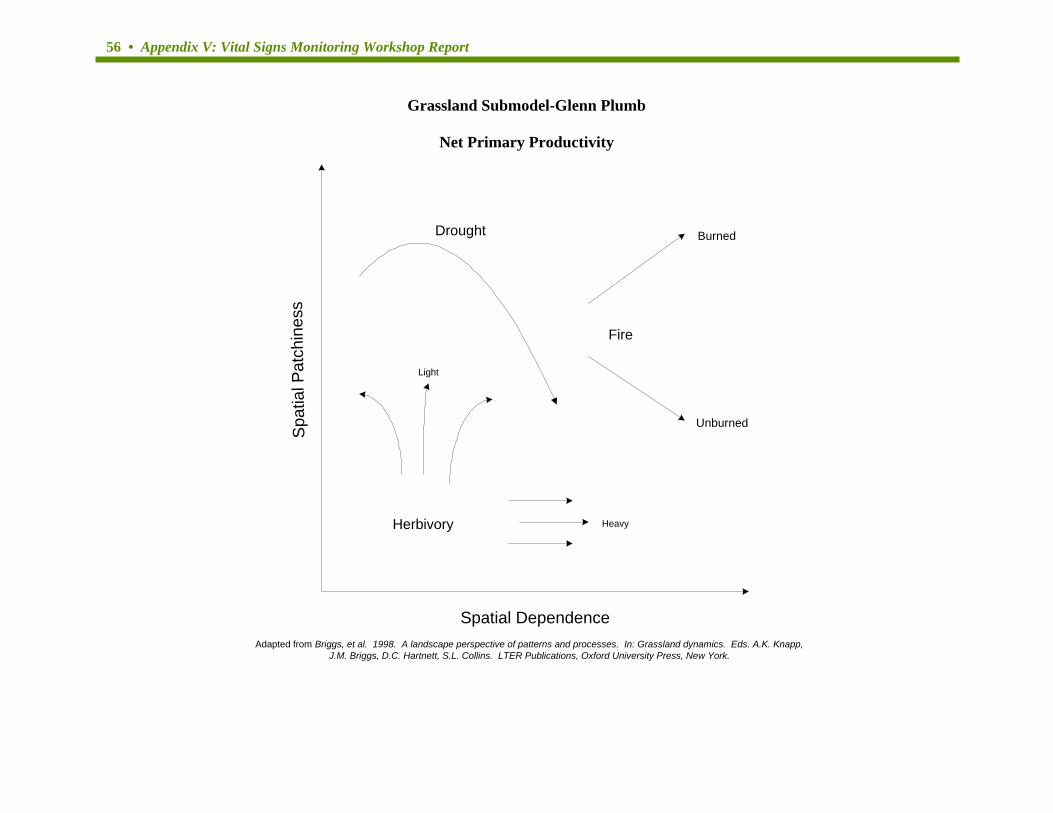
56 • Appendix V: Vital Signs Monitoring Workshop Report
Grassland Submodel-Glenn Plumb
Net Primary Productivity
Spatial Dependence
Spa
tial P
atch
ines
s
Herbivory
Drought Burned
Unburned
Fire
Adapted from Briggs, et al. 1998. A landscape perspective of patterns and processes. In: Grassland dynamics. Eds. A.K. Knapp,J.M. Briggs, D.C. Hartnett, S.L. Collins. LTER Publications, Oxford University Press, New York.
Light
Heavy
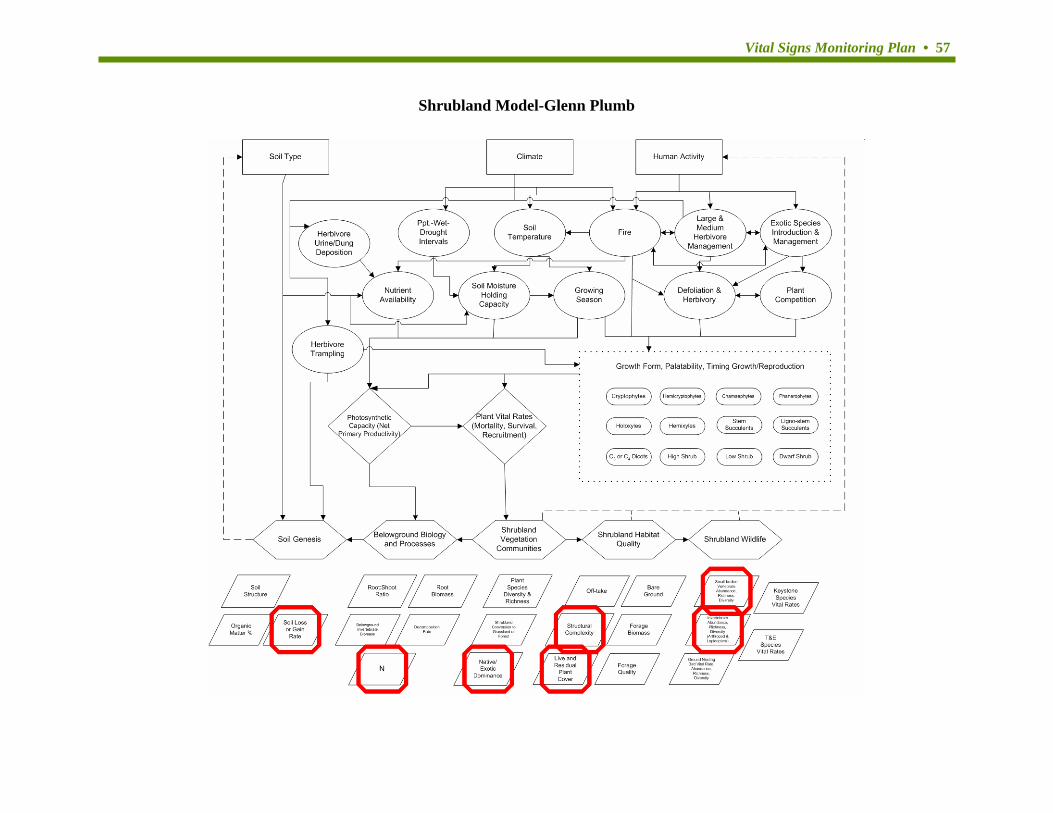
Vital Signs Monitoring Plan • 57
Shrubland Model-Glenn Plumb
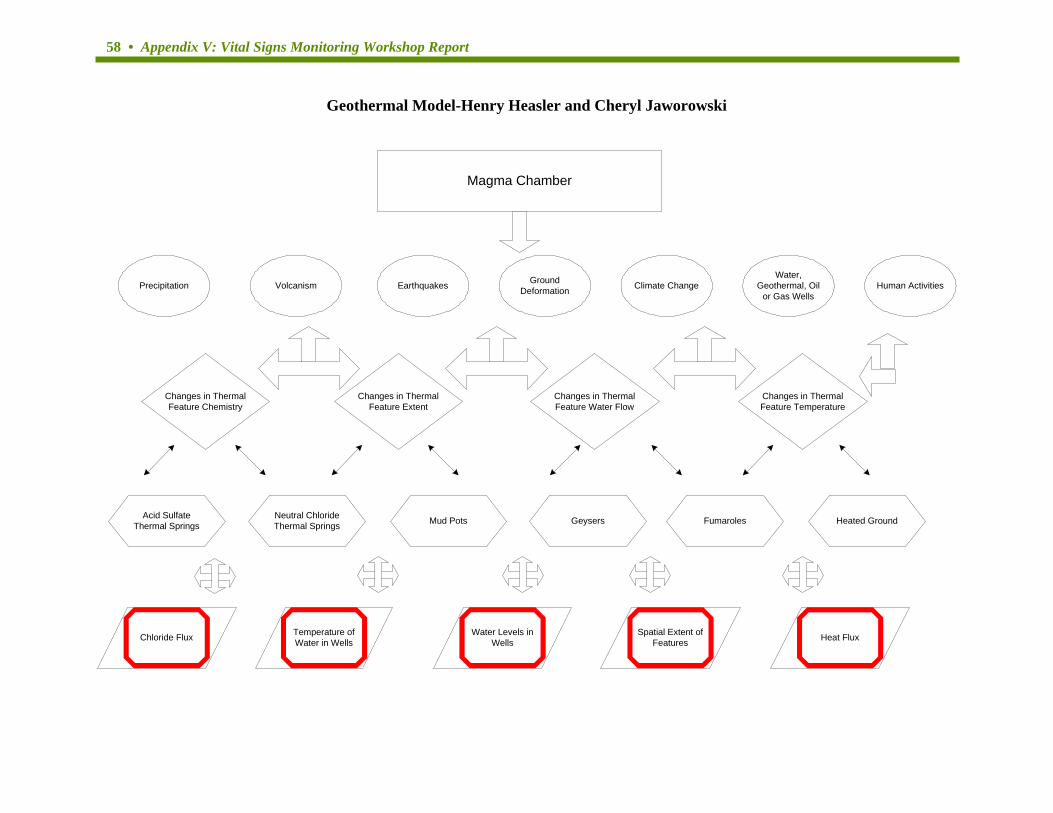
58 • Appendix V: Vital Signs Monitoring Workshop Report
Geothermal Model-Henry Heasler and Cheryl Jaworowski
Magma Chamber
Precipitation Human ActivitiesWater,
Geothermal, Oilor Gas Wells
Climate ChangeGroundDeformationEarthquakesVolcanism
Changes in ThermalFeature Chemistry
Changes in ThermalFeature Extent
Changes in ThermalFeature Water Flow
Changes in ThermalFeature Temperature
Acid SulfateThermal Springs Geysers Heated GroundFumarolesMud PotsNeutral Chloride
Thermal Springs
Chloride Flux Heat FluxSpatial Extent ofFeatures
Water Levels inWells
Temperature ofWater in Wells
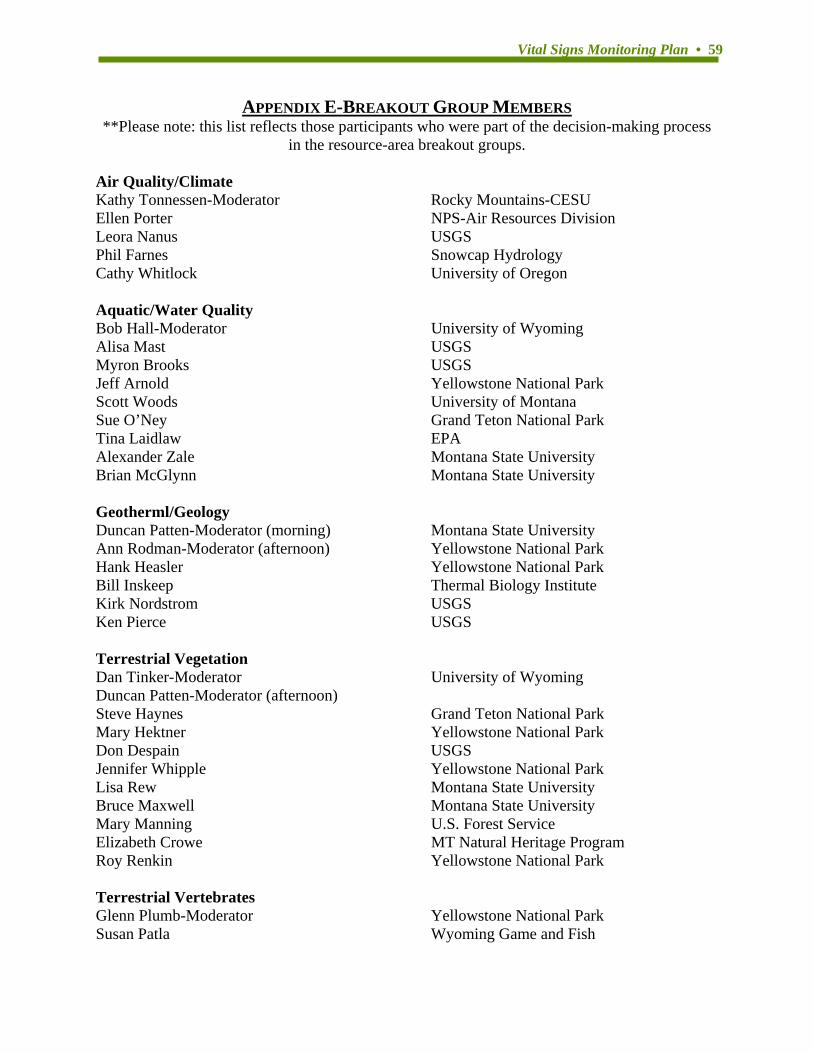
Vital Signs Monitoring Plan • 59
APPENDIX E-BREAKOUT GROUP MEMBERS **Please note: this list reflects those participants who were part of the decision-making process
in the resource-area breakout groups. Air Quality/Climate Kathy Tonnessen-Moderator Rocky Mountains-CESU Ellen Porter NPS-Air Resources Division Leora Nanus USGS Phil Farnes Snowcap Hydrology Cathy Whitlock University of Oregon Aquatic/Water Quality Bob Hall-Moderator University of Wyoming Alisa Mast USGS Myron Brooks USGS Jeff Arnold Yellowstone National Park Scott Woods University of Montana Sue O’Ney Grand Teton National Park Tina Laidlaw EPA Alexander Zale Montana State University Brian McGlynn Montana State University Geotherml/Geology Duncan Patten-Moderator (morning) Montana State University Ann Rodman-Moderator (afternoon) Yellowstone National Park Hank Heasler Yellowstone National Park Bill Inskeep Thermal Biology Institute Kirk Nordstrom USGS Ken Pierce USGS Terrestrial Vegetation Dan Tinker-Moderator University of Wyoming Duncan Patten-Moderator (afternoon) Steve Haynes Grand Teton National Park Mary Hektner Yellowstone National Park Don Despain USGS Jennifer Whipple Yellowstone National Park Lisa Rew Montana State University Bruce Maxwell Montana State University Mary Manning U.S. Forest Service Elizabeth Crowe MT Natural Heritage Program Roy Renkin Yellowstone National Park Terrestrial Vertebrates Glenn Plumb-Moderator Yellowstone National Park Susan Patla Wyoming Game and Fish
60 • Appendix V: Vital Signs Monitoring Workshop Report
Bob Crabtree Yellowstone Ecological Research Center Peter Gogan USGS Scott Creel Montana State University Chuck Peterson Idaho State University Stephen Corn USGS Doug Keniath WY Natural Diversity Database Susan Wolff Grand Teton National Park Invertebrates Steve Fancy-Moderator National I&M Coordinator Diane Debinski Iowa State University John Varley Yellowstone National Park Michael Ivie Montana State University Human Use Tom Olliff-Moderator Yellowstone National Park Dan Burgette Grand Teton National Park Laura Gianakos Bighorn Canyon NRA
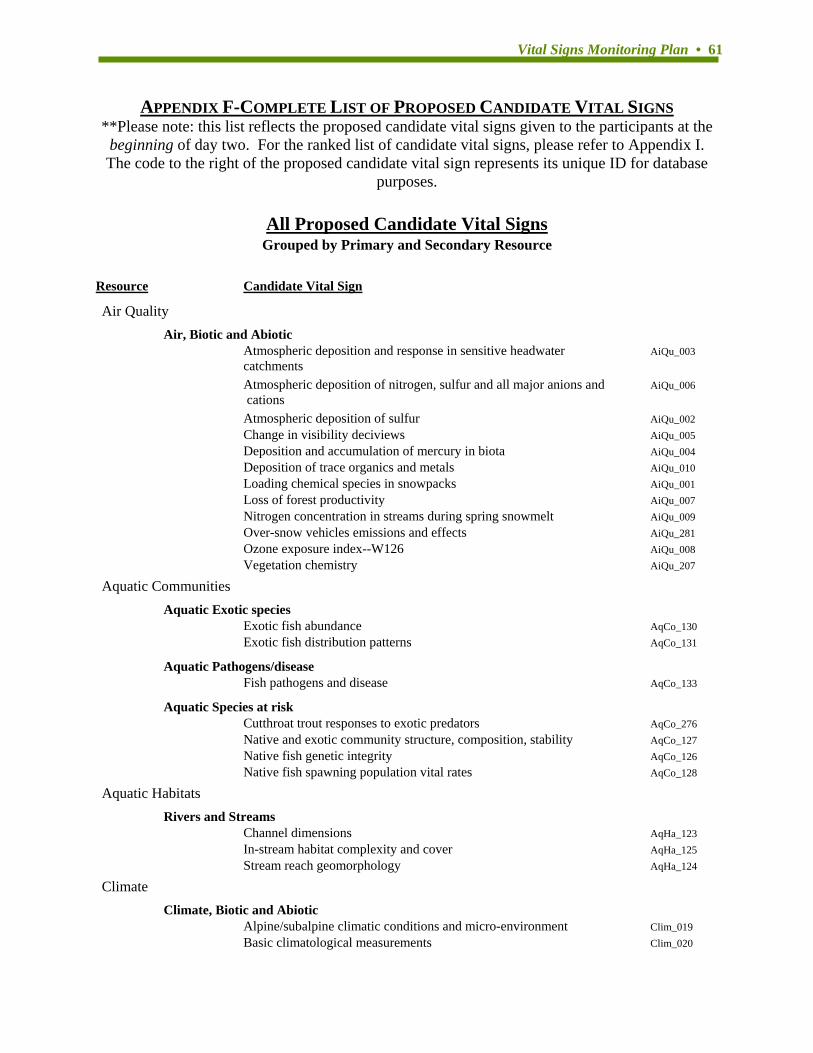
Vital Signs Monitoring Plan • 61
APPENDIX F-COMPLETE LIST OF PROPOSED CANDIDATE VITAL SIGNS **Please note: this list reflects the proposed candidate vital signs given to the participants at the
beginning of day two. For the ranked list of candidate vital signs, please refer to Appendix I. The code to the right of the proposed candidate vital sign represents its unique ID for database
purposes.
All Proposed Candidate Vital Signs Grouped by Primary and Secondary Resource
Resource Candidate Vital Sign Air Quality Air, Biotic and Abiotic Atmospheric deposition and response in sensitive headwater AiQu_003 catchments Atmospheric deposition of nitrogen, sulfur and all major anions and AiQu_006 cations Atmospheric deposition of sulfur AiQu_002 Change in visibility deciviews AiQu_005 Deposition and accumulation of mercury in biota AiQu_004 Deposition of trace organics and metals AiQu_010 Loading chemical species in snowpacks AiQu_001 Loss of forest productivity AiQu_007 Nitrogen concentration in streams during spring snowmelt AiQu_009 Over-snow vehicles emissions and effects AiQu_281 Ozone exposure index--W126 AiQu_008 Vegetation chemistry AiQu_207 Aquatic Communities Aquatic Exotic species Exotic fish abundance AqCo_130 Exotic fish distribution patterns AqCo_131 Aquatic Pathogens/disease Fish pathogens and disease AqCo_133 Aquatic Species at risk Cutthroat trout responses to exotic predators AqCo_276 Native and exotic community structure, composition, stability AqCo_127 Native fish genetic integrity AqCo_126 Native fish spawning population vital rates AqCo_128 Aquatic Habitats Rivers and Streams Channel dimensions AqHa_123 In-stream habitat complexity and cover AqHa_125 Stream reach geomorphology AqHa_124 Climate Climate, Biotic and Abiotic Alpine/subalpine climatic conditions and micro-environment Clim_019 Basic climatological measurements Clim_020
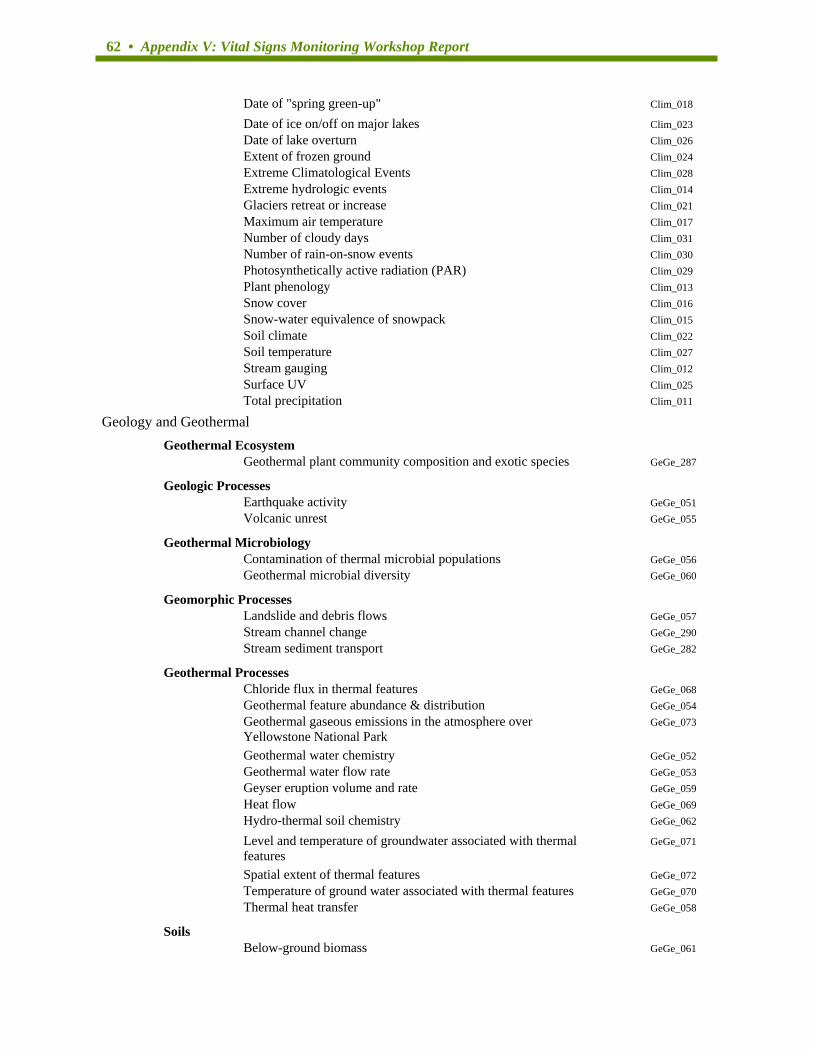
62 • Appendix V: Vital Signs Monitoring Workshop Report
Date of "spring green-up" Clim_018 Date of ice on/off on major lakes Clim_023 Date of lake overturn Clim_026 Extent of frozen ground Clim_024 Extreme Climatological Events Clim_028 Extreme hydrologic events Clim_014 Glaciers retreat or increase Clim_021 Maximum air temperature Clim_017 Number of cloudy days Clim_031 Number of rain-on-snow events Clim_030 Photosynthetically active radiation (PAR) Clim_029 Plant phenology Clim_013 Snow cover Clim_016 Snow-water equivalence of snowpack Clim_015 Soil climate Clim_022 Soil temperature Clim_027 Stream gauging Clim_012 Surface UV Clim_025 Total precipitation Clim_011 Geology and Geothermal Geothermal Ecosystem Geothermal plant community composition and exotic species GeGe_287 Geologic Processes Earthquake activity GeGe_051 Volcanic unrest GeGe_055 Geothermal Microbiology Contamination of thermal microbial populations GeGe_056 Geothermal microbial diversity GeGe_060 Geomorphic Processes Landslide and debris flows GeGe_057 Stream channel change GeGe_290 Stream sediment transport GeGe_282 Geothermal Processes Chloride flux in thermal features GeGe_068 Geothermal feature abundance & distribution GeGe_054 Geothermal gaseous emissions in the atmosphere over GeGe_073 Yellowstone National Park Geothermal water chemistry GeGe_052 Geothermal water flow rate GeGe_053 Geyser eruption volume and rate GeGe_059 Heat flow GeGe_069 Hydro-thermal soil chemistry GeGe_062 Level and temperature of groundwater associated with thermal GeGe_071 features Spatial extent of thermal features GeGe_072 Temperature of ground water associated with thermal features GeGe_070 Thermal heat transfer GeGe_058 Soils Below-ground biomass GeGe_061

Vital Signs Monitoring Plan • 63
Cryptobiotic crust integrity GeGe_066 Soil and sediment erosion GeGe_067 Soil biodiversity GeGe_065 Soil chemistry GeGe_063 Soil moisture/temperature/structure GeGe_293 Soil structure and stability GeGe_064 Human Activities Park Visitation Levels of backcountry day use HuAc_277 Levels of backcountry overnight use HuAc_085 Park infrastructure HuAc_089 Resource consumptive use and hydrologic modification HuAc_090 Resource violations HuAc_088 Visitor experience and satisfaction HuAc_082 Visitor use levels HuAc_087 Surrounding Environments Land use and land cover HuAc_081 Landscape and habitat fragmentation HuAc_080 Night sky pollution HuAc_083 Population census by area HuAc_086 Soundscapes HuAc_084 Invertebrates - Terrestrial and Native and Exotic Insects Critical habitat abundance, distribution and stability TeIn_074 Exotic insects TeIn_078 Forest/grassland/shrubland defoliators and consumers TeIn_250 Insect biomass TeIn_077 Insect herbivory TeIn_076 Insect species distribution TeIn_079 Native insect biodiversity and distribution TeIn_075 Selected insect species of concern TeIn_288 Terrestrial Vegetation Alpine Meadow and Timberline Ecosystems Alpine plant community characteristics TeVeg_208 Timberline elevation boundaries TeVeg_210 Timberline forest density and health TeVeg_209 Aspen Forest Ecosystems Aspen community composition and structure TeVeg_263 Aspen stand extent and distribution in landscape TeVeg_266 Browsing effects within aspen stands TeVeg_265 Dry Woodland Ecosystems Dry woodland community structure and composition TeVeg_268 Extent and distribution of woodlands TeVeg_269 Herbaceous Meadow and Grassland Grassland annual net primary productivity TeVeg_226 Grassland insect and vertebrate community structure TeVeg_229 Grassland nitrogen TeVeg_228 Grassland vegetation annual offtake TeVeg_227
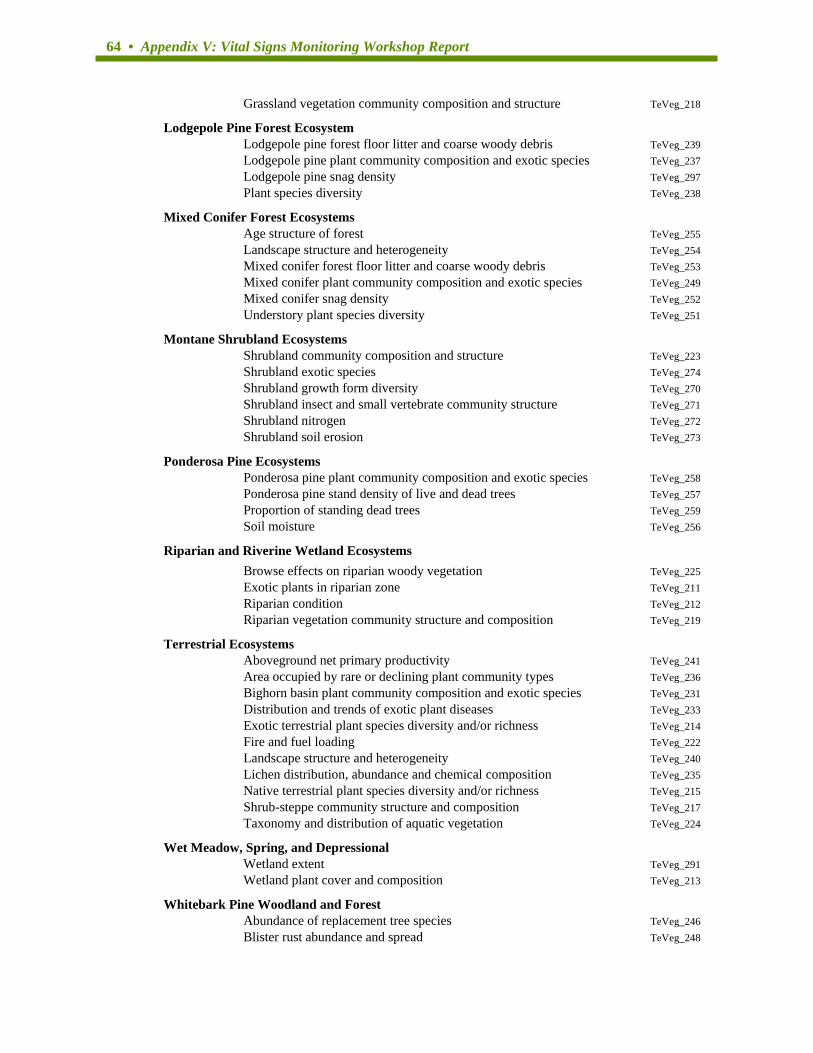
64 • Appendix V: Vital Signs Monitoring Workshop Report
Grassland vegetation community composition and structure TeVeg_218 Lodgepole Pine Forest Ecosystem Lodgepole pine forest floor litter and coarse woody debris TeVeg_239 Lodgepole pine plant community composition and exotic species TeVeg_237 Lodgepole pine snag density TeVeg_297 Plant species diversity TeVeg_238 Mixed Conifer Forest Ecosystems Age structure of forest TeVeg_255 Landscape structure and heterogeneity TeVeg_254 Mixed conifer forest floor litter and coarse woody debris TeVeg_253 Mixed conifer plant community composition and exotic species TeVeg_249 Mixed conifer snag density TeVeg_252 Understory plant species diversity TeVeg_251 Montane Shrubland Ecosystems Shrubland community composition and structure TeVeg_223 Shrubland exotic species TeVeg_274 Shrubland growth form diversity TeVeg_270 Shrubland insect and small vertebrate community structure TeVeg_271 Shrubland nitrogen TeVeg_272 Shrubland soil erosion TeVeg_273 Ponderosa Pine Ecosystems Ponderosa pine plant community composition and exotic species TeVeg_258 Ponderosa pine stand density of live and dead trees TeVeg_257 Proportion of standing dead trees TeVeg_259 Soil moisture TeVeg_256 Riparian and Riverine Wetland Ecosystems Browse effects on riparian woody vegetation TeVeg_225 Exotic plants in riparian zone TeVeg_211 Riparian condition TeVeg_212 Riparian vegetation community structure and composition TeVeg_219 Terrestrial Ecosystems Aboveground net primary productivity TeVeg_241 Area occupied by rare or declining plant community types TeVeg_236 Bighorn basin plant community composition and exotic species TeVeg_231 Distribution and trends of exotic plant diseases TeVeg_233 Exotic terrestrial plant species diversity and/or richness TeVeg_214 Fire and fuel loading TeVeg_222 Landscape structure and heterogeneity TeVeg_240 Lichen distribution, abundance and chemical composition TeVeg_235 Native terrestrial plant species diversity and/or richness TeVeg_215 Shrub-steppe community structure and composition TeVeg_217 Taxonomy and distribution of aquatic vegetation TeVeg_224 Wet Meadow, Spring, and Depressional Wetland extent TeVeg_291 Wetland plant cover and composition TeVeg_213 Whitebark Pine Woodland and Forest Abundance of replacement tree species TeVeg_246 Blister rust abundance and spread TeVeg_248
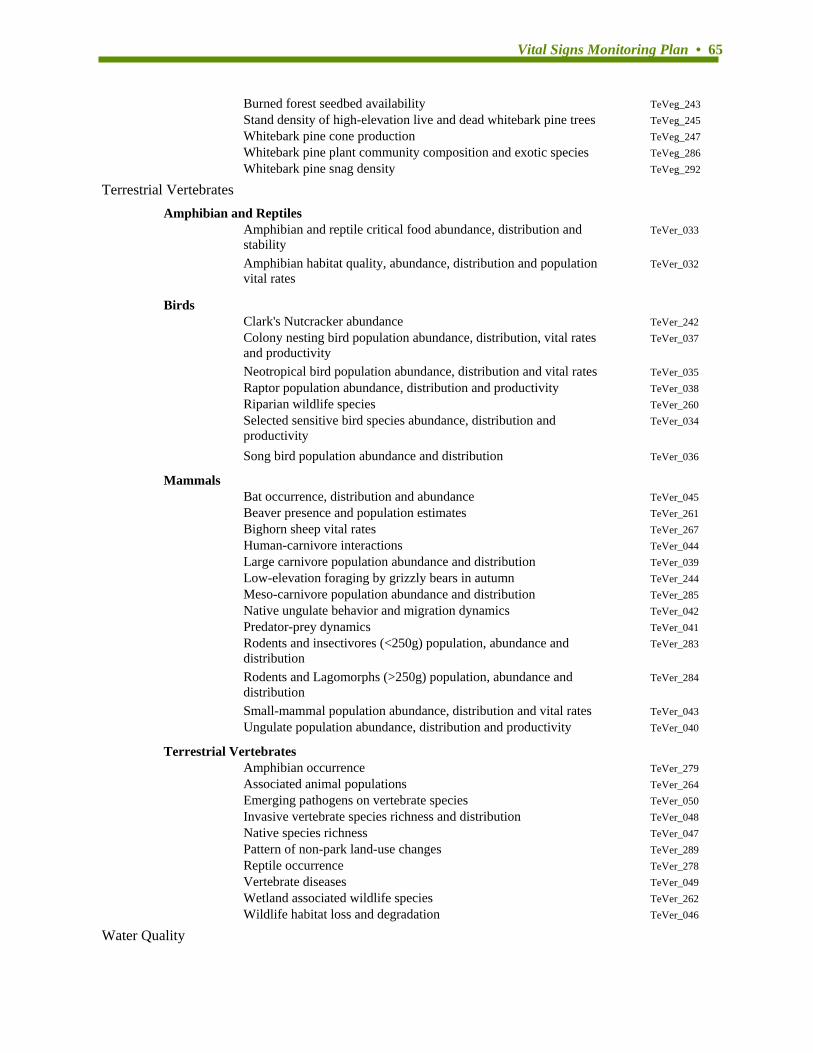
Vital Signs Monitoring Plan • 65
Burned forest seedbed availability TeVeg_243 Stand density of high-elevation live and dead whitebark pine trees TeVeg_245 Whitebark pine cone production TeVeg_247 Whitebark pine plant community composition and exotic species TeVeg_286 Whitebark pine snag density TeVeg_292 Terrestrial Vertebrates Amphibian and Reptiles Amphibian and reptile critical food abundance, distribution and TeVer_033 stability Amphibian habitat quality, abundance, distribution and population TeVer_032 vital rates
Birds Clark's Nutcracker abundance TeVer_242 Colony nesting bird population abundance, distribution, vital rates TeVer_037 and productivity Neotropical bird population abundance, distribution and vital rates TeVer_035 Raptor population abundance, distribution and productivity TeVer_038 Riparian wildlife species TeVer_260 Selected sensitive bird species abundance, distribution and TeVer_034 productivity Song bird population abundance and distribution TeVer_036 Mammals Bat occurrence, distribution and abundance TeVer_045 Beaver presence and population estimates TeVer_261 Bighorn sheep vital rates TeVer_267 Human-carnivore interactions TeVer_044 Large carnivore population abundance and distribution TeVer_039 Low-elevation foraging by grizzly bears in autumn TeVer_244 Meso-carnivore population abundance and distribution TeVer_285 Native ungulate behavior and migration dynamics TeVer_042 Predator-prey dynamics TeVer_041 Rodents and insectivores (<250g) population, abundance and TeVer_283 distribution Rodents and Lagomorphs (>250g) population, abundance and TeVer_284 distribution Small-mammal population abundance, distribution and vital rates TeVer_043 Ungulate population abundance, distribution and productivity TeVer_040 Terrestrial Vertebrates Amphibian occurrence TeVer_279 Associated animal populations TeVer_264 Emerging pathogens on vertebrate species TeVer_050 Invasive vertebrate species richness and distribution TeVer_048 Native species richness TeVer_047 Pattern of non-park land-use changes TeVer_289 Reptile occurrence TeVer_278 Vertebrate diseases TeVer_049 Wetland associated wildlife species TeVer_262 Wildlife habitat loss and degradation TeVer_046 Water Quality
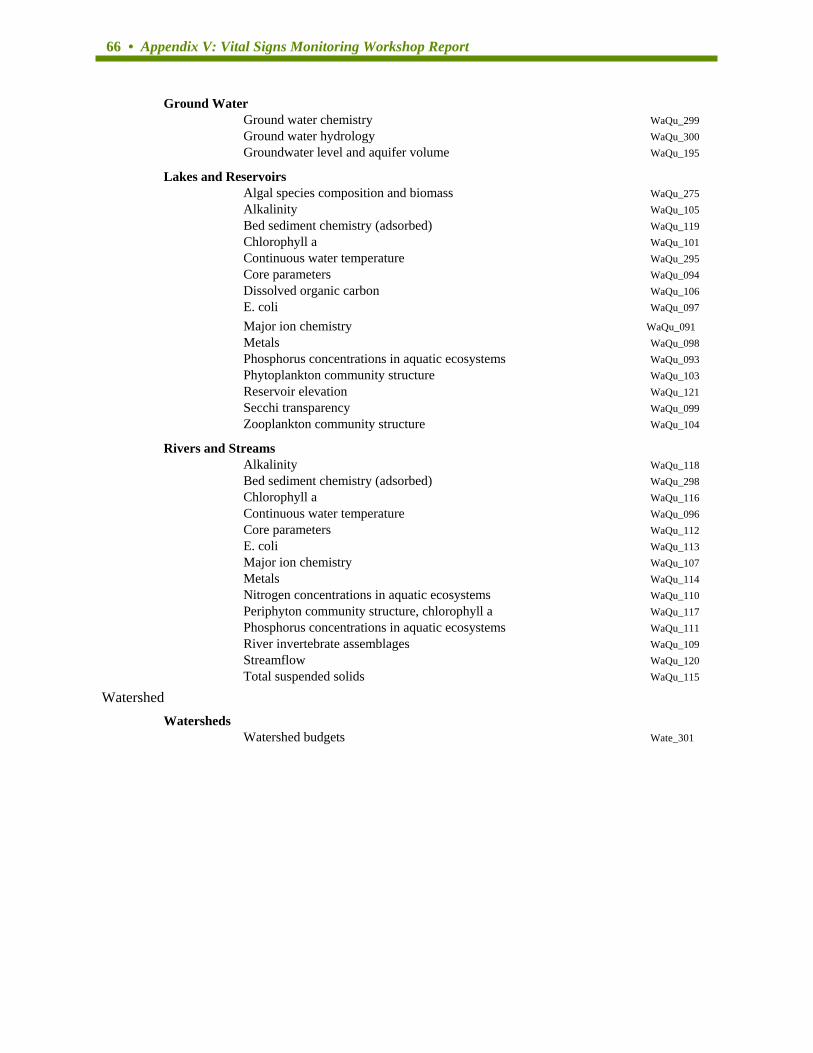
66 • Appendix V: Vital Signs Monitoring Workshop Report
Ground Water Ground water chemistry WaQu_299 Ground water hydrology WaQu_300 Groundwater level and aquifer volume WaQu_195 Lakes and Reservoirs Algal species composition and biomass WaQu_275 Alkalinity WaQu_105 Bed sediment chemistry (adsorbed) WaQu_119 Chlorophyll a WaQu_101 Continuous water temperature WaQu_295 Core parameters WaQu_094 Dissolved organic carbon WaQu_106 E. coli WaQu_097 Major ion chemistry WaQu_091 Metals WaQu_098 Phosphorus concentrations in aquatic ecosystems WaQu_093 Phytoplankton community structure WaQu_103 Reservoir elevation WaQu_121 Secchi transparency WaQu_099 Zooplankton community structure WaQu_104 Rivers and Streams Alkalinity WaQu_118 Bed sediment chemistry (adsorbed) WaQu_298 Chlorophyll a WaQu_116 Continuous water temperature WaQu_096 Core parameters WaQu_112 E. coli WaQu_113 Major ion chemistry WaQu_107 Metals WaQu_114 Nitrogen concentrations in aquatic ecosystems WaQu_110 Periphyton community structure, chlorophyll a WaQu_117 Phosphorus concentrations in aquatic ecosystems WaQu_111 River invertebrate assemblages WaQu_109 Streamflow WaQu_120 Total suspended solids WaQu_115 Watershed Watersheds Watershed budgets Wate_301
Vital Signs Monitoring Plan • 67
APPENDIX G-SELECTION CRITERIA EXPLANATIONS AND APPENDICES
ECOLOGICAL RELEVANCE Criterion #1 - The candidate vital sign has high ecological importance with a demonstrated linkage between the vital sign and the ecological structure or function that it is supposed to represent, based on a conceptual model and/or supporting ecological literature.
Often, the selection of a relevant indicator is obvious from the assessment question and from professional judgement. However, a conceptual model can be helpful to demonstrate and ensure an indicator's ecological relevance, particularly if the indicator measurement is a surrogate for measurement of the valued resource. It must be demonstrated that the proposed indicator is conceptually linked to the ecological function of concern. A straightforward link may require only a brief explanation. If the link is indirect or if the indicator itself is particularly complex, ecological relevance should be clarified with a description, or conceptual model. (Adapted from Jackson, L.E., J.C. Kurt and W.S. Fisher, eds. 2000. Evaluation guidelines for ecological indicators. EPA/620/R-99/05. U.S. E.P.A, Office of Research and Development, Research Triangle Park, NC. 107pp.)
Criterion #2 - The candidate vital sign provides relevant information that is applicable to multiple scales of ecological organization.
The term “multiple scales of ecological organization” refers to the hierarchical ecological structure including individuals, populations, communities, landscapes and ecosystems. Accordingly, information from one scale can sometimes provide insight relevant to other scales, thus increasing the applicability of the candidate vital sign if the information gathered from monitoring it can be useful at multiple scales of ecological organization. (Adapted from Dale, V.H. and S.C. Beyeler. Challenges in the development and use of ecological indicators. 2001. Ecological Indicators 1:3-10.)
RESPONSE VARIABILITY
Criterion #3 - The candidate vital sign responds to ecosystem stressors in a predictable manner with known statistical power.
Predictable manner refers to the lack of ambiguity in the response of the candidate vital sign to ecosystem stressors. The response should be clear and predictable even given gradual change in the stressor. In a best-case scenario, the candidate vital sign’s response is observable before the system is actually threatened. (Adapted from Dale, V.H. and S.C. Beyeler. Challenges in the development and use of ecological indicators. 2001. Ecological Indicators 1:3-10.) Statistical power refers to the ability of a candidate vital sign to have a low chance of Type I and II errors. If a change has occurred in an ecosystem, a vital sign will either detect the change or detect no change. If the vital sign detects a change when a real change has occurred, then no error has occurred. However, if the vital sign detects a change when no real change has occurred, then a false-positive,

68 • Appendix V: Vital Signs Monitoring Workshop Report
or Type I, error has been made. Making a false positive error is costly, monetarily speaking, because usually unnecessary action ensues. If change has occurred and the vital sign does not detect this change, then a missed-change, or Type II, error has occurred. Therefore, although action should be taken, most likely the change will go unnoticed. (Adapted from Booth, G.D. Monitoring data and the risks of management decisions. USDA Forest Service publication.)
No change has
taken place There has been a
real change
Vital sign detects change
False-positive
Error (Type I)
No Error
Vital sign detects no
change
No Error
Missed-change
Error (Type II)
Criterion #4 - The candidate vital sign is anticipatory and sensitive enough to stressors to provide an early warning of change.
In this case, sensitivity does not necessarily refer to a candidate vital sign that is responsive to any and all dramatic changes in the system; but, rather, those that react to subtle stressors in the system, giving early warning of potentially reduced system integrity. (Adapted from Dale, V.H. and S.C. Beyeler. Challenges in the development and use of ecological indicators. 2001. Ecological Indicators 1:3-10.)
Criterion #5 - The candidate vital sign has low natural variability and has high signal-to-noise ratio.
Signal-to-noise ratio refers to the measure of how the signal from the candidate vital sign compares with background noise. Noise is defined as the uncommon variance of the data. The strength of the signal is positively correlated with the quality of the candidate vital sign as an indicator of ecosystem health. Therefore, the higher the signal-to-noise ratio, the better the candidate vital sign is at predicting ecosystem changes. If the signal and noise are of equal strength, the signal borders on unreadable because the noise strongly competes with it. (Adapted from Cook, E.R. and L.A. Kairiukstis. Methods of dendrochronology: applications in the environmental sciences. 1990. Dordrecht, The Netherlands.)

Vital Signs Monitoring Plan • 69
MANAGEMENT RELEVANCE
Criterion #6 - The candidate vital sign is stated in specific park management goals, GPRA goals or Business Plan Standards.
Park Management Goals - The overall natural resource management goal of the National Park Service is as follows: The National Park Service will preserve the natural resources, processes, systems and values of units of the national park system in an unimpaired condition, to perpetuate their inherent integrity and to provide present and future generations with the opportunity to enjoy them. (Adapted from Management Policies 2001. National Park Service publication.) The key management-related provision stated in the National Park Service Organic Act of 1916 is: [The National Park Service] shall promote and regulate the use of the Federal areas known as national parks, monuments, and reservations hereinafter specified...by such means and measures as conform to the fundamental purpose of the said parks, monuments, and reservations, which purpose is to conserve the scenery and the natural and historic objects and the wild life therein and to provide for the enjoyment of the same in such manner and by such means as will leave them unimpaired for the enjoyment of future generations. (Adapted from Management Policies 2001. National Park Service publication.) **Please refer to specific park management goals for Grand Teton and Bighorn Canyon in Appendix A. GPRA Goals - The Government Performance and Results Act (GPRA) goals can be divided into four focal areas: 1) preserve park resources, 2) provide for the public enjoyment and visitor experience of parks, 3) strengthen and preserve natural and cultural resources and enhance recreational opportunities managed by partners and 4) ensure organizational effectiveness. (Adapted from Yellowstone National Park Business Plan Fiscal Year 2002.) **Please refer to specific GPRA goals in the appendix. Business Plan Standards - According to Yellowstone National Park’s Business Plan (Fiscal Year 2002), resource protection encompasses all activities related to the management, preservation and protection of the park’s cultural and natural resources. Activities include research, restoration efforts, species-specific management programs, wildland fire management, archives and collections management, and historic site protection and information integration activities. (Adapted from Yellowstone National Park Business Plan Fiscal Year 2002.) **Please refer to specific business plan standards for Yellowstone National Park in Appendix A.
70 • Appendix V: Vital Signs Monitoring Workshop Report
Criterion #7 - There is a demonstrated, direct application of candidate vital sign measurement data to current key management decisions, or for evaluating past management decisions.
Ultimately, an indicator is useful only if it can provide information to support a management decision or to quantify the success of past decisions. Policy makers and resource managers must be able to recognize the implications of indicator results for stewardship, regulation, or research. An indicator with practical application should display one or more of the following characteristics: responsiveness to a specific stressor, linkage to policy indicators, utility in cost-benefit assessments, limitations and boundaries of application, and public understanding and acceptance. Detailed consideration of an indicator's management utility may lead to a re-examination of its conceptual relevance and to a refinement of the original assessment question. (Adapted from Jackson, L.E., J.C. Kurt and W.S. Fisher, eds. 2000. Evaluation guidelines for ecological indicators. EPA/620/R-99/05. U.S. E.P.A, Office of Research and Development, Research Triangle Park, NC. 107pp. and Dale, V.H. and S.C. Beyeler. Challenges in the development and use of ecological indicators. 2001. Ecological Indicators 1:3-10.) **Please refer to the Threats and Management Issues table in Appendix A.
FEASIBILITY OF IMPLEMENTATION
Criterion #8 - The candidate vital sign’s cost of measurement is not prohibitive.
Cost is often the limiting factor in considering to implement an indicator. Estimates of all implementation costs should be evaluated. Cost evaluation should incorporate economy of scale, since cost per indicator or cost per sample may be considerably reduced when data are collected for multiple indicators at a given site. Costs of a pilot study or any other indicator development needs should be included if appropriate. The vital sign not only has to be relevant to monitoring but implementation also has to be feasible, practical and affordable. Sampling methods may include simple, low-tech or low-cost data collection methods, or more complex or expensive collection methods may be cost-effective, e.g. data collection every five years results in low annual costs. Consideration should be given to data collection methods, logistical requirements, data processing and information management, data quality, and costs in terms of time, money and personnel (Adapted from Jackson, L.E., J.C. Kurt and W.S. Fisher, eds. 2000. Evaluation guidelines for ecological indicators. EPA/620/R-99/05. U.S. E.P.A, Office of Research and Development, Research Triangle Park, NC. 107pp.).
Criterion #9 - Impacts of the candidate vital sign’s measurement meet NPS standards.
Sampling activities for indicator measurements should not significantly disturb a site. Evidence should be provided to ensure that measurements made during a single visit do not affect the same measurement at subsequent visits or, in the case of integrated sampling regimes, simultaneous measurements at the site. Also, sampling should not create an adverse impact on protected species, species of special concern, or protected habitats. Any impact due to data collection of a specific park resource on that resource or
Vital Signs Monitoring Plan • 71
on the surrounding environment can be considered impairment of a National Park Service natural resource or value if it impacts a resource or value whose conservation is:
• Necessary to fulfill specific purposes identified in the enabling legislation or proclamation of the park
• Key to the natural or cultural integrity of the park or to opportunities for enjoyment of the park
• Identified as a goal in the park’s general management plan or other relevant NPS planning documents.
However, an impact is less likely to be considered impairment if it is the unavoidable result of an action necessary to restore or conserve the integrity of a park natural resource or value. All proposals for natural resource use and measurement within a National Park are evaluated against the following four points:
• Consistency with applicable laws, Executive Orders, regulations and policies • Consistency with existing plans for public use and resource management • Actual and potential effects on park resources and values • Total costs to the Service, and whether the public interest will be served.
(Adapted from Yellowstone National Park Business Plan Fiscal Year 2002.) **Please refer to specific NPS standards in Appendix B.
Criterion #10 - The candidate vital sign is relatively easy to measure and has measurable results that are repeatable with different personnel.
A vital sign should be straightforward with methodology that is relatively easy to understand, and simple to apply. Measurement of the vital sign should not be dependent on a single expert, but rather should incorporate expert systems that can be implemented by adequately trained field staff. The logistical requirements should warrant practical implementation and the length of time required to collect, analyze and report the data of a vital sign should not be prohibitive. (Adapted from Jackson, L.E., J.C. Kurt and W.S. Fisher, eds. 2000. Evaluation guidelines for ecological indicators. EPA/620/R-99/05. U.S. E.P.A, Office of Research and Development, Research Triangle Park, NC. 107pp. and Dale, V.H. and S.C. Beyeler. Challenges in the development and use of ecological indicators. 2001. Ecological Indicators 1:3-10.)
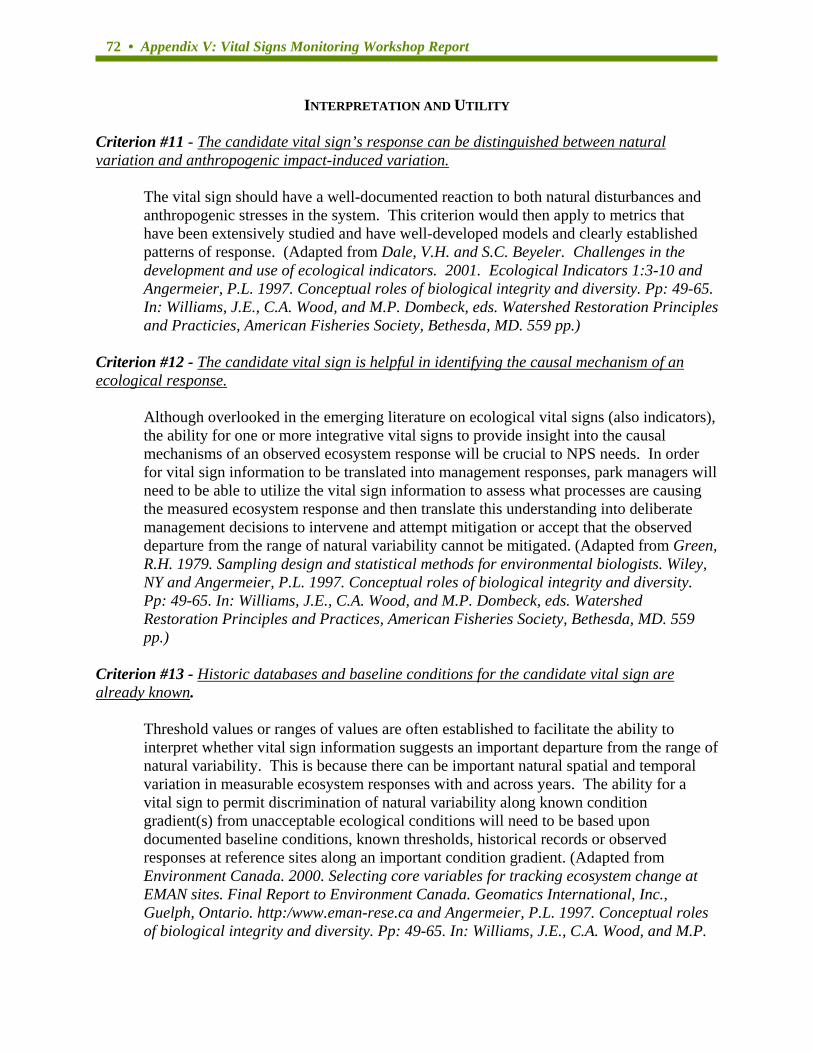
72 • Appendix V: Vital Signs Monitoring Workshop Report
INTERPRETATION AND UTILITY Criterion #11 - The candidate vital sign’s response can be distinguished between natural variation and anthropogenic impact-induced variation.
The vital sign should have a well-documented reaction to both natural disturbances and anthropogenic stresses in the system. This criterion would then apply to metrics that have been extensively studied and have well-developed models and clearly established patterns of response. (Adapted from Dale, V.H. and S.C. Beyeler. Challenges in the development and use of ecological indicators. 2001. Ecological Indicators 1:3-10 and Angermeier, P.L. 1997. Conceptual roles of biological integrity and diversity. Pp: 49-65. In: Williams, J.E., C.A. Wood, and M.P. Dombeck, eds. Watershed Restoration Principles and Practicies, American Fisheries Society, Bethesda, MD. 559 pp.)
Criterion #12 - The candidate vital sign is helpful in identifying the causal mechanism of an ecological response.
Although overlooked in the emerging literature on ecological vital signs (also indicators), the ability for one or more integrative vital signs to provide insight into the causal mechanisms of an observed ecosystem response will be crucial to NPS needs. In order for vital sign information to be translated into management responses, park managers will need to be able to utilize the vital sign information to assess what processes are causing the measured ecosystem response and then translate this understanding into deliberate management decisions to intervene and attempt mitigation or accept that the observed departure from the range of natural variability cannot be mitigated. (Adapted from Green, R.H. 1979. Sampling design and statistical methods for environmental biologists. Wiley, NY and Angermeier, P.L. 1997. Conceptual roles of biological integrity and diversity. Pp: 49-65. In: Williams, J.E., C.A. Wood, and M.P. Dombeck, eds. Watershed Restoration Principles and Practices, American Fisheries Society, Bethesda, MD. 559 pp.)
Criterion #13 - Historic databases and baseline conditions for the candidate vital sign are already known.
Threshold values or ranges of values are often established to facilitate the ability to interpret whether vital sign information suggests an important departure from the range of natural variability. This is because there can be important natural spatial and temporal variation in measurable ecosystem responses with and across years. The ability for a vital sign to permit discrimination of natural variability along known condition gradient(s) from unacceptable ecological conditions will need to be based upon documented baseline conditions, known thresholds, historical records or observed responses at reference sites along an important condition gradient. (Adapted from Environment Canada. 2000. Selecting core variables for tracking ecosystem change at EMAN sites. Final Report to Environment Canada. Geomatics International, Inc., Guelph, Ontario. http:/www.eman-rese.ca and Angermeier, P.L. 1997. Conceptual roles of biological integrity and diversity. Pp: 49-65. In: Williams, J.E., C.A. Wood, and M.P.

Vital Signs Monitoring Plan • 73
Dombeck, eds. Watershed Restoration Principles and Practices, American Fisheries Society, Bethesda, MD. 559 pp.)
APPENDIX A **This information appends the expanded selection criteria information.
MANAGEMENT RELEVANCE
Park Management Goals Specific park management goals are taken from each park’s General Management Plan or Master Plan. The specific management goals of Bighorn Canyon National Recreation Area, according to its General Management Plan, are:
The preservation of the natural environment for the enjoyment of the recreation area visitors and for the integrity of the ecosystems...
According to the Master Plan of Grand Teton National Park states the following purpose:
To protect the scenic and geological values of the Teton Range and Jackson Hole, and to perpetuate the Park’s indigenous plant and animal life. The Park will interpret these natural and scenic values, in association with the historical significance of the region, in a manner that preserves these resources for the benefit and d pleasure of present and future generations. (Adapted from Greater Yellowstone Network Phase I Report.)
GPRA Goals Each of the four GPRA goal focal areas can be separated into specific mission goals, as follows: Preserve park resources: 1) natural and cultural resources and associated values are protected, restored and maintained in good condition and managed within their broader ecosystem and cultural context; and 2) the National Park Service contributes to knowledge about natural and cultural resources and associated valued; management decisions about resources and visitors are based on adequate scholarly and scientific information. Provide for the public enjoyment and visitor experience of parks: 1) visitors safely enjoy and are satisfied with the availability, accessibility, diversity and quality of park facilities, services and appropriate recreational opportunities; and 2) park visitors and the general public understand and appreciate the preservation of parks and their resources for this and future generations. Strengthen and preserve natural and cultural resources and enhance recreational opportunities managed by partners: 1) natural and cultural resources are conserved through formal partnership programs; 2) through partnerships with other federal, state and local agencies and non-profit organizations, a nationwide system of parks, open space, rivers and trails provides educational, recreational and conservation benefits for the American people; and 3) assisted through federal
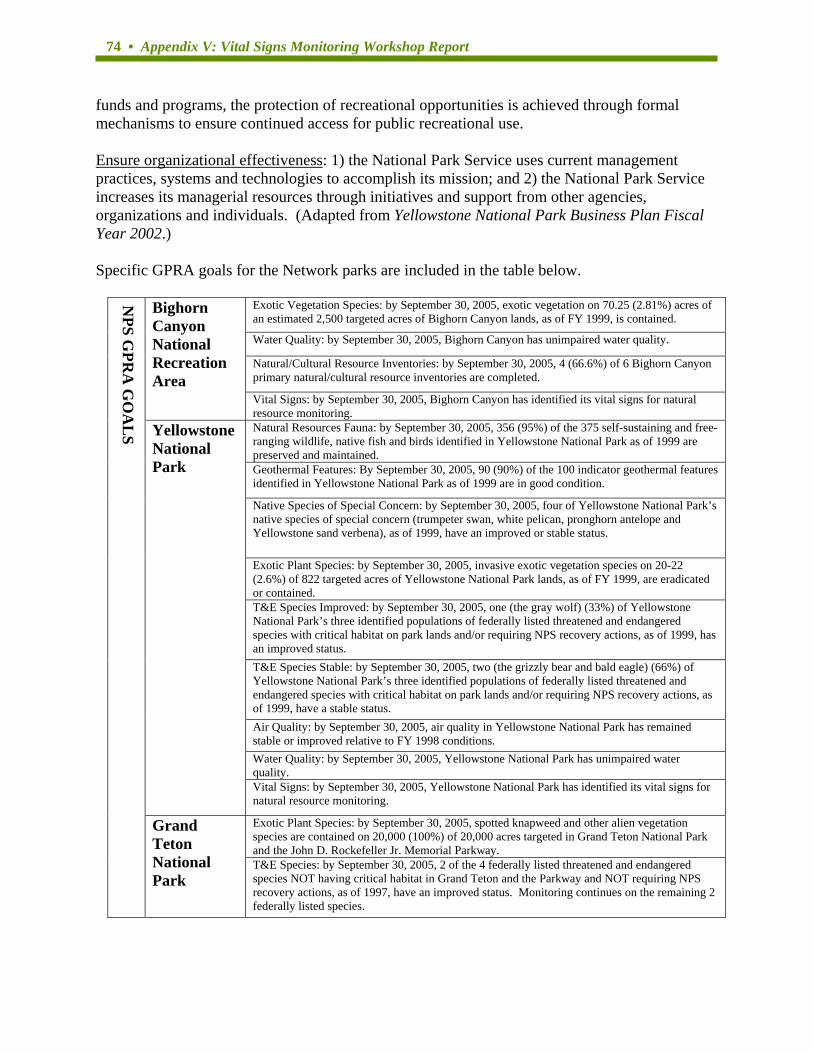
74 • Appendix V: Vital Signs Monitoring Workshop Report
funds and programs, the protection of recreational opportunities is achieved through formal mechanisms to ensure continued access for public recreational use. Ensure organizational effectiveness: 1) the National Park Service uses current management practices, systems and technologies to accomplish its mission; and 2) the National Park Service increases its managerial resources through initiatives and support from other agencies, organizations and individuals. (Adapted from Yellowstone National Park Business Plan Fiscal Year 2002.) Specific GPRA goals for the Network parks are included in the table below.
Exotic Vegetation Species: by September 30, 2005, exotic vegetation on 70.25 (2.81%) acres of an estimated 2,500 targeted acres of Bighorn Canyon lands, as of FY 1999, is contained.
Water Quality: by September 30, 2005, Bighorn Canyon has unimpaired water quality.
Natural/Cultural Resource Inventories: by September 30, 2005, 4 (66.6%) of 6 Bighorn Canyon primary natural/cultural resource inventories are completed.
BCNRA
ighorn anyon ational ecreation rea
Vital Signs: by September 30, 2005, Bighorn Canyon has identified its vital signs for natural resource monitoring. Natural Resources Fauna: by September 30, 2005, 356 (95%) of the 375 self-sustaining and free-ranging wildlife, native fish and birds identified in Yellowstone National Park as of 1999 are preserved and maintained. Geothermal Features: By September 30, 2005, 90 (90%) of the 100 indicator geothermal features identified in Yellowstone National Park as of 1999 are in good condition.
Native Species of Special Concern: by September 30, 2005, four of Yellowstone National Park’s native species of special concern (trumpeter swan, white pelican, pronghorn antelope and Yellowstone sand verbena), as of 1999, have an improved or stable status.
Exotic Plant Species: by September 30, 2005, invasive exotic vegetation species on 20-22 (2.6%) of 822 targeted acres of Yellowstone National Park lands, as of FY 1999, are eradicated or contained. T&E Species Improved: by September 30, 2005, one (the gray wolf) (33%) of Yellowstone National Park’s three identified populations of federally listed threatened and endangered species with critical habitat on park lands and/or requiring NPS recovery actions, as of 1999, has an improved status. T&E Species Stable: by September 30, 2005, two (the grizzly bear and bald eagle) (66%) of Yellowstone National Park’s three identified populations of federally listed threatened and endangered species with critical habitat on park lands and/or requiring NPS recovery actions, as of 1999, have a stable status. Air Quality: by September 30, 2005, air quality in Yellowstone National Park has remained stable or improved relative to FY 1998 conditions. Water Quality: by September 30, 2005, Yellowstone National Park has unimpaired water quality.
YN
ellowstone ational
Park
Vital Signs: by September 30, 2005, Yellowstone National Park has identified its vital signs for natural resource monitoring.
Exotic Plant Species: by September 30, 2005, spotted knapweed and other alien vegetation species are contained on 20,000 (100%) of 20,000 acres targeted in Grand Teton National Park and the John D. Rockefeller Jr. Memorial Parkway.
NPS G
PRA
GO
AL
S
Grand Teton National Park
T&E Species: by September 30, 2005, 2 of the 4 federally listed threatened and endangered species NOT having critical habitat in Grand Teton and the Parkway and NOT requiring NPS recovery actions, as of 1997, have an improved status. Monitoring continues on the remaining 2 federally listed species.
Vital Signs Monitoring Plan • 75
Native Species of Species Concern: by September 30, 2005, 1 of 2 (50%) of Grand Teton National Park and Parkway populations of plant and/or animal species of special concern (e.g. state-listed threatened and endangered species, endemic or indicator species, or native species classified as pests) are at scientifically acceptable levels.
Air Quality: by September 30, 2005, air quality in Grand Teton National Park has remained stable or improved relative to FY 1998 conditions.
Water Quality: by September 30, 2005, Grand Teton National Park and Parkway continue to have unimpaired water quality.
Wildlife Research and Monitoring: by September 30, 2005, 9 of 9 (100%) of Grand Teton National Park and Parkway species of concern will continue to be monitored to provide sufficient information to assist in management decisions. Resource Inventories: by September 30, 2005, 50% of the available natural resource data sets for Grand Teton National Park will be collected and evaluated.
Vital Signs: by September 30, 2005, Grand Teton National Park has identified its vital signs for natural resource monitoring.
(Table adapted from Strategic Plan for Grand Teton National Park and John D. Rockefeller Jr. Memorial Parkway October 1, 2001- September 30, 2005. Strategic Plans. 2001. <http://im.den.nps.gov/Documents/GpraPlans/GRTE%2Edoc> (3 Apr. 2003); The Strategic Plan for Yellowstone National Park 2001-2005. Strategic Plans. 2000. <http://im.den.nps.gov/Documents/GpraPlans/YELL%2Epdf> (3 Apr. 2003); The Strategic Plan for Bighorn Canyon National Recreation Area 2001-2005. Strategic Plans. 2001. <http://im.den.nps.gov/Documents/GpraPlans/BICA%2Epdf> (3 Apr. 2003)) Business Plan Standards The following aspects of Yellowstone’s natural resources are included in the Natural Resource Protection section of Yellowstone National Park’s Business Plan:
• Air, Soils and Geology-including the monitoring of geothermal features, weather, air quality, river gauging stations and volcanic and earthquake unrest
• Backcountry and Wilderness Management-including 300 remote sites and 1,000 miles of trails
• Bear Management-including the reduction of bear-human conflicts and the monitoring of bear populations and ecology
• Bison Management-including the Interagency Bison Management Plan (a brucellosis transmission risk management strategy relying on strategic hazing and capture and removal techniques) and vaccination of bison calves and yearlings
• Elk and Other Ungulate Management-including monitoring of elk, pronghorn antelope, bighorn sheep, mountain goats, moose and whitetail and mule deer populations and ecology
• Fisheries and Aquatic Resources-including the control of invasive exotic species (e.g. lake trout, whirling disease, New Zealand mud snails) and the management of consumptive use through fishing permits and regulations
• Natural Resource Protection-including the protection of resources from human-caused threats and the protection of humans from wildlife, geothermal and other natural threats

76 • Appendix V: Vital Signs Monitoring Workshop Report
• Natural Resource Research, Publications and Events-including the creation of a resource management-based research program that will benefit residential education programs and produce publications for various audiences
• Other Wildlife Management-including the management of birds, reptiles, amphibians, invertebrates, small mammals and mid-sized carnivores (e.g. Canada lynx, cougars, wolverines) and the Integrated Pest Management program
• Vegetation Management-including wetlands mapping and preservation, invasive exotic species control, rare vascular plant documentation, hazard tree removal and vegetation ecology studies
• Wildland Fire-including the encouragement of natural fires except when they threaten irreplaceable historic structures and sharing fire management resources with surrounding National Forest land
• Wolf Management-including monitoring wolves and their impacts on the ecosystem Additionally, included in the Yellowstone Business Plan is the vision of the park, which encompasses the following areas:
• Public enjoyment and visitor experience • Resource preservation • Efficiency and effectiveness • Safety
(Adapted from Yellowstone National Park Business Plan Fiscal Year 2002.)
Vital Signs Monitoring Plan • 77
APPENDIX B
Feasibility of Implementation
National Park Service Standards For example, the following uses of National Park Service land are restricted and require special prior approval:
• Off-road vehicle use (Executive Order 11644) • Aircraft over flights (Director’s Order 47) • Telecommunication antenna sites (Director’s Order 53) • Consumptive uses (i.e. collecting natural products) are only allowed when they are:
o Specifically authorized by federal law or treaty rights o Specifically authorized pursuant to other existing rights o Some pre-specified grazing activities o Traditional visitor activities that are authorized in accordance with NPS
general regulations. (Adapted from Management Policies 2001. National Park Service publication.) These additional conditions are placed on research permits obtained for Yellowstone National Park:
• All equipment left in the field including plot markers must be specifically authorized in advance. If you are authorized to place plot markers in Yellowstone, they must be eight-penny nails with an optional washer
• All VHF and GPS collars on wildlife must be camouflaged to blend in with the animal. The antennas on the collars must also be as invisible as possible. All collars must be removed at the completion of the study by either blow-off capabilities or cotton (rot-away) spacers
• Specific authorization must be obtained in advance before using chemicals or hazardous materials
• A research permit does not authorize you to enter closed or restricted areas in Yellowstone. Examples of restricted areas include most service roads, bear management areas, some thermal areas, some bird nesting areas, and wolf den sites, and trout spawning areas
• Cultural resources must not be adversely impacted by your research activities. Any ground disturbances must be specifically authorized in advance
• If your research requires flying in the park, you must request authorization in advance. You must also comply with FAA and Yellowstone National Park flight regulations
• The Permittee agrees to notify the Superintendent of Yellowstone National Park of every subject discovery or invention that relates in any respect to research results derived from use of any research specimens or other materials collected from Yellowstone National Park, or that may be patentable or otherwise protected under the intellectual property (IP) laws of the United States or other jurisdiction
78 • Appendix V: Vital Signs Monitoring Workshop Report
• Travel within the park is restricted to only those methods that are available to the general public unless otherwise specified in additional stipulations associated with this permit.
(Adapted from Yellowstone National Park Permit Conditions 2003.) The following conditions apply to specimen collection in Yellowstone National Park: • Collection of archeological materials without a valid Federal Archeology Permit is prohibited. • Collection of federally listed threatened or endangered species without a valid U.S. Fish and
Wildlife Service endangered species permit is prohibited. • Collection methods shall not attract undue attention or cause unapproved damage, depletion, or
disturbance to the environment and other park resources, such as historic sites. • New specimens must be reported to the NPS annually or more frequently if required by the park
issuing the permit. Minimum information for annual reporting includes specimen classification, number of specimens collected, location collected, specimen status (e.g., herbarium sheet, preserved in alcohol/formalin, tanned and mounted, dried and boxed, etc.), and current location.
• Collected specimens that are not consumed in analysis or discarded after scientific analysis remain federal property. The NPS reserves the right to designate the repositories of all specimens removed from the park and to approve or restrict reassignment of specimens from one repository to another. Because specimens are Federal property, they shall not be destroyed or discarded without prior NPS authorization.
• Each specimen (or groups of specimens labeled as a group) that is retained permanently must bear NPS labels and must be accessioned and cataloged in the NPS National Catalog. Unless exempted by additional park-specific stipulations, the permittee will complete the labels and catalog records and will provide accession information. It is the permittee’s responsibility to contact the park for cataloging instructions and specimen labels as well as instructions on repository designation for the specimens.
• Collected specimens may be used for scientific or educational purposes only, and shall be dedicated to public benefit and be accessible to the public in accordance with NPS policies and procedures.
• Any specimens collected under this permit, any components of any specimens (including but not limited to natural organisms, enzymes or other bioactive molecules, genetic materials, or seeds), and research results derived from collected specimens are to be used for scientific or educational purposes only, and may not be used for commercial or other revenue-generating purposes unless the permittee has entered into a Cooperative Research And Development Agreement (CRADA) or other approved benefit-sharing agreement with the NPS. The sale of collected research specimens or other unauthorized transfers to third parties is prohibited. Furthermore, if the permittee sells or otherwise transfers collected specimens, any components thereof, or any products or research results developed from such specimens or their components without a CRADA or other approved benefit-sharing agreement with NPS, permittee will pay the NPS a royalty rate of twenty percent (20%) of gross revenue from such sales or other revenues. In addition to such royalty, the NPS may seek other damages to which the NPS may be entitled including but not limited to injunctive relief against the permittee.

Vital Signs Monitoring Plan • 79
(Adapted from General Conditions for Scientific Research and Collection Permit. Department of the Interior.)
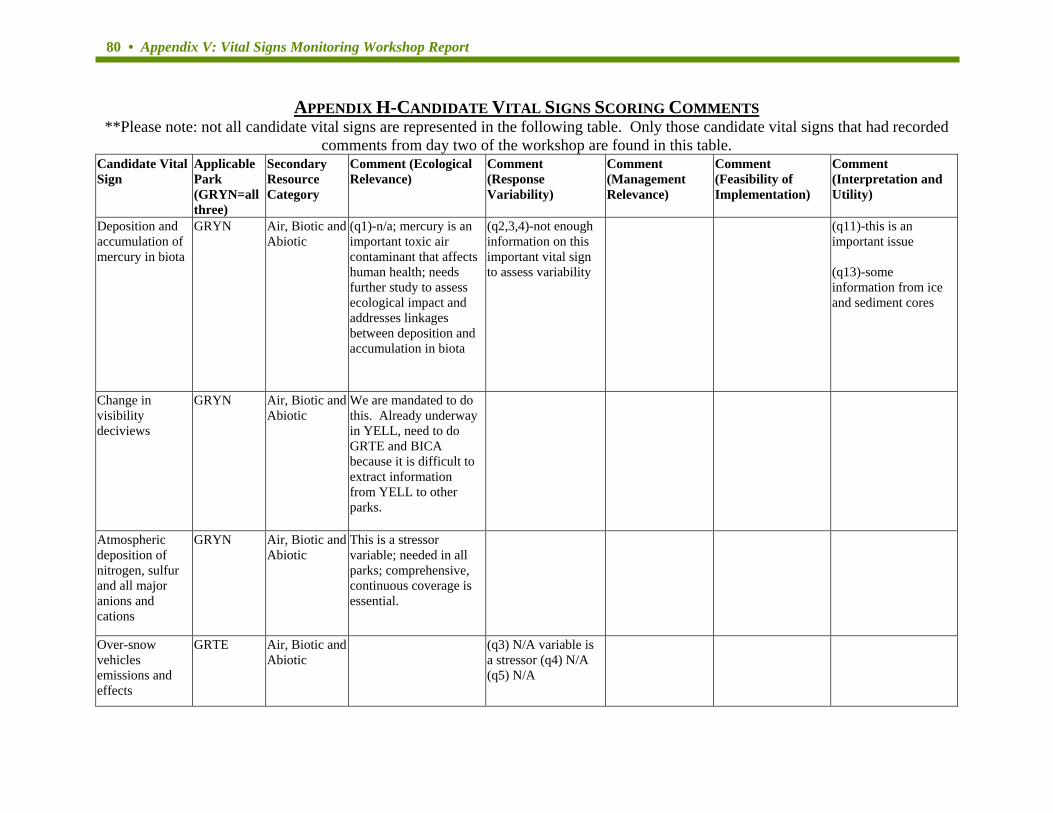
80 • Appendix V: Vital Signs Monitoring Workshop Report
APPENDIX H-CANDIDATE VITAL SIGNS SCORING COMMENTS **Please note: not all candidate vital signs are represented in the following table. Only those candidate vital signs that had recorded
comments from day two of the workshop are found in this table. Candidate Vital Sign
Applicable Park (GRYN=all three)
Secondary Resource Category
Comment (Ecological Relevance)
Comment (Response Variability)
Comment (Management Relevance)
Comment (Feasibility of Implementation)
Comment (Interpretation and Utility)
Deposition and accumulation of mercury in biota
GRYN Air, Biotic and Abiotic
(q1)-n/a; mercury is an important toxic air contaminant that affects human health; needs further study to assess ecological impact and addresses linkages between deposition and accumulation in biota
(q2,3,4)-not enough information on this important vital sign to assess variability
(q11)-this is an important issue (q13)-some information from ice and sediment cores
Change in visibility deciviews
GRYN Air, Biotic and Abiotic
We are mandated to do this. Already underway in YELL, need to do GRTE and BICA because it is difficult to extract information from YELL to other parks.
Atmospheric deposition of nitrogen, sulfur and all major anions and cations
GRYN Air, Biotic and Abiotic
This is a stressor variable; needed in all parks; comprehensive, continuous coverage is essential.
Over-snow vehicles emissions and effects
GRTE Air, Biotic and Abiotic
(q3) N/A variable is a stressor (q4) N/A (q5) N/A
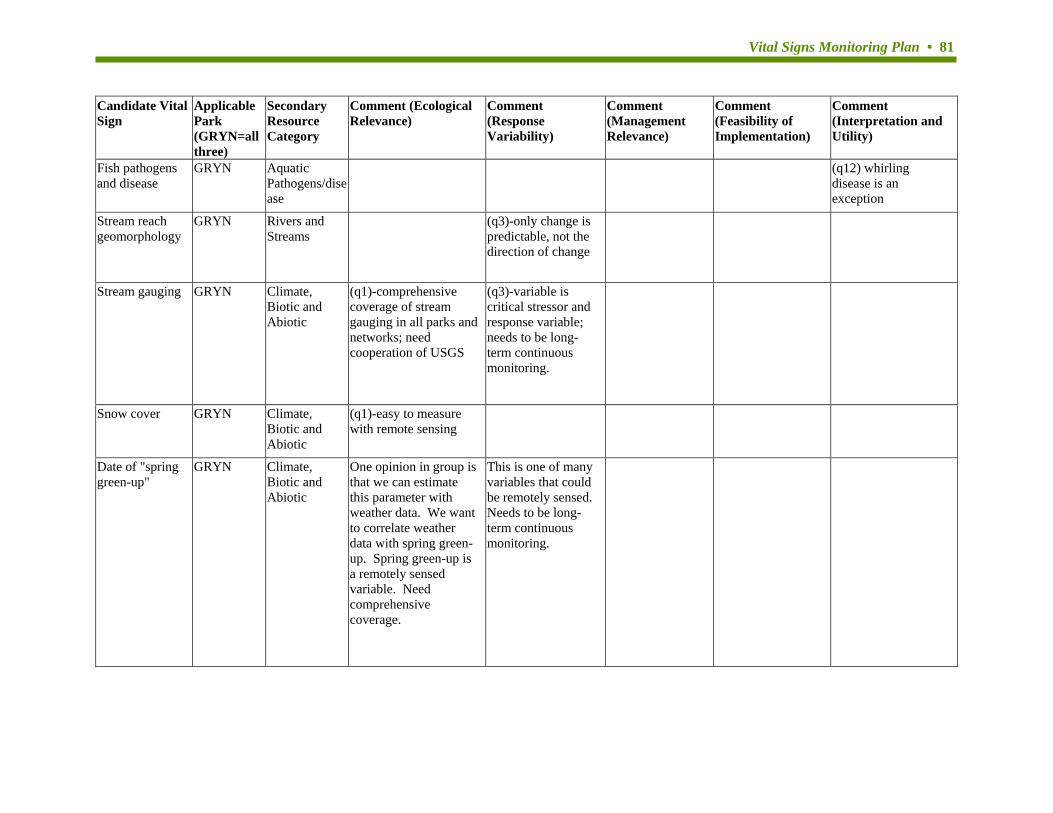
Vital Signs Monitoring Plan • 81
Candidate Vital Sign
Applicable Park (GRYN=all three)
Secondary Resource Category
Comment (Ecological Relevance)
Comment (Response Variability)
Comment (Management Relevance)
Comment (Feasibility of Implementation)
Comment (Interpretation and Utility)
Fish pathogens and disease
GRYN AquaticPathogens/disease
(q12) whirling disease is an exception
Stream reach geomorphology
GRYN Rivers andStreams
(q3)-only change is predictable, not the direction of change
Stream gauging GRYN Climate, Biotic and Abiotic
(q1)-comprehensive coverage of stream gauging in all parks and networks; need cooperation of USGS
(q3)-variable is critical stressor and response variable; needs to be long-term continuous monitoring.
Snow cover GRYN Climate, Biotic and Abiotic
(q1)-easy to measure with remote sensing
Date of "spring green-up"
GRYN Climate,Biotic and Abiotic
One opinion in group is that we can estimate this parameter with weather data. We want to correlate weather data with spring green-up. Spring green-up is a remotely sensed variable. Need comprehensive coverage.
This is one of many variables that could be remotely sensed. Needs to be long-term continuous monitoring.
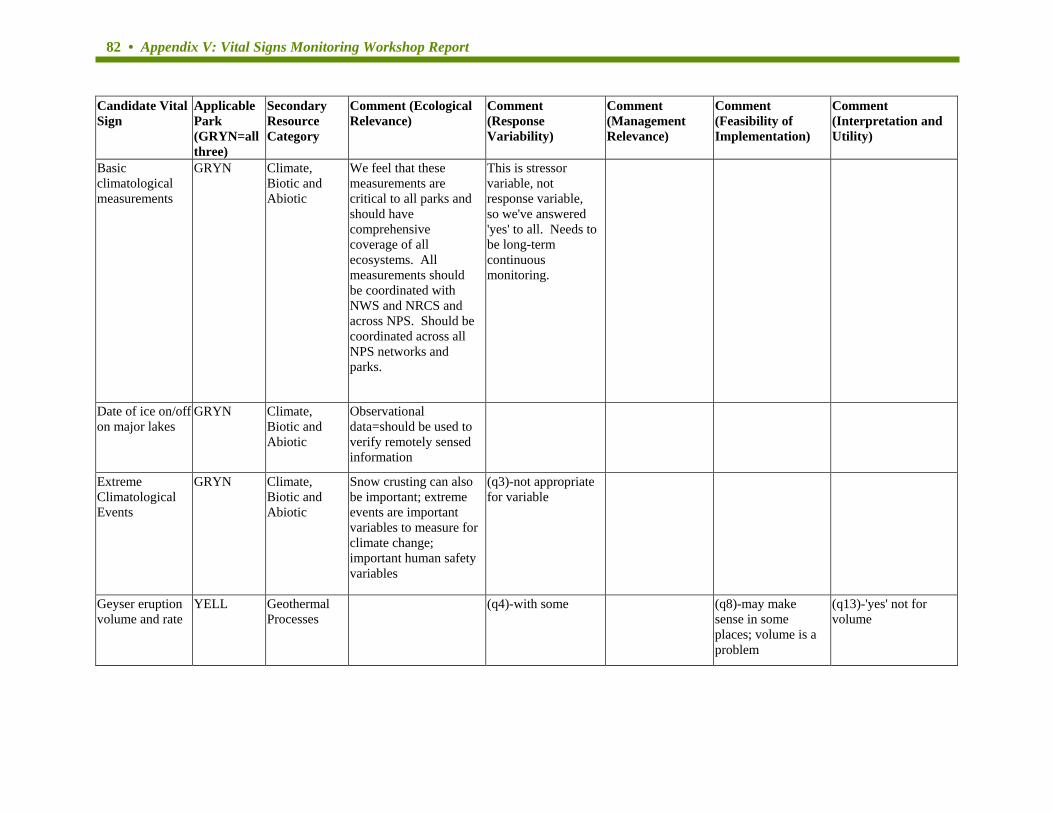
82 • Appendix V: Vital Signs Monitoring Workshop Report
Candidate Vital Sign
Applicable Park (GRYN=all three)
Secondary Resource Category
Comment (Ecological Relevance)
Comment (Response Variability)
Comment (Management Relevance)
Comment (Feasibility of Implementation)
Comment (Interpretation and Utility)
Basic climatological measurements
GRYN Climate,Biotic and Abiotic
We feel that these measurements are critical to all parks and should have comprehensive coverage of all ecosystems. All measurements should be coordinated with NWS and NRCS and across NPS. Should be coordinated across all NPS networks and parks.
This is stressor variable, not response variable, so we've answered 'yes' to all. Needs to be long-term continuous monitoring.
Date of ice on/off GRYNon major lakes
Climate,Biotic and Abiotic
Observational data=should be used to verify remotely sensed information
Extreme Climatological Events
GRYN Climate,Biotic and Abiotic
Snow crusting can also be important; extreme events are important variables to measure for climate change; important human safety variables
(q3)-not appropriate for variable
Geyser eruption volume and rate
YELL GeothermalProcesses
(q4)-with some (q8)-may make sense in some places; volume is a problem
(q13)-'yes' not for volume
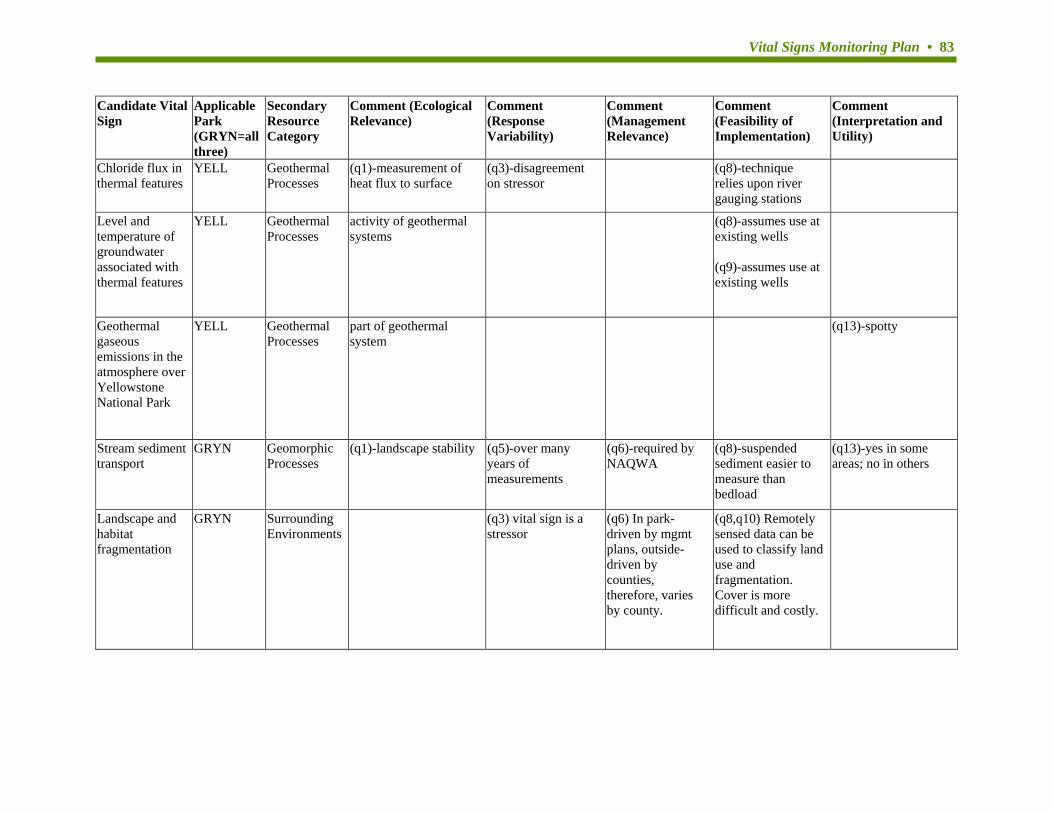
Vital Signs Monitoring Plan • 83
Candidate Vital Sign
Applicable Park (GRYN=all three)
Secondary Resource Category
Comment (Ecological Relevance)
Comment (Response Variability)
Comment (Management Relevance)
Comment (Feasibility of Implementation)
Comment (Interpretation and Utility)
Chloride flux in thermal features
YELL GeothermalProcesses
(q1)-measurement of heat flux to surface
(q3)-disagreement on stressor
(q8)-technique relies upon river gauging stations
Level and temperature of groundwater associated with thermal features
YELL GeothermalProcesses
activity of geothermal systems
(q8)-assumes use at existing wells (q9)-assumes use at existing wells
Geothermal gaseous emissions in the atmosphere over Yellowstone National Park
YELL GeothermalProcesses
part of geothermal system
(q13)-spotty
Stream sediment transport
GRYN GeomorphicProcesses
(q1)-landscape stability (q5)-over many years of measurements
(q6)-required by NAQWA
(q8)-suspended sediment easier to measure than bedload
(q13)-yes in some areas; no in others
Landscape and habitat fragmentation
GRYN SurroundingEnvironments
(q3) vital sign is a stressor
(q6) In park- driven by mgmt plans, outside- driven by counties, therefore, varies by county.
(q8,q10) Remotely sensed data can be used to classify land use and fragmentation. Cover is more difficult and costly.
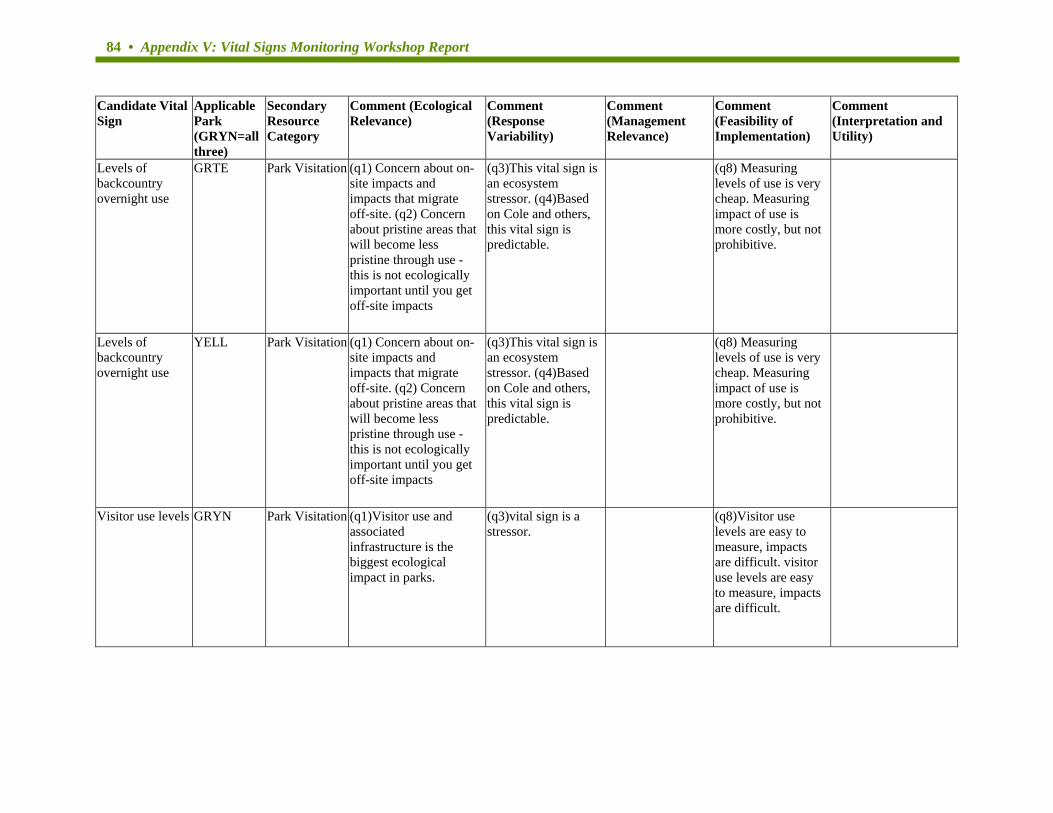
84 • Appendix V: Vital Signs Monitoring Workshop Report
Candidate Vital Sign
Applicable Park (GRYN=all three)
Secondary Resource Category
Comment (Ecological Relevance)
Comment (Response Variability)
Comment (Management Relevance)
Comment (Feasibility of Implementation)
Comment (Interpretation and Utility)
Levels of backcountry overnight use
GRTE Park Visitation (q1) Concern about on-site impacts and impacts that migrate off-site. (q2) Concern about pristine areas that will become less pristine through use - this is not ecologically important until you get off-site impacts
(q3)This vital sign is an ecosystem stressor. (q4)Based on Cole and others, this vital sign is predictable.
(q8) Measuring levels of use is very cheap. Measuring impact of use is more costly, but not prohibitive.
Levels of backcountry overnight use
YELL Park Visitation (q1) Concern about on-site impacts and impacts that migrate off-site. (q2) Concern about pristine areas that will become less pristine through use - this is not ecologically important until you get off-site impacts
(q3)This vital sign is an ecosystem stressor. (q4)Based on Cole and others, this vital sign is predictable.
(q8) Measuring levels of use is very cheap. Measuring impact of use is more costly, but not prohibitive.
Visitor use levels GRYN Park Visitation (q1)Visitor use and associated infrastructure is the biggest ecological impact in parks.
(q3)vital sign is a stressor.
(q8)Visitor use levels are easy to measure, impacts are difficult. visitor use levels are easy to measure, impacts are difficult.
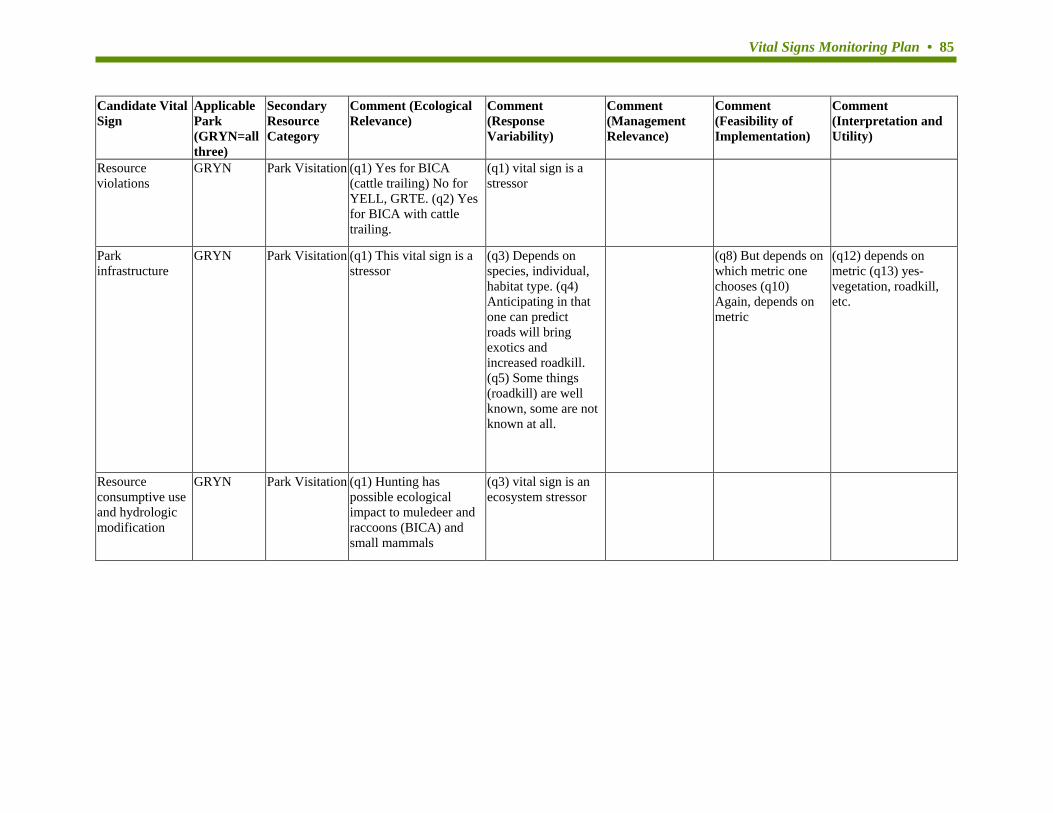
Vital Signs Monitoring Plan • 85
Candidate Vital Sign
Applicable Park (GRYN=all three)
Secondary Resource Category
Comment (Ecological Relevance)
Comment (Response Variability)
Comment (Management Relevance)
Comment (Feasibility of Implementation)
Comment (Interpretation and Utility)
Resource violations
GRYN Park Visitation (q1) Yes for BICA (cattle trailing) No for YELL, GRTE. (q2) Yes for BICA with cattle trailing.
(q1) vital sign is a stressor
Park infrastructure
GRYN Park Visitation (q1) This vital sign is a stressor
(q3) Depends on species, individual, habitat type. (q4) Anticipating in that one can predict roads will bring exotics and increased roadkill. (q5) Some things (roadkill) are well known, some are not known at all.
(q8) But depends on which metric one chooses (q10) Again, depends on metric
(q12) depends on metric (q13) yes- vegetation, roadkill, etc.
Resource consumptive use and hydrologic modification
GRYN Park Visitation (q1) Hunting has possible ecological impact to muledeer and raccoons (BICA) and small mammals
(q3) vital sign is an ecosystem stressor
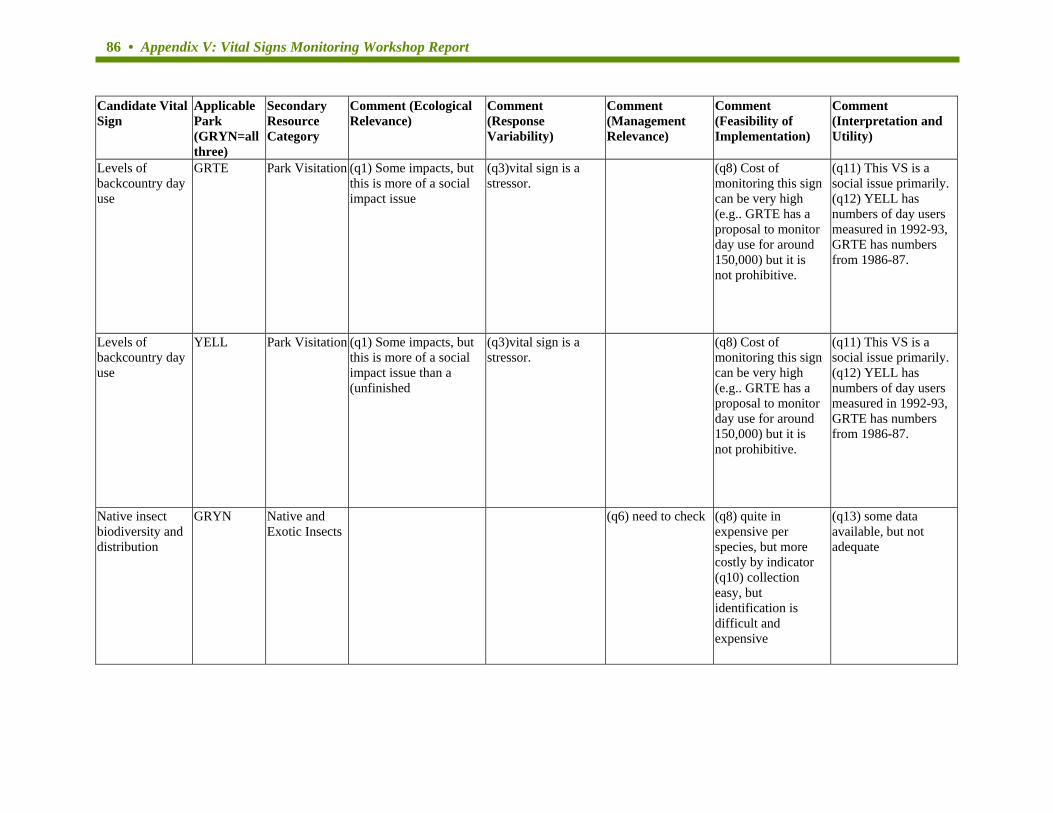
86 • Appendix V: Vital Signs Monitoring Workshop Report
Candidate Vital Sign
Applicable Park (GRYN=all three)
Secondary Resource Category
Comment (Ecological Relevance)
Comment (Response Variability)
Comment (Management Relevance)
Comment (Feasibility of Implementation)
Comment (Interpretation and Utility)
Levels of backcountry day use
GRTE Park Visitation (q1) Some impacts, but this is more of a social impact issue
(q3)vital sign is a stressor.
(q8) Cost of monitoring this sign can be very high (e.g.. GRTE has a proposal to monitor day use for around 150,000) but it is not prohibitive.
(q11) This VS is a social issue primarily. (q12) YELL has numbers of day users measured in 1992-93, GRTE has numbers from 1986-87.
Levels of backcountry day use
YELL Park Visitation (q1) Some impacts, but this is more of a social impact issue than a (unfinished
(q3)vital sign is a stressor.
(q8) Cost of monitoring this sign can be very high (e.g.. GRTE has a proposal to monitor day use for around 150,000) but it is not prohibitive.
(q11) This VS is a social issue primarily. (q12) YELL has numbers of day users measured in 1992-93, GRTE has numbers from 1986-87.
Native insect biodiversity and distribution
GRYN Native andExotic Insects
(q6) need to check (q8) quite in expensive per species, but more costly by indicator (q10) collection easy, but identification is difficult and expensive
(q13) some data available, but not adequate
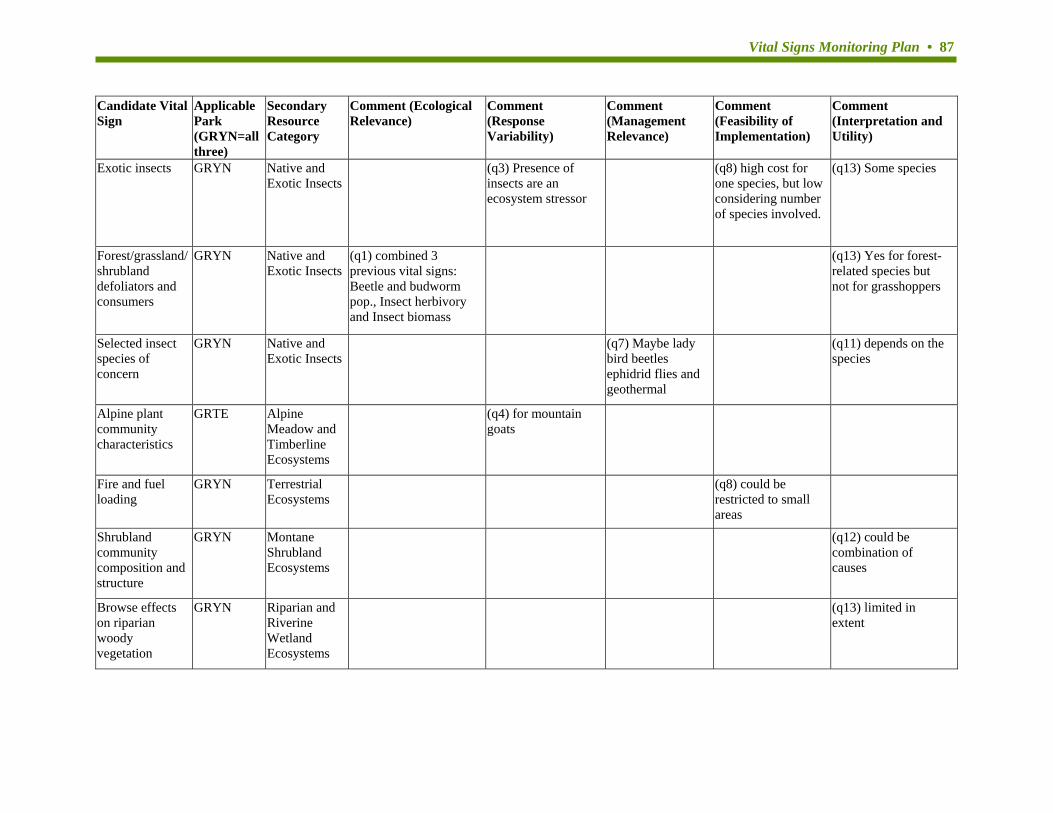
Vital Signs Monitoring Plan • 87
Candidate Vital Sign
Applicable Park (GRYN=all three)
Secondary Resource Category
Comment (Ecological Relevance)
Comment (Response Variability)
Comment (Management Relevance)
Comment (Feasibility of Implementation)
Comment (Interpretation and Utility)
Exotic insects GRYN Native and Exotic Insects
(q3) Presence of insects are an ecosystem stressor
(q8) high cost for one species, but low considering number of species involved.
(q13) Some species
Forest/grassland/shrubland defoliators and consumers
GRYN Native andExotic Insects
(q1) combined 3 previous vital signs: Beetle and budworm pop., Insect herbivory and Insect biomass
(q13) Yes for forest-related species but not for grasshoppers
Selected insect species of concern
GRYN Native andExotic Insects
(q7) Maybe lady bird beetles ephidrid flies and geothermal
(q11) depends on the species
Alpine plant community characteristics
GRTE AlpineMeadow and Timberline Ecosystems
(q4) for mountain goats
Fire and fuel loading
GRYN TerrestrialEcosystems
(q8) could be restricted to small areas
Shrubland community composition and structure
GRYN MontaneShrubland Ecosystems
(q12) could be combination of causes
Browse effects on riparian woody vegetation
GRYN Riparian andRiverine Wetland Ecosystems
(q13) limited in extent
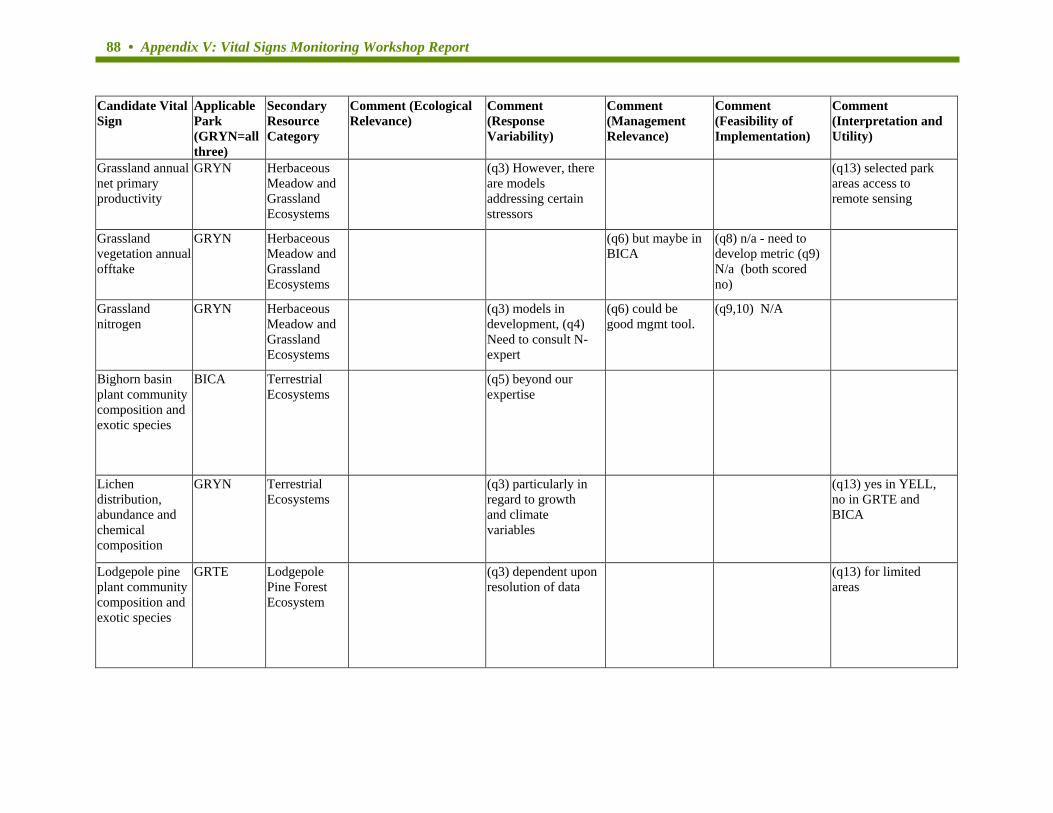
88 • Appendix V: Vital Signs Monitoring Workshop Report
Candidate Vital Sign
Applicable Park (GRYN=all three)
Secondary Resource Category
Comment (Ecological Relevance)
Comment (Response Variability)
Comment (Management Relevance)
Comment (Feasibility of Implementation)
Comment (Interpretation and Utility)
Grassland annual net primary productivity
GRYN HerbaceousMeadow and Grassland Ecosystems
(q3) However, there are models addressing certain stressors
(q13) selected park areas access to remote sensing
Grassland vegetation annual offtake
GRYN HerbaceousMeadow and Grassland Ecosystems
(q6) but maybe in BICA
(q8) n/a - need to develop metric (q9) N/a (both scored no)
Grassland nitrogen
GRYN HerbaceousMeadow and Grassland Ecosystems
(q3) models in development, (q4) Need to consult N- expert
(q6) could be good mgmt tool.
(q9,10) N/A
Bighorn basin plant community composition and exotic species
BICA TerrestrialEcosystems
(q5) beyond our expertise
Lichen distribution, abundance and chemical composition
GRYN TerrestrialEcosystems
(q3) particularly in regard to growth and climate variables
(q13) yes in YELL, no in GRTE and BICA
Lodgepole pine plant community composition and exotic species
GRTE LodgepolePine Forest Ecosystem
(q3) dependent upon resolution of data
(q13) for limited areas
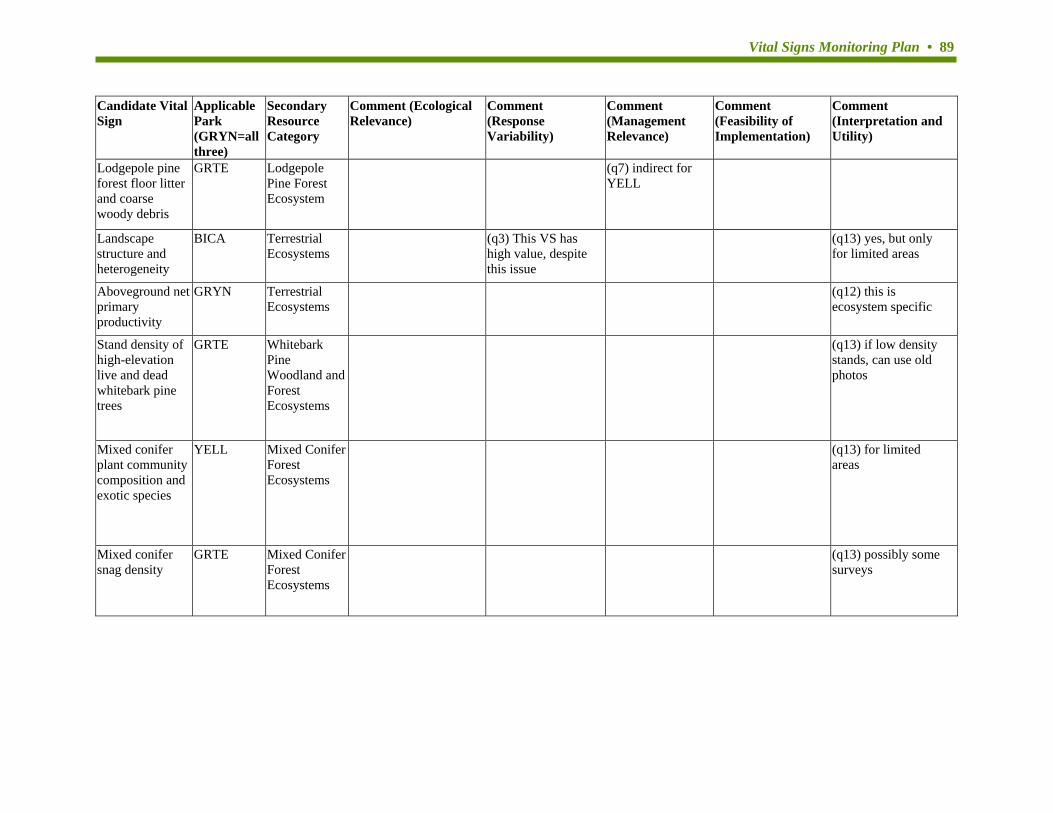
Vital Signs Monitoring Plan • 89
Candidate Vital Sign
Applicable Park (GRYN=all three)
Secondary Resource Category
Comment (Ecological Relevance)
Comment (Response Variability)
Comment (Management Relevance)
Comment (Feasibility of Implementation)
Comment (Interpretation and Utility)
Lodgepole pine forest floor litter and coarse woody debris
GRTE LodgepolePine Forest Ecosystem
(q7) indirect for YELL
Landscape structure and heterogeneity
BICA TerrestrialEcosystems
(q3) This VS has high value, despite this issue
(q13) yes, but only for limited areas
Aboveground net primary productivity
GRYN TerrestrialEcosystems
(q12) this is ecosystem specific
Stand density of high-elevation live and dead whitebark pine trees
GRTE WhitebarkPine Woodland and Forest Ecosystems
(q13) if low density stands, can use old photos
Mixed conifer plant community composition and exotic species
YELL Mixed ConiferForest Ecosystems
(q13) for limited areas
Mixed conifer snag density
GRTE Mixed ConiferForest Ecosystems
(q13) possibly some surveys
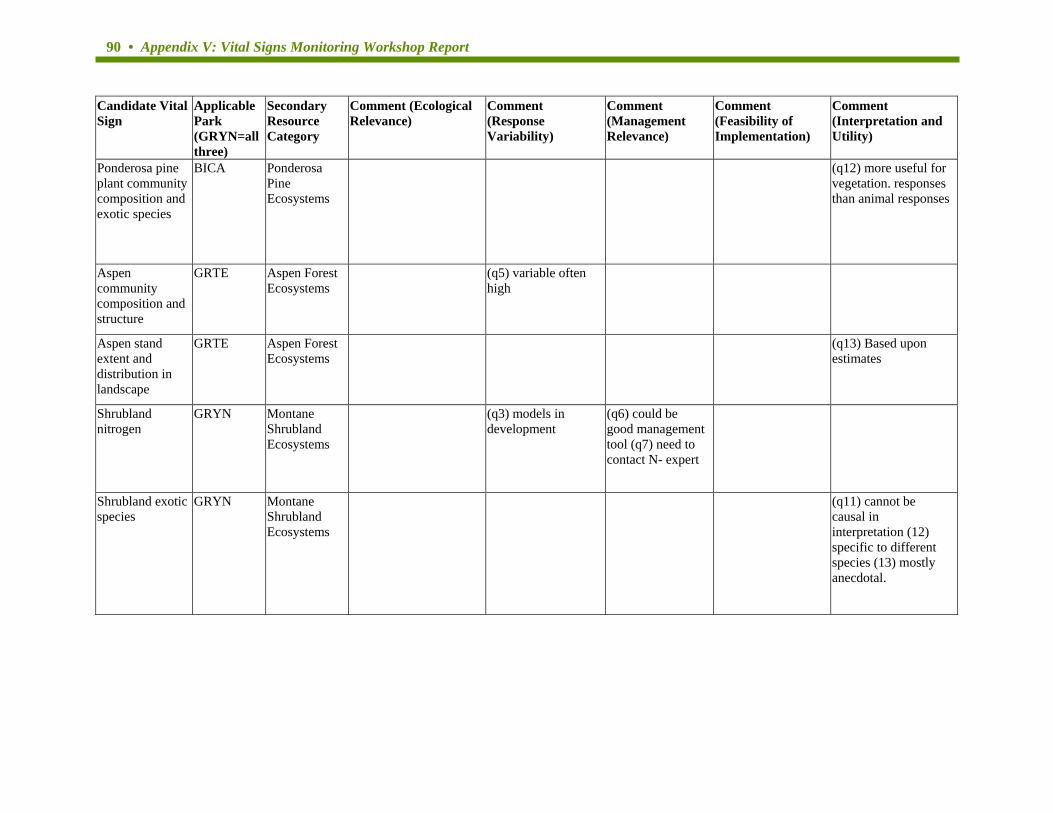
90 • Appendix V: Vital Signs Monitoring Workshop Report
Candidate Vital Sign
Applicable Park (GRYN=all three)
Secondary Resource Category
Comment (Ecological Relevance)
Comment (Response Variability)
Comment (Management Relevance)
Comment (Feasibility of Implementation)
Comment (Interpretation and Utility)
Ponderosa pine plant community composition and exotic species
BICA PonderosaPine Ecosystems
(q12) more useful for vegetation. responses than animal responses
Aspen community composition and structure
GRTE Aspen ForestEcosystems
(q5) variable often high
Aspen stand extent and distribution in landscape
GRTE Aspen ForestEcosystems
(q13) Based upon estimates
Shrubland nitrogen
GRYN MontaneShrubland Ecosystems
(q3) models in development
(q6) could be good management tool (q7) need to contact N- expert
Shrubland exotic species
GRYN MontaneShrubland Ecosystems
(q11) cannot be causal in interpretation (12) specific to different species (13) mostly anecdotal.
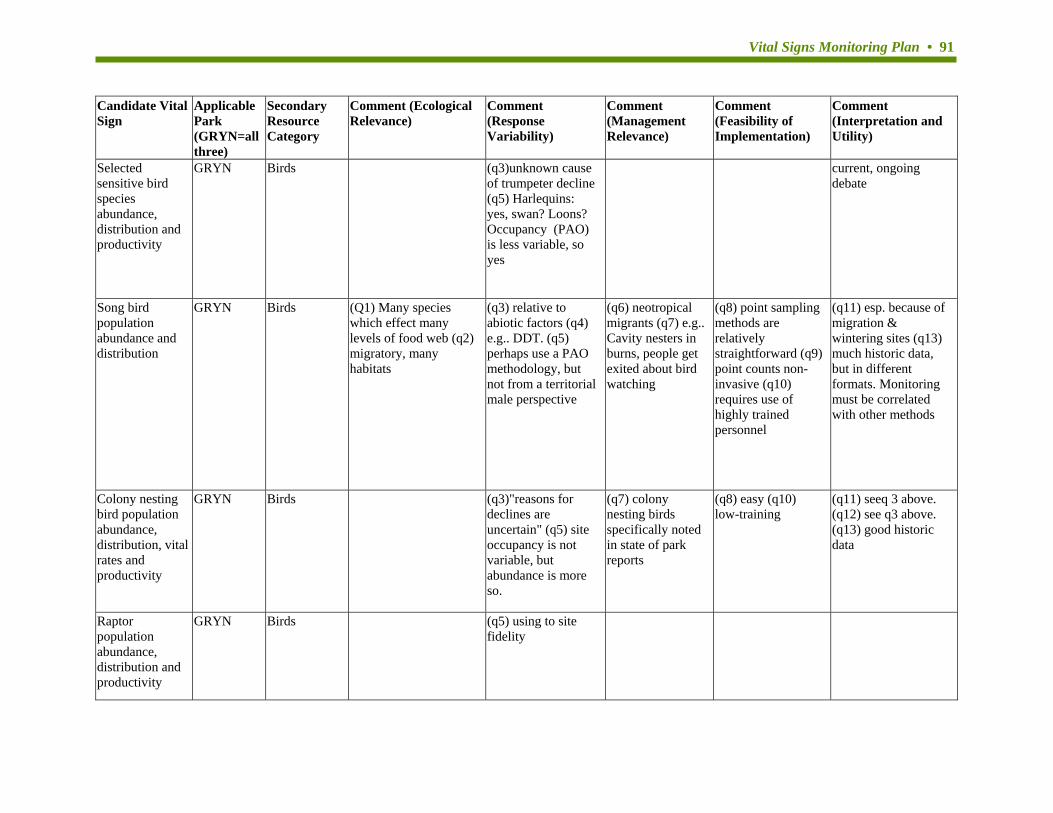
Vital Signs Monitoring Plan • 91
Candidate Vital Sign
Applicable Park (GRYN=all three)
Secondary Resource Category
Comment (Ecological Relevance)
Comment (Response Variability)
Comment (Management Relevance)
Comment (Feasibility of Implementation)
Comment (Interpretation and Utility)
Selected sensitive bird species abundance, distribution and productivity
GRYN Birds (q3)unknown cause of trumpeter decline (q5) Harlequins: yes, swan? Loons? Occupancy (PAO) is less variable, so yes
current, ongoing debate
Song bird population abundance and distribution
GRYN Birds (Q1) Many species which effect many levels of food web (q2) migratory, many habitats
(q3) relative to abiotic factors (q4) e.g.. DDT. (q5) perhaps use a PAO methodology, but not from a territorial male perspective
(q6) neotropical migrants (q7) e.g.. Cavity nesters in burns, people get exited about bird watching
(q8) point sampling methods are relatively straightforward (q9) point counts non-invasive (q10) requires use of highly trained personnel
(q11) esp. because of migration & wintering sites (q13) much historic data, but in different formats. Monitoring must be correlated with other methods
Colony nesting bird population abundance, distribution, vital rates and productivity
GRYN Birds (q3)"reasons for declines are uncertain" (q5) site occupancy is not variable, but abundance is more so.
(q7) colony nesting birds specifically noted in state of park reports
(q8) easy (q10) low-training
(q11) seeq 3 above. (q12) see q3 above. (q13) good historic data
Raptor population abundance, distribution and productivity
GRYN Birds (q5) using to site fidelity
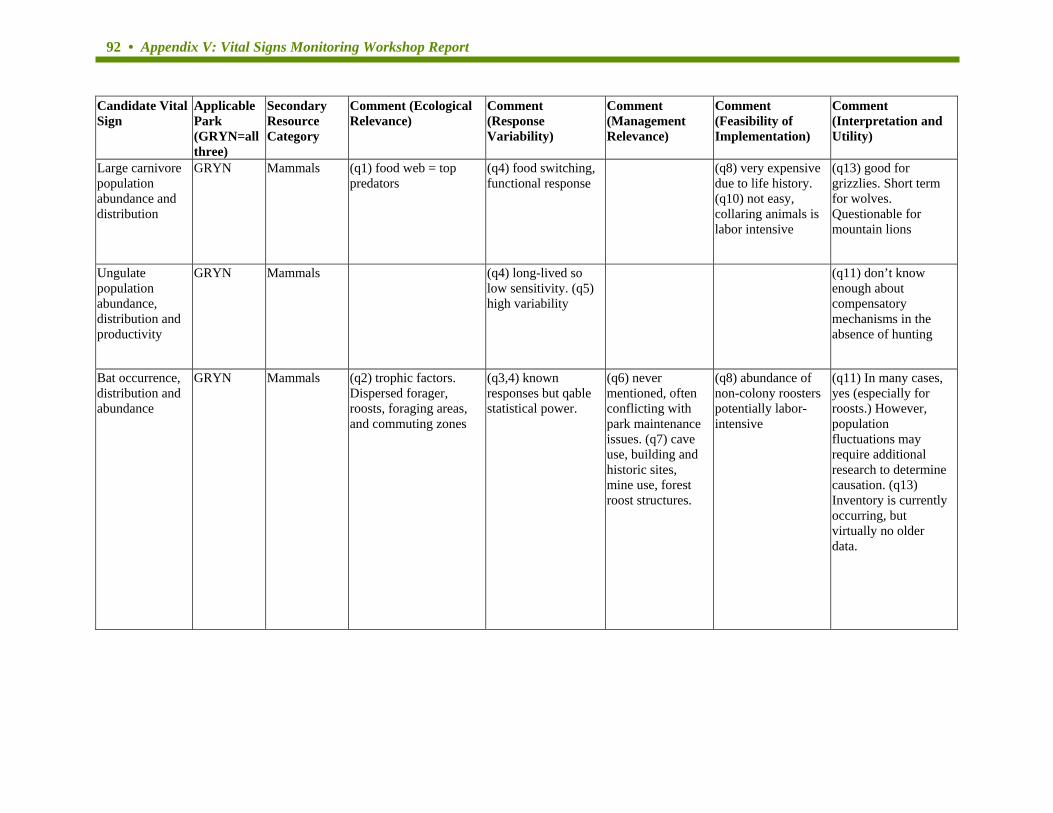
92 • Appendix V: Vital Signs Monitoring Workshop Report
Candidate Vital Sign
Applicable Park (GRYN=all three)
Secondary Resource Category
Comment (Ecological Relevance)
Comment (Response Variability)
Comment (Management Relevance)
Comment (Feasibility of Implementation)
Comment (Interpretation and Utility)
Large carnivore population abundance and distribution
GRYN Mammals (q1) food web = top predators
(q4) food switching, functional response
(q8) very expensive due to life history. (q10) not easy, collaring animals is labor intensive
(q13) good for grizzlies. Short term for wolves. Questionable for mountain lions
Ungulate population abundance, distribution and productivity
GRYN Mammals (q4) long-lived so low sensitivity. (q5) high variability
(q11) don’t know enough about compensatory mechanisms in the absence of hunting
Bat occurrence, distribution and abundance
GRYN Mammals (q2) trophic factors. Dispersed forager, roosts, foraging areas, and commuting zones
(q3,4) known responses but qable statistical power.
(q6) never mentioned, often conflicting with park maintenance issues. (q7) cave use, building and historic sites, mine use, forest roost structures.
(q8) abundance of non-colony roosters potentially labor-intensive
(q11) In many cases, yes (especially for roosts.) However, population fluctuations may require additional research to determine causation. (q13) Inventory is currently occurring, but virtually no older data.
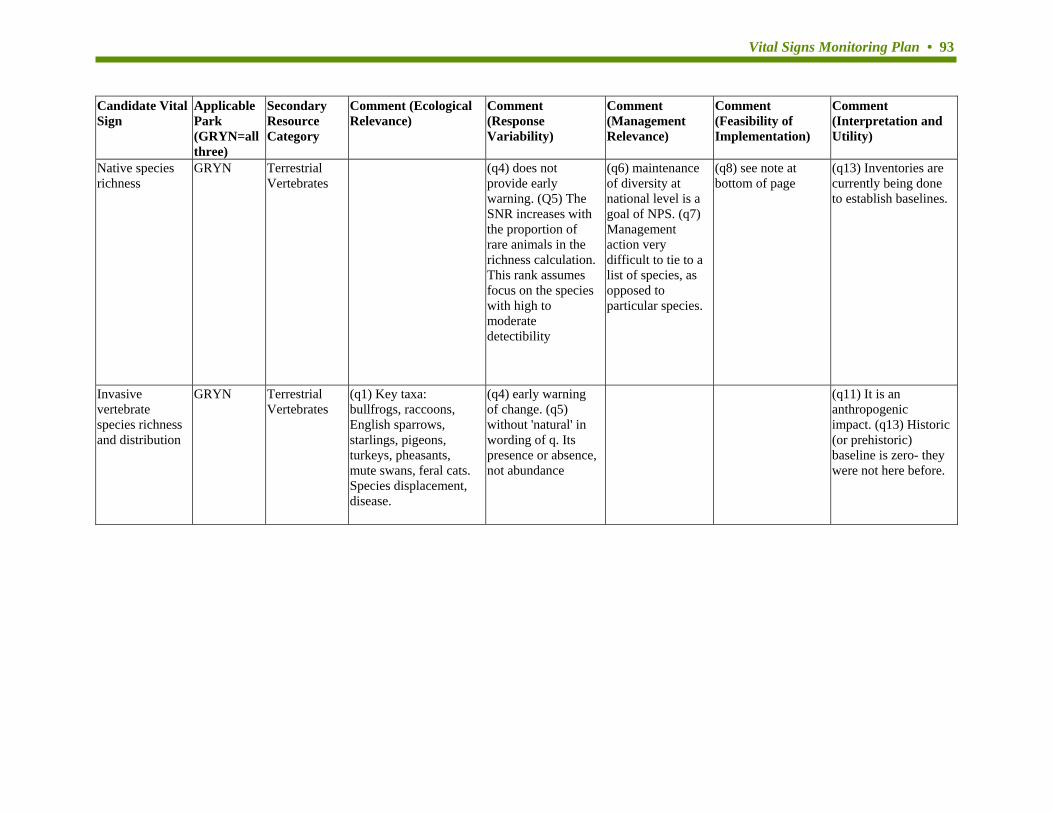
Vital Signs Monitoring Plan • 93
Candidate Vital Sign
Applicable Park (GRYN=all three)
Secondary Resource Category
Comment (Ecological Relevance)
Comment (Response Variability)
Comment (Management Relevance)
Comment (Feasibility of Implementation)
Comment (Interpretation and Utility)
Native species richness
GRYN TerrestrialVertebrates
(q4) does not provide early warning. (Q5) The SNR increases with the proportion of rare animals in the richness calculation. This rank assumes focus on the species with high to moderate detectibility
(q6) maintenance of diversity at national level is a goal of NPS. (q7) Management action very difficult to tie to a list of species, as opposed to particular species.
(q8) see note at bottom of page
(q13) Inventories are currently being done to establish baselines.
Invasive vertebrate species richness and distribution
GRYN TerrestrialVertebrates
(q1) Key taxa: bullfrogs, raccoons, English sparrows, starlings, pigeons, turkeys, pheasants, mute swans, feral cats. Species displacement, disease.
(q4) early warning of change. (q5) without 'natural' in wording of q. Its presence or absence, not abundance
(q11) It is an anthropogenic impact. (q13) Historic (or prehistoric) baseline is zero- they were not here before.

94 • Appendix V: Vital Signs Monitoring Workshop Report
Candidate Vital Sign
Applicable Park (GRYN=all three)
Secondary Resource Category
Comment (Ecological Relevance)
Comment (Response Variability)
Comment (Management Relevance)
Comment (Feasibility of Implementation)
Comment (Interpretation and Utility)
Vertebrate diseases
GRYN TerrestrialVertebrates
(q3) much current research to uncover causes of spread
(q11) Anthropogenic causes can interact with diseases, making wildlife more susceptible. (q13) Many diseases are recently discovered or recently prevalent. With molecular techniques the history of diseases can often be traced back in time.
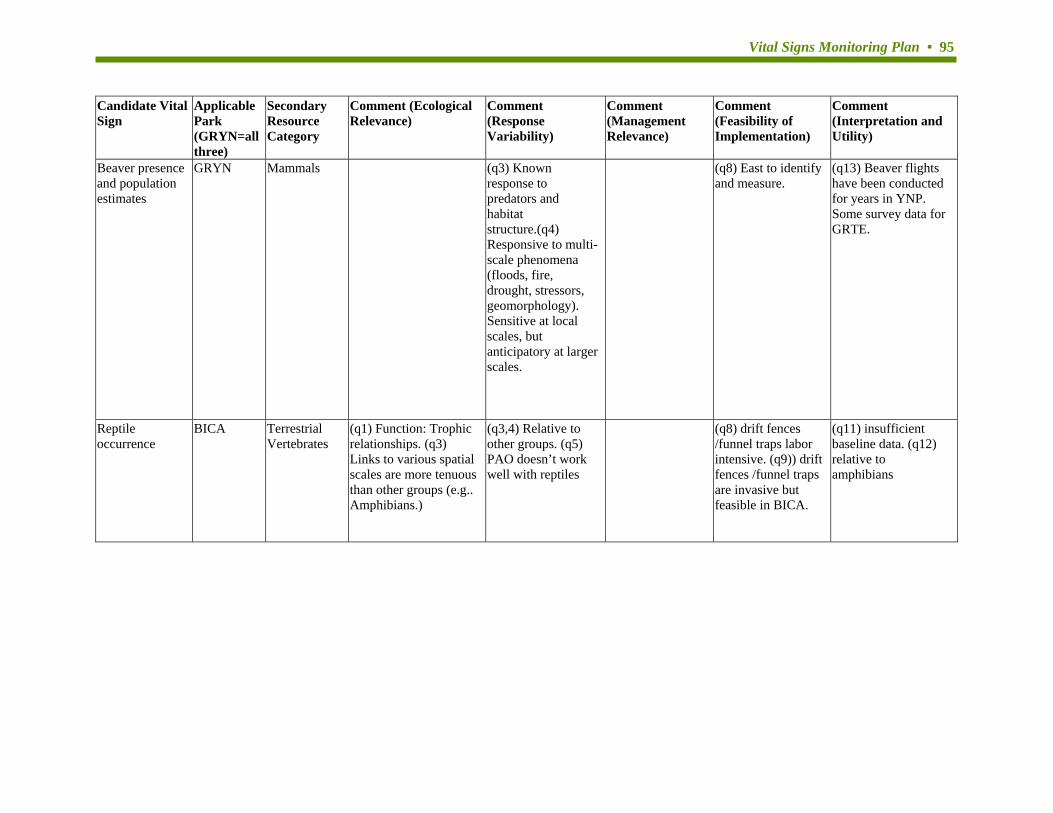
Vital Signs Monitoring Plan • 95
Candidate Vital Sign
Applicable Park (GRYN=all three)
Secondary Resource Category
Comment (Ecological Relevance)
Comment (Response Variability)
Comment (Management Relevance)
Comment (Feasibility of Implementation)
Comment (Interpretation and Utility)
Beaver presence and population estimates
GRYN Mammals (q3) Known response to predators and habitat structure.(q4) Responsive to multi-scale phenomena (floods, fire, drought, stressors, geomorphology). Sensitive at local scales, but anticipatory at larger scales.
(q8) East to identify and measure.
(q13) Beaver flights have been conducted for years in YNP. Some survey data for GRTE.
Reptile occurrence
BICA TerrestrialVertebrates
(q1) Function: Trophic relationships. (q3) Links to various spatial scales are more tenuous than other groups (e.g.. Amphibians.)
(q3,4) Relative to other groups. (q5) PAO doesn’t work well with reptiles
(q8) drift fences /funnel traps labor intensive. (q9)) drift fences /funnel traps are invasive but feasible in BICA.
(q11) insufficient baseline data. (q12) relative to amphibians
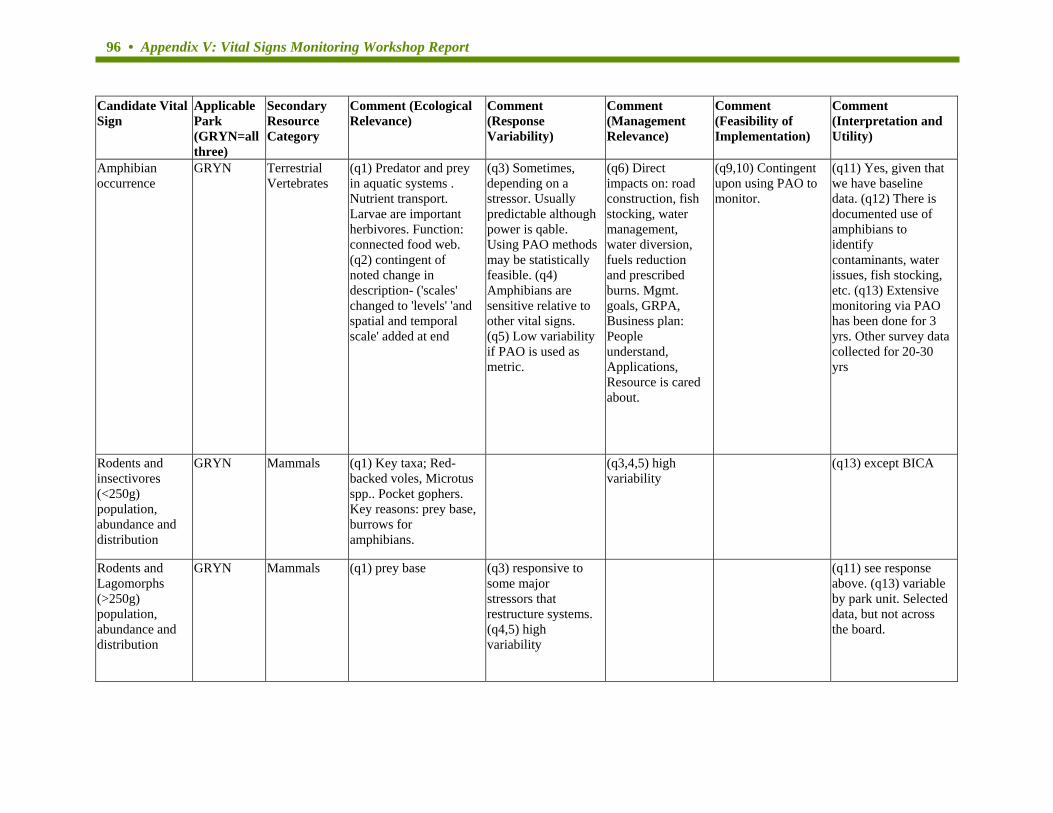
96 • Appendix V: Vital Signs Monitoring Workshop Report
Candidate Vital Sign
Applicable Park (GRYN=all three)
Secondary Resource Category
Comment (Ecological Relevance)
Comment (Response Variability)
Comment (Management Relevance)
Comment (Feasibility of Implementation)
Comment (Interpretation and Utility)
Amphibian occurrence
GRYN TerrestrialVertebrates
(q1) Predator and prey in aquatic systems . Nutrient transport. Larvae are important herbivores. Function: connected food web. (q2) contingent of noted change in description- ('scales' changed to 'levels' 'and spatial and temporal scale' added at end
(q3) Sometimes, depending on a stressor. Usually predictable although power is qable. Using PAO methods may be statistically feasible. (q4) Amphibians are sensitive relative to other vital signs. (q5) Low variability if PAO is used as metric.
(q6) Direct impacts on: road construction, fish stocking, water management, water diversion, fuels reduction and prescribed burns. Mgmt. goals, GRPA, Business plan: People understand, Applications, Resource is cared about.
(q9,10) Contingent upon using PAO to monitor.
(q11) Yes, given that we have baseline data. (q12) There is documented use of amphibians to identify contaminants, water issues, fish stocking, etc. (q13) Extensive monitoring via PAO has been done for 3 yrs. Other survey data collected for 20-30 yrs
Rodents and insectivores (<250g) population, abundance and distribution
GRYN Mammals (q1) Key taxa; Red-backed voles, Microtus spp.. Pocket gophers. Key reasons: prey base, burrows for amphibians.
(q3,4,5) high variability
(q13) except BICA
Rodents and Lagomorphs (>250g) population, abundance and distribution
GRYN Mammals (q1) prey base (q3) responsive to some major stressors that restructure systems. (q4,5) high variability
(q11) see response above. (q13) variable by park unit. Selected data, but not across the board.
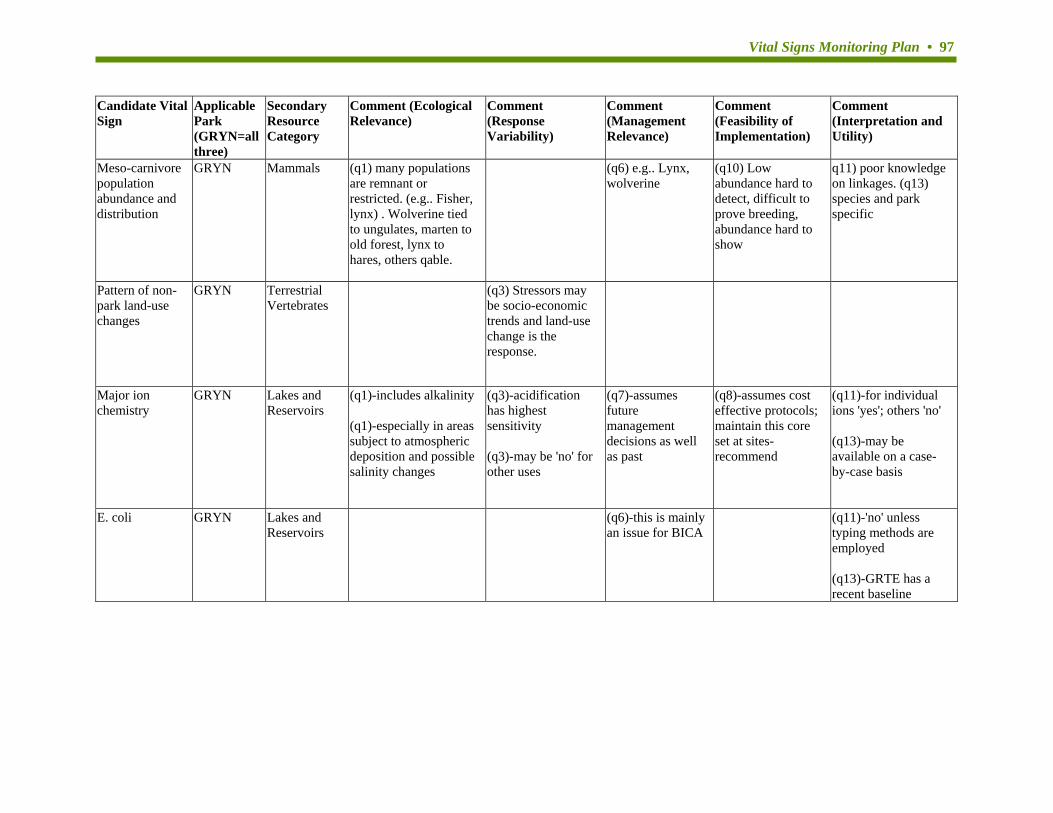
Vital Signs Monitoring Plan • 97
Candidate Vital Sign
Applicable Park (GRYN=all three)
Secondary Resource Category
Comment (Ecological Relevance)
Comment (Response Variability)
Comment (Management Relevance)
Comment (Feasibility of Implementation)
Comment (Interpretation and Utility)
Meso-carnivore population abundance and distribution
GRYN Mammals (q1) many populations are remnant or restricted. (e.g.. Fisher, lynx) . Wolverine tied to ungulates, marten to old forest, lynx to hares, others qable.
(q6) e.g.. Lynx, wolverine
(q10) Low abundance hard to detect, difficult to prove breeding, abundance hard to show
q11) poor knowledge on linkages. (q13) species and park specific
Pattern of non-park land-use changes
GRYN TerrestrialVertebrates
(q3) Stressors may be socio-economic trends and land-use change is the response.
Major ion chemistry
GRYN Lakes andReservoirs
(q1)-includes alkalinity (q1)-especially in areas subject to atmospheric deposition and possible salinity changes
(q3)-acidification has highest sensitivity (q3)-may be 'no' for other uses
(q7)-assumes future management decisions as well as past
(q8)-assumes cost effective protocols; maintain this core set at sites-recommend
(q11)-for individual ions 'yes'; others 'no' (q13)-may be available on a case-by-case basis
E. coli GRYN Lakes and Reservoirs
(q6)-this is mainly an issue for BICA
(q11)-'no' unless typing methods are employed (q13)-GRTE has a recent baseline
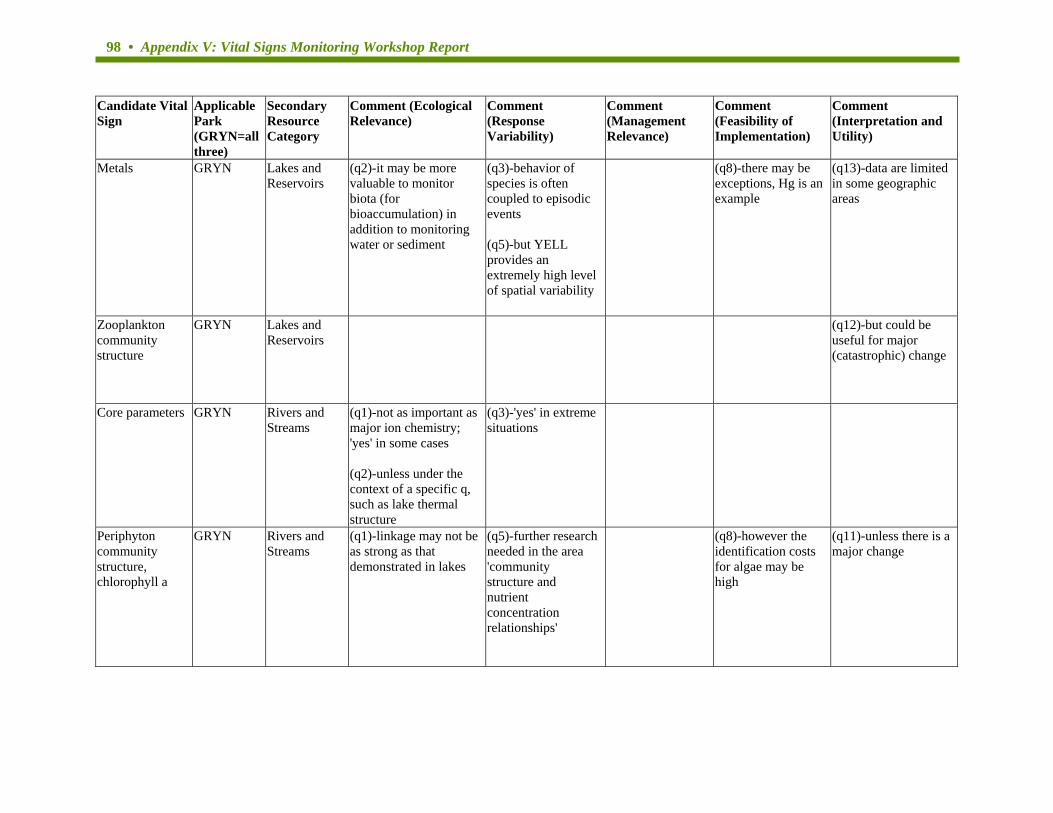
98 • Appendix V: Vital Signs Monitoring Workshop Report
Candidate Vital Sign
Applicable Park (GRYN=all three)
Secondary Resource Category
Comment (Ecological Relevance)
Comment (Response Variability)
Comment (Management Relevance)
Comment (Feasibility of Implementation)
Comment (Interpretation and Utility)
Metals GRYN Lakes andReservoirs
(q2)-it may be more valuable to monitor biota (for bioaccumulation) in addition to monitoring water or sediment
(q3)-behavior of species is often coupled to episodic events (q5)-but YELL provides an extremely high level of spatial variability
(q8)-there may be exceptions, Hg is an example
(q13)-data are limited in some geographic areas
Zooplankton community structure
GRYN Lakes andReservoirs
(q12)-but could be useful for major (catastrophic) change
Core parameters GRYN Rivers and Streams
(q1)-not as important as major ion chemistry; 'yes' in some cases (q2)-unless under the context of a specific q, such as lake thermal structure
(q3)-'yes' in extreme situations
Periphyton community structure, chlorophyll a
GRYN Rivers andStreams
(q1)-linkage may not be as strong as that demonstrated in lakes
(q5)-further research needed in the area 'community structure and nutrient concentration relationships'
(q8)-however the identification costs for algae may be high
(q11)-unless there is a major change
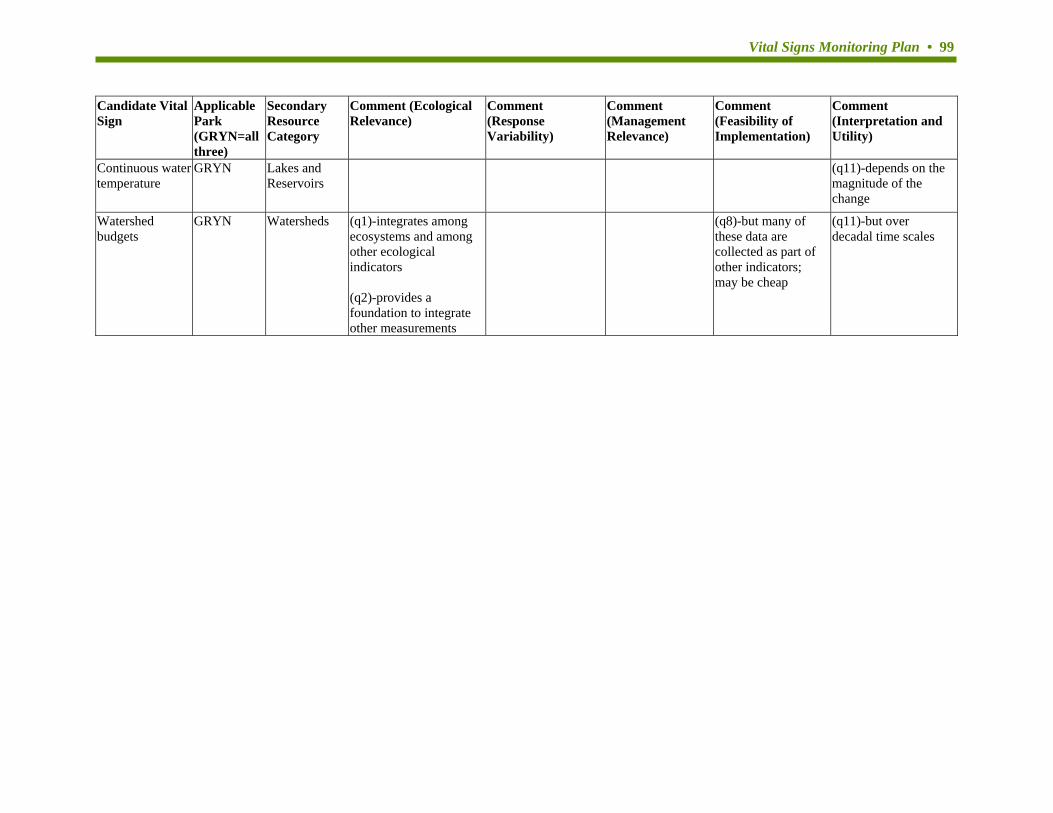
Vital Signs Monitoring Plan • 99
Candidate Vital Sign
Applicable Park (GRYN=all three)
Secondary Resource Category
Comment (Ecological Relevance)
Comment (Response Variability)
Comment (Management Relevance)
Comment (Feasibility of Implementation)
Comment (Interpretation and Utility)
Continuous water temperature
GRYN Lakes andReservoirs
(q11)-depends on the magnitude of the change
Watershed budgets
GRYN Watersheds (q1)-integrates among ecosystems and among other ecological indicators (q2)-provides a foundation to integrate other measurements
(q8)-but many of these data are collected as part of other indicators; may be cheap
(q11)-but over decadal time scales
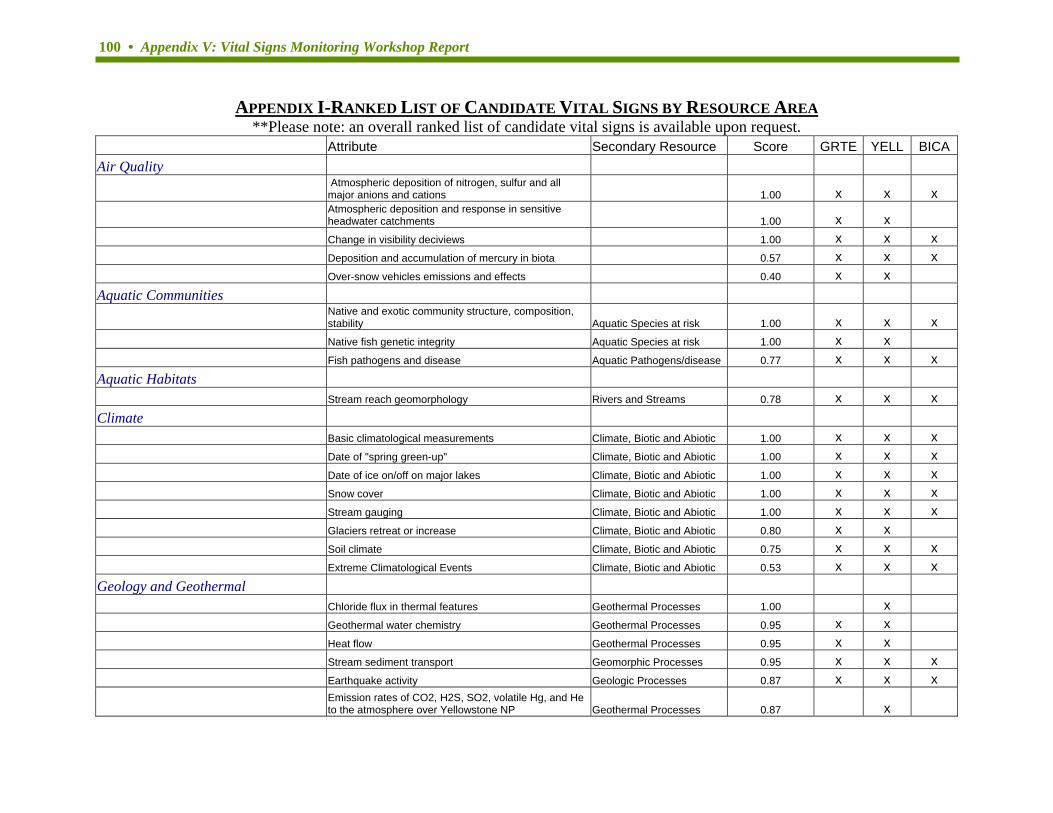
100 • Appendix V: Vital Signs Monitoring Workshop Report
APPENDIX I-RANKED LIST OF CANDIDATE VITAL SIGNS BY RESOURCE AREA **Please note: an overall ranked list of candidate vital signs is available upon request.
Attribute Secondary Resource Score GRTE YELL BICAAir Quality
Atmospheric deposition of nitrogen, sulfur and all major anions and cations 1.00 x x x
Atmospheric deposition and response in sensitive headwater catchments 1.00 x x
Change in visibility deciviews 1.00 x x x Deposition and accumulation of mercury in biota 0.57 x x x Over-snow vehicles emissions and effects 0.40 x xAquatic Communities
Native and exotic community structure, composition, stability Aquatic Species at risk 1.00 x x x
Native fish genetic integrity Aquatic Species at risk 1.00 x x Fish pathogens and disease Aquatic Pathogens/disease 0.77 x x xAquatic Habitats Stream reach geomorphology Rivers and Streams 0.78 x x xClimate Basic climatological measurements Climate, Biotic and Abiotic 1.00 x x x Date of "spring green-up" Climate, Biotic and Abiotic 1.00 x x x Date of ice on/off on major lakes Climate, Biotic and Abiotic 1.00 x x x Snow cover Climate, Biotic and Abiotic 1.00 x x x Stream gauging Climate, Biotic and Abiotic 1.00 x x x Glaciers retreat or increase Climate, Biotic and Abiotic 0.80 x x Soil climate Climate, Biotic and Abiotic 0.75 x x x Extreme Climatological Events Climate, Biotic and Abiotic 0.53 x x xGeology and Geothermal Chloride flux in thermal features Geothermal Processes 1.00 x Geothermal water chemistry Geothermal Processes 0.95 x x Heat flow Geothermal Processes 0.95 x x Stream sediment transport Geomorphic Processes 0.95 x x x Earthquake activity Geologic Processes 0.87 x x x
Emission rates of CO2, H2S, SO2, volatile Hg, and He to the atmosphere over Yellowstone NP Geothermal Processes 0.87 x
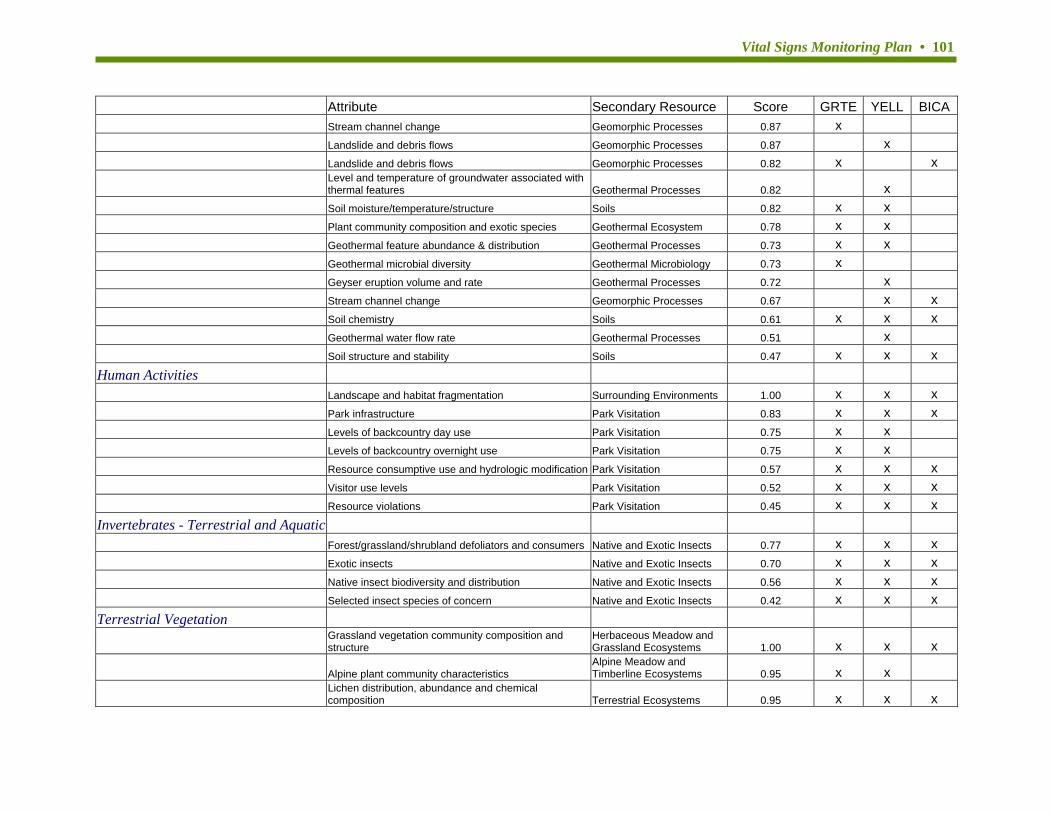
Vital Signs Monitoring Plan • 101
Attribute Secondary Resource Score GRTE YELL BICA Stream channel change Geomorphic Processes 0.87 x Landslide and debris flows Geomorphic Processes 0.87 x Landslide and debris flows Geomorphic Processes 0.82 x x
Level and temperature of groundwater associated with thermal features Geothermal Processes 0.82 x
Soil moisture/temperature/structure Soils 0.82 x x Plant community composition and exotic species Geothermal Ecosystem 0.78 x x Geothermal feature abundance & distribution Geothermal Processes 0.73 x x Geothermal microbial diversity Geothermal Microbiology 0.73 x Geyser eruption volume and rate Geothermal Processes 0.72 x Stream channel change Geomorphic Processes 0.67 x x Soil chemistry Soils 0.61 x x x Geothermal water flow rate Geothermal Processes 0.51 x Soil structure and stability Soils 0.47 x x xHuman Activities Landscape and habitat fragmentation Surrounding Environments 1.00 x x x Park infrastructure Park Visitation 0.83 x x x Levels of backcountry day use Park Visitation 0.75 x x Levels of backcountry overnight use Park Visitation 0.75 x x Resource consumptive use and hydrologic modification Park Visitation 0.57 x x x Visitor use levels Park Visitation 0.52 x x x Resource violations Park Visitation 0.45 x x xInvertebrates - Terrestrial and Aquatic Forest/grassland/shrubland defoliators and consumers Native and Exotic Insects 0.77 x x x Exotic insects Native and Exotic Insects 0.70 x x x Native insect biodiversity and distribution Native and Exotic Insects 0.56 x x x Selected insect species of concern Native and Exotic Insects 0.42 x x xTerrestrial Vegetation
Grassland vegetation community composition and structure
Herbaceous Meadow and Grassland Ecosystems 1.00 x x x
Alpine plant community characteristics Alpine Meadow and Timberline Ecosystems 0.95 x x
Lichen distribution, abundance and chemical composition Terrestrial Ecosystems 0.95 x x x
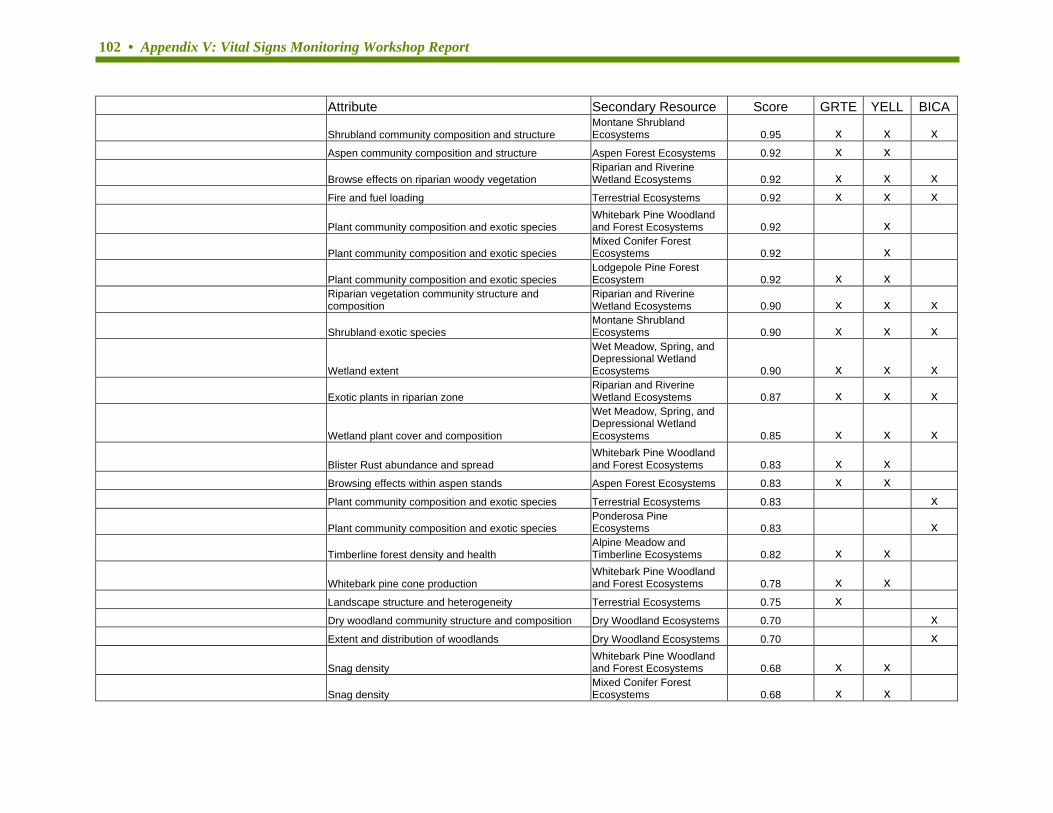
102 • Appendix V: Vital Signs Monitoring Workshop Report
Attribute Secondary Resource Score GRTE YELL BICA
Shrubland community composition and structure Montane Shrubland Ecosystems 0.95 x x x
Aspen community composition and structure Aspen Forest Ecosystems 0.92 x x
Browse effects on riparian woody vegetation Riparian and Riverine Wetland Ecosystems 0.92 x x x
Fire and fuel loading Terrestrial Ecosystems 0.92 x x x
Plant community composition and exotic species Whitebark Pine Woodland and Forest Ecosystems 0.92 x
Plant community composition and exotic species Mixed Conifer Forest Ecosystems 0.92 x
Plant community composition and exotic species Lodgepole Pine Forest Ecosystem 0.92 x x
Riparian vegetation community structure and composition
Riparian and Riverine Wetland Ecosystems 0.90 x x x
Shrubland exotic species Montane Shrubland Ecosystems 0.90 x x x
Wetland extent
Wet Meadow, Spring, and Depressional Wetland Ecosystems 0.90 x x x
Exotic plants in riparian zone Riparian and Riverine Wetland Ecosystems 0.87 x x x
Wetland plant cover and composition
Wet Meadow, Spring, and Depressional Wetland Ecosystems 0.85 x x x
Blister Rust abundance and spread Whitebark Pine Woodland and Forest Ecosystems 0.83 x x
Browsing effects within aspen stands Aspen Forest Ecosystems 0.83 x x Plant community composition and exotic species Terrestrial Ecosystems 0.83 x
Plant community composition and exotic species Ponderosa Pine Ecosystems 0.83 x
Timberline forest density and health Alpine Meadow and Timberline Ecosystems 0.82 x x
Whitebark pine cone production Whitebark Pine Woodland and Forest Ecosystems 0.78 x x
Landscape structure and heterogeneity Terrestrial Ecosystems 0.75 x Dry woodland community structure and composition Dry Woodland Ecosystems 0.70 x Extent and distribution of woodlands Dry Woodland Ecosystems 0.70 x
Snag density Whitebark Pine Woodland and Forest Ecosystems 0.68 x x
Snag density Mixed Conifer Forest Ecosystems 0.68 x x
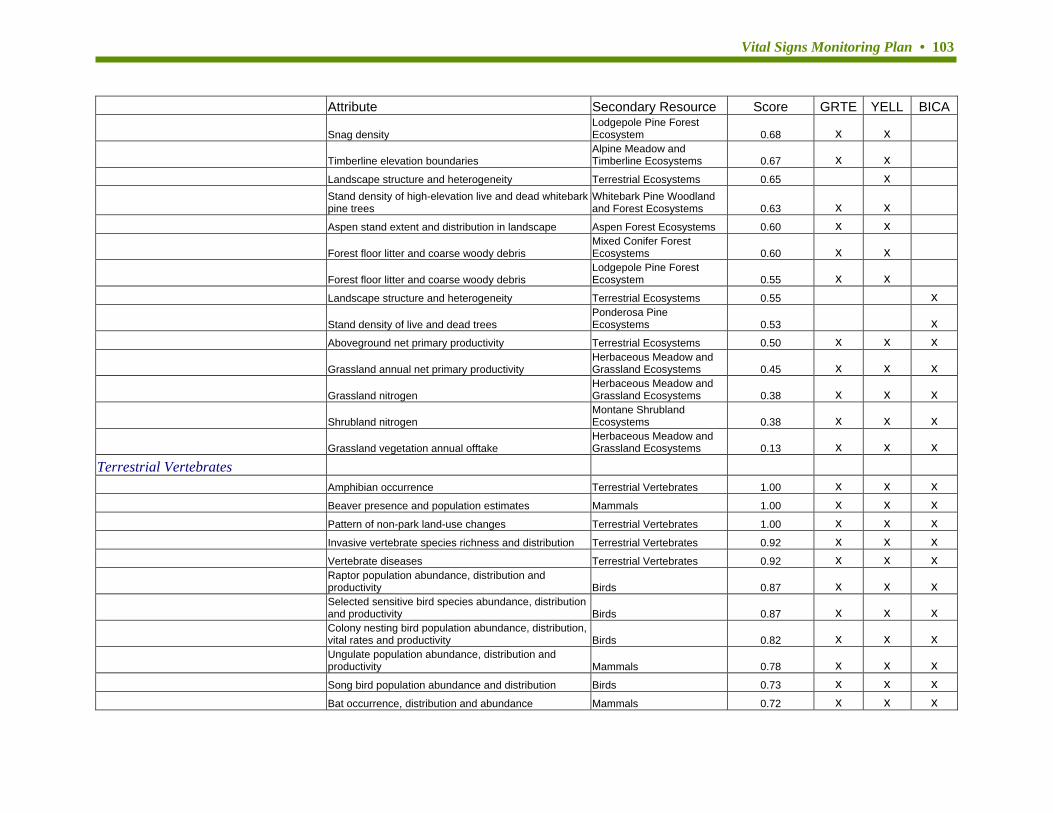
Vital Signs Monitoring Plan • 103
Attribute Secondary Resource Score GRTE YELL BICA
Snag density Lodgepole Pine Forest Ecosystem 0.68 x x
Timberline elevation boundaries Alpine Meadow and Timberline Ecosystems 0.67 x x
Landscape structure and heterogeneity Terrestrial Ecosystems 0.65 x
Stand density of high-elevation live and dead whitebark pine trees
Whitebark Pine Woodland and Forest Ecosystems 0.63 x x
Aspen stand extent and distribution in landscape Aspen Forest Ecosystems 0.60 x x
Forest floor litter and coarse woody debris Mixed Conifer Forest Ecosystems 0.60 x x
Forest floor litter and coarse woody debris Lodgepole Pine Forest Ecosystem 0.55 x x
Landscape structure and heterogeneity Terrestrial Ecosystems 0.55 x
Stand density of live and dead trees Ponderosa Pine Ecosystems 0.53 x
Aboveground net primary productivity Terrestrial Ecosystems 0.50 x x x
Grassland annual net primary productivity Herbaceous Meadow and Grassland Ecosystems 0.45 x x x
Grassland nitrogen Herbaceous Meadow and Grassland Ecosystems 0.38 x x x
Shrubland nitrogen Montane Shrubland Ecosystems 0.38 x x x
Grassland vegetation annual offtake Herbaceous Meadow and Grassland Ecosystems 0.13 x x x
Terrestrial Vertebrates Amphibian occurrence Terrestrial Vertebrates 1.00 x x x Beaver presence and population estimates Mammals 1.00 x x x Pattern of non-park land-use changes Terrestrial Vertebrates 1.00 x x x Invasive vertebrate species richness and distribution Terrestrial Vertebrates 0.92 x x x Vertebrate diseases Terrestrial Vertebrates 0.92 x x x
Raptor population abundance, distribution and productivity Birds 0.87 x x x
Selected sensitive bird species abundance, distribution and productivity Birds 0.87 x x x
Colony nesting bird population abundance, distribution, vital rates and productivity Birds 0.82 x x x
Ungulate population abundance, distribution and productivity Mammals 0.78 x x x
Song bird population abundance and distribution Birds 0.73 x x x Bat occurrence, distribution and abundance Mammals 0.72 x x x
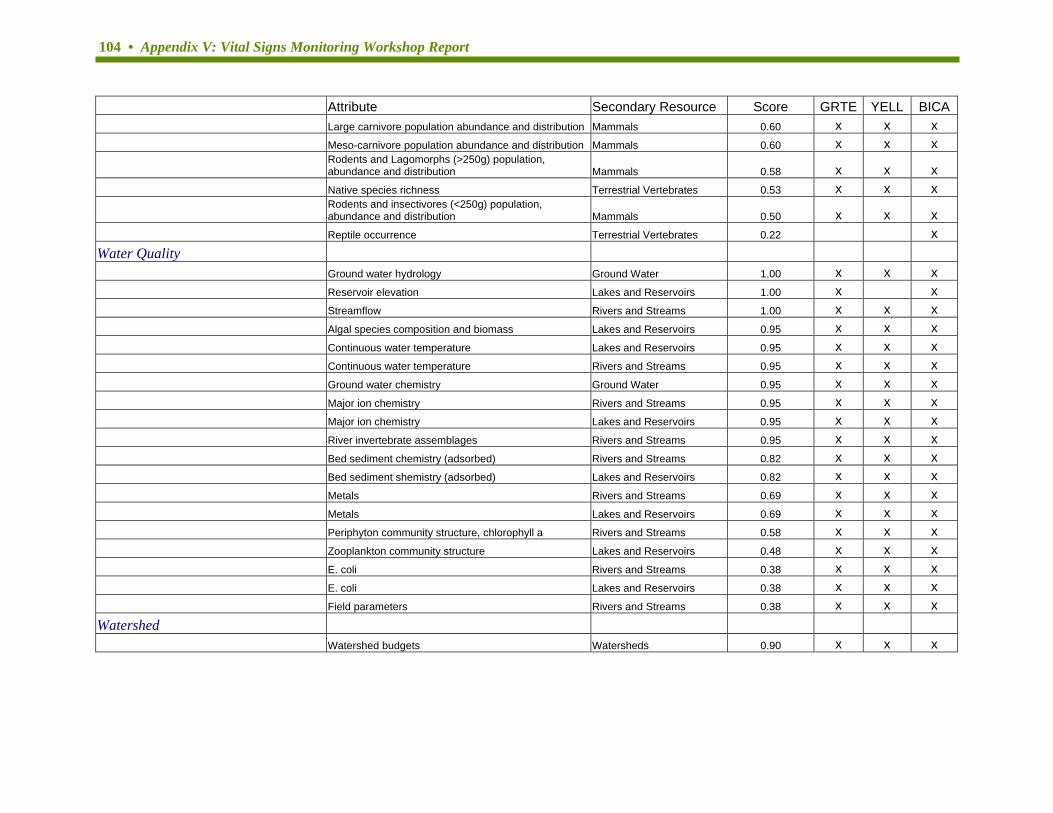
104 • Appendix V: Vital Signs Monitoring Workshop Report
Attribute Secondary Resource Score GRTE YELL BICA Large carnivore population abundance and distribution Mammals 0.60 x x x Meso-carnivore population abundance and distribution Mammals 0.60 x x x
Rodents and Lagomorphs (>250g) population, abundance and distribution Mammals 0.58 x x x
Native species richness Terrestrial Vertebrates 0.53 x x x
Rodents and insectivores (<250g) population, abundance and distribution Mammals 0.50 x x x
Reptile occurrence Terrestrial Vertebrates 0.22 xWater Quality Ground water hydrology Ground Water 1.00 x x x Reservoir elevation Lakes and Reservoirs 1.00 x x Streamflow Rivers and Streams 1.00 x x x Algal species composition and biomass Lakes and Reservoirs 0.95 x x x Continuous water temperature Lakes and Reservoirs 0.95 x x x Continuous water temperature Rivers and Streams 0.95 x x x Ground water chemistry Ground Water 0.95 x x x Major ion chemistry Rivers and Streams 0.95 x x x Major ion chemistry Lakes and Reservoirs 0.95 x x x River invertebrate assemblages Rivers and Streams 0.95 x x x Bed sediment chemistry (adsorbed) Rivers and Streams 0.82 x x x Bed sediment shemistry (adsorbed) Lakes and Reservoirs 0.82 x x x Metals Rivers and Streams 0.69 x x x Metals Lakes and Reservoirs 0.69 x x x Periphyton community structure, chlorophyll a Rivers and Streams 0.58 x x x Zooplankton community structure Lakes and Reservoirs 0.48 x x x E. coli Rivers and Streams 0.38 x x x E. coli Lakes and Reservoirs 0.38 x x x Field parameters Rivers and Streams 0.38 x x xWatershed Watershed budgets Watersheds 0.90 x x x

Vital Signs Monitoring Plan • 105
APPENDIX J-SPATIO-TEMPORAL MODELS **Please note: these models are reproduction of those made by the breakout groups on day three of the workshop.
LICHEN
Lodgepole, Mixed Conifer, Ponderosa, WhitebarkComposition and Exotic Species
Time Span
Fuel and Fire Loading
Spatial Scale (m2)
Tem
pora
l Sca
le
Century
Decade
Year
Month
Week
Day
Patch/Stand Landscape Ecoregion Continent
∞
50 Years
101 102 103 104 105 106 107 108 109 1010 1011 1012 1013
Blister Rust Abundance
Whitebark Pine ConeProduction
Fuel and Fire Loading
Lichen
Composition andExotic Species
Blister RustAbundance
TerrestrialVegetation
Whitebark Pine Cone Production
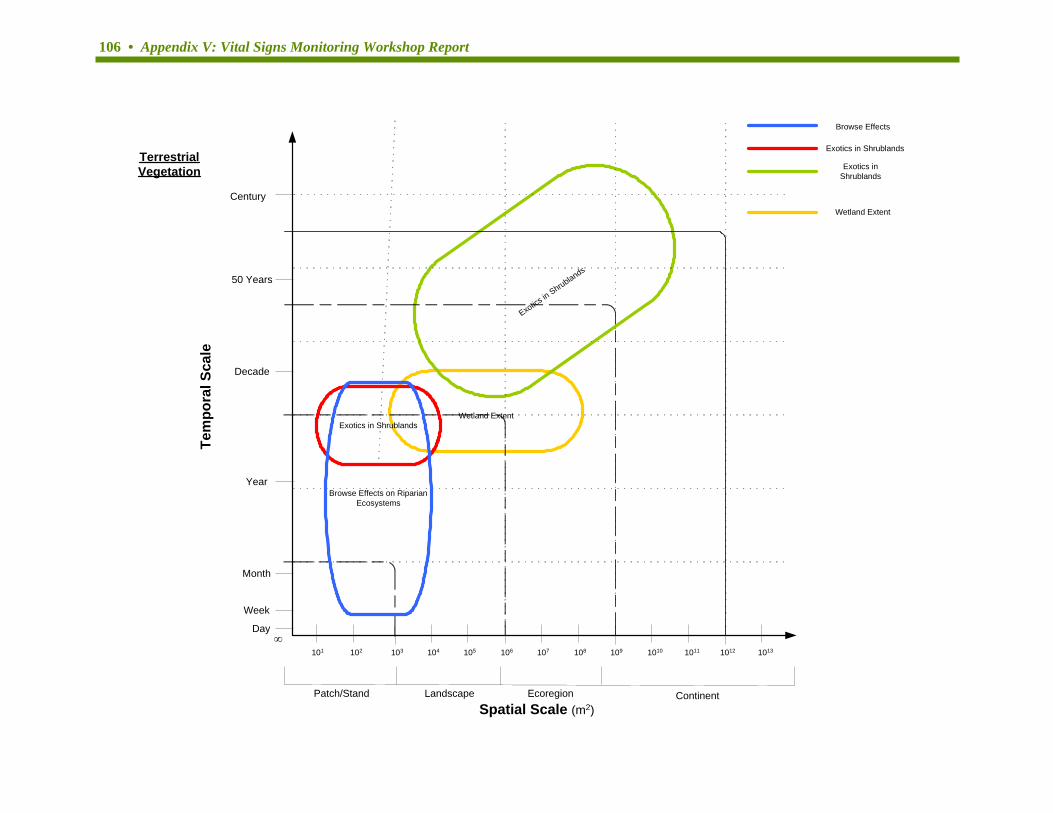
106 • Appendix V: Vital Signs Monitoring Workshop Report
Wetland Extent
Exotics in Shrublands
Spatial Scale (m2)
Tem
pora
l Sca
leCentury
Decade
Year
Month
Week
Day
Patch/Stand Landscape Ecoregion Continent
∞
50 Years
101 102 103 104 105 106 107 108 109 1010 1011 1012 1013
Exotics in Shrublands
Browse Effects
Exotics in Shrublands
Exotics inShrublands
Wetland Extent
TerrestrialVegetation
Browse Effects on RiparianEcosystems
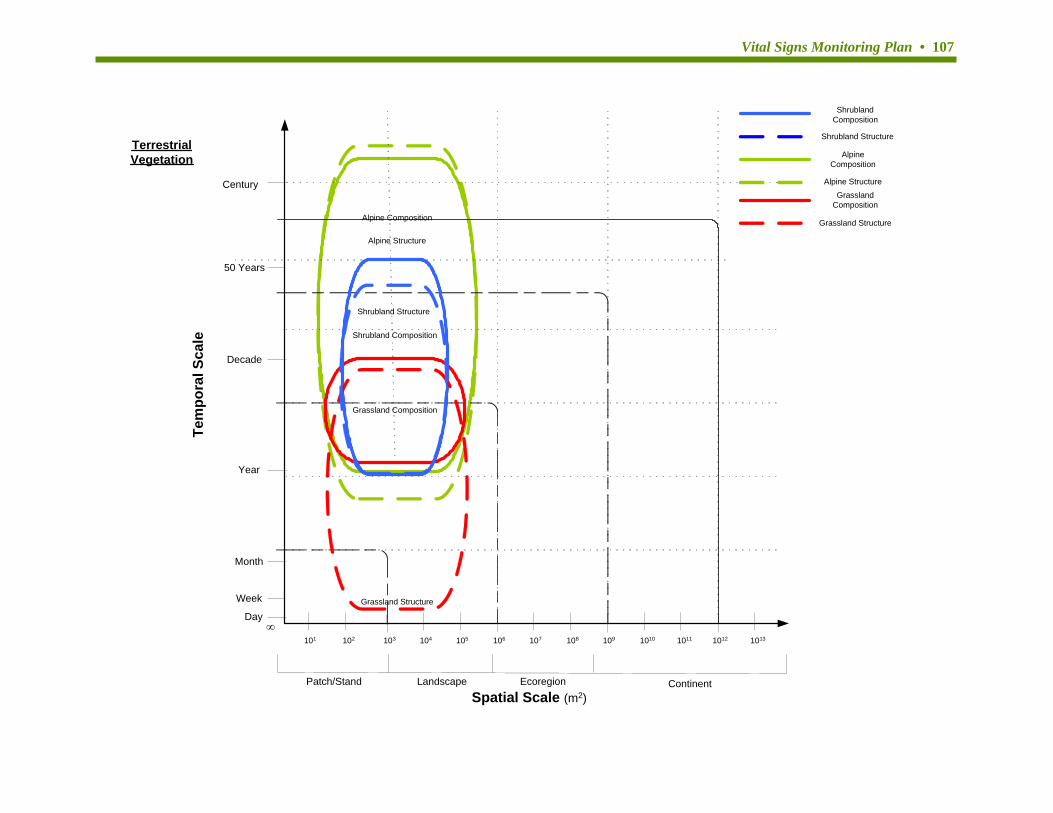
Vital Signs Monitoring Plan • 107
Alpine Structure
Alpine Composition
Spatial Scale (m2)
Tem
pora
l Sca
leCentury
Decade
Year
Month
Week
Day
Patch/Stand Landscape Ecoregion Continent
∞
50 Years
101 102 103 104 105 106 107 108 109 1010 1011 1012 1013
Grassland Composition
ShrublandComposition
Shrubland Structure
AlpineComposition
GrasslandComposition
TerrestrialVegetation
Shrubland Composition
Grassland Structure
Shrubland Structure
Alpine Structure
Grassland Structure
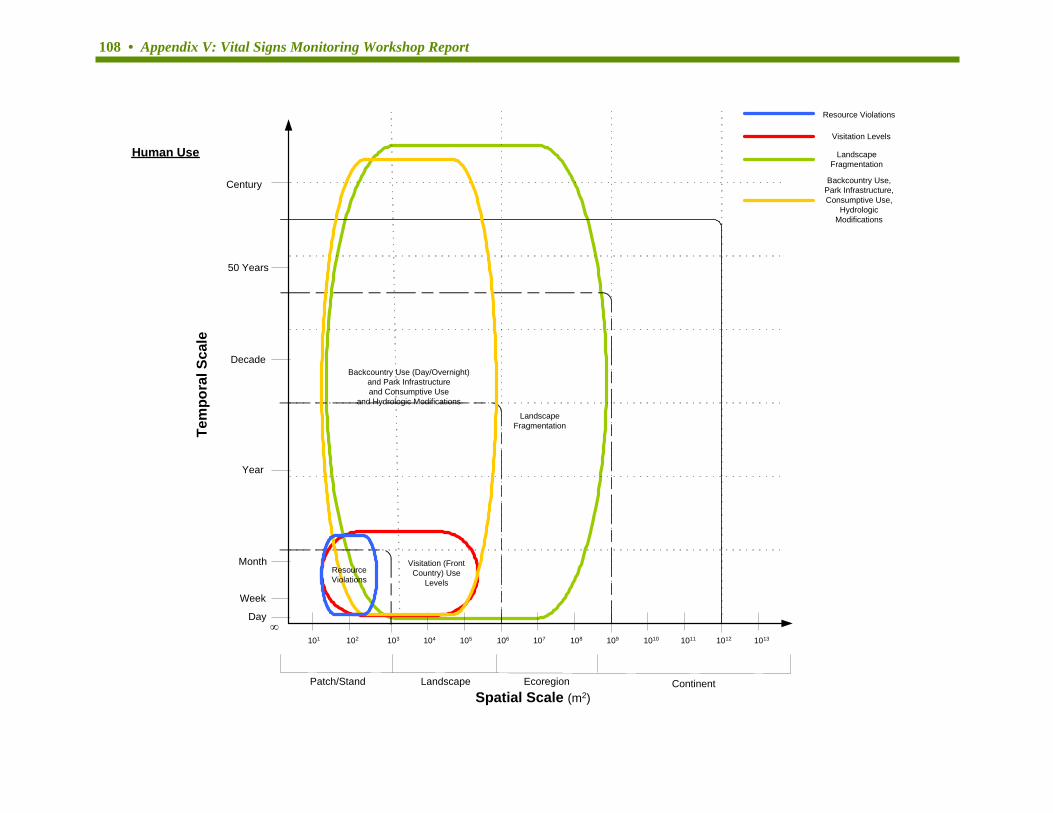
108 • Appendix V: Vital Signs Monitoring Workshop Report
LandscapeFragmentation
Spatial Scale (m2)
Tem
pora
l Sca
leCentury
Decade
Year
Month
Week
Day
Patch/Stand Landscape Ecoregion Continent
∞
50 Years
101 102 103 104 105 106 107 108 109 1010 1011 1012 1013
Visitation (FrontCountry) Use
Levels
Backcountry Use (Day/Overnight)and Park Infrastructureand Consumptive Use
and Hydrologic Modifications
Resource Violations
Visitation Levels
LandscapeFragmentation
Backcountry Use,Park Infrastructure,Consumptive Use,
HydrologicModifications
Human Use
ResourceViolations
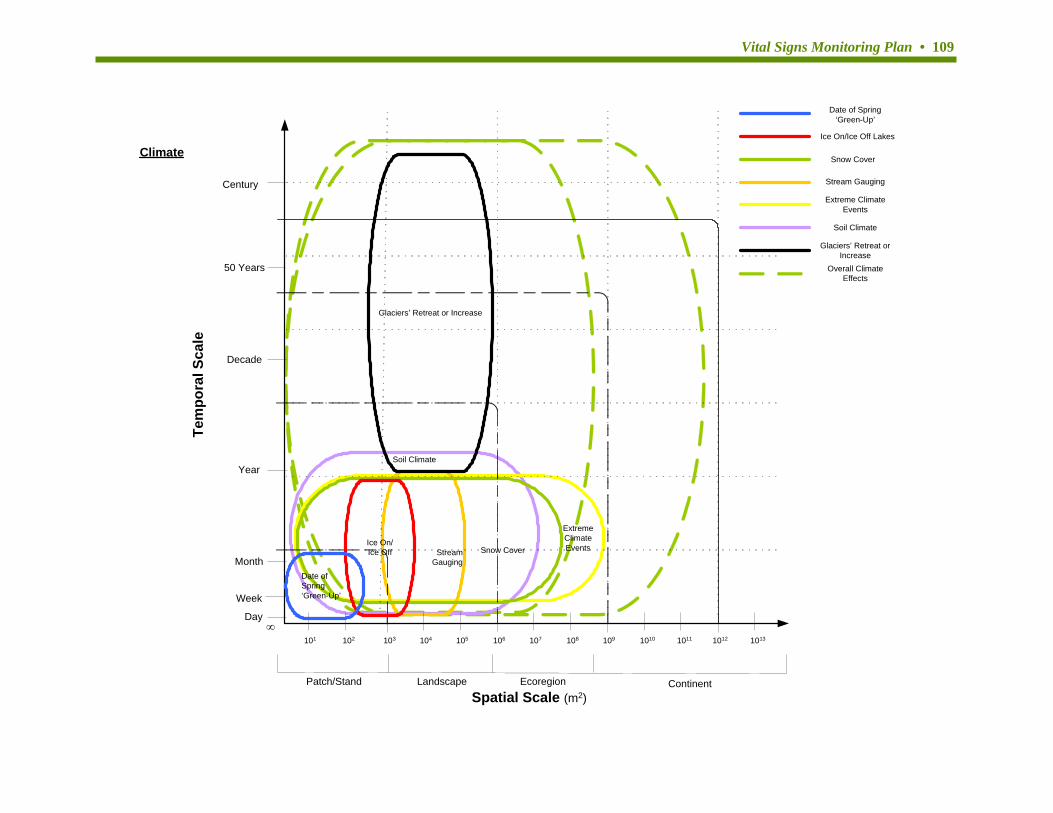
Vital Signs Monitoring Plan • 109
Soil Climate
ExtremeClimateEventsStream
GaugingSnow Cover
Spatial Scale (m2)
Tem
pora
l Sca
leCentury
Decade
Year
Month
Week
Day
Patch/Stand Landscape Ecoregion Continent
∞
50 Years
101 102 103 104 105 106 107 108 109 1010 1011 1012 1013
Date of Spring‘Green-Up’
Ice On/Ice Off Lakes
Snow Cover
Stream Gauging
Climate
Ice On/Ice Off
Date of Spring ‘Green-Up’
Glaciers’ Retreat or Increase
Overall ClimateEffects
Glaciers’ Retreat orIncrease
Soil Climate
Extreme ClimateEvents
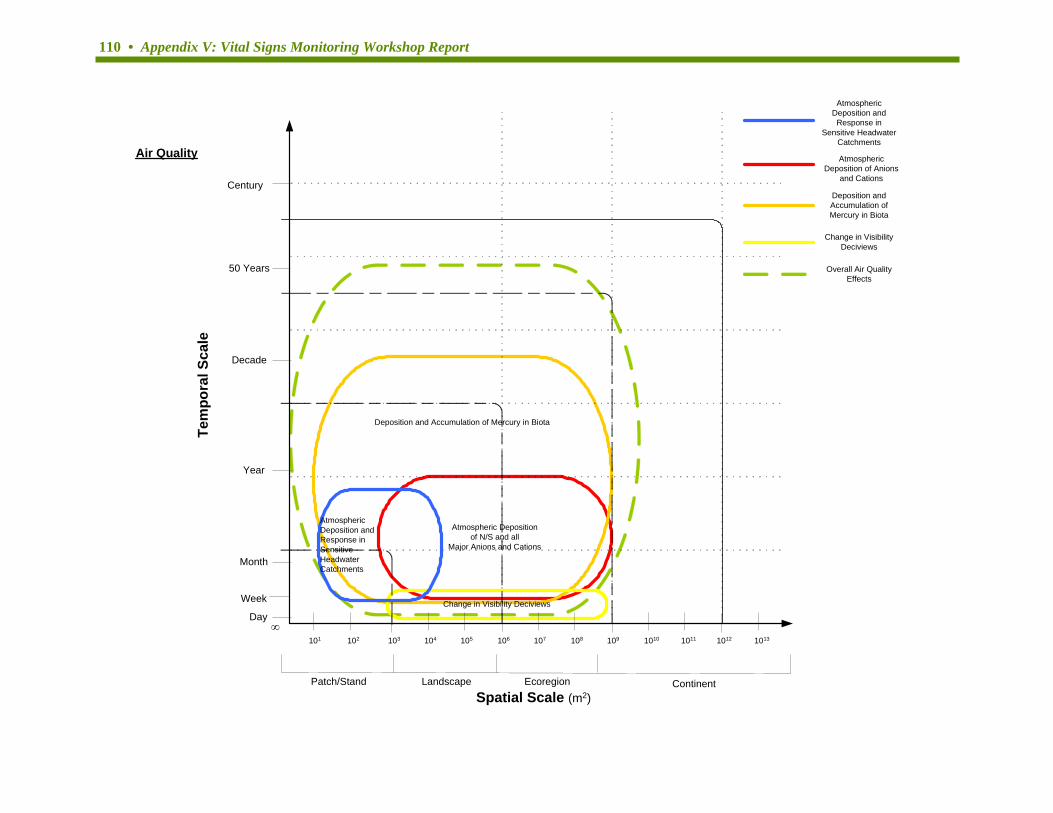
110 • Appendix V: Vital Signs Monitoring Workshop Report
Atmospheric Depositionof N/S and all
Major Anions and Cations
Deposition and Accumulation of Mercury in Biota
Change in Visibility Deciviews
Spatial Scale (m2)
Tem
pora
l Sca
leCentury
Decade
Year
Month
Week
Day
Patch/Stand Landscape Ecoregion Continent
∞
50 Years
101 102 103 104 105 106 107 108 109 1010 1011 1012 1013
AtmosphericDeposition and
Response inSensitive Headwater
Catchments
AtmosphericDeposition of Anions
and Cations
Deposition andAccumulation ofMercury in Biota
Air Quality
AtmosphericDeposition andResponse inSensitiveHeadwaterCatchments
Overall Air QualityEffects
Change in VisibilityDeciviews
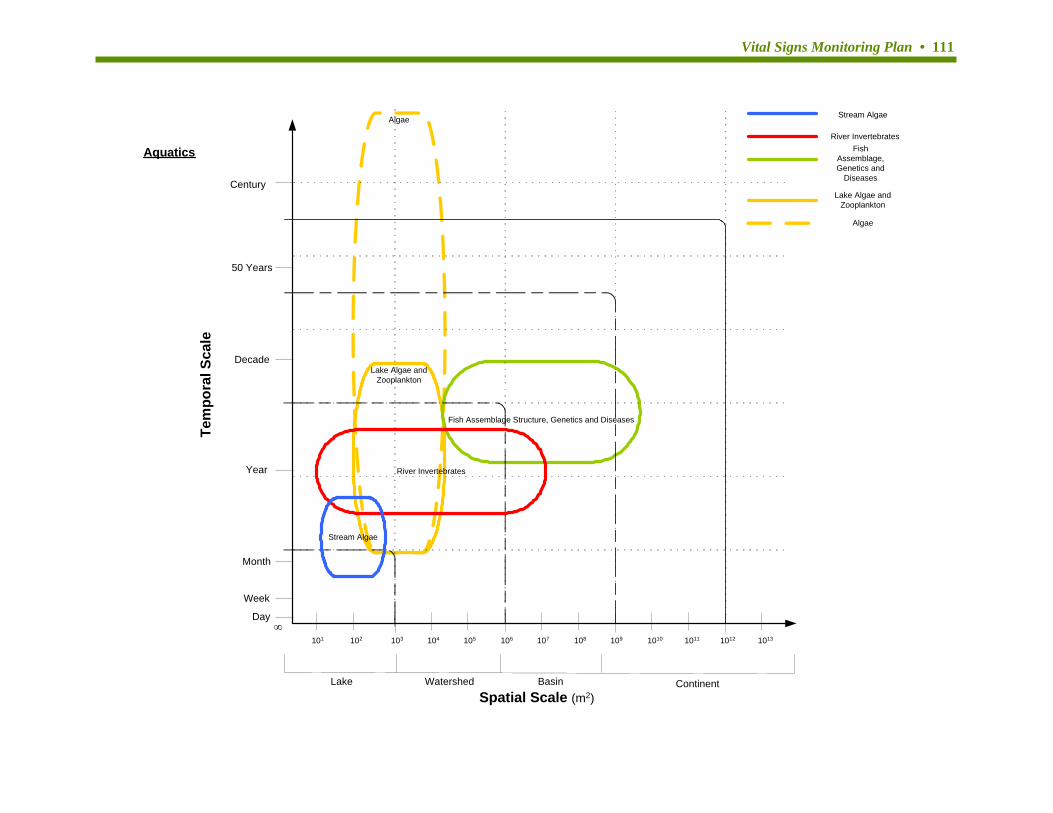
Vital Signs Monitoring Plan • 111
Algae
Lake Algae andZooplankton
Fish Assemblage Structure, Genetics and Diseases
Spatial Scale (m2)
Tem
pora
l Sca
leCentury
Decade
Year
Month
Week
Day
Lake Watershed Basin Continent
∞
50 Years
101 102 103 104 105 106 107 108 109 1010 1011 1012 1013
River Invertebrates
Stream Algae
River InvertebratesFish
Assemblage,Genetics and
Diseases
Lake Algae andZooplankton
Aquatics
Stream Algae
Algae
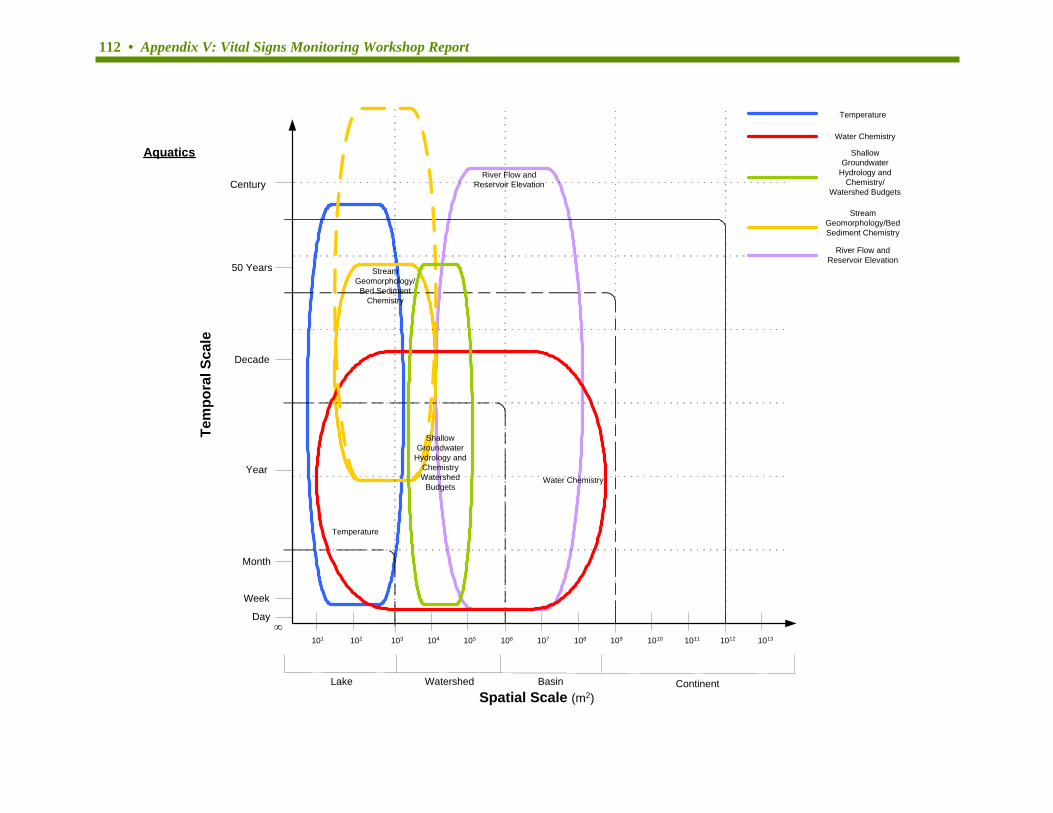
112 • Appendix V: Vital Signs Monitoring Workshop Report
Temperature
River Flow andReservoir Elevation
StreamGeomorphology/
Bed SedimentChemistry
Spatial Scale (m2)
Tem
pora
l Sca
leCentury
Decade
Year
Month
Week
Day
Lake Watershed Basin Continent
∞
50 Years
101 102 103 104 105 106 107 108 109 1010 1011 1012 1013
Water Chemistry
Temperature
Water Chemistry
ShallowGroundwater
Hydrology andChemistry/
Watershed Budgets
StreamGeomorphology/BedSediment Chemistry
Aquatics
River Flow andReservoir Elevation
ShallowGroundwater
Hydrology andChemistryWatershed
Budgets
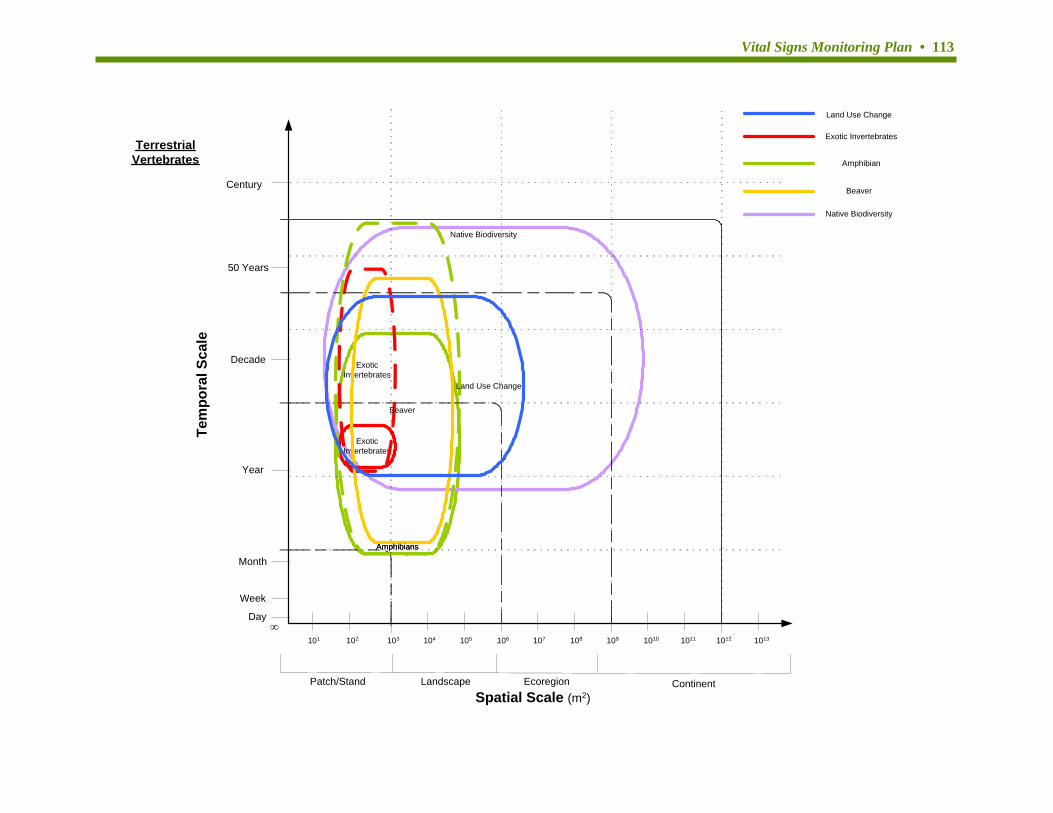
Vital Signs Monitoring Plan • 113
Amphibians
Native Biodiversity
Spatial Scale (m2)
Tem
pora
l Sca
leCentury
Decade
Year
Month
Week
Day
Patch/Stand Landscape Ecoregion Continent
∞
50 Years
101 102 103 104 105 106 107 108 109 1010 1011 1012 1013
ExoticInvertebrates
Land Use Change
Exotic Invertebrates
Amphibian
Beaver
TerrestrialVertebrates
Native Biodiversity
ExoticInvertebrates
Beaver
Amphibians
Land Use Change
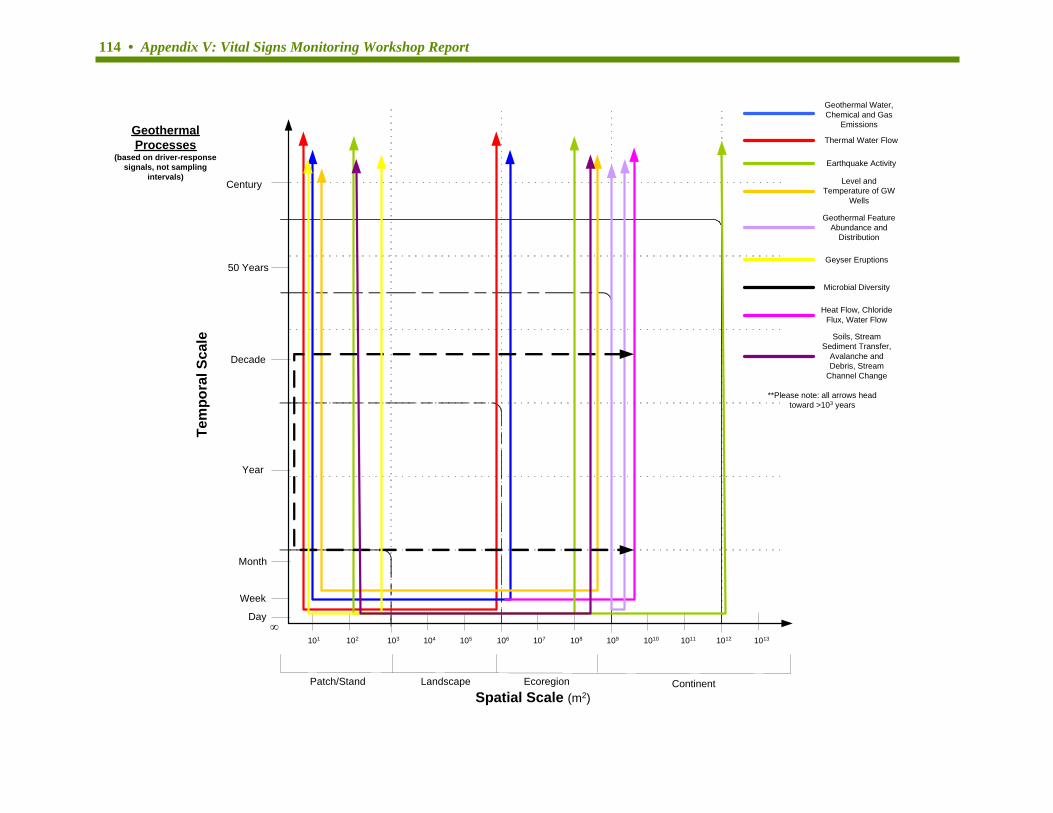
114 • Appendix V: Vital Signs Monitoring Workshop Report
Spatial Scale (m2)
Tem
pora
l Sca
leCentury
Decade
Year
Month
Week
Day
Patch/Stand Landscape Ecoregion Continent
∞
50 Years
101 102 103 104 105 106 107 108 109 1010 1011 1012 1013
Geothermal Water,Chemical and Gas
Emissions
Thermal Water Flow
Earthquake Activity
Level andTemperature of GW
Wells
GeothermalProcesses
(based on driver-responsesignals, not sampling
intervals)
Geothermal FeatureAbundance and
Distribution
Heat Flow, ChlorideFlux, Water Flow
Microbial Diversity
Geyser Eruptions
Soils, StreamSediment Transfer,
Avalanche andDebris, Stream
Channel Change
**Please note: all arrows headtoward >103 years
Vital Signs Monitoring Plan • 1
APPENDIX VI: PROTOCOL DEVELOPMENT SUMMARIES
TABLE OF CONTENTS Amphibian ...................................................................................................... 2 Aridland seeps & springs................................................................................ 5 Aridland soil stability & structure ................................................................ 10 Climate .......................................................................................................... 14 Integrated water quality................................................................................ 19 Invasive plants............................................................................................... 26 Landbirds ...................................................................................................... 34 Land use ........................................................................................................ 38 Regulatory water quality............................................................................... 42 Streamflow .................................................................................................... 50 Whitebark pine .............................................................................................. 54
September 1, 2005

2 • Appendix VI: Protocol Development Summaries
PROTOCOL DEVELOPMENT SUMMARY Protocol: Amphibians Parks Where Protocol will be Implemented: YELL, GRTE, BICA Justification/Issues being addressed: Declines in the abundance and distribution of amphibians have been widely recognized as an emerging issue (Stuart et al. 2004). Concerns regarding such declines resulted in the funding of the Amphibian Research and Monitoring Initiative (ARMI) in 2000. ARMI is a national program coordinated by the U.S. Geological Survey (USGS), with the goal of better understanding the dynamics of amphibian population trends and providing the information necessary to guide management decisions to manage and conserve amphibian populations. Our specific monitoring objectives are intended to answer the following question(s): Is the occurrence of amphibians decreasing within the Greater Yellowstone Network of parks (GRYN) and is there any evidence regarding likely underlying causes of any observed declines that might warrant further directed research or management actions consistent with National Park Service policies? Although our specific monitoring objectives are targeted for inferences to the GRYN, they are also intended to complement broader objectives of ARMI that would seek to answer similar questions at more regional and/or national scales. Monitoring Questions Addressed by the Protocol: Some of the specific monitoring questions that will be addressed by this protocol include:
• What is the proportion of breeding sites (wetlands) within the GRYN occupied by each species of amphibian?
• What are the extinction and colonization rates of breeding sites within the GRYN, and are these rates associated primarily with whether or not sites are inundated within a given year?
Specific Monitoring Objectives: Objective 1. To estimate the proportion of catchments (approximately 8th order) within YELL and GRTE used for breeding by each of each species of amphibian and to estimate the rate at which use of these sites for breeding is changing over time (except boreal toads, see Objective # 2). Justification/Rationale for this objective.-- Actual population estimates for most amphibians are not logistically feasible due to substantial variability in detection of adults and in highly variable populations both within and among years (Corn et al. 2004). The use of sites for breeding should provide a more consistent measure of the occupancy of sites, at least for this life stage. Objective 2. To estimate the proportion of catchments (approximately 8th order) and targeted
September 1, 2005

Vital Signs Monitoring Plan • 3
breeding sites within YELL and GRTE used for breeding by boreal toads (Bufo boreas) and to estimate changes in occupancy of targeted breeding sites over time. Justification/Rationale for this objective.-- Boreal toads present a special case in that they are sufficiently rare so as to make estimation of rates of change difficult from a sampling scheme with a targeted scope of inference to the entire parks. Preliminary sampling indicates that the proportion of sites occupied by boreal toads is too low to enable reliable estimation of rates of change. Thus, the major distinction between this objective for boreal toads and that of the other species is that our sampling frame for change over time would be restricted to a targeted set of known potential breeding locations. This will limit our inference to change over time for these specific sites, but these probably represent the primary breeding sites for this species. Objective 3. To estimate the proportion of potential breeding sites (i.e. wetlands) that are minimally suitable for breeding (i.e., have standing water) in any given year. Justification/Rationale for this objective.-- For reliable comparisons of change in occupancy over time, the sampling frame must be the same from year to year. The occupancy estimator carries the assumption that sites have a non-zero probability of being occupied at the time that estimates are made. However, during some years, some wetlands have a probability of zero that amphibians will be breeding, given the hydrologic fluctuation that can occur. This objective is intended to account for that dynamic by incorporating the wetland dynamic into the likelihood whereby the occupancy estimator will be conditional on those sites with a non-zero probability of breeding. BASIC APPROACH: We are currently working with the USGS and the Idaho State University to refine a protocol that will meet the needs of ARMI as well as the GRYN. ARMI has widely adopted use of occupancy as their basic approach. Occupancy provides a measure that: (1) explicitly enables estimation of local extinctions and colonization of sites; (2) takes into account detectability of individual species; (3) enables estimation of confidence intervals; (4) is comparable across sites; and (5) is becoming a widely accepted approach for reliable estimates of occupancy. The general design will be a cluster design, with the primary design unit approximately equivalent to an 8th order. The size of these units resulted from an extensive collaborative effort with the USGS EROS Data Center as well as field testing as part of a pilot effort. All wetlands will be surveyed within each unit. The general suitability of hydrologic units—based on the quantity of NWI wetland types within each unit—will be used to define unequal sampling probabilities. This is necessary because most hydrologic units within the parks are of poor quality for amphibians. Thus, using an unequal inclusion probability will enable us to invest most of our resources in those units that are most important to amphibians. The overall design will likely be modified for BICA because most of the suitable amphibian habitat is contained within a series of impounded wetlands. Monitoring in BICA will consist of targeted surveys conducted collaboratively with the Wyoming Game and Fish Commission.
September 1, 2005

4 • Appendix VI: Protocol Development Summaries
Principal Investigators and NPS Lead: The NPS lead within the GRYN is Robert E. Bennetts, Greater Yellowstone Network, Box 173492, 229 AJM Johnson, Montana State University, Bozeman, MT 59717, tel: (406) 994-2281, fax: (406) 994-4160, Email: [email protected]. Our primary USGS cooperator is Steve Corn, who is the USGS Principle Investigator for ARMI within the Northern Rocky Mountain Region. Our primary cooperator with Idaho State University is Chuck Peterson, who has been conducting research and monitoring of amphibians within the Greater Yellowstone Ecosystem for the past two decades. Development Schedule, Budget, and Expected Interim Products: The GRYN recently hosted a small workshop to address several issues of concern. Participants included staff members from the GRYN, GRYN network parks, ARMI, University of Idaho, and the USGS-Patuxent Wildlife Research Center. Based on the outcome of the workshop and subsequent workshops, we modified the existing ARMI methods to an approach that will be consistent throughout the Rocky Mountains from Montana to Colorado. We have just completed field testing of those modifications in collaboration with ARMI during FY05, with an expectation for a full protocol ready for review in fall of 2005. We anticipate full implementation by spring of 2006. The total cost to NPS will be approximately $35,000 per year with additional funds at least equivalent to the NPS contribution coming from USGS ARMI program. Literature Cited: Stuart SN, Chanson JS, Cox NA, Young BE, Rodrigues ASL, Fischman DL, Waller RW. 2004.
Status and trends of amphibian declines and extinctions worldwide. Science 306:1783-1786.
September 1, 2005

Vital Signs Monitoring Plan • 5
Protocol Development Summary Protocol: Aridland Seeps and Springs Parks Where Protocol Will Be Implemented: BICA Justification/Issues Being Addressed: Seeps and springs are often the only localized water source within a desert/arid environment during the drier periods of the year, since there are few perennial tributaries within the NRA. Also, Bighorn Lake (a reservoir behind Yellowtail Dam) is located within a deep canyon with vertical cliffs through much of the NRA and is difficult to access, and the water level is subject to tremendous variability depending on yearly and seasonal irrigation demands and on-going water rights disputes. Seeps and springs maintain the flow in many streams and in some cases are the sole sources for tributaries feeding Bighorn Lake. Plant and insect populations thrive in seeps and springs. By supporting the base of the food chain, seeps and springs indirectly support upland communities through trophic energy transfer. Some springs support known rare, endemic flora (e.g., Sullivantia hapemanii var. hapemanii) and possibly rare invertebrates. Other fauna are potentially strongly dependent on these scarce and vital water sources.
There are threats to seeps and springs within Bighorn Canyon that could reduce their potential to support wildlife, biodiversity, and streamflow. These threats include trampling and herbivory of vegetation and degradation of water quality by human visitors and ungulates (cattle and wild horses), and potential degradation of water quality and loss of water quantity through influence of industrial and agricultural activities and changes in water rights both inside and outside of the NRA on local and regional aquifers.
Of the three Greater Yellowstone Network units, Bighorn Canyon NRA is most susceptible to long-term climate changes affecting the primary water sources away from the mainstem of Bighorn River and Bighorn Lake behind Yellowtail Dam.
Specific Monitoring Questions and Objectives to be Addresses by the Protocol:
Specific monitoring questions are: 1. What are the current hydrological and ecological condition of the seeps and springs in
BICA? 2. Which springs are affected by natural climatic changes or stochastic events vs. human-
caused disturbance? And more specifically: 3. Are there springs/seeps vulnerable to degradation from human activities both inside and
outside the park? 4. Are the springs/seeps vulnerable to climatic changes? 5. Are there specific activities that degrade water quality, reduce water quantity (discharge)
or change hydroperiod characteristics?
Specific monitoring objectives are: Objective 1: Estimate discharge, variation in discharge, and change in discharge over time of seeps and springs within BICA, taking into account seasonal annual, and decadal variation.
September 1, 2005
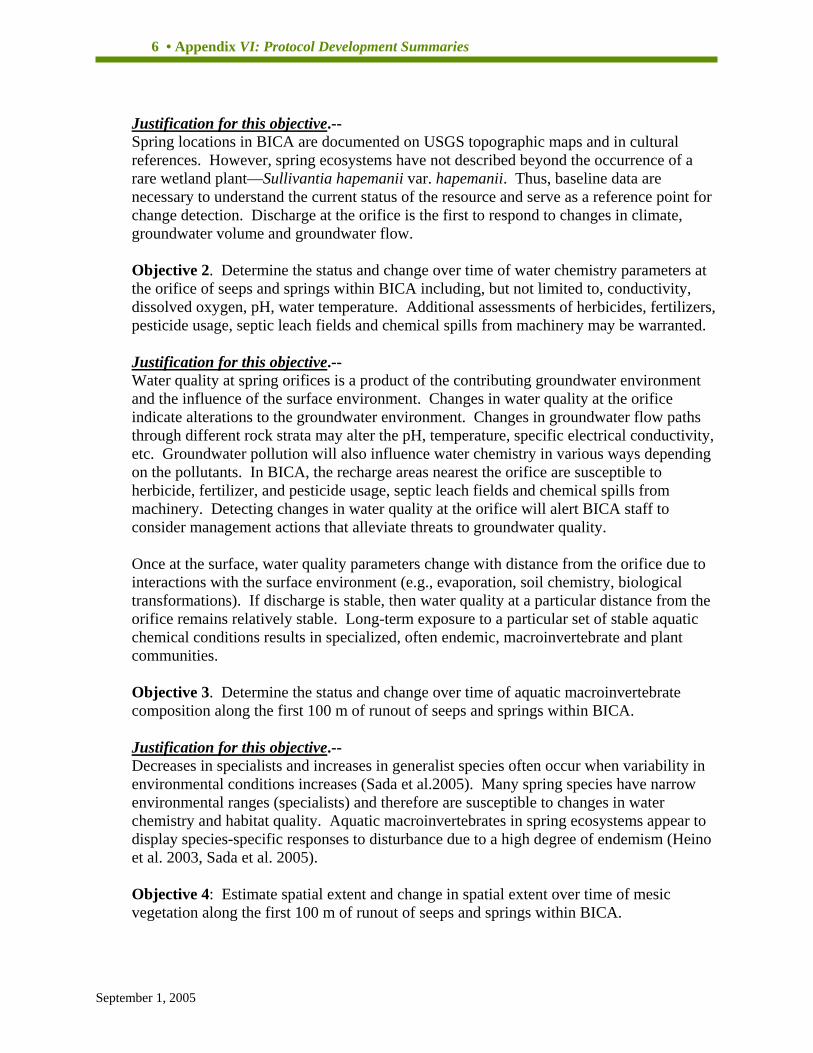
6 • Appendix VI: Protocol Development Summaries
Justification for this objective.-- Spring locations in BICA are documented on USGS topographic maps and in cultural references. However, spring ecosystems have not described beyond the occurrence of a rare wetland plant—Sullivantia hapemanii var. hapemanii. Thus, baseline data are necessary to understand the current status of the resource and serve as a reference point for change detection. Discharge at the orifice is the first to respond to changes in climate, groundwater volume and groundwater flow. Objective 2. Determine the status and change over time of water chemistry parameters at the orifice of seeps and springs within BICA including, but not limited to, conductivity, dissolved oxygen, pH, water temperature. Additional assessments of herbicides, fertilizers, pesticide usage, septic leach fields and chemical spills from machinery may be warranted.
Justification for this objective.-- Water quality at spring orifices is a product of the contributing groundwater environment and the influence of the surface environment. Changes in water quality at the orifice indicate alterations to the groundwater environment. Changes in groundwater flow paths through different rock strata may alter the pH, temperature, specific electrical conductivity, etc. Groundwater pollution will also influence water chemistry in various ways depending on the pollutants. In BICA, the recharge areas nearest the orifice are susceptible to herbicide, fertilizer, and pesticide usage, septic leach fields and chemical spills from machinery. Detecting changes in water quality at the orifice will alert BICA staff to consider management actions that alleviate threats to groundwater quality. Once at the surface, water quality parameters change with distance from the orifice due to interactions with the surface environment (e.g., evaporation, soil chemistry, biological transformations). If discharge is stable, then water quality at a particular distance from the orifice remains relatively stable. Long-term exposure to a particular set of stable aquatic chemical conditions results in specialized, often endemic, macroinvertebrate and plant communities. Objective 3. Determine the status and change over time of aquatic macroinvertebrate composition along the first 100 m of runout of seeps and springs within BICA. Justification for this objective.-- Decreases in specialists and increases in generalist species often occur when variability in environmental conditions increases (Sada et al.2005). Many spring species have narrow environmental ranges (specialists) and therefore are susceptible to changes in water chemistry and habitat quality. Aquatic macroinvertebrates in spring ecosystems appear to display species-specific responses to disturbance due to a high degree of endemism (Heino et al. 2003, Sada et al. 2005). Objective 4: Estimate spatial extent and change in spatial extent over time of mesic vegetation along the first 100 m of runout of seeps and springs within BICA.
September 1, 2005
Vital Signs Monitoring Plan • 7
Justification for this objective.-- Changes in extent of spring wetlands and riparian areas along spring runout correspond to water flow changes whether natural (climate) or anthropogenic (water use). Lowered water tables, decreased flows and shorter flow duration result in smaller spring areas (Thompson et al. 2002). Because riparian and wetland plant communities vary with groundwater depth, changes in groundwater levels may result in shifts in community composition of spring ecosystems (Grootjans et al. 1988, Hendrickson and Minckley 1985). Numerous studies across the arid West have documented wetland and spring ecosystem shrinkage and losses in biodiversity due to groundwater depletion, regardless of cause. Objective 5: Determine species composition and change in composition over time of vegetation along the first 100 m of runout of seeps and springs within BICA. Justification for this objective.-- Decreases in specialists and increases in generalist species often occur when variability in environmental conditions increases (Sada et al. 2005). A decrease in spring-related biodiversity could be indicated by a corresponding increase in upland or introduced aquatic and riparian species. While water quality and aquatic macroinvertebrates respond to acute environmental changes, soil chemistry and spring vegetation composition appear to respond to sustained environmental changes. Monitoring soil conditions in spring systems is fairly destructive which makes it a less appropriate monitoring attribute. Changes in spring vegetation composition indicate potential long-term, if not permanent, damage to spring ecosystems with the least amount of impact to the system. This objective owul also enable us to determine the extent of native vs non-native plant species changes in micro habitat diversity.
BASIC APPROACH: Most spring and seep locations are known. A brief inventory to locate additional springs and seeps, especially along the canyon walls in the North District, has been undertaken. Threats to ecosystem functions of seeps and springs have be identified, including: long-term climate changes; groundwater withdrawals and additions of polluted water; additional or changing water rights on lands outside NRA boundary that are hydrologically connected to BICA seeps and springs; and effects of human and ungulate activities. Twenty-four springs were visited. Four springs are proposed as candidates for monitoring: one seep, one cattle-impaired spring, one pristine spring and one human-impacted spring. The overall sampling design will be developed cooperatively among the cooperators and Rob Bennetts. We will have alternative sampling design packages such that the costs and feasibility of implementation can be considered in light of trade-offs among exclusion of specific monitoring objectives, spatial or temporal extent of sites monitored and levels of precision or type II errors. Field SOPs will be developed to identify changes in flow, water quality and aquatic and riparian vegetation, specific rare and/or sensitive plant species (and possibly specific invertebrates) associated with seeps and springs. Other standard operating procedures from protocols currently being developed will be incorporated as appropriate. These may include water quality and quantity SOPS from other spring/seep protocols (e.g., from NCPN), vegetation measurement SOPs from the landbird monitoring protocol and SOPs from the water chemistry protocol.
September 1, 2005
8 • Appendix VI: Protocol Development Summaries
Principal Investigators and NPS Lead: Principal Investigators: Co-Principal Investigator Co-Investigator Brian McGlynn Department of Land Resources and Environmental Sciences Montana State University 334 Leon Johnson Hall Bozeman, MT 59717-3120 Phone: (406) 994-7690 Fax: (406) 994-3933 Email: [email protected]
Duncan Patten Big Sky Institute Montana State University 106 AJM Johnson Hall Bozeman, MT 59717 Phone: (406) 994-2784 Fax: (406) 994-5122 Email: [email protected]
Denine Schmitz Big Sky Institute Montana State University 106 AJM Johnson Hall Bozeman, MT 59717 Phone: (406) 994-6499 Fax: (406) 994-5122 Email: [email protected]
NPS Lead GRYN Project Technical Representative Cathie Jean Program Manager Greater Yellowstone Inventory and Monitoring Network P.O. Box 173492 229 AJM Johnson Montana State University Bozeman, MT 59717-3492 Phone: (406) 994-7530 Fax: (406) 994-4160 Email: [email protected]
Elizabeth Crowe Project Coordinator Greater Yellowstone Inventory and Monitoring Network P.O. Box 173492 229 AJM Johnson Montana State University Bozeman, MT 59717-3492 Phone: (406) 994-7202 Fax: (406) 994-4160 Email: [email protected]
Development Schedule, Budget and Expected Interim Products: The sampling design and field data collection standard operating procedures as well as the data analysis and reporting protocols and final conceptual models will be completed by March 30, 2006. The cost of the task agreement with the cooperators is $57,500. There are also some costs associated with the salary for Elizabeth Crowe’s time as NPS project technical representative and Cathie Jean and NPS Lead, which are difficult to forecast accurately. Literature Cited: Bernaldez FG, Rey Benayas JM. 1992. Geochemical relationships between groundwater and
wetland soils and their effects on vegetation in central Spain. Geoderma 55:273-288. Bolen SC. 1964. Plant ecology of spring-fed salt marshes in Utah. Ecological Monographs
34:143-166. Bradley WG. 1970. The vegetation at Saratoga Springs, Death Valley National Monument,
California. Southwestern Naturalist(15):111-129.
September 1, 2005
Vital Signs Monitoring Plan • 9
Grootjans AP, van Diggelen R, Wassen MJ, Wiersinga WA. 1988. The effects of drainage on
groundwater quality and plant species distribution in stream valley meadows. Vegetatio 75:37-48.
Heino J, Muotka T, Mykra H, Paavola R, Hamalainen H, Koskenniemi E. 2003. Defining
macroinvertebrate assemblage types of headwater springs: implications for bioassessment and conservation. Ecological Applications 13:842-852.
Hendrickson DA, Minckley WL. 1985. Cienegas-vanishing climax communities of the American
Southwest. Desert Plants 6(3):131-175. Hershler R, Sada DW. 2002. Biogeography of Great Basin aquatic snails of the genus
Pyrgulopsis. Smithsonian Contributions to the Earth Sciences 33:255-276. Perla B, Stevens LE. 2003. Biodiversity and productivity as an undisturbed spring in comparison
with adjacent grazed riparian and upland habitats. In: Stevens LE, Meretsky VJ, editors. Every last drop: Ecology and conservation of springs ecosystems. Flagstaff, AZ: University of Arizona Press. p in press.
Sada DW, Fleishman E, Murphy DD. 2005. Associations among spring-dependent aquatic
assemblages and environmental and land use gradients in a Mojave Desert mountain range. Diversity and Distrubutions 11:91-99.
Thompson BC, Matusik-Rowan PL, Boykin KG. 2002. Prioritizing conservation potential of
arid-land montane natural springs and associated riparian areas. Journal of Arid Environments 50(4):527-547.
September 1, 2005
10 • Appendix VI: Protocol Development Summaries
Protocol Development Summary Protocol: Aridland Soil Structure and Stability Parks Where Protocol Will Be Implemented: BICA Justification/Issues Being Addressed: National Park Service staff at is concerned about the impacts of grazing animal populations on the structure and function of soils in Bighorn Canyon NRA. This concern is based on personal observations in the field and on the results of the rangeland health assessment of the Pryor Mountain Wild Horse Range (PMWHR) (Natural Resources Conservation Service 2004). The NRCS states that rangeland within the NRA portion of the PMWHR is in an unhealthy condition, reflecting attributes of the soils and plant communities that “may not be able to recover from degradation without energy inputs, such as mechanical alteration” (Natural Resources Conservation Service 2004). These poor soil conditions include: severe erosion, excessive loss of biological soil crust cover, and high bare soil and erosion pavement cover. The NRCS also states that “conditions are right for an explosion of noxious weeds” (Natural Resources Conservation Service 2004).
In aridlands, overgrazing by ungulates can cause soil compaction, loss of vegetation, loss of biological soil crust cover and diminishment of microbial activity and can ultimately lead to soil erosion (Belnap et al. 2001, Evenari 1981, Lee 1981, Metting 1991). Compaction of soils decreases water infiltration as well as reducing soil aggregates and pore space, which are important for soil stability and soil biota habitat (Belnap 1995, Lee 1981, Whitford 2002). Changes in aboveground vegetative cover or composition may result in reduction of belowground phytomass. In aridland environments, which have sporadic temporal and spatial precipitation, underground phytomass reserves are important reservoirs that provide resilience in face of erratic primary production rates (Evenari 1981). Loss of vegetative cover also reduces soil nitrogen retention (Hooper and Vitousek 1997, Tilman et al. 1997) and results in loss of food supply for soil bioturbators, such as ants and termites, which are essential for maintaining macropores and channels for water infiltration and redistributing and decomposing organic matter (Lee 1981, MacKay 1991, Polis and Yamashita 1991, West 1981).
Nitrogen is a limiting nutrient in aridland systems (Whitford 2002). Loss of biological soil crusts disrupts nitrogen and carbon cycles in interspaces between vascular plants (Belnap 1995, Harper and Pendelton 1993, Metting 1991). Biological soil crusts increase soil surface stability through the entrapment and binding together of soil particles by polysaccharides exuded by cyanobacteria and green algae and by lichen and moss rhizines (Belnap et al. 2001, Metting 1991, St. Clair and Johansen 1993). Accordingly, loss of biological crust cover decreases surface soil stability (Whitford 2002). Biological crusts also improve water infiltration on fine-textured soils (Metting 1991).
This initial assessment by the NRCS provides not only justification but a baseline to begin monitoring. Through development of a long-term monitoring protocol, we can provide more precise monitoring of soil structural and functional conditions. Long-term monitoring sites, sampled on a regular basis can also demonstrate whether range conditions correlate with short-
September 1, 2005

Vital Signs Monitoring Plan • 11
term (5-10 year) climatic changes in the NRA. This monitoring may also allow for more precise correlation of soil characteristics with increases and decreases in ungulate population sizes. Other studies in the PMWHR on the effects of grazing ungulates on vegetation (Fahnestock and Detling 2000, Fahnestock and Detling 2000, Gerhardt 2000, Gerhardt and Detling 2000) were conducted over such short time periods that results are ambiguous at best, and the studies did not apply to soil structure and function. Additionally, there is a proposal to expand the PMWHR into two more areas in BICA, the Sorenson Extension and East Trail Creek, both of which are north of the current National Park Unit boundary and both of which are currently in good condition. Should this extension occur, it would be opportune to install baseline monitoring sites before horses start grazing these areas and monitor conditions over time to supply information for future management decisions about grazing in the extension. Specific Monitoring Questions and Objectives to be Addresses by the Protocol: Specific monitoring questions are:
1. Are current soil structural and functional (nitrogen availability, soil moisture availability, wind and water erosion) attributes within the range of natural variability for different soil types?
2. Are there differences in soil structural and functional attributes and biological soil crust
structure and composition in areas of ungulate grazing ranges compared to areas outside of ungulate grazing ranges? – see #1 above
Specific monitoring objectives are:
1. Determine the status and trend of unprotected bare soil, i.e., without biological crust cover or armoring by rocks, between vascular plants on each soil mapping unit paired both inside and outside of the PMWHR at three-year intervals.
BASIC APPROACH: In FY2005 a literature review was completed, and threats and concerns were written. In July 2005 Dr. Jayne Belnap, world expert on biological soil crusts, who is helping to develop the soil monitoring protocols for the Northern Colorado Plateau and Southern Colorado Plateau Networks, joined GRYN and BICA staff on a two-day field trip to BICA to survey crusts in different soil mapping units inside and outside of the PMWHR and to discuss monitoring questions, objectives, sampling design and field methods.
NOTE: Communications Plan: This is an important Vital Sign to monitor, and we understand that it is a sensitive issue in that it involves the Pryor Mountain wild horse population. Thus, we will develop an appropriate communication plan along the same lines as the communication plan being developed for the Land use protocol. Principal Investigators and NPS Lead: The NPS lead is Elizabeth Crowe, Greater Yellowstone Network, P.O. Box 173492, 229 AJM Johnson, Montana State University, Bozeman, MT 59717-3492, Phone: (406) 994-7202, Fax: (406) 994-4160, Email: [email protected].
September 1, 2005
12 • Appendix VI: Protocol Development Summaries
Development Schedule and Expected Interim Products:
FY2005-2006 – planning phase; development of protocol FY2006 – pilot of sampling design and field procedures FY2007 – approval of final protocol and start implementation
Literature Cited: Belnap J. 1995. Surface disturbances: their role in accelerating desertification. Environmental
Monitoring and Assessment 37:39-57. Belnap J, Kaltenecker JH, Rosentreter R, Williams J, Leonard S, Eldridge D. 2001. Biological
Soil Crusts: Ecology and Management. Denver, Colorado: USDI-Bureau of Land Management. 110 p.
Evenari M. 1981. Synthesis. In: Goodall DW, Perry RA, Howes KMW, editors. Arid-land
ecosystems: structure, functioning and management. Cambridge: Cambridge University Press. p 555-587.
Fahnestock JT, Detling JK. 2000. The influence of herbivory on plant cover and species
composition in the Pryor Mountains Wild Horse Range, USA. In: Singer FJ, Schoenecker KA, editors. Managers' summary - Ecological studies of the Pryor Mountain Wild Horse Range, 1992-1997. Fort Collins, CO: U.S. Geological Survey, Midcontinent Ecological Science Center. p 37-50.
Fahnestock JT, Detling JK. 2000. Plant responses to defoliation and resource supplementation in
the Pryor Mountains. In: Singer FJ, Schoenecker KA, editors. Managers' summary - Ecological studies of the Pryor Mountain Wild Horse Range, 1992-1997. Fort Collins, CO: U.S. Geological Survey, Midcontinent Ecological Science Center. p 51-62.
Gerhardt T. 2000. Plant cover species richness in the Pryor Mountain Wild Horse Range - 1998.
In: Singer FJ, Schoenecker KA, editors. Managers' summary - Ecological studies of the Pryor Mountain Wild Horse Range, 1992-1997. Fort Collins, CO: U.S. Geological Survey, Midcontinent Ecological Science Center. p 63-69.
Gerhardt T, Detling JK. 2000. Summary of vegetation dynamics at the Pryor Mountain Wild
Horse Range, 1992-1996. In: Singer FJ, Schoenecker KA, editors. Managers' summary - Ecological studies of the Pryor Mountain Wild Horse Range, 1992-1997. Fort Collins, CO: U.S. Geological Survey, Midcontinent Ecological Science Center. p 3-36.
Harper KT, Pendelton RL. 1993. Cyanobacteria and cyanolichens: can they enhance availability
of essential minerals for higher plants? Great Basin Naturalist 53(1):59-72. Hooper DU, Vitousek PM. 1997. The effects of plant composition and diversity on ecosystem
processes. Science 277:1302-1305.
September 1, 2005
Vital Signs Monitoring Plan • 13
Lee KE. 1981. Effects of biotic on abiotic components. In: Goodall DW, Perry RA, Howes KMW, editors. Arid-land ecosystems: structure, functioning and management. Cambridge: Cambridge University Press. p 105-123.
MacKay WP. 1991. The role of ants and termites in desert communities. In: Polis GA, editor.
Ecology of Desert Communities. Tucson, Arizona: The University of Arizona Press. p 113-150.
Metting B. 1991. Biological surface features of semiarid lands and deserts. In: Skujins J, editor.
Semiarid Lands and Deserts: Soil Resource and Reclamation. New York: Marcel Dekker, Inc. p 257-293.
Natural Resources Conservation Service (US). 2004. Pryor Mountain Wild Horse Range Survey
and Assessment. Bozeman. 148 p. Polis GA, Yamashita T. 1991. The ecology and importance of predaceous arthropods in desert
communities. In: Polis GA, editor. The Ecology of Desert Communities. Tucson: The University of Arizona Press. p 180-222.
St. Clair L, Johansen JR. 1993. Introduction to the symposium on soil crust communities. Great
Basin Naturalist 53(1):1-4. Tilman D, Knops J, Wedin D, Reich P, Ritchie M, Siemann E. 1997. The influence of functional
diversity and composition on ecosystem processes. Science 277:1300-1302. West NE. 1981. Nutrient cycling in desert ecosystems. In: Goodall DW, Perry RA, Howes
KMW, editors. Arid-land ecosystems: structure, functioning and management. Cambridge: Cambridge University Press. p 301-324.
Whitford W. 2002. Ecology of Desert Systems. San Diego: Academic Press. 343 p.
September 1, 2005
14 • Appendix VI: Protocol Development Summaries
PROTOCOL DEVELOPMENT SUMMARY Protocol: Climate Parks Where Protocol will be Implemented: YELL, GRTE, BICA. Justification/Issues being addressed: Climate is a primary driver of almost all physical and ecological processes in the Greater Yellowstone Network (GRYN). Climate controls ecosystem fluxes of energy and matter as well as the geomorphic and biogeochemical processes underlying the distribution and structure these ecosystems (Jacobson et al. 1997, Schlesinger 1997, Bonan 2002). The effects of climate are especially visible in the strong zonation and steep elevational gradients displayed by vegetation types in the Greater Yellowstone Ecosystem (GYE) (Despain 1990, Whitlock 1993). Conceptual system models for the GRYN have also emphasized the influence of climate on other vital signs in the region (NPS 2003). Because YELL and GRTE are major sources of runoff for the Columbia and Missouri River Basins, climate variability in the GRYN has profound implications across large portions of North America. Proxy records from archives such as glacial ice, lake sediments, tree rings and fossil corals show that, in both the recent and distant past, the earth’s climate has varied significantly over timescales from months to millennia. Studies using combinations of instrumental records and paleo-proxies confirm, however, that global climate has changed rapidly over the 20th century and that the speed of these changes exceeds that of most previous fluctuations (Mann et al. 1999, IPCC 2001, USGCRP 2003). Global surface temperatures, in particular, have risen by 0.6 ºC ± 0.2 over the past century (IPCC 2001). Moreover, the bulk of scientific evidence indicates that this rise in global temperatures is related to human activities. These global-scale changes will inevitably lead to significant alterations of Greater Yellowstone regional climate. Changing regional climate will, in turn, have a tremendous effect on natural systems in the GYE (Bartlein et al. 1997, Baron 2002, Wagner 2003). It is imperative that the parks of the GRYN have a climate monitoring system in place that allows for the detection and characterization of GYE climate change and provides climate data for use in monitoring and predicting the dynamics of other vital signs. Weather and climate are also among the primary drivers of floods, fires and avalanches (NRC 1990, Singh 1996, Casale and Margotini 1999, Baker 2003). Timely and accurate weather and climate information can aid in predicting their occurrence and behavior, thus improving human safety and reducing negative economic impacts. Development and maintenance of weather and climate monitoring networks will provide invaluable information for the scientific study of these events. Monitoring Questions Addressed by the Protocol: Some of the specific monitoring questions that will be addressed by this protocol include:
• How does the climate of the Greater Yellowstone Ecosystem vary at different spatial and temporal scales relevant to the management of natural resources and the dynamics of other vital signs?
September 1, 2005

Vital Signs Monitoring Plan • 15
• Has the climate of the GYE changed significantly from that of past decades to centuries as a result of natural or anthropogenic forcing?
• Do these changes in climate warrant specific research or management actions to monitor or predict their effects on natural resources and other vital signs?
Specific Monitoring Objectives: Objective 1: To measure precipitation and air temperature in the GRYN, including BICA, GRTE, YELL and surrounding areas. Justification/Rationale for this objective: This objective will provide baseline data and continuously updated datasets to facilitate the detection of regional climatic change (both natural and human induced) and its effects on natural systems in the Greater Yellowstone Ecosystem (GYE) as a whole. Precipitation and temperature exert strong controls over almost all physical and ecological processes in the GRYN. Temperature and precipitation control ecosystem fluxes of energy and matter as well as the geomorphic and biogeochemical processes underlying the distribution and structure of these ecosystems (Jacobson et al. 1997, Schlesinger 1997, Bonan 2002). Because YELL and GRTE are major sources of runoff for downstream areas throughout North America, precipitation and temperature variability in the GRYN have profound implications outside the region as well. Objective 2: To measure secondary climatic elements including wind speed/direction, relative humidity, soil temperatures and incoming solar radiation in the GRYN, including BICA, GRTE, YELL and surrounding areas. Justification/Rational for this Objective: These data will complement information on temperature and precipitation gathered under Objective 1. Like the primary climatic elements (precipitation and temperature), wind, humidity, soil temperature and solar radiation exert strong controls over physical and ecological processes in the GRYN. These data are also tied to a large number of key GRYN vital signs. In the case of whitebark pine, for example, relative humidity and wind speed/direction are both key factors in controlling the spread of white pine blister rust (Kendall and Keane 2001). Wind and humidity influence fire behavior while soil temperatures and incoming solar radiation help control plant species distribution and ecosystem productivity. BASIC APPROACH: Unlike most vital signs, GRYN climate has been monitored continuously for over 100 yr. There is also a legacy network of monitoring stations maintained by a variety of state and federal agencies. Protocol development has focused on determining (1) if the legacy network provides adequate sampling of spatial and temporal variability in GRYN climate and (2) how best to address shortfalls in the current system. Our basic approach involves a detailed analysis of existing climate monitoring stations in the GYE to determine if:
1. Current stations in the GRYN can adequately capture the key spatial and temporal components of climate variability in the region.
September 1, 2005
16 • Appendix VI: Protocol Development Summaries
2. Strata of management interest or scientific importance are being adequately sampled.
3. The array of stations adequately provides data needed to understand and predict the dynamics of other vital signs in the GRYN.
Item #1 is being addressed using a combination of literature review and an examination of existing instrumental- and paleo-climate records for the GRYN. We are also examining sampling regimes and instrumentation at each site to determine if they meet National Weather Service surface observer guidelines (http://www.nws.noaa.gov/directives/010/010.htm), or if they must be updated to meet these standards. Item #2 involves a series of geographic information systems (GIS) based analyses that will compare the locations of existing GYE climate stations (from Selkowitz 2003) against the vegetation and topography of the region. Item #3 may also include a series of GIS-based analyses comparing station locations to key habitat types, populations of interest, sensitive ecosystems, etc., but will center on consultations with other cooperators and NPS personnel familiar with GRYN vital signs. Efforts aimed at improving data transfer and archiving is also a key component of climate protocol development for the GRYN. Almost all high-quality climate data produced in the GRYN is now available via the Internet. These datasets, however, are hosted by a number of different agencies and navigating the vast amounts of available climate information can be a daunting and time-consuming task. To maximize the usefulness and accessibility of GRYN climate data, we are exploring means to achieve:
1. Rapid data transfer. 2. Improved quality control and network-wide quality control standards. 3. Development of software and Web access that allows users to develop a mesoscale or
synoptic view of current and past GRYN climate (see http://www.mesonet.org/ for examples).
The GRYN and Big Sky Institute also recently conducted a workshop in conjunction with MTNCLIM 2005, a research conference aimed at understanding interactions between climate and ecosystems in western North America (www.fs.fed.us/pnw/mtnclim). This workshop focused on integrating climate monitoring in the GRYN with efforts from surrounding networks. Principal Investigators and NPS Lead: The NPS Lead within the GRYN is Robert E. Bennetts, Greater Yellowstone Network, Box 173492, 229 AJM Johnson, Montana State University, Bozeman, MT 59717, tel: (406) 994-2281, fax: (406) 994-4160, Email: [email protected]. Our primary cooperator on this effort is Stephen T. Gray, Desert Laboratory, U.S. Geological Survey, 1675 West Anklam Road, Tucson AZ 85745, Phone: (520) 670-6821 ext. 119, email: [email protected].
September 1, 2005
Vital Signs Monitoring Plan • 17
Development Schedule, Budget, and Expected Interim Products: In June 2005 the network received a draft monitoring protocol from the cooperator. This protocol will be augmented with products derived from the Cooperative Agreement between NPS WASO and the Western Regional Climate Center which are expected in late 2006. The final protocol will be ready for peer review and full implementation in 2007. Literature Cited Baker WL. 2003. Fires and climate in forested landscapes of the U.S. Rocky Mountains. In:
Veblen TT, Baker WL, Montenegro G, Swetnam TW, editors. Fire and climatic change in temperate ecosystems of the western Americas. New York: Springer. p. 120-157.
Baron JS. 2002. Rocky Mountain Futures: An Ecological Perspective. Washington DC: Island
Press. Bartlein PJ, Whitlock C, Shafer S. 1997. Future climate in the Yellowstone National Park region
and its potential impact on vegetation. Conservation Biology 11:782-792. Bonan GB. 2002. Ecological Climatology: Concepts and Applications. Cambridge: Cambridge
University Press. Casale R, Margottini C (editors). 1999. Floods and landslides: integrated risk assessment. New
York: Springer-Verlag. Despain DG. 1990. Yellowstone vegetation: consequences of environment and history in a
natural setting. Boulder, CO: Roberts Rinehart, Inc. IPCC (Intergovernmental Panel on Climate Change). 2001. Contribution of working group I to
the third assessment report of the intergovernmental panel on climate change. In: Houghton JT, Ding Y, Griggs DJ, Noguer M, van der Linden PJ, Xiaosu D, editors. Climate change 2001: the scientific basis. Cambridge: Cambridge University Press.
Jacobson MC, Charlson RJ, Rodhe H, Orians GH. 2000. Earth system science: from
biogeochemical cycles to global change. San Diego: Academic Press. Kendall KC, Keane RE. 2001. Whitebark pine decline: Infection, mortality, and population
trends. Pages 221-242 in Tomback DF, Arno SF, Keane RE, editors. Whitebark pine communities: Ecology and restoration. Washington DC: Island Press.
Mann ME, Bradley RS, Hughes MK. 1999. Northern hemisphere temperatures during the past
millennium: inferences, uncertainties, and limitations. Geophysical Research Letters 26:759-762.
NPS (National Park Service). 2003. Vital signs monitoring plan: phase II report. Bozeman, MT:
National Park Service, Greater Yellowstone Inventory and Monitoring Network.
September 1, 2005

18 • Appendix VI: Protocol Development Summaries
NRC (National Research Council). 1990. Snow avalanche hazards and mitigation in the United States. Washington, DC: National Academy Press, National Research Council Committee on Ground Failure Hazards and Mitigation
Schlesinger WH. 1997. Biogeochemistry: an analysis of global change. San Diego: Academic
Press. Selkowitz D. 2003. Compilation and analysis of climate data in the Greater Yellowstone
Ecosystem/Bighorn Canyon Area: completed products, problems encountered, and recommendations for the future. Bozeman, MT: National Park Service, Greater Yellowstone Network.
Singh VP (editor). 1996. Hydrology of disasters. Dordrecht, The Netherlands: Kluwer Academic
Publishers. USGCRP (U.S. Global Change Research Program). 2003. Strategic plan for the U.S. climate
change science program. Washington, DC: NOAA-Climate Change Science Program. Wagner FH (editor). 2003. Rocky Mountain/Great Basin regional climate change assessment: a
report of the Rocky Mountain/Great Basin regional assessment team for the U.S. Global Change Research Program. Logan, UT: Utah State University.
Whitlock C. 1993. Postglacial vegetation and climate of Grand Teton and southern Yellowstone
National Parks. Ecological Monographs 63:173-198.
September 1, 2005

Vital Signs Monitoring Plan • 19
PROTOCOL DEVELOPMENT SUMMARY Protocol: Integrated Water Quality Parks Where Protocol will be Implemented: YELL, GRTE, BICA. Justification/Issues being addressed: Water quality monitoring is a fundamental tool in the management of freshwater resources. The chemical, physical and biological health of waters is considered of national value and is protected by the Federal Water Pollution Control Act. This act is designed to ensure that Americans have clean water for domestic, agricultural, commercial and recreational uses. Water quality monitoring helps ensure that a water body is suitable for its determined use. It can also be used for protective purposes to prevent degradation or to upgrade conditions. Chemical and physical tests give information that is accurate only at the moment the sample is taken. Physicochemical measures have predominated North American aquatic bioassements and monitoring programs despite the well-documented arguments that pollution assessment is primarily a biological problem. The use of macroinvertebrates as indicators of aquatic ecosystem health developed out of observations that specific taxa were restricted under certain environmental conditions (Richardson 1925, 1929 and Gaufin 1958). The presence of a mixed population of healthy aquatic insects usually indicates that the water quality has been good for some time. This then led to the development of a list of indicator organisms and the acceptance of using macroinvertebrates for use in water quality monitoring. Water resources are especially important in the Greater Yellowstone Network (GRYN) because of the Outstanding National Resource Water designation for Yellowstone and Grand Teton National Parks. These important places are headwaters to the Yellowstone and Snake River watershed. Water resources also provide important public recreational opportunities in Bighorn Canyon NRA, critically important plant and wildlife habitat, and unique scenic vistas within all three network parks. Aquatic resources across the GRYN face numerous and varied threats, including atmospheric deposition, altered hydrology, mining, agriculture, pollution from boats, non-native species, erosion, leaking underground storage tanks, improper sewage plant or drain field operations, and storm water runoff. Water quality monitoring to assess the effects of these threats has been underway for over 50 years, though not as a coordinated, comprehensive program focused on ecosystem health. Specific Monitoring Questions and Objectives Addressed by the Protocol Objective 1. Determine the status and trend of a primary set of water chemistry parameters including, but not limited to, conductivity, dissolved oxygen, pH, water temperature and discharge in perennial surface waters of all GRYN parks. Justification/Rationale for this objective.-- The initial status and variation of core water quality parameters provides the background reference point to which all subsequent data will be compared. Although these data do not provide a measure of completely pristine conditions, they
September 1, 2005
20 • Appendix VI: Protocol Development Summaries
do provide a measure of the status of aquatic systems at the start of the GRYN monitoring program. Objective 2. Determine levels of substrate composition and embeddedness in perennial surface waters of GRYN parks. Justification/Rationale for this objective.-- Sedimentation issues have been a concern in the parks for the past century. Sedimentation associated with grazing, construction (including roads), trail use and fire are of particular concern. Areas with steep slopes and geologically sensitive areas such as Mount Everts near Mammoth Hot Springs (YELL) and the Grand Canyon of the Yellowstone River (YELL) have been previously identified as areas of concern (www.nps.gov/yell/nature/nothernrange). Grazing of commercial livestock is of particular concern in GRTE. As of 2004, five ranches remain in the park with permits to graze 1,800 cows and horses on 36,000 acres of property (Smith 2004). Objective 3. Determine the status and trend in benthic macroinvertebrate communities in flowing perennial in surface waters of GRYN. Justification/Rationale for this objective.-- These data provide information on long-term trends in macroinvertebrate communities and will be used as an indicator of potential degradation. Changes in the macroinvertebrate community may indicate impacts (episodic events) on water quality missed in routine water chemistry monitoring. In addition, changes in the abundance or richness of macroinvertebrate may indicate changes in food-web dynamics that may impact both aquatic (fish) and terrestrial (birds, amphibians) ecosystems. Objective 4. Determine the status and trend in the acid-neutralizing capacity of high-risk alpine lakes of the GRYN and estimate the rate at which water chemistry is changing over time in response to atmospheric deposition. Factors that determine high risk have been recently assessed through a complimentary research program that will enable us to identify this subset of lakes. Justification/Rationale for this objective.-- Atmospheric deposition maps (for 1992 through 1999) of the Rocky Mountains show regions of high atmospheric deposition in the northern Rocky Mountains (Nanus and others 2003), including parts of Wyoming and Montana. High-elevation watersheds in the Rocky Mountains are particularly sensitive to the impacts of N-deposition because they are typically underlain by thin soils and resistant bedrock that provide little acid-neutralizing capacity, which makes the watersheds highly sensitive to chemical inputs (Williams and Tonnessen 2000, Clow and Sueker 2000, Nanus et al. 2003). Nitrogen deposition has been linked to high surface water nitrate levels, changes in zooplankton community composition (Barmuta et al. 1990), impacts on macroinvertebrate fauna (Kratz et al. 1994) and altered diatom composition (Williams and Tonnessen 2000, Lafrancois et al. 2003, Baron et al., 2000, Wolfe et al. 2001). Cutthroat and rainbow trout are particularly sensitive to acidic episodes that may result from nitrogen deposition (Baker et al. 1990). Current (2005) atmospheric deposition rates and proposed changes in atmospheric emissions, including increasing emissions from power plants and energy production near Grand Teton and Yellowstone, have the potential to further alter the chemistry of these aquatic ecosystems (Nanus et al. 2005).
September 1, 2005

Vital Signs Monitoring Plan • 21
Objective 5. Measure concentrations of polycyclic aromatic hydrocarbons (PAHs) and other constituents associated with two-stroke and four-stroke engines at targeted marinas within GRYN. Justification/Rationale for this objective.-- Monitoring of surface waters will be designed to assess the impacts of two-stroke and four-stroke engines via direct deposition into the lakes (boating). Objective 6. Determine input of nutrient enrichment and wastewater effluents through analysis of fecal coliform bacteria and macroinvertebrate communities at a small number of targeted sites of high concern within the GRYN. Justification/Rationale for this objective.-- Surface waters located adjacent to or immediately downstream of old septic fields, park residential areas, heavily used backcountry sites, park lodging and dining areas may be susceptible to water quality impairments associated with waste water effluent. Objective 7. To detect occurrence of aquatic invasive plant and animal species at select targeted locations most susceptible to initial invasion (marinas, areas of high fishing access, etc) with an emphasis on areas that coincide with water quality monitoring samples within GRYN. Justification/Rationale for this objective.-- Detecting incipient populations of aquatic invasive species is crucial to preventing permanent establishment and/or spread. Eradication of an invader that is become established is rare (Mack and others 2000), so it is best to find and eliminate a species before it becomes established. Previous surveys have reported the presence of New Zealand mud snails in GRYN surface waters and initial investigations suggest the potential for others such as Zebra mussel (Dreissena polymorpha), Eurasian watermilfoil (Myriophyllum spicatum) and purple loosestrife (Lythrum salicaria). These organisms are likely to have significant impacts on native vertebrate and invertebrate fauna and a monitoring program designed to detect the distribution and determine the trend in spatial extent and abundance is critical to park managers. Basic Approach: Our approach is intended to balance several conflicting considerations of cost, feasibility, statistical validity, preserving the integrity and continuity of previous data, and multiple users of water quality data. From purely a statistical standpoint, the broadest inference would be obtained using a probabilistic design (e.g., a Generalized Random Tessellation Stratified Survey Design [GRTS]); however, this would: (1) potentially decrease, at least initially, the integrity and continuity of existing fixed monitoring stations; (2) be prohibitively expensive given the difficulty of access to many parts of the GRYN; and (3) decrease its value for other vitals signs for which some fixed stations were located (e.g., geothermal monitoring). After considerable debate and discussion, the direction that we are now taking would:
1. maintain existing fixed stations as part of a split panel design (see below).
September 1, 2005

22 • Appendix VI: Protocol Development Summaries
2. incorporate a component of probabilistic sampling within realistic costs. 3. incorporate a few targeted sites for specific threats (e.g., polycyclic aromatic
hydrocarbons [PAHs]). We will use a split panel design that partitions (splits) the panels (i.e., collection of sites sampled during a given year) into two or more revisit designs. Such an approach constitutes a compromise between emphasis on spatial and temporal variation. Typically, split panels entail an always visit design in combination with some other revisit design (e.g., repeating panel). The “always visit” design is the strongest for detecting temporal variation but is weak for detecting spatial variation since the same panels are visited on each occasion. Combining this with an alternative panel can strengthen detection of spatial variation. Fixed monitoring sites were selected that target specific waters of concern and/or act as integrator sites (i.e., located at outlets of drainage basins with relatively homogeneous land use and physiographic conditions, intended to reflect conditions within that basin). As such, these are important data sources to the parks, which have placed high value on maintaining their continued monitoring. These sites also have sufficient access to enable feasible year-round monitoring. Thus, our intention is to maintain use of these sites in the context of the “always visit” component of the split panel design, where these sites are monitored every year and provide a temporal continuity that is used to help interpret sites selected through probability sample that have a repeating panel (see below). The fixed sites would be augmented with additional sites selected through a probabilistic sample. These sites would be on a repeated panel design such that a subset of sites (probably within a given drainage basin) would be sampled in any given year. When all of the sites have been sampled (i.e., after a period of years), the sampling would then return to a repeat sampling of the first subset, and so on. This approach enables a sample of sites representing the spatial variation to be accumulated over several years (we are targeting 3-5). However, this type of panel structure can result in confounding of spatial and temporal variation, particularly when the samples within a given year are from the same basin. Given that logistical constraints of access precludes having the panels distributed throughout the parks within any given year, the fixed sites, which are monitored every year, will help to reduce the confounding of spatial and temporal variation. The probabilistic approach that we will use will be the Generalized Random-Tessellation Stratified Design (GRTS [Stevens and Olsen 2004]), which is well suited to our needs. The GRTS design uses a hierarchical randomization process to achieve spatial balance across the region and resource and has good variance properties. In addition to the design described above, we anticipate having a small set of targeted sites intended to assess specific threats. For example, sites in the vicinity of marinas will be targeted for monitoring polycyclic aromatic hydrocarbons and sites used for swimming may be targeted for fecal coliforms. Principal Investigators and NPS Lead:
September 1, 2005
Vital Signs Monitoring Plan • 23
The NPS Lead within the GRYN is Cathie Jean, Greater Yellowstone Network, P.O. Box 173492, AJM Johnson Hall, Montana State University, Bozeman, MT 59717, tel: (406) 994-7530, fax: (406) 994-4160, Email: [email protected]. Our primary cooperator during the design phase are Will Clements and Donna Kashian, Department of Fishery and Wildlife Biology, Colorado State University, Fort Collins, CO 80523, Phone: 970-491-0690, FAX: 970-491-5091, E-mail: [email protected] and [email protected]. The integrated water quality monitoring protocol is a collaborative effort among Rob Bennetts, who is lead on the sampling design, Rob Daley, who is lead on the data management, and park staff Susan O’Ney at GRTE, Cassity Bromley at BICA and Jeff Arnold at YELL. Development Schedule, Budget, and Expected Interim Products: The protocol narrative is a joint effort with help from the cooperator and network staff. The sampling design and protocol narrative will be completed and ready for peer review in FY06. Implementation will start in FY07. The SOPs for this protocol were peer reviewed in 2005 as part of the review for the regulatory water quality plan, which covers objectives for 303(d) streams only (see the Regulatory Water Quality Protocol Development Summary for details). Changes specific to the integrated water quality protocol will be incorporated into the SOPs in FY06. Literature Cited Baker JP, Bernard DP, Christensen SW. 1990. Biological effects of changes in surface water
acid-base chemistry. NAPAP Report 13. Volume 2. National Acid Precipitation Assessment Program, Washington, D.C., USA.
Barmuta LA, Cooper SD, Hamilton SK, Kratz KW, Melack JM. 1990. Responses of zooplankton
and zoobenthos to experimental acidification in a high-elevation lake (Sierra Nevada, California, U.S.A.). Freshwater Biology 23: 571-586.
Baron JS, Rueth HM, Wolfe AP, Nydick K, Allstott EJ, Minear JT, Moraska B. 2000. Ecosystem
response to nitrogen deposition in the Colorado Front Range. Ecosystems 3: 352-368. Clow DW, Sueker JK. 2000. Relations between basin characteristics and stream-water chemistry
in alpine/sub-alpine basins in Rocky Mountain National Park, Colorado. Water Resources Research 36: 49-61.
Gaufin AR. 1958. The effects of pollution on a Midwestern stream. Ohio Journal of Science 58:
197-208. Kratz K, Cooper S, Melack J. 1994. Effects of a single and repeated experimental acid pulses on
invertebrates in a high altitude Sierra Nevada stream. Freshwater Biology 32: 161-183.
September 1, 2005
24 • Appendix VI: Protocol Development Summaries
Lafrancois BM, Nydick KR, Caruso B. 2003. Influence of nitrogen and phytoplankton biomass and community composition in fifteen Snowy Range Lakes (Wyoming, U.S.A.). Arctic, Antarctic, and Alpine Research 35(4): 499-508.
Mack RN, Simberloff D, Lonsdale WM, Evans H, Clout M, Bazzaz FA. 2000. Biotic invasions:
causes, epidemiology, global consequences, and control. Ecological Applications 10(3):689-710.
Nanus L, Campbell DH, Ingersoll GP, Chow DW, Mast MA. 2003. Atmospheric deposition
maps for the Rocky Mountains. Atmospheric Environment. 37: 4881-4892. Nanus L, Campbell DH, Williams MW. 2005. Sensitivity of alpine and subalpine lakes to
acidification from atmospheric deposition in Grand Teton National Park and Yellowstone National Park, Wyoming: U.S. Geological Survey Scientific Investigations Report 2005 -5023, 37 p.
Nydick KR, Lafancois BM, Baron JS, Johnson BM. 2003. Lake-specific responses to elevated
atmospheric nitrogen deposition in the Colorado Rocky Mountains, U.S.A. Hydrobiolgia. 510: 103-114.
Richardson RE. 1925. Illinois River bottom fauna in 1923. Bulletin of the Illinois Natural
History Survey 15:391-422. Richardson RE. 1929. The bottom fauna of the Middle Illinois River 1913-1925. It’s
distribution, abundance, valuation and index value in the study of stream pollution. Bulletin of the Illinois Natural History Survey 17: 387-475.
Smith R. 2004. Commercial livestock grazing in Grand Teton National Park. Forest Guardians. Stevens DL Jr, Olsen AR. 2004. Spatially balanced sampling of natural resources. Journal of the
American Statistical Association. 99: 262-278. Williams M, Tonnessen KA. 2000. Critical loads for inorganic nitrogen deposition in the
Colorado front Range USA. Ecological Applications 10(6): 1648-1665. Wolfe AP, Baron JS, Cornett RJ. 2001. Anthropogenic nitrogen deposition induces rapid
ecological changes in alpine lakes of the Colorado Front Range (U.S.A.). Journal of Paleolimnology 25: 1-7.
The following reports and products support the development of this plan. Arnold J, Koel T. 2004. Evaluation of Stream Quality Using Benthic Macroinvertebrate
Communities as Biological Indicators, Final Report. Bozeman, MT: National Park Service, Greater Yellowstone Network. 60 pp. plus appendices.
September 1, 2005
Vital Signs Monitoring Plan • 25
Knauf M, Williams MW. 2004. Soda Butte Creek and Reese Creek: Vital Signs Monitoring Program, Final Report. Bozeman, MT: National Park Service, Greater Yellowstone Network. 29 pp. plus appendices.
O'Ney SE, McCloskey K, eds. 2004. Water quality monitoring plan, phase II report. Bozeman,
MT: National Park Service, Greater Yellowstone Network. 51 pp. plus appendices.
Rodman A. 2004. Surface Water Classification for the Greater Yellowstone Network, Final Report. Bozeman, MT: National Park Service, Greater Yellowstone Network. 24 pp.
Simmons T, Ostermiller JD and Hawkins CP. 2004. Synoptic review of river invertebrate data and initial development of a monitoring protocol for the Greater Yellowstone Network Inventory and Monitoring Program, final report. Bozeman, MT: National Park Service, Greater Yellowstone Network. 37 pp. plus appendices.
Woods SW, Corbin J. 2003. Vital signs water quality monitoring for the Greater Yellowstone
Network: Bighorn Canyon National Recreation Area: Final Technical Report, July 2003. Bozeman, MT: National Park Service, Greater Yellowstone Network.
Woods SW, Corbin J. 2003. Vital signs water quality monitoring for the Greater Yellowstone
Network: Grand Teton National Park: Final Technical Report, August 2003. Bozeman, MT: National Park Service, Greater Yellowstone Network.
Woods SW, Corbin J. 2003. Vital signs water quality monitoring for the Greater Yellowstone
Network: Yellowstone National Park: Final Technical Report, September 2003. Bozeman, MT: National Park Service, Greater Yellowstone Network.
September 1, 2005
26 • Appendix VI: Protocol Development Summaries
Protocol Development Summary Protocol: Invasive Plants Parks Where Protocol Will Be Implemented: BICA, GRTE, YELL Justification/Issues being addressed: Invasive exotic plants are a top priority vital sign for the Greater Yellowstone Network. There is a strong consensus among scientists around the world that, after habitat loss and landscape fragmentation, the second most important cause of biodiversity loss now and in the coming decades is invasion by alien plant, animal and other species (Allendorf and Lundquist 2003, Chornesky and Randall 2003, Walker and Steffen 1997). In all of the parks, invasive exotic plant species are a serious threat to natural and cultural resources. Yellowstone and Grand Teton are two of the more heavily visited national parks in the country and are visited by people from throughout the 50 states and the world, who bring a continuous influx of new species on their clothes and vehicles. Bighorn Canyon has fewer visitors but most of them come to the NRA for fishing and boating, and exotic aquatic species are spread even more quickly than terrestrial. Invasive exotic plants have replaced native vegetation in large areas of Grand Teton and Bighorn Canyon, are widespread in the Northern Range of Yellowstone, and present an ongoing threat of further displacement. This displacement affects not only native vegetative community structure, composition and succession but can also cause extirpation or extinction of endemic and/or endangered plant species (Mack et al. 2000, Walker and Smith 1997). Exotic plants that become invasive, aggressive and widespread create detrimental impacts to animal habitat and nutrition, soil nutrient cycling, and fire and flood processes in parks (DiTomaso 2000, Goodwin 1992, Mack et al. 2000). Park Service national management policy states that exotic species will not displace native species if displacement can be prevented (NPS 2001). In order to prevent this displacement, monitoring of new populations and established species is essential. In addition it is vital to monitor the effects of both the existence of exotic populations and the management of exotic populations on native species and ecosystems. Inventory or mapping of infestations has been completed for BICA, GRTE, and the Northern Range, along major roads and in some backcountry areas of YELL. BASIC APPROACH: There are four general areas of invasive plant monitoring that are addressed in this protocol: early detection, status and trend, effects of invasive plants on native vegetation and ecosystems, and restoration of native vegetation and ecosystems following control/treatment of invasive plants. Through the process of researching background material and writing threats and concerns for this vital sign as well as meeting with park staff about their needs and priorities, we are approaching these four areas of monitoring as described below.
Early Detection
FRONTCOUNTRY The three park units in the GRYN have been conducting informal early detection surveys for species new to frontcountry areas of the parks in conjunction with their invasive plant control programs. The parks would like to standardize data management of the 11 standard NAWMA (North American Invasive Plant Mapping Standards) fields that are in the databases of the three park units in order to be able to share and consolidate information. Searching these frontcountry
September 1, 2005

Vital Signs Monitoring Plan • 27
areas has been found to be highly effective in detecting incipient populations of new species. GRYN staff will assist the parks in developing standard operating procedures (SOPs) for data collection, training of personnel and data management.
BACKCOUNTRY For backcountry early detection monitoring GRYN staff will test procedures currently being developed by USGS researchers in various parks and I&M networks throughout the country. These procedures will be available in 2007. If these procedures are found to be practical for use in the GRYN park units, staff will develop SOPs for backcountry early detection monitoring in 2007-2008. Status and Trend Status and trend monitoring of invasive species will emphasize Priority 1-3 species (see below) and will likely be conducted by park staff. The GRYN will develop the SOPs and assist staff in initial implementation. Effects of Invasive Plants on Native Vegetation and Ecosystems GRYN staff will develop SOPs and conduct monitoring of the effects of invasive exotic plant populations on the native plant communities and ecosystems. This monitoring will emphasize Priority 4 species (see table below for definition of priority levels), which are so widespread in the parks that they are no longer considered treatable but are thought to have serious impacts on resources. Restoration of Native Vegetation and Ecosystems Following Treatment/Control of Invasive Plants GRYN staff will develop SOPs and conduct monitoring on the restoration of native plant communities and ecosystems following treatment/control of invasive plants. A list of invasive exotic plants has been compiled for the three parks and a network classification of priorities for species has been created based on individual park prioritization categories (Table 1). These priority categories, based primarily on need for and ability to control populations, have been applied to specific monitoring objectives as shown below. The priority classifications will be updated over time as population demographics of established species and management priorities change and as new species arrive in the parks. If necessary, classifications will also be revised to reflect monitoring priorities rather than primarily control priorities. We are currently developing a matrix of the 125 prioritized invasive exotic species on: phenology; demographics; general growth characteristics; reproduction; habitat affinities; tolerances; invasiveness; documented effects on native vegetation, nutrient cycling, soil biota, and higher trophic levels; and successful or recommended monitoring methods. This matrix will be used to develop final specific monitoring objectives. Currently, we have draft general objectives (see below) that will potentially apply to specific species in specific habitats or targeted sites in the parks. Researchers at Montana State University are currently refining monitoring methodologies for tracking the changes in density and spread of invasive species (especially those that grow in definable patches, such as smooth brome) on national forest land north of Yellowstone National
September 1, 2005

28 • Appendix VI: Protocol Development Summaries
Park. A main focus of their research is to determine the difference in invasiveness of a given species in different habitats. We will work as closely as possible with the researchers and YELL park staff to coordinate with and complement (rather than overlap) these efforts. Monitoring of all important invasive plant species may be costly, especially in terms of field data collection. We will develop a set of sampling designs to answer different monitoring objectives that can be evaluated in terms of cost and feasibility and that will offer trade-offs in levels of precision or type II error rates.
Table 1. Definitions for GRYN Prioritization of Invasive Species
Watch List (WL): Exotic species not documented/established in the park(s).
Priority 1: Species that have produced seed in the park, but populations are small and limited in number. These species have a high probability for eradication with continued annual monitoring and treatment. They are also the most cost effective species to control. SMALL POPULATIONS, CONTROLLABLE Priority 2: Species that are invasive and aggressive and capable of rapid spread within the parks. Most are confined to relatively small localized areas. These species are capable of disrupting or displacing native plants. Many of these species are well established in the park, but aggressive control can be effective by limiting the spread. Containment will be the primary goal for these species with eradication as a secondary goal. Individual plants or small infestations away from core infestation areas will be a high priority for aggressive control. AGGRESSIVE INVADERS, CONTROLLABLE Priority 3: Species that are invasive but less aggressive and less capable of displacing native species. They are undesirable, but not necessarily as invasive as Priority 2 species. Control actions have a greater chance of containing or eradicating the populations. LESS AGGRESSIVE. CONTROLLABLE Priority 4: Aggressive exotics that are dispersed over large areas of the parks and have deleterious effects on the park ecosystem. Control efforts are likely to be ineffective and costly and have lower probability of reducing, containing, or eradicating populations. However, work may be done to confine the spread of these plants in sensitive areas. These species may be treated with other treatment activities (i.e., roadside treatments, vegetation restoration work) but will not be aggressively treated until more feasible methods are found and approved. Biological controls will be utilized when available to reduce populations. Monitoring would be beneficial, but will come after Priorities 1 and 2. AGGRESSIVE, WIDESPREAD,(CURRENTLY) NOT CONTROLLABLE EXCEPT IN LOCALIZED AREAS Priority 5: Exotics, for which little or no control efforts are foreseen. Even though many of these plants displace native vegetation, control of high priority species takes precedence. Limited monitoring actions may be undertaken. Approximately 138 species fall into this category. None of the plants in this category are listed as noxious by the surrounding states. ??? Priority 6: New species that have been found during inventory efforts throughout the park. Species are non-native, escaped ornamentals about which little is known. ???
Specific Monitoring Questions and Objectives to be Addresses by the Protocol: Monitoring questions are:
1. Where are new populations of invasive exotic plant species being established? 2. In which habitats of our network parks are these species invasive? 3. How can we monitor invasive plants to ensure that our currently known weed-free areas,
especially in habitats that are rare, sensitive or of particularly high value, remain in that condition?
4. What is the status and trend of existing populations of invasive species of interest, including species being actively treated and those that are currently considered beyond control?
5. What effects are existing populations of invasive plant species having on native vegetation and ecosystems?
6. What effect is the management of exotic plant species having on restoration of native vegetation and ecosystems?
September 1, 2005

Vital Signs Monitoring Plan • 29
Current DRAFT general monitoring objectives are:
(NOTE!!: background work is still ongoing that will used in refining monitoring objectives and making them specific to individual species and locations, i.e. inferential populations will be defined):
1. Management Objective: Prevent the establishment of viable populations of invasive exotic
plants new to the parks (Watch list species).
Monitoring Objective: Detect occurrences of invasive exotic plants new to the parks before they become viable populations. Until USGS protocols are available to test in backcountry areas, this objective will be applied primarily to roads, developed sites and easily accessible areas of the parks, i.e. frontcountry areas.
2. Management Objective: Prevent the establishment of viable populations of invasive exotic plants (Priorities 1-3) in weed-free zones of the parks.
Monitoring Objective: Detect occurrences of Priority 1-3 invasive exotic plants in weed-
free zones of the park before they become viable populations.
Justification/Rationale for Objectives 1 and 2.-- Detecting infestations as soon as possible is crucial to preventing establishment or allowing invasion to begin. Eradication of an invader that has become established is rare (Mack et al. 2000), so it is best to find and eliminate a species before it becomes established. In addition, the costs associated with controlling an invasive species escalate as it becomes more widely distributed (McNeely et al. 2001). Propagule pressure is very important to the success of an exotic plant becoming established and invasive (Allendorf and Lundquist 2003, Colautti and MacIsaac 2004, D'Antonio and Vitousek 1992, Williamson 1996). Propagule pressure comprises not only the number of seeds or regenerative asexual parts that a species produces, but also the number of establishment sites of a species. The more infestation sites or invasion foci a species has, the greater are its chances of successful establishment (Moody and Mack 1988). Also, the lag time for a given species to become invasive in an area is unknown, and there is no way to predict the outcome of any particular introduction of an exotic species (Lodge 1993). No successful set of characteristics to predict invasibility has been determined (Rejmánek and Richardson 1996, Williamson 1996). All of these reasons demonstrate the importance of finding and eliminating an exotic species as soon as possible after its arrival in an area.
3. Management Objective: Allow no establishment of viable populations of Priority 1-3
invasive species outside of control boundaries.
Monitoring Objective: Determine status and trend of Priority 1-3 invasive exotic plants outside of control boundaries at 5 year intervals.
4. Management Objective: Observe status and trend of selected Priority 4 & 5 invasive species throughout the parks in order to inform management.
September 1, 2005
30 • Appendix VI: Protocol Development Summaries
Monitoring Objective: Determine distribution and abundance of Priority 4 & 5 invasive species at 5 year intervals.
Justification/Rationale for Objectives 3 & 4.-- Park weed management staff need information on the status of existing populations of invasive plants in order to prioritize yearly control efforts as well as to evaluate the success of containment of designated species. For some Priority 1-3 species control area polygons have been established within park boundaries. Management staff are less concerned with increases in abundances of species within these control areas than with establishment of species outside of control area boundaries. Control areas are specific to individual species and do not correspond to completely weed-free zones (see above). For example, Dalmation toadflax may have a 5 mi2 control area in the vicinity of the Mammoth terraces in the northern range of YELL. The rest of the Northern Range is not weed-free but is outside of the Dalmation toadflax control area and may be targeted for status and trend monitoring for this species. For species that are widespread and untreated (Priority 4 & 5), no information is available on their population status. It may be that once a certain threshold of invasion pressure is exceeded, the whole structure of the native vegetative community collapses (Parker et al. 1999). Although traditional control efforts are not feasible for these species, information about their rates of spread and total coverage within the parks is potentially important information for management of threatened, endangered or sensitive plants, wildlife populations and fires.
5. Management Objective: Maintain the current native plant community and ecosystem
attributes (e.g., frequency and cover of native plants, forage, habitat, soil stability and primary productivity) at 80-100% of levels associated with habitat types not infested with invasive exotic plants.
Monitoring Objective: Determine status and trend of selected native plant community
(e.g., frequency and cover of key native plants) and ecosystem attributes (e.g., forage, wildlife habitat, soil stability, primary productivity) at locations (e.g., in targeted habitats) infested with one or more specified Priority 4 invasive plant species in comparison to comparable sites not infested with invasive plant species at five year intervals.
Justification/Rationale for Objective 5: Very few studies have been conducted that address community-level consequences of invasion by exotic species (Woods 1997). From these few studies, however, plant invaders have been found to completely alter nutrient cycling, disturbance regimes, hydrology and energy budgets and can greatly diminish the abundance or survival of native species (D'Antonio and Vitousek 1992, Ehrenfeld 2004, Mack et al. 2000, Walker and Smith 1997, Woods 1997). In addition, primary productivity can be diminished by invasive plants and subsequently affect, for example, grassland forage for grazing animals (Walker and Smith 1997). Although we have little information specifically documenting the effects of the majority of invasive exotic species found in the GRYN park units, we expect these species to have moderate to substantial undesirable effects on native vegetation and other ecosystem components and processes. Priority 4 species are targeted for these objectives because most of them are not being treated or controlled by
September 1, 2005
Vital Signs Monitoring Plan • 31
park staff, except in some localized areas, and there is concern about their effects on native vegetation and ecosystems within the parks. Also, most of these species are not listed as noxious on state weed lists, are not researched as thoroughly as Priority 1-3 species. Noxious weed status is granted to invasive plant species that pose a threat to agricultural systems rather than to natural resources and natural ecosystems. Priority 4 species may pose a much greater threat to park resources than higher priority species. Without quantitative data, however, park staff cannot divert attention and request management funding to address these species.
6. Management Objective: Return native plant community and ecosystem attributes (e.g.,
frequency and cover of native plants, forage, habitat, soil stability and primary productivity) to levels associated with habitat types not infested with invasive exotic plants. To have statistically significant improvement in these ecosystem properties within three years of treatment.
Monitoring Objective: Determine status and trend of native plant community (e.g.,
frequency and cover of key native plants) and ecosystem attributes (e.g., forage, habitat, soil stability, primary productivity) of selected sites where invasive species have been treated/controlled in comparison to habitat types not infested with invasive exotic plants at five-year intervals.
Justification/Rationale for Objective 6: Eradication of an exotic species can have unintended negative impacts on the ecosystem, including invasion by other exotic plant species or loss of critical habitat for a rare native species (Zavaleta et al. 2001). On the other hand, eradication of exotic species often allows native vegetation to become reestablished on the available site. Treatment of invasive plant species is not successful unless native ecosystem properties have returned to the functional level of similar uninvaded ecosystems.
Principal Investigators and NPS Lead: The NPS lead is Elizabeth Crowe, Greater Yellowstone Network, P.O. Box 173492, 229 AJM Johnson, Montana State University, Bozeman, MT 59717-3492, Phone: (406) 994-7202, Fax: (406) 994-4160, Email: [email protected]. Development Schedule and Expected Interim Products: In FY06, the GRYN will determine the primary focus of the invasive plant monitoring program and revise monitoring objectives accordingly. The schedule for protocol development and implementation is timed to take advantage of products developed by the national program, other networks and regions that have on-going task agreements for backcountry early detection monitoring etc. In FY06 the GRYN will work with the network parks to formalize the front country early detection ‘repeat inventories’ by developing protocols for data collection, data management and reporting for use by the parks. Literature Cited: Allendorf FW, Lundquist LL. 2003. Introduction: population biology, evolution, and control of
invasive species. Conservation Biology 17(1):24-30.
September 1, 2005

32 • Appendix VI: Protocol Development Summaries
Chornesky EA, Randall JM. 2003. The threat of invasive alien species to biological diversity:
setting a future course. Annals of the Missouri Botanical Garden 90:67-76. Colautti RI, MacIsaac HJ. 2004. A neutral terminology to define 'invasive' species. Diversity and
Distributions 10:135-141. D'Antonio CM, Vitousek PM. 1992. Biological invasions by exotic grasses, the grass/fire cycle,
and global change. Annual Review of Ecological Systems 23:63-87. DiTomaso JM. 2000. Invasive weeds in rangelands: Species, impacts, and management. Weed
Science 48(2):255-265. Ehrenfeld JG. 2004. Implications of invasive species for belowground community and nutrient
processes. Weed Technology 18(5):1232-1235. Goodwin J. 1992. The role of mycorrhizal fungi in competitive interactions among native
bunchgrasses and alien weeds: a review and synthesis. Northwest Science 66(4):251-260. Lodge DM. 1993. Biological invasions: Lessons for ecology. Trends in Ecology and Evolution
8(4):133-137. Mack RN, Simberloff D, Lonsdale WM, Evans H, Clout M, Bazzaz FA. 2000. Biotic invasions:
causes, epidemiology, global consequences, and control. Ecological Applications 10(3):689-710.
McNeely JA, Mooney HA, Neville LE, Schei PJ, Waage JK, editors. 2001. A Global Strategy on
Invasive Alien species. Gland, Switzerland: IUCN. 60 p. Moody ME, Mack RN. 1988. Controlling the spread of plant invasions: the importance of
nascent foci. Journal of Applied Ecology 25:1009-1021. National Park Service (US). 2001. Management Policies 2001. Washington, D.C.: U.S.
Department of the Interior, National Park Service. Report nr NPS D1416. 137 p. Parker IM, Simberloff D, Lonsdale WM, Goodell K, Wonham M, Kareiva PM, Williamson MH,
Von Holle B, Moyle PB, Byers JE and others. 1999. Impact: toward a framework for understanding the ecological effects of invaders. Biological Invasions 1:3-19.
Rejmánek M, Richardson DM. 1996. What attributes make some plant species more invasive?
Ecology 77(6):1655-1661. Walker B, Steffen W. 1997. An overview of the implications of global change for natural and
managed terrestrial ecosystems. Conservation Ecology; 1(2). Available at: http://www.ecologyandsociety.org/vol1/iss2/art2/index.html.
September 1, 2005

Vital Signs Monitoring Plan • 33
Walker LR, Smith SD. 1997. Impacts of invasive plants on community and ecosystem properties. In: Luken JO, Thieret JW, editors. Assessment and Management of Plant Invasions. New York: Springer-Verlag.
Williamson M. 1996. Biological Invasions. London: Chapman & Hall. 244 p. Woods KD. 1997. Community response to plant invasion. In: Luken JO, Thieret JW, editors.
Assessment and Management of Plant Invasions. New York: Springer-Verlag. pp 56-68. Zavaleta ES, Hobbs RJ, Mooney HA. 2001. Viewing invasive species removal in a whole-
ecosystem context. Trends in Ecology and Evolution 16(8):454-459.
September 1, 2005

34 • Appendix VI: Protocol Development Summaries
Protocol Development Summary Protocol: Landbirds Parks Where Protocol will be Implemented: YELL, GRTE, BICA Justification/Issues being addressed: This vital sign measures the distribution and abundance of landbirds, other than those selected as "sensitive species". Protection of native species and their habitats is one of the primary challenges outlined in the NPS Natural Resource Challenge (National Park Service 1999). The National Park Service Inventory and Monitoring Guidelines (NPS-75) further state that “…preserving the natural resources (and natural processes) in the national parks may be the most important legacy the Park Service can provide American conservation.” Thus, monitoring the composition of native communities of concern and the changes occurring within and among these communities is essential to meeting our Natural Resource Challenge. Because of the large number of habitat types within the Greater Yellowstone Network (GRYN) and the enormous variability within these habitat types, our initial efforts on landbirds will focus on estimating the status and trends of landbirds within four habitats (communities) of concern: alpine, aspen, shrub steppe (sage), and riparian. Although the overall objectives will be very similar among these habitat types, there may be subtle differences in the secondary objectives that reflect the potential threats to each of these habitat types. Our specific monitoring objectives are intended to answer the following general question: Are there observable changes in the native bird communities for each of four habitats of concern that would indicate a systematic changes in abundance or distribution within these habitats that is indicative of that habitat becoming less suitable for persistence of the native avian fauna associated with these communities? Monitoring Questions Addressed by the Protocol: Some of the specific monitoring questions that will be addressed by this protocol include:
• What is the proportion of sites within a given habitat of concern that is occupied by the obligate species of that habitat?
• What is the density and variation in density of obligate species within each of four habitats of concern?
• Are there systematic changes in community composition within the four habitats of concern that would be indicative of that habitat becoming less suitable for persistence of the native avian fauna associated with these communities?
Specific Monitoring Objectives: Note: The scope of inference for all objectives will be four habitats of concern (alpine, aspen, riparian, and sage-shrub steppe), where they occur within the GRYN. Details of how these habitats are defined are provided in the full protocol.
September 1, 2005
Vital Signs Monitoring Plan • 35
Objective 1. To estimate the proportion of sites occupied (MacKenzie et al. 2002) in habitats of concern in BICA, GRTE, and YELL and to estimate the changes in occupancy over time. Although we will estimate occupancy and changes in occupancy for all species with sufficient data, our emphasis will be species identified as dependent on or obligates of the particular habitat of concern (see protocol for details).
Justification/Rationale for this objective.-- Changes in distribution are often used as indicators of environmental quality. Estimates of occupancy are a direct measure of distribution and the corresponding measures of local extinction and colonization of sites can provide valuable information as to the thresholds of that quality. Objective 2. To estimate the abundance (density) of birds in habitats of concern in BICA, GRTE, and YELL and to estimate the changes in abundance over time. Justification/Rationale for this objective.-- Population dynamics, hence changes in abundance, frequently depend on environmental factors (Buckland et al. 2001); thus, they are often used as indicators of environmental quality. Further, Bock and Jones (2004) recently examined 109 reported cases of 67 species in North America and Europe and concluded that in most cases density was a reliable indicator of habitat quality. Objective 3. To estimate community composition and associated parameters of landbirds in habitats of concern in BICA, GRTE, and YELL and to estimate trends in these parameters over time. Specific parameters to be estimated include, but are not limited to, species richness and relative species richness (e.g., richness of native to exotic species). Justification/Rationale for this objective.-- Biodiversity is “central to the productivity and sustainability of the earth’s ecosystems” (Christensen et al. 1996), and preserving natural abundances and diversity of native plants and animals is one of the general principles guiding the management of biological resources in our national parks (NPS 2000). BASIC APPROACH: The general sampling for each of our objectives would be essentially the same, and these objectives would be reflected in different ways of analyzing the resulting data. Our sampling approach is based on distance-based “point transects” (Buckland et al. 1993, 2001) with some minor refinements in the design to facilitate estimation of some parameters. Although in some cases we may use actual line transects, the use of points allows us to measure some site-specific covariates that may be useful in interpreting the results. Our measure of changes in distribution would be based on the proportion of sites occupied (MacKenzie et al. 2002). This measure: (1) explicitly enables estimation of local extinctions and colonization (MacKenzie et al. 2003); (2) takes into account detectability of individual species (MacKenzie and Kendall 2002); (3) enables estimation of confidence intervals; (4) is comparable across sites; and (5) is becoming a widely accepted approach for reliable estimates of occupancy. Estimates of density, based on distance sampling, explicitly account for detectability of
September 1, 2005
36 • Appendix VI: Protocol Development Summaries
individuals of a species through estimation of a detection function, given certain assumptions detailed in Buckland et al. (2001). Estimates of community-level parameters (e.g., species richness and relative species richness) will be based on the approach developed by Boulinier et al. (1998) and Nichols et al. (1998) using program COMDYN (Hines et al. 1999). As for the other parameters, this approach explicitly takes into account species detectability. Principal Investigators and NPS Lead: The NPS lead within the GRYN is Robert E. Bennetts, Greater Yellowstone Network, 1648 S. 7th Ave., Bozeman, MT 59717, tel: (406) 994-2281, fax: (406) 994-4160, Email: [email protected]. We also have a cooperative agreement with the statistics department at Montana State University to assist in refinement of our final protocol. We also have been working closely with Paul Lukacs, statistician with the WASO office, and with several staff at the Patuxent Wildlife Research Center. Development Schedule, Budget, and Expected Interim Products: The general field methods and sampling design have been developed and will be compatible with the Rocky Mountain Bird Observatory (RMBO) protocol. We also recently completed a field testing of methods at GRTE and anticipate a full advanced draft of our protocol by late fall 2005. We anticipate full implementation by spring of 2006. The budget will depend on final details of the sampling design, but is expected to cost approximately $50k for full implementation of this program. Literature Cited: Bock CE, Jones ZF. 2004. Avian habitat evaluation: should counting birds count? Frontiers in
Ecology and the Environment 2:403-410. Boulinier T, Nichols JD, Sauer JR, Hines JE, Pollock KH. 1998. Estimating species richness to
make inference in community ecology: the importance of heterogeneity in species detectability as shown from capture-recapture analyses of North American Breeding Bird Survey Data. Ecology 79:1018-1028.
Buckland ST, Anderson DR, Burnham KP, Laake JL. 1993. Distance sampling: estimating
abundance of biological populations. London: Chapman and Hall. Buckland ST, Anderson DR, Burnham KP, Laake JL, Borchers DL, Thomas L. 2001.
Introduction to distance sampling: estimating abundance of biological populations. New York: Oxford University Press.
Hines JE, Boulinier T, Nichols JD, Sauer JR, Pollock KH. 1999. COMDYN: software to study
the dynamics of animal communities using a capture-recapture approach. Bird Study 46 (suppl.):S209-217.
September 1, 2005

Vital Signs Monitoring Plan • 37
MacKenzie DI, Kendall WL. 2002. How should detection probability be incorporated into estimates of relative abundance. Ecology 83: 2387-2393.
MacKenzie DI, Nichols JD, Lachman GB, Droege S, Royle JA, Langtimm CA. 2002. Estimating
site occupancy rates when detection probabilities are less than one. Ecology 83: 2248-2255.
MacKenzie DI, Nichols JD, Hines JE, Knutson MG, Franklin AD. 2003. Estimating site
occupancy, colonization and local extinction when a species is detected imperfectly. Ecology 84: 2200-2207.
National Park Service (NPS). 1999. Natural Resource Challenge: the National Park Service's
action plan for preserving natural resources. Washington, DC: National Park Service. National Park Service (NPS). 2000. Management Policies 2001. NPS D1416, Washington, DC. Nichols JD, Boulinier T, Hines JE, Pollock KH, Sauer JR. 1998. Inference methods for spatial
variation in species richness and community composition when not all species are detected. Conservation Biology 12:1390-1398.
September 1, 2005

38 • Appendix VI: Protocol Development Summaries
Protocol Development Summary Protocol: Land use Parks Where Protocol Will Be Implemented: YELL, GRTE, BICA Justification/Issues being addressed: Land-use activities surrounding park borders can significantly influence the status of ecological condition and functioning within parks. The Greater Yellowstone Network (GRYN) has identified land use change as a top priority vital sign for defining ecosystem health within parks. Long-term monitoring of land-use activities surrounding parks of the GRYN will provide information on trends in land-use and land-cover change and allow for analyses that quantify potential consequences for park resources. This will provide managers with the scientific background for incorporating the consequences of surrounding land-use activities into park management decisions. Specific monitoring objectives will answer the following questions: How is land use changing around parks, and how do these changes impact park ecosystem components and processes? Monitoring Questions Addressed by the Protocol: The primary monitoring questions that will be addressed by this protocol are:
• What is the extent of different land-use activities, and how is this changing over time? Specific Monitoring Objectives: Objective 1 – To determine the density and location of homes on private and public lands within BICA, GRTE, and YELL, 20 counties comprising the Greater Yellowstone Ecosystem (Rasker 1991), and two additional counties surrounding BICA. Justification/Rationale for this objective. -- Housing density can have significant ecological impacts, including: general loss of habitat, loss of unique habitat components, barriers to animal movements, increased disturbance and altered hydrologic regimes (including changes in water quantity and quality). Thus, understanding changes in housing density surrounding parks may have important implications for the functioning of the parks. Objective 2 – To determine the number, length and type (i.e. size) of roads within 22 counties within and surrounding the GRYN, as well as measure changes in the existence and characteristics of roads over time. Justification/Rationale for this objective. -- Roads can have significant ecological impacts, including: the fragmentation of habitats, direct wildlife mortality from collisions with cars, and increased accessibility to backcountry areas resulting in higher levels of human disturbance in remote areas. Therefore, quantifying the extent and characteristics of roads, and monitoring change over time, is relevant for considering the ecological impacts of land-use change on ecological condition of parks.
September 1, 2005
Vital Signs Monitoring Plan • 39
Objective 3 – To determine the distribution, area, and type of agricultural habitats within 22 counties within and surrounding the GRYN, as well as measure changes to those attributes over time. Justification/Rationale for this objective. -- Although the effects of agriculture may be less intensive than some other types of land use (e.g., urban development), agriculture also can have significant ecological impacts, including: the conversion of important habitats, increased disturbance and altered hydrologic regimes (including changes in water quantity and quality). Further, the area of land surface altered by agriculture likely exceeds that of more intensive development. Thus, understanding changes in agriculture surrounding parks may have important implications for the functioning of the parks. Objective 4 – To determine the distribution and area of major land use changes that can be detected using remotely sensed data (Landsat) within 22 counties within and surrounding the GRYN. This objective would not target successional vegetation changes; rather major abrupt changes such as clearcuts, new developments and fires. Justification/Rationale for this objective. – Some major land use changes are not recorded through government records used for housing, roads or agricultural. This objective would target only the most major and abrupt changes that could be detected through course scale image classification (e.g., clearcuts, new developments and fires). Basic Approach: The general approach for this vital sign will be to use land-cover maps derived from remotely sensed data to determine the general distribution of housing and agricultural development. These maps will provide only the crude distribution of primary land-use types equivalent to approximately the Level I features of the Anderson et al. (1976) classification scheme or the land cover classes used by the National Land-Cover Database (NLCD) (Vogelmann et al. 1998, Homer et al. 2004). Such maps will not provide sufficient accuracy or detail for monitoring change over time (Jones and Hansen 2005). As such, these data will be augmented with ancillary data (described below) for more detailed metrics. Housing density- Ancillary data used to derive housing densities have been described in detail by Hernandez (2004) and Jones and Hansen (2005) and are derived from county tax-assessor offices, state Departments of Revenue, and the U.S. Census Bureau (USCB). Because of differences among states and/or counties in data storage and distribution, some compilation, processing and merging will be necessary. The scale of these data will likely be in 1 mi2 units identified by township/range/section (TRS). The TRS field will also provide a basis for joining states, counties, etc. for this attribute. We anticipate compiling data on housing density and assessing change of this attribute every five years. Roads- As part of the decennial census, the USCB also distributes TIGER/Line files which include geographic information about roads. This is the most extensive and reliable census of roads within the GRYN study area, and the only source for which roads are updated on a regular basis. TIGER files are used in conjunction with a Geographical Information System (GIS), so
September 1, 2005
40 • Appendix VI: Protocol Development Summaries
that roads can be mapped at 1:100,000 scale across the entire study area. Roads are classified into five categories, including interstates, state and county highways, local roads, and four-wheel drive logging roads. We anticipate compiling data on roads and assessing change of this attribute every ten years. Agriculture- The USDA NASS compiles a county-level census of agriculture every five years, and distributes this agricultural information for free on its Web site. The census of agriculture data quantifies most of the agriculture monitoring classes, including total agriculture, irrigated and non-irrigated cropland including hay and other crops, and irrigated and non-irrigated pastureland. Data for irrigated and non-irrigated cropland and pastureland classes are distributed separately from data for total agriculture. These two data sources can be manipulated and merged to create one database containing data for each county. These data can then be spatially referenced by linking to a county basemap. The final map quantifies all levels of agricultural classes for each of the counties within the GRYN study area. We anticipate completing an updated map of agriculture and assessment of change every five years. Other Major Land use Changes- This objective would be accomplished through comparison of Landsat imagery from one time period to another. Te specific details/protocol has not yet been developed, but the methodology would likely be similar to other ratio techniques that are used for vegetation indices or fire severity indices. Principal Investigators and NPS Lead: The NPS Lead within the GRYN is Robert E. Bennetts, Greater Yellowstone Network, Box 173492, 229 AJM Johnson, Montana State University, Bozeman, MT 59717, tel: (406) 994-2281, fax: (406) 994-4160, Email: [email protected]. The principal investigator with Montana State University is Andy Hansen, who has been conducting research investigating land-use change within the region for the past ten years. Development Schedule and Expected Interim Products: A draft protocol, including SOPs, was submitted to the GRYN in January, 2005 and included a literature review of land-use change in the region surrounding GRYN parks, conceptual models identifying indicators of land-use change, and draft monitoring objectives. Monitoring objectives were subsequently revised after discussions with park and network personnel. This protocol from our cooperator needs to be augmented with information from the network on data management, reporting, etc. We anticipate a complete protocol ready for review in 2006. Literature Cited: Anderson JR, Hardy EE, Roach JT, Witmer RE. 1976. A land-use and land-cover classification
system for use with remote sensor data. U.S. Geological Survey Professional Paper 964. Jones, J and Hansen A. 2005. Development of land use change protocols for the Greater
Yellowstone Network: Draft Final Report to the National Park Service January 2005. National Park Service, Greater Yellowstone Network, Bozeman, MT. 45 pp.
September 1, 2005
Vital Signs Monitoring Plan • 41
Hernandez PC. 2004. Rural residential development in the Greater Yellowstone: Rates, drivers, and alternative future scenarios [thesis]. Bozeman (MT): Montana State University-Bozeman. 164 p.
Homer CC, Huang L, Yang B, Wylie B, Coan M. 2004. Development of a 2001 national land-
cover database for the United States. Photogrammetric Engineering and Remote Sensing 70(7): 829-840.
Rasker R.1991. Rural development, conservation, and public policy in the Greater Yellowstone
Ecosystem. Society and Natural Resources 6: 109-126. Vogelmann JE, Sohl T, Howard SM, and Shaw DM. 1998. Regional land cover characterization
using Landsat Thematic Mapper data and ancillary data sources. Environmental Monitoring and Assessment 51:415-428.
September 1, 2005
42 • Appendix VI: Protocol Development Summaries
Protocol Development Summary Protocol: Regulatory Water Quality Parks Where Protocol will be Implemented: YELL, BICA Justification/Issues being addressed: Regulatory water quality monitoring is being conducted in response to the requirements of the Clean Water Act (CWA) and the direction of the vital signs monitoring program. The CWA requires states to adopt standards for the protection of surface-water quality. Both Montana and Wyoming have established specific water-quality standards identifying what concentrations of chemical pollutants are allowable in their waters. Water-quality standards themselves consist of two parts: a specific desired use appropriate to the waterbody, termed a designated use, and a criterion that can be measured to establish whether the designated use is being achieved. A waterbody is considered to be impaired when water quality monitoring data reveal changes to natural conditions that exceed those allowed by state standards. The CWA also requires states to submit a listing (commonly referred to as the 303[d] list) of impaired waters to the Environmental Protection Agency (EPA) every other year. The vital signs monitoring program views the monitoring of state identified impaired waters as fulfilling the fundamental requirement of Goal 1a4 of the National Park Service (NPS) Strategic Plan (NPS 2001), and partially fulfilling the requirements of the Government Performance and Results Act (GPRA) which mandates that federal agencies (federally funded programs) focus on “measurable or quantifiable” results for reporting to Congress. In contrast to several other vital signs components, the CWA provides one recognized means (by formal statute and state-developed numeric criteria and narrative standards) for the NPS to broadly measure improvement, or further degradation, of 303(d)-listed water resources and synthesize that information in reports to Congress (NPS 2003). Four waterbodies in the Greater Yellowstone Network (GRYN) have been identified by the states of Montana and Wyoming (in response to the CWA) as being impaired and appear on their respective 303(d) lists. Causes for listing include: fecal coliforms, nitrogen, dewatering and metal contamination. The parameters to be monitored are dependent not only on the cause for listing, but also upon the specific criteria that each state uses to define the use categories or classes of its surface waters. Monitoring Questions Addressed by the Protocol: The development of measurable objectives is a critical element of any monitoring protocol. Regulatory monitoring (i.e., monitoring conducted under the provisions of the CWA) is intended to determine whether certain chemical or biological parameters meet state standards. The parameters chosen for monitoring are those found to be outside state standards and are the reasons for listing as 303(d) impaired by either the state of Montana or Wyoming. By answering the general question “Does parameter “X” exceed state standards?” the GRYN will:
1. Determine whether the overall goal of improved water quality is being achieved; and
September 1, 2005
Vital Signs Monitoring Plan • 43
2. Help gather information on the pollutants that exceed standards to assist the park and the state in designing specific pollution prevention or remediation programs through total maximum daily loads.
These objectives specifically cover streams that are currently listed by the state as 303(d). Montana and Wyoming update their list of impaired river and streams (303(d)) every two years. Bighorn Lake is scheduled to be assessed by the state of Montana in 2005. GRYN will keep appraised of state 303(d) status; if the status of streams in the network change and new streams are listed, additional objectives will need to be developed. Specific monitoring objectives Based on Wyoming standards for fecal coliforms (WY-DEQ 2001) (and anticipated standard for Escherichia coli [E. coli]), the regulatory monitoring objectives for the impaired portion of the Shoshone River are: 1a) Determine fecal coliform concentrations at the sampling location Shoshone River at Kane.
Compare analytical results to the state standard: the geometric mean of 200 organisms per 100 milliliters based on a minimum of not less than 5 samples obtained during separate 24-hour periods for any 30-day period.
1b) Determine E. coli concentrations at the sampling location Shoshone River at Kane. Compare
analytical results to the state standard: the geometric mean of 126 organisms per 100 mL based on a minimum of not less than 5 samples obtained during separate 24-hour periods for any 30-day period.
Based on Montana standards for nitrogen and the required documentation for “partially supporting” waters, the regulatory monitoring objective for the impaired portion of the Bighorn River are as follows: 2a) Determine nitrate concentrations at the sampling location Bighorn River near St. Xavier.
Compare analytical results to the state standard: 10,000 µg/L as the geometric mean of monthly measurements.
2b) Determine the natural range of variability of nitrate concentrations at the sampling location
Bighorn River near Xavier, based on monthly measurements. 2c) Determine the MT impairment score for macroinvertebrates (based on taxa richness, EPT
richness, biotic index, % dominant taxon, % collectors, % EPT, Shannon diversity, % scrapers+shredders, #predator taxa and % multivoltine) at the sampling location bighorn River near St. Xavier. Compare to the state standard of between 0.75 – 1.00 for fully supporting waterbodies.
Sampling recommendations for Soda Butte Creek are based on a synoptic study conducted by Knauf and Williams (2004). Sampling of invertebrates, total and dissolved trace metals, and trace metals in sediments will address concerns about metal contamination in Soda Butte Creek. Metals targeted for analyses include arsenic, copper, iron and selenium. Samples will be
September 1, 2005
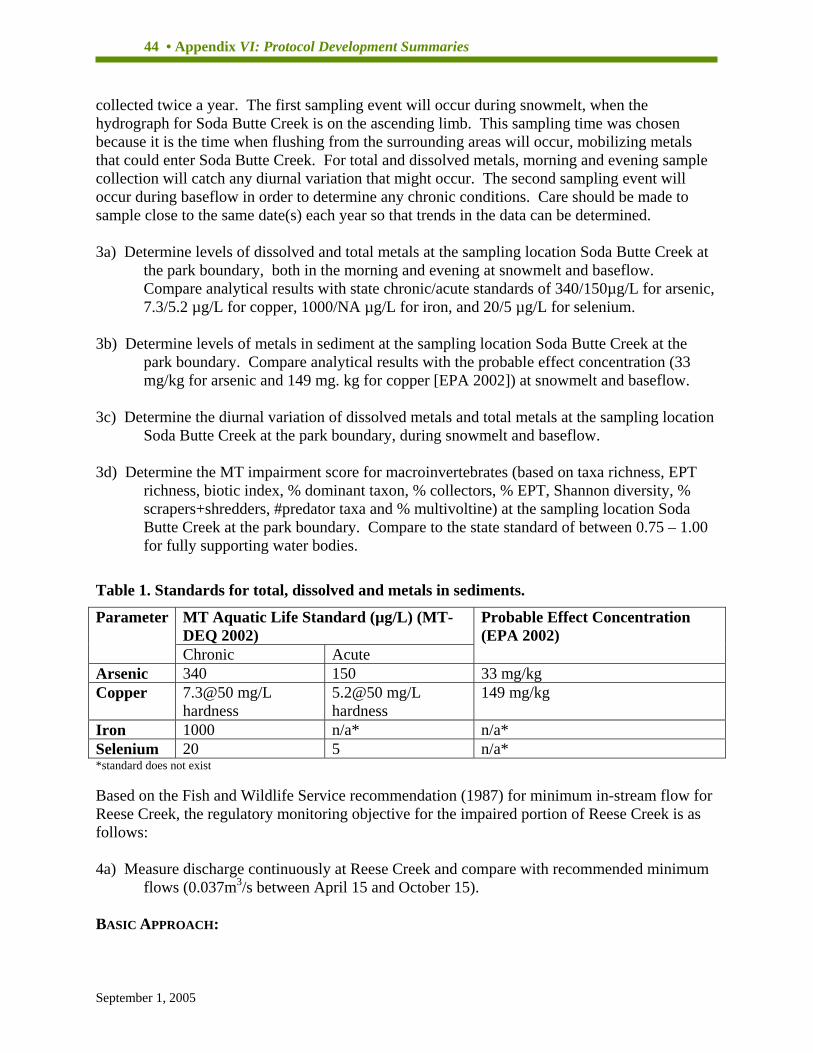
44 • Appendix VI: Protocol Development Summaries
collected twice a year. The first sampling event will occur during snowmelt, when the hydrograph for Soda Butte Creek is on the ascending limb. This sampling time was chosen because it is the time when flushing from the surrounding areas will occur, mobilizing metals that could enter Soda Butte Creek. For total and dissolved metals, morning and evening sample collection will catch any diurnal variation that might occur. The second sampling event will occur during baseflow in order to determine any chronic conditions. Care should be made to sample close to the same date(s) each year so that trends in the data can be determined. 3a) Determine levels of dissolved and total metals at the sampling location Soda Butte Creek at
the park boundary, both in the morning and evening at snowmelt and baseflow. Compare analytical results with state chronic/acute standards of 340/150µg/L for arsenic, 7.3/5.2 µg/L for copper, 1000/NA µg/L for iron, and 20/5 µg/L for selenium.
3b) Determine levels of metals in sediment at the sampling location Soda Butte Creek at the
park boundary. Compare analytical results with the probable effect concentration (33 mg/kg for arsenic and 149 mg. kg for copper [EPA 2002]) at snowmelt and baseflow.
3c) Determine the diurnal variation of dissolved metals and total metals at the sampling location
Soda Butte Creek at the park boundary, during snowmelt and baseflow. 3d) Determine the MT impairment score for macroinvertebrates (based on taxa richness, EPT
richness, biotic index, % dominant taxon, % collectors, % EPT, Shannon diversity, % scrapers+shredders, #predator taxa and % multivoltine) at the sampling location Soda Butte Creek at the park boundary. Compare to the state standard of between 0.75 – 1.00 for fully supporting water bodies.
Table 1. Standards for total, dissolved and metals in sediments.
MT Aquatic Life Standard (µg/L) (MT-DEQ 2002)
Parameter
Chronic Acute
Probable Effect Concentration (EPA 2002)
Arsenic 340 150 33 mg/kg Copper 7.3@50 mg/L
hardness 5.2@50 mg/L hardness
149 mg/kg
Iron 1000 n/a* n/a* Selenium 20 5 n/a* *standard does not exist Based on the Fish and Wildlife Service recommendation (1987) for minimum in-stream flow for Reese Creek, the regulatory monitoring objective for the impaired portion of Reese Creek is as follows: 4a) Measure discharge continuously at Reese Creek and compare with recommended minimum
flows (0.037m3/s between April 15 and October 15). BASIC APPROACH:
September 1, 2005
Vital Signs Monitoring Plan • 45
This monitoring protocol targets specific objectives related to 303(d) listed water bodies in the network. The network expects that many of the standard operating procedures developed for this protocol will also be used in the integrated water quality monitoring protocol. Existing protocols or methods that are incorporated into the protocol: The monitoring protocol for regulatory water quality monitoring has adapted and incorporated protocols from the following: American Public Health Association. 1998. Standard Methods for the Examination of Water and
Wastewater. Twentieth Edition. American Public Health Association, Washington, D.C. 1268 pp.
Montana Department of Environmental Quality. 1995. Non-Point Source Water Quality Standard Operating Procedures. http://www.deq.state.mt.us/wqinfo/monitoring/SOP/sop.asp
Peck, D.V., J.M. Lazorchak, and D.J. Klemm (editors). Unpublished draft. Environmental Monitoring and Assessment Program -Surface Waters: Western Pilot Study Field Operations Manual for Wadeable Streams. EPA/XXX/X-XX/XXXX. U.S. Environmental Protection Agency, Washington, D.C.
Texas Commission on Environmental Quality. 2003. Surface Water Quality Monitoring Procedures, Volume 1: Physical and Chemical Monitoring Methods for Water, Sediment and Tissue. RG 415. Also available on-line at http://www.tceq.state.tx.us/publications. 198 p.
U.S. Geological Survey, variously dated, National field manual for the collection of water-quality data: U.S. Geological Survey Techniques of Water-Resources Investigations, book 9, chaps. A1-A9, available online at http://pubs.water.usgs.gov/twri9A
Wyoming Department of Environmental Quality. 1999. Manual of Standard Operating Procedures for Sample Collection and Analysis. Water Quality Division, Watershed Program. Cheyenne, Wyoming. August 1999 and revisions.
In addition, EPA standard methods for analysis and sample preservation will be used by the GRYN, unless state standards dictate an alternate procedure. The complete protocol consists of the protocol narrative, several appendices (which include field forms, maps, references, etc.), and eleven standard operating procedures (SOPs) which are summarized below. Summary of Standard Operating Procedures Initial Site Establishment – SOP#1 This SOP describes the process for formally establishing water quality sampling stations. Procedures include establishing NPSTORET project and station files, selecting a suitable location for collecting water quality samples, establishing a preliminary profile of field measurements, obtaining station coordinates, photographic documentation, creating field folders, installing a staff gage and establishing a rating curve. Pre-Season Activities – SOP#2
September 1, 2005

46 • Appendix VI: Protocol Development Summaries
This SOP provides a dozen or so steps that should be taken to prepare for the field season. Specific tasks include reading the entire protocol, obtaining required training, reviewing checklists, updating reference materials, updating field folders, testing equipment and preparing equipment blanks. Safety and Health – SOP#3 The “Safety and Health SOP” provides safety checklists and forms for GRYN and contract personnel who are involved with field activities. This SOP is meant to be used in conjunction with more comprehensive manuals (cf. Lane and Fay 1997) that provide details on regulations and recommendations that apply to specific locales and field conditions. In addition, technicians are instructed to contact local park safety officers for information regarding local problems and issues such as bear safety, avalanches, West Nile virus, Lyme’s disease, and other location-specific issues. Cleaning of Equipment for Water Quality Sampling – SOP#4 Standard procedures are described in this SOP for when, where and how to clean equipment and to collect equipment blanks and field blanks for quality control. Sections of this protocol have been adapted from Chapter A3 of the USGS National Field Manual (Wilde 2004). Also, equipment care after each stream visit is discussed, which includes general cleaning for biological contaminants including whirling disease spores. Procedures for Collection of Required Field Parameters – SOP#5 This SOP focuses on the use of multi-parameter instruments and current velocity/flow meters for measuring the WRD required field parameters. Details include calibration of multi-parameter instruments, thermometers, thermistors and current velocity meters as well as the actual measurement procedures. Procedures for Collection of Regulatory Parameters – SOP#6 Standard procedures for the collection of water quality samples for regulatory monitoring purposes in the GRYN are addressed in this protocol. This SOP describes sampling techniques such as preventing contamination, the use of disposable gloves, clean hands/dirty hands techniques, field rinsing of equipment, isokinetic sampling and filtration. Sample collection procedures for fecal coliforms, E. coli, nitrogen, total and dissolved metals, metals in sediment and two different procedures (one from Wyoming DEQ and one from Montana DEQ) for collection of benthic macroinvertebrates are described in detail. This SOP also provides instructions for sample preservation, labeling and packaging. Quality Assurance/Quality Control Procedures – SOP#7 This SOP discusses aspects of the representativeness, comparability, completeness, precision, systematic error/bias and accuracy of the data to be collected for the regulatory water quality monitoring parameters in the GRYN. General data quality objectives (DQOs) for the GRYN are described. The use of quality control samples, such as blanks, duplicates and spikes is discussed with associated tables that illustrate the frequency, acceptable range and corrective actions for each QC sample. This SOP includes instructions for completing/maintaining instrument calibration log books, field log books and chain of custody forms. QA/QC procedures for data management, such as field data sheet review, electronic data entry, data archiving, data
September 1, 2005

Vital Signs Monitoring Plan • 47
verification, error correction procedures, data qualification codes and data validation are included in this protocol. Data Management Procedures – SOP#8 This SOP outlines data stewardship responsibilities and lists specific instructions and references for managing data collected. The procedure focuses on the installation and configuration of NPSTORET (a standardized database application called the Water Quality Database Templates or NPSTORET) at network parks, data flow and submission of each park’s master water quality data files to staff at NPS-WRD. Data Analysis Procedures – SOP#9 This procedure provides guidelines for the analysis of the laboratory results from the regulatory water quality samples. The analyses of results from equipment blanks, descriptive statistics and trend analysis, calculating QA/QC and standard exceedances for fecal coliforms, E. coli, metals, macroinvertebrates, nitrate and discharge are described, as well as calculations for precision estimates. Data Reporting Procedures – SOP#10 This procedure provides guidance for immediate reporting (i.e., when monitoring results show an exceedance of a state water quality standard) and for the preparation of annual reports. It includes a suggested report outline along with report review and distribution procedures. The information contained in this SOP was adapted for the GRYN from Peitz and Rowell (2004), Standard Operating Procedure #11, prepared for the Prairie Cluster Prototype Long-Term Ecological Monitoring Program. Revising the Protocol – SOP#11 This SOP provides instructions for the use of the revision history log that lists all edits and amendments to a document since the original publication date. Information entered in the revision history log should be complete and concise. The table of changes in the narrative and each SOP tracks the original publication date and version, previous version date and number, date of revision, author(s) of revision, location of change by section and paragraph, description of change and the reason for change. What is the basic methodological approach and sampling design? Regulatory water quality monitoring for the GRYN will be conducted at fixed monitoring sites using an intermittent sampling scheme. Because state monitoring and assessment programs for water quality use this type of sampling design, it is important to continue this type of sampling to maintain data comparability. The sampling design follows the strategies described by the USGS National Water Quality Assessment (NAWQA) program (Shelton 1994) for basic and intensive fixed-site assessments. Basic fixed-site assessments characterize the spatial and temporal distribution of general water quality and constituent transport in relation to hydrologic conditions and contaminant sources. Intensive fixed site assessments characterize seasonal and short-term temporal variability of general water quality and constituent transport and determine the occurrence and seasonal patterns in the transport of contaminants (Shelton 1994). Principal Investigators and NPS Lead:
September 1, 2005

48 • Appendix VI: Protocol Development Summaries
The NPS lead contributors are: Name: Rob Daley, Data Manager Location: Greater Yellowstone Network
Room 232C, AJM Johnson Montana State University Bozeman, MT 59717-3492
Phone: 406-994-4124 E-Mail: [email protected] Name: Susan E. O’Ney, Hydrologist Location: Grand Teton National Park
P. O. Drawer 170 Moose, WY 83012
Phone: 307-739-3666 FAX: 307-739-3490 E-Mail: Susan_O’[email protected] Development Schedule, Budget, and Expected Interim Products: This protocol (O’Ney 2005) was completed and peer reviewed by NPS WRD personnel in 2005 and is available on the I&M website. Revisions (based on WRD comments) will be completed in early FY06. In June 2005 objectives 1-3 of this protocol were implemented. Implementation for objective #4 (Reese Creek) is planned for FY06. The network is presently populating the required fields of NPSTORET for the regulatory water quality monitoring project and associated stations. At present, the protocol is being implemented using park affiliated personnel. In FY06 the operational plans and budget will be combined with the integrated water quality Literature Cited: Knauf M, Williams MW. 2004. Soda Butte Creek and Reese Creek: Vital Signs Monitoring
Program: Final report. 35 p plus appendices. Lane SL, Fay RG. 1997. Ch A9: Safety in field activities. In: National field manual for the
collection of water-quality data: U.S. Geological Survey techniques of water-resources investigations, Book 9. Available from: <http://pubs.water.usgs.gov/twri9A9/>.
Montana Department of Environmental Quality. 2002. Circular WQB-7. Montana Numeric
Water Quality Standards. December 2002. 38 p. National Park Service (NPS). 2001. National Park Service Strategic Plan , FY2001-FY2005.
Washing, DC: National Park Service. Available at http://www.nps.gov/performance/StrategicPlan01-05.pdf.
National Park Service. 2003.Vital signs long-term aquatic monitoring projects: Part C, draft
guidance on WRD required and other field parameter measurements, general monitoring methods and some design considerations in preparation of a detailed study plan, (work in
September 1, 2005
Vital Signs Monitoring Plan • 49
progress)”, August 6, 2003. Draft. Available at: http://science.nature.nps.gov/im/monitor/protocols/wqPartC.doc.
O’Ney SE. 2005. Regulatory water quality monitoring protocol, Version 1.0. Bozeman (MT):
National Park Service, Greater Yellowstone Network. Peitz DG, Rowell GA (Prairie Cluster Prototype Long-Term Ecological Monitoring Program).
2004. Fish community monitoring in prairie park streams with emphasis on Topeka Shiner (Notropis Topeka), Version 1. Republic (MO): National Park Service. 31 p.
Shelton LR. 1994. Field guide for collecting and processing stream-water samples for the
National Water Quality Assessment Program. U. S. Geological Survey Open-File Report 94-455. Sacramento, California.
US Environmental Protection Agency. December 2002. A Guidance Manual to Support the
Assessment of Contaminated Sediments in Freshwater Ecosystems: Volume III – Interpretation of the Results of Sediment Quality Investigations. EPA-905-B02-001-C.
US Fish and Wildlife Service. May 1987. Aquatic Resource Inventory and Fisheries Habitat
Assessment in Reese Creek, Yellowstone National Park. Aquatic Ecology Studies. Technical Report Number 3.
Wilde FD, editor. 2004. Ch A3: Cleaning of equipment for water sampling, Version 2.0. In:
National field manual for the collection of water-quality data: U.S. Geological Survey techniques of water-resources investigations, Book 9. Available from: <http://pubs.water.usgs.gov/twri9A3/>.
Wyoming Department of Environmental Quality. 2001. Water Quality Rules and Regulations,
Chapter 1, 2001. <http://deq.state.wy.us/wqd/watershed/11567-doc.pdf> last visited 10/16/03.
September 1, 2005
50 • Appendix VI: Protocol Development Summaries
Protocol Development Summary Protocol: Streamflow Parks Where Protocol will be Implemented: YELL, GRTE, BICA. Justification/Issues being addressed: Streamflow is of such importance that the NPS Water Resources Division recognizes that “ flow/discharge is a very important physical parameter of the water body that can strongly affect or show direct correlation to chemical parameters. For that reason, although not required, flow measurements are highly recommended” (Penoyer 2001, see also Irwin 2002). Streamflow at any point in time is an integration of the streamflow generation and routing mechanisms in a watershed. This integration also defines the water quality at that time, including land use activities, point source discharges and natural sources (NPS 1998). Thus streamflow measurement is an essential component of water quality monitoring. The hydrology of rivers in the GYRN can change from direct human modification (e.g., impoundments, water abstraction) or via changes in climate (Meyer et al. 1999). Measurements of continuous discharge can help determine how water withdrawals and impoundments are influencing river and streamflow dynamics. Rivers can be altered hydrologically from dam operations (e.g., Snake River), which can in turn alter biotic assemblages (Stanford and Ward 1989). Water removal for irrigation can reduce instream flows and flood peaks in the summer, (e.g., Gros Ventre River, Bighorn River, Shoshone River, Spread Creek, Reese Creek) and may negatively impact fisheries populations (Mahoney 1987). Climate change may alter stream hydrology (Poff 2002) which will affect all aspects of river ecosystem function (Meyer et al. 1999, Firth and Fisher 1992) ranging from food web interactions (Power et al. 1995) to nutrient cycling. Changes in baseflow characteristics may affect the following: balance of competitive, ruderal, and stress-tolerant organisms; creation of sites for plant colonization; structuring of aquatic ecosystems by abiotic vs. biotic factors; structuring of river channel morphology and physical habitat conditions; soil moisture stress in plants; dehydration in animals; anaerobic stress in plants; volume of nutrient exchanges between rivers and floodplains; duration of stressful conditions such as low oxygen and concentrated chemicals in aquatic environments; distribution of plant communities in lakes, ponds, floodplains; duration of high flows for waste disposal, aeration of spawning beds in channel sediments. The timing of annual extreme water conditions (such as the date of maximum flow) may affect the following: compatibility with life cycles of organisms; predictability/avoidability of stress for organisms; access to special habitats during reproduction or to avoid predation; spawning cues for migratory fish; and evolution of life history strategies; behavioral mechanisms (The Nature Conservancy 2005). Specific Monitoring Questions and Objectives Addressed by the Protocol: Specific monitoring objectives are being developed to answer the following broad question:
Are the magnitude, timing and duration of streamflow changing in the GRYN?
September 1, 2005

Vital Signs Monitoring Plan • 51
Objective 1. Estimate trends in baseflow characteristics of rivers within or adjacent to the GRYN that are “permanently” gaged by the USGS. Objective 2. Estimate trends in the timing of annual extreme water conditions of rivers within or adjacent to the GRYN that are “permanently” gaged by the USGS. Objective 3. Compare annual hydrographs for the five most recent years of record of rivers within or adjacent to the GRYN that are “permanently” gaged by the USGS. BASIC APPROACH: This monitoring protocol will include the networks plans for gathering, storing, analyzing and reporting on streamflow in the GRYN. The GRYN will utilize the network of permanent streamflow (continuous discharge) gaging stations that are being monitored by the USGS National Stream Gaging Program. Currently streamflow is being monitored continuously by the USGS at the following locations:
Station_Name USGS Station_ID
Period_of_Record
Madison River near West Yellowstone MT 06037500 1913-present
Yellowstone River at Yellowstone Lk Outlet YNP 06186500 1926-present Soda Butte Cr nr Lamar Ranger Station YNP 06187950 1888-89; 1990-present
Lamar River nr Tower Falls Ranger Station YNP 06188000 1923-present Yellowstone River at Corwin Springs MT 06190500 1889-1893; 1910-present
Gardner River near Mammoth YNP 06191000 1938-present
Firehole River near West Yellowstone MT 06036905 1983-1996 (discharge); 2002-present
Gibbon River at Madison Jct, YNP 06037100 2000-present
Boiling River at Mammoth, YNP 06190540 1988-1995; 2002-present
Soda Butte Cr at Park Bndry at Silver Gate 06187915 1999-present
Tantalus Creek at Norris junction, YNP 06039640 2004-present
Bighorn River at Kane, WY 06279500 1928-present
Bighorn River near St. Xavier, MT 06287000 1934-present
Shoshone River near Lovell, WY 06285100 1966-present
Snake River AB Jackson Lake t Flagg Ranch WY 13010065 1983 to present; prior to 1988 pub as 13010200
Snake River NR Moran WY 13011000 1903 to present
Pacific Creek at Moran WY 13011500 1906 to 1917; 1944 to 1975; 1978 to current year
September 1, 2005
52 • Appendix VI: Protocol Development Summaries
Buffalo Fork AAB Lava Creek NR Moran WY 13011900 1965 to present
Gros Ventre River at Zenith WY 13015000 July-Sept. 1917 and 1918; October 1987 to present
Granite C AB Granite C Supplemental, NR Moose, WY 13016305 1995 to present
Snake River AT Moose, WY 13013650 1995 to present
Our primary goal is to connect park managers with available data by providing annual and synthesis reports on streamflow using these data. The GRYN will analyze and interpret streamflow data through the use of the analysis program “Indicators of Hydrologic Alteration” or IHA. IHA is a software program that provides useful information for those trying to understand the hydrologic impacts of human activities. Over 1,000 water resource managers, hydrologists, ecologists, researchers and policy makers from around the world have used this program to assess how rivers, lakes and groundwater basins have been affected by human activities over time or to evaluate future water management scenarios. This program was developed by scientists at the Nature Conservancy to facilitate hydrologic analysis in an ecologically meaningful manner. This software program assesses 67 ecologically relevant statistics derived from daily hydrologic data. For instance, the IHA software can calculate the timing and maximum flow of each year’s largest flood or lowest flows, then calculates the mean and variance of these values over some period of time. Comparative analysis can then help statistically describe how these patterns have changed for a particular river or lake due to abrupt impacts such as dam construction or more gradual trends associated with land- and water-use changes. Principal Investigators and NPS Lead: The NPS Lead within the GRYN is Susan E. O’Ney, Grand Teton National Park, tel: (307) 739 3666, fax: (307) 739-3490, Email: susan_o’[email protected].
Development Schedule, Budget, and Expected Interim Products: A protocol narrative (5-10 pages) and associated SOP for using the IHA will be completed, peer-reviewed and implemented in FY06 for targeted watersheds in the GRYN. This protocol is expected to be brief and should be relatively inexpensive to prepare. Literature Cited: Firth, P. and S. G. Fisher. Eds 1992. Global climate change and freshwater ecosystems. Springer,
New York. Irwin, RJ, 2002. Vital Signs Long-Term Aquatic Monitoring Projects: Part B Draft update
October 3, 2002. http://www.nature.nps.gov/im/monitor/wqPartB.doc Mahoney, D. 1987. Aquatic Resource Inventory and Fisheries Habitat Assessment in Reese
Creek, Yellowstone National Park.
September 1, 2005
Vital Signs Monitoring Plan • 53
Meyer, J.L., M.J. Sale, P.J. Mulholland, and N.L. Poff. 1999. Impacts of climate change on aquatic ecosystem functioning and health. Journal of the American Water Resources Association 35:1373-1386.
National Park Service. 1998. Water Quality Inventory Protocol: Riverine Environments.
Technical Report NPS/NRWRD/NRTR-98/177. Penoyer, P. 2001. Water Quality, Contaminants, and Aquatic Biology Vital Signs Monitoring
Under the Natural Resource Challenge Long-Term Water Quality Monitoring Program. Part C. Draft guidance on WRD required and other field parameters measurements.
Poff, N.L. 2002. Ecological response to and management of increased flooding due to climate
change. Philosophical Transactions of the Royal Society of London (A) 360:1497-1510. Power, M., A. Sun, G. Parker, W. E. Dietrich, and J. T. Wootton. 1995. Hydraulic food chain
models. BioScience 45:159-167. Stanford, J. A., and J. V. Ward. 1989. Serial discontinuities of a Rocky Mountain River 1.
Distribution and abundance of Plecoptera. Regulated Rivers: Research and Management 3:169-175.
The Nature Conservancy. 2005. Indicators of hydrologic alteration version 7 user’s manual. 56
pp. US Fish and Wildlife Service (Department of the Interior). June 1994. Fishery and Aquatic
Management Program in Yellowstone National Park: 1993 Annual Report.
September 1, 2005

54 • Appendix VI: Protocol Development Summaries
Protocol Development Summary Protocol: Whitebark pine Parks Where Protocol will be Implemented: YELL and GRTE, with the possibility of BICA if this vital sign is extended to include limber pine. In addition, this protocol will be implemented on six national forests (Bridger-Teton, Custer, Shoshone, Gallatin, Beaverhead-Deerlodge and Caribou-Targhee). Justification/Issues being addressed: Whitebark pine occurs in the subalpine zone of the Pacific Northwest, where it is adapted to a harsh environment, often consisting of poor soils, steep slopes, high winds and extreme cold temperatures. This long-lived species is well known for its diverse growth forms ranging from straight and narrow to multi-stemmed, stunted and gnarled krummholz. Although its inaccessibility and often gnarled growth forms render whitebark pine of low commercial value, it is high in ecological value. Whitebark pine is often considered a “keystone” species of the subalpine zone (Tomback et al. 2001). Because whitebark pine can become established under conditions tolerated by few other trees, its presence can alter the microclimate such that it enables other species, such as subalpine fir, to follow (Tomback et al 1993). Its occurrence on wind-swept ridges serves as a snow fence, thus playing an important role in snow accumulation. But, perhaps its best-known role in these ecosystems is as a food source for a variety of wildlife species. Whitebark pine seeds are large and high in fat content, making them a valuable food source for more than 17 wildlife species (Kendall and Arno 1990). Whitebark pine seeds are an especially important food source for grizzly bears, which can find them stockpiled in large quantities cached by red squirrels in middens (Mattson et al. 1992). In the Greater Yellowstone Ecosystem (GYE), this food source is so important that annual cone production in the GYE is one of the major predictors of annual survival and reproduction of the bears (Mattson et al. 1992). Whitebark pine stands have been decimated in areas of the Cascades and northern Rocky Mountains due to the introduction of an exotic fungus—white pine blister rust—as well as mountain pine beetles (with a possible interaction effect between these sources of mortality). Our objectives are intended to estimate the current status of whitebark pine relative to infection with white pine blister rust as well as to assess the vital rates that would enable us to determine the probability of whitebark pines persisting in the Greater Yellowstone Ecosystem. Monitoring Questions Addressed by the Protocol: Some of the monitoring questions that will be addressed by this protocol include:
• What is the extent of white pine blister rust infection of whitebark pine throughout the Greater Yellowstone Ecosystem and is the rate of infection increasing?
• What is the severity of existing infections of white pine blister rust on whitebark pine and is the severity increasing?
• What is the survival of mature whitebark pine trees infected with white pine blister rust throughout the Greater Yellowstone Ecosystem and are mortality rates increasing?
September 1, 2005
Vital Signs Monitoring Plan • 55
Specific Monitoring Objectives:
Objective 1. To estimate the proportion of whitebark pine trees within the Greater Yellowstone Ecosystem (GRTE, YELL and six national forests) infected with white pine blister rust, and to determine whether that proportion is changing over time. Justification/rationale for this objective.-- White pine blister rust has devastated whitebark pine in other parts of the Northwest (Kendall and Keane 2001, Koteen 2002), and anecdotal evidence suggests that it may be escalating in the GYE (Koteen 2002, D. Tomback pers. comm.). Objective 2. To determine the relative severity of white pine blister rust infection in trees > 1.4 m in height within stands of infected whitebark pine within the Greater Yellowstone Ecosystem (GRTE, YELL and six national forests). Severity is indicated by the number and location (trunk or branch) of blister rust cankers. Justification/rationale for this objective.-- Determining the proportion of trees infected with white pine blister rust can be misleading without a further understanding of the magnitude of the infection. Trees that are infected at low levels may persist for a considerable time in the absence of new infections and continue to produce seeds (Tomback et al. 2001). Trees that are infected on or near the trunk of the tree also have a greater risk of mortality and loss of reproduction (Zeglan 2002). Objective 3. To estimate survival of individual whitebark pine trees > 1.4 m in height within the Greater Yellowstone Ecosystem (GRTE, YELL and six national forests), explicitly taking into account the severity of infection with white pine blister rust (from objective 2).
Justification/rationale for this objective.-- Trees that are infected at low levels may persist for considerable time (i.e., decades) in the absence of new infections, depending on where the tree is infected (Tomback et al. 2001, Koteen 2002). Estimating survival will enable us to distinguish the occurrence and severity of white pine blister rust from the ecological effect of infestation (i.e., loss of whitebark pine). Therefore, we will be better able to determine the vulnerability of whitebark pine in the Greater Yellowstone Ecosystem directly, rather than relying on potentially controversial extrapolation from other regions. BASIC APPROACH: An existing protocol has been developed by the Whitebark Pine Ecosystem Foundation (Tomback et al. 2004), although modification was needed to meet GRYN objectives and I&M standards, particularly related to site selection. In the existing protocol, the use of probability sampling is only suggested as one alternative, because of a perception that such an approach will be cost prohibitive. Judgment sampling (also known as the “relevé” method) is proposed as a viable alternative, which is unacceptable for I&M Standards, as it suffers from a high probability of selection bias that can greatly diminish the reliability of the sampling effort (Cochran 1977, Levy and Lemeshow 1999, Olsen et al. 1999). We have been working with partner organizations (USGS, U.S. Forest Service, the Greater Yellowstone Coordinating Committee, and the Statistics Department of Montana State University) to make revisions that will meet NPS standards but will make use of those parts of the existing protocol that are acceptable.
September 1, 2005

56 • Appendix VI: Protocol Development Summaries
The basic approach will be a two-stage cluster design with stands (polygons) of whitebark pine being the primary units and 10x50 m plots being the secondary units. Plots are permanently monumented for repeated visits and individual trees > 1.4 m in height are marked for estimating survival. An ongoing pilot effort funded by USFS includes subsampling within stands in order for us to evaluate within- and between–stand variability. This effort will guide the final refinement of our sampling design. The revisit design will be a rotating panel with approximately a five-year interval between surveys for a given panel (exact interval to be determined based on preliminary analysis of the pilot effort). Principal Investigators and NPS Lead: The NPS Lead within the GRYN is Robert E. Bennetts, Greater Yellowstone Network, Box 173492, 229 AJM Johnson, Montana State University, Bozeman, MT 59717, tel: (406) 994-2281, fax: (406) 994-4160, Email: [email protected]. However, this will be a collaborative effort among the GRYN, USGS (Interagency Grizzly Bear Study Team, contact: Charles Schwartz), the U.S. Forest Service (Contact: Gregg DeNitto), the Greater Yellowstone Coordinating Committee (Contact: Mary Maj). We also have a cooperative agreement with the statistics department at Montana State University to assist in this effort (Contact: Steve Cherry). Development Schedule, Budget, and Expected Interim Products: The primary monitoring objectives have been developed and adopted by our partners, although two additional objectives are still being considered. An existing protocol had been developed for monitoring whitebark pine, although some modifications were necessary to meet the specific needs of the GRYN and to meet I&M program standards. Field testing of these revised methods was initiated during FY04 using USFS money. Some problems were encountered during this initial effort and solutions proposed. We are currently field testing these refinements during our 2005 effort, again using USFS money. We anticipate an advanced field tested protocol to be completed by late fall 2005 for peer review. We anticipate full implementation by summer of 2006. This will be a collaborative effort among several agencies. Further, the necessary sample size would be obtained over several years via the revisit design, thus should not entail an unreasonable cost to the NPS. The final budget will depend on final details of the objectives and sampling design. However, based on preliminary efforts, we anticipate an annual budget for NPS of approximately $25,000, which will be matched by our partner organizations. Literature Cited Arno SF. 1986. Whitebark pine cone crops; a diminishing source of wildlife food? Western
Journal of Applied Forestry 1: 92-94. Carlson CE. 1978. Noneffectiveness of Ribes eradication as a control of white pine blister rust in
Yellowstone National Park. Forest Insect and Disease Management Report 78-18. Missoula, MT: U.S. Department of Agriculture, Forest Service, Northern Region. 6 p.
September 1, 2005
Vital Signs Monitoring Plan • 57
Cochran WG. 1977. Sampling techniques. New York: John Wiley and Sons. Hirt RR. 1942. The relation of certain meteorological factors to the infection of eastern white
pine blister rust fungus. Syracuse, NY: NY State College of Forestry. Kendall KC, Arno SF. 1990. Whitebark pine: an important but endangered wildlife
resource. In: Schmidt W, McDonald K, compilers. Whitebark pine ecosystems: ecology and management of a high mountain resource: proceedings of a symposium. General Technical Report INT-270. Ogden, UT: U.S. Department of Agriculture, Forest Service, Intermountain Research Station. p. 264-274.
Kendall KC and Keane RE. 2001. Whitebark pine decline: infection, mortality and population
trends. In: DF Tomback, SF Arno and RE Keane, editors. Whitebark pine communities: ecology and restoration. Washington: Island Press. p. 221-242.
Koteen L. 2002. Climate change, whitebark pine, and grizzly bears in the Greater Yellowstone
Ecosystem. In: Schneider SH and Root TL, eds. Wildlife responses to climate change: North American case studies. Washington: Island Press. p.343-414.
Levy PS, Lemeshow S. 1999. Sampling of populations. New York: John Wiley and Sons. Mattson DJ, Blanchard BM, Knight RR. 1992. Yellowstone grizzly bear mortality, human
habituation and whitebark pine seed crops. Journal of Wildlife Management 56:432-442. McCaughey WW, Schmidt WC. 2001. Taxonomy, distribution and history. In: Tomback DF,
Arno SF, Keane RE, editors. Whitebark pine communities: ecology and restoration. Washington, DC: Island Press. p. 29-40.
Olsen AR, Sedransk J, Edwards D, Gotway CA, Liggett W, Rathbun S, Reckhow KH, Wong LJ.
1999. Statistical issues for monitoring ecological and natural resources in the United States. Environmental Monitoring and Assessment 54: 1-45.
Tomback DF. 1982. Dispersal of whitebark pine seeds by Clark’s Nutcracker: a mutualism
hypothesis. Journal of Animal Ecology 51: 451–467. Tomback DF, Arno SF, Keane RE. 2001. The compelling case for management intervention.
In: Tomback DF, Arno SF and Keane RE, editors. Whitebark pine communities: ecology and restoration. Washington: Island Press. p. 3-25.
Tomback DF, Sund SK, Hoffmann LA. 1993. Post-fire regeneration of Pinus albicaulis: height–
age relationships, age structure and microsite characteristics. Canadian Journal of Forest Research 23:113–119.
Tomback DF, Keane RE, McCaughley WW, Smith C. 2004. Methods for surveying and
monitoring whitebark pine for blister rust infection and damage. Missoula, MT: Whitebark Pine Ecosystem Foundation. 29 p.
September 1, 2005

58 • Appendix VI: Protocol Development Summaries
Van Arsdel EP, Riker AJ, Patton RF. 1956. The effects of temperature and moisture on the
spread of white pine blister rust. Phytopathology 46: 307-318. Zeglen S. 2002. Whitebark pine and white pine blister rust in British Columbia, Canada,
Canadian Journal of Forestry Research 32: 1265-1274.
September 1, 2005
Vital Signs Monitoring Plan • i
Data and Information Management Plan
Version 1.0 September 2005
National Park Service Greater Yellowstone Inventory and Monitoring Network
Bighorn Canyon National Recreation Area
Grand Teton National Park John D. Rockefeller Jr. Memorial Parkway
Yellowstone National Park
NPS GRYN Offices USGS Northern Rocky Mountain Science Center
229 AJM Johnson Montana State University
Bozeman, MT 59717
Prepared by
Rob Daley GRYN Data Manager
With contributions from
Sara Stevens, Margaret Beer, Deborah Angell, Dorothy Mortenson, Chad Jacobson, Ann Rodman, Richard Easterbrook, Cassity Bromley, Shannon Savage, Doug Wilder, Gareth Rowell,
Michael Williams, Geoffrey Sanders, Teresa Leibfreid, Bill Moore, Patrick Flaherty, Fred Dieffenbach, Lisa Nelson, Velma Potash, Gary Entsminger, Joe Gregson and Steve Fancy
Web Site (subject to change): http://www.nature.nps.gov/im/units/gryn/index.shtml Recommended citation: Daley R. 2005. Data and Information Management Plan, Greater Yellowstone Inventory and Monitoring Network. Bozeman, MT: National Park Service, Greater Yellowstone Network. 82 p. plus appendices.
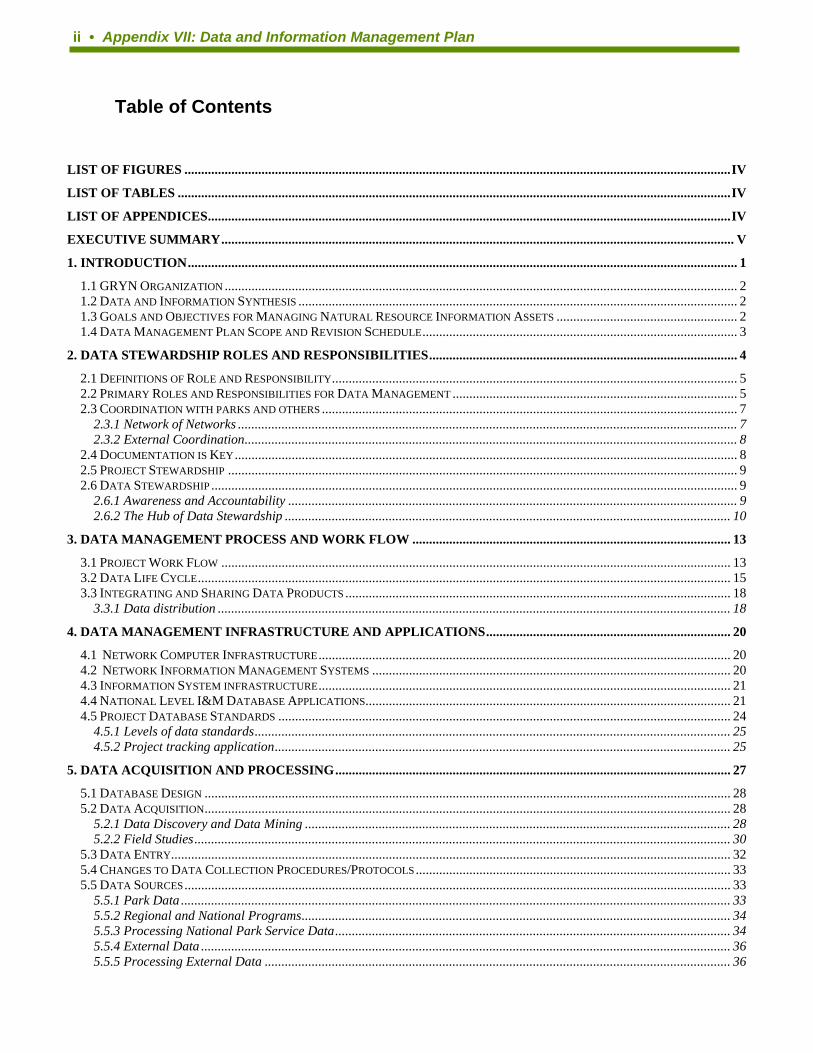
ii • Appendix VII: Data and Information Management Plan
Table of Contents LIST OF FIGURES ...................................................................................................................................................................IV LIST OF TABLES .....................................................................................................................................................................IV LIST OF APPENDICES............................................................................................................................................................IV EXECUTIVE SUMMARY......................................................................................................................................................... V 1. INTRODUCTION.................................................................................................................................................................... 1
1.1 GRYN ORGANIZATION ......................................................................................................................................................... 2 1.2 DATA AND INFORMATION SYNTHESIS ................................................................................................................................... 2 1.3 GOALS AND OBJECTIVES FOR MANAGING NATURAL RESOURCE INFORMATION ASSETS ...................................................... 2 1.4 DATA MANAGEMENT PLAN SCOPE AND REVISION SCHEDULE.............................................................................................. 3
2. DATA STEWARDSHIP ROLES AND RESPONSIBILITIES............................................................................................ 4 2.1 DEFINITIONS OF ROLE AND RESPONSIBILITY......................................................................................................................... 5 2.2 PRIMARY ROLES AND RESPONSIBILITIES FOR DATA MANAGEMENT ..................................................................................... 5 2.3 COORDINATION WITH PARKS AND OTHERS ............................................................................................................................ 7
2.3.1 Network of Networks ..................................................................................................................................................... 7 2.3.2 External Coordination................................................................................................................................................... 8
2.4 DOCUMENTATION IS KEY...................................................................................................................................................... 8 2.5 PROJECT STEWARDSHIP ........................................................................................................................................................ 9 2.6 DATA STEWARDSHIP ............................................................................................................................................................. 9
2.6.1 Awareness and Accountability ...................................................................................................................................... 9 2.6.2 The Hub of Data Stewardship ..................................................................................................................................... 10
3. DATA MANAGEMENT PROCESS AND WORK FLOW ............................................................................................... 13 3.1 PROJECT WORK FLOW ........................................................................................................................................................ 13 3.2 DATA LIFE CYCLE............................................................................................................................................................... 15 3.3 INTEGRATING AND SHARING DATA PRODUCTS ................................................................................................................... 18
3.3.1 Data distribution ......................................................................................................................................................... 18 4. DATA MANAGEMENT INFRASTRUCTURE AND APPLICATIONS......................................................................... 20
4.1 NETWORK COMPUTER INFRASTRUCTURE........................................................................................................................... 20 4.2 NETWORK INFORMATION MANAGEMENT SYSTEMS ........................................................................................................... 20 4.3 INFORMATION SYSTEM INFRASTRUCTURE........................................................................................................................... 21 4.4 NATIONAL LEVEL I&M DATABASE APPLICATIONS............................................................................................................. 21 4.5 PROJECT DATABASE STANDARDS ....................................................................................................................................... 24
4.5.1 Levels of data standards.............................................................................................................................................. 25 4.5.2 Project tracking application........................................................................................................................................ 25
5. DATA ACQUISITION AND PROCESSING...................................................................................................................... 27 5.1 DATABASE DESIGN ............................................................................................................................................................. 28 5.2 DATA ACQUISITION............................................................................................................................................................. 28
5.2.1 Data Discovery and Data Mining ............................................................................................................................... 28 5.2.2 Field Studies................................................................................................................................................................ 30
5.3 DATA ENTRY....................................................................................................................................................................... 32 5.4 CHANGES TO DATA COLLECTION PROCEDURES/PROTOCOLS.............................................................................................. 33 5.5 DATA SOURCES................................................................................................................................................................... 33
5.5.1 Park Data .................................................................................................................................................................... 33 5.5.2 Regional and National Programs................................................................................................................................ 34 5.5.3 Processing National Park Service Data...................................................................................................................... 34 5.5.4 External Data .............................................................................................................................................................. 36 5.5.5 Processing External Data ........................................................................................................................................... 36
Vital Signs Monitoring Plan • iii
6. DATA QUALITY ASSURANCE.......................................................................................................................................... 38 6.1 NPS MANDATE FOR QUALITY............................................................................................................................................. 38 6.2 DEFINITIONS OF QUALITY ASSURANCE AND QUALITY CONTROL ....................................................................................... 39 6.3 ROLES AND RESPONSIBILITIES FOR QUALITY ASSURANCE.................................................................................................. 40 6.4 GOALS AND OBJECTIVES FOR QUALITY ASSURANCE .......................................................................................................... 41 6.5 DATA COLLECTION ............................................................................................................................................................. 42
6.5.1 Suggested Methods to reduce errors during field data collection............................................................................... 42 6.6 QUALITY ASSURANCE FOR DATA ENTRY............................................................................................................................ 44
6.6.1 Suggested Methods to reduce errors during data entry .............................................................................................. 45 6.7 VERIFICATION AND VALIDATION PROCEDURES .................................................................................................................. 46
6.7.1 Suggested Methods for Data Verification ................................................................................................................... 47 6.7.2 Data Validation ........................................................................................................................................................... 48 6.7.3 Suggested Methods for Data Validation...................................................................................................................... 49
6.8 VERSION CONTROL ............................................................................................................................................................. 51 6.9 DATA QUALITY REVIEW AND COMMUNICATION................................................................................................................. 52
7. DATA DOCUMENTATION................................................................................................................................................. 56 7.1 PURPOSE OF METADATA ..................................................................................................................................................... 56 7.2 NPS INTEGRATED METADATA SYSTEM PLAN AND TOOLS.................................................................................................. 56 7.3 METADATA PROCESS AND WORKFLOW .............................................................................................................................. 58
8. DATA MANAGEMENT SUPPORT FOR ANALYSIS AND REPORTING................................................................... 61 8.1 PERIODIC AND ANNUAL REPORTING ................................................................................................................................... 61 8.2 LONG-TERM TRENDS ANALYSIS AND REPORTING............................................................................................................... 61
9. DATA DISTRIBUTION ........................................................................................................................................................ 63 9.1 NATIONAL PARK SERVICE POLICY ON DATA OWNERSHIP .................................................................................................. 63 9.2 ESTABLISHING DATA OWNERSHIP GUIDELINES .................................................................................................................. 64 9.3 DATA DISTRIBUTION........................................................................................................................................................... 65
9.3.1 Data Distribution Mechanisms.................................................................................................................................... 65 9.4 DATA CLASSIFICATION: PROTECTED VS. PUBLIC ................................................................................................................. 67 9.5 ACCESS RESTRICTIONS ON SENSITIVE DATA....................................................................................................................... 69 9.6 NPS INVENTORY AND MONITORING DATA AVAILABILITY ................................................................................................. 70 9.7 DATA ACCESS AND REQUEST PROCEDURES........................................................................................................................ 71 9.8 DATA QUALITY FEEDBACK................................................................................................................................................. 71
10. DATA MAINTENANCE, STORAGE AND ARCHIVING ............................................................................................. 72 10.1 DIGITAL DATA MAINTENANCE ......................................................................................................................................... 72
10.1.1 Short-term data sets .................................................................................................................................................. 72 10.1.2 Long-term monitoring data sets ................................................................................................................................ 73
10.2 QUALITY CONTROL FOR CONVERTED DATA....................................................................................................................... 73 10.3 STORAGE AND ARCHIVING PROCEDURES FOR DIGITAL DATA........................................................................................... 74 10.4 DIRECTORY STRUCTURE FOR INDIVIDUAL PROJECTS ......................................................................................................... 74 10.5 BACKUP PROCEDURES FOR DIGITAL DATA......................................................................................................................... 75 10.6 DATA AND NETWORK SECURITY........................................................................................................................................ 75 10.7 STORAGE AND ARCHIVING PROCEDURES FOR DOCUMENTS AND PHYSICAL OBJECTS ...................................................... 75
10.7.1 Documents................................................................................................................................................................. 76 10.7.2 Specimens.................................................................................................................................................................. 77 10.7.3 Photographs .............................................................................................................................................................. 77
10.8 ROLE OF CURATORS IN STORAGE AND ARCHIVING PROCEDURES ....................................................................................... 77 CHANGE PROCEDURES AND REVISION HISTORY LOG ............................................................................................ 78 REFERENCES........................................................................................................................................................................... 79

iv • Appendix VII: Data and Information Management Plan
List of Figures Figure 1.1. National Park Service Units served by the GRYN......................................................................1 Figure 2.1. Joint Project and Data Management Responsibilities ...............................................................11 Figure 3.1. Conceptual model of project work flow ....................................................................................14 Figure 3.2. Diagram of the typical project data life cycle............................................................................17 Figure 3.3. Storing and disseminating project information..........................................................................18 Figure 3.4. Steps involved in product distribution.......................................................................................19 Figure 4.1. Network Computer Architecture ...............................................................................................20 Figure 4.2. Model of the national-level application architecture. ................................................................22 Figure 4.3. Water Quality Data Flow..........................................................................................................23 Figure 4.4. Common lookup tables and satellite databases .........................................................................24 Figure 4.5. Different levels of data standards ..............................................................................................25 Figure 5.1. Natural Resource Data Management Framework.....................................................................35 Figure 6.1. QA/QC controls applied at progressive stages of a project.......................................................40 Figure 7.1. NPS Integrated Metadata System Plan ......................................................................................57 List of Tables TABLE 2.1. CATEGORIES OF DATA STEWARDSHIP INVOLVING ALL NETWORK PERSONNEL...................... 4 TABLE 2.2. SUMMARY OF ROLES AND RESPONSIBILITIES ........................................................................................ 6 TABLE 3.1. REPOSITORIES FOR GRYN PRODUCTS...................................................................................................... 18 TABLE 5.1. ABBREVIATED DATA DEVELOPMENT MODEL....................................................................................... 27 TABLE 6.1. CHECKLIST OF FUNDAMENTAL QUALITY CONTROL ACTIVITIES FOR A PROJECT ............... 55 TABLE 9.1. ONLINE DATABASE APPLICATIONS AND RELATED DATA TYPES. .................................................. 66
List of Appendices Appendix A: Roles, Responsibilities, and Awareness Levels for Data Management ................................ vii Appendix B: GRYN Folder and File Naming Conventions ........................................................................xv Appendix C: Freedom of Information Act (FOIA) and Sensitive Data.................................................. xxvii Appendix D: Using the Global Positioning System and Portable Data Recorders..................................xxxv
Vital Signs Monitoring Plan • v
Executive Summary Established in 2000 as one of 32 field offices in the NPS Natural Resource Inventory and Monitoring Program, the Greater Yellowstone Network (GRYN) provides coordination and services for the inventory and long term monitoring of selected natural resources in Bighorn Canyon National Recreation Area, Grand Teton National Park (including John D. Rockefeller Jr. Memorial Parkway), and Yellowstone National Park. As a component of the network’s Vital Signs Monitoring Plan this data management plan outlines the strategy and guidelines for thorough, integrated, and coordinated resource information management activities to meet NPS-wide information requirements and park level inventory and monitoring information needs. The content of this plan includes overview descriptions, guiding principles, important concepts, and elements of the Service’s evolving enterprise architecture for its natural resource line of business. Specific procedures and best practices not covered in this plan are found in the data management and other sections of the network’s individual monitoring protocols. About one-third of I&M program and network resources are devoted to generating, managing, and sharing data and information resources that are well planned, highly organized, easily accessible, completely documented, and scientifically credible. The purpose of emphasizing data management is to provide stable, long-term support for natural resource managers and decision makers in the NPS, as well as non-NPS partners, scientists, and other stakeholders. The foundation for effective data management begins with specifying data stewardship roles and responsibilities for every aspect of program and project planning and operations. This plan lists several roles and associated responsibilities for data management that cover data producers through end users. Management level support for these responsibilities, particularly at parks, is required to meet I&M program goals. Park managers need to plan for and provide funds and time to adequately manage data and information resources generated by I&M program and other natural resource management activities. Managers at all levels also need to provide accountability for data management responsibilities as performance elements for all natural resource positions. Emphasis is placed on the collaborative nature of successful data stewardship, and the network promotes a teamwork approach to data management. Because it is essential to establish, communicate, and support data stewardship responsibilities for all staff at all stages of a project, chapter three discusses project workflow and data management issues and opportunities. A standard data lifecycle model helps demonstrate the relationship between park-level data collection for inventory and monitoring projects with NPS service-wide databases and data distribution services. The network operates and maintains a NPS-compliant information technology infrastructure at offices currently located on the Montana State University campus in Bozeman. Hardware, software, security provisions, and local area network services are managed by GRYN staff with support from regional and park level technology service staff. The network maintains project-specific database applications and data sets designed and populated based on inventory study plans and specific monitoring objectives, often in partnership with non-NPS partners such as the US Geological Survey and the US Forest Service. The data stored in these local applications are transferred at appropriate intervals to NPS service-wide
Executive Summary

Executive Summary
vi • Appendix VII: Data and Information Management Plan
databases and repositories including NPSpecies, NatureBib, NPSTORET, the NPS Natural Resource GIS Metadata and Data Clearinghouse, and the NPS Biodiversity Data Store. The network necessarily focuses on collecting and managing data that are required to meet monitoring objectives specified in the vital sign monitoring protocols. GRYN also works with staff from network parks, the NPS regional and Washington offices, and other partner entities to identify, manage, and integrate legacy data from past monitoring efforts and relevant data sources from ongoing monitoring that are not based strictly on protocols generated by the NPS I&M program. Chapter five discusses the networks options for recording data in the field, its approach to database design and data discovery, acquisition, and entry, and the treatment of data from different organizational levels in the NPS. An important data management goal discussed in chapter six is how to ensure that I&M projects produce data that meet quality requirements specified in vital sign monitoring protocols. The plan discusses ways to reduce errors when entering data, procedures for verifying and validating data, and methods to share information about data quality to promote the appropriate application and use of data resources. Another principal component of effective data management operations is data documentation, discussed in the context of network activities involving NPS metadata creation and distribution tools in chapter seven. Chapter eight follows with a brief discussion of the supporting role of data management for analysis and reporting. GRYN is committed to making all available and relevant data easily accessible while providing for the appropriate level of protection for sensitive data resources. Procedures and solutions for making data available to park natural resource managers and decision makers, as well as other stakeholders and interested parties are presented in Chapter nine. In the final chapter the long term elements of data maintenance, storage, and archiving are addressed for electronic as well as physical (specimen) and hardcopy data and information resources. Current and future GIS and information management strategies and solutions at each park represent valuable information about what works and what needs improvement in the realm of data management. Staff from the network and the parks will coordinate and integrate data management activities based on common tools, best practices and shared objectives. This plan is a key mechanism to help understand and address the relationships between park level information needs supported by park GIS and data management activities, and I&M program organization and standards for Network data management.
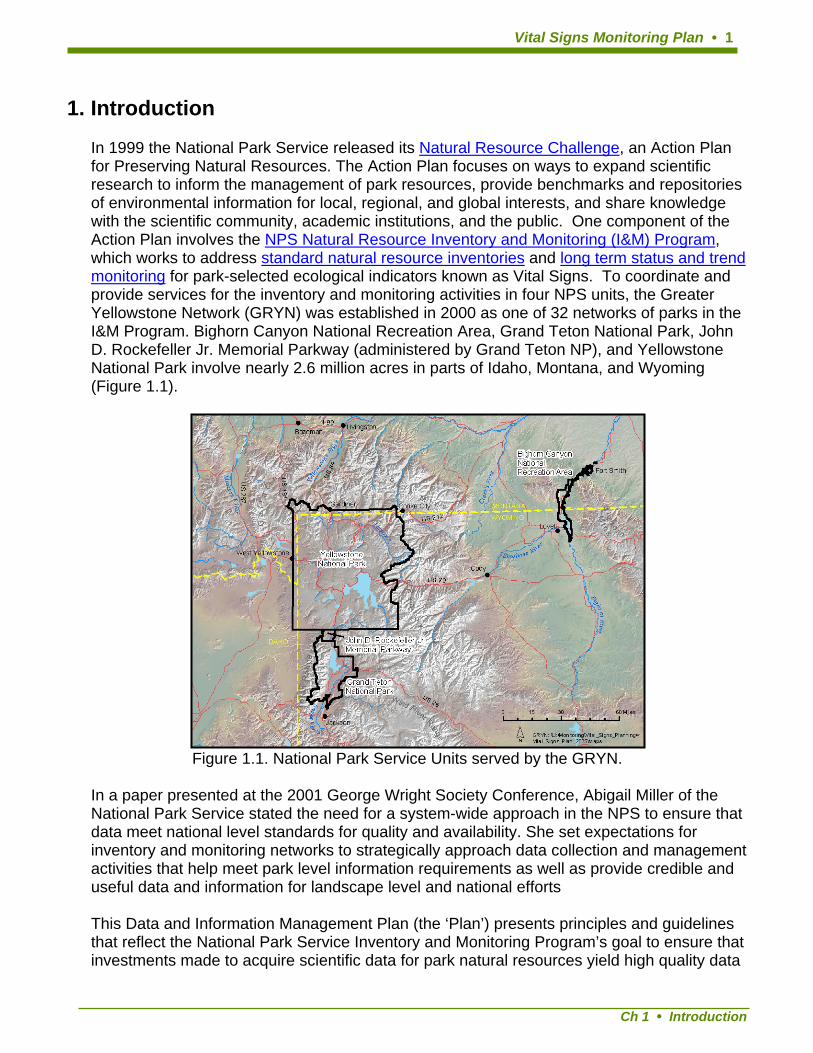
Vital Signs Monitoring Plan • 1
1. Introduction In 1999 the National Park Service released its Natural Resource Challenge, an Action Plan for Preserving Natural Resources. The Action Plan focuses on ways to expand scientific research to inform the management of park resources, provide benchmarks and repositories of environmental information for local, regional, and global interests, and share knowledge with the scientific community, academic institutions, and the public. One component of the Action Plan involves the NPS Natural Resource Inventory and Monitoring (I&M) Program, which works to address standard natural resource inventories and long term status and trend monitoring for park-selected ecological indicators known as Vital Signs. To coordinate and provide services for the inventory and monitoring activities in four NPS units, the Greater Yellowstone Network (GRYN) was established in 2000 as one of 32 networks of parks in the I&M Program. Bighorn Canyon National Recreation Area, Grand Teton National Park, John D. Rockefeller Jr. Memorial Parkway (administered by Grand Teton NP), and Yellowstone National Park involve nearly 2.6 million acres in parts of Idaho, Montana, and Wyoming (Figure 1.1).
Figure 1.1. National Park Service Units served by the GRYN.
In a paper presented at the 2001 George Wright Society Conference, Abigail Miller of the National Park Service stated the need for a system-wide approach in the NPS to ensure that data meet national level standards for quality and availability. She set expectations for inventory and monitoring networks to strategically approach data collection and management activities that help meet park level information requirements as well as provide credible and useful data and information for landscape level and national efforts This Data and Information Management Plan (the ‘Plan’) presents principles and guidelines that reflect the National Park Service Inventory and Monitoring Program’s goal to ensure that investments made to acquire scientific data for park natural resources yield high quality data
Ch 1 • Introduction

2 • Appendix VII: Data and Information Management Plan
and information assets that are organized, available, useful, compliant, and secure. To achieve these fundamental requirements, the Plan focuses on the following objectives: • Provide data management services and guidance in support of the Inventory and
Monitoring Program’s goal to identify, catalog, organize, structure, archive, and make available relevant natural resource information;
• Initiate and invest in data management activities based on data and information needs defined in network monitoring protocols and inventory study plans;
• Integrate data management activities with all aspects and at all stages of network business;
• Specify data stewardship responsibilities for all personnel; • Collaborate internally and externally to address data management issues with individuals
at all organizational levels. 1.1 GRYN Organization The network’s coordinator, ecologist, and data manager are stationed in Bozeman, Montana. Temporary staff can be stationed in Bozeman and at the parks. Network business is guided locally by a Technical Committee of managers from the network parks, and approved by a Board of Directors made up by superintendents (or their representative) from each network park. Yellowstone National Park and Grand Teton National Park have active GIS and resource information management programs whose staff work with network personnel to identify and develop common strategies and policies for integrated data management. Resource specialists and managers at Bighorn Canyon National Recreation Area work with network staff to develop and implement data management practices that meet the information needs of the recreation area and the network. 1.2 Data and Information Synthesis Natural resource data include collections of estimated, predicted, observed, and measured values or classifications for any element or event of an ecological system, including physical, chemical, biological, and human dimensions. The patterns and relationships among these data represent the information that provides meaning to people who wish to understand, manage, and use park resources. An important objective of the network’s Vital Signs Monitoring Plan is to synthesize and deliver overall ecosystem status and trend information. Resulting products are based on data from multiple network Vital Sign monitoring protocols and other relevant data and information in various formats and conditions, from sources within and outside the National Park Service. The network manages all types, forms, and stages of data and information and their inherent relationships, provided that they support one or more of the following program elements:
• goals and objectives of the network’s Vital Signs Monitoring Plan • specific needs defined in approved Vital Sign monitoring protocols • network inventory study plan objectives • other specific natural resource management projects that network personnel and park
staff agree to cooperate in developing and managing 1.3 Goals and Objectives for Managing Natural Resource Information Assets The overall mission for GRYN data management is to provide and support data and information resources that are organized, useful, available, compliant, and secure. The
Ch 1 • Introduction

Vital Signs Monitoring Plan • 3
network’s monitoring efforts and resource information management activities are expected to provide park managers with the scientific data they need to understand and manage park resources. Based on the strategic approach to data management from the Inventory and Monitoring Program, the goals of the network include the following: • Identify the most critical data needs for parks and networks • Develop partnerships with other land and resource management agencies, non-
government entities, and public and private interests • Collaborate internally and externally to help establish consistency among approaches
and protocols • Compare and share protocols and data sets locally and via the NPS I&M Protocol
Database • Use standard quantitative and qualitative measures to report on the condition and trends
of natural resources Primary objectives of natural resource data and information management include: • Manage data and information as programmatic and service-wide resources • Manage data acquisition to avoid duplication and unnecessary expense • Store, manage, and maintain data in one or more central and accessible repositories • Protect data from unauthorized or unplanned modifications • Perform quality controls on data throughout its life cycle • Share data and information appropriately with internal and external interests 1.4 Data Management Plan Scope and Revision Schedule Data and information resources relevant to the network are those that result from or relate to the implementation of a formal network Vital Signs monitoring protocol, network Inventory Study Plan, or park and network approved project with well defined and thoroughly reviewed information needs. This plan covers ways in which the network manages all programmatic information assets, including hardcopy reports and field forms, electronic files, spatial and tabular data sets, image data from remote sensors and cameras, audio and video data, and ground-based images. The plan also discusses the network’s involvement with the parks and conservatories in handling and managing physical specimens such as voucher evidence for records used in NPSpecies, the National Park Service’s biological diversity database. This plan, its appendices, and the data management section in each Vital Sign monitoring protocol require updates and regular maintenance by network staff. To provide access to data and information management principles and guidance, the network continuously maintains a web-based data and information management plan. Minor revisions and edits occur regularly and more substantial changes or additions occur as needed when relevant new information results from network business, NPS policy, or Inventory and Monitoring Program direction. A comprehensive review and update of the Data and Information Management Plan will occur every three years. Changes to the Plan are documented in the Revision History Log at the end of this document.
Ch 1 • Introduction

4 • Appendix VII: Data and Information Management Plan
2. Data Stewardship Roles and Responsibilities
The benefits to natural resource managers, scientists, and the public from inventory and monitoring project results are substantially affected by the ability of the individuals working on the project, the network staff, and the National Park Service to keep track of data from the time they are gathered until and while they inform a decision making process. Managing data for multiple monitoring protocols and NPS inventories involves timeframes of several years and includes changes in information technology, turnover in staff, new scientific insights, and shifting priorities. This requires that every individual involved with the Greater Yellowstone network understand and perform data stewardship responsibilities in the production, analysis, management, and/or end use of the data (Table 2.1). As coordinator of these activities, the fundamental role of the network data manager is to understand program and project requirements, create and maintain data management infrastructure and standards, and educate, communicate, and work with all responsible individuals. In order to achieve the highest possible success in delivering useful and credible scientific information about park ecosystems, the Inventory and Monitoring Program expects each network to invest at least thirty percent of available resources (time, money, and expertise) in data management, analysis, and reporting. In addition to the overall data management roles and responsibilities presented here, each Vital Sign monitoring protocol and inventory study plan contains specific instructions for assignments and tasks that nest within a data stewardship framework. Table 2.1. Categories of data stewardship involving all network personnel.
Stewardship Category Related Activities Principal jobs or
positions Note: Each position is listed in only one category according to overriding responsibilities. However, most positions contribute in each category.
Production
Creating data or information from any original or derived source. This includes recording locations, images, measurements, and observations in the field, digitizing source maps, keying in data from a hardcopy source, converting existing data sources, image processing, and preparing and delivering informative products, such as summary tables, maps, charts, and reports.
Project Crew Member Project Crew Leader Data/GIS Specialist or Technician
Analysis
Using data to predict, qualify, and quantify ecosystem elements, structure, and function as part of the effort to understand these components, address monitoring objectives, and inform park and ecosystem management.
Network Ecologist Resource Specialist Statistician/Biometrician
Management
Preparing and executing policies, procedures, and activities that keep data and information resources organized, available, useful, compliant, and secure.
Network Data Manager Project Leader GIS Manager IT Specialist Database Manager National I&M Data Manager Curator
Ch 2 • Data Stewardship Roles and Responsibilities

Vital Signs Monitoring Plan • 5
Stewardship Principal jobs or Related Activities Category positions
End Use
Informing the scope and direction of science information needs and activities. Providing the money and scheduling the time required for project leaders and staff to meet stated objectives for data quality and other data management objectives. Obtaining and applying available information to develop knowledge that contributes to understanding and managing park resources. Providing feedback for improvements in data content and quality.
Network Coordinator Park managers and superintendents Others
2.1 Definitions of Role and Responsibility The network considers a role as a function or position (e.g., Data Manager) while a responsibility is a duty or obligation (e.g., review data records). Data stewardship is not treated as a role because it involves all project staff sharing the responsibilities for managing data and information resources. Using the term ‘Data Steward’ seems appropriate only when a list of specific responsibilities is associated with every role in a given project or program. Establishing a single project data steward role is avoided because an unmanageable burden (real or perceived) is placed on a single position/person, and others with data management responsibilities are more likely to under perform. 2.2 Primary Roles and Responsibilities for Data Management An increasing demand for more detailed, higher quality data and information about natural resources and ecosystem functions requires a group of people working together to effectively steward data and information assets. The current and expected capacity, diversity, and rate of change in information technology make managing any large amount of data a greater task than any person can reasonably do alone. Knowledgeable individuals from scientific, administrative, and technological disciplines must work together to ensure that data are collected using appropriate methods, and that resulting data sets, reports, maps, models, and other derived products are well managed. Data sets and related products must be credible, representative, and available for current and future needs. A typical data set used for inventory and monitoring is handled, viewed, and stewarded by most or all of the people serving in the roles (jobs) listed in Table 2.2. These roles are listed ‘from the ground up’ to help demonstrate the hierarchy and overlap of responsibilities. For example, a project leader is ultimately responsible for the activities listed in the field level roles of crew leader and crew member, and the network coordinator ensures that the network data manager and ecologist achieve the required performance level. With one third of network resources devoted to overall data management, analysis, and reporting, the network intends to avoid cases in which a single position is assigned unattainable duties for multiple roles, resulting in a lack of attention to one or more aspects of the project. Meeting this goal requires awareness and support from park managers to plan for, fund, and provide performance level accountability for the resources required to adequately manage their park’s data and information assets. Learning, understanding, and acting on the responsibilities listed for all categories of data stewardship will help prevent the critical aspects of data management from being overlooked or under-funded.
Ch 2 • Data Stewardship Roles and Responsibilities

6 • Appendix VII: Data and Information Management Plan
Table 2.2. Summary of Roles and Responsibilities Role Primary responsibilities related to data management
Project Crew Member Record and verify measurements and observations based on project objectives and protocols. Document methods, procedures and anomalies.
Project Crew Leader Supervise crew members to ensure their data collection and management obligations are met, including data verification and documentation.
Data/GIS Specialist or Technician Perform assigned level of technical data management and/or GIS activities, including data entry, data conversion, and documentation. Work on overall data quality and stewardship with project leaders, resource specialists, and the Network data manager.
Information Technology/Systems Specialist
Provide and maintain an information systems and technology foundation to support data management.
Project Leader Oversee and direct operations, including data management requirements, for one or more network projects. Maintain communication with project staff, Network Data Manager, and resource specialist regarding data management. Determine what others inside and outside the NPS are doing relative to the project, and establish a minimum set of standard data items to promote comparability with other efforts. Note: The Project Leader is often a resource specialist, in which case the associated responsibilities for data authority apply (see next role). A Project Leader without the required background to act as an authority for the data will consult with and involve the appropriate resource specialists.
Resource Specialist Understand the objectives of the project, the resulting data, and their scientific and management relevance. Make decisions about data with regard to validity, utility, sensitivity, and availability. Describe, publish, release, and discuss the data and associated information products.
Note: The Resource Specialist serving as a Project Leader is also responsible for the duties listed with that role.
GIS Manager Support park management objectives. Coordinate and integrate local GIS and resource information management with network, regional, and national standards and guidelines.
Network Data Manager Provide overall network planning, training, and operational support for the awareness, coordination, and integration of data and information management activities, including people, information needs, data, software, and hardware. Serve as Point of Contact for National Park Service database applications (NPSpecies) Coordinate internal and external data management activities, especially in collaboration with project leaders Ensure that metadata is created to meet NPS standards and published on an NSDI clearinghouse
Database Manager Apply particular knowledge and abilities related to database software and associated application(s)
Curator Oversee all aspects of the acquisition, documentation, preservation, and use of park collections
Statistician/Biometrician Analyze data and present information
Ch 2 • Data Stewardship Roles and Responsibilities

Vital Signs Monitoring Plan • 7
Role Primary responsibilities related to data management Network Ecologist Ensure useful data are collected and managed by integrating
natural resource science in network activities and products, including objective setting, sample design, data analysis, synthesis, and reporting
Network Coordinator Ensure programmatic data and information management requirements are met as part of overall network business
I&M Data Manager (National Level)
Provide service-wide database design, support, and services, including receiving and processing to convert, store, and archive data in service-wide databases
Other End Users These 'information consumers' include park managers and superintendents, researchers, staff from other agencies, and the public. End users are responsible for informing the scope and direction of science information needs and activities, applying data and derived products appropriately, and providing feedback for improvements. Park superintendents and program managers, in particular, are responsible for providing the money and scheduling the time required for project leaders and staff to meet stated data quality and other data management objectives.
2.3 Coordination with parks and others The Natural Resource Challenge states that collaboration among the National Park Service, other public agencies, universities, and non-governmental organizations is necessary to effectively acquire, apply, and promulgate the scientific knowledge gained in parks. The Inventory and Monitoring Program encourages coordination among participants at all levels to help ensure that data collected by NPS staff, cooperators, researchers and others are entered, quality-checked, documented, analyzed, reported, archived, cataloged, and made available for management decision-making, research, and education. The network data manager works with national Inventory and Monitoring Program data management staff and regional resource information management personnel to maintain awareness and involvement in service-wide and regional databases and data management policy and guidance. The network data manager works locally with network personnel, park staff, and cooperators to promote and develop workable standards and procedures that result in integration and availability of data sets. Key contacts for the network data manager include park GIS and data managers and the project leaders for each monitoring or inventory project. Regular and productive communication among these personnel leads to common understanding and better synchronization of network and park data management activities. Park and network staff coordinate on resource information management using a variety of methods, including personal visits, phone calls, email, joint meetings and training sessions, as well as the meetings and work of the network’s Technical Committee, Science Committee, and Board of Directors. The development of network planning materials, including inventory study plans and monitoring protocols, includes involvement and input from park scientists and resource information management staff. This data and information management plan, for example, is prepared with input and review from park GIS managers and others. 2.3.1 Network of Networks The prototype monitoring parks and networks established a foundation of collaboration and coordination in network and park data management that continues to benefit the Inventory and Monitoring Program and data management in the National Park Service.
Ch 2 • Data Stewardship Roles and Responsibilities

8 • Appendix VII: Data and Information Management Plan
Data managers throughout the program regularly coordinate with each other and national program staff via annual meetings, conference calls, workgroups, a listserv, web sites, and informal communication. Data managers from several networks divided the workload and collaborated on developing their respective network Data Management Plans. This model of cooperation using available resources and strong communication is effective in the National Park Service and can be productively applied to most situations involving resource information management across and among the administrative units of the organization. The Greater Yellowstone Network maintains an active role in coordination between networks and parks to promote practical consistency among protocols, database designs, and data sets. GIS and data managers from network parks are asked to participate in program development and activities, take advantage of Inventory and Monitoring Program resources, and communicate with network and program staff to share information about progress and direction and address concerns. 2.3.2 External Coordination The two largest network parks are partners in land and resource management within the Greater Yellowstone Ecosystem, which garners a high level of interest ranging from research and interpretation of the Ecosystem to dialogue about natural resource policy and management issues. This pervasive and intense interest bolsters the network’s responsibility and the opportunity to participate in coordinated data management activities with external stakeholders. This involves establishing and maintaining awareness and communication regarding resource information management activities at other federal, state, and local government offices. For example, the Greater Yellowstone Coordinating Committee is an established group of federal land managers who have an interest in promoting high quality data and information management to support the work and products of their issue teams, subcommittees and the associated projects. The network uses and supports the functions of the Greater Yellowstone Coordinating Committee to maintain a role in ecosystem management based on credible data both inside and outside the parks. Another important commitment and opportunity for the network involves interagency collaboration on the development of Vital Sign monitoring protocols, which includes examining and producing solutions to make data useful among different agencies. Most or all network monitoring protocols benefit from coordination with inventory and monitoring interests in the National Park Service and from contributions made by external partners. A list of past and current contacts and contributors is maintained in the network’s information system. Partnerships with organizations and agencies outside of the National Park Service are available for reference in the network Vital Signs Monitoring Plan. 2.4 Documentation is Key If a single shared responsibility stands out in importance and value, it is to document data sets, the data source(s), and the methodology by which the data were collected or acquired. This establishes the basis for the appropriate use of the data in resulting analysis and products, both short term and long term. Network monitoring protocols contain key elements of data documentation. Network data records collected according to these protocols will include the name, date, and version of the associated protocol. Additional important guidance and reference for documentation and metadata are found in the Data Documentation chapter of this plan.
Ch 2 • Data Stewardship Roles and Responsibilities

Vital Signs Monitoring Plan • 9
2.5 Project Stewardship Since the data management aspects of every inventory or monitoring project normally require the expertise and involvement of several people over a period of months or years, it makes sense that one person is charged with keeping track of the objectives, requirements, and progress for each project. This project leader (or steward) is normally a resource management specialist with training and experience in the field of science related to the inventory or monitoring project and may have worked in the geographic area where the study occurs. A background like this prepares the project leader to oversee the field work, coordinate with GIS and data managers on information management needs, understand the project’s objectives, and authorize the validity, utility, sensitivity, and availability of data resources. A project leader who lacks the background or expertise to act as an authority for the data will work with the appropriate resource specialists to account for those aspects of data stewardship. In order to ensure quality management of each project, including data management requirements, project leaders are assigned only those projects they can effectively oversee based on workload and other relevant factors determined by the network coordinator. Unless the project is short term (3 months or less) the project will have at least one alternate or backup project leader to provide continuity in case the principal project leader becomes temporarily or completely unavailable. Table 2.2 describes the primary responsibilities of a project leader, resource specialist, and network data manager that, when coordinated for a project, result in quality data and information products. Comprehensive responsibilities and assignments for these roles vary by project and are listed and described in detail with each Vital Sign monitoring protocol or other project study plan. 2.6 Data Stewardship Keeping track of data from the time of acquisition until it is no longer useful is the shared responsibility of everyone involved with data as a producer, analyst, manager, or end user. This, in essence, is data stewardship. It is a principle of mutual accountability rather than a particular job for one individual. The importance of data stewardship must not be understated, and the degree of success with which it is used will have direct bearing on the quality and utility of products developed by the network. Data stewardship responsibilities for network and park level roles are listed in Appendix A, and are specified with more detail in individual monitoring protocols and study plans. 2.6.1 Awareness and Accountability Successful data stewardship requires that people involved in network activities learn and understand the expectations for continuous data management, and are held accountable to perform the duties required to meet these expectations. This is equally important for network staff, park employees, and contractors or cooperators. All project participants receive training, briefings, materials, and additional regular communication about data stewardship from supervisors, project leaders, and data managers. The purpose is to promote the appropriate level of understanding about how their efforts relate to park and network management objectives, National Park Service and Department of Interior policies, and other federal government requirements. Other relevant context and linkages can also be discussed to help establish a sense of ownership and accountability among project staff. Inventory and Monitoring project leaders have a good understanding of resource information management issues and requirements and an awareness of the challenges and limitations associated with field data collection, including the use of GPS technology. This is achieved
Ch 2 • Data Stewardship Roles and Responsibilities

Ch 2 • Data Stewardship Roles and Responsibilities
10 • Appendix VII: Data and Information Management Plan
through training, detailed and regular briefings, and accompanying field crews to perform data collection at reasonable intervals. 2.6.2 The Hub of Data Stewardship Project leaders, data managers, and GIS specialists comprise the central data management team for inventory and monitoring projects. Each is responsible for certain aspects of project data, and all share responsibility for some overlapping tasks. Because of the collaborative nature of project data management, communication among project leaders, data managers and GIS specialists is essential to meeting program goals. The following section outlines the individual and shared responsibilities of each role. Project leaders (stewards) The project leader is accountable for data quality during all phases of the project, including collecting, entering, handling, reviewing, summarizing, and reporting data. Developing project documentation and metadata are crucial elements of the project leader’s role. Specifically, the role of the project leader includes the following.
• Complete project documentation describing the who, what, where, when, why and how of
a project. • Develop, document and implement standard procedures for field data collection and data
handling. • Enact and supervise quality assurance and quality control measures for the project.
Supervise and certify all field operations, including staff training, equipment calibration, species identification, and data collection. Supervise or perform data entry, verification and validation.
• Maintain concise explanatory documentation of all deviations from standard procedures. • Ensure documentation of important details for each field data collection period. • Maintain hard copies of data forms and send original data forms to archive on a regular
basis. • Work with program coordinators to identify analysis and reporting mechanisms and to
establish a schedule for regular project milestones such as data collection periods, data processing target dates, and reporting deadlines.
• Produce regular summary reports and conduct periodic trend analysis of data, store the resulting reports, and make them available to users.
• Act as the main point of contact concerning data content. The project leader will also work closely with the data manager to:
• Develop quality assurance and quality control procedures specific to project operations. • Identify training needs for staff related to data management philosophy, database
software use, quality control procedures, etc. • Coordinate changes to the field data forms and the user interface for the project
database. • Fully document and maintain master data. • Identify sensitive information that requires special consideration prior to distribution. • Manage the archival process to ensure regular archival of project documentation, original
field data, databases, reports and summaries, and other products from the project.

Vital Signs Monitoring Plan • 11
• Define how project data will be transformed from raw data into meaningful information and create data summary procedures to automate and standardize this process.
• Identify and prioritize legacy data for conversion; convert priority data sets to a modern format.
• Increase the interpretability and accessibility of existing natural resource information.
Figure 2.1. Joint Project and Data Management Responsibilities Data managers The data manager is responsible for ensuring the compatibility of project data with program standards, for designing the infrastructure for the project data, and for ensuring long-term data integrity, security, and availability. The data manager coordinates with the project leader throughout the project, as shown in Figure 2.1. • Develop and maintain the infrastructure for metadata creation, project documentation,
and project data management. • Create and maintain project databases in accordance with best practices and current
program standards. • Provide training in the theory and practice of data management tailored to the needs of
project personnel. • Develop ways to improve the accessibility and transparency of digital data. • Establish and implement procedures to protect sensitive data according to project needs. • Collaborate with GIS specialists to integrate tabular data with geospatial data in a GIS
system in a manner that meets project objectives. Data managers will also work closely with the project leader to:
• Define the scope of the project data and create a data structure that meets project needs. • Become familiar with how the data are collected, handled and used.
Ch 2 • Data Stewardship Roles and Responsibilities

Ch 2 • Data Stewardship Roles and Responsibilities
12 • Appendix VII: Data and Information Management Plan
• Review quality control and quality assurance aspects of project protocols and standard procedure documentation.
• Identify elements that can be built into the database structure to facilitate quality control, such as required fields, range limits, pick lists and conditional validation rules.
• Create a user interface that streamlines the process of data entry, review, validation, and summarization that is consistent with the capabilities of the project staff.
• Develop automated database procedures to improve the efficiency of the data summarization and reporting process.
• Make sure that project documentation is complete, complies with metadata requirements, and enhances the interpretability and longevity of the project data.
• Ensure regular archival of project materials. • Inform project staff of changes and advances in data management practices. GIS specialists The GIS specialists manage spatial data themes associated with network inventory and monitoring projects, as well as other spatial data related to the full range of park resources. They incorporate spatial data into the GIS. They also maintain standards for geographic data and are responsible for sharing and disseminating GIS data throughout the network. The GIS specialists will work in collaboration with project leaders to:
• Determine the GIS data and analysis needs for the project. • Develop procedures for field collection of spatial data including the use of GPS and other
spatial data collection techniques. • Display, analyze, and create maps from spatial data to meet project objectives. • Properly document data in compliance with spatial metadata standards.
GIS specialists will also work directly with data managers to:
• Design databases and other applications for the network. • Create relationships between GIS and non-spatial data and create database and GIS
applications to facilitate the integration and analysis of both spatial and non-spatial data. • Establish and implement procedures to protect sensitive spatial data according to project
needs. • Develop and maintain an infrastructure for metadata creation and maintenance. • Ensure that project metadata are created and comply with national and agency
standards.

Vital Signs Monitoring Plan • 13
3. Data Management Process and Work Flow The network is involved with short-term and long-term projects that share many work flow characteristics and generate data sets and other products that must be managed and made available to current and future users. Short-term projects usually last from one to three years and include individual research projects, inventories, or pilot work done in preparation for long-term monitoring. Long-term projects include the network’s vital sign monitoring projects and other multi-year research and monitoring projects performed by other agencies and cooperators. Successful project management is based in part on establishing and communicating data stewardship responsibilities for all staff at all stages of a project. 3.1 Project Work Flow The five stages of a project shown in Figure 3.1 involve the roles and responsibilities for project and data management discussed in this section. Planning and approval The project leader and program administrator are responsible for defining the scope and objective(s) of the project, establishing funding sources, and obtaining permits and compliance clearances. The data manager contributes where appropriate as data processing and reporting schedules are set and budgets for data management activities are discussed and incorporated. Design and testing The project leader is responsible for adopting or developing and testing project methodology to meet project objectives. The project leader and data manager work together to establish appropriate data management procedures, develop the data design, and prepare a data dictionary, which comprehensively lists and describes the database fields and data value domains. The data manager develops a new database application or adapts an existing database to meet project requirements. Implementation During implementation data are acquired, processed, error-checked and documented. Reports, maps, GIS themes, and other products are developed and distributed. The project leader oversees all aspects of implementation, including logistics, contracting, training, and equipment procurement, data acquisition, report preparation and final delivery of products to resource managers. Data management staff provide training and support for database applications, GIS, GPS, and other data processing applications; facilitation of data summarization, validation and analysis; and assistance with the technical aspects of documentation and product development.
Product integration The network maintains master copies and archives of all network-generated data on a local server. These are used to update NPS databases at appropriate intervals, e.g. annually updates to WRDSTORET for water quality data. Section 4.2.1 lists and describes the Service-wide databases used by the network for archival and distribution of data and information resources. The network also works with other partners to share and integrate results from network projects.
Ch 3 • Data Management Process and Work Flow
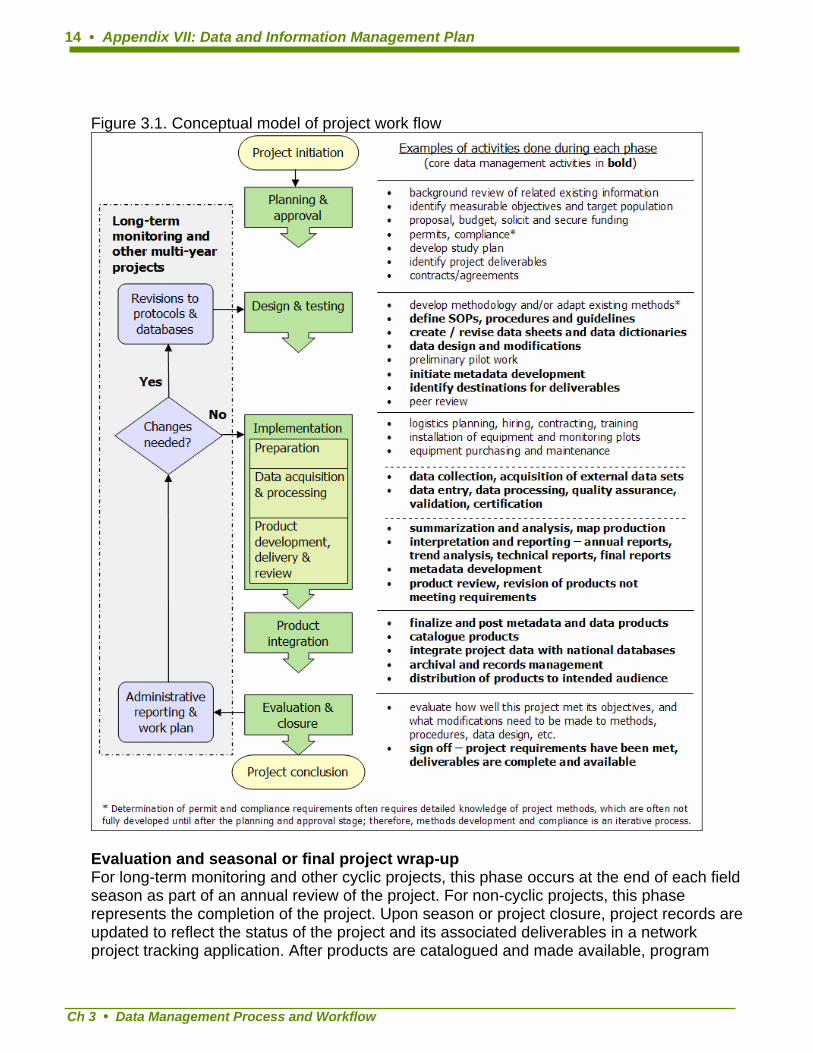
14 • Appendix VII: Data and Information Management Plan
Figure 3.1. Conceptual model of project work flow
Evaluation and seasonal or final project wrap-up For long-term monitoring and other cyclic projects, this phase occurs at the end of each field season as part of an annual review of the project. For non-cyclic projects, this phase represents the completion of the project. Upon season or project closure, project records are updated to reflect the status of the project and its associated deliverables in a network project tracking application. After products are catalogued and made available, program
Ch 3 • Data Management Process and Workflow

Vital Signs Monitoring Plan • 15
administrators, project leaders, and data managers work together to assess how well the project met its objectives, and to determine what might be done to improve various aspects of the methodology, implementation, and formats of the resulting information. For monitoring protocols, careful documentation of all changes is required. Changes to methods and procedures are maintained in a tracking table associated with each document. Significant revisions, as defined in each protocol, may require additional peer review. 3.2 Data Life Cycle Project data take on different forms and are maintained in different places as they are acquired, processed, documented, and archived. Figure 3.2 is a conceptual model that shows relationships between forms of data, databases, and data processes. Listed here are databases and forms of data: • Raw data – Analog data recorded by hand on hard-copy forms and digital files from
handheld computers, GPS receivers, telemetry data loggers, etc. • Working database – A project-specific database for entering and processing data for the
current season (or other logical period of time). • Certified data and metadata – Completed data and documentation for short-term
projects, or one season of completed data for long-term monitoring projects. Certification is a confirmation by the project leader that the data have passed all quality assurance requirements and are complete and ready for integration and distribution. Metadata records include the detailed information about project data needed for its proper use and interpretation (see Chapter 7).
• Master database – Project-specific database for storing the full project data set, used for viewing, summarizing, and analysis. Only used to store data that have passed all quality assurance steps.
• Reports and data products – Information that is derived from certified project data. • Edit log – A means of tracking changes to certified data. • National databases and repositories – Applications and repositories maintained at the
national level, for the purpose of centralization, archival, and distribution among NPS units and with cooperators and the public.
• Local archives and digital library – Locally stored data, metadata and other products generated by projects.
The typical data process flow is described here and also shown in Figure 3.2: 1. Acquire data – For data recorded by hand in the field, data forms should be reviewed
regularly (e.g., daily or weekly) for completeness and clarity in order to identify and resolve errors as close to their origin as possible.
2. Archive raw data – Copies of all raw data files are initially stored intact. Digital files are
copied to the digital library section for the project; hard copy forms are either scanned and placed in the digital library, or are copied and placed in the archives. Archival or scanning of hard copy data forms may occur at the end of a season as a means of retaining all marks and edits made during the verification and validation steps. Once a project is completed or annual data results are validated and reported, original and intermediate data sets may be disposed in order to avoid unnecessary clutter in the information system. Disposing of data assets must be approved by at least the project
Ch 3 • Data Management Process and Work Flow

Ch 3 • Data Management Process and Workflow
16 • Appendix VII: Data and Information Management Plan
leader and the data manager based on established criteria for disposition that is documented in the data management procedures for the project.
3. Data entry / import – Analog data are entered manually, and digital data files are
uploaded to the working database. 4. Verification, processing and validation – Verify accurate transcription of raw data and
validate data using database queries to identify and resolve missing data values, out-of-range values, and logical errors.
5. Documentation and certification – Develop or update project metadata and certify the
data set. Certification is a confirmation by the project leader that the data have passed all quality assurance requirements and are complete and documented. It also means that data and metadata are ready to be posted and delivered externally or used locally.
6. Archive versioned data set – Copies of the certified data and metadata are placed in the
digital library. This can be accomplished by storing a compressed copy of the working database, or by exporting data to a more software-independent format (e.g., ASCII text; see Chapter 10).
7. Post data and update national databases – To make data available to others, certified
data and metadata are posted to national repositories such as the NR-GIS Data Store and Biodiversity Data Store. In addition, national databases such as NPSpecies, NPSTORET, and NR-GIS Metadata Database are updated. Data and data products containing protected information are posted according to the guidelines and access levels outlines in chapter 9.
8. Upload data – Certified data are uploaded from the development database to the
production database. 9. Reporting and analysis – Certified data are used to generate data products, analysis, and
reports, including semi-automated annual summary reports for monitoring projects. Depending on project needs, data can be exported for analysis using other software applications and/or summarized within the database.
10. Store products – Reports and other data products are stored according to format and
expected demand – either in the digital library, on off-line media, or in the document archives.
11. Post products and update national databases – To make products available to others,
reports and other products are posted to national repositories such as NR-GIS Data Store or the NR Data Image Server. In addition, products are catalogued in NatureBib. Data products may not be posted if they contain protected information about the nature or location of rare, threatened or endangered species, or other natural resources of management concern (see Chapter 9).
12. Distribute data and information – Deliverables can be shared and distributed in a variety
of ways - via the web-based national databases and repositories, by FTP or mailing in

Vital Signs Monitoring Plan • 17
response to specific requests, or by providing direct access to project records. Distribution is subject to legal requirements to protect information about sensitive resources (see Chapter 9).
13. Track changes – All subsequent changes to certified data are documented in an edit log,
which accompanies project data and metadata upon distribution. Significant edits will trigger reposting of updated data and products to national databases and repositories.
Figure 3.2. Diagram of the typical project data life cycle.
This data flow occurs iteratively (usually annually) for long-term monitoring projects and once for short-term projects. For projects spanning multiple years, decision points include whether or not a separate working database is desirable, and the extent to which product development and delivery is repeated year after year.
Ch 3 • Data Management Process and Work Flow
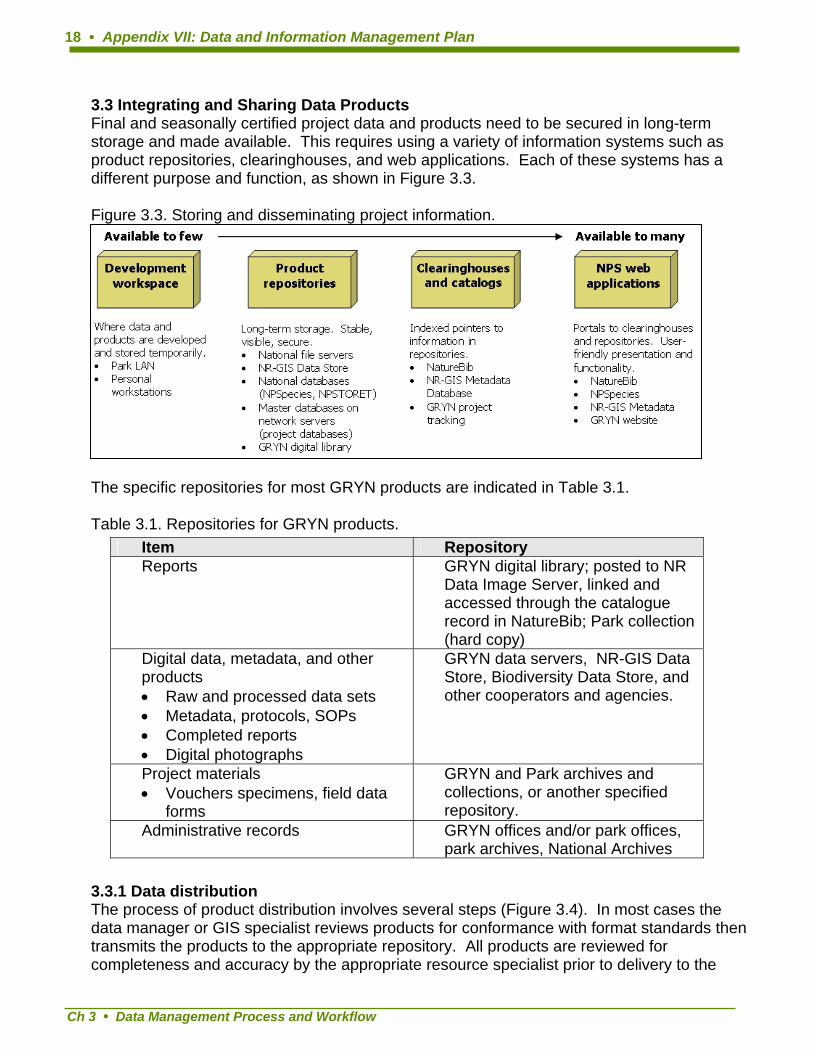
18 • Appendix VII: Data and Information Management Plan
3.3 Integrating and Sharing Data Products Final and seasonally certified project data and products need to be secured in long-term storage and made available. This requires using a variety of information systems such as product repositories, clearinghouses, and web applications. Each of these systems has a different purpose and function, as shown in Figure 3.3. Figure 3.3. Storing and disseminating project information.
The specific repositories for most GRYN products are indicated in Table 3.1. Table 3.1. Repositories for GRYN products. Item Repository
Reports GRYN digital library; posted to NR Data Image Server, linked and accessed through the catalogue record in NatureBib; Park collection (hard copy)
Digital data, metadata, and other
products
Ch 3 • Data Management Process and Workflow
• Raw and processed data sets • Metadata, protocols, SOPs
• Completed reports • Digital photographs
GRYN data servers, NR-GIS Data Store, Biodiversity Data Store, and other cooperators and agencies.
Project materials • Vouchers specimens, field data
forms
GRYN and Park archives and collections, or another specified repository.
Administrative records GRYN offices and/or park offices, park archives, National Archives
3.3.1 Data distribution The process of product distribution involves several steps (Figure 3.4). In most cases the data manager or GIS specialist reviews products for conformance with format standards then transmits the products to the appropriate repository. All products are reviewed for completeness and accuracy by the appropriate resource specialist prior to delivery to the
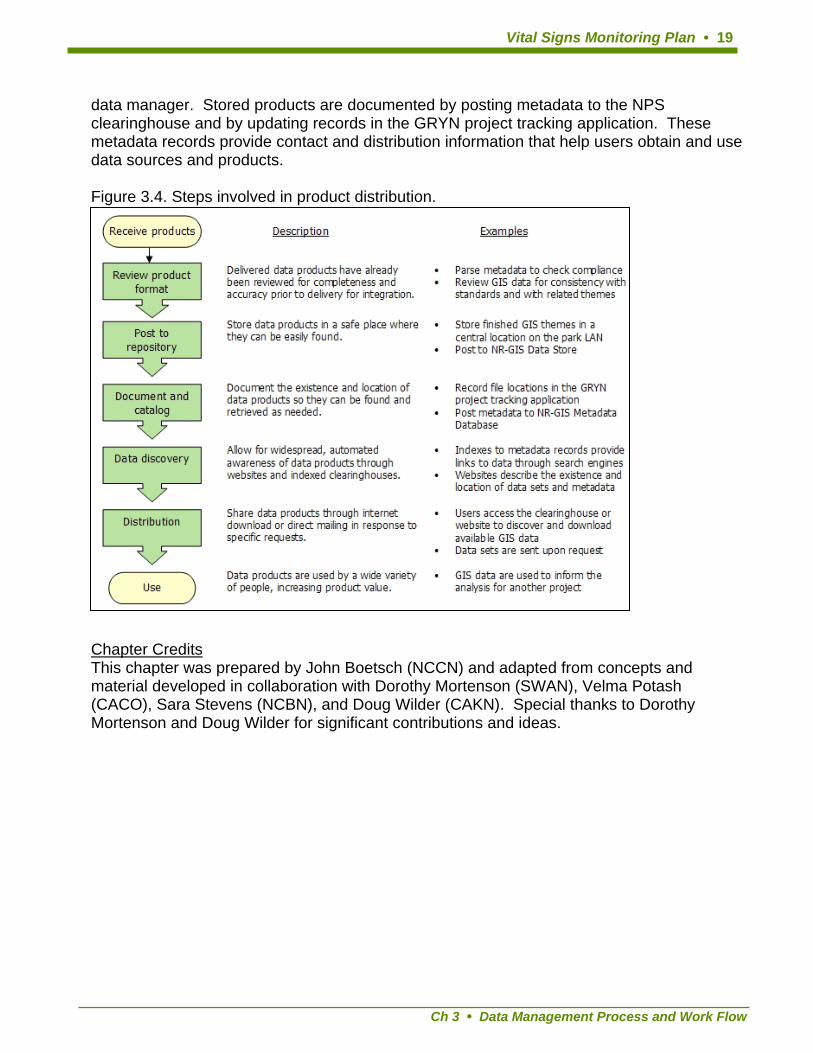
Vital Signs Monitoring Plan • 19
data manager. Stored products are documented by posting metadata to the NPS clearinghouse and by updating records in the GRYN project tracking application. These metadata records provide contact and distribution information that help users obtain and use data sources and products. Figure 3.4. Steps involved in product distribution.
Chapter Credits This chapter was prepared by John Boetsch (NCCN) and adapted from concepts and material developed in collaboration with Dorothy Mortenson (SWAN), Velma Potash (CACO), Sara Stevens (NCBN), and Doug Wilder (CAKN). Special thanks to Dorothy Mortenson and Doug Wilder for significant contributions and ideas.
Ch 3 • Data Management Process and Work Flow
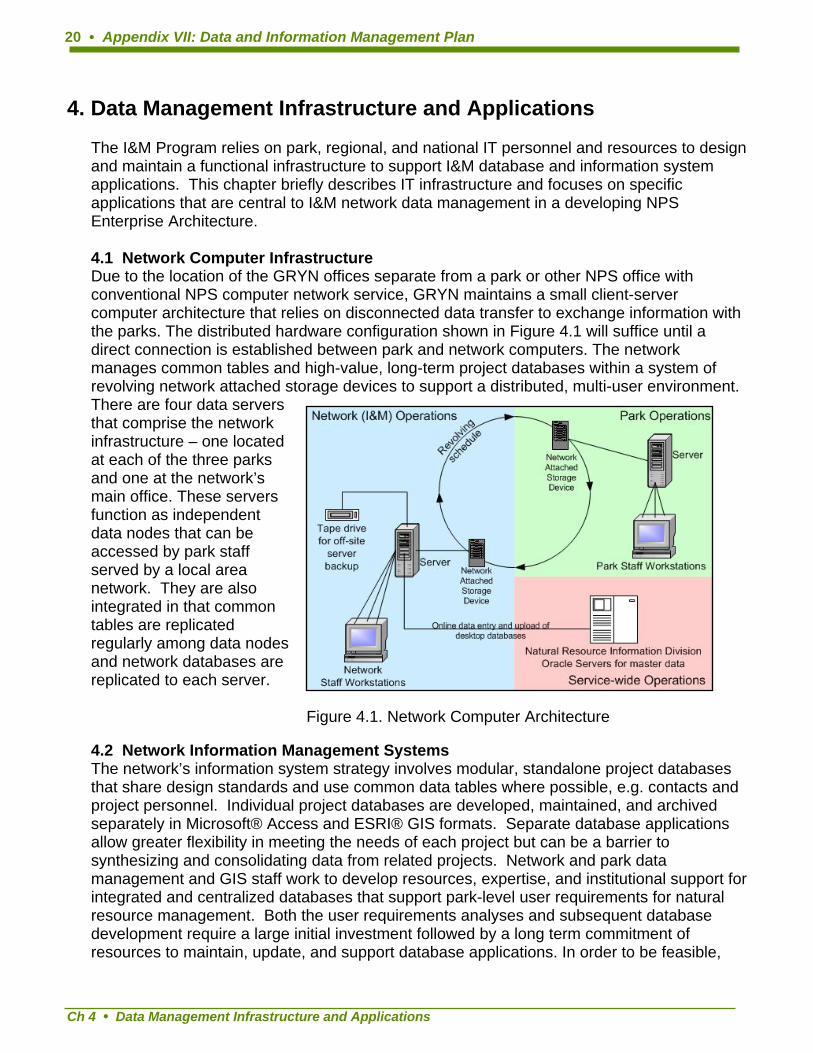
20 • Appendix VII: Data and Information Management Plan
4. Data Management Infrastructure and Applications The I&M Program relies on park, regional, and national IT personnel and resources to design and maintain a functional infrastructure to support I&M database and information system applications. This chapter briefly describes IT infrastructure and focuses on specific applications that are central to I&M network data management in a developing NPS Enterprise Architecture. 4.1 Network Computer Infrastructure Due to the location of the GRYN offices separate from a park or other NPS office with conventional NPS computer network service, GRYN maintains a small client-server computer architecture that relies on disconnected data transfer to exchange information with the parks. The distributed hardware configuration shown in Figure 4.1 will suffice until a direct connection is established between park and network computers. The network manages common tables and high-value, long-term project databases within a system of revolving network attached storage devices to support a distributed, multi-user environment. There are four data servers that comprise the network infrastructure – one located at each of the three parks and one at the network’s main office. These servers function as independent data nodes that can be accessed by park staff served by a local area network. They are also integrated in that common tables are replicated regularly among data nodes and network databases are replicated to each server.
Figure 4.1. Network Computer Architecture 4.2 Network Information Management Systems The network’s information system strategy involves modular, standalone project databases that share design standards and use common data tables where possible, e.g. contacts and project personnel. Individual project databases are developed, maintained, and archived separately in Microsoft® Access and ESRI® GIS formats. Separate database applications allow greater flexibility in meeting the needs of each project but can be a barrier to synthesizing and consolidating data from related projects. Network and park data management and GIS staff work to develop resources, expertise, and institutional support for integrated and centralized databases that support park-level user requirements for natural resource management. Both the user requirements analyses and subsequent database development require a large initial investment followed by a long term commitment of resources to maintain, update, and support database applications. In order to be feasible,
Ch 4 • Data Management Infrastructure and Applications

Vital Signs Monitoring Plan • 21
investments made in complex interdisciplinary databases must be made with full participation from and understanding by park managers, scientists, and information technology staff. National level business requirements, such as summarizing and reporting core variables, must also be considered. 4.3 Information System infrastructure The network stores data on national servers that host several master NPS applications, including NatureBib, NPSpecies, NR-GIS Metadata and Data Store. Centralized NPS repositories that include some of the network’s data include the Biodiversity Data Store and the I&M Protocol Database. Public access sites to network data resources include current and planned portals to NatureBib, NPSpecies, NPSFocus, and the STORET National Data Warehouse. Network and park data servers hold master network applications for data sets that are available locally for use by park and network natural resource specialists and managers. These include common tables, certified project data, a project tracking database, working data sets for NatureBib, NPSpecies, Dataset Catalog, and NPSTORET, digital libraries of developmental and production files and data sources, and downloads from national NPS or other data sources. Each of the GRYN park servers and the network server uses a hierarchical folder and filing structure that meets the needs of local users. Files in development are commonly stored in separate folders from those used for production. The network’s approach to folder and file management is explained in appendix B. Files for finished products are typically read-only. "Inbox" folders can be used as bins where users can save project-related files for processing and filing. Standards such as naming conventions and hierarchical filing are enforced within the production sections of the folder system. Although less stringent in other sections, these conventions are encouraged as good practice. 4.4 National Level I&M Database Applications Integrating inventory and monitoring results at the network level involves national-level programmatic data and information management strategies that help provide consistent, long-term data and information sources for stewardship decisions, resource protection, and interpretation. The network maintains local access to all certified project data for use by park and network staff to help inform resource management and protection at parks. The network also provides data to the NPS Natural Resource Program Center (NRPC) and the I&M Program are involved in to centralized data archiving and distribution solutions developed by the NPS Natural Resource Program Center and the I&M Program. These databases and applications provide archive and accessibility for network data, and summary use by NPS and DOI managers and central office personnel to answer requests from Congress and for budget, program, and project planning. To achieve an integrated information management system, three of the national-level data management applications (NatureBib, NPSpecies, and NR-GIS Metadata Database) utilize a distributed architecture (Figure 4.2) with master Oracle RDBMS applications available via web browser and desktop database applications for off-line data entry and access.
Ch 4 • Data Management Infrastructure and Applications
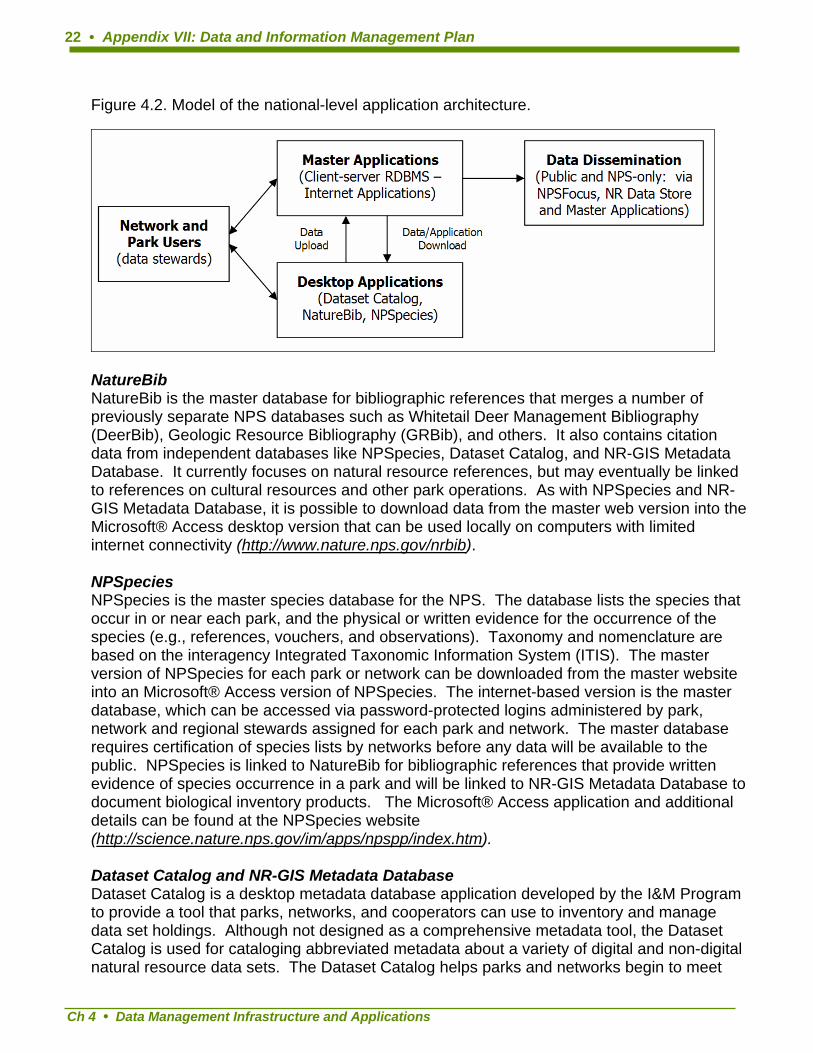
22 • Appendix VII: Data and Information Management Plan
Figure 4.2. Model of the national-level application architecture.
NatureBib NatureBib is the master database for bibliographic references that merges a number of previously separate NPS databases such as Whitetail Deer Management Bibliography (DeerBib), Geologic Resource Bibliography (GRBib), and others. It also contains citation data from independent databases like NPSpecies, Dataset Catalog, and NR-GIS Metadata Database. It currently focuses on natural resource references, but may eventually be linked to references on cultural resources and other park operations. As with NPSpecies and NR-GIS Metadata Database, it is possible to download data from the master web version into the Microsoft® Access desktop version that can be used locally on computers with limited internet connectivity (http://www.nature.nps.gov/nrbib). NPSpecies NPSpecies is the master species database for the NPS. The database lists the species that occur in or near each park, and the physical or written evidence for the occurrence of the species (e.g., references, vouchers, and observations). Taxonomy and nomenclature are based on the interagency Integrated Taxonomic Information System (ITIS). The master version of NPSpecies for each park or network can be downloaded from the master website into an Microsoft® Access version of NPSpecies. The internet-based version is the master database, which can be accessed via password-protected logins administered by park, network and regional stewards assigned for each park and network. The master database requires certification of species lists by networks before any data will be available to the public. NPSpecies is linked to NatureBib for bibliographic references that provide written evidence of species occurrence in a park and will be linked to NR-GIS Metadata Database to document biological inventory products. The Microsoft® Access application and additional details can be found at the NPSpecies website (http://science.nature.nps.gov/im/apps/npspp/index.htm). Dataset Catalog and NR-GIS Metadata Database Dataset Catalog is a desktop metadata database application developed by the I&M Program to provide a tool that parks, networks, and cooperators can use to inventory and manage data set holdings. Although not designed as a comprehensive metadata tool, the Dataset Catalog is used for cataloging abbreviated metadata about a variety of digital and non-digital natural resource data sets. The Dataset Catalog helps parks and networks begin to meet
Ch 4 • Data Management Infrastructure and Applications

Vital Signs Monitoring Plan • 23
Executive Order 12906 mandating federal agencies to document all data collected after January 1995. It provides brief metadata and a comprehensive list about all resource data sets for use in data management, project planning, and more stringent metadata activities. As with other service-wide applications, the master metadata database (NR-GIS Metadata Database) is available through a website and will be linked to NPSpecies (the NPS species database) and NatureBib (the bibliographic database). It will be possible to download a version in Microsoft® Access format from the master website (Dataset Catalog: http://science.nature.nps.gov/im/apps/datacat/index.htm and NR-GIS Metadata Database: http://science.nature.nps.gov/nrdata). NPSTORET NPSTORET is the NPS desktop database designed to facilitate standardized park-level reporting for STORET, an interagency water quality database developed and supported by the Environmental Protection Agency’s (EPA). STORET is an electronic warehouse for local, state, and federal water quality data collected in support of managing the nation’s water resources under the Clean Water Act. STORET is used by NPS as a repository of physical, chemical, biological, and other monitoring data collected in and around national park units by park staff, contractors, and cooperators. The NPS Water Resource Division (WRD) operates WRD STORET and makes periodic uploads to the EPA STORET National Data Warehouse so that data collected by and for parks will be publicly accessible. NPS Director’s Order 77 instructs the NPS to archive water quality data in STORET. Network staff and cooperators will use NPSTORET for data entry and management and to prepare data for upload to STORET by WRD staff (Figure 4.3). To support spatial analysis and functionality NPSTORET includes a field for the National Hydrography Dataset (NHD) reach code where water samples are collected. This allows sampling stations to be indexed to hydrographic features and analyzed with other resource layers in a GIS using a suite of hydrographic network and hydrologic tools. The Microsoft® Access application and additional details can be found at: http://www.nature.nps.gov/water/infodata.htm. Additional information on STORET can be found at: http://www.epa.gov/storet.
Figure 4.3. Water Quality Data Flow Natural Resource Database Template The Natural Resource Database Template (NRDT) is a flexible, relational database in Microsoft® Access for storing inventory and monitoring data (including raw data collected during field studies). This relational database can be used as a standalone database or in conjunction with the GIS software (e.g., ArcView™ or ArcGIS™) to enter, store, retrieve, and otherwise manage natural resource information. The template has a core database structure that can be modified and extended by different parks and networks depending on the components of their inventory and monitoring projects and the specific sampling protocols in use. NRDT is designed to support some standardization among monitoring protocols.
Ch 4 • Data Management Infrastructure and Applications
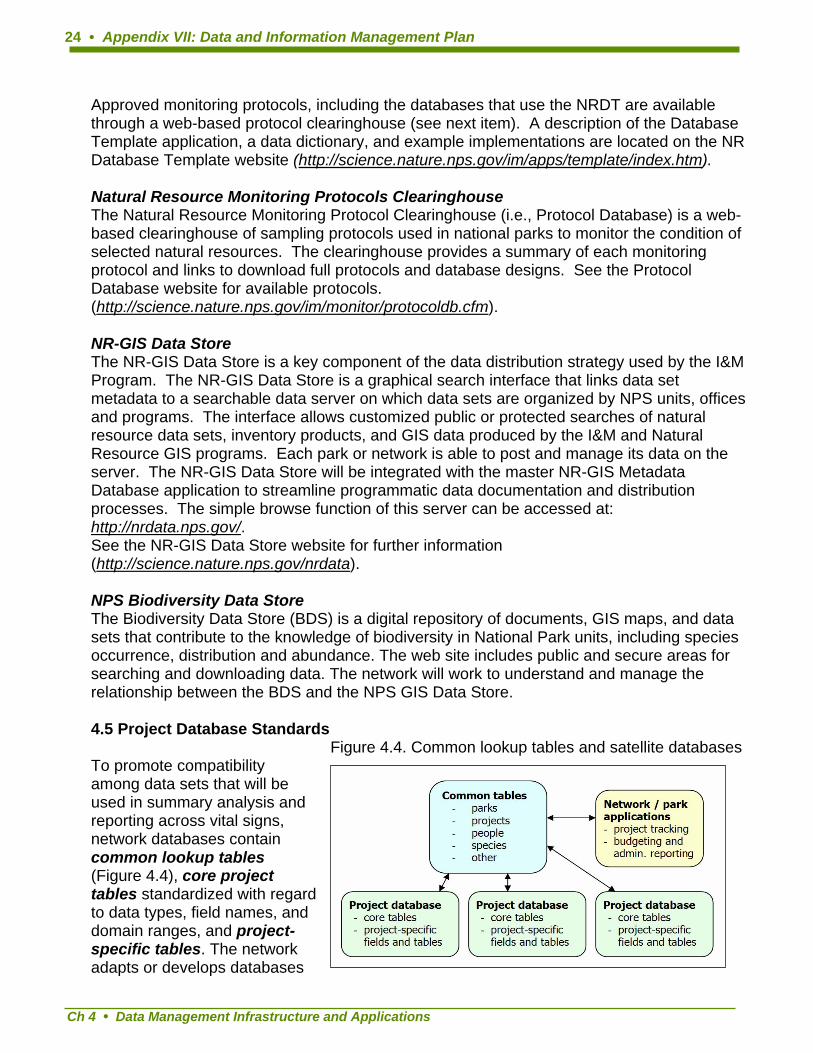
24 • Appendix VII: Data and Information Management Plan
Approved monitoring protocols, including the databases that use the NRDT are available through a web-based protocol clearinghouse (see next item). A description of the Database Template application, a data dictionary, and example implementations are located on the NR Database Template website (http://science.nature.nps.gov/im/apps/template/index.htm). Natural Resource Monitoring Protocols Clearinghouse The Natural Resource Monitoring Protocol Clearinghouse (i.e., Protocol Database) is a web-based clearinghouse of sampling protocols used in national parks to monitor the condition of selected natural resources. The clearinghouse provides a summary of each monitoring protocol and links to download full protocols and database designs. See the Protocol Database website for available protocols. (http://science.nature.nps.gov/im/monitor/protocoldb.cfm). NR-GIS Data Store The NR-GIS Data Store is a key component of the data distribution strategy used by the I&M Program. The NR-GIS Data Store is a graphical search interface that links data set metadata to a searchable data server on which data sets are organized by NPS units, offices and programs. The interface allows customized public or protected searches of natural resource data sets, inventory products, and GIS data produced by the I&M and Natural Resource GIS programs. Each park or network is able to post and manage its data on the server. The NR-GIS Data Store will be integrated with the master NR-GIS Metadata Database application to streamline programmatic data documentation and distribution processes. The simple browse function of this server can be accessed at: http://nrdata.nps.gov/. See the NR-GIS Data Store website for further information (http://science.nature.nps.gov/nrdata). NPS Biodiversity Data Store The Biodiversity Data Store (BDS) is a digital repository of documents, GIS maps, and data sets that contribute to the knowledge of biodiversity in National Park units, including species occurrence, distribution and abundance. The web site includes public and secure areas for searching and downloading data. The network will work to understand and manage the relationship between the BDS and the NPS GIS Data Store.
4.5 Project Database Standards
Figure 4.4. Common lookup tables and satellite databases To promote compatibility among data sets that will be used in summary analysis and reporting across vital signs, network databases contain common lookup tables (Figure 4.4), core project tables standardized with regard to data types, field names, and domain ranges, and project-specific tables. The network adapts or develops databases
Ch 4 • Data Management Infrastructure and Applications

Vital Signs Monitoring Plan • 25
to be compatible with those maintained by other networks and cooperators managing similar data sets. In the future a client-server database system may be developed at the network to associate common database components that are replicated among data nodes hosted at each network park. Individual project databases will continue to access these common tables. 4.5.1 Levels of data standards Because common lookup tables are stored in one place and are referred to by multiple databases, they represent the highest level of data standard because they are implemented identically among data sets. The second level of standards is implied by core template fields and tables, which are standardized where possible, but project-specific objectives and needs could lead to varied implementations among projects. The third level of standards is applied most flexibly to accommodate the range of needs and possibilities for each project, yet always with compatibility and integrity in mind. Figure 4.5 presents the resulting variation in implementation of these differing levels as a “bull’s eye”, with the common lookup tables providing the most consistent implementation and hence the smallest range of variation. Figure 4.5. Different levels of data standards
4.5.2 Project tracking application To support program coordination and annual reporting, and to improve accountability for the products of natural resource inventory and monitoring efforts, the network will use a project tracking database. The primary functions of this application include: 1. Maintaining the list of projects – By maintaining a single list of natural resource data
projects, it is much easier to quickly find project-related information (e.g., status, funding sources and amounts, objectives, contact information) and summarize that information for administrative reports.
2. Tracking product deliverables – For each project a comprehensive list is maintained of what deliverables are expected and when. Once they are delivered and posted or archived, this function shifts to being a finding aid for available products. Deliverables
Ch 4 • Data Management Infrastructure and Applications

Ch 4 • Data Management Infrastructure and Applications
26 • Appendix VII: Data and Information Management Plan
are first specified at project initiation and information is updated at various project milestones (e.g., contracting, product delivery, archival).
3. Managing project codes – These are intelligent alphanumeric codes used to tie together digital information in various, minimally connected systems (e.g., RPRS, PMIS), along with analog materials that cannot otherwise be linked to an integrated information system. These codes are also used to link to data in databases and GIS themes, especially where information from multiple sources is stored together.
The master version of this application will be maintained at the network office and made available to each park. Project leaders, the network data manager, GIS staff, and the network coordinator share responsibility for the maintenance and availability of the project tracking data and reports. Each of these staff will be able to make certain changes to update information about project status, deliverable details, etc. Database views will be created to help project leaders keep on schedule, and to facilitate quick reporting on project status, accomplishments and delivered products. Chapter Credits This chapter was adapted from material prepared by John Boetsch (NCCN) and Patrick Flaherty (APHN). Section 4.2 - National Information Management Systems was adapted from material written by Lisa Nelson (WASO).

Vital Signs Monitoring Plan • 27
5. Data Acquisition and Processing
The network’s peer reviewed and NPS-approved monitoring protocols list specific ecosystem parameters that are collected by observation, measurement, and/or prediction and stored as data. To be useful to park managers these data must be processed, analyzed, mapped, displayed, and reported not only as stand alone vital signs but in ways that demonstrate the dynamic connections among and between vital signs. Some of the vital signs selected by network parks are monitored using methods developed before the GRYN was established. Data from these past and continuing efforts contribute to scientific understanding and park stewardship regardless of their basis in local methods or peer-reviewed I&M protocols. The network engages natural resource professionals at all organizational levels to help determine the relevance to monitoring objectives for a variety of park and other data sources. Data that are certified by subject matter experts as valid, complete, and fully documented with FGDC and NPS spatial and biological metadata are processed to contribute to the network’s inventory and monitoring objectives.
Table 5.1. Abbreviated Data Development Model Newly acquired vital sign data funded by the network involve the steps outlined in Table 5.1 and will meet the following requirements:
1. Identify issues and concerns 2. Define the purpose and need for data collection and analysis 3. Develop explicit monitoring objectives or inventory criteria (these
are key questions addressing the issue or concern within the scope of the purpose and need)
4. List measurable, observable, and predictable variables associated with each key question
5. Formalize (document) information needs 6. Develop a Data Dictionary for field names, lists of values, quality
factors, and metadata characteristics 7. Select or develop an appropriate sample design 8. Identify and assign explicit data stewardship roles and
responsibilities 9. Write a complete monitoring protocol or inventory study plan 10. Design or adopt/adapt a database (including quality control
elements) 1. Plan for data acquisition (beginning of data life cycle) 2. Collect data – field and office components 3. Process data (includes verification, transfer, addition of required
attributes) 4. Store, organize, and secure data 5. Use, analyze, and report data 6. Maintain and serve data and derived products 7. Archive data (long term storage that may require media and/or
platform transfer) 8. Dispose of data that are no longer needed, if appropriate (end of
data life cycle)
• Base data acquisition on
documented and approved monitoring protocols
• Adhere to a data dictionary approved by the project leader and the network data manager
• Use common and/or existing data formats and field definitions to promote crosswalk and comparison with data from other times and places.
• Enter data in a database approved by the network data manager
• Provide data verification in the field and in the office by field crew members and the field crew leader
• Process the data with quality control features built in to a database application
Ch 5 • Data Acquisition and Processing

Ch 5 • Data Acquisition and Processing
28 • Appendix VII: Data and Information Management Plan
5.1 Database Design To promote data comparability among parks and networks GRYN draws on and extends the concepts and structure of the NPS Natural Resource Database Template and the NPS conventions for naming database objects. It is also important for GRYN to consider design elements that promote data comparability with other land and resource management entities in the Greater Yellowstone Ecosystem. Before starting a new database design from scratch the network will look to the following sources for existing designs and database objects: • NPS Natural Resource Database Template • I&M Protocol clearinghouse • Other NPS I&M networks • Cooperating agencies and entities • Other parks • Other agencies In particular the network will review and associate, where appropriate, existing database and application design elements from the US Forest Service because their data structures store ecosystem parameters for administered lands surrounding Yellowstone National Park and Grand Teton National Park. Achieving some consistency in common data objects between the parks and the surrounding forests promotes ecosystem-based analysis and reporting. 5.2 Data Acquisition New data collected by the network are from natural resources inventories or vital sign monitoring projects and collaborative efforts between the network and other regional programs or institutions. Data for these projects will be collected by I&M personnel, park staff, partners, and cooperators. Natural resource inventories help to identify the presence or occurrence, and status of park natural resources and represent an important component of park stewardship. A listing, description, and park status of standard NPS Natural Resource Inventories conducted by the Inventory and Monitoring Program are available online at http://science.nature.nps.gov/im/inventories.htm. Network-base inventory results are available via the GRYN web site (see title page for web address). Monitoring data are collected and processed according to requirements specified in peer reviewed and NPS-approved GRYN Vital Sign monitoring protocols. Vital signs are a subset of physical, chemical, and biological elements and processes of park ecosystems that are selected to represent the overall health or condition of a park’s natural resources, known or hypothesized effects of stressors, or elements that have important human values. Information about the status and trend of vital signs contributes to the decision making processes used by park managers. Chapter III of the network’s Vital Signs Monitoring Plan lists the vital signs and explains the selection process. 5.2.1 Data Discovery and Data Mining Data discovery in the Greater Yellowstone Network refers to the process of searching out existing natural resource data and information that are useful to the I&M Program mission. Since 2000 GRYN has identified, catalogued, and entered thousands of data records and data sources in Dataset Catalog, NatureBib, and NPSpecies. The bulk of this effort occurred during the inventory phase of network development from 2000 through 2004 (GRYN 2000). These data discovery efforts primarily involved interviews with park natural resource specialists and targeted searches through hardcopy and electronic data sources stored at
Vital Signs Monitoring Plan • 29
park service units, other government offices, academic institutions, and collection facilities such as libraries, museums, and herbaria. Those efforts represent a different approach than more fundamental IT industry ‘data mining’ procedures that incorporate data input, data analysis, and results output using complex computer platforms and software applications for extracting knowledge from large volumes of data (US GAO 2004). The network does not intend to perform that type of data mining in the foreseeable future, but will continue to intentionally and incidentally identify and process relevant natural resource data sources related to GRYN parks and inventory and monitoring activities. A useful discussion and set of procedures for data mining activities that emphasizes a data catalog, bibliography, and metadata is available from the Klamath Network of the NPS I&M Program (Smith and Truitt, 2004). Additional background and guidelines for data mining in the NPS I&M Program are available on the npsweb: (http://www1.nrintra.nps.gov/im/datamgmt/DataMining/datamining.htm). GRYN staff will find and review different sources for various types of data at the onset of new projects or during the development of new protocols as part of research for background information. Network staff use the following data sources via the internet and visits to local research or academic institutions, museums, and local parks. Bibliographic/Literature • National NPS Databases (e.g., NatureBib) • Online literature databases (e.g., First Search or Biosis) • Local document library • Library catalogs (e.g., academic or research institutions) • Park and other archives Geographic Data • Regional GIS Specialists • Park GIS Specialists • Federal and State Geographic data clearinghouses • Local, state, and federal government offices Biological/Natural Resources Data • Automated National Catalog System (ANCS+) • NPSpecies • Voucher collections (museums, parks, universities) • Network Parks • Local, state, and federal government offices Relevant information collected during a data discovery process is maintained at the network and/or at one or more network parks either electronically or in hard copy format depending on how it was collected. Geographic data sets collected during this process are documented with FGDC compliant metadata when possible and/or documented with brief metadata in Dataset Catalog.
4. Dataset Catalog – new data sets (spatial or non-spatial) are entered into Dataset
Catalog.
Ch 5 • Data Acquisition and Processing

Ch 5 • Data Acquisition and Processing
30 • Appendix VII: Data and Information Management Plan
• Scientific citations – The network uses the online and desktop versions of NatureBib. • NPSpecies – Information relating to the biodiversity of network parks is entered into
NPSpecies and linked to the available reference documents in NatureBib. • Reference Cabinets – Hard copy materials are stored that relate to the network parks
and the GRYN projects. All original data sheets, final reports, and contracts are stored in a fire proof cabinet and/or in more than one building as insurance against total loss. General references as well as those references linked to NPSpecies records in NatureBib are stored in file cabinets in the GRYN office.
Information collected during the data discovery process is likely to be legacy data, which may be of high value to the network parks but differs in structure and intent from current NPS, I&M Program, or network data models, and/or is based on a different protocol with different objectives and methodology. Legacy data resources are primarily from inventory and monitoring efforts that originated before the NPS I&M Program. GRYN regards all legacy data sources as potentially useful. Network staff will coordinate with park staff to minimally document (e.g. in Dataset Catalog) those legacy data sources discovered incidentally during normal park and network business. Due to the volume of legacy data sources, particularly at YELL, investments in additional or extensive data discovery efforts must be reviewed and approved by project leaders and resource specialists to determine if candidate data sources can be documented as valid and related to the objectives of the vital signs monitoring program. If so, then legacy data may be converted using I&M funds to file formats compatible with the current standards. The network may scan hardcopy references and materials, saving them as PDF files in a digital library and transferring a copy to the NatureBib document center or NPS Biodiversity Data Store.
5.2.2 Field Studies Biological inventories and monitoring projects are the most common examples of field studies conducted by the network. All NPS employees, volunteers, educational partners, contractors, etc. must conform to the National Park Service Geographic Information System Data Specification for Resource Mapping, Inventories, and Studies. (http://imgis.nps.gov/contract_specs.html) Following this guidance helps ensure that NPS investments result in usable GIS data in standard formats. The data manager is responsible for ensuring that data collection, data entry, verification, documentation, storage, and archiving for all field projects are consistent with the program and network standards. In addition to general operating procedures that define network-wide requirements, protocol specific standard operation procedures (SOP’s) are developed for each protocol. The data manager works closely with the project leaders and network staff to develop these guidelines and methodologies for data collection, processing, and management. These activities range from specifying the proper design and use of hardcopy and electronic data entry forms to outlining calibration procedures for automated data loggers. Refer to the individual vital sign monitoring protocols for specific data management procedures. General NPS examples of protocol specific SOP’s are available online at http://www1.nrintra.nps.gov/im/datamgmt/dmplanning.htm.

Vital Signs Monitoring Plan • 31
Field Data Acquisition Tools: Since different protocols require unique data collection methods, the details about specific field data collection tools for individual projects are documented in each protocol’s operating procedures. The network invests in technology based on the particular needs of each project rather than the allure of the latest, greatest gadgetry. The process to select equipment and methods will consider short term and long term cost, functionality, ease of use, user comfort levels, and support and training requirements. The network expects to use many of the general tools listed below. Field Forms – this common method of recording field data is straightforward and inexpensive. Special attention must be paid to maximize clarity of written data values and minimize data form coding errors during the data recording process. Field forms require neat, legible handwriting and rigorous quality control. For some projects the network may transition from using hardcopy forms as the primary recording medium to electronic equipment, and continue to use field forms for backup when electronic equipment fails or is unavailable. Field Computers – Collecting data in digital format in the field can increase data entry and processing efficiency and help reduce errors. Data can be directly transferred from the field computers to the office desktop computers to eliminate a data entry step. Data entry errors can be minimized by applying quality control functions in the electronic data entry forms. Field computers can complement hardcopy field notes, and hardcopy data sheets should always be available in case the electronic equipment is damaged, lost, out of power, or otherwise unavailable.
• Handheld computers (Personal Digital Assistants (PDA’s), Portable Data Recorders (PDR’s), etc.) – The small size and relative low cost of these devices make them worth considering for collecting field data. Those that are made for dusty, wet, and extreme temperature conditions or those that can be protected within a rugged container may be a good option for small field projects. However some may not have the battery, memory, or functional capacity for large data intensive field projects. Many rugged handheld computers are available with global positioning system (GPS) functions, as well as feature attribute data collection capacity. Most use Microsoft PocketPC or Palm operating systems which may require additional expertise and training in processing and programming to create the database structure for the handheld computer and transfer database content between computers.
• Tablet PC’s – These have many of the same properties as laptop computers and provide
the user with the convenience of a touch screen interface. They are bulkier, more expensive and harder to make rugged for field use than the handheld computers but are more powerful. Tablet PC’s may be a better choice for field projects that are very data intensive. Because these units run Windows XP (Tablet Edition) the project database can usually be directly transferred from desktop units to field units without additional programming steps. The visibility of the computer screen in bright sunlight conditions is an important consideration for tablet PC’s and handheld computers.
Automated Data Loggers – These are mainly used to collect physical environment data such as weather data or water quality parameter values. Data loggers require proper and
Ch 5 • Data Acquisition and Processing

Ch 5 • Data Acquisition and Processing
32 • Appendix VII: Data and Information Management Plan
regular calibration and maintenance, so field crews must receive appropriate training, and standard operating procedures must include specific calibration and maintenance procedures. The resources required to set up, maintain, and manage automated data loggers should be carefully assessed and compared to alternative sampling techniques and equipment. • Permanently deployed devices – Data from these devices must be retrieved and
batteries changed on a regular basis. These intervals should be defined in the protocol and costs of visits and maintenance should be considered in the project budget.
• Portable hand-held devices – Deployed for sampling only during site visits, these are
generally less expensive than units that are permanently deployed in the field.
Global Positioning System (GPS) Units – Two types of GPS units are typically used during field work to display and/or collect location information. The decision about which type to use depends on the requirements of the project related to the capabilities and limitations of the GPS equipment. See Appendix D for the GPS standard operating procedure. • Recreational GPS Units – These are preferred mainly for all-purpose navigation rather
than data collection because they store little or no attribute data and only general position information. Since most units do not record the accuracy of each position or feature, and the positions cannot be differentially corrected to improve the accuracy, recreational GPS units are not recommended for protocols or projects that require highly accurate location information. In some cases it is appropriate to use recreational GPS units to collect point features using position averaging to improve accuracy. Collecting line and area features with recreational GPS units is not recommended. Users are advised to record error estimates along with the coordinates.
• Mapping GPS Receivers – When used by well trained crew members, these receivers
can collect highly accurate (sub-meter) location information, when using real time or post processed differential correction. Mapping grade receivers also support data entry forms for collecting feature attribute data that facilitates transfer to a GIS. Use of mapping grade units is encouraged for all line and area feature GPS data collection.
5.3 Data Entry After data is recorded using the tools listed above, the following data entry procedures are necessary to maintain data flow and ensure data quality. • Field crew members or other project staff will enter all data into a database approved by
the project leader and network data manager. • Project personnel will periodically transfer data files to the data manager. Individual
protocols state the requirements for data transfer, backup, and archiving. • The data manager maintains and updates the network’s master copy of the database
with data received from the field crews.

Vital Signs Monitoring Plan • 33
• All data is subject to quality assurance procedures. Chapter 6 discusses data verification and validation. Specific quality control activities are specified in each vital sign monitoring protocol.
Network data is stored and processed in local and national databases. Microsoft® Access databases and personal geodatabases are developed using the NPS Natural Resources Database Template. The flexibility of the NRDT allows customized local database applications to meet the needs and requirements of each project while using common tables for data values that repeat and are shared between projects (places, people, species, etc). Network database applications incorporate quality assurance mechanisms such as pick lists and validation rules. The network also processes its data using Service-wide data stores (listed in chapter 4) for centralized archival and distribution. The network keeps master data synchronized between local and Service-wide data stores. 5.4 Changes to Data Collection Procedures/Protocols Changes to data collection procedures are made based on valid reasons for altering the methodologies. Most issues will be identified during the design and testing stages of the project and changes will be implemented prior to the collection of field data. The protocol development process includes attempting to identify and address any foreseeable issues that might occur with data acquisition and processing. Unforeseen issues may arise after data collection has begun which require changes to procedures or protocols. Significant changes to the protocols must be approved by the project leader, an I&M Program official at the Washington Office level, and the data manager. The I&M official must evaluate the proposed changes and determine if additional peer review is required before accepting the modifications. Changes to protocols and associated data collection procedures may also occur as a result of scheduled program reviews. During the review, data are analyzed to determine if the current protocol is meeting stated objectives. If it is determined that the protocol has not achieved the desired results then recommended changes should be made. 5.5 Data Sources A large percentage of data collected in network parks are collected by park personnel involved in projects initiated at the individual park level or by other NPS regional or national programs. The resulting data and associated products provide a great deal of information about park natural resources and are often relevant to the mission of the I&M Program. 5.5.1 Park Data Network parks often use base funding or receive funding through other sources and programs to support park-level projects.
• Park-based biological inventories - network parks conducting their own park-based
inventory projects generate data that can be used to supplement network-level inventories conducted by the I&M Program.
• Park-based monitoring projects - Park-level monitoring projects (such as vegetation and water quality) produce information that is valuable when developing network-level monitoring protocols.
Ch 5 • Data Acquisition and Processing
Ch 5 • Data Acquisition and Processing
34 • Appendix VII: Data and Information Management Plan
• Park and multi-park based projects - other studies or projects conducted at the park or regional level that do not fall into one of the previous two categories (e.g., restoration projects).
5.5.2 Regional and National Programs NPS regional and national programs support all of the parks within the network and also provide a good resource for natural resource information.
• Air – The NPS Air Resources Division (ARD) presents interpolated spatial and tabular air
quality data for parks via the online Air Atlas: (http://www2.nature.nps.gov/air/). The NPS ARD compiles and analyzes air-related data from several national air monitoring networks, and performs broad-scale trend analyses relevant to GRYN air quality issues. The GRYN I&M Program will rely in part on these national scale monitoring networks to obtain trends for air-related vital signs.
• EPMT - Exotic Plant Management Teams (EPMT) collect and maintain data regarding
the presence of exotic species in regional parks and the methods used to treat these species. This information is stored in the Alien Plant Control and Monitoring Database (APCAM) which is maintained by the EPMT data manager or EPMT liaison. http://www1.nrintra.nps.gov/BRMD/invasivespecies/exoticplants/index.htm
• Fire Program – data concerning the occurrence of fires within the network are
maintained at the parks and regionally. National databases such as Fire-Pro, SACS and the soon-to-be implemented Fire Program Analysis (FPA) package (http://fpa.nifc.gov/) provide information regarding resources devoted to fires as well as fire occurrences. The NPS is also involved in efforts such as the Joint Fire Science Program (http://jfsp.nifc.gov/) that provides scientific information and support for fuel and fire management programs.
• GIS – The NPS OCIO GIS Division, the Natural Resource Program Center, and regional
GIS staff provide guidance and assistance to network and park staff.
• Water - nearly all of the field data collected by the regional water resources program supports the water resources vital signs monitoring projects. The program also synthesizes, analyzes, and interprets water resources data collected by parks. The National Hydrography Dataset (NHD) is the NPS standard for spatial hydrography data. NPS Water Resource Division assists with water quality data management by providing NPSTORET and data transfer services for STORET.
• Wildlife Management - The NPS Wildlife Management Program is involved with
coordinating long-term monitoring and assessment of wildlife populations.
5.5.3 Processing National Park Service Data The I&M Program’s current framework for natural resource information management (Figure 5.1) aims at achieving maximum return on investments made in data gathering, such that
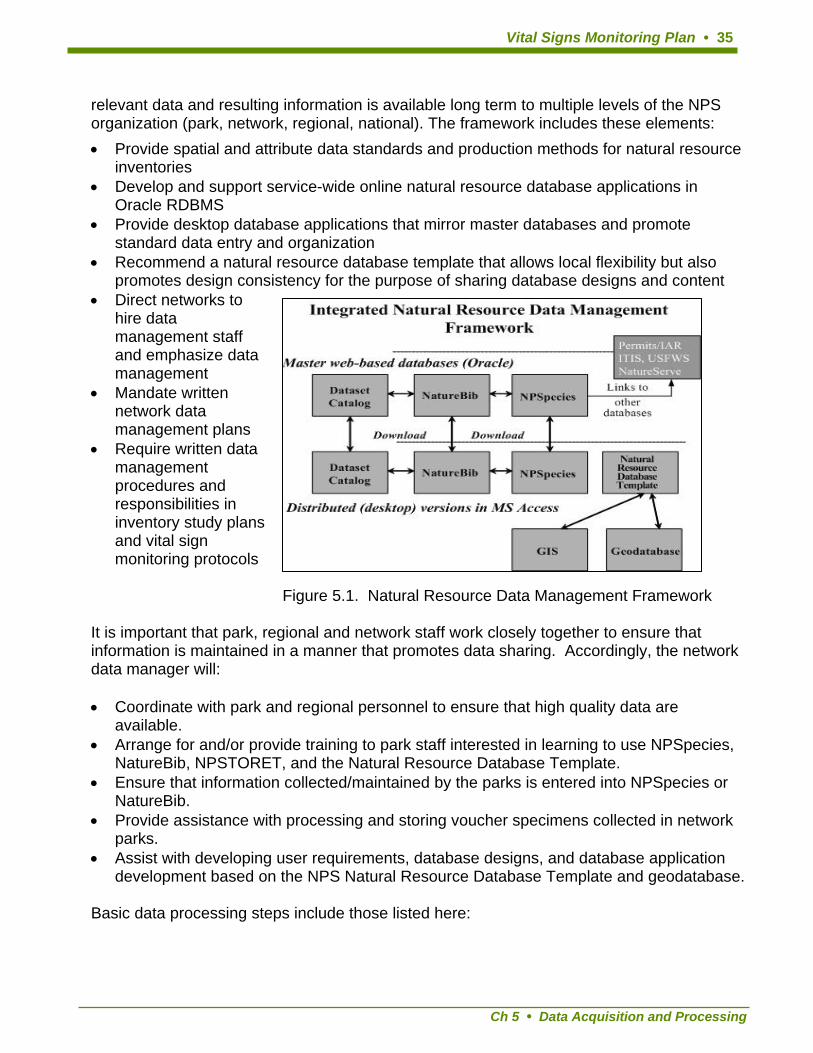
Vital Signs Monitoring Plan • 35
relevant data and resulting information is available long term to multiple levels of the NPS organization (park, network, regional, national). The framework includes these elements:
• Provide spatial and attribute data standards and production methods for natural resource inventories
• Develop and support service-wide online natural resource database applications in Oracle RDBMS
• Provide desktop database applications that mirror master databases and promote standard data entry and organization
• Recommend a natural resource database template that allows local flexibility but also promotes design consistency for the purpose of sharing database designs and content
• Direct networks to hire data management staff and emphasize data management
• Mandate written network data management plans
• Require written data management procedures and responsibilities in inventory study plans and vital sign monitoring protocols
Figure 5.1. Natural Resource Data Management Framework
It is important that park, regional and network staff work closely together to ensure that information is maintained in a manner that promotes data sharing. Accordingly, the network data manager will:
• Coordinate with park and regional personnel to ensure that high quality data are
available. • Arrange for and/or provide training to park staff interested in learning to use NPSpecies,
NatureBib, NPSTORET, and the Natural Resource Database Template. • Ensure that information collected/maintained by the parks is entered into NPSpecies or
NatureBib. • Provide assistance with processing and storing voucher specimens collected in network
parks. • Assist with developing user requirements, database designs, and database application
development based on the NPS Natural Resource Database Template and geodatabase. Basic data processing steps include those listed here:
Ch 5 • Data Acquisition and Processing

Ch 5 • Data Acquisition and Processing
36 • Appendix VII: Data and Information Management Plan
• Enter all new park biological inventory and monitroing data into NPSpecies (this is important for network-based and park-based biological inventories) and enter all associated references into NatureBib.
• Enter all park-based or regional reports and publications into the park library. Hard copies are stored in the appropriate file cabinets and electronic copies are archived in the proper directory on the park and network file server.
• Ensure that all GIS data is in the proper projection and accompanied by metadata that is complete and compliant with NPS format requirements.
• All data sets are entered into and tracked using Dataset Catalog.
5.5.4 External Data Non-NPS and non-I&M data sources contribute to the development of the network’s long term monitoring program. Certain vital signs may be addressed primarily by data that is collected and managed by non-NPS agencies or entities. For example, some vital sign parameters related to air quality, geology, and water can be referenced from existing non-NPS or non-I&M repositories and data stores. The agencies or organizations that collect these data have the expertise to conduct appropriate quality control procedures, and the capability to function as a repository and clearinghouse for the validated data. When necessary for analysis or summary reporting, the network acquires and processes off-site data according to the monitoring protocols. These “data snapshots” are archived by the network in cases where it may not be possible to repeat the same data acquisition and processing steps. 5.5.5 Processing External Data Much of the data collected from external sources must undergo the following processing to meet the standards of the GRYN I&M Program.
• All GIS data obtained from other entities are stored in a format compatible with NPS
information systems, has the correct spatial reference information, and has FGDC compliant metadata.
• All park-related biodiversity data obtained or received from other entities is entered into NPSpecies.
• Citations are entered into NatureBib for data taken from a report or published document. • All reference materials obtained are kept in the network’s library of electronic and/or
hardcopy information resources. • All data sets are entered into and tracked using Dataset Catalog.
Certain data sets will require more than the basic processing steps described above. The level of data processing required for external data sets such as those used in the vital signs monitoring program depends on the desired output. For example, if basic trends are of interest for air quality then relatively little processing is required. Where it meets the needs of the parks, the network will rely on trend analyses by other national programs. However, if more intensive analyses are needed, such as conducting in-depth analyses at a specific location rather than monitoring regional trends, the network will perform additional processing. In such cases, the specific protocols provide the necessary data processing requirements.

Vital Signs Monitoring Plan • 37
Remote sensing data sets such as satellite imagery or aerial photography will require varying levels of processing depending on how they are received and applied. Ideally, all spatial data sets will be acquired with existing geo-referencing and may only require geographic transformations to be compatible with NPS systems. Varying degrees of spatial and spectral processing may be necessary to adequately address stated inventory and monitoring objectives. The individual protocols outline the necessary processing steps. Chapter Credits This chapter was adapted from material prepared by Geoff Sanders (NCRN).
Ch 5 • Data Acquisition and Processing

Ch 6 • Data Quality Assurance
38 • Appendix VII: Data and Information Management Plan
6. Data Quality Assurance “Data need to meet national-level quality standards and need to be accessible to be used for wise and defensible decision-making at all levels. Data need to be able to be shared and aggregated with data from other parks and from adjacent lands to support landscape-level and national planning and decision-making.” (Abigail B. Miller, National Park Service, 2001) Importance of Quality Assurance/Quality Control (QA/QC)Ecological data and related information resulting from GRYN resource inventory and monitoring efforts are a valuable resource worthy of preservation only if those data may be used with confidence. Analyses performed to detect trends or patterns in ecosystem processes and the condition of natural resources require data of documented quality. Data of inadequate quality can result in loss of sensitivity to subtle changes and incorrect interpretations and conclusions, and the potential for problems with data quality increases dramatically with the size and complexity of the data set (Chapal & Edwards 1994). Therefore, one important data management goal is to ensure that I&M projects produce data that meet quality requirements specified in monitoring protocols. Documented methods to ensure data quality are critical to the preservation of data integrity. Established protocols for the identification and reduction of errors at all stages in the data lifecycle, including project planning, data collection, data entry, verification and validation, processing, and archiving, should be incorporated into the data management infrastructure and institutionalized. While a data set containing zero errors is an ideal goal, such perfection is rarely achieved, and the cost of pursuing 100% accuracy may outweigh the benefit. Two parameters should be considered in setting a data quality goal: 1) the percent of entries that are incorrect (frequency of errors) and 2) the magnitude of the error (criticality of errors). For example, a two-digit numeric entry off by one decimal place is more likely to be a significant critical error than a six-digit numeric entry with the sixth digit off by one. In another case, one incorrect digit in a six-digit species number indicates a completely different species and is clearly significant. Error significance, therefore, is dependent on the type of data. The overall data quality goal should be a reasonable and attainable level of quality based on the intended use of the data and the potential consequences of making a wrong decision or interpretation. 6.1 NPS Mandate for Quality Producers and users must know and document the quality of their data. This is especially important for sharing data and is the intent of several government directives. NPS Director’s Order #11B: Ensuring Quality of Information Disseminated by the National Park Service was issued in 2002 to comply with these directives to ensure and maximize the quality of information disseminated by Federal agencies. The order defines ‘quality’ as an encompassing term comprising objectivity, utility, and integrity; therefore ‘quality’ generally refers to all three of these elements. ‘Objectivity’ includes two distinct elements: 1) presentation, whether disseminated information is being presented in an accurate, clear, complete, and unbiased manner within a proper context and 2) substance, a focus on ensuring accurate, usable, and reliable information. ‘Utility’ refers to the usefulness of the

Vital Signs Monitoring Plan • 39
information to its intended users, from the perspectives of both the office and the public. ‘Integrity’ refers to the security of information, e.g., protection from unauthorized access or revision to ensure that the information is not compromised through corruption or falsification. The order further specifies that information will be developed only from reliable data sources and that it will be accurate, timely, and representative of the most current information available. These standards apply not only to NPS-generated information, but also to information provided by other parties to the NPS if the NPS disseminates or relies upon this information. High quality data and information are not only mandated by directives and orders, they are vital to the credibility and success of the I&M Program. According to Abby Miller (2001) of the Natural Resource Stewardship and Science Division, “data need to meet national-level quality standards and need to be accessible to be used for wise and defensible decision-making at all levels. Data need to be able to be shared and aggregated with data from other parks and from adjacent lands to support landscape-level and national planning and decision-making.” 6.2 Definitions of Quality Assurance and Quality Control Quality assurance procedures plan for quality in all stages of the data development process, while quality control procedures monitor or evaluate the resulting data products. Palmer (2003) defines quality assurance as “an integrated system of management activities involving planning, implementation, documentation, assessment, reporting, and quality improvement to ensure that a process, item, or service is of the type and quality needed and expected by the consumer.” He defines quality control as “the overall system of technical activities that measures the attributes and performance of a process, item, or service against defined standards to verify that they meet the stated requirements established by the customer.” QA/QC mechanisms are designed to prevent data contamination, which occurs when a process or event other than the one of interest affects the value of a variable and introduces two fundamental types of errors into a data set. Errors of commission include those caused by data entry and transcription errors or malfunctioning equipment. They are common, fairly easy to identify, and can be effectively reduced upfront with appropriate QA mechanisms built into the data acquisition process, as well as QC procedures applied after the data have been acquired. Errors of omission often include insufficient documentation of legitimate data values, which could affect the interpretation of those values. These errors may be harder to detect and correct, but many of these errors should be revealed by rigorous QC procedures. QA/QC procedures applied to ecological data include four activities ranging from simple to sophisticated, inexpensive to costly: 1) defining and enforcing standards for electronic formats, locally defined codes, measurement units, and metadata, 2) checking for unusual or unreasonable patterns in data, 3) checking for comparability of values between data sets, and 4) assessing overall data quality. Much QA/QC work is related to the first activity, which begins with data design and continues through acquisition, entry, metadata development, and archiving. The progression from raw data to verified data to validated data implies increasing confidence in the quality of the data through time (Figure 6.1).
Ch 6 • Data Quality Assurance
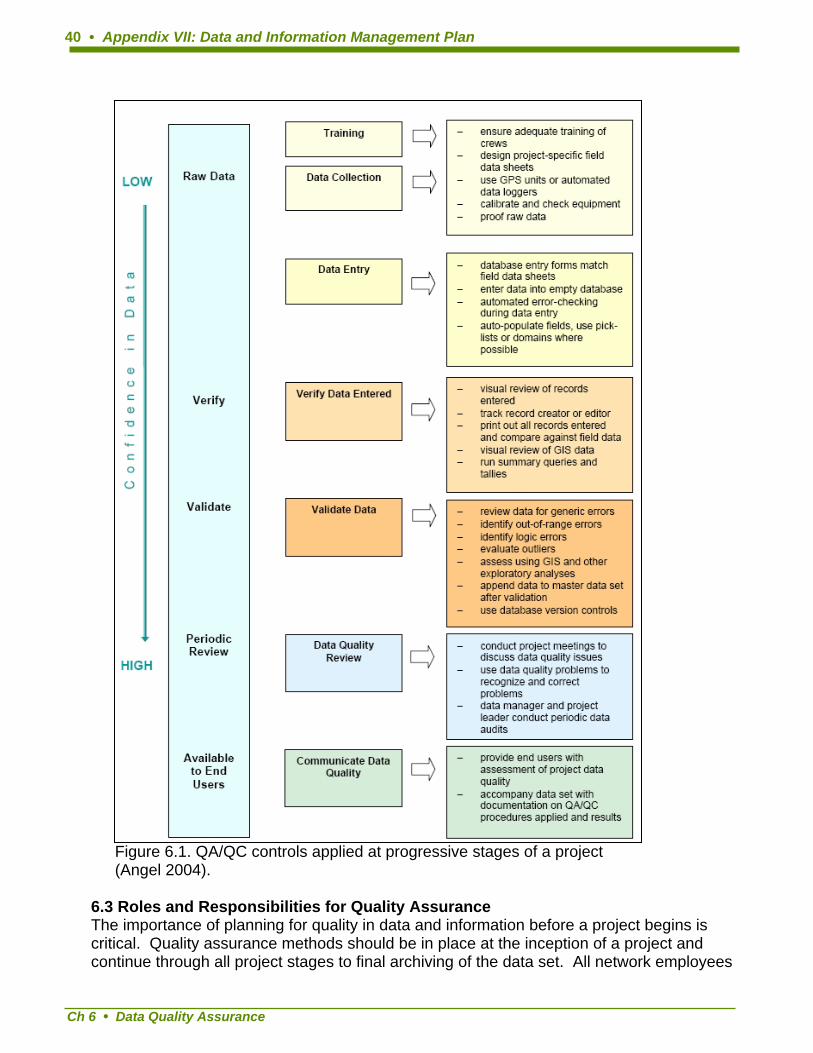
40 • Appendix VII: Data and Information Management Plan
Figure 6.1. QA/QC controls applied at progressive stages of a project (Angel 2004).
6.3 Roles and Responsibilities for Quality Assurance The importance of planning for quality in data and information before a project begins is critical. Quality assurance methods should be in place at the inception of a project and continue through all project stages to final archiving of the data set. All network employees
Ch 6 • Data Quality Assurance

Vital Signs Monitoring Plan • 41
from the network coordinator to the data entry technicians, along with the data manager, should take responsibility for, and pride in, achieving a high level of data quality. People are the most important factor in the data quality process, and everyone plays a part in achieving high quality data products. All employees assigned to a project are responsible for the quality of the results generated from his or her task(s). The network coordinator and park managers must recognize the importance of data quality and support all appropriate efforts to achieve the highest possible quality in the data produced by network and park inventory and monitoring projects. Project leaders must: 1) help prepare quality protocols and convey their importance to technicians and field crews, 2) ensure compliance with the protocols, 3) validate data after the verification process is complete, and 4) review and approve all final reports and information products. The data manager is responsible for: 1) helping the project leader prepare protocols and SOPs to ensure data quality, 2) making project leaders, technicians, etc., aware of the established procedures and
helping enforce adherence to them, 3) evaluating the quality of all data and information against NPS standards before
distributing data outside the network, and 4) performing periodic data audits and quality control checks to monitor and improve data
quality activities. Technicians must follow established protocols for data collection, data entry, and verification established in the inventory and monitoring protocol data management SOPs. 6.4 Goals and Objectives for Quality Assurance The overarching goal in establishing goals, objectives, and criteria for data quality is to ensure that a project produces data of the right type, quality, and quantity to meet the project objectives and the user’s needs. Quality criteria should be set at a level proportionate to the project-specific objectives, and these criteria should indicate the level of quality acceptable for the final data product. The EPA (2003) defines data quality objectives as qualitative and quantitative statements that: • clarify the intended use of the data, • define the type of data needed to support the decision, • identify the conditions under which the data are to be collected, and • specify tolerable limits on the probability of making a decision error due to uncertainty in
the data. The most effective mechanism for ensuring that a project produces data of the right type, quality, and quantity is to provide procedures and guidelines to assist the investigator in accurate data collection, entry, and validation. Therefore, a comprehensive set of SOPs and data-collecting protocols for quality control, namely clear field methodologies, a well-trained field staff, well-organized field forms, and data entry applications with simple built-in validation controls are part of the network’s data management approach.
Ch 6 • Data Quality Assurance

Ch 6 • Data Quality Assurance
42 • Appendix VII: Data and Information Management Plan
Although specific QA/QC procedures will depend upon the individual vital signs being monitored and must be specified in the protocols for each monitoring vital sign, some general concepts apply to all network projects. The general QA/QC procedures presented in this plan were primarily adapted from the Draft Data Management Protocol (Tessler & Gregson 1997) and the ideas contained in Michener and Brunt (2000). These general guidelines will ensure that all data collected are checked for integrity before being integrated into monitoring program databases. Refer to SOPs and monitoring protocols for specific QA/QC procedures. 6.5 Data Collection Careful, accurate recording of field observations in the data collection phase of a project will help reduce the incidence of invalid data in the resulting data set. Unlike a typographical error that occurs when a recorded observation is incorrectly transferred from a paper field form to a digital database, an incorrect entry in the field cannot be easily corrected. Therefore, attention to detail during data collection is crucial to overall data quality and will reduce the overall frequency and criticality of errors at subsequent stages in the data lifecycle. Paper field notebooks and data forms are primary methods for recording ecological data. Paper has advantages in terms of longevity and ease of use, but requires careful handling and storage under some environmental conditions. Data processing options are limited until the data are transferred to digital format. As an alternative to paper, several options for electronic data collection in the field are now available, including handheld computers, automated data collection instruments, and audio recorders (see Chapter 5). Regardless of the collection method, data should be transferred from one form to another only once because each transfer has the potential to introduce additional errors into the data set. One transfer should result in fewer errors, provided that appropriate QA/QC measures are incorporated into the process. Before the data collection phase of a project, the project leader, with assistance from the data manager provides the protocols/SOPs for data collection and storage. All field sheets and field data recording procedures must be reviewed and approved by the data manager and documented in the protocol SOPs. The project leader ensures that field crew members understand the procedures and closely follow them in the field. The data manager works with the project leader to provide necessary training. Field crew members are responsible for proofing raw data forms in the field, ensuring their readability and legibility, and verifying and explaining any unusual entries. They are expected to understand how to use the data collection forms, know how to take measurements, and follow the protocols. 6.5.1 Suggested Methods to reduce errors during field data collection Use a formatted, project-specific data sheet as opposed to a field notebook. When electronic data collection devices are not used, data will be recorded on paper data forms. The use of acid-free paper prevents fading and subsequent data loss. Some circumstances require the use of paper and writing implements that can withstand moisture, dust, and other extreme environmental conditions.
Vital Signs Monitoring Plan • 43
Standardized data sheets that identify the parameters to be recorded and display the data for efficient computer entry (i.e., reflect the design of the data entry interface) will help ensure that all relevant information is recorded and subsequent data entry errors are minimized. Data sheets should contain as much basic preprinted project information as possible and sufficient space for recording relevant metadata such as date, collectors, weather conditions, etc. They should clearly specify all required information, using examples where needed to ensure that the proper data are recorded. Project personnel must follow these guidelines: • All information added to the data sheet must be printed and clearly legible. • If alterations to the data values are necessary, the original value should be crossed out
with a single line and the new value written next to the original entry. Information should never be erased and old information should not be overwritten.
• Upon return from the field, copies of all original data sheets should be made and checked for legibility and completeness (i.e., no data cut off at the edges). The copies of the data sheets will be stored as specified in the protocol SOP, and the original data sheets will be used for data entry.
Use a handheld computer for data collection when applicable. The use of handheld computers minimizes the need for manual data entry from field forms and associated transcription and data entry errors. Specially designed database or computer programs may be required for handheld computers, and the user interface should be customized to meet project requirements. A customized data entry application has the advantage of incorporating on-the-spot QA/QC checks, so this data collection method provides a high level of data quality when combined with point-of-entry data quality checks. These portable units, however, are subject to environmental constraints such as heat, dust, and moisture. When handheld computers are used for data entry in the field, the data must be downloaded daily to avoid potential loss of information. Thus, if a handheld unit fails during data collection, only the current day’s data are lost. Batteries should be checked prior to a data collection trip, and they should be charged at the end of every field day. The use of a memory card that will store the data in case of damage to the unit or battery failure is suggested. Finally, in case the unit becomes inoperable in the field, printed data sheets should always accompany field crews on data collection trips. Use automated data loggers where appropriate. Instruments with their own data acquisition systems may be used to collect some types of data, such as water and air quality data. These devices can be calibrated and programmed to automatically record data and store them for later download directly to a computer, thereby eliminating the possibility for manual data entry errors. Data loggers are an efficient method for recording continuous sensor data, but routine inspections are necessary. Environmental constraints, as well as power (e.g., sufficient battery charge) and maintenance requirements, must be considered in the use of these instruments. Regular downloads are required since physical memory is usually limited, but the elimination of manual data entry reduces potential errors. Use a handheld tape or digital audio recorder. Another alternative to paper field data forms is a handheld digital audio or micro cassette tape recorder. Recorded observations are subsequently transcribed to paper or directly entered into computer files. As with other technological solutions, there are drawbacks including battery and tape maintenance, low environmental tolerance, and risk of failure. However, if a single data collector is in the field,
Ch 6 • Data Quality Assurance

Ch 6 • Data Quality Assurance
44 • Appendix VII: Data and Information Management Plan
audio recorders can provide an easily operated, high quality, efficient method of collecting data. Consider calibration, maintenance, and minimum timing requirements of field equipment. Accurate field measurements are only possible if field equipment is regularly calibrated and maintained. Where appropriate, consult reference manuals for recommended calibration and maintenance procedures. Once in the field, allow sufficient time for field equipment (such as water quality probes and GPS units) to adjust to the environment so they will record accurate measurements. . Project personnel maintain records of equipment calibration and failures that accompany their field data. Be organized and keep a log. Organization is the key to good data collection methods. Keeping a log of any decisions made and events that occurred will help clarify information and contribute to an accurate report. Ensure that field crews receive proper training. Although protocols and SOPs are in place, they cannot guarantee that high quality data will be collected. Prior to routine data collection for a project, conduct training sessions to ensure that field personnel have a clear understanding of data collection procedures described in the SOPs. A training program may also include a process to certify that field staff understand and can perform the specified data collection procedures. The development of a training manual is advised for long-term monitoring data collection efforts and those that will involve a large number of field staff. Palmer and Landis (2002) provide an outline for a training manual and suggestions for planning training sessions. Perform quantitative assessments of data quality. A quantitative assessment of data quality during data collection activities may be performed to determine if measurement protocols are being followed and quality objectives are being achieved. Repeating a measurement is the primary tool for performing quantitative assessments. Project leaders should periodically review the work of field technicians to ensure that their work does not drift from standards during the course of the field season. Quantitative assessments may be considered if staff and funding are available, and Palmer and Landis (2002) describe several approaches that may be employed. 6.6 Quality Assurance for Data Entry Data entry is the initial set of operations where raw data from paper field forms are transcribed or typed into a computerized form linked to database tables. Spreadsheets may be used for data entry with approval from the project leader and data manager. When data are gathered or stored digitally in the field (e.g., on a data logger), data entry is the transfer of data (downloading) to a file in an office computer where they can be further manipulated. Transferring data from field forms into the computer is a straightforward task. Nevertheless, concentration, close attention to detail, and an absence of distractions during data entry are important for reducing errors and maximizing quality. Without proper preparation and some established guidelines, the quality and integrity of the data will be in question. Data entry is best performed by a person who is familiar with the data and ideally takes place as soon as data collection is complete. The goal of data entry is the transcription of the data from paper records into the computer with 100% accuracy. However, since transcription errors are
Vital Signs Monitoring Plan • 45
virtually unavoidable during data entry, they will have to be corrected during the data verification process. Observing the data entry guidelines in the next section will help minimize verification work. The data manager, in conjunction with the project leader, should provide training in the use of the database to all data entry technicians and any other users. The project leader will ensure that data entry technicians understand how to enter data and that they follow the protocols. Data entry technicians are responsible for becoming familiar with the field data forms and differences in handwriting. They must also be familiar with the database software, database structure, and any standard codes for data entry that have been developed. If the program or application used for entering the records is not familiar, the data entry technician should spend some time practicing before actually entering the data. They should know how to open the data entry form, create a new record, and exit the database properly. They must learn how to commit both a ‘field’ entry and a complete record entry and correct mistakes made while typing. 6.6.1 Suggested Methods to reduce errors during data entry Enter or download data in a timely manner. All data should be entered or downloaded into the project database as soon as possible, preferably within one week. Do not delay data entry until all the project data have been collected. Downloaded data should be periodically stored on CD or other appropriate media and stored according to the protocol data management SOP. Design efficient data entry forms and methods. A full-screen data entry form that mimics the field data forms can effectively reduce manual data entry errors due to the 1:1 correspondence of the attributes. A strategy to distinguish between validated data and newly entered data should be adopted. Data may be entered into an empty, fresh database table to avoid contaminating existing data and the new data appended to the master data only after formal verification, validation, and documentation. An alternate method is to include validation attributes that indicate which data have been checked and validated by the project leader in the database. Regardless of the strategy chosen, the process for validation must be clearly documented in the protocol data management SOP and built into the database design. Build automated error checking features into the database. The most robust QA/QC measures for data entry will be built into the database design to perform automatic validation checks of data. Data entry forms reduce transcription errors through auto-filled fields, range limits, pick lists, and spelling checks; provide controlled access to the database (i.e., forms are set for data entry only, which prevents accidental deletion or alteration of existing data); and control the sequence of data entry (i.e., certain fields require an entry before more information can be entered). Controls warn the operator when errors are made and provide the opportunity for correction before the data are committed to a file. • Auto-filled fields. Whenever possible, the data in a field should be auto-filled by the
computer. For example, if a location ID is comprised of a park code, project code, and a unique number, those elements are automatically inserted into the location ID field, ensuring that the record always contains a unique identifier.
Ch 6 • Data Quality Assurance

Ch 6 • Data Quality Assurance
46 • Appendix VII: Data and Information Management Plan
• Range limits. Where the appropriate values for a particular field span a finite range, the data entry program can check the entered value against the specified minimum and maximum values for that parameter. When a value is outside the accepted range, a warning message appears and asks the user to reenter a valid value. For some fields, values outside a specified ‘normal’ range may be acceptable. In this case, the warning message asks the user to verify the entry before continuing.
• Pick lists. The data entry application may also use pop-up pick lists for standardized text items where spelling errors can occur. For example, rather than typing in a species code or name (where a misspelling generates a new species in the database), the code or name is selected from a list of valid species codes or scientific names and automatically entered into the species field. A pick list may also be used when only certain entries are acceptable. Lists are not appropriate for all written fields but should be used when appropriate.
• Unique constraints. Duplicate and incorrect data entry can often be caught with the application of unique constraints on data entry fields. These constraints are particularly useful when importing data from other applications.
Provide a clean, organized work environment. Desktop space near the computer should be free of clutter and distractions that could cause the technician to lose their place. There should be enough space for two stacks of paper documents, one from which data are being entered and one from which data have been entered. A pad or notebook and some fine-point colored markers should also be available for making notes. The need for a clean workspace also applies to the verification and validation phases. Have two data entry technicians available for data entry. Although not required, when one technician reads the data from the field data forms and another enters them into the computer, the work is often faster and results in a lower error rate. If only one person is available, he/she should work at a slower pace to avoid errors. Like many monotonous tasks, data entry can be done in a personal rhythm that eases the work for some people. Frequent rest periods (approximately every 20 minutes) also helps reduce data entry errors. Perform initial and interval testing of data quality. To help ensure consistent, useful data is collected for a given monitoring objective it is important to test the data collection procedures and quality control methods soon after field work begins. A mandatory trial period (from one day to two weeks) follows thorough training for personnel involved in data collection. Data from the trial is measured against quality requirements. If the data meets the overall and protocol-specific requirements, then data collection will continue. If the data quality does not meet requirements, then personnel receive additional training and the trial is repeated followed by another quality test. If the data quality does not improve following the second trial, other aspects of the protocol will be examined for factors contributing to the difficulty of meeting data quality requirements. 6.7 Verification and Validation Procedures Data quality is appraised by applying verification and validation procedures as part of the quality control process. These procedures are more successful when preceded by effective quality assurance practices. Performing both verification and validation of data is emphasized because verified data are not always valid data. Data verification checks that

Vital Signs Monitoring Plan • 47
the digitized data match the source data, whereas data validation checks that the data make sense. It is essential that all data are validated as truthful and do not misrepresent the circumstances and limitations of their collection. Failure to follow SOPs for data entry, validation, and verification will render a data set suspect. It is important to remember that only the data entry and verification stages can be done by someone who is not familiar with the kinds of errors sought during validation; validation requires in-depth knowledge about the data. The project leader and data manager establish SOPs for verification and validation. The project leader will ensure that the SOPs are followed. The project leader or designee will validate the data after verification is complete. He/she is also responsible for reviewing all data products and reports before they are released outside the network. The data and project leaders will evaluate the results of verification and validation and determine any procedural or data form revisions that may be indicated by the results. Technicians will follow the SOPs for verification of data, make required changes, and document those changes. Manual effort is generally required to get data into electronic format. Any typographical errors made will accumulate in the permanent database unless the data are verified and the errors detected. By implementing data verification procedures, these errors can be reduced, if not eliminated. Data verification immediately follows data entry and involves checking the accuracy of the computerized records against the original source, usually hard copy field records, and identifying and correcting any errors. When the computerized data are verified as accurately reflecting the original field data, the paper forms can be archived. 6.7.1 Suggested Methods for Data Verification Data verification is most effective when performed immediately after data entry to check the accuracy of the computerized records against the original source, usually hard copy field records, and to identify and correct any errors. Once the computerized data is verified as accurately reflecting the original field data, the original paper forms are archived and further data processing is done on the computer. Each of the following methods has a direct correlation between effectiveness and effort. The methods to identify and eliminate the most errors can be very time consuming while the fastest (cheapest) methods will result in fewer error detections and corrections. Visually review values and records at the time of data entry. The data entry technician verifies each record after it is input. The values recorded in the database are compared with the original values from the hard copy and any errors are corrected immediately. This method is the least complicated since no additional personnel or software is required. The reliability of this method depends wholly on the person keying data and is generally the least reliable of the data verification methods. Visually review after data entry. All records are printed upon the completion of data entry. The values on the printout are compared with the original values from the hard copy. Errors are marked and corrected in a timely manner. When one technician performs this review, the reliability increases if someone other than the person keying data performs the review. As an alternative, two technicians may perform this review. One technician reads the original data sheets (the reader) and the second the same data on the printout (the checker).
Ch 6 • Data Quality Assurance

Ch 6 • Data Quality Assurance
48 • Appendix VII: Data and Information Management Plan
Perform duplicate data entry. The data entry technician completes all data entry, as normal. Random records are selected (every nth record) and entered into an empty replica of the permanent database, preferably by someone other than the person keying the permanent data. A query that automatically compares the duplicate records from the two data sets and reports on any mismatches of data is run. Any disparities are manually reviewed and corrected if necessary. This method involves the overhead of retyping the selected records, as well as the creation of a comparison query (which requires additional effort, but is not time-consuming). This method becomes increasingly successful as the value of n decreases. This method is frequently used by professional data entry services. Generate simple summary statistics. In addition to the above methods, summary information using the entered data can be calculated with statistical software. This is important because even when care is taken up to this point, a duplicate or omitted entry may have been overlooked. For example, the number of known constant elements, such as the number of sampling sites, plots per site, or dates per sample, can be viewed. The same question can be posed in different ways; differences in the answer provide clues to errors. The more checks devised to test the completeness of the data, the greater the confidence that the data are completely verified. To minimize transcription errors during manual data entry, the network verifies 100% of records to their original source by NPS staff. In addition, 10% of records are reviewed a second time by the project leader, and the results of that comparison are reported with the data. If errors are found in the project leader’s review, then the entire data set is verified again. 6.7.2 Data Validation Data values correctly transcribed from the original field forms into a database are not automatically assumed to be accurate or logical. For example, a pH of 25.0 for a stream is suspect in the database and on the field form. The process of reviewing data for range and logic errors is validation. It can be done during data verification only if the operator has comprehensive knowledge about the subject matter to which the data relates. More often, validation is a separate operation carried out after verification by a natural resource specialist to identify generic and specific errors in particular data types. Validation efforts are often facilitated by database entry controls that inform the user when a value entered is out of a previously defined expected or normal range of continuous values or list of discrete values. For resource specialists not familiar with the database, the data manager can produce hardcopy summary reports and lists for review during the validation phase. Corrections or deletions of logical or range errors in a data set require notations in the original paper field records about how and why the data were changed. Modifications of the field data should be clear and concise while preserving the original data entries or notes (i.e., no erasing!). Validation efforts should also include a check for the completeness of a data set since field sheets or other sources of data could easily be overlooked. General step-by-step instructions are not possible for data validation because each data set has unique measurement ranges, sampling precision, and accuracy. Nonetheless, validation is a critically important step in the certification of the data. Invalid data commonly consist of slightly misspelled species names or site codes, the wrong date, or out-of-range
Vital Signs Monitoring Plan • 49
errors in parameters with well defined limits (e.g., elevation). But more interesting and often puzzling errors are detected as unreasonable metrics (e.g., stream temperature of 70°C) or impossible associations (e.g., a tree 2 feet in diameter and only 3 feet high). These types of erroneous data are called logic errors because using them produces illogical (and incorrect) results. The discovery of logic errors has direct, positive consequences for data quality and provides important feedback to the methods and data forms used in the field. Histograms, line plots, and basic statistics can reveal possible logic and range errors. 6.7.3 Suggested Methods for Data Validation The following general methods may be used to validate data. Specific procedures for data validation depend upon the vital sign being monitored and will be included in the monitoring protocols. Data entry application programming. Certain components of data validation are built into data entry forms. The simplest validation during data entry is range checking, such as ensuring that a user attempting to enter a pH of 20.0 gets a warning and the opportunity to enter a correct value between 1.0 and 14.0 (or better yet, within a narrow range appropriate to the study area). Not all fields, however, have appropriate ranges that are known in advance, so knowledge of what are reasonable data and a separate, interactive validation stage are important. Edwards (2000) suggests the use of ‘illegal data’ filters, which check a specified list of variable value constraints on the master data set (or on an update to be added to the master) and create an output data set. This output data set includes an entry for each violation, along with identifying information and an explanation of the violation. They illustrate the structure of such a program, written in the SAS® programming language. A caveat should be interjected regarding the operative word ‘illegal’. Even though a value above or below a given threshold has never before been observed and the possibility that it could occur seems impossible, such an observation is not always an illegal data point. Edwards (2000) points out that one of the most famous data QA/QC blunders to date occurred when NASA’s computer programs deleted satellite observations of ozone concentrations that were below a specified level, seriously delaying the discovery of the ozone hole over the South Pole. Outlier Detection. According to Edwards (2000), “the term outlier is not (and should not be) formally defined. An outlier is simply an unusually extreme value for a variable, given the statistical model in use.” Any data set will undoubtedly contain some extreme values, so the meaning of ‘unusually extreme’ is subjective. The challenge in detecting outliers is in deciding how unusual a value must be before it can (with confidence) be considered ‘unusually’ unusual. Data quality assurance procedures should not aim to eliminate outliers. Extreme values naturally occur in many ecological phenomena; eliminating these values simply because they are extreme is equivalent to pretending the phenomenon is ‘well-behaved’ when it is not. Eliminating data contamination is a better way to explain this quality assurance goal. If contamination is not detected during data collection, it is usually only be detected later if an outlying data value results. When an outlier is detected, attempts should be made to
Ch 6 • Data Quality Assurance
Ch 6 • Data Quality Assurance
50 • Appendix VII: Data and Information Management Plan
determine if some contamination is responsible and to resolve the issue by making appropriate changes and documenting the changes. Database, graphic, and statistical tools can be used for ad-hoc queries and displays of the data to detect outliers. Some of these outlying values may appear unusual but prove to be valid after confirmation. Noting correct but unusual values in documentation of the data set saves other users from checking the same values. Other exploratory data analyses. (Palmer and Landis 2002) suggest that in some cases, calculations for assessments of precision, bias, representativeness, completeness, and comparability may be applicable and that for certain types of measurements, evaluation of a detection limit may also be warranted (the authors provide examples of procedures that may be applicable). Normal probability plots, Grubb’s test, and simple and multiple linear regression techniques may also be used (Edwards, 2000; the author provides SAS® and Splus® code for constructing normal probability plots and examples of output showing normal and non-normal distributions). Examples of Validation Errors (Tessler & Gregson 1997) Wrong Date. A simple typo during data entry creates a logical set of data for a day, month, or year in which samples were never taken. This can become puzzling if the data are sorted by date – thus moving the entry away from its true neighbors. If sorting creates the appearance of missing data where a record should have been, the apparently appropriate corrective action might actually create duplicate records in the file rather than fix the ones that were wrong – leaving the original problem unresolved. Even when left in the original order, however, date errors may go undetected because checkers can sometimes see what the readers say – especially when the month and day are the items of focus and an incorrect year digit is not examined. A summary analysis counting the total records in the data set will also be correct. A check of the number of dates or samples per year will often detect an erroneous year by revealing too many samples or a year that does not belong, whereas the rest of the data records reveal where the correction is needed. Identifying site code errors, etc. is a similar process for incorrect values not identified during verification. Cryptic Duplicates. An example is a contracted vegetation monitoring program. The contractor supplies a field sheet containing species codes, names, and counts in each sample which are to be entered into the computer. Cryptic duplicates occur in the data files when a single sample contains two entries for the same species – the contractor didn't realize he already had a line for that species when doing the counts and added another line later in the table. The data verification process correctly confirms the separate entries but does not recognize that they should be pooled for that sample. Summary counts of the number of species for that sample also show the same number as lines of original data – apparently correct. However, using a count distinct query, a count of the number of unique species in the sample is one less than the line count. Returning to the original data form and comparing each line with the others for that sample eventually reveals the error of duplication, and the data file is corrected by pooling the abundance values into the first record of that species and then deleting the second. The original printed data table (the original form) is then also corrected. Here, two different methods of making counts of the same item (species per sample) were used and compared to find the discrepancy. In
Vital Signs Monitoring Plan • 51
Microsoft Access, cryptic duplicates can be eliminated with the proper use of unique primary keys. Wild Temperatures. Temperatures can show wild variations and yet be completely verifiable and valid. For example, some older data (or the occasional spurious recent record) may have been taken in Fahrenheit rather than Celsius. The difference in the recorded number(s) is large. This is actually a protocol problem and not a data question, but if quality control procedures during data collection were lax, these types of errors are often found only during data validation or (more annoyingly) data analysis. Routinely producing a box-plot or histogram of numerical data reveals drastic outliers, and when the original data forms are consulted, true outliers vs. errors in measurement scale or units become apparent, as does the correction for the files (i.e., convert the measurement to the appropriate units). Foxes that Change Sexes or Get Younger. As an example, let’s use vertebrate monitoring and capture and tagging of foxes each year. The program manager discovered that some of these re-captured measured foxes were changing sex or getting younger. Foxes don't change sexes or get younger. Some serious detective work revealed that inexperienced observers were not able to accurately gauge the age and sex of the foxes. Queries can be run to find these discrepancies. Unfortunately, sometimes these discrepancies cannot be fixed by editing the data files and may result in data of poor quality which may not be usable for their original purpose. Trees that shrink. The vegetation monitoring program in Shenandoah National Park includes remeasuring trees in permanent plots every five years. In one survey, the project manager discovered that some of the remeasured trees were getting smaller—recent DBHs (diameters at breast height) were less than the original measurements 5 years earlier. Tree trunks of live trees do not get smaller. Some serious detective work revealed that the data were entered accurately (verifiable), but seemingly slight-to-moderate differences in the accuracy and exact methodology by current vs. previous crews. A search-and-compare program was written to parse the data and identify and scale the differences between trees, revealing the extent of the damaged data. Unfortunately, this problem could not be fixed by editing the data files. Rather, it revealed a previous protocol problem that resulted in data of poor quality and data that are useless for the original purpose. 6.8 Version Control Version control is the process of documenting the temporal integrity of files as they are being changed or updated. Change includes any alteration in the structure or content of the files, and such changes should not be made without the ability to undo mistakes caused by incorrect manipulation of the data. Data progresses through various lifecycle stages, and whenever a set of changes is complete, the user should save the file with a unique name. Version control is simple insurance for maintaining data integrity, and using good version control should be routine for all data handlers. Prior to any major changes to a file, a copy should be stored with the appropriate version number that allows the tracking of changes over time. With proper controls and communication, versioning ensures that only the most current version is used in any analysis.
Ch 6 • Data Quality Assurance

Ch 6 • Data Quality Assurance
52 • Appendix VII: Data and Information Management Plan
The data manager determines the version control method that will be used, and other network personnel are responsible for accurately designating versions for any files upon which they have worked. Staff is encouraged to design and use software tools that assist in file management. For example, databases can be created that include fields to record revision history on the file. Backup routines can be built into the databases that allow for automatic file renaming and archiving. Important program files can be catalogued in a simple index or more formally tracked and archived using professionally developed version control software. Refer to Appendix B for additional information on file management and storage. Version Control Options Dates. Using a date provides logical version control. The date is usually formatted as YYYYMMDD or YYMMDD, where DD is optional (depending on the frequency of changes). One drawback to this method is that dates may be hard to read, thus causing confusion for users who may open the wrong version of a file. Sequential numbers. Versioning of archived data sets is handled by adding a number to the file name, e.g., 001 or V1.0 for the first version. Each additional version is assigned a sequentially higher number. Documenting the date that a file becomes a new version is strongly recommended if this method is used. For example, backup copies of the same database with different raw data are placed in a backup subdirectory with the YYYYMMDD date tagged on the end. Frequent users of the data must be aware of the version control method so they can identify the most recent version. Version control software. To avoid the work of differentiating multiple versions of documents by appending modifying characters to the file name, version control software is an option. Such software applications track changes made to a document, add comments related to the different document iterations, and retrieve the document at any recorded stage of development. These applications are available in either desktop or online formats. The following list summarizes some of the issues version control software should address: • Track documents as they change during the course of the developmental and editorial
phases of document/report creation. • Prevent conflicts between multiple collaborators by prohibiting multiple edits to the same
file at the same time. • Provide the ability to recover previous versions of documents. • Evaluate the document creation process by tracking who changes a file, when they make
the change, and what changes they make. • Reduce storage requirements by eliminating multiple copies of complete documents. 6.9 Data Quality Review and Communication QA/QC review is required prior to communicating/disseminating data and information. Only data and information that adhere to NPS quality standards will be released. Director’s Order #11B states that all information (e.g., brochures, research and statistical reports, policy and regulatory information, and general reference information) distributed by

Vital Signs Monitoring Plan • 53
the NPS (including information obtained from sources outside of the NPS) must be accurate, reliable and timely in nature. Therefore, the network must evaluate and identify the types of information it will disseminate that will be subject to the guidelines. Information disseminated to the public must be approved by the appropriate reviewing officials and programs. Documentation of the QA/QC standards used in producing the information and that substantiate the quality of the information must be formally documented Furthermore, mechanisms must be in place for receiving and addressing comments/complaints pertaining to the quality of data. Data are distributed to the public through the GRYN I&M web page, national web sites such as the Biodiversity Data Store and the Natural Resource/GIS Data Store, and public access databases such as NPSpecies and NatureBib. Any information distributed through any of these mechanisms must undergo internal QA/QC procedures and be approved for release. Data Quality Review Methods The network will establish guidelines and protocols to ensure compliance with DO #11B. These protocols will document both internal and external review procedures for data and information disseminated outside the network, as well as a process for processing feedback about data quality. Edwards (2000) suggests the initiation of quality circles, regular meetings of project leaders, the data manager, and data management personnel for discussing data quality problems and issues. These meetings promote teamwork attitudes while focusing brainpower on data quality issues. Participants become more aware of quality issues and learn to anticipate problems. Moreover, all participants develop a greater appreciation of the importance of their role in data quality and the entire monitoring effort. Value of Feedback from QA/QC Procedures Quality assurance procedures may need revision to improve the quality level if random checks reveal an unacceptable level of data quality. Quality checks should not be performed with the sole objective of eliminating errors; the results may also prove useful in improving the overall process. For example, if the month and day are repeatedly reversed in a date field, the data entry technicians may require retraining about the month/day entry order. If retraining is unsuccessful in reducing the error’s occurrence, the computer program may need to be rewritten so that month and day are entered separately, field length limits are enforced, or a pick list is created. In this manner, the validation process will serve as a means of improving quality as well as controlling the lack of quality. Sometimes, modification of field data forms to avoid common mistakes is necessary. With knowledge of validation errors and exploratory data results in hand, the field data forms as the source of the logic errors can be reevaluated. Often minor changes, small annotations, or adding check boxes to a field form remove ambiguity about what to enter on the form. In fact, any time the same type of validation error occurs repeatedly in different data sets, the field form – not the field crew – is usually at fault. Repeated errors found during validation can also mean that protocols or field training are at fault, which can then be recognized and corrected.
Ch 6 • Data Quality Assurance

Ch 6 • Data Quality Assurance
54 • Appendix VII: Data and Information Management Plan
Monitoring Conformance to Plans and Standards Data managers may elect to use periodic data audits and quality control checks as mechanisms to actively participate in the oversight and improvement of data quality activities. Data managers must verify that staff is operating in conformance with the data quality procedures specified in this plan and the protocol specific data management plans. The data manager should track and facilitate the correction of any deficiencies. These quality checks promote a cyclic process of continuous feedback and improvement of the both the data and quality planning process. The cyclic process of quality planning, data collection, data validation and acting on problems is the foundation for the quality assurance philosophies of quality gurus Dr. William Edwards Demming and Dr. Joseph Juran.
Periodic checks by the data manager to see if network staff are adhering to the data quality procedures established in the Data Management Plan and protocols SOPS may include verification of the following: • Data collection and reporting requirements are being met. • Data collection and reporting procedures are being followed. • Verification and validation procedures are being followed. • Data file structures and maintenance is clear, accurate and according to plan. • Revision control of program documents and field sheets is adequate. • Calibration and maintenance procedures are being followed. • Seasonal and temporary staff have been trained in data management practice. • Metadata collection and construction for the program is complete. • Data is being archived and catalogued appropriately for long term storage.
The results of quality assessments should be documented and reported to the project staff and the network coordinator. The project leader and coordinator are responsible for ensuring that non-conformities in data management practices are corrected. Communicating Data Quality Data documentation and metadata will be used to notify end users, project leaders, and network management of data quality. A descriptive document for each data set/database will provide information on the specific QA/QC procedures applied and the results of the review. Descriptive documents or formal FGDC-compliant metadata will document quality for spatial and non-spatial data files posted on the Internet. Every monitoring project requires standard quality control procedures like those listed in table 6.1. In addition to these customary activities, many projects involve unique or specialized quality control measures such as properly calibrating a particular brand and model of equipment used in monitoring.
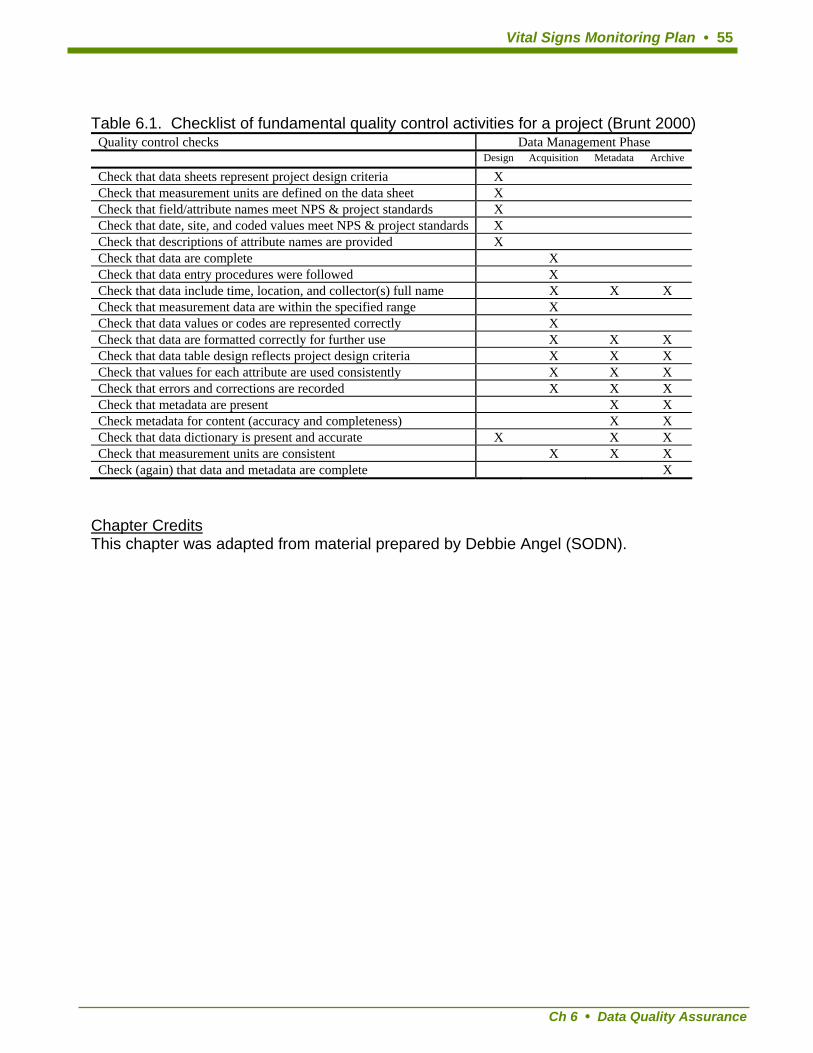
Vital Signs Monitoring Plan • 55
Table 6.1. Checklist of fundamental quality control activities for a project (Brunt 2000)
Quality control checks Data Management Phase Design Acquisition Metadata Archive
Check that data sheets represent project design criteria X Check that measurement units are defined on the data sheet X Check that field/attribute names meet NPS & project standards X Check that date, site, and coded values meet NPS & project standards X Check that descriptions of attribute names are provided X Check that data are complete X Check that data entry procedures were followed X Check that data include time, location, and collector(s) full name X X X Check that measurement data are within the specified range X Check that data values or codes are represented correctly X Check that data are formatted correctly for further use X X X Check that data table design reflects project design criteria X X X Check that values for each attribute are used consistently X X X Check that errors and corrections are recorded X X X Check that metadata are present X X Check metadata for content (accuracy and completeness) X X Check that data dictionary is present and accurate X X X Check that measurement units are consistent X X X Check (again) that data and metadata are complete X
Chapter Credits This chapter was adapted from material prepared by Debbie Angel (SODN).
Ch 6 • Data Quality Assurance

Ch 7 • Data Documentation
56 • Appendix VII: Data and Information Management Plan
7. Data Documentation 7.1 Purpose of Metadata Data documentation is information about the content, quality, condition, and other characteristics of a data set so that it may be used and qualified based on its original purpose and limitations. Structured metadata also provide the means to catalog data sets for discovery and distribution on a computer network to a broad range of potential users. In addition to data set documentation, the network will use feature level metadata to document characteristics about each data record associated with a vital sign monitoring protocol. Feature level metadata will include the name, date, source, and version of the monitoring protocol, and FGDC standard attributes for Process Description, Horizontal Positional Accuracy Report, and Process Date. Other feature level metadata characteristics may be added to some data sets. Many data sets seem to take on lives of their own, with different copies and versions on multiple hard drives, servers, and other storage media. Some data sets remain hidden in digital formats or in seldom used file drawers. Once these data are discovered, a potential user may have little or no information about a data set’s quality, content, or process methodologies. Such ambiguity can result in lost productivity when the user must invest time tracking down information, or can render a data set useless because answers to critical questions about the data cannot be found. For these reasons, the planning and implementation of inventory and monitoring projects includes requirements and procedures to provide documentation for all project data. The following mandates and policies exist to guide network staff in developing data documentation strategies. • Executive Order 12906, “Coordinating Geographic Data Acquisition and Access: The
National Spatial Data Infrastructure,” signed by President Clinton in 1994, mandates federal agencies to “...document all new geospatial data it collects or produces, either directly or indirectly...” using the Federal Geographic Data Committee (FGDC) Content Standard for Digital Geospatial Metadata (CSDGM). In addition, EO 12906 directs agencies to plan for legacy data documentation and provide metadata and data to the public.
• The FGDC Biological Data Profile contains all the elements of the CSDGM and includes additional elements for describing biological data sets. Metadata created in compliance with the Biological Data Profile can be added to the National Biological Information Infrastructure (NBII) Clearinghouse. Although not a requirement, completion of the Biological Data Profile is recommended for biological data sets.
• All GIS data layers must be documented with applicable FGDC and NPS metadata standards. The NPS GIS Committee requires all GIS data layers be described with FGDC standards and the NPS Metadata Profile.
• While there are numerous tools available for developing metadata, the NPS Integrated Metadata System Plan is limited to three recommended desktop applications: Dataset Catalog, ArcCatalog™, and Spatial Metadata Management System (SMMS™).
7.2 NPS Integrated Metadata System Plan and Tools The NPS Integrated Metadata System Plan represented in figure 7.1 recommends three desktop applications for collecting metadata. The following briefly describes each of these
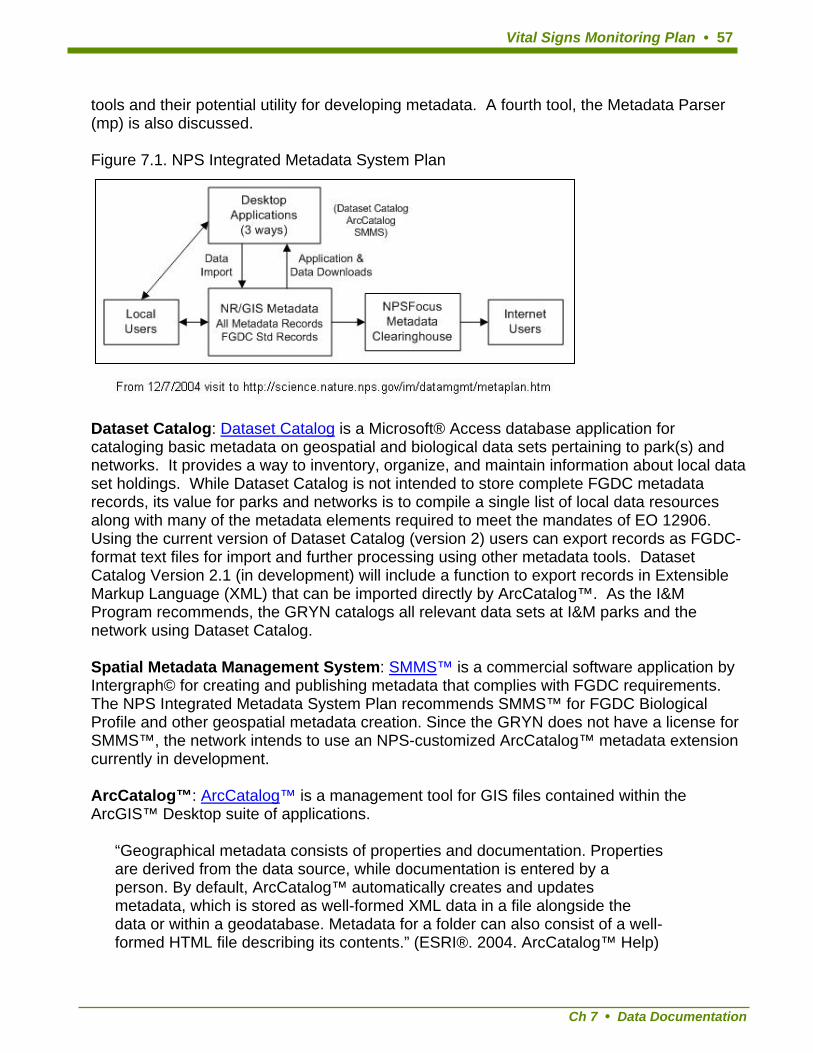
Vital Signs Monitoring Plan • 57
tools and their potential utility for developing metadata. A fourth tool, the Metadata Parser (mp) is also discussed. Figure 7.1. NPS Integrated Metadata System Plan
Dataset Catalog: Dataset Catalog is a Microsoft® Access database application for cataloging basic metadata on geospatial and biological data sets pertaining to park(s) and networks. It provides a way to inventory, organize, and maintain information about local data set holdings. While Dataset Catalog is not intended to store complete FGDC metadata records, its value for parks and networks is to compile a single list of local data resources along with many of the metadata elements required to meet the mandates of EO 12906. Using the current version of Dataset Catalog (version 2) users can export records as FGDC-format text files for import and further processing using other metadata tools. Dataset Catalog Version 2.1 (in development) will include a function to export records in Extensible Markup Language (XML) that can be imported directly by ArcCatalog™. As the I&M Program recommends, the GRYN catalogs all relevant data sets at I&M parks and the network using Dataset Catalog. Spatial Metadata Management System: SMMS™ is a commercial software application by Intergraph© for creating and publishing metadata that complies with FGDC requirements. The NPS Integrated Metadata System Plan recommends SMMS™ for FGDC Biological Profile and other geospatial metadata creation. Since the GRYN does not have a license for SMMS™, the network intends to use an NPS-customized ArcCatalog™ metadata extension currently in development. ArcCatalog™: ArcCatalog™ is a management tool for GIS files contained within the ArcGIS™ Desktop suite of applications.
“Geographical metadata consists of properties and documentation. Properties are derived from the data source, while documentation is entered by a person. By default, ArcCatalog™ automatically creates and updates metadata, which is stored as well-formed XML data in a file alongside the data or within a geodatabase. Metadata for a folder can also consist of a well-formed HTML file describing its contents.” (ESRI®. 2004. ArcCatalog™ Help)
Ch 7 • Data Documentation

Ch 7 • Data Documentation
58 • Appendix VII: Data and Information Management Plan
With ArcCatalog™, users can browse, manage, create, and organize tabular and GIS data. In addition, ArcCatalog™ comes with support for several metadata standards that allow one to create, edit, and view information about the data. It includes editors for entering metadata text, a storage schema, and property sheets to view the data. With ArcCatalog™ users can view GIS data holdings, preview geographic information, view and edit metadata, work with tables, and define the schema structure for GIS data layers. Metadata within ArcCatalog™ is stored exclusively as Extensible Markup Language (XML) files. The NPS Integrated Metadata System Plan recommends ArcCatalog™ for gathering GIS-integrated geospatial metadata. The network uses the NPS Metadata ArcCatalog™ Extension developed by NPS Midwest Region GIS Technical Support Center which fixes several ArcGIS™ 8 metadata errors and provides added functionality to properly document NPS data sets. NPS GIS is also developing Biological Profile editing capability and NPS Profile support for the ArcCatalog™ extension. Metadata Parser: The MetaParser (mp) program is used by the network to validate metadata records by checking the syntax against the FGDC Content Standard for Digital Geospatial Metadata and to generate compliant output files for posting to clearinghouses. It generates a textual report indicating errors in the metadata, primarily in the structure, but also in the values of some of the scalar elements where values are restricted by the standard. 7.3 Metadata Process and Workflow The general procedures involved with the lifecycle of metadata include identifying which existing and planned data sets require documentation, compiling data characteristics, cataloging, preparing FGDC metadata records, posting the metadata records, and maintaining the records. An overview of these procedures is presented in this section. Step 1. Identify Data Sets The scope of data resources requiring metadata for the I&M Program is limited primarily to natural resource themes. Therefore, the network is not concerned with identifying and documenting all data sets for cultural, facility, law enforcement, and other park operations and values. This does not preclude the use of these data by the network for reporting, mapping, etc. Whether natural resource data are acquired as a result of implementing an I&M vital sign monitoring protocol, from existing or future park protocols, or from those of non-NPS sources such as other federal agencies, the value of the data for network parks is determined by professional resource specialists who examine the data and its metadata for relevance to local information needs. For existing data sets determined to be useful and new data sets that are designed to be useful, the next step is to gather information about the data. Step 2. Compile Metadata Elements Existing data sets may lack complete metadata and the originator may no longer be available for consultation. In cases where comprehensive documentation is not available, the supporting information relating to a data set is assembled in order to keep track of as much background as possible. Existing data from non-NPS sources may require contacts to request available metadata and/or conduct a metadata interview.

Vital Signs Monitoring Plan • 59
For new projects, metadata development begins up front, with documentation requirements specified in project plans, contracts, and agreements. In addition to written requirements, project leaders, cooperators, and other participants should receive verbal briefings about metadata responsibilities and expectations. Metadata for data sets acquired according to a vital sign protocol will include the protocol name, date, version, and source, along with the protocol’s justification statement and specific monitoring objective(s) ‘purpose’ section of the metadata record. This ensures a link among the complete monitoring protocol documentation, the metadata record, and the data set via the protocol name and version at the record/feature level in the database. The network data manager works principally with project leaders to ensure metadata requirements are met. Complete metadata is required by the network as criteria for completing a project. Step 3. Create Dataset Catalog Record The network enters Dataset Catalog records for data sets identified in step one, including both geospatial and non-spatial data sets. Benefits of cataloging brief metadata records include the following: • provides brief metadata for park and network data holdings in a searchable, centralized
location • helps to organize, identify, and prioritize data sets for which formal FGDC metadata will
be developed • records the status of metadata documentation for a particular data set (i.e., planned, in
work, complete) • supports exporting records for import into the online NR-GIS Metadata System or to
continue with additional processing steps based on data type, source, and importance. Once data sets are cataloged, they can be prioritized for further documentation according to their current and expected level of use or distribution. For example, data sets frequently requested outside the NPS will be fully documented, and those data sets not in use due to vintage or format are considered adequately tracked and documented in Dataset Catalog and the metadata records are available for future processing. All locally published GIS layers will be documented with applicable FGDC and NPS metadata standards. Step 4. Prepare the Complete Metadata Record The network plans to use ArcCatalog™ and NPS extensions as the primary tool to create and maintain data set documentation according to FGDC and NPS standards. In order to correctly process, apply, and interpret raw data contained in the rows and columns of a tabular data files, these must be accompanied by a descriptive document that includes the following information about the project and the data: • List and description of contents data set content • Description of the project • Location of the project study plan and work plan • Project leader’s name and contact information • Principal investigator’s name and contact information • Data set contact’s name and contact information
Ch 7 • Data Documentation
Ch 7 • Data Documentation
60 • Appendix VII: Data and Information Management Plan
• Description of the database model (entity-relationship diagram and data dictionary) • Sensitive data issues, if any • Description of data verification/validation methods and results • Additional comments and documentation as needed to inform, as completely as
possible, those not involved in the project who will process and apply the data. Step 5. Make Information Available Complete metadata and associated data will be submitted to the internet-based NR-GIS Metadata and Data Store as the primary distribution mechanism for sharing information on data holdings with park resource managers, researchers, and others. This system integrates metadata search functions, data downloading, and metadata maintenance. Basic metadata is also available to network parks via reporting functions in Dataset Catalog, including customized queries and reports. Non-sensitive NR-GIS Metadata records are routinely posted to NPS Focus. Step 6. Maintain metadata records Like any data set, it takes planning and effort to keep metadata records current. The network intends to schedule annual review of metadata records and to update and synchronize Dataset Catalog and ArcCatalog™ records with the NR-GIS Metadata database. Chapter Credits This chapter was adapted from material prepared by Theresa Leibfreid (CUPN).

Vital Signs Monitoring Plan • 61
8. Data Management Support for Analysis and Reporting Providing meaningful results from data summary and analysis is a cornerstone of the I&M Program and characterizes the network’s data management mission to provide useful information for managers and scientists. The Data Analysis and Reporting chapter (VII) of the Vital Signs Monitoring Plan contains the background and overall approach to data analysis and reporting by the network. The associated data management objective is to provide valid data in formats that support scheduled and ad hoc display, query, analysis, summary, and reporting of data to meet local, regional, and national requirements. Routine and scheduled data summary and analysis requirements and procedures are identified in each vital sign monitoring protocol. The following sections discuss data management activities related to using GIS and database application software for data summary and analysis, and to prepare data for analysis using statistical software applications. 8.1 Periodic and Annual Reporting The network data manager will work with the network ecologist, project leaders, and others involved in data analysis to specify and design or adapt database objects, fields, and values to support the formats and functions necessary for analysis using statistical software applications, e.g., SAS®, R, and S. A list of common vital sign monitoring reports and venues and their purpose, frequency, and intended audience is shown in chapter 7 in the GRYN Vital Signs Monitoring Plan. Some basic summary and reporting functions required by a vital sign monitoring protocol can be developed within Microsoft® Access database applications where data are stored. Examples include descriptive statistics (mean, standard deviation, sample size). The network ecologist and others will use existing and custom data conversion and export functions in Microsoft® Access to prepare data sets for import into other software applications. Spatial analysis and maps will be produced by network and/or park affiliate staff. Ad hoc queries and reports will be handled on a case by case basis due to their dynamic nature. The network will enhance its web site over time to deliver reports and provide supplemental background data and information. In the future this may include web-based internet map services and functions for user-controlled queries and summaries of network data. The web-site offers easy access to park managers for up-to-date information generated by the network and other related programs. 8.2 Long-term Trends Analysis and Reporting Most long term data analysis will involve statistical software applications to perform the three primary types of analyses described in Chapter VII of the network Vital Sign Monitoring Plan: parameter estimation, hypothesis testing and model selection. Data formats required by statistical software often involve arrays of binary or discrete values that represent one or more parameters. Data analysts and the network data manager will identify and develop the data conversion routines necessary to generate these formats for analysis. GIS functions can also contribute to understanding long term status and trends of vital signs and ecosystems. The network will provide geographic data display, summary, and mapping services for scheduled reports and other requests. Methods may be developed for using GIS to visualize time-series data, perform geostatistical, functions, and do spatial network
Ch 8 • Data Management Support for Analysis and Reporting

Ch 8 • Data Management Support for Analysis and Reporting
62 • Appendix VII: Data and Information Management Plan
analysis with hydrography, transportation, and other linear features. Tabular and spatial results can be shared in reports and made available on the network’s web site and via internet map services.

Vital Signs Monitoring Plan • 63
9. Data Distribution 9.1 National Park Service Policy on Data Ownership The National Park Service defines conditions for the ownership and sharing of collections, data, and results from survey and research funded by the United States government. All cooperative and interagency agreements, as well as contracts, should include clear provisions for data ownership and sharing as defined by the National Park Service:
• All data and materials collected or generated using National Park Service personnel and
funds become the property of the National Park Service.
• Any important findings from research and educational activities should be promptly submitted for publication. Authorship must accurately reflect the contributions of those involved.
• Investigators must share collections, data, results, and supporting materials with other
researchers whenever possible. In exceptional cases, where collections or data are sensitive or fragile, access may be limited.
The Office of Management and Budget (OMB) ensures that grants and cooperative agreements are managed properly. Federal funding must be disbursed in accordance with applicable laws and regulations. OMB circulars establish some degree of standardization government-wide to achieve consistency and uniformity in the development and administration of grants and cooperative agreements. Specifically, OMB Circular A-110 establishes property standards within cooperative agreements with higher institutions and non-profit organizations. Section 36 of Circular A-110, “Intangible Property” describes the following administrative requirements pertinent to data and ownership:
(a) The recipient (academic institution or non-profit organization receiving federal monies for natural resource inventory and/or monitoring) may copyright any work that is subject to copyright and was developed, or for which ownership was purchased, under an award. The Federal awarding agency(ies) (in this case the National Park Service) reserve a royalty-free, nonexclusive and irrevocable right to reproduce, publish, or otherwise use the work for Federal purposes, and to authorize others to do so. Section 36 also states:
(c) The Federal Government has the right to:
(1) obtain, reproduce, publish or otherwise use the data first produced under an award (2) authorize others to receive, reproduce, publish, or otherwise use such data for Federal purposes
(d) (1) In addition, in response to a Freedom of Information Act (FOIA) request for research data relating to published research findings produced under an award that were
Ch 9 • Data Distribution

Ch 9 • Data Distribution
64 • Appendix VII: Data and Information Management Plan
used by the Federal Government in developing an agency action that has the force and effect of law, the Federal awarding agency shall request, and the recipient shall provide, within a reasonable time, the research data so that they can be made available to the public through the procedures established under the FOIA (5 U.S.C. 552(a)(4)(A)). (2) The following definitions apply for purposes of paragraph (d) of this section:
(i) Research data is defined as the recorded factual material commonly accepted in the scientific community as necessary to validate research findings, but not any of the following: preliminary analyses, drafts of scientific papers, plans for future research, peer reviews, or communications with colleagues. This "recorded" material excludes physical objects (e.g., laboratory samples)… (ii) Published is defined as either when:
(A) Research findings are published in a peer-reviewed scientific or technical journal; or (B) A Federal agency publicly and officially cites the research findings in support of an agency action that has the force and effect of law.
(iii) Used by the Federal Government in developing an agency action that has the force and effect of law is defined as when an agency publicly and officially cites the research findings in support of an agency action that has the force and effect of law.
9.2 Establishing Data Ownership Guidelines The network has established guidelines for the ownership of data and other research information. To ensure that proper ownership, format, and development of network products is maintained, all cooperative or interagency work must be conducted as part of a signed collaborative agreement. Every cooperative or interagency agreement or contract involving the network must include OMB Circular A-110 cited under the Reports and Deliverables Section of all agreements and contracts. The following shows appropriate language to use when citing Circular A-110:
“As the performing organization of this agreement, <institution or organization name> shall follow the procedures and policies set forth in Office of Management and Budget (OMB) Circular A-110. (http://www.whitehouse.gov/omb/circulars/a110/a110.html)”
Every cooperative or interagency agreement or contract must include a list of deliverables and products clearly defined within each agreement or contract. Details on formatting and media types that will be required for final submission must be included. Agreements and contracts must list all products expected to result from the project. These include, but are not limited to, field notebooks, photographs (hardcopy and digital), specimens, raw data, and reports. The following statement must be included in the Reports and Deliverables section of all GRYN agreements and contracts:
“All reports and deliverables must follow the most recent version of the GRYN Product Specifications.”
Vital Signs Monitoring Plan • 65
Investigators should also provide a schedule of deliverables that includes sufficient time for NPS review of draft deliverables before scheduled final submissions. 9.3 Data Distribution One of the most important goals of the Inventory and Monitoring Program is to integrate natural resource inventory and monitoring information into National Park Service planning, management, and decision making. To accomplish this goal, the network uses procedures to ensure that relevant natural resource data collected by NPS staff, cooperators, researchers and the public are entered, quality-checked, analyzed, documented, cataloged, archived, and made available for management decision-making, research, and education. Providing well-documented data in a timely manner to park managers is important to the success of the program. The network will make certain that:
• Data are easily discoverable and obtainable • Data that have not yet been subjected to full quality control will not be released to non-
NPS requestors, unless necessary in response to a FOIA request • Distributed data are accompanied by complete metadata that clearly establishes the data
as a product of the NPS I&M Program • Sensitive data are identified and protected from unauthorized access and inappropriate
use • A complete record of data distribution is maintained To accomplish this, the network uses a variety of distribution methods that allow information collected and developed as part of the program to be widely available to park staff and the public. 9.3.1 Data Distribution Mechanisms Network staff will coordinate with park staffs to help prevent unnecessary duplication of metadata and data that are posted to internal and external clearinghouses. This will help preserve storage space on the clearinghouse server(s) and prevent confusion among users about duplicate or similar data sets. For distinct but similar data sets the metadata record must include text explaining the differences. The primary distribution of the network’s inventory and monitoring data will occur on the internet. This approach makes data and information available to a broad community of users and does not require a local system to receive and process multiple data requests. As part of the NPS I&M Program, the following web-based applications and repositories (Table 9.1) have been developed to store park natural resource information:
• NatureBib–a master web database housing natural resource bibliographic citations for
I&M Program parks (NatureBib web site)
Ch 9 • Data Distribution

Ch 9 • Data Distribution
66 • Appendix VII: Data and Information Management Plan
• NPSpecies–a master web-based database to store, manage and disseminate scientific information on the biodiversity of all organisms in all National Park units (NPSpecies web site)
• Biodiversity Data Store–a digital archive of document, GIS data set and non-GIS data set
files that document the presence/absence, distribution and/or abundance of any taxa in National Park Service units ( Biodiversity Service Center web site)
• Natural Resource and GIS Metadata and Data Store-online repository for metadata and
associated data products. NR/GIS Metadata System is a component of the Natural Resource and GIS Data Store (NPS NR-GIS Metadata and Data Store web site prototype).
• GRYN Website–provides detailed information about the I&M network and its activities.
Metadata, data sets, and related products such as summary reports for all network-funded inventory and monitoring products will be available via the web site. Park-funded and non-NPS-sourced materials related to the vital signs monitoring program will be linked via the network website where possible.
Table 9.1. Online Database Applications and Related Data Types.
Web Application Name Data types available at site NPSpecies Data on Park Biodiversity (species
information) NatureBib Park Related Scientific Citations Biodiversity Data Store The raw or processed data and products
associated with Inventory and Monitoring projects that are stored in NPSpecies.
NR-GIS Metadata and Data Store
Metadata and GIS data sets with no biological component
GRYN Website Reports and metadata for all Inventory and Monitoring Data produced by the network.
Currently, the NR-GIS Metadata and Data Store and the Biodiversity Data Store are under development. Until procedures and further guidance become available for the use of these two repositories, the network may also disseminate data via the network website. When both Service-wide repositories are completely operational, the network will upload all applicable data and information to each of those sites as needed. Storing network metadata and data sets in the data stores listed above enables searching via the integrated metadata and image management system and search gateway called NPS Focus. NPSFocus is a Digital Library and Research Station that complies with an international standard protocol (ISO 23950:Z39.50 (http://www.loc.gov/z3950/agency/)) for computer-to-computer information retrieval. This makes NPSFocus a compliant node with the National Spatial Data Infrastructure (NSDI). The system is under development using Blue Angel Enterprise software for metadata management and the LizardTech© Express Server

Vital Signs Monitoring Plan • 67
for image management. One stop searching is currently available for ten NPS and two non-NPS databases in the NPS Focus prototype. NPSFocus is an Intranet version only, and a future public version is planned. 9.4 Data Classification: protected vs. public All data and associated information resulting from I&M activities must be assessed by network staff to identify sensitive content so that the appropriate level of access can be granted to potential users of the data. This includes, but is not limited to, materials such as reports, metadata, raw and processed spatial and non-spatial data, and maps. The Federal Geographic Data Committee’s Homeland Security Working Group has published an interim version of the “Guidelines for Providing Appropriate Access to Geospatial Data in Response to Security Concerns.” The Guidelines include procedures to help identify sensitive information content in geospatial data sets and helps data producers provide appropriate access to the data while protecting sensitive contents. The Freedom of Information Act, 5 U.S.C. § 552, referred to as FOIA, stipulates that the United States Government, including the National Park Service, must provide access to data and information of interest to the public. FOIA, as amended in 1996 to provide guidance for electronic information distribution, applies to records that are owned or controlled by a federal agency, regardless of whether or not the federal government created the records. FOIA establishes a right for any person to access federal agency records that are not protected from disclosure by exemptions. Under the terms of FOIA, agencies must make non-protected records available for inspection and copying in public reading rooms and/or online. Protected records are provided in response to requests through a specified process. The Department of the Interior’s revised FOIA regulations and the Department’s Freedom of Information Act Handbook can be accessed at http://www.doi.gov/foia/ for further information. The Northeast Coastal and Barrier Network prepared a summary discussion of FOIA issues related to the Inventory and Monitoring Program and its networks (Appendix C) In some cases, public access to data can be restricted. Under the NPS Director’s Order #66 (draft), and four resource confidentiality laws (the National Parks Omnibus Management Act (16 U.S.C. 5937), the National Historic Preservation Act (16 U.S.C. 470w-3), the Federal Cave Resources Protection Act (16 U.S.C. 4304) and the Archaeological Resources Protection Act (16 U.S.C. 470hh)), the National Park Service is directed to protect information about the nature and location of sensitive park resources. Through these regulations, information that could result in harm to natural resources can be classified as ‘protected’ or ‘sensitive’ and withheld from public release (National Parks Omnibus Management Act (NPOMA)). The following guidance for determining whether information should be protected is suggested in the draft Director’s Order #66 (the final guidance may be contained in the Reference Manual 66):
• Has harm, theft, or destruction occurred to a similar resource on federal, state, or private
lands?
Ch 9 • Data Distribution

Ch 9 • Data Distribution
68 • Appendix VII: Data and Information Management Plan
• Has harm, theft, or destruction occurred to other types of resources of similar commercial value, cultural importance, rarity, or threatened or endangered status on federal, state, or private lands?
• Is information about locations of the park resource in the park specific enough so that the park resource is likely to be found at these locations at predictable times now or in the future?
• Would information about the nature of the park resource that is otherwise not of concern permit determining locations of the resource if the information were available in conjunction with other specific types or classes of information?
• Even where relatively out-dated, is there information that would reveal locations or characteristics of the park resource such that the information could be used to find the park resource as it exists now or is likely to exist in the future?
• Does NPS have the capacity to protect the park resource if the public knows its specific location?
Natural Resource information that is sensitive or protected requires the:
• Identification of potentially sensitive resources • Compilation of all records relating to those resources • Determination of what data must not be released to the public • Management and archival of those records to prevent their unintentional release
Classification of sensitive I&M data will be the responsibility of the GRYN staff, the park superintendents, and investigators working on individual projects. network staff will classify sensitive data on a case by case, project by project, basis. They will work closely with investigators for each project to ensure that potentially sensitive park resources are identified, and that information about these resources is tracked throughout the project. The network staff is also responsible for communicating all potentially sensitive resources to project leaders and principal investigator(s) working on each project. The investigators, whether network staff or partners, will develop procedures to flag all potentially sensitive resources in all products that come from the project, including documents, maps, images, databases, and metadata. When submitting products and results, investigators should specifically identify all records and other references pertaining to potentially sensitive resources. One method for flagging sensitive information is designing fields in database objects and using data entry procedures for tracking sensitive records. Partners should not release any information in a public forum before consulting with network staff to ensure that the information is not classified as sensitive or protected. For example, information may be withheld regarding the nature and/or specific locations of the following resources recognized as ‘sensitive’ by the National Park Service. According to NPOMA, if the NPS determines that disclosure of information would be harmful, information may be withheld concerning the nature and specific location of: • Endangered, threatened, rare or commercially valuable National Park System Resources
(species and habitats) • Mineral or paleontological objects

Vital Signs Monitoring Plan • 69
• Objects of cultural patrimony • Significant caves Information already in the public domain can, in general, be released to the public. For example, the media reports in detail the return of condors to the Grand Canyon. If an individual requests site-specific information about where the condors have been seen, general description of geographic areas can be released. However, the locations of specific nest sites cannot be released. 9.5 Access Restrictions on Sensitive Data Network personnel are responsible for managing access to sensitive data handled by the program. All potentially sensitive park resources will be identified and investigators working on network projects will be informed that: • All data and associated information must be made available for review by network staff
prior to release in any format • Any information classified as protected should not be released in any format except as
approved in advance by the National Park Service For each project dealing with known or potentially sensitive resources, the network staff provides a complete list of all references to potentially sensitive park resources in each park to the park superintendent for review. Each superintendent then determines which information should be protected. The network coordinator, project leader, or data manager identifies all potentially sensitive park resources to the principal investigator for each project. Reciprocally, the principal investigators for each project must identify any known references to potentially sensitive park resources. When preparing to upload information into any network database, the network staff ensures that all protected information is properly identified and marked. The network staff must ensure that all references to protected information are removed or obscured in reports, publications, maps, and other public material. Network staff will: • remove any sensitive information from public versions of documents or other media • isolate sensitive from non-sensitive data • determine the appropriate measures for withholding sensitive data The main distribution applications and repositories developed by the I&M Program, (see section 9.3.1) are maintained on both secure and public servers, and all records that are marked ‘sensitive’ during uploading will be available only to appropriate NPS personnel on the secure servers. Procedures for assigning a sensitivity level to specific records when uploading to both the NPSpecies and NatureBib databases are discussed in the GRYN NPSpecies and the NatureBib Data User Manuals (unfinished appendices) as well as at the following websites: • http://science.nature.nps.gov/im/apps/npspp/index.htm
Ch 9 • Data Distribution

Ch 9 • Data Distribution
70 • Appendix VII: Data and Information Management Plan
5. http://www.nature.nps.gov/nrbib/index.htm Thus, access to data on sensitive park resources can be limited to network staff or project partners. However, limits to how these data are subsequently released must also be clearly defined. It is crucial that the network staff institute quality control and quality assurance measures to ensure that the person doing the uploading of records into the online applications is familiar with the procedures for identifying and entering protected information. 9.6 NPS Inventory and Monitoring Data Availability According to FOIA (specifically the 1996 amendments), all information routinely requested must be made available to the public via reading rooms and/or the internet. Network project data will be available to the public at one or more internet locations: • The GRYN web site • Public servers for the NPSpecies and NatureBib databases • Public server for the Biodiversity Data Store • Public server for the NR/GIS Data Store The network will regularly provide updated information about inventories and monitoring projects, including annual reports and detailed project reports through the network web site. Information on species in the National Parks, including all records generated through the Inventory and Monitoring Program, will be stored and accessible in the NPSpecies database. Bibliographic citations that refer to National Park System natural resources will stored and accessible through the NatureBib database. Documents, maps, and data sets containing resource information from all sources, and their associated metadata, will be accessible through the Biodiversity Data Store and/or NR/GIS Data Store. Each of these databases/repositories offer both a secure server and a public server, and the public can access all information in these databases except those records marked as ‘sensitive.’ Both raw and processed data resulting from the network’s inventory and monitoring projects will be fully documented with FGDC compliant metadata and made available to the public via the network’s website. The metadata for all data sets will be made accessible to the public as soon as they are provided and verified by the principal investigator(s) or project leaders. Data sets for short-term inventory studies will be provided to the public via the GRYN website not more than two years following the year the data were collected or following publication of the investigator’s results (whichever comes first). Data sets for long-term monitoring studies will be provided to the public when the data is sufficient to support trend analyses reported by the network. The network’s Vital Signs Monitoring Plan and the network web site contain further scheduling details. Before data are posted, a park representative and the investigator or project leader will verify the final data set and metadata if necessary. GRYN staff will notify investigators prior to making data sets available to the public. This will allow each investigator the opportunity to submit a written request to postpone or further restrict access to the data set by the public. Network staff will review the request to determine whether a data set can or should remain restricted to public access.

Vital Signs Monitoring Plan • 71
Geospatial data records from GIS are a priority electronic records format identified by the US National Archives and Records Administration (NARA) and by partner agencies as part of the Electronic Records Management (ERM) initiative, one of 24 E-Gov initiatives under the President's Management Agenda. A major goal of this initiative is to provide the tools for agencies to access electronic records for as long as required and to transfer permanent electronic records to NARA for preservation and future use by government and citizens. The requirements in this guidance are effective April 15, 2004. The network will incorporate these guidelines into data management operations. http://www.archives.gov/records-mgmt/initiatives/digital-geospatial-data-records.html 9.7 Data Access and Request Procedures Online Access The network does not intend to track downloads of data or reports from the network website or other data stores like the Biodiversity Data Store and NR GIS and Metadata Data Store. The network web site will contain a statement about use and appropriate citation of data in resulting publications and a request that users acknowledge the National Park Service Inventory and Monitoring Program. Offline Requests For data and information not available online, non-NPS individuals or entities can submit a written request to the network, preferably by email. Requests should include the name of the person or entity, their contact information, the export file format and transfer method, the date delivery is requested, and a description of the content and/or geographic extent of the data. An optional description can be included about the expected use of the data. The purpose of gathering this information in writing is to understand the request for complete and appropriate response by the network, and to document interest in the program and its results by maintaining a list of those who receive network data and products. In many cases the network data manager will follow up by phone with the requesting individual to clarify the information once the written request is received. 9.8 Data Quality Feedback The GRYN will accept feedback from NPS staff, cooperators and the public on data and information gathered as part of the network’s I&M Program. The purpose is to identify, communicate, and resolve errors or concerns about data content and quality. Users can notify network staff by email, phone, or in person. Network staff will investigate and resolve issues and concerns brought to their attention and follow up with the user and other affected individuals to communicate the resolution. Chapter Credits This chapter was adapted from material prepared by Sara Stevens (CUPN) and edited by Gary Entsminger (Partner).
Ch 9 • Data Distribution

Ch10 • Data Maintenance, Storage, and Archiving
72 • Appendix VII: Data and Information Management Plan
10. Data Maintenance, Storage and Archiving This chapter describes procedures for the long-term management and maintenance of digital data, documents, and objects that result from GRYN projects and activities. The overall goals of these procedures are: • to preserve information over time • to ensure that information can be easily obtained, shared, and properly interpreted by a
broad range of users. Effective long-term data maintenance is inseparable from proper data documentation, and an essential part of any archive is accompanying explanatory materials (Olson and McCord 1998). This chapter will refer to, and in some cases elaborate on, metadata standards and data set documentation procedures that are more fully explained in Chapter VII (Data Documentation) of this plan. 10.1 Digital Data Maintenance In general, digital data maintained over the long term will be one of two types: short-term data sets for which data collection and modification have been completed (i.e. inventory projects), and long-term monitoring data sets for which data acquisition and entry will continue indefinitely. Technological obsolescence is a significant cause of information loss, and data can quickly become inaccessible to users if stored in out-of-date software programs, on outmoded media, or in legacy data formats. Maintaining digital files involves managing for the dynamic infrastructure of associated hardware, software, file formats, and storage media. Major changes in hardware can be expected every 1-2 years, and in software every 1-5 years (Vogt-O’Connor 2000). As software and hardware evolve, data sets must be consistently migrated to new platforms, or they must be saved in formats that are independent of specific platforms or software (e.g., ASCII delimited files). Data sets for which data entry or updates are still occurring will be stored in a structured file system for active projects on the GRYN server. A file system for completed projects will hold data and information resources that are no longer expected to change. 10.1.1 Short-term data sets For finalized short-term data sets created or managed by GRYN, a set of American Standard Code for Information Interchange (ASCII) tab-delimited or comma-delimited text files will be created for each data table comprising the data set. These files will be accompanied by a readme.txt file that explains the contents of each file, file relationships, field definitions, and useful queries in sql format. Because delimited ASCII files can be imported by virtually all known database and spreadsheet software applications, the ASCII files serve as a format independent, cross-platform archive of the native version of the data set. All finalized files will be stored on the GRYN server in the appropriate project’s archive folder. In addition to creating ASCII files, the network will update data sets stored in previous versions of Microsoft® Access, so that no data set is more than two versions behind the

Vital Signs Monitoring Plan • 73
current version of Microsoft® Access used by GRYN. To the extent possible, preexisting functionality of data entry forms and reports will be maintained. However, the priority will be to ensure basic table and relationship integrity. 10.1.2 Long-term monitoring data sets Long-term monitoring data sets require regular updates and conversion to current database formats. All active or long-term databases will conform to the current NPS and I&M software version standards. Monitoring projects have variable long-term data archiving requirements that include those listed here. • Original data sets are normally stored in perpetuity as a basis for processing and deriving
new values. This can be accomplished both by preserving values in original data fields throughout the life of a database object, and by archiving complete database objects.
• Substantial changes in database design or content due to evolving monitoring protocols may require complete data sets to be archived, with new data stored in different database structures and/or formats. If necessary for comparing new and legacy data sets, a process to relate between the two should be developed as part of the transition.
• Some project methods require preservation of interim data sets (data “milestones”) over the long term.
Data sets or subsets destined for long-term archiving will be saved, whenever possible, in their native formats in addition to ASCII delimited text files. Data archiving requirements for ongoing projects will be spelled out in the data management SOPs for each monitoring project. 10.2 Quality control for converted data All ASCII files created from databases will undergo quality control activities or functions to ensure that the number of records and fields correspond to the source data set, and that conversion has not created errors or data loss. A second reviewer (preferably a program scientist) will evaluate the ASCII files and documentation to verify that tables, fields, and object relationships are adequately explained and documented for users not familiar with the program. Databases that are converted from one version of database software to an upgraded version will require additional QC, particularly when the database applications are actively used for data entry or analysis. Forms, queries, reports, and data entry will be thoroughly tested during upgrades.
Version control Documentation of version updates and associated details will be part of the archive metadata record, and revision information and history will be included in tables within the database files. File names of the archived revisions will clearly indicate the revision number or date.
Spatial data Spatial data sets are maintained in formats that remain compatible with the current version of ArcGIS™. The network will work towards converting existing GIS formats to the personal
Ch10 • Data Maintenance, Storage, and Archiving

Ch10 • Data Maintenance, Storage, and Archiving
74 • Appendix VII: Data and Information Management Plan
geodatabase format. The network will investigate using the Spatial Data Transfer Standard (SDTS) to archive GIS data in a software or platform-independent format. Both uncorrected and corrected GPS data (e.g., Trimble .ssf and .cor files) will be archived in their native format in addition to the corresponding GIS files that are created. Remote sensing data, including satellite images, are stored in their native format and in processed formats for use in image processing and GIS applications. Digital Still Images The network expects that most images acquired with handheld cameras will be still images in digital Joint Photographic Experts Group (JPEG) format. Network staff and cooperators are encouraged to use digital camera resolution and quality settings that produce images with adequate quality at a reasonable file size. Project crew members normally collect more images than necessary for documenting a project. The project leader should select and submit only those images necessary to complement the other project data. The data manager will review images for quality and file size and may process the images to meet specifications. Digital images are stored and named according to the instructions in each monitoring protocol. 10.3 Storage and Archiving Procedures for Digital Data Digital data need to be stored in a repository that ensures both security and ready access to the data in perpetuity. GRYN will maintain a RAID (redundant array of independent disks) server for data storage, combined with a schedule of full, incremental, and differential backups using Network Attached Storage (NAS) devices for on-site backup and magnetic tape for off-site backup. 10.4 Directory structure for individual projects The organization and naming of folders and files should be concise, descriptive, and clear to users unfamiliar with a specific project. Because the amount and type of material varies with each project, a high level standardized folder structure organizes several of the following common project elements: • administrative documents such as agreements, correspondence, research permits • programmatic documents including protocols, procedures, supporting documents • interim data sets or “milestones” • data sets distinguished by status: original, in-work, published, and archived • conceptual or statistical models used for data interpretation • final reports • ‘readme’ files - includes an explanation of directory contents, project metadata (including
a Dataset Catalog report), and version documentation.
Files are stored in a hierarchical folder structure that provides context to the information system. Folder structures are kept as flat as possible while providing for adequate classification. The network uses the folder and file naming and version tracking conventions in Appendix B. Once final data and reports have been submitted, approved, and archived, draft and intermediate products should be reviewed and deleted if appropriate.

Vital Signs Monitoring Plan • 75
10.5 Backup procedures for digital data The risk of data loss exists from a variety of sources including catastrophic events (e.g., fire, flood), user error, hardware failure, software failure or corruption, and security breaches or vandalism. Network staff perform regular backups of data and arrange for off-site storage of backup sets to safeguard data resources. Data stored on the GRYN server receives weekly normal backups and nightly differential backups using a Network Attached Storage device. A set of four revolving quarterly full backups on magnetic tape are stored off-site to preserve all digital information resources for one full year. All backups are performed and monitored by the network data manager. The data manager tests backup files at random by performing intermittent restore operations. All backups are run with “verify,” which compares source files against the backup files and detects any discrepancy in file size or other errors. Magnetic tape media is replaced every two years to prevent data loss due to deterioration. Backups of data that reside on the desktop computers of network staff are the responsibility of each staff member. Network staff is reminded regularly to copy working files onto the network server or local backup device. The data manager works with network staff and cooperators to develop and perform regular backups of network data resources.
10.6 Data and network security Access to files on the network server requires successful completion of all required security awareness and IT training for both I&M staff and network partners. Folders containing completed or protected project data may be designated as read-only for certain staff, as determined by the network coordinator. This helps ensure that changes to files are authorized by appropriate staff and communicated to the data manager when updates to associated documentation or other activities must accompany the change. It also deters inadvertent copying, moving, or deleting of files and folders. 10.7 Storage and Archiving Procedures For Documents and Physical Objects This section applies to documents such as final reports prepared by staff or contractors, program administrative documents, contracts and agreements, memoranda of agreement, and other documents related to GRYN administration, activities, and projects. This section also applies to physical items such as natural history specimens, photographs, and audio tapes. In most instances these documents and objects are essential companions to the digital data described in the previous sections. Direction for managing many of these materials (as well as digital materials) is provided in NPS Director’s Order 19: Records Management (2001) and its appendix, NPS Records Disposition Schedule (NPS-19 Appendix B, revised 5-2003). NPS-19 states that all records of natural and cultural resources and their management are considered mission-critical records, that is, necessary for fulfillment of the NPS mission. NPS-19 further states:
Mission critical records are permanent records that will eventually become archival records. They should receive the highest priority in records management activities and resources and should receive archival care as soon as practical in the life of the record.
Ch10 • Data Maintenance, Storage, and Archiving

Ch10 • Data Maintenance, Storage, and Archiving
76 • Appendix VII: Data and Information Management Plan
Section N of NPS-19 Appendix B, which provides guidelines on natural resource-related records (including, specifically, the results of Inventory and Monitoring programs), indicates that all natural resource records are considered “permanent,” that is, are to be transferred to the National Archives when 30 years old. It also indicates that non-archival copies of natural resource-related materials are “...potentially important for the ongoing management of NPS resources” and should not, in any instance, be destroyed. 10.7.1 Documents All paper documents managed or produced by the GRYN will be housed in one of three locations: 1. GRYN central files, Bozeman, MT. Central files contain project files, administrative documents, and non-record copies of documents that are archived at an off-site facility (see item 2, below). Examples include: meeting minutes, correspondence, memoranda of understanding, contracts and agreements, research permits, interim and selected final reports produced by the program or under its auspices. GRYN will use acid-free paper and folders for all permanent records in the central files. In addition to maintaining these paper records, GRYN will maintain electronic versions, when possible, on the GRYN server. The central files are maintained by the GRYN administrative clerk, under the guidance of the data manager and network coordinator. 2. Western Archeological and Conservation Center (WACC) [repository subject to change]. WACC provides temperature and humidity-controlled facilities, a professional archival staff, and meets all museum standards set by NPS. This repository will be used for original documents and associated materials produced by the network (e.g., photographs, field notes, permits) that are a high priority to maintain under archival conditions. Examples include: original inventory reports and accompanying slides and maps; original vegetation mapping reports; GRYN Phase 1, 2 and 3 reports. Copies of these reports will be maintained in the GRYN central files, and all will have an electronic equivalent (e.g., PDF) for distribution or reproduction. For all materials submitted to WACC, GRYN will provide essential cataloging information such as the scope of content, project purpose, and range of years, to facilitate ANCS+ record creation and accession. GRYN will also ensure that materials are presented using archival-quality materials (acid-free paper and folders, polypropylene or polyethylene slide pages). Many GRYN reports and documents encompass data from multiple parks, which makes it challenging to accession archival copies into a specific network park museum. In these instances WACC will prepare associated ANCS+ records that reference all parks included in a report or document, and will prepare finding aids to help potential users locate the materials. 3. Network parks’ central files and/or museums. High-quality copies of park-related documents resulting from GRYN projects, along with electronic versions, will be provided to park resource management staff. Parks may choose to accession these materials into their museums, incorporate them into their central files, or

Vital Signs Monitoring Plan • 77
house them in their resource management library. GRYN will not directly manage documents at the park level but will work with park resource managers and curators to bridge network and park level document management requirements. 10.7.2 Specimens The network assists with planning for monitoring projects that includes budgeting for specimen preparation and records processing and cataloging. Specimens collected under the auspices of GRYN will be provided to the network park in which they were collected for curation, or to a repository approved by a park (where the specimens are considered on loan). GRYN will provide park curators with necessary data for cataloging each specimen. This data will be in comma-delimited format (.csv) for automated uploading into ANCS+. Data provided to non-NPS curators will be in an appropriate format for each institution. 10.7.3 Photographs Due to concern among some archivists that the accelerating rate of technological change threatens documentary heritage in the information age (Cox 2000), GRYN accepts and processes 35mm slides (preferably Kodachrome or Ektachrome), which have a proven long-term stability (Wilhelm and Brower 1993), and 4x6 color prints. Original photographs are a high priority for placing in archival storage conditions. Slides are labeled using indelible pigment ink, or using laser-printed archival-quality slide labels. Slide labels will include: a unique ID, project name, photographer name, photo date, a brief identification of contents (e.g., species name, plot ID), and geographic location (UTM coordinates or a description). All slides are stored in polypropylene slide sleeves at the GRYN office until transferred to WACC. In addition, all slides are scanned and saved digitally as Tagged Image File Format (TIFF) files, and these are used as the primary means of distributing and reproducing the images. Photographs are stored in individual polypropylene sleeves and within archival boxes. Each photo is labeled on the back, using archival-quality labels that are either laser-printed or hand-labeled with the same information elements required for slides. If a contractor is submitting photographs, corresponding TIFF files must also be submitted. Every image, regardless of format, has an entry into the GRYN Photo Database where attributes such as electronic file name, keywords, project, photo description, photographer, date, and location are catalogued. All digital image files and the associated photo database are stored on the GRYN server. 10.8 Role of curators in storage and archiving procedures Curators for parks within GRYN and from other NPS collection facilities are a valuable source of expertise, advice, and guidance on archiving and curatorial issues, and they have a role in almost every project undertaken by the network. Project leaders should involve park curators when projects are in the planning stage to ensure that all aspects of specimen curation and document archiving are considered, and that any associated expenses are included in project budgets. Chapter Credits This chapter was adapted from material prepared by Margaret Beer (NCPN).
Ch10 • Data Maintenance, Storage, and Archiving

Change Procedures and Revision History Log
78 • Appendix VII: Data and Information Management Plan
Change Procedures and Revision History Log
This following table lists all edits and amendments to this document since the original publication date. Information entered in the log must be complete and concise. Users of this document should promptly notify the GRYN data manager and/or program coordinator about recommended and required changes. The GRYN data manager must review and incorporate all changes, complete the revision history log, and change the date and version number on the title page and in the footer of the document file. Write down edits and versioning in the Revision History Log table for the GRYN Data and Information Management Plan. Version numbers increase incrementally by hundredths (e.g. version 1.01, version 1.02, …etc) for minor changes. Major revisions should be designated with the next whole number (e.g., version 2.0, 3.0, 4.0 …). Post new versions on the GRYN web site and communicate the update to all known individuals with a previous version of the Plan.
Revision History Log: Original Publication Name, Version and Date: Data and Information Management Plan - Greater Yellowstone Inventory and Monitoring Network, Version 1.0, September 30, 2005 Date and
number of Previous Version
Date of Revision
Author(s) of Revision (with title
and affiliation) Location in Document and Concise
Description of Revision Reason for Change
Add rows as needed for each change or set of changes tied to an updated version number
Vital Signs Monitoring Plan • 79
References Angel, D. 2004. Sonoran Desert Network Data Management Plan, National Park Service. Boetsch, J.R., B. Christoe, and R.E. Holmes. 2004. Draft data management plan for the North Coast and Cascades Network Inventory and Monitoring Program. National Park Service. Port Angeles, WA. Brunt, J. W. 2000. Data management principles, implementation and administration. Pp. 25-47 in Michener, William K., and James W. Brunt (eds), 2000, Ecological Data: Design, Management and Processing, Methods in Ecology Series, Malden, MA: Blackwell Science Ltd. Chapal, S. E., and Edwards, D. 1994. Automated smoothing techniques for visualization and quality control of long-term environmental data. Pp. 141-158 in Environmental Information Management and Analysis: Ecosystem to Global Scales edited by W. K. Michener, J.W. Brunt, and S.G. Stafford. London: Taylor & Francis Ltd. Cox, R. J. 2000. Searching for authority: archivists and electronic records in the New World at the fin-de-siècle. First Monday 5:1. <http://firstmonday.org/issues/issue5_1/cox/index.html>. Accessed 2005 September 12. Edwards, D. 2000. Data quality assurance. Pp. 70-91 in Ecological Data: Design, Management and Processing, Methods in Ecology Series edited by W. K. Michener and J.W. Brunt. Malden, MA: Blackwell Science Ltd. Environmental Systems Research Institute© ArcCatalog™ (Build 800). 2002. Help Menu. Federal Geographic Data Committee. USGS, 590 National Center, Reston, VA 20192 http://www.fgdc.gov/metadata/metadata.html. Accessed 2005 September 12. Gregson, J. 2000. Natural Resources Data and Information Systems Handbook Outline. USDI National Park Service Inventory and Monitoring Program. Unpublished. Gregson, J. 2002. Draft Natural Resource Data and Information Systems Management Handbook Chapter 2. USDI National Park Service Inventory and Monitoring Program. <http://www1.nrintra.nps.gov/im/datamgmt/nrdismhb.htm>. Accessed 2004 August 29. International Organization for Standardization. < http://www.iso.org>. Accessed 2005 September 12. McGinnis, J. and Wickwire, D. 1998 Draft. Spatial Data Management, A Shared Perspective. USDI Bureau of Land Management and USDA Forest Service. <http://ims.reo.gov/website/swop/html/swop_slide_show/swop_sdm_whitepaper/sdm.htm>. Accessed 2005 September 29.
References

References
80 • Appendix VII: Data and Information Management Plan
Miller, A. B. 2001. Managing Data to Bridge Boundaries. Pp. 316-320 in Crossing Boundaries in Park Management: Proceedings of the 11th Conference on Research and Resource Management in Parks and on Public Lands, edited by David Harmon. Hancock, Michigan: The George Wright Society Office of Management and Budget. Circular A-110 <http://www.whitehouse.gov/omb/circulars/a110/a110.html>. Accessed 2005 September 12. Olson, R.J. and McCord, R.A. 1998. Data Archival. pp 53-57 in Data and information management in the ecological sciences: a resource guide Michener, W.K., J.H. Porter, and S.G. Stafford. LTER Network Office, University of New Mexico. Albuquerque, NM. Palmer, C. J. 2003. Approaches to Quality Assurance and Information Management for Regional Ecological Monitoring Programs. Pp. 211-225 in Monitoring Ecosystem: Interdisciplinary Approaches for Evaluating Ecoregional Initiatives edited by D. E. Busch and J.C.Trexler. Washington, DC.: Island Press Palmer, C. J. and E. B. Landis. 2002 Draft. Lake Mead National Recreational Area Resource Management Division: Quality System Management Plan for Environmental Data Collection Projects. Powell, D. S. 2000. A “White Paper” for the Washington Office Ecosystem Management Corporate Team & Interregional Ecosystem Management Coordinating Group, United States Department of Agriculture Forest Service, Washington, D.C. Smith, S. and Truitt, B. 2004. Klamath National Parks Network Data Mining Protocol, Klamath Network, National Park Service. Tessler, S. and Gregson J. 1997. Draft Data Management Protocol. USDI National Park Service Inventory and Monitoring Program. <http://www1.nrintra.nps.gov/im/dmproto/joe40001.htm>. Accessed 2004 August 21. National Water Quality Monitoring Council < http://water.usgs.gov/wicp/acwi/monitoring/>. Accessed 2005 September 12. United States Government Accountability Office. August 2005. DATA MINING - Agencies Have Taken Key Steps to Protect Privacy in Selected Efforts, but Significant Compliance Issues Remain. http://www.gao.gov/new.items/d05866.pdf. Accessed 2005 September 9. United States Government Accountability Office. May 2004. DATA MINING – Federal Efforts Cover a Wide Range of Uses. http://www.gao.gov/new.items/d04548.pdf. Accessed 2005 September 9. US Environmental Protection Agency. 2003. Guidance for geospatial data quality assurance project plans. EPA QA/G-5G. EPA/240/R-03/003. Washington, DC: Office of Environmental Information.
Vital Signs Monitoring Plan • 81
US Environmental Protection Agency. STORET. < http://www.epa.gov/storet/>. Accessed 2005 September 12. USDA Forest Service Forest. 2004. Forest Service Natural Resource Applications Geodatabase Design Tactical Plan. Unpublished. USDA Forest Service. 2004. Resource Information Management Roles and Responsibilities, Intermountain Region, Unpublished. USDA. Integrated Taxonomic Information System http://www.itis.usda.gov/. Accessed 2005 September 12. USGS National Biological Information Infrastructure. < http://www.nbii.gov/>. Accessed 2005 September 12. USGS National Hydrography Dataset. < http://nhd.usgs.gov/>. Accessed 2005 September 12. USDI National Park Service. 2000. Greater Yellowstone Network Vertebrate and Vascular Plant Inventory Study Plan. National Park Service, Washington D.C. USDI National Park Service. 2003. NPS records disposition schedule. NPS-19, Appendix B – Revised, 5-03. USDI National Park Service. NPS Natural Resource Challenge. < http://www.nature.nps.gov/challenge/>. Accessed 2005 September 12. USDI National Park Service. The IT Manager’s Playbook – Guidelines and Standards for NPS IT Policies. National Park Service, Washington, D.C. USDI National Park Service. Vital Signs Water Quality Data Management and Archiving. < http://www.nature.nps.gov/water/infoanddata/>. Accessed 2005 September 12. USDI National Park Service. 2002. Director’s Order #11B: Ensuring quality of information disseminated by the National Park Service. National Park Service, Washington, D.C. USDI National Park Service. 2005. Greater Yellowstone Inventory and Monitoring Network Vital Signs Monitoring Plan. National Park Service, Bozeman, MT. Vogt-O’Connor, D. 1997. Caring for photographs: general guidelines. National Park Service Conserve O Gram 14:4. NPS Museum Management Program, Washington, DC. Vogt-O’Connor, D. 2000. Planning digital projects for preservation and access. National Park Service Conserve O Gram 14:4. NPS Museum Management Program, Washington, DC.
References

References
82 • Appendix VII: Data and Information Management Plan
Wilhelm, H. and C. Brower. 1993. The permanence and care of color photographs: traditional and digital color prints, color negatives, slides, and motion pictures. Preservation Publishing Company: Grinnel, IA.

Vital Signs Monitoring Plan • vii
Appendix A: Roles, Responsibilities, and Awareness Levels for Data Management This table is an expanded version of Table 2.2 – Summary of Roles and Responsibilities in the Data and Information Management Plan. This representative list of data stewardship roles, responsibilities, and awareness levels can be applied and extended by anyone involved with the NPS Greater Yellowstone Inventory & Monitoring Network. For example, the listed elements can help to brief and debrief project staff and crew members, and inform training plans, work plans, recruitment efforts, contract specifications, and other data management aspects of network operations.
Role Programmatic Responsibility Data Stewardship Responsibilities Recommended
Awareness Level
Project Crew Member
Collect, record, and verify data
Obtain training in data management for the project.
Read and follow project protocols, study plans, and relevant NPS guidance.
Communicate with Crew Leader, Project Leader, and Data Manager.
Record and verify observed or measured data values.
Schedule and perform regular data transfer and backup.
Review, verify, and correct field data.
Assist with data and procedural documentation, especially deviations from the protocol or study plan.
Aware of specific protocol and related subject(s) for the project.
Aware of related protocols and projects.
Project Crew Leader Supervise crew
Obtain training in data management for the project.
Ensure crew members receive data management training and briefings.
Conduct debriefing sessions; summarize and communicate the results to the project leader.
Read and follow all protocol, project, and relevant Network-level guidelines.
Communicate with Crew Members, Project Leader, and Data Manager.
Ensure data are regularly transferred, backed up, verified, and entered into the appropriate NPS database(s).
Assist with data and procedural documentation.
Aware of specific protocol and related subject(s) for the project.
Aware of related protocols and projects.
Aware of Network activities, NPS I&M Program generally.
Data/GIS Specialist or Technician
Process and manage data
Obtain briefings about projects and related data to understand the geospatial and technical requirements and relevance.
Communicate with other participants in the project to the extent necessary to accomplish assigned tasks.
Perform assigned level of technical data management and/or GIS activities, including data entry, data conversion, and documentation.
Work on overall data quality and stewardship with Project Leaders, Resource Specialists, and the Network Data Manager.
Aware of Network activities, NPS I&M Program generally. Aware of data management relationships between parks and the network.
Appendix A: Roles, Responsibilities, and Awareness Levels for Data Management

Appendix A: Roles, Responsibilities, and Awareness Levels for Data Management
viii • Appendix VII: Data and Information Management Plan
Role Programmatic Responsibility Data Stewardship Responsibilities Recommended
Awareness Level
Information Technology/ Systems Specialist
Provide IT/IS support
Provide and maintain an information systems and technology foundation to support data management.
Advise project participants about capabilities of hardware and software resources to support project and program objectives.
Work with Database Manager to resolve hardware and software issues relating to database functions and availability.
Aware of NPS I&M Program generally. Aware of database tools and applications used by the I&M program.
Project Leader
Oversee and direct project operations
Ensure Crew Leader receives pertinent training and briefings.
Prepare debriefing plans and materials for field crews; participate in selected debriefing sessions.
Communicate with Crew Leader, Data Manager, and I&M Network Coordinator.
Complete project documentation describing the who, what, where, when, why and how of a project.
Develop, document and implement standard procedures for field data collection and data handling.
Enact and supervise quality assurance and quality control measures for the project.
Supervise and certify all field operations, including staff training, equipment calibration, species identification, and data collection.
Supervise or perform data entry, verification and validation.
Maintain concise explanatory documentation of all deviations from standard procedures.
Ensure documentation of important details of each field data collection period.
Maintain hard copies of data forms and send original data forms to archive on a regular basis.
Work with program coordinators to identify analysis and reporting mechanisms, and to establish a schedule for regular project milestones such as data collection periods, data processing target dates, and reporting deadlines.
Produce regular summary reports and conduct periodic trend analysis of data, store the resulting reports, and make them available to users.
Act as the main point of contact concerning data content.
The project leader works closely with the data manager to:
Develop quality assurance and quality control procedures specific to project operations.
Identify training needs for staff related to data
Aware of specific protocol and related subject(s) for the project.
Aware of related protocols and projects.
Aware of Network activities, NPS I&M Program generally.
Aware of park resource information management and GIS Plans and capabilities.
Aware of other related projects external to NPS.

Vital Signs Monitoring Plan • ix
Programmatic Recommended Role Data Stewardship Responsibilities Responsibility Awareness Level
Project Leader (continued)
Oversee and direct project operations
management philosophy, database software use, quality control procedures, etc.
Coordinate changes to the field data forms and the user interface for the project database.
Fully document and maintain master data.
Identify sensitive information that requires special consideration prior to distribution.
Manage the archival process to ensure regular archival of project documentation, original field data, databases, reports and summaries, and other products from the project.
Define how project data will be transformed from raw data into meaningful information and create data summary procedures to automate and standardize this process.
Identify and prioritize legacy data for conversion; convert priority data sets to a modern format.
Increase the interpretability and accessibility of existing natural resource information.
Note: The Project Leader is often a resource specialist, in which case the associated responsibilities for data authority apply (see resource specialist role). A Project Leader without the required background to act as an authority for the data will consult with and involve the appropriate Resource Specialists.
Resource Specialist
Understand the project and make decisions about the data
Understand the objectives of the project, the resulting data, and their scientific and management relevance. Guide development of an Information Needs Assessment based on the objectives of the project. Make decisions about data with regard to validity, utility, sensitivity, and availability. Describe, publish, release, and discuss the data and associated information products.
Note: The Resource Specialist serving as a Project Leader is also responsible for the duties listed with that role.
Aware of specific protocol and related subject(s) for the project.
Aware of related protocols and projects.
Aware of Network activities, NPS I&M Program generally.
Aware of park resource information management and GIS Plans and capabilities.
Aware of other related projects external to NPS.
Appendix A: Roles, Responsibilities, and Awareness Levels for Data Management
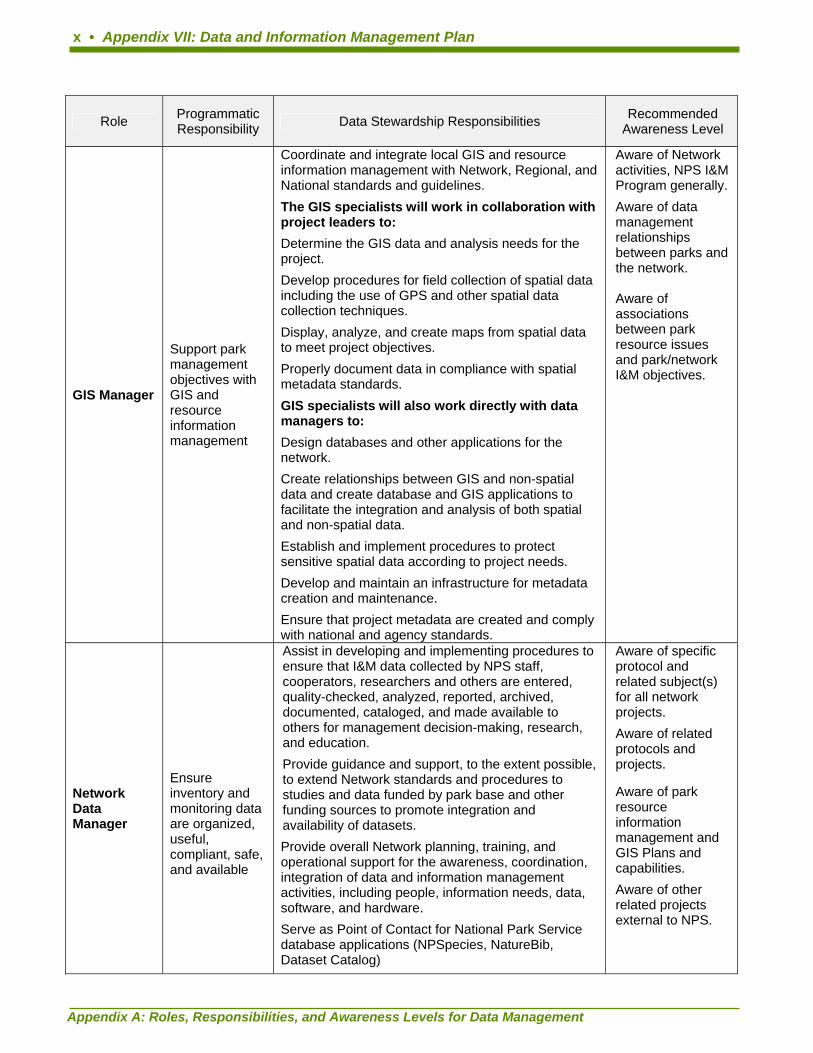
x • Appendix VII: Data and Information Management Plan
Programmatic Recommended Role Data Stewardship Responsibilities Responsibility Awareness Level
GIS Manager
Support park management objectives with GIS and resource information management
Coordinate and integrate local GIS and resource information management with Network, Regional, and National standards and guidelines.
The GIS specialists will work in collaboration with project leaders to:
Determine the GIS data and analysis needs for the project.
Develop procedures for field collection of spatial data including the use of GPS and other spatial data collection techniques.
Display, analyze, and create maps from spatial data to meet project objectives.
Properly document data in compliance with spatial metadata standards.
GIS specialists will also work directly with data managers to:
Design databases and other applications for the network.
Create relationships between GIS and non-spatial data and create database and GIS applications to facilitate the integration and analysis of both spatial and non-spatial data.
Establish and implement procedures to protect sensitive spatial data according to project needs.
Develop and maintain an infrastructure for metadata creation and maintenance.
Ensure that project metadata are created and comply with national and agency standards.
Aware of Network activities, NPS I&M Program generally.
Aware of data management relationships between parks and the network. Aware of associations between park resource issues and park/network I&M objectives.
Network Data Manager
Ensure inventory and monitoring data are organized, useful, compliant, safe, and available
Assist in developing and implementing procedures to ensure that I&M data collected by NPS staff, cooperators, researchers and others are entered, quality-checked, analyzed, reported, archived, documented, cataloged, and made available to others for management decision-making, research, and education.
Provide guidance and support, to the extent possible, to extend Network standards and procedures to studies and data funded by park base and other funding sources to promote integration and availability of datasets.
Provide overall Network planning, training, and operational support for the awareness, coordination, integration of data and information management activities, including people, information needs, data, software, and hardware.
Serve as Point of Contact for National Park Service database applications (NPSpecies, NatureBib, Dataset Catalog)
Aware of specific protocol and related subject(s) for all network projects.
Aware of related protocols and projects.
Aware of park resource information management and GIS Plans and capabilities.
Aware of other related projects external to NPS.
Appendix A: Roles, Responsibilities, and Awareness Levels for Data Management
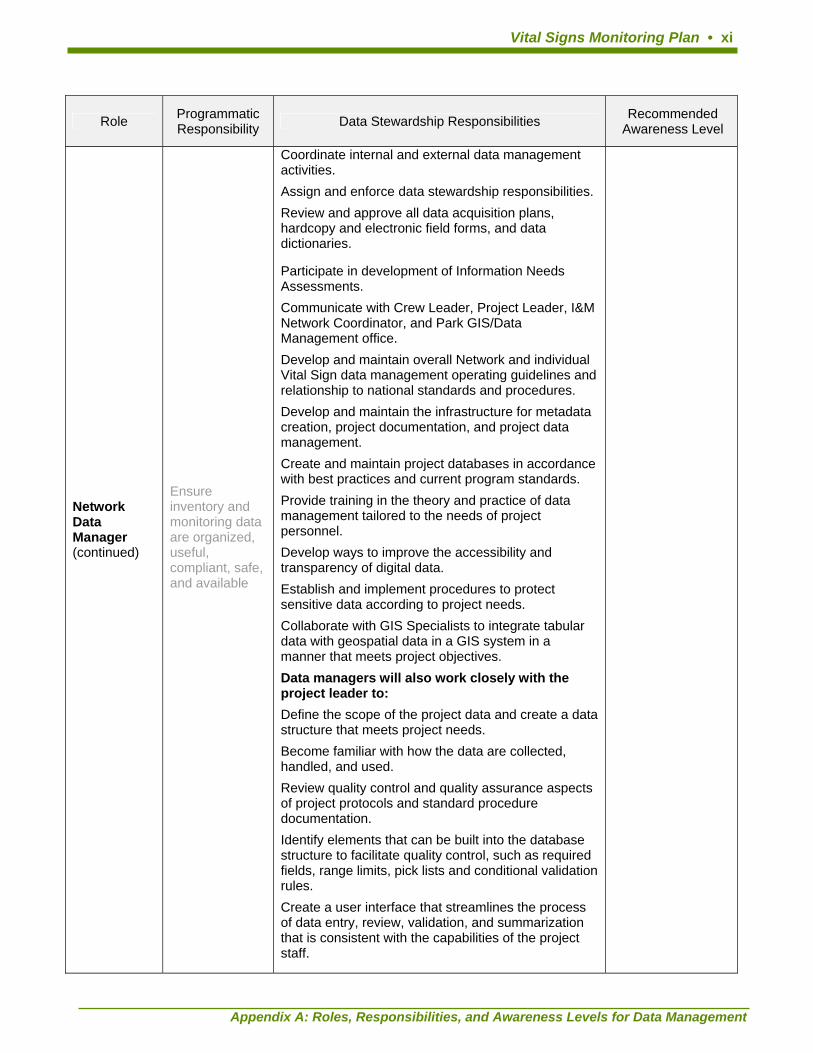
Vital Signs Monitoring Plan • xi
Programmatic Recommended Role Data Stewardship Responsibilities Responsibility Awareness Level
Network Data Manager (continued)
Ensure inventory and monitoring data are organized, useful, compliant, safe, and available
Coordinate internal and external data management activities.
Assign and enforce data stewardship responsibilities.
Review and approve all data acquisition plans, hardcopy and electronic field forms, and data dictionaries.
Participate in development of Information Needs Assessments.
Communicate with Crew Leader, Project Leader, I&M Network Coordinator, and Park GIS/Data Management office.
Develop and maintain overall Network and individual Vital Sign data management operating guidelines and relationship to national standards and procedures.
Develop and maintain the infrastructure for metadata creation, project documentation, and project data management.
Create and maintain project databases in accordance with best practices and current program standards.
Provide training in the theory and practice of data management tailored to the needs of project personnel.
Develop ways to improve the accessibility and transparency of digital data.
Establish and implement procedures to protect sensitive data according to project needs.
Collaborate with GIS Specialists to integrate tabular data with geospatial data in a GIS system in a manner that meets project objectives.
Data managers will also work closely with the project leader to:
Define the scope of the project data and create a data structure that meets project needs.
Become familiar with how the data are collected, handled, and used.
Review quality control and quality assurance aspects of project protocols and standard procedure documentation.
Identify elements that can be built into the database structure to facilitate quality control, such as required fields, range limits, pick lists and conditional validation rules.
Create a user interface that streamlines the process of data entry, review, validation, and summarization that is consistent with the capabilities of the project staff.
Appendix A: Roles, Responsibilities, and Awareness Levels for Data Management

Appendix A: Roles, Responsibilities, and Awareness Levels for Data Management
xii • Appendix VII: Data and Information Management Plan
Role Programmatic Responsibility Data Stewardship Responsibilities Recommended
Awareness Level
Network Data Manager (continued)
Ensure inventory and monitoring data are organized, useful, compliant, safe, and available
Develop automated database procedures to improve the efficiency of the data summarization and reporting process.
Make sure that project documentation is complete, complies with metadata requirements, and enhances the interpretability and longevity of the project data.
Ensure regular archival of project materials.
Inform project staff of changes and advances in data management practices.
Additional examples of the duties and responsibilities of the network data managers are listed in the I&M Program Vision and Organizational Framework document “Network Data Manager Overview of Responsibilities”.
NOTE: Data Managers with Prototype Monitoring Programs have the same basic duties and responsibilities as the network data managers but also are responsible for mentoring and training others and developing and testing new approaches to data analysis, synthesis, and reporting of monitoring results.
Database Manager
Know and use databases and applications
Install, maintain, and support specific database software applications and NPS database applications.
Work with Information Technology Specialists to resolve hardware and software issues.
Aware of NPS I&M Program generally. Aware of database tools and applications used by the I&M program. Aware of IT functions and capabilities at the park and network.
Curator
Oversee all aspects of the acquisition, documentation, preservation, and use of park collections
Know park natural resource collections
Conduct accessioning, cataloging, legal, and other documentation of collections
Manage collections databases
Recognize objects needing conservation treatment
Recommend and refer treatment to the appropriate facility
Work with Network Data Manager to acquire and process data related to natural resource collections
Aware of NPS Museology
Aware of database tools and applications used by the I&M program.
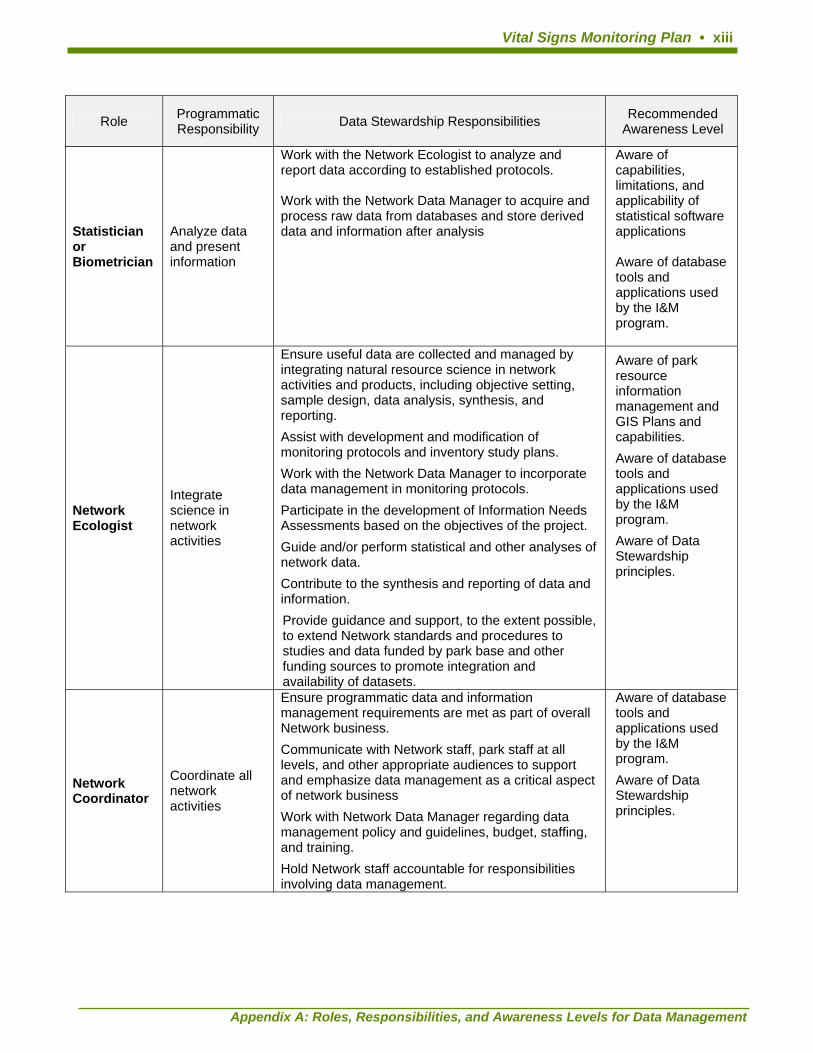
Vital Signs Monitoring Plan • xiii
Programmatic Recommended Role Data Stewardship Responsibilities Responsibility Awareness Level
Statistician or Biometrician
Analyze data and present information
Work with the Network Ecologist to analyze and report data according to established protocols. Work with the Network Data Manager to acquire and process raw data from databases and store derived data and information after analysis
Aware of capabilities, limitations, and applicability of statistical software applications Aware of database tools and applications used by the I&M program.
Network Ecologist
Integrate science in network activities
Ensure useful data are collected and managed by integrating natural resource science in network activities and products, including objective setting, sample design, data analysis, synthesis, and reporting.
Assist with development and modification of monitoring protocols and inventory study plans.
Work with the Network Data Manager to incorporate data management in monitoring protocols.
Participate in the development of Information Needs Assessments based on the objectives of the project.
Guide and/or perform statistical and other analyses of network data.
Contribute to the synthesis and reporting of data and information.
Provide guidance and support, to the extent possible, to extend Network standards and procedures to studies and data funded by park base and other funding sources to promote integration and availability of datasets.
Aware of park resource information management and GIS Plans and capabilities.
Aware of database tools and applications used by the I&M program.
Aware of Data Stewardship principles.
Network Coordinator
Coordinate all network activities
Ensure programmatic data and information management requirements are met as part of overall Network business.
Communicate with Network staff, park staff at all levels, and other appropriate audiences to support and emphasize data management as a critical aspect of network business
Work with Network Data Manager regarding data management policy and guidelines, budget, staffing, and training.
Hold Network staff accountable for responsibilities involving data management.
Aware of database tools and applications used by the I&M program.
Aware of Data Stewardship principles.
Appendix A: Roles, Responsibilities, and Awareness Levels for Data Management
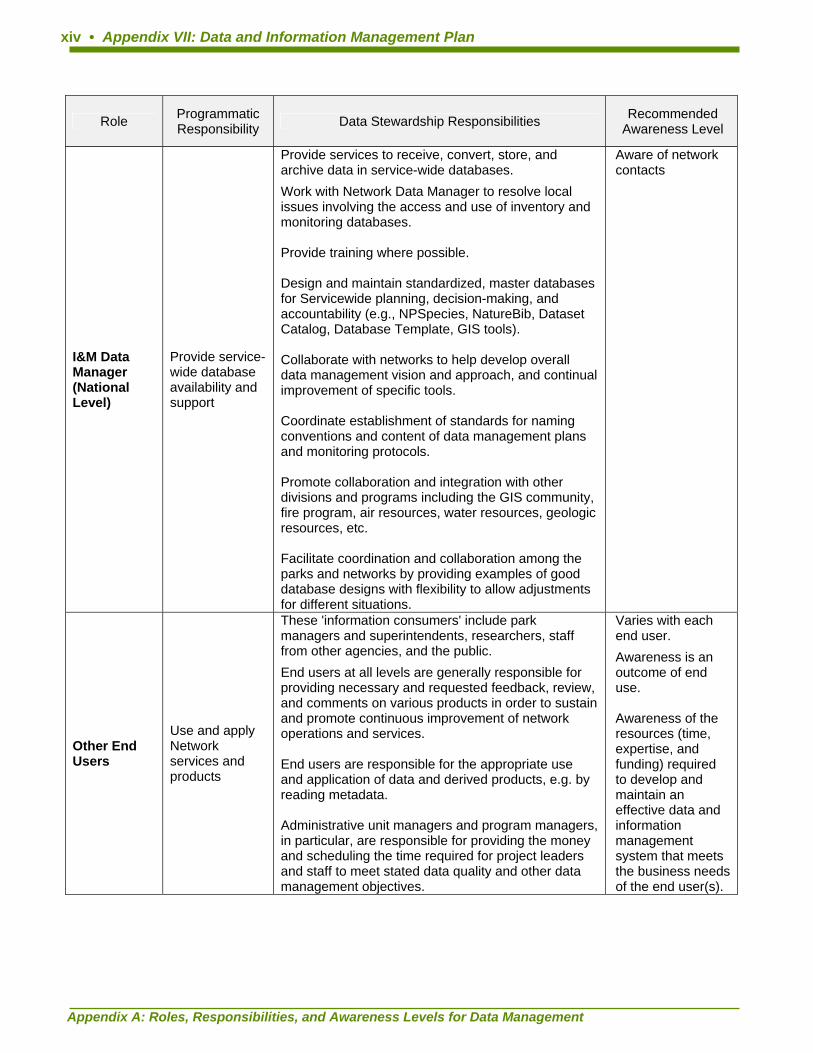
Appendix A: Roles, Responsibilities, and Awareness Levels for Data Management
xiv • Appendix VII: Data and Information Management Plan
Role Programmatic Responsibility Data Stewardship Responsibilities Recommended
Awareness Level
I&M Data Manager (National Level)
Provide service-wide database availability and support
Provide services to receive, convert, store, and archive data in service-wide databases.
Work with Network Data Manager to resolve local issues involving the access and use of inventory and monitoring databases. Provide training where possible. Design and maintain standardized, master databases for Servicewide planning, decision-making, and accountability (e.g., NPSpecies, NatureBib, Dataset Catalog, Database Template, GIS tools). Collaborate with networks to help develop overall data management vision and approach, and continual improvement of specific tools. Coordinate establishment of standards for naming conventions and content of data management plans and monitoring protocols. Promote collaboration and integration with other divisions and programs including the GIS community, fire program, air resources, water resources, geologic resources, etc. Facilitate coordination and collaboration among the parks and networks by providing examples of good database designs with flexibility to allow adjustments for different situations.
Aware of network contacts
Other End Users
Use and apply Network services and products
These 'information consumers' include park managers and superintendents, researchers, staff from other agencies, and the public.
End users at all levels are generally responsible for providing necessary and requested feedback, review, and comments on various products in order to sustain and promote continuous improvement of network operations and services. End users are responsible for the appropriate use and application of data and derived products, e.g. by reading metadata. Administrative unit managers and program managers, in particular, are responsible for providing the money and scheduling the time required for project leaders and staff to meet stated data quality and other data management objectives.
Varies with each end user.
Awareness is an outcome of end use. Awareness of the resources (time, expertise, and funding) required to develop and maintain an effective data and information management system that meets the business needs of the end user(s).
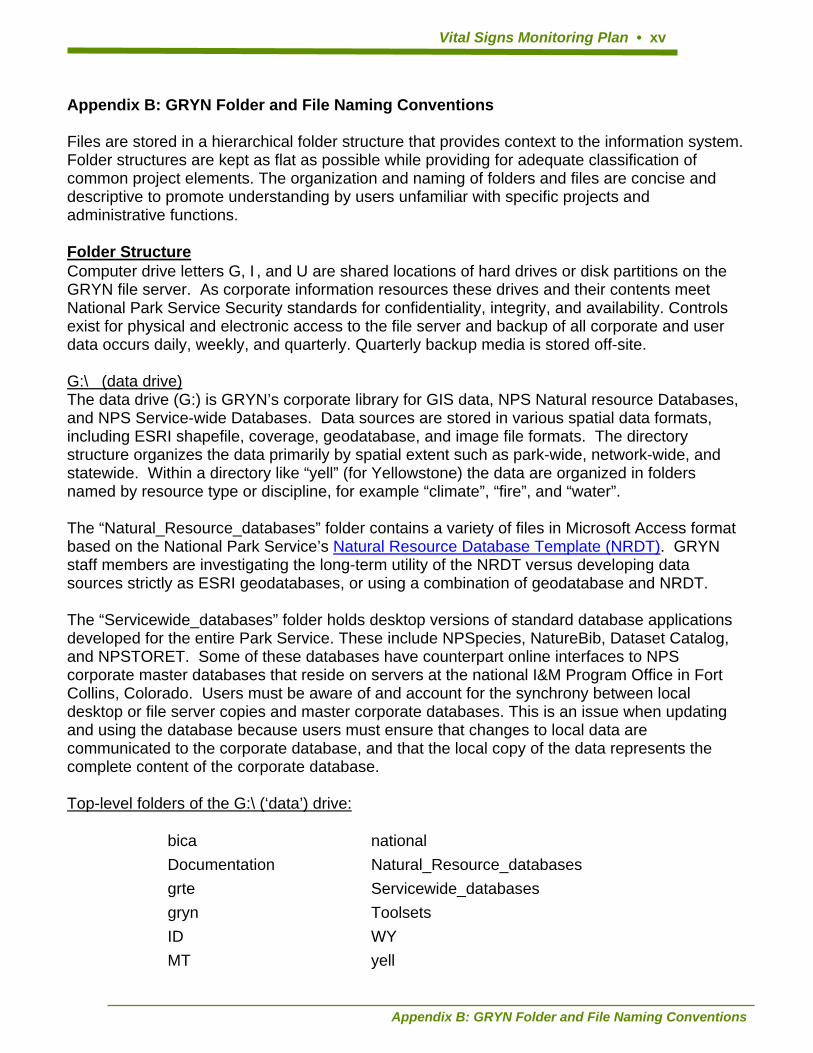
Vital Signs Monitoring Plan • xv
Appendix B: GRYN Folder and File Naming Conventions Files are stored in a hierarchical folder structure that provides context to the information system. Folder structures are kept as flat as possible while providing for adequate classification of common project elements. The organization and naming of folders and files are concise and descriptive to promote understanding by users unfamiliar with specific projects and administrative functions. Folder Structure Computer drive letters G, I, and U are shared locations of hard drives or disk partitions on the GRYN file server. As corporate information resources these drives and their contents meet National Park Service Security standards for confidentiality, integrity, and availability. Controls exist for physical and electronic access to the file server and backup of all corporate and user data occurs daily, weekly, and quarterly. Quarterly backup media is stored off-site. G:\ (data drive) The data drive (G:) is GRYN’s corporate library for GIS data, NPS Natural resource Databases, and NPS Service-wide Databases. Data sources are stored in various spatial data formats, including ESRI shapefile, coverage, geodatabase, and image file formats. The directory structure organizes the data primarily by spatial extent such as park-wide, network-wide, and statewide. Within a directory like “yell” (for Yellowstone) the data are organized in folders named by resource type or discipline, for example “climate”, “fire”, and “water”. The “Natural_Resource_databases” folder contains a variety of files in Microsoft Access format based on the National Park Service’s Natural Resource Database Template (NRDT). GRYN staff members are investigating the long-term utility of the NRDT versus developing data sources strictly as ESRI geodatabases, or using a combination of geodatabase and NRDT. The “Servicewide_databases” folder holds desktop versions of standard database applications developed for the entire Park Service. These include NPSpecies, NatureBib, Dataset Catalog, and NPSTORET. Some of these databases have counterpart online interfaces to NPS corporate master databases that reside on servers at the national I&M Program Office in Fort Collins, Colorado. Users must be aware of and account for the synchrony between local desktop or file server copies and master corporate databases. This is an issue when updating and using the database because users must ensure that changes to local data are communicated to the corporate database, and that the local copy of the data represents the complete content of the corporate database. Top-level folders of the G:\ (‘data’) drive:
bica Documentation grte gryn ID MT
national Natural_Resource_databases Servicewide_databases Toolsets WY yell
Appendix B: GRYN Folder and File Naming Conventions

Appendix B: GRYN Folder and File Naming Conventions
16 • Appendix VII: Data and Information Management Plan
Replicas of GRYN corporate datasets on local computers are stored in explicit locations on the local hard drive that indicate a copy of a master information resource. For example, GRYN corporate data stored on the workgroup file server’s G: drive is stored locally at C:\NPS_Corporate_Data\G_Drive_Replica\
U:\ (User drive) The user drive (U:) holds I&M staff workspaces and corporate files representing the business of the I&M Network. Each GRYN staff member with login access to the local computer network (IMWORKGROUP) is assigned a top-level folder named with their user name. User workspaces support daily operations to assemble and manipulate files and documents, prepare drafts and sections of documents, etc. The U: drive also contains folders and files specific to the business of the program, such as “Admin”, “Inventory”, and “Monitoring”. Top-level folders of the U:\ drive:
Admin Data_Info_Management General_Library Inventory
Monitoring Program_Web_Portal Users
Managing data and information resources across computer networks Some GRYN personnel are not directly connected to the GRYN computer workgroup which is supported by a US Geological Survey Local Area Network. This prevents access to GRYN’s shared disk drives. This is due to staff using non-NPS computer hardware or because these staff are located at offices served by a different Local Area Network. Staff working off-network and those without access to network drives must be aware of GRYN corporate folder structure and should follow the GRYN guidelines for file naming and storage. Using the following GRYN directory structure and naming convention on desktop and laptop computers facilitates information exchange. The convention for local disks includes the following: C:\NPS_Corporate_Data\G_Drive_Replica\ C:\NPS_Corporate_Data\I_Drive_Replica\ C:\NPS_Corporate_Data\U_Drive_Replica\ C:\NPS_Working_Data\ C:\NPS_Install_Files\
Local users should build the basic structure listed above and need to replicate and synchronize only those folders and subfolders relevant to the work they contribute for the GRYN Program. For example, an off-network employee working on the arid seeps and

Vital Signs Monitoring Plan • 17
springs Vital Sign will work in the following local directory: C:\NPS_Corporate_Data\U_Drive_Replica\Monitoring\Vital_Signs\Arid_Seep_Spring\ Subfolders under Arid_Seep_Spring should follow the corporate Vital Sign subfolders listed below. It is not necessary for this user to build the other vital sign folders and subfolders on the local computer. If users choose not to replicate the corporate structure on the local machine, they must communicate their local file management design and explicitly define how it relates to the GRYN corporate structure. This can be submitted in writing or verbally communicated to the GRYN data manager. Information transfer can occur by several methods, depending on the circumstances. All off-network personnel can use e-mail to exchange files. Small files (less than 500KB) can be directly attached to an email message. Larger files or collections of files should be compressed to a target size of 3MB or less. Larger compressed files should be transferred using other methods, including physical transfer of files on USB storage devices and optical disk media (DVD or CD), or file transfer protocol (ftp). Those personnel using NPS laptop computer hardware can also transfer large volumes of information by physically connecting the laptop to a site on the USGS Local Area Network that serves GRYN. Those not using NPS hardware are prohibited by Department Of Interior security policy from directly accessing the USGS LAN. The data manager assists users to reconcile and synchronize the contents of the corporate files on the file server and the replicas on desktop and laptop computers. To gain access to GRYN information resources, off-network users request CD or DVD media containing copies of GRYN files, or connect NPS-property computers to the network temporarily to transfer files. Synchronization of files between staff computers and the GRYN file server should occur frequently in order to maintain a current corporate library that is available to all GRYN staff, other NPS employees and for including in backup and security procedures. Synchronization is strongly recommended on a monthly basis or more frequently. Vital Signs Information Management The U:\Monitoring directory and its subfolders represent the strategic planning at GRYN to develop a consistent, simple, and comprehensive file management model that directly supports development of products like the Network Monitoring Plan and individual Vital Sign Monitoring Plan and Protocol documents, as well as web-interfaces targeted to a variety of audiences. The structured design of folders, file naming convention, and file content format allow for functional development and maintenance of information resources as manageable components. The design provides for easy assembly of information products, both hardcopy and web-based. These products may be compiled manually at first, but will later be automatically generated based on content tags and markup language.
Appendix B: GRYN Folder and File Naming Conventions
Appendix B: GRYN Folder and File Naming Conventions
18 • Appendix VII: Data and Information Management Plan
Information sources are named and filed according to this convention. Filing information sources in shared locations and using descriptive file name are important steps to develop a useful corporate information system. In cases where users are acquiring several files from another source, it is appropriate to file them in the best location and follow up as soon as possible with file naming that follows the GRYN convention. Versioning and Change Procedures The structure of the Vital Signs directories and files supports a version tracking system based on file name that avoids creating multiple subfolders. The master file in each Vital Sign subfolder is indicated by the word ‘current’ in the file name. When a master file meets the criteria for a version change (See below) it is copied to the same folder and given a different file name that replaces the word ‘current’ with the next available sequential version number, preceded by the letter ‘v’. For example, the Whitebark pine issues and threats document “isth_Whitebark_Pine_current.doc” is the current, master file that is supported by two previous versions. The most recent version is a file named “isth_Whitebark_Pine_v3.doc” In addition to the file naming convention for version tracking, a reader can establish the timing of related documents by viewing the file properties, that include the date and time the file was created, modified, and accessed. What constitutes a version change and how does GRYN track changes in documents? The scope of this guideline is for documents produced in Microsoft Word, the NPS-standard documenting application. To address compatibility issues and user requirements on various computing platforms, documents may be published and distributed as Adobe Portable Document Format (pdf). GRYN materials are developed at two levels – one level is draft, internal working documents leading to publication of an initial or subsequent products for distribution. The other level is a previously published, external document that compels changes to network operations. Examples of substantial changes requiring a new version include a change in monitoring objectives, sampling design, data collection, analysis, or distribution methods, or any aspect of the inventory and monitoring program that requires a process adjustment. This might be the result of information learned during a pilot implementation of a monitoring protocol. Document edits that do not require a separate version include text manipulation, grammatical and formatting changes, addition of supporting content not resulting in a process adjustment, etc. It is necessary to track changes in draft, pre-publication documents, and track versions in published, updated documents. GRYN content is developed with multiple levels of interaction and review. For example, Individual GRYN staff author documents which may be exchanged with others for review and edits. In order to establish and track the master copy of a working document, the

Vital Signs Monitoring Plan • 19
original author will usually act as Document Steward and be responsible for storing the master copy, keeping a current copy of the master document in the corporate GRYN file system, distributing the document for edits and review, providing instruction for reviewers/editors, receiving tracked changes(edits), comparing and merging edit copies into the master, managing version of the document, etc. Example: The network coordinator emails a note to several people requesting review and edits to document “standard_MOU_v1.doc”. The email includes the local network file path and file name as well as the attached document. The document has the track changes feature turned on. The email message includes instructions to use the track changes feature, how to provide edits and return the edited document. The procedures that follow depend on whether or not the collaborating individual has access to the local network. Off-Network Collaborators: Each person saves the attached document to a personal working directory and includes their username and the word ‘edits’ in the file name. For example, the attached document “standard_MOU_v1.doc” is saved locally as “standard_MOU_v1_rdaley_edits.doc” Edits are made using the track changes feature, which allows Cathie as the Document Steward to compare and merge the changes from multiple review copies when they are returned. ISSUE: Occasionally more than one person will need to review and edit a draft document at the same time. SOLUTION: It is best to maintain a single edit copy of the network based document. If it is necessary for more than one person to review and edit the document at the same time, then when the second or subsequent users sees the message about “Read only – someone else is using this file”, that user will make a copy of the file following the naming convention outlined above, i.e. “standard_MOU_v1.doc” is saved locally as “standard_MOU_v1_rdaley_edits.doc” Document Identification Standards: Information in the footer of the document to help readers use the documents. Include the following: Document Steward – name of a single individual responsible for the master document File path and name Date file originated Date file last modified Page # of ##
Appendix B: GRYN Folder and File Naming Conventions
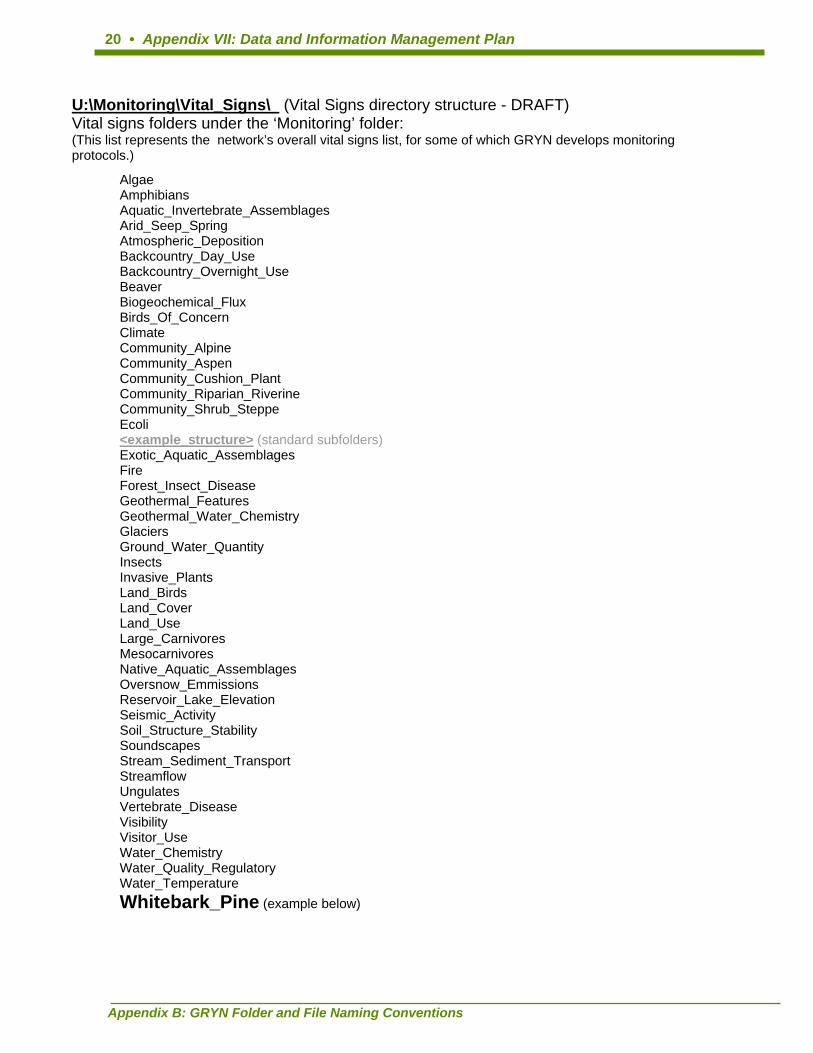
Appendix B: GRYN Folder and File Naming Conventions
20 • Appendix VII: Data and Information Management Plan
U:\Monitoring\Vital_Signs\ (Vital Signs directory structure - DRAFT) Vital signs folders under the ‘Monitoring’ folder: (This list represents the network’s overall vital signs list, for some of which GRYN develops monitoring protocols.)
Algae Amphibians Aquatic_Invertebrate_Assemblages Arid_Seep_Spring Atmospheric_Deposition Backcountry_Day_Use Backcountry_Overnight_Use Beaver Biogeochemical_Flux Birds_Of_Concern Climate Community_Alpine Community_Aspen Community_Cushion_Plant Community_Riparian_Riverine Community_Shrub_Steppe Ecoli <example_structure> (standard subfolders) Exotic_Aquatic_Assemblages Fire Forest_Insect_Disease Geothermal_Features Geothermal_Water_Chemistry Glaciers Ground_Water_Quantity Insects Invasive_Plants Land_Birds Land_Cover Land_Use Large_Carnivores Mesocarnivores Native_Aquatic_Assemblages Oversnow_Emmissions Reservoir_Lake_Elevation Seismic_Activity Soil_Structure_Stability Soundscapes Stream_Sediment_Transport Streamflow Ungulates Vertebrate_Disease Visibility Visitor_Use Water_Chemistry Water_Quality_Regulatory Water_Temperature Whitebark_Pine (example below)

Vital Signs Monitoring Plan • 21
Common (required) subfolder structure under each vital sign folder: <vital_sign> !Overview Conceptual_Models Current_Historic_Monitoring Data_Management Issues_Threats Meetings Monitoring_objectives Projects <specific project folder> (replace with project name) !Bin Agreements Project_Deliverables Proposals Protocol Resources !Bin Guidance_Documents Images Restricted Unrestricted Journal_Articles Maps Other Popular_Articles Presentations Related_Protocols Reports Web Sampling_Design Below is an example with explanation of common subfolder structure shared by all folders with a vital sign name. The example uses the Whitebark Pine vital sign name:
Appendix B: GRYN Folder and File Naming Conventions

Appendix B: GRYN Folder and File Naming Conventions
22 • Appendix VII: Data and Information Management Plan
Example of common subfolder structure shared by all folders with a vital sign name:
U:\Monitoring\Vital_Signs\Whitebark_Pine\ !Overview This folder contains the following documents: Protocol Development Summary(PDS) for all protocols scheduled for implementation by year 2009. The
PDS briefly explains why this vital sign is important, lists specific objectives, outlines the basic approach to develop the protocol (e.g. borrowing from existing protocols), and information about who will develop the protocol, how long it will take, what it will cost, etc. Summarizing and formatting this information to share among the networks will enhance opportunities for collaboration and consistency. PDS’s are for internal use to promote communication and collaboration.
Example: Whitebark_Pine_PDS_current.doc Vital Sign Summary for those Vital Signs not scheduled for implementation by year 2009. The Vital Sign
Summary describes the vital sign, provides background, and explains the justification for developing the vital sign plan and protocol.
The “Technical Notes” from Phase 2 planning are a source of information that relate to Parts 1 and 2 of
the monitoring protocol document. Project Status Summary lists by date those efforts and resources related to the Vital Sign, and may
contain hyperlinks to materials stored in the ‘Projects’ subfolders for this Vital Sign. Workshops Summary lists by date those workshops related to the vital sign. Change Log lists substantive changes related to the vital sign. Conceptual_Models Current_Historic_Monitoring
This folder contains a document that describes the who, what, when, where, and why for monitoring projects taking place in the network, but not directly by GRYN.
Data_Management Issues_Threats Meetings Monitoring_objectives Protocol This folder contains a structured document compiled from master component documents stored in the
other folders for this Vital Sign, in addition to Standard Operating Procedures stored in folder U:\Monitoring\SOPs. Versions of this document are compiled as needed for hardcopy publication and distribution.
Projects <specific project folder> (replace with project name) !Bin Agreements
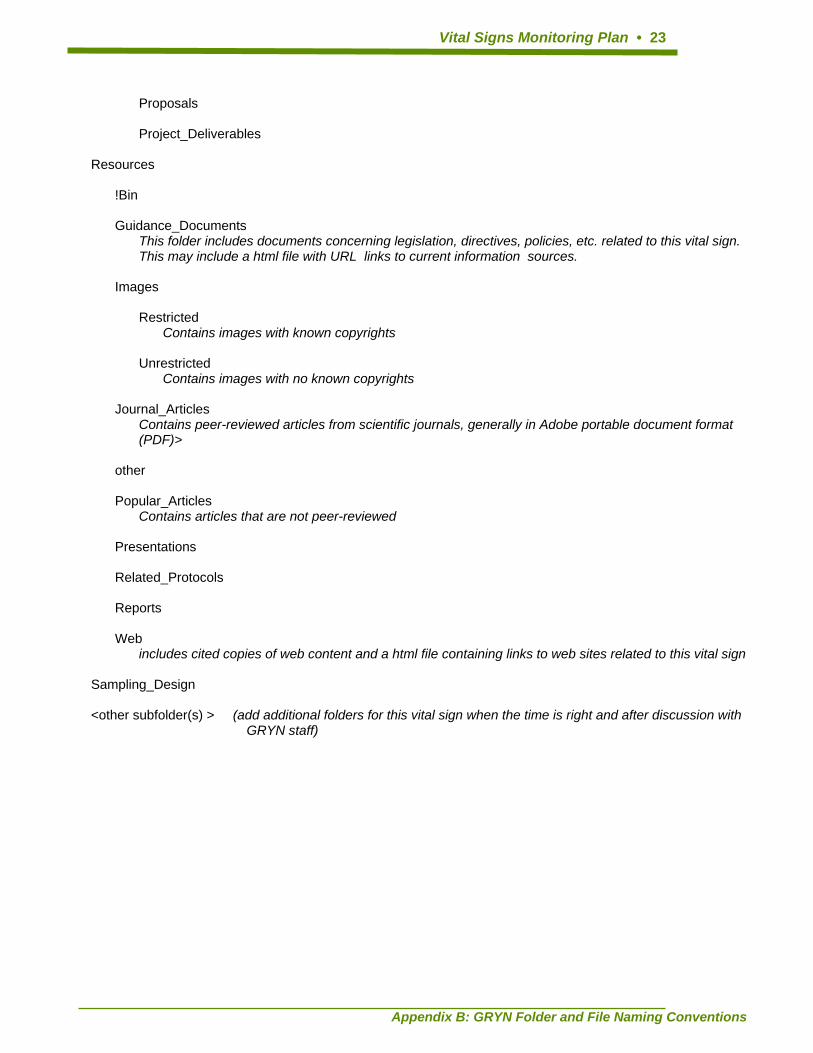
Vital Signs Monitoring Plan • 23
Proposals Project_Deliverables Resources !Bin Guidance_Documents This folder includes documents concerning legislation, directives, policies, etc. related to this vital sign.
This may include a html file with URL links to current information sources. Images Restricted Contains images with known copyrights Unrestricted Contains images with no known copyrights Journal_Articles
Contains peer-reviewed articles from scientific journals, generally in Adobe portable document format (PDF)>
other Popular_Articles Contains articles that are not peer-reviewed Presentations Related_Protocols Reports Web includes cited copies of web content and a html file containing links to web sites related to this vital sign Sampling_Design <other subfolder(s) > (add additional folders for this vital sign when the time is right and after discussion with
GRYN staff)
Appendix B: GRYN Folder and File Naming Conventions

Appendix B: GRYN Folder and File Naming Conventions
24 • Appendix VII: Data and Information Management Plan
Best Practices for Folder and File Naming: Use official/original file sources Where possible, avoid storing local copies of files that can be accessed via web link to the entity or organization that keeps the master file. This prevents storing and using an outdated copy and relieves network staff from monitoring the source for updates. An example is a web site with federal or NPS forms that can be accessed when needed. It is necessary to use GRYN corporate folders to store files that support a particular version of a GRYN product or document. For example, files containing current NPS policy and I&M guidance that support GRYN monitoring protocols must be archived with the protocol documents to avoid confusion as policies and protocols change over time. Likewise, data records and data sets and the subsequent use, analysis, and reporting of the data link to specific protocols. Since protocols will change over time, each preceding protocol is archived with supporting documentation, and all data associated with each version of a protocol is documented to support the utility and longevity of the data and resulting information. Avoid spaces in file names Avoid using special characters, other than underscore, in file names Avoid uncommon acronyms, abbreviations and codes Avoid codes that require any user unfamiliar with GRYN business to refer to another table or document for the code description. Use recognizable abbreviations or spell it out. Exceptions: Park Service Unit acronyms like GRYN, YELL, GRTE, BICA
Acronyms in common use within and outside the National Park Service and related to natural resource management.
For additional details and reference, refer to: http://science.nature.nps.gov/im/apps/template/IM_DB_Naming_Recs_v3.pdf”: This file stored at this location on the GRYN server: U:\Data_Management\Library\Guidance_Documents\ IM_DB_Naming_Recs_v3.pdf
Vital Signs Monitoring Plan • 25
Definition and Examples of file naming convention The GRYN file name conventions are as follows: For articles published in peer reviewed journals: GRYN staff will comply with the terms set forth in each journal publication regarding use and distribution of journal articles. Files are stored in the following folder: U:\Monitoring\Vital_Signs\<vital_sign>\Resources\Journal_Papers\ The file name is composed of the following elements separated with the underscore character:
• last name of the first listed author If a publications has two authors: • after last name of first author include last name of the second listed author If a publication has more than two authors: • after last name of first author include “et_al”
• year published (if necessary use <Year>a etc. for multiple articles by the same author in the same year)
• journal title abbreviation. Once source for abbreviations: http://www.bioscience.org/atlases/jourabbr/list.htm
• article title {optional} - a reasonable portion of the title with limited use of arbitrary abbreviations
• file extension – a three-place file format extension. syntax: <Author>_<Year>_<Journal_title>_{Article_title}.<ext> <Author1>_<Author2>_<Year>_<Journal_title>_{Article_title}.<ext> <Author1>_et_al_<Year>_<Journal_title>_{Article_title}.<ext> examples: single author example: Corn_2003_conserv_biol.pdf two-author example: Haines_Pollock_1998_Environ_Ecolo_Stats.pdf more than two-author example: Vos_et_al_2000_Env_Mon_Ass.pdf For reports such as status reports of inventory or monitoring work required as a deliverable from an agreement with a cooperator or a contract. syntax: <vital_sign>_<Author>_<Report_title>_<Year>
Appendix B: GRYN Folder and File Naming Conventions

Appendix B: GRYN Folder and File Naming Conventions
26 • Appendix VII: Data and Information Management Plan
References not fitting into other categories Directives folder: Meetings folder: <vital_sign>_<Date>_<Meeting_location>_<Key_group(s) or Key_Individual(s)> Actions folder: Decisions folder Issues_Threats folder: The following file name prefixes were considered for use by GRYN staff using as a convention to prefix document and file names. Since the directory structure provides context to such material, use of these prefixes is optional and generally will not be used.
File prefix type of document or file lit_ peer reviewed journal article rep_ report title, e.g. a deliverable from a cooperator ref_ reference documents pres_ presentations such as PowerPoint reg_ regulation pol_ policy exec_ executive order direction mtg meeting notes act_ management actions dcsn_ management Decision isth_ issues and threats

Vital Signs Monitoring Plan • xxvii
Appendix C: Freedom of Information Act (FOIA) and Sensitive Data
From Northeast Coastal and Barrier Network Data Management Plan
Marc Albert and Sara Stevens November 2004
This appendix summarizes the laws and policy related to protected information about Park resources and the Freedom of Information Act (FOIA). It also describes the procedures for classifying and managing protected information from Inventory and Monitoring Program projects, as well as the procedures for responding to FOIA requests. Much of the material contained in this section is copied or derived from NPS Director’s Order #66: Freedom of Information Act and the Protection of Exempted Information (Drafts 12-4-03 and 4-12-04). C.1 Summary The FOIA specifies a process through which all United States Government entities must respond to requests for information by any member of the public. FOIA and National Park Service policy require that NPS staff routinely make available information that is of interest to the public, including data regarding park resources and management. Resource information collected through the Greater Yellowstone Network, whether by NPS staff or partners, is intended to be available not only to parks but also to the public, and the routine dissemination of resource information is an important component of the Network Inventory and Monitoring Program. However, information that could result in harm to resources may be withheld from public release. Four resource confidentiality laws and an Executive Order direct the NPS to protect information regarding the nature and location of certain sensitive park resources. One of these laws, the National Parks Omnibus Management Act, states that information that could result in harm to specific natural resources, including endangered or threatened species, may not be released to the public, and that records containing such information are exempted from release through FOIA. Only a small subset of the information collected through the Inventory and Monitoring Program is likely to be considered protected. Nevertheless, all data sets and associated information from Inventory and Monitoring Program activities, including spatial data such as GIS files, should be assessed to determine sensitivity, and any protected information should be carefully managed to prevent its release. When publishing or posting resource information, or when responding to a FOIA request in collaboration with the regional FOIA officer, Inventory and Monitoring Program staff should try to ensure that only the protected information is withheld and not associated non-sensitive information. C.2 Definitions Relating to Management of Protected Information Endangered or threatened National Park System resources. For natural resources, this indicates a species or population that has been formally designated as endangered, threatened, a species of concern, or proposed for such a designation by the U.S. Fish and Wildlife Service or the National Marine Fisheries Service, or a similar designation by an appropriate state agency. A parallel definition exists for cultural resources. Partners are individuals or entities that enter into cooperative or collaborative relationships with NPS for the purpose of achieving overlapping goals, where at least some goal is held in common by both the partner and the NPS. This relationship is documented through a letter, VIP appointment, general agreement, permit, contract, or some similar written arrangement. Partners can include both private entities and other federal agencies. Protected information indicates information about a sensitive park resource that must not be released to the public according to any of the four resource confidentiality laws and the Executive Order applicable to NPS.
Appendix C: FOIA and Sensitive Data

xxviii • Appendix VII: Data and Information Management Plan
Principal Investigator in this context means the person primarily responsible for the implementation of an inventory or monitoring project, whether that person is a partner, is affiliated with a partner institution, or is an NPS employee. Record includes all books, papers, maps, photographs, machine-readable materials, or other documentary materials, regardless of physical form or characteristics. Records are made or received by an agency of the United States Government under federal law or in connection with the transaction of public business and preserved by that agency as evidence of the organization, functions, policies, decisions, procedures, operations, or other activities of the Government, or because of the informational value of the data in them (44 U.S.C. 3301). Resource confidentiality laws refer specifically National Parks Omnibus Management Act (16 U.S.C. 5937), National Historic Preservation Act (16 U.S.C. 470w-3), Federal Cave Resources Protection Act (16 U.S.C. 4304) and Archaeological Resources Protection Act (16 U.S.C. 470hh). Sensitive park resource indicates a park resource covered by the resource confidentiality laws that is considered susceptible to significant harm, theft or destruction, and about which information should be protected from public release. C.3 Legal and Policy Framework for NPS Natural Resources Information Dissemination C.3.1 Freedom of Information Act, 5 U.S.C. § 552 The Freedom of Information Act of 1966 (FOIA), amended in 1F6 to provide guidance for electronic information distribution (the amendments are commonly referred to as EFOIA) applies to records that are owned or controlled by a federal agency, regardless of whether or not the federal government created the records. FOIA is a broad disclosure law intended to establish a right for any person to access federal agency records that are not protected from disclosure by exemptions. Under the terms of FOIA, agencies make some non-protected records generally available for inspection and copying in public reading rooms and via the Internet. Other records are provided in response to specific requests through a specified process. The Department of the Interior’s revised FOIA regulations (43 CFR Part 2, Subparts A through E [see 67 FR 64527]) and the Department’s Freedom of Information Act Handbook (383 DM 15) can be accessed at http://www.doi.gov/foia/. C.3.2 National Parks Omnibus Management Act, Section 207, 16 U.S.C. § 5937 The National Parks Omnibus Management Act (NPOMA) prohibits the release, under FOIA, of information regarding the nature and specific location of certain cultural and natural resources in the National Park System. Information prohibited from release includes the location of endangered or threatened species–specifically maps or narrative descriptions indicating site specific locations. The law also identifies conditions under which the Secretary may release this information. C.3.3 National Park Service Management Policies The NPS Management Policies (2001) explain the dual goals of the National Park Service with regard to information on resources–to withhold information that will put particular resources at risk and to expeditiously release information that does not. C.3.4 Director’s Order #66 Freedom of Information Act and the Protection of Exempted Information (Drafts 12-04-03 and 4-12-04)
Appendix C: FOIA and Sensitive Data

Vital Signs Monitoring Plan • xxix
The final Order will function as a supplement to the Department of the Interior FOIA regulations. It is intended to clarify internal NPS operational questions and responsibilities regarding procedures, signature authority, security requirements, and the relationship of paper and electronic records to FOIA and EFOIA. Also, the final Order will specifically address records concerning the location and nature of specific types of park resources that are prohibited from disclosure by the resource confidentiality laws. The draft of the Order states “In general, any federal agency that holds information about the nature and specific location of park resources that qualifies as protected information under the provisions of NPOMA must withhold that information from the public unless the Director of the National Park Service or designee determines that its release would:
1) further the purposes of the unit of the National Park System in which the resource is located 2) not create an unreasonable risk of harm, theft, or destruction of the resource
3) be consistent with other applicable laws protecting the resource–the expected Order will be accompanied
by Reference Manual 66 which will give more detail (refer also to NPOMA) C.4 Public Access to Network Inventory and Monitoring Data According to NPS Management Policies and Inventory and Monitoring Program goals, each Network will make information on park resources readily available. In addition, the 1F6 amendments to FOIA require that all information that is regularly requested, except exempted records, must be made available to the public via reading rooms and the internet. The five internet portals through which information from Greater Yellowstone Network projects will be made available to the public are listed in Table C.1. Table C.1 Greater Yellowstone Network Internal Portals for Projects
Name Description of Content For More Information GRYN Web Site
Reports and other information on all Network projects as well as Network parks, operations and staff
http://www1.nature.nps.gov/im/units/gryn/
NPSpecies Information on species in the National Parks, including all records generated through the I&M Program
www.nature.nps.gov/im/apps/npspp/
NatureBib Bibliographic references that refer to National Park System natural resources
http://www.nature.nps.gov/nrbib/index.htm
NR-GIS Metadata and Data Store
Documents, maps, and data sets containing resource information from all sources, and their associated metadata
http://science.nature.nps.gov/nrdata/docs/about.cfm
Biodiversity Data Store
Documents, GIS maps, and data sets that contribute to the knowledge of biodiversity in National Park units
http://science.nature.nps.gov/im/inventory/biology/
Both secure and public interfaces are maintained for each of the databases associated with these portals (the NatureBib interface is in development currently), and the public will have access to all information in these databases except those records marked as ‘sensitive.’ C.5 Classifying and Managing Protected Information The procedures for classifying protected information and managing information about sensitive park resources can be summarized as follows:
Network staff (Coordinator, Data Manager, and/or other designated staff) will ensure that all known potentially sensitive park resources are identified.
Network staff will ensure that investigators working on Network projects understand that (1) all data and associated information must be made available for review by Network staff prior to public release in any
Appendix C: FOIA and Sensitive Data

Appendix C: FOIA and Sensitive Data
xxx • Appendix VII: Data and Information Management Plan
format, and (2) that any information classified by the NPS as protected should not be released in any format except as specifically coordinated with the NPS (see section 9.2.5.2.2).
Network staff will identify all known potentially sensitive park resources to the principal investigator for each project.
All known references to potentially sensitive park resources that are generated from each project will be identified to the Network by the principal investigator for that project.
For each project, the Network staff will provide a complete list of all references to potentially sensitive park resources in each park to the park superintendent for review.
Each superintendent determines which information should be protected. The Network staff will ensure that all protected information is properly identified and marked before
uploading into Network or National databases, and before archiving the databases. Network staff will ensure that all references to protected information are removed or obscured in any
reports, publications, maps, or other public forum. Following the standard for FOIA requests, the Network will segregate the non-releasable information and where practical will not withhold associated releasable information.
C.5.1 Classifying Protected Information The classification of protected natural resource information from Inventory and Monitoring Program activities will be done on a case-by-case, project-by-project basis. According to NPOMA, if the NPS determines that disclosure of information would be harmful, information may be withheld concerning the nature and specific location of:
endangered, threatened, rare, or commercially valuable National Park System resources mineral or paleontologic objects objects of cultural patrimony
The Federal Cave Resources Protection Act (16 U.S.C. § 4304) similarly authorizes the withholding of information concerning the specific location of any significant caves. The Network will work closely with the investigators for each project to ensure that potentially sensitive park resources are identified and that information about these resources is tracked throughout the project. Network staff will be responsible for identifying all potentially sensitive resources to the principal investigator(s) working on each project. The investigators, whether NPS staff or partners, should develop procedures to flag all potentially sensitive resources in any products that come from the project, including documents, maps, databases and metadata. All records and other references to the potentially sensitive resources should be specifically identified by the investigator when submitting any products. Partners should not release any information before consulting with NPS staff to ensure that the information is not classified as protected. See section C.5.2.2. Network staff should compile information about potentially sensitive resources from each project and forward it in the context in which it would be made available to the public (report, map, database etc.) to each appropriate park superintendent (or his or her designee). Each superintendent will determine whether or not to protect the information. For inventory reports, monitoring project reports, or other stand-alone documents, this process will be most efficiently conducted as part of the final draft review for each document. For information contained in other formats that will not have a discrete review process, Network staff will be responsible for flagging any potentially sensitive information and forwarding a request to the appropriate Superintendent(s). The following guidance for determining whether information should be protected is suggested in the draft Director’s Order #66 (the final guidance may be contained in the Reference Manual 66):
1) Has harm, theft, or destruction occurred to a similar resource on federal, state, or private lands? 2) Has harm, theft, or destruction occurred to other types of resources of similar commercial value, cultural
importance, rarity, or threatened or endangered status on federal, state, or private lands? 3) Is information about locations of the park resource in the park specific enough so that the park resource
likely could be found at these locations at predictable times now or in the future? 4) Would information about the nature of the park resource that is otherwise not of concern permit finding the
resource if the information were available in conjunction with other specific types or classes of information?

Vital Signs Monitoring Plan • xxxi
5) Even where relatively out-dated, is there information that would reveal locations or characteristics of the park resource such that the information could be used to find the park resource as it exists now or is likely to exist in the future?
6) Does NPS have the capacity to protect the park resource if the public knows its specific location? In the Greater Yellowstone Network, most information that may qualify as protected will pertain to rare species of plants and animals, including federal and state-listed species. The information that may be protected could include the location, density or abundance, or presence/absence of the resources in question. Specific examples are maps, narrative descriptions, or monitoring plot locations indicating site specific locations of species. Information that is already in the public domain can be released. For instance, the return of condors to the Grand Canyon has been well documented by the press. If parties request site-specific information about where the condors have been seen, this information can be released. However, specific nest site locations must not be released. C.5.2 Managing Protected Information C.5.2.1 General Procedures Any information that a superintendent determines should be protected will be removed by Network staff, or by partners with Network staff guidance, before publication or the posting of documents or other media in which the information is contained. Following the standard for FOIA requests, the Network will segregate the non-releasable information and where practical will not withhold associated releasable information. The method used to withhold protected information depends on the nature of the particular park resource and the medium in which the information is contained. It is the responsibility of Network staff, with guidance from park superintendent(s), to determine the appropriate measures to withhold protected information. In the Greater Yellowstone Network, protected information is likely to refer to the presence or absence and location of rare species. It may be appropriate to generalize location data in order to make an area large enough so that the public will be provided some information without learning the specific location of the park resource. This principle can be applied to text descriptions of locations, to text or coded data located on field data sheets or in databases, to GIS files, or to printed maps. In the case of databases, all references to any resource regarding which information is protected should be deleted or otherwise concealed in any publicly accessible version. For example, when providing location information, cutting off the last digits in UTM coordinates will make the location general enough in some cases. This could apply to metadata files associated with GIS data as well. An option for GIS-based displays or printed maps would be to increase the pixel size to the point that finding the object of interest is not possible. Four of the databases for natural resource related information from the Inventory and Monitoring Program–NatureBib for bibliographic references, NPSpecies for species records, and the Biodiversity Data Store and NR-GIS Data and Metadata Store for documents, GIS maps, and data sets–are equipped with the capacity to mark protected information when records are being uploaded. All records that are marked ‘sensitive’ upon uploading will only be available through the secure applications. Thus, access to information on sensitive park resources will be limited to NPS staff or partners who have signed a confidentiality agreement and procedures regarding the release of protected information can be provided along with access to the databases. It is critical that the Network implement quality control and quality assurance measures to ensure that anyone uploading records into these databases will know the procedures for identifying and entering protected information. Precautions should be taken to avoid inadvertent releases of protected information. Examples of inadvertent releases are the use of protected information in the development of NPS interpretive and public information programs or the inclusion of protected information in National Environmental Policy Act documents. C.5.2.2 Procedures for Working with Partners
Appendix C: FOIA and Sensitive Data

xxxii • Appendix VII: Data and Information Management Plan
Network staff must work with any partners that are collecting or reporting information from Inventory and Monitoring Program projects to ensure that:
all of the records and other information associated with projects are submitted to the NPS protected information is identified as described in section C.5 protected information is withheld from public release the NPS and the partner have a signed agreement including a confidentiality clause specific procedures for review of information that may be reported by partners are established (This
consultation must occur before the partner releases potentially sensitive information to any outside party, whether as part of a publication, posted to a website, or pursuant to a FOIA request or any other request.)
C.5.2.2.1 Partner Agreements The rights and responsibilities of the NPS and partners regarding potentially sensitive park resources should be stated clearly in any Cooperative Agreement, contract, Interagency Agreement, VIP agreement, or other written confirmation of a working relationship. Each agreement should address the following:
Clarification of the ownership of data and associated information–the following text, adapted from guidelines developed by Acadia National Park, is recommended: “All associated data (including, but not limited to field notes, maps, slides, photographs, charts/graphs, tabular and GIS data with associated metadata) are required to be submitted to the Network annually and are owned by the National Park Service.”
All known potentially sensitive park resources should be named. Since the agreement itself is a public document only the names of the resources should be provided, not specific information about their distribution or abundance, in case that information should be protected.
The procedures for the classification of protected information should be summarized, especially with regard to cooperation between the Network staff and the project staff (as described in section C.5.1).
A requirement for the partner to withhold protected information and to consult with the NPS before releasing any information on sensitive park resources should be stated. Thus, the document should include a confidentiality agreement.
If agreements do not contain specific responsibilities for the NPS and the partner regarding protected information, then Network staff must work with partners to institute the appropriate procedures. Note that Federal ownership of information means that the information is subject to public release through FOIA. C.6 Responding to FOIA Requests When a Network or a Network park receives a specific FOIA request for Inventory and Monitoring Program information, they will handle it according to standard Department of the Interior and NPS procedures, following the Department’s Regulations, the Department’s FOIA Handbook, and the NPS Directors Order #66 and Reference Manual 66. General information and web links regarding FOIA are located in section C.3.1. (The NPS Northeast Region’s FOIA Program Officer is currently Annette Sasso, and the Regional FOIA Officer is currently Edie Shean-Hammond.) The procedures for responding to FOIA requests for Inventory and Monitoring Program-related information can be summarized as follows:
When a request is received by a park or the Network, it is the responsibility of the NPS official recipient (the superintendent for a park, or the Network Coordinator) to comply with FOIA. Notification of the request is forwarded to the regional FOIA program coordinator and the request is logged into the Electronic FOIA Tracking System.
The request is ‘perfected’ (finalized) by estimating fees and determining the requestors payment limit or request for payment exemption; from this date the NPS has 20 days to respond.
Appendix C: FOIA and Sensitive Data

Vital Signs Monitoring Plan • xxxiii
The requested records are compiled by the recipient office, noting any records that contain protected information and thus are exempted from release. The recipient must consult with the NPS solicitor regarding any exempted records.
When a record contains both exempt and nonexempt material, a reasonable attempt should be made to segregate and release nonexempt information.
A draft response to the request containing the requested records along with an explanation of any records that have been withheld should be submitted to the Regional FOIA Program Coordinator, then forwarded to the Regional FOIA Officer and finally to the Regional Director for signature and release.
C.6.1 Inquiries for Information and/or Records Upon receipt of a request, the FOIA Officer will make a determination as to whether it is subject to FOIA (i.e., a request for records) or merely a request for information. If the requester seeks an answer to a specific question, or an explanation of policy, procedures, or a Departmental action, DOI is not required to process the request under FOIA. Nonetheless, the FOIA Officer should refer the request for information to the appropriate office for response in a timely manner. C.6.2 Exemptions from Release of Records through FOIA Nine exemptions and three special law enforcement record exclusions permit the withholding of sensitive or confidential information from release through FOIA. Although the NPS does not rely on any particular exemption, the one most likely to be used in the context of park natural resources requires withholding records that are prohibited from disclosure by another statute. Four resource confidentiality laws and one Executive Order direct the NPS to protect information regarding the nature and location of certain sensitive park resources. These include the Federal Cave Resources Protection Act and the National Parks Omnibus Management Act (NPOMA), which requires that information potentially harmful to particular natural resources, including listed endangered or threatened species, be withheld from public release. In some instances, acknowledgement that a particular resource exists at all in a park may reveal too much information. In such cases, a response that neither confirms nor denies the existence of such records may be appropriate in reply to a FOIA request. Such a reply is known as a Glomar response. C.6.3 Release of Records through FOIA for Projects with Partners FOIA dictates that once an agency has shared records with any party outside the federal government without a pre-release agreement, it must make the records available to any and all other parties who request them. This provision is referred to as the “release to one, release to all” rule. When published research findings are produced under a grant or other Federal assistance, including funding from the Inventory and Monitoring Program, and the findings are used by a bureau in developing an agency action that has the force and effect of law (e.g., a policy or regulation), the research data related to such findings are considered agency records even if they are in the possession of the recipient. C.6.3.1 Procedures for Working with Federal Agency Partners In general, any federal agency that holds information about the nature and specific location of park resources that qualifies as protected information under the provisions of NPOMA must withhold that information from the public unless the Director of the National Park Service or designee determines that its release would:
1) further the purposes of the unit of the National Park System 2) not create an unreasonable risk of harm, theft, or destruction of the resource 3) be consistent with other applicable laws protecting the resource
Appendix C: FOIA and Sensitive Data
xxxiv • Appendix VII: Data and Information Management Plan
When another federal agency informs NPS that it has received a FOIA request regarding information that the other agency holds about park resources, NPS first assists the agency in determining whether the requested records fit within the definition of protected information. The agency must withhold the information pending action from the NPS. NPS will ask the agency to forward the FOIA request to the NPS with either: 1) a preliminary recommendation that the information be withheld; 2) a preliminary recommendation that it be released; or 3) a statement that the agency will not be making a recommendation whether the information should be released. The NPS will make its determination about what information, if any, is to be withheld based on information the NPS receives from the agency, the requester, any other party that it consults, and its own inquiry into whether the information can be released under the provisions of NPOMA. C.6.3.2 Requests for NPS Records Held by a State Agency or Partner Before sharing information with state employees, whether from state agencies or state funded universities, NPS must be aware that those state employees may be obligated to release information in their possession to any party requesting it because state freedom of information or sunshine laws require such release. In states with Freedom of Information laws that allow the withholding of certain types of information, it may be possible that state employees would have the authority to enter into contractual agreements with NPS to withhold protected information. NPS must not share protected information with any state employee where state laws require the release of all information in state records. C.6.3.3 Requests for Information Received by NPS from Non-NPS Entities The NPS cannot guarantee confidentiality of information received from any non-NPS entity. Once NPS receives information from others, its treatment of the information is governed by FOIA. Such information must be released in response to a FOIA request if it does not qualify as protected information. The NPS must, however, withhold any information it receives that does qualify as protected.
Appendix C: FOIA and Sensitive Data
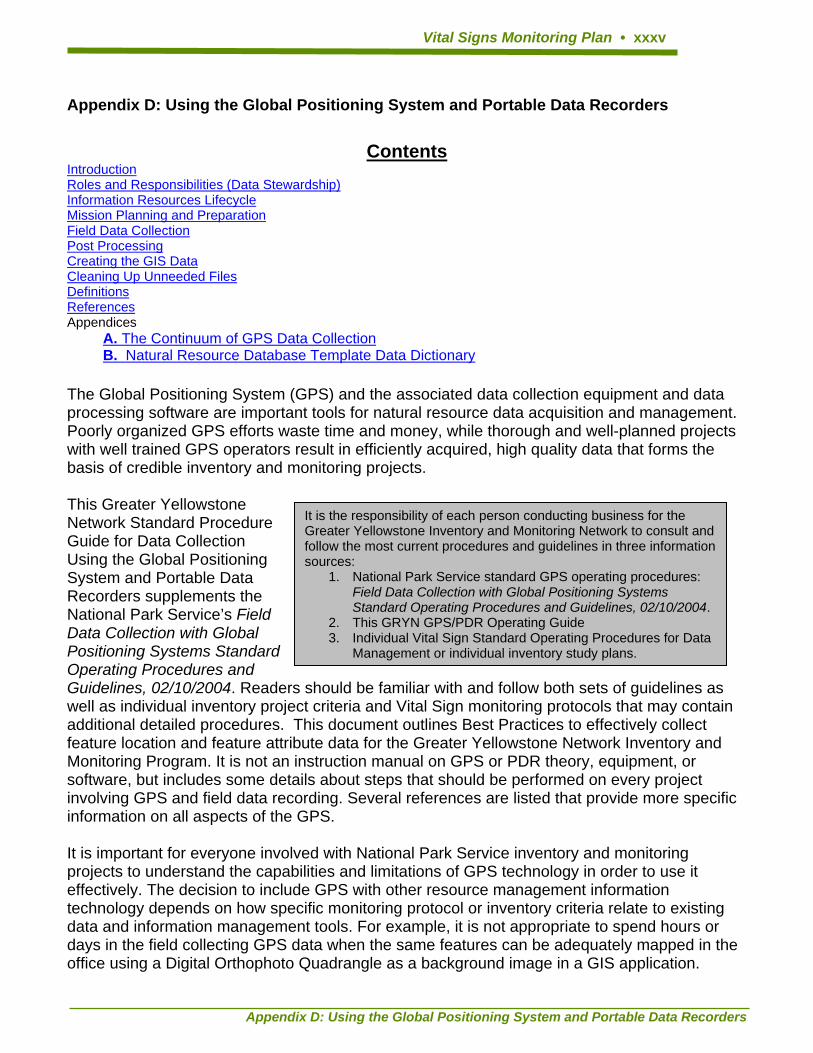
Vital Signs Monitoring Plan • xxxv
Appendix D: Using the Global Positioning System and Portable Data Recorders
Contents IntroductionRoles and Responsibilities (Data Stewardship)Information Resources LifecycleMission Planning and PreparationField Data CollectionPost ProcessingCreating the GIS DataCleaning Up Unneeded FilesDefinitionsReferencesAppendices
A. The Continuum of GPS Data CollectionB. Natural Resource Database Template Data Dictionary
The Global Positioning System (GPS) and the associated data collection equipment and data processing software are important tools for natural resource data acquisition and management. Poorly organized GPS efforts waste time and money, while thorough and well-planned projects with well trained GPS operators result in efficiently acquired, high quality data that forms the basis of credible inventory and monitoring projects. This Greater Yellowstone Network Standard Procedure Guide for Data Collection Using the Global Positioning System and Portable Data Recorders supplements the National Park Service’s Field Data Collection with Global Positioning Systems Standard Operating Procedures and Guidelines, 02/10/2004. Readers should be familiar with and follow both sets of guidelines as well as individual inventory project criteria and Vital Sign monitoring protocols that may contain additional detailed procedures. This document outlines Best Practices to effectively collect feature location and feature attribute data for the Greater Yellowstone Network Inventory and Monitoring Program. It is not an instruction manual on GPS or PDR theory, equipment, or software, but includes some details about steps that should be performed on every project involving GPS and field data recording. Several references are listed that provide more specific information on all aspects of the GPS. It is important for everyone involved with National Park Service inventory and monitoring projects to understand the capabilities and limitations of GPS technology in order to use it effectively. The decision to include GPS with other resource management information technology depends on how specific monitoring protocol or inventory criteria relate to existing data and information management tools. For example, it is not appropriate to spend hours or days in the field collecting GPS data when the same features can be adequately mapped in the office using a Digital Orthophoto Quadrangle as a background image in a GIS application.
It is the responsibility of each person conducting business for the Greater Yellowstone Inventory and Monitoring Network to consult and follow the most current procedures and guidelines in three information sources:
1. National Park Service standard GPS operating procedures: Field Data Collection with Global Positioning Systems Standard Operating Procedures and Guidelines, 02/10/2004.
2. This GRYN GPS/PDR Operating Guide 3. Individual Vital Sign Standard Operating Procedures for Data
Management or individual inventory study plans.
Appendix D: Using the Global Positioning System and Portable Data Recorders

xxxvi • Appendix VII: Data and Information Management Plan
Effective use of GPS for resource information management involves shared responsibilities that include strong communication and understanding by each person involved in the collection, management, and use of data resources. In order to promote understanding and inform good decisions about using tools like GPS, field crew members and crew leaders should receive briefings from higher level supervisors, project managers, and data managers at least once per season about how their efforts fit with park and network management objectives, National Park Service and Department of Interior Policies, and federal government requirements, including those of congressional offices, the Federal Geographic Data Committee(FGDC), etc. Inventory and Monitoring project managers should have a good understanding of resource information management issues and requirements and be aware of the challenges and limitations of field data collection, including the use of GPS. This is achieved by detailed and regular briefings and/or accompanying field crews to perform data collection at least once each season. Table 1 provides a framework for the roles and responsibilities involved in using GPS for inventory and monitoring projects. Table 1. Data Stewardship Framework for GPS and Field Data Collection Activities
Position or Office Primary Role(s)
Primary Responsibilities related to GPS & Field Data Collection
Recommended Awareness Level
Field Crew Member
Collect and Record Data
Obtain training in GPS theory and equipment.
Read and follow all three levels of NPS GPS Operating Guidelines.
Communicate with Crew Leader, Project Manager, and Data Manager.
Perform regularly scheduled data transfer and backup data for further processing.
Review, validate, and correct field data.
Assist with data documentation.
Good understanding of specific protocol and related discipline.
Some awareness of any related protocols.
Briefed on Network Program, NPS I&M Program, and relationships with e-Gov and other agencies efforts and initiatives.
Field Crew Leader
Supervise crew
Ensure crew members receive GPS training and briefings.
Read and follow all three levels of GPS Operating Guidelines.
Communicate with Crew Members, Project Manager, and Data Manager.
Ensure data is regularly transferred, backed up, verified, and entered into the appropriate NPS database(s).
Assist with data documentation.
Appendix D: Using the Global Positioning System and Portable Data Recorders

Vital Signs Monitoring Plan • xxxvii
Position or Office
Primary Responsibilities Recommended Primary Role(s) related to GPS & Field Awareness Level Data Collection Project Leader Supervise or
Advise Field Crew Leader. Oversee and coordinate the project.
Ensure crew leader receives pertinent training and briefings.
Read and follow all three levels of GPS Operating Guidelines.
Communicate with Crew Leader, Data Manager, and I&M Network Coordinator.
I&M Network Coordinator
Supervise or Advise Project Manager. Coordinate all projects in general.
Network Data Management Office
Ensure inventory and monitoring data is organized, useful, compliant, safe, and available.
Coordinate with Network parks, other Networks, and regional and national I&M and Natural Resource Programs as well as other agencies and entities.
Assign and enforce data stewardship roles and responsibilities.
Review and approve all data acquisition plans, hardcopy and electronic field forms, and GPS/GIS data dictionaries.
Communicate with Crew Leader, Project Leader, I&M Network Coordinator, and Park GIS/Data Management office.
Develop and maintain overall Network and individual Vital Sign GPS Operating Guidelines and relationship to national standards and procedures.
Park GIS/Data Management office
Coordinate and integrate local GIS and resource information management with Network, regional, and National standards.
Support park management objectives.
Appendix D: Using the Global Positioning System and Portable Data Recorders

xxxviii • Appendix VII: Data and Information Management Plan
Information Resources Lifecycle Data collected using GPS-enabled equipment represents all or part of the acquisition stage of an information resources lifecycle that includes several other stages (see Table 5.1 in GRYN Data and Information Management Plan). Data collection using the same equipment may also relate to the data maintenance stage of the Lifecycle. Whether GPS equipment includes data logging functionality, or Portable Data Recorders (PDR’s) are GPS-enabled, it is most efficient to use a single device to collect and store data about both the location and characteristics of features for inventory and monitoring projects. The process and methodology used for acquisition planning, data collecting, and post-processing incorporate several aspects of data management, including quality assurance, data storage and organization, and data stewardship. To promote data quality and simplify data management, the Greater Yellowstone Network expects to use electronic data logging equipment for some data acquisition. However, parallel or complementary use of hand written data sheets and field notes will remain important for data collection activities. Mission Planning and Preparation Information gathering and mission planning are essential requirements that help protect investments in field data collection efforts that result in data that meet the requirements of the inventory or monitoring project. It is a chance to anticipate and prepare for the challenges as well as take advantage of the opportunities related to field data collection. Read the monitoring plan and protocol for the vital sign or the inventory project plan. It provides the context and details for the overall effort and approach, which may include using the GPS and GPS-enabled equipment. Read National Park Service standard GPS operating procedures: Field Data Collection with Global Positioning Systems Standard Operating Procedures and Guidelines. Obtain training on GPS theory and on the use of GPS equipment. This may include commercially or academically available training and GRYN-sponsored training. Obtain training and experience in map reading, using a compass, and orienteering because battery powered electronic GPS equipment is not fail-proof and should not be relied on as the only means of navigation. Work with the network data manager to identify and become familiar with the database(s) that will store and manage the results of the GPS data collection. In most cases the data will ultimately reside with related data in one or more corporate databases managed by the National Park Service, other federal agency databases, national park databases, and I&M Network databases. Work with the Network data manager and project leader to design field forms and electronic data collection forms (e.g. Trimble© Data Dictionary, ArcPad© application, or other). The design of the form(s) is determined by the inventory and monitoring objectives, their protocols, and existing or co-developed database structures. For example, know and use existing database field names in forms rather than locally invented names. All data dictionaries and field forms will include the Vital Sign Monitoring Plan or inventory study plan title, version number and publication date. This information is a critical element of required metadata for all data
Appendix D: Using the Global Positioning System and Portable Data Recorders

Vital Signs Monitoring Plan • xxxix
collected based on a given monitoring plan or inventory study plan. The NPS Natural Resource Database Template (NRDT) Data Dictionary documentation and database design structure is the appropriate starting point for database development. The NRDT sample databases and the I&M web-based monitoring protocol clearinghouse should also be consulted for existing databases that can be adapted to serve GRYN data management requirements. Obtain as much information as possible about the field site(s) through site reconnaissance, dialogue with individuals who are familiar with the site and topographic or other maps. Use GPS planning software such as Trimble Planning Software (www.trimble.com) or equivalent to predict satellite availability, account for site visibility obstructions, and determine the best observation periods related to GPS receiver settings, as well as predict hours which the field crew can work on site under favorable conditions for satellite reception. Print tables and graphs from the planning software to take to the field. Reliable results from planning depend on a current almanac file. Current almanac files can be downloaded from a recently used GPS unit to the planning software. If the GPS unit has not been used for more than three weeks, first acquire an updated almanac by powering on the unit outdoors. The almanac file can take up to 15 minutes to refresh. Practice collecting and post-processing data in real-world conditions before undertaking official data collection missions. Expect to learn a lot during initial field sessions and post-processing efforts, and expect to learn some little tip or trick on every subsequent data collection mission. Understand the power requirements of the equipment and plan for the batteries and other power sources (battery recharging, 12V DC (auto) adapters, etc) necessary to support the duration of your mission. Document and communicate any and all deviations from these procedures along with any events or circumstances from the field that affect the viability of using these procedures. This feedback is necessary for data documentation and to continually improve these procedures. Include in electronic field data forms (e.g. Trimble GPS data dictionaries) only those parameters or attributes specified in the monitoring protocol or inventory criteria that require on-site measurement, observation, or description. This reduces data collection cost and promotes data quality. Other required attributes for a given database will be incorporated with the data following field work. This approach allows field personnel to focus on protocol-specific data collection using uncomplicated forms that include pick lists of valid attribute values. It also saves space on portable electronic data recorders and helps to enforce proper data flow and prompt verification of field data. For example, don’t include or require the entry of administrative data such as state, county, or quad names. These known geospatial attributes are easily joined later using a GIS and unnecessarily take up field time and PDR space.
Field Data Collection Only collect data with equipment and field forms that are approved by the GRYN project leader and GRYN data manager.
Appendix D: Using the Global Positioning System and Portable Data Recorders
xl • Appendix VII: Data and Information Management Plan
Consider using an external antenna with a ground plane where appropriate to maximize satellite reception. External antennas can be mounted above a person’s head and body to provide better reception and remove the sensor from internal noise of the GPS receiver. Always use a restraint system (neck/wrist lanyard, hand strap, clamp, etc) to secure the equipment and prevent accidental damage or loss. Verify or set GPS configurations. Do this at the beginning of each session unless you were the last person to use the equipment, in which case you probably already know the settings. Use proper receiver settings from NPS Field Data Collection with Global Positioning Systems Standard Operating Procedures and Guidelines. This includes PDOP, SNR, elevation masks, minimum satellites, and antenna height. Distinguish between the navigation and data collection portions of the mission and use appropriate GPS configurations for each. For general navigation use more forgiving settings. For precise navigation in the vicinity of a target location and for feature data collection, use settings that yield the most precise location possible while still allowing the receiver to record positions. When field conditions, including terrain and canopy, and/or timing conditions, such as fall and winter missions, prevent reception using NPS recommended settings, use the best possible settings that permit the receiver to record positions. In all cases perform differential correction during post processing to improve the precision of the location data. With Trimble GeoExplorer equipment, use only one rover file per day for each data dictionary. (In some cases a GPS operator may support integrated monitoring using more than one data dictionary, but preferably the integrated data elements will reside in a single data dictionary.) This minimizes post-processing time required to merge multiple field files. For extended backcountry missions over multiple days, the investment in data collected is at risk from accidental loss and a field backup solution is desired but sometimes not practical depending on the PDR equipment. Whenever possible, back up field data at least once each day to a secondary device. Post Processing The Greater Yellowstone Network requires all GPS data to be post processed, including differential correction and data verification, preferably by the individual(s) who collected the data. It is important to perform the differential correction and verification as soon as possible following the field work (strongly preferred within two weeks) in order to maintain and apply the knowledge and memories of the field crew to the data.
Appendix D: Using the Global Positioning System and Portable Data Recorders
Processing location and attribute data once the equipment and personnel return to the office after a data collection mission involves several steps that serve key data management requirements. Processing stages include organizing and securing the data, improving the accuracy of feature locations (differential correction), verifying and making corrections where necessary, and
What about Real Time Differential Correction? Due to predominantly mountainous terrain in and around the parks and the lack of coverage by land based beacons transmitting the differential correction signals, most missions will not benefit from real time differential correction. Exceptions include operating in areas covered by real time signals and subscriptions to satellite based real time signals.

Vital Signs Monitoring Plan • xli
exporting the data to GIS and/or other required formats. Once the data makes it through post processing it can be merged with related data using GIS and RDBMS, become part of larger datasets, and enter the realm of corporately managed data in relevant database structures and at administrative levels including park and national databases. Establish a PC file structure Use a standard file structure to manage the various stages of file processing. All files should be stored on a disk that is backed up daily. Subfolders for each data collection project should accommodate field (rover) files, base files, differentially corrected files, validated files, exported files for incorporating in a GIS, and any other required export formats. Transfer PDR Data Use Trimble’s Data Transfer program to copy the rover files from the GPS receiver to the local PC. Be aware that rover files and differentially corrected files must be stored in the same folder so they can be opened together in Pathfinder Office’s Map View for a visual representation of the differential correction results. Comparing uncorrected and corrected data is not mandatory but it is useful in building trust in and understanding the process. Look at (don’t touch) rover file(s) While it doesn’t make sense to edit rover files that aren’t differentially corrected, you should look at and understand each stage of the data so you know what is happening during the process. Looking at the ‘raw’ rover data provides visual verification that the rover file contains the data you expect to see and is adequate for further processing. You probably also verified this in the map screen on the GPS receiver or portable data recorder, so it should look similar (nicer and bigger) on the PC screen. Perform Differential Correction Use Trimble’s Differential Correction Utility to improve the precision of the features. Use the closest base station provider if possible. If the closest station’s data is unavailable or the base files will not transfer, try the next closest station. Call the GRYN data manager if you cannot obtain any base data for your rover files. Base station operators might archive the station data after two or three months, so it is advised to correct (and validate) your data immediately – within a few days of field work. Verify and correct the differentially corrected data Many times the differentially corrected data requires additional edits to fix missing or extraneous positions and correct attribute values. Differential Correction in the previous step uses available positions and geometry to improve the location accuracy of your feature data. The most important part of post processing is verification of the feature types and attributes by the person who collected the data. It is especially important to verify and “manually correct” for potentially missing positions during periods of poor satellite signal reception when the GPS receiver may not have logged enough positions to describe the feature alignment or location. IMPORTANT: Prior to performing any edits to the corrected file make a copy in the folder that will hold validated data files. Depending on the feature type(s) and number of attributes, verification and edits can take a substantial amount of time. Save often during lengthy edit sessions. Remember, this is the last best chance for verifying and improving data quality for
Appendix D: Using the Global Positioning System and Portable Data Recorders

xlii • Appendix VII: Data and Information Management Plan
data that is expected to support inventory and monitoring objectives over several years or decades. One goal of verification is to delete errant positions that result in spikes or ‘spaghetti’ in line and area features (point features generally don’t need to be edited due to their spatial simplicity). Spikes in line and area features are usually caused by unavoidable multi-path signals, and messy spaghetti of overlapping lines are caused by collecting too many positions in too short a distance along the feature – this can be avoided by using the Pause/Resume key on the GPS receiver while collecting positions. Another part of data verification is to check, and change if necessary, the attribute values for the features.
Appendix D: Using the Global Positioning System and Portable Data Recorders
Understanding map scale. It is helpful to know that generic use of the term ‘scale’ in many natural resource discussions contrasts with explicit numeric ratios (map scales) that relate distance between features on a map to the true ground distance represented. For example, a map with scale 1:100 (0.01) means that one distance unit on the map represents 100 of the same distance units on the ground. Compared to a 1:100,000 (0.00001) scale map, the 0.01 scale ratio is larger and the map depicts a smaller area. So, maps with small scale ratios represent larger areas than maps with large scale ratios and vice versa. This differs from the more intuitive understanding of scale in a statement like “The project involves a large scale analysis of several ecological parameters,” which is normally interpreted as a project involving a large area.
The features should represent a mapped model of what exists on the ground but should not be ‘perfect’. That is, don’t zoom in so much that you spend hours fine tuning one feature. Use the scale factor displayed in the upper left of the Pathfinder Office Map View window to relate to the purpose of the data. Data is expected to at least meet National Map Accuracy Standards for maps on publication scales larger than 1:20,000 scale (http://rockyweb.cr.usgs.gov/nmpstds/nmas.html). Sometimes you need to zoom in at larger scales (smaller areas) to find and fix the spaghetti and spikes in your features, but don’t zoom to 1:100 scale and spend a lot of time there. Usually with position log intervals of 1 second or greater, you can see most of the ‘messy stuff’ at scales less than 1:2000. However, pay extra attention to data that represent places where you collected several positions in a line feature over a short distance, or stood in one place without pausing the collection of positions. These are circumstances where the data tends to get ‘messy’ and needs to be edited to clean it up. As you become familiar with the relationships between equipment operation, your movements in the field as the ‘platform’ for the GPS equipment, and the resulting data, you will collect and produce cleaner data that takes less post-processing effort. Open the corrected file in Pathfinder Office. (Optionally and carefully, you can open both the rover file (.ssf) and the corrected file (.cor) for the same Trimble data to compare the two. If you do this, it is recommended that before you edit the corrected features, you close all open files and reopen only the corrected file to avoid confusion about which file is which because you want to be sure to edit the corrected file rather than the rover file.) IMPORTANT: Prior to performing any edits to the corrected file, create a copy of the corrected file in the folder for validated files. This helps keep track of the processing stage of the data file, and effectively leaves a ‘backup’ of the differentially corrected file in case there is a problem during the edit session. The “validated” folder will hold all the data that you’ve spent significant time processing and cleaning up.

Vital Signs Monitoring Plan • xliii
From the “Data” menu in Trimble Pathfinder Office, make sure “Feature properties” and “Position Properties” are checked so they are visible on screen. If you don’t see them, use the “Window” menu to tile or cascade the windows and then arrange them agreeably. You can also make the ‘timeline’ visible if it helps. Keeping the feature properties window bigger than position properties lets you see all or more of the attribute values and distinguishes between the windows so you don’t accidentally delete a feature when you meant to delete a position. Remember that you can undelete until you save the edits. If you really mess up the edits, you can always start over with a fresh copy of the corrected file or by differentially correcting the rover file again. Use the tools for zooming and panning to navigate among and along the features to examine them for spikes and spaghetti. Remember not to zoom in too much in an attempt to make the features perfect. Try a zoom scale of 1:2000. You may need to zoom in more on a certain messy area, but remember to zoom back out again to validate other parts of the feature. Use the arrow tool to select features and positions. Look at the position properties and feature properties windows for information and clarification. Once the corrected data is validated and edited make sure it is saved to the folder containing validated files for that project. Copy the validated data to a network drive or other backup device before proceeding. Once the same file is on both the local PC and the backup device (always try to keep each file in two places), it is safe to delete the rover file from the PDR in preparation for the next collection session. Inform the project manager and data manager about the validated status and file location. Work with the project manager and data manager to document the data fields, value domains, and other required metadata elements according to FGDC Metadata Standards. Creating the GIS Data Exporting files from GPS format to GIS format is an important step that nearly completes the GPS data acquisition portion of the information resources lifecycle, and provides an important opportunity to add value and utility to the data by including feature level metadata with the exported files. Use the Trimble Pathfinder Office export utility to output the appropriate GIS format based on discussion with the network data manager. The network requires the following GPS Generated Attributes with exported data: Generated Attributes for all feature types: PDOP, Correction Status, Receiver Type, Date Recorded, Update Status, Data File Name, Total Positions, Data Dictionary Name (As specified in the Mission Planning section of this document, the data dictionary name represents and links to the specific version of a Vital Sign monitoring protocol).
Appendix D: Using the Global Positioning System and Portable Data Recorders

Appendix D: Using the Global Positioning System and Portable Data Recorders
xliv • Appendix VII: Data and Information Management Plan
Generated Attributes for point features: Height, Vertical Precision, Horizontal Precision, Standard Deviation Generated Attributes for line features: Length (2D), Length (3D), Average Vert. Precision, Average Horiz. Precision Generated Attributes for area features: Area (2D), Perimeter (2D), Perimeter (3D), Average Vert. Precisions, Average Horiz. Precision Verify the GIS data generated from the GPS data source to make sure the conversion was successful and the spatial, attribute, and GPS metadata elements exist. If problems are discovered, reexamine the GPS data source and the procedures used to convert to GIS format. If necessary, consult with the network data manager or park GIS Specialist to solve the problem. Cleaning Up Unneeded Files If the GIS data from the PDR/GPS source is complete and backed up in at least one other location, archive the corrected and validated GPS data files and delete the rover files, base data files, and other files generated during the GPS portion of post-processing. Provide the archived GPS data to the network data manager in a standard compressed and zipped format, i.e. Winzip.
Vital Signs Monitoring Plan • xlv
References References are available online or by request from GRYN Data Manager. Field Data Collection with Global Positioning Systems Standard Operating Procedures and Guidelines, NPS, 02/10/04 http://www.nps.gov/gis/fm/documents/Field_Data_Collection_with_GPS02-04.doc GRYN Server: U:\Data_Info_Management\Acquisition\Field_Data_Collection_with_GPS02-04.doc(6/29/04 download) DRAFT GPS Data Accuracy Standard, US Forest Service, March 14, 2000 http://www.fs.fed.us/database/gps/gps_standards/GPS_Data_Standard.pdf GRYN Server: U:\Data_Info_Management\Acquisition\USFS_Draft_GPS_Data_Standard.pdf (6/29/04 download) National Park Service GPS for GIS Workflow, www.nps.gov/gis/gps/gps4gis/ Natural Resource Database Template, Inventory and Monitoring Program, National Park Service, http://science.nature.nps.gov/im/apps/template/index.htm Protocol Database, Inventory and Monitoring Program, National Park Service, http://science.nature.nps.gov/im/monitor/protocoldb.cfm GPSToolBox, Alaska Support Office, National Park Service, http://www.nps.gov/gis/gps/aksogps/ GPS to GIS Procedural Handbook & Reference Guide VERSION 6.0, San Juan National Forest, US Forest Service, 12/08/2003. GRYN Server: U:\Data_Info_Management\Acquisition\USFS_San_Juan_gps_gis_v6-0.pdf Class Notes – Design, Capture, Edit, And Integration Of Resource-Grade Trimble® GPS Data, Coconino National Forest, US Forest Service, January 2004 National Park Service Geography and Mapping Technologies, www.nps.gov/gis National Park Service Global Positioning Systems, www.nps.gov/gis/gps/ USDA Forest Service GPS, www.fs.fed.us/database/gps/ Trimble Navigation Limited, 2004, www.trimble.com
Appendix D: Using the Global Positioning System and Portable Data Recorders
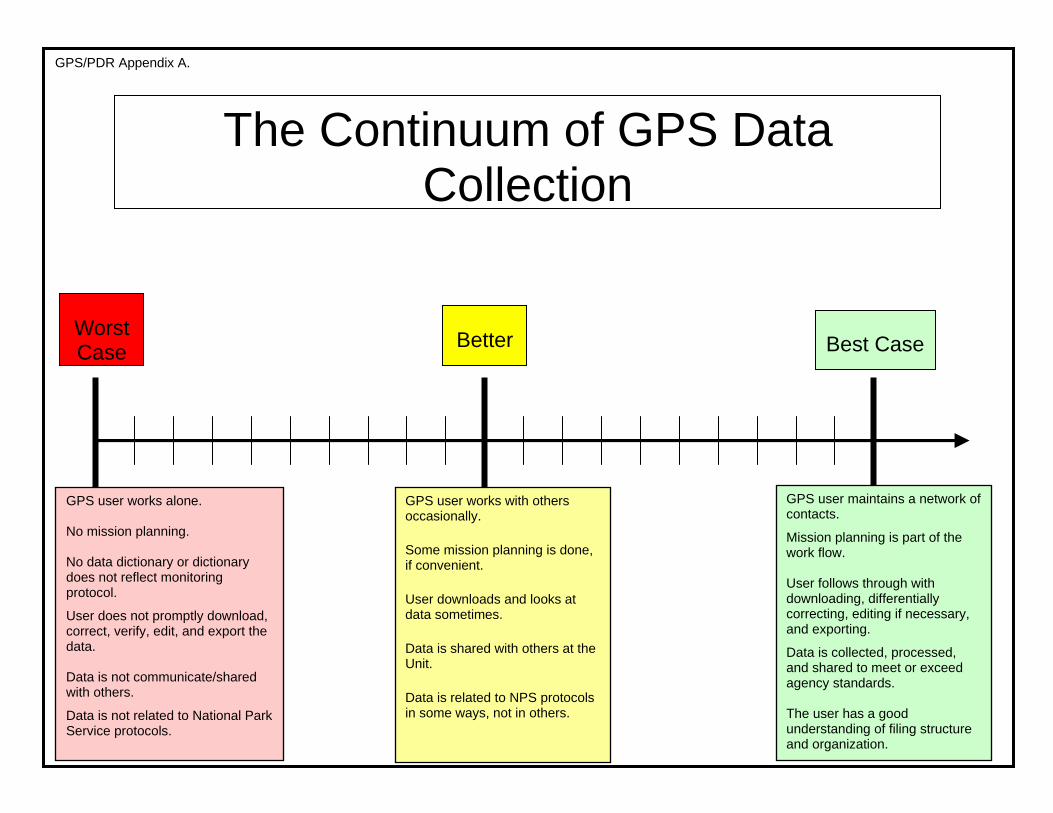
Appendix D: Using the Global Positioning System and Portable Data Recorders
46 • Appendix VII: Data and Information Management Plan
Worst Case Better
GPS user works alone. No mission planning. No data dictionary or dictionary does not reflect monitoring protocol.
User does not promptly download, correct, verify, edit, and export the data. Data is not communicate/shared with others.
Data is not related to National Park Service protocols.
GPS user maintains a network of contacts.
Mission planning is part of the work flow. User follows through with downloading, differentially correcting, editing if necessary, and exporting.
Data is collected, processed, and shared to meet or exceed agency standards. The user has a good understanding of filing structure and organization.
GPS user works with others occasionally.
Some mission planning is done, if convenient.
User downloads and looks at data sometimes.
Data is shared with others at the Unit.
Data is related to NPS protocols in some ways, not in others.
Best Case
The Continuum of GPS Data Collection
GPS/PDR Appendix A.

GPS/PDR Appendix B. NPS Natural Resource Database Template Data Dictionary The NRDT is a developing tool for data management that will change over time. For the current version of the NRDT Data Dictionary refer to the NRDT web site (checked 9/27/2005): http://science.nature.nps.gov/im/apps/template/index.htm For hardcopy distribution of the NPS Natural Resource Database Template Data Dictionary as an attachment to this GPS/PDR Standard Operating Procedure, print and attach the latest version from the online link above. The latest version is filed at this location on the GRYN server: G:\Natural_Resource_databases\Database_template\DATA DICTIONARY.DOC (version 10/9/2002)
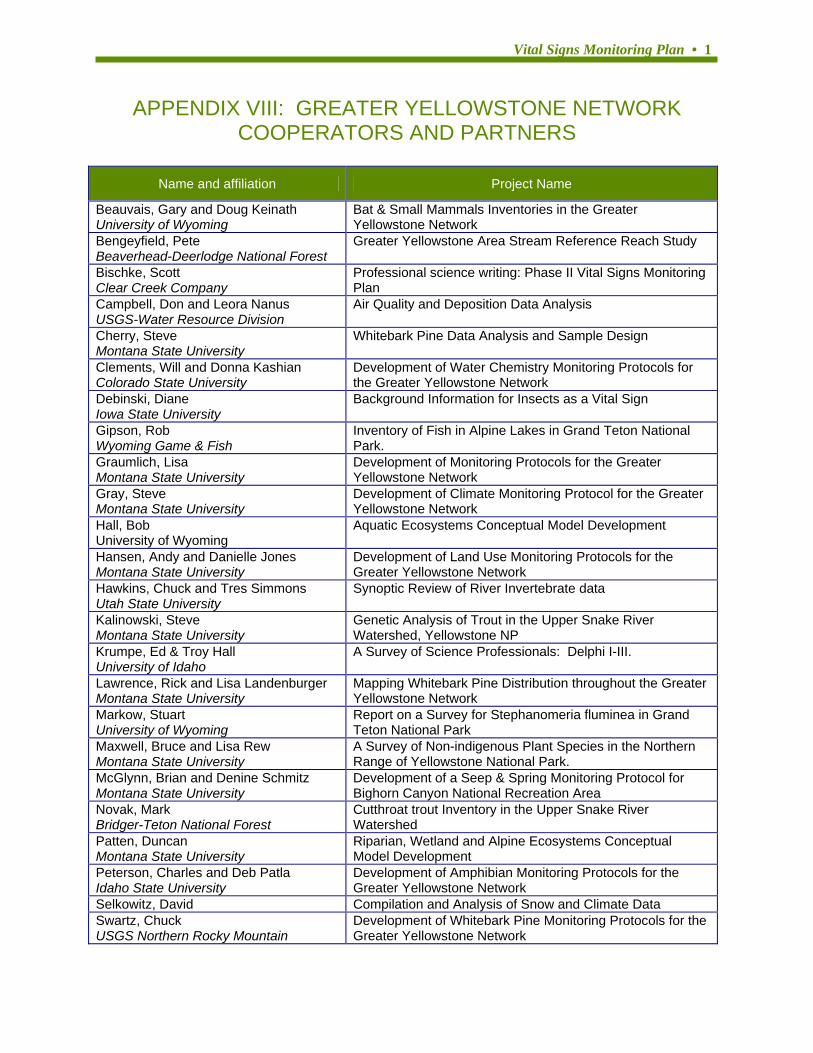
Vital Signs Monitoring Plan • 1
APPENDIX VIII: GREATER YELLOWSTONE NETWORK COOPERATORS AND PARTNERS
Name and affiliation Project Name
Beauvais, Gary and Doug Keinath University of Wyoming
Bat & Small Mammals Inventories in the Greater Yellowstone Network
Bengeyfield, Pete Beaverhead-Deerlodge National Forest
Greater Yellowstone Area Stream Reference Reach Study
Bischke, Scott Clear Creek Company
Professional science writing: Phase II Vital Signs Monitoring Plan
Campbell, Don and Leora Nanus USGS-Water Resource Division
Air Quality and Deposition Data Analysis
Cherry, Steve Montana State University
Whitebark Pine Data Analysis and Sample Design
Clements, Will and Donna Kashian Colorado State University
Development of Water Chemistry Monitoring Protocols for the Greater Yellowstone Network
Debinski, Diane Iowa State University
Background Information for Insects as a Vital Sign
Gipson, Rob Wyoming Game & Fish
Inventory of Fish in Alpine Lakes in Grand Teton National Park.
Graumlich, Lisa Montana State University
Development of Monitoring Protocols for the Greater Yellowstone Network
Gray, Steve Montana State University
Development of Climate Monitoring Protocol for the Greater Yellowstone Network
Hall, Bob University of Wyoming
Aquatic Ecosystems Conceptual Model Development
Hansen, Andy and Danielle Jones Montana State University
Development of Land Use Monitoring Protocols for the Greater Yellowstone Network
Hawkins, Chuck and Tres Simmons Utah State University
Synoptic Review of River Invertebrate data
Kalinowski, Steve Montana State University
Genetic Analysis of Trout in the Upper Snake River Watershed, Yellowstone NP
Krumpe, Ed & Troy Hall University of Idaho
A Survey of Science Professionals: Delphi I-III.
Lawrence, Rick and Lisa Landenburger Montana State University
Mapping Whitebark Pine Distribution throughout the Greater Yellowstone Network
Markow, Stuart University of Wyoming
Report on a Survey for Stephanomeria fluminea in Grand Teton National Park
Maxwell, Bruce and Lisa Rew Montana State University
A Survey of Non-indigenous Plant Species in the Northern Range of Yellowstone National Park.
McGlynn, Brian and Denine Schmitz Montana State University
Development of a Seep & Spring Monitoring Protocol for Bighorn Canyon National Recreation Area
Novak, Mark Bridger-Teton National Forest
Cutthroat trout Inventory in the Upper Snake River Watershed
Patten, Duncan Montana State University
Riparian, Wetland and Alpine Ecosystems Conceptual Model Development
Peterson, Charles and Deb Patla Idaho State University
Development of Amphibian Monitoring Protocols for the Greater Yellowstone Network
Selkowitz, David Compilation and Analysis of Snow and Climate Data Swartz, Chuck USGS Northern Rocky Mountain
Development of Whitebark Pine Monitoring Protocols for the Greater Yellowstone Network
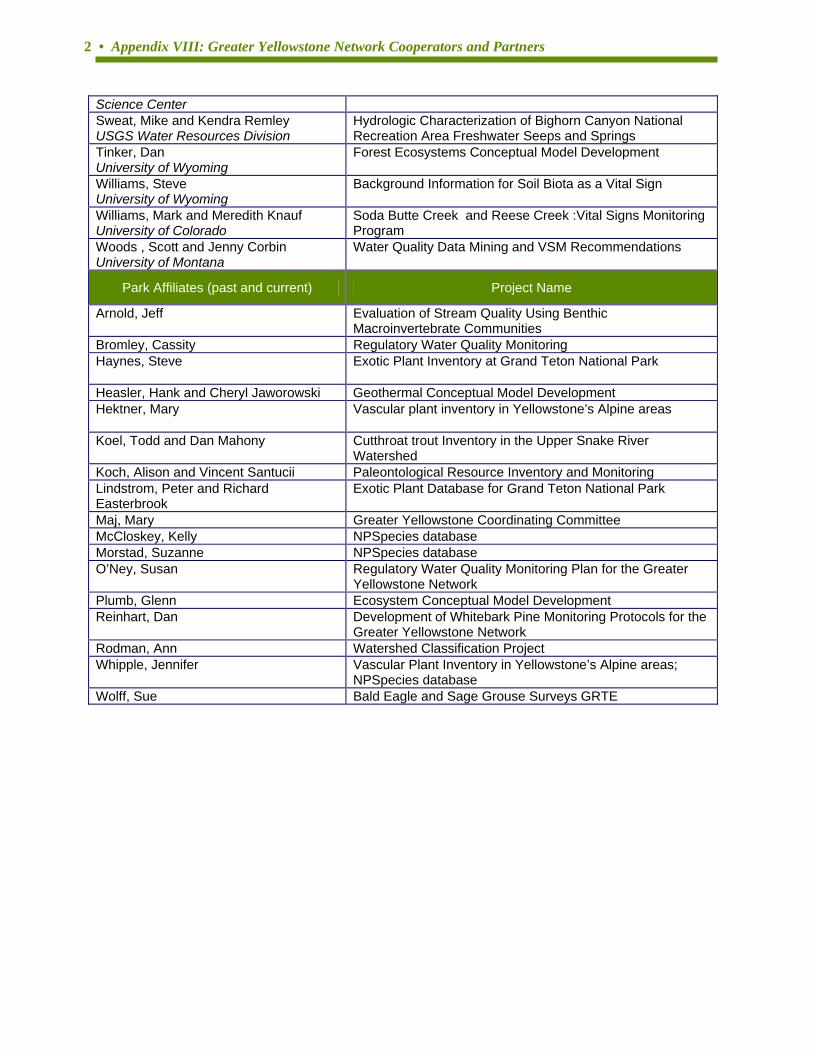
2 • Appendix VIII: Greater Yellowstone Network Cooperators and Partners
Science Center Sweat, Mike and Kendra Remley USGS Water Resources Division
Hydrologic Characterization of Bighorn Canyon National Recreation Area Freshwater Seeps and Springs
Tinker, Dan University of Wyoming
Forest Ecosystems Conceptual Model Development
Williams, Steve University of Wyoming
Background Information for Soil Biota as a Vital Sign
Williams, Mark and Meredith Knauf University of Colorado
Soda Butte Creek and Reese Creek :Vital Signs Monitoring Program
Woods , Scott and Jenny Corbin University of Montana
Water Quality Data Mining and VSM Recommendations
Park Affiliates (past and current) Project Name
Arnold, Jeff Evaluation of Stream Quality Using Benthic Macroinvertebrate Communities
Bromley, Cassity Regulatory Water Quality Monitoring Haynes, Steve
Exotic Plant Inventory at Grand Teton National Park
Heasler, Hank and Cheryl Jaworowski Geothermal Conceptual Model Development Hektner, Mary
Vascular plant inventory in Yellowstone’s Alpine areas
Koel, Todd and Dan Mahony Cutthroat trout Inventory in the Upper Snake River Watershed
Koch, Alison and Vincent Santucii Paleontological Resource Inventory and Monitoring Lindstrom, Peter and Richard Easterbrook
Exotic Plant Database for Grand Teton National Park
Maj, Mary Greater Yellowstone Coordinating Committee McCloskey, Kelly NPSpecies database Morstad, Suzanne NPSpecies database O’Ney, Susan Regulatory Water Quality Monitoring Plan for the Greater
Yellowstone Network Plumb, Glenn Ecosystem Conceptual Model Development Reinhart, Dan
Development of Whitebark Pine Monitoring Protocols for the Greater Yellowstone Network
Rodman, Ann Watershed Classification Project Whipple, Jennifer
Vascular Plant Inventory in Yellowstone’s Alpine areas; NPSpecies database
Wolff, Sue Bald Eagle and Sage Grouse Surveys GRTE
Vital Signs Monitoring Plan • 1
APPENDIX IX: COMMUNICATION PLAN GREATER YELLOWSTONE INVENTORY AND
MONITORING NETWORK
NATIONAL PARK SERVICE
COMMUNICATIONS PLAN
NOVEMBER 26, 2004
ANNE SCHRAG
Research Associate
Forestry Sciences Laboratory Montana State University
1648 S. 7th Avenue Bozeman, Montana 59717
http://www.nature.nps.gov/im/units/gryn/index.shtml
November 26, 2004 GRYN Communications Plan Page 1 of 8
2 • Appendix IX: Communications Plan
INTRODUCTION The Greater Yellowstone Network (GRYN) is an inventory and monitoring network within the National Park Service (NPS) Inventory and Monitoring (I&M) Program. The mission of the National Park Service (NPS) is “to conserve unimpaired the natural and cultural resources and values of the national park system for the enjoyment of this and future generations”. To uphold this goal, the NPS created the Natural Resource Challenge in 2000 to encourage national parks to focus on the preservation of the nation’s natural heritage through science, natural resource inventories and expanded resource monitoring and management. This Challenge was legally guided by the National Parks Omnibus Management Act of 1998. Through the Natural Resource Challenge, the 265 parks of the NPS were placed into seven regions and, subsequently, organized into thirty-two inventory and monitoring networks, based on geographic and ecological similarities. The overarching goal of the networks can be summarized by the following quote from the NPS Advisory Board in July 2001: “A sophisticated knowledge of resources and their condition is essential. The Service must gain this knowledge through extensive collaboration with other agencies and academia, and its findings must be communicated to the public. For it is the broader public that will decide the fate of these resources”. The goals of the National I&M Program are:
1. Determine status and trends in selected indicators of the condition of park ecosystems to allow managers to make better-informed decisions and to work more effectively with other agencies and individuals for the benefit of park resources.
2. Provide early warning of “abnormal” conditions and impairment of selected resources to help develop effective mitigation measures and reduce costs of management.
3. Provide data to better understand the dynamic nature and condition of park ecosystems and to provide reference points for comparisons with other, altered environments.
4. Provide data to meet certain legal and Congressional mandates related to natural resource protection and visitor enjoyment.
5. Provide a means of measuring progress toward performance goals. COMMUNICATIONS PLAN GOALS The GRYN Communications Plan outlines the communications products and strategies (those required by the National I&M Program and those more specific to the GRYN) and the target audience of these products. As well, after implementation, the communications plan should lead to:
• consistency and repetition in communicating the goals and purposes of the GRYN • increased cooperation within the GRYN and effectiveness in communicating these goals • the elimination of contradictory/conflicting messages • the reinforcement and strengthening of the overall goal of the network • increased awareness of the network to internal/external members • increased understanding of network goals by internal/external members • increased willingness to accept and support network
MAIN AUDIENCES For the GRYN to be successful in communicating its purpose and progress toward inventory and monitoring, it is essential that the network focus on five audiences: 1) the National I&M Program

Vital Signs Monitoring Plan • 3
and Congress; 2) the GRYN Board of Directors, Technical Committee and Science Committee; 3) Yellowstone National Park, Grand Teton National Park and Bighorn Canyon National Recreation Area park managers and employees and audiences external to the NPS including: 4) academic community; 5)other government agencies; 6) non-profit/non-governmental organizations; and 7) the general public. PRODUCTS PRODUCTS RECOMMENDED BY THE NATIONAL I&M PROGRAM The following reports are highlighted by the National I&M Program as methods for information dissemination:
• Annual Administrative Report and Work Plan • Annual reports for specific protocols or projects • Inventory project reports • Analysis and synthesis reports—trends • Program and protocol review reports • Scientific journal articles and book chapters • Symposia, workshops and conferences • State of the Parks Report
ADDITIONAL COMMUNICATION TOOLS USED BY THE GRYN In addition to the products recommended by the National I&M Program, the GRYN will use the following methods for informing a variety of audiences:
• Monthly reports • Submissions to the BNR report at Yellowstone • Submissions of links for the Intermountain Region report • Visual identity system • Public brochures • Posters for network parks about the I&M program • Data management reports • Ongoing list of network cooperators • Website • Popular press articles
The intended audiences for these reports will be covered in the following section. SPECIFIC INFORMATION CONCERNING COMMUNICATIONS PRODUCTS Each of the listed communication products will be covered in more detail, including the following information: 1) definition and intended audience; 2) frequency of reporting; 3) purpose and content of the report; 4) author of the report; and 5) reporting format. ANNUAL ADMINISTRATIVE REPORT AND WORK PLAN
November 26, 2004 GRYN Communications Plan Page 3 of 8
4 • Appendix IX: Communications Plan
Definition: The Annual Administrative Report and Work Plan (AARWP) is required by the National I&M Program and the Washington Office (WASO) as a way to account for funds used during the fiscal year. In order to accomplish this, the report requires that the network account for funds used during the past fiscal year towards completing a list of accomplishments written in the previous year’s work plan. Furthermore, the AARWP requires the creation of a budget and work plan for the following year, including staffing, cooperative agreements, contracts, miscellaneous, etc. Frequency: The AARWP is due on an annual basis. The Annual Administrative Report and Draft Work Plan should be reviewed by the Technical Committee prior to submission to WASO on November 8. The final Work Plan is due to WASO by January 31. Purpose: The purpose of the report is to account for money spent and employees hired during the fiscal year. A section of the report called “Summary of Major Accomplishments” is inserted into the annual report to Congress to obtain future funding for the program. Author: The primary author of the report is the network program manager, with additional input from network staff on the year’s accomplishments. The Technical Committee will review the report, and the Board of Directors must approve the report before submission. Then, the Intermountain Regional Office and the National I&M Program Manager will review the report and give approval. Format: The format of the report is outlined by the national program each year. MONITORING PROTOCOLS Definition: Protocols created for the network are required to follow a Service-wide format, which is documented by Oakley et al. (2003). When a final protocol format has been decided upon, it will then serve as the template for all further protocols developed for the network. Frequency: Protocols will be developed once for each vital sign; they will be updated on an as-needed basis and after the program review occurs. Purpose: Protocols are used to integrate information concerning applicability, reliability and feasibility into a coherent whole that guides sampling design and data collection for vital signs monitoring. Author: Protocols will be written by staff with help from collaborators in the academic community and other agencies. Format: The protocols will follow the guidelines in Oakley et al. (2003) at a minimum, with additional information provided in a format agreed upon by network staff. INVENTORY PROJECT REPORTS Definition: An inventory project report documents the products of an inventory project, including species documented, new species found, data collected, etc.

Vital Signs Monitoring Plan • 5
Frequency: Inventory reports should be completed at the end of the inventory, although an annual synopsis of interesting results is helpful to network staff. Purpose: The inventory report should detail the methods and results of the inventory project, as well as provide a list of species officially documented as occurring in the network parks. This report should also include the sites sampled and the distribution of the species within these sites. Author: This report will be completed by the inventory project leader. Format: Inventory reports follow a variety of formats. ANALYSIS AND SYNTHESIS REPORTS Definition: Three synthesis reports will be developed by the GRYN. First, a full-length report detailing the status and management options with regard to the vital signs will be developed to provide a synthesis of the progress of monitoring, as well as a picture of overall ecosystem health. Also, a detailed synthesis report will be provided that includes information needed to make day-to-day, on-the-ground management decisions. Finally, an annual progress report will synthesize the year’s activities and provide a synopsis for interested parties. Frequency: Full-length synthesis report: every ten years; detailed synthesis report: at least once every ten years; and the annual progress report: once per year Purpose: These reports will provide a synthesis of monitoring progress and a picture of the overall state of the ecosystem. Author: The synthesis reports will be written by network staff, particularly the ecologist. Format: To be determined. PROGRAM REVIEW REPORTS Definition: Review reports of the program are used as a formal review of program progress at various intervals. Frequency: The National I&M Program recommends the completion of these reports on five-year intervals, and the network will begin these reviews in 2008. Purpose: These reports are meant to review operations and results obtained by the program. If changes in protocols are determined to be necessary, they should be included in this report. Author: This report will be initiated by the program manager, with input from other cooperators and network staff. Format: The format will be determined once monitoring begins.
November 26, 2004 GRYN Communications Plan Page 5 of 8
6 • Appendix IX: Communications Plan
SCIENTIFIC JOURNAL ARTICLES AND BOOK CHAPTERS Definition: This includes articles published in peer-reviewed scientific journals or chapters published in books. Frequency: Variable. Purpose: These articles and chapters represent a method for the network and its cooperators to disseminate information gained through the I&M program to a larger scientific audience. Author: These articles will be prepared by network staff or cooperators. Format: The format is determined by the journal or book publisher. SYMPOSIA, WORKSHOPS AND CONFERENCES Definition: Symposia, workshops and conferences are interactive methods for engaging interested parties and communicating the objectives and progress of the I&M program and the GRYN to a wider audience, including external scientists and park managers. Frequency: Variable Purpose: These interactive methods help to connect with a wider audience, review progress, create new ideas or directions and communicate the purpose of the I&M program and the network. Author: These workshops are generally initiated by the program manager, with reports written by staff. Format: Workshop reports should be completed as soon as possible after the end of the workshop. Reports for large workshops should follow the GRYN Vital Signs Monitoring Workshop Report as a template. Smaller workshop reports should use the meeting note template created for the GRYN. MONTHLY REPORTS Definition: This report describes current happenings in the GRYN and is distributed to interested parties, including the Technical and Science Committees, Board of Directors, other network coordinators and participants in GRYN workshops. Frequency: This report is distributed during the latter half of each month. Purpose: The reports are meant to inform a large audience about current GRYN activities. Author: The GRYN research associate, with input from network staff, will create and distribute the report.

Vital Signs Monitoring Plan • 7
Format: The format should follow the standard monthly report format. SUBMISSIONS TO NETWORK PARK REPORTS Definition: Short synopses of current activities in the GRYN are distributed to network parks for inclusion in their monthly reports. Frequency: These reports are compiled on a monthly basis. Purpose: The reports will help to inform managers at the parks about current happenings in the GRYN. Author: The research associate and program manager will prepare these reports as relevant activities are completed. Format: The reports are submitted to the parks in standard text format. VISUAL IDENTITY SYSTEM Definition: The visual identity system defines the network and identifies it to external parties. Frequency: The system (including the logo, memorandum style and report style) should be used as frequently as possible. The NPS banner is another symbol that is encouraged by the NPS. Purpose: This system is meant to identify the network within the NPS, as well as increase awareness of the network to outside parties. Author: N/A Format: Standard NPS visual identity system components (such as the NPS banner) should be used on official documents, while internal documents can follow the format developed by the network (i.e., memos, reports, etc.). PUBLIC BROCHURES Definition: Brochures that describe ongoing monitoring efforts and problem statements pertaining to vital signs of interest. These brochures may also be used to provide a synopsis and update on the current progress of the network. Frequency: Variable. Purpose: These brochures will inform interested parties, in a concise manner, of the background of the I&M program, the GRYN and current happenings and can be distributed to interested parties (i.e., park managers, superintendents, the public) on an as-needed basis.
November 26, 2004 GRYN Communications Plan Page 7 of 8

8 • Appendix IX: Communications Plan
Author: Network staff will develop these brochures, with input from participating collaborators, agencies, etc. when possible. Format: Varies, depending on topic. DATA MANAGEMENT PLAN Definition: The data management plan describes the method for managing data pertinent to GRYN monitoring. Frequency: The final version of the plan should be complete in FY2005, with continual revisions as needed. Purpose: The purpose of the plan is to effectively communicate the scope of data management in the network and the method for managing data collected by and for the network. Author: The data management plan is written by the data manager, with help from other network data managers. Format: The format is determined by the national data management plan authors. WEBSITE Definition: The website serves as an online method for distributing information about GRYN activities, as well as providing a repository for reports and publications and templates for cooperators. Frequency: To be determined. Purpose: The website represents an efficient method for information dissemination to various parties quickly. Author: The data manager, with help from a web designer, will develop the new web-based interface for the GRYN. Format: To be determined.

Vital Signs Monitoring Plan • 1
APPENDIX X: GREATER YELLOWSTONE NETWORK CHARTER
CHARTER
OF THE GREATER YELLOWSTONE INVENTORY AND MONITORING NETWORK
(GRYN)
INTRODUCTION
The purpose of this document is to describe the basic practices that will be used to plan, organize, manage, evaluate and modify the efforts of the Greater Yellowstone Inventory and Monitoring Network (GRYN) in its pursuit of the intent and purposes of the of the National Park Service, Natural Resource Challenge with respect to the inventory and monitoring of natural resources. The Network is comprised of four units of the National Park system. They are Yellowstone National Park (YELL), Grand Teton National Park (GRTE), John D. Rockefeller National Parkway (JODR), and Bighorn Canyon National Recreation Area (BICA). BOARD OF DIRECTORS The Board of Directors of GRYN is committed to operate in and foster an atmosphere of fairness, trust, and mutual respect with all of the network partners. It will pursue a holistic approach in implementing the I&M program using scientifically credible standards while serving the needs of all network partners. RESPONSIBILITIES OF THE BOARD OF DIRECTORS
The major responsibilities of the GRYN Board of Directors will be to: • Promote accountability and oversee the I&M Program by reviewing progress
towards Servicewide and GRYN I&M goals as described in annual accomplishment reports and work plans.
• Provide guidance to the Technical Committee and natural resource staffs of the GRYN in the design and implementation of vital signs monitoring and other management activities related to the Natural Resource Challenge.
• Decide on strategies and procedures for leveraging GRYN funds and personnel to best accomplish the I&M and other natural resource needs of GRYN units.
• Consult on hiring of new personnel using funding provided to the GRYN, and from base funds or other sources.
• Seek professional guidance with other individuals, organizations and networks and promote productive partnerships between groups.
• Communicate the progress of the I&M program to park managers and park staff

2 • Appendix X: Greater Yellowstone Network Charter
MEMBERSHIP The GRYN Board of Directors is comprised of the superintendents of Yellowstone, Grand Teton (including JODR), and Bighorn Canyon units, or their designees, the NPS Research Coordinator of the Rocky Mountains Cooperative Ecosystem Studies Unit (RM-CESU) and the Intermountain Region's Inventory and Monitoring Coordinator (ex officio). The staff to the Board of Directors will be the I&M Program Manager and the chair of the Technical Committee. The initial Chair of the Board of Directors shall be the Yellowstone representative but Chair will rotate at two-year intervals to Bighorn Canyon NRA, Yellowstone NP and then Grand Teton NP representatives.
BOARD MEETINGS Any member can call meetings of the Board, but there will be at least two formal, announced meetings annually. Formal meetings will be called by the Board Chair, who will assure proper logistics and planning is done, and that a written agenda is distributed at least one week prior to the meeting. Conference calls may be scheduled by any Board member at any time. ALTERNATES AND QUORUMS Any Board member who cannot attend a meeting of the Board may assign an alternate who shall have full voting authority. Three officio Board members constitute a quorum. DECISION MAKING Every effort will be made by the Board members to reach unanimity on all significant decisions. When this is not possible, three of the four voting members constitute a majority decision. Decisions will be recorded in the meeting minutes and sent to all members in a timely fashion. If needed, the IMR Regional Director or designee will cast the tie-breaking vote. SCIENCE COMMITTEE The Science Committee (SC) will include five members of the scientific community who will assist the Technical Committee and the Board of Directors over the long term of the Inventory and Monitoring program to accomplish the following:
• Ensure the scientific credibility of the program by reviewing and commenting on GRYN monitoring plans and protocols
• Review the overall direction and program plans for the GRYN network • Make recommendations for future directions for the long term monitoring • Assist the network in leveraging activities with other groups and funding sources
The SC will meet twice a year to provide guidance to the network. They will also be asked to attend some workshops convened by the network. The Inventory and

Vital Signs Monitoring Plan • 3
Monitoring Program Manager is primary staff to the SC, with the Technical Committee providing assistance with meetings. TECHNICAL COMMITTEE The Technical Committee provides advice to the Board of Directors and assists as staff to the Science Committee. The primary mission of this committee is to guide the collection of existing information, take the lead in I&M planning for the network, and evaluate proposals, plans and final reports. To achieve these ends, the Technical Committee may call on other members of park staff or outside experts to assist with the review and planning. The Technical Committee includes at least one member of the natural resource staff from each of the member parks, the I&M Program Manager, the I&M Data Manager, the NPS-Research Coordinator from the RM-CESU and may include the Regional Inventory and Monitoring Coordinator. The chair will rotate every 12 months. The chair of the Technical Committee is responsible for organizing conference calls and workshops, preparing minutes and following up on recommendations of the committee. The chair communicates with the program manager (unless the same) and the program manager will communicate with the Board of Directors on issues that require their involvement.
PROCEDURES VITAL SIGNS MONITORING (VSM) PLAN: A monitoring plan to guide the long term program of the network will be prepared according to the schedule set out by the WASO-Inventory and Monitoring Program. The VSM plan will follow the outline provided to identify what will be monitored and why, where and how it will be monitored, with appropriate descriptions of protocols, quality assurance procedures and reporting. This plan will include a component for Water Quality Monitoring as specified in guidance from the NPS-Water Resources Division. ANNUAL ADMINISTRATIVE REPORT & WORK PLAN (AARWP): The I&M Program Manager, working with the Technical Committee, will complete an annual administrative report and work plan for consideration by the WASO-Inventory and Monitoring Program following content and completion guidelines. This plan will include specific tasks, milestones, products and a budget that implements the Inventory and Monitoring plans in place for GRYN. The plan will be reviewed by the Technical Committee and approved by the Board of Directors before being submitted to the Regional Office and WASO representatives.

4 • Appendix X: Greater Yellowstone Network Charter
FUNDING: Available I&M program funds will be distributed in strict accordance with approved annual work plans, following the guidance provided by the