Automatic OpenCL Device Characterization: Guiding Optimized Kernel Design
13
Automatic OpenCL Device Characterization: Guiding Optimized Kernel Design Peter Thoman, Klaus Kofler, and John Thomson University of Innsbruck Abstract. The OpenCL standard allows targeting a large variety of CPU, GPU and accelerator architectures using a single unified program- ming interface and language. While the standard guarantees portability of functionality for complying applications and platforms, performance portability on such a diverse set of hardware is limited. Devices may vary significantly in memory architecture as well as type, number and com- plexity of computational units. To characterize and compare the OpenCL performance of existing and future devices we propose a suite of mi- crobenchmarks, uCLbench. We present measurements for eight hardware architectures – four GPUs, three CPUs and one accelerator – and illustrate how the results accu- rately reflect unique characteristics of the respective platform. In addi- tion to measuring quantities traditionally benchmarked on CPUs like arithmetic throughput or the bandwidth and latency of various address spaces, the suite also includes code designed to determine parameters unique to OpenCL like the dynamic branching penalties prevalent on GPUs. We demonstrate how our results can be used to guide algorithm design and optimization for any given platform on an example kernel that represents the key computation of a linear multigrid solver. Guided manual optimization of this kernel results in an average improvement of 61% across the eight platforms tested. 1 Introduction The search for higher sustained performance and efficiency has, over re- cent years, led to increasing use of highly parallel architectures. This move- ment includes GPU computing, accelerator architectures like the Cell Broad- band Engine, but also the increased thread- and core-level parallelism in clas- sical CPUs [9]. In order to provide a unified programming environment capa- ble of effectively targeting this variety of devices, the Khronos group proposed the OpenCL standard. It includes a runtime API to facilitate communication with devices and a C99-based language specification for writing device code. Currently, many hardware vendors provide implementations of the standard, including AMD, NVIDIA and IBM. The platform model for OpenCL comprises a host – the main computer – and several devices featuring individual global memory. Computation is performed by invoking data-parallel kernels on an N-dimensional grid of work items. Each point in the grid is mapped to a processing element, and elements are grouped in compute units sharing local memory. Broad acceptance of the standard leads to the interesting situation where vastly different hardware architectures can be targeted with essentially unchanged code. However, implementations suited well to one platform may – because of seemingly small architectural differences – fail
Transcript of Automatic OpenCL Device Characterization: Guiding Optimized Kernel Design

Automatic OpenCL Device Characterization:Guiding Optimized Kernel Design
Peter Thoman, Klaus Kofler, and John Thomson
University of Innsbruck
Abstract. The OpenCL standard allows targeting a large variety ofCPU, GPU and accelerator architectures using a single unified program-ming interface and language. While the standard guarantees portabilityof functionality for complying applications and platforms, performanceportability on such a diverse set of hardware is limited. Devices may varysignificantly in memory architecture as well as type, number and com-plexity of computational units. To characterize and compare the OpenCLperformance of existing and future devices we propose a suite of mi-crobenchmarks, uCLbench.We present measurements for eight hardware architectures – four GPUs,three CPUs and one accelerator – and illustrate how the results accu-rately reflect unique characteristics of the respective platform. In addi-tion to measuring quantities traditionally benchmarked on CPUs likearithmetic throughput or the bandwidth and latency of various addressspaces, the suite also includes code designed to determine parametersunique to OpenCL like the dynamic branching penalties prevalent onGPUs. We demonstrate how our results can be used to guide algorithmdesign and optimization for any given platform on an example kernelthat represents the key computation of a linear multigrid solver. Guidedmanual optimization of this kernel results in an average improvement of61% across the eight platforms tested.
1 Introduction
The search for higher sustained performance and efficiency has, over re-cent years, led to increasing use of highly parallel architectures. This move-ment includes GPU computing, accelerator architectures like the Cell Broad-band Engine, but also the increased thread- and core-level parallelism in clas-sical CPUs [9]. In order to provide a unified programming environment capa-ble of effectively targeting this variety of devices, the Khronos group proposedthe OpenCL standard. It includes a runtime API to facilitate communicationwith devices and a C99-based language specification for writing device code.Currently, many hardware vendors provide implementations of the standard,including AMD, NVIDIA and IBM.
The platform model for OpenCL comprises a host – the main computer – andseveral devices featuring individual global memory. Computation is performedby invoking data-parallel kernels on an N-dimensional grid of work items. Eachpoint in the grid is mapped to a processing element, and elements are groupedin compute units sharing local memory. Broad acceptance of the standard leadsto the interesting situation where vastly different hardware architectures can betargeted with essentially unchanged code. However, implementations suited wellto one platform may – because of seemingly small architectural differences – fail

to perform acceptably on other platforms. The large and increasing number ofhardware and software targets and complex relationships between code and per-formance changes make it hard to gain an understanding of how some algorithmwill perform across the full range of platforms.
In order to enable automated in-depth characterization and comparison ofOpenCL hardware and software platforms we have created a suite of microbench-marks – uCLbench. It provides programs measuring the following data points:
Arithmetic Throughput Parallel and sequential throughput for all basic math-ematical operations, and many built-in functions defined by the OpenCL stan-dard. When available, native implementations (with reduced accuracy) arealso measured.
Memory Subsystem Host to device, device to device and device to host copy-ing bandwidth. Streaming bandwidth for on-device address spaces. Latency formemory accesses to global, local and constant address spaces. Also determinesexistence and size of caches.
Branching Penalty Impact of divergent dynamic branching on device perfor-mance, particularly pronounced on GPUs.
Runtime Overheads Kernel compilation time and queuing delays incurredwhen invoking kernels of various code volume.
2 Benchmark Design and Methodology
Before examining the individual benchmarks composing the uCLbench suitethe basic goals that shaped our design decisions need to be established. Theprimary purpose of the suite is to characterize and compare the low-level per-formance of OpenCL devices and implementations. As such, we did not employdevice-specific workarounds to ameliorate problems affecting performance onsome particular device, since the same behavior would be encountered by actualprograms. Another concern is providing implementers with useful informationthat can support them in achieving good performance over a broad range of de-vices. Particularly the latency and branching penalty benchmarks are designedwith this goal in mind.
There are three main implementation challenges for uCLbench:1. Ensure accuracy. The benchmarks need to actually measure the intended
quantity on all devices tested, and it must be possible to verify the compu-tations performed.
2. Minimize overheads. Overheads are always a concern in microbenchmarks,but with the variety of devices available to OpenCL they can be hard to avoid.E.g. a simple loop that is negligible in its performance impact on a generalpurpose CPU can easily dominate completion time on a GPU.
3. Prevent compiler optimization. Since kernel code is compiled at runtimeusing the compiler provided by the OpenCL implementation, we have no con-trol over the generated code. Thus it is imperative to design the benchmarksin a way that does not allow the compiler to perform unintended optimiza-tions. Such optimizations could result in the removal of operations that shouldbe measured.
There is an obvious area of conflict between these three goals. It is particularlychallenging to prevent compiler optimization while not creating significant over-heads that could compromise accuracy – even more so when the same code base

is used on greatly differing hardware and compiled by different closed-sourceoptimizing compilers.
2.1 Arithmetic Throughput
As a central part of the suite, this benchmark measures the arithmetic capabili-ties of a device. It includes primitive operations as well as many of the complexfunctions defined in the OpenCL standard. Two distinct quantities are deter-mined: the device-wide throughput that can be achieved by independent parallelexecution as well as the performance achieved for sequentially dependent code.All measurements are taken for scalar and vector types, and, if available, bothnative (less accurate) and default versions of complex functions are considered.
To enable result checking and prevent compiler optimization, input and out-put are performed by means of global memory pointers, and the result of eachoperation is used in subsequent ones. The loop is manually unrolled to minimizeloop overheads on all devices. Automatic unrolling can not be relied upon toachieve repeatable results for all platforms and data/operation types.
The kernel is invoked with a local and global range of one work item to de-termine the sequential time required for completion of the operation, and witha local range of loc = CL DEVICE MAX WORK GROUP SIZE and a global range ofCL DEVICE MAX COMPUTE UNITS∗loc items to calculate device-wide throughput.
2.2 Memory Subsystem
Current GPUs and accelerator devices have a memory design that differs fromthe deep cache hierarchies common in CPUs.
Bandwidth While global GPU memory bandwidth per-chip is high, due to thedegree of hardware parallelism the memory bandwidth available per processingelement can be insufficient [13]. Another bottleneck for current GPUs is the PCIeslot intermediating host memory and device.
Many GPUs and accelerators attempt to ameliorate these issues by providinga manually controlled, multi-layered memory subsystem. In OpenCL, this con-cept is represented by separate address spaces: private, local, constant, globaland host memory.
For this reason, the benchmark is divided in two major parts: one for on-device memory layers and one for memory traffic between host memory anddevice. To test bandwidth for on-device memory the benchmark invokes ker-nels streaming data from one layer back into the same layer. We also discerndifferences between scalar and various vectorized types, as the latter might beoptimized.
Host↔device bandwidth measurement does not require any kernel, insteadit uses the runtime API for copying data from/to the device’s global memory orinside device global memory. For device/host communication, two options areconsidered: the first generates a buffer and commands the OpenCL runtime totransfer it (clEnqueueWriteBuffer), the second maps a device buffer into thehost memory and works directly on the returned pointer.
For the streaming kernel, overheads were a major concern. This was addressedby using fast add operations to forestall optimization, and by maximizing theratio of read/write memory accesses.
Latency In addition to bandwidth, knowledge about access latency is essentialto effectively utilize the available OpenCL memory spaces. Depending on the

device used, only some or none of the accesses may be cached, and latency canvary by two orders of magnitude, from a few cycles up to several hundreds.
1 5 6 7 8 9 1110 1312 1514 20 43
(a) Latency benchmark offset array for acache line size of 4 elements
0 1 b . . .
0 0 0 0 1 1 1 1 0 0 0 0 1 1 1 1
2 Branches, branching width 4
0 0 1 1 2 2 3 3 4 4 5 5 0 0 1 1
6 Branches, branching width 2
(b) Branch penalty measurement layoutoptions
Fig. 1. Patterns used for latency and branch penalty benchmark, respectively
The latency benchmark uses a specifically designed index array to performa large number of indirect memory accesses. The index array contains addressoffsets chosen to cause jumps larger than cache line size, and end on a zero entryafter traversing the entire array, as illustrated in Fig. 1(a).
Some input-dependent computation and output has to be performed to pre-vent optimization, which is achieved by accumulating offsets.Manual loop un-rolling is used to minimize overheads. When measuring local memory latency alarge number of repeated traversals is required.2.3 Branching Penalty
On some OpenCL devices divergent dynamic branching on work items leads tosome or all work being serialized. The impact can differ with the amount andtopological layout of diverging branches on the work range. Since the effect on al-gorithm performance of this penalty can be severe [6] we designed a microbench-mark to determine how devices react to various branch counts and layouts.
The benchmark kernel is provided with an array of floating point numbersequal in length to the amount of work items. Each item then takes a branch de-pending on the number stored in its assigned location. Fig. 1(b) illustrates howbrancharray configurations can be used to test a varying number of branchesand different branch layouts.2.4 Runtime Overheads
Compared to traditional program execution, the OpenCL model introduces twopotential sources of overhead. Firstly, it is possible to compile kernels at run-time, and secondly there is an amount of time spent between queuing a ker-nel invocation and the start of computation. These overheads are measured inuCLBench using the OpenCL profiling event mechanism – we define the invoca-tion overhead as the elapsed time between the CL PROFILING COMMAND QUEUEDand CL PROFILING COMMAND START events, and the compilation time as the timespent in the clBuildProgram call. The actual kernel execution time is disre-garded for this benchmark, and the accuracy of the profiling events is imple-mentation defined (see Table 1).
3 Device Characterization – Results
To represent the broad spectrum of OpenCL-capable hardware we selectedeight devices, comprising four GPUs, three CPUs and one accelerator. Theirdevice characteristics as reported by OpenCL are summarized in Table 1.

Device Tesla2050 Radeon5870 GTX460 GTX275 2x X5570 2x Opt.2435 2xCellPPE 2xCellSPEImplementation NVIDIA AMD NVIDIA NVIDIA AMD AMD IBM IBMOperating System CentOS5.3 CentOS5.4 CentOS5.4 Win 7 CentOS5.4 CentOS5.4 YDL 6.2 YDL 6.2Host Connection PCIe 2.0 PCIe 2.0 PCIe 2.0 PCIe 2.0 - - - On-chipType GPU GPU GPU GPU CPU CPU CPU ACCELCompute Units 14 20 7 30 16 12 4 16Max Workgroup 1024 256 1024 512 1024 1024 256 256Vect.Width Float 1 1 4 1 4 4 4 4Clock (MHz) 1147 1400 850 1404 2933 2600 3200 3200Max.Alloc. (MB) 671 256 512 220 1024 1024 757 757Images Yes Yes Yes Yes No No No NoKernel Args 4352 4352 1024 4352 4096 4096 256 256Alignment 64 128 128 16 128 128 1 1Cache R/W None R/W None R/W R/W R/W NoneCache Line 128 - 128 - 64 64 128 -Cache Size (KB) 224 - 112 - 64 64 32 -Global Mem (MB) 3072 1024 2048 877 3072 3072 3072 3072Constant (KB) 64 64 64 64 64 64 64 64Local Type Scratch Scratch Scratch Scratch Global Global Global ScratchLocal (KB) 48 32 48 16 32 32 512 243Timer Res. (ns) 1000 1000 1 1000 1 1 37 37
Table 1. OpenCL devices benchmarked
NVIDIA TESLA 2050 The GF100 Fermi chip in this GPGPU device con-tains 14 compute units with a load/store unit, a cluster of four special functionunits as well as two clusters of 16 scalar processors each. The scalar processorclusters can work on different data using different threads that issue the sameinstruction, a method referred to as Single Instruction Multiple Thread (SIMT).AMD Radeon HD5870 The Cypress GPU on this card has 20 compute unitscontaining 16 Very Long Instruction Word (VLIW) [5] processors with an in-struction word length of five. To benefit from the VLIW architecture in OpenCLthe programmer should use a vector data type such as float4.
NVIDIA GeForce GTX460 The GTX460 contains a GF110 Fermi GPUwhich comprises 7 compute units. These compute units are similar to the oneson the TESLA 2050, with one important difference. Each compute unit consistsof 3 SIMT clusters fed by 2 superscalar scheduling units.NVIDIA GeForce GTX275 This graphics card is based on the GT200 GPUwhich has 30 compute units containing 8 scalar processors which work in SIMTmanner.Intel Xeon X5570 The Intel Xeon X5570 features 4 physical CPU cores withsimultaneous multithreading (SMT) leading to a total of 8 logical cores. TheXeons used in our benchmarks are mounted on an IBM HS22 Blade featuringtwo CPUs with shared main memory, resulting in a single OpenCL device witha 16 compute units.AMD Opteron 2435 The Opteron 2435 CPUs used in this paper are mountedon a two-socket IBM LS22 Blade. Each of them contains 6 cores leading to atotal of 12 compute units.IBM PowerXCell 8i The accelerator device in our benchmarks consists of twoPowerXCell 8i processors mounted on an IBM QS22 Blade. In OpenCL a Cellprocessor comprises two devices: A CPU (the PPE of the Cell) and an accelerator(all SPEs of the Cell). The two Cell PPEs, each featuring SMT, contain four com-pute units, the eight SPE cores of the two Cell chips add up to 16 compute units.
3.1 Arithmetic Throughput
We have gathered well over 3000 throughput measurements using the uCLBencharithmetic benchmark. A small subset that provides an overview of the devicesand contains some of the more significant and interesting results will be presentedin this section.
Fig. 2(a) shows the number of floating point multiplications per second mea-sured on each device and the theoretical maximum calculated from the hard-ware specifications. The first thing to note is the large advantage of GPUs in

0 50 100 150 200 250
XeonOpteronCell PPECell SPE
MeasuredTheoretical Max
0 250 500 750 1000 1250
Tesla 2050RadeonGTX460GTX275
GOp/s
(a) Parallel
0 200 400 600 800
Tesla 2050
Radeon
GTX460GTX275
Xeon
Opteron
Cell PPE
Cell SPE
MOp/s
(b) Sequential
Fig. 2. Floating point multiplication throughput
this metric, which necessitates the use of separate scales to portrait all devicesmeaningfully.
Looking at the effective utilization of hardware capabilities, the GPUs alsodo well. The Fermi cards reach over 99% utilization. The other GPUs still goover 80% while the two x86 CPUs fail to reach the 50% mark. IBM’s OpenCLperforms a bit better, achieving slightly over 65% of the theoretical maximumthroughput on both PPEs and SPEs.
While throughput of vectorized independent instructions is important forscientific computing and many multimedia workloads, some problems are hardto parallelize. The performance in such cases depends on the speed at whichsequentially dependent calculations can be performed, which is summarized inFig. 2(b). The CPUs clearly outperform GPUs and accelerators here, providinga solid argument for the use of heterogeneous systems.
Vectorization Figures 3(a) and 3(b) show the relative performance impact ofmanual vectorization using the floatN OpenCL datatypes. With a single workitem all devices benefit from vectorization to some extent. Since all three CPUsdeliver the same relative performance, they are consolidated.
1
2
4
8
16
float float2 float4 float8 float16
Tesla 2050
Radeon
GTX460
GTX275
CPU
Cell SPE
(a) Using a single Work Item
0,5
1
2
4
8
16
float float2 float4 float8 float16
Tesla 2050
Radeon
GTX460
GTX275
Xeon
Opteron
Cell PPE
Cell SPE
(b) Using many Work Items
Fig. 3. Vectorization Impact
When the full amount of work items is used there are two clearly visible cat-egories. The NVIDIA GPUs effectively gather individual work items into SIMDgroups and thus show no additional benefit from manual vectorization, vectorswith 16 elements even slow down execution. The GTX460 result is counter-intuitive, but can be explained by scheduling constraints introduced by the su-perscalar architecture.
3.2 Memory Subsystem
The memory subsystems of the benchmarked OpenCL devices diverge in two ar-eas – availability of dedicated global device memory and structure of the on-chipmemory. The GPU devices feature dedicated global memory while for all otherdevices the global device address space resides in host memory. Furthermore,
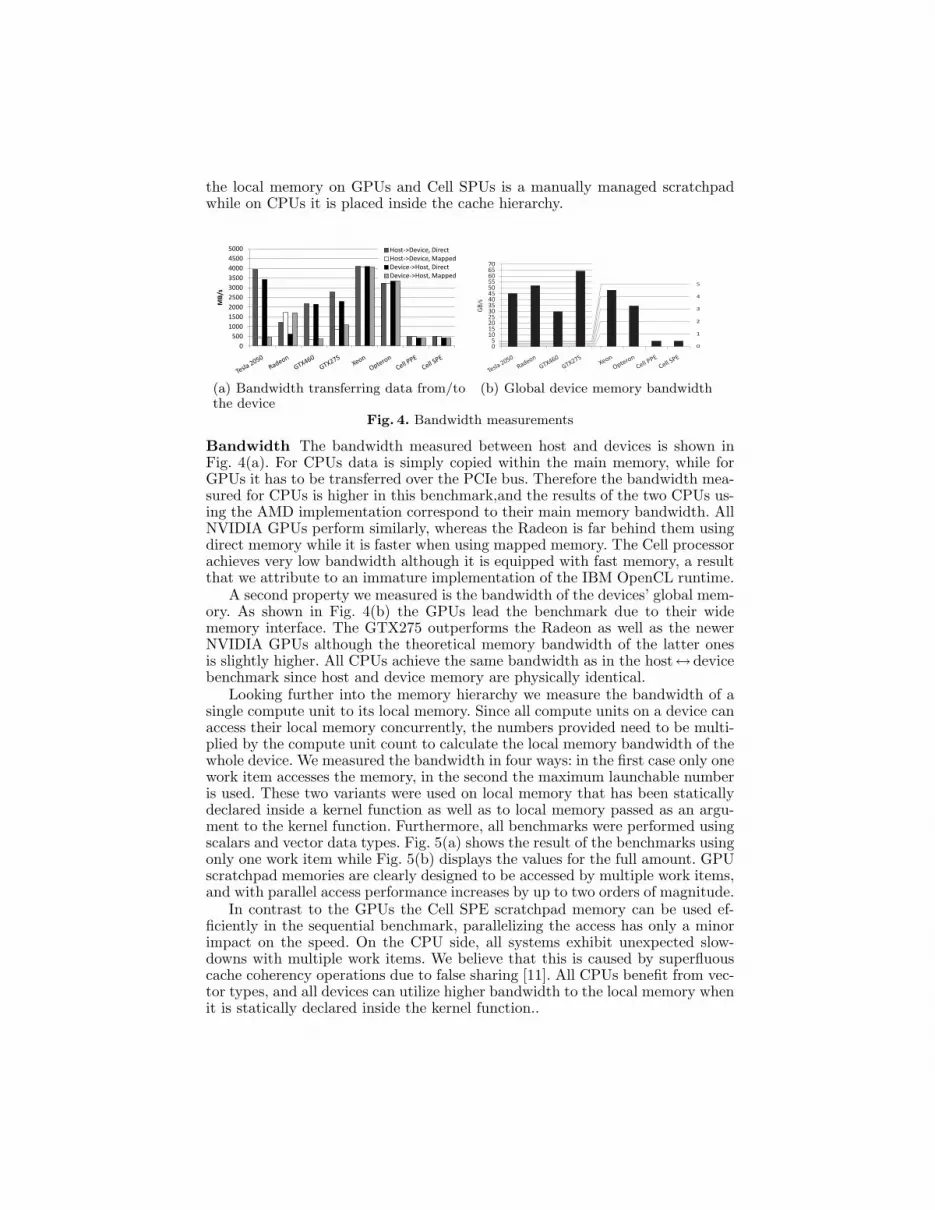
the local memory on GPUs and Cell SPUs is a manually managed scratchpadwhile on CPUs it is placed inside the cache hierarchy.
0
500
1000
1500
2000
2500
3000
3500
4000
4500
5000
MB/s
Host->Device, DirectHost->Device, MappedDevice->Host, DirectDevice->Host, Mapped
(a) Bandwidth transferring data from/tothe device
05
10152025303540455055606570
GB
/s
0
1
2
3
4
5
(b) Global device memory bandwidth
Fig. 4. Bandwidth measurements
Bandwidth The bandwidth measured between host and devices is shown inFig. 4(a). For CPUs data is simply copied within the main memory, while forGPUs it has to be transferred over the PCIe bus. Therefore the bandwidth mea-sured for CPUs is higher in this benchmark,and the results of the two CPUs us-ing the AMD implementation correspond to their main memory bandwidth. AllNVIDIA GPUs perform similarly, whereas the Radeon is far behind them usingdirect memory while it is faster when using mapped memory. The Cell processorachieves very low bandwidth although it is equipped with fast memory, a resultthat we attribute to an immature implementation of the IBM OpenCL runtime.
A second property we measured is the bandwidth of the devices’ global mem-ory. As shown in Fig. 4(b) the GPUs lead the benchmark due to their widememory interface. The GTX275 outperforms the Radeon as well as the newerNVIDIA GPUs although the theoretical memory bandwidth of the latter onesis slightly higher. All CPUs achieve the same bandwidth as in the host↔devicebenchmark since host and device memory are physically identical.
Looking further into the memory hierarchy we measure the bandwidth of asingle compute unit to its local memory. Since all compute units on a device canaccess their local memory concurrently, the numbers provided need to be multi-plied by the compute unit count to calculate the local memory bandwidth of thewhole device. We measured the bandwidth in four ways: in the first case only onework item accesses the memory, in the second the maximum launchable numberis used. These two variants were used on local memory that has been staticallydeclared inside a kernel function as well as to local memory passed as an argu-ment to the kernel function. Furthermore, all benchmarks were performed usingscalars and vector data types. Fig. 5(a) shows the result of the benchmarks usingonly one work item while Fig. 5(b) displays the values for the full amount. GPUscratchpad memories are clearly designed to be accessed by multiple work items,and with parallel access performance increases by up to two orders of magnitude.
In contrast to the GPUs the Cell SPE scratchpad memory can be used ef-ficiently in the sequential benchmark, parallelizing the access has only a minorimpact on the speed. On the CPU side, all systems exhibit unexpected slow-downs with multiple work items. We believe that this is caused by superfluouscache coherency operations due to false sharing [11]. All CPUs benefit from vec-tor types, and all devices can utilize higher bandwidth to the local memory whenit is statically declared inside the kernel function..

0
1
2
3
4G
B/s
scalar, Argumentvectorized, Argumentscalar, in Kernelvectorized, in Kernel
0
10
20
30
40
(a) Using a single work item
0
50
100
150
200
GB
/s
0
10
20
scalar, Argumentvectorized, Argumentscalar, in Kernelvectorized, in Kernel
(b) Using multiple work items
Fig. 5. Bandwidth of one compute unit to its local memory
Latency One purpose of the multiple address spaces in OpenCL is allowingaccess to lower latency memory pools. This is particularly important on GPUsand accelerators, where global memory is often uncached. As shown in Fig. 6(b)absolute access latency to global memory is almost an order of magnitude largeron GPUs and accelerators than on CPUs. Additionally CPUs can rely on theirhighly sophisticated cache hierarchies to reduce the access times even further.The impact of caching is shown in Fig. 6(a) which shows the relative time toaccess a data item of a certain size in comparison to the previously measuredlatency to the global memory. This depiction clearly identifies the number ofcaches featured by a device, as well as their usable size in OpenCL. Non-FermiGPUs as well as the Cell SPE do not feature any automated caching of data inglobal memory resulting in equal access time for all tested sizes.
0
0,2
0,4
0,6
0,8
1
4K 8K 16K 32K 64K 128K256K512K 1M 2M 4M 8M 16M 32M
Tesla 2050
GTX460
Xeon
Opteron
Cell PPE
(a) Global depending on size
1
10
100
Acc
ess
Late
ncy
(n
s)
global
const
local
(b) Measured in absolute time
Fig. 6. Memory access latency
Local and Constant memory latency is significantly smaller on all devices.On the CPUs it corresponds to L1 cache latency as expected. All four GPUsshow very similar results to access the local memory, while the Fermi basedchips outperform the Radeon and GTX275 in accessing the constant memoryby approximately six and three times, respectively. The accelerator’s behaviormore closely resembles a CPU than a GPU regarding local latency, resulting inthe largest difference between global and local timings. The SPEs are the onlydevice to achieve significantly lower latency for const than local accesses.
3.3 Branching Penalty
We measured the time taken to process the branch penalty testing kernel withone to 128 branches relative to the time required to complete a single branch.All CPUs remain at the same performance level regardless of the number of di-vergent branches. This is expected, as CPUs do not feature the SIMT executionmodel that results in a branching penalty. The Cell SPE accelerator also does notexhibit any penalty. The situation is more interesting for the GPUs, which show

a linear increase in runtime with the number of branches until a cutoff point. Incase of all NVIDIA GPUs, this point is reached at 32 divergent branches, andit takes 64 branches on the Radeon. This measurement coincides perfectly withthe warp size reported for each GPU, which is the number of SIMT threads thatare grouped for SIMD execution.
5 10 15 20 25 30
5
10
15
20
5
10
15
20
5 10 15 20 25 30
Num
ber o
f div
erge
nt b
ranc
hes
Branching widthBranching width
8
16
24
16
Fig. 7. Branching penalty with varying branch width. NVIDIA GPUs / Radeon
Fig. 7 summarizes the results obtained varying both branch count and topo-logical layout of branches in the local range. A darker color indicates longerkernel runtime, and the lower right part is black since it contains infeasible com-binations of branching width and branch count. Generally, grouping branches to-gether improves performance. In fact, the hardware behaves in a very predictableway: if the condition branchingWidth ∗ branchCount ≥ warpSize is fulfilled,further increases in the branch count will not cause performance degradation.On NVIDIA GPUs, multiples of 8 for the branch width are particularly advan-tageous, and the same is true for multiples of 16 on the Radeon. For GTX275and Radeon this value is equal to the reported SIMD width of the architecture.This is not the case for the Fermi-based NVIDIA GPUs, where a SIMD widthof 16 is generally assumed, yet their behavior remains unchanged.
3.4 Runtime Overheads
Invocation overheads remain below 10 microseconds on the tested x86 CPUs aswell as the Fermi GPUs. The two IBM Parts and the GTX275 take around 30and 50 microseconds, respectively. The Radeon HD5870 requires approximately450 microseconds from enqueueing to kernel startup.
We measured compilation times below 1 second for all mature platforms,scaling linearly with code size. The IBM platform has larger compilation times,particularly for the SPEs, reaching 30 seconds and more for kernels beyond 200lines of code.
4 Guiding Kernel Design
In this section we evaluate the usefulness and accuracy of the device charac-terization provided by the uCLbench suite on a real-world kernel. Performanceportability is a main concern with OpenCL kernels, with different devices react-ing very differently to optimization attempts. While some of these optimizations– such as local work group dimensions – can be auto-tuned relatively easily oth-ers require significant manual implementation effort. These latter optimizationsare the focus of this chapter. We will demonstrate that the automatic characteri-zation provided by uCLbench reliably identifies promising optimizations for each

of the diverse set of devices tested, and that implementing these optimizationsconsistently improves performance beyond the capabilities of a state-of-the-artoptimizing GPGPU compiler.4.1 The Model Problem
As our test case we selected a simple elliptic partial differential equation, thediscrete two-dimensional Poisson equation with Dirichlet boundary conditionsin the unit square Ω = (0, 1)2. This problem is given by
−∆huh(x, y) = fΩh (x, y)
uh(x, y) = fΓh (x, y) for ((x, y) ∈ Γh = ∂Ωh)
with boundary conditions fΓh (x, y) and discretization width h = 1/n, n ∈ IN
being the number of grid points in each direction.The central component in a multigrid algorithm for this problem is the relax-
ation step, an iterative solver for the discretized version of the given equation.Due to its good smoothing effects and parallelization properties (see [12]), wechose an ω-Jacobi kernel.4.2 Optimizations
To evaluate the predictive power of our benchmark suite, we implemented sixkinds of manual optimizations belonging to one of three categories:
Vectorization The kernel was vectorized for vector widths of 4, 8 and 16. (des-ignated vec4, vec8, vec16)
Branching Elimination A straightforward implementation of the boundaryconditions fΓ
h (x, y) introduces dynamic branching. This optimization elimi-nates the branching by using oversized buffers and performing a separate stepto fix the boundary after each iterative step. (designated BE)
Manual Caching These kernels manually load their working set into localmemory. There are two slightly different versions, dynamic and static. Theformer passes the local memory buffer to the kernel as a parameter while thelatter statically allocates it inside the kernel. (designated mcDyn and mcStat)
Combinations of these optimizations result in a total of 16 implementations, plusone baseline version with no manual optimization. This does not include the vari-ation introduced by easily tunable parameters like local work group dimensions –for these, we selected the optimal values for each device by exhaustively iteratingover all possibilities. Clearly, manually implementing 16 or more versions of eachkernel is not generally viable. The following results demonstrate that automaticcharacterization can be used to assess the impact of an optimization on a givendevice before implementing it, thus guiding the implementation effort.4.3 Results
Table 2 lists, for each device, the best performing version of the ω-Jacobi ker-nel and how much that version improves upon the baseline (Improvement =(Tbaseline/Tbest − 1) ∗ 100). If the best version combines more than one op-timization, the Primary column contains the single optimization that has thelargest impact on the result, and the Contribution column shows the impact ofthat option on its own. Finally, we present the speedup achieved by a state ofthe art GPGPU optimizing compiler targeted primarily at the GTX275 architec-ture [15]. Even when a speedup is achieved, the automatically optimized kernel

still does not reach the performance of the version arrived at by guided manualoptimization.
Device Best Version Improvement Primary Contrib. GPGPU CompilerTesla 2050 vec4 14% - - slowdownRadeon vec8 BE mcStat 63% vec8 29% crashedGTX460 vec4 BE 10% vec4 9% slowdownGTX275 BE mcStat 31% mcStat 19% 22%Xeon vec8 42% - - slowdownOpteron vec16 79% - - slowdownCell PPE vec16 BE 39% vec16 25% slowdownCell SPE vec16 BE mcStat 192% mcStat 78% 90%
Table 2. Most Effective Optimizations per Device and their Speedup
The results correspond to several device characteristics identified by ourbenchmarks. All the devices that do not show any caching behavior in thememory latency tests – Radeon, GTX275 and Cell SPE – benefit from man-ual caching, and as determined by the local memory bandwidth results staticallocation is generally as fast or faster than the alternative (Section 3.2). Branchelimination is most beneficial on those devices that show a high variance in thebranch penalty benchmark, while not having any impact on CPUs with their flatbranching profile (Section 3.3). In this regard, the minor Cell PPE speedup due toBE seems counter-intuitive, but its arithmetic throughput results indicate that itsuffers penalties in branching code due to its long pipeline and in-order execution.
The impact of vectorization is well predicted by the characterization results(Section 3.1). While the NVIDIA compiler and devices do a good job at auto-matically vectorizing scalar code, on all other platforms the impact of manualvectorization is large. Our vectorization benchmark results correctly indicate themost effective vector length for each device.
5 Related Work
Microbenchmarks have a long history in the characterization of parallel ar-chitectures. The Intel MPI Benchmarks (IMB) [7] are often used to determinethe performance of basic MPI operations on clusters. For OpenMP, the EPCCsuite [2] measures the overheads incurred by synchronization, loop schedulingand array operations. Bandwidth is widely measured using STREAM [8], andour memory bandwidth benchmark implementation is based on its principles.
A major benefit of using OpenCL is the ability to target GPU devices.Historically these were mostly used for graphics rendering, and benchmarkedaccordingly, particularly for use in games. A popular tool for this purpose is3DMark [10]. When GPU computing first became widespread Stanford Univer-sity’s GPUbench suite [1] provided valuable low-level information. However, itpredates the introduction of specific GPU computing languages and platforms,and therefore only measures performance using the restrictive graphics program-ming interface. In depth performance analysis of one particular GPU architecturehas been performed by Wong et al. [14].
Recently the SHOC suite of benchmarks for OpenCL was introduced [4].While it contains some microbenchmarks, it is primarily targeted at measur-ing mid- to high-level performance. It does not try to identify the individualcharacteristics of mathematical operations or measure the latency of access to

OpenCL address spaces. Conversely, our suite is aimed at determining usefullow-level characteristics of devices and includes exhaustive latency and arith-metic performance measurements as well as a benchmark investigating dynamicbranching penalties. We also present results for a broader range of hardware,including an accelerator device.
The Rodinia Heterogeneous Benchmark Suite [3] predates wide availabilityof OpenCL, therefore separately covering CUDA, OpenMP and other languageswith distinct benchmark codes. Also, unlike uCLbench, Rodinia focuses on de-termining the performance of high-level patterns of parallelism.
6 Conclusion
The uCLbench suite provides tools to accurately measure important low-level device properties including: arithmetic throughput for parallel and sequen-tial code, memory bandwidth and latency to several OpenCL address spaces,compilation time, kernel invocation overheads and divergent dynamic branchingpenalties. We obtained results on eight compute devices which reflect importanthardware characteristics of the platforms and, in some cases, show potential forimprovement in the OpenCL implementations.
The automatic device characterization provided by uCLbench is useful inquickly gaining an in-depth understanding of new hardware and software OpenCLplatforms, exposing undisclosed microarchitectural details such as dynamic branch-ing penalties. We have shown that the measured characterisics can be used toguide manual optimization by identifying the most promising optimizations for agiven device. Applying these transformations to an ω-Jacobi multigrid relaxationkernel results in an average improvement of 61% across the devices tested.
Acknowledgments
This research is partially funded by the Austrian Research Promotion Agency(FFG), project number: 824925. We thank Dr.techn. Peter Zinterhof from theUniversity of Salzburg for giving us access to a Tesla cluster.
References
[1] I. Buck, K. Fatahalian, and P. Hanrahan. GPUBench, 2004.[2] J. M. Bull. Measuring synchronisation and scheduling overheads in openmp. In
Proc. of 1st Europ. Workshop on OpenMP, pages 99–105, 1999.[3] S. Che, M. Boyer, J. Meng, D. Tarjan, J. W. Sheaffer, S. Lee, and K. Skadron.
Rodinia: A benchmark suite for heterogeneous computing. IEEE WorkloadCharacterization Symposium, 0:44–54, 2009.
[4] A. Danalis, G. Marin, C. McCurdy, J. S. Meredith, P. C. Roth, K. Spafford, V. Tip-paraju, and J. S. Vetter. The scalable heterogeneous computing (shoc) benchmarksuite. In GPGPU ’10: Proc., pages 63–74, New York, NY, USA, 2010. ACM.
[5] J.A. Fisher. Very long instruction word architectures and the ELI-512. In Pro-ceedings of the 10th annual international symposium on Computer architecture,pages 140–150. ACM, 1983.
[6] W. L. Fung, I. Sham, G. Yuan, and T. M. Aamodt. Dynamic warp formationand scheduling for efficient gpu control flow. In MICRO 40., pages 407–420,Washington, DC, USA, 2007. IEEE Computer Society.
[7] MPI Intel. Benchmarks: Users Guide and Methodology Description. Intel GmbH,Germany, 2004.

[8] J. D. McCalpin. Memory bandwidth and machine balance in current high per-formance computers. IEEE Comp. Soc. Tech. Comm. on Computer Architecture(TCCA) Newsletter, pages 19–25, December 1995.
[9] K. Olukotun and L. Hammond. The future of microprocessors. Queue, 3(7):26–29,2005.
[10] Fadi N. Sibai. Performance analysis and workload characterization of the3dmark05 benchmark on modern parallel computer platforms. ACM SIGARCHComputer Architecture News, 35(3):44–52, 2007.
[11] J. Torrellas, M.S. Lam, and J.L. Hennessy. False sharing and spatial locality inmultiprocessor caches. IEEE Transactions on Computers, 43(6):651–663, 1994.
[12] U. Trottenberg, C.W. Oosterlee, and A. Schueller. Multigrid. Academic Press,2001.
[13] V. Volkov and James W. Demmel. Benchmarking gpus to tune dense linearalgebra. In SC ’08: Proc., pages 1–11, Piscataway, NJ, USA, 2008. IEEE Press.
[14] H. Wong, M. Papadopoulou, M. Sadooghi-Alvandi, and A. Moshovos. Demys-tifying gpu microarchitecture through microbenchmarking. In ISPASS, pages235–246, 2010.
[15] Yi Yang, Ping Xiang, Jingfei Kong, and Huiyang Zhou. A gpgpu compilerfor memory optimization and parallelism management. In Proceedings ofthe 2010 ACM SIGPLAN conference on Programming language design andimplementation, PLDI ’10, pages 86–97, New York, NY, USA, 2010. ACM.