Measuring and modeling thermal conductivity of gas hydrate-bearing sand
10
Measuring and modeling thermal conductivity of gas hydrate-bearing sand Duzi Huang 1 and Shuanshi Fan Guangzhou Center for Gas Hydrate Research, Guangzhou Institute of Energy Conversion, Chinese Academy of Sciences, Guangzhou, China Received 11 July 2004; revised 4 November 2004; accepted 19 November 2004; published 25 January 2005. [1] Effective thermal conductivity (ETC) of both tetrahydrofuran (THF) and methane hydrate-bearing sandy porous media was measured by the Hot Disk Thermal Constant Analyser. Thermal conductivity of methane hydrate is 0.575 W m 1 K 1 at 0°C and 6.6 MPa (methane gas pressure), which is close to THF hydrate’s 0.51 W m 1 K 1 at 0°C and 0.1 MPa (atmosphere pressure). However, the measured 1 W m 1 K 1 ETC of methane hydrate-bearing sand is significantly lower than that of THF hydrate-bearing sand at 2Wm 1 K 1 . This is because the methane hydrate formed with a sodium dodecyl sulfate (SDS) solution in sand at our laboratory has a ‘‘wall creeping’’ growth characteristic and consequently a large part of the pores were filled with methane free gas. ETCs of sand containing gas hydrates were also calculated using a renormalization method. The process involves sample partitioning, labeling, initial value assignments, and renormalization calculations. A Monte Carlo analysis was applied to sample laboratory-scale gas hydrate-bearing sand assemblies. We found that the renormalization modeling results agreed well with measured ETCs when each photo of a 1.3 mm 1.3 mm subsample was divided into 16 or more blocks. Citation: Huang, D., and S. Fan (2005), Measuring and modeling thermal conductivity of gas hydrate-bearing sand, J. Geophys. Res., 110, B01311, doi:10.1029/2004JB003314. 1. Introduction [2] Large natural gas (mainly methane) hydrate deposits are found world wide in sediments of outer continental margins and polar permafrost areas [Kvenvolden, 2000]. It has been estimated that naturally occurring methane hydrates contain at least twice as much combustible carbon as in all other fossil fuels on the Earth [Sloan, 1994]. Besides being a potentially promising future energy source [Holder and Angert, 1981; Holder et al., 1984; Kvenvolden, 1988; Max and Lowrie, 1996; Haq, 1999; Collett, 2002], natural gas hydrate’s stability may play an important role in global warming [Hatzikiriakos and Englezos, 1993; Makogon et al., 1998] and as a geohazard [Ergun and Cifci, 1999; Kvenvolden and Lorenson, 2001; Zhang, 2003]. Combined with predictive models of hydrate dissemination and concentration, Xu and Ruppel [1999] constrain the migration of hydrate dissociation fronts in marine sediments. Thus the thermal property measure- ment of hydrate-bearing sediments provide necessary inputs for assessing seafloor stability, global climate change, sedimentation, erosion, submarine slide formation and other processes [Ruppel, 2000]. Evaluating the effect of present- day climate change on hydrate stability may also require estimates of thermal conductivity in hydrate-bearing sedi- ment [Revil, 2000]. So, it is critical to use reliable thermal properties when evaluating the response of gas hydrate to environmental changes and exploitation operations. [3] In spite of having crystal-like structures, gas hydrates exhibit peculiar glass-like behavior in the dependence of thermal conductivity on temperature [Ross et al., 1981; Dharma-wardana, 1983; Andersson and Ross, 1983; Tse, 1988; Andersson and Suga, 1996]. Most thermal conductiv- ity measurements were done for THF hydrate since labora- tory-made THF hydrate is usually very uniform. Thermal conductivity of natural gas hydrate or hydrate-bearing sys- tems and their dependence on temperature are not well constrained [Waite et al., 2002a; Kumar et al., 2004]. Cook and Leaist [1983] measured thermal conductivity of methane hydrate using a needle probe and their result was 0.49 W m 1 K 1 at 10°C with corrections to account for the fact that 43% of methane hydrate decomposed to water ice in their experiment. Stoll and Bryan [1979] systemati- cally measured physical properties of sediments containing propane gas hydrates and found that thermal conductivity of sediment tends to decrease rather than increase when the water in sediment was replaced by gas hydrate. This, in turn, would affect the interpretation of various geophysical measurements, such as heat flow. Waite measured the thermal conductivity of well-characterized pure methane hydrate [Waite et al., 2002a] and methane hydrate in quartz sand [Waite et al., 2002b]. The results show clear relation- JOURNAL OF GEOPHYSICAL RESEARCH, VOL. 110, B01311, doi:10.1029/2004JB003314, 2005 1 Also at Department of Thermal Science and Energy Engineering, University of Science and Technology of China, Hefei, China. Copyright 2005 by the American Geophysical Union. 0148-0227/05/2004JB003314$09.00 B01311 1 of 10
-
Upload
independent -
Category
Documents
-
view
4 -
download
0
Transcript of Measuring and modeling thermal conductivity of gas hydrate-bearing sand
Measuring and modeling thermal conductivity
of gas hydrate-bearing sand
Duzi Huang1 and Shuanshi FanGuangzhou Center for Gas Hydrate Research, Guangzhou Institute of Energy Conversion, Chinese Academy of Sciences,Guangzhou, China
Received 11 July 2004; revised 4 November 2004; accepted 19 November 2004; published 25 January 2005.
[1] Effective thermal conductivity (ETC) of both tetrahydrofuran (THF) and methanehydrate-bearing sandy porous media was measured by the Hot Disk Thermal ConstantAnalyser. Thermal conductivity of methane hydrate is 0.575 W m�1 K�1 at 0�C and6.6 MPa (methane gas pressure), which is close to THF hydrate’s 0.51 W m�1 K�1 at 0�Cand 0.1 MPa (atmosphere pressure). However, the measured 1 W m�1 K�1 ETC ofmethane hydrate-bearing sand is significantly lower than that of THF hydrate-bearing sandat �2 W m�1 K�1. This is because the methane hydrate formed with a sodium dodecylsulfate (SDS) solution in sand at our laboratory has a ‘‘wall creeping’’ growthcharacteristic and consequently a large part of the pores were filled with methane free gas.ETCs of sand containing gas hydrates were also calculated using a renormalizationmethod. The process involves sample partitioning, labeling, initial value assignments,and renormalization calculations. A Monte Carlo analysis was applied to samplelaboratory-scale gas hydrate-bearing sand assemblies. We found that therenormalization modeling results agreed well with measured ETCs when each photo ofa 1.3 mm � 1.3 mm subsample was divided into 16 or more blocks.
Citation: Huang, D., and S. Fan (2005), Measuring and modeling thermal conductivity of gas hydrate-bearing sand, J. Geophys. Res.,
110, B01311, doi:10.1029/2004JB003314.
1. Introduction
[2] Large natural gas (mainly methane) hydrate depositsare found world wide in sediments of outer continentalmargins and polar permafrost areas [Kvenvolden, 2000]. Ithas been estimated that naturally occurring methanehydrates contain at least twice as much combustiblecarbon as in all other fossil fuels on the Earth [Sloan,1994]. Besides being a potentially promising future energysource [Holder and Angert, 1981; Holder et al., 1984;Kvenvolden, 1988; Max and Lowrie, 1996; Haq, 1999;Collett, 2002], natural gas hydrate’s stability may play animportant role in global warming [Hatzikiriakos andEnglezos, 1993; Makogon et al., 1998] and as a geohazard[Ergun and Cifci, 1999; Kvenvolden and Lorenson, 2001;Zhang, 2003]. Combined with predictive models ofhydrate dissemination and concentration, Xu and Ruppel[1999] constrain the migration of hydrate dissociation frontsin marine sediments. Thus the thermal property measure-ment of hydrate-bearing sediments provide necessary inputsfor assessing seafloor stability, global climate change,sedimentation, erosion, submarine slide formation and otherprocesses [Ruppel, 2000]. Evaluating the effect of present-
day climate change on hydrate stability may also requireestimates of thermal conductivity in hydrate-bearing sedi-ment [Revil, 2000]. So, it is critical to use reliable thermalproperties when evaluating the response of gas hydrate toenvironmental changes and exploitation operations.[3] In spite of having crystal-like structures, gas hydrates
exhibit peculiar glass-like behavior in the dependence ofthermal conductivity on temperature [Ross et al., 1981;Dharma-wardana, 1983; Andersson and Ross, 1983; Tse,1988; Andersson and Suga, 1996]. Most thermal conductiv-ity measurements were done for THF hydrate since labora-tory-made THF hydrate is usually very uniform. Thermalconductivity of natural gas hydrate or hydrate-bearing sys-tems and their dependence on temperature are not wellconstrained [Waite et al., 2002a; Kumar et al., 2004]. Cookand Leaist [1983] measured thermal conductivity ofmethane hydrate using a needle probe and their result was0.49 W m�1 K�1 at �10�C with corrections to account forthe fact that 43% of methane hydrate decomposed to waterice in their experiment. Stoll and Bryan [1979] systemati-cally measured physical properties of sediments containingpropane gas hydrates and found that thermal conductivityof sediment tends to decrease rather than increase whenthe water in sediment was replaced by gas hydrate. This, inturn, would affect the interpretation of various geophysicalmeasurements, such as heat flow. Waite measured thethermal conductivity of well-characterized pure methanehydrate [Waite et al., 2002a] and methane hydrate in quartzsand [Waite et al., 2002b]. The results show clear relation-
JOURNAL OF GEOPHYSICAL RESEARCH, VOL. 110, B01311, doi:10.1029/2004JB003314, 2005
1Also at Department of Thermal Science and Energy Engineering,University of Science and Technology of China, Hefei, China.
Copyright 2005 by the American Geophysical Union.0148-0227/05/2004JB003314$09.00
B01311 1 of 10
ships of effective thermal conductivity (ETC) to porosity andgas pressure, but they are not mathematically described.[4] Various models and formulae have been proposed for
predicting ETC for two-phase systems and all of thempredict ETC as function of thermal conductivities of indi-vidual phases and their volume fraction [de Vries, 1952;Maxwell, 1954; Woodside and Messmer, 1961; Krupiczka,1967]. Volume fraction based methods are easy to use butcan be inaccurate because individual phases are usually notuniformly distributed. Consequently, they have variousapplicable ranges and may yield different values even atequivalent conditions. Revil [2000] modeled the ETC by upscaling the local equations using a differential effectivemedium approach. Revil’s model accounts for the porespace distribution and complexity of the thermal flow linesthrough the porous material by introducing a thermalformation factor. Some researchers began to use newtechnique to resolve ETC of porous media. On thebasis of the self-similar characteristic of porous media, thefractal theory [Mandelbrot, 1982] was first used inthe research of the ETC for unidirectional fibrous compo-sites by Pitchumani and Yao [1991]. Wang et al. [2003]used the fractal theory to predict the ETC of liquid withsuspension of nanoparticles. King [1989] and Fernandes etal. [1996] have used the renormalization technique tocalculate effective permeability, but it has not yet beenapplied to ETC problems. In this work, we first measurethe thermal conductivities of sand particles, methane andTHF hydrates and then use a space renormalization tech-nique to model the ETC of sand containing THF hydrate.
2. Experiments
2.1. Apparatus
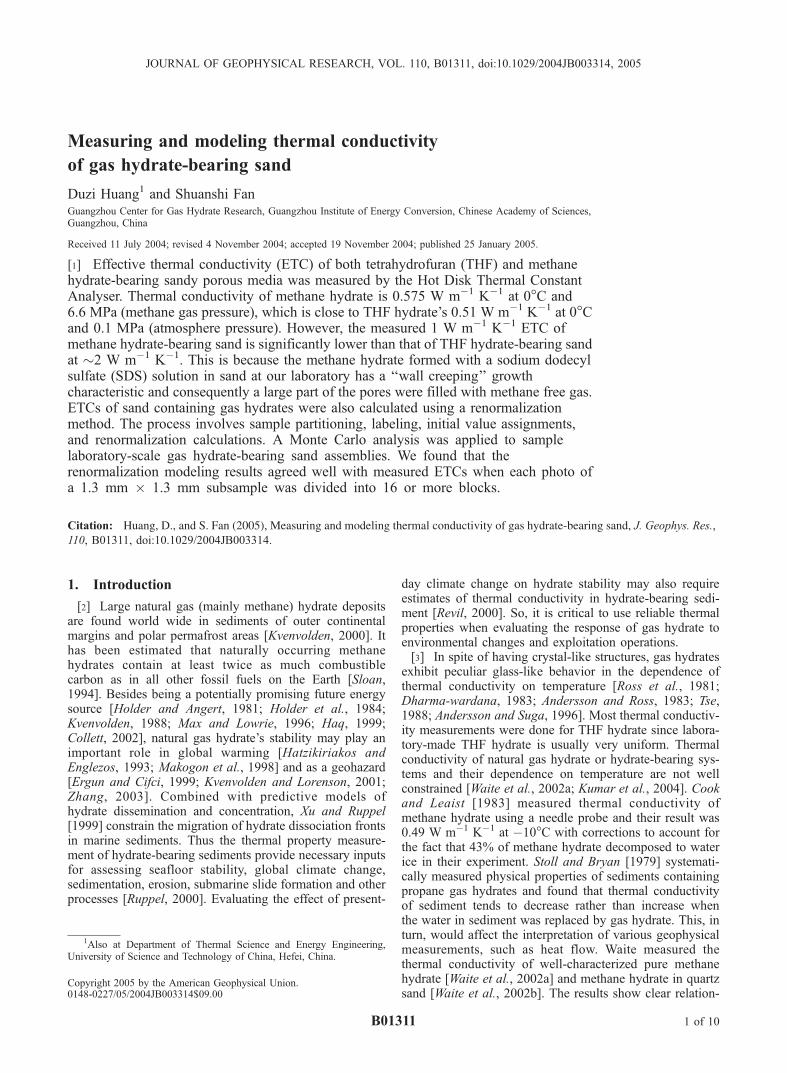
[5] The experimental system includes two parts, one forgas hydrate formation, and the other for thermal conductiv-
ity measurement. A schematic of the system is shown inFigure 1. There are five functioning units in the hydrateformation part. The gas tank, the gas flux monitor and thevacuum pump (not shown in Figure 1) are responsible forgas input and output. The alcohol bath and the temperaturecontroller (not shown in Figure 1) form the temperaturecontrolling section. The hand pump and the piston, which islocated at the inner bottom of the cell, perform hydraulicfunctions. Data of the gas flow and the temperature inside ofthe cell are collected at points A and B respectively, andlogged by the Agilent 34901A. Figure 1 shows the detail ofthe stainless steel cell. Sample volume can be changed using
Figure 1. Schematic of gas hydrate formation and measurement system (not to scale). The cell is madeof stainless steel with 250 mm height and 50 mm width (inner diameter). The sample volume can beadjusted, and the maximal sample volume is 200 mL.
Figure 2. Hot Disk probe used in the experiment. Thestandard probe of Hot Disk Thermal Constants Analyzer isalso shown in the white frame, and the diameter of doublespiral disk is 14 mm. See color version of this figure in theHTML.
B01311 HUANG AND FAN: THERMAL CONDUCTIVITY OF HYDRATES
2 of 10
B01311
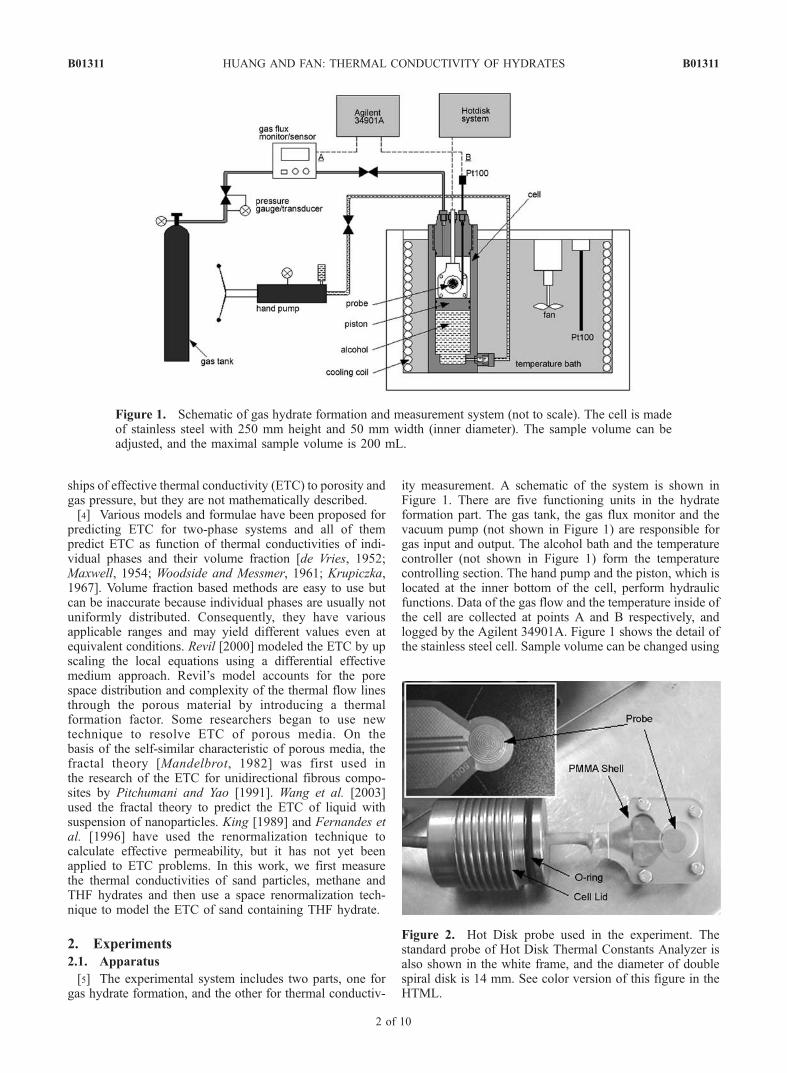
the piston at the bottom of the cell. The piston is hydrau-lically driven by the hand pump. The whole cell is im-mersed in the temperature controlled alcohol bath. Thethermal conductivity measurement probe is also shown inFigure 1. Thermal conductivity of the sample is measuredby the Hot Disk Thermal Constant Analyser system. Thissystem is manufactured by Sweden Hot Disk AB Companyand it is based on the transient plane source (TPS) techniqueof Gustafsson et al. [1979, 1986]. The Hot Disk probe isspecially designed for this investigation. As Figure 2 shows,it is sandwiched by two polymethyl methacrylate (PMMA)shells with a hole on each of them, through which the probecan make a contact with the sample. This design alsoprotects and supports the soft probe.
2.2. Hot Disk TPS Technique
[6] On the basis of the theory of TPS technique, theHot Disk Thermal Constants Analyzer utilizes a sensorelement in the shape of a double spiral. As Figure 2shows, this Hot Disk sensor acts both as a heat source forincreasing the temperature of the sample and a resistancethermometer for recording the time-dependent temperatureincrease. The sensor element is made of a 10-mm-thickNickel-metal double spiral, with precisely designeddimensions (width, number of windings, and their radii).This spiral is supported by a plate to protect its particularshape, give it mechanical strength and keep it electricallyinsulated. The plate, made of the polyimide ‘‘Kapton’’can be used throughout the temperature range from 10 Kto 500 K.[7] The encapsulated Ni-spiral sensor is then sandwiched
between two halves of the sample (solid samples), orembedded in the sample (powders, liquids). During a presettime, 200 resistance recordings are taken and from these therelation between temperature and time is established. A fewparameters, like the ‘‘power output’’ to increase the tem-
perature of the spiral, the ‘‘measuring time’’ for recording200 points and the sensor size are used to optimize theexperimental settings so thermal conductivities from 0.01 to400 W m�1 K�1 can be measured. The TPS principle,procedure, and method have been discussed in detail byGustafsson et al. [1979, 1986], Log and Gustafsson [1995],and Nagai et al. [2000].
2.3. Sample Description
[8] The sediment used in the experiment is constructionsand with quartz as the primary component. The sand issieved by a 60/120 mesh (300–125 mm) sieve. Porosities ofloosely packed dry sand, water saturated sand, ice saturatedsand and THF hydrate saturated sand are around 50%,47%, 49% and 53%, respectively. A THF solution of 21%THF to 79% water in mass ratio [Ross and Andersson,1982], which is larger that the ideal THF hydrate ratio of20:80, was used to form THF hydrate and avoid the effectof ice. The THF hydrate thus formed is very uniform andmay be viewed as an end-member state since no such idealmixture of hydrate and sediment is found in nature. We alsofound that it is hard to form methane hydrate via reactionof pure water with methane gas because of the low gassolubility and a long induction period. On the basis ofZhong and Rogers’ [2000] work, instead of pure water, a280-ppm sodium dodecyl sulfate (SDS) aqueous solutionwas used to enhance hydrate formation.
2.4. Procedure
[9] Before each experiment, the cell was first filled withthe liquid solution (of either THF or SDS), sand was thenslowly put into the liquid solution with the guidance of aglass rod, and any superfluous liquid above the top of thesand was pumped out. Temperature and pressure were 0�Cand 0.1 MPa (atmospheric) for THF hydrate formation and0�C and 6.6 MPa (methane gas pressure) for methane
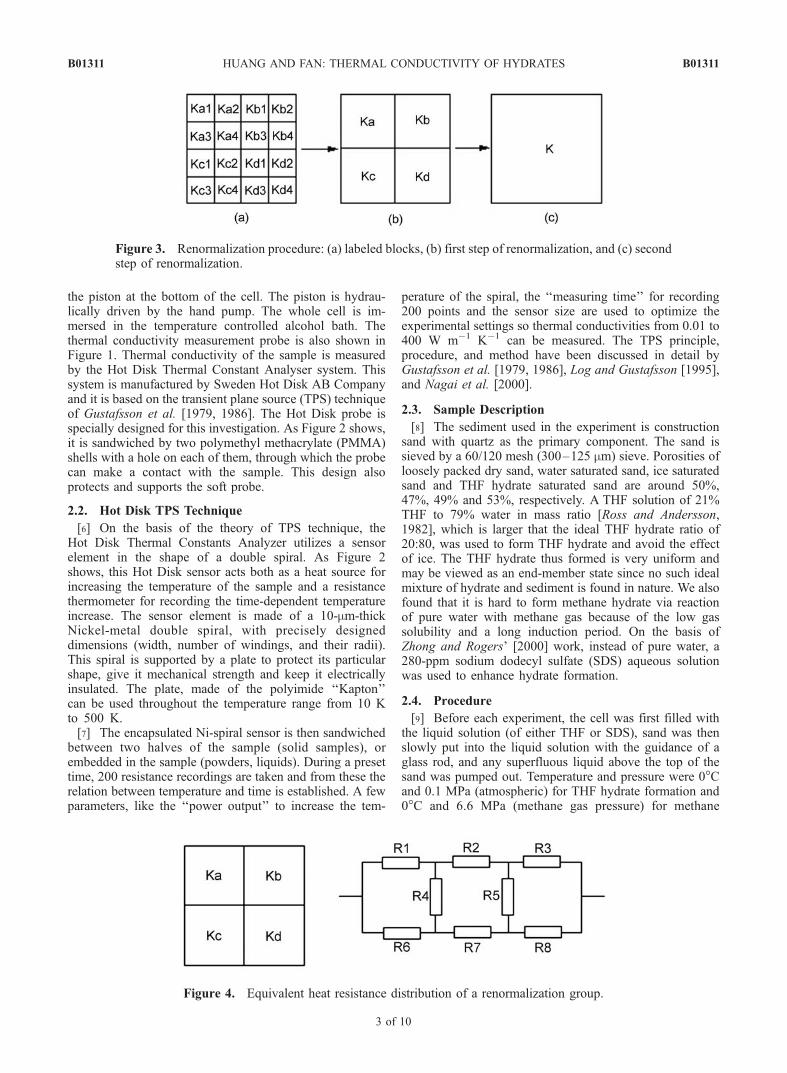
Figure 3. Renormalization procedure: (a) labeled blocks, (b) first step of renormalization, and (c) secondstep of renormalization.
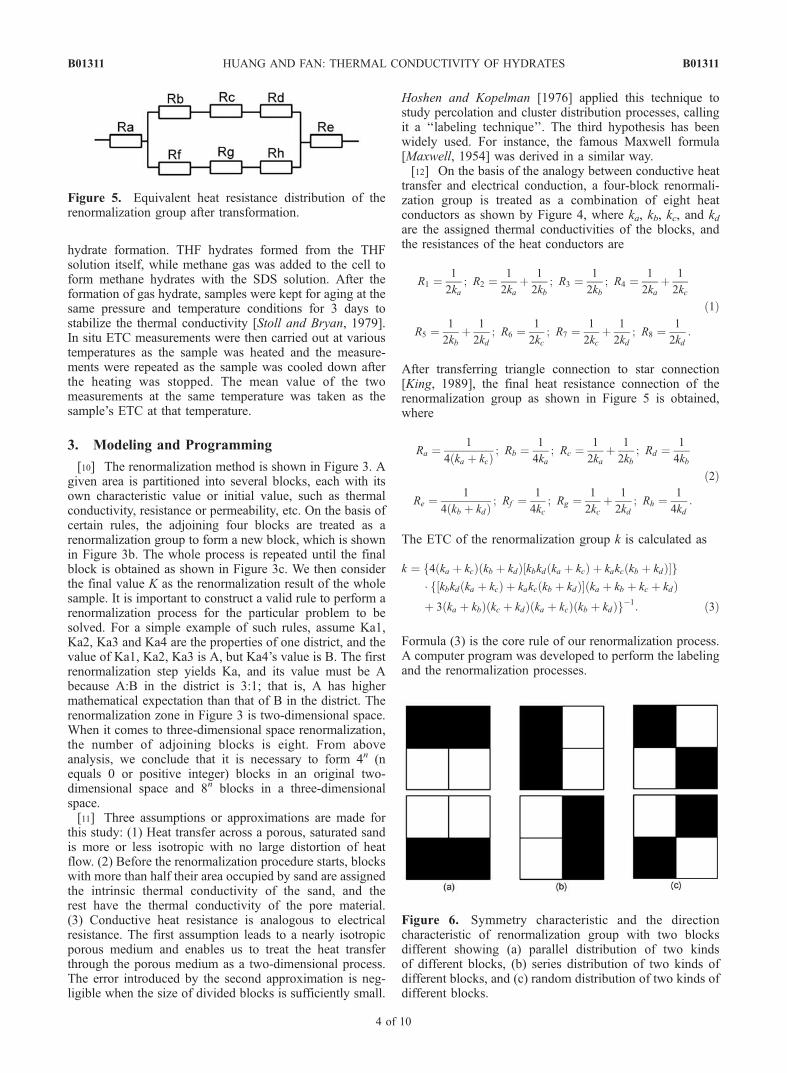
Figure 4. Equivalent heat resistance distribution of a renormalization group.
B01311 HUANG AND FAN: THERMAL CONDUCTIVITY OF HYDRATES
3 of 10
B01311
hydrate formation. THF hydrates formed from the THFsolution itself, while methane gas was added to the cell toform methane hydrates with the SDS solution. After theformation of gas hydrate, samples were kept for aging at thesame pressure and temperature conditions for 3 days tostabilize the thermal conductivity [Stoll and Bryan, 1979].In situ ETC measurements were then carried out at varioustemperatures as the sample was heated and the measure-ments were repeated as the sample was cooled down afterthe heating was stopped. The mean value of the twomeasurements at the same temperature was taken as thesample’s ETC at that temperature.
3. Modeling and Programming
[10] The renormalization method is shown in Figure 3. Agiven area is partitioned into several blocks, each with itsown characteristic value or initial value, such as thermalconductivity, resistance or permeability, etc. On the basis ofcertain rules, the adjoining four blocks are treated as arenormalization group to form a new block, which is shownin Figure 3b. The whole process is repeated until the finalblock is obtained as shown in Figure 3c. We then considerthe final value K as the renormalization result of the wholesample. It is important to construct a valid rule to perform arenormalization process for the particular problem to besolved. For a simple example of such rules, assume Ka1,Ka2, Ka3 and Ka4 are the properties of one district, and thevalue of Ka1, Ka2, Ka3 is A, but Ka4’s value is B. The firstrenormalization step yields Ka, and its value must be Abecause A:B in the district is 3:1; that is, A has highermathematical expectation than that of B in the district. Therenormalization zone in Figure 3 is two-dimensional space.When it comes to three-dimensional space renormalization,the number of adjoining blocks is eight. From aboveanalysis, we conclude that it is necessary to form 4n (nequals 0 or positive integer) blocks in an original two-dimensional space and 8n blocks in a three-dimensionalspace.[11] Three assumptions or approximations are made for
this study: (1) Heat transfer across a porous, saturated sandis more or less isotropic with no large distortion of heatflow. (2) Before the renormalization procedure starts, blockswith more than half their area occupied by sand are assignedthe intrinsic thermal conductivity of the sand, and therest have the thermal conductivity of the pore material.(3) Conductive heat resistance is analogous to electricalresistance. The first assumption leads to a nearly isotropicporous medium and enables us to treat the heat transferthrough the porous medium as a two-dimensional process.The error introduced by the second approximation is neg-ligible when the size of divided blocks is sufficiently small.
Hoshen and Kopelman [1976] applied this technique tostudy percolation and cluster distribution processes, callingit a ‘‘labeling technique’’. The third hypothesis has beenwidely used. For instance, the famous Maxwell formula[Maxwell, 1954] was derived in a similar way.[12] On the basis of the analogy between conductive heat
transfer and electrical conduction, a four-block renormali-zation group is treated as a combination of eight heatconductors as shown by Figure 4, where ka, kb, kc, and kdare the assigned thermal conductivities of the blocks, andthe resistances of the heat conductors are
R1 ¼1
2ka; R2 ¼
1
2kaþ 1
2kb; R3 ¼
1
2kb; R4 ¼
1
2kaþ 1
2kc
R5 ¼1
2kbþ 1
2kd; R6 ¼
1
2kc; R7 ¼
1
2kcþ 1
2kd; R8 ¼
1
2kd:
ð1Þ
After transferring triangle connection to star connection[King, 1989], the final heat resistance connection of therenormalization group as shown in Figure 5 is obtained,where
Ra ¼1
4 ka þ kcð Þ ; Rb ¼1
4ka; Rc ¼
1
2kaþ 1
2kb; Rd ¼
1
4kb
Re ¼1
4 kb þ kdð Þ ; Rf ¼1
4kc; Rg ¼
1
2kcþ 1
2kd; Rh ¼
1
4kd:
ð2Þ
The ETC of the renormalization group k is calculated as
k ¼ 4 ka þ kcð Þ kb þ kdð Þf kbkd ka þ kcð Þ þ kakc kb þ kdð Þ½ g� kbkd ka þ kcð Þ þ kakc kb þ kdð Þ½ f ka þ kb þ kc þ kdð Þþ 3 ka þ kbð Þ kc þ kdð Þ ka þ kcð Þ kb þ kdð Þg�1: ð3Þ
Formula (3) is the core rule of our renormalization process.A computer program was developed to perform the labelingand the renormalization processes.
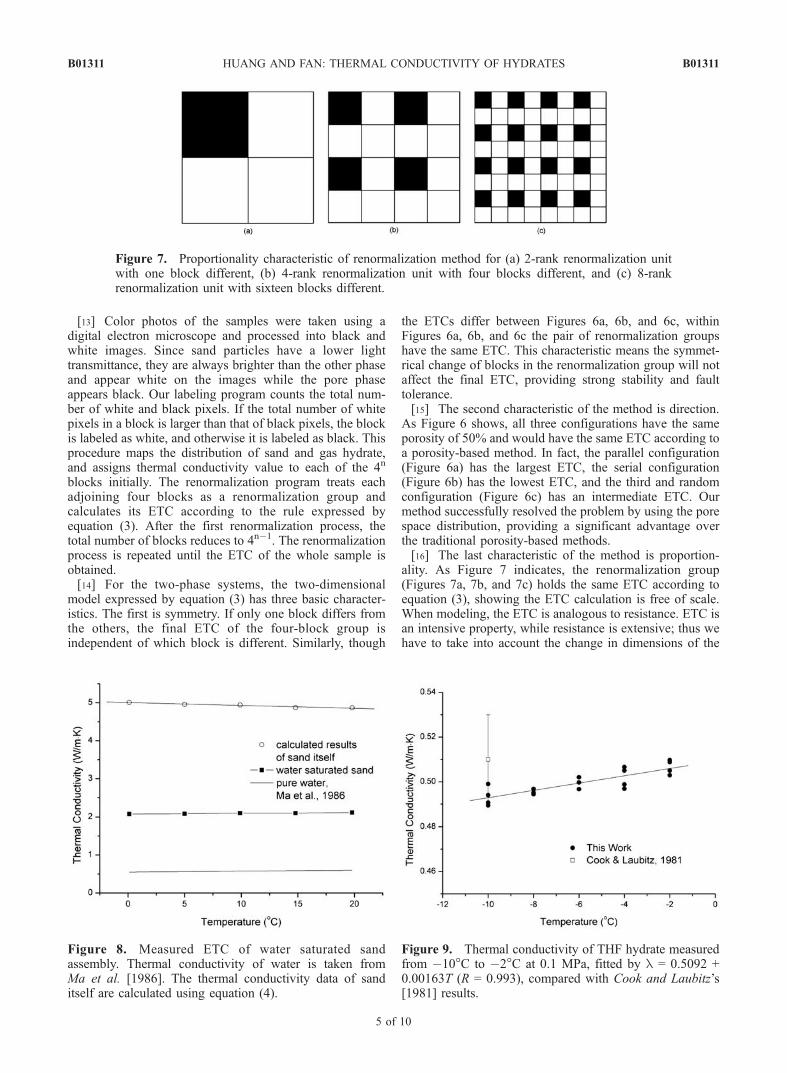
Figure 5. Equivalent heat resistance distribution of therenormalization group after transformation.
Figure 6. Symmetry characteristic and the directioncharacteristic of renormalization group with two blocksdifferent showing (a) parallel distribution of two kindsof different blocks, (b) series distribution of two kinds ofdifferent blocks, and (c) random distribution of two kinds ofdifferent blocks.
B01311 HUANG AND FAN: THERMAL CONDUCTIVITY OF HYDRATES
4 of 10
B01311
[13] Color photos of the samples were taken using adigital electron microscope and processed into black andwhite images. Since sand particles have a lower lighttransmittance, they are always brighter than the other phaseand appear white on the images while the pore phaseappears black. Our labeling program counts the total num-ber of white and black pixels. If the total number of whitepixels in a block is larger than that of black pixels, the blockis labeled as white, and otherwise it is labeled as black. Thisprocedure maps the distribution of sand and gas hydrate,and assigns thermal conductivity value to each of the 4n
blocks initially. The renormalization program treats eachadjoining four blocks as a renormalization group andcalculates its ETC according to the rule expressed byequation (3). After the first renormalization process, thetotal number of blocks reduces to 4n�1. The renormalizationprocess is repeated until the ETC of the whole sample isobtained.[14] For the two-phase systems, the two-dimensional
model expressed by equation (3) has three basic character-istics. The first is symmetry. If only one block differs fromthe others, the final ETC of the four-block group isindependent of which block is different. Similarly, though
the ETCs differ between Figures 6a, 6b, and 6c, withinFigures 6a, 6b, and 6c the pair of renormalization groupshave the same ETC. This characteristic means the symmet-rical change of blocks in the renormalization group will notaffect the final ETC, providing strong stability and faulttolerance.[15] The second characteristic of the method is direction.
As Figure 6 shows, all three configurations have the sameporosity of 50% and would have the same ETC according toa porosity-based method. In fact, the parallel configuration(Figure 6a) has the largest ETC, the serial configuration(Figure 6b) has the lowest ETC, and the third and randomconfiguration (Figure 6c) has an intermediate ETC. Ourmethod successfully resolved the problem by using the porespace distribution, providing a significant advantage overthe traditional porosity-based methods.[16] The last characteristic of the method is proportion-
ality. As Figure 7 indicates, the renormalization group(Figures 7a, 7b, and 7c) holds the same ETC according toequation (3), showing the ETC calculation is free of scale.When modeling, the ETC is analogous to resistance. ETC isan intensive property, while resistance is extensive; thus wehave to take into account the change in dimensions of the
Figure 7. Proportionality characteristic of renormalization method for (a) 2-rank renormalization unitwith one block different, (b) 4-rank renormalization unit with four blocks different, and (c) 8-rankrenormalization unit with sixteen blocks different.
Figure 8. Measured ETC of water saturated sandassembly. Thermal conductivity of water is taken fromMa et al. [1986]. The thermal conductivity data of sanditself are calculated using equation (4).
Figure 9. Thermal conductivity of THF hydrate measuredfrom �10�C to �2�C at 0.1 MPa, fitted by l = 0.5092 +0.00163T (R = 0.993), compared with Cook and Laubitz’s[1981] results.
B01311 HUANG AND FAN: THERMAL CONDUCTIVITY OF HYDRATES
5 of 10
B01311
renormalized block. The third characteristic of our methodindicates the ETC model still has the intensive property, andthe model is stable.
4. Results and Discussion
4.1. Thermal Conductivity of Sand
[17] One difficulty in modeling the ETC of a hydrate-bearing porous medium is the assignment of a proper value
of thermal conductivity to the porous medium itself, or theintrinsic thermal conductivity of the sand. On the basis ofthe analogy of electrical conductivity and thermal conduc-tivity, Woodside and Messmer [1961] proposed a model topredict the ETC of a porous medium saturated with a fluid:
ke ¼akskf
ks 1� dð Þ þ dkfþ ckf ; ð4Þ
where ke is the ETC, ks and kf are the thermal conductivitiesof the solid phase and the fluid respectively. For c = f �0.03, a = 1 � c and d = (1 � f)/a, where f is the porosity,the predicted ETC values were in fair agreement with thoseobserved for unconsolidated sands. Figure 8 shows ourmeasured ETCs of sand saturated with water from 0�C to20�C at 0.1 MPa. The intrinsic thermal conductivity of sandis calculated using (4). The thermal conductivity of water istaken from Ma et al. [1986]. The thermal conductivity ofour sand, as calculated using equation (4), can berepresented by a linear dependence of the thermalconductivity on temperature:
ks ¼ 5:004� 0:0075T R ¼ �0:967ð Þ; ð5Þ
where T is temperature (�C). To validate this determinationof the thermal conductivity of sand, we used equation (5)and our ETC renormalization technique described in section4.3, and successfully resolved the ETC of sand saturatedwith water. The calculated ETC of water saturated sand is2.00 W m�1 K�1 at 0�C and 0.1 MPa, which is very close tothe measured value of 2.08 W m�1 K�1 (Figure 8).
4.2. Thermal Conductivity of THF Hydrate
[18] Figure 9 shows the thermal conductivity of pureTHF hydrate measured at temperatures from �10�C to�2�C. The results are obtained from two independentexperiments. Cook and Laubitz’s [1981] result is also shownfor comparison. The results show a well-defined positive
Figure 10. Image of a THF hydrate-bearing sand sampletaken by a digital electron microscope at �2�C (not toscale). The white parts on the image represent sandparticles.
Figure 11. Six levels of renormalization partition for the sample shown in Figure 10 (not to scale).
B01311 HUANG AND FAN: THERMAL CONDUCTIVITY OF HYDRATES
6 of 10
B01311
temperature dependence similar to that of a glass-likematerial, which agrees well with previous studies [Rossand Andersson, 1982]. This may be explained becauseclathrates encapsulated atoms that can ‘‘rattle’’ inside thevoids and that such a ‘‘phonon-glass and electron-crystal’’material tends to have glass-like thermal transport character-istics [Slack, 1995, 1997; Iversen et al., 2000]. Because ofthe glass-like behavior of THF hydrate thermal conductiv-ity, we can safely assume that the effect of anisotropyresulting from the crystalline structure of THF hydrates onthermal conductivity is minor.
4.3. ETC of Sand Containing Hydrate
[19] Figure 10 shows the black and white image of aTHF hydrate saturated sand porous medium at �2�C and0.1 MPa, and the image is 40 times of original 1.3 mm �1.3 mm sample zone. Figure 11 shows six levels of thelabeling process performed for the image. The result of the
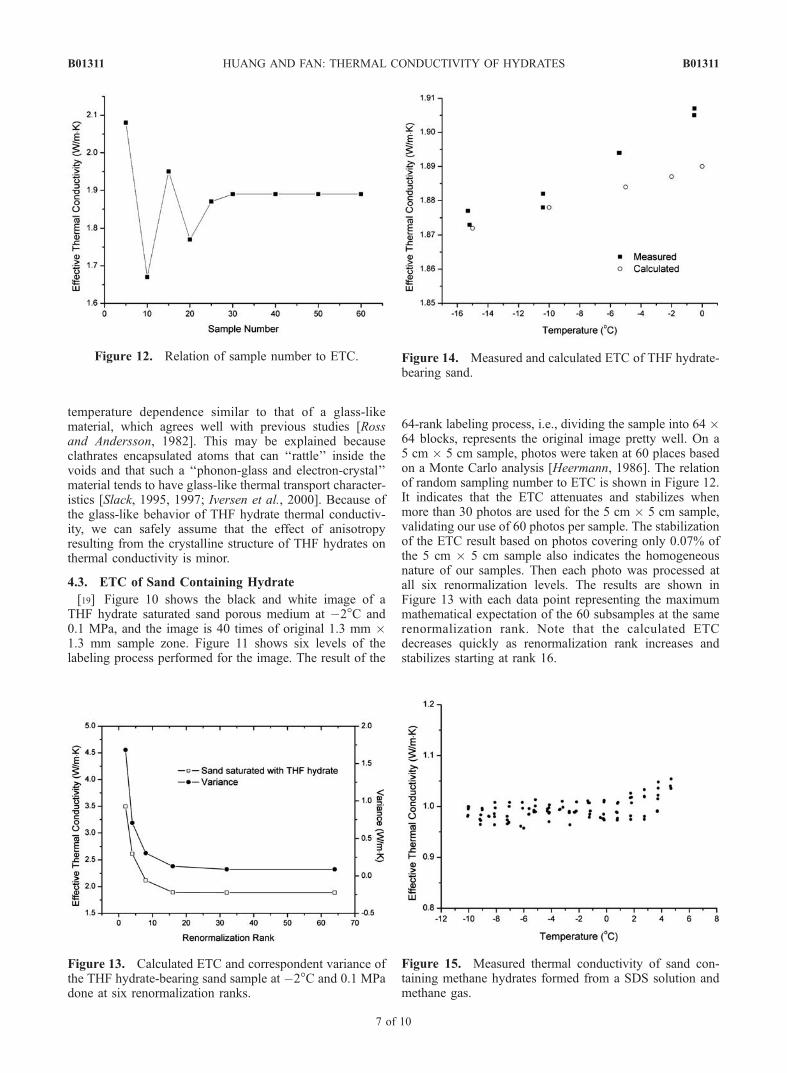
64-rank labeling process, i.e., dividing the sample into 64 �64 blocks, represents the original image pretty well. On a5 cm � 5 cm sample, photos were taken at 60 places basedon a Monte Carlo analysis [Heermann, 1986]. The relationof random sampling number to ETC is shown in Figure 12.It indicates that the ETC attenuates and stabilizes whenmore than 30 photos are used for the 5 cm � 5 cm sample,validating our use of 60 photos per sample. The stabilizationof the ETC result based on photos covering only 0.07% ofthe 5 cm � 5 cm sample also indicates the homogeneousnature of our samples. Then each photo was processed atall six renormalization levels. The results are shown inFigure 13 with each data point representing the maximummathematical expectation of the 60 subsamples at the samerenormalization rank. Note that the calculated ETCdecreases quickly as renormalization rank increases andstabilizes starting at rank 16.
Figure 12. Relation of sample number to ETC.
Figure 13. Calculated ETC and correspondent variance ofthe THF hydrate-bearing sand sample at �2�C and 0.1 MPadone at six renormalization ranks.
Figure 14. Measured and calculated ETC of THF hydrate-bearing sand.
Figure 15. Measured thermal conductivity of sand con-taining methane hydrates formed from a SDS solution andmethane gas.
B01311 HUANG AND FAN: THERMAL CONDUCTIVITY OF HYDRATES
7 of 10
B01311
[20] The ETCs of THF hydrate-bearing sand porousmedia calculated using the rank 64 renormalization processis compared with those measured using the Hot DiskThermal Constant Analyzer in Figure 14. The partitioningand renormalization method prediction is within 0.8% of themeasured value in the temperature range from �15�C to0�C.[21] Figure 15 plots the ETC of a methane hydrate-
bearing sand sample measured at 6.6 MPa, which shows aslight increase with increasing temperature. The results areobtained from three independent experiments, and themeasurements were carried out on methane hydrate formedwith a 280ppm SDS solution. The measured ETCs are muchlower than those of THF hydrate-bearing sand. For exam-ple, the measured ETC of methane hydrate-bearing sandsample is about 1 W m�1 K�1 at 0�C and 6.6 MPa, whilethat of THF hydrate-bearing sand is close to 2 W m�1 K�1
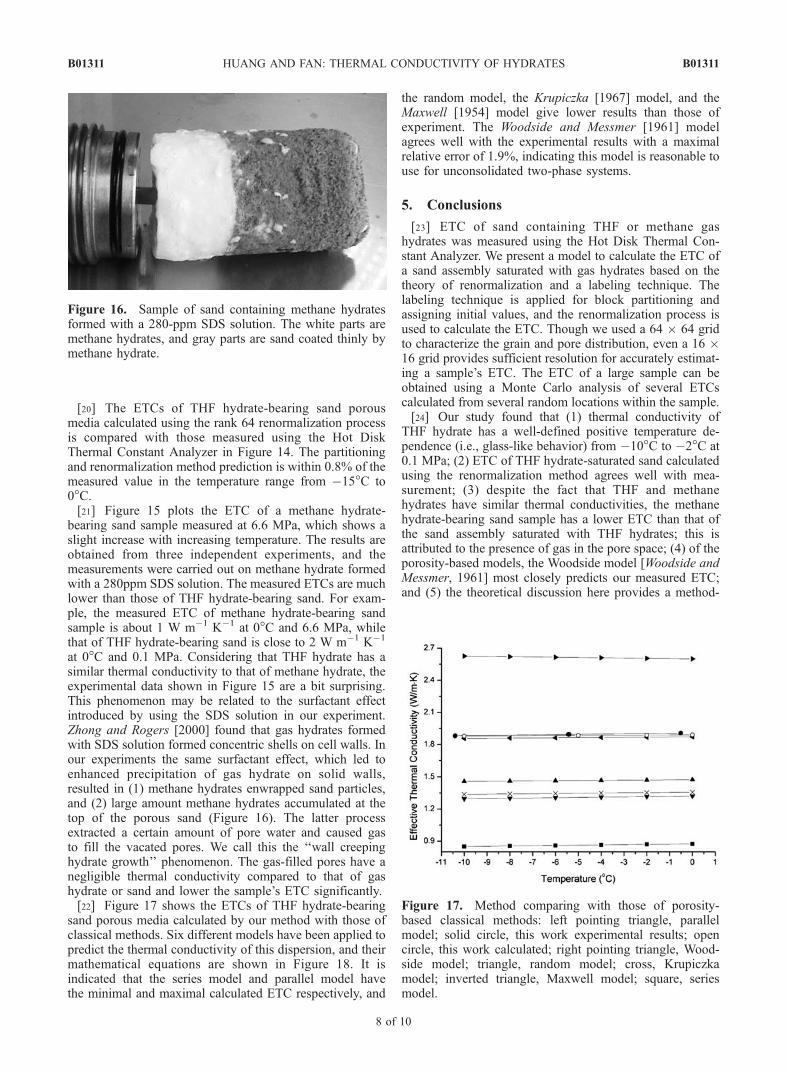
at 0�C and 0.1 MPa. Considering that THF hydrate has asimilar thermal conductivity to that of methane hydrate, theexperimental data shown in Figure 15 are a bit surprising.This phenomenon may be related to the surfactant effectintroduced by using the SDS solution in our experiment.Zhong and Rogers [2000] found that gas hydrates formedwith SDS solution formed concentric shells on cell walls. Inour experiments the same surfactant effect, which led toenhanced precipitation of gas hydrate on solid walls,resulted in (1) methane hydrates enwrapped sand particles,and (2) large amount methane hydrates accumulated at thetop of the porous sand (Figure 16). The latter processextracted a certain amount of pore water and caused gasto fill the vacated pores. We call this the ‘‘wall creepinghydrate growth’’ phenomenon. The gas-filled pores have anegligible thermal conductivity compared to that of gashydrate or sand and lower the sample’s ETC significantly.[22] Figure 17 shows the ETCs of THF hydrate-bearing
sand porous media calculated by our method with those ofclassical methods. Six different models have been applied topredict the thermal conductivity of this dispersion, and theirmathematical equations are shown in Figure 18. It isindicated that the series model and parallel model havethe minimal and maximal calculated ETC respectively, and
the random model, the Krupiczka [1967] model, and theMaxwell [1954] model give lower results than those ofexperiment. The Woodside and Messmer [1961] modelagrees well with the experimental results with a maximalrelative error of 1.9%, indicating this model is reasonable touse for unconsolidated two-phase systems.
5. Conclusions
[23] ETC of sand containing THF or methane gashydrates was measured using the Hot Disk Thermal Con-stant Analyzer. We present a model to calculate the ETC ofa sand assembly saturated with gas hydrates based on thetheory of renormalization and a labeling technique. Thelabeling technique is applied for block partitioning andassigning initial values, and the renormalization process isused to calculate the ETC. Though we used a 64 � 64 gridto characterize the grain and pore distribution, even a 16 �16 grid provides sufficient resolution for accurately estimat-ing a sample’s ETC. The ETC of a large sample can beobtained using a Monte Carlo analysis of several ETCscalculated from several random locations within the sample.[24] Our study found that (1) thermal conductivity of
THF hydrate has a well-defined positive temperature de-pendence (i.e., glass-like behavior) from �10�C to �2�C at0.1 MPa; (2) ETC of THF hydrate-saturated sand calculatedusing the renormalization method agrees well with mea-surement; (3) despite the fact that THF and methanehydrates have similar thermal conductivities, the methanehydrate-bearing sand sample has a lower ETC than that ofthe sand assembly saturated with THF hydrates; this isattributed to the presence of gas in the pore space; (4) of theporosity-based models, the Woodside model [Woodside andMessmer, 1961] most closely predicts our measured ETC;and (5) the theoretical discussion here provides a method-
Figure 16. Sample of sand containing methane hydratesformed with a 280-ppm SDS solution. The white parts aremethane hydrates, and gray parts are sand coated thinly bymethane hydrate.
Figure 17. Method comparing with those of porosity-based classical methods: left pointing triangle, parallelmodel; solid circle, this work experimental results; opencircle, this work calculated; right pointing triangle, Wood-side model; triangle, random model; cross, Krupiczkamodel; inverted triangle, Maxwell model; square, seriesmodel.
B01311 HUANG AND FAN: THERMAL CONDUCTIVITY OF HYDRATES
8 of 10
B01311
ology for accurately estimating thermal conductivity in two-phase systems.
[25] Acknowledgments. We would like to express our heartfeltthanks to Wenyue Xu for spending so much time on correcting this paperand improving the clarity of its expression. We benefited greatly fromdiscussions with him. Financial assistance from National Natural ScienceFoundation of China (50176051, 90410003) is gratefully appreciated.
ReferencesAndersson, O., and H. Suga (1996), Thermal conductivity of normal anddeuterated tetrahydrofuran clathrate hydrates, J. Phys. Chem. Solids,57(1), 125–132.
Andersson, P., and R. G. Ross (1983), Effect of guest molecule size on thethermal conductivity and heat capacity of clathrate hydrates, J. Phys. C,16, 1423–1432.
Collett, T. S. (2002), Energy resource potential of natural gas hydrates,AAPG Bull., 86(11), 1971–1992.
Cook, J. G., and M. J. Laubitz (1981), The thermal conductivity of twoclathrate hydrates, paper presented at 17th International Thermal Con-ductivity Conference, Natl. Inst. of Stand. and Technol., Gaithersburg,Md.
Cook, J. G., and D. G. Leaist (1983), An exploratory study of the thermalconductivity of methane hydrate, Geophys. Res. Lett., 10, 397–399.
de Vries, D. A. (1952), A nonstationary method for determining thermalconductivity of soil in situ, Soil Sci., 73(2), 83–89.
Dharma-wardana, M. W. C. (1983), Thermal conductivity of the ice poly-morphs and the ice clathrates, J. Phys. Chem., 87, 4185–4190.
Ergun, M., and G. Cifci (1999), Gas-saturated shallow sediments in theeastern Black Sea and geohazard effects, paper presented at the AnnualOffshore Technology Conference, Offshore Technol. Conf., Houston,Tex.
Fernandes, C. P., F. S. Magnani, P. C. Philippi, and J. F. Daıan (1996),Multiscale geometrical reconstruction of porous structures, Phys. Rev. E,54(2), 1734–1741.
Gustafsson, S. E., E. Karawacki, and M. N. Khan (1979), Transient hot-strip method for simultaneously measuring thermal conductivity and ther-mal diffusivity of solids and fluids, J. Phys. D, 12, 1411–1421.
Gustafsson, S. E., E. Karawacki, and M. A. Chohan (1986), Thermal trans-port studies of electrically conducting materials using the transient hot-strip technique, J. Phys. D, 19, 727–735.
Haq, B. U. (1999), Methane in the deep blue sea, Science, 285, 543–544.Hatzikiriakos, S. G., and P. Englezos (1993), The relationship betweenglobal warming and methane gas hydrate in the Earth, Chem. Eng.Sci., 48(23), 3963–3969.
Heermann, D. W. (1986), Computer Simulation Methods in TheoreticalPhysics, Springer, New York.
Holder, G. D., and P. Angert (1981), Methane hydrate as a gas resource,paper presented at Intersociety Energy Conversion Engineering Confer-ence, Atlanta, Ga.
Holder, G. D., V. A. Kamath, and S. P. Godbole (1984), Potential of naturalgas hydrates as an energy resource, Annu. Rev. Energy, 9, 427–445.
Hoshen, J., and R. Kopelman (1976), Percolation and cluster distribution.I. Cluster multiple labeling technique and critical concentration algo-rithm, Phys. Rev. B, 14(8), 3438–3445.
Iversen, B. B., et al. (2000), Why are clathrates good candidates for thermo-electric materials, J. Solid State Chem., 149, 455–458.
King, P. R. (1989), The use of renormalization for calculating effectivepermeability, Transp. Porous Media, 4, 37–58.
Krupiczka, R. (1967), Analysis of thermal conductivity in granular materi-als, Int. Chem. Eng., 7(1), 122–144.
Kumar, P., D. Turner, and E. D. Sloan (2004), Thermal diffusivity measure-ments of porous methane hydrate and hydrate-sediment mixtures, J. Geo-phys. Res., 109, B01207, doi:10.1029/2003JB002763.
Kvenvolden, K. A. (1988), Methane hydrate-a major reservoir of carbon inthe shallow geosphere, Chem. Geol., 71, 41–51.
Kvenvolden, K. (2000), Natural gas hydrate: Introduction and history ofdiscovery, in Natural Gas Hydrate in Oceanic and Permafrost Environ-ments, edited by M. D. Max, pp. 9–16, Springer, New York.
Kvenvolden, K. A., and T. D. Lorenson (2001), Global occurrences of gashydrate, paper presented at the 11th International Offshore and PolarEngineering Conference, Nor. Conoco, Stavanger, Norway.
Log, T., and S. E. Gustafsson (1995), Transient plane source technique formeasuring thermal transport properties of building materials, Fire Mater.,19, 43–49.
Ma, Q. F., R. S. Fang, L. C. Xiang, and S. Ni (1986), Handbook of AppliedThermal Properties (in Chinese), China Agric. and Mech. Press, Beijing.
Makogon, Y. F., J. C. Holste, and S. A. Holditch (1998), Natural gashydrates and global change, paper presented at the International Offshoreand Polar Engineering Conference, Montreal, Que., Canada.
Mandelbrot, B. B. (1982), TheFractal Geometry of Nature, W. H. Freeman,New York.
Max, M. D., and A. Lowrie (1996), Oceanic methane hydrates: A ‘frontier’gas resource, J. Pet. Geol., 19(1), 41–56.
Maxwell, J. C. (1954), A Treatise on Electricity and Magnetism, 3rd ed.,Dover, Mineola, N. Y.
Nagai, H., Y. Nakata, T. Tsurue, and H. Minagawa (2000), Thermal con-ductivity measurement of molten silicon by a hot-disk method in short-duration microgravity environments, Jpn. J. Appl. Phys., 39, 1405–1408.
Pitchumani, R., and S. C. Yao (1991), Correlation of thermal conductivitiesof unidirectional fibrous composites using local fractal techniques,J. Heat Transfer, 113, 788–796.
Figure 18. Classical thermal conductivity models.
B01311 HUANG AND FAN: THERMAL CONDUCTIVITY OF HYDRATES
9 of 10
B01311
Revil, A. (2000), Thermal conductivity of unconsolidated sediments withgeophysical applications, J. Geophys. Res., 105, 16,749–16,768.
Ross, R. G., and P. Andersson (1982), Clathrate and other solid phases inthe tetrahydrofuran-water system: Thermal conductivity and heat capacityunder pressure, Can. J. Chem., 60, 881–892.
Ross, R. G., P. Andersson, and G. Backstrom (1981), Unusual PT depen-dence of thermal conductivity for a clathrate hydrate, Nature, 290, 322–323.
Ruppel, C. (2000), Thermal state of the gas hydrate reservoir, in NaturalGas Hydrate in Oceanic and Permafrost Environments, edited by M. D.Max, pp. 29–42, Springer, New York.
Slack, G. A. (1995), CRC Handbook of Thermoelectrics, edited by D. M.Rowe, 401 pp., CRC Press, Boca Raton, Fla.
Slack, G. A. (1997), Design concepts for improved thermoelectric materi-als, in Thermoelectric Materials: New Directions and Approaches, MRSSymp.Proc., vol. 478, edited by T. M. Tritt et al., p. 47, Mater. Res. Soc.,Pittsburgh, Pa.
Sloan, E. D. (1994), Conference overview, Ann. N. Y. Acad. Sci., 715, 1–23.
Stoll, R. D., and G. M. Bryan (1979), Physical properties of sedimentscontaining gas hydrates, J. Geophys. Res., 84, 1629–1634.
Tse, J. S. (1988), Origin of glassy crystalline behavior in the thermal prop-erties of clathrate hydrates: A thermal conductivity study of tetrahydro-furan hydrate, J. Phys. Chem., 92, 5006–5011.
Waite, W. F., J. Pinkston, and S. H. Kirby (2002a), Preliminary laboratorythermal conductivity measurements in pure methane hydrate and methanehydrate-sediment mixtures: A progress report, paper presented at the
Fourth International Conference on Gas Hydrate, Mitsui Eng. and Ship-build., Yokohama, Japan.
Waite, W. F., et al. (2002b), Thermal conductivity measurements in porousmixtures of methane hydrate and quartz sand, Geophys. Res. Lett.,29(24), 2229, doi:10.1029/2002GL015988.
Wang, B. X., L. P. Zhou, and X. F. Peng (2003), A fractal model forpredicting the effective thermal conductivity of liquid with suspensionof nanoparticles, Int. J. Heat Mass Trans., 46, 2665–2672.
Woodside, W., and J. H. Messmer (1961), Thermal conductivity of porousmedia. I. Unconsolidated sands, J. Appl. Phys., 32(9), 1688–1699.
Xu, W., and C. Ruppel (1999), Predicting the occurrence, distribution, andevolution of methane gas hydrate in porous marine sediments, J. Geo-phys. Res., 104, 5081–5095.
Zhang, Y. (2003), Methane escape from gas hydrate systems in marineenvironment, and methane-driven oceanic eruptions, Geophys. Res. Lett.,30(7), 1398, doi:10.1029/2002GL016658.
Zhong, Y., and R. E. Rogers (2000), Surfactant effects on gas hydrateformation, Chem. Eng. Sci., 55, 4175–4187.
�����������������������S. Fan, Guangzhou Center for Gas Hydrate Research, Guangzhou
Institute of Energy Conversion, Chinese Academy of Sciences, Guangzhou510640, China. ([email protected])D. Huang, Department of Thermal Science and Energy Engineering,
University of Science and Technology of China, Hefei 230026, China.
B01311 HUANG AND FAN: THERMAL CONDUCTIVITY OF HYDRATES
10 of 10
B01311