Recovery of Methane from Hydrate Formed in a Variable Volume Bed of Silica Sand Particles
9
5508 r2009 American Chemical Society pubs.acs.org/EF Energy Fuels 2009, 23, 5508–5516 : DOI:10.1021/ef900543v Published on Web 09/24/2009 Recovery of Methane from Hydrate Formed in a Variable Volume Bed of Silica Sand Particles Praveen Linga, † Cef Haligva, † Sung Chan Nam, ‡ John A. Ripmeester, § and Peter Englezos* ,† † Department of Chemical and Biological Engineering, University of British Columbia, Vancouver, BC, Canada V6T 1Z3, ‡ Energy Conversion Research Department, Korea Institute of Energy Research, Yuseong-gu, Daejeon, Korea 305-343, and § Steacie Institute for Molecular Sciences, National Research Council Canada, Ottawa, ON, Canada K1A 0R6 Received May 27, 2009. Revised Manuscript Received August 31, 2009 The decomposition of methane hydrate crystals formed in sediment at 1.0, 4.0, and 7.0 °C was studied in a new apparatus designed to accommodate three different size volume beds of silica sand particles. The sand particles are microporous with a 0.9 nm pore diameter and have an average diameter equal to 329 μm. The hydrate was formed in the interstitial spaces between sand particles, and the hydrate crystal decomposition was driven by heating (thermal stimulation). The amount of methane released from the dissociating hydrate in each experiment (methane recovery curve) was determined, and it was shown that the release of gas proceeds in two stages in terms of rate. The rate of methane release (recovery) per mole of water depends on the bed size for the first stage of hydrate dissociation. The second stage rate does not depend on the bed size. This work suggests that the comparison of simulated data to experimental results from laboratory synthesized hydrate and possibly from natural samples should be done with more than one sample-size data. 1. Introduction Methane and other natural gas components are found stored in the earth in a crystalline form known as gas or clathrate hydrate. 1 The first indication of naturally occurring gas hydrates outside of the Soviet Union was the report by Stoll et al. 2 On the basis of wireline logs from two exploratory wells in the Mackenzie Delta, Canada, Bily and Dick 3 con- cluded that gas hydrates were contained in shallow sand reservoirs. As soon as the significance of the natural gas potential of gas hydrates stored in the earth was realized, efforts to develop extraction methods started. 4-9 Potential reserves of natural gas hydrates are over 1.5 10 16 m 3 and are distributed all over the earth on land in the Arctic and offshore. 10-13 Gas hydrates are nonstoichiometic, crystalline, inclusion compounds. 14,15 For about eight decades they have been known to plug hydrocarbon pipelines. 16 Two reports from the Los Alamos National labora- tory presented the first state of the art analysis and pointed out the difficulties associated with natural gas recovery techniques. 7,17,18 Holder et al. 19 concluded that reservoir porosity and the thermal properties of the hydrates and the reservoir were limiting factors that would determine whether a gas hydrate reservoir could produce gas in an energy efficient manner. It was also realized during these early studies that knowledge of the rate of hydrate decom- position is required. A reliable assessment of the feasibility of producing natural gas from the earth’s naturally occurr- ing hydrates requires several pieces of key information. 20 Although some are reservoir-specific, others such as disso- ciation kinetics have general applicability and can be evalu- ated in the laboratory. 20 Although significant progress has been made regarding modeling and numerical simulation *To whom correspondence should be addressed. Telephone: 1-604- 822-6184. Fax: 1-604-822-6003. E-mail: [email protected]. (1) Makogon, Y. F.; Trebin, F. A.; Trofimuk, A. A.; Tsarev, V. P.; Cherskii, N. Doklady Akademii Nauk SSSR 1971, 196, 203–206. (2) Stoll, R. D.; Ewing, J.; Bryan, G. M. J. Geophys. Res. 1971, 76 (8), 2090–2094. (3) Bily, C.; Dick, J. W. L. Bull. Can. Pet. Geol. 1974, 22 (3), 340–352. (4) Davidson, D. W.; El-Defrawy, M. K.; Fuglem, M. O.; Judge, A. S. Int. Conf. Permafrost Proc. 1978, 3 (1), 937–943. (5) Bowsher, A. L. Proceedings of a Workshop on Clathrates in NPRA held in Menlo Park 7/16-17/79 USGS Open File Report 81-1298; 1981; pp 0-164. (6) Stoll, R. D.; Bryan, G. M. J. Geophys Res. 1979, 84 (B4), 1629. (7) Barraclough, B. L. Methane Hydrate Resource Assessment Pro- gram. Los Alamos Sci Lab Progr Rep No. LA-8569-PR; April-June 1980; p 27. (8) Makogon, Y. F. Perspectives for the Development of Gas-Hydrate Deposits; 4th Can. Permafrost Conf. Proc., R.J.E. Brown Memor. Vol.; 1982; pp 299-304. (9) Judge, A. Natural Gas Hydrates in Canada; 4th Can. Permafrost Conf. Proc., R.J.E. Brown Memor. Vol.; 1982; pp 320-328. (10) Kvenvolden, K. Proc. Natl. Acad. Sci. US 1999, 96, 3420. (11) Milkov, A. V.; Dickens, G. R.; Claypool, G. E.; Lee, Y. J.; Borowski, W. S.; Torres, M. E.; Xu, W. Y.; Tomaru, H.; Trehu, A. M.; Schultheiss, P. Earth Planetary Sci.Lett. 2004, 222 (3-4), 829–843. (12) Kvenvolden, K. A. Rev. Geophys. 1993, 31 (2), 173–187. (13) Makogon, Y. F.; Holditch, S. A.; Makogon, T. Y. J. Pet. Sci. Eng. 2007, 56 (1-3), 14–31. (14) Davidson, D. W., Gas Hydrates. In Water: A Comprehensive Treatise; Plenum Press: New York, 1973; Vol. 2, p 115-234. (15) Sloan, E. D., Jr., Clathrate Hydrates of Natural Gases, Second ed., Revised and Expanded. Marcel Dekker: New York, 1998; p 754. (16) Hammerschmidt, E. G. Ind. Eng. Chem. 1934, 26 (8), 851–855. (17) McGuire, P. L. Methane Hydrate Gas Production: An Assess- ment of Conventional Production Technology as Applied to Hydrate Recovery. LASL Report LA-9102-MS, Order No. DE82006746 from NTIS; 1981; p 20. (18) McGuire, P. L. Methane Hydrate Gas Production by Thermal Stimulation; 4th Can. Permafrost Conf, Calgary 3/2-6/81, R.E. Brown Memor. Vol.; 1982; p 356-362. (19) Holder, G. D.; Angert, P. F.; John, V. T.; Yen, S. A. J. Petrol Tech. 1982, 34 (5), 1127–1132. (20) Kneafsey, T. J.; Tomutsa, L.; Moridis, G. J.; Seol, Y.; Freifeld, B. M.; Taylor, C. E.; Gupta, A. J. Pet. Sci. Eng. 2007, 56 (1-3), 108–126.
Transcript of Recovery of Methane from Hydrate Formed in a Variable Volume Bed of Silica Sand Particles

5508r 2009 American Chemical Society pubs.acs.org/EF
Energy Fuels 2009, 23, 5508–5516 : DOI:10.1021/ef900543vPublished on Web 09/24/2009
Recovery of Methane from Hydrate Formed in a Variable Volume Bed of Silica Sand
Particles
Praveen Linga,† Cef Haligva,† Sung Chan Nam,‡ John A. Ripmeester,§ and Peter Englezos*,†
†Department of Chemical and Biological Engineering, University of British Columbia, Vancouver, BC,Canada V6T 1Z3, ‡Energy Conversion Research Department, Korea Institute of Energy Research, Yuseong-gu,Daejeon, Korea 305-343, and §Steacie Institute for Molecular Sciences, National Research Council Canada,
Ottawa, ON, Canada K1A 0R6
Received May 27, 2009. Revised Manuscript Received August 31, 2009
The decomposition of methane hydrate crystals formed in sediment at 1.0, 4.0, and 7.0 �Cwas studied in anew apparatus designed to accommodate three different size volume beds of silica sand particles. The sandparticles are microporous with a 0.9 nm pore diameter and have an average diameter equal to 329 μm. Thehydrate was formed in the interstitial spaces between sand particles, and the hydrate crystal decompositionwas driven by heating (thermal stimulation). The amount of methane released from the dissociatinghydrate in each experiment (methane recovery curve) was determined, and it was shown that the release ofgas proceeds in two stages in terms of rate. The rate of methane release (recovery) per mole of waterdepends on the bed size for the first stage of hydrate dissociation. The second stage rate does not depend onthe bed size. This work suggests that the comparison of simulated data to experimental results fromlaboratory synthesized hydrate and possibly from natural samples should be done with more than onesample-size data.
1. Introduction
Methane and other natural gas components are foundstored in the earth in a crystalline form known as gas orclathrate hydrate.1 The first indication of naturally occurringgas hydrates outside of the Soviet Union was the report byStoll et al.2 On the basis of wireline logs from two exploratorywells in the Mackenzie Delta, Canada, Bily and Dick3 con-cluded that gas hydrates were contained in shallow sandreservoirs. As soon as the significance of the natural gaspotential of gas hydrates stored in the earth was realized,efforts to develop extraction methods started.4-9 Potential
reserves of natural gas hydrates are over 1.5� 1016m3 and aredistributed all over the earth on land in the Arctic andoffshore.10-13 Gas hydrates are nonstoichiometic, crystalline,inclusion compounds.14,15 For about eight decades they havebeen known to plug hydrocarbon pipelines.16
Two reports from the Los Alamos National labora-tory presented the first state of the art analysis and pointedout the difficulties associated with natural gas recoverytechniques.7,17,18 Holder et al.19 concluded that reservoirporosity and the thermal properties of the hydrates andthe reservoir were limiting factors that would determinewhether a gas hydrate reservoir could produce gas in anenergy efficient manner. It was also realized during theseearly studies that knowledge of the rate of hydrate decom-position is required. A reliable assessment of the feasibilityof producing natural gas from the earth’s naturally occurr-ing hydrates requires several pieces of key information.20
Although some are reservoir-specific, others such as disso-ciation kinetics have general applicability and can be evalu-ated in the laboratory.20 Although significant progresshas been made regarding modeling and numerical simulation
*To whom correspondence should be addressed. Telephone: 1-604-822-6184. Fax: 1-604-822-6003. E-mail: [email protected].(1) Makogon, Y. F.; Trebin, F. A.; Trofimuk, A. A.; Tsarev, V. P.;
Cherskii, N. Doklady Akademii Nauk SSSR 1971, 196, 203–206.(2) Stoll, R. D.; Ewing, J.; Bryan, G.M. J. Geophys. Res. 1971, 76 (8),
2090–2094.(3) Bily, C.; Dick, J. W. L. Bull. Can. Pet. Geol. 1974, 22 (3), 340–352.(4) Davidson, D.W.; El-Defrawy,M.K.; Fuglem,M.O.; Judge, A. S.
Int. Conf. Permafrost Proc. 1978, 3 (1), 937–943.(5) Bowsher, A. L. Proceedings of a Workshop on Clathrates in
NPRA held in Menlo Park 7/16-17/79 USGS Open File Report81-1298; 1981; pp 0-164.(6) Stoll, R. D.; Bryan, G. M. J. Geophys Res. 1979, 84 (B4), 1629.(7) Barraclough, B. L. Methane Hydrate Resource Assessment Pro-
gram.LosAlamosSci LabProgrRepNo.LA-8569-PR; April-June 1980;p 27.(8) Makogon, Y. F. Perspectives for the Development of Gas-Hydrate
Deposits; 4th Can. Permafrost Conf. Proc., R.J.E. BrownMemor. Vol.; 1982;pp 299-304.(9) Judge, A. Natural Gas Hydrates in Canada; 4th Can. Permafrost
Conf. Proc., R.J.E. Brown Memor. Vol.; 1982; pp 320-328.(10) Kvenvolden, K. Proc. Natl. Acad. Sci. US 1999, 96, 3420.(11) Milkov, A. V.; Dickens, G. R.; Claypool, G. E.; Lee, Y. J.;
Borowski, W. S.; Torres, M. E.; Xu, W. Y.; Tomaru, H.; Trehu, A. M.;Schultheiss, P. Earth Planetary Sci.Lett. 2004, 222 (3-4), 829–843.(12) Kvenvolden, K. A. Rev. Geophys. 1993, 31 (2), 173–187.(13) Makogon, Y. F.; Holditch, S. A.; Makogon, T. Y. J. Pet. Sci.
Eng. 2007, 56 (1-3), 14–31.
(14) Davidson, D. W., Gas Hydrates. In Water: A ComprehensiveTreatise; Plenum Press: New York, 1973; Vol. 2, p 115-234.
(15) Sloan, E.D., Jr.,ClathrateHydrates of Natural Gases, Second ed.,Revised and Expanded. Marcel Dekker: New York, 1998; p 754.
(16) Hammerschmidt, E. G. Ind. Eng. Chem. 1934, 26 (8), 851–855.(17) McGuire, P. L. Methane Hydrate Gas Production: An Assess-
ment of Conventional Production Technology as Applied to HydrateRecovery. LASL Report LA-9102-MS, Order No. DE82006746 fromNTIS; 1981; p 20.
(18) McGuire, P. L. Methane Hydrate Gas Production by ThermalStimulation; 4th Can. Permafrost Conf, Calgary 3/2-6/81, R.E. BrownMemor. Vol.; 1982; p 356-362.
(19) Holder, G. D.; Angert, P. F.; John, V. T.; Yen, S. A. J. PetrolTech. 1982, 34 (5), 1127–1132.
(20) Kneafsey, T. J.; Tomutsa, L.;Moridis,G. J.; Seol, Y.; Freifeld, B.M.; Taylor, C. E.; Gupta, A. J. Pet. Sci. Eng. 2007, 56 (1-3), 108–126.

5509
Energy Fuels 2009, 23, 5508–5516 : DOI:10.1021/ef900543v Linga et al.
of natural gas hydrate reservoirs,21-27 few papers in theliterature present experimental data on hydrate forma-tion and decomposition kinetics investigated in porousmedia.20,28-38 Selim and Sloan37 used thermal stimulationto decompose hydrates formed in porousmedia in the labora-tory. The dissociation rate was found to depend on thethermal properties and the porosity of the reservoir. Fur-ther work that was reported from Sloan’s laboratory foundthat endothermic hydrate decomposition processes couldcause such a temperature drop that hydrates might reformor water could freeze.39,40 Handa and Stupin28 reportedthermodynamic properties and dissociation characteristicsof methane and propane in silica gel pores. Stern et al.29
observed the peculiarities of methane clathrate hydrate for-mation and solid state deformation. However the observa-tions28,29 were made at <105 K and 10-3 Pa, whereas in thenatural environment such samples have pressures approxi-mately 3 to 10 MPa and above-freezing temperatures.20 Thecomplexity of hydrate dissociation was also highlighted byTsimpanogiannis and Lichtner41 who also presented a thor-ough literature review along with a parametric study ofmethane hydrate dissociation in oceanic sediments driven bythermal stimulation.
Kneafsey et al.20 studied methane hydrate formation ina bed of silica sand using an X-ray transparent pressurevessel. They highlighted the need for multiple means ofmeasurement, which is critical for understanding hydratebehavior during hydrate formation/decomposition. Theyalso reported that the rate of hydrate formation is not alwaysproportional to the driving force, that is, might increase as
the pressure is reduced toward the equilibrium value. Theyattribute this counterintuitive result to the exsolutionof methane in the water. Tang et al.32 studied the produc-tion behavior of gas hydrate under thermal stimulation inunconsolidated sediment. They reported that the gas pro-duction rate increased with time until it reached a maxi-mum and then it began to decrease. Kono et al.35 reportedthat the decomposition rates can be adjusted by controllingthe sediment properties. They formed methane hydrate invarious custom-designed porous sediments (glass beads) atexperimental conditions of 273.5 K and pressures between6.8 and 13.6 MPa.35 Recently, Liu et al.33 reported throughRaman studies on methane hydrate decomposition in sandthat the change in the intensity ratio of large to small cageswere consistent with respect to bulk hydrate but droppeddramatically after some time, and this turning point wasfound to be related to particle size of the sand. This beha-vior was observed for sands with particle size below 106 μm.The particle sizes of the sands were 53-75, 90-106, 106-150,and 150-180 μm.33
One of the aspects that was not examined in previouslaboratory studies with synthetic hydrate samples or samplesrecovered from the earth is the impact of the sample size on therate with which the gas is released from the sample duringthermal stimulation or depressurization. It should be noted,however, that Handa42 briefly discussed the sample size of anaturally occurring hydrate in the context of calorimetricmeasurements. Such information is useful if the collected dataare to be used to test the validity of numerical simulationschemes for hydrate dissociation. Thus, the objective of thiswork is to study the kinetics of hydrate decomposition in anew apparatus that was specifically designed to investigate thepotential dependency of the results on the size of the silicasand bed. The gas recovery rate during decomposition, alongwith the temperature profiles at various locations in the bed, ispresented.The kinetics studyofhydrate formation in the sameapparatus is presented separately.43
2. Experimental Section
UHP grade methane (Praxair Technology Inc.) and dis-tilled and deionized water was used. The diameter of thesilica sand particles ranged from 150 to 630 μm and had anaverage value of 329 μm. The sand particles were supplied bySigma-Aldrich (catalog number: 274739). The BET surfacearea of the sand was found to be 0.3499 cm2/g and that thesand has micropores with a pore volume of 0.000 152 cm3/g andan average pore diameter of 0.90 nm. The pore volume andpore diameter were calculated using the Horvath-Kawazoemethod.44
2.1. Apparatus. Figure 1 shows the schematic of the appa-ratus. It consists of a crystallizer (CR) that is a cylindrical vessel(I.D.=10.16 cm, height=15.24 cm). The gas released duringdecomposition is collected in a reservoir (R). The crystallizerand the reservoir are immersed in a temperature-controlledwater bath. Pressure is measured with Rosemount smart pres-sure transmitters (model 3051, Norpac controls, Vancouver,BC). Themaximumuncertainty is 0.075%of the span (0-15 000kPa), that is, 11 kPa. The temperatures of the hydrate phase andthe gas phase of the crystallizer are measured using Omegacopper-constantan thermocouples with an uncertainty of 0.1 K.
(21) Moridis, G.; Collett, T. S.; Dallimore, S. R.; Satoh, T.; Hancock,S.; Weatherill, B. In Numerical Simulation Studies of Gas ProductionScenarios From Hydrate Accumulations at the Mallik Site, MackenzieDelta, Canada, Proc. 4th International Conference on Gas Hydrates,Yokohama, May 19-23, 2002; Yokohama, 2002; pp 239-244.(22) Moridis, G. J. SPE J. 2003, 8 (4), 359–370.(23) Moridis, G. J. SPE Reservoir Eval. Eng. 2004, 7 (3), 175–183.(24) Moridis, G. J.; Collett, T. S.; Dallimore, S. R.; Satoh, T.;
Hancock, S.; Weatherill, B. J. Pet. Sci. Eng. 2004, 43 (3-4), 219–238.(25) Moridis, G. J.; Kowalsky, M. B. SPE J. 2007, 12 (2), 253–268.(26) Kowalsky, M. B.; Moridis, G. J. Energy Convers. Manage. 2007,
48 (6), 1850–1863.(27) Gerami, S.; Pooladi-Darvish,M. J. Pet. Sci. Eng. 2007, 56 (1-3),
146–164.(28) Handa, Y. P.; Stupin, D. J. Phys. Chem. 1992, 96, 8599.(29) Stern, L. A.; Kirby, S. H.; Curham, W. B. Science 1996, 273
(5283), 1843–1848.(30) Sakamoto, Y.; Komai, T.; Kawamura, T.; Minagawa, H.;
Tenma, N.; Yamaguchi, T. Int. J. Offshore Polar Eng. 2007, 17 (1),47–56.(31) Katsuki, D.; Ohmura, R.; Ebinuma, T.; Narita, H. Philos. Mag.
2007, 87 (7), 1057–1069.(32) Tang, L. G.; Xiao, R.; Huang, C.; Feng, Z. P.; Fan, S. S. Energy
Fuels 2005, 19 (6), 2402–2407.(33) Liu, C. L.; Lu, H. L.; Ye, Y. G.; Ripmeester, J. A.; Zhang, X. H.
Energy Fuels 2008, 22 (6), 3986–3988.(34) Sung,W.M.; Lee,H.; Kim, S.; Kang,H.Energy Sources 2003, 25
(8), 845–856.(35) Kono, H. O.; Narasimhan, S.; Song, F.; Smith, D. H. Powder
Technol. 2002, 122 (2-3), 239–246.(36) Sun, C. Y.; Chen, G. J. Fluid Phase Equilib. 2006, 242 (2), 123–
128.(37) Selim,M. S.; Sloan, E. D. Soc. Petr. Eng. Reservoir Eng. 1990, 245.(38) Kamata, Y.; Ebinuma, T.; Omura, R.; Minagawa, H.; Narita,
H.; Masuda, Y.; Konno, Y. In Decomposition Experiment of MethaneHydrate Sediment by Thermal Recovery Method, 5th International con-ference on gas hydrates, Trondheim, June 12-16, 2005; Trondheim, 2005.(39) Yousif, M. H.; Abass, H. H.; Selim, M. S.; Sloan, E. D. SPE
Reservoir Eng. 1991, 6 (1), 69–76.(40) Yousif, M. H.; Sloan, E. D. SPE Reservoir Eng. 1991, 6 (4), 452–
458.(41) Tsimpanogiannis, I. N.; Lichtner, P. C. J. Pet. Sci. Eng. 2007, 56
(1-3), 165–175.
(42) Handa, Y. P. Ind. Eng. Chem. Res. 1988, 27 (5), 872–874.(43) Linga, P.; Haligva, C.; Nam, S. C.; Ripmeester, J. A.; Englezos,
P. Energy Fuels 2009, DOI: 10.1021/ef900542m.(44) Horvath, G.; Kawazoe, K. J. Chem. Eng. Jpn. 1983, 16 (6), 470–
475.

5510
Energy Fuels 2009, 23, 5508–5516 : DOI:10.1021/ef900543v Linga et al.
Seven thermocouples are located in the crystallizer with one inthe gas phase and six in the silica sand bed. Constant pressureduring decomposition is obtained by a PID controller and acontrol valve (Fisher Bauman). The data acquisition system(National Instruments) is coupled with a computer to record thedata as well as to communicate with the control valve during theexperiment. The software used for this purpose is LabView 8.0(National Instruments). The apparatus is also equipped with asafety pressure valve.
Figure 2a, shows the location of the seven thermocouplesin the crystallizer. In order to study the effect of the vari-able volume of the silica sand bed on hydrate formation anddecomposition, two copper cylinders are placed inside thecrystallizer as shown in Figure 2b. The reason we chosecopper cylinders to place in the hydrate vessel and decreasethe sample size is because heat transfer resistance throughcopper (copper thermal conductivity = 400 W/mK45) is mini-mized. The first copper cylinder (CC1) has a diameter of 7.62 cm(3 in) and the second one (CC2) is 5.08 cm (2 in). The wallthickness of both cylinders is 1.27 cm (0.5 in). Both coppercylinders fit precisely in the crystallizer. The placement of thecopper cylinders is seen in Figure 3. It is noted that only fourthermocouples could be accommodated in the silica bed withboth CC1 and CC2 present in the crystallizer (Figure 2b).
2.2. Procedure. 2.2.1. Formation Experiment. The procedurefor the formation experiment is described in detail in theformation paper.43 Briefly, a 7.0 cm (height) bed of silica sandis created by placing 914.1 g of sand in the crystallizer. Thevolume of water required to fill the void space with water (100%saturation) was found to be 0.217 cm3/g which is the interstitialor pore volume of the bed of sand particles. Accordingly,198.5 mL of water was added to the sand. The amount of thesand placed in the crystallizer was reduced to 513.7 g and 228.5 gwhen one (CC1) or two (CC1þCC2) copper cylinders are pre-sent, respectively. The height of the silica sand bed remained thesame (7.0 cm). The bed was prepared by splitting the requiredamount of sand and water into five equal parts and placing eachin a batch order (sand þ water) to form a uniform bed and alsoto eliminate the presence of any pockets of air in the bed.Subsequently, the crystallizer is pressurized with methane to
2.5MPa and depressurized to atmospheric pressure three times.The pressure in the crystallizer is then set to the desired value.When the temperature reaches the target temperature(approximately 5 min) then the data is logged. All hydrateformation experiments are carried out with a fixed amount ofwater and gas. The temperature in the crystallizer was main-tained constant by providing cooling externally. When hydrateformation occurs, gas will be consumed and hence the pressurein the closed system drops. Typically, the experiment wasallowed to continue until there is no significant change in therate of pressure drop in the crystallizer. Finally, the pressure andtemperature data are used to calculate the moles of methaneconsumed in the crystallizer (gas uptake). This is equal to thenumber of moles in the gas phase of the crystallizer andthe tubing at time zero minus the number of moles at the endof the experiment.43,46
2.2.2. Decomposition Experiment. After the completion ofeach hydrate formation experiment, the hydrates were de-composed at a constant pressure as follows. The pressure inthe crystallizer was decreased to the desired pressure (20%above the equilibrium hydrate formation pressure). The tem-perature in the crystallizer was then allowed to become stable(to reach 4.0 �C, if the formation experiment was conductedat 4.0 �C). This takes less than about 10 min. The temperatureof the crystallizer was then increased to the desired value byheating the water bath with an external refrigerator/heater.This is time zero for the decomposition experiment, and thedata is recorded. Note that during this step there was nodecomposition taking place since the temperature in the crys-tallizer was below the equilibrium temperature at the experi-mental pressure. For example, the decomposition temperaturefor methane hydrate at 4.6 MPa is 5.7 �C. During the experi-ment, when the temperature of the crystallizer crosses theequilibrium phase boundary, the hydrate starts to decompose,and since the pressure in the crystallizer was maintained con-stant by the PID controller, the excess gas was released from thecrystallizer and collected in the reservoir (R). The experimentproceeded until therewas no further release ofmethane gas fromthe hydrate.
At any given time, the total number of moles (nT,t) in thesystem remains constant and equal to that at time zero (nT,0).The system in this case includes the crystallizer (CR), thereservoir (R), and the connecting tubing. During the decom-position experiment the pressure in the crystallizer is keptconstant. Hence, the gas released from the hydrate during theexperiment is collected in the reservoir (R). A PID controllercoupled with a control value is employed for this purpose. Thetotal number ofmoles at any given time is the sumof the numberof moles (nG) in gas phase (G) of the crystallizer, the number ofmoles (nR) collected in the reservoir, and the number of moles(nH) in the hydrate phase. The number of moles of gas releasedfrom the hydrate at any time during hydrate decomposition canthen be calculated as follows,
nH,0 -nH, t ¼ nG, t -nG, 0þnR, t -nR, 0 ð1Þor
ΔnH, v ¼ nH,0 -nH, t
¼ PV
zRT
� �G, t
-PV
zRT
� �G,0
þ PV
zRT
� �R, t
-PV
zRT
� �R, 0
ð2Þwhere z is the compressibility factor calculated by Pitzer’scorrelation.47
Figure 1. Apparatus.
(45) Incropera, F. P.; DeWitt, D. P., Fundamentals of Heat and MassTransfer, Fifth ed.; John Wiley & Sons Inc.: 2002.
(46) Haligva, C.Natural Gas Recovery fromHydrates in a Silica SandMatrix; University of British Columbia: Vancouver, 2008.
(47) Smith, J. M.; Van Ness, H. C.; Abbott, M. M., Introduction toChemical Engineering Thermodynamics; McGraw-Hill, Inc.: New York,2001.

5511
Energy Fuels 2009, 23, 5508–5516 : DOI:10.1021/ef900543v Linga et al.
The percent methane recovery is calculated as a function oftime for any given decomposition experiment based on informa-tion obtained from its formation experiment and is calculated bythe following equation:
% methane recovery ¼ ðΔnH, vÞtðΔnH, VÞtend
� 100 ð3Þ
where (ΔnH,V)tend is the number of moles consumed for hydrateformation at the end of a typical formation experiment and(ΔnH,v)t is the number of moles released from hydrates duringhydrate decomposition at any given time. It should be noted herethat if one has a natural sample (hydrate core), then during adecomposition experiment the number of moles released (ΔnH,v)tcan be determined but the quantity (ΔnH,V)tend is not known.
3. Results and Discussion
Table 1 summarizes the hydrate formation experimentalconditions, the amount ofmethane consumed to formhydrateand the water conversion to hydrate crystals. The duration of
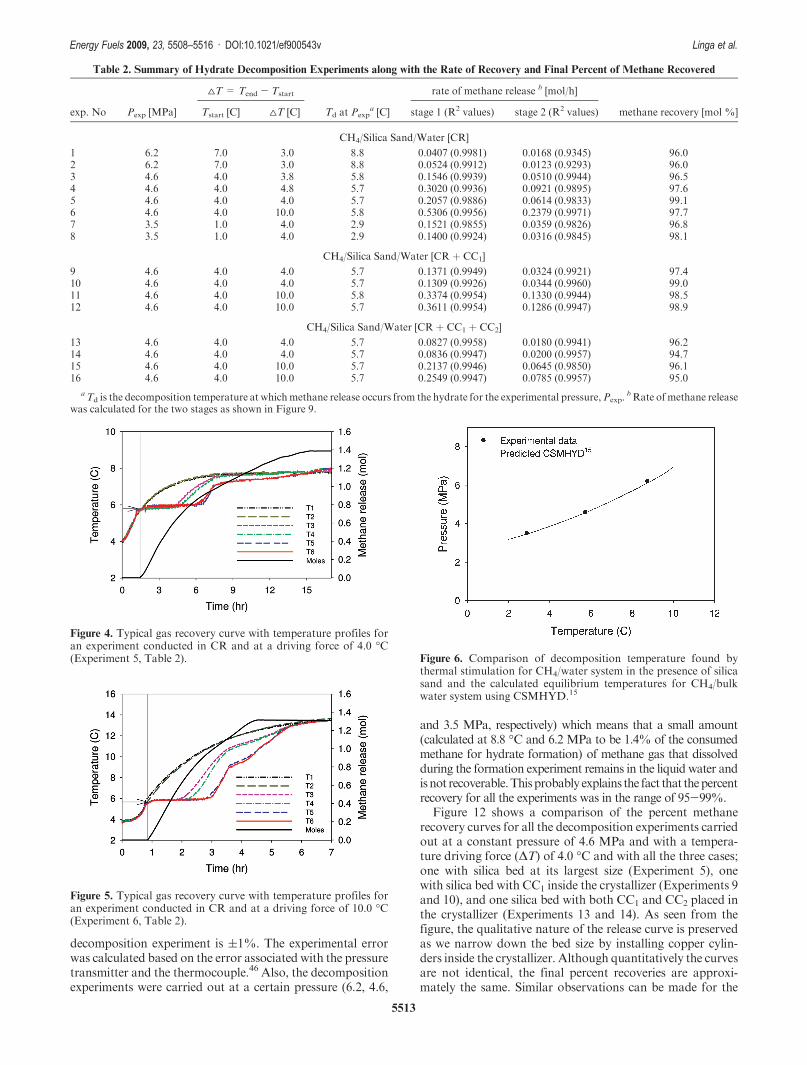
each experiment is reported in Table 1. The water conversionwas calculated based on a hydration number of 6.1.48 Allexperiments with the reduced size beds (CC1 and CC1þCC2)were conducted at a temperature of 4.0 �C to ensure that asignificant amount of hydrate exists in the bed. The decom-position experiments are summarized in Table 2. Figures 4and 5 show the typical gas recovery curves, (ΔnH,v)t, obtainedduring Experiments 5 and 6 respectively. As seen in thefigures, when the temperature exceeds 5.7 �C (equilibriumtemperature at Pexp), hydrate starts to decompose. The pres-sure in the crystallizer ismaintained constant, and the releasedgas is collected in the reservoir.When the temperature exceeds5.7 �C, the temperature profiles are different because thetemperatures depend on the heat absorbed for hydrate dis-sociation (hydrate dissociation is an endothermic process) andheat supplied (heat is supplied to the crystallizer by heating the
Figure 2. Cross section and top view of the crystallizer showing, (a) location of the thermocouples with in the crystallizer without the coppercylinders (b) arrangement of the copper cylinders (CC1 and CC2) in the crystallizer, and the location of the thermocouples.
(48) Tulk, C. A.; Ripmeester, J. A.; Klug, D. D. Gas Hydrates:Challenges Future 2000, 912, 859–872.

5512
Energy Fuels 2009, 23, 5508–5516 : DOI:10.1021/ef900543v Linga et al.
bathby an external heater). Thebalance of theseheat transfersdetermines the thermocouple responses. The decompositiontemperatures at which methane release occurred for the otherexperiments carried out at 6.2 and 3.5 MPa are also given inTable 2. All the decomposition temperatures were comparedwith those calculated based on widely known computationalmethod and software.15 They were found to be in excellentagreement, as seen in Figure 6.
Figure 7 shows the temperature profiles and methanerelease curves for two experiments obtained with beds CC1
(experiment 10) and CC1þCC2 (experiment 14) in the crystal-lizer for a thermal driving force of 4.0 �C. As seen bycomparing the temperature profiles for the full size (CR)bed (Figure 4) with one copper (CRþCC1) cylinder(Figure 7, top) and two copper (CRþCC1þCC2) cylinders
(Figure 7, bottom), the temperature profiles are no longerdistinct when we narrow the bed size. For example, T6 (seeFigure 2a for its position) in Figure 4 stays constant at about∼5.7 C for ∼4.5 h and gradually catches up with the otherthermocouples as methane release slows down. Whereas inFigure 7 (top), T4 (as seen in Figure 2b it is located in thesameposition asT6 in the full size bed) stays constant at about∼5.7 C for ∼2 h when one copper cylinder is present, and inFigure 7 (bottom) T4 follows the path of the other thermo-couples. This is probably due to the heat transfer between thecopper cylinder and the reactorwall (Figure 2b) being faster ascompared to the heat transfer between the sand/hydratematrix and the reactor wall (Figure 2a). The same behaviorcanbe seen in the thermocouple readings in the decompositionexperiments conducted at a higher driving force (10 �C) for thethree bed sizes (Figures 5, 8-top and 8-bottom).
Figure 9 shows the methane recovery curve for Experiment9 carried out at 4.6 MPa and a driving force (4T) of4.0 �C. Time zero in the figure is the time when methanerelease from the hydrate begins.As seen in the figure,methanerecovery occurred at two stages (stages 1 and 2). Two suchstages were observed for all the decomposition experimentswith all bed sizes. The rate of methane release for each stagewas calculated by fitting the data to a straight line. The ratesare given in Table 2. As seen in Figure 9, 0.5 mols of methaneare recovered in the first stage. Considering that the totalamount of methane recovered from hydrate for this experi-ment (Experiment 9) is 0.77 mols, this corresponds to 65%recovery in the first stage. The explanation why the decom-position slows down after stage 1 can be obtained by examin-ing Figure 4. As seen in Figure 4, around 0.79 mols arerecovered in the first stage, which lasts approximately 4 h.At this time the temperatures of thermocouples T3 and T4
begin to increase while, T5 and T6 are still in the plateauindicating decomposition taking place in the region where T5
and T6 are located, while the decomposition appears to becompleted in the region around thermocouples T3 and T4.Hence, during the first stage the decomposition appears tooccur in the entire sample (activity detected by all thermo-couples in the bed), whereas in the second stage the decom-position appears to be complete in some regions whileoccurring in some regions (stranded pockets), leading to areduction in the rate of gas release.
The moles of methane released due to hydrate decomposi-tion for the set of experiments carried out in the presence ofcopper cylinder CC1 and both CC1 and CC2 are shown inFigures 10 (top) and 11 (top). The percent recovery ofmethane as a function of time was calculated using eq 3.The values are shown inFigures 10 (bottom) and 11 (bottom).As expected, the recoveryofmethane fromhydrateswas fasterfor the higher driving force of 10.0 �C for both cases.Complete recovery was achieved in just over 3.3 h (Figure10 & 11) for the higher driving force, whereas it took around12.5 h (Figure 10) for the experiments carried out at a drivingforce of 4.0 �C with the presence of CC1 and around 8.3 h(Figure 11) with the presence of both CC1 and CC2 at thedriving force of 4.0 �C. Moreover, the release curves at thesame driving force are similar. The final percent recovery ofmethane from hydrate for the decomposition experiments arepresented in Table 2. As can be seen, a percentage recovery inthe range of 95-99% was obtained for all the decompositionexperiments performed at 6.2, 4.6, and 3.5 MPa, respectively.It is also noted that the experimental error associated withthe mole consumption calculation for each formation and
Table 1. Hydrate Formation Experimental Conditionsa
end of experiment
exp. No. Texp [C] time [hr]CH4 consumed[mol/mol of H20]
water conversionto hydrate [mol %]
CH4/Silica Sand/Water [CR]1 7.0 92.5 0.0172 10.22 7.0 100.6 0.0180 11.03 4.0 71.6 0.1287 78.54 4.0 48.6 0.1261 77.05 4.0 29.0 0.1266 77.26 4.0 29.0 0.1215 74.17 1.0 65.3 0.1308 79.88 1.0 95.4 0.1350 82.4
CH4/Silica Sand/Water [CR þ CC1]9 4.0 61.2 0.1288 78.510 4.0 24.0 0.1244 75.911 4.0 24.0 0.1315 80.212 4.0 40.0 0.1381 84.3
CH4/Silica Sand/Water [CR þ CC1 þ CC2]13 4.0 46.9 0.1261 76.914 4.0 41.7 0.1410 85.915 4.0 46.7 0.1238 75.516 4.0 34.7 0.1603 97.8
aThe initial pressure for all the experiments was 8.0 MPa.
Figure 3. Arrangement of copper cylinders inside the crystallizer.
5513
Energy Fuels 2009, 23, 5508–5516 : DOI:10.1021/ef900543v Linga et al.
decomposition experiment is (1%. The experimental errorwas calculated based on the error associated with the pressuretransmitter and the thermocouple.46 Also, the decompositionexperiments were carried out at a certain pressure (6.2, 4.6,
and 3.5 MPa, respectively) which means that a small amount(calculated at 8.8 �C and 6.2 MPa to be 1.4% of the consumedmethane for hydrate formation) of methane gas that dissolvedduring the formation experiment remains in the liquid water andisnot recoverable.Thisprobably explains the fact that thepercentrecovery for all the experiments was in the range of 95-99%.
Figure 12 shows a comparison of the percent methanerecovery curves for all the decomposition experiments carriedout at a constant pressure of 4.6 MPa and with a tempera-ture driving force (ΔT) of 4.0 �C and with all the three cases;one with silica bed at its largest size (Experiment 5), onewith silica bed with CC1 inside the crystallizer (Experiments 9and 10), and one silica bed with both CC1 and CC2 placed inthe crystallizer (Experiments 13 and 14). As seen from thefigure, the qualitative nature of the release curve is preservedas we narrow down the bed size by installing copper cylin-ders inside the crystallizer. Although quantitatively the curvesare not identical, the final percent recoveries are approxi-mately the same. Similar observations can be made for the
Table 2. Summary of Hydrate Decomposition Experiments along with the Rate of Recovery and Final Percent of Methane Recovered
4T = Tend - Tstart rate of methane release b [mol/h]
exp. No Pexp [MPa] Tstart [C] 4T [C] Td at Pexpa [C] stage 1 (R2 values) stage 2 (R2 values) methane recovery [mol %]
CH4/Silica Sand/Water [CR]
1 6.2 7.0 3.0 8.8 0.0407 (0.9981) 0.0168 (0.9345) 96.02 6.2 7.0 3.0 8.8 0.0524 (0.9912) 0.0123 (0.9293) 96.03 4.6 4.0 3.8 5.8 0.1546 (0.9939) 0.0510 (0.9944) 96.54 4.6 4.0 4.8 5.7 0.3020 (0.9936) 0.0921 (0.9895) 97.65 4.6 4.0 4.0 5.7 0.2057 (0.9886) 0.0614 (0.9833) 99.16 4.6 4.0 10.0 5.8 0.5306 (0.9956) 0.2379 (0.9971) 97.77 3.5 1.0 4.0 2.9 0.1521 (0.9855) 0.0359 (0.9826) 96.88 3.5 1.0 4.0 2.9 0.1400 (0.9924) 0.0316 (0.9845) 98.1
CH4/Silica Sand/Water [CR þ CC1]
9 4.6 4.0 4.0 5.7 0.1371 (0.9949) 0.0324 (0.9921) 97.410 4.6 4.0 4.0 5.7 0.1309 (0.9926) 0.0344 (0.9960) 99.011 4.6 4.0 10.0 5.8 0.3374 (0.9954) 0.1330 (0.9944) 98.512 4.6 4.0 10.0 5.7 0.3611 (0.9954) 0.1286 (0.9947) 98.9
CH4/Silica Sand/Water [CR þ CC1 þ CC2]
13 4.6 4.0 4.0 5.7 0.0827 (0.9958) 0.0180 (0.9941) 96.214 4.6 4.0 4.0 5.7 0.0836 (0.9947) 0.0200 (0.9957) 94.715 4.6 4.0 10.0 5.7 0.2137 (0.9946) 0.0645 (0.9850) 96.116 4.6 4.0 10.0 5.7 0.2549 (0.9947) 0.0785 (0.9957) 95.0
a Td is the decomposition temperature at whichmethane release occurs from the hydrate for the experimental pressure,Pexp.bRate of methane release
was calculated for the two stages as shown in Figure 9.
Figure 4. Typical gas recovery curve with temperature profiles foran experiment conducted in CR and at a driving force of 4.0 �C(Experiment 5, Table 2).
Figure 5. Typical gas recovery curve with temperature profiles foran experiment conducted in CR and at a driving force of 10.0 �C(Experiment 6, Table 2).
Figure 6. Comparison of decomposition temperature found bythermal stimulation for CH4/water system in the presence of silicasand and the calculated equilibrium temperatures for CH4/bulkwater system using CSMHYD.15

5514
Energy Fuels 2009, 23, 5508–5516 : DOI:10.1021/ef900543v Linga et al.
results with a temperature driving force of 10.0 �C shownFigure 13.
The quantitative differences between the results with dif-ferent size sand beds are better illustrated when the calculated
rates of methane release (given in Table 2) are plotted. Morespecifically, the rates permol ofwater are determined since thebeds hold different amounts of water available for hydrateformation. Figure 14 shows the calculated rates along withthe standard errors plotted against the volume of the bed forthe temperature driving force of 4.0 and 10.0 �C, respectively.There is a decreasing trend in the calculated rate of methanerelease for the first stage as we increase the bed size while therates are more or less the same for the second stage. Clearly,there is a strong dependency of methane recovery rate on the
Figure 7. Gas recovery curve with temperature profiles for theexperiment conducted with one copper cylinder (Experiment 10)and two copper cylinders in CR (Experiment 14) and a driving forceof 4.0 �C.
Figure 8. Gas recovery curve with temperature profiles for theexperiment conducted with one copper cylinder (Experiment 12)and two copper cylinders in CR (Experiment 15) and a driving forceof 10.0 �C.
Figure 9. Methane release measurement curve from hydrate show-ing two stages of recovery and the calculated rate of recovery(Experiment 9, Table 2).
Figure 10. Moles of methane released and corresponding percentmethane recovery from hydrate from the decomposition experi-ments carried out with the presence of CC1 at 4.6 MPa and drivingforce (4T) of 4.0 and 10 �C.Number in the parentheses indicates theexperiment number in Table 2.

5515
Energy Fuels 2009, 23, 5508–5516 : DOI:10.1021/ef900543v Linga et al.
bed size for the first stagewhile the calculated rates aremore orless the same for the second stage. In our view, this finding hasimportant implications when data are compared to models.When numerical simulations are performed to validate hy-drate reservoirmodels or simply to comparewith experimentaldata, then laboratory data for different sample sizes must beused. This is especially significant when the model underconsideration relies on adjustable parameters. Second, it isrecommended that when samples of naturally occurring hy-drates are obtained for physical testing, then different sample
sizes should be obtained for use in hydrate dissociationexperiments where the rate of gas release is measured.
4. Conclusions
A new apparatus was set up to study methane hydrateformation and decomposition behavior in the interstitial spaceof a bed of silica sand particles. The unique feature of thisapparatus is the ability to do experiments with three bed sizes.This was achieved by installing one and two copper cylindersin the crystallizer, thereby narrowing the size of the bed withthe height of bed kept constant at 7.0 cm. Decomposition of
Figure 11. Moles of methane released and corresponding percentmethane recovery from hydrates from the decomposition experi-ments carried out with the presence of CC1 and CC2 at 4.6MPa anddriving force (4T) of 4.0 and 10 �C, respectively. Number in theparentheses indicates the experiment number in Table 2.
Figure 12. Comparison of methane recovery from decompositionexperiments for the three different silica bed sizes studied at con-stant pressure of 4.6 MPa and a temperature driving force (4T) of4.0 �C. Number in the parentheses indicates the experiment numberin Table 2.
Figure 13. Comparison of percent methane recovery from decom-position experiments for three different silica bed sizes (CR,CRþCC1, CRþCC1þCC2) studied at a constant pressure of4.6 MPa and a temperature driving force (4T) of 10.0 �C. Numberin the parentheses indicates the experiment number in Table 2.
Figure 14. The calculated rates along with the standard errorsplotted against the volume of the bed for all the decompositionexperiments carried out at a driving force of 4.0 �C (Experiments 5,9, 10, 13, and 14) and 10 �C (Experiments 6, 11, 12, 15, and 16).

5516
Energy Fuels 2009, 23, 5508–5516 : DOI:10.1021/ef900543v Linga et al.
hydrate by thermal stimulation was carried out for the recov-ery of the methane from the decomposing hydrate. Recoveriesin the range of 95-99%were achieved. The recovery was alsofound to be faster with a driving force of 10.0 �C compared tothat at 4.0 �C, as expected. The results from all experimentsindicated that hydrate dissociation occurred in two stages(a faster methane recovery rate was followed by a slower one).Moreover, the rate of methane release (recovery) per mol ofwater was found to depend on the bed size for the first stage ofhydrate dissociation. The implications of the findings on theuse of laboratory data and sampling of natural gas hydrates inthe earth were discussed.
Nomenclature
nT = total number of molesnH=molesof the gas inhydrateþwaterphaseofCrystallizer
nG = moles of gas in gas phase of CrystallizernR = moles of gas in ReservoirVG = volume of gas phase in CrystallizerVR = volume of Reservoirz = compressibility factor(ΔnH,V)tend = number of moles consumed for hydrate for-
mation at the end of a formation experiment.(ΔnH,v)t =number of moles released from hydrates during
hydrate decomposition at any given time
Acknowledgment. The financial support from the NaturalSciences and Engineering Research Council of Canada(NSERC) and Natural Resources Canada (NRCan) is greatlyappreciated. Dr. Nam would like to thank the Korean Govern-ment (MOEHRD) for the Korea Research Foundation Grant(KRF-2006-611-D00006).