Study on methane hydrate formation in gas–water systems ...
13
Study on methane hydrate formation in gas–water systems with a new compound promoter Xiaofang Lv, * a Dayong Lu, a Yang Liu, * a Shidong Zhou, a Jiangwei Zuo, a Hao Jin, b Bohui Shi c and Entian Li a The effects of a new promoter on the growth kinetics of methane hydrates were investigated using a visualized constant-pressure autoclave. The experimental results show that when the 1#, 2# and 3# unit promoter was compounded at a ratio of 2 : 1 : 1, the induction time was shortened greatly from 30 h to 0.64 h compared to the no promoter situation. Meanwhile, there was a larger amount of hydrate formation, and final hydrate volume fraction was 83.652%. Then, the hydrate formation characteristics under different additive dosages (500 ppm, 1000 ppm, 2000 ppm, 5000 ppm) and different subcooling degrees (2.5 C, 3.5 C, 4.5 C, 5.5 C, 6.5 C) were investigated. The new promoter at these 4 concentrations could effectively shorten the induction time. And the higher the concentration, the smaller the induction time (0.22 h at 5000 ppm). It was also found that gas consumption and hydrate production rate increased first and then decreased with increasing promoter dosage. Finally, the optimal dosage was determined to be 2000 ppm, at which the induction time was shortened to 0.52 h, and the final hydrate volume fraction was 85.74%. Under the dosage of 2000 ppm and the subcooling degree of 6.5 C, the shortest induction time (0.29 h) and the maximum formation rate (20.950 ml h 1 ) were obtained among all the experimental conditions in this work. Moreover, the greater the subcooling degree, the faster the hydrate nucleation, and the shorter the induction time. However, if the subcooling degree was too high, a hydrate layer formed rapidly at the gas–liquid interface in the autoclave, which would hinder hydrate formation and lead to the reduction of hydrate volume fraction to 60.153%. Therefore, a reasonable selection of the proportioning of promoters, dosage of the promoter and formation temperature could significantly promote the formation of hydrates. The findings in this work are meaningful to hydrate associated applications and can provide useful references for the selection of hydrate promoters. 1 Introduction Hydrates are cage crystals formed by small molecules of gas and water molecules under low temperature and high pressure conditions. 1,2 1m 3 of hydrate can store 180 m 3 of natural gas (standard conditions). 3,4 Based on their unique physical and chemical characteristics, a series of hydrate associated tech- nologies in hydrogen storage, 5,6 carbon capture, 7,8 seawater desalination, 9,10 cold storage refrigeration 11,12 and other elds have been developed and applied. However, a series of prob- lems such as strict hydrate formation conditions, long induc- tion time, slow reaction rate, etc., hinder the industrialization of hydrate application technology. 13–15 In the recent decade, one of the most common methods to promote hydrate formation is adding low-dose chemical additives, most of which are organic liquids and surfactants, including tetrahydrofuran (THF), sodium dodecyl sulfate (SDS), sodium dodecylbenzenesulfonate (SDBS) and nanouid series, etc. 16–21 Veluswamy et al. 22 studied the effects of 5.6 mol% THF on the kinetics of methane hydrates. They found that under static conditions, the hydrate formation pressure decreased from 6.7 MPa to 2.5 MPa, indicating that a large amount of gas could be stored at moderate pressure. Zhang et al. 23 investigated the effects of different dosages of SDS on the induction time of methane hydrates. For their pure water + methane system, aer the addition of SDS, the induction time was reduced to less than 14 hours, while there was no hydrate formed even 3 days later without SDS addition. However, no regular relationship was observed between induction time and SDS concentration by them. Kumar 24 studied the growth kinetics of CO 2 hydrates under different concentrations of SDS solution. They found that the addition of SDS signicantly increased the hydrate a Jiangsu Key Laboratory of Oil and Gas Storage and Transportation Technology, Changzhou University, Changzhou 213016, China. E-mail: [email protected]. cn; [email protected] b The 714 Research Institute of CSIC (China Shipbuilding Industry Corporation), Building 1, 55 Kehui Road, Beijing 100101, China c National Engineering Laboratory for Pipeline Safety, MOE Key Laboratory of Petroleum Engineering, Beijing Key Laboratory of Urban Oil and Gas Distribution Technology, China University of Petroleum-Beijing, Beijing 102249, China Cite this: RSC Adv. , 2019, 9, 33506 Received 18th August 2019 Accepted 11th October 2019 DOI: 10.1039/c9ra06467b rsc.li/rsc-advances 33506 | RSC Adv., 2019, 9, 33506–33518 This journal is © The Royal Society of Chemistry 2019 RSC Advances PAPER Open Access Article. Published on 18 October 2019. Downloaded on 2/7/2022 7:02:21 AM. This article is licensed under a Creative Commons Attribution-NonCommercial 3.0 Unported Licence. View Article Online View Journal | View Issue
-
Upload
khangminh22 -
Category
Documents
-
view
0 -
download
0
Transcript of Study on methane hydrate formation in gas–water systems ...

RSC Advances
PAPER
Ope
n A
cces
s A
rtic
le. P
ublis
hed
on 1
8 O
ctob
er 2
019.
Dow
nloa
ded
on 2
/7/2
022
7:02
:21
AM
. T
his
artic
le is
lice
nsed
und
er a
Cre
ativ
e C
omm
ons
Attr
ibut
ion-
Non
Com
mer
cial
3.0
Unp
orte
d L
icen
ce.
View Article OnlineView Journal | View Issue
Study on methan
aJiangsu Key Laboratory of Oil and Gas S
Changzhou University, Changzhou 213016
cn; [email protected] 714 Research Institute of CSIC (Chi
Building 1, 55 Kehui Road, Beijing 100101,cNational Engineering Laboratory for Pip
Petroleum Engineering, Beijing Key Labora
Technology, China University of Petroleum-B
Cite this: RSC Adv., 2019, 9, 33506
Received 18th August 2019Accepted 11th October 2019
DOI: 10.1039/c9ra06467b
rsc.li/rsc-advances
33506 | RSC Adv., 2019, 9, 33506–335
e hydrate formation in gas–watersystems with a new compound promoter
Xiaofang Lv, *a Dayong Lu,a Yang Liu, *a Shidong Zhou, a Jiangwei Zuo,a
Hao Jin,b Bohui Shi c and Entian Li a
The effects of a new promoter on the growth kinetics of methane hydrates were investigated using
a visualized constant-pressure autoclave. The experimental results show that when the 1#, 2# and 3#
unit promoter was compounded at a ratio of 2 : 1 : 1, the induction time was shortened greatly from
30 h to 0.64 h compared to the no promoter situation. Meanwhile, there was a larger amount of hydrate
formation, and final hydrate volume fraction was 83.652%. Then, the hydrate formation characteristics
under different additive dosages (500 ppm, 1000 ppm, 2000 ppm, 5000 ppm) and different subcooling
degrees (2.5 �C, 3.5 �C, 4.5 �C, 5.5 �C, 6.5 �C) were investigated. The new promoter at these 4
concentrations could effectively shorten the induction time. And the higher the concentration, the
smaller the induction time (0.22 h at 5000 ppm). It was also found that gas consumption and hydrate
production rate increased first and then decreased with increasing promoter dosage. Finally, the optimal
dosage was determined to be 2000 ppm, at which the induction time was shortened to 0.52 h, and the
final hydrate volume fraction was 85.74%. Under the dosage of 2000 ppm and the subcooling degree of
6.5 �C, the shortest induction time (0.29 h) and the maximum formation rate (20.950 ml h�1) were
obtained among all the experimental conditions in this work. Moreover, the greater the subcooling
degree, the faster the hydrate nucleation, and the shorter the induction time. However, if the subcooling
degree was too high, a hydrate layer formed rapidly at the gas–liquid interface in the autoclave, which
would hinder hydrate formation and lead to the reduction of hydrate volume fraction to 60.153%.
Therefore, a reasonable selection of the proportioning of promoters, dosage of the promoter and
formation temperature could significantly promote the formation of hydrates. The findings in this work
are meaningful to hydrate associated applications and can provide useful references for the selection of
hydrate promoters.
1 Introduction
Hydrates are cage crystals formed by small molecules of gas andwater molecules under low temperature and high pressureconditions.1,2 1 m3 of hydrate can store 180 m3 of natural gas(standard conditions).3,4 Based on their unique physical andchemical characteristics, a series of hydrate associated tech-nologies in hydrogen storage,5,6 carbon capture,7,8 seawaterdesalination,9,10 cold storage refrigeration11,12 and other eldshave been developed and applied. However, a series of prob-lems such as strict hydrate formation conditions, long induc-tion time, slow reaction rate, etc., hinder the industrialization of
torage and Transportation Technology,
, China. E-mail: [email protected].
na Shipbuilding Industry Corporation),
China
eline Safety, MOE Key Laboratory of
tory of Urban Oil and Gas Distribution
eijing, Beijing 102249, China
18
hydrate application technology.13–15 In the recent decade, one ofthe most common methods to promote hydrate formation isadding low-dose chemical additives, most of which are organicliquids and surfactants, including tetrahydrofuran (THF),sodium dodecyl sulfate (SDS), sodium dodecylbenzenesulfonate(SDBS) and nanouid series, etc.16–21
Veluswamy et al.22 studied the effects of 5.6 mol% THF on thekinetics of methane hydrates. They found that under staticconditions, the hydrate formation pressure decreased from6.7 MPa to 2.5 MPa, indicating that a large amount of gas couldbe stored at moderate pressure. Zhang et al.23 investigated theeffects of different dosages of SDS on the induction time ofmethane hydrates. For their pure water + methane system, aerthe addition of SDS, the induction time was reduced to less than14 hours, while there was no hydrate formed even 3 days laterwithout SDS addition. However, no regular relationship wasobserved between induction time and SDS concentration bythem. Kumar24 studied the growth kinetics of CO2 hydratesunder different concentrations of SDS solution. They found thatthe addition of SDS signicantly increased the hydrate
This journal is © The Royal Society of Chemistry 2019
Fig. 1 Overview diagram of the gas hydrate experimental system. 1-Gas cylinder; 2-gas booster pump; 3-air compressor; 4-water bath; 5-constant pressure reactor; 6-pressure sensor; 7-temperature sensor;8, 9-data acquisition system; 10, 11, 12, 13, 14, 15, 17-valves.
Paper RSC Advances
Ope
n A
cces
s A
rtic
le. P
ublis
hed
on 1
8 O
ctob
er 2
019.
Dow
nloa
ded
on 2
/7/2
022
7:02
:21
AM
. T
his
artic
le is
lice
nsed
und
er a
Cre
ativ
e C
omm
ons
Attr
ibut
ion-
Non
Com
mer
cial
3.0
Unp
orte
d L
icen
ce.
View Article Online
conversion rate, and hydrate conversion rate graduallyincreased with the increasing SDS concentration. Okutaniet al.25 examined the promotion of methane hydrate formationby SDS in a static system, and found that the SDS solution at1000 ppm could shorten the induction time to 40 min, simul-taneously, enhance the formation rate and conversion rate ofhydrates. Jiang et al.26 found that the addition of SDS couldsignicantly shorten the induction time and improve thestability of hydrate formation, but SDS did not have signicanteffect on hydrate storage capacity.
Torre J.-P. et al.27 found that the combination of THF andSDS could greatly shorten the induction time of CO2 hydrates inboth static and stirring conditions. They suggested that theadditives directly affected hydrate formation, while SDS had noeffect on the phase equilibrium curve of CO2 hydrates and CO2 +THF hydrates. However, the reason why the combination (THF +SDS) was so effective, and the exact mechanism has not beenproposed by them. Lirio et al.28 studied the effects of SDS andTHF on the gas storage capacity of CO2 hydrates. It was foundthat hydrates could nucleate faster in the SDS (500 ppm) andTHF (5 mol%) compound solution, and the gas storage capacitywas also promoted. They presented that THF formed SII(structure II) hydrates and occupied larger cavities formed bywater molecules, which would promote the formation of SIhydrates formed by CO2 molecules. This effect was benecial tocapture more gas into the solid hydrates, indicating a syner-gistic effect of the simultaneous usage of SDS and THF. Kumaret al.29 studied the formation kinetics of CO2 hydrates atconstant pressure (3.55 MPa) and constant temperature (274 K)condition with the addition of silica gel. They found that silicagel possessed large pore size and high surface area, which couldimprove hydrate formation rate and conversion rate. Among thethree surfactants, anion (SDS) and nonionic (Tween-80) aremore effective than the cationic surfactant (dodecyl-trimethylammonium chloride). SDS was found to be mosteffective in increasing the rate of hydrate formation andreducing the induction time, and the hydrate formation ratewas increased 15 times compared to static pure water system.Mohammadi et al.30,31 studied the effects of synthetic silvernano-particles and SDS on the formation rate and storagecapacity of CO2 hydrates. Their results showed that SDS or silvernano-particles had no signicant effect on reducing inductiontime or increasing the storage capacity of CO2 hydrates. But themixture of SDS and silver nano-particles signicantly increasedthe storage capacity of carbon dioxide. Fazlali et al.32 studied theeffects of complex solutions of SDS, SDBS and CTAB on theformation characteristics of methane hydrates. Compared withthe pure water system, the induction time of the system withSDS and CTAB was shortened from 58min to 17 min (which was2.4 times) and the formation rate was increased by 4.5 times(from 3.811 � 10�5 mol s�1 to 2.091 � 10�4 mol s�1), exhibitingpretty signicant promotion effect. In conclusion, the effect ofthe compounding additive is much more signicant than thatof a single additive.
For both single hydrate promoters and complex hydratepromoters, the promotion effect varies and are limited byexperimental materials and conditions. There is still a big gap
This journal is © The Royal Society of Chemistry 2019
from industrial applications.33 In this work, the growth char-acteristics of methane hydrates (induction time, hydratevolume fraction and average formation rate) in different com-pounding ratio, dosage, and subcooling degree were investi-gated in a high pressure autoclave. This study providesa reference for the study of the kinetics of methane hydrate inthe presence of promoters.
2 Experiment section2.1 Apparatus
According to the requirements of the experiments, a constantpressure visualized experimental system for studying gashydrate formation characteristics was designed and built. Asshowed in Fig. 1, the experimental system mainly consists ofa hydrate reaction system (visualized reaction kettle), a gassupply and boosting system, a temperature control system,a data acquisition system, etc. The core device, reaction kettle, isshown in Fig. 2, and its working principle diagram is shown inFig. 3. The piston can move downwards to maintain the systempressure in the kettle. The maximum volume of the kettle is100 ml, which can hold liquid up to 50 ml. Besides, with 30 mlliquid injection, the gas–liquid interface can be just observed atthe center of lens, which are benecial to obtain a more clearversion of images of the hydrate growth process. The workingpressure range is 0–15 MPa, and the working temperature rangeis �10–30 �C. The temperature sensor in the kettle is platinumresistance (Pt100) with a precision of �0.1 �C. The gas pressurein the autoclave is measured by a pressure sensor with a preci-sion of �0.01 MPa. The experimental temperature of the reac-tion kettle is controlled by a water bath with the adjustingprecision of�0.01 �C, where an antifreeze solution composed of40% ethylene glycol and 60% distilled water is selected as thecoolant.
2.2 Materials
The methane gas used in the experiments was purchased fromChangzhou Jinghua Industrial Gas Co. Ltd, and the purity was99.8%. The experimental hydrate promoter was obtained by
RSC Adv., 2019, 9, 33506–33518 | 33507
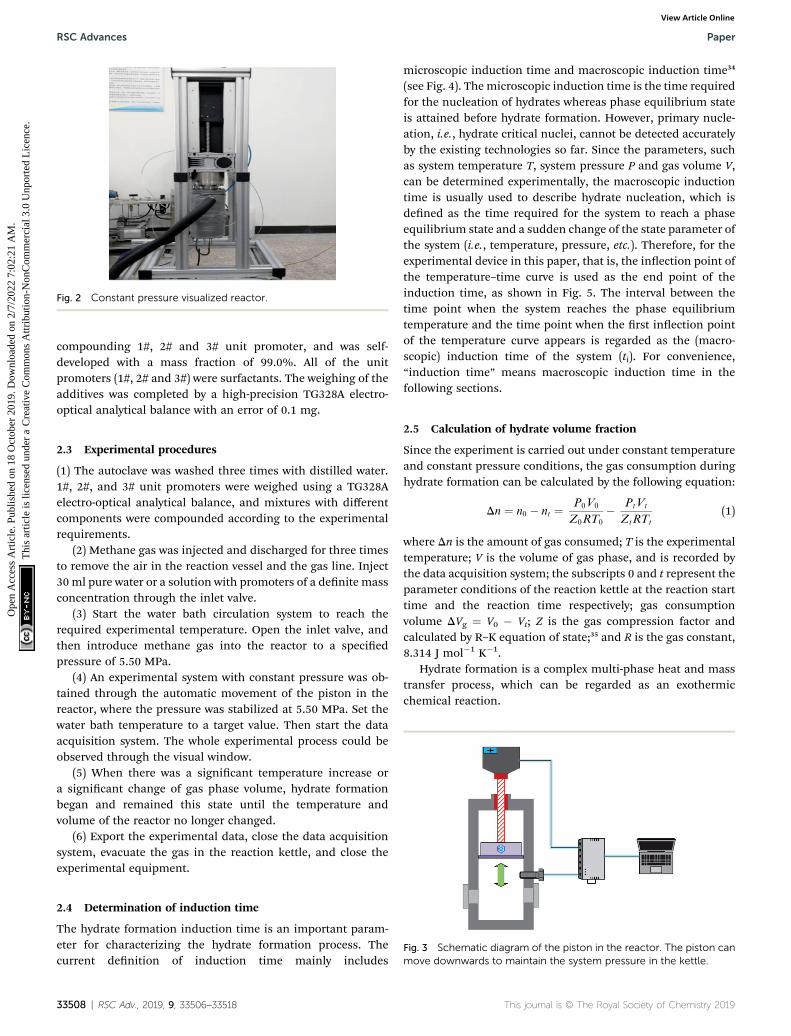
Fig. 2 Constant pressure visualized reactor.
RSC Advances Paper
Ope
n A
cces
s A
rtic
le. P
ublis
hed
on 1
8 O
ctob
er 2
019.
Dow
nloa
ded
on 2
/7/2
022
7:02
:21
AM
. T
his
artic
le is
lice
nsed
und
er a
Cre
ativ
e C
omm
ons
Attr
ibut
ion-
Non
Com
mer
cial
3.0
Unp
orte
d L
icen
ce.
View Article Online
compounding 1#, 2# and 3# unit promoter, and was self-developed with a mass fraction of 99.0%. All of the unitpromoters (1#, 2# and 3#) were surfactants. The weighing of theadditives was completed by a high-precision TG328A electro-optical analytical balance with an error of 0.1 mg.
2.3 Experimental procedures
(1) The autoclave was washed three times with distilled water.1#, 2#, and 3# unit promoters were weighed using a TG328Aelectro-optical analytical balance, and mixtures with differentcomponents were compounded according to the experimentalrequirements.
(2) Methane gas was injected and discharged for three timesto remove the air in the reaction vessel and the gas line. Inject30 ml pure water or a solution with promoters of a denite massconcentration through the inlet valve.
(3) Start the water bath circulation system to reach therequired experimental temperature. Open the inlet valve, andthen introduce methane gas into the reactor to a speciedpressure of 5.50 MPa.
(4) An experimental system with constant pressure was ob-tained through the automatic movement of the piston in thereactor, where the pressure was stabilized at 5.50 MPa. Set thewater bath temperature to a target value. Then start the dataacquisition system. The whole experimental process could beobserved through the visual window.
(5) When there was a signicant temperature increase ora signicant change of gas phase volume, hydrate formationbegan and remained this state until the temperature andvolume of the reactor no longer changed.
(6) Export the experimental data, close the data acquisitionsystem, evacuate the gas in the reaction kettle, and close theexperimental equipment.
Fig. 3 Schematic diagram of the piston in the reactor. The piston canmove downwards to maintain the system pressure in the kettle.
2.4 Determination of induction time
The hydrate formation induction time is an important param-eter for characterizing the hydrate formation process. Thecurrent denition of induction time mainly includes
33508 | RSC Adv., 2019, 9, 33506–33518
microscopic induction time and macroscopic induction time34
(see Fig. 4). The microscopic induction time is the time requiredfor the nucleation of hydrates whereas phase equilibrium stateis attained before hydrate formation. However, primary nucle-ation, i.e., hydrate critical nuclei, cannot be detected accuratelyby the existing technologies so far. Since the parameters, suchas system temperature T, system pressure P and gas volume V,can be determined experimentally, the macroscopic inductiontime is usually used to describe hydrate nucleation, which isdened as the time required for the system to reach a phaseequilibrium state and a sudden change of the state parameter ofthe system (i.e., temperature, pressure, etc.). Therefore, for theexperimental device in this paper, that is, the inection point ofthe temperature–time curve is used as the end point of theinduction time, as shown in Fig. 5. The interval between thetime point when the system reaches the phase equilibriumtemperature and the time point when the rst inection pointof the temperature curve appears is regarded as the (macro-scopic) induction time of the system (ti). For convenience,“induction time” means macroscopic induction time in thefollowing sections.
2.5 Calculation of hydrate volume fraction
Since the experiment is carried out under constant temperatureand constant pressure conditions, the gas consumption duringhydrate formation can be calculated by the following equation:
Dn ¼ n0 � nt ¼ P0V0
Z0RT0
� PtVt
ZtRTt
(1)
where Dn is the amount of gas consumed; T is the experimentaltemperature; V is the volume of gas phase, and is recorded bythe data acquisition system; the subscripts 0 and t represent theparameter conditions of the reaction kettle at the reaction starttime and the reaction time respectively; gas consumptionvolume DVg ¼ V0 � Vt; Z is the gas compression factor andcalculated by R–K equation of state;35 and R is the gas constant,8.314 J mol�1 K�1.
Hydrate formation is a complex multi-phase heat and masstransfer process, which can be regarded as an exothermicchemical reaction.
This journal is © The Royal Society of Chemistry 2019
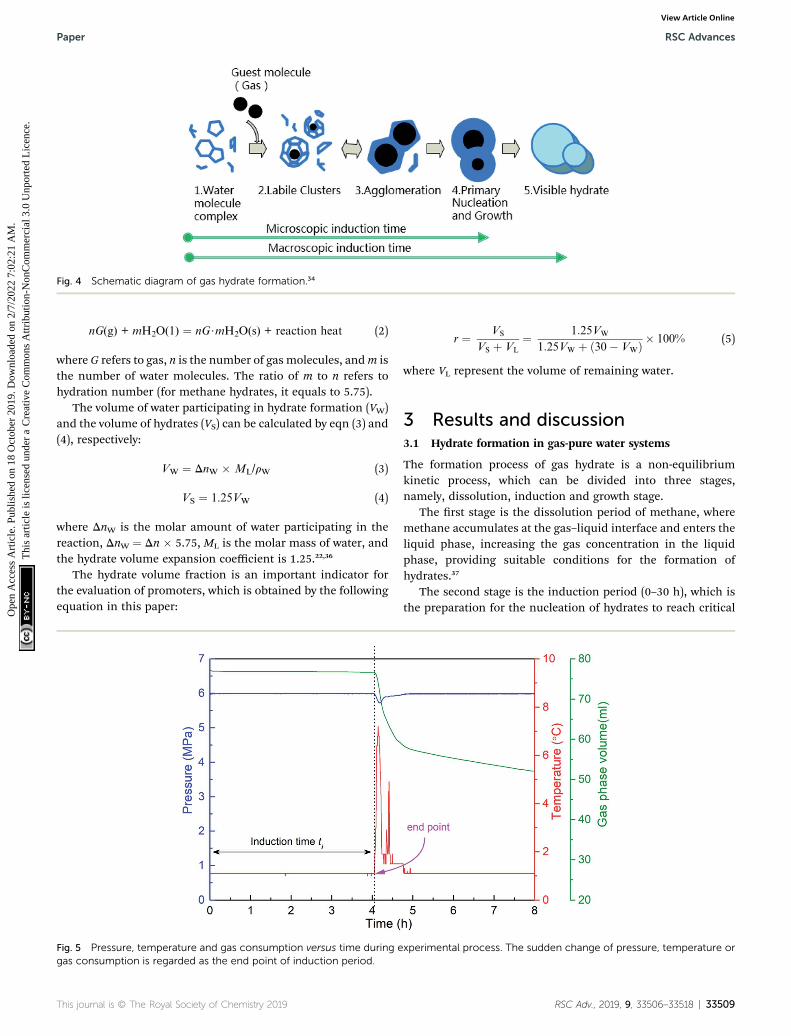
Fig. 4 Schematic diagram of gas hydrate formation.34
Paper RSC Advances
Ope
n A
cces
s A
rtic
le. P
ublis
hed
on 1
8 O
ctob
er 2
019.
Dow
nloa
ded
on 2
/7/2
022
7:02
:21
AM
. T
his
artic
le is
lice
nsed
und
er a
Cre
ativ
e C
omm
ons
Attr
ibut
ion-
Non
Com
mer
cial
3.0
Unp
orte
d L
icen
ce.
View Article Online
nG(g) + mH2O(1) ¼ nG$mH2O(s) + reaction heat (2)
where G refers to gas, n is the number of gas molecules, andm isthe number of water molecules. The ratio of m to n refers tohydration number (for methane hydrates, it equals to 5.75).
The volume of water participating in hydrate formation (VW)and the volume of hydrates (VS) can be calculated by eqn (3) and(4), respectively:
VW ¼ DnW � ML/rW (3)
VS ¼ 1.25VW (4)
where DnW is the molar amount of water participating in thereaction, DnW ¼ Dn � 5.75, ML is the molar mass of water, andthe hydrate volume expansion coefficient is 1.25.22,36
The hydrate volume fraction is an important indicator forthe evaluation of promoters, which is obtained by the followingequation in this paper:
Fig. 5 Pressure, temperature and gas consumption versus time during egas consumption is regarded as the end point of induction period.
This journal is © The Royal Society of Chemistry 2019
r ¼ VS
VS þ VL
¼ 1:25VW
1:25VW þ ð30� VWÞ � 100% (5)
where VL represent the volume of remaining water.
3 Results and discussion3.1 Hydrate formation in gas-pure water systems
The formation process of gas hydrate is a non-equilibriumkinetic process, which can be divided into three stages,namely, dissolution, induction and growth stage.
The rst stage is the dissolution period of methane, wheremethane accumulates at the gas–liquid interface and enters theliquid phase, increasing the gas concentration in the liquidphase, providing suitable conditions for the formation ofhydrates.37
The second stage is the induction period (0–30 h), which isthe preparation for the nucleation of hydrates to reach critical
xperimental process. The sudden change of pressure, temperature or
RSC Adv., 2019, 9, 33506–33518 | 33509
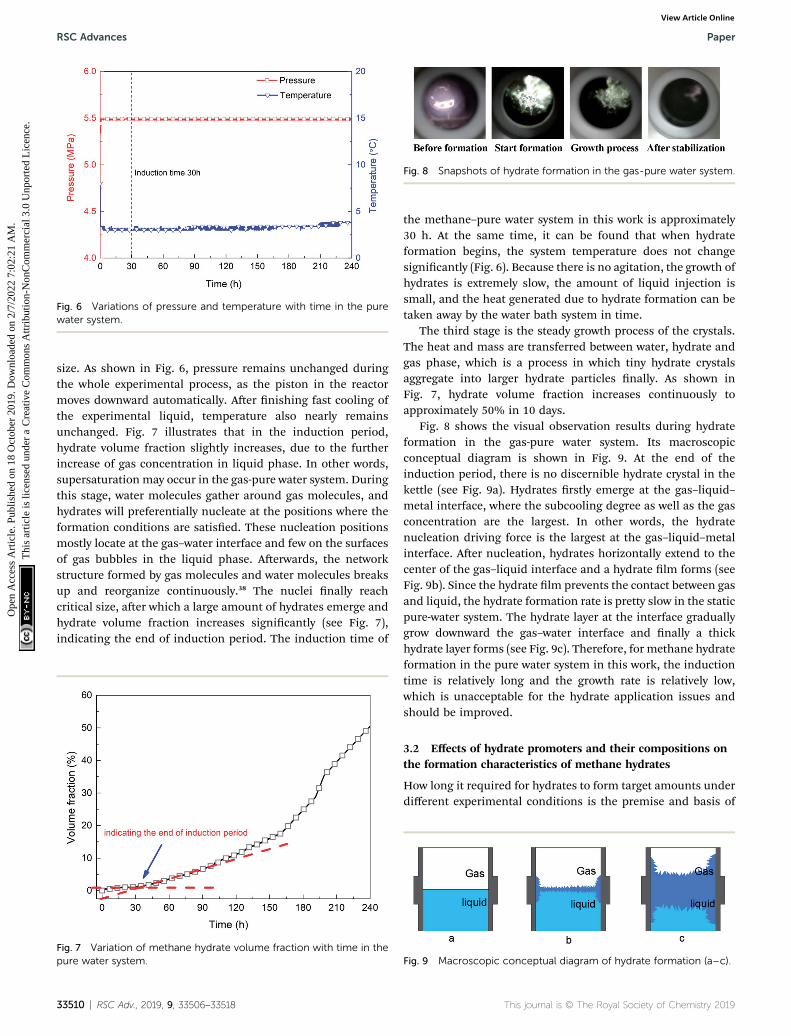
Fig. 8 Snapshots of hydrate formation in the gas-pure water system.
Fig. 6 Variations of pressure and temperature with time in the purewater system.
RSC Advances Paper
Ope
n A
cces
s A
rtic
le. P
ublis
hed
on 1
8 O
ctob
er 2
019.
Dow
nloa
ded
on 2
/7/2
022
7:02
:21
AM
. T
his
artic
le is
lice
nsed
und
er a
Cre
ativ
e C
omm
ons
Attr
ibut
ion-
Non
Com
mer
cial
3.0
Unp
orte
d L
icen
ce.
View Article Online
size. As shown in Fig. 6, pressure remains unchanged duringthe whole experimental process, as the piston in the reactormoves downward automatically. Aer nishing fast cooling ofthe experimental liquid, temperature also nearly remainsunchanged. Fig. 7 illustrates that in the induction period,hydrate volume fraction slightly increases, due to the furtherincrease of gas concentration in liquid phase. In other words,supersaturation may occur in the gas-pure water system. Duringthis stage, water molecules gather around gas molecules, andhydrates will preferentially nucleate at the positions where theformation conditions are satised. These nucleation positionsmostly locate at the gas–water interface and few on the surfacesof gas bubbles in the liquid phase. Aerwards, the networkstructure formed by gas molecules and water molecules breaksup and reorganize continuously.38 The nuclei nally reachcritical size, aer which a large amount of hydrates emerge andhydrate volume fraction increases signicantly (see Fig. 7),indicating the end of induction period. The induction time of
Fig. 7 Variation of methane hydrate volume fraction with time in thepure water system.
33510 | RSC Adv., 2019, 9, 33506–33518
the methane–pure water system in this work is approximately30 h. At the same time, it can be found that when hydrateformation begins, the system temperature does not changesignicantly (Fig. 6). Because there is no agitation, the growth ofhydrates is extremely slow, the amount of liquid injection issmall, and the heat generated due to hydrate formation can betaken away by the water bath system in time.
The third stage is the steady growth process of the crystals.The heat and mass are transferred between water, hydrate andgas phase, which is a process in which tiny hydrate crystalsaggregate into larger hydrate particles nally. As shown inFig. 7, hydrate volume fraction increases continuously toapproximately 50% in 10 days.
Fig. 8 shows the visual observation results during hydrateformation in the gas-pure water system. Its macroscopicconceptual diagram is shown in Fig. 9. At the end of theinduction period, there is no discernible hydrate crystal in thekettle (see Fig. 9a). Hydrates rstly emerge at the gas–liquid–metal interface, where the subcooling degree as well as the gasconcentration are the largest. In other words, the hydratenucleation driving force is the largest at the gas–liquid–metalinterface. Aer nucleation, hydrates horizontally extend to thecenter of the gas–liquid interface and a hydrate lm forms (seeFig. 9b). Since the hydrate lm prevents the contact between gasand liquid, the hydrate formation rate is pretty slow in the staticpure-water system. The hydrate layer at the interface graduallygrow downward the gas–water interface and nally a thickhydrate layer forms (see Fig. 9c). Therefore, for methane hydrateformation in the pure water system in this work, the inductiontime is relatively long and the growth rate is relatively low,which is unacceptable for the hydrate application issues andshould be improved.
3.2 Effects of hydrate promoters and their compositions onthe formation characteristics of methane hydrates
How long it required for hydrates to form target amounts underdifferent experimental conditions is the premise and basis of
Fig. 9 Macroscopic conceptual diagram of hydrate formation (a–c).
This journal is © The Royal Society of Chemistry 2019
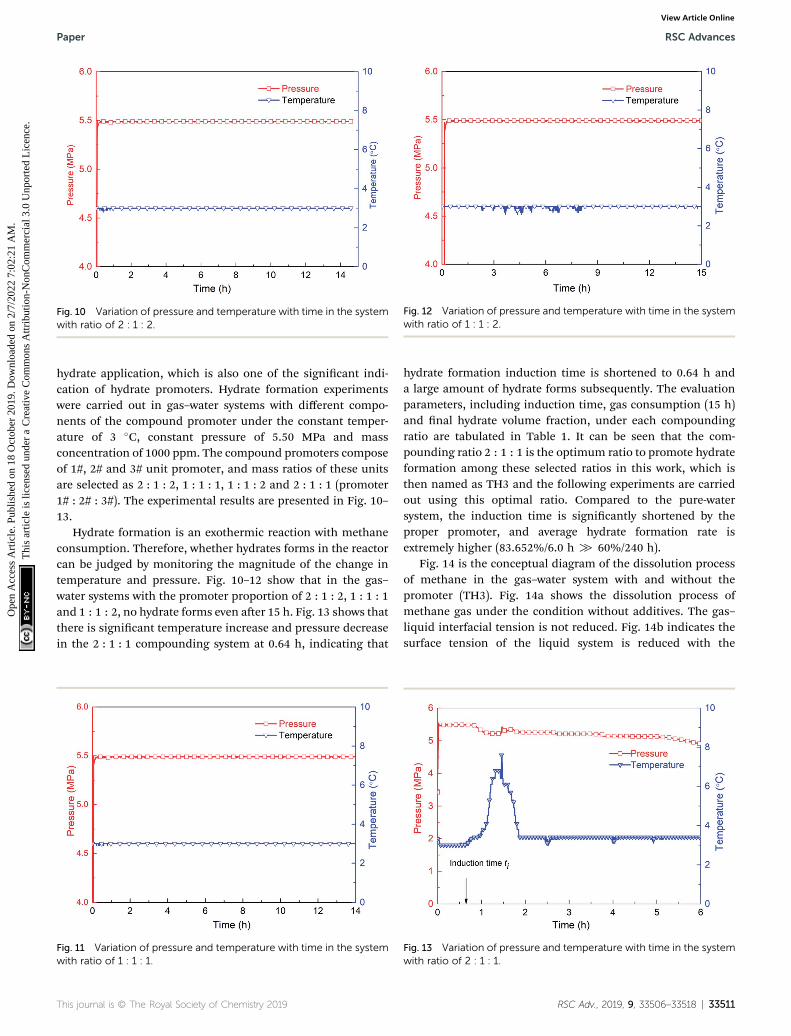
Fig. 12 Variation of pressure and temperature with time in the systemwith ratio of 1 : 1 : 2.
Fig. 10 Variation of pressure and temperature with time in the systemwith ratio of 2 : 1 : 2.
Paper RSC Advances
Ope
n A
cces
s A
rtic
le. P
ublis
hed
on 1
8 O
ctob
er 2
019.
Dow
nloa
ded
on 2
/7/2
022
7:02
:21
AM
. T
his
artic
le is
lice
nsed
und
er a
Cre
ativ
e C
omm
ons
Attr
ibut
ion-
Non
Com
mer
cial
3.0
Unp
orte
d L
icen
ce.
View Article Online
hydrate application, which is also one of the signicant indi-cation of hydrate promoters. Hydrate formation experimentswere carried out in gas–water systems with different compo-nents of the compound promoter under the constant temper-ature of 3 �C, constant pressure of 5.50 MPa and massconcentration of 1000 ppm. The compound promoters composeof 1#, 2# and 3# unit promoter, and mass ratios of these unitsare selected as 2 : 1 : 2, 1 : 1 : 1, 1 : 1 : 2 and 2 : 1 : 1 (promoter1# : 2# : 3#). The experimental results are presented in Fig. 10–13.
Hydrate formation is an exothermic reaction with methaneconsumption. Therefore, whether hydrates forms in the reactorcan be judged by monitoring the magnitude of the change intemperature and pressure. Fig. 10–12 show that in the gas–water systems with the promoter proportion of 2 : 1 : 2, 1 : 1 : 1and 1 : 1 : 2, no hydrate forms even aer 15 h. Fig. 13 shows thatthere is signicant temperature increase and pressure decreasein the 2 : 1 : 1 compounding system at 0.64 h, indicating that
Fig. 11 Variation of pressure and temperature with time in the systemwith ratio of 1 : 1 : 1.
This journal is © The Royal Society of Chemistry 2019
hydrate formation induction time is shortened to 0.64 h anda large amount of hydrate forms subsequently. The evaluationparameters, including induction time, gas consumption (15 h)and nal hydrate volume fraction, under each compoundingratio are tabulated in Table 1. It can be seen that the com-pounding ratio 2 : 1 : 1 is the optimum ratio to promote hydrateformation among these selected ratios in this work, which isthen named as TH3 and the following experiments are carriedout using this optimal ratio. Compared to the pure-watersystem, the induction time is signicantly shortened by theproper promoter, and average hydrate formation rate isextremely higher (83.652%/6.0 h [ 60%/240 h).
Fig. 14 is the conceptual diagram of the dissolution processof methane in the gas–water system with and without thepromoter (TH3). Fig. 14a shows the dissolution process ofmethane gas under the condition without additives. The gas–liquid interfacial tension is not reduced. Fig. 14b indicates thesurface tension of the liquid system is reduced with the
Fig. 13 Variation of pressure and temperature with time in the systemwith ratio of 2 : 1 : 1.
RSC Adv., 2019, 9, 33506–33518 | 33511
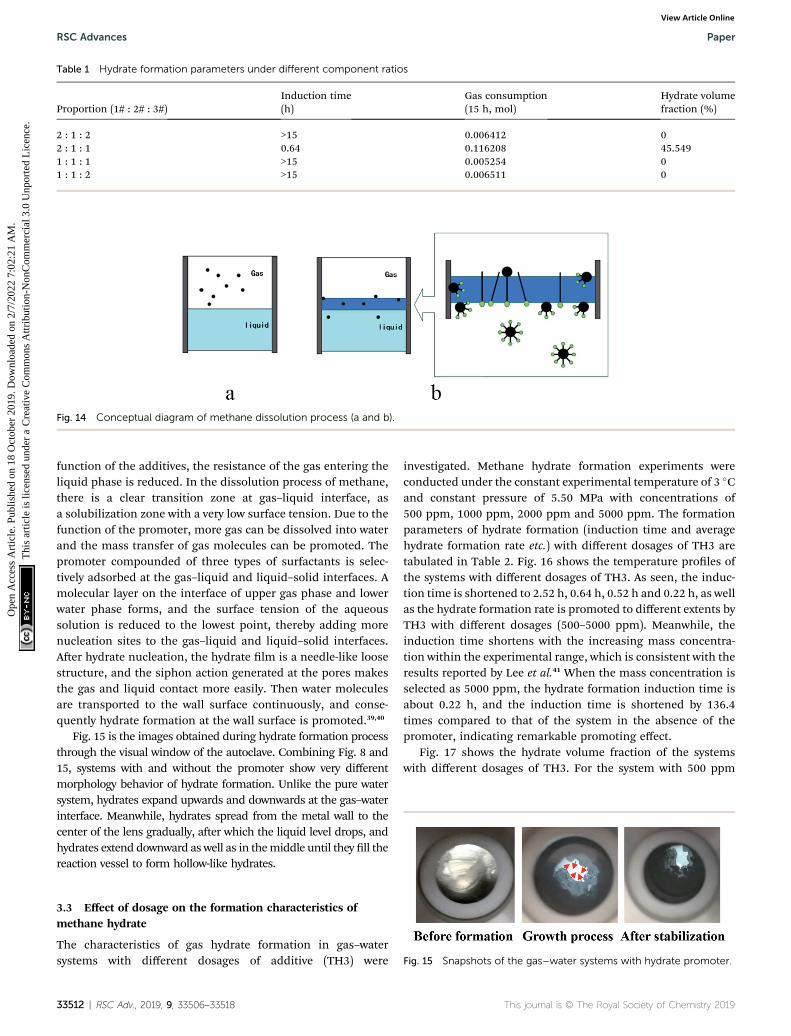
Fig. 14 Conceptual diagram of methane dissolution process (a and b).
Table 1 Hydrate formation parameters under different component ratios
Proportion (1# : 2# : 3#)Induction time(h)
Gas consumption(15 h, mol)
Hydrate volumefraction (%)
2 : 1 : 2 >15 0.006412 02 : 1 : 1 0.64 0.116208 45.5491 : 1 : 1 >15 0.005254 01 : 1 : 2 >15 0.006511 0
RSC Advances Paper
Ope
n A
cces
s A
rtic
le. P
ublis
hed
on 1
8 O
ctob
er 2
019.
Dow
nloa
ded
on 2
/7/2
022
7:02
:21
AM
. T
his
artic
le is
lice
nsed
und
er a
Cre
ativ
e C
omm
ons
Attr
ibut
ion-
Non
Com
mer
cial
3.0
Unp
orte
d L
icen
ce.
View Article Online
function of the additives, the resistance of the gas entering theliquid phase is reduced. In the dissolution process of methane,there is a clear transition zone at gas–liquid interface, asa solubilization zone with a very low surface tension. Due to thefunction of the promoter, more gas can be dissolved into waterand the mass transfer of gas molecules can be promoted. Thepromoter compounded of three types of surfactants is selec-tively adsorbed at the gas–liquid and liquid–solid interfaces. Amolecular layer on the interface of upper gas phase and lowerwater phase forms, and the surface tension of the aqueoussolution is reduced to the lowest point, thereby adding morenucleation sites to the gas–liquid and liquid–solid interfaces.Aer hydrate nucleation, the hydrate lm is a needle-like loosestructure, and the siphon action generated at the pores makesthe gas and liquid contact more easily. Then water moleculesare transported to the wall surface continuously, and conse-quently hydrate formation at the wall surface is promoted.39,40
Fig. 15 is the images obtained during hydrate formation processthrough the visual window of the autoclave. Combining Fig. 8 and15, systems with and without the promoter show very differentmorphology behavior of hydrate formation. Unlike the pure watersystem, hydrates expand upwards and downwards at the gas–waterinterface. Meanwhile, hydrates spread from the metal wall to thecenter of the lens gradually, aer which the liquid level drops, andhydrates extend downward as well as in themiddle until they ll thereaction vessel to form hollow-like hydrates.
Fig. 15 Snapshots of the gas–water systems with hydrate promoter.
3.3 Effect of dosage on the formation characteristics ofmethane hydrate
The characteristics of gas hydrate formation in gas–watersystems with different dosages of additive (TH3) were
33512 | RSC Adv., 2019, 9, 33506–33518
investigated. Methane hydrate formation experiments wereconducted under the constant experimental temperature of 3 �Cand constant pressure of 5.50 MPa with concentrations of500 ppm, 1000 ppm, 2000 ppm and 5000 ppm. The formationparameters of hydrate formation (induction time and averagehydrate formation rate etc.) with different dosages of TH3 aretabulated in Table 2. Fig. 16 shows the temperature proles ofthe systems with different dosages of TH3. As seen, the induc-tion time is shortened to 2.52 h, 0.64 h, 0.52 h and 0.22 h, as wellas the hydrate formation rate is promoted to different extents byTH3 with different dosages (500–5000 ppm). Meanwhile, theinduction time shortens with the increasing mass concentra-tion within the experimental range, which is consistent with theresults reported by Lee et al.41 When the mass concentration isselected as 5000 ppm, the hydrate formation induction time isabout 0.22 h, and the induction time is shortened by 136.4times compared to that of the system in the absence of thepromoter, indicating remarkable promoting effect.
Fig. 17 shows the hydrate volume fraction of the systemswith different dosages of TH3. For the system with 500 ppm
This journal is © The Royal Society of Chemistry 2019
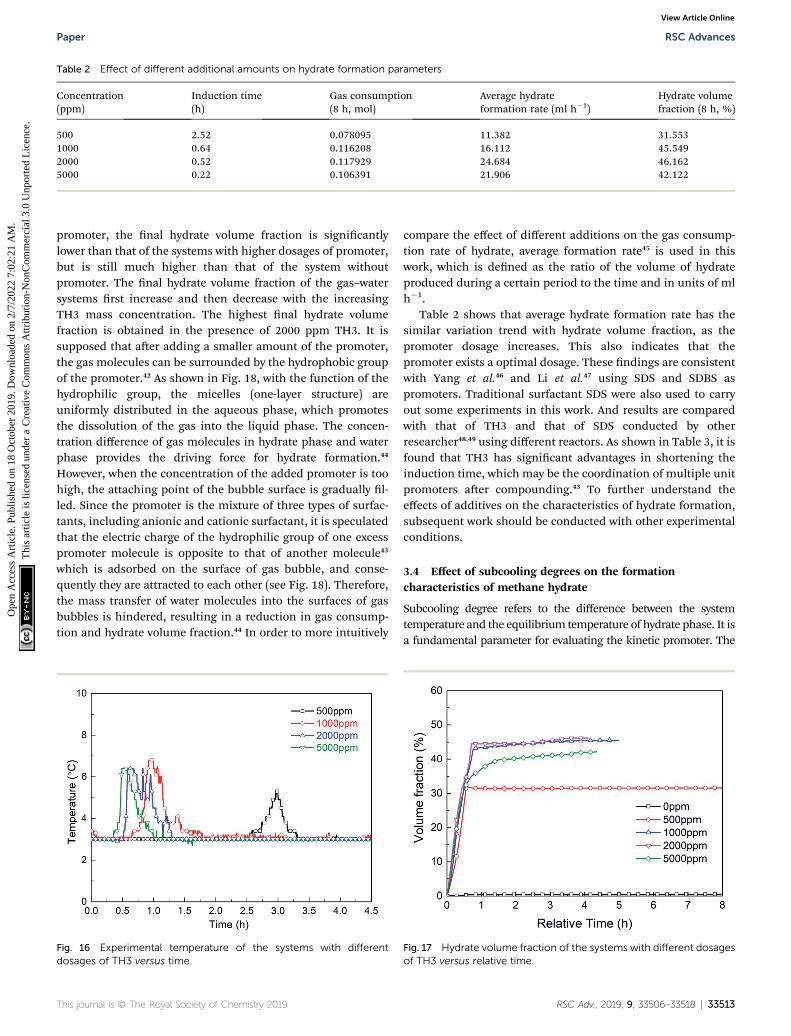
Table 2 Effect of different additional amounts on hydrate formation parameters
Concentration(ppm)
Induction time(h)
Gas consumption(8 h, mol)
Average hydrateformation rate (ml h�1)
Hydrate volumefraction (8 h, %)
500 2.52 0.078095 11.382 31.5531000 0.64 0.116208 16.112 45.5492000 0.52 0.117929 24.684 46.1625000 0.22 0.106391 21.906 42.122
Paper RSC Advances
Ope
n A
cces
s A
rtic
le. P
ublis
hed
on 1
8 O
ctob
er 2
019.
Dow
nloa
ded
on 2
/7/2
022
7:02
:21
AM
. T
his
artic
le is
lice
nsed
und
er a
Cre
ativ
e C
omm
ons
Attr
ibut
ion-
Non
Com
mer
cial
3.0
Unp
orte
d L
icen
ce.
View Article Online
promoter, the nal hydrate volume fraction is signicantlylower than that of the systems with higher dosages of promoter,but is still much higher than that of the system withoutpromoter. The nal hydrate volume fraction of the gas–watersystems rst increase and then decrease with the increasingTH3 mass concentration. The highest nal hydrate volumefraction is obtained in the presence of 2000 ppm TH3. It issupposed that aer adding a smaller amount of the promoter,the gas molecules can be surrounded by the hydrophobic groupof the promoter.42 As shown in Fig. 18, with the function of thehydrophilic group, the micelles (one-layer structure) areuniformly distributed in the aqueous phase, which promotesthe dissolution of the gas into the liquid phase. The concen-tration difference of gas molecules in hydrate phase and waterphase provides the driving force for hydrate formation.44
However, when the concentration of the added promoter is toohigh, the attaching point of the bubble surface is gradually l-led. Since the promoter is the mixture of three types of surfac-tants, including anionic and cationic surfactant, it is speculatedthat the electric charge of the hydrophilic group of one excesspromoter molecule is opposite to that of another molecule43
which is adsorbed on the surface of gas bubble, and conse-quently they are attracted to each other (see Fig. 18). Therefore,the mass transfer of water molecules into the surfaces of gasbubbles is hindered, resulting in a reduction in gas consump-tion and hydrate volume fraction.44 In order to more intuitively
Fig. 16 Experimental temperature of the systems with differentdosages of TH3 versus time.
This journal is © The Royal Society of Chemistry 2019
compare the effect of different additions on the gas consump-tion rate of hydrate, average formation rate45 is used in thiswork, which is dened as the ratio of the volume of hydrateproduced during a certain period to the time and in units of mlh�1.
Table 2 shows that average hydrate formation rate has thesimilar variation trend with hydrate volume fraction, as thepromoter dosage increases. This also indicates that thepromoter exists a optimal dosage. These ndings are consistentwith Yang et al.46 and Li et al.47 using SDS and SDBS aspromoters. Traditional surfactant SDS were also used to carryout some experiments in this work. And results are comparedwith that of TH3 and that of SDS conducted by otherresearcher48,49 using different reactors. As shown in Table 3, it isfound that TH3 has signicant advantages in shortening theinduction time, which may be the coordination of multiple unitpromoters aer compounding.43 To further understand theeffects of additives on the characteristics of hydrate formation,subsequent work should be conducted with other experimentalconditions.
3.4 Effect of subcooling degrees on the formationcharacteristics of methane hydrate
Subcooling degree refers to the difference between the systemtemperature and the equilibrium temperature of hydrate phase. It isa fundamental parameter for evaluating the kinetic promoter. The
Fig. 17 Hydrate volume fraction of the systems with different dosagesof TH3 versus relative time.
RSC Adv., 2019, 9, 33506–33518 | 33513
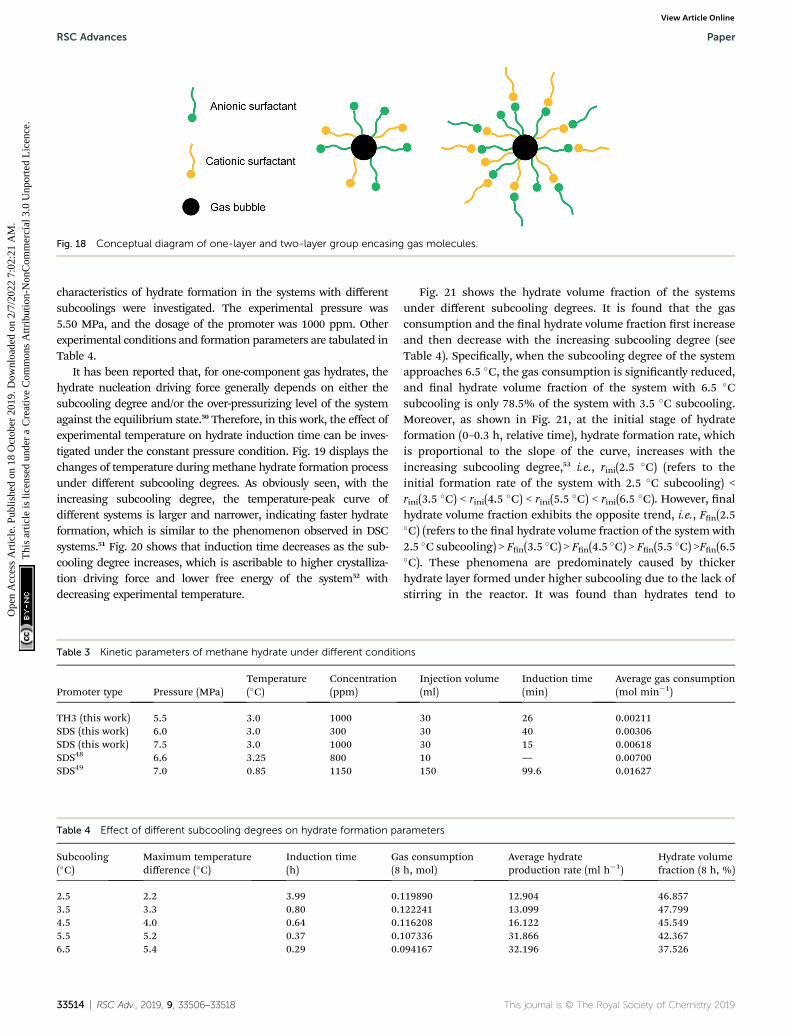
Fig. 18 Conceptual diagram of one-layer and two-layer group encasing gas molecules.
RSC Advances Paper
Ope
n A
cces
s A
rtic
le. P
ublis
hed
on 1
8 O
ctob
er 2
019.
Dow
nloa
ded
on 2
/7/2
022
7:02
:21
AM
. T
his
artic
le is
lice
nsed
und
er a
Cre
ativ
e C
omm
ons
Attr
ibut
ion-
Non
Com
mer
cial
3.0
Unp
orte
d L
icen
ce.
View Article Online
characteristics of hydrate formation in the systems with differentsubcoolings were investigated. The experimental pressure was5.50 MPa, and the dosage of the promoter was 1000 ppm. Otherexperimental conditions and formation parameters are tabulated inTable 4.
It has been reported that, for one-component gas hydrates, thehydrate nucleation driving force generally depends on either thesubcooling degree and/or the over-pressurizing level of the systemagainst the equilibrium state.50 Therefore, in this work, the effect ofexperimental temperature on hydrate induction time can be inves-tigated under the constant pressure condition. Fig. 19 displays thechanges of temperature during methane hydrate formation processunder different subcooling degrees. As obviously seen, with theincreasing subcooling degree, the temperature-peak curve ofdifferent systems is larger and narrower, indicating faster hydrateformation, which is similar to the phenomenon observed in DSCsystems.51 Fig. 20 shows that induction time decreases as the sub-cooling degree increases, which is ascribable to higher crystalliza-tion driving force and lower free energy of the system52 withdecreasing experimental temperature.
Table 4 Effect of different subcooling degrees on hydrate formation pa
Subcooling(�C)
Maximum temperaturedifference (�C)
Induction time(h)
Ga(8
2.5 2.2 3.99 0.3.5 3.3 0.80 0.4.5 4.0 0.64 0.5.5 5.2 0.37 0.6.5 5.4 0.29 0.
Table 3 Kinetic parameters of methane hydrate under different conditio
Promoter type Pressure (MPa)Temperature(�C)
Concentration(ppm)
TH3 (this work) 5.5 3.0 1000SDS (this work) 6.0 3.0 300SDS (this work) 7.5 3.0 1000SDS48 6.6 3.25 800SDS49 7.0 0.85 1150
33514 | RSC Adv., 2019, 9, 33506–33518
Fig. 21 shows the hydrate volume fraction of the systemsunder different subcooling degrees. It is found that the gasconsumption and the nal hydrate volume fraction rst increaseand then decrease with the increasing subcooling degree (seeTable 4). Specically, when the subcooling degree of the systemapproaches 6.5 �C, the gas consumption is signicantly reduced,and nal hydrate volume fraction of the system with 6.5 �Csubcooling is only 78.5% of the system with 3.5 �C subcooling.Moreover, as shown in Fig. 21, at the initial stage of hydrateformation (0–0.3 h, relative time), hydrate formation rate, whichis proportional to the slope of the curve, increases with theincreasing subcooling degree,53 i.e., rini(2.5 �C) (refers to theinitial formation rate of the system with 2.5 �C subcooling) <rini(3.5 �C) < rini(4.5 �C) < rini(5.5 �C) < rini(6.5 �C). However, nalhydrate volume fraction exhibits the opposite trend, i.e., Fn(2.5�C) (refers to the nal hydrate volume fraction of the system with2.5 �C subcooling) > Fn(3.5 �C) > Fn(4.5 �C) > Fn(5.5 �C) >Fn(6.5�C). These phenomena are predominately caused by thickerhydrate layer formed under higher subcooling due to the lack ofstirring in the reactor. It was found than hydrates tend to
rameters
s consumptionh, mol)
Average hydrateproduction rate (ml h�1)
Hydrate volumefraction (8 h, %)
119890 12.904 46.857122241 13.099 47.799116208 16.122 45.549107336 31.866 42.367094167 32.196 37.526
ns
Injection volume(ml)
Induction time(min)
Average gas consumption(mol min�1)
30 26 0.0021130 40 0.0030630 15 0.0061810 — 0.00700150 99.6 0.01627
This journal is © The Royal Society of Chemistry 2019
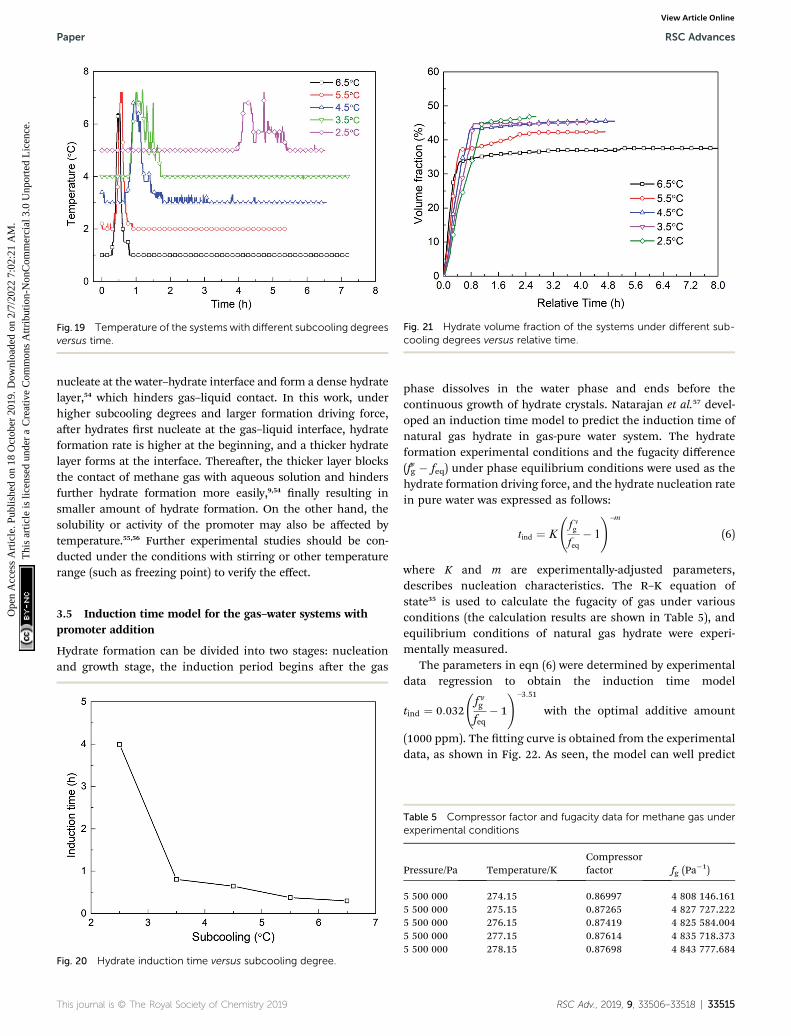
Fig. 21 Hydrate volume fraction of the systems under different sub-cooling degrees versus relative time.
Fig. 19 Temperature of the systems with different subcooling degreesversus time.
Paper RSC Advances
Ope
n A
cces
s A
rtic
le. P
ublis
hed
on 1
8 O
ctob
er 2
019.
Dow
nloa
ded
on 2
/7/2
022
7:02
:21
AM
. T
his
artic
le is
lice
nsed
und
er a
Cre
ativ
e C
omm
ons
Attr
ibut
ion-
Non
Com
mer
cial
3.0
Unp
orte
d L
icen
ce.
View Article Online
nucleate at the water–hydrate interface and form a dense hydratelayer,54 which hinders gas–liquid contact. In this work, underhigher subcooling degrees and larger formation driving force,aer hydrates rst nucleate at the gas–liquid interface, hydrateformation rate is higher at the beginning, and a thicker hydratelayer forms at the interface. Thereaer, the thicker layer blocksthe contact of methane gas with aqueous solution and hindersfurther hydrate formation more easily,9,54 nally resulting insmaller amount of hydrate formation. On the other hand, thesolubility or activity of the promoter may also be affected bytemperature.55,56 Further experimental studies should be con-ducted under the conditions with stirring or other temperaturerange (such as freezing point) to verify the effect.
3.5 Induction time model for the gas–water systems withpromoter addition
Hydrate formation can be divided into two stages: nucleationand growth stage, the induction period begins aer the gas
Fig. 20 Hydrate induction time versus subcooling degree.
This journal is © The Royal Society of Chemistry 2019
phase dissolves in the water phase and ends before thecontinuous growth of hydrate crystals. Natarajan et al.57 devel-oped an induction time model to predict the induction time ofnatural gas hydrate in gas-pure water system. The hydrateformation experimental conditions and the fugacity difference(fvg � feq) under phase equilibrium conditions were used as thehydrate formation driving force, and the hydrate nucleation ratein pure water was expressed as follows:
tind ¼ K
f vg
feq� 1
!�m
(6)
where K and m are experimentally-adjusted parameters,describes nucleation characteristics. The R–K equation ofstate35 is used to calculate the fugacity of gas under variousconditions (the calculation results are shown in Table 5), andequilibrium conditions of natural gas hydrate were experi-mentally measured.
The parameters in eqn (6) were determined by experimentaldata regression to obtain the induction time model
tind ¼ 0:032
f vgfeq
� 1
!�3:51with the optimal additive amount
(1000 ppm). The tting curve is obtained from the experimentaldata, as shown in Fig. 22. As seen, the model can well predict
Table 5 Compressor factor and fugacity data for methane gas underexperimental conditions
Pressure/Pa Temperature/KCompressorfactor fg (Pa
�1)
5 500 000 274.15 0.86997 4 808 146.1615 500 000 275.15 0.87265 4 827 727.2225 500 000 276.15 0.87419 4 825 584.0045 500 000 277.15 0.87614 4 835 718.3735 500 000 278.15 0.87698 4 843 777.684
RSC Adv., 2019, 9, 33506–33518 | 33515
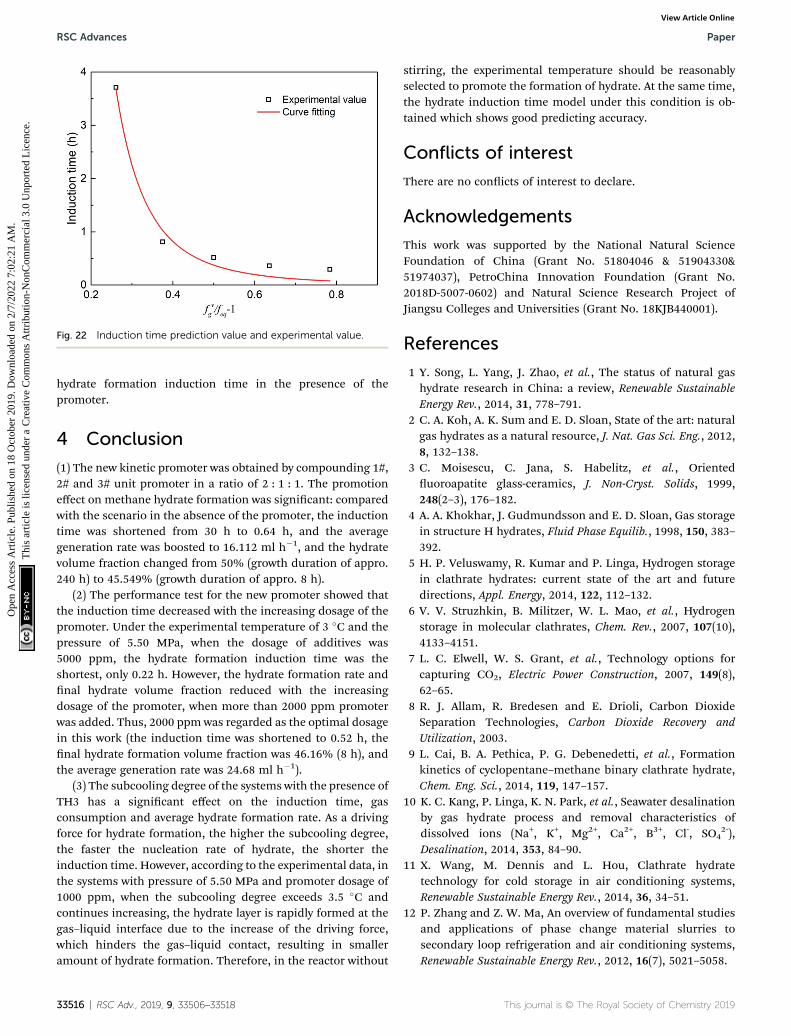
Fig. 22 Induction time prediction value and experimental value.
RSC Advances Paper
Ope
n A
cces
s A
rtic
le. P
ublis
hed
on 1
8 O
ctob
er 2
019.
Dow
nloa
ded
on 2
/7/2
022
7:02
:21
AM
. T
his
artic
le is
lice
nsed
und
er a
Cre
ativ
e C
omm
ons
Attr
ibut
ion-
Non
Com
mer
cial
3.0
Unp
orte
d L
icen
ce.
View Article Online
hydrate formation induction time in the presence of thepromoter.
4 Conclusion
(1) The new kinetic promoter was obtained by compounding 1#,2# and 3# unit promoter in a ratio of 2 : 1 : 1. The promotioneffect on methane hydrate formation was signicant: comparedwith the scenario in the absence of the promoter, the inductiontime was shortened from 30 h to 0.64 h, and the averagegeneration rate was boosted to 16.112 ml h�1, and the hydratevolume fraction changed from 50% (growth duration of appro.240 h) to 45.549% (growth duration of appro. 8 h).
(2) The performance test for the new promoter showed thatthe induction time decreased with the increasing dosage of thepromoter. Under the experimental temperature of 3 �C and thepressure of 5.50 MPa, when the dosage of additives was5000 ppm, the hydrate formation induction time was theshortest, only 0.22 h. However, the hydrate formation rate andnal hydrate volume fraction reduced with the increasingdosage of the promoter, when more than 2000 ppm promoterwas added. Thus, 2000 ppm was regarded as the optimal dosagein this work (the induction time was shortened to 0.52 h, thenal hydrate formation volume fraction was 46.16% (8 h), andthe average generation rate was 24.68 ml h�1).
(3) The subcooling degree of the systems with the presence ofTH3 has a signicant effect on the induction time, gasconsumption and average hydrate formation rate. As a drivingforce for hydrate formation, the higher the subcooling degree,the faster the nucleation rate of hydrate, the shorter theinduction time. However, according to the experimental data, inthe systems with pressure of 5.50 MPa and promoter dosage of1000 ppm, when the subcooling degree exceeds 3.5 �C andcontinues increasing, the hydrate layer is rapidly formed at thegas–liquid interface due to the increase of the driving force,which hinders the gas–liquid contact, resulting in smalleramount of hydrate formation. Therefore, in the reactor without
33516 | RSC Adv., 2019, 9, 33506–33518
stirring, the experimental temperature should be reasonablyselected to promote the formation of hydrate. At the same time,the hydrate induction time model under this condition is ob-tained which shows good predicting accuracy.
Conflicts of interest
There are no conicts of interest to declare.
Acknowledgements
This work was supported by the National Natural ScienceFoundation of China (Grant No. 51804046 & 51904330&51974037), PetroChina Innovation Foundation (Grant No.2018D-5007-0602) and Natural Science Research Project ofJiangsu Colleges and Universities (Grant No. 18KJB440001).
References
1 Y. Song, L. Yang, J. Zhao, et al., The status of natural gashydrate research in China: a review, Renewable SustainableEnergy Rev., 2014, 31, 778–791.
2 C. A. Koh, A. K. Sum and E. D. Sloan, State of the art: naturalgas hydrates as a natural resource, J. Nat. Gas Sci. Eng., 2012,8, 132–138.
3 C. Moisescu, C. Jana, S. Habelitz, et al., Orienteduoroapatite glass-ceramics, J. Non-Cryst. Solids, 1999,248(2–3), 176–182.
4 A. A. Khokhar, J. Gudmundsson and E. D. Sloan, Gas storagein structure H hydrates, Fluid Phase Equilib., 1998, 150, 383–392.
5 H. P. Veluswamy, R. Kumar and P. Linga, Hydrogen storagein clathrate hydrates: current state of the art and futuredirections, Appl. Energy, 2014, 122, 112–132.
6 V. V. Struzhkin, B. Militzer, W. L. Mao, et al., Hydrogenstorage in molecular clathrates, Chem. Rev., 2007, 107(10),4133–4151.
7 L. C. Elwell, W. S. Grant, et al., Technology options forcapturing CO2, Electric Power Construction, 2007, 149(8),62–65.
8 R. J. Allam, R. Bredesen and E. Drioli, Carbon DioxideSeparation Technologies, Carbon Dioxide Recovery andUtilization, 2003.
9 L. Cai, B. A. Pethica, P. G. Debenedetti, et al., Formationkinetics of cyclopentane–methane binary clathrate hydrate,Chem. Eng. Sci., 2014, 119, 147–157.
10 K. C. Kang, P. Linga, K. N. Park, et al., Seawater desalinationby gas hydrate process and removal characteristics ofdissolved ions (Na+, K+, Mg2+, Ca2+, B3+, Cl-, SO4
2-),Desalination, 2014, 353, 84–90.
11 X. Wang, M. Dennis and L. Hou, Clathrate hydratetechnology for cold storage in air conditioning systems,Renewable Sustainable Energy Rev., 2014, 36, 34–51.
12 P. Zhang and Z. W. Ma, An overview of fundamental studiesand applications of phase change material slurries tosecondary loop refrigeration and air conditioning systems,Renewable Sustainable Energy Rev., 2012, 16(7), 5021–5058.
This journal is © The Royal Society of Chemistry 2019
Paper RSC Advances
Ope
n A
cces
s A
rtic
le. P
ublis
hed
on 1
8 O
ctob
er 2
019.
Dow
nloa
ded
on 2
/7/2
022
7:02
:21
AM
. T
his
artic
le is
lice
nsed
und
er a
Cre
ativ
e C
omm
ons
Attr
ibut
ion-
Non
Com
mer
cial
3.0
Unp
orte
d L
icen
ce.
View Article Online
13 A. A. Khokhar, J. S. Gudmundsson and E. D. Sloan, Gasstorage in structure H hydrates, Fluid Phase Equilib., 1998,150, 383–392.
14 U. K. And and M. Parlaktuna, Surfactants as HydratePromoters, Energy Fuels, 2000, 14(5), 1103–1107.
15 Y. Zhong and R. E. Rogers, Surfactant effects on gas hydrateformation, Chem. Eng. Sci., 2000, 55(19), 4175–4187.
16 J. Verrett, D. Posteraro and P. Servio, Surfactant effects onmethane solubility and mole fraction during hydrategrowth, Chem. Eng. Sci., 2012, 84, 80–84.
17 I. Watanabek and Y. H. Mori, Surfactant effects on hydrateformation in an unstirred gas/liquid system: anexperimental study using HFC-32 and sodium dodecylsulfate, Chem. Eng. Sci., 2015, 60(5), 4846–4857.
18 H. Kakati, A. Mandal and S. Laik, Promoting effect of Al2O3/ZnO-based nanouids stabilized by SDS surfactant on CH4 +C2H6 + C3H8 hydrate formation, J. Ind. Eng. Chem., 2016, (35),357–368.
19 Z. Sun, R. Wang and R. Ma, Natural gas storage in hydrateswith the presence of promoters, Energy Convers. Manage.,2003, 44(17), 2733–2742.
20 V. K. Saw, M. Gudala, G. Udayabhanu, et al., Kinetics ofmethane hydrate formation and its dissociation inpresence of non-ionic surfactant Tergitol, Journal ofUnconventional Oil and Gas Resources, 2014, 6, 54–59.
21 H. Kakati, A. Mandai and S. Laik, Phase Stability andKinetics of CH4 + CO2 + N2 Hydrates in Synthetic Seawaterand Aqueous Electrolyte Solutions of NaCI and CaCl2, J.Chem. Eng. Data, 2015, 60(6), 1835–1843.
22 H. P. Veluswamy, S. Kumar, R. Kumar, P. Rangsunvigit andP. Linga, Enhanced clathrate hydrate formation kinetics atnear ambient temperatures and moderate pressures:application to natural gas storage, Fuel, 2016, 182, 907–919.
23 J. S. Zhang, S. Y. Lee, J. W. Lee, et al., Kinetics of methanehydrate formation from SDS solution, Ind. Eng. Chem. Res.,2007, 46(19), 6353–6359.
24 A. Kumar and A. Kumar, Role of metallic packing and kineticpromoter in designing a hydrate-based gas separationprocess, Energy Fuels, 2015, 29(7), 4463–4472.
25 K. Okutani, Y. Kuwabara and Y. H. Mori, Surfactant effectson hydrate formation in an unstirred gas/liquid system: anexperimental study using methane and sodium alkylsulfates, Chem. Eng. Sci., 2008, 63(1), 183–194.
26 L. Jiang, A. Li, J. Xu, et al., Effects of SDS and SDBS on CO2
hydrate formation, induction time, storage capacity andstability at 274.15 K and 5.0 MPa, ChemistrySelect, 2016,1(19), 6111–6114.
27 J.-P. Torre, M. Ricaurte, C. Dicharry and D. Broseta, CO2
enclathration in the presence of water-soluble hydratepromoters: hydrate phase equilibria and kinetic studies inquiescent conditions, Chem. Eng. Sci., 2012, 82, 1–13.
28 C. F. d. S. Lirio, F. L. P. Pessoa and A. M. C. Uller, Storagecapacity of carbon dioxide hydrates in the presence ofsodium dodecyl sulfate (SDS) and tetrahydrofuran (THF),Chem. Eng. Sci., 2013, 96, 118–123.
This journal is © The Royal Society of Chemistry 2019
29 A. Kumar, T. Sakpal, P. Linga and R. Kumar, Inuence ofcontact medium and surfactants on carbon dioxideclathrate hydrate kinetics, Fuel, 2013, 105, 664–671.
30 A. Mohammadi, M. Manteghian, A. Haghtalab, et al., Kineticstudy of carbon dioxide hydrate formation in presence ofsilver nanoparticles and SDS, Chem. Eng. J., 2014, 237(1),387–395.
31 A. Mohammadi, Semicompletion time of carbon dioxideuptake in the process of gas hydrate formation in presenceand absence of SDS and silver nanoparticles, Pet. Sci.Technol., 2017, 35(1), 37–44.
32 A. Fazlali, S. A. Kazemi, M. Keshavarz-Moraveji, et al., Impactof Different Surfactants and their Mixtures on Methane-Hydrate Formation, Energy Technol., 2013, 1(8), 471–477.
33 R. E. Rogers and Y. Zhong, Feasibility of storing natural gasin hydrates commercially, Ann. N. Y. Acad. Sci., 2000, 912(1),843–850.
34 Y. X. Pan, D. P. Liu, W. X. Huang, et al., Induction time of gashydrate formation and its inuencing factors, Nat. GasGeosci., 2005, 16(2), 255–260.
35 O. Redlich and J. N. S. Kwong, On the Thermodynamics ofSolutions. V. An Equation of State. Fugacities of GaseousSolutions, Chem. Rev., 1949, 44(1), 233.
36 J. Zhang and J. W. Lee, Enhanced Kinetics of CO2 HydrateFormation under Static Conditions, Ind. Eng. Chem. Res.,2009, 48(13), 5934–5942.
37 P. Skovborg, H. J. Ng, et al., Measurement of induction timesfor the formation of methane and ethane gas hydrates,Chem. Eng. Sci., 1993, 48(3), 445–453.
38 R. L. Christiansen and E. D. Sloan, Mechanisms and kineticsof hydrate formation, Ann. N. Y. Acad. Sci., 1994, 715(1), 283–305.
39 H. P. Veluswamy, J. Y. Chen and P. Linga, Surfactant effecton the kinetics of mixed hydrogen/propane hydrateformation for hydrogen storage as clathrates, Chem. Eng.Sci., 2015, 126(4), 488–499.
40 J. Yoslim, P. Linga and P. Englezos, Enhanced growth ofmethane-propane clathrate hydrate crystals with sodiumdodecyl sulfate, sodium tetradecyl sulfate, and sodiumhexadecyl sulfate surfactants, J. Cryst. Growth, 2010, 313(1),68–80.
41 K. Lee, S. H. Lee and W. Lee, Stochastic nature of carbondioxide hydrate induction times in Na montmorilloniteand marine sediment suspensions, Int. J. Greenhouse GasControl, 2013, 14(2), 15–24.
42 A. Mandal and S. Laik, Effect of the Promoter on Gas HydrateFormation and Dissociation, Energy Fuels, 2008, 22(4), 2527–2532.
43 A. N. Malik, Surfactant-Amino Acid and Surfactant-Surfactant Interactions in Aqueous Medium: A Review,Appl. Biochem. Biotechnol., 2015, 176(8), 2077–2106.
44 C. Y. Sun, G. J. Chen, C. F. Ma, et al., The growth kinetics ofhydrate lm on the surface of gas bubble suspended in wateror aqueous surfactant solution, J. Cryst. Growth, 2007, 306(2),491–499.
45 Y. Chen, B. Shi, Y. Liu, et al., Experimental and TheoreticalInvestigation of the Interaction between Hydrate
RSC Adv., 2019, 9, 33506–33518 | 33517
RSC Advances Paper
Ope
n A
cces
s A
rtic
le. P
ublis
hed
on 1
8 O
ctob
er 2
019.
Dow
nloa
ded
on 2
/7/2
022
7:02
:21
AM
. T
his
artic
le is
lice
nsed
und
er a
Cre
ativ
e C
omm
ons
Attr
ibut
ion-
Non
Com
mer
cial
3.0
Unp
orte
d L
icen
ce.
View Article Online
Formation and Wax Precipitation in Water-in-OilEmulsions, Energy Fuels, 2018, 32(9), 9081–9092.
46 M. Yang, Y. Song, W. Liu, et al., Effects of additive mixtures(THF/SDS) on carbon dioxide hydrate formation anddissociation in porous media, Chem. Eng. Sci., 2013, 90,69–76.
47 Y. X. Li, C. Zhu and W. C. Wang, Promoting Effects ofSurfactants on Carbon Dioxide Hydrate Formation and theKinetics, Petrochem. Technol., 2012, 41(6), 699–703.
48 W. Lin, G. J. Chen, C. Y. Sun, et al., Effect of surfactant on theformation and dissociation kinetic behavior of methanehydrate, Chem. Eng. Sci., 2004, 59(21), 4449–4455.
49 J. S. Zhang, S. Lee and J. W. Lee, Kinetics of Methane HydrateFormation from SDS Solution, Ind. Eng. Chem. Res., 2007,46(19), 6353–6359.
50 M. Arjmandi, B. Tohidi, A. Danesh, et al., Is subcooling theright driving force for testing low-dosage hydrateinhibitors, Chem. Eng. Sci., 2005, 60(5), 1313–1321.
51 J. W. Lachance, E. D. Sloan and C. A. Koh, Determining gashydrate kinetic inhibitor effectiveness using emulsions,Chem. Eng. Sci., 2009, 64(1), 180–184.
52 X. S. Li, C. G. Xu, Z. Y. Chen and H. J. Wu, Tetra-n-butylAmmonium Bromide Semi-Clathrate Hydrate Process for
33518 | RSC Adv., 2019, 9, 33506–33518
Post-Combustion Capture of Carbon Dioxide in thePresence of Dodecyl Trimethyl Ammonium Chloride,Energy, 2010, 35(9), 3902–3908.
53 S. P. Kang and J. W. Lee, Kinetic behaviors of CO2 hydrates inporous media and effect of kinetic promoter on theformation kinetics, Chem. Eng. Sci., 2010, 65(5), 1840–1845.
54 T. Uchida, T. Ebinuma, J. Kawabata, et al., Microscopicobservations of formation processes of clathrate-hydratelms at an interface between water and carbon dioxide, J.Cryst. Growth, 1999, 204(3), 348–356.
55 M. J. Yang, Y. C. Song, W. G. Liu, et al., Effects of additivemixtures(THF/SDS) on carbon dioxide hydrate formationand dissociation in porous media, Chem. Eng. Sci., 2013,90, 69–76.
56 C. Dicharry, J. Diaz, J. P. Torre, et al., Inuence of the carbonchain length of a sulfate-based surfactant on the formationof CO2, CH4 and CO2–CH4 gas hydrates, Chem. Eng. Sci.,2016, 152, 736–745.
57 V. Natarajan, P. R. Bishnoi and N. Kalogerakis, Inductionphenomena in gas hydrate nucleation, Chem. Eng. Sci.,1994, 49(13), 2075–2087.
This journal is © The Royal Society of Chemistry 2019