Estimating the amount of gas-hydrate using effective medium theory: a case study in the Blake Ridge
9
ORIGINAL RESEARCH PAPER Estimating the amount of gas-hydrate using effective medium theory: a case study in the Blake Ridge Ranjana Ghosh • Kalachand Sain • Maheswar Ojha Received: 28 September 2009 / Accepted: 20 April 2010 / Published online: 12 May 2010 Ó Springer Science+Business Media B.V. 2010 Abstract Estimating the amount of gas-hydrate and free- gas is difficult in deep seas even with scientific coring and downhole measurements. Well data may be incompatible between holes of a site as well as with depth in the same hole. In this paper, we demonstrate an approach to estimate saturation of gas-hydrate from seismic velocities at any site where data set is limited. The study is carried out in the outer Blake Ridge, which is one of the most intensively studied regions of natural gas-hydrate occurrences and a very distinctive example of studying geophysical signa- tures of gas-hydrate and free-gas in deep marine sediments. Although, downhole measurements from both vertical seismic profiles (VSPs) and sonic logs provide the most accurate and direct measurements of velocity, only VSP velocities at Ocean Drilling Program (ODP) Sites 994, 995, and 997 on the Blake Ridge are used to estimate the sat- uration of gas-hydrate and free-gas as sonic logs at ODP sites are not reliable. Here we derive a general trend of the background velocity with depth using the porosity and mineralogy from coring at discrete depth intervals. Satu- rations of gas-hydrate and free-gas are then estimated from this background velocity using the effective medium modeling. The porosity and mineralogical compositions are taken from four different depths at Site 995, as data quality is the best in this hole. Average saturations of gas-hydrate and free-gas at three holes are estimated as 10–14 and 2–3%, respectively. Keywords Gas-hydrate Free-gas VSP Effective medium theory Blake Ridge Introduction Natural gas-hydrate is an ice-like non-stoichiometric clathrate of gas molecules (mainly methane) and water, which forms when the constituents come into contact at low temperature and high pressure (Sloan 1998, 2003). Below the gas-hydrate-saturated sediments, methane may be present as dissolved or free-gas, but not as crystalline hydrate (MacKay et al. 1994). Methane stored within and trapped as free-gas below hydrate-bearing sediments is almost double the known other fossil fuel (crude oil, nat- ural gas and coal) reserves. The global reserves of gas trapped in gas-hydrate are speculated as 1–120 9 10 15 m 3 (Makogon et al. 2007; Klauda and Sandler 2005; Milkov 2004; Ahlbrandt 2002; Kvenvolden 1998a, b). However reliable estimates are yet to be made. Dissociation of gas- hydrate releases methane (green-house gas) into the atmosphere, which may cause global warming and reduces the rigidity of the sediment leading to slope failure or seafloor instability (Sloan 1998; Kvenvolden 1998a, b). Hence, quantification of natural gas-hydrate and free-gas are essential to evaluate their resource potential and impacts on the environment. Seismic velocities provide important estimates of aver- age saturations of hydrate and gas that, in general, agree with estimates from other downhole logs (Paull et al. 1996; Collett and Ladd 2000). Well data such as the porosity and mineralogy are essential parameters required for rock physics modeling. However, drilling itself is costly and sometimes becomes difficult in the deep seas. Moreover, well data may not be consistent between holes at the same site as well as with depth in the same hole depending on the conditions of hole and quality of log data. Therefore, use of some empirical relations formulated for already explored areas is the conventional way to determine a porosity-depth R. Ghosh K. Sain (&) M. Ojha National Geophysical Research Institute (Council of Scientific and Industrial Research), Uppal Road, Hyderabad 500 606, India e-mail: [email protected] 123 Mar Geophys Res (2010) 31:29–37 DOI 10.1007/s11001-010-9084-y
-
Upload
independent -
Category
Documents
-
view
2 -
download
0
Transcript of Estimating the amount of gas-hydrate using effective medium theory: a case study in the Blake Ridge

ORIGINAL RESEARCH PAPER
Estimating the amount of gas-hydrate using effective mediumtheory: a case study in the Blake Ridge
Ranjana Ghosh • Kalachand Sain • Maheswar Ojha
Received: 28 September 2009 / Accepted: 20 April 2010 / Published online: 12 May 2010
� Springer Science+Business Media B.V. 2010
Abstract Estimating the amount of gas-hydrate and free-
gas is difficult in deep seas even with scientific coring and
downhole measurements. Well data may be incompatible
between holes of a site as well as with depth in the same
hole. In this paper, we demonstrate an approach to estimate
saturation of gas-hydrate from seismic velocities at any site
where data set is limited. The study is carried out in the
outer Blake Ridge, which is one of the most intensively
studied regions of natural gas-hydrate occurrences and a
very distinctive example of studying geophysical signa-
tures of gas-hydrate and free-gas in deep marine sediments.
Although, downhole measurements from both vertical
seismic profiles (VSPs) and sonic logs provide the most
accurate and direct measurements of velocity, only VSP
velocities at Ocean Drilling Program (ODP) Sites 994, 995,
and 997 on the Blake Ridge are used to estimate the sat-
uration of gas-hydrate and free-gas as sonic logs at ODP
sites are not reliable. Here we derive a general trend of the
background velocity with depth using the porosity and
mineralogy from coring at discrete depth intervals. Satu-
rations of gas-hydrate and free-gas are then estimated from
this background velocity using the effective medium
modeling. The porosity and mineralogical compositions are
taken from four different depths at Site 995, as data quality
is the best in this hole. Average saturations of gas-hydrate
and free-gas at three holes are estimated as 10–14 and
2–3%, respectively.
Keywords Gas-hydrate � Free-gas � VSP �Effective medium theory � Blake Ridge
Introduction
Natural gas-hydrate is an ice-like non-stoichiometric
clathrate of gas molecules (mainly methane) and water,
which forms when the constituents come into contact at
low temperature and high pressure (Sloan 1998, 2003).
Below the gas-hydrate-saturated sediments, methane may
be present as dissolved or free-gas, but not as crystalline
hydrate (MacKay et al. 1994). Methane stored within and
trapped as free-gas below hydrate-bearing sediments is
almost double the known other fossil fuel (crude oil, nat-
ural gas and coal) reserves. The global reserves of gas
trapped in gas-hydrate are speculated as 1–120 9 1015 m3
(Makogon et al. 2007; Klauda and Sandler 2005; Milkov
2004; Ahlbrandt 2002; Kvenvolden 1998a, b). However
reliable estimates are yet to be made. Dissociation of gas-
hydrate releases methane (green-house gas) into the
atmosphere, which may cause global warming and reduces
the rigidity of the sediment leading to slope failure or
seafloor instability (Sloan 1998; Kvenvolden 1998a, b).
Hence, quantification of natural gas-hydrate and free-gas
are essential to evaluate their resource potential and
impacts on the environment.
Seismic velocities provide important estimates of aver-
age saturations of hydrate and gas that, in general, agree
with estimates from other downhole logs (Paull et al. 1996;
Collett and Ladd 2000). Well data such as the porosity and
mineralogy are essential parameters required for rock
physics modeling. However, drilling itself is costly and
sometimes becomes difficult in the deep seas. Moreover,
well data may not be consistent between holes at the same
site as well as with depth in the same hole depending on the
conditions of hole and quality of log data. Therefore, use of
some empirical relations formulated for already explored
areas is the conventional way to determine a porosity-depth
R. Ghosh � K. Sain (&) � M. Ojha
National Geophysical Research Institute (Council of Scientific
and Industrial Research), Uppal Road, Hyderabad 500 606, India
e-mail: [email protected]
123
Mar Geophys Res (2010) 31:29–37
DOI 10.1007/s11001-010-9084-y

profile for an unexplored region or for a region having poor
data from coring. However, they may not be applicable in
areas with rock properties different from where they were
formulated. For overcoming these difficulties, we show that
a general background velocity-depth profile and a velocity-
porosity relation can be derived for a region with limited
data set. Saturations of gas-hydrate and free-gas are then
estimated at any location of the region by translating the
velocity anomaly with respect to the background velocity
trend using a rock physics modeling. The method can be
applied potentially to obtain a continuous saturation-depth
profile throughout the prospective region of gas-hydrate-
bearing sediment.
The study is carried out in the outer Blake Ridge
(Fig. 1a) as it provides the unique opportunities to under-
stand the geophysical signature of gas-hydrate and free-gas
in deep marine sediments (Holbrook 2001). Ocean Drilling
program (ODP) Leg 164 was the first dedicated academic
effort to investigate naturally occurring marine gas-hydrate
beneath the Blake-Bahama Ridge, a sediment drift deposit,
located off the coast of the southeastern United States at a
water depth of about 3,000 m. Most of the sediments
recovered in Leg 164 (Shipboard Scientific Party 1996)
were accumulated during the Miocene and Pliocene at very
rapid rates (up to 350 m/my). The stratigraphic sequence is
composed of lithologically rather homogeneous, nanno-
fossil-rich clays and claystones and variable amounts of
opaline silica. The sediments typically contain 0.5–1.5%
organic carbon, enough to generate significant quantities of
microbial methane (Shipboard Scientific Party 1996).
Gas-hydrate and free-gas saturations are estimated on the
Blake Ridge from several sources of velocity: (a) downhole
sonic log in the Leg 164 (Collett and Ladd 2000; Paull et al.
1996), (b) vertical seismic profiling (VSP) data in the Leg
164 (Holbrook et al. 1996; Paull et al. 1996), (c) wide-angle
reflection data recorded on ocean-bottom hydrophones
(OBH) or seismometers (Korenaga et al. 1997), and (d)
high-resolution 3-D seismic data (Hornbach et al. 2008).
Downhole measurements from sonic logs and VSPs provide
the accurate and direct measurement of P-wave velocity on
the Blake Ridge (Holbrook 2001). Although, sonic logs
provide a higher-resolution record and are superior for
identifying small-scale variations in velocity, we prefer to
interpret VSP velocities because VSP is conducted at sur-
face-seismic frequencies and thus provides more practical
links to the surface-seismic reflection study. Besides, their
long wavelengths make them less inclined to degradation
due to near-hole conditions which is especially important in
the low velocity zone (Holbrook 2001). Another reason for
choosing VSP velocity is because the sonic log at Site 997
did not detect the free-gas zone properly (Holbrook 2001).
Figure 1a (Shipboard Scientific Party 1996) shows the
location of Blake Ridge and ODP Sites 994, 995, and 997
drilled to depths of 700–750 m below sea floor (mbsf) along
a *10-km-long transect across the crest of the Blake Ridge.
The single channel seismic data acquired through three sites
(Fig. 1b) show a clear bottom-simulating reflector (BSR),
prime marker for gas hydrates at Sites 995 and 997, but no
BSR at Site 994.
Seismic velocities acquired in the Blake Ridge are
considered to estimate saturations of gas-hydrate and free-
gas across the BSR using different models of rock physics
based on empirical relations and seismic tools (Guerin
et al. 1999; Helgerud et al. 1999; Holbrook et al. 1996;
Jakobsen et al. 2000; Lee 2000; Tinivella and Lodolo 2000;
Holbrook 2001; Hornbach et al. 2008). The advantage of
an empirical relation is that it is based upon real data and is
simple to apply but it may not be valid in all geological
circumstances. In this paper, we have used the effective
medium theory (EMT) proposed by Jakobsen et al. (2000)
for estimating saturations of gas-hydrate and underlying
free-gas in the gas-hydrate-bearing sediment.
Fig. 1 a Map showing the location of drilled holes in the outer Blake
Ridge on ODP Leg 164 off the southeastern coast of the United
States. Gray region in offshore is the distribution of gas-hydrate
inferred from seismic and other data (Shipboard Scientific Party
1996), b single-channel seismic data on Blake Ridge (Holbrook et al.
1996)
30 Mar Geophys Res (2010) 31:29–37
123

Effective medium theory
The effective medium theory (EMT) is based on the first
principle of physics and can incorporate the physics-based
input parameters (Helgerud et al. 1999; Jakobsen et al.
2000). The EMT proposed by Jakobsen et al. (2000) is a
combination of self-consistent approximation (SCA)
(Willis 1977) and differential effective medium theory
(DEM) (Nishizawa 1982) coupled with smoothing
approximation for crystalline aggregate (Bonilla and Keller
1985). The EMT is capable of computing the effective
elastic properties due to infinitesimal change in any of the
constituents in the sediment, complexity in sediment
microstructure associated with the grain geometry, and
inherent anisotropy caused by the alignment of clay
platelets. The combined SCA-DEM theory was developed
to determine the elastic and electrical properties of sand-
stone (Sheng 1990, 1991) and elastic properties of intrin-
sically anisotropic shale (Hornby et al. 1994). The effective
medium is created by implanting inclusions of one material
within another. Both SCA and DEM methods determine
the effective elastic moduli of a medium from the
individual components and their geometry. In marine
sediments, grains and pore-fluids are fully connected
(bi-connected medium) at all realistic porosities. However,
SCA and DEM individually cannot model such a medium
which is bi-connected at all porosities. SCA constructs a bi-
connected medium within 40–60% porosity and it is not
valid above 60% porosity (Sheng 1990, 1991; Hornby et al.
1994).
The DEM model can include micro-structure of a
medium but it depends absolutely on the status of the
starting medium. If the starting medium is bi-connected,
the DEM determines the effective elastic properties pre-
serving the bi-connectivity of the medium at all porosities.
Jakobsen et al. (2000) extended the theory to determine the
elastic property of gas-hydrate-bearing sediment. Accord-
ing to this theory, two end-member distributions of gas-
hydrate are considered: (1) non-load bearing gas-hydrate in
which gas-hydrate is a part of the pore fluid, and remains
without appreciable grain contact (non-contact model,
Fig. 2a) and (2) load-bearing gas-hydrate where gas-
hydrate cements the grains and forms a continuous matrix
(contact model, Fig. 2b).
A large fraction of the offshore sedimentary basins are
rich in clay minerals in which plate-like clay minerals
commonly prefer horizontal alignments. Such type of
sediments exhibit aniosotropic elastic behavior in the limits
of the long wavelength (Hornby et al. 1994; Sayers 1994;
Cholach and Schmitt 2006). Clay platelets form the con-
nected skeleton of the sediment and silt minerals remain as
the isolated phase. Abundance of phyllosilicate minerals
such as clays in sediments contribute to the overall
anisotropy of many rocks because of large anisotropy of
the phyllosilicate single crystals and their texture, quanti-
tatively described by an orientation distribution function
(ODF)(Cholach and Schmitt 2006). Groups of clay plate-
lets are fully aligned locally, but the orientation of these
groups of clay platelets may vary depending on the depo-
sitional and stress history of the sediment (Jakobsen et al.
2000; Hornby et al. 1994; Sayers 1994). The orientation of
these crystalline aggregates varies from completely aligned
(transversely isotropic) to completely disorder (isotropic).
The degree of anisotropy depends on the precise orienta-
tion-distribution pattern of the clay platelets. The average
elastic properties of partially aligned clay platelets are
Fig. 2 a Gas-hydrate replaces
pore-fluid—non-contact model,
b gas-hydrate cements and coats
grain—contact-cementing
model. Bottom panel shows the
concept of effective medium
theory in which we calculate the
elastic properties of a
homogeneous medium (right)having equivalent elastic
properties of a heterogeneous
medium (left) with constituents
of different elastic properties
Mar Geophys Res (2010) 31:29–37 31
123

computed by the method of smoothing (Bonilla and Keller
1985). We have assumed the same ODF of clay platelets as
has been used by Jakobsen et al. (2000).
In modeling procedure, the starting phases are either
clay particles and pore water (required for the non-load
bearing/non-contact model) or clay particles and gas-
hydrate (required for load bearing/contact model), whose
effective elastic moduli are calculated by the SCA-DEM
method. In case of non-contact model, gas-hydrate is
included by replacing water, leaving the clay concen-
tration unchanged. Here, the effective microstructure is
connected clay (load-bearing), connected water and
unconnected gas-hydrate (non-load-bearing). Gas-hydrate
has the same aspect ratio (1/20) and orientation as the
clay platelets (Hornby et al. 1994; Jakobsen et al. 2000).
Up to this, the clay-water-hydrate composites are fully
aligned. But clay platelets are distributed according to
the depositional history of the sediment and generally
partially aligned. Water and gas-hydrate are also oriented
according to the ODF (taken from Jakobsen et al. 2000)
of clay platelets. After incorporating the anisotropy due
to distribution pattern of clay platelets by the method of
smoothing, quartz is included in the aggregated clay-
water-gas-hydrate composite using the DEM method.
The concentration of quartz is increased successively
from zero to the desired volume replacing all other
constituents in proportion to the volume fraction of the
inclusion (quartz) and other constituents. A spherical
inclusion model (aspect ratio of 1) is used for quartz
(Hornby et al. 1994). The only difference in case of
contact modeling of gas-hydrate is that the roles of water
and gas-hydrate are reversed.
Free-gas is included in the clay-water composite using
the DEM theory by replacing water, and leaving clay
unchanged. Then quartz is included in the clay-water-gas
composite. The velocity of the effective medium is com-
puted from the effective stiffness coefficients (Hornby et al.
1994; Jakobsen et al. 2000) of the sediment.
Procedure
First we describe the procedure in the form of a flow chart
(Fig. 3) and then provide details of each step separately.
Determination of background velocity-depth trend
The velocity-depth functions at all three sites (994, 995,
and 997) derived from the VSP data are shown in Fig. 4a.
The saturations of gas-hydrate and free-gas are estimated
using the rock physics modeling by translating the
deviation of velocity-depth profiles of gas-hydrate- and/or
free-gas-bearing sediment from the trend of the back-
ground (water-saturated) velocity. Results of ODP Leg 164
suggest that the lithology of the Blake Ridge is relatively
homogeneous and therefore all anomalies (e.g., reflectance,
velocity or resistivity) can be confidently attributed to gas-
hydrate or free-gas (Paull et al. 1996; Holbrook 2001). We,
therefore, assume a linear increase in velocity (VP) with
depth (Z) for the reference velocity as
VPðZÞ ¼ V0 þ GZ ð1Þ
Core porosity and mineralogy at four different depths of
Site-995A (Table 1), where data quality is the best, are
used for modeling. The elastic properties of different
constituents of the sediment are given in Table 2. Miner-
alogical components given as percentages (wt %) of total
sediment volume (Table 1) are to be expressed as a fraction
of total solid grains (Table 3), by approximating all the silt
minerals as quartz grains.
For water-saturated sediment, the bi-connected, par-
tially-aligned starting effective medium is constructed from
clay and water using the combined SCA-DEM theory
coupled with the smoothing approximation. Following the
DEM method, quartz is included in the partially aligned
clay-water composite. Water-saturated/background P-wave
velocities at four different depths are calculated as shown
in Table 3. Seafloor velocity (V0) and gradient (G) are then
determined as per Eq. 1 using the calculated velocities at
four depths (Table 3), the average values of which are
calculated as V0 = 1.52 km/s and G = 0.3/s. The average
seafloor velocity differs by *1% from individual values
calculated with respect to different depth intervals. We
Fig. 3 Flow chart of the procedure
32 Mar Geophys Res (2010) 31:29–37
123

therefore consider ±1% error in the calculation of seafloor
velocity. The trend of the reference velocity with error
bounds is shown in Fig. 4a.
Derivation of velocity-porosity relation
Due to various obstacles below deep seas (Lee 2000), the
continuous porosity-depth profile could not be made at all
sites even with coring and downhole measurements. Also,
the existing empirical velocity-porosity relations formu-
lated based on real data at a place may not be applicable to
all places. We, therefore, attempt to deduce a velocity-
porosity relation using the core porosity and mineralogy
from one representative hole. Porosity (/) is inversely
proportional to the velocity (V), and existing porosity-
velocity relations are expressed as polynomials of degree
two, four, etc. (Hamilton 1974; Hyndman et al. 1993;
Erickson and Jarrard 1998). We assume the porosity-
velocity relation as a polynomial of degree four
Fig. 4 a VSP velocity-depth profiles at Sites 994, 995 and 997 digitized from Holbrook et al. (1996) and computed background velocity-depth
profile (blue) with error bounds (red and pink), b computed porosity-depth function (blue) with error bounds (red and pink)
Table 1 Approximate composition of samples from Site 995A (Jakobsen et al. 2000; Shipboard Scientific Party 1996)
Depth (mbsf) Porosity (%) Clay wt (%) Quartz wt (%) Calcite wt (%) Other wt (%)
100 68 45 19 26 10
200 65 56 25 11 08
300 57 63 25 12 00
400 54 58 20 17 05
Table 2 Densities (q), P-wave (VP) and S-wave (VS) velocities of
different constituents used for modeling (Jakobsen et al. 2000)
Constituents q (g/cm3) VP (m/s) VS (m/s)
Clay 2.60 3,400 1,600
Water 1.00 1,500 0000
Hydrate 0.92 3,800 2,000
Quartz 2.70 5,980 4,040
Methane 0.23 692 0000
The data for methane is taken from Helgerud et al. (1999)
Mar Geophys Res (2010) 31:29–37 33
123

/ ¼ aþ b=V þ c=V2 þ d=V3 ð2Þ
We solve Eq. 2 using the porosity and velocity (Table 3)
and find the coefficients a, b, c, and d of the polynomial.
The velocity-porosity relation derived for this region can
be expressed as
/ ¼ 0:32þ 0:1634=V � 3:12=V2 þ 5:729=V3 ð3Þ
Determination of porosity-depth function
The background velocity-depth function in Eq. 1 and the
velocity-porosity relation in Eq. 3 are combined to obtain the
porosity-depth profile (Fig. 4b). The error bound in porosity
is obtained from the error bounds in velocity-depth function.
Determination of volume of clay and quartz with depth
The background velocity and porosity are then used to
determine approximately the fractions of mineralogical
constituents in the sediment with depth. The amount of
clay and quartz are determined by varying the volume
fractions of clay and quartz at different depths and
matching the velocity calculated using the EMT with the
background velocity. From the contour plot of clay,
velocity and porosity (Fig. 5), the fraction of clay (or
quartz) can be determined at any depth by matching the
corresponding velocity and porosity at that depth.
Estimation about saturations of gas-hydrate
and free-gas
We have estimated the gas-hydrate saturation with depth and
associated error bounds (Fig. 6) throughout the gas-hydrate-
bearing sediments at all Sites of 994, 995 and 997 using the
EMT from the VSP velocity (Fig. 4a). The base of gas-
hydrate stability zone (BGHSZ) generally coincides with the
BSR which is deepest at Site 994 (Fig. 6). We model the gas-
hydrate-bearing sediment by considering gas-hydrate as a
part of pore fluid (non-contact model) in one case and as a
part of matrix (contact model) in other case.
Results and discussion
In this paper, we estimate gas-hydrate and free-gas satu-
rations throughout the depth range of their occurrences at
Sites 994, 995, and 997 from VSP velocity (Fig. 4a) in the
outer Blake ridge. The trend of the background velocity is
determined from the core data at Site 995. The accuracy of
the derived background velocity trend (Fig. 4a) and the
velocity-porosity relation in Eq. 3 are confirmed through a
reasonable comparison between the calculated porosity-
depth profile (Fig. 4b) and the shipboard-measured poros-
ity-depth function (Holbrook et al. 1996; Shipboard Sci-
entific Party 1996).
The calculated velocity for contact model is always
higher than that from the observed velocity and therefore,
does not provide any estimation of gas-hydrate at all sites.
The average gas-hydrate saturations, estimated for non-
contact model of gas-hydrate, are 10–11, 10–13, and 11–
14% of pore space within *250 m thick sedimentary
column at Sites 994, 995 and 997, respectively. The satu-
ration of free-gas with error bounds at three sites, calcu-
lated from the VSP velocities, is shown in Fig. 6. At Site
997, where the free-gas saturation is maximum, average
free-gas is estimated as 2–2.6% of pore volume within
*200-m thick sediment below the BGHSZ. The average
Table 3 Volume concentrations used in the effective medium modeling to compute the background P-wave velocities at corresponding depths
Depth (mbsf) Porosity (%) Clay (fraction) Quartz (fraction) Velocity km/s
100 68 0.14 0.18 1.54
200 65 0.20 0.15 1.56
300 57 0.27 0.16 1.63
400 54 0.27 0.19 1.66
Fig. 5 Contour plot between velocity and volume fraction of clay
minerals at different porosities
34 Mar Geophys Res (2010) 31:29–37
123
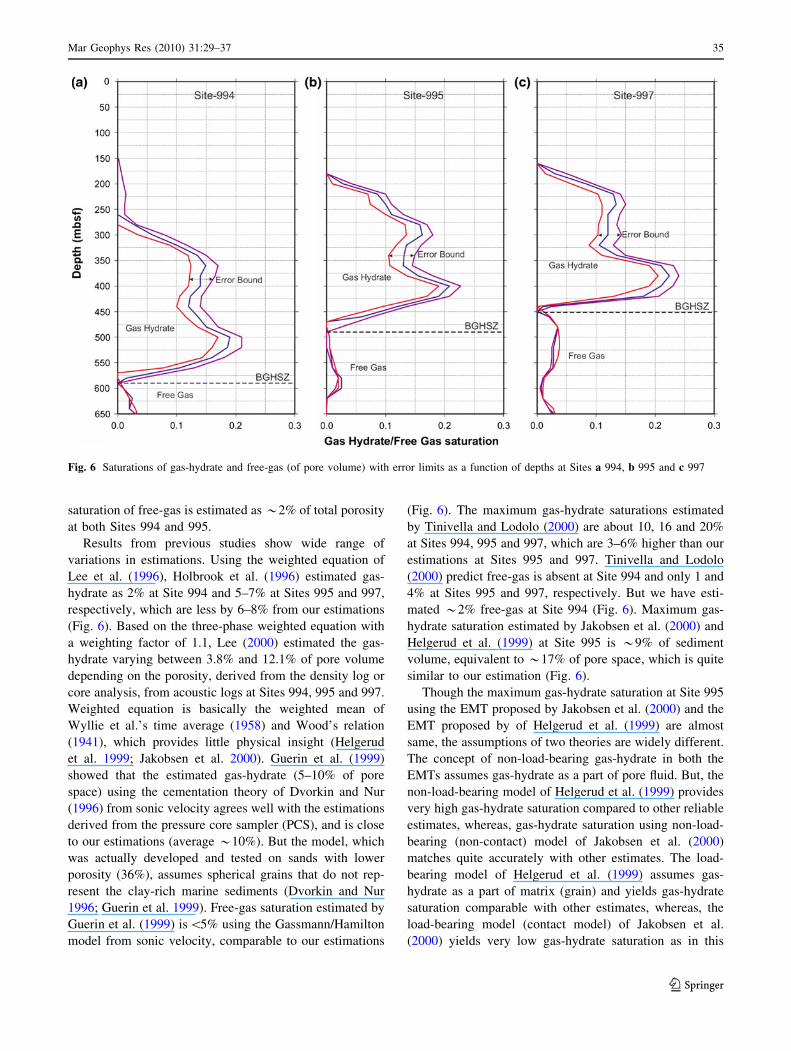
saturation of free-gas is estimated as *2% of total porosity
at both Sites 994 and 995.
Results from previous studies show wide range of
variations in estimations. Using the weighted equation of
Lee et al. (1996), Holbrook et al. (1996) estimated gas-
hydrate as 2% at Site 994 and 5–7% at Sites 995 and 997,
respectively, which are less by 6–8% from our estimations
(Fig. 6). Based on the three-phase weighted equation with
a weighting factor of 1.1, Lee (2000) estimated the gas-
hydrate varying between 3.8% and 12.1% of pore volume
depending on the porosity, derived from the density log or
core analysis, from acoustic logs at Sites 994, 995 and 997.
Weighted equation is basically the weighted mean of
Wyllie et al.’s time average (1958) and Wood’s relation
(1941), which provides little physical insight (Helgerud
et al. 1999; Jakobsen et al. 2000). Guerin et al. (1999)
showed that the estimated gas-hydrate (5–10% of pore
space) using the cementation theory of Dvorkin and Nur
(1996) from sonic velocity agrees well with the estimations
derived from the pressure core sampler (PCS), and is close
to our estimations (average *10%). But the model, which
was actually developed and tested on sands with lower
porosity (36%), assumes spherical grains that do not rep-
resent the clay-rich marine sediments (Dvorkin and Nur
1996; Guerin et al. 1999). Free-gas saturation estimated by
Guerin et al. (1999) is\5% using the Gassmann/Hamilton
model from sonic velocity, comparable to our estimations
(Fig. 6). The maximum gas-hydrate saturations estimated
by Tinivella and Lodolo (2000) are about 10, 16 and 20%
at Sites 994, 995 and 997, which are 3–6% higher than our
estimations at Sites 995 and 997. Tinivella and Lodolo
(2000) predict free-gas is absent at Site 994 and only 1 and
4% at Sites 995 and 997, respectively. But we have esti-
mated *2% free-gas at Site 994 (Fig. 6). Maximum gas-
hydrate saturation estimated by Jakobsen et al. (2000) and
Helgerud et al. (1999) at Site 995 is *9% of sediment
volume, equivalent to *17% of pore space, which is quite
similar to our estimation (Fig. 6).
Though the maximum gas-hydrate saturation at Site 995
using the EMT proposed by Jakobsen et al. (2000) and the
EMT proposed by of Helgerud et al. (1999) are almost
same, the assumptions of two theories are widely different.
The concept of non-load-bearing gas-hydrate in both the
EMTs assumes gas-hydrate as a part of pore fluid. But, the
non-load-bearing model of Helgerud et al. (1999) provides
very high gas-hydrate saturation compared to other reliable
estimates, whereas, gas-hydrate saturation using non-load-
bearing (non-contact) model of Jakobsen et al. (2000)
matches quite accurately with other estimates. The load-
bearing model of Helgerud et al. (1999) assumes gas-
hydrate as a part of matrix (grain) and yields gas-hydrate
saturation comparable with other estimates, whereas, the
load-bearing model (contact model) of Jakobsen et al.
(2000) yields very low gas-hydrate saturation as in this
Fig. 6 Saturations of gas-hydrate and free-gas (of pore volume) with error limits as a function of depths at Sites a 994, b 995 and c 997
Mar Geophys Res (2010) 31:29–37 35
123

model gas-hydrate cements the grain and therefore velocity
of the effective medium is very high. Moreover, Helgerud
et al. (1999) assumes all solid grains including the clay
particles are spherical which are unlikely based on the
observations of seismic anisotropy for clay-rich sediments
(Pecher et al. 2003). Intrinsic elasticity of clay-rich sedi-
ments is significantly influenced by the distribution pattern
of anisotropic clay platelets. Other factors such as oriented
microcraks and in-situ stress distribution may significantly
influence anisotropy and the models that include these
factors would benefit by starting from the intrinsically
anisotropic matrix (Cholach and Schmitt 2006). The criti-
cal porosity (porosity at which rigidity of a material van-
ishes) also strongly depends on the clay content, thus the
EMT used by Helgerud et al. (1999) is limited if the critical
porosity is assumed to be 0.35 (Chand et al. 2004; Ecker
et al. 1998, 2000; Helgerud et al. 1999). Since the SCA-
DEM theory, capable of computing the effective elastic
properties of sediments at any finite porosity, we prefer the
EMT proposed by Jakobsen et al. (2000).
Recent coring and drilling in the eastern Indian offshore
show veins/fractures, filled with gas-hydrates (grain-dis-
placing morphology of gas-hydrate), in the shallow clay-
rich sediments (Cook and Goldberg 2008, Holland et al.
2008; Kastner et al. 2008; Lee and Collett 2008; Ghosh
et al. 2010). As the anisotropy in the Blake Ridge is
interpreted to be caused by the alignment of clay platelets
rather than the high-velocity gas-hydrate veins (Pecher
et al. 2003), we assume only the pore-filling morphology of
gas-hydrate.
Conclusions
We find that the distribution of gas-hydrate in pore space is
non-contact type (non-load-bearing model). Saturation of
gas-hydrate is zero for load-bearing model (contact model).
Jakobsen et al. (2000) also concluded the nature of gas-
hydrate distribution is non-contact type in this region. Our
estimation shows that the saturation of gas-hydrate (max-
imum of 20–23% of pore space) and free-gas (maximum of
3% of pore space) are higher at Site 997 than the corre-
sponding values at two other sites. Both gas-hydrate and
free-gas saturations estimated from our methodology
match quite well with those from other methods and data
sets (Paull et al. 1996; Collett and Ladd 2000; Ecker et al.
2000; Helgerud et al. 1999; Jakobsen et al. 2000).
We show that, from a limited data set, we can approx-
imate the reference velocity-depth profile, a velocity-
porosity relation, and mineralogical constituents as well as
gas-hydrate and free-gas saturations. We demonstrate this
approach at the outer Blake Ridge; however, it can be
employed potentially to use seismic velocities to estimate
saturation of gas-hydrate at any other region. The SCA-
DEM theory in combination with the smoothing approxi-
mation, though suitable for clay-rich sediment, can be used
for predicting gas-hydrate saturation for sand-rich lithology
also (Ghosh and Sain 2008). Since the theory underesti-
mates the effect of quartz, which has higher stiffness than
clay, by considering the clay platelets connected and quartz
grains unconnected even at much higher concentration, the
present approach provides higher estimates than other rock
physics models.
Acknowledgments We are grateful to the Director, NGRI for his
kind consent to publish this work. The Ministry of Earth Sciences,
Delhi and the Department of Science & Technology, Delhi are
acknowledged for financial support. We are grateful to the Editor and
two anonymous reviewers for their comments and suggestions.
References
Ahlbrandt TS (2002) Future petroleum energy resources of the world.
Int Geol Rev 44:1092–1104
Bonilla LL, Keller JB (1985) Acoustoelastic effect and wave
propagation in heterogeneous weakly anisotropic materials.
J Mech Phys Solids 33:241–261
Chand S, Minshull TA, Gei D, Carcione JM (2004) Elastic velocity
models for gas-hydrate-bearing sediments-a comparison. Geo-
phys J Int 159:573–590
Cholach PY, Schmitt DR (2006) Intrinsic elasticity of a textured
transversely isotropic muscovite aggregate: Comparisons to the
seismic anisotropy of schists and shales. J Geophys Res
111:B09410
Collett TS, Ladd J (2000) Detection of gas hydrate with downhole
logs and assessment of gas hydrate concentrations (saturations)
and gas volumes on the Blake Ridge with electrical resistivity
log data. In: Paull CK, Matsumoto R, Wallace PJ, Dillon WP
(eds) Proceedings of ODP, science results, vol 164, pp 179–191
Cook A, Goldberg D (2008) Stress and gas-hydrate-filled fracture
distribution, Krishna–Godavari basin, India, In: Proceedings of
the 6th international conference on gas hydrates, Vancouver,
July 6–10
Dvorkin J, Nur A (1996) Elasticity of high porosity sandstones:
theory for two North Sea data sets. Geophysics 61:1363–1370
Ecker C, Dvorkin J, Nur A (1998) Sediments with gas hydrate:
internal structure from seismic AVO. Geophysics 63:1659–1669
Ecker C, Dvorkin J, Nur A (2000) Estimating the amount of gas
hydrate and free gas from marine seismic data. Geophysics
65:565–573
Erickson SN, Jarrard RD (1998) Velocity-porosity relationships for
water-saturated siliciclastic sediments. J Geophys Res
103:30385–30406
Ghosh R, Sain K (2008) Effective medium modeling to assess gas
hydrate and free gas evident from the velocity structure in the
Makran accretionary prism. Mar Geophys Res 29:267–274
Ghosh R, Sain K, Ojha M (2010) Effective medium modeling of gas
hydrate-filled fractures using sonic log in the Krishna-Godavari
basin, eastern Indian offshore. J Geophys Res. doi:10.1029/
2009JB006711 (in press)
Guerin G, Goldberg D, Meltser A (1999) Characterization of in situ
elastic properties of gas hydrate-bearing sediments on the Blake
Ridge. J Geophys Res 104:17781–17795
36 Mar Geophys Res (2010) 31:29–37
123

Hamilton EL (1974) Prediction of deep-sea sediment properties: state
of the art. In: Inderbitzen AL (ed) Deep-Sea sediments: physical
and mechanical properties. Plenum, New York, pp 1–44
Helgerud MB, Dvorkin J, Nur A (1999) Elastic-wave velocity in
marine sediments with gas hydrates: effective medium modeling.
Geophys Res Lett 26:2021–2024
Holbrook WS (2001) Seismic studies of the Blake Ridge: implications
for hydrate distribution, methane expulsion, and free gas
dynamics. In: Paull CK, Dillon WP (eds) Natural gas hydrates:
occurrence, distribution, and detection. American Geophysical
Union Geophys Mono 124, pp 307–315
Holbrook WS, Hoskins H, Wood WT, Stephen RA, Lizarralde D, Leg
164 Science Party (1996) Methane hydrate and free gas on the
Blake Ridge from vertical seismic profiling. Science 273:1840–
1843
Holland M, Schultheiss P, Roberts J, Druce M (2008) Observed gas
hydrate morphologies in marine sediments. In: Proceedings of
the 6th international conference on gas hydrates, Vancouver,
July 6–10
Hornbach MJ, Saffer DM, Holbrook WS, Avendonk HJAV, Gorman
AR (2008) Three-dimensional seismic imaging of the Blake
Ridge methane hydrate province: Evidence for large, concen-
trated zones of gas hydrate and morphologicalyy driven advec-
tion. J Geophys Res 113:B07101. doi:10.1029/2007JB005329
Hornby BE, Schwartz LM, Hudson JA (1994) Anisotropic effective
medium modeling of the elastic properties of shales. Geophysics
59:1570–1583
Hyndman RD, Moore GF, Moran K (1993) Velocity, porosity and
pore-fluid loss from the Nankai subduction zone accretionary
prism. In: Proceedings of the ocean drilling program, scientific
results, vol 131, pp 211–220
Jakobsen M, Hudson JA, Minshull TA, Singh SC (2000) Elastic
properties of hydrate-bearing sediments using effective medium
theory. J Geophys Res 105:561–577
Kastner M, Claypool G, Robertson G (2008) Geochemical constraints
on the origin of the pore fluids and gas hydrate distribution at
Atwater Valley and Keathley Canyon, northern Gulf of Mexico.
Mar Petro Geol 25:860–872
Klauda JB, Sandler SI (2005) Global distribution of methane hydrate
in ocean sediment. Energy Fuels 19:459–470
Korenaga J, Holbrook WS, Singh SC, Minshull TA (1997) Natural
gas hydrates on the southeast US margin: constraints from full
waveform and travel time inversions of wide-angle seismic data.
J Geophys Res 102:15345–15365
Kvenvolden KA (1998a) A primer on the geological occurrence of
gas hydrate. In: Henriet JP, Mienert J (eds) Gas hydrates:
relevance to the world margin stability and climate change, pp
9–30, Geol Soc Special Publications 37, London
Kvenvolden KA (1998b) Methane hydrate—a major reservoir of
carbon in the shallow geosphere? Chem Geol 71:41–51
Lee MW (2000) Gas hydrates amount estimated from acoustic logs at
the Blake Ridge, Sites 994, 995, and 997. In: Paull CK,
Matsumoto R, Wallace PJ, Dillon WP (eds) Proceedings of
ocean drilling program, scientific results, vol 164, pp 193–198
Lee MW, Collett TS (2008) Integrated analysis of well logs and
seismic data to estimate gas hydrate concentrations at Keathley
Canyon, Gulf of Mexico. Mar Petro Geol 25:924–931
Lee MW, Hutchinson DR, Collett TS, Dillon WP (1996) Seismic
velocities for hydrate-bearing sediments using weighted equa-
tion. J Geophys Res 101:20347–20358
Mackay ME, Jarrad RD, Westbrook GK, Hyndman RD (1994) Origin
of bottom simulating reflectors: geophysical evidence from the
Cascadia accretionary prism. Geology 22:459–462
Makogon YF, Holditch SA, Makogon TY (2007) Natural gas
hydrates—a potential energy source for the 21st century.
J Petrol Sci Eng 56:14–31
Milkov AV (2004) Global estimates of hydrate-bound gas in marine
sediments: how much is really out there? Earth Sci Rev 66:183–
197
Nishizawa O (1982) Seismic velocity anisotropy in a medium
containing oriented cracks: Transversely isotropic case. J Phys
Earth 30:331–347
Paull CK et al (1996) Proceedings of the Ocean drilling program. Sci
Results 164:623
Pecher IA, Holbrook WS, Sen MK, Lizarralde D, Wood WT (2003)
Seismic anisotropy in gas hydrate-and gas-bearing sediments on
the Blake ridge, from a walk away vertical seismic profile.
Geophys Res Lett 30:1733. doi:10.1029/2003GL017477
Sayers CM (1994) The elastic anisotropy of shales. J Geophys Res B1
99:767–774
Sheng P (1990) Effective medium theory of sedimentary rocks. Phys
Rev B 41:4507–4512
Sheng P (1991) Consistent modeling of the electrical and elastic
properties of sedimentary rocks. Geophysics 56:1236–1243
Shipboard Scientific Party (1996) Site 995. In: Paull CK, Matsumoto
R, Wallace et al (eds) Proceedings of ocean drilling program,
initial reports, vol 164, pp 175–240
Sloan ED (1998) Clathrate hydrate of natural gases. Marcel Dekker,
New York
Sloan ED (2003) Fundamental principles and applications of natural
gas hydrates. Nature 426:353–359
Tinivella U, Lodolo E (2000) The Blake Ridge bottom-simulating
reflector transect: tomographic velocity field and theoretical
model to estimate methane hydrate quantities. In: Paull CK,
Matsumoto R, Wallace PJ, Dillon WP (eds) Proceedings of
ocean drilling program, initial reports, vol 164, pp 273–281
Willis JR (1977) Bounds of self-consistent estimates for the overall
properties of anisotropic composites. J Mech Phys Solids
25:185–202
Wood AB (1941) Text book of sound. Macmillan, Indianapolis, p 578
Wyllie MR, Gergory AR, Gardner GHP (1958) An experimental
investigation of factors affecting elastic wave velocities in
porous media. Geophysics 23:459–493
Mar Geophys Res (2010) 31:29–37 37
123