Mathematical Modeling of the Gas Hydrate Formation in a 90 ...
6
CHEMICAL ENGINEERING TRANSACTIONS VOL. 70, 2018 A publication of The Italian Association of Chemical Engineering Online at www.aidic.it/cet Guest Editors: Timothy G. Walmsley, Petar S. Varbanov, Rongxin Su, Jiří J. Klemeš Copyright © 2018, AIDIC Servizi S.r.l. ISBN 978-88-95608-67-9; ISSN 2283-9216 Mathematical Modeling of the Gas Hydrate Formation in a 90 Elbow Utilizing CFD Technique Sajjad Jozian, Leila Vafajoo* Department of Chemical and Polymer Engineering, Islamic Azad University, Tehran South Branch, Ahang Blvd., Deh-Haghi St., Tehran, Iran, [email protected] Gas hydrate considered as one of the major issues in gas transmission industry forming an ice-like substance by water molecules under certain temperature and pressure conditions. This may cause obstruction of the pipeline and other operating equipment while reducing the throughput of production line ultimately leading to the general pipeline plugging. The goal of this study was to develop a dynamic mathematical model of a gas hydrate production in gas transport pipeline in order to identify the potential areas being prone to collect hydrate, as well as appropriate management for time and zone of inhibitor injection eliminating hydrates. For this purpose, a 90 elbow modelled in 3D and appropriate points to form hydrate determined. Results revealed that at the beginning (i.e.; at the inlet of the geometry and on the inner walls of the elbow) due to the favorable low temperatures and high pressures, methane hydrate formed and increased over time until it blocked the flow path. To validate results of the developed model, since there existed no experimental data for hydrate formation in a 90 elbow; at first; hydrate formation in a 3D pipeline modelled utilizing the kinetics and user defined function (UDF) available for other configurations in the open literature. Then obtained theoretical results of the current work checked against existing pipeline’s experimental data of the open literature. The average resulting error was about 8.2 %. One considered this outcome very satisficing. 1. Introduction Gas hydrate formed under pressure-driven formation of crystalline water around cages occupied by gest gas molecules, for example methane, at temperatures below 10 o C. Naturally, such conditions found in permafrost and deep at bottom of water tanks. The formation of gas hydrate through the pipelines considered mostly along with petroleum products. Hydrates transported by the flows as solids particles dissipating energy during collisions with the pipe walls as well as each other. This phenomenon significantly increased the pumping costs while formed plugs. Therefore, the presence of these materials considered very harmful. Figure 1 depicted a real pipeline through which gas hydrate formed. Balakin et al. (2016) investigated the density and deposition of gas hydrates inside industrial tubes using a combination of computational fluid dynamics and modeling with Population Balance Method (CFD-PBM). The resulting model was capable of predicting the agglomeration and deposition of hydrate particles in turbulent oil- dominated flows. Omidi et al. (2016) modeled and simulated thermal decomposition of the hydrates around the vertical pipelines produced gas from subocean sediments. As such, in layers of sediments, the volume of the gas and hydrate analyzed and the related pressure determined. They understudied the effect of the gas flow in the vertical pipelines while porosity of the sediment layers and volume of the hydrate investigated. Results revealed that the raising of the gas velocity in the pipelines enhanced the hydrate decomposition. Naseer et al. (2011) modelled the production of hydrate inside a pipeline-transported gas by CFD-Software. They found out that, some parts of the pipeline with a positive gradient considered the best place for accumulating water and forming gas hydrate. Lorenzo et al. (2018) presented a preliminary sloughing model to determine the effective shear strength of the hydrate deposits considered a key property to predict hydrate detachment and accumulation in gas-dominated pipelines. Musakaev et al. (2018) proposed a mathematical model for decomposition of gas hydrate under a negative (i.e.; below 0C) initial reservoir temperature. This model took DOI: 10.3303/CET1870362 Please cite this article as: Jozian S., Vafajoo L., 2018, Mathematical modeling of the gas hydrate formation in a 90( elbow utilizing cfd technique , Chemical Engineering Transactions, 70, 2167-2172 DOI:10.3303/CET1870362 2167
-
Upload
khangminh22 -
Category
Documents
-
view
0 -
download
0
Transcript of Mathematical Modeling of the Gas Hydrate Formation in a 90 ...

CHEMICAL ENGINEERING TRANSACTIONS
VOL. 70, 2018
A publication of
The Italian Association of Chemical Engineering Online at www.aidic.it/cet
Guest Editors: Timothy G. Walmsley, Petar S. Varbanov, Rongxin Su, Jiří J. Klemeš Copyright © 2018, AIDIC Servizi S.r.l.
ISBN 978-88-95608-67-9; ISSN 2283-9216
Mathematical Modeling of the Gas Hydrate Formation in a 90
Elbow Utilizing CFD Technique
Sajjad Jozian, Leila Vafajoo*
Department of Chemical and Polymer Engineering, Islamic Azad University, Tehran South Branch, Ahang Blvd., Deh-Haghi
St., Tehran, Iran,
Gas hydrate considered as one of the major issues in gas transmission industry forming an ice-like substance
by water molecules under certain temperature and pressure conditions. This may cause obstruction of the
pipeline and other operating equipment while reducing the throughput of production line ultimately leading to
the general pipeline plugging. The goal of this study was to develop a dynamic mathematical model of a gas
hydrate production in gas transport pipeline in order to identify the potential areas being prone to collect hydrate,
as well as appropriate management for time and zone of inhibitor injection eliminating hydrates. For this purpose,
a 90 elbow modelled in 3D and appropriate points to form hydrate determined. Results revealed that at the
beginning (i.e.; at the inlet of the geometry and on the inner walls of the elbow) due to the favorable low
temperatures and high pressures, methane hydrate formed and increased over time until it blocked the flow
path. To validate results of the developed model, since there existed no experimental data for hydrate formation
in a 90 elbow; at first; hydrate formation in a 3D pipeline modelled utilizing the kinetics and user defined function
(UDF) available for other configurations in the open literature. Then obtained theoretical results of the current
work checked against existing pipeline’s experimental data of the open literature. The average resulting error
was about 8.2 %. One considered this outcome very satisficing.
1. Introduction
Gas hydrate formed under pressure-driven formation of crystalline water around cages occupied by gest gas
molecules, for example methane, at temperatures below 10 oC. Naturally, such conditions found in permafrost
and deep at bottom of water tanks. The formation of gas hydrate through the pipelines considered mostly along
with petroleum products. Hydrates transported by the flows as solids particles dissipating energy during
collisions with the pipe walls as well as each other. This phenomenon significantly increased the pumping costs
while formed plugs. Therefore, the presence of these materials considered very harmful. Figure 1 depicted a
real pipeline through which gas hydrate formed.
Balakin et al. (2016) investigated the density and deposition of gas hydrates inside industrial tubes using a
combination of computational fluid dynamics and modeling with Population Balance Method (CFD-PBM). The
resulting model was capable of predicting the agglomeration and deposition of hydrate particles in turbulent oil-
dominated flows. Omidi et al. (2016) modeled and simulated thermal decomposition of the hydrates around the
vertical pipelines produced gas from subocean sediments. As such, in layers of sediments, the volume of the
gas and hydrate analyzed and the related pressure determined. They understudied the effect of the gas flow in
the vertical pipelines while porosity of the sediment layers and volume of the hydrate investigated. Results
revealed that the raising of the gas velocity in the pipelines enhanced the hydrate decomposition. Naseer et al.
(2011) modelled the production of hydrate inside a pipeline-transported gas by CFD-Software. They found out
that, some parts of the pipeline with a positive gradient considered the best place for accumulating water and
forming gas hydrate. Lorenzo et al. (2018) presented a preliminary sloughing model to determine the effective
shear strength of the hydrate deposits considered a key property to predict hydrate detachment and
accumulation in gas-dominated pipelines. Musakaev et al. (2018) proposed a mathematical model for
decomposition of gas hydrate under a negative (i.e.; below 0C) initial reservoir temperature. This model took
DOI: 10.3303/CET1870362
Please cite this article as: Jozian S., Vafajoo L., 2018, Mathematical modeling of the gas hydrate formation in a 90( elbow utilizing cfd technique , Chemical Engineering Transactions, 70, 2167-2172 DOI:10.3303/CET1870362
2167

into account the methane hydrate decomposition in a porous medium with both the frontal surface and extended
zone of phase transitions. Saeedi-Dehghani et al. (2016) investigated the Thermodynamic modelling of the gas
hydrate production in the presence of some chemical inhibitors like methanol, Ethanol, and Mono Ethylene
glycol. Their model could predict the equilibrium temperature of the methane hydrate production. In a different
research, Inkong et al. (2016) studied the effects of mixed MES (Methyl Ester Sulfonate) and SDS (Sodium
Dodecyl Sulphate) hydrate promoters on formation and dissociation of gas hydrate kinetics. Their work aimed
at facilitating the rate of hydrate formation towards improving its storage capacity for transportation. They
revealed all concentrations of mixed surfactants enhanced the methane formation rate compared to pure water.
Nonetheless, this did not significantly affect the rate of methane recovery. In another study, three phase (liquid-
vapour-hydrate) equilibrium for some gas mixture containing methane with various compositions investigated
by Lee et al. (2013). Results of their work illustrated that existing of large cavity occupying molecules (e.g.,
ethylene) increased non-linearly of the equilibrium curves.
In the present study, a 3D CFD model containing three phases (gas-vapour-hydrate) developed to determine
the position and time of gas hydrate formation in a gas transfer pipeline including a 90 elbows. Obtained results
could help predicting the location and time for injection of hydrate inhibitors to prevent the pipeline plugging.
Figure 1: Gas hydrate in a gas pipeline
Figure 2: Scheme of a 90 elbow
2168

2. The modeling of gas hydrate
In this study, a 90 elbow modelled in the context of a three-phase flow. The mesh characterization of the model
illustrated in Table1. A schematic of this elbow presented in Figure 2.
Table 1: Characterization of model’s mesh
Method No. of elements Size function Relevance Center Transition
Automatic 36,260 Proximity and Curvature Fine Slow
3. Utilized equations
In order to predict the hydrate formation phenomena, one needed to solve equations of continuity, momentum
and energy balances simultaneously. These equations provided below.
3.1 The continuity equation
0.
mmm
t
(1)
Where ρm and υ⃗ m are volume fraction averaged mixture density and mass averaged velocity, respectively.
3.2 The momentum equations
n
k
kdrkrdkk
m
T
mmmmmmmm
F
gPt
1
,,.
..
(2)
Where m is volume fraction averaged mixture viscosity and kdr,
is the drift velocity of individual phases.
3.3 The energy balance equations
Effe
n
k
kkkk
n
k
kkk STkPEEt
..11
(3)
Where Ek was the energy of phase k, k known as the volume fraction of phase k, P was its pressure, Keff taken
as the effective thermal conductivity, T was the temperature, and SE represented an energy source.
As long as operating conditions for hydrate formation hold, one assumed that the gas hydrate formation followed
the Naseer et al. (2011) equation provided:
gasgaswaterwaterhydrateM
(4)
A mixture of 80% methane gas and 20% water vapour (by volume) utilizing velocity-inlet condition entered into
the pipe. Initialization method used was the standard with no slip shear condition and stationary wall motion.
The saturated temperature determined with existing experimental data related to every inlet pressure through
the following equation (Naseer et al., 2011):
08.167ln335.16 PT sat
(5)
However, as the process was unsteady, computations repeated in every 10 seconds duration with the Pressure-
outlet condition for the exiting flowing mixture. In the present model, PISO (Pressure Implicit Split Operator)
method used to couple the velocity and pressure of the system. The K--RNG (Re Normalization Group) Viscous
model with Standard Wall Functions and Implicit body force also utilized for solving the aforementioned
equations. Summary of solution method for model’s equations provided in Table 2.
2169

Table 2: Model Solution Methods
P-V coupling Gradient pressure energy momentum
PISO Least Square cell based PRESTO First order upwind First order upwind
Eventually, to increase the accuracy of the computations for discretization as well as the momentum equations
in terms of the volume fractions, the first-order up winding incorporated. The operating parameters used for this
model presented in Table 3.
Table 3: Operating parameters of the model
Pipe diameter Gas
inlet temperature
Operating
pressure Inlet velocity
Volume fraction of water
vapor in the feed
0.25m 315K 6.3Mpa 2m/s 0.2
(b)
(a)
(d)
(c)
Figure 3: The velocity contours of three phases flow in a 90 elbow understudied (a) t=10s, (b) t=100s, (c)
t=1000s and (d) t= 3000s
2170
(b)
(a)
(d)
(c)
(e)
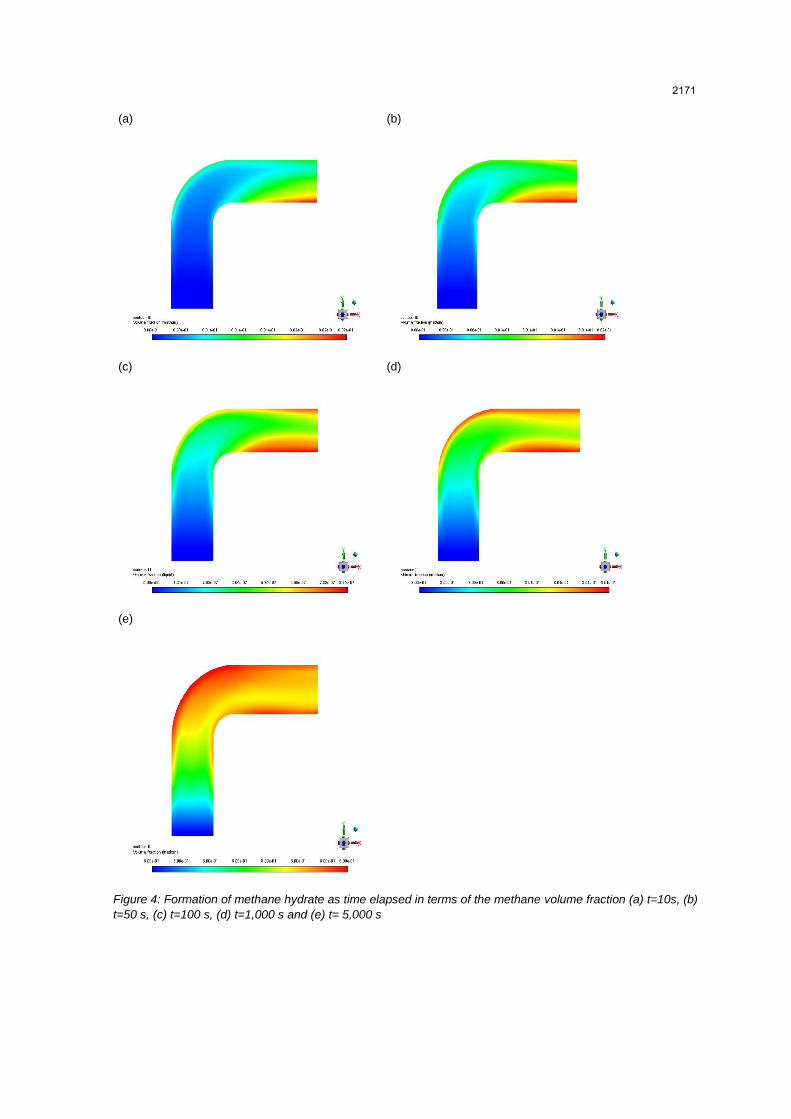
Figure 4: Formation of methane hydrate as time elapsed in terms of the methane volume fraction (a) t=10s, (b)
t=50 s, (c) t=100 s, (d) t=1,000 s and (e) t= 5,000 s
2171

4. Results and discussion
The stream velocity for the three-phase flow systems considered as a function of the flowing route and the
amount of formed gas hydrates (Figure 3). Moreover, formation of the hydrates in gaseous regions further
enhanced with corresponding high fluid velocities. This attributed to the reduced cross sectional area (due to
the hydrate formation) imposed upon the flowing fluid. In other words, the gas hydrate formed at the inlet of the
geometry, at the bottom of the pipe and in some parts of the elbow, the velocity increase seemed logical. At
the beginning (i.e.; at the inlet of the geometry and on the inner walls of the elbow) due to the favorable low
temperatures and high pressures, the methane hydrate formed and increased over time until it blocked the flow
path. In the present work, through the computational fluid dynamics the formation of methane hydrate predicted
inside a pipeline (Figure 4). This meant one was able to identify the location and amount of the hydrate formed.
This information helped to prevent hydrate formation through injecting of inhibitors at a right spot. Furthermore,
this model rendered proper operating conditions in order to slow down or stop forming of gas hydrate.
5. Conclusions
One of the most important problems in the gas pipeline transportation considered hydrate formation causing
excess line pressure drop ultimately leading to the pipeline plugging. The main goal of the present research was
to develop a dynamic model capable of predicting the time and location of gas hydrate formation in a 90 elbow
utilizing the CFD technique. In this model, gas hydrate formation predicted utilizing Piecewise-linear mechanism
at 0.01sec time intervals. For this purpose, a typical system comprising three phases of methane, liquid water
and gas hydrate considered and consequent equations solved through application of an appropriate mixing rule
model. Moreover, the PISO method used to solve simultaneously the energy and momentum balance equations.
The K--RNG model along with Standard Wall Functions used to determine gas turbulence. Ultimately, a first-
order up-winding method utilized to discretize the momentum balance equations. Results of this research
directly applied to determine amounts and locations of hydrate inhibitor injection needed to prevent problems
due to such natural gas transportation through pipelines.
References
Balakin B.V., Lo S., Kosinski P., Hoffman A. C., 2016, Modelling agglomeration and deposition of gas hydrate
in industrial pipelines with combined CFD-PBM Technique, Chemical Engineering Science, 153, 45-57.
Inkong K., Rangsunvigit P., Kulprathipanja S., 2016, Effects of Mixed Surfactants on Methane Hydrate
Formation and Dissociations, Chemical Engineering Transaction, 52, 151-156, DOI: 10.3303/CET1652026
Lee J. W., Kang S. P., 2013, Formation behaviours of Mixed Gas Hydrate Including Olefin Compounds,
Chemical Engineering Transaction, 32, 1921-1926, DOI: 10.3303/CET13332321
Lorenzo M.D., Aman Z. M., Kozielski K., Norris B. W. E., Johns M. L., May E. F., 2018, Modelling hydrate
deposition and sloughing in gas-dominant pipelines, Journal of Chemical Thermodynamics, 117, 81-90.
Musakaev N. G., Khasanov M. K., Borodin S. L., 2018, the mathematical model of gas hydrate deposit
development in permafrost, International Journal of Heat and Mass Transfer, 118, 455-461.
Nasser M., Brandstatter W., 2011, Hydrate formation in natural gas pipelines, Computational methods in
multiphase flow VI, WIT PRESS, 261-270.
Omidi M., Shahsavand A., Share Mohammadi H., 2016, Modelling and Simulation of Hydrate thermal
dissociation around gas production pipe from suboceanic sediment, Journal of Natural Gas Science and
Engineering, 32, 48-58.
Saeedi Dehghani A. H., Badizad M., 2016, Thermodynamic modelling of gas hydrate formation in presence of
thermodynamic inhibitors with a new association equation of state, Fluid Phase Equilibria, 427, 328-339.
2172