
what will it take for ghana to achieve 90-90-90? - Health Policy ...
48
August 2017 WHAT WILL IT TAKE FOR GHANA TO ACHIEVE 90-90-90? Costing an Enhanced HIV Treatment Cascade
-
Upload
khangminh22 -
Category
Documents
-
view
0 -
download
0
Transcript of what will it take for ghana to achieve 90-90-90? - Health Policy ...

August 2017
WHAT WILL IT TAKE FOR GHANA TO ACHIEVE 90-90-90?Costing an Enhanced HIV Treatment Cascade

August 2017
This publication was prepared by Bryant Lee (Palladium), Reshma Naik (Population Reference Bureau), and Ernest Kenu (consultant) of the Health Policy Plus project.
Suggested citation: Lee, B., R. Naik, and E. Kenu. 2017. What Will it Take for Ghana to Achieve 90-90-90? Costing an Enhanced HIV Treatment Cascade. Washington, DC: Palladium, Health Policy Plus.
ISBN: 978-1-59560-155-1
Health Policy Plus (HP+) is a five-year cooperative agreement funded by the U.S. Agency for International Development under Agreement No. AID-OAA-A-15-00051, beginning August 28, 2015. The project’s HIV activities are supported by the U.S. President’s Emergency Plan for AIDS Relief (PEPFAR). HP+ is implemented by Palladium, in collaboration with Avenir Health, Futures Group Global Outreach, Plan International USA, Population Reference Bureau, RTI International, ThinkWell, and the White Ribbon Alliance for Safe Motherhood.
This publication was produced for review by the U.S. Agency for International Development. It was prepared by HP+. The information provided in this document is not official U.S. Government information and does not necessarily reflect the views or positions of the U.S. Agency for International Development or the U.S. Government.

What Will it Take for Ghana to Achieve 90-90-90? Costing an Enhanced HIV Treatment Cascade
iii
CONTENTS Acknowledgments ...................................................................................................................... v
Acronyms ................................................................................................................................... vi
Executive Summary .................................................................................................................. vii
1. Introduction ........................................................................................................................... 1 Purpose of Analysis .................................................................................................................................. 1
2. Methods ................................................................................................................................ 3
3. Results .................................................................................................................................. 6 Identification ............................................................................................................................................. 6 Linkage .................................................................................................................................................. 15 Treatment .............................................................................................................................................. 18 Retention and Viral Suppression ......................................................................................................... 23
4. Conclusion .......................................................................................................................... 27
References .............................................................................................................................. 30
Annex A. Annual Regimen Unit Costs ...................................................................................... 33
Annex B. Pediatric Clients by Weight Assumptions ................................................................ 33
Annex C. ARV Regimen Assumptions ...................................................................................... 34
Annex D. Laboratory Unit Costs .............................................................................................. 35
Annex E. Facility Visits and Expert Interviews ......................................................................... 35
Annex F. Procurement and Supply Chain Management Cost Assumptions as a Percentage of Commodity Costs ....................................................................................................... 37
Annex G. Progress in Scaling up ART versus All PLHIV in Ghana, 2003–2016 ..................... 37
Annex H. 90-90-90 Roadmap ART Coverage Targets and Progress Toward Second “90” .... 38
Annex I. 2017 ART Unit Cost per Patient by Component ........................................................ 38
LIST OF FIGURES AND TABLES Figure 1: Ghana Cascade Steps and Sub-steps for Costing ..................................................................... 2
Table 1: Types of Costs Analyzed and Data Sources ................................................................................. 3
Figure 2: Gap between Current Scenario and 90-90-90 Scenario ........................................................... 5
Figure 3: HIV National Strategic Plan HTC Targets across Population Groups ........................................ 7
Table 2: Regional Prioritization for HIV Testing .......................................................................................... 7
Figure 4: Testing Commodity Costs ............................................................................................................ 8
Figure 5: Staff and Travel Cost per Positive Patient Found by Mode of Testing Intervention ................. 9
Table 3: Baseline Testing Yields by Mode of Intervention and Diminishing Returns .............................. 9

What Will it Take for Ghana to Achieve 90-90-90? Costing an Enhanced HIV Treatment Cascade
iv
Figure 6: Forecasted Undiagnosed PLHIV ............................................................................................... 10
Table 4: Key Populations Summary ......................................................................................................... 11
Figure 7: Newly Diagnosed by sub-Population Group ............................................................................. 11
Figure 8: Newly Diagnosed by Geographic Region for General Population ........................................... 12
Figure 9: Newly Diagnosed by Mode of Testing Intervention for General Population .......................... 12
Figure 10: Progress Toward 90% of PLHIV Who Know Their Status ...................................................... 14
Table 5: Models of Hope Newly Diagnosed Patient Load ....................................................................... 15
Figure 11: 35% LTFU with 10% of Defaulters Traced and Returned to Care ........................................ 16
Figure 12: Progress toward Second “90” (81% of PLHIV on Treatment) .............................................. 16
Figure 13: 90-90-90 Roadmap ART Enrollment Targets for PLHIV by Subcategory ............................. 18
Figure 14: Treatment Commodity Costs by Category ............................................................................. 19
Table 6: Sixth Edition National Guidelines for Number of Laboratory Tests for HIV and AIDS per Year ........................................................................................................................................... 19
Table 7: Differentiated Care Model for Treatment .................................................................................. 20
Table 8: Differentiated Care Model for Treatment: Labs Algorithm on Tests per Year ........................ 21
Figure 15: US$28 Million Potential Cost Efficiency from MMP and Differentiated Labs Algorithm .... 22
Table 9: Models of Hope Patient Load at Retention Step ...................................................................... 24
Figure 16: 22% LTFU from treatment with 60% of Defaulters Traced and Returned to Care through Models of Hope ............................................................................................................................... 24
Figure 17: Progress toward the Third “90” (73% of PLHIV Achieving Viral Suppression) .................... 25
Figure 18: GFATM and PEPFAR Supply Plan versus Resource Needs .................................................. 28
Table 10: Resource Needs (US$) to Achieve 90-90-90 ......................................................................... 28
Table A1: Adult and Adolescent Regimen Unit Costs ............................................................................. 33
Table A2: Weighted Average Regimen Costs, All Pediatrics ................................................................... 33
Table C1: Percentage Breakdown of Adult Patients by ARV Regimens—First Line ............................... 34
Table C2: Percentage Breakdown of Adult Patients by ARV Regimens—Second Line ......................... 34
Table C3: Percentage Breakdown of Pediatric Patients by ARV Regimens–First Line ......................... 34
Table C4: Percentage Breakdown of Pediatric Patients by ARV Regimens—Second Line ................... 34

What Will it Take for Ghana to Achieve 90-90-90? Costing an Enhanced HIV Treatment Cascade
v
ACKNOWLEDGMENTS The authors gratefully acknowledge the support provided by multiple stakeholders in Ghana who supplied data, comments, and suggestions during the analysis. Specifically, we would like to thank the Director General of the Ghana Health Service; Minister of Health; Dr. Stephen Ayisi Addo, Program Manager of the National AIDS/STI Control Program; Director General of the Ghana AIDS Commission; Jacob Sackey; Dr. Nyonuku Akosua Baddoo; and other major stakeholders involved in Ghana’s national HIV and AIDS response for key inputs into this document. In addition, we thank the U.S. Agency for International Development (USAID) and U.S. President’s Emergency Plan for AIDS Relief (PEPFAR) Ghana.
The authors would also like to acknowledge Suzie Jacinthe of USAID for her review, as well as the following from the USAID- and PEPFAR-funded Health Policy Plus project: Arin Dutta, Sara Bowsky, Julie Chitty, Barbara Rieckhoff, Steven Forsythe, and Andrew Zapfel.
What Will it Take for Ghana to Achieve 90-90-90? Costing an Enhanced HIV Treatment Cascade
vi
ACRONYMS 3TC lamivudine
ABC abacavir
AIDS acquired immunodeficiency syndrome
ART antiretroviral therapy
ARV antiretroviral
ATV atazanavir
AZT zidovudine
CHPS community-based health planning and services
COP Country/Regional Operational Plan
DOTS directly observed treatment, short-course
EFV efavirenz
FTC emtricitabine
GAC Ghana AIDS Commission
GFATM Global Fund to Fight AIDS, Tuberculosis and Malaria
GH¢ Ghanaian Cedi
GHS Ghana Health Service
GOG Government of Ghana
HIV human immunodeficiency virus
HP+ Health Policy Plus
HRH human resources for health
HTC HIV testing and counseling
LPV lopinavir
LTFU lost to follow-up
MMP multi-month prescriptions
NACP National AIDS Control Programme
NVP nevirapine
PEPFAR U.S. President’s Emergency Plan for AIDS Relief
PLHIV people living with HIV
R ritonavir
TB tuberculosis
TDF tenofovir
US$ U.S. dollar
USAID U.S. Agency for International Development
WHO World Health Organization

What Will it Take for Ghana to Achieve 90-90-90? Costing an Enhanced HIV Treatment Cascade
vii
EXECUTIVE SUMMARY With the goal of ending the AIDS epidemic by 2030, the Government of Ghana (GOG) has adopted the global Joint United Nations Programme on HIV/AIDS 90-90-90 targets for its HIV program. These targets aim to achieve by 2020 90% of people living with HIV knowing their HIV status, 90% of people who know their HIV status accessing treatment, and 90% of people receiving treatment achieving viral suppression within 12 months. In July 2016, the Ghana Health Service, National AIDS Control Programme (GHS/NACP) presented its five-year roadmap for achieving the 90-90-90 targets, which included revising the national antiretroviral therapy (ART) guidelines to treat all who are diagnosed with HIV regardless of CD4 count. Given the potential to inform the GOG of its resource needs for the implementation of its 90-90-90 scale-up efforts and to provide an evidence base for resource mobilization efforts, there is an immediate need for high-quality evidence on the costs of scale-up for testing, linkage, treatment, retention in treatment, and viral suppression.
The Health Policy Plus (HP+) project, funded by the U.S. Agency for International Development (USAID) and U.S. President’s Emergency Plan for AIDS Relief (PEPFAR), conducted a public sector costing and policy analysis of the Ghana HIV program clinical cascade to determine the additional costs for scaling up HIV services to meet GOG adult and pediatric targets by 2020. HP+ also explored the possibility for cost efficiencies that can be achieved from differentiated care service delivery, which adapts services for ART to better meet client needs and reduce unnecessary burdens on the health system. Furthermore, HP+ considered costs for interventions to help retain and reinitiate clients that have been lost to follow-up (LTFU) along the clinical cascade. All of these components were not factored into costing for Ghana’s National HIV & AIDS Strategic Plan 2016-2020. Findings from this study can inform resource allocation decisions that will allow the GOG to achieve its ambitious scale-up targets more effectively. Findings may also be used to advocate for financing and to inform future policy and program decisions across the clinical cascade in Ghana.
Identification. To reach the first “90” target—90% of people who know their HIV status accessing treatment—the GOG has adopted a strategy to increase HIV testing and counseling (HTC) significantly, with a plan to test 2.7 million people per year by 2018. Antenatal HIV testing as well as testing of key populations and geographic targeting of four high-prevalence regions will be prioritized. The four priority geographic regions and key populations are a logical place to start HTC scale-up as these populations have the largest number of undiagnosed people living with HIV and will achieve the highest yields early on.
Findings from the HP+ costing analysis indicate that the total resource needs for HTC for commodities, procurement and supply chain management, and non-facility service delivery staff and travel costs are estimated to be US$38 million from 2017–2020. Costs not included in the national strategic plan are US$3.3 million per year for additional staff and travel costs associated with community and mobile outreach for HTC, which is needed to find people living with HIV that do not come forward on their own or are located in hard to reach places. Based on baseline testing yields, and if financing is not an obstacle, implementation of the GOG’s scale up efforts for testing should result in reaching the first “90” by as early as 2020. The results are calculated with the assumption of diminishing yields from testing as more and more people living with HIV are found.
Linkage. The benefits of HIV care and treatment are best realized through timely linkage of clients to care and prompt initiation of treatment. Currently, it is estimated that 35% of newly diagnosed HIV clients are LTFU at this step in the cascade. HIV program experts and clinical

What Will it Take for Ghana to Achieve 90-90-90? Costing an Enhanced HIV Treatment Cascade
viii
staff that were interviewed by HP+ indicated that use of community health workers and peer counselors (through the Models of Hope approach) are the primary interventions to improve linkage to treatment, though the efficacy of this approach has never been formally evaluated. Models of Hope is a program that trains people living with HIV to provide adherence counseling and also track defaulters. Because these peer counselors have gone through the process of starting HIV treatment and understand the challenges faced by newly diagnosed clients, in particular issues related to stigma and discrimination, they are thought to be more effective in reintegrating defaulters. Models of Hope patient experts are able to access patient contact details from case managers, allowing them to first follow up with phone calls to the defaulter and, when necessary, make home visits. HP+ calculated that 203 patient experts/community health workers are needed to track all newly diagnosed clients that are LTFU at this stage of the cascade in 2017. These personnel should be allocated in proportion to the expected distribution of positive HIV test results geographically and by targeted sub-population. Giving Models of Hope staff a monthly stipend of GH¢425 per month would cost a total of about US$900,000 from 2017–2020.
Treatment. With GHS/NACP adopting a “treat all” policy, the number of people eligible for treatment has increased dramatically. HP+ estimated that the total resource requirements for treatment commodities needed to meet the GOG’s ART targets is US$162 million from 2017–2020. This amount includes the standard mark-up used by GHS/NACP for procurement and supply chain management expenses for HIV commodities, equivalent to either 26% or 30.5% of commodity costs, based on Medical Stores Department fees and expense ratios.
As part of this activity, HP+ looked at the impact of potential efficiency gains from applying new ART service delivery models. HP+ assessed site-level ART service delivery costs related to human resources for health (HRH) and shared overhead costs. HP+ also estimated the financial savings that could potentially be achieved from more efficiently delivering treatment services, focusing primarily on multi-month prescription (MMP) antiretroviral refills for stable clients and a differentiated labs algorithm for monitoring and initiation. Implementation of these service delivery models based on World Health Organization recommendations could make Ghana’s ART program less expensive and more sustainable. Findings from the analysis showed that total ART costs could be reduced by US$28 million from 2017–2020 by immediately implementing PEPFAR’s recommended differentiated care model. The main drivers of the theoretical cost savings are a reduced need for HRH and overhead/supplies. These efficiency gains could allow GHS/NACP to redeploy freed-up HRH and facility space/overhead to other health scale-up or commodity procurement efforts.
Retention and Viral Suppression. Proper counseling on adherence prior to initiation of treatment is important for preventing loss to follow-up as clients that are vulnerable to interruptions in care are not likely to achieve viral suppression. Similar to the strategy at the linkage step in the cascade, HIV program experts and clinical staff that were interviewed for the analysis indicated that use of community health workers and peer counselors are the primary interventions to improve retention and adherence. For retention, Models of Hope will track defaulters that miss facility appointments, follow up with phone call reminders, and make house visits, if necessary, to return clients to treatment. Models of Hope also indicated that special adherence counseling interventions such as community support groups are an effective method to increase retention, with interview respondents claiming 90% adherence for clients that participate. Incentives such as food and other gifts, estimated at GH¢40 per client per meeting, may be needed to encourage attendance. A targeted intervention that would focus on clients that are at high risk of being LTFU would cost US$16.1 million from 2017–2020.

What Will it Take for Ghana to Achieve 90-90-90? Costing an Enhanced HIV Treatment Cascade
ix
Conclusion. The total amount of resources needed to achieve 90-90-90 is US$217 million from 2017–2020, excluding facility HRH and overhead costs. From 2017–2018, total funding commitments for the purchase of HIV commodities is projected to be US$46 million with over 96% of financing coming from the Global Fund to Fight AIDS, Tuberculosis and Malaria (GFATM) and PEPFAR. Assuming no other funding commitments, there is a forecasted resource gap for commodities of US$18.6 million in 2017. Finding technical efficiencies in HIV service delivery models can potentially help close the financing gap. The important health benefits that result from rapid scale-up of ART will not be realized if there is not enough money available to implement Ghana’s national HIV strategic plan. Even if donors like PEPFAR and GFATM continue to heavily support Ghana with the purchase of ART commodities and if funding remains constant beyond 2018, which is not guaranteed, funding shortfalls are expected to grow as more clients are initiated on ART. In 2020, the shortfall for HIV commodities is estimated at US$29 million. For a sustainable financing future for ART, the GOG must continue to search for, advocate for, and implement increased domestic resource mobilization for HIV and to implement sustainable financing mechanisms and more efficient HIV service delivery models.

What Will it Take for Ghana to Achieve 90-90-90? Costing an Enhanced HIV Treatment Cascade
1
1. INTRODUCTION With the goal of ending the AIDS epidemic by 2030, the Government of Ghana (GOG) has adopted the global Joint United Nations Programme on HIV/AIDS 90-90-90 targets for its HIV program. These targets aim to achieve by 2020 90% of people living with HIV (PLHIV) knowing their HIV status; 90% of people who know their HIV status accessing treatment; and 90% of people receiving treatment achieving viral suppression within 12 months. In July 2016, the Ghana Health Service, National AIDS Control Programme (GHS/NACP) presented its five-year roadmap for achieving the 90-90-90 targets, which included revising the national antiretroviral therapy (ART) guidelines to treat all clients diagnosed with HIV, regardless of CD4 count, and to increase the number of people tested for HIV from about 1 million in 2016 to 2.7 million per year by 2018 (GHS/NACP, 2016a).
Currently, HIV prevalence is estimated at 1.6% (GHS/NACP, 2017a) or 290,000 PLHIV, 32,000 of whom are younger than 15 years old, with an estimated 15,000 AIDS deaths and 20,000 new infections occurring each year (GHS/NACP, 2017c). The HIV epidemic in Ghana is a low-level generalized epidemic with pockets of high infection among female sex workers and men who have sex with men. Key populations influence epidemic dynamics and play a key role in determining the nature and effectiveness of the response to HIV. At the end of 2016, GHS/NACP reported that 100,665 PLHIV were on treatment, or about 37% of PLHIV (GHS/NACP, 2017a), highlighting that there is significant work ahead to meet the country’s ambitious goals.
Financing for HIV commodities is largely reliant on development partners such as the U.S. President’s Emergency Plan for AIDS Relief (PEPFAR) and the Global Fund to Fight AIDS, Tuberculosis and Malaria (GFATM). PEPFAR has committed US$14 million in supplemental funding for the purchase of antiretrovirals (ARVs) from 2017–2018. This is not intended to be a long-term solution, but rather short-term funding for ARVs due to commodity stock-outs resulting from a warehouse fire at Ghana’s Central Medical Stores in 2015. PEPFAR’s commitment is dependent on GOG contributions and program performance in implementing a “treat all” policy and progress toward achieving the 90-90-90 targets. Meanwhile, the current GFATM funding model, which ends in 2018, is contributing US$30.4 million for the purchase of ARVs, HIV test kits, and opportunistic infection medicines over the same period. The GOG is contributing US$1.6 million for the purchase of test kits which brings the total funding commitment from 2017–2018 to US$46 million.
Purpose of Analysis Given the potential to inform the Ghana AIDS Commission (GAC) and GHS/NACP of resource needs for the implementation of its 90-90-90 scale-up efforts and to provide an evidence base for resource mobilization efforts, there is an immediate need for high-quality evidence on the costs of scale-up for testing, linkage, treatment, retention in treatment, and viral suppression. To successfully scale up ART and achieve high levels of viral suppression will require a detailed understanding of the process by which PLHIV are identified early, linked to care, initiated on treatment quickly, and retained on treatment to achieve viral suppression—a process often referred to as the clinical cascade (see Figure 1). Each step in the cascade consists of several sub-steps. At various steps or sub-steps there are bottlenecks and leakages that cause PLHIV to drop out of the cascade. This analysis considers key investments that can be made to strengthen interventions that will help reduce the number of PLHIV dropping out of the cascade. Interventions that help plug leaks have incremental costs that must be considered in a resource-

What Will it Take for Ghana to Achieve 90-90-90? Costing an Enhanced HIV Treatment Cascade
2
constrained setting, but it will not be possible to achieve the 90-90-90 goals without such investments in these interventions.
Figure 1: Ghana Cascade Steps and Sub-steps for Costing
Identification Linkage Treatment Retention and Viral
Suppression
Provider-Initiated
Testing and Counseling
Early Infant Diagnosis
Community Outreach
Drop-in Centers
Key Populations and Prison
Testing Prevention of
Mother-to-Child Transmission
Adherence Counseling
Referral Systems
Models of Hope
Defaulter Monitoring
Laboratory Monitoring
Opportunistic Infections Treatment
Adherence Counseling
Treatment with ARVs
Transport for Labs
Peer Education
Models of Hope
Community Support Groups
Peer Education
Defaulter Monitoring
Adherence Counseling
Viral Load Monitoring
Sources: GAC, 2016; Health Policy Plus project interviews
Taking a more holistic, evidence-based costing approach through a cascade lens, as opposed to traditional costing exercises that focus primarily on resources needed to cover drugs and supply costs, will help identify some root causes that prevent targets from being achieved and allow the GOG to prioritize financing to address these issues. For example, if early cascade gaps related to identification and linkage are not addressed, it will be more costly to achieve targets over the long term. Findings from this study can inform resource allocation decisions that will allow the GOG to achieve its ambitious scale-up targets more effectively. Findings may also be used to advocate for financing and to inform future policy and program decisions across the clinical cascade in Ghana.
The 2015 World Health Organization (WHO) Consolidated Guidelines on the Use of Antiretroviral Drugs for Treating and Preventing HIV Infection recommends treating all, marking a paradigm shift in the delivery of HIV treatment from focusing on who is eligible and when to start ART to how to provide client-centered and quality care to all PLHIV, while achieving efficiency gains. As a part of this shift, the WHO guidance includes service delivery recommendations based on a “differentiated care framework” as there is broad agreement that a “one size fits all” model of HIV services will not succeed in providing sustainable access to HIV testing and ART initiation, and support retention and viral suppression. This requires adapting HIV services to specific client populations and contexts across the cascade, in ways that both serve the needs of PLHIV better and reduce unnecessary burdens on the health system. Differentiating care also incorporates concepts such as simplification, task shifting, and decentralization or optimizing care. The implications of adapting current models of HIV testing,

What Will it Take for Ghana to Achieve 90-90-90? Costing an Enhanced HIV Treatment Cascade
3
care, and treatment are clear: when a health system adopts a more responsive model of care, tailored to the needs of various groups of PLHIV, it can allocate resources more effectively, provide better access for underserved populations, and deliver care in ways that improve the quality of care and life.
2. METHODS
The Health Policy Plus (HP+) project, funded by the U.S. Agency for International Development (USAID) and PEPFAR, conducted a public sector costing and policy analysis of the Ghana HIV program clinical cascade to determine the additional costs for scaling up diagnosis, linkage, treatment, retention, and viral suppression interventions for an expanded cohort of clients on ART, both adult and pediatric, by 2020. The analysis considered where undiagnosed PLHIV may be and what may need to be done to encourage targeted testing through different modes of intervention and analyzed what can be expected to happen in terms of a decline in testing yields as more and more PLHIV are initiated on ART over time. HP+ also explored the possibility for cost efficiencies that can be achieved from adapting ART services to better meet client needs and reduce unnecessary burden on the health system—referred to as differentiated care service delivery. Furthermore, HP+ considered the costs for interventions that will help retain and reinitiate clients that have been lost to follow-up along the clinical cascade. All of these components were not factored into costing for Ghana’s National HIV & AIDS Strategic Plan 2016-2020.
The analysis in this report presents costs from a financial flow perspective to understand costs of specific inputs that must be paid incrementally and accounted for in the state budget. HP+ focused on the direct cost of drugs, supplies, and direct activities. In addition to commodity costs, HP+ considered some service delivery costs that will be incurred at facility and community levels for human resources and some health system costs related to procurement and supply chain management (see Table 1). The analysis accounted for differences in identification costs, including the higher costs of identification for those that do not typically come forward for testing on their own or are located in remote or hard to reach places. The cost modeling also included a component that looks at the impact of potential cost-efficiency gains from applying more efficient service delivery models for stable clients. These service delivery models derive from technical recommendations found in the PEPFAR Country/Regional Operational Plan (COP) 2016. Lastly, based on responses from key stakeholders within the GHS/NACP and GAC’s care and treatment program, HP+ identified some promising practices from the latest literature that can potentially help address bottlenecks and failures along the treatment cascade going forward. HP+ does not have cost inputs to estimate what it would take for the GOG to incorporate these innovations, but this could be done as part of a future modeling exercise.
Table 1: Types of Costs Analyzed and Data Sources
Cost Category Cost Types
Commodities ARVs, other drugs, laboratory reagents and consumables, test kits, supplies
Human resources for health
Salary cost or stipend based on labor intensity of ART services, including costs associated with travel to provide services
Health system costsProcurement and supply chain management costs, shared overhead costs for facility visits, costs to change policy guidelines including training

What Will it Take for Ghana to Achieve 90-90-90? Costing an Enhanced HIV Treatment Cascade
4
After first conducting a desk review of published reports and studies on the HIV landscape in Ghana, HP+ made an initial trip to Ghana in November 2016 to collect secondary data from existing programmatic sources. Major providers of quantitative data were GHS/NACP, GAC, GHS, and other HIV implementers in Ghana. Data collected included:
• National ART targets • Existing quantification assumptions and prices for ARVs, laboratory reagents and
consumables, test kits, and other supplies • ARV regimen assumptions • Failure rates and retest rate assumptions • HIV testing yields by mode of testing intervention and sub-population groups • Human resources for health (HRH) salary and stipend costs and level of engagement for
ART services • Supply chain loading assumptions • HIV epidemiological profile, including national and sub-national prevalence and
incidence rates • HIV population size estimates by sub-population groups and by geography • Projections for PLHIV (National Spectrum, 2016) • HIV funding commitments by source • HIV national strategic plan unit costs
Unit costs for adult and pediatric ARV regimens (first- and second-line) were calculated from GHS/NACP’s ARV reference pricing list and the ARV quantification exercise done in July 2016 by GHS/NACP (see Annex A and B). Costs are in line with other countries supported by PEPFAR and GFATM for ARV procurement. The current and projected percentage breakdowns of clients by ARV regimen were also derived from this quantification (see Annex C). Similarly, weighted average unit costs accounting for price variances for different test alternatives, for laboratory costs differentiated by new versus established clients—inclusive of reagents, consumables, shared lab supplies, quality control, and wastage—were taken from a lab quantification exercise conducted by the GHS/NACP concurrent with the ARV quantification (see Annex D). Assumptions on failure rates of first-line treatment and retest rates were confirmed with GHS/NACP to determine the number of clients on second-line regimens and to properly account for the number of tests required. Laboratory assumptions for monitoring and initiation are based on GHS/NACP’s current 2016 Guidelines for Antiretroviral Therapy in Ghana, sixth edition.
HP+ made several visits to health facilities of varying sizes, from regional hospitals to a small community-based health planning and services (CHPS) compound, the most decentralized form of primary healthcare in Ghana. The project also performed structured interviews with program experts to see how HIV services were organized in Ghana and understand where leakages were occurring along the clinical cascade (see Annex E for facilities visited and experts interviewed). Qualitative information that was collected from these interviews was used to guide the costing of interventions that could help plug leakages along the cascade. As a baseline, HP+ estimated losses currently occurring at each step in cascade (see Figure 2). The 46% loss at the identification step was estimated by summing the actual number of people on ART at the end of 2015 (GHS/NACP, 2016b) with total new clients that were diagnosed positive in 2016 (GHS/NACP, 2017a). The 35% loss at the initiation step was estimated based on the actual number of people on ART at the end of 2016 (GHS/NACP, 2017a) compared to the 2016 estimate for PLHIV that know their status. The 22% loss at the retention step was sourced from a GHS study on ART Cohort Survival (GHS, 2016a). Lastly, the 16% loss at the viral suppression
What Will it Take for Ghana to Achieve 90-90-90? Costing an Enhanced HIV Treatment Cascade
5
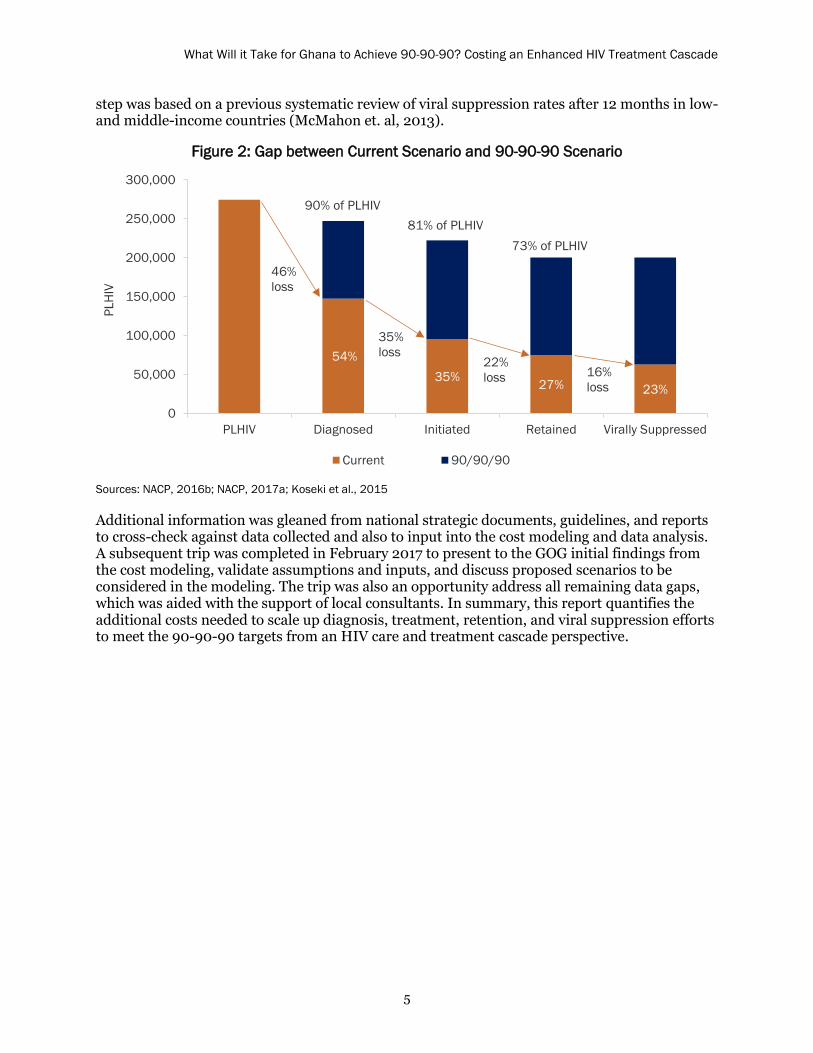
step was based on a previous systematic review of viral suppression rates after 12 months in low-and middle-income countries (McMahon et. al, 2013).
Figure 2: Gap between Current Scenario and 90-90-90 Scenario
300,000
250,00090% of PLHIV
81% of PLHIV
200,00073% of PLHIV
46%
PLHI
V
150,000loss
100,000 35%
50,000
loss54% 22% 16% 35% loss 27% loss 23%
0PLHIV Diagnosed Initiated Retained Virally Suppressed
Current 90/90/90
Sources: NACP, 2016b; NACP, 2017a; Koseki et al., 2015
Additional information was gleaned from national strategic documents, guidelines, and reports to cross-check against data collected and also to input into the cost modeling and data analysis. A subsequent trip was completed in February 2017 to present to the GOG initial findings from the cost modeling, validate assumptions and inputs, and discuss proposed scenarios to be considered in the modeling. The trip was also an opportunity address all remaining data gaps, which was aided with the support of local consultants. In summary, this report quantifies the additional costs needed to scale up diagnosis, treatment, retention, and viral suppression efforts to meet the 90-90-90 targets from an HIV care and treatment cascade perspective.

What Will it Take for Ghana to Achieve 90-90-90? Costing an Enhanced HIV Treatment Cascade
6
3. RESULTS
The key results and takeaways from the study are:
The National HIV & AIDS Strategic Plan 2016-2020 HIV testing strategy does notconsider testing mix and cost differences between modes of testing interventions. TheGOG does not have a costed operational plan, which could better inform their approach.
Diminishing yields from testing as more and more PLHIV are initiated on treatment willmake finding the last 10%–20% of untested persons difficult and expensive.
As more people start HIV treatment, it is important to maximize the quality of care andensure efficient health services.
90-90-90 targets will be difficult to achieve without addressing key bottlenecks at eachstep of the cascade.
There is a lack of scale-up of viral load education, access to viral load testing, and datacapturing and utilization in the country.
Pediatric and adolescent HIV identification, treatment, and viral load suppressionservice delivery remain a neglected area in need of attention among both the generalpopulation and children of female sex workers.
There are limited differentiated care models identified within guidelines or programservice delivery and there is a lack of customized care and enhanced service deliverymodels for key populations or the general population.
Identification
Current identification strategy, targets, and costs
To reach the first “90” target, the GOG has adopted a strategy to increase HIV testing and counseling (HTC) significantly, with a plan to test 2.7 million people per year by 2018 (see Figure 3). Antenatal HIV testing as well as testing of key populations and geographic targeting of four high prevalence regions (Ashanti, Accra, Eastern, and Western) were prioritized in 2016. The four priority geographic regions and key populations were a logical place to start HTC scale-up as these populations have the largest number of undiagnosed PLHIV (see Table 2) and will achieve the highest yields early on. HTC coverage of targets in 2016 was only 40% (GHS/NACP, 2017b). Two significant reasons for low testing include shortages of test kits and human resources for testing, so it is important to recognize that implementation of such an ambitious volume of tests will be a challenge. This raises the importance of stratification of identified populations and adapting HIV testing to the needs of the population, including task sharing and use of lay counselors to support testing, linkage, and retention in the clinical cascade. HP+ is conducting another activity on this topic as part of its Ghana portfolio.

What Will it Take for Ghana to Achieve 90-90-90? Costing an Enhanced HIV Treatment Cascade
7
Figure 3: HIV National Strategic Plan HTC Targets across Population Groups
1,547,040 1,540,972 1,459,379 1,433,752
1,045,333 1,069,078 1,150,671 1,176,298
0
500,000
1,000,000
1,500,000
2,000,000
2,500,000
3,000,000
2017 2018 2019 2020
Num
ber o
f Tes
ts
Prisoners
Female Sex Workers
Men Who Have Sex withMenPrevention of Mother-to-Child TransmissionGeneral Population
Sources: GAC, 2016; GHS/NACP, 2016a
Table 2: Regional Prioritization for HIV Testing
Region 2017
Testing Target
HIV Prevalence PLHIV On
Treatment
In Clinical Care but
not on ART Undiagnosed
Ashanti 393,362 2.7% 51,157 17,477 5,030 28,650
Accra 552,499 3.2% 87,790 22,563 3,274 61,953
Eastern 403,524 2.7% 40,087 13,767 4,901 21,419
Western 405,798 2.0% 34,683 6,388 2,127 26,168
Brong Ahafo 331,774 1.7% 1,258 12,919 3,623 4,715
Volta 196,538 1.7% 2,593 7,653 2,146 2,793
Central 123,398 1.8% 7,906 4,805 1,348 1,754
Northern 86,211 1.2% 5,524 3,357 942 1,225
Upper West 69,031 1.3% 4,423 2,688 754 981
Upper East 92,914 1.5% 5,953 3,618 1,015 1,321
Sources: GHS/NACP, 2016a; GHS/NACP, 2017a; HP+ interpolation
Commodity costs for HIV testing and counseling
HP+ calculated HTC commodity costs based on GHS/NACP’s rapid diagnostic test quantification exercise completed in July 2016. The quantification includes a confirmatory test for all people who are forecasted to test positive based on the GOG’s testing protocol. Total HTC commodity costs are expected to be about US$6 million per year (see Figure 4). This includes costs for procurement and supply chain management, assumed to be 26% of commodity costs (see Annex F).

What Will it Take for Ghana to Achieve 90-90-90? Costing an Enhanced HIV Treatment Cascade
8
Figure 4: Testing Commodity Costs
Source: GHS/NACP, 2016c
Service delivery costs for HTC
The GOG’s HTC strategy does not consider varying service delivery costs for different modes of testing interventions. To fill this gap, HP+ sourced salary information and labor intensity to determine full-time equivalents needed for service delivery of HTC to reach national HIV strategic plan targets and to calculate staff unit costs per test, estimated to be US$3 at a static testing site.
According to WHO, HIV epidemics with pockets of high infection among key populations require both a clinic-based and community-based HIV testing approach (WHO, 2015). However, HTC costs are expected to be two times more expensive for community outreach testing and four times as expensive for mobile outreach testing (Bautista-Arredondo et al., 2016; Menzies et al., 2009; Clinton Health Access Initiative, 2014). The additional costs are attributed to increased staff travel time and transport costs necessary to reach those most vulnerable.
Although facility-based, provider-initiated, and community-based testing have very similar yields, community-based testing is less cost efficient. However, a more proactive testing approach such as community-based models will be needed to find PLHIV in key populations and other sub-population groups like adolescents that typically do not come forward for testing on their own. Long distance mobile outreach testing, which is even more expensive and also has relatively low yields, is by far the least cost-effective mode of testing. However, once most PLHIV have been found in high prevalence areas, it will be increasingly necessary to use community outreach and long distance mobile outreach to find the last 10%–20% of PLHIV that do not come forward on their own for testing or are located in remote and hard to reach places. Testing at directly observed treatment, short-course (DOTS) sites is the most cost-effective method given the high yields from testing tuberculosis clients. Overall, with diminishing returns from testing, the cost per patient found increases significantly for all modes of intervention, but most noticeably for mobile outreach testing (see Figure 5). After the first “90” target has been met, a detailed epidemiological mapping exercise and corresponding mode of transmission study will be needed to make testing effective enough to find the last remaining PLHIV.
3.97 4.05 4.14 4.16
0.72 0.73 0.71 0.70
1.22 1.24 1.26 1.26
0.00
1.00
2.00
3.00
4.00
5.00
6.00
7.00
2017 2018 2019 2020
US$,
Mill
ions
Procurement and SupplyChain Management
Gen Screen/Elisa
Ora Quick
First Response Test Kit

What Will it Take for Ghana to Achieve 90-90-90? Costing an Enhanced HIV Treatment Cascade
9
Figure 5: Staff and Travel Cost per Positive Patient Found by Mode of Testing Intervention
Sources: HP+ calculation and full-time equivalent estimation sourced from interviews
Declining testing yields over time
The yield from HTC is defined as the number of people receiving positive HIV test results divided by the total number of people tested, expressed as a percentage. Assumptions on testing yields used in the cost modeling were based on a range of sources from GHS/NACP and GAC (GAC, 2014a; GAC, 2016; GHS/NACP, 2017b; GHS/NACP, 2016c). Additional data points on yields from community outreach events were sourced from facility workers, GHS, and interviews conducted by HP+ consultants. These yields were cross-checked against reported PEPFAR yields by mode of intervention (Birx, 2017) to calculate a baseline yield for each targeted population (see Table 3).
Table 3: Baseline Testing Yields by Mode of Intervention and Diminishing Returns
Yields Baseline 2017 2018 2019 2020
Men who have sex with men 11.5% 11.5% 5.3% 2.4% 1.1%
Female sex workers 6.2% 6.2% 2.9% 1.3% 0.6%
Prisoners 1.6% 1.6% 0.7% 0.3% 0.2%
People who inject drugs 4.7% 4.7% 2.1% 1.0% 0.5%
Prevention of mother-to child transmission 2.0% 2.0% 0.9% 0.4% 0.2%
Early infant diagnosis 9.7% 9.7% 4.4% 2.0% 0.9%
Provider-initiated testing and counseling 4.8% 4.8% 2.2% 1.0% 0.5%
Community 4.7% 4.7% 2.1% 1.0% 0.5%
Mobile outreach 1.6% 1.6% 0.7% 0.3% 0.2%
Tuberculosis/HIV 21.7% 21.7% 10.0% 4.6% 2.1%
Diminishing returns — — 46% 21% 10%
Source: HP+ calculation based on data from Barker et al., 2017; Birx, 2017; GAC, 2014a; GAC, 2016; GHS/NACP, 2017b; GHS/NACP, 2016c; and HP+ interviews.
$62 $135 $294 $640 $124 $270 $587
$1,275 $750
$1,630
$3,542
$7,697
$14 $30 $65 $141 $0
$2,000
$4,000
$6,000
$8,000
$10,000
2017 2018 2019 2020
US$
Provider-initiated/Drop-in Community Outreach Mobile Outreach Tuberculosis/HIV
What Will it Take for Ghana to Achieve 90-90-90? Costing an Enhanced HIV Treatment Cascade
10
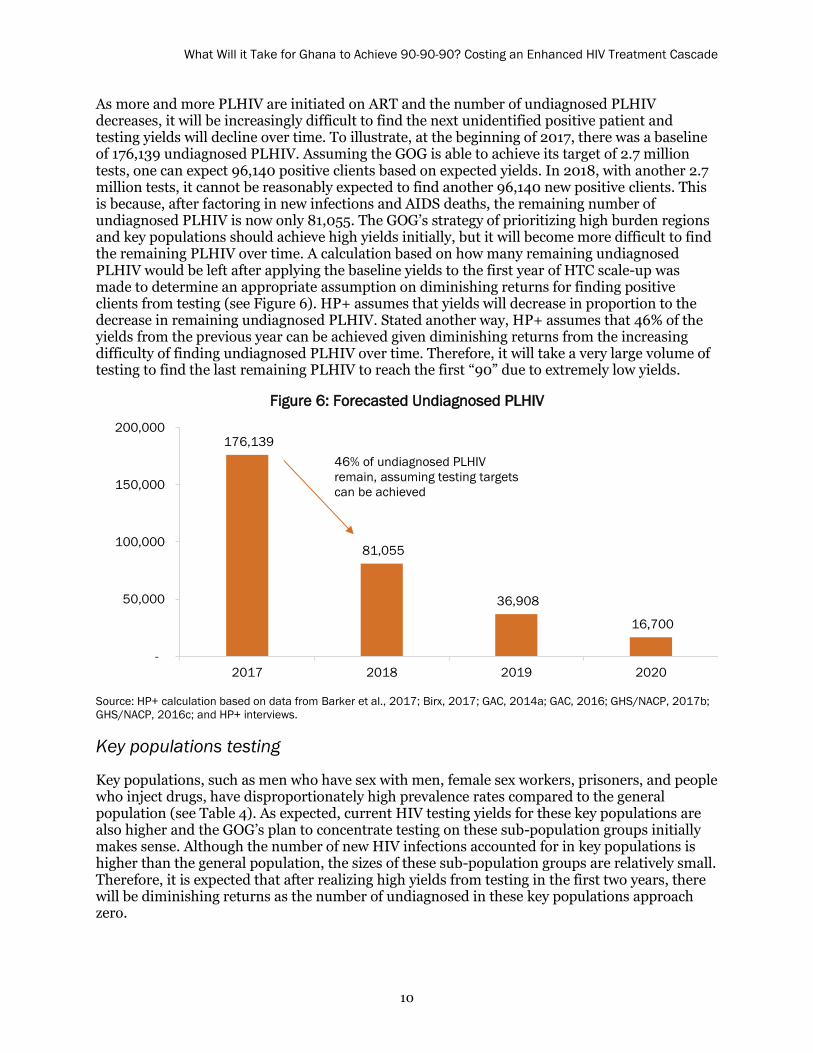
As more and more PLHIV are initiated on ART and the number of undiagnosed PLHIV decreases, it will be increasingly difficult to find the next unidentified positive patient and testing yields will decline over time. To illustrate, at the beginning of 2017, there was a baseline of 176,139 undiagnosed PLHIV. Assuming the GOG is able to achieve its target of 2.7 million tests, one can expect 96,140 positive clients based on expected yields. In 2018, with another 2.7 million tests, it cannot be reasonably expected to find another 96,140 new positive clients. This is because, after factoring in new infections and AIDS deaths, the remaining number of undiagnosed PLHIV is now only 81,055. The GOG’s strategy of prioritizing high burden regions and key populations should achieve high yields initially, but it will become more difficult to find the remaining PLHIV over time. A calculation based on how many remaining undiagnosed PLHIV would be left after applying the baseline yields to the first year of HTC scale-up was made to determine an appropriate assumption on diminishing returns for finding positive clients from testing (see Figure 6). HP+ assumes that yields will decrease in proportion to the decrease in remaining undiagnosed PLHIV. Stated another way, HP+ assumes that 46% of the yields from the previous year can be achieved given diminishing returns from the increasing difficulty of finding undiagnosed PLHIV over time. Therefore, it will take a very large volume of testing to find the last remaining PLHIV to reach the first “90” due to extremely low yields.
Figure 6: Forecasted Undiagnosed PLHIV
176,139
81,055
36,908
16,700
-
50,000
100,000
150,000
200,000
2017 2018 2019 2020
46% of undiagnosed PLHIV remain, assuming testing targets can be achieved
Source: HP+ calculation based on data from Barker et al., 2017; Birx, 2017; GAC, 2014a; GAC, 2016; GHS/NACP, 2017b; GHS/NACP, 2016c; and HP+ interviews.
Key populations testing
Key populations, such as men who have sex with men, female sex workers, prisoners, and people who inject drugs, have disproportionately high prevalence rates compared to the general population (see Table 4). As expected, current HIV testing yields for these key populations are also higher and the GOG’s plan to concentrate testing on these sub-population groups initially makes sense. Although the number of new HIV infections accounted for in key populations is higher than the general population, the sizes of these sub-population groups are relatively small. Therefore, it is expected that after realizing high yields from testing in the first two years, there will be diminishing returns as the number of undiagnosed in these key populations approach zero.

What Will it Take for Ghana to Achieve 90-90-90? Costing an Enhanced HIV Treatment Cascade
11
Table 4: Key Populations Summary
Key population group Size Prevalence ART coverage On ART Undiagnosed
% of all new infections from group
Men who have sex with men 30,579 17.5% 33.9% 1,815 3,536 3.6%
Female sex workers 51,937 11.1% 36.7% 2,114 3,651 18.4%
Prisoners 13,714 2.3% 63.5% 200 115 0.8%
People who inject drugs 9,598 16.9% 4.0% 65 1,559 1.0%
Sources: GAC, 2015; Koseki et al., 2015
This testing strategy assumes that the GOG knows where key populations are located. The location of female sex workers are known to be highly concentrated in the Accra and Eastern regions, and the location of men who have sex with men are known to be most highly concentrated in the Accra and Ashanti regions. The locations of prisoners are known, but there are rights-based issues for consent to testing in confined populations and constraints related to voluntary testing that must be acknowledged. There is limited data available on where people who inject drugs are located, but a study conducted in 2014 showed a high concentration of people who inject drugs in Kumasi in the Ashanti region (Messersmith et al., 2014).
In summary, targeting key populations is a good strategy, however, it is important to recognize that after achieving high yields initially, testing will be less effective in terms of finding undiagnosed PLHIV over time. Key population testing will scale-up to peak testing volumes by 2018 based on national strategic plan targets and will account for nearly 6% of all newly diagnosed PLHIV. This percentage drops to below 2% by 2020 (see Figure 7). Therefore, current testing volumes for key populations as outlined in the national strategic plan will not be required for key populations in subsequent years. Incidence rates will continue to decline over time with the scale-up of ART (GHS/NACP, 2016b). The net new PLHIV from key population groups is expected to be only 30–35 people by 2020. Using forecasted key population yields for 2020, it would take 5,658 tests to find people who newly acquire HIV.
Figure 7: Newly Diagnosed by sub-Population Group
Sources: GHS/NACP, 2016c; GHS/NACP, 2017a; GHS/NACP, 2016a; Birx, 2017; HP+ calculation
0
20,000
40,000
60,000
80,000
100,000
2017 2018 2019 2020
Early Infant Diagnosis
Prevention of Mother-to-Child Transmission
Key Populations
General Population

What Will it Take for Ghana to Achieve 90-90-90? Costing an Enhanced HIV Treatment Cascade
12
Regional prioritization for general population testing
According to GHS/NACP, 88% of care and treatment clients and 73% of ART sites will be located in four priority regions: Ashanti, Accra, Eastern, and Western. PEPFAR has also categorized Brong Ahafo as a fifth priority region. The GOG will concentrate its efforts to identify PLHIV in the general population significantly in the four priority regions. The GOG has indicated in the national strategic plan that it will implement testing at more service delivery points by scaling up community-based testing and outreach service delivery at special community events, festivals, and religious events. This will be in addition to scale-up of testing at fixed health facilities that include non-HIV clinics, tuberculosis clinics (DOTS), and drop-in clinics.
In the absence of an HTC operational plan, assumptions on the test-share percentage by mode of intervention were made based on experiences seen in other countries (50% provider-initiated/drop-in clinic, 39% community based, 10.5% mobile outreach, and 0.5% tuberculosis/HIV-DOTS). Testing of tuberculosis clients has shown particularly high yields, however, the tuberculosis population in Ghana is estimated at around 15,000 with prevalence estimated to be 14.8% (GAC, 2015). HP+ calculated yields by region and by mode of testing intervention, again accounting for diminishing returns as more and more PLHIV know their status (see Figures 8 and 9).
Figure 8: Newly Diagnosed by Geographic Region for General Population
Sources: GHS/NACP, 2016a; GHS/NACP, 2017a; HP+ calculation
Figure 9: Newly Diagnosed by Mode of Testing Intervention for General Population
Sources: GHS/NACP, 2016a; GHS/NACP, 2017a; HP+ calculation
-
10,000
20,000
30,000
40,000
50,000
60,000
70,000
Tuberculosis/HIV
Mobile Outreach
Community Outreach
Provider-initiated/Drop-in
2017 2018 2019 2020
-
10,000
20,000
30,000
40,000
50,000
60,000
70,000
2017 2018 2019 2020
All Other Regions
Brong Ahafo
Western
Eastern
Accra
Ashanti

What Will it Take for Ghana to Achieve 90-90-90? Costing an Enhanced HIV Treatment Cascade
13
Antenatal testing: prevention of mother-to-child transmission and early infant diagnosis
The GOG has a current target of testing 95% of all pregnant women for HIV and increasing this coverage to 100% by 2019. There is estimated to be about 1.2 million pregnancies per year in Ghana, which will account for a large percentage (39%–44%) of all HIV tests per year. Of the pregnant women that test positive, the GOG has a current target of putting 95% of these women on ARVs and increasing coverage to 100% by 2019. All infants born to HIV-positive women will receive two early infant diagnosis tests with baseline yields at 9.7%.
In 2016, yields from antenatal care testing were highest in Volta, Western, and Northern regions (GHS/NACP, 2017a), which does not correspond to overall prevalence rates regionally. Overall, there was not much variation in yields between regions. Testing yields from prevention of mother-to-child transmission in the general population are relatively low (2% or less), which from a cost-efficiency lens may not be considered a priority. However, from a public health focus, understanding who this 2% represents warrants attention. If this 2% is comprised of high concentrations of female sex workers and their children, this would elevate the need for greater attention to this population with a response that is tailored to their unique situation.
Summary of HTC costs, progress towards first “90” target, and possible scenarios to make identification more cost efficient
The total resource needs for HTC commodities, procurement, supply chain management, and non-facility service delivery staff and travel costs are estimated to be US$9–$10 million per year or US$38 million from 2017–2020. Costs not included in the national strategic plan are US$3.3 million per year for additional staff and travel costs associated with community and mobile outreach HTC, needed to find PLHIV that do not come forward on their own or are located in hard to reach places. If resources are scarce, focusing antenatal HIV testing, which is low-yielding, on high-burden geographies to reduce expenses makes sense from a cost-effectiveness standpoint, as 40% of HTC commodity costs and 30% of HTC service delivery costs are currently spent on antenatal care testing. However, from a public health standpoint, access and use of antenatal care HTC services is critical. Key population testing should also be reduced over time as the number of undiagnosed PLHIV in these sub-populations approaches zero. Long-distance mobile outreach testing that attempts to find PLHIV in remote and hard to reach places should be the first mode of testing intervention to be reduced or discontinued if financing is constrained as it is by far the least cost-efficient method as it is both very expensive and does not result in high yields.
Based on baseline testing yields and if financing is not an obstacle, implementation of the GOG’s regional and key population-focused scale-up efforts for testing should result in reaching the first “90” by as early as 2020 (see Figure 10). The results were calculated with the assumption of diminishing yields as more and more PHLIV are found. Results also assume that the GOG is able to meet its testing volume targets. This may not be realistic given that in 2016, 1.1 million HIV test were conducted, which would require a 141% increase in test volume to meet 2017 targets. In addition, more expensive, community-based and mobile outreach will be needed to find the last 10%–20% of the remaining PLHIV to meet the first “90.”

What Will it Take for Ghana to Achieve 90-90-90? Costing an Enhanced HIV Treatment Cascade
14
Figure 10: Progress Toward 90% of PLHIV Who Know Their Status
Sources: GHS/NACP, 2016a; HP+ calculation
Limitations to achieving testing targets and suggestions for improvement
Sustaining and further improving current testing yields will require increasing political will and addressing important structural and logistic barriers. First, to foster an enabling environment for testing, concerted efforts will be needed to reduce stigma and discrimination, particularly among key populations. The enactment of the Ghana AIDS Commission Act offers a legal remedy for stigma and discrimination against PLHIV by recognizing them as a protected class (GOG, 2016). However, many social barriers remain and efforts to reduce them are limited. It is important to shift the current climate so that people most at risk for HIV self-identify as being at risk and voluntarily seek HIV testing services. HP+ is conducting analysis on this topic as part of another activity.
It will also be important to address logistical bottlenecks, such as insufficient stock of screening and confirmatory test kits and lack of a sufficient healthcare workforce to meet current needs (GHS/NACP, 2016a), which HP+ is analyzing as part of a legal environment assessment. As the roll-out of “test and start” ramps up, some needed improvements might include: strengthening systems for facility-level planning and national-level quantification and forecasting; securing test kits from different sources if one is not able to provide enough; improving coordination between the Ministry of Health and Ministry of Finance to ensure the release of promised funds; and ensuring sufficient distribution of test kits to both public and private facilities (GOG, 2016). In addition, operationalizing a national task-sharing policy and accelerating HTC delivery training for lay counselors could significantly improve service gaps.
55% 69%
86% 94%
0
50,000
100,000
150,000
200,000
250,000
300,000
2017 2018 2019 2020
PLHIV
Diagnosed
90/90/90

What Will it Take for Ghana to Achieve 90-90-90? Costing an Enhanced HIV Treatment Cascade
15
Linkage The benefits of HIV care and treatment are best realized through timely linkage of clients to care and prompt initiation of treatment, which leads to reduced morbidity and mortality and decreased risk of onward transmission. The optimal approach is to customize care for those who are more likely to be lost to care, such as key populations. These groups warrant more linkage support (WHO, 2015). Currently, it is estimated that 35% of newly diagnosed HIV clients are lost to follow-up (LTFU) at this step of the cascade and never initiate treatment. Supply costs related to linkage include registration folders, logbooks, registries, appointment books, etc. These supplies, estimated to cost from US$250,000 to $356,000 per year or US$1.2 million from 2017–2020, allow case managers to keep records of newly initiated clients including contact information and addresses. These records are then passed from the testing site to the referral facility, whether it be an antenatal care clinic for prevention of mother-to-child transmission or a care and treatment clinic for others.
HIV program experts from GAC, GHS/NACP, and clinical staff indicated that the use of community health workers and peer counselors through the Models of Hope approach (see Box 1) are the primary interventions to improve linkage to treatment. This strategy is also outlined in the national strategic plan. Models of Hope counselors that were interviewed by HP+ indicated that they typically track 70 defaulters per month, 20% of which are newly diagnosed clients (see Table 5). On average, one Model of Hope counselor working full time will be able to trace and return to care 10% of newly diagnosed positive clients that have been LTFU over the course of the month and help them get initiated, or 1.4 new clients per month (see Figure 11). It is important to note that the Models of Hope intervention has never been formally evaluated to appropriately assess its contribution to PLHIV linkage to care and adherence to treatment and there is no uniform monitoring and standardization of what Models of Hope does across facilities. In the absence of this research, HP+ relied on responses from interviews.
Table 5: Models of Hope Newly Diagnosed Patient Load
Models of Hope Defaulters Yield Retained
Patients per week 17.5 — —
Patients per month 70.0 50% 35.0
New patients 14.0 (20%) 10% 1.4
Source: Models of Hope interview panels
Box 1. Models of Hope Approach
Models of Hope counselors are PLHIV that provide adherence counseling and track defaulters. Because Models of Hope counselors have gone through the process of starting HIV treatment and understand the challenges faced by newly diagnosed clients (such as stigma and discrimination) they are more effective in reintegrating defaulters, having faced these challenges themselves. This was the opinion of facility workers interviewed and Models of Hope personnel themselves. Models of Hope patient experts are able to access patient contact details from case managers, allowing them to first follow up with phone calls to the defaulter and, when necessary, make home visits. Models of Hope counselors/community health workers are typically paid a monthly stipend of GH¢100–200 per month (about US$35) to cover transport costs. This cost is currently being covered by GAC (for 70 people) and GFATM (for 79 people).

What Will it Take for Ghana to Achieve 90-90-90? Costing an Enhanced HIV Treatment Cascade
16
Figure 11: 35% LTFU with 10% of Defaulters Traced and Returned to Care
0
20,000
40,000
60,000
80,000
100,000
2017 2018 2019 2020Newly Diagnosed LTFU Returned to Care Newly Diagnosed and Initiated
Source: HP+ interviews and calculations
Assuming national strategic plan testing volume targets can be achieved, along with the testing yields by mode of intervention outlined in the previous section, with LTFU rates of 35% from identification to treatment initiation, and 10% of defaulters traced and returned to care by peer counselors/community health workers, the GOG can achieve the second “90”—90% of people who know their HIV status accessing treatment, or 81% of PLHIV on treatment—by 2019 (see Figure 12). HP+ calculated that 203 Models of Hope counselors/community health workers are needed to track all newly diagnosed clients that are LTFU at this stage of the cascade in 2017. These personnel should be allocated in proportion to the expected distribution of positive HIV test results geographically and by targeted sub-population. Given their average stipend of GH¢150 per month, this cost amounts to less than US$100,000 annually, or about US$23 per defaulted patient that is linked back to treatment initiation. Yet Models of Hope counselors often have to pay out-of-pocket beyond what is covered by the stipend for airtime and travel expenses for home visits. Models of Hope staff that were interviewed indicated that GH¢150 per month was typically not enough and that a more appropriate stipend would be GH¢350–500 per month to cover all their expenses. If resources were not an object, paying an average of GH¢425 per month would increase the annual cost to about US$225,000 per year or US$900,000 from 2017–2020.
Supporting 203 Models of Hope personnel at a stipend of GH¢425 per
month would cost US$225,000 per year.
Figure 12: Progress toward Second “90” (81% of PLHIV on Treatment)
Sources: GHS/NACP, 2016a; HP+ calculation
44% 64%
83% 92%
-
50,000
100,000
150,000
200,000
250,000
300,000
2017 2018 2019 2020
PLHIV
Initiated
90/90/90
What Will it Take for Ghana to Achieve 90-90-90? Costing an Enhanced HIV Treatment Cascade
17
Limitations to achieving linkage targets and suggestions for improvement
Although the test and start approach will reduce some aspects of “linkage” and persistent barriers to pre-ART care, to achieve the second “90,” there will still be a need to address key health system and patient barriers to ensure that those who test positive do not delay initiation or become lost altogether. In addition, significant efforts will be needed to re-engage those who had previously tested but were not eligible for treatment.
Differentiated and customized client-focused care, improved management of health facilities, and better utilization of site data are all means to improve reaching PLHIV and addressing loss to follow-up. Currently, programs are not adapted in a way that acknowledge specific client needs, especially for key populations, so that care can be tailored with regards to service frequency, location, intensity, and cadre. Each component of differentiated care represents a flexible lever for adjusting care to serve a specific patient population in a given geographic area with different intensities of services delivered within a single location or between locations, as determined by the needs and preferences of the clients. Within differentiated care, the distribution of clients across care populations is dynamic due to the need for periodic referral to more or less intensive care based on needs, for instance, offering linkage counselors and SMS (text) reminders for those in need of more support or starting those who are stable on multi-drug scripting with less frequent clinic monitoring.
To achieve the second “90,” re-engaging already diagnosed clients will be critical. However, known challenges with tracing clients due to high mobility or no longer working mobile numbers, are likely to make this difficult, particularly for those who did not test recently. Community or media campaigns could help raise public awareness about the new treatment guidelines and alert those who already know that they are HIV positive to their eligibility for treatment. Attention and planning will be needed, however, to mitigate a client load that exceeds what facilities can handle. Re-engaging clients may also have other resource implications, for example, re-testing may be needed for some clients who might have tested in a community setting, misplaced their results, or need confirmation.
Patient challenges also exist when it comes to transition from diagnosis to care and treatment. Namely, as is common in other sub-Saharan African settings, clients report lacking time as well as money for transport and required lab tests and to attend all sessions of ART adherence counseling that are required prior to treatment initiation. Additionally, clients may face psychological challenges with acceptance and engaging in care after receiving a positive diagnosis. One critical approach to the “treat all” strategy is offering same-day ART initiation for clients who exhibit readiness. Evidence shows that this approach gives clients a sense of hope and optimism, can effectively reduce losses between diagnosis and treatment for a substantial proportion of clients, and can improve retention and viral suppression (Rosen, 2016; Koenig, 2016). Improved patient education and counseling may be needed for those who are clinically ready for treatment but who express hesitation, disinterest, or fear.
Other potentially promising practices identified by a 2014 systematic review of interventions to improve linkage and retention in low- and middle-income countries include the provision of incentives such as nutritional support in the form of a food package, home-based ART initiation and management, and peer support (Govindasamy, 2014). In addition, making adjustments to scheduling to reduce waiting times and “fast tracking” clients through counseling and assessment could improve retention at this stage (Govindasamy, 2014). Provision of a transport allowance or voucher has worked in other settings and could potentially facilitate the transition to ART for those that face stigma and discrimination or gender issues, particularly for those who

What Will it Take for Ghana to Achieve 90-90-90? Costing an Enhanced HIV Treatment Cascade
18
test in community settings or in facilities different than where they plan to seek treatment (Nsigaye, 2009).
Treatment The revised ART targets based on GHS/NACP’s 90-90-90 roadmap (see Figure 13) were entered into the 2016 Spectrum AIM model for Ghana, which then recalculated HIV and AIDS population outputs. These outputs included changes in vertical transmission due to increased ART coverage among pregnant HIV-positive women in Ghana. Over the five-year period from 2011 to 2015, GHS/NACP managed to scale up the number of people on ART from 59,007 to 89,113, or a 51% increase (GHS/NACP, 2016b) (see Annex G). However, achieving the 2020 target of 217,530 people on ART would require a 116% increase from the 100,665 people on ART1 at the end of 2016 (see Annex H for progress on scaling up ART in Ghana). Desired ART scale-up objectives will be heavily linked to achievement of identification targets. If PLHIV are not identified, it is not possible to put them on treatment, which will make the goal of reaching the second “90” nearly impossible without the prerequisite of reaching the first “90.”
Figure 13: 90-90-90 Roadmap ART Enrollment Targets for PLHIV by Subcategory
98,912 114,886 137,468
159,092 181,945
12,392 17,875
18,281 20,712
21,173
6,0087,686
9,51911,464
14,411
-
50,000
100,000
150,000
200,000
250,000
2016 2017 2018 2019 2020Adults on ART Prevention of Mother-to-Child Transmission Children on ART
Source: GHS/NACP, 2016a
Total resource requirements to meet the GOG’s ART targets are estimated to reach US$25.3 million in 2017 for ARVs, laboratory supplies, and opportunistic infection commodities (see Figure 14 for cost breakdown by category). This figure rises to an estimated US$38.0 million by 2020. Assumptions for how these costs were calculated are described in the methods section of the report. It is significant to note that under the test and start policy, CD4 tests are no longer required for initiation of ART (see Table 6). However, it should be noted that viral load scale-up has been slow so CD4 tests are still being used in practice.
1 This figure, provided by NACP in July 2017, is the most up to date year end figure for 2016. Annex H was produced using Spectrum 2016 figures.

What Will it Take for Ghana to Achieve 90-90-90? Costing an Enhanced HIV Treatment Cascade
19
Figure 14: Treatment Commodity Costs by Category
$13 $15 $18 $21 $24 $5
$6 $7
$8 $9
$2 $2
$2 $2
$3
$1 $2
$2 $2
$2
$6 $7
$8 $9
$11
$-
$10
$20
$30
$40
$50
$60
2016 2017 2018 2019 2020
USD
Mill
ions
Procurement and SupplyChain ManagementOpportunistic Infections
Prevention of Mother-to-Child TransmissionLabs
ARVS
Sources: GHS/NACP, 2016c and 2016d; HP+ calculation
Table 6: Sixth Edition National Guidelines for Number of Laboratory Tests for HIV and AIDS per Year
New patient (≤ 12 months)
Not stable, existing (> 12 months)
Stable, existing (> 12 months)
AZT TDF AZT TDF AZT TDF
CD4* X X X X X X
Creatinine clearance X X X X X X
Clinical chemistry 2 2 2 2 2 2
Hemoglobin X X X X X X
Full blood count (hematology) 2 2 2 2 2 2
Viral load 2 2 1 1 1 1
* CD4 is still being used in practice as viral load gradually scales up.Source: GHS/NACP, 2016e
The standard mark-up used by the GHS/NACP for procurement and supply chain management expenses for HIV commodities is equivalent to either 26% or 30.5% of commodity costs, based on Medical Stores Department fees and expense ratios (see Annex F). Including procurement and supply chain management costs, the total funding need is estimated to be US$32.3 million in 2017, increasing to US$48.6 million by 2020 (see Annex I for 2017 ART unit costs). Total resource needs for treatment commodities including procurement and supply chain management is US$162 million for 2017 to 2020.

What Will it Take for Ghana to Achieve 90-90-90? Costing an Enhanced HIV Treatment Cascade
20
Differentiated care models
Differentiated care simplifies and adapts HIV services to reflect preferences of specific sub-population groups of people living with HIV while also reducing unnecessary burdens on the health system, allowing for reallocation of resources to those most in need. As part of this activity, HP+ looked at the impact of potential efficiency gains from applying new ART service delivery models. HP+ assessed the cost of site-level ART service delivery for HRH and shared overhead that would be needed to achieve national GHS/NACP targets. HP+ also estimated the financial savings that could potentially be achieved from more efficiently delivering treatment services, focusing primarily on multi-month prescription (MMP) refills for ARVs for stable clients (see Box 2 for the definition of a stable patient). With GHS/NACP adopting a treat all policy, the number of people eligible for treatment has increased dramatically. HP+ calculated how the implementation of MMP refills could make Ghana’s ART program less expensive and more sustainable by adopting WHO recommendations, which reduces the number of clinical visits per year from 7–8 to 3 visits for new clients and from 4–6 visits to 2 visits for stable clients (see Table 7). GHS/NACP and service providers have voiced concerns about the increased likelihood of loss to follow-up for clients who initiate MMPs and therefore have fewer contacts with the healthcare system. It is important to recognize that stable clients moving to MMPs will require other community support interventions for adherence and retention that will help mitigate the negative impact of patient outcomes from less frequent clinical visits.
Table 7: Differentiated Care Model for Treatment
Assumptions Current Practice Ghana Guidelines (Sixth Edition) Efficient Service Delivery
Clinical visits for new clients 10–13 visits per year 7–8 visits per year 3 visits per year
Clinical visits for stable, continuing clients 4–6 visits per year 4–6 visits per year 2 visits per year
Clinical visits for nonstable, continuing clients
12 visits per year 12 visits per year 12 visits per year
Sources: GHS/NACP, 2016a; WHO recommendations
A different consideration for more efficient ART service delivery is to differentiate clients and their needs for laboratory monitoring and initiation. Savings can accrue from eliminating or reducing the frequency of certain laboratory tests. Ghana’s ART guidelines (sixth edition) are
Box 2. Defining Stable Clients
NACP defines “stable patients” as adults that have received ART for at least one year and have no adverse drug reactions that require regular monitoring, no current illnesses or pregnancy, are not currently breastfeeding, have a good understanding of lifelong adherence, and show evidence of treatment success (two consecutive tests showing reduced viral load or rising CD4 count) (GHS/NACP, 2016f). In practice, methods being used by medical officers in Ghana to determine whether a patient is stable are variable. HP+ assumed that 70% of clients were stable based on a combination of different published sources (Nyogea et al., 2015; Dow et al., 2014; Mosha et al., 2013).

What Will it Take for Ghana to Achieve 90-90-90? Costing an Enhanced HIV Treatment Cascade
21
quite comprehensive for laboratory tests, recommending clinical chemistry and a full blood count twice per year for both new and continuing clients, whether they are stable or not. By applying a labs algorithm taken from the PEPFAR COP 2016 technical recommendations, HP+ quantified the value of efficiency gains that can potentially be achieved in Ghana by implementing these laboratory guidelines (see Table 8). A creatinine clearance test would be conducted only for clients on tenofovir (TDF)-based regimens once per year as opposed to all clients getting a clinical chemistry test twice per year. Also, a hemoglobin (hematology) test would be conducted for clients on zidovudine (AZT)-based regimens once per year as opposed to all clients getting a full blood count twice per year. Lastly, continuing stable clients would only get a viral load test once per year, compared to twice per year for non-stable clients. This differentiated care model was applied in Tanzania, another country in which HP+ has conducted analyses on technical efficiency.
Table 8: Differentiated Care Model for Treatment: Labs Algorithm on Tests per Year*
New patient (≤ 12 months)
Not stable, existing (> 12 months)
Stable, existing (> 12 months)
AZT TDF AZT TDF AZT TDF
CD4 X X X X X X
Creatinine clearance X 1 X 1 X 1
Clinical chemistry X X X X X X
Hemoglobin 1 X 1 X 1 X
Full blood count (hematology) X X X X X X
Viral load 2 2 2 2 1 1
* Darker cells indicate difference in efficient scenario. Source: PEPFAR, 2016; WHO 2017
Findings from the analysis showed that total ART costs could be reduced by US$13 million from 2017–2020 by implementing PEPFAR’s recommended differentiated care model of one clinical visit every six months (with quarterly refill visits) for stable clients. The main drivers of the theoretical cost savings are a reduced need for HRH and overhead/supplies. These efficiency gains could allow GHS/NACP to redeploy freed-up HRH and facility space/overhead to other health scale-up or commodity procurement efforts. Furthermore, implementation of this laboratory algorithm in Ghana could potentially reduce lab monitoring costs by US$13.9 million for adult clients and US$896,000 for pediatric clients from 2017–2020. The US$28 million potential cost savings from these differentiated care models are based on the assumption of immediate implementation. Realistically, implementation of differentiated care models would be scaled-up gradually. There are some start-up investment costs to consider for revising and training on the GHS/NACP ART guidelines to consider, which are estimated to cost US$315,000 (based on HP+ interviews with GHS). Given Ghana’s ART targets for 2017 of 140,448 clients, the resources needed to support this many clients on treatment with undifferentiated care is US$21.6 million. Assuming the same resource envelope, 188,163 clients can be supported with differentiated care, or an additional 47,715 clients (see Figure 15).

What Will it Take for Ghana to Achieve 90-90-90? Costing an Enhanced HIV Treatment Cascade
22
Figure 15: US$28 Million Potential Cost Efficiency from MMP and Differentiated LabsAlgorithm
Limitations for achieving treatment targets and suggestions for improvement
Beyond improving linkage, to reach the second “90,” Ghana will need to address a number of key health systems challenges. Primary among these is insufficient stock of ARVs across facilities. Providers report that these shortages not uncommonly result in clients receiving as little as a two-week supply of drugs at one time or being shifted to other regimens. Transitioning existing and new clients to treatment and moving to more efficient models of care such as MMPs, will require substantial improvements to the current supply chain. As with test kits, improvements in planning, requisition, and forecasting for ARVs, and improved distribution schedules could help with this bottleneck.
In addition, the high client load compared to service providers trained for initiation may require accelerating plans to scale up ART sites and task-shift ART initiation to other cadres of providers, such as nurses. Evidence shows that initiating and managing HIV-positive clients at the primary healthcare level using nurse-initiated and -managed ART has equally good outcomes as hospital-based care at a lower cost (Long et al., 2016). This is part of GHS’s task-shifting guidelines (GHS, 2016b), and nurse midwives and practitioners have been prescribing and dispensing to some extent in various parts of Ghana for a while. A nurses monthly salary of US$346 is about 53% that of a doctor’s salary at $653. However, doctors’ contact time with ART

What Will it Take for Ghana to Achieve 90-90-90? Costing an Enhanced HIV Treatment Cascade
23
clients is only 12 minutes per facility visit. Shifting that engagement to nurses would not result in massive savings in Ghana, estimated at US$2.7 million from 2017–2020, though with the added responsibility, nurses will likely request further compensation.
Another key challenge to address is that not all medications for opportunistic infections are currently part of the national health insurance scheme, limiting patient’s access and affecting their health outcomes as drugs will likely not be available at community levels because clinics cannot be reimbursed for them. Scale-up of health insurance mechanisms and including some HIV services in the GOG benefits package may be a long-term solution to mobilize additional, sustainable revenue for HIV from a large base of beneficiaries. Further analysis is needed to determine the viability of including these services, considering potential utilization and cost of purchasing the services, but pre-payments are a way to pool risk and cross-subsidize coverage for those that are sick (including PLHIV) with premium payments from those that are healthy.
Another key challenge that will need to be addressed to ensure that clients on treatment are well monitored and receive the level of care needed based on their stability, is to improve systems for measuring viral load. Since this is not currently being used as a standard clinical measure in Ghana and given that each region only has one viral load machine, the anticipated increase in patient load will impose a substantial burden. Already existing constraints include shortages of viral load reagents as well as difficulties with transport of blood samples and return of results, given the often long distances between facilities and regional hospitals. Systems strengthening will require training of providers as well as improved procurement/supply and transport systems. Elevating the priority of current plans to use existing GeneXpert machines for viral load testing, at least in some of the higher burden areas, could help alleviate some challenges.
Current plans for integrating HIV and tuberculosis services should be prioritized, as this type of integration improves both case-finding and ART initiation rates. A recent meta-analysis showed that integrated HIV/tuberculosis services resulted in a nearly two-fold increase in the rate of ART initiation among those with active tuberculosis also living with HIV (Fox et al., 2016).
Retention and Viral Suppression It is estimated that 22% of HIV clients that are on treatment are LTFU at the retention step of the cascade at 12 months after initiation (GHS, 2016a), with 16% of those retained unable to achieve viral suppression. Research from a U.S.-based study on populations of men who have sex with men and people who inject drugs has shown that retained clients need to adhere to 80%–95% of treatment or better in order for approximately 80%–85% of a cohort of clients to achieve viral suppression (Viswanathan et al., 2015). As a baseline, about 63,000 of Ghana’s ART clients are virally suppressed, based on current estimates for leakages along the clinical cascade. Proper counseling on adherence prior to initiation on treatment is important for preventing loss to follow-up as clients that are vulnerable to interruptions in care are not likely to achieve viral suppression. In some cases, clients that have regained their health from treatment stop taking their medication. Others do not like the side effects or feel ill from taking ARVs, find ART clinic hours to be inconvenient, or find that clinics are located too far away. Lack of trust or confidentiality and issues related to stigma and discrimination result in poor adherence as well. Lastly, according to responses from clinical staff interviewed by HP+, stock-outs related to supply chain issues have led to problems with adherence.
Comprehensive counseling sessions are critical to ensure strict adherence to ART that will lead to sustained HIV suppression and survival. Models of Hope personnel that were interviewed by HP+ indicated that community support groups are an effective way to provide additional

What Will it Take for Ghana to Achieve 90-90-90? Costing an Enhanced HIV Treatment Cascade
24
Box 3. Models of Hope Approach to Improving Retention and Adherence
Similar to the strategy at the linkage step in the cascade, HIV program experts and clinical staff indicated that the use of community health workers and Models of Hope peer counselors are the primary interventions to improve retention and adherence. For retention, Models of Hope counselors will track defaulters that miss facility appointments, follow up with phone call reminders, and make house visits, if necessary, to return clients to treatment. Models of Hope personnel indicated that special adherence counseling interventions such as community support groups are an effective method to increase retention, claiming 90% adherence for clients that participate. In the past, incentives such as food and other gifts paid for by GAC were provided at support group meetings to encourage clients to attend. This practice has largely been discontinued due to lack of funding. Without incentives, clients have not been willing to participate in the support groups due to costs associated with attendance, such as transportation expenses. Interviewed Models of Hope personnel indicated that GH¢40 worth of incentives would be enough to get clients to start attending support groups again.
adherence counseling (see Box 3). As during the linkage step, Models of Hope counselors conduct case tracking at the retention step as well. Each person typically tracks 56 continuing clients per month that have defaulted from treatment (see Table 9). On average, Models of Hope counselors are significantly more effective at returning existing clients to care compared to new clients. Models of Hope personnel believe they can track and return to care 60% of existing clients that have defaulted, or 33.6 clients each per month (see Figure 16).
Table 9: Models of Hope Patient Load at Retention Step
Models of Hope Defaulters Yield Retained
Patients per week 17.5 — —
Patients per month 70.0 50% 35.0
Continuing patients 56.0 (80%) 60% 33.6
Source: Interviews with Models of Hope personnel
Figure 16: 22% LTFU from treatment with 60% of Defaulters Traced and Returned to Care through Models of Hope
-
50,000
100,000
150,000
200,000
250,000
2017 2018 2019 2020
On ART
LTFU
Returned to Care
Retained
Source: Interviews with Models of Hope personnel and HP+ analysis

What Will it Take for Ghana to Achieve 90-90-90? Costing an Enhanced HIV Treatment Cascade
25
If GHS/NACP’s 90-90-90 roadmap targets are met through the treatment stage and 22% of clients are LTFU at this stage with Models of Hope counselors tracing and returning to care 60% of defaulters, the GOG will meet the third “90”—90% of people on treatment achieving viral suppression or 73% of PLHIV virally suppressed—by 2020 (see Figure 17). Staff costs for community health workers and Models of Hope counselors have already been calculated in the linkage section, as these are the same people tracing loss to follow-up at that stage. Given the high rate of success from tracking defaulters that are existing clients and returning them to treatment, Models of Hope is one recommended approach to track those that are LTFU. About 203 Models of Hope personnel should sufficient and be allocated in proportion to the expected distribution of PLHIV on treatment, geographically and by targeted sub-population. The recommendation to provide an incentive of GH¢40 per patient to attend community support groups, assuming one meeting per month, would result in a cost of US$14.7 million to cover all clients on ART in 2017, increasing to US$22.7 million by 2020. A more targeted intervention that would focus on clients that are at high risk of being LTFU would reduce the cost to US$3.2 million in 2017, increasing to US$4.9 million by 2020 or US$16.1 million from 2017 to 2020. Incentivizing every person living with HIV on treatment to attend community support groups would cost US$78 million from 2017 to 2020, which is not financially feasible given resource constraints.
Funding for incentives to encourage patients at
high risk of loss to follow-up to participate in
community support groups would cost US$3.2–$4.9
million per year.
Currently, Ghana has nine operational viral load machines, dispersed throughout the country by region, with each machine having the capacity to conduct 90 tests per day, or roughly 23,400 tests per year. With nine viral load machines, Ghana’s annual test capacity is 210,600. Viral load testing requirements based on GHS/NACP’s sixth edition guidelines and Ghana’s ART targets suggest that the current test capacity is enough to meet the viral load testing needs of the country until 2020 from a volume perspective. However, issues related to access and transport to regional hospitals where the viral load machines are located are major constraints. The cost of a new COBAS AmpliPrep or COBAS Tagman 48 viral load machine is US$155,000. Doubling the number of viral load machines in the country would cost US$1.4 million. According to GHS/NACP, there is an active pipeline of point-of-care viral load technologies, which may help accelerate access to diagnostic tools (GHS/NACP, 2016a). GHS/NACP, in collaboration with PEPFAR, plans to review laboratory policies and develop guidelines and scale-up plans for viral load testing (GHS/NACP, 2016a).
Figure 17: Progress toward the Third “90” (73% of PLHIV Achieving Viral Suppression)
128,31348%
150,989 57%
174,742 67%
198,735 77%
-
50,000
100,000
150,000
200,000
250,000
300,000
2017 2018 2019 2020
PLHIV
Retained
Viral LoadSuppression Target
Sources: GHS/NACP, 2016a; HP+ calculation

What Will it Take for Ghana to Achieve 90-90-90? Costing an Enhanced HIV Treatment Cascade
26
Limitations for achieving retention and viral suppression targets and
suggestions for improvement
To reach the last “90” and to ensure more optimal retention, adherence, and viral suppression, Ghana will need to address some key health system challenges related to monitoring and engaging clients who are on treatment as well as scale-up of viral load testing. In addition to or in the absence of Models of Hope counselors and community health workers at CHPS compounds, facility staff are often responsible for tracing clients, however, they are not well motivated, compensated, or equipped to do so. Though some staff take it upon themselves to pay for relevant expenses out-of-pocket, such an approach is not a sustainable or fair expectation. Ensuring that staff responsible for tracing have sufficient funds for transportation to visit clients or airtime to call them, as well as dedicated time in their schedules, will be important to overcome this barrier. Further, strengthening systems to document multiple ways of contacting clients and to effectively trace them will be critical, particularly given high levels of mobility and commonly noted challenges reaching clients at given mobile numbers and some clients’ preferences to obtain care far from home.
To ensure viral suppression, retention in care and ART adherence are key. Viral suppression is complex and includes many other factors, including treatment regimen, dosage over time, immune profile and comorbidities, psychosocial support, and disclosure of status. One particularly promising approach that should be considered in Ghana is reducing required clinic visits. This can be done by coordinating pharmacy and clinic visits and by changing appointment schedules. Evidence suggests that reducing clinic visits can significantly improve retention. A study in Zambia showed that a 6-month interval between appointments (compared to 1-month or 3-month intervals) significantly reduced the likelihood of missed visits, gaps in medication refills, and losses to follow-up (Mody et al., 2017).
Other complementary promising approaches could also be implemented. For example, high quality evidence from two randomized-controlled trials in Kenya suggests that weekly mobile phone reminders can improve ART adherence. One of the trials further showed that mobile phone messaging can improve viral suppression (Horvath et al., 2012). Provision of patient counseling or a call-in line may also be effective so that clients who are facing challenges but have lost contact with a facility can seek information and referrals and have an easy re-entry point for care. The intervention can also help with issues related to gender, stigma and discrimination, and transitioning to adult care.
A separate challenge with retention is the popularity of spiritual or prayer camps, which can undermine clients’ engagement in medical care and ART adherence (GhanaWeb, 2015; FHI 360, 2014; News Ghana, 2012). More widespread treatment education and interventions to work with camp leaders may be necessary to counter this obstacle.

What Will it Take for Ghana to Achieve 90-90-90? Costing an Enhanced HIV Treatment Cascade
27
4. CONCLUSION
The GOG has developed a solid strategy to achieve the targets set forth in the 90-90-90 roadmap. 2.7 million HIV tests per year may seem a bit excessive at first glance, but it will take a very large volume of tests to find the last remaining undiagnosed PLHIV to be able to reach the first “90” objective. Targeting testing in high burden geographical regions and key populations are a logical place to start, but test yields will decline over time as more and more PLHIV are initiated on treatment and yields will be extremely low across all populations by 2020 when the GOG is on the verge of achieving 90% of PLHIV knowing their status. Important to note is that the national strategic plan’s HTC strategy does not consider cost differences between different modes of HTC interventions. More expensive community and mobile outreach testing will be needed to find PLHIV that do not come forward on their own or are located in hard to reach places, which will add US$3.3 million per year in additional staff and travel costs. If resources are constrained, possible considerations to reduce costs are to prioritize high burden regions for antenatal care testing, reduce key population testing over time as the number of undiagnosed PLHIV in these sub-populations approaches zero, and reduce or discontinue mobile outreach testing as it is by far the least cost-efficient mode of testing. Total resource needs for HTC to achieve 90-90-90, excluding facility-based service delivery, is estimated to be US$38 million from 2017 to 2020.
Models of Hope, one of the primary approaches used in Ghana, appears to be one cost-effective way to reduce loss to follow-up at both linkage and retention steps in the cascade and also to improve adherence through community support groups, which will help lead to increased viral suppression. Models of Hope counselors are effective at tracking and engaging with those LTFU because of their understanding of issues related to stigma and discrimination, having gone through the process themselves. Total resource needs for Models of Hope stipends at an increased rate of GH¢425 per month, costs for registration supplies, and incentives for participation at community support groups that will improve adherence are US$18.2 million from 2017 to 2020. Scale-up of access to viral load machines will be needed, which requires capital investment of about US$1.4 million.
The total amount of resources needed to achieve 90-90-90 is US$217 million from 2017 to 2020, excluding facility HRH and overhead costs. From 2017 to 2018, total funding commitments for the purchase of HIV commodities is projected to be US$46 million with over 96% of financing coming from GFATM and PEPFAR. Assuming no other funding commitments, there is a forecasted commodity resource gap of US$18.6 million in 2017 (see Figure 18), which increases to US$29.0 million by 2020. GFATM and PEPFAR both plan to increase funding in 2018 by over 50% compared to 2017 levels; assuming funding levels remain constant at 2018 levels, the total commodity resource gap from 2017 to 2020 is US$89.1 million. Finding technical efficiencies in HIV service delivery models can help close the financing gap. Immediate implementation of more efficient service delivery models, as proposed in this report, offers an opportunity to potentially reduce costs by US$28 million. Another perspective on the magnitude of funding constraints is to compare the total resource needs to the estimated resources for all HIV prevention and treatment activities in Ghana (see Table 10).

What Will it Take for Ghana to Achieve 90-90-90? Costing an Enhanced HIV Treatment Cascade
28
Figure 18: GFATM and PEPFAR Supply Plan versus Resource Needs
$-
$10,000,000
$20,000,000
$30,000,000
$40,000,000
$50,000,000
$60,000,000
Funding ResourceNeeds
Funding ResourceNeeds
Funding ResourceNeeds
Funding ResourceNeeds
2017 2018 2019 2020
GFATM PEPFAR Government of Ghana Resource Needs
Sources: Global Health Supply Chain Project, 2016; HP+ calculation
Table 10: Resource Needs (US$) to Achieve 90-90-90
commodities and chain
2017 2018 2019 2020
Treatment procurement and supply management
$32,253,458
commodities and
$37,686,571 $43,292,745 $48,575,842
Identification procurement and supply chain management
$5,911,140 $6,030,704 $6,103,631 $6,126,030
Registration supplies $279,709 $328,503 $ 379,614 $431,136
HRH and Non-facility testing travel $3,389,913 $3,454,064 $3,285,607 $3,232,698
Models of Hope $224,747 $105,109 $47,474
community
$20,892
Retention and adherence groups $3,164,021 $3,723,168 $4,308,897 $4,900,529
Total $45,222,988 $51,328,119 $57,417,969 $63,287,127
Percent coverage of resources versus resource needs
resources for
101% 89% 79% 72%
Estimated prevention and treatment $45,577,465 $45,577,465 $45,577,465 $45,577,465
Sources: PEPFAR, 2016; GHS/NACP, 2016c and 2016d; HP+ calculations

What Will it Take for Ghana to Achieve 90-90-90? Costing an Enhanced HIV Treatment Cascade
29
The important health benefits that result from rapid scale-up of ART will not be realized if there is not enough money available to implement the HIV national strategic plan. Even if donors like PEPFAR and GFATM continue to heavily support Ghana with the purchase of ART commodities and funding remains constant beyond 2018 (which is not guaranteed, given the forthcoming new GFATM application), funding shortfalls are expected to grow as more clients are initiated on ART. For a sustainable financing future for ART, the GOG must continue to search for, advocate for, and implement increased domestic resource mobilization for HIV and to implement sustainable financing mechanisms and more efficient HIV service delivery models. One such mechanism being explored is an HIV fund, established under Act 938.
One study limitation is that targeted interventions for adolescents are largely omitted from this report as data collected did not distinguish specifically for this group. As previously mentioned, the impact of female sex workers on Ghana’s HIV epidemic is significant, with the majority being adolescents and young women. Young people from key populations, perhaps more so than their peers in the general population, experience power imbalances and may lack the skills needed to navigate the clinical cascade. Another limitation is that the HRH analysis does not consider the cost impact of using lay counselors for HIV testing and other tasks. HP+ and the GOG have prioritized a policy action planning process for lay counselors for HIV testing, including a differentiated care component. Further, the Models of Hope approach is the only linkage and retention intervention that was costed, although there has never been an evaluation to appropriately assess its contribution to the HIV cascade. As mentioned in the recommendations sections for each step of the cascade, there are other interventions that could help improve program performance. Lastly, MMPs and a differentiated labs algorithm are the only models of differentiated care included in the costing. An overarching conclusion from the study is that limitations in reaching targets may be tied to the country’s lack of differentiated care, which needs urgent attention, particularly on targeted service delivery to improve outcomes related to key populations.
90-90-90 targets will be difficult to achieve without addressing key bottlenecks at each step ofthe cascade. HP+ is currently conducting two complementary activities in Ghana that willinform approaches needed to overcome bottlenecks throughout the HIV care and treatmentcascade. First, a legal environmental assessment/policy scan and action planning process willhelp stakeholders, including government, civil society, service providers, and the private sector,identify service gaps in Ghana’s HIV response and develop policy solutions that address thosegaps, particularly in areas of task-sharing and HIV testing kit commodity procurement andsupply chain management. Through this activity, HP+ is also working with GAC to provide anupdate to the 2010/2011 legal environment assessment. A second HP+ activity is helping tocollect data on health facility stigma and discrimination to build an understanding of themagnitude of its key drivers and manifestations. Ultimately this information can be used toimprove the quality of service delivery and maximize investments in HIV prevention andtreatment.

What Will it Take for Ghana to Achieve 90-90-90? Costing an Enhanced HIV Treatment Cascade
30
REFERENCES Barker, C., A. Dutta, and K. Klein. 2017. Can Differentiated Care Models Solve the Crisis in Treatment Financing? Analysis of Prospects for 38 High-Burden Countries in sub-Saharan Africa. Washington, DC: Palladium, Health Policy Plus.
Bautista-Arredondo, S., S. Sos-Rubi, L. Contreras, A. Kwan, C. Chaumont, et al. 2016. Costs along the Service Cascades for HIV Testing and Counselling and Prevention of Mother-to-Child Transmission. ORPHEA Project.
Birx, D. 2017. Optimizing Results in PEPFAR. Washington, DC: PEPFAR.
Clinton Health Access Initiative. 2014. Zambia HTC Implementation Plan 2014-2015 Cost Model. Lusaka, Zambia: Clinton Health Access Initiative.
Dow, D., A. Shayo, C. Cunningham, and E. Reddy. 2014. Durability of Antiretroviral Therapy and Predictors of Virologic Failure among Perinatally HIV Infected Children in Tanzania: A Four-Year Follow-Up. London, UK: BioMed Central Ltd.
FHI 360. 2014. “Program in Ghana Returns HIV Patients Back to Care.” Available at: https://www.fhi360.org/news/program-ghana-returns-hiv-patients-back-care (accessed March 30, 2017).
Fox, M., S. Rosen, P. Geldsetzer, T. Bärnighausen, E. Negussie, et al. 2016. “Interventions to Improve the Rate or Timing of Initiation of Antiretroviral Therapy for HIV in sub-Saharan Africa: Meta-Analyses of Effectiveness.” Journal of the International AIDS Society 19(1).
Ghana AIDS Commission (GAC). 2014a. 2014 Status Report. Accra, Ghana: GOG.
GAC. 2015. Country AIDS Response Progress Report – Ghana. Accra, Ghana: GOG.
GAC. 2016. National HIV & AIDS Strategic Plan 2016-2020. Accra, Ghana: GOG.
Ghana Health Service (GHS). 2016a. Assessment of HIV Treatment Services in Ghana: Availability, Quality and ART Cohort Survival Analysis. Accra, Ghana: GOG.
GHS. 2016b. Operational Policy and Implementation Guidelines on Task Sharing. Accra, Ghana: GOG.
Ghana Health Service/National AIDS Control Programme (GHS/NACP). 2016a. “Locate, Test, Treat and Retain Ghana Campaign: 90-90-90 Ending the AIDS Epidemic by 2030, Roadmap to Treat All.” Accra, Ghana: GOG.
GHS/NACP. 2016b. “Ghana National Spectrum File, 2016.” Accra, Ghana: GOG.
GHS/NACP. 2016c. “ARV & RDT Assumptions July 2016 Quantification.” Accra, Ghana: GOG.
GHS/NACP. 2016d. “Laboratory Commodities and Supplies, July 2016 Quantification.” Accra, Ghana: GOG.
GHS/NACP. 2016e. Guidelines for Antiretroviral Therapy in Ghana. Sixth Edition. Accra, Ghana: GOG.

What Will it Take for Ghana to Achieve 90-90-90? Costing an Enhanced HIV Treatment Cascade
31
GHS/NACP. 2016f. “Treat All Policy PowerPoint.” Accra, Ghana: GOG
GHS/NACP. 2016g. “ARV Reference Pricing List.” Accra, Ghana: GOG
GHS/NACP. 2017a. “HIV Program, Treat All Policy Guidelines and Update.” Accra, Ghana: GOG.
GHS/NACP. 2017b. “2016 End of the Year Regional Performance Reviews.” Accra, Ghana: GOG.
GHS/NACP. 2017c. “Ghana National Spectrum File, 2017.” Accra, Ghana: GOG.
GhanaWeb. 2015. “Prayer Camps Compound HIV/AIDS Treatment - Medical Doctor.” Available at: http://www.ghanaweb.com/GhanaHomePage/economy/artikel.php?ID=343475 (accessed March 30, 2017).
Global Health Supply Chain Project. 2016. “GFATM and PEPFAR Supply Plan.” Accra, Ghana: Global Health Supply Chain Project.
Government of Ghana (GOG). 2016. Ghana AIDS Commission Act, 938.
Govindasamy, D., J. Meghij, E.K. Negussi, R.C. Baggaley, N. Ford, et al. 2014. “Interventions to Improve or Facilitate Linkage to or Retention in pre-ART (HIV) Care and Initiation of ART in Low- and Middle-income Settings–A Systematic Review.” Journal of the International AIDS Society 17.1.
Horvath, T., H. Azman, G.E. Kennedy, G.W. Rutherford. 2012. “Mobile Phone Text Messaging for Promoting Adherence to Antiretroviral Therapy in Patients with HIV Infection.” Cochrane Database of Systematic Reviews Mar 14;(3):CD009756.
Koenig S., N. Dorvil, P. Severe, C. Riviere, M. Faustin, et al. 2016. “Same-day HIV Testing and Antiretroviral Therapy Initiation Results in Higher Rates of Treatment Initiation and Retention in Care.” 21st International AIDS Conference, Durban, abstract WEAE0202.
Koseki, S., V. Hate, M. Schnure, A. Dutta, and A. Paxton. 2015. Making Strategic Choices: Prioritizing HIV Interventions in a Resource-Limited Setting. Washington, DC: Futures Group, Health Policy Project.
Long, L., S. Rosen, A. Brennan, F. Moyo, C. Sauls, et al. 2016. « Treatment Outcomes and Costs of Providing Antiretroviral Therapy at a Primary Health Clinic versus a Hospital-based HIV Clinic in South Africa.” PloS One 11(12), e0168118.
McMahon, J., J. Elliot, S. Bertagnolio, R. Kubiak, and M. Jordan. 2013. Viral Suppression after 12 Months of Antiretroviral Therapy in Low- and Middle-Income Countries: A Systematic Review. Geneva, Switzerland: World Health Organization.
Menzies, N., B. Abang, R. Wanyenze, F. Nuwaha, B. Mugisha, et al. 2009. The Costs and Effectiveness of Four HIV Counseling and Testing Strategies in Uganda. Cambridge, MA: Harvard University Health Policy Program.
Messersmith, L., J. Beard, R. Adjei, T. Agyarko-Poku, D. Longobardi, A. Falconer, et al. 2014. HIV Vulnerability of Men and Women Who Inject Drugs in Kumasi, Ghana. Boston, MA: Boston University, Center for Global Health and Development.

What Will it Take for Ghana to Achieve 90-90-90? Costing an Enhanced HIV Treatment Cascade
32
Mody, A., N. Padian, N. Czaicki, M. Roy, C.B. Moore, et al. 2017. “Improved Retention with Longer Follow-up Intervals for Stable Patients in Zambia.” Conference on Retroviruses and Opportunistic Infections, Seattle, abstract 1000.
Mosha, F., V. Muchunguzi, M. Matee, R. Sangeda, J. Vercauteren, et al. 2013. Gender Differences in HIV Disease Progression and Treatment Outcomes Among HIV Patients One Year After Starting Antiretroviral Treatment. London, UK: BioMed Central Ltd.
News Ghana. 2012. “Prayer Camp and HIV Treatment.” Available at: https://www.newsghana.com.gh/prayer-camp-and-hiv-treatment/ (accessed March 30, 2017).
Nsigaye, R., A. Wringe, M. Roura, S. Kalluvya, M. Urassa, et al. 2009. “From HIV Diagnosis to Treatment: Evaluation of a Referral System to Promote and Monitor Access to Antiretroviral Therapy in Rural Tanzania.” Journal of the International AIDS Society 12.1: 31.
Nyogea, D., S. Mtenga, L. Henning, F. Franzeck, T. Glass, et al. 2015. Determinants of Antiretroviral Adherence among HIV Positive Children and Teenagers in Rural Tanzania: A Mixed Methods Study. Ifakara, Tanzania: Ifakara Health Institute.
Rosen, S., M. Fox, B. Larson, P. Sow, P. Ehrenkranz, et al. 2016. “Accelerating the Uptake and Timing of Antiretroviral Therapy Initiation in Sub-Saharan Africa: An Operations Research Agenda.” PLoS Medicine 13.8: e1002106.
U.S. President’s Emergency Plan for AIDS Relief (PEPFAR). 2016. PEPFAR Technical Considerations for COP/ROP 2016. Washington, DC: PEPFAR, U.S. Department of State.
Viswanathan, S., R. Detels, S. Mehta, B. Macatangay, G. Kirk, et al. 2015. “Level of Adherence and HIV RNA Suppression in the Current Era of Highly Active Antiretroviral Therapy.” AIDS and Behavior 19(4):601-11.
WHO. 2015. Consolidated Guidelines on the Use of Antiretroviral Drugs for Treating and Preventing HIV Infection. Geneva, Switzerland: World Health Organization.
WHO. 2017. What’s New in Treatment Monitoring: Viral Load and CD4 Testing. Geneva, Switzerland: World Health Organization.

What Will it Take for Ghana to Achieve 90-90-90? Costing an Enhanced HIV Treatment Cascade
33
ANNEX A. ANNUAL REGIMEN UNIT COSTS Table A1: Adult and Adolescent Regimen Unit Costs
First Line Cost (US$) Second Line Cost (US$)
AZT/3TC+EFV $121 ABC/3TC/LPVr $393
AZT/3TC/NVP $101 AZT/3TC/ATV/r $302
TDF/3TC/EFV $101 AZT/3TC/LPVr $313
TDF/3TC/NVP $101 TDF/3TC/ATV/r $261
TDF/FTC/EFV $101 TDF/3TC/LPVr $286
— — TDF/FTC/LPV/r $298
Table A2: Weighted Average Regimen Costs, All Pediatrics
First Line Cost (US$) Second Line Cost (US$)
AZT/3TC+EFV $87 AZT + 3TC + LPV/r $161
ABC+3TC+EFV $159 ABC + 3TC + LPV/r $233
AZT+3TC+NVP $103 — —
ABC+3TC+NVP $175 — —
ABC/3TC/AZT for TB children $231 — —
TDF/3TC/EFV $85 — —
TDF/FTC/EFV $85 — —
TDF/3TC/NVP $96 — —
Sources: GHS/NACP, 2016g; HP+ calculation
ANNEX B. PEDIATRIC CLIENTS BY WEIGHT ASSUMPTIONS
Weight % Age
3–5.9 kg 7.5% 0–11 months
6–9.9 kg 7.5% 1 to < 2 years
10–14.9 kg 21.2% 2 to < 5 years
15–19.9 kg 17.0% 5 to < 10 years
20–24.9 kg 17.0%
25–34.9 kg 29.8% 10 to < 15 years
Source: GHS/NACP, 2016c

What Will it Take for Ghana to Achieve 90-90-90? Costing an Enhanced HIV Treatment Cascade
34
ANNEX C. ARV REGIMEN ASSUMPTIONS Table C1: Percentage Breakdown of Adult Patients by ARV Regimens—First Line
Regimen 2016 2017 2018 2019 2020
AZT/3TC+EFV 15.00% 15.00% 15.00% 13.00% 10.00%
AZT/3TC/NVP 20.00% 15.00% 10.00% 10.00% 9.00%
TDF/3TC/EFV 45.00% 57.00% 68.00% 70.00% 75.00%
TDF/3TC/NVP 15.00% 10.00% 5.00% 5.00% 4.00%
TDF/FTC/EFV 5.00% 3.00% 2.00% 2.00% 2.00%
Table C2: Percentage Breakdown of Adult Patients by ARV Regimens—Second Line
Regimen 2016 2017 2018 2019 2020
ABC/3TC/LPVr 2.50% 2.50% 2.50% 2.50% 2.50%
AZT/3TC/ATV/r 4.50% 4.50% 4.50% 4.50% 4.50%
AZT/3TC/LPVr 45.00% 45.00% 45.00% 45.00% 45.00%
TDF/3TC/ATV/r 8.00% 8.00% 8.00% 8.00% 8.00%
TDF/3TC/LPVr 38.00% 38.00% 38.00% 38.00% 38.00%
TDF/FTC/LPV/r 2.00% 2.00% 2.00% 2.00% 2.00%
Table C3: Percentage Breakdown of Pediatric Patients by ARV Regimens–First Line
Regimen 2016 2017 2018 2019 2020
AZT/3TC+EFV 32.00% 32.00% 32.00% 32.00% 32.00%
ABC+3TC+EFV 3.00% 3.00% 3.00% 3.00% 3.00%
AZT+3TC+NVP 55.00% 55.00% 55.00% 55.00% 55.00%
ABC+3TC+NVP 0.00% 0.00% 0.00% 0.00% 0.00%
ABC/3TC/AZT for TB children 2.00% 2.00% 2.00% 2.00% 2.00%
TDF/3TC/EFV 5.50% 5.50% 5.50% 5.50% 5.50%
TDF/FTC/EFV 0.00% 0.00% 0.00% 0.00% 0.00%
TDF/3TC/NVP 2.50% 2.50% 2.50% 2.50% 2.50%
Table C4: Percentage Breakdown of Pediatric Patients by ARV Regimens—Second Line
Regimen 2016 2017 2018 2019 2020
AZT+3TC+LPV/r 10.00% 10.00% 10.00% 10.00% 94.00%
ABC+3TC+LPV/r 90.00% 90.00% 90.00% 90.00% 2.60%
Source: GHS/NACP, 2016c

What Will it Take for Ghana to Achieve 90-90-90? Costing an Enhanced HIV Treatment Cascade
35
ANNEX D. LABORATORY UNIT COSTS: INCLUDES ALL REAGENTS, CONSUMABLES, SHARED LAB SUPPLIES, QUALITY CONTROL, AND WASTAGE
Test Type Laboratory Test Cost (US$) Percent of Test Type
Clinical Chemistry Fully Chemistry Selectra $10.94 —
CD4 Becton Dickinson FACSCalibur $11.70 60%
Becton Dickinson FACSCount $18.32 40%
Hematology Sysmex KK 21 N $2.94 40%
Sysmex XT 2000i & XS 500 I $2.39 60%
Viral load CAP CTM HIV Monitor Version $14.62 —
Early infant diagnosis $18.26 —
Source: GHS/NACP, 2016d
ANNEX E. FACILITY VISITS AND EXPERT INTERVIEWS
Facility Visits • Odorna Clinic (Accra) • La General Hospital (Accra) • Somanya Polyclinic (Eastern) • Noaso Community-Based Health Planning and Services Compound (Eastern) • Koforidua Regional Hospital (Eastern)
Key Panel/Expert Interviews
• Pat Youri, HIV National Strategic Plan strategist • EQUIP panel • GAC panel • Global Health Supply Chain-Procurement and Supply Management Project panel • Care Continuum (key populations) panel • Silas Quaye, Centers for Disease Control and Prevention • Models of Hope panel
Additional Experts Interviewed Data Retrieved
Dr. Stephen Ayisi Addo HIV testing yield data and responses to questionnaire on bottlenecks along the cascade
Ekow Wiah (NACP, Data Manager) e-tracker and responses to questionnaire on bottlenecks along the cascade
Mr. Allotey (Korle-Bu) Human resources for health salaries for care and treatment and full time equivalent

Additional Experts Interviewed Data Retrieved
Dr. Odame Ankrah (Ag Director PPME, GHS)
Human resources for health salaries for care and treatment and full time equivalent
Dr. Alfred E. Yawson (Consultant, School of Public Health)
Job descriptions for community health workers/task-shifting guidelines
Cynthia Adobea (Data Manger, GAC) HIV testing yield data and responses to questionnaire on bottlenecks along the cascade
Margaretta Chandi (DDNS, Tutor Nursing Training) Sample lab transport costs and training curriculum
Dr. Saul Onyango (PMTCT Integration Consultant)
Responses to questionnaire on bottlenecks along the cascade/task-shifting guidelines
Kodulo Winfred (PLHIV Greater Accra President)
Responses to questionnaire on bottlenecks along the cascade/contact time
Bridget Badu (Senior Health Educator, KBTH)
HIV testing yield data and responses to questionnaire on bottlenecks along the cascade
Yaa Serwaa Addai Appiah (Principal Bio-medical Scientist, KBTH)
HIV testing yield data and responses to questionnaire on bottlenecks along the cascade/contact time
Stephen Adu Sarpong (Models of Hope President)
Contact time, honorarium for Models of Hope, and responses to questionnaire on bottlenecks along the cascade
Dr. Joseph Oliver Commey (Head of HIV Clinic, LEKMA )
HIV testing yield data and responses to questionnaire on bottlenecks along the cascade
Dr. Ganu Vincent (HIV Clinic, KBTH) HIV testing yield data and responses to questionnaire on bottlenecks along the cascade
Pharm Elaine Awemee (HIV Focal Person, KBTH)
HIV testing yield data and responses to questionnaire on bottlenecks along the cascade
Miriam Mensah (KBTH, Principal Health Educator)
HIV testing yield data and responses to questionnaire on bottlenecks along the cascade
Mercy Acquah-Hayford (HIV Focal Person, Ridge Hospital)
HIV testing yield and responses to bottleneck along the cascade
Miriam Sam (Adolescent HIV Care) Contact time and responses to bottleneck along the cascade
Joana Fynn (PLHIV) Contact time
Mandy Obeng-Mensah (Nurse) HIV testing yield data and responses to questionnaire on bottlenecks along the cascade
Prof Margaret Lartey (Technical Working ZGroup)
HIV testing yield data and responses to questionnaire on bottlenecks along the cascade
Dominic Kobinah (GHS) Job descriptions for community health workers/task-shifting guidelines
What Will it Take for Ghana to Achieve 90-90-90? Costing an Enhanced HIV Treatment Cascade
36

What Will it Take for Ghana to Achieve 90-90-90? Costing an Enhanced HIV Treatment Cascade
37
ANNEX F. PROCUREMENT AND SUPPLY CHAIN MANAGEMENTCOST ASSUMPTIONS AS A PERCENTAGE OF COMMODITYCOSTS
Cost Category Antiretroviral Medicines
Lab Reagents and
Consumables
Opportunistic Infection and
Other non-Core Medicines
HIV Test Kits
Syphilis Test Kits
Procurement agent and handling fees 2.5% 7.0% 7.0% 2.5% 7.0%
Freight and insurance costs 11.0% 11.0% 11.0% 11.0% 11.0%
Warehouse and storage costs 5.0% 5.0% 5.0% 5.0% 5.0%
In-country distribution costs 5.0% 5.0% 5.0% 5.0% 5.0%
Quality assurance and quality control costs 1.5% 1.5% 1.5% 1.5% 1.5%
Procurement and supply chain management customs clearance 1.0% 1.0% 1.0% 1.0% 1.0%
TOTAL 26.0% 30.5% 30.5% 26.0% 30.5%
Source: Global Health Supply Chain Project, 2016
ANNEX G. PROGRESS IN SCALING UP ART VERSUS ALL PLHIVIN GHANA, 2003–2016
95,235
271,374
0% 1% 1% 2% 4%7% 10%
14%
21%25% 27%
30% 30%35%
0%
10%
20%
30%
40%
50%
60%
70%
80%
-
50,000
100,000
150,000
200,000
250,000
300,000
350,000
2003 2004 2005 2006 2007 2008 2009 2010 2011 2012 2013 2014 2015 2016
% o
f PLH
IV o
n AR
T
Num
bers
on
ART
or P
LHIV
Adults on ART Children on ART PLHIV % PLHIV on ART
Sources: GHS/NACP, 2016a and 2016b

What Will it Take for Ghana to Achieve 90-90-90? Costing an Enhanced HIV Treatment Cascade
38
ANNEX H. 90-90-90 ROADMAP ART COVERAGE TARGETS ANDPROGRESS TOWARD SECOND “90”
89,113 32%
117,312 43%
140,448 52%
165,268 62%
191,268 73%
217,530 84%
-
50,000
100,000
150,000
200,000
250,000
300,000
2015 2016 2017 2018 2019 2020
Number on ART PLHIV 90-90-90 ART Target
Note: 2015 data is actual; 2016–2020 data are estimates. Sources: GHS/NACP, 2016a and 2016b
ANNEX I. 2017 ART UNIT COST PER PATIENT BY COMPONENT
109.7 104.9
44.1 44.1
9.0 14.1
44.7 45.0
24.1 24.1 29.7 29.7
$-
$50
$100
$150
$200
$250
$300
Adults Pediatrics
US$
Shared Overhead
Human Resources
Procurement and SupplyChain Management
Other Drugs
Labs
ARVs
$261.3 $261.9
Source: HP+ calculation

For more information, contact:
Health Policy Plus
Palladium
1331 Pennsylvania Ave NW, Suite 600
Washington, DC 20004
Tel: (202) 775-9680
Fax: (202) 775-9694
Email: [email protected]
www.healthpolicyplus.com