Upward shifts in the southern Hydrate Ridge gas hydrate stability zone following postglacial...
13
Upward shifts in the southern Hydrate Ridge gas hydrate stability zone following postglacial warming, offshore Oregon Nathan L. B. Bangs University of Texas Institute for Geophysics, Austin, Texas, USA Robert J. Musgrave Department of Earth Sciences, La Trobe University, Bundoora, Victoria, Australia Anne M. Tre ´hu College of Oceanic and Atmospheric Sciences, Oregon State University, Corvallis, Oregon, USA Received 2 July 2004; revised 8 November 2004; accepted 9 December 2004; published 26 March 2005. [1] High-resolution three-dimensional (3-D) seismic reflection data acquired on the R/V Thomas G. Thompson in 2000 reveal a pair of bottom simulating reflections (BSRs) across a broad region of southern Hydrate Ridge, offshore Oregon. The primary BSR (BSR p ) is a regionally extensive reflection that lies 120–150 m below seafloor and exhibits typical characteristics of a gas hydrate BSR. We also imaged a second weaker BSR (BSR s ), 20– 40 m below BSR p , with similar characteristics. BSR s is interpreted as a remnant of a BSR that probably formed during the Last Glacial Maximum 18,000 years ago, when the base of the gas hydrate stability zone (GHSZ) was deeper. An increase in bottom water temperatures of 1.75° –2.25° and a corresponding sea level rise of 120 m could have produced the BSR shift. The preservation of BSR s for at least 5000 years, which is the time since subseafloor temperatures stabilized following ocean warming after the Last Glacial Maximum, implies very slow upward advective and diffusive flow of methane (<1 m/1000 years in the vicinity of BSR s ). BSR s appears where there are no resolvable steeply dipping faults and fractures, consistent with very low advective flow rates, and has dispersed where vertical fractures are visible. Free gas released by the shift in the BSR either migrates so slowly that it remains stable beneath the GHSZ or is directed upward along fractures to reform as hydrate in the GHSZ. There is no evidence for release of this free gas into the ocean or atmosphere. Citation: Bangs, N. L. B., R. J. Musgrave, and A. M. Tre ´hu (2005), Upward shifts in the southern Hydrate Ridge gas hydrate stability zone following postglacial warming, offshore Oregon, J. Geophys. Res., 110, B03102, doi:10.1029/2004JB003293. 1. Introduction [2] BSRs (bottom simulating reflections) are distinctive, commonly observed seismic reflections that roughly parallel the seafloor. Although BSRs with positive polarity have been documented to form from mineral phase transitions such as opal CT to quartz [Hein et al., 1978], most BSRs have clear negative polarity and are attributed to physical property contrasts generated by a sharp contact between gas hydrates above the BSR and a few percent free gas below it [Miller et al., 1991]. Gas hydrate BSRs thus usually mark the base of the gas hydrate stability zone (GHSZ) defined by specific pressure and temperature (P-T) conditions. [3] Geologic processes such as rising bottom water tem- peratures, sea level rise, and tectonic uplift shift sediment P- T conditions and hydrate stability zones. If global P-T changes cause an upward shift of the GHSZ, hydrate dissociation below the new GHSZ could potentially release large volumes of methane stored in vast gas hydrate reservoirs around the world and affect global climate [Mienert et al., 2000; Kennett et al., 2003]. Recent obser- vations of a rare, double BSR, in distinctively different, broadly ranging settings [Foucher et al., 2002; Andreassen et al., 2000; Mienert et al., 2000] imply the possibility that shifting P-T conditions can leave behind a relict base of the gas hydrate stability zone [Foucher et al., 2002]. These double BSRs may thus offer clues to the dynamics of hydrates by potentially revealing the response of gas hydrates to changing P-T conditions, and the potential for release of methane, which is a powerful greenhouse gas, into the ocean and atmosphere. [4] In 2000, we acquired a high-resolution three-dimen- sional (3-D) seismic reflection data set across southern Hydrate Ridge to map the subsurface plumbing system and geophysical properties of the sediment related to the hydrate and free gas system. For the first time we image a double BSR with 3-D, high-resolution seismic data. This paper documents the regional extent and characteristics of a double BSR, and presents a qualitative model for its JOURNAL OF GEOPHYSICAL RESEARCH, VOL. 110, B03102, doi:10.1029/2004JB003293, 2005 Copyright 2005 by the American Geophysical Union. 0148-0227/05/2004JB003293$09.00 B03102 1 of 13
-
Upload
independent -
Category
Documents
-
view
2 -
download
0
Transcript of Upward shifts in the southern Hydrate Ridge gas hydrate stability zone following postglacial...

Upward shifts in the southern Hydrate Ridge gas hydrate stability
zone following postglacial warming, offshore Oregon
Nathan L. B. BangsUniversity of Texas Institute for Geophysics, Austin, Texas, USA
Robert J. MusgraveDepartment of Earth Sciences, La Trobe University, Bundoora, Victoria, Australia
Anne M. TrehuCollege of Oceanic and Atmospheric Sciences, Oregon State University, Corvallis, Oregon, USA
Received 2 July 2004; revised 8 November 2004; accepted 9 December 2004; published 26 March 2005.
[1] High-resolution three-dimensional (3-D) seismic reflection data acquired on the R/VThomas G. Thompson in 2000 reveal a pair of bottom simulating reflections (BSRs) acrossa broad region of southern Hydrate Ridge, offshore Oregon. The primary BSR (BSRp) is aregionally extensive reflection that lies 120–150 m below seafloor and exhibits typicalcharacteristics of a gas hydrate BSR. We also imaged a second weaker BSR (BSRs), 20–40 m below BSRp, with similar characteristics. BSRs is interpreted as a remnant of a BSRthat probably formed during the Last Glacial Maximum 18,000 years ago, when the baseof the gas hydrate stability zone (GHSZ) was deeper. An increase in bottom watertemperatures of 1.75�–2.25� and a corresponding sea level rise of 120 m could haveproduced the BSR shift. The preservation of BSRs for at least 5000 years, which is thetime since subseafloor temperatures stabilized following ocean warming after theLast Glacial Maximum, implies very slow upward advective and diffusive flow ofmethane (<1 m/1000 years in the vicinity of BSRs). BSRs appears where there are noresolvable steeply dipping faults and fractures, consistent with very low advective flowrates, and has dispersed where vertical fractures are visible. Free gas released by theshift in the BSR either migrates so slowly that it remains stable beneath the GHSZ or isdirected upward along fractures to reform as hydrate in the GHSZ. There is no evidencefor release of this free gas into the ocean or atmosphere.
Citation: Bangs, N. L. B., R. J. Musgrave, and A. M. Trehu (2005), Upward shifts in the southern Hydrate Ridge gas hydrate stability
zone following postglacial warming, offshore Oregon, J. Geophys. Res., 110, B03102, doi:10.1029/2004JB003293.
1. Introduction
[2] BSRs (bottom simulating reflections) are distinctive,commonly observed seismic reflections that roughly parallelthe seafloor. Although BSRs with positive polarity havebeen documented to form from mineral phase transitionssuch as opal CT to quartz [Hein et al., 1978], most BSRshave clear negative polarity and are attributed to physicalproperty contrasts generated by a sharp contact between gashydrates above the BSR and a few percent free gas below it[Miller et al., 1991]. Gas hydrate BSRs thus usually markthe base of the gas hydrate stability zone (GHSZ) defined byspecific pressure and temperature (P-T) conditions.[3] Geologic processes such as rising bottom water tem-
peratures, sea level rise, and tectonic uplift shift sediment P-T conditions and hydrate stability zones. If global P-Tchanges cause an upward shift of the GHSZ, hydratedissociation below the new GHSZ could potentially release
large volumes of methane stored in vast gas hydratereservoirs around the world and affect global climate[Mienert et al., 2000; Kennett et al., 2003]. Recent obser-vations of a rare, double BSR, in distinctively different,broadly ranging settings [Foucher et al., 2002; Andreassenet al., 2000; Mienert et al., 2000] imply the possibility thatshifting P-T conditions can leave behind a relict base of thegas hydrate stability zone [Foucher et al., 2002]. Thesedouble BSRs may thus offer clues to the dynamics ofhydrates by potentially revealing the response of gashydrates to changing P-T conditions, and the potential forrelease of methane, which is a powerful greenhouse gas,into the ocean and atmosphere.[4] In 2000, we acquired a high-resolution three-dimen-
sional (3-D) seismic reflection data set across southernHydrate Ridge to map the subsurface plumbing systemand geophysical properties of the sediment related to thehydrate and free gas system. For the first time we image adouble BSR with 3-D, high-resolution seismic data. Thispaper documents the regional extent and characteristics of adouble BSR, and presents a qualitative model for its
JOURNAL OF GEOPHYSICAL RESEARCH, VOL. 110, B03102, doi:10.1029/2004JB003293, 2005
Copyright 2005 by the American Geophysical Union.0148-0227/05/2004JB003293$09.00
B03102 1 of 13

formation and evolution. We also present calculationsestimating effects of these processes to first order in orderto demonstrate the model’s feasibility. Calculations arelimited to first order because of a lack of constraint on pastin situ conditions.
2. High-Resolution 3-D Seismic Reflection DataAcquisition and Processing
[5] The high-resolution 3-D seismic reflection data vol-ume across southern Hydrate Ridge (Figure 1) served as asite survey for designing the drilling plan for Leg 204[Trehu et al., 2003a] and for interpreting drilling results.Hydrate Ridge is a thrust ridge, uplifted by the collisionbetween the subducting Farallon plate and the North Amer-ican plate at a rate of �4.5 cm/yr in the Cascadia subductionzone. The crest of the ridge lies approximately 800 m belowthe sea surface, and forms a depositional basin on thelandward (eastern) flank. The high-resolution 3-D seismicimages of the ridge (Figure 2a) reveal detailed deforma-tional structures, such as thrusting, tilting and folding ofstratigraphic horizons.[6] During the high-resolution 3-D seismic experiment
we acquired 81 lines, each 11 km long, using a singlestreamer on the R/V Thomas G. Thompson. The lines are50 m apart and thus cover a 4 � 11 km2 area (Figure 1). Weused a Racal differential GPS (Global Positioning System)navigational system for determining ship’s position and shot
spacing. For the seismic source we used two 0.65 L (40 in.3)Generator Injector (GI) guns, towed from floats 2.5 mbelow the sea surface, fired simultaneously at 15 m inter-vals. The GI guns are designed to provide a high-frequency(25–250 Hz) impulsive source with minimal bubble pulseinterference. The source has a dominant frequency of 120 Hzand in these sediments (Vp < 1700 m/s) the data resolvelayers <5 m thickness. The receiver array was the Lamontportable high-resolution ITI solid-state streamer. It has48 channels with 12.5 m receiver spacing for a total activearray length of 600 m. Data were recorded at 1 ms samplingfor 6 s. Streamer depth was maintained at 2.5 m using5 control birds spaced every 150 m. The shallow depthswere maintained in order to match the source tow depthsand minimize receiver ghost effects at high frequencies. Wereconstructed receiver positions from five compasses 150 mapart.[7] The data were processed using Paradigm’s Focus
software. We edited noisy traces from shot gathers byinspecting each gather individually. The remaining traceswere sorted into 12.5 � 25 m bins with a nominal fold of 60traces. Some extended binning was used to fill in low foldareas by replicating traces from adjacent bins. We appliednormal moveout and stacked the binned traces followingvelocity analysis; however, these data are very insensitive tothe velocity function because of the short maximum offsetof �600 m. Data were migrated using 3-D poststackfrequency-wave number time migration in Focus, which
Figure 1. Location map showing 3-D area on southern Hydrate Ridge and the Leg 204 drill sites.Yellow lines mark the location of seismic line 296 shown in Figure 2a (southern line) and line 241 shownin Figure 12. White dot is the location of a 30 m high carbonate pinnacle protruding from the seafloor.
B03102 BANGS ET AL.: SHIFTS IN THE GAS HYDRATE STABILITY ZONE
2 of 13
B03102

migrates reflections to their proper position in both inlineand cross line directions.
3. BSRs Within Southern Hydrate Ridge
3.1. Primary BSR
[8] BSRs are common throughout Hydrate Ridge andappear prominently in our 3-D seismic volume acrosssouthern Hydrate Ridge. A regionally extensive BSR standsout as a high-amplitude reflection that roughly parallels theseafloor across the crest of the ridge, 100–130 m beneaththe seafloor (BSRp in Figure 2). On the true amplitudedisplay in Figure 2a, the BSR is consistently one of thebrightest subseafloor reflections. This reflection is readilydistinguished as a gas hydrate bottom simulating reflectionbecause it is phase reversed relative to the seafloor, roughlyparallels the seafloor, and intersects dipping and deformedstratigraphic horizons. The reversed polarity indicates adecrease in seismic impedance (the product of velocityand density) and is consistent with the contrast betweenhigh-velocity sediments containing hydrate overlying low-er-velocity sediment containing free gas. The lowest veloc-ities and low densities associated with BSRp are within a 5 minterval at the base of the GHSZ (Figure 2b).
3.2. Second BSR
[9] Throughout areas of the 3-D data volume, predomi-nantly on the western flank of the ridge, a second, relativelyweak seismic reflection lies between 20 and 40 m belowand nearly parallel to BSRp (Figure 2a). By comparison toBSRp, BSRs is considerably weaker and discontinuous. It isidentifiable as a distinct reflection for about 500 m betweencommon midpoint (CMP) 200 and CMP 250 in Figure 2aand fades into the noise level with only hints of thereflection across the rest of the profile. The polarity appearsto be the same for both BSRs, suggesting that BSRs is alsocaused by a decrease in velocity and/or density across thisinterface. Figure 2b shows a model for the BSRp and BSRs
at CMP 243 on line 296 showing that similar velocity anddensity changes and a low-velocity and low-density intervalproduce these reflections. CMP 243 was modeled because ithas a locally high BSRs amplitude, which can be distin-guished above noise and makes modeling easier.
3.3. Correlation Between the BSRs
[10] BSRs is common throughout the 3-D data volumeand nearly parallels the primary BSR (BSRp). In mappingthe BSRs we have picked the largest amplitude lobe of thereflection (red in Figure 2a). The separation between the
Figure 2. (a) A 1.5 km long portion of seismic line 296 across the crest of southern Hydrate Ridge fromthe 3-D seismic data volume. Display is true amplitude to compare relative amplitudes. Note BSRp isphase-reversed relative to the seafloor and intersects stratigraphic horizons closely paralleling theseafloor. BSRs lies 20–40 m below and is nearly parallel with BSRp. BSRs has the same phase as BSRp
but is considerable weaker and discontinuous. Note the terminations and amplitude changes ofstratigraphic horizons, especially horizon A, across BSRs. See Figure 1 for location. (b) Seismic model ofCMP 243 from line 296 constructed to show velocity and density that could produce two BSRs. Thicklines are models that produce the model seismic trace on the right. Gradients are derived from Site 1247log data. Seafloor reflection coefficient is estimated to be �0.15 by comparison with the seafloormultiple.
B03102 BANGS ET AL.: SHIFTS IN THE GAS HYDRATE STABILITY ZONE
3 of 13
B03102

BSRs varies from �20 m in the north and west to �40 m inthe southern and eastern areas of its observed occurrence(Figure 3). We note that, with some exceptions, this varia-tion corresponds approximately to the seafloor bathymetry(Figure 3, right), with greater separation beneath the ridgecrest.[11] The occurrence of BSRs is very patchy; however, its
occurrence is not random with respect to BSRp. Figure 4shows the region in which BSRs occurs (outlined in red) andthe areas of highest relative reflection amplitude (outlined inblack). BSRs amplitudes are 2–3 times less than BSRp
(Figure 4). The occurrence of BSRs is distinctly located onthe western flank of southern Hydrate Ridge, but, with afew exceptions, it lies beneath an area of moderate BSRp
amplitude and flanked by the areas of highest BSRp
reflection amplitudes (Figure 4b). BSRs is not a bubblepulse or other artifact of the seismic wavelet, because if itwere the amplitude of both BSRs would correlate well inamplitude and separation. They clearly do not.[12] There is a bubble pulse that can be seen as a
reflection that parallels the seafloor that is not a BSR. Thebubble pulse is distinguishable by its consistent separationand amplitude correlation between the bubble and mainsource pulses. A reflection that parallels the seafloor(Figure 2a) has both of these attributes (Figure 5); however,the correlation is degraded in places by other reflections thatinterfere with the bubble pulse. Our examination of theBSRs recognizes and avoids the bubble pulse.
3.4. Reflection Amplitude Changes at the BSRs
[13] Reflection amplitudes of stratigraphic horizons areapparently altered by the transition into the GHSZ. Brightreflections below the BSR weaken or commonly terminateat the base of the primary BSR (BSRp) (e.g., on the easternflank of Hydrate Ridge in Figure 2a), probably because of achange in the physical properties as free gas below thehydrate stability field changes to hydrate within the stabilityfield. Where BSRs is present, the reflection amplitudes ofstratigraphic horizons are also consistently higher beneath
BSRs and appear to terminate or substantially decrease inamplitude across this deeper boundary. This is especiallypronounced along horizon A (Figure 2a), which is a region-ally extensive seismic reflection that we mapped from thenorthernmost line of the survey to the summit of southernHydrate Ridge [Trehu et al., 2004b; Bangs et al., 2001;Trehu et al., 2002, 2003a]. Where it was drilled on Leg 204,horizon A is usually a 2–4 m thick interval of fine sandturbidites containing abundant volcanic glass shards sur-rounded above and below by silty clays. Sandy turbiditespresumably give it relatively high permeability. On the basisof Leg 204 density logs and other data, horizon A wasinterpreted as the primary conduit for free gas that hasmigrated from deep sources [Trehu et al., 2002, 2004b] andfeeds free gas to the hydrate stability zone at the summit ofsouthern Hydrate Ridge. The amplitude of horizon A shouldtherefore be larger below the GHSZ than within it.[14] A series of profiles across the western flank of
southern Hydrate Ridge reveals a common relationshipbetween BSRs and horizon A (Figure 6). Horizon Achanges amplitude at both BSRs. Near the summit, theamplitude of horizon A decreases to near zero at BSRs, andleaves little possibility for further decrease at BSRp. Furthernorth on lines 292 and 270, the amplitude decreasespartially at BSRs, and again at BSRp.
4. Interpretation of the BSRs
4.1. Upper BSR (BSRp)
[15] From Leg 204 evidence, BSRp is a typical gashydrate BSR that lies at the base of the GHSZ. The lowvelocities and densities that produce BSRp lie within a�5 mthick layer that probably contains locally high concentra-tions of free gas. Observations of cores, infrared photo-graphs of cores, pressure core samples, resistivity logs, andpore water geochemistry all indicate an abundance ofhydrate above BSRp, and none below it [Trehu et al.,2004a, 2003a]. Temperature profiles at Leg 204 drill sitespredict the base of the gas hydrate stability field between
Figure 3. Maps showing (left) the thickness between BSRs and BSRp and (right) seafloor bathymetry inmeters. These maps show a general relationship between the change in BSR depth and the seafloorbathymetry with exceptions.
B03102 BANGS ET AL.: SHIFTS IN THE GAS HYDRATE STABILITY ZONE
4 of 13
B03102

±10 and 20 m of the observed base of hydrate occurrence[Trehu et al., 2003a]. This places BSRp at the predicted baseof the methane hydrate stability field for structure I hydratesto within the limits of instrument errors. We interpret BSRp
as the active BSR in equilibrium with current P-T conditionsthat define the base of the hydrate stability field for structureI hydrates.
4.2. Lower BSR (BSRs)
[16] There are several possible interpretations for thedeeper BSR, BSRs. Our preferred interpretation is that BSRs
is a remnant from a time when the base of the gas hydratestability was deeper in the section and subsequently shiftedfollowing changes in P-T conditions. However, we will firstconsider two other possibilities.4.2.1. Structure II Hydrate BSR[17] Higher-order hydrocarbons, such as propane, lead to
the formation of structure II hydrates [Sloan, 1997], whichare stable at higher temperature than methane hydrate(structure I) and can therefore possibly form a second
BSR below the methane hydrate stability zone [Andreassenet al., 2000]. Other gases, such as CO2 and H2S have asimilar effect on hydrate stability. The region between thetwo BSRs could contain free methane gas and structure IIhydrate in the pore space. In that case, the depth of thesecond BSR should depend on the composition of gasespresent during formation of hydrates. Leg 204 drillingconfirmed the presence of thermogenic hydrocarbons withlocally high quantities of ethane, propane, and butane nearBSRp, especially in the vicinity of the primary gas conduit,horizon A [Trehu et al., 2003a], and BSRs could be the baseof the hydrate stability zone for structure II hydrates.[18] Although we cannot completely rule out BSRs as an
effect of the presence of gases other than methane, severalobservations conflict with this interpretation. Most compel-ling, Leg 204 drilling found considerable evidence forhydrates above BSRp, but no evidence was found for thepresence of hydrates beneath BSRp, either directly in cores,or indirectly as thermal anomalies in cores or resistivityanomalies in logs [Trehu et al., 2004a, 2003a]. Sites 1245,
Figure 4. (a) Amplitude maps of BSRs. Red outline shows the regional occurrence of BSRs. Bluepatchy areas show BSRs where the amplitude is large enough to recognize the reflection. (b) Amplitudemap of BSRp with occurrence of BSRs from Figure 4a superimposed. Note that BSRs most commonlylies adjacent to the areas of highest BSRp amplitude and beneath areas of moderate BSRp amplitude.Arrows point to tuning effects on BSR amplitudes due to interference with other horizons (e.g., horizonsB and B’ described by Trehu et al. [2003a], which are avoided in the interpretation of amplitudes.
B03102 BANGS ET AL.: SHIFTS IN THE GAS HYDRATE STABILITY ZONE
5 of 13
B03102

1247, 1248 and 1250 crossed both BSRs, offering severalopportunities to observe the presence of hydrates betweenthe BSRs, but we observed no hydrates or hydrate proxies.4.2.2. Opal/Quartz BSR[19] Although rare compared to gas hydrate BSRs, silica
phase transitions (opal-A to opal-CT or opal-CT to quartz)can also produce BSRs [Hein et al., 1978; Kuramoto et al.,1989]; however, they have geophysical signatures that aredistinctive from a hydrate BSR. Because of a densityincrease across the opal-A to opal-CT transition these BSRshave normal reflection polarity, which is not observed ineither BSRs or BSRp in our data. Furthermore, temperatureis a critical factor for these mineral phase transitions. Opal-A/opal-CT BSRs were found at temperatures between 35�and 50�C in Leg 127/128 in the Sea of Japan [Kuramoto etal., 1989], and the opal-CT to quartz transition was found attemperatures above 50�C at Site 1173 in the Nankai Trough[Mikada et al., 2002]. Leg 204 temperature measurements atthe BSR were substantially lower; typically �10�C. Neitherof the BSRs within Hydrate Ridge can therefore be attrib-uted to silica phase transitions.4.2.3. Relict BSR[20] Changes in pressure and temperature in sediments
will shift the GHSZ (Figure 7) and disrupt the BSR. BSRs
could be a remnant of an older gas hydrate stabilityboundary that is in the process of dispersing, as others havepredicted [e.g., von Huene and Pecher, 1999; Pecher et al.,2000] and interpreted [e.g., Foucher et al., 2002] elsewhere.The polarity and seismic models of BSRs (Figure 2b) areconsistent with a thin layer of free gas that is typical of aBSR that forms along the base of the gas hydrate stabilityzone. If the current BSR (BSRp) is representative of thecontinuity of an active BSR, BSRs has developed a patch-iness and weak reflection amplitude, probably from variableamounts of dispersion of the gas comprising BSRs by fluidadvection or methane diffusion since the shift from BSRs toBSRp.[21] In addition to the double BSRs, there is evidence
from other seismic reflections that support an upward shift
in the hydrate stability zone. As noted above, strongreflection amplitudes of dipping stratigraphic horizons usu-ally extend up to BSRp but decrease abruptly across it. Weinterpret the locally high amplitude of horizon A to be due tothe presence of free gas beneath the BSR. Free gas is knownto significantly affect reflectivity because of the effects offree gas on P wave velocity [Domenico, 1976]. The changein reflection amplitude is likely a result of the transition fromfree gas within the sediments below the hydrate stability
Figure 6. Three parallel seismic sections across the crestof southern Hydrate Ridge between Sites 1249 and 1247.Displays are true amplitude to show the relative amplitudeof reflections in each of the profiles. Note the progressionfrom the relatively high amplitude of BSRs in line 296 tolow amplitude of BSRs in line 270. Purple arrows mark thecoincident progression from the abrupt termination ofhorizon A at BSRs in line 296 to continuous reflectionsacross BSRs in line 270. Blue arrows show a coincidentincrease in reflection amplitude at the intersection ofhorizon A and BSRp.
Figure 5. Characteristics of amplitude and separationrelative to the seafloor reflection of the ‘‘bubble pulse’’ online 296 (Figure 2a). Separation (diamonds) is consistently�37 ms and varies �5 ms. Amplitudes are smoothed with a50-point running average. Amplitudes vary similarly;however, the bubble pulse is affected by interference fromother reflections.
B03102 BANGS ET AL.: SHIFTS IN THE GAS HYDRATE STABILITY ZONE
6 of 13
B03102
zone to gas hydrate above it. However, where BSRs isobserved, the amplitude change is often below the base ofthe GSHZ at BSRs rather than at BSRp. There are somerelatively high-amplitude reflections from horizonA betweenthe BSRs as noted in Figure 6 (blue arrows). Therefore thereis probably some free gas beneath BSRp, but the terminationsof horizon A at BSRs suggest that free gas that accumulatedat the old BSR (BSRs) is still there and may be in the processof migrating up to the new BSR (BSRp). This interpretationis consistent with a transition of the hydrate stability fieldfrom BSRs to BSRp and inconsistent with other alternativessuch as structure II hydrates.
5. Discussion
[22] The evidence presented here supports the existenceof two BSRs as due to a shift in the BSR from BSRs toBSRp as a response to changes in P-T conditions. However,several puzzling questions remain about observing two
BSRs. What caused the shift in the BSR, and is it geolog-ically reasonable and consistent with the recent conditionswithin southern Hydrate Ridge? When did the upward shifthappen and how old is the relict BSR? What does thedouble BSR imply about the dynamics of hydrates, theBSR, and migration of free gas through the sediments andinto the ocean or atmosphere after release from hydratedissociation following the P-T shift (i.e., the clathrate gunhypothesis)?[23] A likely geologic cause for the BSR shift is
changing P-T conditions following warming since theLast Glacial Maximum. Waelbroeck et al. [2002] estimatethat bottom water temperatures have risen by 2.2�C andthat sea level has risen 120 m since the Last GlacialMaximum, 18,000 years ago (Figure 8). Both changeswould have had a substantial effect on the position of theBSR. Sea level rise and bottom water temperaturechanges since the Last Glacial Maximum, however,should have had a global effect on hydrate stability, yet
Figure 7. Cartoons showing two mechanisms for creating a double BSR. (a) BSRs at the initialequilibrium stage lies at the intersection of the temperature (red line) and hydrate stability (green line)profiles. Tectonic uplift or sea level fall reduces overburden pressure and shift sediments relative to thehydrate stability curve and shifts the temperature profile. The BSRs shifts to BSRp, releasing free gas intosediments (yellow areas) from hydrate dissociation. (b) Bottom water temperature rising and conductinginto the sediments, increasing sediment temperatures while maintaining the thermal gradient. Elevatedtemperatures shift the hydrate stability boundary upward. BSRs shifts to BSRp.
B03102 BANGS ET AL.: SHIFTS IN THE GAS HYDRATE STABILITY ZONE
7 of 13
B03102

observations of a double BSR are relatively rare. We willfirst consider the possibility of localized changes in P-Tconditions within Hydrate Ridge as the cause of the shiftin the BSR before examining if BSRs could be a relictBSR from the Last Glacial Maximum.
5.1. Tectonic Uplift, Sea Level Fall,or Temperature Rise?
[24] We calculated the magnitude of tectonic, sea level orthermal effects for a 20–40 m upward shift of the BSR toexamine whether these effects are geologically reasonablefor Hydrate Ridge. Figure 7 shows the effects on the GHSZfrom either a pressure decrease from tectonic uplift (or sealevel drop), or an increase in bottom water temperature.Although at equilibrium there is an identical outcome fromeither of these scenarios, bottom temperature changes,unlike pressure effects, have significant time lags due tothermal propagation from the seafloor to the BSR. Weassume that temperature equilibrates to a constant thermalgradient or a constant basement temperature at 6 km depth[Trehu et al., 1994], which are within error limits of eachother (55�C/km versus 54.6�C/km, respectively).[25] Figure 9 shows the amount of tectonic uplift (or sea
level fall) or of bottom water temperature increase needed toexplain the observations. In each of the maps we use thehydrate stability curve of Dickens and Quinby-Hunt [1994]for hydrate formation in the presence of seawater. On the basisof the observed thermal gradients of 53–57�C/km at Leg204 drill sites, we assumed a constant thermal gradient of55�C/km [Trehu et al., 2003a]. Following the scenariodepicted in Figure 7a, we calculate an uplift (or sea levelfall) of 100–170 m to shift the BSR from BSRs to BSRp
(Figure 9a). (A second-order effect is the effect of a bottom
Figure 8. Timeline to illustrate the timing of variousevents and processes that led to the development of BSRs.Solid lines are likely timing and duration of events. Dashedlines represent the likely uncertainty. Diagonal lines arevarious time lags that may have delayed the upward shift ofBSRs. See text for more details.
Figure 9. Maps of bottom water temperature changes and/or tectonic uplift required to match observedshift from BSRs to BSRp. (a) Bottom water temperature changes only, (b) tectonic uplift (or sea level fall)only, and (c) bottom water temperature changes assuming simultaneous 120 m sea level rise.
B03102 BANGS ET AL.: SHIFTS IN THE GAS HYDRATE STABILITY ZONE
8 of 13
B03102

water temperature change associated with a change in thewater column height. Estimates from current seawater tem-perature profiles [Trehu et al., 2003a] are 0.20/100�C. Afterthis temperature change propagates to the BSR, it will affectBSR depth by�25%. For simplicity, it will be ignored in thisdiscussion.) The greatest uplift occurs near the crest ofHydrate Ridge. Following the scenario depicted inFigure 7b, the rise in bottom water temperatures needed toshift the BSR fromBSRs to BSRp is 0.75�–1.25� (Figure 9b).[26] Is tectonic uplift a reasonable cause of the shift of the
BSR in southern Hydrate Ridge? This question can beaddressed by determining if 100–170 m of uplift could occurwithin a short enough time for BSRs to survive the diffusionand advective processes that will disperse it. It has taken�1.6 my to raise trench sediments of this age from a depth of�2,900 m to their present depth of �1000 m. The long-termaverage uplift rate is 0.001188 m/yr. It would therefore take85,000–143,000 years (63,000–108,000 years with the 25%correction) on average to uplift the ridge 100–170 m.Foucher et al. [2002] estimate roughly that the free gas layerthat produces the relict BSR cannot survive more than�10,000 years without dispersing by diffusion or advection(discussed further below).[27] Recent uplift might be substantially faster than the
average uplift rate if recent uplift occurred from an extremetectonic event, such as seamount or ridge subduction. In theextreme case, all of the plate convergence might occur alongfaults beneath Hydrate Ridge and an uplift of 100–170 mcould be possible in 4400–7400 years. However, there is noevidence that such an extreme event is currently underway,so we conclude that tectonic uplift can be ruled out.[28] Furthermore, the transition from BSRs to BSRp
probably represents two periods of relatively stable P-Tconditions separated by a period of rapid changes. Uplift of100–170 m would probably have to occur in multiplestages that would generate additional BSRs in betweenBSRs and BSRp, and these are not seen.[29] Could local bottom water temperature changes cause
a shift in the BSR? Figure 9 shows that a temperatureincrease of 0.75–1.25�C would cause the observed BSRshift. The larger temperature shifts are associated withshallower seafloor depths, which is reasonable from down-ward propagation of surface water warming in recent times.However, if bottom water warming does not occur on thetimescale of <5000 years, global bottom water temperaturesand sea level rise since the Last Glacial Maximum will alsoaffect the hydrate stability boundary. Local bottom watertemperature changes on Hydrate Ridge can be considered apossibility if they occurred recently enough to be distinctfrom global glacial events. There is a considerable time lagassociated with the propagation of bottom water temper-atures through the sediments to the depths of the BSR.Figure 10 shows temperature profiles to depths of the BSRfollowing an increase in bottom water temperature of 2�following Louden and Wright [1989]. Thermal lags initiallyaffect the BSR little, and then a rapid upward shift isfollowed by a slow rise to equilibrium. Observed tempera-ture profiles from Leg 204 are consistent with an equilib-rium conductive thermal gradient and show no indication ofa downward propagating thermal pulse. On the basis of theobservation that the upward position of the BSR does notbegin to stabilize until 5000 to 10,000 years after the initial
pulse, we speculate that bottom water temperature changeslarge enough to shift the BSR significantly had to occurmore than 5000 and possibly as much as 10,000 years ago(Figure 8).
5.2. BSRs, a Remnant From the Last Glacial Maximum
[30] A shift in the BSR is likely the result of postglaciationP-T changes within Hydrate Ridge as suggest by others fornorthern Cascadia [Westbrook et al., 1994], southwesternJapan [Foucher et al., 2002], and the Norwegian margin[Posewang and Mienert, 1999]. Estimates of bottom watertemperatures from 18O isotopes taken from benthic forams inthe Pacific show a 2.2� rise in temperatures in the past18,000 years [Waelbroeck et al., 2002]. The largest in-
Figure 10. Temperature data for Sites 1245 (open circles)and 1247 (solid circles) and calculated temperature profiles(thin annotated curves) following a bottom water tempera-ture increase from 2� to 4�. We assume a temperaturegradient of 0.055�/m, which fits data from Site 1245 well,and may be slightly high for Site 1247. Numbers indicateyears following temperature change. Thick line on the right-hand side is the theoretical base of the gas hydrate stabilityzone for hydrate in seawater [Dickens and Quinby-Hunt,1994]. Horizontal lines are the positions of the BSR atvarious times. Note that the BSR does not become stable forat least 5000 years and possible 10,000 years. Temperaturedata suggest a bottom water temperature rise of 2�C wouldhave had to occur at least 5000 years ago and possibly10,000 years ago.
B03102 BANGS ET AL.: SHIFTS IN THE GAS HYDRATE STABILITY ZONE
9 of 13
B03102
crease occurred between 10,000 and 18,000 years ago.Concurrently, Waelbroeck et al. [2002] estimate that sealevel has risen globally by 120–130 m. While a bottomwater temperature rise of 2.2� is substantially larger thanwhat is needed to shift BSRs to BSRp, the sea level risehas an opposite effect on the position of the base of thehydrate stability zone. Figure 9c shows changes of 1.75–2.25� will shift BSRs to BSRp with a coincident 120 m sealevel rise. These changes in bottom water temperatures andsea level since the Last Glacial Maximum, most of whichoccurred more than 10,000 years ago, are sufficient tocause a shift of the BSR from BSRs to BSRp. Given thelag in thermal propagation, we believe that the observedchanges in bottom water temperatures and sea level risethat have occurred since the Last Glacial Maximum are abetter explanation of the shift of the BSR than a smaller,more recent bottom water temperature change (Figure 8).
5.3. Time Frame for the BSR Shift
[31] The time frame of the BSR shift is further criticalevidence that BSRs shifted as part of the last glacial cycle,but also it reveals the dynamics of the hydrate/free gassystem in response to the changing P-T conditions. Theobservation of a relict BSR, puts constraints on the time-scale over which gas hydrates decompose and the productsof this decomposition disperse in nature. If concentrationsof free gas within the BSRs layer (Figure 2b) are below thethreshold for percolation, which they likely are, the mech-anism for methane migration is diffusion within the porefluid or advection with migrating pore fluids [Henry et al.,1999]. Temperature profiles measured on Leg 204 showlinear thermal gradients to within the limitations of theinstrument error (Figure 10). We estimate from the temper-ature profiles at Sites 1245 and 1247 that upward advectioncan not be greater than 3.5 � 10�10 m/s or 11 m/1000 yearsand still fit the temperature profile. The advection modelfollows Turcotte and Schubert [1982, p. 401] and assumesthermal conductivity of 1.0 W/m �K, fluid density of1000 kg/m3, fluid specific heat of 4000 J/kg �K, and areservoir temperature of 50�C. At this advection rate BSRs
would disperse half the seismic wavelength (�10 m) in900 years. We speculate that BSRs would not be recogniz-able in the seismic section unless advection has beenextremely slow, substantially less than 11 m/1000 years.[32] In an alternative scenario, Foucher et al. [2002]
make a crude estimate that without any advection, or freegas percolation, a free gas interval would diffuse 10 m,more than enough to become seismically unrecognizable, in1000 years. Following Foucher et al. [2002], a roughestimate of the average diffusion distance can be madefor Hydrate Ridge. Methane concentration measurements[Milkov et al., 2003] indicate some undersaturated samplesbetween the free gas intervals that produce the BSRs, andtherefore there is a concentration gradient that can drivediffusion. If we assume a linear concentration gradient, wecan use the Einstein-Smoluchowski equation [Levine, 1978]for diffusion (xrms = 2Dtð Þ
1=2 ) where x is the diffusiondistance, D is the diffusion coefficient, and t is time. Ifwe conservatively assume the same value for D (0.02 m2/yr)as Foucher et al. [2002] (D depends on temperature,porosity, and tortuosity but should range between 0.021and 0.023 m2/yr for sediments between 0 and 500 m below
seafloor [Martin et al., 1996]) and that the BSR free gaslayer diffuses both upward and downward an average of 5 m(10 m total), the estimated time is 625 years (Foucher et al.[2002] estimate this as �1000 years). Foucher et al. [2002]also assume that with the presence of free gas, whichdissolves into solution as methane diffuses away, thediffusion time increases in proportion to the ratio of totalmethane to dissolved methane, which they estimate as 3–10from pressure core sampler (PCS) measurements fromBlake Ridge. On the basis of a few Leg 204 PCS measure-ments between the BSRs it is �3 [Milkov et al., 2003] butprobably higher at BSRs (Figure 2b). Foucher et al. [2002]estimate diffusion would disperse a BSR 10 m in<10,000 years. A similar rough estimate of diffusion of aBSR layer 10 m for Hydrate Ridge could also be 3000–10,000 years (Figure 8). Preservation of a BSR long enoughto survive since postglacial warming is probably onlypossible with near-zero fluid advection and high enoughfree gas concentrations within BSRs to assure that it doesnot diffuse away quickly. Low velocities and densitiesbelow BSRs is evidence for the free gas that could helpsustain BSRs (Figure 2b) [Trehu et al., 2003a].[33] Further critical evidence for the age of BSRs is
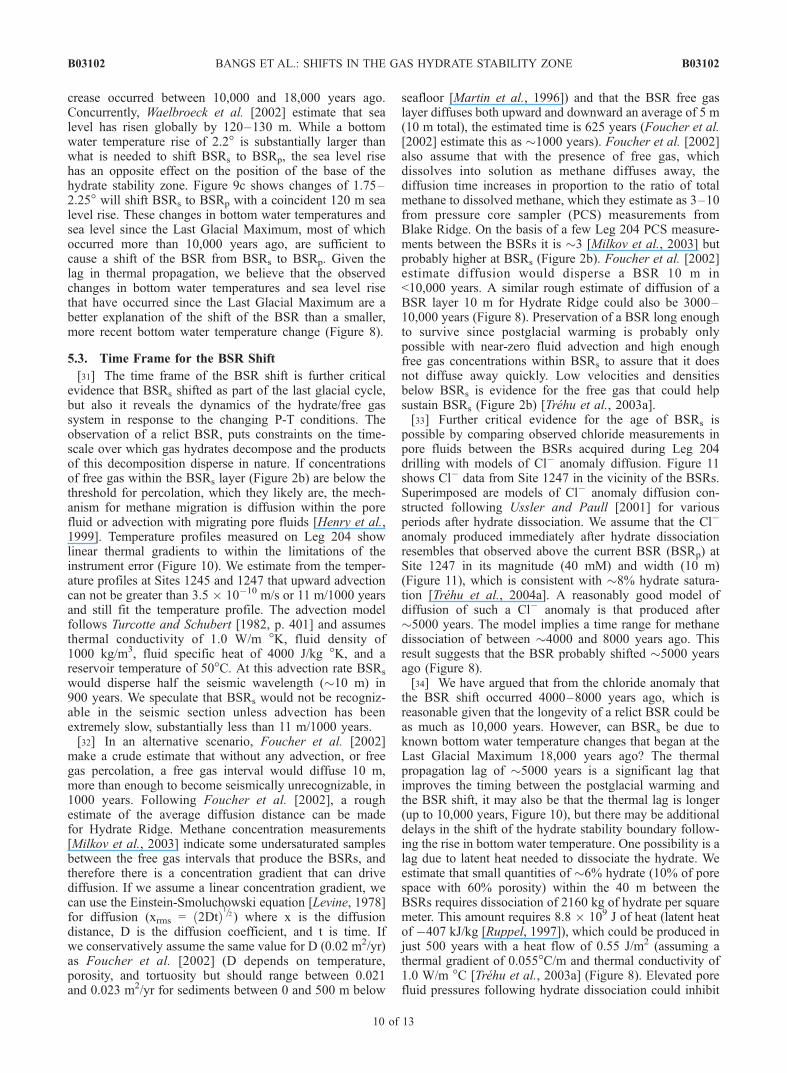
possible by comparing observed chloride measurements inpore fluids between the BSRs acquired during Leg 204drilling with models of Cl� anomaly diffusion. Figure 11shows Cl� data from Site 1247 in the vicinity of the BSRs.Superimposed are models of Cl� anomaly diffusion con-structed following Ussler and Paull [2001] for variousperiods after hydrate dissociation. We assume that the Cl�
anomaly produced immediately after hydrate dissociationresembles that observed above the current BSR (BSRp) atSite 1247 in its magnitude (40 mM) and width (10 m)(Figure 11), which is consistent with �8% hydrate satura-tion [Trehu et al., 2004a]. A reasonably good model ofdiffusion of such a Cl� anomaly is that produced after�5000 years. The model implies a time range for methanedissociation of between �4000 and 8000 years ago. Thisresult suggests that the BSR probably shifted �5000 yearsago (Figure 8).[34] We have argued that from the chloride anomaly that
the BSR shift occurred 4000–8000 years ago, which isreasonable given that the longevity of a relict BSR could beas much as 10,000 years. However, can BSRs be due toknown bottom water temperature changes that began at theLast Glacial Maximum 18,000 years ago? The thermalpropagation lag of �5000 years is a significant lag thatimproves the timing between the postglacial warming andthe BSR shift, it may also be that the thermal lag is longer(up to 10,000 years, Figure 10), but there may be additionaldelays in the shift of the hydrate stability boundary follow-ing the rise in bottom water temperature. One possibility is alag due to latent heat needed to dissociate the hydrate. Weestimate that small quantities of �6% hydrate (10% of porespace with 60% porosity) within the 40 m between theBSRs requires dissociation of 2160 kg of hydrate per squaremeter. This amount requires 8.8 � 109 J of heat (latent heatof �407 kJ/kg [Ruppel, 1997]), which could be produced injust 500 years with a heat flow of 0.55 J/m2 (assuming athermal gradient of 0.055�C/m and thermal conductivity of1.0 W/m �C [Trehu et al., 2003a] (Figure 8). Elevated porefluid pressures following hydrate dissociation could inhibit
B03102 BANGS ET AL.: SHIFTS IN THE GAS HYDRATE STABILITY ZONE
10 of 13
B03102

the upward migration of the hydrate stability field and theBSR by compensating for the temperature rise and effec-tively delay the shift of the BSR [Pecher et al., 2000].However, we can only speculate on past fluid pressures.Pore water freshening effects following hydrate dissociationwould change the P-T phase boundary for free gas and gashydrate in pore fluid [Dickens and Quinby-Hunt, 1994],which would also stabilize the BSR during a temperaturerise. The effect, however, could only be sustained for asignificant time with slow advection and diffusion offreshened pore waters. These additional mechanisms canpotentially contributed to delay the shift of the BSR andimprove the timing between the known bottom waterwarming and the BSR shift (Figure 8).
5.4. Dynamics of Gas Hydrate, BSRs, and Free Gas
[35] If our interpretation of the double BSR as an upwardshift from BSRs to BSRp following postglacial maximumwarming is correct, then the changes in P-T conditionsimplied by the double BSR have created a natural experi-ment for examining the effects of changing P-T condition onthe BSR, gas hydrates and the free gas system. Kennett etal. [2003] describe release of methane during interglacial
periods following bottom water warming as the ‘‘clathrategun hypothesis.’’ The results presented here examine justsuch a scenario.[36] As discussed above, preservation of the BSR for
5000 years implies extremely slow upward advective flowand high gas concentrations at BSRs. We suggest that areaswhere BSRs is preserved have a lower advective flow ratethan the areas where BSRs is not observed. Fracturepermeability from faults probably has a large role inpreservation of BSRs. Figure 12 shows the disappearanceof BSRs where normal faults developed from uplift andextension of the crest of southern Hydrate Ridge. Thesenormal faults are typically found on the eastern flank ofsouthern Hydrate Ridge coincident with both a weak ornonexistent BSRs and higher BSRp amplitudes.[37] This observation has two implications.[38] 1. The formation of BSRp above a relict BSRs occurs
even without upward migration of free gas. If upwardmigration of gas were required to develop BSRp, it wouldsimultaneously destroy the relict BSRs. Where BSRs hasdispersed, advective flow may have also enhanced the gasconcentration and contributed to enhance the BSRp seismicreflection amplitude. BSRp amplitude is higher in areaswhere BSRs is not preserved. However, a relatively strongBSRp still forms above BSRs even though very littleadvective or diffusive migration of free gas has occurred,as the survival of BSRs implies. BSRp must therefore formfrom exsolution from fluids saturated or supersaturated inmethane.[39] 2. Localized fractures probably control the migration
of free gas released from hydrate dissociation following amajor warming event like the recent postglacial warming.Gas migration along fractures can also serve to direct freegas from beneath the hydrate stability zone into it, as alsoinferred in the Blake Ridge [Gorman et al., 2002]. Trehu etal. [2004a] noted higher concentrations of hydrates withinand near vertical fractures on the eastern flank of HydrateRidge at Sites 1244 and 1246, relative to the western flankat Site 1245 where there are fewer vertical fractures. We donot see indications that the BSR is perturbed upward atfaults due to upward advection of warm fluids along thesefaults. Trehu et al. [2003b] calculate that a minimum flowrate of >1 cm/yr is needed to observe such a perturbed BSR,while an upward advection rate of >1 cm/yr would dissipateBSRs in <1000 years.
5.5. Significance of the Double BSR
[40] While rising bottom water temperatures followingthe Last Glacial Maximum are a global phenomenon, theoccurrence of two parallel BSRs is a relatively rare obser-vation and is thus an indicator of global and local con-ditions. These conditions are likely (1) a lengthy period ofstable P-T conditions that established a significant BSRinitially, (2) a significant shift in P-T conditions, (3) little orno fluid advection following a shift in P-T conditions, and(4) sufficient free gas to prevent BSRs from dispersingquickly by diffusion. The observation of a double BSR thusimplies that there is unusually high methane concentrationin pore waters, some probably released from hydrate disso-ciation following the shift in bottom water temperatures asdescribed in the ‘‘clathrate gun hypothesis’’ [Kennett et al.,2003]. However, the clathrate gun hypothesis does not work
Figure 11. Chloride concentrations in pore water samplesfrom Site 1247 compared with expected Cl� concentrationsderived from a model of a Cl� diffusion following hydratedissociation. Crosses are Site 1247 Cl� pore water data.Note the freshening above BSRp, which is attributed tohydrate dissociation. The initial model, t = 0, has width(10 m) and magnitude comparable to the Cl� anomaly aboveBSRp. Hydrate diffusion is calculated following Ussler andPaull [2001] using diffusion equation 2.15 from Crank[1975]. We used a diffusion coefficient of 2.5 � 10�9 m2/s.The data are reasonably well matched at t = 5000 years. Theage of BSRs is probably <8000 years and >4000 years.
B03102 BANGS ET AL.: SHIFTS IN THE GAS HYDRATE STABILITY ZONE
11 of 13
B03102

here, because once released, the free gas migrated very littleand was not released into the atmosphere. Although thedouble BSR is rare, it may be rare because of unusuallyhigh free gas concentrations within the relict BSR as muchas it is due to slow methane migration. Areas without adouble BSR may also be areas of slow upward migration ofmethane that would impede release of methane into theatmosphere described in the ‘‘clathrate gun hypothesis’’.Areas of southern Hydrate Ridge where BSRs is notpreserved have vertical faults and fractures that have in-creased the advective flow enough to disperse BSRs, buthave also directed the gas upward into the hydrate stabilityzone where it has reformed as gas hydrate and enhancedlocal hydrate concentrations [Trehu et al., 2004a]. Giventhat fracturing on the eastern flank of Hydrate Ridgecoincides with higher BSRp amplitudes, fracture permeabil-ity may also serve to enhance free gas concentrations at thebase of the gas hydrate stability zone.
6. Conclusions
[41] Beneath the primary BSR (BSRp), we have mapped asecond, weaker bottom simulating reflection (BSRs) acrossthe crest of southern Hydrate Ridge with 3-D seismicreflection data. BSRs lies 20–40 m beneath BSRp and isobserved mostly on the western flank of southern HydrateRidge. From observations during Leg 204, BSRp lies at thebase of the hydrate occurrence zone and is in equilibriumwith pressure and temperature conditions that define the
base of hydrate stability. BSRs is not currently the primarymethane hydrate BSR. We suggest that it represents thedisintegrating remnants of a BSR that existed stably for anextended period under past P-T conditions. The most likelycause for the upward migration of the BSR is changing P-Tconditions within the last 18,000 years. An increase inbottom water temperatures of 1.75–2.25� and a 120 m risein sea level shifts the BSR upward 20–40 m and fits withestimates of bottom water temperatures and sea level risesince the Last Glacial Maximum 18,000 years ago.[42] The significance of the double BSR is that it indi-
cates where significant amounts of gas was released fromdissociated hydrate as the BSR migrated upward, and itdemonstrates that the gas can stay in place for extendedperiods of �5000 years. The stability of the gas is becauseof low permeability, and slow diffusion along the westernflank of Hydrate Ridge. On the eastern flank of HydrateRidge, faults have formed and fracture permeability ishigher. The fracture pathways contribute to disperse BSRs
faster, and direct methane released by gas hydrate dissoci-ation migrate back into the gas hydrate stability zone toreform as hydrate. There is no evidence for escape ofmethane to the ocean through this process.
[43] Acknowledgments. We thank JGR Associate Editor WilliamWaite, Brandon Dugan, Warren Wood, and an anonymous reviewer forhelpful comments and suggestions that improved the manuscript. Thisresearch used samples and/or data provided by the Ocean Drilling Program(ODP). ODP is sponsored by the U.S. National Science Foundation (NSF)and participating countries under management of Joint Oceanographic
Figure 12. Seismic line 241 showing a coincident relationship between the amplitude of BSRs and thelocation of numerous normal faults (between arrows). This is a true amplitude display. See Figure 1 forlocation. See text for details.
B03102 BANGS ET AL.: SHIFTS IN THE GAS HYDRATE STABILITY ZONE
12 of 13
B03102

Institutions (JOI), Inc. This work was funded by JOI-USSSP F00161,NSF OCE-9907205, and OCE-0002487 at UTIG and OCE-9906990 andOCE-0002410 at OSU. This is UTIG contribution 1724.
ReferencesAndreassen, K., J. Mienert, P. Bryn, and S. C. Singh (2000), A double gas-hydrate related bottom simulating reflector at the Norwegian continentalmargin, in Gas Hydrates: Challenges for the Future, edited by G. D.Holder and P. R. Bishnoi, Ann. N. Y. Acad. Sci., 912, 126–135.
Bangs, N. L., A. M. Trehu, and M. Sen (2001), Mapping methane-rich fluidsystems within southern Hydrate Ridge with high-resolution 3-D seismicreflection data, Eos Trans. AGU, 82(47), Fall Meet. Suppl., AbstractOS12B-0422.
Crank, J. (1975), The Mathematics of Diffusion, Clarendon, Oxford, U.K.Dickens, G. R., and M. S. Quinby-Hunt (1994), Methane hydrate stabilityin seawater, Geophys. Res. Lett., 21, 2115–2118.
Domenico, S. N. (1976), Effect of brine-gas mixture on velocity in anunconsolidated sand reservoir, Geophysics, 41, 882–894.
Foucher, J.-P., H. Nouze, and P. Henry (2002), Observation and tentativeinterpretation of a double BSR on the Nankai slope, Mar. Geol., 187,161–175.
Gorman, A. R., W. S. Holbrook, M. J. Hornbach, K. L. Hackwith,D. Lizarralde, and I. Pecher (2002), Migration of methane gas throughthe hydrate stability zone in a low-flux hydrate province, Geology, 30,327–330.
Hein, J. R., D. W. Scholl, J. A. Barron, M. G. Jones, and J. Miller (1978),Diagenesis of late Cenozoic diatomaceous deposits and formation of thebottom simulating reflector in southern Bering Sea, Sedimentology, 25,155–181.
Henry, P., M. Thomas, and M. B. Clennel (1999), Formation of natural gashydrates in marine sediments: 2. Thermodynamic calculations of stabilityconditions in porous sediments, J. Geophys. Res., 104, 23,005–23,022.
Kennett, J. P., K. G. Cannariato, I. L. Hendy, and R. J. Behl (2003),Methane Hydrates in Quaternary Climate Change: The Clathrate GunHypothesis, 216 pp., AGU, Washington, D. C.
Kuramoto, S., K. Tamaki, M. G. Langseth, D. C. Nobes, H. Tokuyama,K. A. Pisciotto, and A. Taira (1989), Can opal-A/opal.-CT BSR be anindicator of the thermal structure of the Yamato Basin, Japan Sea?, Proc.Ocean Drill. Program Sci. Results, 127/128, 1145–1156.
Levine, I. N. (1978), Physical Chemistry, McGraw-Hill, New York.Louden, K. E., and J. A. Wright (1989), Marine heat flow data: A newcompilation of observations and brief review of its analysis, in CRCHandbook of Seafloor Heat Flow, edited by J. A. Wright and K. E.Louden, pp. 3–67, CRC Press, Boca Raton, Fla.
Martin, J. B., M. Kastner, P. Henry, X. Le Pichon, and S. Lallement (1996),Chemical and isotopic evidence for sources of fluids in a mud volcanofield seaward of the Barbados accretionary wedge, J. Geophys. Res., 101,20,325–20,345.
Mienert, J., K. Andreassen, J. Posewang, and D. Lukas (2000), Changes ofthe hydrate stability zone of the Norwegian marine from glacial to inter-glacial times, in Gas Hydrates: Challenges for the Future, edited by G. D.Holder and P. R. Bishnoi, Ann. N. Y. Acad. Sci., 912, 200–210.
Mikada, H., et al. (2002), Proceedings of the Ocean Drilling Program,Initial Reports [CD-ROM], vol. 196, Ocean Drill. Program, CollegeStation, Tex.
Milkov, A. V., G. E. Claypool, Y.-J. Lee, W. Xu, G. R. Dickens, W. S.Borowski, and ODP Leg 204 Scientific Party (2003), In situ methaneconcentrations at Hydrate Ridge, offshore Oregon: New constraints onthe global gas hydrate inventory from an active margin, Geology, 31,833–836.
Miller, J. J., M. W. Lee, and R. von Huene (1991), An analysis of a seismicreflection from the base of the gas hydrate zone, offshore Peru, AAPGBull., 75, 910–924.
Pecher, I. A., N. Kukowski, C. R. Ranero, and R. von Huene (2000), Gashydrates along the Peru and Middle America Trench systems, in NaturalGas Hydrates: Occurrence, Distribution, and Detection, Geophys.Monogr. Ser., vol. 124, edited by C. K. Paull and W. P. Dillon,pp. 257–271, AGU, Washington, D. C.
Posewang, J., and J. Mienert (1999), The enigma of double BSRs: Indica-tors for changes in the hydrate stability field?, Geo Mar. Lett., 19, 157–163.
Ruppel, C. (1997), Anomalously cold temperatures observed at the base ofthe gas hydrate stability zone on the U.S. Atlantic passive margin, Geol-ogy, 25, 699–702.
Sloan, E. D. (1997), Clathrate Hydrates of Natural Gases, CRC Press,Boca Raton, Fla.
Trehu, A. M., I. Asudeh, T. M. Brocher, J. Luetgert, W. D. Mooney, J. L.Nabelek, and Y. Nakamura (1994), Crustal architecture of the Cascadiaforearc, Science, 265, 237–243.
Trehu, A. M., N. L. Bangs, M. A. Arsenault, G. Bohrmann, C. Goldfinger,J. E. Johnson, Y. Nakamura, and M. E. Torres (2002), Complex subsur-face plumbing beneath southern Hydrate Ridge, Oregon continental mar-gin, from high-resolution 3-D seismic reflection and OBS data, paperpresented at Fourth International Conference on Gas Hydrates, HeatTransfer Soc. of Jpn., Yokohama, Japan.
Trehu, A. M., et al. (2003a) Proceedings of the Ocean Drilling Program,Initial Reports [CD-ROM], vol. 204, Ocean Drill. Program, CollegeStation, Tex.
Trehu, A. M., D. S. Stakes, C. D. Bartlett, J. Chevallier, R. A. Duncan, S. K.Goffredi, S. M. Potter, and K. A. Salamy (2003b), Seismic and seafloorevidence for free gas, gas hydrates, and fluid seeps on the transformmargin offshore Cape Mendocino, J. Geophys. Res., 108(B5), 2263,doi:10.1029/2001JB001679.
Trehu, A. M., et al. (2004a), Three-dimensional distribution of gas hydratebeneath the seafloor: constraints from ODP Leg 204, Earth Planet. Sci.Lett., 845–862.
Trehu, A. M., P. B. Flemings, N. L. Bangs, J. Chevallier, E. Gracia, J. E.Johnson, C.-S. Liu, X. Liu, M. Riedel, and M. E. Torres (2004b), Feedingmethane vents and gas hydrate deposits at south Hydrate Ridge, Geophys.Res. Lett., 31, L23310, doi:10.1029/2004GL021286.
Turcotte, D. L., and G. Schubert (1982), Geodynamics, Applications ofContinuum Physics to Geological Problems, John Wiley, Hoboken, N. J.
Ussler, W., III, and C. K. Paull (2001), Ion exclusion associated with marinegas hydrate deposits, in Natural Gas Hydrates: Occurrence, Distribution,and Detection, Geophys. Monogr. Ser., vol. 124, edited by C. K. Paulland W. P. Dillon, pp. 41–51, AGU, Washington, D. C.
von Huene, R., and I. A. Pecher (1999), Neotectonics and the origins ofBSRs along the Peru margin, Earth Planet. Sci. Lett., 166, 47–55.
Waelbroeck, C., L. Labeyrie, E. Michel, J. C. Duplessy, J. F. McManus,K. Lambeck, E. Balbon, and M. Labracherie (2002), Sea-level and deepwater temperature changes derived from benthic foraminifera isotopicrecords, Quat. Sci. Rev., 21, 295–305.
Westbrook, G. K., et al. (1994), Proceedings of the Ocean Drilling Pro-gram, Initial Reports, vol. 146, Part 1, pp. 5–14, Ocean Drill. Program,College Station, Tex.
�����������������������N. L. B. Bangs, University of Texas Institute for Geophysics, 4412
Spicewood Springs Rd., Austin, TX 78759, USA. ([email protected])R. J. Musgrave, Department of Earth Sciences, La Trobe University,
Bundoora, Victoria 3086, Australia. ([email protected])A. M. Trehu, College of Oceanic and Atmospheric Sciences, Oregon
State University, 104 Ocean Admin Bldg, Corvallis, OR 97331-5503, USA.([email protected])
B03102 BANGS ET AL.: SHIFTS IN THE GAS HYDRATE STABILITY ZONE
13 of 13
B03102