Caste and Upward Mobility
28
Chapter 7 CASTE AND UPWARD MOBILITY Vegard Iversen 1 Introduction A key question confronting India, well into the postiberalization era, 1 is whether— and if so, why—the traditional institution of caste may be beginning to lose its grip. This matter is not only of academic interest. It remains a fact that the social groups at the bottom of the caste hierarchy (scheduled castes, or SCs) or otherwise judged worthy of special concessions 2 continue to be overrepresented among the rural and urban poor. This is in spite of radical, comprehensive, and enduring pol- icy interventions to address this idiosyncratic facet of Indian deprivation. While representing 16.2% and 8.2% of the population, respectively, almost half (47.3%) of India’s poor rural households belonged to one of these two groups in 1999/2000 (Gang et al. 2008). 3 Described as “a silent revolution,” a vital ingredient for a radical social trans- formation already appears to be in place. The gradual ascent of lower castes into north Indian legislative assemblies following earlier and similar progress in the South and West 4 has not only altered India’s political landscape but spurred a new optimism. Consistent with a strengthening of the lower castes’ political muscle, Banerjee and Somanathan (2007) report faster progress in rural public goods sup- ply in parliamentary constituencies with high concentrations of SCs, while sched- uled tribe (ST) and Muslim constituencies continued to lag behind. Change is discernible also in education statistics and in empirical studies of the persistence of educational deprivation (Jalan and Murgai 2008). Disaggregating by sex and OUP UNCORRECTED PROOF – FIRST-PROOF, 11/29/11, NEWGEN 07_Ghate_CH07.indd 1 11/29/2011 9:57:34 PM
-
Upload
greenwich2 -
Category
Documents
-
view
6 -
download
0
Transcript of Caste and Upward Mobility

Chapter 7
Caste and Upward Mobility
Vegard Iversen
1 introduction
A key question confronting India, well into the postiberalization era,1 is whether—and if so, why—the traditional institution of caste may be beginning to lose its grip. This matter is not only of academic interest. It remains a fact that the social groups at the bottom of the caste hierarchy (scheduled castes, or SCs) or otherwise judged worthy of special concessions2 continue to be overrepresented among the rural and urban poor. This is in spite of radical, comprehensive, and enduring pol-icy interventions to address this idiosyncratic facet of Indian deprivation. While representing 16.2% and 8.2% of the population, respectively, almost half (47.3%) of India’s poor rural households belonged to one of these two groups in 1999/2000 (Gang et al. 2008).3
Described as “a silent revolution,” a vital ingredient for a radical social trans-formation already appears to be in place. The gradual ascent of lower castes into north Indian legislative assemblies following earlier and similar progress in the South and West4 has not only altered India’s political landscape but spurred a new optimism. Consistent with a strengthening of the lower castes’ political muscle, Banerjee and Somanathan (2007) report faster progress in rural public goods sup-ply in parliamentary constituencies with high concentrations of SCs, while sched-uled tribe (ST) and Muslim constituencies continued to lag behind. Change is discernible also in education statistics and in empirical studies of the persistence of educational deprivation (Jalan and Murgai 2008). Disaggregating by sex and
OUP UNCORRECTED PROOF – FIRST-PROOF, 11/29/11, NEWGEN
07_Ghate_CH07.indd 1 11/29/2011 9:57:34 PM

2 new insights into tackling rural poverty
comparing upper caste, scheduled caste, scheduled tribe, and Muslim households over the 1983–2000 period, Desai and Kulkarni (2008) observe declining illiteracy across the board, with the percentage of individuals with middle and secondary school completed rising for all social groups but mainly towards the end of the period covered.5
Studies of regional contrasts provide evidence to the contrary. The more recent political mobilization of lower castes in the north would be consistent with a com-paratively slower closing of the gap between SCs and “others” in north Indian states. If population shares are reasonable proxies for political leverage, the state with the highest percentage of upper castes (24.2%), Rajasthan, might be expected to per-form poorly on SC disadvantage.6 The opposite appears to be the case; Rajasthan (and Himachal Pradesh) is the state with the lowest absolute SC disadvantage (Deshpande 2001).
The question, then, becomes not whether India is changing but whether the optimism that has gained currency finds support in data that go beyond political representation and coarse measures of rural public infrastructure provision. Put differently, while the long-term transformative potential of the silent revolution is not under scrutiny, the transformative impacts to date will be. Another aim of this chapter is to avoid merely updating such existing and useful reviews on caste as Deshpande (2001) and (2008). While some background and conceptual overlaps are inevitable, the main priority will be to take a hard look at the existing evidence. The chapter concludes with suggestions for future research.
2 Caste: Historical, sociological, and anthropological perspectives
It is instructive to set out with a synthesis of anthropological and sociological accounts of caste and of the extensive legal and other provisions put in place to eradicate caste- and tribe-based disadvantage soon after India gained her indepen-dence. Echoing the vision of the person described as the constitution’s (1950) main architect, Dr. B. R. Ambedkar, affirmative action became the focal policy to com-pensate for what constitutional article 15 describes as the “disabling” effect of low social status (Bayly 1999, 68–69). Quotas or reservations covered government jobs, seats in legislative assemblies, and higher education admissions.7, 8
The notion of a rigid, caste-based social order originates in the varna system, which portrays a society where citizens belong to four broad hereditary and hier-archically ordered occupational categories, with priests or Brahmans at the top, warriors (Kshatriyas) next, merchants and traders (Vaishyas) third, and menial workers (Shudras) making up the bottom layer. Erstwhile “untouchables” (Dalits)
OUP UNCORRECTED PROOF – FIRST-PROOF, 11/29/11, NEWGEN
07_Ghate_CH07.indd 2 11/29/2011 9:57:34 PM

caste and upward mobility 3
are either treated as a subset of the Shudras (ati-Shudras; cf. Deshpande 2001) or as a separate category whose main distinguishing characteristic is a particularly degrading (“polluting”) traditional occupation.9 Each varna comprises a large number of subcastes, or jatis,10 who with few exceptions are endogamous (i.e. they intra-marry).
Among economists it is not uncommon to perceive caste and its manifesta-tions as exclusive to Hinduism. However, and although few may willingly admit it (Fuller et al. 1997), social ranks exist also among Muslims (Jeffrey et al. 2007) and other religious groups.11 The portrayal of caste hierarchies as immutable and rigid is perhaps most strongly associated with the French anthropologist Louis Dumont,12 whose perceptions were shaped by in-depth studies of rural Tamil Nadu (Dumont 1970; Pandian 2009). When observed over a more extensive time period, the social status of individual jatis is more flexible than Dumont alludes to.13 In a series of examples, Srinivas (1966) shows how perceiving caste through the varna lens “successfully obscured the dynamic features of caste during the traditional or pre-British period” (ibid. 1966, 2). Struggles for upward mobility and status eleva-tion thus have a distinguished and rich history.
Efforts to upset the prevailing social order through so-called Sanskritization could involve a jati changing its “customs, ritual, ideology and way of life in the direction of a high, and frequently “twice-born’ caste” (ibid., 6). Bayly (1999, 58–59) highlights the symbolic value of absorbing practices associated with a varna of a higher rank, describing the meticulously choreographed ascendancy to Kshatriya status by the seventeenth-century Maratha leader Shivaji Bhonsle. A lower-profile yet similarly compelling example captures the official elevation of some carpenter and barber jatis from Vaishya or Kshatriya to Brahmin status between the 1911 and 1931 census rounds (Srinivas 1996, 103).14
The shrewd political tactics deployed by Mughal emperors and colonial admin-istrators during the British Raj undoubtedly, and at specific historical junctures, had the intended effect of sharpening identity and caste focus. Specifically, the obses-sion with jati, caste, and social ranks among late Victorian data collectors strength-ened the competition for “official” status around the turn of the twentieth century, as these census examples attest. Many new caste associations surfaced in response to the emergence of this room to maneuver and to lobby for status elevation.15
2.1 Caste distinctions in social and economic lifeAnthropologists often interpret commensality, or rules about interdining, as the essence of caste distinction (Conlon 1977, 157; cited in Madsen 1991). Concerns over ritual purity permeate obsessions with the identity of those preparing and serving food, with whether vegetarian food was prepared in appropriate vessels, and with the sharp rules about the houses and families from whom food could be accepted. Anthropological studies of social change in rural India have, therefore, perhaps to a
OUP UNCORRECTED PROOF – FIRST-PROOF, 11/29/11, NEWGEN
07_Ghate_CH07.indd 3 11/29/2011 9:57:34 PM

4 new insights into tackling rural poverty
greater extent than necessary, focused on customs surrounding village ceremonial meals (e.g., Mayer 1997). Close-up observations of changing caste relations in an urban milieu prompted Beteille (1997) to call for new and other types of evidence.
Guha (2007, 380–381) illustrates the gravity and repertoire of sanctions meted out by “upper castes” to keep Dalits in their place, using examples from early post-independence India. The denial of paid work, expulsion from their homes, and beatings and other violence all feature. In a more recent example, a group of Jat farmers punished a recalcitrant SC Pradhan in Meerut district in western Uttar Pradesh by punching his teeth out and continuing to kick him after he fell to the ground (Jeffrey 2001). Similar practices and acts, when extended to every-day economic and social life, can be expected to leave deep psychological scars. In Nambissan’s (2010) study of rural and urban Rajasthan, Dalit children often felt singled out for special treatment by classmates and teachers.16 An important ques-tion, therefore, is whether individuals of scheduled caste background are likely to find conducive learning environments in regular schools. Caste-based practices may affect learning directly but also, more indirectly affect self-confidence,17 as well as the access to other benefits associated with school attendance.18
To close in on the relationship between identity and economic progress in con-temporary India, one should perhaps avoid reading too much into single episodes, however dramatic any of these might appear. Many practices associated with what Madsen (1991) describes as India’s “apartheid-like” system of the past have, after all, receded. With the implementation of the 1955 Untouchability Offences Act (Jaffrelot 2003, 90), the legal ban on barring Dalits from entering eating places,19 a key landmark was won on paper.
Such progress notwithstanding, the recent study by Shah et al. (2006) of the practice of untouchability in rural India found that in about half of the villages surveyed, Dalits were not permitted to sell milk to village dairy cooperatives.20 In 30% to 40% of the same villages, Dalits were unable to participate fully in local markets (Iversen et al. 2010). This evidence is interspersed with findings sugges-tive of social change (e.g., Parry 1999; Iversen and Raghavendra 2006; Munshi and Rosenzweig 2006; Banerjee and Somanathan 2007; Kapur et al 2010). Caste iden-tity does not, for instance, prevent coke oven department workers in Bhillai Steel Plant in Madhya Pradesh from eating lunch together. Parry (1999) believes that this “radical” behavioral pattern, which is not paralleled among private-sector com-pany employees nearby, is a result of the production activity within the unit; a pro-cess requiring careful coordination and cooperation has fostered companionship within the workforce. The shifting caste composition of the workforce in south Indian eating places in Mumbai and Bangalore reflects not only the declining sta-tus of such jobs among upper castes in Karnataka’s coastal belt but also, as far as cooks are concerned, changing consumer preferences and menus that require a greater repertoire of cooking skills than a traditional Brahmin upbringing would typically be able to provide.
In Dadar, Mumbai, Munshi and Rosenzweig (2006) contend that surging labor-market returns to education in English has prompted a shift in parental
OUP UNCORRECTED PROOF – FIRST-PROOF, 11/29/11, NEWGEN
07_Ghate_CH07.indd 4 11/29/2011 9:57:34 PM

caste and upward mobility 5
educational choices for lower-caste girls, with a more limited response for lower-caste boys. The preferred explanation—that boys attend Marathi schools to pre-serve jati-based labor-market networks which support labor-market entry later on—suggests that networks may delay the response to emerging opportunities and become a source of dynamic inefficiency that also cements or contributes to amplify caste-based inequalities.
Two points can now be put down. The first is that within the sphere of mar-riage, endogamy norms have turned out to be stubbornly resilient.21 Indeed, violent and fierce sanctions await transgressors of marriage and relationship norms even (or especially) in prosperous northern states like Haryana (Chowdhry 2007) where strict policing and violent punishment, often with the blessing of local politicians, is administered by so-called Khap, or caste panchayats (Kaur 2010).
In other spheres there is evidence of both persistence and change, the latter occasionally of a radical nature (e.g., Parry 1999; Kapur et al 2010) and with a rich menu of underlying “causes.” The rest of this chapter will focus on the latter; in particular, on the implications for educational choice and learning, for occupa-tional choice, earnings, and career progress, and for the persistence of identity-based poverty and deprivation.
3 identity and disadvantage: theoretical points
Theories of discrimination, political economy, and of norms and identity (e.g., Akerlof 1976) are all relevant for the present discussion with economic theories of discrimination as the natural vantage point. One appealing but not usually recog-nized feature of theories of taste-based discrimination (Becker 1971) particularly relevant to India is the attention paid to the preferences of not only employers but also workers (and coworkers) and (sellers or) buyers of products and services. A premise for taste-based discrimination is that caste identities are known. In village India, except for newcomers or temporary in-migrants, caste identities are usu-ally common knowledge. Cities and urban labor markets are different. In informal enterprises, it is not unusual for an employer to be unaware of an employee’s caste. SC workers may, as suggested by observations from Mumbai and Bangalore, feel compelled to invent new names to hide their caste identity to be able to compete for jobs (Iversen and Raghavendra 2006). Similarly, coworkers may not know the caste of their colleagues. In the absence of visual, linguistic, or other markers, cus-tomers will not know the identity of a particular worker. Taste-based discrimina-tion along caste lines is therefore, in general, feasible in a village but often not in a city. In a village setting, boycott of milk produced by cows owned by Dalit women
OUP UNCORRECTED PROOF – FIRST-PROOF, 11/29/11, NEWGEN
07_Ghate_CH07.indd 5 11/29/2011 9:57:35 PM

6 new insights into tackling rural poverty
would be an example of taste-based discrimination; reluctance or unwillingness to eat a meal prepared by a Dalit cook or served by a Dalit waiter, another. The main prediction of taste-based models is that when exposed to sufficiently intense competitive pressures, discriminatory agents will be outperformed and disappear. If correct, a period of economic liberalization should reduce the disadvantage of marginalized social groups. The persistence of black-white male wage disparities in the United States does not, however, square with this type of prediction (Altonji and Blank 1999). For the Indian case, both the scope for and realism of sufficient competitive penetration of the countryside becomes a relevant issue.
Theories of statistical discrimination (Arrow 1972) are founded instead on employer stereotyping about worker productivity in the presence of informational constraints: an employer may use the average perceived quality of a social group to predict the quality of all applicants from this group (Akerlof 1976). A group perceived as “low quality” will be at risk of becoming interlocked in low-skill and low-education equilibria because of inadequate incentives to upgrade skills and invest in education. As above, statistical discrimination by caste will only be feasi-ble in pockets of urban labor markets where employers are informed about worker identities. This is more likely in jobs that require proof of educational attainments, CVs, and so forth, but it also applies to informal sector jobs where an employer can infer caste identify from traditional occupational skills, e.g., for carpenters, tailors, smiths, leatherworkers, and so forth.
Two questions relate to how hard it is to observe quality and thereby reduce the information problem and to policies for addressing statistical discrimination. A key question in the Indian context is whether affirmative action can eliminate employer stereotypes and thus statistical discrimination. The theoretical answer is ambiguous (e.g., Coate and Loury 1993); job quotas may result in equalization of labor-market outcomes, the goal, but also support equilibria where workers lack incentives to upgrade their human capital since they benefit from quotas anyway (Altonji and Blank 1999). As noted, informational constraints are likely to be less relevant in a static rural setting, where the productivity and employment history of individual workers are comparatively easy to track. Persistent caste-based dis-advantage in village community labor markets cannot, therefore, be attributed to statistical discrimination.
These frameworks suggest radically different paths towards a more egalitarian society. Competitive pressures should eliminate agents with discriminatory tastes, while neutralizing the adverse effects of statistical discrimination poses a steeper challenge. Affirmative action is a policy alternative, but effects are not straightfor-ward. As tools to inform policies to remedy caste- and other forms of identity-based disadvantage, the remit of each of these classes of models appears to be limited. On the face of it, competitive penetration of the countryside looks unrealistic. At the same time, the key assumption about information constraints in models of statis-tical discrimination is too strong when applied to rural employers. For urban labor markets, competitive penetration is a realistic prospect, while the availability of
OUP UNCORRECTED PROOF – FIRST-PROOF, 11/29/11, NEWGEN
07_Ghate_CH07.indd 6 11/29/2011 9:57:35 PM

caste and upward mobility 7
sufficient information for employers to engage in statistical discrimination based on caste is likely to vary across labor market pockets.
Two alternative ways of thinking about the roots and processes of rural social change are offered, first, by political economy models which add a political dimen-sion to the dynamic analysis of identity-based disadvantage and, secondly, by sociological theories of caste dominance (Srinivas 1955; Anderson 2011; Iversen et al. 2010). While a focus on discrimination in urban labor markets is easy to jus-tify, the rural setting offers a richer set of potential discriminatory avenues.
Political economy models focus on public-goods provision in response to voter preferences within a democratic polity. The broad idea is that the political pro-cess, over time, may alleviate group-based disparities. Banerjee and Somanathan’s (2007) comparisons of rural infrastructure in political constituencies between 1971 and 1991 suggest considerable responsiveness to a constituency’s social composi-tion. Moreover, while STs and Muslims are observed to lag, SCs are reported to have leaped forward. The latter is consistent with the silent revolution hypothesis in the sense that historically disadvantaged social groups that politically mobilized gained relative to those that did not. Providing further ammunition to this argu-ment, the analysis by Jalan and Murgai (2008) of the intergenerational transmis-sion of education suggests that illiteracy persistence is lower in India than in other developing countries and that the decline in persistence was particularly notable in the mid-1980s.
On closer inspection, however, political economy models may not adequately absorb and account for institutional realities in village India. In an innovative study addressing this theoretical limitation, Anderson (2011) jumps the disciplin-ary fence and takes anthropological and sociological theories of caste dominance to a data set covering rural households in Bihar and Uttar Pradesh. We discuss her findings below. A second question to which we next turn is whether the apparent and dramatic progress for SCs compared to STs and Muslims, which is the foun-dation for linking the silent revolution hypothesis to rural public-goods supply, is discernible in the data that allow for more fine-tuned well-being comparisons.
4 regional contrasts
Using NFHS I (1992/93) data on five indicators—occupational status, education, landholdings, assets and livestock—Deshpande (2001) calculates a caste develop-ment index (CDI) for three broad social groups: SCs, STs and “others.” She also measures caste disparity as the difference between the CDI for SCs and for the “others” category. The findings, summarized in Table 7.1, suggest distinct interstate variation.
OUP UNCORRECTED PROOF – FIRST-PROOF, 11/29/11, NEWGEN
07_Ghate_CH07.indd 7 11/29/2011 9:57:35 PM

8 new insights into tackling rural poverty
Against the backdrop of the sequential timing of a silent political revolution in the south and north and starting with the “absolute” predicaments of the sched-uled castes, the low-ranking of SCs in Tamil Nadu, Andhra Pradesh, and Kerala is surprising. If accurate, this would cast some doubt on the hypothesis of a strong transformative impact of the growing representation of lower castes in political bodies in the south compared to the more recent such developments in the north. The Spearman rank correlation between per capita income and the CDI is positive (0.22), which indicates some trickle down of per capita income rises also to the lower echelons of the caste hierarchy. Notice, moreover, that without the afore-mentioned three southern states, the Spearman correlation between per capita income and the CDI for SCs jumps to (0.50), indicating a stronger positive relation-ship in areas where this relationship is expected to be more fragile. What about caste-based disparities? Deshpande (2001) finds the best performing states to be
table 7.1 regional dimensions of caste-based inequality (source: deshpande 2001).
real per capita
income Cdi for sCsCaste disparity (7 is the lowest,
1 the highest disparity level)
Delhi 1 2 2
Punjab 2 2 2
Haryana 3 4 1
Maharashtra 4 4 4
Gujarat 5 3 6
Tamil Nadu 6 8 4
Himachal Pradesh 7 1 4
Andhra Pradesh 8 7 4
West Bengal 9 5 6
Karnataka 10 4 5
Kerala 11 7 6
Madhya Pradesh 12 3 4
Rajasthan 13 1 6
Assam 14 2 7
Jammu 15 1 4
Uttar Pradesh 16 4 4
Tripura 17 7 3
Orissa 18 6 4
Bihar 19 8 3
OUP UNCORRECTED PROOF – FIRST-PROOF, 11/29/11, NEWGEN
07_Ghate_CH07.indd 8 11/29/2011 9:57:35 PM
caste and upward mobility 9
Assam, Rajasthan, West Bengal, Kerala, and Gujarat; thus a less sharp picture, with a mix of east, west, south and north and with Delhi, Haryana, Punjab, Tripura, and Bihar as the worst. For absolute SC well-being, Rajasthan comes out, once more, as a good performer; that West Bengal and Kerala are low-inequality states is not surprising. Deshpande (2001) also provides state-wise descriptive statistics for the indicators used for constructing her indices, but there are better ways of identify-ing the contributions of factor endowments to identity-based disparities discussed below. For now we register that the link between political empowerment and well-being improvements looks more fragile than expected. The following section adds a sharper methodological edge to the documentation of poverty trends.
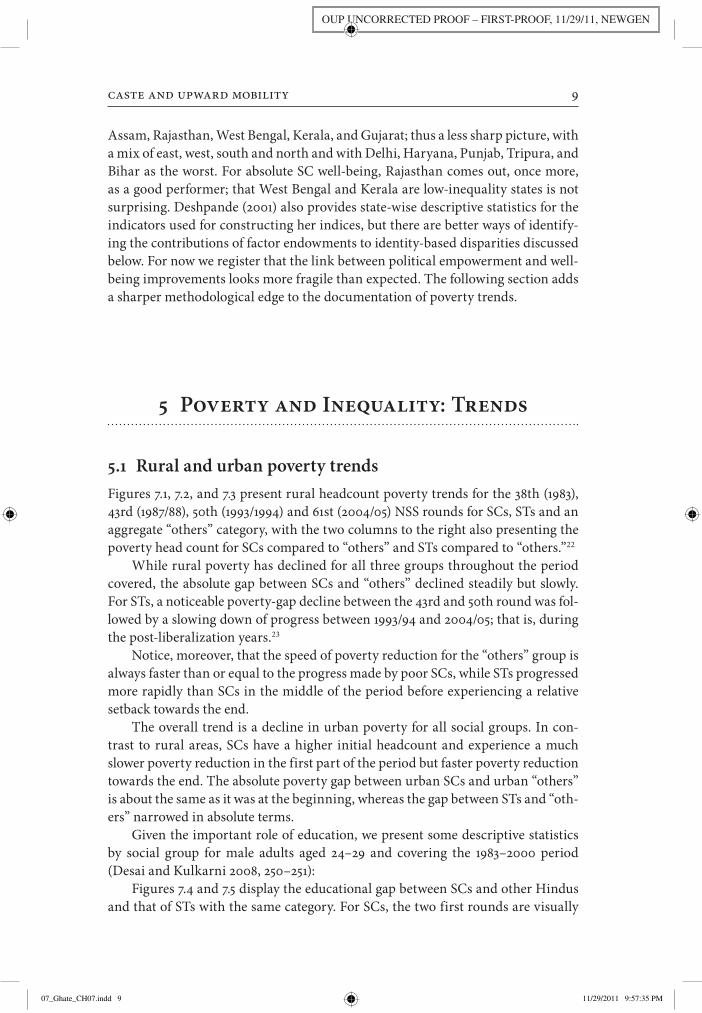
5 poverty and inequality: trends
5.1 rural and urban poverty trendsFigures 7.1, 7.2, and 7.3 present rural headcount poverty trends for the 38th (1983), 43rd (1987/88), 50th (1993/1994) and 61st (2004/05) NSS rounds for SCs, STs and an aggregate “others” category, with the two columns to the right also presenting the poverty head count for SCs compared to “others” and STs compared to “others.”22
While rural poverty has declined for all three groups throughout the period covered, the absolute gap between SCs and “others” declined steadily but slowly. For STs, a noticeable poverty-gap decline between the 43rd and 50th round was fol-lowed by a slowing down of progress between 1993/94 and 2004/05; that is, during the post-liberalization years.23
Notice, moreover, that the speed of poverty reduction for the “others” group is always faster than or equal to the progress made by poor SCs, while STs progressed more rapidly than SCs in the middle of the period before experiencing a relative setback towards the end.
The overall trend is a decline in urban poverty for all social groups. In con-trast to rural areas, SCs have a higher initial headcount and experience a much slower poverty reduction in the first part of the period but faster poverty reduction towards the end. The absolute poverty gap between urban SCs and urban “others” is about the same as it was at the beginning, whereas the gap between STs and “oth-ers” narrowed in absolute terms.
Given the important role of education, we present some descriptive statistics by social group for male adults aged 24–29 and covering the 1983–2000 period (Desai and Kulkarni 2008, 250–251):
Figures 7.4 and 7.5 display the educational gap between SCs and other Hindus and that of STs with the same category. For SCs, the two first rounds are visually
OUP UNCORRECTED PROOF – FIRST-PROOF, 11/29/11, NEWGEN
07_Ghate_CH07.indd 9 11/29/2011 9:57:35 PM

10 new insights into tackling rural poverty
0
10
20
30
40
50
60
70
Oth Rural SC Rural ST Rural SC-Oth ST-Oth
38435061
Figure 7.1 Rural headcount trend by social group (calculations based on NSS 38th, 43rd, 50th, and 61st rounds).
0
0.05
0.1
0.15
0.2
0.25
0.3
1 2 3
Oth RuralSC RuralST Rural
Figure 7.2 Reduction in rural poverty (as a percentage of base) by social group from (1) 38th–43rd, (2) 43rd–50th, and (3) 50th–61st rounds.
0
10
20
30
40
50
60
Oth Urban SC Urban ST Urban SC-Oth ST-Oth
38435061
Figure 7.3 Urban headcount trends by social group.
OUP UNCORRECTED PROOF – FIRST-PROOF, 11/29/11, NEWGEN
07_Ghate_CH07.indd 10 11/29/2011 9:57:38 PM

caste and upward mobility 11
indistinguishable, and any closing of the educational gap with other Hindus is discernible only in the last two rounds, showing up as improvements in terms of reducing illiteracy and in completing lower levels of education (categories 2, 3, and 4). While absolute progress occurred across the board and for both women and men, for secondary education the gap has remained proximately constant, while
–40
–35
–30
–25
–20
–15
–10
–5
0
5
10
1 2 3 4 5 6
1984198819942000
Figure 7.4 Educational gap between “other Hindus” and SCs. *The educational categories are (1) never enrolled; (2) below primary; (3) primary completed; (4) middle school completed; (5) secondary completed; (6) college graduate.
The gap is computed as the difference between the percentage of “other” and percentage of SCs who have completed the respective educational level.
–40
–35
–30
–25
–20
–15
–10
–5
0
5
10
1 2 3 4 5 6
1984
1988
1994
2000
Figure 7.5 Educational gap between “other Hindus” and STs. *The educational categories are (1) never enrolled; (2) below primary; (3) primary completed; (4) middle school completed; (5) secondary completed; (6) college graduate.
The gap is computed as the difference between the percentage of “other” and percentage of STs who have completed the respective educational level.
OUP UNCORRECTED PROOF – FIRST-PROOF, 11/29/11, NEWGEN
07_Ghate_CH07.indd 11 11/29/2011 9:57:40 PM

12 new insights into tackling rural poverty
a widening gap is observed for higher education. For STs, the overall picture also shows a drop in the illiteracy gap and improvements for lower educational catego-ries. In contrast to SCs, the gap has widened both for middle school completion and for higher education.
5.2 between- and within-group inequalitiesThe study of caste-based inequalities may be grouped under two broad headings: (1) decompositions to identify contributions of between- and within-group inequali-ties to overall inequality (e.g., Deshpande 2000 and Lanjouw and Rao 2011) and (2) variations of Blinder Oaxaca decompositions to identify the contributions to household expenditure, wages, or household income of social group differences in attributes and differences in returns to those attributes (e.g., Borooah 2005; Kijima 2006; Gang et al. 2008). The latter have a significant informational edge, although, as the next section shows, interpretations are less straightforward than research practice would suggest.
We begin, however, with the former. Deshpande (2000) implements the Theil index to quantify the contribution of caste to inequality in expenditures on food and clothing in Kerala. As is common for this class of decompositions, her findings suggest that between-group disparities contribute as little as 1% to overall inequality, while within-group disparities in the “others” category is the main contributor to overall inequality. The latter partly reflects the large popu-lation share of “others.” Expressing reservations about the properties of standard decomposition techniques, specifically the propensity to understate the contri-bution of intergroup disparities to overall inequality, Lanjouw and Rao (2011) estimate inequality for Palanpur village in western Uttar Pradesh and Sugao village in Maharashtra, comparing the performance of the Theil index with a measure proposed by Elbers, Lanjouw, Mistian, and Ozler (2008), hereafter denoted ELMO. Caste contributes little to inequality in Sugao and considerably to inequality in Palanpur village, but this distinction is discernible only for the ELMO estimates.
What has happened to between- and within-group inequalities in India dur-ing the post-liberalization era? Using ELMO and the two rounds of the household panel data set from the NCAER/University of Maryland Human Development Survey and social-group disaggregation for SCs, STs, OBCs, Muslims and upper castes, we compute the contributions of between- and within-group inequality to total-real-income inequality in rural India in 1993/94 and 2004/05. We find that overall rural inequality increased between the two rounds and that the contribu-tion of between-group inequality to overall inequality jumped from 6.1% in the first round to 9.6% in the second round. The principal limitation of this class of decompositions is the absence of insights about the factors responsible for the wid-ening or narrowing of inequality between social groups.
OUP UNCORRECTED PROOF – FIRST-PROOF, 11/29/11, NEWGEN
07_Ghate_CH07.indd 12 11/29/2011 9:57:40 PM

caste and upward mobility 13
6 Variants of blinder-oaxaca decompositions and Methodological
remarks
Below we discuss results that shed light both on the factors responsible for SC and ST rural disadvantage and on the poverty gap between these groups and a broad “others” category. A first methodological remark is that differences in returns to attributes, too often and somewhat uncritically, are interpreted as evidence of dis-crimination (e.g., Madheswaran and Attewell 2007). This may not only lead to wrongly diagnosing the underlying problem’s nature but also distort policy recom-mendations. Invaluable insights may nevertheless be gained from carefully con-ducted decomposition analysis.
Using All-India data and four NSS cross-sections covering the years from 1983 to 1999/2000, Kijima (2006) makes intergroup comparisons over a 16-year period, starting before and stretching well into the post-liberalization era. Kijima’s (2006) estimates (cf. Table 7.2) reveal the fundamental contrast in the determinants of SC and ST disadvantage compared to the aggregate “others” category. Since her study spans several NSS rounds, her results can also be used to shed in-depth light on the changing facets of rural disadvantage.
Consider, first, some overall trends. Up to 1993, the decline in the gap in the log of per capita expenditure between “others” and STs is unambiguous; the latter does not extend to SCs. Compared to previous years, the 1999 estimates suggest pro-found change. However, and as noted by Kijima (footnote 4) and above, consump-tion expenditure estimates for the 55th round are not compatible with estimates from previous rounds. We focus, therefore on the results for the other three rounds while revisiting the gap resulting from the absence of more recent information below. Over the three NSS rounds, characteristics account for between 55% and 66% of the between-group difference in the log of PCE for STs. The correspond-ing figure for SCs is somewhere in the 45% to 51% range. Differences in education characteristics are responsible for a large share of both ST and SC disadvantage. For STs, the second large characteristic determinant is unfavorable location, while limited land ownership is the second most important attribute affecting SC disad-vantage. The locational contribution to ST disadvantage resonates with Banerjee and Somanathan’s (2007) observations. Turning to the returns to attributes, these are comparatively less important for ST disadvantage; location is again impor-tant and the key contributor to low returns. Not only may STs be constrained by limited supply of public infrastructure and services; they also appear to be held back by lower returns to endowments—which again is likely to reflect geographic isolation.
For SCs, there is a discernible shift over time, with location becoming less important and lower returns to education more so. How do these results square with the decomposition by Gang et al. (2008) of the poverty gap between SCs and
OUP UNCORRECTED PROOF – FIRST-PROOF, 11/29/11, NEWGEN
07_Ghate_CH07.indd 13 11/29/2011 9:57:40 PM

tabl
e 7.2
dec
ompo
sitio
ns o
f ine
qual
ity in
log
per c
apita
exp
endi
ture
bet
wee
n sC
/st
and
non-
sC/s
t
(sou
rce:
tabl
e 4
in K
ijim
a 20
06)
d
iffe
renc
e of
lo
g of
per
cap
ita
expe
nditu
re
perc
enta
geC
hara
cter
istic
sst
ruct
ures
Cha
ract
eris
tics
stru
ctur
ed
emo
edu
land
loca
tion
dem
oed
ula
ndlo
catio
n
ST 1983
0.31
564
.335
.7–4
.462
.548
.3–6
.4–
1.3–1
.65.5
97.4
1987
0.29
758
.341
.7–6
.170
.939
.2–3
.912
.52.
85.7
78.9
1993
0.25
466
.633
.4–7
.374
.938
.4–6
.026
.11.8
. . . .
69.0
1999
0.26
766
.633
.415
.252
.7–1
.033
.146
.25.
2–0
.849
.2
SC 1983
0.22
845
.254
.8–1
0.5
77.3
25.8
7.4–2
.219
.9–1
5.4
46.7
1987
0.21
649
.950
.1–1
6.3
91.1
27.3
–2.1
40.7
19.1
–12.
432
.8
1993
0.22
450
.949
.1–1
4.4
87.2
22.5
4.8
–14.
035
.3–1
2.313
.7
1999
0.19
150
.249
.8–1
7.088
.924
.73.
431
.340
.5–
9.5
37.8
OUP UNCORRECTED PROOF – FIRST-PROOF, 11/29/11, NEWGEN
07_Ghate_CH07.indd 14 11/29/2011 9:57:41 PM

caste and upward mobility 15
STs and an aggregate “others” group? Notice that Gang and colleagues use data only from the 55th NSS round and rely on an augmented Blinder-Oaxaca type of decomposition where the so-called two-stage World Bank approach is used to estimate the probability of being poor and then to identify the factors responsible for the poverty gaps. While the determinants of disadvantage for poor SC and ST households may differ from those of SC and ST household disadvantage in general, the high incidence of poverty among these households would suggest a consider-able overlap between the results of Kijima (2006) and Gang et al. (2008). Consider, first, the latter’s decomposition of the poverty gap between SC households and “others.” Characteristics account for about 60% of the poverty gap (returns explain the rest) when controls for NSS regions are included. The characteristics that mat-ter, in declining order of importance, are occupation (24.7%), education (21.5%), and land (8.1%). The NSS region dummies and thus unfavorable location account for about 8% of the differences in characteristics. The main coefficient effects are, respectively, household size (53.8%), the NSS region dummies (32.7%), age (18.7%), and education (-13.7%).
As indicated above and consistent with Dreze and Kingdon (2001), differ-ences in educational characteristics are also important, with landholdings playing a lesser yet significant role. Location contributes only about 8% to characteristic differences. In sum and for SCs, restrictions on occupational choice and diversi-fication are a key barrier to narrowing the poverty gap between SCs and “others” and as such merit further research attention.
As in Kijima (2006), the results for STs are strikingly dissimilar. Characteristics are responsible for about 49% of the poverty gap. Location is the most important characteristic (21.6%), followed by education (15.9%). For the return variables, house-hold size is important (53.4%), with location second (34.3%). Location-related fac-tors are again crucial, along with household demography and a lower ST take-up of education (rather than returns to education).
As noted by Altonji and Blank (1999), Gang et al. (2008), and others, the “convention” of interpreting differences in returns as evidence of discrimina-tion is riddled with pitfalls generally and even more so in the Indian context. As Gang et al. (2008) remark, characteristic differences determined by occupational choice and educational opportunity can also be affected by discriminatory prac-tices, the latter being an example of premarket discrimination (Neal and Johnson 1996).
Given the rich array of potential misreadings of decomposition results and the repercussions for policy advice, the issue is worth discussing in more depth. While the lower returns to education for scheduled castes could reflect labor-market discrimination, the decomposition results reported above shed limited light on precisely where the problem sits, whether there is more than one prob-lem, and what policy to opt for. Following standard practice, suppose that educa-tional attainment is measured by years of schooling. In a setting with compulsory school attendance, fairly uniform school quality, and undifferentiated treatment
OUP UNCORRECTED PROOF – FIRST-PROOF, 11/29/11, NEWGEN
07_Ghate_CH07.indd 15 11/29/2011 9:57:41 PM

16 new insights into tackling rural poverty
of pupils in the classroom, one could safely assume that the explanatory variable captures what it should. If social identity is correlated with school quality24 or patchy attendance, either of which is plausible in the Indian context, a returns coefficient in a decomposition analysis would pick up variation in past educa-tional opportunities or behavior, in addition to potential current labor-market discrimination. Further, the self-confidence and motivation of SC individuals might have been affected by a hostile classroom environment while in school. Once more, a low returns coefficient may be casually interpreted to reflect cur-rent labor-market discrimination, while the real culprit is an educational over-hang from the past.
Turning to educational characteristic differences, Kijima (2006), Gang et al. (2008), and Dreze and Kingdon (2001) consistently show that SCs receive less schooling. Dreze and Kingdon (2001) use the PROBE data set comprising house-holds from 122 randomly selected villages in Bihar, Madhya Pradesh, Uttar Pradesh, Rajasthan, and Himachal Pradesh. After controlling for household wealth, paren-tal education and motivation, community, and school-quality variables, they conclude that SC children have an intrinsic educational handicap, irrespective of gender. “This suggests the persistence of an overall bias against SC children in the schooling system in spite of positive discrimination in schooling incentives” (Dreze and Kingdon 2001, 20). No similar disadvantage was detected for Muslim chil-dren. It is possible, therefore, that SC children, as the observations of Nambissan (2010) and of the PROBE team attest, are treated differently by peers, teachers, or both. Such negative classroom experiences may translate into irregular attendance, a drop in confidence, and school discontinuation. An alternative explanation is that SC children, because of higher parental illiteracy, receive systematically less and lower-quality domestic support. The results of Dreze and Kingdon (2001) do not, however, support this hypothesis, since variation in parental background and motivations were carefully controlled for.
There are other candidate explanations. In Glewwe’s (2002) simple model of educational choice, lower expected (perceived or real) labor-market returns to schooling in adult labor markets could explain why SC children are schooled less. Further, if SC households are less able to shoulder adverse shocks or more likely to experience them, schooling can be negatively affected (Ranjan 2001; Jacoby and Skoufias 1997). Finally, apart from educational endowments, landholdings contrib-ute importantly to SC disadvantage. Like Gang et al. (2008), Kijima (2006) reports higher returns to SC land, which could reflect the higher cultivation intensity of such landholdings.25
As noted, Banerjee and Somanathan (2007) study public-goods provision in rural India using 1931 census data on the social composition of political constitu-encies. Comparing the availability of different types of rural public goods and ser-vices over a 20-year period, they attempt to identify the constituency attributes that correlate with rural infrastructure provision and improvements. They also explore the impact of community heterogeneity (“fractionalization”) on public-goods pro-vision, expecting more heterogeneity to be associated with less improvement (e.g.,
OUP UNCORRECTED PROOF – FIRST-PROOF, 11/29/11, NEWGEN
07_Ghate_CH07.indd 16 11/29/2011 9:57:41 PM

caste and upward mobility 17
Olson 1971). It is well known that in the Indian context, rural infrastructure is an imprecise indicator of standard of living. To be persuasive, claims of rapid SC progress need to be accompanied by evidence of well-being improvements using household-level data.
In light of the evidence assembled above, the comparatively slow poverty reduction among SCs lends limited support to Banerjee and Somanathan’s opti-mism on the SC’s behalf. Further and as noted (Kijima 2006), while STs made steady progress vis-à-vis the “others” category between 1983 and 1993, there was no discernible SC improvement during the same period. So why such a mismatch between Banerjee and Somanathan (2007) and studies using household-level data? One possibility might be that infrastructure impacts kick in with a lag. Even so, one would expect an overall effect on SC performance between 1983 and 1993. A more plausible explanation is that inadequate controls for quality variation in pub-lic infrastructure matter. Electricity provision is not the same if power is available only during the night. The same applies to access to primary schools or a local health centre.26 If such quality differences are correlated with constituency compo-sition so that government schools and electricity supply in areas with high SC con-centration are of an inferior standard, Banerjee and Somanathan’s results would overstate SC progress.27
We next consider two studies that attempt to model and account for the potential institutional rigidities imposed by India’s traditional and hierarchical social order, represented by caste dominance at the village level (Srinivas 1955; Dumont 1970). Using exogenous and historically determined village-level varia-tion in caste composition and land ownership to infer causality, Anderson (2011) finds that in villages where Yadavs are the dominant landowners, Yadavs realize higher agricultural yields (45%) than in villages where the dominant landowners belong to a local upper caste. Her explanation is the impact on the market for irrigation water, which breaks down because of social distance in villages where local upper castes are the dominant landowners. In a more general study of the impact of village-level upper-caste dominance on the economic performance of SCs, STs, Muslims, and OBCs, Iversen et al. (2010) adopt a similar identification strategy and use the NCAER/University of Maryland panel data set to make com-parisons of economic performance in early and more recent postreform years. While upper-caste land dominance bestows a positive externality on other social groups in a given village, this effect is discounted by group-specific “oppression” effects that account for up to 16% of mean income and that peak for SCs and OBCs. The effects of village regime are substantive: while SCs residing in villages where their own group is land dominant leaped significantly forward between the two rounds, SCs in upper-caste-dominated villages made less progress even when compared to other social groups. They also find that the contribution of upper-caste “oppression” to rural disadvantage can be eliminated through land reform (but not by education), a finding that suggests that well into the post-liberalization era, the causes of rural disadvantage remain deeply entrenched in traditional institutions and ways.
OUP UNCORRECTED PROOF – FIRST-PROOF, 11/29/11, NEWGEN
07_Ghate_CH07.indd 17 11/29/2011 9:57:41 PM

18 new insights into tackling rural poverty
6.1 rural-urban contrastsAs with studies of ethnicity and disadvantage elsewhere, empirical studies of caste and its effects have focused mainly on labor-market discrimination. Shifting the focus from rural to urban, Banerjee and Knight’s (1985) early study of Delhi’s labor markets suggested that not only were individuals of SC background paid less; they were also more likely to get stuck in dead-end jobs, career-wise. For long, this was the only credible economic study of urban labor-market discrimination in India. Addressing the paucity of evidence, a recent initiative was motivated by the ques-tion of whether, in the era of globalization, institutions of caste and religion were losing their grip on the behavior of urban employers. Madehswaran and Attewell (2007) use NSS data to put numbers on what they interpret as caste discrimination in urban labor markets for men. Their study distinguishes between upper- and lower-end jobs, government and private-sector jobs, and job and wage discrim-ination. An expanded Mincerian wage equation is complemented by variants of Blinder-Oaxaca decompositions. While some believe that Mincerian wage equa-tions perform well in general,28 weaknesses are accentuated in the context of urban India. If school-quality or learning outcomes are correlated with caste identity through one of the many plausible avenues discussed above, a coefficient on SC or other identity in a wage equation will be downward biased.
In a study using primary data from Lucknow, an urban environment where caste discrimination is expected, Kingdon (1998) estimates two-stage models with selection into the workforce and with and without using parental education as a proxy variable for school quality; once this proxy is introduced, negative low-caste coefficients both in her second-stage male and female wage equations turn insig-nificant.29 Against this background and our above discussion, Madehswaran and Attewell’s (2007) discrimination assertions look perilous.30 While able to document considerable caste-based disadvantage in urban labor markets, they are unable to pinpoint the problem’s precise root or nature. For policy this shortfall is fatal. If labor-market discrimination is responsible, which is not implausible, the target for policy interventions would be the labor market itself. If the problem instead has pre-market roots, policymakers would want to know whether the school environment, the parental household, or a combination is responsible. As Dreze and Kingdon’s (2001) study demonstrates, data that make it possible to test the domestic-shortfall hypothesis can be collected. Suppose that the school environment is the culprit; it would still not be clear whether this is because of differential treatment in school of Dalits or other lower-caste children—treatment that could relate to teachers, peers or both—or whether the problem has a political-economy foundation; that is to say, that the schools that minority children attend are systematically underfunded or, for a variety of other reasons, provide inferior instruction compared to other schools.31
The identification problems imposed by the informational constraints in the NSS Employment Survey data are formidable and not easy to overcome. Kingdon (1998) shows that more information-rich data sets provide attractive alternatives
OUP UNCORRECTED PROOF – FIRST-PROOF, 11/29/11, NEWGEN
07_Ghate_CH07.indd 18 11/29/2011 9:57:41 PM

caste and upward mobility 19
that future research can and should take inspiration from. In a small-scale study with sufficiently detailed data on the first job for IIM Ahmedabad graduates, Chakravarty and Somanathan (2008) present another example of how the problem of unobservable variation in the quality of education and ability may be tackled: once the first-year marks of students are controlled for, the identity coefficients in the estimated wage equations turn insignificant. Even so, startling contrasts in the human capital endowment of the candidates at the point of entry prevail.
6.2 Field experimentsThe challenge posed by unobservables in cross-section analysis may be neutralized by designs that facilitate causal inference of labor-market discrimination. Thorat and Attewell (2007) and Banerjee et al. (2008) use field experiments to identify dis-crimination at an early stage in the job-entry process. Inspired by correspondence studies pioneered by Bertrand and Mullainathan (2004), researchers respond to job ads using CVs or applications where fake applicant names signal applicant identity. These studies—while limited by the lack of insights offered about actually getting a job, as well as on pay and career progress later on—do, when carefully executed, generate credible evidence. Theirs being the first such study conducted in India, we discuss some of Thorat and Attewell’s (2007) findings, along with their design and implementation. Focusing on modern private-sector enterprises and jobs where applicants could come straight from a graduate program,32 ads from the main English-language newspapers in Delhi, Mumbai, Chennai, Bangalore, and Hyderabad were collected. For each job ad, different applications were pre-pared with CVs having as-close-to-identical qualifications and experience as pos-sible without their being obvious to an employer; thus, degrees at the same level and from equivalent universities, experience in firms of similar status, and similar parallels (Attewell, personal correspondence). Applicant names were manipulated to reflect caste or religious identity. In all, 4,808 applications were submitted to a total of 548 job ads. Compared to an applicant with a high-caste name, the odds of receiving a response was 0.67 for a Dalit and 0.33 for a Muslim applicant.
In a similar study focusing on two sectors within Delhi’s urban economy, Banerjee et al. (2008) submitted résumés in response to call-center and software jobs advertised in main English newspapers and on two popular job websites, naukri.com and monsterindia.com. Banerjee et al.’s (2008) approach is more cau-tious. First, they pretested for familiarity with regional caste names among univer-sity students and faculty for individuals from different parts of the country. Not perhaps surprising but still important, familiarity could not be taken for granted: North Indians were typically unable to link caste to names from Gujarat and Maharashtra. No similar recognition problem applied to Muslim names. Secondly, in another possible contrast to Thorat and Attewell (2007), Banerjee et al. (2007) randomly allocated names to the prepared résumés. Banerjee et al.’s (2008) callback
OUP UNCORRECTED PROOF – FIRST-PROOF, 11/29/11, NEWGEN
07_Ghate_CH07.indd 19 11/29/2011 9:57:41 PM

20 new insights into tackling rural poverty
rates display no identity bias in the software sector, while OBCs and to a lesser extent SCs receive fewer callbacks from call centers. There was no discernible bias against Muslim respondents in either sector. Notice that the findings apply only to callback rates and not to whether an applicant will or won’t get a job.
The evidence on urban labor-market discrimination is mixed: more research using better data and designs that facilitate causal inference, keeping in mind the limited scope of correspondence studies, is necessary to uncover variation across urban locations and by sector of work, social group, and time. The weaknesses of the NSS data sets for identifying discrimination suggest that collection of pri-mary data following Kingdon’s (1998) study of Lucknow is a credible alternative. Chakravarty and Somanathan’s (2008) IIM study is a case study with limited scope for generalization but underscores the importance of premarket disadvantage.
7 affirmative action
India’s stint with affirmative action has not lived up to the expectations and inten-tions of its perhaps most passionate advocate. Dr. Ambedkar thought the use of quotas to compensate for historical disadvantage would be temporary. On the con-trary, the implementation of the Mandal Commission’s recommendations in the early 1990s added fresh impetus to reservations as political battleground fueling a battle for “downgrading” to OBC status by social groups with sufficient political leverage.
Poor implementation was an early reason why affirmative action failed to nar-row disparities. The first postindependence government stuck to the population-proportionality principle put in place by its colonial predecessor, with 15% of all classes of government jobs reserved for scheduled castes (Jaffrelot 2003, 91). By 1967, the quotas for scheduled castes had been filled only for class 4 jobs, with sub-stantive shortfalls in the more prestigious higher-level jobs (ibid.). More progress was made between 1975 and 1985.
Political reservations have been implemented with greater determination. As explained by Rajaraman and Gupta (2010), the random allocation of female sar-panches (village heads) across Gram Panchayats, creating an ideal natural exper-iment that facilitates causal inference,33 does not extend to SC or ST reservations. In contrast to gender, SC and ST reservations of GP headship is determined by the demographic composition of Gram Panchayats. Several empirical studies have found reservations to be correlated with reductions in SC/ST disadvantage both in West Bengal (e.g., Bardhan et al. 2008) and south India (e.g., Besley et al. 2007).
Studying the impacts of mandatory political reservations in state legislative assemblies, Pande (2003) finds SC reservations to be correlated with more job
OUP UNCORRECTED PROOF – FIRST-PROOF, 11/29/11, NEWGEN
07_Ghate_CH07.indd 20 11/29/2011 9:57:41 PM

caste and upward mobility 21
quotas, while ST reservations were associated with greater expenditure on ST wel-fare schemes. ST reservations were also associated with a decline in spending on education and a rise in overall government spending. She also finds that increases in the number of SC and ST representatives have not bolstered the likelihood of land-reform legislation and other radical redistribution policies (ibid. 1142).
Turning to the issue of job reservations, the rare empirical paper of Deshpande and Weisskopf (2010) attempts to pin down the impact of job reservations on pro-ductivity in the Indian railways. Their evidence suggests that reservations have improved productivity, especially in higher-level jobs. While their productivity measures are constrained by data availability, the findings question negative ste-reotypes about the impact of affirmative action and raises (without being able to answer) fundamental questions about the channels through which such productiv-ity improvements may occur. A higher intrinsic work motivation to prove critics of reservations wrong, more efficiency in the supervision of lower-level workers from their own social groups, and general productivity gains from greater workforce diversity are three potential explanations (ibid.).
8 Conclusion, with remarks on a Future research agenda
Rural poverty is declining across the board, but at a slower pace than one might have hoped. The speed of poverty reduction has, moreover, been faster for the “others” group than for SC and ST households. While ST poverty reduction was marked between the 43rd and 50th NSS round, STs experienced a setback between the 50th and 61st round. For overall inequality NSS data suggest that STs progressed steadily between 1983 and 1993, while no similar improvements were discernible for SCs (Kijima 2006). These ST and SC observations do not square with the timing of Banerjee and Somanathan’s (2007) public-goods-supply observations and progress claims—suggesting, moreover, that the silent political revolution documented by Jaffrelot (2003) has yet to translate into substantive standard-of-living improvements in rural India. Using the decomposition technique proposed by Elbers, Lanjouw, Mistian, and Ozler (2008), we found that overall group-based inequalities in real household per capita incomes and the contribution of between-group inequality to overall inequality have significantly increased during the reform years.
One explanation for why rural transformation has not been sharper may relate to the fact that in spite of India’s democratic polity, the hurdles posed by the caste system and patterns of resource control (land ownership) in rural areas are not easily overcome. Iversen et al.’s (2010) finding that SCs perform much better in villages dominated by their own group suggest that village environments matter.
OUP UNCORRECTED PROOF – FIRST-PROOF, 11/29/11, NEWGEN
07_Ghate_CH07.indd 21 11/29/2011 9:57:41 PM

22 new insights into tackling rural poverty
The same study finds that the old and familiar land-reform recipe appears to be the most effective remedy to alleviate the adverse effects of upper caste dominance on SC well-being in villages dominated by upper castes.
Although low returns to endowments contribute significantly to SC disadvan-tage and poverty, human-capital data will only pick up changes in such returns that result from improvements in village schools and other educational institutions with a lag. The paucity of in-depth microeconomic evidence on identity, educa-tional experience, learning outcomes, and retention that disentangle the role of school environments should inspire future research efforts.34
Similarly, as Gang et al. (2008) observe, occupational persistence, while poten-tially important, has not so far been sufficiently unpacked. Coefficients on occupa-tion are subject to endogeneity concerns, and the absence of credible instruments needs to be addressed.
One important technical constraint highlighted above is that the scope for identifying urban labor-market discrimination using NSS data will be subject to grave concerns posed by the problem of controlling for variation in the quality of schooling and for individual unobservables. Kingdon (1998) shows that more detailed cross-section data can offer a way around this hurdle. For understand-ing identity-based entry-level barriers to the labor market (as opposed to actually getting a job and subsequent career progress) and for establishing causality, field experiments—conducted more widely and aiming to pin down variation across time, space, labor-market segments and social groups—are here to stay and should be encouraged, with a view to keeping track of whether India’s labor markets are, as playing fields, becoming more level.
Finally and as observed, research on the impact of affirmative action to com-pensate for historical disadvantage has hitherto been scarce. This will not last. For local governance, the studies of village panchayats by Besley et al. (2007) and Bardhan et al. (2008), inspired by the pathbreaking work of Chattopadhyay and Duflo (2004), are instructive.
Pande’s (2003) findings on the effects of mandatory political reservations raise fundamental questions about the transformative potential and the potential limi-tations imbuing political reservations. Deshpande and Weisskop’s (2010) research on the Indian railways suggests an unexpected relationship between job reser-vations and labor productivity. More evidence both about the channels through which public-sector reservations affect productivity and about aggregate produc-tivity effects are needed before verdicts about the impact of job reservations on public-sector productivity can be passed.
Acknowledgments
The author would like to thank the editor and two anonymous referees for con-structive comments and Amaresh Dubey for calculating the poverty figures in this chapter.
OUP UNCORRECTED PROOF – FIRST-PROOF, 11/29/11, NEWGEN
07_Ghate_CH07.indd 22 11/29/2011 9:57:42 PM

caste and upward mobility 23
Notes
1 The period after the 1991 economic reforms. See Sen (2007) for a comprehensive account of India’s growth turnaround.
2 Scheduled castes are former “untouchables,” while scheduled tribes are (indigenous) tribes perceived as historically disadvantaged.
3 Census of India (2001). Data from the 55th NSS round.4 As documented by Jaffrelot (2003).5 In contrast, Kijima (2006) observes very strong occupational persistence between 1983
and 2000.6 Ahead of Uttar Pradesh (20%) (Jaffrelot 2003, 69). Both figures are based on the 1931
census, the last to collect information at the jati (subcaste) level. The most numerous upper-caste groups were Brahmins, Rajputs, and Baniyas. The 2011 census is the first in 70 years (and since independence) to collect information on caste (jati).
7 Reservation policies are, in fact, a colonial legacy; the first such policy, introduced in 1892, involved establishing schools for untouchable boys and girls (Jaffrelot 2003, 91). Reservations in government jobs came later and closer to independence, in 1934 (ibid. 91).
8 Compensatory policies for a third and less sharply defined group of citizens was taken up first by the Backward Class commission appointed by Jawaharlal Nehru and headed by K. Kalelkar and later by the Mandal Commission (1978–1980). In the pre-Mandal era, quotas for Other Backward Classes were subject to state discretion but were often struck down by the Supreme Court (Jaffrelot 2003, ch. 7). The issue of quotas for OBCs was finally endorsed by the Supreme Court in December 1992.
9 Scavenging and leatherwork are two examples.10 The Kalelkar commission identified 2,399 social groups as belonging to the Other
Backward Classes. The Anthropological Survey of India identified 4,635 different communities in India (Singh 1992).
11 See Singh’s (1984) account of caste among non-Hindus and Jodhka’s (2004) discussion of Sikhism and caste arrangements.
12 See Rao and Ban’s (2007) discussion of antecedents of Dumont.13 There is no shortage of criticisms making a similar point; see Fuller (1997) and the
contributions therein.14 See also Cohn (1987) chapter 10.15 Changes in recorded official status during a time window when caste status
became “negotiable” is a promising research agenda. A reversal of the status chase has occurred, in particular, in response to the implementation of the Mandal Commission’s recommendations. In an unusual paper, Ban and Rao (2007) contend that caste categories are endogenous and use the establishment of linguistic states and villages in adjacent border areas of Andhra Pradesh, Karnataka, Kerala, and Tamil Nadu as a natural experiment to argue that the number and nomenclature of castes has changed in matched villages on both sides of each of the borders under consideration.
16 Taken from the PROBE team report 1999; Desai and Kulkarni (2008) describe how Dalit children could also be denied entry to the classroom.
17 In Hoff and Pandey’s (2006) extensively quoted but small-scale experimental study, the performance in solving mazes of boys from a jati associated with leatherwork (SC-Chamars) significantly declined when their caste was publicly revealed, as opposed to when caste was kept secret. While potentially important, unless such
OUP UNCORRECTED PROOF – FIRST-PROOF, 11/29/11, NEWGEN
07_Ghate_CH07.indd 23 11/29/2011 9:57:42 PM

24 new insights into tackling rural poverty
experimental results are confirmed by others, they should be accompanied by caveats. As explained below, the need for caution does not extend to larger field experiments or to natural experiments that facilitate identification of the causal impact of reservation policies on policy outcomes.
18 The provision of midday meals, increasingly common in rural Indian schools, becomes more intricate once commensality norms enter the frame (e.g., Dreze and Goyal 2003).
19 Forcing Dalits to drink tea and eat food outside (e.g., Iversen and Raghavendra 2006).20 The study covered 550 villages in 11 main states.21 Banerjee et al.’s (2009) findings using data from matrimonial ads in Kolkata attest
to such stubbornness. Munshi and Rosenzweig (2006) contend that attending English schools in Mumbai are associated with a higher prevalence of nontraditional marriages.
22 These are the so-called thick NSS rounds. Notice that figures for the 55th round are not reported because of incompatibility with other rounds due to a change in the recall period for consumption expenditure.
23 Notice also that the figures are not strictly comparable, since the time window between each of the first three rounds for which figures are reported is about half that between the last two rounds.
24 The test score variation in math and reading brought out by the Annual Status of Education Reports highlights the likely severity of unobservable school-quality variation in a years-of-schooling measure of educational attainment.
25 Dercon and Krishnan (2007) use the ICRISAT household panel to evaluate the relative economic performance of SC/STs, but their panel is limited to 204 households from six villages and two states. The lower educational attainment of SC/STs is reported to fully account for their slower standard of living improvements.
26 In a cross-country study where government health institutions and schools were subjected to unannounced visits, Chaudhury et al. (2006) found that 25% of primary school teachers in India were not in school, and among those who were, only about 50% were teaching at the time of the visit. For health care workers, the average absenteeism was 40%.
27 The use of state dummies is likely to pick up some quality variation.28 See the references cited in Kingdon (1998).29 One important limitation of Kingdon’s (1998) study is that it does not differentiate
between SCs and other lower castes. It is also possible, as Kingdon (1998) notes, that a similar observation would ensue if parental education instead was a proxy for better parental labor-market networks.
30 Note that male labor-force participation in India in the relevant age range typically is close to 100% (e.g., Das 2006).
31 See Kochar (forthcoming) for an interesting elaboration on some such explanations.32 E.g., securities and investment companies, pharmaceutical and medical sales, IT,
many kinds of manufacturing jobs, media, banking, etc.33 See Chattopadhyay and Duflo’s (2004) study of the impacts of reservations of female
headship on the policy priorities of Gram Panchayats in West Bengal and Rajasthan.34 Nambissan’s (2010) findings from Rajasthan, observations by the Probe Team, and
evidence on the widespread use of corporal punishment in government schools documented by the Ministry of Women and Child Development (2007) illustrate the need for more research on the link between educational experience and school performance.
OUP UNCORRECTED PROOF – FIRST-PROOF, 11/29/11, NEWGEN
07_Ghate_CH07.indd 24 11/29/2011 9:57:42 PM

caste and upward mobility 25
References
Akerlof, G. (1976). The Economics of Caste and of the Rat Race and Other Woeful Tales. Quarterly Journal of Economics 90 (4): 599–617.
Altonji, J. G., and R. M. Blank (1999). Race and Gender in the Labor Market. Chapter 48 in O. C. Ashenfelter and D. Card (eds.). Handbook of Labor Economics, vol. 3C. Amsterdam: Elsevier.
Anderson, S. (2011). Caste as an Impediment to Trade. American Economic Journal: Applied Economics 3(1): 239–63.
Arrow, K. J. (1972). Models of Job Discrimination. In C. H. Pascal (ed.), Racial Discrimination in Economic Life, pp. 83–102, Lexington, MA: D. C. Heath.
Banerjee, A., M. Bertrand, S. Datta, and S. Mullainathan (2008). Labor Market Discrimination in Delhi. Journal of Comparative Economics 37: 14–27.
Banerjee, A., E. Duflo, M. Ghatak, and J. Lafortune (2009). Marry for What? Caste and Mate Selection in Modern India. Mimeo. Department of Economics, MIT.
Banerjee, A., and R. Somanathan (2007). The Political Economy of Public Goods: Some Evidence from India. Journal of Development Economics 82: 287–314.
Banerjee, B. and J. B. Knight (1985). Caste discrimination in the Indian labour Market. Journal of Development Economics 17: 277–307.
Bardhan, P., D. Mokherjee, and M. P. Torado (2008). Impact of Reservations of Panchayat Pradhans on Targeting in West Bengal. In E. Dhar (ed.), Some Contemporary Issues in Development and Growth Economics. Kolkata: Allied Publishers.
Bayly, S (1999). Caste, Society and Politics in India: From the Eighteenth Century to the Modern Age. Cambridge: Cambridge University Press.
Becker, G. (1971). The Economics of Discrimination. Chicago: University of Chicago Press.
Besley, T., R. Pande, and V. Rao (2007). Political Economy of Panchayats in South India. Economic and Political Weekly 42: 661–666.
Bertrand, M., and S. Mullainathan (2004). Are Emily and Greg More Employable than Lakisha and Jamal? A Field Experiment on Labor Market Discrimination. American Economic Review 94 (4): 991–1013.
Beteille, A. (1997). Caste in Contemporary India. In C. Fuller (ed.), Caste Today, 150–179. New Delhi: Oxford University Press.
Borooah, V. K. (2005). Caste, Inequality and Poverty in India. Review of Development Economics 9 (3): 399–414.
Chakravarty, S., and E. Somanathan (2008). Discrimination in an Elite Labour Market? Job Placements at IIM Ahmedabad. Economic and Political Weekly, November 1, 45–50.
Chattopadhyay, R., and E. Duflo (2004). Women as Policy Makers: Evidence from a Randomized Policy Experiment in India. Econometrica 72 (5): 1409-43.
Chaudhury, N., J. Hammer, M. Kremer, K. Muralidharan, and F. H. Rogers (2006). Missing in Action: Teacher and Health Worker Absence in Developing Countries. Journal of Economic Perspectives 20 (1): 91–116.
Chowdhry, P. (2007). Contentious Marriages, Eloping Couples. Gender, Caste, and Patriarchy in Northern India. New Delhi: Oxford University Press.
Coate, S., and G. Loury (1993). Will Affirmative-Action Policies Eliminate Negative Stereotypes? American Economic Review 83 (5): 1220–40.
OUP UNCORRECTED PROOF – FIRST-PROOF, 11/29/11, NEWGEN
07_Ghate_CH07.indd 25 11/29/2011 9:57:42 PM

26 new insights into tackling rural poverty
Cohn, B. S. (1987). An Anthropologist among the Historians and Other Essays, New Delhi: Oxford University Press.
Conlon, F. (1977). A Caste in a Changing World. The Chitrapur Saraswat Brahmans, 1700-1935.
Berkeley: University of California Press.Das, M. B. (2006). Do Traditional Axes of Exclusion Affect Labor Market Outcomes?
South Asia Working Paper series 97. World Bank.Dercon, S., and P. Krishnan (2007). Caste revisited: Consumption Dynamics and
Exclusion in South-Indian villages 1975–2005. Mimeo. Department of Economics, University of Oxford.
Desai, S., and V. Kulkarni (2008). Changing Educational Inequalities in India in the Context of Affirmative Action. Demography 45 (2): 245–270.
Deshpande, A. (2001). Caste at Birth? Redefining Disparity in India. Review of Development Economics 5 (1): 130–144.
———. (2008). Caste and Diversity in India. In J. B. Davis and W. Dolfsma (eds.), The Elgar Companion to Social Economics, pp. 171–187. Cheltenham: Edward Elgar.
Deshpande, A., and T. E. Weisskopf (2010). Does Affirmative Action Affect Productivity in the Indian Railways? Working Paper no. 185, Centre for Development Economics, Delhi School of Economics.
Dreze, J., and A. Goyal (2003). Future of Mid-Day Meals. Economic and Political Weekly 38 (44):
Dreze, J., and G. Kingdon (2001). School Participation in Rural India. Review of Development Economics 5 (1): 1–24.
Dumont, L (1970). Homo Hierarchicus. The Caste System and Its Implications. London: Paladin Press.
Elbers, C., P. Lanjouw, J. Mistian, and B. Ozler (2008). Re-interpreting Sub-Group Inequality Decompositions. Journal of Economic Inequality 6 (3): 1569–1721.
Fuller, C (1997). Caste Today. New Delhi: Oxford University Press.Gang, I. N., K. Sen, and M-S. Yun (2008). Poverty in Rural India: Caste and Tribe.
Review of Income and Wealth 54 (1): 50–70.Glewwe, P. (2002). Schools and Skills in Developing Countries: Education Policies
and Socioeconomic Outcomes. Journal of Economic Literature 40 (2): 436–482.Guha, R. (2007). India after Gandhi: The History of the World’s Largest Democracy.
London: Macmillan.Hoff, K., and P. Pandey (2006). Discrimination, Social Identity and Durable
Inequalities. American Economic Review 96 (2): 206–211.Iversen, V., A. Kalwij, A. Verschoor, and A. Dubey (2010). Caste Dominance and
Economic Performance in Rural India. Discussion Paper no. 10–01, Indian Statistical Institute, Planning Unit, New Delhi.
Iversen, V., and P. S. Raghavendra (2006). What the Signboard Hides: Food, Caste and Employability in Small South-Indian Eating Places. Contributions to Indian Sociology 40 (3): 311–341.
Jaffrelot, C. (2003). India’s Silent Revolution: The Rise of Low Castes in North Indian Politics New Delhi:Permanent Black.
Jalan, J., and R. Murgai (2008). Intergenerational Mobility in Education in India. Paper presented at the Annual Growth and Development Conference, December 2008, Indian Statistical Institute, New Delhi.
Jeffrey, C (2001). A Fist Is Stronger than Five Fingers: Caste and Dominance in North India. Transactions of the Institute of British Geographers 26: 217–236.
OUP UNCORRECTED PROOF – FIRST-PROOF, 11/29/11, NEWGEN
07_Ghate_CH07.indd 26 11/29/2011 9:57:42 PM

caste and upward mobility 27
Jeffrey, C., P. Jeffery, and R. Jeffery (2007). Degrees without Freedom: Education, Masculinities and Unemployment in North-India. Palo Alto, CA: Stanford University Press.
Jodhka, S. S. (2004). Sikhism and the Caste Question: Dalits and Their Politics in Contemporary Punjab. Contributions to Indian Sociology 38 (1–2): 165–192.
Kapur, D., C. B. Prasad, L. Pritchett and D. S. Babu (2010). Rethinking Inequality: Dalits in Uttar Pradesh in the Market Reform Era. Economic and Political Weekly 45 (35): 39–49.
Kaur, R. (2010). Khap Panchayats, Sex Ratio and Female Agency. Economic and Political Weekly 45 (23): 14–16.
Kijima, Y. (2006). Caste and Tribe Inequality: Evidence from India, 1983-1999. Economic Development and Cultural Change 54 (2): 369–404.
Kingdon, G. (1998). Does the Labour Market Explain Lower Female Schooling in India? Journal of Development Studies 35 (1): 39–65.
Kochar, A. (forthcoming). Reforming Primary and Secondary Schooling. In C. Ghate (ed.), The Oxford Handbook of the Indian Economy. New York: Oxford University Press.
Lanjouw, P., and V. Rao (2011). Revisiting between Group-Inequality Measurement: An Application to the Dynamics of Caste Inequality in Two Indian Villages. World Development 39 (2): 174–87.
Madehswaran, S. and P. Attewell (2007). Caste Discrimination in the Indian Urban Labour Market: Evidence from the National Sample Survey. Economic and Political Weekly October 13, 4146–4153.
Madsen, S. T. (1991). Udupi Hotels: A Case of Ethnicity Based Non-Virulent Development. Paper presented at the First Nordic Conference on South-Asian Studies, October 11–13, Nordic Association for South-Asian Studies.
Mayer, A. (1997). Caste in an Indian Village: Change and Continuity, 1954–1992, in C. J. Fuller (ed). Caste Today, 32-64. New Delhi: Oxford University Press.
Ministry of Women and Child Development (2007): Study of Child Abuse in India, New Delhi.
Munshi, K., and M. Rosenzweig (2006). Traditional Institutions Meet the Modern World: Caste, Gender and Schooling Choice in a Globalizing Economy. American Economic Review 96(4): 1225-52.
Nambissan, G. B. (2010). Exclusion and Discrimination in Schools: Experiences of Dalit Children, in S. Thorat and K. S. Newman (eds), Blocked by Caste: Economic Discrimination in Modern India, 253–86. New Delhi: Oxford University Press.
Pande, R. (2003). Can Mandated Political Reservations Increase Policy Influence for Disadvantaged Minorities? Theory and Evidence from India. American Economic Review 93 (4): 1132–1151.
Pandian, A. (2009). ‘The Remembering Village: Looking back on Louis Dumont from Rural Tamil Nadu. Contributions to Indian Sociology 43: 121–133.
Parry, J. (1999). Two Cheers for Reservations: The Satnamis and the Steel Plant. In R. Guha and J. Parry (ed.). Institutions and Inequalities: Essays in Honour of Andre Beteille, 128–69, Oxford University Press.
Rajaraman, I., and M. Gupta (2010). Further Evidence on the Policy Impact of Randomised Political Reservation. Mimeo. Indian Statistical Institute, Planning Unit, New Delhi.
Ranjan, P. (2001). Credit Constraints and the Phenomenon of Child Labor. Journal of Development Economics 64 (1): 81–102.
OUP UNCORRECTED PROOF – FIRST-PROOF, 11/29/11, NEWGEN
07_Ghate_CH07.indd 27 11/29/2011 9:57:42 PM

28 new insights into tackling rural poverty
Rao, V., and R. Ban (2007). The Political Construction of Caste in South India. Mimeo, World Bank, Research Department.Sen, K. (2007). Why Did the Elephant Start to Trot? India’s Growth Acceleration Re-
examined. Economic and Political Weekly 42 (43):37–49.Shah, G., H. Mander, S. Thorat, S. Deshpande and A. Baviskar (2006).
Untouchability in rural India. New Delhi: Sage Publications.Singh, H. (1984): Caste among non-Hindus in India, New Delhi: National Publishing
House.Singh, K. S. (1992): People of India: An Introduction. Calcutta:Anthropological
Survey of India.Srinivas, M. N. (1955). The Social System of a Mysore Village. In M. McKim (ed.).
Village India, 1–35. Chicago: University of Chicago Press.———. (1966). Social Change in Modern India. Berkeley: University of California
Press.Thorat, S., and P. Attewell (2007). The Legacy of Social Exclusion—a Correspondence
Study of Job Discrimination in India. Economic and Political Weekly, October 13: 4141–4145.
OUP UNCORRECTED PROOF – FIRST-PROOF, 11/29/11, NEWGEN
07_Ghate_CH07.indd 28 11/29/2011 9:57:42 PM