Does the Nonfarm Economy Offer Pathways for Upward Mobility?
13
Does the Nonfarm Economy Offer Pathways for Upward Mobility? Evidence from a Panel Data Study in Ethiopia SOSINA BEZU Norwegian University of Life Sciences, Norway CHRISTOPHER B. BARRETT Cornell University, Ithaca, USA and STEIN T. HOLDEN * Norwegian University of Life Sciences, Norway Summary. — Empirical studies across many developing countries routinely document a positive correlation between participation in rural nonfarm employment and households’ wealth or income. This paper explores whether nonfarm employment leads to higher con- sumption expenditure growth in Ethiopia. We find that: (1) households’ consumption expenditure growth is positively correlated with the initial share of nonfarm income; (2) the growth elasticity of nonfarm income share is higher for wealthier households; and (3) the main source of growth for nonfarm participants comes from the higher rates of return participants enjoy on their human and physical capital. Ó 2012 Elsevier Ltd. All rights reserved. Key words — rural nonfarm, income dynamics, income diversification, Africa, Ethiopia, impact 1. INTRODUCTION Several studies in various developing countries have shown that participation in the rural nonfarm employment (RNFE) is routinely positively correlated with total income, wealth, and even agricultural productivity (Haggblade, 2007; Lanjouw & Lanjouw, 2001; Reardon, 1997; Reardon, Berdegue, & Esco- bar, 2001). The observed positive correlations between non- farm participation and income, wealth and productivity have fostered hope that nonfarm employment may offer a way out of poverty. However, studies of determinants of participation also indicate that typically the rich have superior access to remunerative nonfarm activities (Corral & Reardon, 2001; de Janvry & Sadoulet, 2001; Dercon & Krishnan, 1996; Kung & Lee, 2001; Lanjouw & Shariff, 2002; Woldenhanna & Oskam, 2001). 1 These findings thus call into question the direction of causality in the positive relationship between RNFE participa- tion and welfare indicators of rural households. Only a few prior studies examine the relationship between RNFE participation and households’ subsequent income or expenditure growth. A panel study of income diversification and poverty in India by Kijima and Lanjouw (2005) links re- gional changes in poverty levels with nonfarm sector expan- sion. They found no evidence of a direct impact of nonfarm employment on poverty. However, they noted that by raising the agricultural wage rate and providing the poor with a safety net, nonfarm employment may play an important indirect role. Block and Webb (2001) examine whether higher diversifica- tion into the RNFE in one period is associated with higher in- come and consumption outcomes in the subsequent period in Ethiopia. They found that households who are more diversi- fied in the initial period subsequently increased their relative income and calorie intake. While Block and Webb (2001) make an important contribution in exploring the impact of diversification on welfare dynamics, the sample used in their analysis and the initial period under consideration are too spe- cific for broad generalizations. The survey sites in the sample were selected because of their famine experience and the two periods compared are the post-famine year 1989 and the post-reform year 1994. Moreover, they use crop share of in- come as a measure of diversification. This is not equivalent to the share of nonfarm income, however, since even the in- comes of pure agriculturalists may include income from crop, livestock, farm wage employment, and transfers. Hence the conclusions drawn from crop share variables, while indicative perhaps of livelihood diversification, do not really reflect accu- rately households’ RNFE activity levels. This paper examines the impact of rural farm households’ diversification into nonfarm employment on their consump- tion expenditure dynamics. It addresses the limitations in Block and Webb (2001) by focusing on income from rural nonfarm employment and by using panel data on a diversified sample. Our study also goes further than the previous litera- ture in investigating the sources of consumption growth for nonfarm participants. Furthermore, this paper examines whether nonfarm employment is pro-poor by estimating its impact on expenditure growth separately for the poor and the rich. Consistent with the pattern observed in other African coun- tries, we find that total nonfarm income increases across expen- diture and wealth terciles. Households at the top tercile of the distribution earn 75% more per capita than those in the * Final revision accepted: January 9, 2012. World Development Vol. 40, No. 8, pp. 1634–1646, 2012 Ó 2012 Elsevier Ltd. All rights reserved 0305-750X/$ - see front matter www.elsevier.com/locate/worlddev http://dx.doi.org/10.1016/j.worlddev.2012.04.019 1634
Transcript of Does the Nonfarm Economy Offer Pathways for Upward Mobility?

World Development Vol. 40, No. 8, pp. 1634–1646, 2012� 2012 Elsevier Ltd. All rights reserved
0305-750X/$ - see front matter
www.elsevier.com/locate/worlddevhttp://dx.doi.org/10.1016/j.worlddev.2012.04.019
Does the Nonfarm Economy Offer Pathways for Upward Mobility?
Evidence from a Panel Data Study in Ethiopia
SOSINA BEZUNorwegian University of Life Sciences, Norway
CHRISTOPHER B. BARRETTCornell University, Ithaca, USA
and
STEIN T. HOLDEN *
Norwegian University of Life Sciences, Norway
Summary. — Empirical studies across many developing countries routinely document a positive correlation between participation inrural nonfarm employment and households’ wealth or income. This paper explores whether nonfarm employment leads to higher con-sumption expenditure growth in Ethiopia. We find that: (1) households’ consumption expenditure growth is positively correlated withthe initial share of nonfarm income; (2) the growth elasticity of nonfarm income share is higher for wealthier households; and (3) themain source of growth for nonfarm participants comes from the higher rates of return participants enjoy on their human and physicalcapital.� 2012 Elsevier Ltd. All rights reserved.
Key words — rural nonfarm, income dynamics, income diversification, Africa, Ethiopia, impact
* Final revision accepted: January 9, 2012.
1. INTRODUCTION
Several studies in various developing countries have shownthat participation in the rural nonfarm employment (RNFE)is routinely positively correlated with total income, wealth,and even agricultural productivity (Haggblade, 2007; Lanjouw& Lanjouw, 2001; Reardon, 1997; Reardon, Berdegue, & Esco-bar, 2001). The observed positive correlations between non-farm participation and income, wealth and productivity havefostered hope that nonfarm employment may offer a way outof poverty. However, studies of determinants of participationalso indicate that typically the rich have superior access toremunerative nonfarm activities (Corral & Reardon, 2001; deJanvry & Sadoulet, 2001; Dercon & Krishnan, 1996; Kung &Lee, 2001; Lanjouw & Shariff, 2002; Woldenhanna & Oskam,2001). 1 These findings thus call into question the direction ofcausality in the positive relationship between RNFE participa-tion and welfare indicators of rural households.
Only a few prior studies examine the relationship betweenRNFE participation and households’ subsequent income orexpenditure growth. A panel study of income diversificationand poverty in India by Kijima and Lanjouw (2005) links re-gional changes in poverty levels with nonfarm sector expan-sion. They found no evidence of a direct impact of nonfarmemployment on poverty. However, they noted that by raisingthe agricultural wage rate and providing the poor with a safetynet, nonfarm employment may play an important indirectrole.
Block and Webb (2001) examine whether higher diversifica-tion into the RNFE in one period is associated with higher in-come and consumption outcomes in the subsequent period inEthiopia. They found that households who are more diversi-fied in the initial period subsequently increased their relative
1634
income and calorie intake. While Block and Webb (2001)make an important contribution in exploring the impact ofdiversification on welfare dynamics, the sample used in theiranalysis and the initial period under consideration are too spe-cific for broad generalizations. The survey sites in the samplewere selected because of their famine experience and the twoperiods compared are the post-famine year 1989 and thepost-reform year 1994. Moreover, they use crop share of in-come as a measure of diversification. This is not equivalentto the share of nonfarm income, however, since even the in-comes of pure agriculturalists may include income from crop,livestock, farm wage employment, and transfers. Hence theconclusions drawn from crop share variables, while indicativeperhaps of livelihood diversification, do not really reflect accu-rately households’ RNFE activity levels.
This paper examines the impact of rural farm households’diversification into nonfarm employment on their consump-tion expenditure dynamics. It addresses the limitations inBlock and Webb (2001) by focusing on income from ruralnonfarm employment and by using panel data on a diversifiedsample. Our study also goes further than the previous litera-ture in investigating the sources of consumption growth fornonfarm participants. Furthermore, this paper examineswhether nonfarm employment is pro-poor by estimating itsimpact on expenditure growth separately for the poor andthe rich.
Consistent with the pattern observed in other African coun-tries, we find that total nonfarm income increases across expen-diture and wealth terciles. Households at the top tercile of thedistribution earn 75% more per capita than those in the
DOES THE NONFARM ECONOMY OFFER PATHWAYS FOR UPWARD MOBILITY? 1635
bottom. However, unlike the case for several other Africancountries, the share of income from nonfarm employment isnot higher for the rich. In fact, the share for households inthe lower income tercile is higher suggesting that distress re-sponse may be the driving force behind livelihood diversifica-tion among the poorest households.
The results from our parametric and non-parametric analy-ses suggest that participation in nonfarm activities acceleratesconsumption growth and enables upward mobility. Ourregression results exploring the impact of nonfarm participa-tion on consumption expenditure growth indicate that house-holds who participate in RNFE experience higher growth inexpenditure with the growth rate increasing as one engagesmore intensively in nonfarm employment. While both the poorand non-poor benefit from nonfarm employment, we also findthat RNFE has greater impact on the consumption expendi-ture growth of wealthier households. Our decomposition anal-ysis indicates that rural nonfarm employment participantsenjoy higher rates of return to their human and physical cap-ital than do non-participants. The primary gains from RNFEparticipation thus appear attributable to increased averageproductivity of households’ productive assets.
The remainder of the paper proceeds as follows. Section 2discusses the data and the macroeconomic conditions inEthiopia during the study period. Sections 3 and 4 presentthe conceptual framework and empirical model, respectively.Results are discussed in Section 5. The final section presentsconcluding remarks.
2. BACKGROUND, DATA AND DESCRIPTIVESTATISTICS
(a) Background: Ethiopia 1994–2004
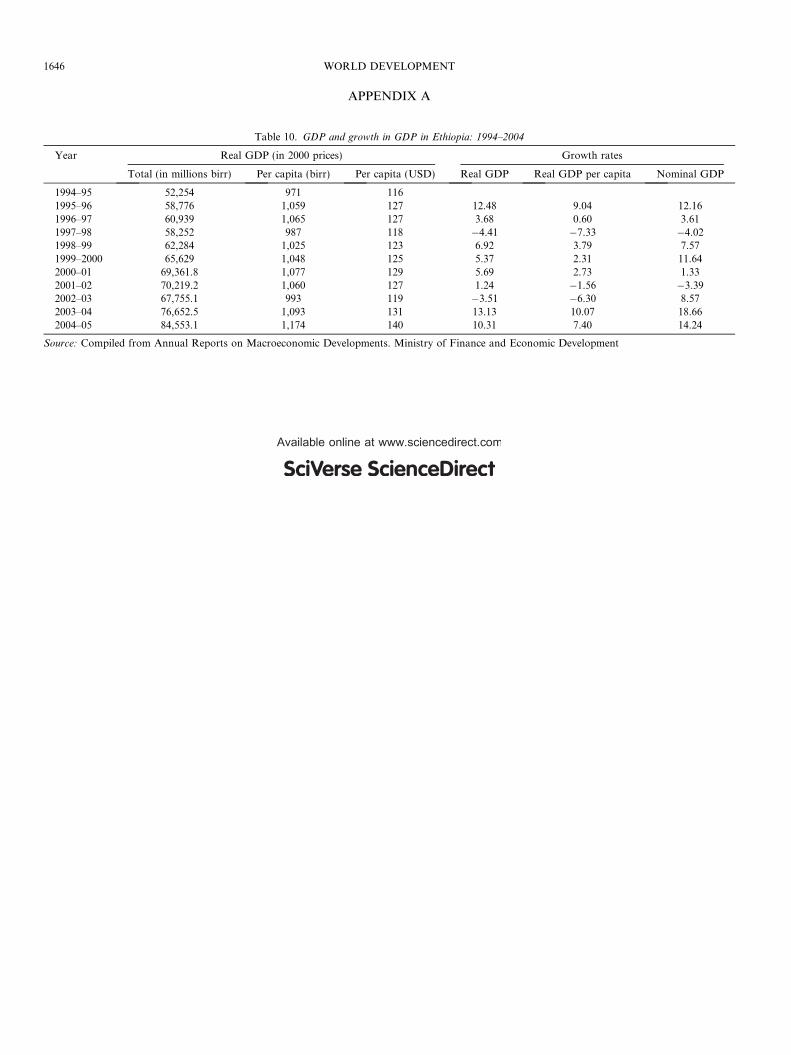
The 1990s brought important macroeconomic policy andpolitical changes to Ethiopia that had tremendous impact onthe incentives and opportunities available to households(Dercon, 2006). There was a transition of power in 1991–92when the decades old civil war ended with the overthrow ofthe socialist Derg regime. Although a modest liberalizationhad already started in 1989, significant changes were made inthe early 1990s. The new government agreed on a policy frame-work paper with the International Monetary Fund (IMF) andthe World Bank in September 1992, which led to the structuraladjustment program of 1993–96 (ADB, 2000). In the period1994–2004, the economy performed reasonably well. The aver-age per capita annual income over this period was 126 US dol-lars. Total real GDP grew by an average of five percent per yearand GDP per capita by two percent (see Appendix Table 10).
(b) Data
The analysis is based on the Ethiopian Rural HouseholdSurvey (ERHS) data. The ERHS is a unique longitudinal dataset. It was launched in 1994 by the Department of Economicsat Addis Ababa University and the Centre for the Study ofAfrican Economics at Oxford. These data were collected insix rounds over the span of ten years, from 1994 to 2004.There are 15 villages in the sample from different parts ofthe country. The villages were selected to represent the mainfarming systems in the country. However, the sample doesnot include villages from pastoralist regions. 2
We use data from 1994, 1999 and 2004 surveys to computetwo annualized growth rates over 5 years each. The panel dataare unbalanced covering 1792 households in these three
surveys. Eighty percent of these households were observed atleast twice while 65% were observed in all the three years.The descriptive statistics are computed based on the full sam-ple (1792 households) while for the growth model we necessar-ily used only those households who were observed in at leasttwo consecutive periods.
Consumption expenditures include both food and non-fooditems. The monetary value of food consumed from own pro-duction, food aid and in-kind payments are computed usingprices collected in the village markets at the time of the survey.To make comparison across time possible, we report real val-ues using the national consumer price index with December2000 as a base period. The average monthly consumptionexpenditures per adult equivalent 3 for the three years are re-ported in Table 1. Consumption expenditures increased from108 Birr in 1994 to 136 Birr in 2004, giving an annualizedgrowth rate of 2.6%. Table 1 also reports the average monthlyincome for comparison. Total rural income is composed ofrural nonfarm income (RNFI), agricultural income (includingcrop income, livestock income and agricultural wages), and in-come from transfers (including aid and remittances). Con-sumption expenditures per adult equivalent are higher thanincome per adult equivalent, likely indicating income under-reporting in our sample. 4 Because expenditures data are typi-cally considered more reliable than income data in rural areasof developing countries, the growth analysis in this paper isbased on the expenditures data.
Rural nonfarm income (RNFI) includes income earned fromall types of wage and self-employment activities in the non-agricultural sector. It does not include free food aid or othertransfers. Households who are engaged in food-for-work pro-gram supply labor to receive food, so those in-kind paymentshave been included under wage earnings. For self-employment,respondents were asked to report net income or, alternatively,the cost of raw materials and the proceeds from sale of prod-ucts, from which we computed net income. The questionnaireelicits the details of nonfarm activities and income from thenonfarm activities for the four preceding months. A fourmonth recall period has advantages over a full year recall per-iod—fewer measurement errors due to recall problems—but ithas also a limitation in that there may be under-reporting forthose households whose main nonfarm engagement is seasonaland falls outside the four months covered by the survey.
Share of nonfarm income (RNFsh) refers to total monthlyRNFI expressed as a share of total monthly consumptionexpenditures. It is always zero for non-participants. For par-ticipants it could be negative, since some households incurlosses from self employment activities, or more than one, whenthere is saving, i.e., RNFI exceeds expenditures.
(c) Descriptive statistics: 1994–2004
(i) Participation and income in RNFEClose to half of the sample households (48%) participated in
RNFE in these periods. Nonfarm activities include both wageemployment and self-employment activities. About 70% par-ticipated in self-employment and 13% in both wage and self-employment. The higher proportion of self-employment likelyreflects a lack of wage employment opportunities in ruralEthiopia rather than a dynamic business environment. Mostof these self-employment activities are small, low-investmentmicro-enterprises or petty trade.
The survey identified more than twenty distinct types ofnonfarm employment activities. Employment in food-for-work projects, petty trade, charcoal and dung cake making,and fuel wood collection are among the most common

Table 2. Classification of RNFE activities
Low resource requirement High resource requirement
Wage employment Unskilled: e.g., food-for-work, other casual labor, e.g.,working as guards or maid
Skilled: e.g., teaching, administration,clergy, masonry
Self-employment Low-investment: e.g., homemade food,petty trade, handicrafts
High-investment: e.g., livestock trade,transport by pack animals
Table 1. Monthly expenditure and income of sample households in 1994, 1999 and 2004a
Year Household consumption expenditure per adultequivalent
Household income per adult equivalent
Mean Std. dev Median Mean Std. dev Median
1994 108 109 77 50 67 321999 131 224 82 71 188 412004 136 137 93 85 106 50
a Income and expenditures are given in USD at 2000 constant prices.
1636 WORLD DEVELOPMENT
nonfarm activities, while very few people participate in tradi-tional medicine or clerical work. 5 Table 2 groups nonfarmactivities based on a functional classification into wage andself-employment, and sub-grouping within these two catego-ries based on the skills required for wage employment andthe capital requirements for self-employment.
As may be expected, activities that involve higher skill orinvestment yield higher returns but are accessible to fewer peo-ple. The returns to skilled wage employment at 15 Birr per dayare about three times as high as that from unskilled wage la-bor. The return from high investment business at 20 Birr perday is more than twice that of low investment business, whichyields barely 9 Birr per day. Unskilled wage employment is thelowest paying job; its return is roughly equivalent to the re-turns to (unskilled) farm wage employment. We therefore clas-sify the activities with low resource requirements as “low-return RNFE” and those with high (skill or capital) resourcerequirements as “high-return RNFE”.
The vast majority of households participating in the RNFEwere engaged in the low-return, unskilled wage employmentand in business activities with low capital requirements. Only7% of households participated in high-return, skilled wageemployment or high investment self-employment (Table 3).A quarter of the nonfarm participants are female headed,which is the same as their share in the sample. However, only14% of the high-return RNFE participants are female headed.
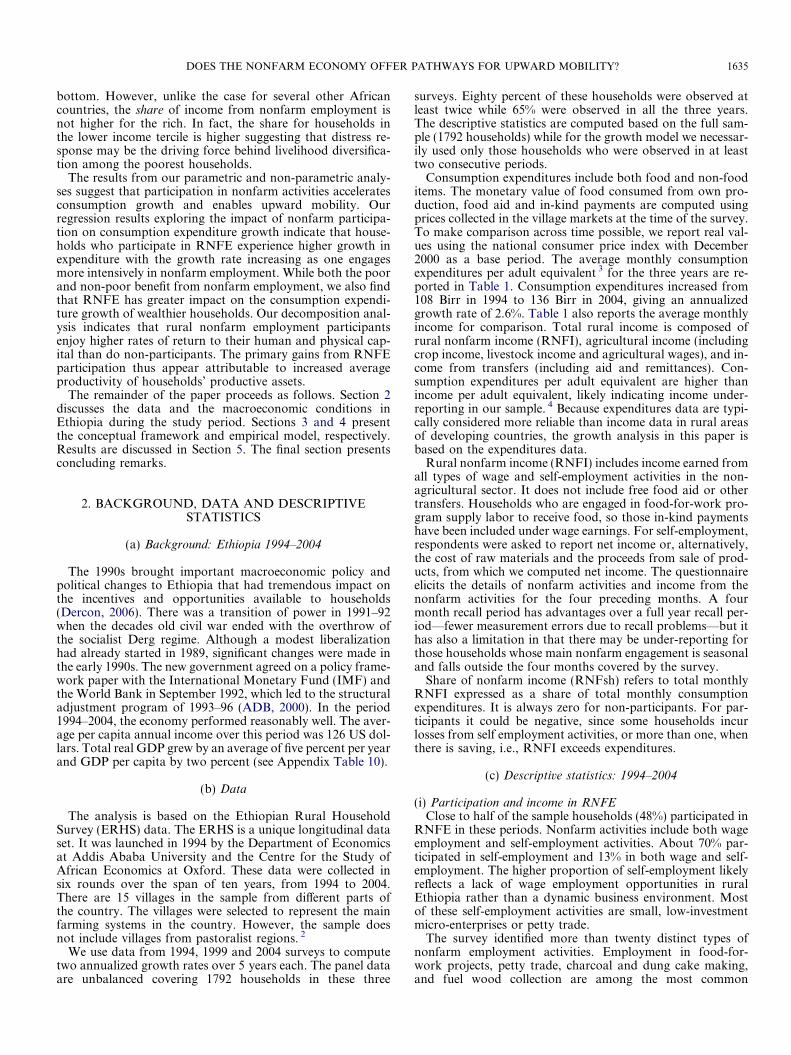
Income from nonfarm activities accounts for 21% of con-sumption expenditure for households engaged in RNFE.Table 4 reports the share of income from RNFE disaggregatedby expenditure and asset terciles. While income share is not aperfect indicator of RNFE participation, as it reflects successin RNFE activities as well as resource allocation to thoseactivities, it is the best available indicator as labor allocationdata are notoriously prone to measurement error and the allo-cation and valuation of non-labor assets are incompletely re-corded in the ERHS data (as is typical of most surveys).The share of rural nonfarm income declines across expenditure
Table 3. Proportion of RNF
Year RNFEa
1994 0.571999 0.432004 0.44Average 0.48
a Some households participated in more than one type of RNFE.
terciles. For the poor, it accounts for one-third of householdconsumption expenditure, while for those in the top tercile,it is barely 10%. This indicates that RNFE is an importantsource of income for the poor, although they are typically in-volved only in low-return activities because of entry barriers.This is unlike the findings for several African countries wherethe average reported share of income from nonfarm activitiesfor households in upper income tercile is twice that of house-holds in the lower income tercile (Reardon, 1997). However,the high share for the poor in Ethiopia seems to be a resultof lower total income from other sources rather than greaterinvolvement in and income from RNFE. The average nonfarmincome of households in the upper income tercile is 75% higherthan those in the lower tercile.
Classifying households based on assets, a more robust mea-sure of wealth status, we found that the share of income fromRNFE is almost the same for all participant households butthe rich still get considerably higher income from RNFEsources. This pattern may be an indication to distress diversi-fication on the part of the poor households rather than a resultof income maximization in response to attractive non-farmbusiness opportunities. Because of pervasive risk in rural areasof developing countries, poor farm households may diversifyinto nonfarm activities either to smooth income ex ante orto smooth consumption ex post (Ellis, 2000; Reardon,Berdegue, Barrett, & Stamoulis, 2007).
(ii) Total income, expenditures, and capitalRNFE participants have higher total expenditures and in-
come levels than do non-participants and the monthly incomedifference is statistically significant. However, they also havelarger households. Hence, the average income and expenditureper adult equivalent are not statistically significantly differentbetween participants and non-participants. (See Table 5)
Nonfarm participants have significantly greater laborendowments and more nonfarm equipment, while the RNFEnon-participants have more farm equipment. RNFE
E participant households
High-return RNFE Low-return RNFE
0.06 0.530.08 0.380.06 0.410.07 0.44
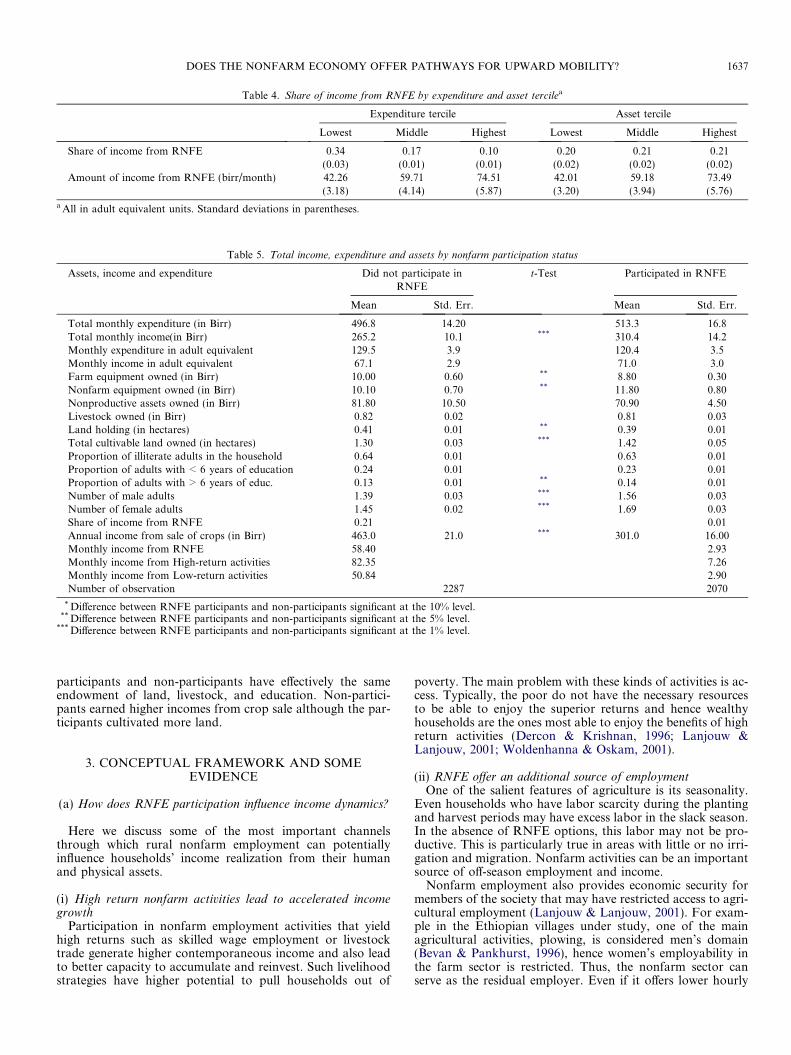
Table 5. Total income, expenditure and assets by nonfarm participation status
Assets, income and expenditure Did not participate inRNFE
t-Test Participated in RNFE
Mean Std. Err. Mean Std. Err.
Total monthly expenditure (in Birr) 496.8 14.20 513.3 16.8Total monthly income(in Birr) 265.2 10.1 *** 310.4 14.2Monthly expenditure in adult equivalent 129.5 3.9 120.4 3.5Monthly income in adult equivalent 67.1 2.9 71.0 3.0Farm equipment owned (in Birr) 10.00 0.60 ** 8.80 0.30Nonfarm equipment owned (in Birr) 10.10 0.70 ** 11.80 0.80Nonproductive assets owned (in Birr) 81.80 10.50 70.90 4.50Livestock owned (in Birr) 0.82 0.02 0.81 0.03Land holding (in hectares) 0.41 0.01 ** 0.39 0.01Total cultivable land owned (in hectares) 1.30 0.03 *** 1.42 0.05Proportion of illiterate adults in the household 0.64 0.01 0.63 0.01Proportion of adults with < 6 years of education 0.24 0.01 0.23 0.01Proportion of adults with > 6 years of educ. 0.13 0.01 ** 0.14 0.01Number of male adults 1.39 0.03 *** 1.56 0.03Number of female adults 1.45 0.02 *** 1.69 0.03Share of income from RNFE 0.21 0.01Annual income from sale of crops (in Birr) 463.0 21.0 *** 301.0 16.00Monthly income from RNFE 58.40 2.93Monthly income from High-return activities 82.35 7.26Monthly income from Low-return activities 50.84 2.90Number of observation 2287 2070
* Difference between RNFE participants and non-participants significant at the 10% level.** Difference between RNFE participants and non-participants significant at the 5% level.
*** Difference between RNFE participants and non-participants significant at the 1% level.
Table 4. Share of income from RNFE by expenditure and asset tercilea
Expenditure tercile Asset tercile
Lowest Middle Highest Lowest Middle Highest
Share of income from RNFE 0.34 0.17 0.10 0.20 0.21 0.21(0.03) (0.01) (0.01) (0.02) (0.02) (0.02)
Amount of income from RNFE (birr/month) 42.26 59.71 74.51 42.01 59.18 73.49(3.18) (4.14) (5.87) (3.20) (3.94) (5.76)
a All in adult equivalent units. Standard deviations in parentheses.
DOES THE NONFARM ECONOMY OFFER PATHWAYS FOR UPWARD MOBILITY? 1637
participants and non-participants have effectively the sameendowment of land, livestock, and education. Non-partici-pants earned higher incomes from crop sale although the par-ticipants cultivated more land.
3. CONCEPTUAL FRAMEWORK AND SOMEEVIDENCE
(a) How does RNFE participation influence income dynamics?
Here we discuss some of the most important channelsthrough which rural nonfarm employment can potentiallyinfluence households’ income realization from their humanand physical assets.
(i) High return nonfarm activities lead to accelerated incomegrowth
Participation in nonfarm employment activities that yieldhigh returns such as skilled wage employment or livestocktrade generate higher contemporaneous income and also leadto better capacity to accumulate and reinvest. Such livelihoodstrategies have higher potential to pull households out of
poverty. The main problem with these kinds of activities is ac-cess. Typically, the poor do not have the necessary resourcesto be able to enjoy the superior returns and hence wealthyhouseholds are the ones most able to enjoy the benefits of highreturn activities (Dercon & Krishnan, 1996; Lanjouw &Lanjouw, 2001; Woldenhanna & Oskam, 2001).
(ii) RNFE offer an additional source of employmentOne of the salient features of agriculture is its seasonality.
Even households who have labor scarcity during the plantingand harvest periods may have excess labor in the slack season.In the absence of RNFE options, this labor may not be pro-ductive. This is particularly true in areas with little or no irri-gation and migration. Nonfarm activities can be an importantsource of off-season employment and income.
Nonfarm employment also provides economic security formembers of the society that may have restricted access to agri-cultural employment (Lanjouw & Lanjouw, 2001). For exam-ple in the Ethiopian villages under study, one of the mainagricultural activities, plowing, is considered men’s domain(Bevan & Pankhurst, 1996), hence women’s employability inthe farm sector is restricted. Thus, the nonfarm sector canserve as the residual employer. Even if it offers lower hourly

1638 WORLD DEVELOPMENT
returns to labor than other activities, it still can make a posi-tive contribution toward total returns for those resources thatwould have been, at least partially, idle otherwise.
(iii) RNFE help relax households’ liquidity constraintsGiven financial market imperfections in rural economies,
farm households face liquidity constraints to invest in agricul-tural inputs and human capital (Reardon, 1997). Earningsfrom nonfarm employment may thereby have added value ifit enables farmers to purchase agricultural inputs that arecomplementary with other inputs. For example, Bezu andHolden (2008) show that, controlling for plot and householdlevel characteristics, food-for-work participants in Tigray weremore likely to use fertilizer on their farm than non-partici-pants, presumably because the transfer relaxed households’liquidity constraints. In Honduras, Ruben and Van den Berg(2001) showed that the amount of purchased inputs increaseswith households’ nonfarm income. Nonfarm income also en-ables households to hire labor for timely cultivation of crops(Ellis & Freeman, 2004). A relaxation of the liquidity con-straint also means that households may be able to pay for theirchildren’s school fees and books, thereby accumulating humancapital that will eventually yield high returns. RNFE partici-pation may even open the door to credit access. Lendersmay use the evidence of steady pay in the non-farm marketas collateral for loans (Collier & Lal, 1984; Reardon, Taylor,Stamoulis, Lanjouw, & Balisacan, 2000).
(iv) RNFE and riskIn the face of a virtually nonexistent rural insurance mar-
kets, even moderate shocks may have long term impacts onhouseholds’ welfare, especially if households have to sell theirproductive assets or significantly reduce consumption to an ex-tent that compromises human capital. For example, Dercon(2004) documents that rainfall shocks in Ethiopia have an im-pact on consumption growth that persists for several years.
Participation in nonfarm employment can serve as a safetynet for households facing income shocks thereby protectingtheir productive assets. Kijima, Matsumoto, and Yamano(2006) showed that Ugandan households’ nonfarm labor sup-ply increases if they experience agricultural shocks in the pre-vious harvest, especially if they are asset poor households. Asimilar labor supply response was also observed in India(Kochar, 1995). The RNFE is, however, probably more effec-tive as a safety net in the face of idiosyncratic as opposed tocovariate shocks such as due to rainfall or prices. This is be-cause many nonfarm activities are linked with agriculturalactivities for input supply and output demand and also be-cause the market may be saturated quickly if many householdsin the same village enter the RNFE simultaneously in responseto a shock.
Related with the safety net function of the rural nonfarmemployment is its impact on the willingness of households toadopt technologies that give higher average returns but mayalso entail higher risk. Compared to households who dependonly on farming, households who participate in nonfarmactivities may be relatively less worried about the worst out-come of an investment or input use decisions because theyhave alternative income to fall back on. Collier and Lal(1984) demonstrate that in Central Kenya, poorer householdswho have access to nonfarm employment were able to invest intree planting and hybrid livestock, which are considered to behigh-return, high-risk activities often undertaken by the rich.In another study of Kenya farm households in Kirinyag dis-trict, Evans and Ngau (1991) found that participation in non-farm activities was positively associated with agricultural
investment and production decisions that are potentially pro-ductivity enhancing.
(b) The evidence on RNFE and income dynamics
The existing evidence tends to suggest a positive correlationbetween the share and level of income from RNFE and total in-come in Africa. In a review of 23 field studies in Africa, Reardon(1997) found that the rich not only earn higher nonfarm incomebut also get a higher share of their income from nonfarm activ-ities. On average, the share of nonfarm income for the upper in-come tercile households was twice as much as the share forhouseholds in the lower income tercile. A study looking at non-farm employment in Ghana and Uganda (Canagarajah, New-man, & Bhattamishra, 2001) also found that the shares ofnonfarm income were larger in higher income brackets. Butthe direction of causality is not clear. Do the rich earn highernonfarm income because of their preferential access to it or isit nonfarm participation that has enriched them?
The literature on rural nonfarm employment has focused onidentifying the determinants of participation and nonfarm in-come (Ellis, 1998; Lanjouw & Lanjouw, 2001; Reardon,1997). Few studies have systematically examined the impactof participation on households’ welfare dynamics. Barrett,Bezuneh, and Aboud (2001) showed that households who par-ticipate in skilled nonfarm employment experience increase inincome in Cote d’Ivoire following exchange rate reform.Holden, Shiferaw, and Pender (2004) used a dynamic non-separable bio-economic household model to assess the impactsof access to nonfarm employment on household welfare andland management decisions in Ethiopia. Although they exam-ine only access to low-wage employment, their results showthat access to nonfarm employment has a significant positiveimpact on households’ total income as such sources of incomeare constrained. Block and Webb (2001) found that higherdiversification was associated with higher subsequent welfareoutcomes in Ethiopia.
Other studies show the impact indirectly. For example,Nargis and Hossain (2006) show that the returns on adultlabor and education used in nonagricultural activities werehigher than those used in agriculture and increased over time.Canagarajah et al. (2001) show that the contribution of growthto poverty reduction was higher for nonfarm participanthouseholds in Uganda and Ghana.
(c) A simple model of income growth
This conceptual discussion can be captured in a relativelystraightforward model. Following Barrett (2005) we expressincome as the product of households’ productive asset endow-ments (which we call “capital” as compact shorthand) and thereturns to capital:
Y it ¼ Kitrit ð1Þwhere Kit refers to a vector of human and physical capital andrit refers to a vector of net returns to capital. We assume thathouseholds do not have financial capital such as cash, stocks,and bonds. Instead we assume that part of the physical capitalis held, at least partially, for insurance and wealth accumula-tion purposes. These assumptions are not far from the realityin rural Ethiopia where the financial sector is almost nonexis-tent.From total differentiation of the income equation we de-rive growth in income as a function of changes in capitaland in returns to capital:
dY it ¼ dKitrit þ dritKit ð2Þ
DOES THE NONFARM ECONOMY OFFER PATHWAYS FOR UPWARD MOBILITY? 1639
where dKit refers to change in capital i.e., investment and drit re-fers to change in returns to the capital owned. For householdswith little potential to increase their resource endowments,changes in the rate of returns are the only source of incomegrowth.
In well functioning factor markets, households allocate theirresources among different activities until the marginal returnsfrom the respective activities are equal. However, this is oftennot the case in the rural economy of a developing country.Markets routinely fail, with the implication that householdsmay not have access to some activities that yield marginaland average returns higher than the ones in which they arecurrently engaged (Barrett, Sherlund, & Adesina, 2008). Forexample, we find that skilled wage employment and relativelyhigh-investment businesses yield higher average and marginalreturns than farming or other nonfarm activities; but they arenot accessible by poorer households. The returns to house-holds’ capital holdings in such markets will then be highlyinfluenced by the types of activities in which the household en-gages. To capture the different combinations of farm and non-farm activities, we define a variable ACit as an index indicatingthe share of capital employed in the nonfarm economy. Re-turns may then be written as a function of AC:
rit ¼ f ðACit;Kit;EitÞ ð3ÞThe inclusion of Kit in the return function allows for variablereturns to scale. Eit refers to a vector of exogenous variablessuch as prices, infrastructure, and policies that may lead to dif-ferent rates of returns across time or place for the same level ofcapital and RNFE activity index.We can now express growthas a reduced form function of initial human and physical cap-ital, the activity index and changes in the capital and the activ-ity index as well as the initial exogenous conditions andchanges in these conditions:
dY it ¼ gðKit; dKit;ACit; Eit; dEitÞ ð4ÞBased on Eqns. (2) and (3), there would be interaction termsbetween dK and the three arguments of the returns function(AC, E and K), as well as between the K vector and changesin those three variables (dAC, dE and dK). But, as we discussin the empirical section below, estimation of the reduced formgrowth equation with change variables introduces problems ofendogeneity, so Eqn. (4) is typically estimated on just the levelsvariables alone.
In this paper, we want to test the hypothesis that participa-tion in nonfarm employment accelerates income growth. Thisfollows from our theoretical argument that in the absence offully functioning markets, nonfarm activities improve the re-turns to productive endowments and hence the household’swelfare dynamics.
The second issue this paper examines is whether rural non-farm employment impacts the poorer households differentlythan richer ones. Because the poor are more liquidity con-strained, more risk averse, and potentially more abundant inlabor, the impact of participation on their production decisionand efficiency may be higher. Alternatively, since poorerhouseholds have diminished access to nonfarm activities thatyield higher returns, the welfare impact of their participationmay be lower than that of the rich.
4. EMPIRICAL MODEL
(a) Growth equation
In the theoretical growth model developed above, income isa function of initial capital holdings (K), the activities those re-
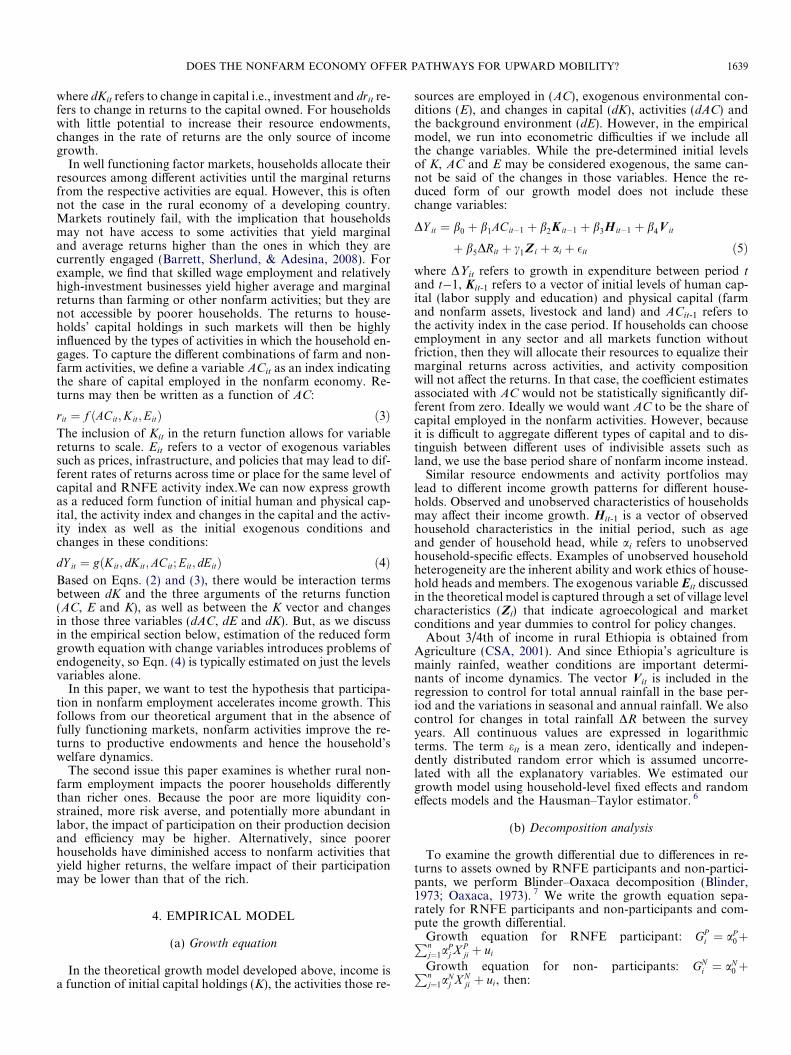
sources are employed in (AC), exogenous environmental con-ditions (E), and changes in capital (dK), activities (dAC) andthe background environment (dE). However, in the empiricalmodel, we run into econometric difficulties if we include allthe change variables. While the pre-determined initial levelsof K, AC and E may be considered exogenous, the same can-not be said of the changes in those variables. Hence the re-duced form of our growth model does not include thesechange variables:
DY it ¼ b0 þ b1ACit�1 þ b2K it�1 þ b3H it�1 þ b4V it
þ b5DRit þ c1Z i þ ai þ �it ð5Þwhere DYit refers to growth in expenditure between period tand t�1, Kit-1 refers to a vector of initial levels of human cap-ital (labor supply and education) and physical capital (farmand nonfarm assets, livestock and land) and ACit-1 refers tothe activity index in the case period. If households can chooseemployment in any sector and all markets function withoutfriction, then they will allocate their resources to equalize theirmarginal returns across activities, and activity compositionwill not affect the returns. In that case, the coefficient estimatesassociated with AC would not be statistically significantly dif-ferent from zero. Ideally we would want AC to be the share ofcapital employed in the nonfarm activities. However, becauseit is difficult to aggregate different types of capital and to dis-tinguish between different uses of indivisible assets such asland, we use the base period share of nonfarm income instead.
Similar resource endowments and activity portfolios maylead to different income growth patterns for different house-holds. Observed and unobserved characteristics of householdsmay affect their income growth. Hit-1 is a vector of observedhousehold characteristics in the initial period, such as ageand gender of household head, while ai refers to unobservedhousehold-specific effects. Examples of unobserved householdheterogeneity are the inherent ability and work ethics of house-hold heads and members. The exogenous variable Eit discussedin the theoretical model is captured through a set of village levelcharacteristics (Zi) that indicate agroecological and marketconditions and year dummies to control for policy changes.
About 3/4th of income in rural Ethiopia is obtained fromAgriculture (CSA, 2001). And since Ethiopia’s agriculture ismainly rainfed, weather conditions are important determi-nants of income dynamics. The vector Vit is included in theregression to control for total annual rainfall in the base per-iod and the variations in seasonal and annual rainfall. We alsocontrol for changes in total rainfall DR between the surveyyears. All continuous values are expressed in logarithmicterms. The term eit is a mean zero, identically and indepen-dently distributed random error which is assumed uncorre-lated with all the explanatory variables. We estimated ourgrowth model using household-level fixed effects and randomeffects models and the Hausman–Taylor estimator. 6
(b) Decomposition analysis
To examine the growth differential due to differences in re-turns to assets owned by RNFE participants and non-partici-pants, we perform Blinder–Oaxaca decomposition (Blinder,1973; Oaxaca, 1973). 7 We write the growth equation sepa-rately for RNFE participants and non-participants and com-pute the growth differential.
Growth equation for RNFE participant: GPi ¼ aP
0þPnj¼1a
Pj X P
ji þ ui
Growth equation for non- participants: GNi ¼ aN
0þPnj¼1a
Nj X N
ji þ ui, then:

1640 WORLD DEVELOPMENT
GP � GN ¼X
aPj ðX P
j � X Nj Þ|fflfflfflfflfflfflfflfflfflfflfflfflffl{zfflfflfflfflfflfflfflfflfflfflfflfflffl}
E
þ X Nj ðaP
j � aNj Þ|fflfflfflfflfflfflfflfflffl{zfflfflfflfflfflfflfflfflffl}
C
þ ðaPo � aN
o Þ|fflfflfflfflfflffl{zfflfflfflfflfflffl}U
ð6Þ
The first part of the decomposition Eqn. (6), E, refers togrowth differences due to participants having higher endow-ments while the second part C refers to growth differencesdue to participants having higher marginal returns, as reflectedin the regression coefficient estimates. The component Cwould be non-zero only if returns to assets differ by participa-tion status. U refers to the growth differences unexplained byendowments or efficiency.
5. RESULTS AND DISCUSSION
(a) Non-parametric regression
Comparison of the mean consumption growth rate forRNFE participants and non-participants show that house-holds who participate in RNFE grow faster, although signifi-cant only at the 10% level. However, mean comparisons byparticipation status reveal very little. We have argued in theconceptual discussion that the activity index may affect thegrowth path. Using the base period share of nonfarm incomein total expenditures as an activity index, Figure 1 presents thenonparametric regression of expenditure growth on the activ-ity index over the range [0,1], which encompasses 96% of thesample. The Kernel-weighted polynomial regression shows astatistically significant positive relationship between expendi-ture growth and nonfarm share. Households who engage moreintensively in nonfarm employment experience higher con-sumption growth, especially in the range where (positive) non-farm income constitutes up to half of consumptionexpenditure. The result seems to confirm our hypothesis thatnonfarm participation accelerates income growth.
(b) Multivariate regression estimation
Following our theoretical discussion earlier, we now explorethe relationship between growth and the activity index in amultivariate regression setting. We regress the change in thelogarithm of expenditure per adult equivalent on initial shareof nonfarm income and a range of control variables. To allowfor the potentially nonlinear relation we include a third orderpolynomial in the nonfarm share. Because only a very smallpercentage of households participated in high-return nonfarm
02
46
8C
onsu
mpt
ion
grow
th ra
te[(Y
t-Yt_
1)/Y
t]
0 .2 .4 .6 .8 1Initial expenditure share of income from RNFE
Kernel=Epanechinkov Degree =1 Bandwidth= 0.4 C.I = 90%
Kernel-weighted local polynomial smoothing
Figure 1. Non-parametric regression of expenditures growth on nonfarm
income share.
activities, of whom half also participated in low-returnemployment, there is unfortunately not enough observationand variation for disaggregating nonfarm income share bytype of employment. The other regressors included are humanand physical capital variables, household characteristics, andvillage characteristics. We include village median expenditureper adult equivalent to control for initial level expenditure inthe community. 8 Except for the variable indicating changein rainfall between the growth periods, all the other variablesare in level form and refer to the base period. We ran fixed ef-fects and Hausman–Taylor regressions but found no qualita-tive difference from the random effects estimates, and couldnot reject the null hypothesis that the individual specific effectsare uncorrelated with the other regressors, so the random ef-fects estimator is both more efficient and permits inferencewith respect to time-invariant household characteristics.Therefore, we report and discuss here only the random effectsestimation results. 9
As shown in Table 6, there is a positive correlation betweenthe share of income from RNFE and expenditure growth. 10
The coefficients on the linear and squared terms are positiveand significant and the coefficient on cubic term negativeand also significant, yielding a highly nonlinear relationship.We compute the marginal effect of nonfarm share on growthat its mean value and find that a 0.1 increase in the share ofnonfarm income increases expenditure growth by 6%, on aver-age. We also compute predicted growth rates for each house-hold and plot the results in Figure 2 against initial nonfarmincome shares. The plot shows a strongly positive and statisti-cally significant relationship between the initial expenditureshare of income from rural nonfarm employment and subse-quent expenditure growth.
The strongly positive relation between household’s nonfarmincome share and its subsequent expenditure growth indicatesthat, controlling for other differences, households who partic-ipate in RNFE experience higher growth in expenditure withthe growth rate increasing as one engages in nonfarm employ-ment more intensively. This may indicate higher returns to re-sources employed in the rural nonfarm economy as opposed toagriculture. For some activities such as skilled wage employ-ment, labor returns are typically much higher than the averageor marginal returns to farming. Moreover, given market con-ditions in rural Ethiopia, one or more of the possible channelsthrough which nonfarm participation increases contempora-neous income (as discussed in Section 3) may also lead to high-er subsequent growth. For example, almost all the survey sitesare characterized by rainfed agriculture with only one majorrainy season. Households that participate in nonfarm employ-ment, even if it was a low-return activity, get better total in-come from their endowments than those households who usetheir full resource only during the agricultural season. Giventhat credit markets function poorly in rural Ethiopia, partici-pation in nonfarm employment may also improve households’capacity to invest in agriculture and subsequently improvetheir income.
Turning to the other regressors in Table 6, age, dependencyratio, labor, and asset holdings also have statistically signifi-cant effects on expenditure growth. Households with olderheads experience lower growth. Households that started outwith higher levels of human and physical capital grow faster.Note that the coefficients in the growth model reflect changesover time in the returns to capital. Hence the positive coeffi-cients imply increasing returns to both male and female labor,with the returns to female labor higher than male labor. Phys-ical assets, on the other hand, exhibit decreasing returns overtime.
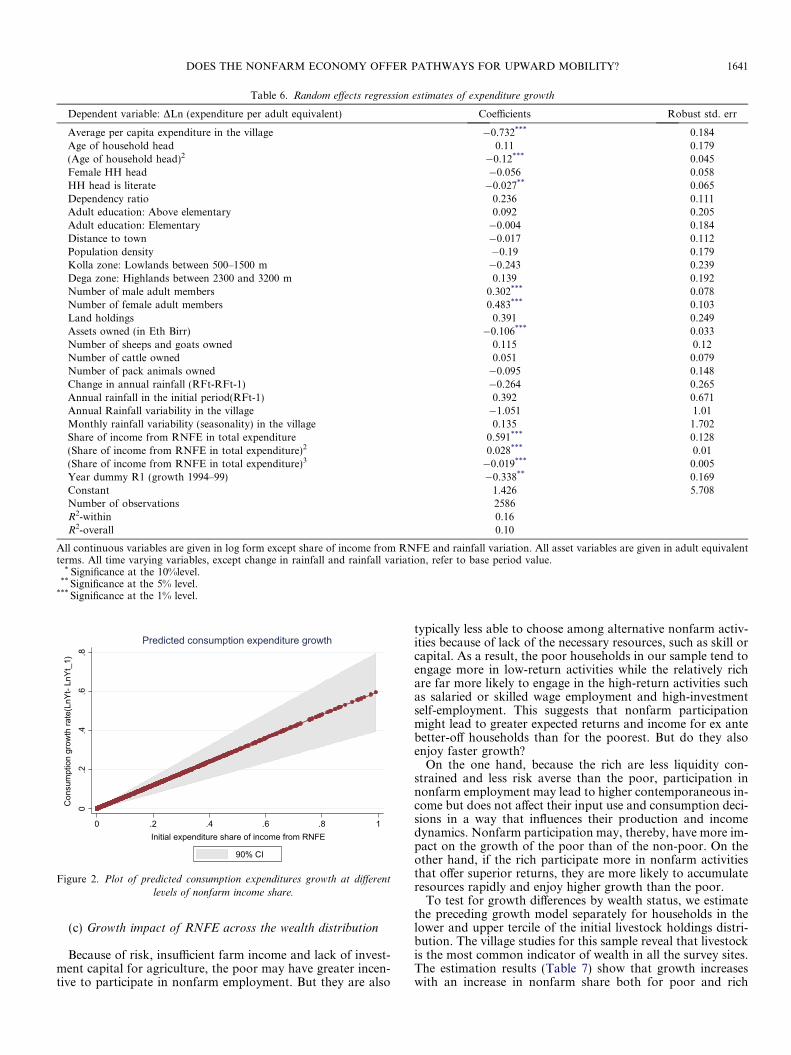
Table 6. Random effects regression estimates of expenditure growth
Dependent variable: DLn (expenditure per adult equivalent) Coefficients Robust std. err
Average per capita expenditure in the village �0.732*** 0.184Age of household head 0.11 0.179(Age of household head)2 �0.12*** 0.045Female HH head �0.056 0.058HH head is literate �0.027** 0.065Dependency ratio 0.236 0.111Adult education: Above elementary 0.092 0.205Adult education: Elementary �0.004 0.184Distance to town �0.017 0.112Population density �0.19 0.179Kolla zone: Lowlands between 500–1500 m �0.243 0.239Dega zone: Highlands between 2300 and 3200 m 0.139 0.192Number of male adult members 0.302*** 0.078Number of female adult members 0.483*** 0.103Land holdings 0.391 0.249Assets owned (in Eth Birr) �0.106*** 0.033Number of sheeps and goats owned 0.115 0.12Number of cattle owned 0.051 0.079Number of pack animals owned �0.095 0.148Change in annual rainfall (RFt-RFt-1) �0.264 0.265Annual rainfall in the initial period(RFt-1) 0.392 0.671Annual Rainfall variability in the village �1.051 1.01Monthly rainfall variability (seasonality) in the village 0.135 1.702Share of income from RNFE in total expenditure 0.591*** 0.128(Share of income from RNFE in total expenditure)2 0.028*** 0.01(Share of income from RNFE in total expenditure)3 �0.019*** 0.005Year dummy R1 (growth 1994–99) �0.338** 0.169Constant 1.426 5.708Number of observations 2586R2-within 0.16R2-overall 0.10
All continuous variables are given in log form except share of income from RNFE and rainfall variation. All asset variables are given in adult equivalentterms. All time varying variables, except change in rainfall and rainfall variation, refer to base period value.
* Significance at the 10%level.** Significance at the 5% level.
*** Significance at the 1% level.
0.2
.4.6
.8C
onsu
mpt
ion
grow
th ra
te(L
nYt-
LnYt
_1)
0 .2 .4 .6 .8 1Initial expenditure share of income from RNFE
90% CI
Predicted consumption expenditure growth
Figure 2. Plot of predicted consumption expenditures growth at different
levels of nonfarm income share.
DOES THE NONFARM ECONOMY OFFER PATHWAYS FOR UPWARD MOBILITY? 1641
(c) Growth impact of RNFE across the wealth distribution
Because of risk, insufficient farm income and lack of invest-ment capital for agriculture, the poor may have greater incen-tive to participate in nonfarm employment. But they are also
typically less able to choose among alternative nonfarm activ-ities because of lack of the necessary resources, such as skill orcapital. As a result, the poor households in our sample tend toengage more in low-return activities while the relatively richare far more likely to engage in the high-return activities suchas salaried or skilled wage employment and high-investmentself-employment. This suggests that nonfarm participationmight lead to greater expected returns and income for ex antebetter-off households than for the poorest. But do they alsoenjoy faster growth?
On the one hand, because the rich are less liquidity con-strained and less risk averse than the poor, participation innonfarm employment may lead to higher contemporaneous in-come but does not affect their input use and consumption deci-sions in a way that influences their production and incomedynamics. Nonfarm participation may, thereby, have more im-pact on the growth of the poor than of the non-poor. On theother hand, if the rich participate more in nonfarm activitiesthat offer superior returns, they are more likely to accumulateresources rapidly and enjoy higher growth than the poor.
To test for growth differences by wealth status, we estimatethe preceding growth model separately for households in thelower and upper tercile of the initial livestock holdings distri-bution. The village studies for this sample reveal that livestockis the most common indicator of wealth in all the survey sites.The estimation results (Table 7) show that growth increaseswith an increase in nonfarm share both for poor and rich

0.5
11.
52
Con
sum
ptio
n gr
owth
(LnY
t- Ln
Yt_1
)
0 .2 .4 .6 .8 1Initial expenditure share of income from RNFE
Poor households 95% CIRich households 95% CI
by wealth statusPredicted consumption expenditure growth
Figure 3. Plot of predicted consumption expenditures as a function of
RNFE income share for poor versus wealthy households.
1642 WORLD DEVELOPMENT
households. However, households who are in the upper wealthtercile have much higher expenditure growth elasticity ofRNFE participation intensity than do the poor. Comparedto poor households, the coefficient of nonfarm share is morethan three times higher for the livestock rich households.
Plots of predicted growth (Figure 3) show that the rich havea statistically significantly higher growth rate at each level ofinitial nonfarm income share. This may be because the richare more engaged in high return activities as compared topoorer households who do not have capacity to participatein these activities. The effect could also result from comple-mentarities between nonfarm participation and agriculturalactivities. For example, those who have donkeys and camelsearn income from RNFE by providing transport service. Buttheir farm also benefits from the animals’ manure. It is alsoeasier to transport inputs from and output to markets. Cropresidues in turn are used as fodder for their livestock, generat-ing important economies of scope.
Of course there is a possibility of endogeneity here. House-holds with more wealth may simply be better farmers who arealso more productive in nonfarm employment. The differencewe observe between rich and poor in the estimated growtheffects of nonfarm participation may thus merely reflectunobserved productivity differences between two groups.However, because we have used a random effects model—
Table 7. Random effects regression estimates
P
Coeff
Average per capita expenditure in the village �0.006Age of household head �0.25Female HH head 0.119HH head is literate �0.03Dependency ratio 0.123Adult education: Above elementary 0.189Adult education: Elementary �0.13Distance to town 0.035Population density 0.01Kolla zone: Lowlands between 500 and 1500 m 0.096Dega zone: Highlands between 2300 and 3200 m 0.402Number of male adult members 0.291*
Number of female adult members 0.544*
Land holding 0.366Asset owned (in Eth Birr) �0.105Number of sheeps and goats owned �0.456Number of cattle owned 0.385Number of pack animals owned 1.007Change in annual rainfall (RFt-RFt-1) 0.092Annual rainfall in the initial period (RFt-1) 0.177Annual Rainfall variability in the village �0.85Monthly rainfall variability (seasonality) in the village 0.962Share of income from RNFE in total expenditure 0.632*
(Share of income from RNFE in total expenditure)2 0.04*
(Share of income from RNFE in total expenditure)3 �0.019Year dummy R1 (growth 1994–99) �0.26Constant �0.80Number of observations 858R2-within 0.121R2-overall 0.095
All continuous variables are given in log form except share of income from RNterms. All time varying variables, except change in rainfall and rainfall variat
a Wealth refers to livestock holding: Poor (bottom tercile), wealthy (top terc* Significance at the 10% level.
** Significance at the 5% level.*** Significance at the 1% level.
and got qualitatively identical results with a less efficient fixedeffects model that explicitly controls for unobserved inter-household skill differences—we expect that some of this effect,if not all, is controlled for and the effect really is causal.
of expenditure growth by wealth statusa
oorest households Wealthiest households
. Std. Err Coeff. Std. Err
** 0.003 �0.003 0.0027 0.244 0.108 0.150
0.160 �0.402*** 0.1388 0.149 �0.137* 0.078
0.125 �0.133 0.1670.271 0.528** 0.262
4 0.285 0.059 0.1790.102 �0.032 0.0680.209 �0.271 0.3880.208 �0.44** 0.2000.379 �0.143 0.302
** 0.109 0.029 0.105** 0.164 0.34** 0.135
0.514 0.212 0.294* 0.056 �0.076* 0.042* 0.236 0.19 0.115
0.523 �0.074 0.1121.153 �0.346* 0.2010.464 0.301 0.7870.881 �0.656 1.332
9 2.121 �3.584** 1.4132.788 �1.534 3.072
** 0.176 1.979*** 0.415* 0.016 �0.594* 0.354** 0.008 0.045 0.0562 0.292 �0.426** 0.1763 8.003 7.26 11.937
8660.1740.129
FE and rainfall variation. All asset variables are given in adult equivalention, refer to base period value.ile).
DOES THE NONFARM ECONOMY OFFER PATHWAYS FOR UPWARD MOBILITY? 1643
(d) Nonfarm employment participation and its impact on assetreturns
Although the regression results discussed above show a posi-tive correlation between growth and the share of nonfarmincome, and that the growth effects of rural nonfarm employ-ment are greater among the relatively wealthy, they do notestablish that the returns to assets owned by RNFE partici-pants are in fact different from the returns to assets owned bynon-participants. In this section we explore this possibilityand also see whether higher returns (if any) accrue for all assetsor only for some asset classes.
We estimate the same function as before except that non-farm share is no longer an explanatory variable. Rather, weestimate the growth model separately for RNFE participants
Table 8. Village fixed effects estimates of expenditure
RNFE part
Coefficient
Age of household head 0.086Female HH head �0.135HH head is literate 0.064Dependency ratio 0.190Adult education: Above elementary �0.270Adult education: Elementary �0.116Number of male adult members 0.230Number of female adult members 0.371**
Land holding �0.313Asset owned (in Eth Birr) �0.043Number of sheeps and goats owned 0.174Number of cattle owned �0.140Number of pack animals owned 0.363Constant �0.685
All continuous variables are given in log form. All asset variables are given in areported.
* Significance at the 10% level.** Significance at the 5% level.
*** Significance at the 1% level.
Table 9. Blinder–Oaxaca decomposition of gro
Variables Amount attr
Age of household headFemale HH headHead is literateDependency ratioAdult education: Above elementaryAdult education: ElementaryNumber of male adultNumber of female adultLand holdingsAssets owned (in Eth. Birr)Number of sheep and goats ownedNumber of cattle ownedNumber of pack animals ownedSubtotal
Summary of decomposition results (as %)Total growth differential (E + C + U)
Amount attributable (C + E)Shift coefficient (unexplained portion) (U)
Coefficients as % of attributable difference [C/(C + E)]a Positive values show difference in favor of nonfarm participants. All continu
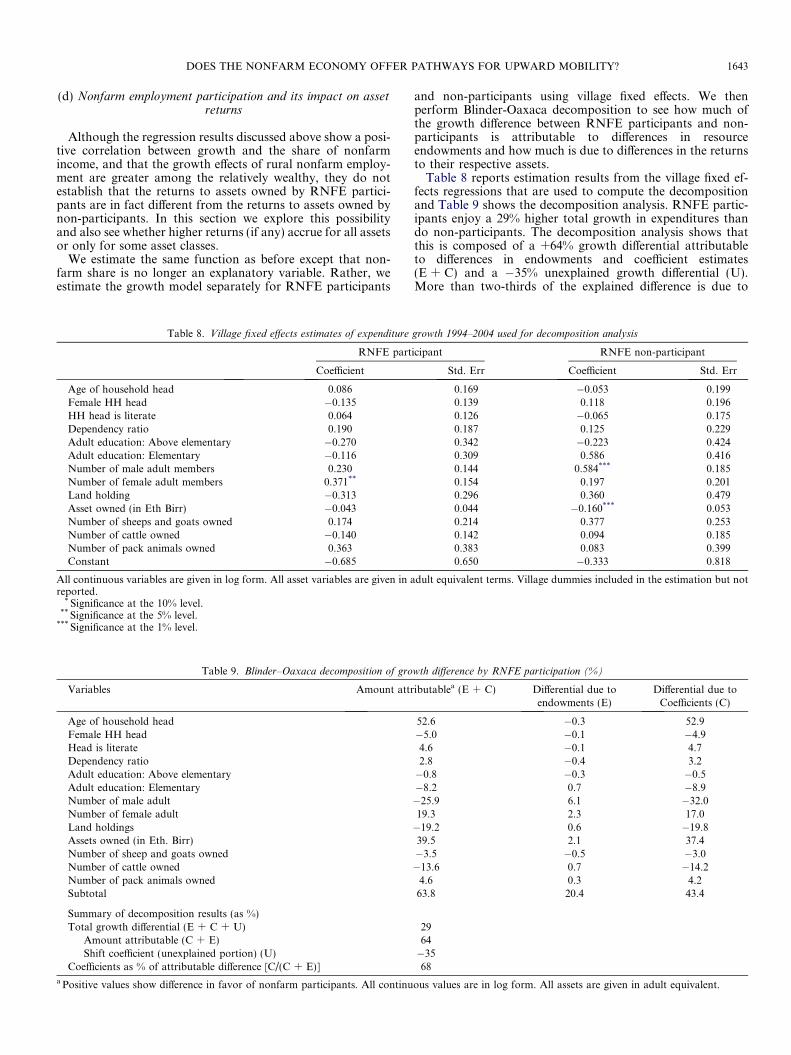
and non-participants using village fixed effects. We thenperform Blinder-Oaxaca decomposition to see how much ofthe growth difference between RNFE participants and non-participants is attributable to differences in resourceendowments and how much is due to differences in the returnsto their respective assets.
Table 8 reports estimation results from the village fixed ef-fects regressions that are used to compute the decompositionand Table 9 shows the decomposition analysis. RNFE partic-ipants enjoy a 29% higher total growth in expenditures thando non-participants. The decomposition analysis shows thatthis is composed of a +64% growth differential attributableto differences in endowments and coefficient estimates(E + C) and a �35% unexplained growth differential (U).More than two-thirds of the explained difference is due to
growth 1994–2004 used for decomposition analysis
icipant RNFE non-participant
Std. Err Coefficient Std. Err
0.169 �0.053 0.1990.139 0.118 0.1960.126 �0.065 0.1750.187 0.125 0.2290.342 �0.223 0.4240.309 0.586 0.4160.144 0.584*** 0.1850.154 0.197 0.2010.296 0.360 0.4790.044 �0.160*** 0.0530.214 0.377 0.2530.142 0.094 0.1850.383 0.083 0.3990.650 �0.333 0.818
dult equivalent terms. Village dummies included in the estimation but not
wth difference by RNFE participation (%)
ibutablea (E + C) Differential due toendowments (E)
Differential due toCoefficients (C)
52.6 �0.3 52.9�5.0 �0.1 �4.94.6 �0.1 4.72.8 �0.4 3.2�0.8 �0.3 �0.5�8.2 0.7 �8.9�25.9 6.1 �32.019.3 2.3 17.0�19.2 0.6 �19.839.5 2.1 37.4�3.5 �0.5 �3.0�13.6 0.7 �14.2
4.6 0.3 4.263.8 20.4 43.4
2964�3568
ous values are in log form. All assets are given in adult equivalent.

1644 WORLD DEVELOPMENT
higher estimated returns on resources owned by RNFE partic-ipants; the rest is due to higher endowments. For every singleregressor, the magnitude of the returns differential exceedsthat of the endowment levels, underscoring that the impactof RNFE participation on welfare changes is overwhelminglydue to induced improvements in productivity. RNFE partici-pants enjoy higher rates of return on their labor and non-laborendowments than do non-participants, due to any or all of themechanisms discussed previously.
Higher average aggregate return for RNFE participantsdoes not mean that each and every asset earns higher returnsin the RNFE. The estimation results from the fixed effectsregression used for the decomposition analysis show that thestatistically significant variables are labor and assets. RNFEparticipants enjoy higher returns on asset holdings. Partici-pants’ higher returns to assets explain 37% of the growth dif-ferential in their favor. This may be explained by higherearnings for assets employed in nonfarm economy. It may alsoimply higher returns for farm equipment employed in farmingbecause of households’ ability to buy complementary inputsthat improve the productivity of these assets, consistent withthe argument that nonfarm participation help relax house-holds’ liquidity constraint.
RNFE participants enjoy higher estimated returns on fe-male labor and lower estimated returns on male labor thannon-participants. This is in line with our earlier argument thatnonfarm employment increases the utilization of labor that isnot fully used in agriculture. Female employment in agricul-ture in Ethiopia is constrained for cultural reasons. Participa-tion in nonfarm employment enables households to utilizeadult female labor more productively. On the other hand,male labor favors non-participants. The returns to householdhead age are noticeably higher for RNFE participants as well,which likely reflects how seniority generates gains in RNFEactivities due to accumulated social connections and experi-ence that more than offset any physical decline due to agingthat might weigh much more heavily in farming activities.
6. CONCLUSIONS
Several studies across the developing world routinely docu-ment a positive correlation between rural nonfarm participa-tion and households’ income and wealth status. However,this could reflect the preferential access of the rich to lucrativeRNFE opportunities or the positive impact of rural nonfarmemployment on earnings and investment. This paper exploitsa rich household panel data set from rural Ethiopia to examinethe impact of participation in the rural nonfarm economy onwelfare dynamics.
Our analysis suggests that the rural nonfarm economy offersimproved prospects for participant households. The regressionresults show that growth in consumption expenditures in-creases with the household’s ex ante share of nonfarm income.The positive relationship between share of nonfarm incomeand expenditure growth holds for both the poor and wealthy.However, relatively wealthy households benefit more fromRNFE participation than do poorer ones. A Blinder–Oaxacadecomposition sheds some light on the source of this growth.Faster growth among nonfarm participants results from high-er returns to their endowments, especially to physical assets,seniority, and female labor.
Although the driving force behind livelihood diversificationdecision for poorer rural households in Ethiopia seems to bedesperation rather than profit seeking in response to lucrativeopportunities, the positive relationship between initial shareof nonfarm income and subsequent consumption expendi-tures growth is encouraging. For a country like Ethiopiawhere land holdings are very small and population pressureis ever-increasing, the RNFE may offer a way out of povertyand into wealth accumulation. However, the observed highergrowth elasticity among wealthy households, suggests thatRNFE may also aggravate rural income inequality as RNFEparticipants earn better returns and enjoy faster incomegrowth, with the greater gains enjoyed by those who are ini-tially better off.
NOTES
1. See also Reardon (1997), Ellis (1998) and Barrett,Reardon, and Webb(2001) for reviews of earlier studies.
2. Information on the data collection , copies of the questionnaires, andraw data for the first four rounds are available at http://www.csae.ox.-ac.uk/datasets/Ethiopia-ERHS/ERHS-main.html.
3. To normalize using adult equivalent units we use a weight of 0.40 forchildren aged less than four and 0.50 for children aged from 5 to 14. Alladults aged 15 or more have weight equal to one.
4. This is also the case for the nationally representative HouseholdIncome and Consumption Expenditure survey data, where 68% of ruralhouseholds reported income lower than their expenditures (CSA, 2001).
5. In 2005, the Government of Ethiopia started a huge safety netprogram to improve food security in chronically food insecure areas. TheProductive Safety Net Program (PSNP) transfers food and/or cash to foodinsecure households either for free or in exchange for labor contributed topublic works projects (“food for work”) if the household has an ablebodied adult who can work. This paper is based on data collected up to2004 and hence includes no data on PSNP transfers.
6. Like the random effects model, the Hausman–Taylor method(Hausman & Taylor, 1981) assumes that the latent individual effect is atime-invariant random variable, distributed independently across individ-uals. Unlike the random effects estimator, however, the Hausman–Taylorspecification assumes that some of the regressors are correlated with thelatent variable ai. To estimate the coefficients for both the time-varyingand time-invariant variables consistently, this method uses the time-varying variables that are uncorrelated with the latent variable toinstrument the variables correlated with the latent variable ai (See Baltagi,Bresson, & Pirotte, 2003; Hausman & Taylor, 1981).
7. Blinder–Oaxaca decomposition is a method used to measure incomedifferentials between groups. It was initially designed to analyze wagedifferential between races and sexes.
8. Including households’ own initial expenditure will introduce endoge-neity.
9. The results from the other two estimators can be obtained from thelead author by request.
10. The results from fixed effects and Hausman–Taylor estimators (notreported here) suggest an even stronger positive relation between the initialshare of income from RNFE and subsequent expenditures growth.

DOES THE NONFARM ECONOMY OFFER PATHWAYS FOR UPWARD MOBILITY? 1645
REFERENCES
ADB (2000). Ethiopia structural adjustment programme: Project perfor-mance evaluation report [report]. African Development Bank Group.
Baltagi, B. H., Bresson, G., & Pirotte, A. (2003). Fixed effects, randomeffects or Hausman–Taylor? A pretest estimator. Economics Letters,79(3), 361–369.
Barrett, C. B. (2005). Rural poverty dynamics: Development policyimplications. Agricultural Economics, 32(Suppl. 1), 45–60.
Barrett, C. B., Bezuneh, M., & Aboud, A. (2001). Income diversification,poverty traps and policy shocks in Cote d’Ivoire and Kenya. FoodPolicy, 26(4), 367–384.
Barrett, C. B., Reardon, T., & Webb, P. (2001). Nonfarm incomediversification and household livelihood strategies in rural Africa:Concepts, dynamics, and policy implications. Food Policy, 26(4),315–331.
Barrett, C. B., Sherlund, S. M., & Adesina, A. A. (2008). Shadow wages,allocative inefficiency, and labor supply in smallholder agriculture.Agricultural Economics, 38(1), 21–34.
Bevan, P., & Pankhurst, A. (1996). A social analysis of fifteen ruraleconomies in Ethiopia. UK: Overseas Development Administration.
Bezu, S., & Holden, S. (2008). Can food-for-work encourage agriculturalproduction?. Food Policy, 33(6), 541–549.
Blinder, A. S. (1973). Wage discrimination: Reduced form and structuralestimates. The Journal of Human Resources, 8(4), 436–455.
Block, S., & Webb, P. (2001). The dynamics of livelihood diversification inpost-famine Ethiopia. Food Policy, 26(4), 333–350.
Canagarajah, S., Newman, C., & Bhattamishra, R. (2001). Non-farmincome, gender, and inequality: Evidence from rural Ghana andUganda. Food Policy, 26(4), 405–420.
Collier, P., & Lal, D. (1984). Why poor people get rich: Kenya 1960–1979.World Development, 12(10), 1007–1018.
Corral, L., & Reardon, T. (2001). Rural nonfarm incomes in Nicaragua.World Development, 29(3), 427–442.
CSA (2001). Report on the 1999/2000 household income, consumptionand expenditure survey: Central Statistical Agency of Ethiopia.
de Janvry, A., & Sadoulet, E. (2001). Income strategies among ruralhouseholds in Mexico: The role of off-farm activities. World Develop-ment, 29(3), 467–480.
Dercon, S. (2004). Growth and shocks: Evidence from rural Ethiopia.Journal of Development Economics, 74(2), 309–329.
Dercon, S. (2006). Economic reform, growth and the poor: Evidence fromrural Ethiopia. Journal of Development Economics, 81(1), 1–24.
Dercon, S., & Krishnan, P. (1996). Income portfolios in rural Ethiopiaand Tanzania: Choices and constraints. Journal of DevelopmentStudies, 32(6), 850–875.
Ellis, F. (1998). Household strategies and rural livelihood diversification.Journal of Development Studies, 35(1), 1–38.
Ellis, F. (2000). The determinants of rural livelihood diversification indeveloping countries. Journal of Agricultural Economics, 51(2),289–302.
Ellis, F., & Freeman, H. A. (2004). Rural livelihoods and povertyreduction strategies in four African countries. Journal of DevelopmentStudies, 40(4), 1–30.
Evans, H. E., & Ngau, P. (1991). Rural-urban relations, household incomediversification and agricultural productivity. Development and Change,22(3), 519–545.
Haggblade, S. (2007). Alternative perceptions of the rural nonfarmeconomy. In T. Reardon, S. Haggblade, & P. Hazell (Eds.),Transforming the rural nonfarm economy: Opportunities and threats inthe developing world. Baltimore: Johns Hopkins University Press.
Hausman, J. A., & Taylor, W. E. (1981). Panel data and unobservableindividual effects. Econometrica, 49(6), 1377–1398.
Holden, S., Shiferaw, B., & Pender, J. (2004). Non-farm income,household welfare, and sustainable land management in a less-favoured area in the Ethiopian highlands. Less Favoured Areas,29(4), 369–392.
Kijima, Y., & Lanjouw, P. (2005). Economic diversification and povertydecline in rural India. Indian Journal of Labor Economics, 48(2).
Kijima, Y., Matsumoto, T., & Yamano, T. (2006). Nonfarm employment,agricultural shocks, and poverty dynamics: Evidence from ruralUganda. Agricultural Economics, 35(Suppl. 3), 459–467.
Kochar, A. (1995). Explaining household vulnerability to idiosyncraticincome shocks. American Economic Review, 85(2), 159–164.
Kung, J. K. S., & Lee, Y. F. (2001). So what if there is income inequality?The distributive consequence of nonfarm employment in rural China.Economic Development and Cultural Change, 50(1), 19–46.
Lanjouw, P., & Shariff, A. (2002). Rural non-farm employment in India:Access, income and poverty impact. [working paper]. Working PaperSeries No. 81(81).
Lanjouw, J. O., & Lanjouw, P. (2001). The rural non-farm sector: Issuesand evidence from developing countries. Agricultural Economics, 26(1),1–23.
Nargis, N., & Hossain, M. (2006). Income dynamics and pathways out ofrural poverty in Bangladesh, 1988–2004. Agricultural Economics,35(Supplement 3), 425–435.
Oaxaca, R. (1973). Male–female wage differentials in urban labor markets.International Economic Review, 14(3), 693–709.
Reardon, T. (1997). Using evidence of household income diversification toinform study of the rural nonfarm labor market in Africa. WorldDevelopment, 25(5), 735–747.
Reardon, T., Berdegue, J., Barrett, C. B., & Stamoulis, K. (2007).Household income diversification into rural nonfarm activities. In T.Reardon, S. Haggblade, & P. Hazell (Eds.), Transforming the ruralnonfarm economy: Opportunities and threats in the developing world.Baltimore: Johns Hopkins University Press.
Reardon, T., Berdegue, J., & Escobar, G. (2001). Rural nonfarmemployment and incomes in Latin America: Overview and policyimplications. World Development, 29(3), 395–409.
Reardon, T., Taylor, J. E., Stamoulis, K., Lanjouw, P., & Balisacan, A.(2000). Effects of non-farm employment on rural income inequality indeveloping countries: An investment perspective. Journal of Agricul-tural Economics, 51(2), 266–288.
Ruben, R., & Van den Berg, M. (2001). Nonfarm employment andpoverty alleviation of rural farm households in Honduras. WorldDevelopment, 29(3), 549–560.
Woldenhanna, T., & Oskam, A. (2001). Income diversification and entrybarriers: Evidence from the Tigray region of northern Ethiopia. FoodPolicy, 26(4), 351–365.
1646 WORLD DEVELOPMENT
APPENDIX A
Table 10. GDP and growth in GDP in Ethiopia: 1994–2004
Year Real GDP (in 2000 prices) Growth rates
Total (in millions birr) Per capita (birr) Per capita (USD) Real GDP Real GDP per capita Nominal GDP
1994–95 52,254 971 1161995–96 58,776 1,059 127 12.48 9.04 12.161996–97 60,939 1,065 127 3.68 0.60 3.611997–98 58,252 987 118 �4.41 �7.33 �4.021998–99 62,284 1,025 123 6.92 3.79 7.571999–2000 65,629 1,048 125 5.37 2.31 11.642000–01 69,361.8 1,077 129 5.69 2.73 1.332001–02 70,219.2 1,060 127 1.24 �1.56 �3.392002–03 67,755.1 993 119 �3.51 �6.30 8.572003–04 76,652.5 1,093 131 13.13 10.07 18.662004–05 84,553.1 1,174 140 10.31 7.40 14.24
Source: Compiled from Annual Reports on Macroeconomic Developments. Ministry of Finance and Economic Development