Mathematical Modeling of the Gas Hydrate Formation in a 90 ...
Upload
khangminh22Category
view
0download
0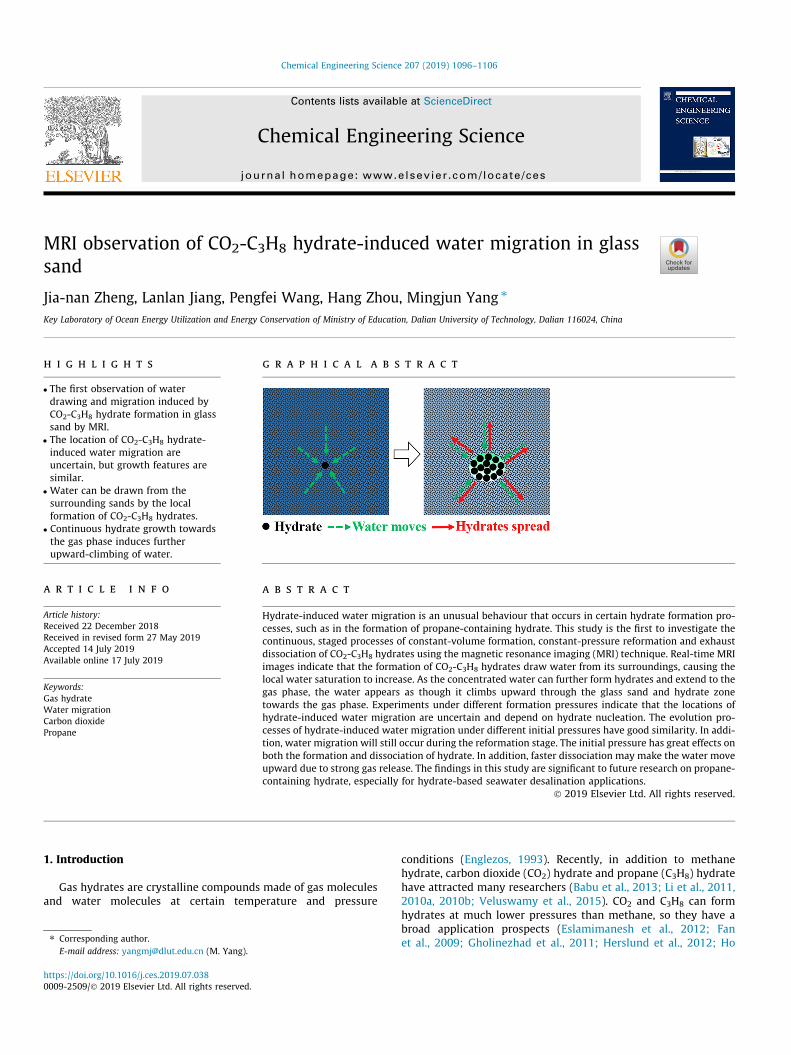
Chemical Engineering Science 207 (2019) 1096–1106
Contents lists available at ScienceDirect
Chemical Engineering Science
journal homepage: www.elsevier .com/ locate /ces
MRI observation of CO2-C3H8 hydrate-induced water migration in glasssand
https://doi.org/10.1016/j.ces.2019.07.0380009-2509/� 2019 Elsevier Ltd. All rights reserved.
⇑ Corresponding author.E-mail address: [email protected] (M. Yang).
Jia-nan Zheng, Lanlan Jiang, Pengfei Wang, Hang Zhou, Mingjun Yang ⇑Key Laboratory of Ocean Energy Utilization and Energy Conservation of Ministry of Education, Dalian University of Technology, Dalian 116024, China
h i g h l i g h t s
� The first observation of waterdrawing and migration induced byCO2-C3H8 hydrate formation in glasssand by MRI.
� The location of CO2-C3H8 hydrate-induced water migration areuncertain, but growth features aresimilar.
� Water can be drawn from thesurrounding sands by the localformation of CO2-C3H8 hydrates.
� Continuous hydrate growth towardsthe gas phase induces furtherupward-climbing of water.
g r a p h i c a l a b s t r a c t
a r t i c l e i n f o
Article history:Received 22 December 2018Received in revised form 27 May 2019Accepted 14 July 2019Available online 17 July 2019
Keywords:Gas hydrateWater migrationCarbon dioxidePropane
a b s t r a c t
Hydrate-induced water migration is an unusual behaviour that occurs in certain hydrate formation pro-cesses, such as in the formation of propane-containing hydrate. This study is the first to investigate thecontinuous, staged processes of constant-volume formation, constant-pressure reformation and exhaustdissociation of CO2-C3H8 hydrates using the magnetic resonance imaging (MRI) technique. Real-time MRIimages indicate that the formation of CO2-C3H8 hydrates draw water from its surroundings, causing thelocal water saturation to increase. As the concentrated water can further form hydrates and extend to thegas phase, the water appears as though it climbs upward through the glass sand and hydrate zonetowards the gas phase. Experiments under different formation pressures indicate that the locations ofhydrate-induced water migration are uncertain and depend on hydrate nucleation. The evolution pro-cesses of hydrate-induced water migration under different initial pressures have good similarity. In addi-tion, water migration will still occur during the reformation stage. The initial pressure has great effects onboth the formation and dissociation of hydrate. In addition, faster dissociation may make the water moveupward due to strong gas release. The findings in this study are significant to future research on propane-containing hydrate, especially for hydrate-based seawater desalination applications.
� 2019 Elsevier Ltd. All rights reserved.
1. Introduction
Gas hydrates are crystalline compounds made of gas moleculesand water molecules at certain temperature and pressure
conditions (Englezos, 1993). Recently, in addition to methanehydrate, carbon dioxide (CO2) hydrate and propane (C3H8) hydratehave attracted many researchers (Babu et al., 2013; Li et al., 2011,2010a, 2010b; Veluswamy et al., 2015). CO2 and C3H8 can formhydrates at much lower pressures than methane, so they have abroad application prospects (Eslamimanesh et al., 2012; Fanet al., 2009; Gholinezhad et al., 2011; Herslund et al., 2012; Ho
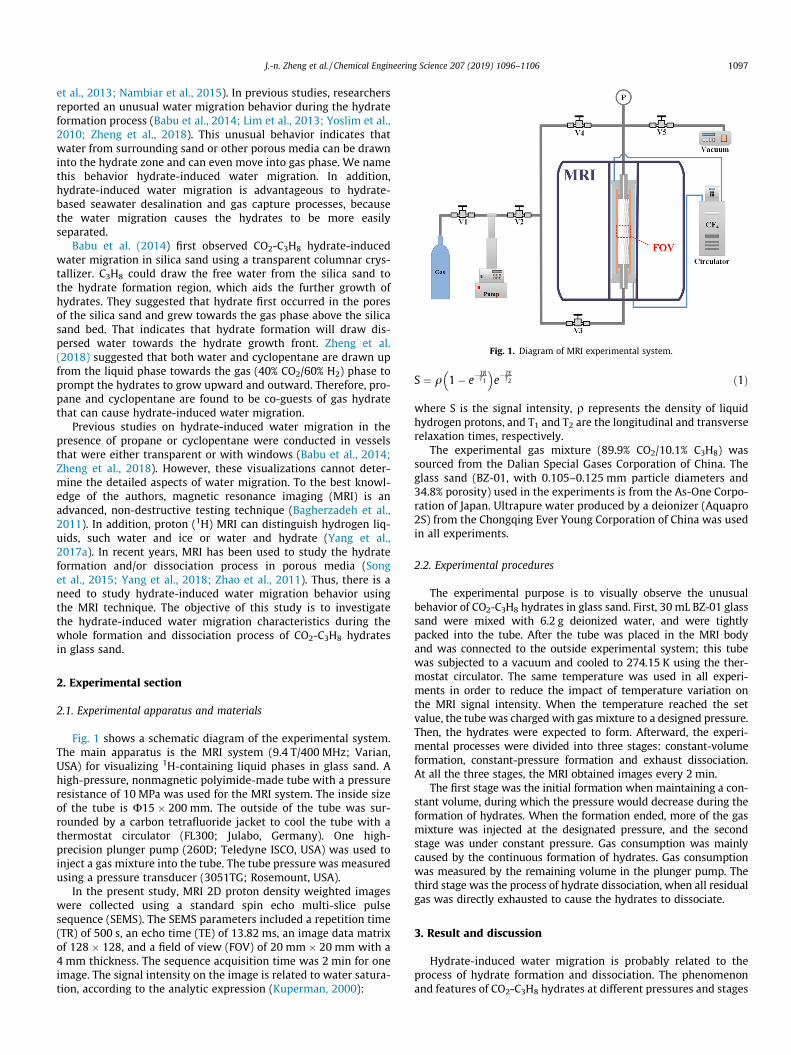
Fig. 1. Diagram of MRI experimental system.
J.-n. Zheng et al. / Chemical Engineering Science 207 (2019) 1096–1106 1097
et al., 2013; Nambiar et al., 2015). In previous studies, researchersreported an unusual water migration behavior during the hydrateformation process (Babu et al., 2014; Lim et al., 2013; Yoslim et al.,2010; Zheng et al., 2018). This unusual behavior indicates thatwater from surrounding sand or other porous media can be drawninto the hydrate zone and can even move into gas phase. We namethis behavior hydrate-induced water migration. In addition,hydrate-induced water migration is advantageous to hydrate-based seawater desalination and gas capture processes, becausethe water migration causes the hydrates to be more easilyseparated.
Babu et al. (2014) first observed CO2-C3H8 hydrate-inducedwater migration in silica sand using a transparent columnar crys-tallizer. C3H8 could draw the free water from the silica sand tothe hydrate formation region, which aids the further growth ofhydrates. They suggested that hydrate first occurred in the poresof the silica sand and grew towards the gas phase above the silicasand bed. That indicates that hydrate formation will draw dis-persed water towards the hydrate growth front. Zheng et al.(2018) suggested that both water and cyclopentane are drawn upfrom the liquid phase towards the gas (40% CO2/60% H2) phase toprompt the hydrates to grow upward and outward. Therefore, pro-pane and cyclopentane are found to be co-guests of gas hydratethat can cause hydrate-induced water migration.
Previous studies on hydrate-induced water migration in thepresence of propane or cyclopentane were conducted in vesselsthat were either transparent or with windows (Babu et al., 2014;Zheng et al., 2018). However, these visualizations cannot deter-mine the detailed aspects of water migration. To the best knowl-edge of the authors, magnetic resonance imaging (MRI) is anadvanced, non-destructive testing technique (Bagherzadeh et al.,2011). In addition, proton (1H) MRI can distinguish hydrogen liq-uids, such water and ice or water and hydrate (Yang et al.,2017a). In recent years, MRI has been used to study the hydrateformation and/or dissociation process in porous media (Songet al., 2015; Yang et al., 2018; Zhao et al., 2011). Thus, there is aneed to study hydrate-induced water migration behavior usingthe MRI technique. The objective of this study is to investigatethe hydrate-induced water migration characteristics during thewhole formation and dissociation process of CO2-C3H8 hydratesin glass sand.
2. Experimental section
2.1. Experimental apparatus and materials
Fig. 1 shows a schematic diagram of the experimental system.The main apparatus is the MRI system (9.4 T/400 MHz; Varian,USA) for visualizing 1H-containing liquid phases in glass sand. Ahigh-pressure, nonmagnetic polyimide-made tube with a pressureresistance of 10 MPa was used for the MRI system. The inside sizeof the tube is U15 � 200 mm. The outside of the tube was sur-rounded by a carbon tetrafluoride jacket to cool the tube with athermostat circulator (FL300; Julabo, Germany). One high-precision plunger pump (260D; Teledyne ISCO, USA) was used toinject a gas mixture into the tube. The tube pressure was measuredusing a pressure transducer (3051TG; Rosemount, USA).
In the present study, MRI 2D proton density weighted imageswere collected using a standard spin echo multi-slice pulsesequence (SEMS). The SEMS parameters included a repetition time(TR) of 500 s, an echo time (TE) of 13.82 ms, an image data matrixof 128 � 128, and a field of view (FOV) of 20 mm � 20 mm with a4 mm thickness. The sequence acquisition time was 2 min for oneimage. The signal intensity on the image is related to water satura-tion, according to the analytic expression (Kuperman, 2000):
S ¼ q 1� e�TRT1
� �e�
TET2 ð1Þ
where S is the signal intensity, q represents the density of liquidhydrogen protons, and T1 and T2 are the longitudinal and transverserelaxation times, respectively.
The experimental gas mixture (89.9% CO2/10.1% C3H8) wassourced from the Dalian Special Gases Corporation of China. Theglass sand (BZ-01, with 0.105–0.125 mm particle diameters and34.8% porosity) used in the experiments is from the As-One Corpo-ration of Japan. Ultrapure water produced by a deionizer (Aquapro2S) from the Chongqing Ever Young Corporation of China was usedin all experiments.
2.2. Experimental procedures
The experimental purpose is to visually observe the unusualbehavior of CO2-C3H8 hydrates in glass sand. First, 30 mL BZ-01 glasssand were mixed with 6.2 g deionized water, and were tightlypacked into the tube. After the tube was placed in the MRI bodyand was connected to the outside experimental system; this tubewas subjected to a vacuum and cooled to 274.15 K using the ther-mostat circulator. The same temperature was used in all experi-ments in order to reduce the impact of temperature variation onthe MRI signal intensity. When the temperature reached the setvalue, the tube was charged with gas mixture to a designed pressure.Then, the hydrates were expected to form. Afterward, the experi-mental processes were divided into three stages: constant-volumeformation, constant-pressure formation and exhaust dissociation.At all the three stages, the MRI obtained images every 2 min.
The first stage was the initial formation when maintaining a con-stant volume, during which the pressure would decrease during theformation of hydrates. When the formation ended, more of the gasmixture was injected at the designated pressure, and the secondstage was under constant pressure. Gas consumption was mainlycaused by the continuous formation of hydrates. Gas consumptionwas measured by the remaining volume in the plunger pump. Thethird stage was the process of hydrate dissociation, when all residualgas was directly exhausted to cause the hydrates to dissociate.
3. Result and discussion
Hydrate-induced water migration is probably related to theprocess of hydrate formation and dissociation. The phenomenonand features of CO2-C3H8 hydrates at different pressures and stages
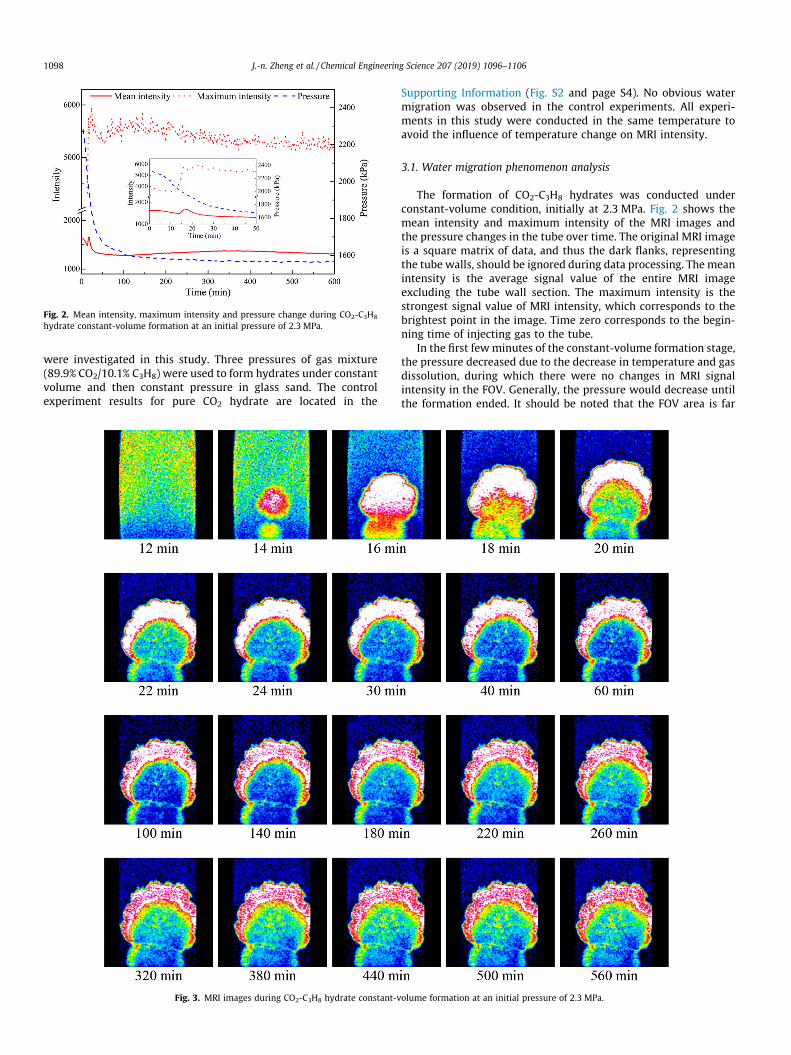
Fig. 2. Mean intensity, maximum intensity and pressure change during CO2-C3H8
hydrate constant-volume formation at an initial pressure of 2.3 MPa.
1098 J.-n. Zheng et al. / Chemical Engineering Science 207 (2019) 1096–1106
were investigated in this study. Three pressures of gas mixture(89.9% CO2/10.1% C3H8) were used to form hydrates under constantvolume and then constant pressure in glass sand. The controlexperiment results for pure CO2 hydrate are located in the
Fig. 3. MRI images during CO2-C3H8 hydrate constant-v
Supporting Information (Fig. S2 and page S4). No obvious watermigration was observed in the control experiments. All experi-ments in this study were conducted in the same temperature toavoid the influence of temperature change on MRI intensity.
3.1. Water migration phenomenon analysis
The formation of CO2-C3H8 hydrates was conducted underconstant-volume condition, initially at 2.3 MPa. Fig. 2 shows themean intensity and maximum intensity of the MRI images andthe pressure changes in the tube over time. The original MRI imageis a square matrix of data, and thus the dark flanks, representingthe tube walls, should be ignored during data processing. The meanintensity is the average signal value of the entire MRI imageexcluding the tube wall section. The maximum intensity is thestrongest signal value of MRI intensity, which corresponds to thebrightest point in the image. Time zero corresponds to the begin-ning time of injecting gas to the tube.
In the first fewminutes of the constant-volume formation stage,the pressure decreased due to the decrease in temperature and gasdissolution, during which there were no changes in MRI signalintensity in the FOV. Generally, the pressure would decrease untilthe formation ended. It should be noted that the FOV area is far
olume formation at an initial pressure of 2.3 MPa.

J.-n. Zheng et al. / Chemical Engineering Science 207 (2019) 1096–1106 1099
smaller than the entire tube, and the pressure change in the tube isdifficult to reflect the hydrate change in the FOV. Thus, the analysisof pressure decrease is meaningless and ignored in this study. Sev-eral minutes after the gas injection, the signal intensity showed anobvious change, indicating changes in the water saturation anddistribution in the FOV. From Fig. 2, it is clear that the overall trendof mean intensity is downward, indicating a decrease in water sat-uration. However, the maximum intensity increases to 5800 from3800, and the mean intensity appears an unexpected heave atapproximately 15 min. This is mainly because the water in otherslices migrates to the FOV slice, which only covers a 4 mmthickness.
Fig. 3 shows the some MRI images during the formation processshown in Fig. 2. CO2-C3H8 hydrates are formed under a constant-volume condition at an initial pressure of 2.3 MPa in glass sand.The various colors in the images reflect changes in the water satu-ration and distribution (see the Supporting Information for thecolor bar illustration). In Fig. 3, the image at 14 min suddenlyshowed two abnormal, brighter areas, indicating an increase inlocal water saturation. The two areas grew to be much larger andbrighter and coalesced in the following two minutes, indicatingan increase in water saturation and change in water distribution.Meanwhile, the color outside the two areas became darker, indicat-ing a decrease in water saturation. We infer that this phenomenonis not caused by hydrate formation, but by water migration toother locations. For convenience, the two areas are called cores
Fig. 4. The average intensity profiles of th
due to their circular appearance. We contribute the occurrence ofthe cores to an increase in the water saturation due to the drawingof water from the surrounding glass sand induced by CO2-C3H8
hydrates. Then, the cores gradually grew until 24 min. It shouldbe noted that the brightest area climbed upward as the cores grewuntil the basic shaping of the cores was completed, ultimatelylooking like wearing a cap. This indicates that the water alwaysmigrates to the hydrate grow front on the gas side. After 24 min,the entire image, including the cores and cap, gradually darkeneduntil 100 min, indicating a decrease in water saturation. Webelieve that the darkening of cores and cap is caused by hydrateformation. Finally, there a boundary remained between the twocores although they had already coalesced.
To quantitatively compare the changes in water saturation atdifferent times, we chose some special locations to analyse changesin the signal intensity. The two cores were selected locations, aswere two horizontal and one vertical columns (C1, C2, and C3)through the centers of the two cores were chosen (see page S5 inthe Supporting Information for detailed information on the FOVand selected columns). The average intensities over time for differ-ent columns are shown in Fig. 4. At 14 min, two peaks appeared inC1(a) and one peak arose at the middle locations in C2(a) and C3(a), corresponding to the two cores. Then, at 16 min, the two peaksin C1(a) coalesced into one peak, and the peaks in C2(a) and C3(a)rose into a broad, flat peak. In the following several minutes, thepeak in C1(a) shifted left, indicating the upward migration of
e selected columns (C1, C2 and C3).

Fig. 5. Mean intensity, maximum intensity and pressure during CO2-C3H8 hydrateconstant-volume formation at an initial pressure of 1.8 MPa.
1100 J.-n. Zheng et al. / Chemical Engineering Science 207 (2019) 1096–1106
water. Meanwhile, the middle of the broad peaks in C2(a) and C3(a) began sink until it became two narrow peaks on the edges ofthe original plateau, nearly bilaterally symmetrical. The flat peakin C1 from 20 min corresponded to the cap. From 22 min to60 min, the average intensity around the cores decreased slightly,mainly due to the continuous formation of hydrates. The averageintensity around the cap became stable after 60 min. From100 min to 260 min, the average intensities around the insides ofcores gradually increased, which may be caused by water migra-tion from other locations because the pressures were nearly stable.After 260 min, all profiles for the three columns showed no change.
Fig. 4 indicates that during formation, the water saturation inthe two cores would increase sharply, then decrease slowly, and
Fig. 6. MRI images during CO2-C3H8 hydrate constant-v
then increase again until it stabilized. It should be noted that theborders of the cores differed from both the outsides and insidesof the cores. The two cores and the cap all had obvious borderswhere the intensities were higher than surrounding areas. In addi-tion, the location of the cap was above the original location of theupper core, indicating the upward migration of free water. In brief,the initial cores caused by CO2-C3H8 hydrate can draw water fromsurrounding sands to grow larger and higher. It can be inferred thatlocal hydrate formation causes the water to gather in hydrate fromthe surrounding sand, and the concentrated water forms hydratewith gas, further causing more water to migrate towards the gasphase. This agrees well with the visual observations of Babuet al. (2014). The hydrate-induced water migration is one phe-nomenon of capillary movement. When hydrates form in any areaof the glass sand, where gases are consumed and is supplementedby gases from other areas. Due to the considerable solubility of CO2
and solubility difference of CO2 and C3H8 in water, the transfer ofCO2 gas may bring some water from the surrounding. That’s whyno water migration was observed in the control experiments forpure CO2 hydrate. In addition, water can transport easily throughthe glass sand and hydrate zone and further convert to hydratesdue to the capillary action (Zheng et al., 2018). Thus, it seems thatthe formation of CO2-C3H8 hydrates draws water from the sur-rounding and climbs upward.
3.2. Formation at different pressures
In the previous subsection, we documented that two coresformed and became coalesced at the initial pressure of 2.3 MPa.The occurrence of core may be related to the random nucleationof hydrates. This subsection investigates the phenomenon of watermigration at lower initial pressures. Two cases of formation
olume formation at an initial pressure of 1.8 MPa.

Fig. 7. The average intensity profiles of the selected columns (C4 and C5).
Fig. 8. Mean intensity, maximum intensity and pressure during CO2-C3H8 hydrateconstant-volume formation at an initial pressure of 1.3 MPa.
J.-n. Zheng et al. / Chemical Engineering Science 207 (2019) 1096–1106 1101
experiments were conducted under a constant-volume conditionat initial pressures of 1.8 MPa and 1.3 MPa, respectively.
Figs. 5 and 6 show the FOV intensity, tube pressure and MRIimage of CO2-C3H8 hydrate constant-volume formation at an initialpressure of 1.8 MPa. In Fig. 5, both mean intensity and maximumintensity increased abnormally before and after hydrate formation,even though the mean intensity decreased for a period of time (7–13 min). The signal intensities (including mean intensity and max-imum intensity) of water saturation were expected to decreaseaccording to the obvious pressure drop. Thus, the abnormalincrease in water saturation was mainly due to water migrationfrom other slices beyond the FOV. In Fig. 6, the image showed asmall core (dot) at 9 min that grew at 11 min. Another bright coreappeared at 13 min. Ultimately, there were two left and right cores,side-by-side, in the images. The two cores gradually grew until25 min. Meanwhile, the maximum intensity increased to 5800from 3300, and the mean intensity increased to approximately1000 (see the inset of Fig. 5). This indicates that water can migrateover slices. In addition, the upper parts of the cores were brighterthan other parts, similar to a cap. The cap seemed to climb upwardas the cores grew.
Two vertical columns through the center of the two cores werealso chosen to quantitatively compare the changes in water satura-tion at different times and locations (see Fig. 7). C4 shows the aver-age intensity profiles in the vertical direction through the left core.It is clear that a peak appeared at 9 min and grew until 15 min inC4(a). In the following several minutes in C4(b), the peaksremained at the same height, but shifted left, corresponding tothe upward-climbing cap. C5 represents the average intensity pro-files of the core on the right. From 7 min to 15 min, all profilesdecreased until a broad peak appeared at 13 min in C5(a). Then,the peak grew and gradually shifted left until 37 min. After47 min, the average intensity profiles of both cores remained con-stant (see C4(c) and C5(c)). It should be noted that the leftwardshifting behaviors (before 47 min) of the peaks (see C4(b) and C5(b)) correspond to the upward-climbing of caps. This indicates thatthe concentrated water continued to climb upward to areas rich ingas during this period. The reason is that water is drawn into thehydrate formation zone and then moves to the gas phase zone.
Figs. 8 and 9 show the FOV intensity, tube pressure and MRIimage of CO2-C3H8 hydrate constant-volume formation at an initial
pressure of 1.3 MPa. During the entire formation process, the meanintensity basically decreased as the pressure decreased, while themaximum intensity changed in a different way. The entire inten-sity decreased from 5 min to 15 min, during which a bright core(dot) appeared in the bottom-right corner of the image at10 min, after which it grew and became brighter. Then, until40 min, the mean intensity gradually decreased, but the maximumintensity increased abnormally due to the appearance of the brightcore in the bottom-right corner of the image. At 50 min, the max-imum intensity was even higher than before hydrate formation.From 150 min, the maximum intensity began to decline slowlywhile the mean intensity remained constant. This may be due tothe partial equilibrium of the water saturation.
Similarly, one vertical column through the center of the core ischosen to quantitatively compare the changes in water saturationat different times (see Fig. 10). It is clear that the entire profiledecreased with the decrease in pressure, while a peak appearedand grew on the right side in C6(a). The peak continued to growhigher and shift leftward until 86 min, when an approximate capformed. It should be noted that a narrow bright area appeared near

Fig. 9. MRI images during CO2-C3H8 hydrate constant-volume formation at an initial pressure of 1.3 MPa.
Fig. 10. The average intensity profiles of the selected column (C6).
1102 J.-n. Zheng et al. / Chemical Engineering Science 207 (2019) 1096–1106
the middle-right edge of the tube at 30 min. In addition, a corre-sponding small peak appeared at the middle of C6(b). The averageintensity on the either side of the small peak showed no obviouschanges. This indicates again that water can be drawn from otherslices beyond the FOV.
Three experimental cases of CO2-C3H8 hydrate formation underconstant-volume conditions at different initial pressures were con-ducted, and the abnormal phenomenon of hydrate-induced watermigration (the cores) was observed in all experiments. Table 1shows the tube pressure and FOV mean intensity changes beforeand after the constant-volume formation. It is clear that a higherinitial pressure can form more hydrates but is unequal to thechanges in the FOV due to water migration across the FOV. Theoccurrence location of the cores may be uncertain, but the growthfeatures are similar. Once one core forms, it will grow larger andbrighter. The upper part of the core is generally much brighterand will gradually move upward, ultimately forming a cap that isthe brightest part of the image, located above the original locationof the core. In addition, a border would exist between differentcores, no matter whether they had become connected. We inferthat hydrate-induced water migration is derived from local reac-
tions caused by CO2-C3H8 hydrate formation. When CO2-C3H8
hydrates form at some locations, the surrounding water moleculeswill spontaneously move towards the hydrate zone, making thecores much brighter. Then, the concentrated water will form morehydrate with surrounding gas molecules and grow towards the gasregion. Meanwhile, the residual water molecules will migratetowards the newly formed hydrate zone. As a result, it appearsas though the water always moves upward towards gas phase, ulti-mately forming a cap-like, water-rich zone.
3.3. Further reformation under constant pressure
Formation under constant-volume conditions is limited due tothe decrease in the driving force (gas pressure) as gas is consumedfor hydrate formation. After a certain time, when the pressure andimage were stable, we conducted the second gas injection in eachcase and maintained a constant pressure to enhance the formation.When the driving force is strong enough after the gas injection, fur-ther formation is possible, also called reformation.
Fig. 11 displays time-series images of three cases at the secondstage of constant-pressure reformation. The detailed mean
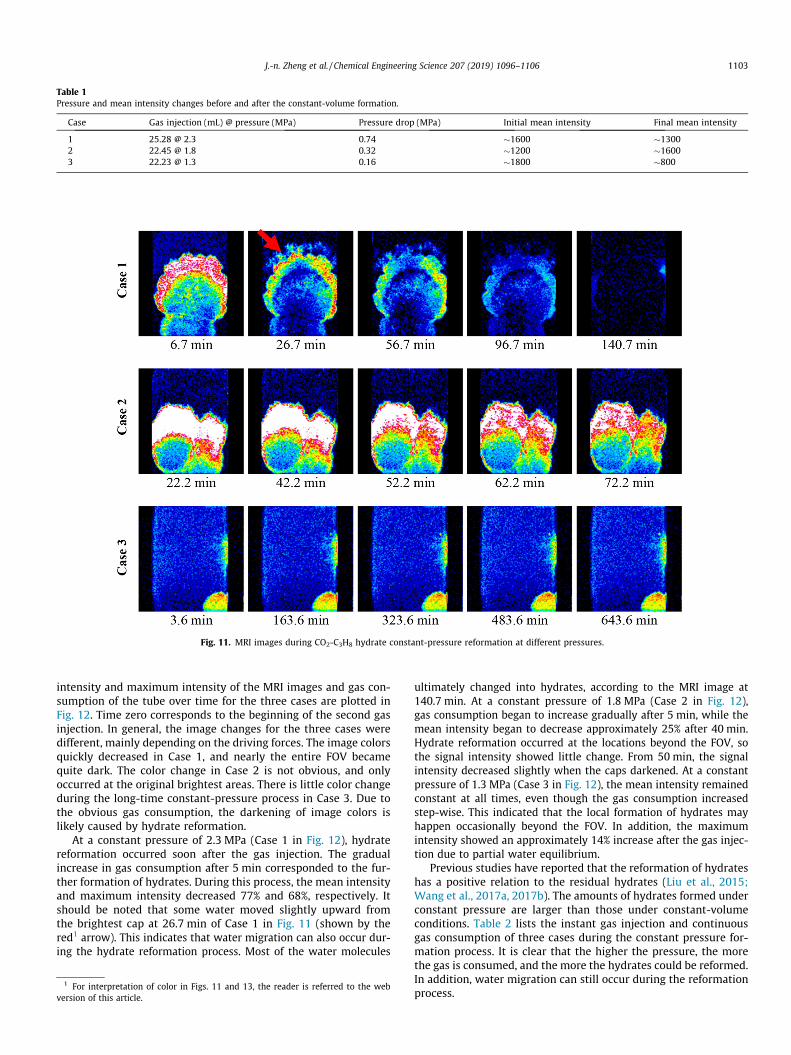
Fig. 11. MRI images during CO2-C3H8 hydrate constant-pressure reformation at different pressures.
Table 1Pressure and mean intensity changes before and after the constant-volume formation.
Case Gas injection (mL) @ pressure (MPa) Pressure drop (MPa) Initial mean intensity Final mean intensity
1 25.28 @ 2.3 0.74 �1600 �13002 22.45 @ 1.8 0.32 �1200 �16003 22.23 @ 1.3 0.16 �1800 �800
J.-n. Zheng et al. / Chemical Engineering Science 207 (2019) 1096–1106 1103
intensity and maximum intensity of the MRI images and gas con-sumption of the tube over time for the three cases are plotted inFig. 12. Time zero corresponds to the beginning of the second gasinjection. In general, the image changes for the three cases weredifferent, mainly depending on the driving forces. The image colorsquickly decreased in Case 1, and nearly the entire FOV becamequite dark. The color change in Case 2 is not obvious, and onlyoccurred at the original brightest areas. There is little color changeduring the long-time constant-pressure process in Case 3. Due tothe obvious gas consumption, the darkening of image colors islikely caused by hydrate reformation.
At a constant pressure of 2.3 MPa (Case 1 in Fig. 12), hydratereformation occurred soon after the gas injection. The gradualincrease in gas consumption after 5 min corresponded to the fur-ther formation of hydrates. During this process, the mean intensityand maximum intensity decreased 77% and 68%, respectively. Itshould be noted that some water moved slightly upward fromthe brightest cap at 26.7 min of Case 1 in Fig. 11 (shown by thered1 arrow). This indicates that water migration can also occur dur-ing the hydrate reformation process. Most of the water molecules
1 For interpretation of color in Figs. 11 and 13, the reader is referred to the webversion of this article.
ultimately changed into hydrates, according to the MRI image at140.7 min. At a constant pressure of 1.8 MPa (Case 2 in Fig. 12),gas consumption began to increase gradually after 5 min, while themean intensity began to decrease approximately 25% after 40 min.Hydrate reformation occurred at the locations beyond the FOV, sothe signal intensity showed little change. From 50 min, the signalintensity decreased slightly when the caps darkened. At a constantpressure of 1.3 MPa (Case 3 in Fig. 12), the mean intensity remainedconstant at all times, even though the gas consumption increasedstep-wise. This indicated that the local formation of hydrates mayhappen occasionally beyond the FOV. In addition, the maximumintensity showed an approximately 14% increase after the gas injec-tion due to partial water equilibrium.
Previous studies have reported that the reformation of hydrateshas a positive relation to the residual hydrates (Liu et al., 2015;Wang et al., 2017a, 2017b). The amounts of hydrates formed underconstant pressure are larger than those under constant-volumeconditions. Table 2 lists the instant gas injection and continuousgas consumption of three cases during the constant pressure for-mation process. It is clear that the higher the pressure, the morethe gas is consumed, and the more the hydrates could be reformed.In addition, water migration can still occur during the reformationprocess.
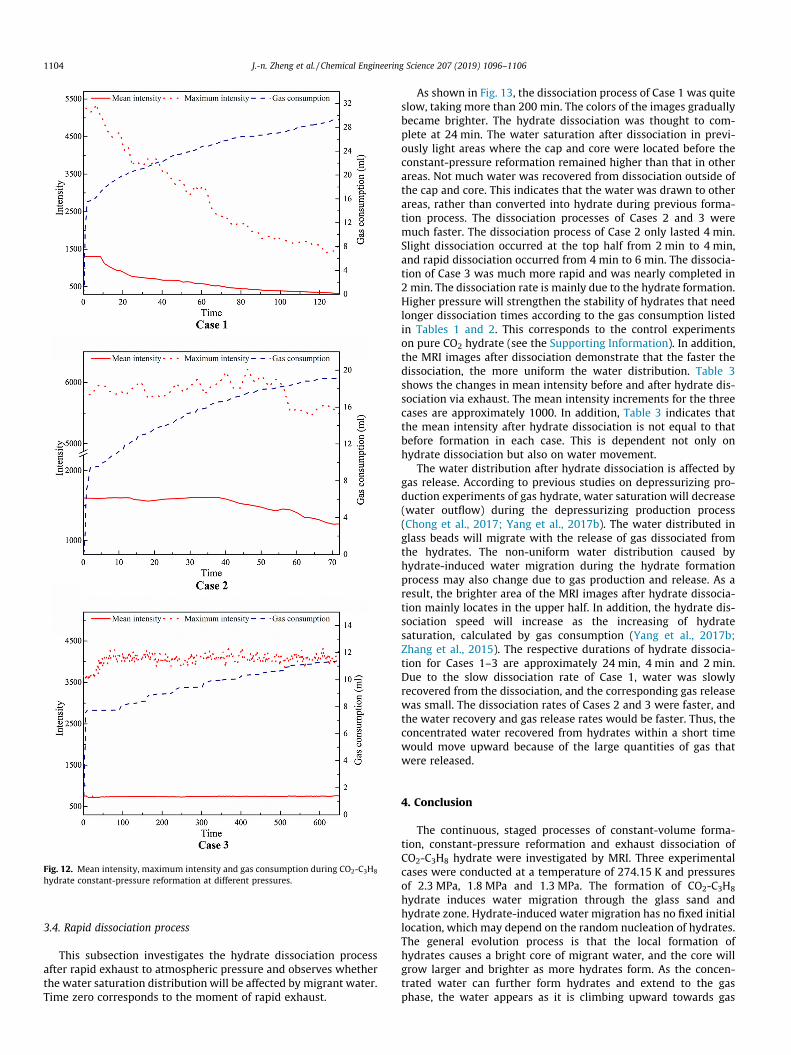
Fig. 12. Mean intensity, maximum intensity and gas consumption during CO2-C3H8
hydrate constant-pressure reformation at different pressures.
1104 J.-n. Zheng et al. / Chemical Engineering Science 207 (2019) 1096–1106
3.4. Rapid dissociation process
This subsection investigates the hydrate dissociation processafter rapid exhaust to atmospheric pressure and observes whetherthe water saturation distribution will be affected by migrant water.Time zero corresponds to the moment of rapid exhaust.
As shown in Fig. 13, the dissociation process of Case 1 was quiteslow, taking more than 200 min. The colors of the images graduallybecame brighter. The hydrate dissociation was thought to com-plete at 24 min. The water saturation after dissociation in previ-ously light areas where the cap and core were located before theconstant-pressure reformation remained higher than that in otherareas. Not much water was recovered from dissociation outside ofthe cap and core. This indicates that the water was drawn to otherareas, rather than converted into hydrate during previous forma-tion process. The dissociation processes of Cases 2 and 3 weremuch faster. The dissociation process of Case 2 only lasted 4 min.Slight dissociation occurred at the top half from 2 min to 4 min,and rapid dissociation occurred from 4 min to 6 min. The dissocia-tion of Case 3 was much more rapid and was nearly completed in2 min. The dissociation rate is mainly due to the hydrate formation.Higher pressure will strengthen the stability of hydrates that needlonger dissociation times according to the gas consumption listedin Tables 1 and 2. This corresponds to the control experimentson pure CO2 hydrate (see the Supporting Information). In addition,the MRI images after dissociation demonstrate that the faster thedissociation, the more uniform the water distribution. Table 3shows the changes in mean intensity before and after hydrate dis-sociation via exhaust. The mean intensity increments for the threecases are approximately 1000. In addition, Table 3 indicates thatthe mean intensity after hydrate dissociation is not equal to thatbefore formation in each case. This is dependent not only onhydrate dissociation but also on water movement.
The water distribution after hydrate dissociation is affected bygas release. According to previous studies on depressurizing pro-duction experiments of gas hydrate, water saturation will decrease(water outflow) during the depressurizing production process(Chong et al., 2017; Yang et al., 2017b). The water distributed inglass beads will migrate with the release of gas dissociated fromthe hydrates. The non-uniform water distribution caused byhydrate-induced water migration during the hydrate formationprocess may also change due to gas production and release. As aresult, the brighter area of the MRI images after hydrate dissocia-tion mainly locates in the upper half. In addition, the hydrate dis-sociation speed will increase as the increasing of hydratesaturation, calculated by gas consumption (Yang et al., 2017b;Zhang et al., 2015). The respective durations of hydrate dissocia-tion for Cases 1–3 are approximately 24 min, 4 min and 2 min.Due to the slow dissociation rate of Case 1, water was slowlyrecovered from the dissociation, and the corresponding gas releasewas small. The dissociation rates of Cases 2 and 3 were faster, andthe water recovery and gas release rates would be faster. Thus, theconcentrated water recovered from hydrates within a short timewould move upward because of the large quantities of gas thatwere released.
4. Conclusion
The continuous, staged processes of constant-volume forma-tion, constant-pressure reformation and exhaust dissociation ofCO2-C3H8 hydrate were investigated by MRI. Three experimentalcases were conducted at a temperature of 274.15 K and pressuresof 2.3 MPa, 1.8 MPa and 1.3 MPa. The formation of CO2-C3H8
hydrate induces water migration through the glass sand andhydrate zone. Hydrate-induced water migration has no fixed initiallocation, which may depend on the random nucleation of hydrates.The general evolution process is that the local formation ofhydrates causes a bright core of migrant water, and the core willgrow larger and brighter as more hydrates form. As the concen-trated water can further form hydrates and extend to the gasphase, the water appears as it is climbing upward towards gas
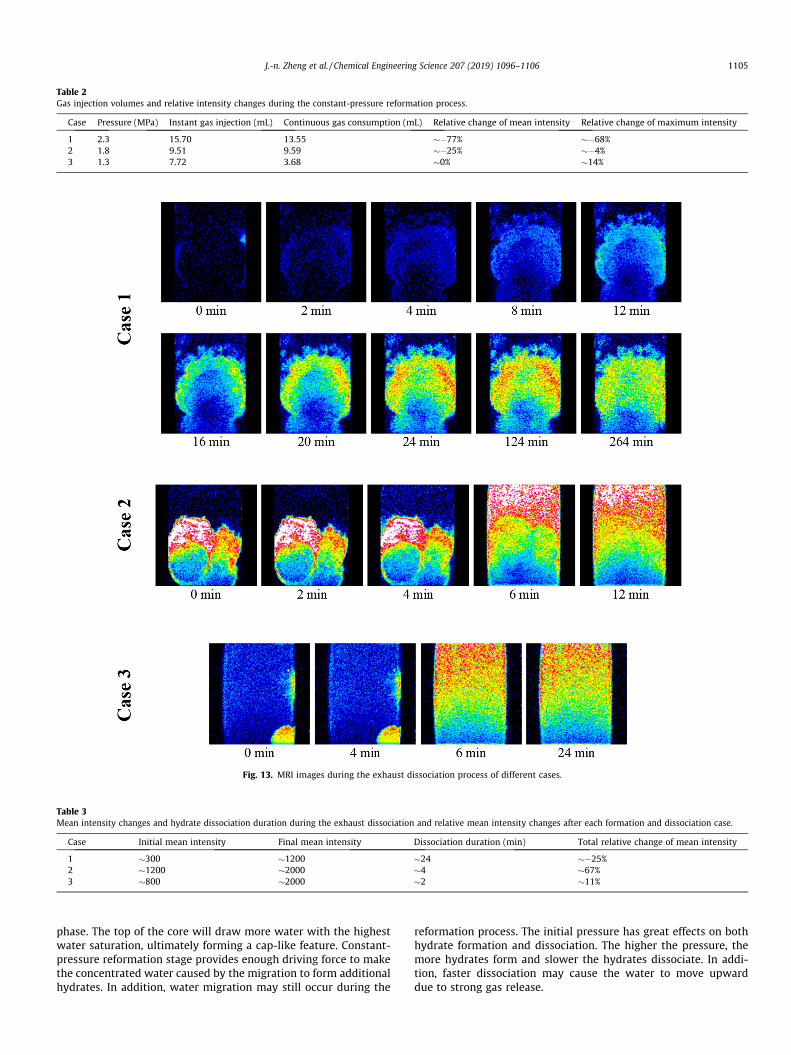
Table 2Gas injection volumes and relative intensity changes during the constant-pressure reformation process.
Case Pressure (MPa) Instant gas injection (mL) Continuous gas consumption (mL) Relative change of mean intensity Relative change of maximum intensity
1 2.3 15.70 13.55 ��77% ��68%2 1.8 9.51 9.59 ��25% ��4%3 1.3 7.72 3.68 �0% �14%
Fig. 13. MRI images during the exhaust dissociation process of different cases.
Table 3Mean intensity changes and hydrate dissociation duration during the exhaust dissociation and relative mean intensity changes after each formation and dissociation case.
Case Initial mean intensity Final mean intensity Dissociation duration (min) Total relative change of mean intensity
1 �300 �1200 �24 ��25%2 �1200 �2000 �4 �67%3 �800 �2000 �2 �11%
J.-n. Zheng et al. / Chemical Engineering Science 207 (2019) 1096–1106 1105
phase. The top of the core will draw more water with the highestwater saturation, ultimately forming a cap-like feature. Constant-pressure reformation stage provides enough driving force to makethe concentrated water caused by the migration to form additionalhydrates. In addition, water migration may still occur during the
reformation process. The initial pressure has great effects on bothhydrate formation and dissociation. The higher the pressure, themore hydrates form and slower the hydrates dissociate. In addi-tion, faster dissociation may cause the water to move upwarddue to strong gas release.
1106 J.-n. Zheng et al. / Chemical Engineering Science 207 (2019) 1096–1106
Acknowledgment
This study was financially supported by grants from theNational Natural Science Foundation of China (51436003,51822603 and 51576025), the National Key Research and Develop-ment Plan of China (2017YFC0307303 and 2016YFC0304001), theFok Ying-Tong Education Foundation for Young Teachers in theHigher Education Institutions of China (161050) and the Funda-mental Research Funds for the Central Universities of China(DUT18ZD403).
Appendix A. Supplementary material
Supplementary data to this article can be found online athttps://doi.org/10.1016/j.ces.2019.07.038.
References
Babu, P., Kumar, R., Linga, P., 2014. Unusual behavior of propane as a co-guestduring hydrate formation in silica sand: potential application to seawaterdesalination and carbon dioxide capture. Chem. Eng. Sci. 117, 342–351.
Babu, P., Yang, T., Veluswamy, H.P., Kumar, R., Linga, P., 2013. Hydrate phaseequilibrium of ternary gas mixtures containing carbon dioxide, hydrogen andpropane. J. Chem. Thermodyn. 61, 58–63.
Bagherzadeh, S.A., Moudrakovski, I.L., Ripmeester, J.A., Englezos, P., 2011. Magneticresonance imaging of gas hydrate formation in a bed of silica sand particles.Energy Fuels 25, 3083–3092.
Chong, Z.R., Yin, Z.Y., Tan, J.H.C., Linga, P., 2017. Experimental investigations onenergy recovery from water-saturated hydrate bearing sediments viadepressurization approach. Appl. Energy 204, 1513–1525.
Englezos, P., 1993. Clathrate hydrates. Ind. Eng. Chem. Res. 32, 1251–1274.Eslamimanesh, A., Mohammadi, A.H., Richon, D., Naidoo, P., Ramjugernath, D., 2012.
Application of gas hydrate formation in separation processes: a review ofexperimental studies. J. Chem. Thermodyn. 46, 62–71.
Fan, S., Li, S., Wang, J., Lang, X., Wang, Y., 2009. Efficient capture of CO2 fromsimulated flue gas by formation of TBAB or TBAF semiclathrate hydrates. EnergyFuels 23, 4202–4208.
Gholinezhad, J., Chapoy, A., Tohidi, B., 2011. Separation and capture of carbondioxide from CO2/H2 syngas mixture using semi-clathrate hydrates. Chem. Eng.Res. Des. 89, 1747–1751.
Herslund, P.J., Thomsen, K., Abildskov, J., von Solms, N., 2012. Phase equilibriummodeling of gas hydrate systems for CO2 capture. J. Chem. Thermodyn. 48, 13–27.
Ho, L.C., Babu, P., Kumar, R., Linga, P., 2013. HBGS (hydrate based gas separation)process for carbon dioxide capture employing an unstirred reactor withcyclopentane. Energy 63, 252–259.
Kuperman, V., 2000. Magnetic Resonance Imaging: Physical Principles andApplications. Academic Press, UK.
Li, X., Xu, C., Chen, Z., Wu, H., Cai, J., 2011. Effect of temperature fluctuation onhydrate-based CO2 separation from fuel gas. J. Nat. Gas Chem. 20, 647–653.
Li, X.S., Xia, Z.M., Chen, Z.Y., Yan, K.F., Li, G., Wu, H.J., 2010a. Gas hydrate formationprocess for capture of carbon dioxide from fuel gas mixture. Ind. Eng. Chem.Res. 49, 11614–11619.
Li, X.S., Xu, C.G., Chen, Z.Y., Wu, H.J., 2010b. Tetra-n-butyl ammonium bromidesemi-clathrate hydrate process for post-combustion capture of carbon dioxidein the presence of dodecyl trimethyl ammonium chloride. Energy 35, 3902–3908.
Lim, Y.A., Babu, P., Kumar, R., Linga, P., 2013. Morphology of carbon dioxide-hydrogen-cyclopentane hydrates with or without sodium dodecyl sulfate.Cryst. Growth Des. 13, 2047–2059.
Liu, Y., Jiang, L.L., Zhu, N.J., Zhao, Y.C., Zhang, Y., Wang, D.Y., Yang, M.J., Zhao, J.F.,Song, Y.C., 2015. MRI investigation of water-oil two phase flow in straightcapillary, bifurcate channel and monolayered glass bead pack. Magn. Reson.Imaging 33, 918–926.
Nambiar, A., Babu, P., Linga, P., 2015. CO2 capture using the clathrate hydrateprocess employing cellulose foam as a porous media. Can. J. Chem. 93, 808–814.
Song, Y., Wang, S., Yang, M., Liu, W., Zhao, J., Wang, S., 2015. MRI measurements ofCO2-CH4 hydrate formation and dissociation in porous media. Fuel 140, 126–135.
Veluswamy, H.P., Yew, J.C., Linga, P., 2015. New hydrate phase equilibrium data fortwo binary gas mixtures of hydrogen and propane coupled with a kinetic study.J. Chem. Eng. Data 60, 228–237.
Wang, P., Yang, M., Chen, B., Zhao, Y., Zhao, J., Song, Y., 2017a. Methane hydratereformation in porous media with methane migration. Chem. Eng. Sci. 168,344–351.
Wang, P., Yang, M., Jiang, L., Zhao, Y., Song, Y., 2017b. Effects of multiple factors onmethane hydrate reformation in a porous medium. ChemistrySelect 2, 6030–6035.
Yang, M., Chong, Z.R., Zheng, J., Song, Y., Linga, P., 2017a. Advances in nuclearmagnetic resonance (NMR) techniques for the investigation of clathratehydrates. Renew. Sustain. Energy Rev. 74, 1346–1360.
Yang, M., Fu, Z., Jiang, L., Song, Y., 2017b. Gas recovery from depressurized methanehydrate deposits with different water saturations. Appl. Energy 187, 180–188.
Yang, M., Zhou, H., Wang, P., Song, Y., 2018. Effects of additives on continuoushydrate-based flue gas separation. Appl. Energy 221, 374–385.
Yoslim, J., Linga, P., Englezos, P., 2010. Enhanced growth of methane-propaneclathrate hydrate crystals with sodium dodecyl sulfate, sodium tetradecylsulfate, and sodium hexadecyl sulfate surfactants. J. Cryst. Growth 313, 68–80.
Zhang, Y., Li, X.S., Chen, Z.Y., Wang, Y., Ruan, X.K., 2015. Effect of hydrate saturationon the methane hydrate dissociation by depressurization in sediments in acubic hydrate simulator. Ind. Eng. Chem. Res. 54, 2627–2637.
Zhao, Y.C., Song, Y.C., Liu, Y., Liang, H.F., Dou, B.L., 2011. Visualization andmeasurement of CO2 flooding in porous media using MRI. Ind. Eng. Chem.Res. 50, 4707–4715.
Zheng, J., Zhang, B., Wu, Q., Linga, P., 2018. Kinetic evaluation of cyclopentane as apromoter for CO2 capture via a clathrate process employing different contactmodes. ACS Sustain. Chem. Eng. 6, 11913–11921.
Copyright © 2022 FDOKUMEN