A Phage Foundry Framework to Systematically Develop Viral ...
Upload
uitmshahalamCategory
view
2download
0
Sand Testing Preparation (Green Sand)
Prepared by:
MUHAMMAD FAKHRUR RAZI BIN MUJAH 2011642844
MOHD ZAKUAN BIN ZABRI 2011864056
MUHAMMAD RABANI BIN KAMARUZZAMAN 2012853256
MUHAMMAD AIMAN FIRDAUS BIN ADNAN 2012677572
MUHAMMAD AZLAN BIN ZAINAL ABIDIN 2011864616
Bachelor in Engineering (Hons.) Mechanical
EM220
Prepared for:
Mohd Ridhwan Mohammed Redza
Lab Instructor for Manufacturing Process Lab (MEM 564)
Faculty of Mechanical Engineering
UiTM, Shah Alam
DATE OF SUBMMISSON:
3 OCTOBER 2013

UNIVERSITI TEKNOLOGI MARA
FAKULTI KEJURUTERAAN MEKANIKAL
Program : Bachelor of Mechanical Engineering (Hons) Manufacturing (EM221)
Bachelor of Engineering (Hons) Mechanical (EM220)
Course : Mechanical Engineering Manufacturing lab Course Code : MEM 564
Lecturer : En Mohd Ridhwan Mohammad Redza
____________________________________________________________________________
Laboratory Report
(Title of Experiment)
Sand Testing Preparation (Green Sand)
Practical Session : _26/09/2013___ Staff certification : ________________
(Date) (Signature)
Report Submission : _1/10/2013__ Staff certification : ________________
(Date) (Signature)
No Student’s Name Student’s ID Signature
1. M.FAKHRUR RAZI MUJAH 2011642844
2. MOHD ZAKUAN ZABRI 2011864056
3. MUHAMMAD RABANI BIN KAMARUZZAMAN 2012853256
4. MUHAMMAD AIMAN FIRDAUS BIN ADNAN 2012677572
5. MUHAMMAD AZLAN BIN ZAINAL ABIDIN 2011864616

TABLE OF CONTENT
TOPICS PAGES
1.0 OBJECTIVE OF THE EXPERIMENT 1
2.0 BACKGROUND OF STUDY
2.1 GREEN COMPRESSION STRENGTH
2.2 PERMEABILITY
2
3
3.0 APPARATUS USED IN THE EXPERIMENT
3.1 MATERIALS.
3.2 EQUIPMENT
3.3 HANDS TOOLS
4
4-5
6
4.0 EXPERIMENTAL PROCEDURES 7
5.0 RESULTS & DATA ANALYSIS
5.1 SAMPLE CALCULATION
5.2 FIGURES OF THE FINAL RESULTS
8-9
10
6.0 DISSCUSSION 11-12
7.0 CONCLUSION 13
8.0 RECOMMENDATION 14
9.0 REFERENCES 15

LIST OF TABLES & FIGURES
Figure 1: The sand that is produced from the addition of silica sand, coal dust, bentonite and
Water altogether in the aluminum tray.
Figure 2: The digital weighing device used in this experiment in order to determine the specific
Weight of the sand
Figure 3: Sand rammer that is used to ram the sand for 3 times before permeability testing.
Figure 4: Permeability Machine that is used to check the permeability properties of the rammed
Sand
Figure 5: Universal Sand Strength Testing Machine that used to determine the strength of the
Rammed sand in Ib/inch2
Figure 6: Funnel tube that is used to allow the sand specimen into the steel tube.
Figure 7: Specimen tube that functions to remove the rammed sand out from the steel cylinder.
Figure 8: Vernier caliper that used to measure the height of the sand specimen after done
Permeability and strength test.
Figure 9: The condition of the rammed sand after strength testing process.
Figure 10: The specimens that failed due to height requirement are not equal to 50.8 mm.
Figure 11: The reading of the universal sand strength testing machine just after the rammed sand
Specimen crack
Table 1 : Reading for 12 trials on the Green Sand specimen.
Table 2 : Reading for the twelfth trials.
Table 3 : Theoretical properties of permeability for green sand.

1.0 OBJECTIVE OF THE EXPERIMENT
There were several objectives of this experiment. Some of the objectives are:
1. To measure the properties of molding sands, green compression strength and
permeability of the sand block.
2. To expose the knowledge of molding process and all the standard procedures to the
students.
3. Enhance the skill of using the laboratory equipment’s with proper method and handling.
2.0 BACKGROUND OF STUDY
2.1 Green Compression Strength
Sand strength test is the measure of holding power of various bonding materials in
green and dry sand. Green sand is made up from silica sand, bentonite (clay), coal dust
and water in ratio of 4:2:2:1.This test determines the cohesiveness or natural binding
capacity of the sand grains and also required the sand specimen to ruptured under
compressive loading. Usually, there are 4 types of test for sand strength: (1) compression,
(2) shear, (3) tensile, and (4) over-hang bar test. Of these tests, the compression test is by
far most widely used and is very convenient for routine testing of all types of national
bonded and synthetic moulding sand.
For green compression strength test, the test is performed on the sand specimen by
using Universal Sand Strength machine. While, preparing the sand specimen, the sample
are required to be taken out quickly from the specimen tube to avoid the sample from
drying which will cause increase in the strength of the sample. This machine also consists
of a pusher arm and weight arm, both hanging from a pivot bearing at the top of the
machine. The weight arm applies load on the specimen while pusher arm pushes the
specimen against the weight until the specimen breaks. Then the compression strength in
Ib/inch2 may be read from the magnetic marker. The green strength of sand is generally
in the range of 0.03 to 0.16 MPa.

2.2 Permeability
Permeability can be defined as physical property of the moulded mass of sand
mixture which allows gas to pass through it. It is determined by measuring the quantity of
air that passes through a given sample of sand in prescribed time and under standard
condition. Standard permeability is determined by measuring the time necessary for 2000
cm3 of air to pass through the standard specimen while it is confined in the specimen
tube. Permeability of moulding sand depends on several factors including shape of sand
grains, fineness, degree of packing, moisture content and amount of binder present. In
conclusion, coarse grained sands are more permeable than finer ones.
The permeability number of the sand sample can be calculated from the following
equation:
P =PxAxT
VxH
Where;
Volume of air, V = 2000 cm3
Height of sand specimen, H = 2 inches
Pressure, P = 10 gm/cm2
Cross sectional area of the sand specimen, A = 1 in2
Time, sec for 2000 cm3 air to pass through specimen, T
This equation also can be reduced to AFS permeability:
P = (sec)
7.3000
T for old machine working with Hg
These formulas reduce to AFS Permeability for Ridscale-Dieter:
P = pxt
30557=

3.0 APPARATUS USED IN EXPERIMENT
1) Materials
a. Silica sand
b. Coal dust
c. Bentonite
d. Water
2) Equipment
a. Permeability Machine
b. Sand Rammer
c. Universal Sand Strength Testing Machine
3) Hand Tools
a. Specimen Tube
b. Ruler.

3.1 MATERIAL USED
Figure 1: The sand that is produced from the addition of silica sand, coal dust, bentonite and
water altogether in the aluminum tray.
3.2 EQUIPMENT USED
Figure 2: The digital weighing device used in this experiment in order to determine the
specific weight of the sand.
Figure 3: Sand rammer that is used to ram the sand for 3 times before permeability testing.

Figure 4: Permeability Machine that is used to check the permeability properties of the
rammed sand.
Figure 5: Universal Sand Strength Testing Machine that used to determine the strength
of the rammed sand in Ib/inch2.
Figure 6: Funnel tube that is used to allow the sand specimen into the cylindrical steel
tube.

3.3 HAND TOOLS USED
Figure 7: Specimen tube that functions to remove the rammed sand out from the cylinder
steel tube.
Figure 8: Vernier caliper that used to measure the height of the sand specimen after done
permeability and strength test.

4.0 EXPERIMENTAL PROCEDURES
1. The desired green sand needed is weighted by using the digital weighing devices ranges
between 145g to 175g.
2. The green sand is filled in a cylindrical steel tube with help of a funnel tube altogether
with stopper at the end of the cylindrical steel tube.
3. The cylindrical steel tube is then located below the ramming machine where the ramming
process by turning the machine three times.
4. The cylindrical steel tube then carried out from the ramming machine and correctly
placed on the top of the permeability machine. The permeability machine was turned on
and the scale was set to zero scale.
5. The permeability number was collected and recorded.
6. The sand specimen was removed from the cylindrical tube by using specimen tube and
the height was measured and recorded in the table.
7. After that, the specimen was placed to the compress part of the universal sand strength
testing machine. The rammed sand specimen need to achieve the height of 50.8mm ±
0.125 mm to ensure specimen broke/ failure within the strength range on the universal
sand strength testing machine.
8. The initial reading was taken by setting the magnet pieces to the zero reading
9. The sand specimen was compressed by using the universal sand strength testing machine
until the sand specimen fails to support the load.
10. The reading of the condition where the sand specimen broke/failure was recorded for
analysis purposed.

5.0 RESULTS & DATA ANALYSIS
Number of
testing
Weight of green sand
used (g) Permeability
Height
(mm) Result
1 160.00 93 57.50 failed
2 155.00 92 56.40 failed
3 145.00 92 51.80 failed
4 142.50 90 50.44 failed
5 142.75 90 50.68 failed
6 142.85 84 50.20 failed
7 142.80 83 50.06 failed
8 142.55 107 51.18 failed
9 141.85 95 51.00 failed
10 142.50 97 51.48 failed
11 141.85 95 51.58 failed
12 139.70 105 50.67 Succeed
Table 1: Reading for 12 trials on the Green Sand specimen.
By observing the table 1, it shows 12 trials in which it shows the weight of the green sand,
permeability and the height. In the laboratory work, reproducing ramming condition are achieved
by the use of a standard sand rammer and specimen tube accessories. The sand is placed in the
specimen tube and rammed by impact with three blows of a standard weight. The height of the
specimen produced should have an exact value of 50.8 mm with the tolerance of 0.125 mm.
From the experiment, our group managed to get 50.67 mm of the specimen height which is still
within the tolerance limit in order to proceed to the next step which requires determining the
strength value. The strength value obtained from the experiment is as below:

Trial Mass(g) Permeability Height(mm) Strength(lb/in2)
12 139.70 105 50.67 16.3
Table 2: Reading for the twelfth trials
By referring to the table 1 above, twelve sample or trials have been done to obtain the require
value of the sample height which is 50.8 mm 0.125 mm. On the twelfth trials, the reading are
manage to be obtained within the required range. Due to the twelfth trials, the results obtained
are as in table 2, in which it produced strength of 16.3 Ib/in2. Convert the unit Ib/in
2 to SI units,
as it is shown below:
16.3 Ib/in2= 114.6023 kN/m
2

5.1 SAMPLE CALCULATION
The permeability number, P are calculated by using the formula of,
P =PxAxT
VxH
Table 3: Theoretical properties of permeability for green sand
P =14516.610
08.52000
xx
x
P = 157.48
Therefore percentage error, %:
|
|
|
|
Parameters Value
Volume of air, V (cm3) 2000
Height of sand specimen (cm) 5.08
Pressure, p (gm/cm2) 10
Cross sectional area of the sand specimen (cm2)
6.4516
Time, T (minute) 1
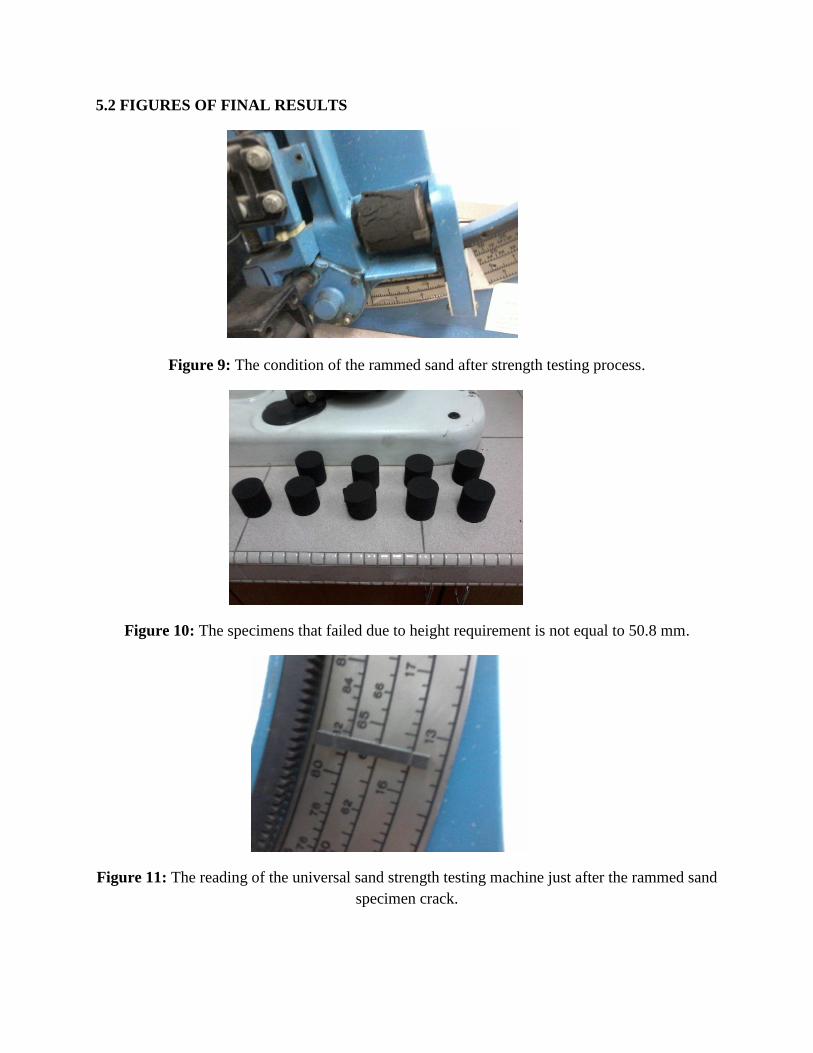
5.2 FIGURES OF FINAL RESULTS
Figure 9: The condition of the rammed sand after strength testing process.
Figure 10: The specimens that failed due to height requirement is not equal to 50.8 mm.
Figure 11: The reading of the universal sand strength testing machine just after the rammed sand
specimen crack.

6.0 DISCUSSIONS
Based from this experiment, the sand testing preparation (green sand).We had to measure the
properties of molding sands ,green compression strength and permeability of the specimen
(rammed sand).Based from the observation of the properties of molding sands, we could see that
the sand is in dark green/black color. The presence of this color was due to the addition of coal
dust inside the composition of the sand. Not just that, we found that the strength of the black
rammed sand was quite hard compare with the ordinary rammed sand. This condition is mainly
due to the presence of bentonite and cold dust that functions to increase the strength of the
specimen.
Meanwhile, according to the definition of the compression strength in the study of
strength of material, the compressive strength is the capacity of a material or structure to
withstand loads tending to reduce size. For green compression strength, it also can be interpret as
the capacity of the rammed sand to withstand the molten metal load that will be applies on the
surface of the rammed sand during pouring process. While, permeability is the property by which
we can know the ability of material to transmit fluid/gases. The permeability is commonly tested
in order to see if this material is suitable for the use of casting conditions. Permeability and green
compression strength are among the important mechanical properties and can be considered as
an important aspect in the sand casting mould preparation. These molding sand properties play a
vital role in determining the optimum moisture content for making green sand casting mould.
Green compression strength material normally has a high melting point. In order to find a
good material that will be able to withstand high temperature cause by the material, the strength
of must be larger than it melting point. Based on the result, only the twelfth trial manages to get
an accurate value which qualifies it to run for the strength test. The value of strength for the
height of 50.67 mm is 114.6023kN/m2. This value tells us that this green sand specimen can only
hold up to 114.6023kN/m2 before it start to change characteristic which it has crack on it
surfaces. The strength of the 139.70g may be different from the specimen mass due to the ratio
which is different. The error may bring lead to the different to the strength values are caused by
parallax error when taken the reading on the Vernier caliper. Unstable reading produce by the
strength machine and the angle of the reader may somehow give difficulties to read the

measurement correctly. Permeability of the green sand also needs to be determined from this
experiment. In order to achieve the objective of, the sand specimen was removed from the
specimen tube; the specimen was places on the adapter of the universal sand strength testing
machine. From here the compression strength can be identified as it value can be read from the
scale. The twelfth specimen gives the reading of 105. Based on the formula provided, the
theoretical value of permeability of the green sand can be calculated and yields value of 157.48.
Then both theoretical and experimental value of permeability was compared and the percentage
of error was calculated. The percentage errors obtained in this experiment are . As we
can see, there was a different in the actual and experimental value of permeability. The value of
permeability obtained from the experiment much smaller than it supposed to be in the theoretical
value. In other words, the percentage of error had shown a little high in value. These different
may be caused by several factors such as moisture contents in the sample, was drying or affected
by the surrounding temperature.
The error that occur also may be influenced by the random error especially during the
experiment was conducted. This may begin from the first steps which is when the sand is poured
into the funnel directly to the test tube. While doing this, some of the sand may stick at the
funnel and the accuracy of mass is totally reduced. Next, when it is being rammed in the sand
rammer machine, the same thing may happen where a small number of sand will also stick at the
head of the rammer. Again, the mass of the specimen will be reduced. Although, the loss of sand
due to these is very small but it still may affected the whole process especially in the term of
sand volume. Since the volume drops, thus the dimension of the specimen may not be accurate,
and thus the desired height of 50.8 mm 0.125 mm might be hardly to be achieved.

7.0 CONCLUSIONS
In conclusion, the green compression strength and permeability and the properties of the
sample are well measured and observed. From what it can be seen, the strength of the green sand
managed to get is 114.6023kN/m2 or 16.3 Ib/in
2. Both green compression strength and
permeability are important to enhance the properties while producing good casting products.
Theoretically, the strength of the molding sand is 30kN/m2 until 160kN/m
2. But from the
experiment, the result obtained is 16.3 Ib/in2 or more accurate 114.6023kN/m
2 which is still in
the range. But for the permeability value, in theory it is calculated as 157.48 but in experiment,
the value managed to achieve is 105. From the value of the permeability, the percentage error is
49.98 % .It shows that the value of the theoretical and experimental are different may be due to
the defects and environment factors.
8.0 RECOMMENDATIONS
During performing the experiments, we notice several ideas that can be proposed in order to
increase the accuracy of this experiment:
a) SAMPLING
i) Keep the sampling sand in an air-tight container or in closed area in order to prevent loss
of moisture.
ii) Make sure that the sand samples are free from other material such as small metal and
plastic composition as two of these compositions exist in our sampling sand.
iii) Do not ram the sand inside the cylindrical steel tube more than 3 times as the final height
of the specimen/sampling may be different.
b) WATER
i) Clay sand must contain the right amount of water in order to ensure the sand specimen is
not too dry or too wet which can finally resulted to the failure or success of the green
sand testing.
c) SPECIMEN PREPARATION
i) Make sure that the composition of the silica sand, coal dust, bentonite (clay) and water is
correct or in suitable condition to get the better result.
ii) Make sure that the height of a specimen is correct h=50.8mm ± 0.125mm, which is
within the tolerance specified.
iii) Pull away the specimen that damage in order to get precise and accurate result.
iv) Any deviation from standard ramming practice should be reported with results.
d) SPECIMEN TESTING
i) Handle specimens carefully to avoid the rammed specimen tear out from the original
rammed position.
ii) Always follow the instructions with regard to rate and method of applying load to
Specimen

9.0 REFERENCES
There are several sources that we used in order to complete this report. There sources are:
i) http://www.mechanicalengineeringblog.com/tag/green-sand-testing/
ii) A study of the permeability of sand, Frederic Mavis and Edward Wilsey, University
Iowa City, 1936
iii) Granlund, Matt (1999-03-01), "Understanding the basics of green sand testing",
Modern Casting 89 (3): 38–40, archived from the original on 2010-01-27.
Copyright © 2022 FDOKUMEN