Response of stream macroinvertebrates to changes in salinity and the development of a salinity index
Upload
khangminh22Category
view
0download
0
ABSTRACT
Title of Thesis: EFFECTS OF SALINITY ON SETTLEMENT
AND METAMORPHOSIS OF THE EASTERN OYSTER (Crassostrea virginica)
Anna M. Priester, Master of Science, 2016
Thesis Directed By: Donald W. Meritt, Principal Agent
University of Maryland Center for Marine Estuarine Environmental Science
The eastern oyster (Crassostrea virginica) is a euryhaline species known for its
historic populations, valuable fishery, and ecological importance. One of the most
critical periods in the oyster’s life cycle is its transition from a free-swimming pelagic
larva into its sessile benthic form. Despite the importance of this transition, which
includes attachment to a substrate (settlement) and metamorphosis into the juvenile,
our understanding of salinity tolerance during these processes is limited. This study
was designed to quantify the effects of salinity on settlement and metamorphosis, and
to determine if those effects were influenced by the salinity in which the larvae were
reared. Multiple cohorts of pediveliger larvae from hatcheries grown in Low (10),
Medium (15-16.5) and High (22-27.5) salinities were allowed four days to settle in
twelve salinity treatments ranging from 5 to 35. A set of additional experiments was
extended to 14 days to investigate if the settlers were also able to complete
metamorphosis and demonstrate juvenile growth within the same range of salinities.
Settlement consistently occurred all tested salinities (5-35), indicating that pediveliger
larvae can adapt to a broader salinity range than described in previous research.
Highest settlement rates were achieved in treatment salinities between 11 and 30 for
all three larval groups. Settlement performance outside that optimal range was highest
for the larvae group reared in salinities closest to those extremes. Settlers from the 14-
day experiments demonstrated metamorphosis and high post-settlement survivorship
in all salinity treatments, but juvenile growth rates were reduced in salinities less than
9 and above 30. This highly repeated study reveals the impressive capacity for
pediveliger larvae to tolerate a wide range of salinities, and has direct implications for
oyster aquaculture and our understanding of natural recruitment.
EFFECTS OF SALINITY ON SETTLEMENT AND METAMORPHOSIS OF THE EASTERN OYSTER (Crassostrea virginica)
by
Anna Margaret Priester
Thesis submitted to the Faculty of the Graduate School of the University of Maryland, College Park in partial fulfillment
of the requirements for the degree of Master of Science
2016 Advisory Committee: Principal Agent Dr. Donald W. Meritt, Chair Professor Dr. Standish K. Allen, Jr. Associate Professor Dr. Kennedy T. Paynter Assistant Professor Dr. Louis V. Plough

© Copyright by Anna Margaret Priester
2016
ii
Acknowledgements
If it takes a village to raise a child, then it took a small country to help me get
my masters. I first want to thank the HPL Hatchery staff and interns for their
incredible generosity, especially Stephanie, Jeff, Lisa, Julie, Stacey, Steven, Dakota,
Zach, Alex, Alicia, and Bob. Thanks for allowing me to take larvae and algae
whenever I needed it, for helping me with various tasks during every experimental
run, and for providing countless hours of laughter and entertainment. I am also
indebted the rest of the Horn Point community for extending unwavering support and
encouragement. The maintenance department also deserves a round of applause,
especially Ralph, Gordy, Bear, and Chris who were particularly helpful with any
power or plumbing problem I could create. I am particularly thankful for the open-
door policy of UMD faculty members, especially Jeff Cornwell, Mike Owens, Vic
Kennedy, Elizabeth North, Slava Lyubchic, and Bahram Momen.
I am also sincerely grateful for the cooperation of all the scientists and
hatchery operators from other institutions, especially Kate Ritter, Jessica Small,
Karen Hudson, Nate Geyerhahn, Tim Rapine, Ken Kurkowski, Matt Newman, David
Jones, Mike Congrove, the Shockley family, Mitch White, Mark Dixon, Gary
Wikfors, and George Waldbusser.
I also want to give huge thanks to my committee members. I thank Ken for
encouraging me to follow my research passions and allowing me to be a proud
member of your lab and dive team. Thank you Stan for always providing prompt and
hilarious email responses and for making excellent final-word decisions. Thank you
Louis, for always allowing me to pop into your office and attack you with questions.
Most of all, I thank Mutt for all the time and resources he spent to help me improve as
a person, hatchery operator, and scientist. Even though life is not about who is right
and who is wrong, it still amazes me many times he wound up being right.
Finally, I would like to thank my small (but growing!) incredible family. You
all have showered me with love, and have encouraged me every step along my life,
studies, and career. Most of all, you’ve inspired me to approach life and work with
passion and enthusiasm.

iii
Table of Contents Acknowledgements ....................................................................................................... iiTable of Contents ......................................................................................................... iiiList of Tables ............................................................................................................... ivList of Figures ............................................................................................................... vGlossary ....................................................................................................................... viChapter 1: Laboratory studies on salinity tolerance during oyster larval settlement and metamorphosis .............................................................................................................. 1
INTRODUCTION .................................................................................................... 1Eastern Oyster Ecology ......................................................................................... 2Settlement and Metamorphosis ............................................................................. 5Project Objectives ................................................................................................. 9
MATERIALS AND METHODS ............................................................................ 10Preliminary Experiments .................................................................................... 10Main Experiments ............................................................................................... 15
RESULTS ............................................................................................................... 284-Day Experiments ............................................................................................. 3414-Day Experiments ........................................................................................... 41Carbonate Chemistry .......................................................................................... 47
DISCUSSION ......................................................................................................... 49Salinity Adaptation During Settlement and Metamorphosis .............................. 49Settlement variability .......................................................................................... 62Implications of Research ..................................................................................... 65
REFERENCES ....................................................................................................... 71
iv
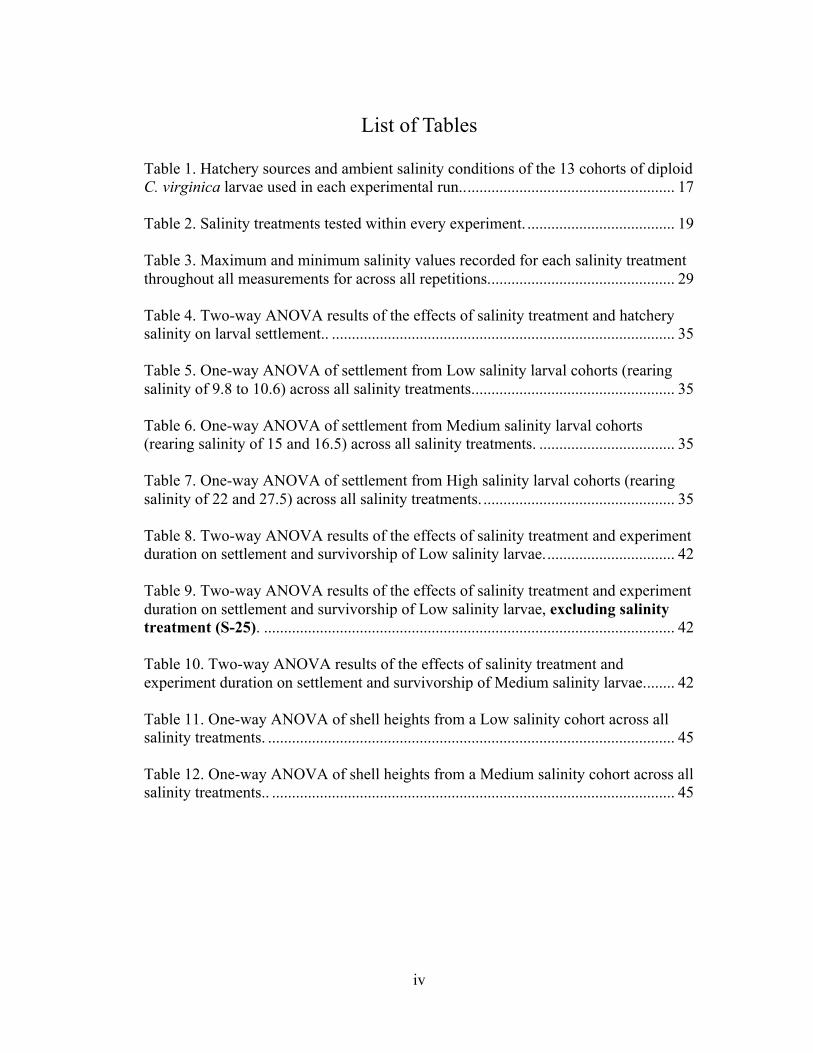
List of Tables Table 1. Hatchery sources and ambient salinity conditions of the 13 cohorts of diploid C. virginica larvae used in each experimental run.. .................................................... 17 Table 2. Salinity treatments tested within every experiment. ..................................... 19 Table 3. Maximum and minimum salinity values recorded for each salinity treatment throughout all measurements for across all repetitions. .............................................. 29 Table 4. Two-way ANOVA results of the effects of salinity treatment and hatchery salinity on larval settlement.. ...................................................................................... 35 Table 5. One-way ANOVA of settlement from Low salinity larval cohorts (rearing salinity of 9.8 to 10.6) across all salinity treatments. .................................................. 35 Table 6. One-way ANOVA of settlement from Medium salinity larval cohorts (rearing salinity of 15 and 16.5) across all salinity treatments. .................................. 35 Table 7. One-way ANOVA of settlement from High salinity larval cohorts (rearing salinity of 22 and 27.5) across all salinity treatments. ................................................ 35 Table 8. Two-way ANOVA results of the effects of salinity treatment and experiment duration on settlement and survivorship of Low salinity larvae. ................................ 42 Table 9. Two-way ANOVA results of the effects of salinity treatment and experiment duration on settlement and survivorship of Low salinity larvae, excluding salinity treatment (S-25). ....................................................................................................... 42 Table 10. Two-way ANOVA results of the effects of salinity treatment and experiment duration on settlement and survivorship of Medium salinity larvae. ....... 42 Table 11. One-way ANOVA of shell heights from a Low salinity cohort across all salinity treatments. ...................................................................................................... 45 Table 12. One-way ANOVA of shell heights from a Medium salinity cohort across all salinity treatments.. ..................................................................................................... 45

v
List of Figures
Figure 1. Settlement rates of HPL larvae graded on 212µm and 224µm sieve sizes.. 14 Figure 2. Experimental array used for all settlement experiments. ............................ 22 Figure 3. Mean settlement rate (across all salinity treatments) of each cohort from all three larval groups. ...................................................................................................... 30 Figure 4. Mean larval sizes from each cohort, plotted against the average settlement across all salinity treatments.. ..................................................................................... 31 Figure 5. Example of gregarious settlement frequently observed on tiles. ................. 32 Figure 6. Example of settlement variability between replicates from one High salinity larval cohort. ............................................................................................................... 33 Figure 7. Settlement of Low (A), Medium (B) and High (C) salinity larval cohorts across the 11 consistent salinity treatments.. .............................................................. 36 Figure 8. Mean Logarithmic Response Ratios (LnRRs), for each larval group across the 11 consistent salinity treatments. .......................................................................... 40 Figure 9. Comparison of Low salinity larvae given 4 days to set (4-Days) with another group given 4 days to set and 10 days to grow (14-Days). ............................ 43 Figure 10. Comparison of Medium salinity larvae given 4 days to set (4-Days) with another group given 4 days to set and 10 days to grow (14-Days). The median and the interquartile range (IQR) are displayed by the box, and maximum and minimum values are shown by the whiskers. .............................................................................. 44 Figure 11. Juvenile Shell heights from Low salinity larvae (A) and Medium salinity larvae (B) after a 14-day period of settlement and growth.. ....................................... 46 Figure 12. Aragonite saturation coefficients (Ωar) of all salinity treatments measured at the start of 3 experimental runs. .............................................................................. 48 Figure 13. The effect of DI and salt mix on the relationship between salinity and alkalinity. .................................................................................................................... 61
vi
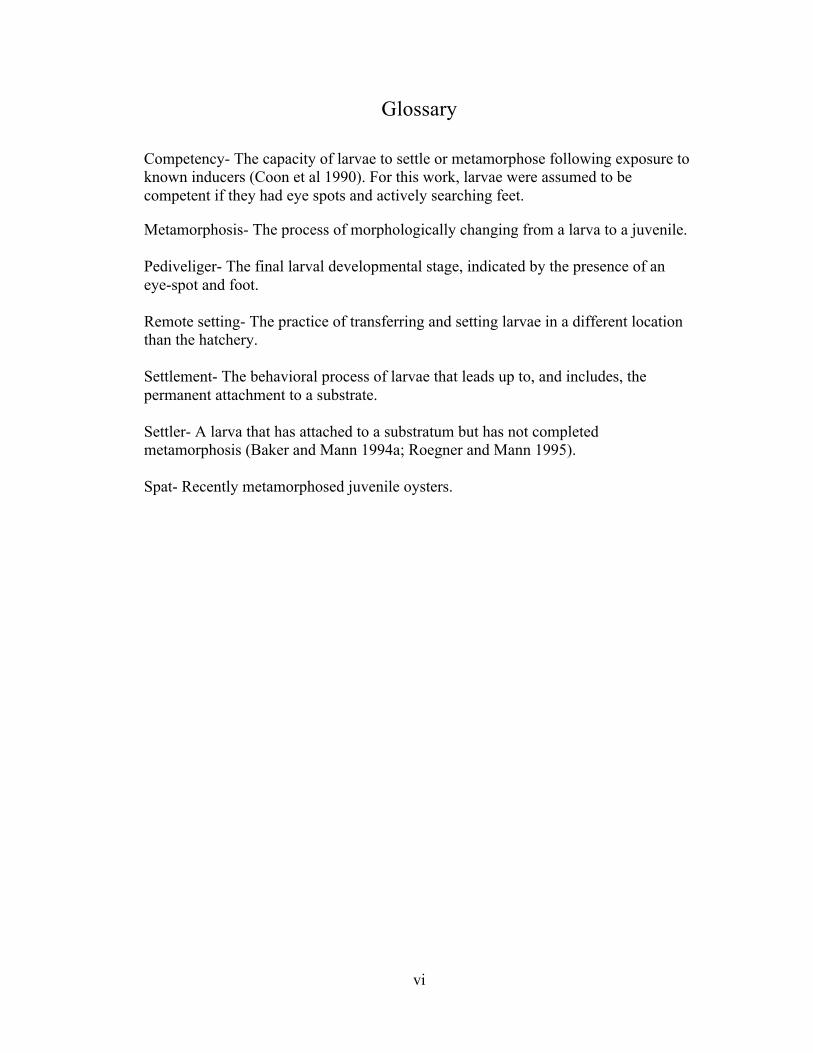
Glossary
Competency- The capacity of larvae to settle or metamorphose following exposure to known inducers (Coon et al 1990). For this work, larvae were assumed to be competent if they had eye spots and actively searching feet.
Metamorphosis- The process of morphologically changing from a larva to a juvenile. Pediveliger- The final larval developmental stage, indicated by the presence of an eye-spot and foot. Remote setting- The practice of transferring and setting larvae in a different location than the hatchery. Settlement- The behavioral process of larvae that leads up to, and includes, the permanent attachment to a substrate. Settler- A larva that has attached to a substratum but has not completed metamorphosis (Baker and Mann 1994a; Roegner and Mann 1995). Spat- Recently metamorphosed juvenile oysters.

1
Chapter 1: Laboratory studies on salinity tolerance during oyster
larval settlement and metamorphosis
INTRODUCTION
The eastern, or American oyster, Crassostrea virginica (Gmelin 1791),
is a bivalve mollusk native to estuaries and coasts of the western Atlantic, Gulf of
Mexico, and Caribbean Islands (Carlton and Mann 1996), known for its historical
abundances and valuable fishery (Rothschild et al. 1994). As an ecosystem engineer
and a keystone species, the eastern oyster creates extensive reefs that provide
substrate for colonization (Underwood and Denley 1984), refugia from predation, and
foraging areas for many invertebrates and fishes (Beck et al. 2001, Soniat et al. 2004).
Oyster reefs also augment coastline resilience by preventing erosion and serving as a
break-wall for storm surges (Meyer et al. 1997). Oysters feed by filtering particles
and algae from the water column, which in turn reduces eutrophication, (Officer et al.
1982; Newell 1988; Dame et al. 2002; Newell et al. 2007) increases water clarity,
(Coen et al. 1999) and improves conditions for other habitats like seagrass beds
(Newell and Koch 2004). Hence, the presence of oyster reefs improves ichthyofaunal
diversity and the sustainability of other commercially important species (Breitburg
1999; Zimmerman et al. 1989; Meyer and Townsend 2000; Harding and Mann 2001).
Due to a combination of overharvest, diseases, reduced water quality,
substrate limitation, and other contributing factors, the current yield from the wild-
harvest fishery of the eastern oyster is a small fraction of the historical production
(Jackson et al. 2001). For instance, the oyster population within the Chesapeake Bay,
which formerly supported the largest oyster fishery in the world, is estimated to be
2
less than 1% of its historic abundance (Newell 1988; Wilberg et al. 2011). The
decline of the oyster populations along the Atlantic coast and the Gulf of Mexico is
well documented, as are the resulting economic and environmental ramifications of
their absence (Newell 1988; Jackson et al. 2001; Kemp et al. 2005; Coen et al. 2007;
Grabowski and Peterson 2007). Recently, oyster restoration efforts and aquaculture
production have been greatly expanding, but are still far from filling the void created
by the collapsed population (Coen et al. 2007; Mann and Powell 2007; Kennedy et al.
2011; Lipcius et al. 2015; Hudson and Murray 2016). As the culturing methods of the
Eastern oyster evolve, gaps in our current knowledge of the basic physiological
responses of the species are becoming apparent. Motivation for the current study
stems from the greater activity in restoration and aquaculture in low salinity waters,
conditions where oysters thrive, but information on some of the basic biology, such as
larval behavior, is scant.
Eastern Oyster Ecology
The life cycle of the eastern oyster is similar to many benthic marine
invertebrates, characterized by sedentary, spawning adults with pelagic larvae (e.g.
Pawlik 1992, Rodriguez et al. 1993). They are commonly found in temperatures
ranging from -2 to 36°C and salinities 5 to 40 (Butler 1954; Galtsoff 1964).
Temperature and salinity are the two most important abiotic factors governing their
biological processes, distribution of predators and diseases, and availability of food
(as reviewed in Shumway 1996). Salinity, which can change dramatically on short
temporal and spatial scales, has important effects on biological processes that can
vary across the life cycle of an oyster and may depend upon their genetic makeup
3
(Davis 1958; Pierce 1992). Classic experimental work that dates back over half a
century indicates that sensitivity to extreme salinity conditions decreases as larvae
age (Davis 1958, Davis and Calabrese 1964, Loosanoff 1965). For example, the
salinity range for successful egg fertilization is narrower than for the development of
D-hinge larvae, and developing larvae can tolerate still a wider range of salinities as
they mature. Davis (1958) and Davis and Calabrese (1964) also found that little to no
fertilization can occur in salinities below 10, and larval growth rates are also minimal
below salinities of 10. Older larvae can survive short periods of exposure to salinities
as low as 5 (Loosanoff 1965).
Juvenile and adult oysters have a greater capacity to tolerate both a broader
range and immediate change in salinity than larvae (Shumway 1996), but unlike
larvae, the oyster’s capacity to tolerate low salinities and higher temperatures
decreases as it grows (Rybovich et al. 2016). The increased sensitivity to changes in
salinity, temperature, and other environmental stressors in larger size classes has been
reported in many studies of bivalves (Widdows 1978, Sukhotin et al. 2003, Peck et al.
2007, Yuan et al. 2010, Clark et al. 2013), and is likely due in-part to the
proportionately increased metabolic demands of larger organisms (Bayne and Newell
1983). Oysters, like many osmoconformers, lack the ability to maintain osmotic
homeostasis. Instead, they must conform at the cellular level, primarily by the
regulation of ion channels and the synthesis or release of intracellular free amino
acids (FAAs) (Pierce and Amende 1981; Zhao et al. 2012; Guo et al. 2015). The first
line of defense for an oyster to a sudden change in intracellular sodium concentration
is to close its valves and cease pumping, thereby creating a barrier between its tissues
4
and the surrounding water (Loosanoff 1953; Hand and Stickle 1977; Natochin et al.
1979). Because oysters cannot feed or respire without pumping, no gases are
exchanged between the oyster and the surrounding medium when its valves are
closed. The subsequent buildup of carbon dioxide (respiratory acidosis) is therefore
one of the main reasons for summertime mortalities in oyster populations associated
with unfavorable salinities and temperatures (Michaelidis et al. 2005; Lannig et al.
2008; Lombardi et al. 2013). Oysters that eventually open their valves due to
respiratory stress must either osmoconform to the new salinity or die (Hoyaux et al.
1976; Hand and Stickle 1977).
Salinity tolerance in both larvae and adults varies because of prior exposure
history, differences in genetics, or both. After conducting a few experiments using
oysters from low salinity conditions in MD, Davis and Calabrese (1964) discovered
that the salinity at which gametogenesis occurs affects the salinity range of successful
larval development. For instance, when gametogenesis occurs in low salinities, the
resulting larvae can tolerate lower salinities than if gametogenesis occurred in higher
salinities. Pierce et al. (1992) also saw significant differences between adult
populations when examining their intracellular response to osmotic stress. They
proposed that adult oysters from the lower-salinity Chesapeake Bay were unable to
adapt to high salinities without stepwise acclimation because of their smaller pools of
FAAs. Recognizing these physiological differences, it is unlikely that a specific
biological response to salinity will be the same across all populations of the eastern
oyster.

5
Settlement and Metamorphosis
The persistence of self-sustaining oyster reefs depends on continued
recruitment of new larvae attaching themselves to a substrate on the reef and then
successfully metamorphosing into juveniles. Although settlement and metamorphosis
are amongst the most critical periods in the life cycle of an oyster (Stafford 1913;
Prytherch 1934; Cole and Knight-Jones 1949; Rodriguez et al. 1990), the process is
difficult to study in the field because is it ephemeral. The development of larvae
culture techniques has enabled study of many of the biological mechanisms, but still
much of what we know about how they respond to their environment is based on
loosely associative evidence riddled with exceptions. Even some of the effects from
the most influential environmental parameters, like salinity, have yet to be adequately
explored.
The process of settlement begins after the late-stage larva (called a
pediveliger, characterized by the development of an eye-spot and foot), begins
“settlement behavior” by swimming in a spiral pattern with the foot extended to
search for a solid substrate (Prytherch 1934: Bonar et al. 1990). Similar to other
settling invertebrates, if the larva encounters a surface that it deems unfavorable, it
can resume swimming and search elsewhere (Bayne 1965; Scheltema 1974). Upon
finding a suitable substrate, the larva will excrete a crystalline cement from its foot
and permanently attach itself (Prytherch 1934). For this thesis, the process leading up
to and including cementation will be henceforth referred to as “setting” or
“settlement,” and larvae that have successfully attached to a substrate will be called
“settlers.” Water-born chemical cues are responsible for initiating and enhancing
6
settlement, which originate from bacterial biofilms and conspecifics of recently set
and adult oysters (as reviewed in Pawlik 1992; Rodriguez et al. 1993; Kennedy
1996). Small increases in water temperature can also stimulate settlement behavior
(Lutz et al 1970). The mechanisms by which larvae choose to orient themselves on a
substrate are not fully understood, but they often prefer surfaces with less light
(negative phototaxis), the undersides of surfaces (geotaxis), and rougher surfaces
(rugotaxis) (Kennedy 1996; Baker 1997; Baker and Mann 1998; Saoud et al. 2000).
After cementation, the settler will begin metamorphosis into its juvenile form
(Galtsoff 1964; Baker and Mann 1994a). Metamorphosis is an energetically costly
process, during which the locomotive and feeding organ called the velum will be cast
off or resorbed and gills will fully develop (Galtsoff 1964; Bayne 1971; Baker and
Mann 1994a; Kennedy 1996). Additionally, the foot is resorbed, and the larval organs
revolve in an anterior-dorsal direction. A sharp transition in the mineralogy of the
shell deposition also occurs when the spat shifts from depositing aragonite to the
denser calcite (Carriker 1996). For this thesis, a fully-metamorphosed settler is
henceforth referred to as a “spat” or juvenile oyster.
The ability of larvae to settle and metamorphose is referred to as
“competency” (Coon et al. 1990a). Furthermore, Coon et al. (1990a) defined
metamorphic competence as the sum of behavioral competence (enabling them to
settle) and morphogenetic competence (enabling them to metamorphose).
Competency to settle can be independent of competency to metamorphose, as the
processes mark different stages of development and are triggered by different
chemical pathways (Coon et al. 1990a). True competency is tested by exposing larvae
7
to chemicals like L-3,4- dihydroxyphenylalanine (L-DOPA) and epinephrine that
induce settlement and metamorphosis, respectively (Coon et al. 1990a, 1990b). For
this work, however, all larvae used in experiments were assumed to be competent if
they had an eye-spot and an actively searching foot.
Salinity is frequently implicated as the most important environmental factor
determining the distribution and number of new juveniles recruited to an area. In
general, higher salinities are associated with higher recruitment (Hopkins 1931;
Chatry et al. 1983; Ulanowicz 1980; Kimmell and Newell 2007; Mann et al. 2009;
Soniat et al. 2012; La Peyre et al. 2013). In Louisiana, setting intensity is highest
between salinities 16-22 while virtually no setting takes place when mean summer
salinity is less than 10 (Chatry et al. 1983). In Galveston Bay, TX, salinities above 20
yielded successful spat sets (Hopkins 1931), while successful settlement in the lower
Laguna Madre, TX, was recorded at substantially higher salinities of 32 to 42 (Breuer
1962). In the Caloosahatchee estuary, FL, spat recruitment and growth rates are low
in salinities 0-15 and more favorable between 15-25 (Barnes et al. 2007). Ulanowicz
(1980) and Kimmell and Newell (2007) also found that the dominant factor
increasing spat production in the upper Chesapeake Bay was sustained high salinity,
although a range was not specified. Because recruitment is affected by the sum of
many factors that affect various processes, including gametogenesis, larval
development, settlement, and post-settlement mortality (Underwood and Denley
1984; Rumrill 1990), the degree to which each of these factors govern settlement on
oyster reefs is hard to pin down (Chatry et al. 1983).

8
Recently, further clarification of the association between salinity and
recruitment has been attributed to the role of river flow and hydrographic dynamics
on larval transport. In systems like the Chesapeake Bay and Delaware Bay, the
majority of larvae are transported downriver where salinity values are higher (North
et al. 2008; North et al. 2010; Narvaez et al. 2012). Paradoxically, many of the largest
and healthiest oyster populations in both systems are found in upriver, low salinity
sites where disease and predation is low (Southworth and Mann 2004; North et al.
2010). The persistence of low-salinity reefs raises questions concerning our
knowledge of the salinities in which settlement and metamorphosis is possible,
particularly because it is a commonly held assumption that C. virginica larvae cannot
successfully complete metamorphosis in salinities below 10.
To the best of my knowledge, only two laboratory studies have investigated
the salinity tolerances of larvae during settlement and metamorphosis, and both of
them involved larvae reared in salinities around 27 (Prytherch 1934; Davis 1958). In
Prytherch’s (1934) work concerning the role of copper in settlement and
metamorphosis, he found that a small addition of copper can stimulate the setting
behavior of pediveligers and used that method to test the salinities in which larval
attachment is possible. The majority of his findings concerning copper have since
been rejected, as the stimulatory effect he witnessed was likely due to larval
avoidance of the sub-lethal addition of copper (Korringa 1952; Lund 1973; Pawlik
1992). Nonetheless, Prytherch (1934) provided evidence that larval attachment only
occurs “with regularity” in salinities between 9 and 29, but observed that at least one
larva settled in salinities as low as 5.6 and as high as 32.2. Years later, Davis (1958)
9
investigated the effects of salinity on larval growth and extended one set of
experimental larval cultures for a few days to get an indication of metamorphic
success in different salinities. Results from this non-replicated study indicated that
metamorphosis does not occur in salinities less than 10 (Davis 1958).
Recognizing that oyster reefs exist within waters regularly experiencing
salinities below 10, there is a distinct need to re-examine how salinity affects oyster
settlement and metamorphosis. Furthermore, the oyster hatchery located at the
University of Maryland Center for Environmental Science (UMCES) Horn Point
Laboratory (HPL) is currently the largest producer of C. virginica larvae in the world
and operates in a salinity of approximately 10. The fact that this hatchery is
successful within the lowest salinity deemed possible for larval development further
emphasizes that conclusions from former studies using oysters from higher salinity
areas may not be entirely appropriate. Additionally, HPL and other facilities in the
Mid-Atlantic are increasingly engaging in the practice of “remote setting,” whereby
hatchery operators send bundles of competent larvae to be set in tanks at different
locations. Therefore the need to examine the adaptive capabilities of larvae to a
salinity change at the time of settlement and metamorphosis is of particular
importance.
Project Objectives
The overall objectives of the present research were to 1) determine how
salinity affects settlement and metamorphosis of larvae reared in low salinities, and 2)
identify if larvae reared in higher salinities perform differently. To achieve this,
settlement rates of HPL larvae placed in different salinity treatments were compared
10
to settlement rates of larvae reared in higher salinity hatcheries. A subset of these
experiments was extended in order to investigate if settlement rates were also
indicative of metamorphic rates. Results from this study will shed new light on how
pediveliger larvae respond to a wide range of salinities, thereby furthering our
understanding of the basic biological processes of C. virginica important to natural
recruitment and the practices of oyster restoration and aquaculture.
MATERIALS AND METHODS
A series of experiments was conducted at the HPL Oyster Hatchery (HPL) in
Cambridge, MD, from April through September of 2015 to quantify the effects of
salinity on settlement and metamorphosis of C. virginica larvae. Preliminary
experiments evaluated the feeding and larval size-selection protocols and established
the range of treatment salinities to be tested. Afterwards, a total of 13 replicated
experiments were conducted using different cohorts of pediveliger larvae originating
from four hatcheries. These experiments tested the ability of larvae to settle when
exposed to salinities ranging from 5 to 35 over a period of four days. Results from
these settlement experiments motivated an additional subset of experiments in which
settlers remained in settlement bags for an additional ten days to investigate their
ability to complete metamorphosis and demonstrate juvenile growth.
Preliminary Experiments
It was deemed important to provide algae during the settlement experiments to
guarantee that larvae from every hatchery did not go through a period of starvation
before settlement (Laing 1995), and that they did not fail to settle simply because

11
ambient food levels were too low (Baker 1994). It was first necessary to verify that
algae cells remained intact and viable when exposed to different salinities, and
therefore would not become a confounding factor within the subsequent settlement
experiments. Two algae species, Chaetoceros muelleri (clone CHGRA, NMFS
Milford laboratory, CT collection) and Tetraselmis chui (clone PLY 429, NMFS
Milford laboratory, CT collection), were chosen for the experiments because they
provide suitable nutrition for bivalve larvae undergoing metamorphosis, they support
high growth rates in developing oyster spat (Enright et al. 1986; Utting et al. 1986;
Jonsson et al. 1990; Wikfors et al. 1996), and consistent supplies are available at
HPL. Aliquots of densely-cultured CHGRA and PLY 429 (grown in a salinity of 12)
were placed in beakers of five treatment salinities; S-5, S-7, S-11.4 (ambient), S-25
and S-35. Samples from each salinity treatment were examined under a microscope
every half hour for a period of three hours to monitor cell activity and cell lysis. At
the end of the three-hour exposure, the only observed difference in the condition of
the cells across all salinity treatments was an approximate 15% increase of lysed PLY
429 cells within the S-5 treatment. Despite this minor change, the two algae species
demonstrated the ability to withstanding large changes in salinity and were deemed
appropriate for their use within subsequent settlement experiments.
Another preliminary trial was conducted to determine the lower salinity limit
that larvae from HPL could settle and to evaluate the practicality of including salinity
treatments greater than 25 or 30 within future experiments. Approximately 400 eyed
larvae were placed within duplicate Pyrex® beakers filled with 250mL of six low
salinities (S-0, S-1, S-2, S-3, S-4, S-5), a control salinity of 10.5 (ambient river
12
water), and 4 higher salinities (S-25, S-27.5, S-30, and S-32.5). The protocols
employed for salinity adjustment, aeration, temperature control, and feeding were the
same as all subsequent settlement experiments described later in this section. Each
beaker was examined under a dissecting scope once every 24 hours over a four-day
period to observe larval activity and presence of settlers. Results from this
preliminary experiment indicated that pediveliger larvae can adapt to a wider range of
salinities than was expected. Larvae successfully set in salinities as low as 3 (S-3),
many having exhibited metamorphosis and shell growth. (Two larvae were attached
to the beaker in treatment S-2 on the second day of the experiment, but those settlers
appeared to have died by Day 4.) Settlement increased as salinity increased up to the
ambient treatment of S-10.5, at which point there were no distinguishable differences
in settlement through S-30. Observed settlement success within these highest
salinities proved that it was necessary to include a treatment salinity of 35 within the
subsequent experiments.
The last preliminary experiment was designed to establish the larval size
selection protocols to be used for all subsequent experiments. At HPL, late-stage
larvae are graded by passing the larval cultures through a stack of metal sieves with
descending screen sizes. Normally, larvae retained on both the 212µm and 224µm
screen sizes display behavioral competence and are bundled for use in setting tanks. It
was therefore necessary to decide which larval size (based on sieve size) would be
most appropriate to use for the main settlement experiments. Using the methods of
the main experiments described in detail below, larvae from one HPL cohort retained
on the 212µm and 224µm screens were placed in a duplicate settlement array to
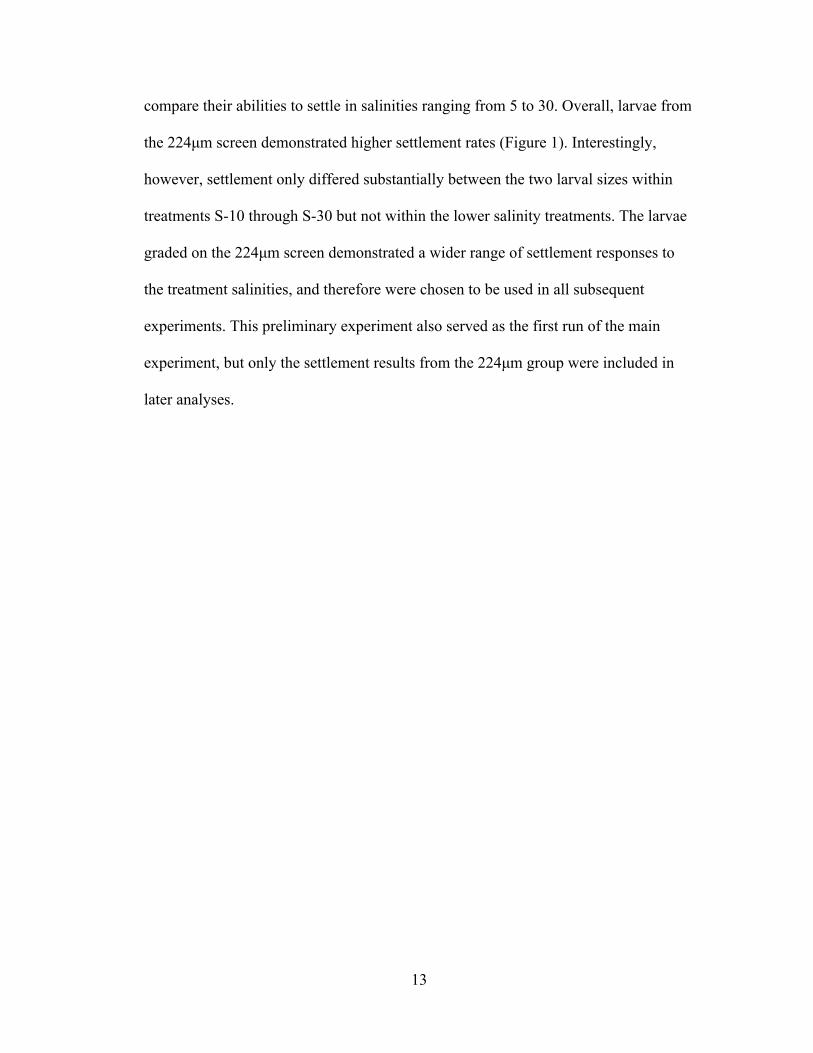
13
compare their abilities to settle in salinities ranging from 5 to 30. Overall, larvae from
the 224µm screen demonstrated higher settlement rates (Figure 1). Interestingly,
however, settlement only differed substantially between the two larval sizes within
treatments S-10 through S-30 but not within the lower salinity treatments. The larvae
graded on the 224µm screen demonstrated a wider range of settlement responses to
the treatment salinities, and therefore were chosen to be used in all subsequent
experiments. This preliminary experiment also served as the first run of the main
experiment, but only the settlement results from the 224µm group were included in
later analyses.

14
Figure 1. Settlement rates of HPL larvae graded on 212µm and 224µm sieve sizes. The median and the interquartile range (IQR) are displayed by the box, and maximum and minimum values are shown by the whiskers.

15
Main Experiments
Larval Sources and Selection Multiple spawns, or cohorts, of pediveliger oyster larvae from four hatcheries were
obtained between May and September of 2015 to be tested in independent settlement
experiments listed in Table 1. The larvae were categorized into three groups (Low,
Medium, and High) according to the salinity in which they were spawned and grown
in their respective hatchery. The Low salinity larvae originated from the HPL oyster
hatchery and were reared within an average salinity of 10. The Medium salinity
larvae, reared at the Aquaculture Genetics and Breeding Technology Center (ABC) at
the Virginia Institute of Marine Science (VIMS) oyster hatchery in Gloucester, VA,
experienced salinities ranging from 15 to 16.5. The High salinity larvae originated
from both the Cherrystone oyster hatchery in Cape Charles, VA and the Rutgers
Aquaculture Innovation Center in Cape May, NJ. These two hatcheries reared their
larvae at salinities averaging 22 and 27.5, respectively. All cohorts were composed of
diploid larvae spawned from parents using broodstock sources normally used within
their respective hatcheries. In Table 1, the term “Wild” broodstock indicates that
oysters were obtained from naturally occurring oyster reefs within the upper
Chesapeake Bay. The broodstock lines “DEBY,” “hANA,” and “NEHTM” are
products of multiple generations of oysters selected for performance in the presence
of oyster diseases within the Mid-Atlantic, described in further detail in Proestou et
al. (2016). As a generalization across all hatcheries, larvae were obtained for these
experiments when deemed competent. Competency was indicated when the vast
majority of larvae had eyespots and feet and demonstrated searching behavior under a
16
compound microscope. Each cohort was used within only one experiment repetition
(hereafter termed a “run”), but three of these cohorts were used in additional
experiments that examined either the effect of larval size selection protocols or the
ability for settlers to complete metamorphosis. The hatcheries provided between
100,000-500,000 larvae for each run. Prior to each run, competent larvae raised at
HPL were bundled in moist cloths or paper towels and refrigerated. For other
hatcheries, bundled larvae were shipped in coolers with gel packs and then
refrigerated at HPL. All larvae were refrigerated for a total of 1-3 days before being
introduced into the experimental array except for one Low salinity larval cohort that
was refrigerated for only 4 hours.
17
Table 1. Hatchery sources and ambient salinity conditions of the 13 cohorts of diploid C. virginica larvae used in each experimental run. Larvae were classified as Low, Medium, or High according to their salinity of origin. Superscript letters represent the three larval cohorts used for multiple experiments that tested larval size selection protocols (A) or metamorphic completion (B and C).
Hatchery
Larval Rearing Salinity
Larval Salinity Group
Experiment Start Date
Experiment Duration Broodstock
HPL 10 Low 5/1/15 4 WildA
HPL 10 Low 5/1/15 4 WildA
HPL 10 Low 5/27/15 4 WildB
HPL 10 Low 5/27/15 14 WildB
HPL 10 Low 6/11/15 4 Wild HPL 10 Low 7/10/15 4 Wild HPL 10 Low 7/20/15 4 Wild HPL 10 Low 8/15/15 4 DEBY HPL 10 Low 8/20/15 4 DEBY VIMS 16.5 Medium 6/16/15 4 DEBYC
VIMS 16.5 Medium 6/16/15 14 DEBYC
VIMS 15 Medium 7/24/15 4 hANA VIMS 15 Medium 7/28/16 4 hANA Cherrystone 22 High 6/30/15 4 DEBY Rutgers 27.5 High 6/22/15 4 NEH Rutgers 27.5 High 7/23/15 4 NEH
18
Preparation and Enumeration of Competent larvae
Immediately prior to the start of every experimental run, each bundle of larvae
was graded by size using on a 224µm stainless steel cloth sieve (W.S. Tyler) with
cold filtered water (~3˚C, < 2µm) from the Choptank River. The larvae that did not
pass through the sieve were placed in a 2-liter plastic pitcher filled with river water
that had been adjusted to match the salinity of their originating hatchery. (See Salinity
Adjustment section for details.) The pitcher was kept on ice to minimize larval
activity, which prevented larvae from exuding mucus and clumping together or
attaching to the beaker, ultimately enabling an evenly distributed larval suspension
when mixed (Vlahovich 2009). A perforated plunger was used to continuously mix
the solution while 1ml aliquots were pipetted onto to a Sedgewick-Rafter counting
chamber to determine the larval density of the pitcher. Each aliquot was preserved
using several drops of 10% formalin, and were counted using a compound
microscope (Olympus BX40) at 40x magnification. These samples were repeated
until the larval count from least five successive aliquots were within 10% of each
other. The stocking density was determined by multiplying the average of the larval
counts by the volume of water in the pitcher. Based on that estimate, a volume of
water containing approximately 1,000 larvae was distributed into sterilized 15ml
plastic vials. The vials were visually inspected to confirm that larvae were distributed
uniformly, and were monitored for a few minutes to verify that larval activity
increased as the water within the vials warmed to room temperature. Two additional
vials were preserved with formalin and later counted to confirm that the number of

19
larvae distributed to the vials was approximately 1,000. The average of the two
verification counts from all runs were within 5% of 1,000.
An additional sample of approximately 2,000 larvae was removed from the
iced pitcher to determine the size distribution of each cohort. Larvae were placed in a
200mL vessel, suspended in a BCI ISOTONII electrolyte solution by a stir bar, and
were measured using a Beckman Coulter Counter Multisizer 4. Three successive
samples of 600 larvae were analyzed, resulting in three independent size distribution
logs.
Salinity Adjustment
Water used for all experiments originated from the Choptank River in the
mesohaline portion of the Chesapeake Bay and was filtered to a particle size ≤ 1µm
by sand, charcoal, and string cartridge filters. The river water, which maintained a
salinity between 9.5 and 11 throughout the experimental period, was adjusted to one
of twelve salinity treatments ranging from 5 to 35 (Table 2).
Table 2. Salinity treatments tested within every experiment. An additional salinity treatment (larval salinity), was adjusted to match the larval rearing salinity of that cohort for each run..
5 6 7.5 9 11 13.5 16.5 20 25 30 35 Larval Salinity
Eleven consistent salinity treatments were accomplished for every
experimental run, while one salinity treatment was adjusted to match the salinity from
where the larvae originated (either 10, 15, 16.5, 22, or 27.5). The first nine salinity
values were chosen to maintain a consistent increase in the percentage of salt between
20
treatments (~ 22.5%). These salinity increments enabled a higher resolution of
treatment effects in lower salinities. Salinity treatments S-30 and S-35 were also
included as a result of the preliminary experiments. Deionized water (DI) was added
to decrease the salinity and Crystal Sea Marinemix® was added to increase the
salinity. Crystal Sea was chosen because of its record of successful use within the
HPL hatchery, and it is a recommended brand by the U.S Environmental Protection
Agency for salinity adjustment within toxicity tests (U.S. Environmental Protection
Agency 2002). The solutions for each salinity treatment were first mixed in a 30L
bucket before being distributed into replicate treatments within the experimental
array. Salinity was measured with a YSI Model 30 temperature and salinity probe that
had been calibrated before each experimental run.
Water samples from 3 different runs were analyzed to observe how the
addition of DI water and the Crystal Sea Marinemix® affected the carbonate
chemistry of the river water. Water samples (30ml) from all 12 salinity solutions were
retrieved from the 30L mixing bucket before the experiment started and preserved
with 1µl of HgCl2. A separate range of salinity solutions was made with only DI
water and Crystal Sea and were sampled in the same manner. Total alkalinity,
temperature, and pH (NBS scale) were measured using an SI Analytics TL 7750
automated titrator. Aragonite and calcite saturation coefficients (Ωar and Ωca) were
calculated with the CO2SYS program (http://cdiac.ornl.gov/ftp/co2sys/) in Excel
2007 using the equilibrium constants K1 and K2 from Millero (2010) and KSO4 from
Dickson (1990).
21
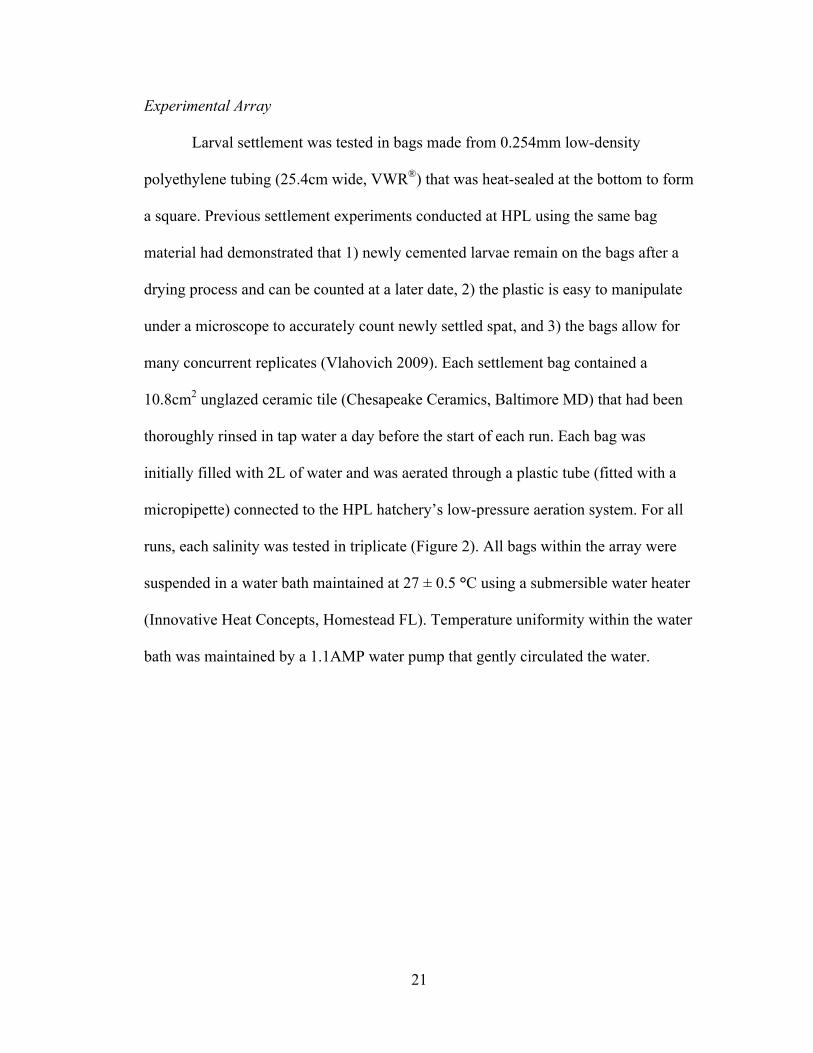
Experimental Array
Larval settlement was tested in bags made from 0.254mm low-density
polyethylene tubing (25.4cm wide, VWR®) that was heat-sealed at the bottom to form
a square. Previous settlement experiments conducted at HPL using the same bag
material had demonstrated that 1) newly cemented larvae remain on the bags after a
drying process and can be counted at a later date, 2) the plastic is easy to manipulate
under a microscope to accurately count newly settled spat, and 3) the bags allow for
many concurrent replicates (Vlahovich 2009). Each settlement bag contained a
10.8cm2 unglazed ceramic tile (Chesapeake Ceramics, Baltimore MD) that had been
thoroughly rinsed in tap water a day before the start of each run. Each bag was
initially filled with 2L of water and was aerated through a plastic tube (fitted with a
micropipette) connected to the HPL hatchery’s low-pressure aeration system. For all
runs, each salinity was tested in triplicate (Figure 2). All bags within the array were
suspended in a water bath maintained at 27 ± 0.5 °C using a submersible water heater
(Innovative Heat Concepts, Homestead FL). Temperature uniformity within the water
bath was maintained by a 1.1AMP water pump that gently circulated the water.

22
Figure 2. Experimental array used for all settlement experiments. The settlement bags, filled with aerated, salinity-adjusted water, contained a ceramic tile, and were suspended in a temperature-controlled water bath.
23
Experimental Protocol: 4-Day Experiments
At the beginning of each “4-Day” run, 1,000 larvae were placed within each
settlement bag filled with 2 liters of salinity-adjusted water. A mixture of algae was
added to the bags once daily for 4 days. The first two algae additions consisted of
75,000 cells ml-1 of Chaetoceros muelleri (strain CHGRA, 70%) and Tetraselmis chui
(strain PLY 429, 30%) given at the beginning of the experiment and again
approximately 24 hours later. Salinity within all treatments was measured again on
Day 2 (approximately 48 hours after beginning the experiment) and an additional 2
liters of water was added to each bag to maintain water quality and to adjust for any
changes in salinity due to algae additions or evaporation. The approximate volume of
algae added on Day 2 and 3 of the experiment remained the same as the prior two
additions, but because the water volume had been doubled, the resulting density of
algae was 37,500 cells ml-1 in the same proportions of CHGRA (70%) and PLY 429
(30%).
Upon completion of the 4-Day experiments (approximately 96 hours after
larvae were added to the settlement bags), salinity was once again measured to
confirm integrity of salinity in the trial. All runs remained within the salinity
tolerances of the experiment. The tiles were removed from the settlement bags and
placed on a rack to dry. Each bag was gently rinsed with water and hung upside down
to dry. After at least one day on the drying rack, settlers were counted under 10x
magnification using an Olympus S2X16 dissecting microscope. No distinction was
attempted to identify recently attached settlers versus those that had settled and
24
metamorphosed. Settlement counts were summed from both the tile and bag to
determine the setting rate for each replicate using the formula:
!"#$% !"##$"%"&#!,!!! !"#$"%
×100 = Setting Rate (%).
Experimental Protocol: 14-Day Experiments
Recognizing that no differentiation was made between recently attached settlers and
fully metamorphosed juveniles within the 4-Day experiments, two longer-term
experiments were conducted to observe if settlers were capable of undergoing
metamorphosis across all salinity treatments. These “14-Day” experiments began
simultaneously with two runs of the 4-Day experiments, using extra larvae provided
with one Low salinity cohort and one Medium salinity cohort (Table 1). The 14-Day
experiment was essentially an exact duplicate of the 4-Day experiment, starting at the
same time and including the same triplicate salinity treatments. Immediately after the
conclusion of the paired 4-Day experiment, water was emptied from the 14-Day
settlement bags to remove any live or dead larvae. The bags were then refilled with 4
liters of water adjusted to the appropriate salinity treatments and the same ration of
algae was provided daily (37.5 cells/ml of Chaetoceros muelleri (clone CHGRA,
70%) and Tetraselmis chui (clone PLY 429, 30%)). Complete water changes were
conducted every 3-4 days. On Day 14, the experiment was concluded with the same
rinsing and drying protocols employed for the 4-Day experiment. Unlike the newly
attached settlers, however, some of the larger juveniles became dislodged from the
bag during the rinsing process. Therefore the rinsing water was poured over a 110µm
screen to capture any dislodged spat. The number of dislodged spat was added to the

25
bag and tile settlement tallies in order to calculate the total setting rate for each
replicate.
After all tiles had been counted, the upper sides of the tiles were photographed
to analyze spat growth within the different salinity treatments. The camera was
mounted approximately 0.5m above the tile and a ruler was mounted next to the tile
to calibrate the digital measurement tools within the image software Adobe Illustrator
CC (version 14.2, 2013). Shell heights were measured as the distance between the
umbo and the edge of the shell at the point of bisection. All shell heights (up to the
maximum of 10) were recorded from each settlement tile. If the spat set on a
particular tile was heavy, the tile was divided into 4 quadrants and the 2 spat closest
to the center of the 4 quadrants and the center of the tile itself were measured.
Statistical Analysis
Effects of the 11 salinity treatments and the possible interaction with different
larval salinity groups on settlement were examined using a linear mixed-effect model
(lmer) with a weighted variance structure. The statistical model is:
Yijkl= αi + βj + αβij + γk + εl(ijk)
where ửi represents the 11 repeated salinity treatments, βj represents the 3 larvae
salinity groups, αβij is the salinity treatment by larval salinity interaction, γk is the
“cohort effect,” and εl(ijk) is the error. The treatment salinities and larval salinity
groups were modeled as fixed categorical factors. Because each larval cohort varies
from one another even from the same hatchery (due to differences in gamete quality,
algae cultures, water quality, competency, etc), there were differences in overall
settlement performance for each repetition of the experiment. Therefore a random
26
factor representing the differences for each repetition, called “cohort effect,” was also
included within the statistical model. This enabled multiple experiments to be
analyzed simultaneously with the a priori prediction that differences between larval
batches would affect the overall settlement rates without changing the nature of
differences between treatment levels. The best variance structure, as determined by
comparing the Akaike Information Criterion (AIC) values of multiple models, was
used to address the heterogeneity of variances by allowing different variances for
each repetition (Zuur et al. 2009).
A two-way analysis of variance (ANOVA) was performed to test the null
hypotheses that mean settlement rates across all salinities were equal, and to test if
differences between the means were affected by the larval salinity group. Similarly,
two-way ANOVAs were used to test the null hypothesis that there were no
differences between the settlement rates of the different sized larvae of the first
experimental cohort as well as differences between the 4-day and 14-day settlement
rates across all salinity treatments.
Settlement results within each larval salinity group were individually
examined using the same model described above, but excluded the larval salinity
group or interaction terms. A one-way ANOVA was used to identify if there
differences in settlement rates between salinity treatments. Afterwards, a Tukey's
HSD (honest significant difference) test was performed to determine between which
salinities the settlement rates were significantly different. Differences in spat lengths
between salinity treatments from the 14-Day experiments were also analyzed in this

27
manner. All ANOVA calculations, tables, and figures were made using the statistical
software R (2015).
Although traditional null-hypothesis testing is still the gold standard to
identify treatment effects, recent scientific literature has emphasized the importance
of describing the direction and magnitude of treatment effects even if there are no
statistical differences between means (Nagawa and Cuthill 2007; Halsey et al. 2015).
Effect size statistics are therefore increasingly being employed to assess differences
between treatment results. For this study, effect sizes were calculated to illustrate how
larvae performed in each salinity treatment relative to how they performed within
their native salinity (acting as the “control”). The effect size for each salinity
treatment within each cohort was calculated as a logarithmic response ratio (LnRR)
using the following formula:
𝑅 = !!"#$%&#'%!!"#$%"&
; ln 𝑅 = 𝐿 = 𝐿𝑛 𝑋!"#$%&#'% − (ln (𝑋!"#$%"&) .
A meta-analysis could then be performed by combining the effect sizes across cohorts
within the same larval salinity group. Recognizing that effect size estimates within
each experiment differ in precision (standard error), one can assume that the more
precise estimate is closer to the true effect (Hedges et al. 1999). Therefore the
estimated effect sizes across experiments could likely be improved by weighting them
according to their variance, as detailed by Hedges et al. (1999). Effect size meta-
analysis was particularly relevant for this data set because it provided a way to
account for the variability between the overall performances of each cohort by
standardizing the magnitude of the effect of the salinity treatments across all runs.
28
The statistical software Metawin (Rosenberg et al. 1996) was used to calculate the
weighted effect sizes.
RESULTS
Salinities were maintained close to the designated treatment values throughout
the experiment duration (Table 3), particularly within all salinity treatments below S-
30. Salinities within treatments S-30 and S-35 varied the most, likely due to the daily
additions of lower-salinity algae. Occasionally, bag seals were breached, which
forced their removal from the experiment, therefore not all treatments contained three
replicates. Overall settlement performance from each cohort varied substantially but
appeared to have generally decreased as the larval season progressed (Figure 3).
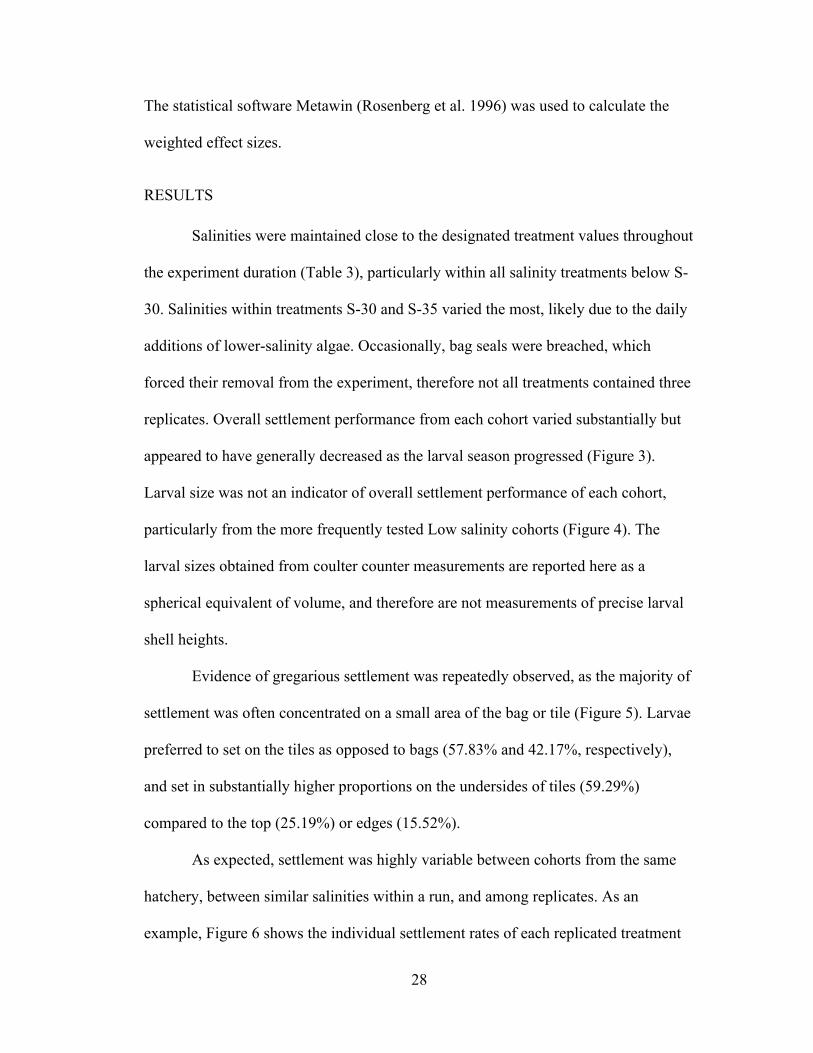
Larval size was not an indicator of overall settlement performance of each cohort,
particularly from the more frequently tested Low salinity cohorts (Figure 4). The
larval sizes obtained from coulter counter measurements are reported here as a
spherical equivalent of volume, and therefore are not measurements of precise larval
shell heights.
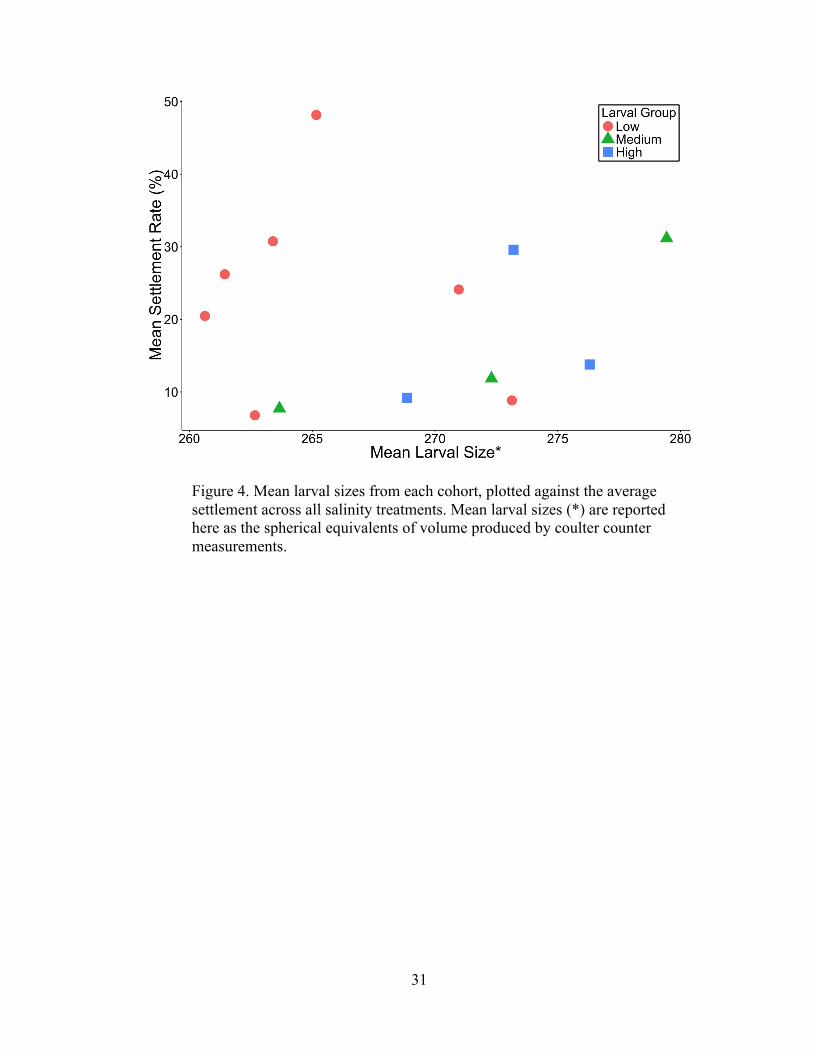
Evidence of gregarious settlement was repeatedly observed, as the majority of
settlement was often concentrated on a small area of the bag or tile (Figure 5). Larvae
preferred to set on the tiles as opposed to bags (57.83% and 42.17%, respectively),
and set in substantially higher proportions on the undersides of tiles (59.29%)
compared to the top (25.19%) or edges (15.52%).
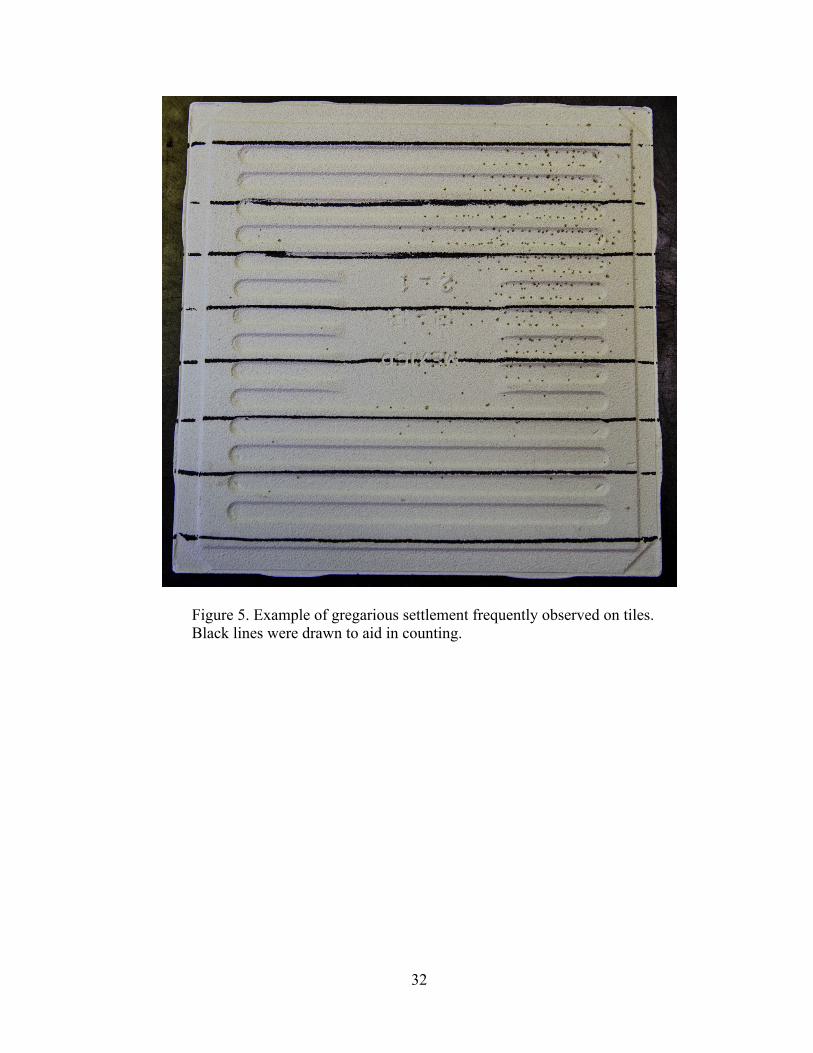
As expected, settlement was highly variable between cohorts from the same
hatchery, between similar salinities within a run, and among replicates. As an
example, Figure 6 shows the individual settlement rates of each replicated treatment

29
from one run of a High salinity larval cohort. Generally speaking across all cohorts,
as settlement averages increased, so did the variability. Despite this variability, clear
settlement patterns across the range of salinities from each larval salinity group
emerged.
Table 3. Maximum and minimum salinity values recorded for each salinity treatment throughout all measurements for across all repetitions. Salinities marked with (*) were only included in the experimental runs using larval cohorts reared within that salinity.
Salinity Treatment Salinity Range 5 5.0-5.4 6 6.0-6.4
7.5 6.9-8.0 9 8.8-9.3
10* 9.7-10.4 11 10.7-11.6
13.5 13.0-14.0 15* 14.8-15.116.5 16.2-17.0 20 18.4-20.4 22* 21.4-22.3 25 24.1-25.2
27.5* 27.3-27.6 30 28.9-30.5 35 33.2-36.0

30
Figure 3. Mean settlement rate (across all salinity treatments) of each cohort from all three larval groups.
31
Figure 4. Mean larval sizes from each cohort, plotted against the average settlement across all salinity treatments. Mean larval sizes (*) are reported here as the spherical equivalents of volume produced by coulter counter measurements.
32
Figure 5. Example of gregarious settlement frequently observed on tiles. Black lines were drawn to aid in counting.
33
Figure 6. Example of settlement variability between replicates from one High salinity larval cohort.
34
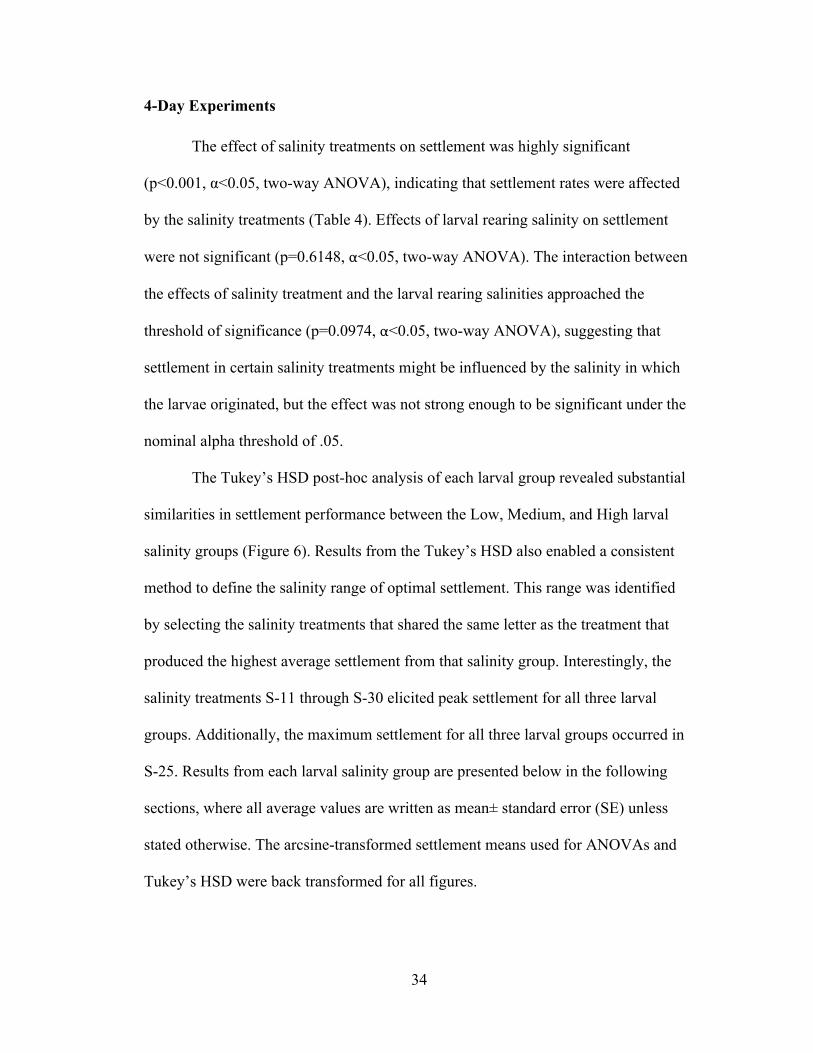
4-Day Experiments
The effect of salinity treatments on settlement was highly significant
(p<0.001, α<0.05, two-way ANOVA), indicating that settlement rates were affected
by the salinity treatments (Table 4). Effects of larval rearing salinity on settlement
were not significant (p=0.6148, α<0.05, two-way ANOVA). The interaction between
the effects of salinity treatment and the larval rearing salinities approached the
threshold of significance (p=0.0974, α<0.05, two-way ANOVA), suggesting that
settlement in certain salinity treatments might be influenced by the salinity in which
the larvae originated, but the effect was not strong enough to be significant under the
nominal alpha threshold of .05.
The Tukey’s HSD post-hoc analysis of each larval group revealed substantial
similarities in settlement performance between the Low, Medium, and High larval
salinity groups (Figure 6). Results from the Tukey’s HSD also enabled a consistent
method to define the salinity range of optimal settlement. This range was identified
by selecting the salinity treatments that shared the same letter as the treatment that
produced the highest average settlement from that salinity group. Interestingly, the
salinity treatments S-11 through S-30 elicited peak settlement for all three larval
groups. Additionally, the maximum settlement for all three larval groups occurred in
S-25. Results from each larval salinity group are presented below in the following
sections, where all average values are written as mean± standard error (SE) unless
stated otherwise. The arcsine-transformed settlement means used for ANOVAs and
Tukey’s HSD were back transformed for all figures.
35
Table 4.Two-way ANOVA results of the effects of salinity treatment and hatchery salinity on larval settlement. Significant p-values (α=.05) are shown in bold.
Source Df F-value P-value Salinity Treatment 10 25.60602 <.0001 Larval Salinity Group 2 0.51099 0.6148 Salinity X Hatchery 30 1.44667 0.0974
Table 5. One-way ANOVA of settlement from Low salinity larval cohorts (rearing salinity of 9.8 to 10.6) across all salinity treatments. Significant p-values (α≤.05) are shown in bold.
Source df Den df F-value P-value Salinity treatment 10 207 8.05196 <.0001
Table 6. One-way ANOVA of settlement from Medium salinity larval cohorts (rearing salinity of 15 and 16.5) across all salinity treatments. Significant p-values (α≤.05) are shown in bold.
Source df Den df F-value P-value Salinity treatment 10 84 9.297656 <.0001
Table 7. One-way ANOVA of settlement from High salinity larval cohorts (rearing salinity of 22 and 27.5) across all salinity treatments. Significant p-values (α≤.05) are shown in bold.
Source df Den df F-value P-value Salinity treatment 10 85 12.64338 <.0001
36
Figure 7. Settlement of Low (A), Medium (B) and High (C) salinity larval cohorts across the 11 consistent salinity treatments. Similar letters above the treatments indicate no significant differences in settlement, and the range of optimal settlement is highlighted in salmon. The median and the interquartile range (IQR) are displayed by the box, and maximum and minimum values are shown by the whiskers. Suspected outliers (defined as 1.5 x IQR) are displayed as open circles.

37
Low Salinity Larvae
A total of 7 larval cohorts were tested within the Low salinity group,
originating from one hatchery that reared the larvae within salinities ranging from 9.8
to 11.2 during the experimental time frame. Because of this relatively small variation,
the “control” treatment salinity tested to match the rearing salinity was always set at
10 (to be used for effect size calculations, described later in this section). Due to the
high number of experiments and the variability among cohorts, the interquartile range
across many of the salinities was large (Figure 6). For instance, the mean settlement
across all salinities for one cohort was as low as 6.79%, while the cohort with the
highest mean settlement was 48.16% (Figure 3). Overall, the mean settlement across
all salinities for all runs was 23.51%. On average, the highest settlement occurred
within S-25 (39.37±6.37%) and least in S-35 (11.32±2.52%). The mean settlement in
the lowest salinity treatment (S-5) was 17.22±4.11%, which was higher than S-6 and
S-7 (10.13±1.7% and 16.48±3.84%, respectively). Although the average settlement
for S-5 was higher than for S-6 and S-7.5, the median settlement increased from 8.2%
in S-5, to 9.9% and 9.8% in S-6 and S-7, indicating that a few high outlier settlement
counts within S-5 are responsible for a higher mean within that treatment (Figure 6).
The optimal salinity range was from S-11 (21.32±4.77%) to S-30 (23.16±4.51%).
Medium Salinity Larvae
The larvae within the Medium salinity group, tested across three replicate
experiments, were obtained from one hatchery with salinity of 16.5 for one cohort
and a salinity of 15 for another two. The average settlement rate across all salinities
for all 3 replicates was 17.21%, ranging from the lowest average settlement of 7.3%
38
from one cohort to the highest of 31.85% from another. As seen with all salinity
groups, on average the highest settlement occurred in S-25 (32.9±6.96%), and the
salinity range of optimal settlement was from S-11 (18.59±6.65 %) to S-30
(17.85±6.81%) (). Settlement within S-25 was only slightly higher than settlement in
the ambient salinity for the larvae of 16.5 (32.67±10.99%). The least amount of
settlement occurred in the lowest salinity treatment, S-5 (4.54± 1.57%).
High Salinity Larvae
The three cohorts tested within the High salinity group originated from two
hatcheries. One cohort was reared in a salinity of 22, and the other two cohorts were
reared in salinity 27.5. The average settlement across all salinities for the High
salinity larvae was 16.89%, ranging from the highest average of 28.34% from the
cohort reared in a salinity of 22, to the lowest average of 9.19% with larvae reared in
a salinity of 27.5. Although there was a relatively large difference in overall
performance between cohorts from these two hatcheries, the patterns of settlement
across salinity treatments closely mirrored each other. As with the Medium salinity
larvae, the lowest settlement occurred in S-5 (2.39± .74%), and similar to the Low
and Medium larval groups, the highest settlement occurred within S-25 (25.28 ±
9.18%) (Figure 6). Unlike the other two larval groups, however, settlement within S-
35 was statistically higher than settlement within the lowest salinities S-5 and S-6.
Differences in how the larval groups performed within the salinity extremes are
illustrated more clearly with treatment effect sizes, described below.
39
Effect Size Analysis
Calculations of mean log response ratios (LnRR) revealed how each cohort
performed within each salinity treatment relative to how they performed within their
native, or “control,” salinity during each repetition. Hence the LnRR, or effect size,
for each larval group at their native salinity is equal to 0, and an increase or decrease
in settlement performance is indicated by a positive or negative LnRR, respectively.
The majority of the effect sizes were negative, indicating that the highest settlement
rates occurred within the salinity treatment that matched the originating hatchery
(Figure 7). The exception to that trend is seen only from the Low salinity larvae,
which demonstrated higher settlement in S-13.5 through S-25 than within its native
salinity of 10. However, the magnitude of the effect sizes between S-11 and S-30 for
all 3 larval salinity groups were not profound, which is consistent with the results
from Tukey’s mean comparison tests (Figure 6).
The effect sizes outside of the optimal setting salinities (S-11 to S-30) became
increasingly negative for all larval groups, but not in an equal manner for each larval
group. The largest negative effects (which indicate the lowest settlement relative to
their native salinity) occurred in salinity treatments S-5 and S-6 only for the Medium
and High larval groups. In contrast, the negative effects on settlement within those
salinity treatments were not as severe for the Low salinity larvae, indicating that the
Low larval group could settle comparatively better within the lower salinities. The
opposite is true within the highest salinity treatment, S-35, which produced the largest
negative effect for Low salinity larvae, but did not induce a large decrease in
settlement for the High salinity larvae.

40
Figure 8. Mean Logarithmic Response Ratios (LnRRs), for each larval group across the 11 consistent salinity treatments. Symbols indicate the weighted mean, while the intersecting bars display the range of maximum and minimum LnRRs calculated for each cohort within the larval group. Negative LnRRs indicate reduced settlement compared to settlement within its native salinity.

41
14-Day Experiments Metamorphosis and Post-settlement Survivorship
The 14-Day experiments examined the survivorship of settlers from two
cohorts after the 4-Day settlement period and indicated that settlers within all salinity
treatments were capable of metamorphic completion and subsequent juvenile growth.
Differences in numbers of settlers between the 4-Day and 14-Day groups were
analyzed statistically with two-way ANOVA testing (Tables 8, 9, and 10) and are
illustrated by boxplots of settlement counts (Figures 8 and 9). As expected, settlement
was significantly affected by salinity for both larval groups (p<0.001, α<0.05; two-
way ANOVA). Differences in settlement between the 4-day group and the 14-day
group approached the significance threshold for the Low salinity larvae (p=.0634,
α<0.05; two-way ANOVA), but were non-significant for the Medium salinity larvae
(p=0.1273, p<0.05, two-way ANOVA). Interactions between treatment salinities and
experiment duration were non-significant for both the Low salinity larvae
(p=0.18515, α<0.05; two-way ANOVA) and the Medium salinity larvae (p=0.9766,
p<0.05; two-way ANOVA). Figures 8 and 9 illustrate that with few exceptions,
settlement rates within the 14-Day groups closely mirrored the settlement rates within
the 4-Day groups for both larval cohorts. The only notable divergence between the 4-
Day settlement rates and the 14-Day settlement and survivorship counts occurred
with Low salinity larvae in the higher salinity treatments. Indeed, as Tables 8 and 9
demonstrate, a primary driver of the statistical differences is the divergence of
settlement means in the treatment S-25. Although the means between the two
settlement results at S-25 are quite different (62.95% and 25.17%), one replicate from

42
the 14-day study contained a settlement and survivorship rate of 59.9%. Therefore,
despite the differences in means, it was proven that settlers were physiologically
capable of fully metamorphosing and growing in that salinity.
Table 8. Two-way ANOVA results of the effects of salinity treatment and experiment duration on settlement and survivorship of Low salinity larvae. Significant p-values (α=.05) are shown in bold.
Source Df F-value P-value Salinity Treatment 11 6.1478 <.0001 Experiment Duration 1 3.6080 0.06392 Salinity X Duration 11 1.4488 0.18515
Table 9. Two-way ANOVA results of the effects of salinity treatment and experiment duration on settlement and survivorship of Low salinity larvae, excluding salinity treatment (S-25). Significant p-values (α=.05) are shown in bold.
Source Df F-value P-value Salinity Treatment 11 6.7110 <.0001 Experiment Duration 1 1.3448 0.2527 Salinity X Duration 11 0.7937 0.6349
Table 10. Two-way ANOVA results of the effects of salinity treatment and experiment duration on settlement and survivorship of Medium salinity larvae. Significant p-values (α=.05) are shown in bold.
Source Df F-value P-value Salinity Treatment 11 13.5677 <.0001 Experiment Duration 1 2.4102 0.1273 Salinity X Duration 11 0.3238 0.9766
43
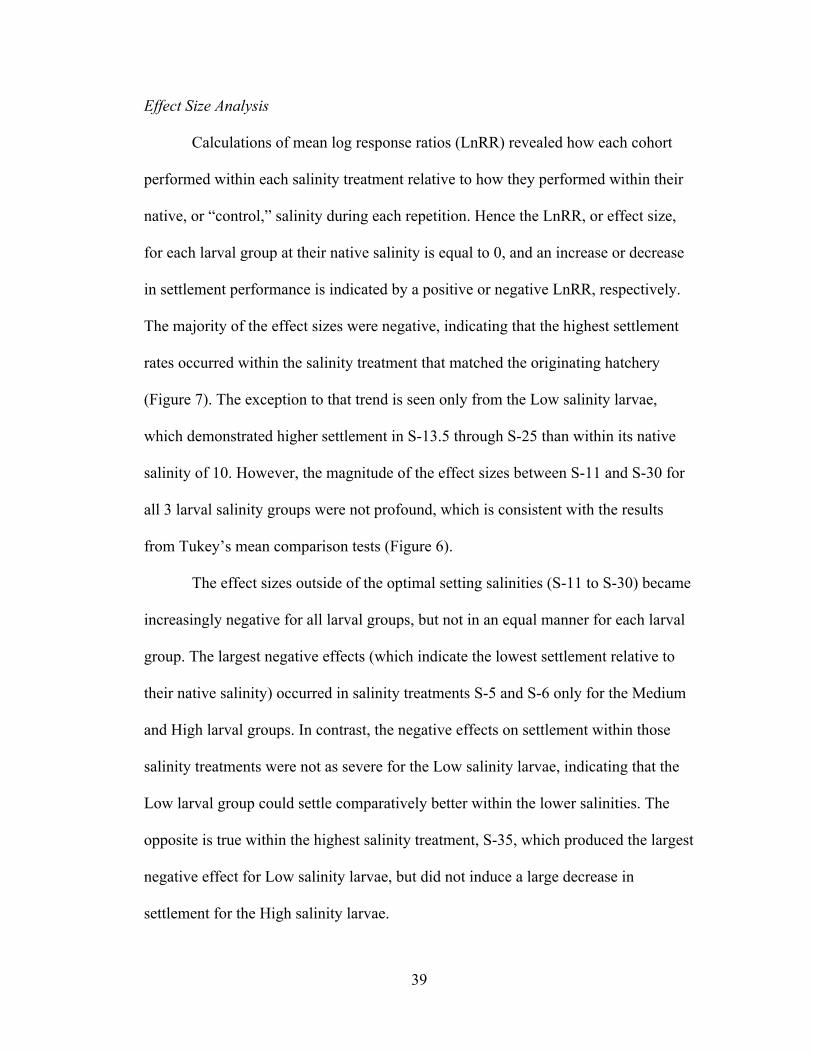
Figure 9. Comparison of Low salinity larvae given 4 days to set (4-Days) with another group given 4 days to set and 10 days to grow (14-Days). The median and the interquartile range (IQR) are displayed by the box, and maximum and minimum values are shown by the whiskers.
44
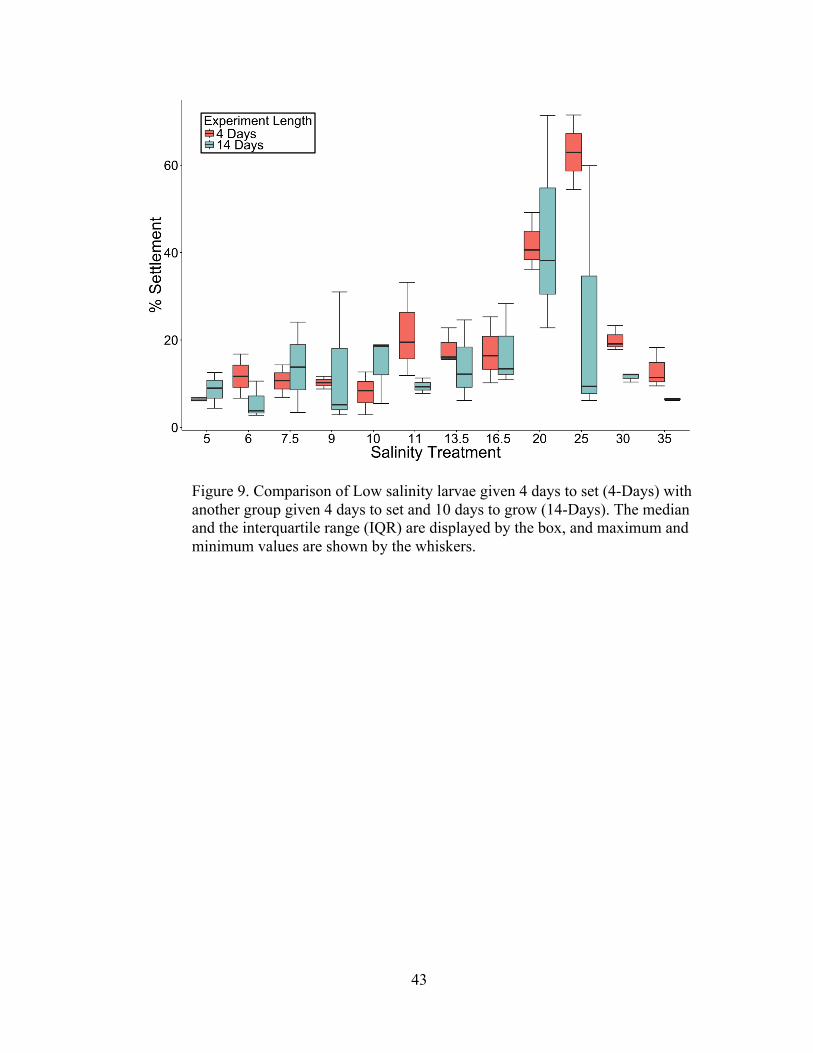
Figure 10. Comparison of Medium salinity larvae given 4 days to set (4-Days) with another group given 4 days to set and 10 days to grow (14-Days). The median and the interquartile range (IQR) are displayed by the box, and maximum and minimum values are shown by the whiskers.
45
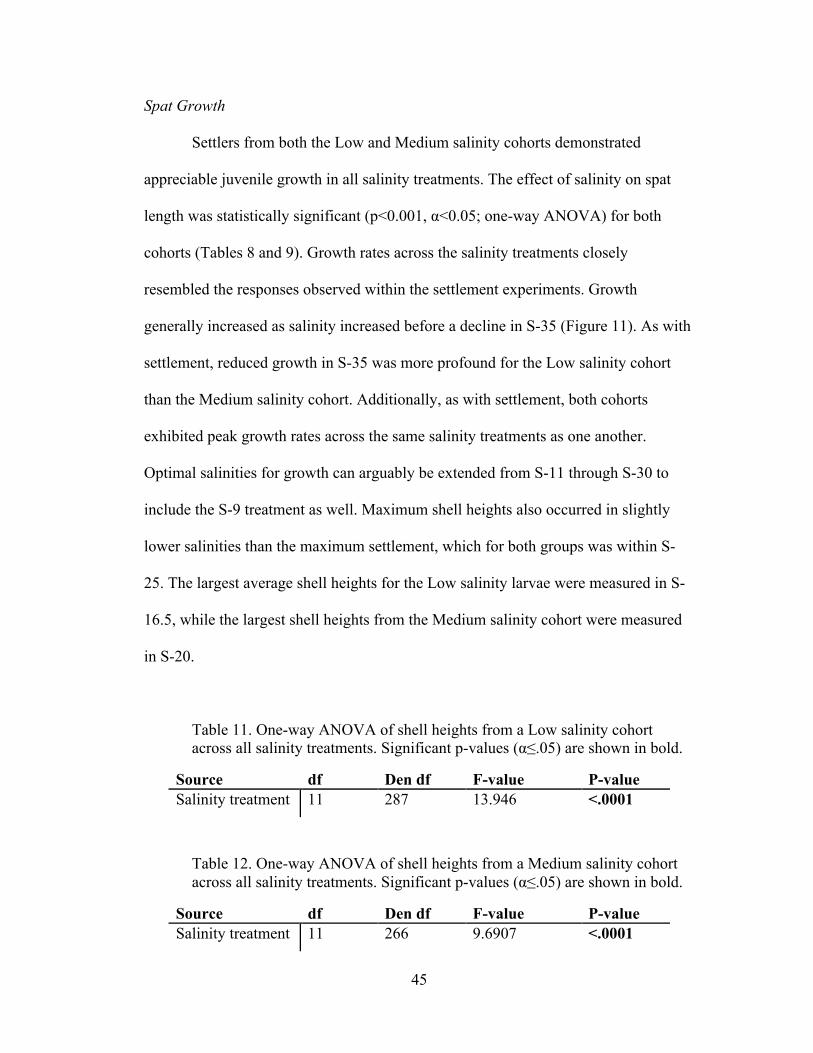
Spat Growth
Settlers from both the Low and Medium salinity cohorts demonstrated
appreciable juvenile growth in all salinity treatments. The effect of salinity on spat
length was statistically significant (p<0.001, α<0.05; one-way ANOVA) for both
cohorts (Tables 8 and 9). Growth rates across the salinity treatments closely
resembled the responses observed within the settlement experiments. Growth
generally increased as salinity increased before a decline in S-35 (Figure 11). As with
settlement, reduced growth in S-35 was more profound for the Low salinity cohort
than the Medium salinity cohort. Additionally, as with settlement, both cohorts
exhibited peak growth rates across the same salinity treatments as one another.
Optimal salinities for growth can arguably be extended from S-11 through S-30 to
include the S-9 treatment as well. Maximum shell heights also occurred in slightly
lower salinities than the maximum settlement, which for both groups was within S-
25. The largest average shell heights for the Low salinity larvae were measured in S-
16.5, while the largest shell heights from the Medium salinity cohort were measured
in S-20.
Table 11. One-way ANOVA of shell heights from a Low salinity cohort across all salinity treatments. Significant p-values (α≤.05) are shown in bold.
Source df Den df F-value P-value Salinity treatment 11 287 13.946 <.0001
Table 12. One-way ANOVA of shell heights from a Medium salinity cohort across all salinity treatments. Significant p-values (α≤.05) are shown in bold.
Source df Den df F-value P-value Salinity treatment 11 266 9.6907 <.0001

46
Figure 11. Juvenile Shell heights from Low salinity larvae (A) and Medium salinity larvae (B) after a 14-day period of settlement and growth. Similar letters above the boxplot indicate no significant differences in settlement among salinities. The median and the interquartile range (IQR) are displayed by the box, and maximum and minimum values are shown by the whiskers. Suspected outliers (defined as 1.5 x IQR) are displayed as open circles.
47
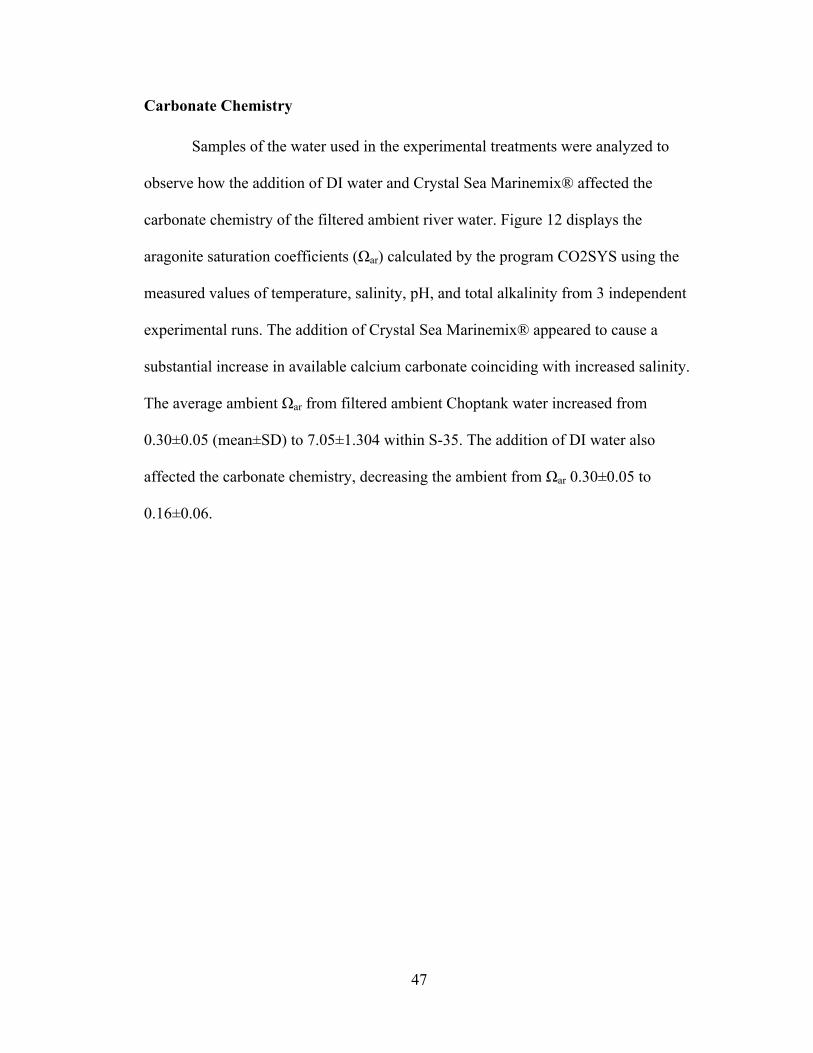
Carbonate Chemistry
Samples of the water used in the experimental treatments were analyzed to
observe how the addition of DI water and Crystal Sea Marinemix® affected the
carbonate chemistry of the filtered ambient river water. Figure 12 displays the
aragonite saturation coefficients (Ωar) calculated by the program CO2SYS using the
measured values of temperature, salinity, pH, and total alkalinity from 3 independent
experimental runs. The addition of Crystal Sea Marinemix® appeared to cause a
substantial increase in available calcium carbonate coinciding with increased salinity.
The average ambient Ωar from filtered ambient Choptank water increased from
0.30±0.05 (mean±SD) to 7.05±1.304 within S-35. The addition of DI water also
affected the carbonate chemistry, decreasing the ambient from Ωar 0.30±0.05 to
0.16±0.06.
48
Figure 12. Aragonite saturation coefficients (Ωar) of all salinity treatments measured at the start of 3 experimental runs.

49
DISCUSSION
Salinity Adaptation During Settlement and Metamorphosis
Results from this study illuminate the impressive capabilities of C. virginica
to adapt to a wide range in salinity conditions during settlement and metamorphosis.
While the responses to salinity stress in bivalves have been shown to be less severe if
the salinity is changed gradually (Davis and Calabrese 1964; Hand and Stickle 1977;
Pierce et al. 1992; Yuan et al. 2010), this study shows that eyed larvae are capable of
tolerating changes in salinity of 20 or more without stepwise acclimation. In fact,
larvae were able to settle in greater proportions and in more extreme salinities than
described in prior research. Results from the preliminary experiments show that
settlement and metamorphosis can occur in salinity as low as 3, and larvae from all
cohorts consistently demonstrated settlement in all salinity treatments ranging from S-
5 to S-35. Furthermore, the experiments extended to 14 days confirmed that the
observed settlement rates after 4 days were also indicative of the number of larvae
capable of undergoing metamorphosis and demonstrating juvenile growth in the
tested salinities.
Although C. virginica is a species that normally lives in salinities from 5 to 40
(Shumway 1996), researchers have seen 100% larval and adult mortality following
exposure to smaller salinity changes than what the pediveligers experienced in this
study (Loosanoff 1953; Davis 1958; Davis and Calabrese 1964; Anderson and
Anderson 1974; Pierce et al. 1992). Therefore it is indeed surprising that larvae from
all cohorts could demonstrate such resilience to osmotic shock during this transitional
phase of their life. One might expect the added physiological stress of a salinity

50
change would severely impair their ability to complete the energetically expensive
processes of settlement and metamorphosis. On the other hand, it is understandable
that settling larvae have developed mechanisms enabling them to adapt to a variety of
conditions on the benthos that may differ from the water column. Unfortunately, very
little research has investigated the behavioral responses, cellular processes, or the
genetic controls of osmoregulation during oyster settlement and metamorphosis. It is
currently unknown if pediveligers have an increased capacity to regulate intercellular
ionic concentration during settlement, or if and for how long they can buffer
themselves from salinity shock by closing their valves. Although inhalent and
exhalent currents have been observed through nearly all the stages of settlement and
metamorphosis (Baker and Mann 1994b), pediveligers and newly-settled juveniles are
capable of anaerobic metabolism in stressful conditions like hypoxia and anoxia
(Baker and Mann 1992), and therefore could potentially remain closed for a period of
time when initially placed in the settlement chamber. This study did not investigate
whether the unsuccessful larvae within the salinity extremes died immediately due to
salinity shock or if they were simply incapable of completing the behavioral process
of searching for and cementing themselves to a substrate. Whether or not the larvae
could maintain an osmotic barrier while they acclimated to the new salinity, it is clear
that a surprisingly high percentage of larvae from all cohorts were eventually able to
settle, osmoconform, and begin feeding and growing as juveniles. To my knowledge,
the only observations of settlement in different salinities were made by Prytherch
(1934), who noted that the process of cementation during settlement is substantially
51
slower in salinities less than 9 and above 29 due to reduced functioning of their byssal
gland in salinity extremes.
A notable downfall of previous settlement experiments that have attempted to
characterize the physiological tolerances and adaptive capabilities of larvae is the use
of broodstock and larvae conditioned and reared in only one location. Research has
shown that tolerance of C. virginica to extreme salinities differs among geographic
regions (Davis 1958; Newkirk 1978; Pierce et al. 1992), therefore the use of only one
larval source ignores the possibility that successful settlement in salinity extremes
might be affected by the environment and genotype of its parents or by the
environment during larval development. Davis (1958) saw evidence of maternal
environment effects on early larval performance when he observed that optimal
salinity for egg development was substantially higher when gametogenesis occurred
in a salinity of 26 as opposed to 8.7. In a sense, the present study extends Davis’s
(1958) work to the next developmental stage, exploring if the salinity during
gametogenesis and larval development influences salinity tolerance during settlement.
The range of salinities for maximum settlement was the same for all larval groups (S-
11 to S-30), implying that maternal effects do not affect salinity tolerances during
settlement as much as they affect egg and larval development. These findings support
the theory that the performance of older larvae in different salinities is less influenced
from the environmental conditions during gametogenesis and spawning than younger
larvae (Newkirk et al. 1977). The similar optimal salinity range between larval groups
also suggests settlement preferences of the species as a whole falls within this range.
Not surprisingly, most (if not all) research on salinity and C. virginica has found that

52
optimal salinity for all biological processes exists somewhere between 14 and 28
(Shumway 1996). Additionally, adult oysters have been shown to rapidly conform to
salinities ranging from 10-30, and reach isosmotic conditions at the higher salinities
much more quickly than in lower salinities (Anderson and Anderson 1975). Spat
heights measured from both cohorts after the extended experiments further
emphasizes that C. virginica functions best within this approximate salinity range
(Figure 10).
Despite the consistent range of optimal setting salinities for all larval groups,
the effect size analysis shows that the “home-field advantage” of settlement is most
notable in the salinity extremes closest to their native salinity (Figure 7). For instance,
larvae reared in the lowest salinity had the highest settlement in the lower treatment
salinities (S-5 to S-9) relative to its native salinity than from all other larvae tested.
Similarly, the High salinity larvae showed better performance in the highest salinity
treatment (S-35). Previous studies that have explored the genotype-by-environment
effects on larvae and adults have also indicated that survival and growth is optimized
in the natal habitat over other environments (Newkirk et al., 1977; Newkirk 1978;
Proestou et al. 2016). Recognizing that the current study was not designed to control
for variations in broodstock lines and rearing conditions within each hatchery,
differences in settlement between larval groups cannot be solely attributed to their
rearing salinity. That being said, all selectively-bred oyster lines tested within these
experiments (NEH, DEBY and hANA) have been shown to have high growth rates
and low mortality within the Mid- Atlantic and are more successful in foreign
environments than other lines developed in New England (Proestou et al. 2016).
53
Further research should be conducted to more specifically control for broodstock
lineage when testing salinity tolerance during settlement.
As mentioned earlier, the observed adaptability of larvae to settle across a
wide range of salinities was also reflective of their ability to complete metamorphosis
and begin growing as juveniles. The lack of statistically significant differences
between the 4-Day and 14-Day groups indicates that the results from all the 4-Day
trials can reasonably represent the proportion of larvae that can successfully
metamorphose in the tested salinities. The only curious exception to that was seen in
S-30 and S-35 with the Low salinity larvae, having noticeably lower settlement
means in the 14-Day Group. However, one 14-Day replicate within S-25 contained a
comparably high settlement rate (60%) as the only two replicates in the 4-Day Group
(71% and 54%), indicating that just as high of a proportion of larvae are technically
capable of successful metamorphosis as they are of settlement. Additionally, the
reduced number of replicates within those particular treatments (as a result of bag
failures) prevents us from assuming that increased mortality in the higher salinity
treatments was a trend.
Shell heights measured after the 14-Day experiments further emphasized that
spat within the salinity extremes were capable of continued juvenile development.
Growth across all salinity treatments for both the Low and Medium salinity cohorts
was high, but as expected, differences between salinity treatments were statistically
significant (Tables 8 and 9). Reduced spat growth observed in lower salinities is
consistent with other literature indicating the same phenomenon with larvae, young
juveniles, and adults (Loosanoff 1953; Chanley 1958, Rybovich et al. 2016). The
54
incremental decreases in shell heights that occurred in treatments below S-9 and
above S-30 could be a result of; 1) later settlement (Collet et al. 1999), 2) slower
progression through settlement and metamorphosis (Prytherch 1934), 3) reduced
feeding rates (Loosanoff 1953), 4) decreased ability to assimilate nutrients, 5)
differences in spat density (Roegner 1991), or by 6) higher energy costs associated
with maintaining osmotic balance (Shumway 1996). That being said, the average
juvenile shell heights observed in this study, ranging from 2.17 ± 0.44mm to 4.38 ±
1.16mm (mean ± SD), were approximately equal to or substantially larger than shell
heights reported in other post-settlement growth studies of C. virginica regardless of
the salinity treatment (Osman et al. 1989; Osman and Abbe 1994; Roegner and Mann
1995; Brownlee et al. 2005). Even though the experimental design did not control for
settlement time or spat density, it is clear that juveniles in all salinity treatments were
successfully consuming the algae provided and were likely not food limited.
It is possible that the adaptive capabilities of pediveligers to different salinities
may depend on their level of competency at the time of introduction to the settlement
apparatus. As previously noted, Prytherch (1934) found that competent larvae could
settle in salinities as low as 5.6, while Davis (1958) found that larvae could only
survive to metamorphosis if in salinities in 10 or higher. Castagna and Chanley
(1973) hypothesized that the discrepancy between these two studies was due to
possible differences in salinities during gametogenesis, differences in genetics or
“physiologic races,” or by differences in particulates from various methods of
creating different salt concentrations. It seems, however, that publications have
incorrectly described the Davis (1958) study by suggesting that the larvae used were
55
reared “almost to setting stage” before exposure to different salinities (Loosanoff and
Davis 1963). In reality, Davis (1958) used larvae requiring an additional 8-11 days of
growth within the different salinity treatments before they reached competency.
Recognizing that older larvae can tolerate a wider range of salinities than younger
larvae (Davis 1958; Davis and Calabrese 1964, Loosanoff 1965; Davis and Ansell
1962; Lough 1975), it seems possible that the differences between the studies by
Prytherch’s (1934) and the Davis (1958) could be the result of testing salinity
tolerances at different points in larval development. Davis and Ansell (1962)
addressed the issue of larval competency when testing the effect of salinity on growth
and metamorphosis of the European flat oyster, Ostrea edulis. They concluded that if
larvae were reared in normal conditions until just before settlement, the larvae which
are truly ready for metamorphosis will do so and succeed in lower salinities than
those in which the larvae could survive if they needed to develop further. They also
noted that larvae within the low salinity treatments that failed to settle right away
would eventually die. Conversely, the larvae that did not immediately settle within
their preferred salinity range could continue to develop and eventually settle.
The question of larval competency and salinity tolerance was partially
investigated by the preliminary experiment examining the settlement rates of two size
classes from one cohort across all salinity treatments (Figure 1). Although the size of
competent larvae of the same oyster species can vary from one hatchery to another
(Figure 4) (Nosho and Chew 1991), and can vary by season or by brood within one
hatchery (Figure 3) (Vlahovich 2009), larger larvae are generally regarded to be more
competent than smaller larvae (Nosho and Chew 1991; Congrove 2008). Thus, even
56
though larvae from both size classes had eye-spots and actively searching feet, it was
predicted that the larger sized larvae were more competent and would set in greater
proportions. Interestingly, settlement rates in salinity treatments S-5 through S-9 were
surprisingly similar between the two groups of larvae (Figure 1). In contrast,
settlement differences between the two groups emerged in the optimal salinities of S-
10 through S-30, where the larger larvae set in significantly higher proportions than
the smaller larvae. Reasons for the divergence in settlement rates in only the optimal
salinities were not investigated, but it is possible that differences in their abilities to
respond to settlement cues could be a contributing factor. When testing the settlement
response of eastern oysters to ammonia, Fitt and Coon (1992) found that newly
competent larvae showed a weaker response to the stimulant than older larvae. If the
larger larvae within this experiment were more capable of sensing and/or responding
to the chemical cues that induce a gregarious settlement response, then either the
chemical cues within the sub-optimal salinities weren’t at high enough concentrations
to elicit the gregarious response, or the ability to respond to chemical cues is reduced
in sub-optimal salinities. Admittedly, further research is required to substantiate these
possible explanations.
Although this study was not conducted in the exact manner as previous
settlement studies, it appears that C. virginica has a wider range of optimal salinities
for settlement than other commonly cultured oyster species. Lund (1972) found that
the optimal salinity range for settlement of C. gigas pediveliger larvae was from 22-
34, which was later corroborated by Henderson (1983) who found peak settlement
occurring at a salinity of 30 and optimal range between 20 and 35. Davis and Ansell
57
(1962) tested how eyed larvae of O. edulis reared in salinity of 26-27 performed in
lower salinities and found the lower salinity limit for good growth and setting is about
22.5. Devakie and Ali (2000) tested C. iredalei settlement by methods similar to
Henderson (1983) in salinities from 5 to 30 and reported highest settlement at 20 and
proposed that the general optimum salinity range was between 14-24. Quite a few
more experiments have involved the salinity tolerances of other oyster species during
settlement, but like the Davis (1958) study, were designed to test larval growth and
survivorship until metamorphosis rather than the effects of salinity change at the time
of settlement. Langdon and Robinson (1996) reared D-stage C. ariakensis larvae at a
salinity of 20, then transferred them to salinities 15, 20, 25, 30 and 35. They found
that C. ariakensis larvae can grow and settle at salinities as low as 10, but grew and
set best in 15 and 20, and no settlement occurred at 35. O'Connor et al. (2015) studied
the effects of salinity on catecholamine‐induced metamorphosis of O. angasi and
found that settlement in salinities 30 and 35 was between 2 and 15 times higher than
in salinities 25 or 20. Recognizing that investigators test different salinity treatments
and employ different statistical methods to determine an “optimum” salinity range,
one cannot definitely claim that C. virginica is the most tolerant to salinity changes.
Nonetheless, it is clear that the eastern oyster is an excellent example of a euryhaline
species, capable of living within tidal estuaries that receive variable freshwater inputs
and is therefore tolerant of a wide range of salinities.
The extremely low carbonate availability within filtered ambient Choptank
River water and the lower salinity treatments (as determined by the calculated
aragonite saturation coefficient (Ωar)), highlights our lack of understanding of the

58
chemical interactions within low salinity estuaries and which chemical variables can
impact the biological processes of the species. Recently, much attention has been
focused on the influence of increasing pCO2 and decreasing pH on the larval
production of shellfish as a result of highly publicized hatchery failures of C. gigas in
the Pacific Northwest (Feely et al. 2012; Waldbusser et al. 2016). Using measured
pH, alkalinity, and temperature values, a calculated Ωar <1 indicates that the water is
undersaturated in terms of carbonate ions, which can lead to shell malformations and
subsequent mortality during early oyster larval development (Waldbusser et al. 2015).
In contrast, research conducted with C. gigas and M. mercenaria larvae has indicated
that Ωar >1 can lower the energetic cost of shell building, thus increasing the scope for
growth (Waldbusser et al. 2016; Miller and Waldbusser 2016). During the present
study, the calculated Ωar of the ambient river water used for the experiments was
regularly below Ωar =0.25, which is consistent with summertime Ωar values measured
at this facility (J. Alexander, UMCES, pers. comm.). The addition of DI water
generally made the river water further undersaturated in terms of carbonate ions,
while the addition of Crystal Sea Marinemix® greatly increased the saturation state
(Figure 12). It is unknown whether the low Ωar values in the low salinity treatments
were maintained through the duration of the experiment or if they negatively
impacted settlement. Equally, no evidence exists to suggest that supersaturated
conditions could negatively affect the biological processes of oysters. Research has
indicated that C. virginica larvae appear to be substantially less sensitive to high CO2
(and lower Ωar) than other US east coast bivalves such as hard clams (M. mercenaria)
and bay scallops (A. irradians). However, the few experiments that have tested

59
metamorphosis and juvenile growth of C. virginica have been conducted in
treatments with substantially higher salinities and Ωar values than the present study
(Talmage and Gobler 2009, 2010; Dickenson et al. 2012; Gobler and Talmage 2014;
Waldbusser 2016). It is nonetheless apparent that the species can adapt to low Ωar
values to some extent, as billions of C. virginica larvae have been successfully grown
and set in the HPL facility where these conditions normally exist .
It is also important to note that the accuracy of Ωar calculations is reduced in
low salinity waters. A possible source of error are pH measurements, as the
technology to accurately calibrate pH measurements in salinities less than 20 has not
yet emerged. The use of alkalinity measurements to estimate the total amount of
carbonate may also be misleading, particularly if a high amount of organic acids and
bases are present. Additionally, the program co2sys was developed for higher-salinity
waters and the chosen K1 and K2 constants may inaccurately characterize the true
carbonate availability within brackish waters (George Waldbusser, OSU, and A.
Dickson, Scripps UCSD, pers. comm.). Even if the calculated Ωar values of the low-
salinity treatments do not accurately reflect the true calcium carbonate availability, it
is clear that additions of both DI water and salt mix substantially altered the alkalinity
of the river water.
Alkalinity values measured from three sets of water samples from the
experiment, as well as the alkalinities of salinity solutions made only with DI water
and the salt mix, are displayed in Figure 13. Superimposed on the figure is the range
of naturally occurring alkalinity and associated salinity values measured within the
Chesapeake Bay (adapted from Waldbusser et al. 2013) and confirms that the
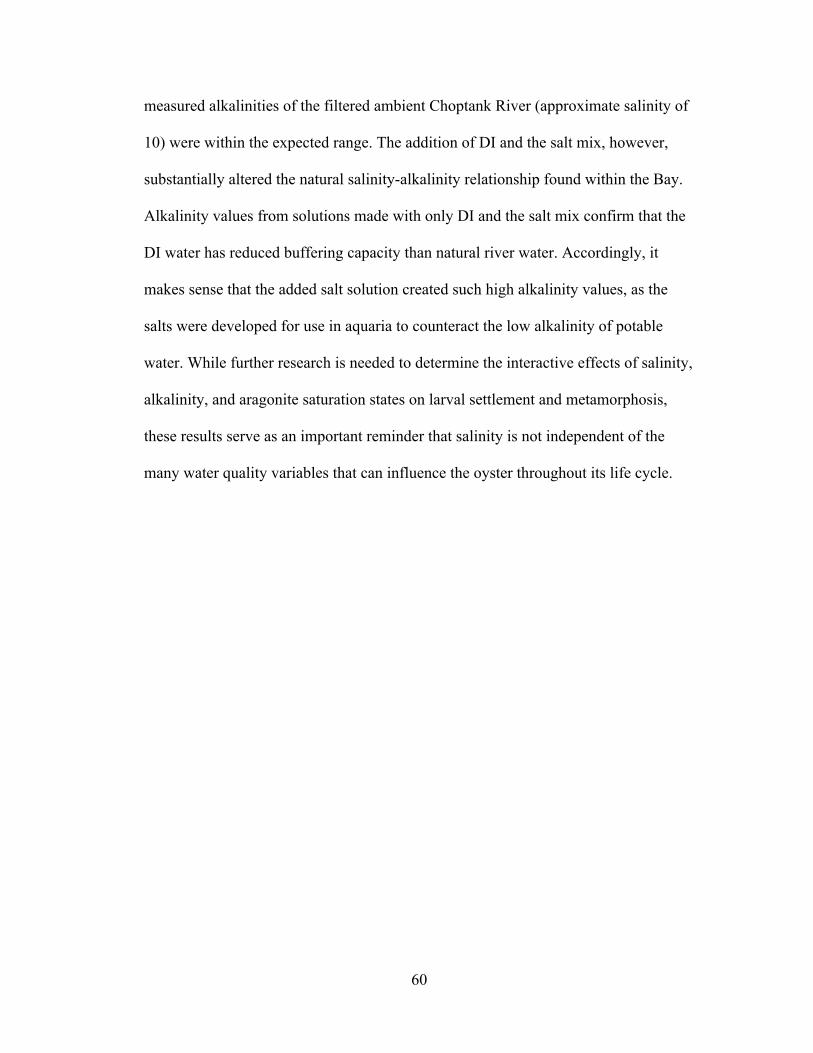
60
measured alkalinities of the filtered ambient Choptank River (approximate salinity of
10) were within the expected range. The addition of DI and the salt mix, however,
substantially altered the natural salinity-alkalinity relationship found within the Bay.
Alkalinity values from solutions made with only DI and the salt mix confirm that the
DI water has reduced buffering capacity than natural river water. Accordingly, it
makes sense that the added salt solution created such high alkalinity values, as the
salts were developed for use in aquaria to counteract the low alkalinity of potable
water. While further research is needed to determine the interactive effects of salinity,
alkalinity, and aragonite saturation states on larval settlement and metamorphosis,
these results serve as an important reminder that salinity is not independent of the
many water quality variables that can influence the oyster throughout its life cycle.
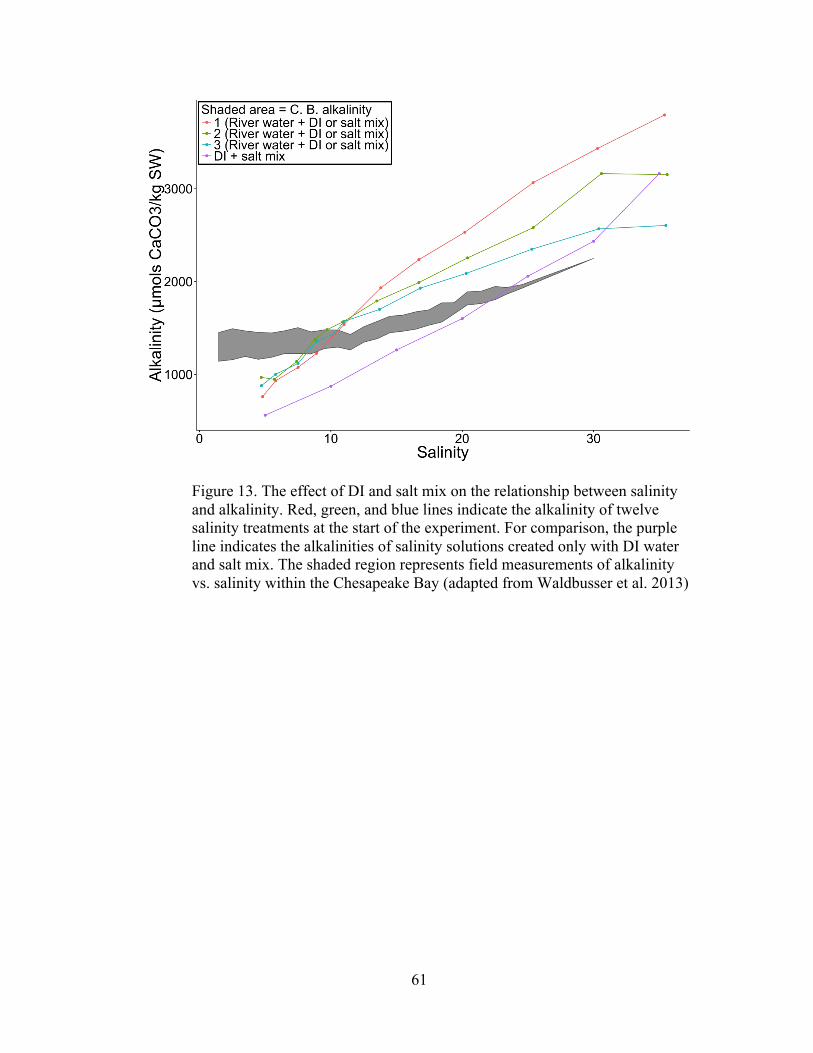
61
Figure 13. The effect of DI and salt mix on the relationship between salinity and alkalinity. Red, green, and blue lines indicate the alkalinity of twelve salinity treatments at the start of the experiment. For comparison, the purple line indicates the alkalinities of salinity solutions created only with DI water and salt mix. The shaded region represents field measurements of alkalinity vs. salinity within the Chesapeake Bay (adapted from Waldbusser et al. 2013)
62
Settlement variability
The uniquely large number of replicates in the present study enabled the
detection of differences in settlement rates as a response to a range of salinities.
However, the substantial variability in settlement that occurred within the experiment
deserves further consideration. As noted by many researchers, high settlement
variability between repeated experiments seems ubiquitous, even within carefully
controlled conditions (Lund 1971; Davis and Ansell 1962; Laing 1995; Baker 1997;
Brownlee et al 2005; Barnes 2008; Congrove 2008; Congrove et al. 2009; Steppe
2016). Additionally, individual oysters display a wide range of variability in response
to salinity changes (Anderson and Anderson 1975). Variability within the present
study existed in two forms: 1) variability in overall settlement rates between larval
cohorts originating from the same hatchery, and 2) variability among replicates and/or
between similar salinity treatments within the same run.
The opportunity to test seven different cohorts reared at HPL over the course
of one production season provided clear evidence that the range of overall settlement
performance can vary widely. (Figures 3 and 6). Despite the adherence to regimented
protocols among hatchery staff for conditioning, spawning, feeding, water changes,
and grading, the overall settlement means from each cohort ranged from 7.05% to
58.37%. Substantial differences in settlement rates were even seen between runs
performed just 10 days after one another, from 50% to 13%, using larvae from
broodstock obtained in the same location, refrigerated the same amount of time, and
nearly identical in size (as determined from coulter counter spherical equivalent
measurements). Particularly for this hatchery, there were no discernable correlations
63
between the size of larvae and settlement rates (Figure 4). However, there appeared to
be a general trend of decreased settlement by cohorts raised later in the larval season
(Figure 3). Although decreased success of egg fertilization, larval development, and
settlement in later summer months is frequently described by hatchery operators (M.
Congrove, S. Bennett, D Meritt and others, pers. comm.), the variability observed in
this study cannot be explained by seasonal differences alone.
Any number of variables can influence larval growth and settlement
performance, including minor differences in water quality, genetics, gamete quality,
and algae (Helm et al., 1991; Berntsson et al. 1997; Jonsson et al. 1999). Variability
in performance and survivorship within environments has also been correlated to
genetic variability, where heterozygous individuals often show increased ability to
tolerate stressors (Koehn and Shumway 1982; Rodhouse and Gaffney 1984; Galleger
et al 1986; Borsa et al. 1992; Lourenço et al. 1997). Additionally, the nutritional value
of algae strains can vary with differences in medium formulations, light, pH,
temperature, and growth phase of algae at harvest (Webb and Chu 1983; Volkman et
al. 1989; Wikfors et al. 1984) that can affect larval growth rates (Enright et al. 1986).
As Berntesson et al. (1997) mentioned, the difficulty in maintaining a constant fatty
acid composition of the diet will confound the interpretation of experimental factors
in studies of condition and larval quality.
The variability in settlement observed between replicates within the same run
was also striking. The example presented in Figure 6 illustrates the dramatic
differences in settlement that occurred amongst replicates of each treatment.
Generally speaking across all cohorts, as settlement averages increased, so did the

64
variability. This variability could be caused by a variety of reasons, which
unfortunately cannot be determined at this time. However, the repeated demonstration
of gregarious settlement on the tiles could potentially be part of the explanation
(Figure 5). We know that a substantial amount of genetic variation exists within a
cohort of larvae (Taris 2009; Plough and Hedgecock 2012) and competency to settle
is not uniform within a cohort, even for larvae of similar size (Vlahovich 2009).
Additionally, it is well documented that osterid larvae respond positively to the water-
soluble cues from settled conspecifics, evoking an increased settlement response
(Cole and Knight-Jones 1949; Knight-Jones 1953; Crisp and Meadows 1962, 1963;
Crisp 1967; Hidu 1969; Hidu 1971). As Hidu (1969) observed, the initial setting of C.
virginica larvae appears to be “spontaneous,” and as spontaneous setting proceeds,
the presence of new spat on shells stimulates more larvae to set than would have
otherwise. It is possible that minute differences in genetics and competency of the
larvae affected the number of larvae that initially settled, which in turn could affect
the number of larvae that set overall. This could explain why settlement within one
bag could be an order of magnitude greater than another, even between replicates
within the same salinity. Researchers have identified many of the chemicals
responsible for eliciting a gregarious response (reviewed in Hadfield 2001), but the
number of settlers needed to elicit a gregarious response within these experiments is
unknown. Clearly, there are still many unanswered questions surrounding the
unpredictable nature of settlement.
65
Implications of Research
Oyster Aquaculture and Restoration
Following the depletion of many wild stocks of the eastern oyster, the
hatchery culture of larvae for aquaculture and restoration purposes has been
increasing. Results from this study have direct implications for the production of
oyster seed and are particularly relevant to facilities that set oyster larvae at a
different location than where they were reared. This practice, called “remote setting,”
was developed in the Pacific Northwest in the 1970s and is currently the industry
standard for the production of C. gigas oysters (Jones and Jones 1988; Nosho and
Chew 1991). The adoption of remote setting practices by industries producing C.
virginica are more recent, but are increasingly being employed within the Mid-
Atlantic and Gulf of Mexico (Supan 1991; Hudson and Murray 2016; Stokes et al.
2014). Just as larvae was obtained for the current study, hatchery operators ship
bundles of pediveliger larvae to an oyster farm or setting facility to be used for the
production of single seed oysters (often set on shell fragments) or “spat-on-shell” (set
on whole oyster shells). Remote setting offers the advantage of reduced shipping and
transportation costs associated with the deployment of seed and spat-on-shell to
locations far from an existing hatchery. Therefore remote setting also offers the
opportunity to source larvae from hatcheries which experience water conditions that
may be considerably different than the setting facility.
The current study addressed the question of how oyster larvae respond to a
salinity change that they might experience during remote setting, and demonstrated
that the four Mid-Atlantic oyster hatcheries participating in this study are producing
66
healthy larvae, capable of withstanding dramatic salinity changes without the need for
stepwise acclimation. Although results indicate that hatchery-reared pediveliger
larvae are more robust with regards to salinity changes than previously thought, a few
rules of thumb emerged. First, the optimal salinity range for C. virginica settlement is
approximately between 11 to 30, regardless of hatchery conditions or broodstock.
Second, for salinities outside of their optimal range, larvae reared closest to the
setting salinity perform better. Third, although larvae generally set best in salinities
close their rearing conditions, larvae reared in the lowest salinities are tolerant to (and
may prefer) salinities substantially higher than their own.
Aside from salinity tolerances, this study revealed a few other lessons
pertinent to a setting operator. First, settlement performance between larval cohorts
can vary substantially, even from the same hatchery. Second, larval size is not strictly
indicative of the cohort’s competency, but larger larvae show an increased capacity to
set than smaller larvae of the same age. Finally, the observed variability among
cohort performances (Figure 3) and among settlement responses among replicates
(Figure 6) serves as a reminder that firm conclusions cannot be made from just one
experience. Despite carefully controlling the experimental conditions within this
study, it is evident that a myriad of variables besides salinity can influence settlement.
As a reminder, the conditions maintained in these experiments were not
designed to achieve the highest amount of settlement possible, but rather, to provide
the most consistent platform to measure the effect of salinity on settlement. Hence the
settlement rates achieved in this study are relative across salinity treatments but are
not absolute. Different results could be expected if changes were made to the
67
settlement chamber, water temperature, algae, or settlement substrate. The use of a
ceramic tile (as opposed to oyster shell) in these experiments was to guarantee a
consistent surface area, uniform composition, and to ensure there were no holes or
crevices in which larvae could settle but not be seen under a microscope. However, as
noted by Nosh and Chew (1991), setting and survival rates are probably not as high
on ceramic tiles compared to oyster culch. It is also possible that the use of a more
preferred substrate with a settlement-enhancing biofilm could increase the speed and
number of settlers (Kirchman et al. 1982; Maki and Mitchell 1985; Weiner et al.
1985; Bonar et al. 1990; Fitt et al. 1990; Pawlik 1992; Tamburri et al. 2008; Hart
2009). However, the bacteria and other organisms that compose a biofilm would have
likely changed over the course of the experimental period, which in turn would have
added confounding variables between runs (Anderson 1996).
Although improvements in the setting process can lead to increased seed
production from each cohort, it is also important to remember that settlement is just
one phase of the multi-step process to produce oysters for profits and ecological
benefits. For instance, setting operators might choose to accept slightly reduced
settlement efficiencies if they have strategically located their operation in salinities
below their settlement optima to avoid increased predation and disease that occurs in
high salinities (Stokes et al. 2014). In summary, the degree to which a setting operator
should manipulate their conditions to increase settlement success will be unique for
each operation and need to be repeatedly tested at each location. Additionally, salinity
is just one of the many variables that can be manipulated in order to affect settlement.
68
Natural Recruitment
Lessons from this study are also applicable to natural recruitment, as the
results have altered our understanding of the physiological limitations of C. virginica
larvae with regards to low salinities. Rumrill (1990) hypothesized that the four most
important factors that limit natural recruitment success are low fertilization success
from broadcast spawning, adverse hydrographic conditions, lack of adequate
substrate, and predation. Researchers that have identified salinity as the most
important environmental factor governing successful spatfall have not determined the
exact mechanisms for the correlation, but note that larvae and spat are the most
sensitive life stages to salinity extremes (Ulanowicz 1980; Kimmell and Newell
2007). This study isolated only a portion of these life stages, and by doing so, it was
observed that competent larvae can settle, metamorphose, and grow in salinities as
low as 5 (given the presence of competent larvae and adequate substrate). This fact
confirms why oyster reefs can and do exist in low salinities, and supports the
assumptions that salinity bears greater influence on earlier larval stages (Davis 1958,
Davis and Calabrese 1964, Loosanoff 1965). Seeing that oyster predation and disease
is generally reduced in lower salinities (Menzel et al. 1966; Cake 1983; Newell 1985;
Paynter and Burreson 1991; La Peyre et al. 2003, 2010; Soniat 1996; Burreson and
Ragone-Calvo 1996; Bushek et al. 2012), other variables in conjunction with salinity
may also be at play.
Reasons why recruitment is reduced in low salinities may partially be
explained by hydrodynamics. With recent advances in hydrographic instrumentation
and computing ability, researchers have developed larval transport models that

69
predict the possible journey of a developing larva within an estuary. As a
generalization, larval transport models of the Delaware Bay and tributaries of the
Chesapeake Bay indicate that the majority of larvae will wind up further downriver
(and in higher salinities) than from where they were spawned (North et al. 2008;
North et al. 2010; Narvaez et al. 2012). Additionally, increases in precipitation likely
increase the transport distance (Narvaez et al. 2012). Hence, precipitation is
responsible for both creating the low salinity conditions and preventing the larvae
from being present in lower salinities. Therefore the assimilation of information
learned from the current research with what is known from hydrographic models
leads to a logical hypothesis: reduced recruitment in low salinity regions may be more
a function of larval availability than a function of the physiological abilities of larvae
to settle there. Admittedly, salinity also exerts indirect control over the distribution of
oyster populations by affecting the availability of food and presence of predators and
diseases.
It is interesting to note that larvae from the Low salinity cohorts were both
more tolerant of low salinity waters and were also tolerant to (and may even prefer)
substantially higher salinities than their natal salinities. These results may be
indicative of faster acclimation to higher salinities than lower salinities as observed in
adult oysters (Anderson and Anderson 1975). However, the higher degree of
plasticity exhibited by the Low salinity larvae is inconsistent with a few other studies
that suggest oysters from lower salinity regions are less capable of adapting to salinity
changes. Pierce et al. (1992) found that adult oysters taken from lower salinities of the
Chesapeake Bay were unable to survive a direct transfer to a salinity of 30, which he
70
attributed to differences on osmolyte production and concentrations compared to the
other Atlantic populations. Eirman and Hare (2013) also suggested that larvae from a
high salinity oyster population showed higher plasticity across salinity treatments
than larvae from parents originating from lower salinity populations. However, their
conclusions should be viewed with caution. Replication was low within the Eirman
and Hare (2013) study because many of the parental crosses failed to produce viable
eggs, and none of their larval cultures could survive long enough for them to reach
competency. In contrast, findings from the highly repeated experiments in this study
support the assumption that larvae from low salinity regions are fully capable of
adapting to and successfully completing settlement and metamorphosis in the higher
salinities that they may encounter downriver.
71
REFERENCES
Anderson, M. J. 1996. A chemical cue induces settlement of Sydney rock oysters, Saccostrea commercialis, in the laboratory and in the field. The Biological Bulletin, 190(3), 350-358.
Anderson, R. D. and Anderson, J. W. 1975. Effects of salinity and selected petroleum hydrocarbons on the osmotic and chloride regulation of the American oyster, Crassostrea virginica. Physiological Zoology, 48(4), 420-430.
Baker, P. 1994. Competency to settle in oyster larvae, Crassostrea virginica: wild versus hatchery-reared larvae. Aquaculture, 122(2-3), 161-169.
Baker, P. 1997. Settlement site selection by oyster larvae, Crassostrea virginica: evidence for geotaxis. Oceanographic Literature Review, 12(44), 1509.
Baker, S. M. and Mann, R. 1992. Effects of hypoxia and anoxia on larval settlement, juvenile growth, and juvenile survival of the oyster Crassostrea virginica. Biological Bulletin, 182, 265-269.
Baker, S. M. and Mann, R. 1994a. Description of metamorphic phases in the oyster Crassostrea virginica and effects of hypoxia on metamorphosis. Marine Ecology Progress Series, 104, 91–99.
Baker, S.M. and Mann, R. 1994b. Feeding ability during settlement and metamorphosis in the oyster, Crassostrea virginica (Gmelin, 1791) and the effects of hypoxia on post-settlement ingestion rates. Journal of Experimental Marine Biolgy and Ecology, 181, 239–253.
Baker, P. and Mann, R. 1998. Response of settling oyster larvae, Crassostrea virginica, to specific portions of the visible light spectrum. Journal of Shellfish Research, 17(4), 1081-1084.
Barnes, B. B. 2008. Interspecific interactions in oyster reef communities: the effect of established fauna on oyster larval recruitment (Doctoral dissertation, The College of William and Mary).
Barnes, T. K., Volety, A. K., Chartier, K., Mazzotti, F. J., & Pearlstine, L. 2007. A habitat suitability index model for the eastern oyster (Crassostrea virginica), a tool for restoration of the Caloosahatchee Estuary, Florida. Journal of Shellfish Research, 26(4), 949-959.
Bayne, B. L. 1965. Growth and the delay of metamorphosis of the larvae of Mytilus edulis (L.). Ophelia, 2, 1-47.
Bayne, B. L. 1971. Some morphological changes that occur at the metamorphosis of the larvae of Mytilus edulis. In: The Fourth European Marine Biology Symposium, 259-280.

72
Bayne, B. L. and R. C. Newell. 1983. Physiological energetics of marine molluscs. In: Wilbur, K. M., editor. The mollusca, vol. 1. London:Academic Press. 407–515.
Beck, M.W., Heck Jr., K.L., Able, K.W., Childers, D.L., Eggleston, D.B., Gillanders, D.M., Halpern, B., Hays, C.G., Hoshino, K., Minello, T.J., Orth, R.J., Sheridan, P.F., Weinstein, M.P. 2001. The identification, conservation, and management of estuarine and marine nurseries for fish and invertebrates. BioScience, 51, 633–641.
Berntsson, K. M., Jonsson, P. R., Wängberg, S. A., & Carlsson, A. S. 1997. Effects of broodstock diets on fatty acid composition, survival and growth rates in larvae of the European flat oyster, Ostrea edulis. Aquaculture, 154(2), 139-153.
Bonar, D. B., S.L. Coon, M. Walch, R. M. Weiner & W.K. Fitt. 1990. Control of oyster settlement and metamorphosis by endogenous and exogenous chemical cues. Bulletin of Marine Science. 46: 484-498.
Borsa, P., Jousselin, Y., & Delay, B. 1992. Relationships between allozymic heterozygosity, body size, and survival to natural anoxic stress in the palourde Ruditapes decussatus L.(Bivalvia: Veneridae). Journal of Experimental Marine Biology and Ecology, 155(2), 169-181.
Breitburg, D. L. 1999. Are three-dimensional structure and healthy oyster populations the keys to an ecologically interesting and important fish community? In: M. W. Luckenbach, R. Mann & J. A. Wesson, editors. Oyster reef habitat restoration: a synopsis and synthesis of approaches. Gloucester Point, Virginia: Virginia Institute of Marine Science Press, 239–250.
Breuer, J. P. 1962. An ecological survey of the lower Laguna Madre of Texas, 1953-1959. Publications of the Institute of Marine Science, University of Texas, 8(15), 3-183.
Brownlee, E. F., Sellner, S. G., & Sellner, K. G. 2005. Prorocentrum minimum blooms: potential impacts on dissolved oxygen and Chesapeake Bay oyster settlement and growth. Harmful Algae, 4(3), 593-602.
Burreson E. M. and Ragone-Calvo L. M. 1996. Epizootiology of Perkinsus marinus disease of oysters in Chesapeake Bay with emphasis on data since 1985. Journal of Shellfish Research, 15, 17–34
Bushek, D., S. E. Ford & I. Burt. 2012. Long-term patterns of an estuarine pathogen along a salinity gradient. Journal of Marine Research. 70, 225– 251.
Butler, P. A. 1954. Summary of our knowledge of the oyster in the Gulf of Mexico. Fishery Bulletin of the Fish and Wildlife Service, 55, 479–489.
Cake, E. W., Jr. 1983. Habitat suitability index models: Gulf of Mexico American oyster. U.S. Department of the Interior Fish and Wildlife Service.
73
Carlton, J. T. and Mann, R. 1996. Transfers and world-wide introductions. In: V.S. Kennedy, R. I.E. Newell, and A. F. Eble (eds). 1996. The eastern oyster Crassostrea virginica. Maryland Sea Grant, College Park, MD, 691-706.
Carriker, M. R. 1996. The shell and ligament. In: V.S. Kennedy, R. I.E. Newell, and A. F. Eble (eds). 1996. The eastern oyster Crassostrea virginica. Maryland Sea Grant, College Park, MD, 75-168.
Castagna, M., and Chanley, P. 1973. Salinity tolerance of some marine bivalves from inshore and estuarine environments in Virginia waters on the western mid-Atlantic coast. Malacologia, 12(1), 47-96.
Chanley, P.E., 1958. Survival of some juvenile bivalves in water of low salinity. Proceedings of the National Shellfish Association, 48: 52-65.
Chatry, M., Dugas, R.J., Easley, K.A., 1983. Optimum salinity regime for oyster production on Louisiana’s state seed grounds. Contributions in Marine Science 26: 81-94.
Clark, M. S., G. Husmann, M. A. Thorne, G. Burns, M. Truebano, L. S. Peck, D. Abele & E. E. Philipp. 2013. Hypoxia impacts large adults first: consequences in a warming world. Global Change Biology, 19:2251–2263.
Coen, L. D., Brumbaugh, R. D., Bushek, D., Grizzle, R., Luckenbach, M. W., Posey, M. H., ... & Tolley, S. G. 2007. Ecosystem services related to oyster restoration. Marine Ecology Progress Series, 341, 303-307.
Coen, L. D., Luckenbach, M. W., & Breitburg, D. L. 1999. The role of oyster reefs as essential fish habitat: a review of current knowledge and some new perspectives. In: American Fisheries Society Symposium, 22, 438-454.
Cole, H. A. and E. W. Knight-Jones. 1949. The setting behavior of larvae of the European flat oyster, Ostrea edulis L., and its influence on methods of cultivation and spat collection. Fishery Investigations, 2(17), 3.
Collet, B., Boudry, P., Thebault, A., Heurtebise, S., Morand, B., & Gérard, A. 1999. Relationship between pre-and post-metamorphic growth in the Pacific oyster Crassostrea gigas (Thunberg). Aquaculture, 175(3), 215-226.
Congrove, M. S. 2008. A bio-economic feasibility model for remote setting: potential for oyster aquaculture in Virginia. Masters Thesis, The College of William and Mary.
Congrove, M. S., Wesson, J. A., Allen Jr, S. K., Seafood, J. W., Seafood, K., Seafood, M. B., ... & Brothers, T. 2009. A practical manual for remote setting in Virginia. VIMS marine resource report, 21.
74
Coon, S. L., W. K. Fitt and D. B. Bonar. 1990a. Competence and delay of metamorphosis in the Pacific oyster Crassostrea gigas. Marine Biology, 106: 379-387.
Coon, S. L., M. Walch, W. K. Fitt, R. M. Weiner, and D. B. Bonar. 1990b. Ammonia induces settlement behavior in oyster larvae. The Biological Bulletin, 179: 297-303.
Crisp, D. J. 1965. Surface chemistry, a factor in the settlement of marine invertebrate larvae. Botanica Gothoburgensia III, Proceedings of the Fifth Marine Biological Symposium, Goteborg, 51-65.
Crisp, D. J. 1967. Chemical factors inducing settlement in Crassostrea virginica (Gmelin). Journal of Animal Ecology. 36, 329-335.
Crisp, D. J. and P. S. Meadows. 1962. The chemical basis of gregariousness in Cirripedes. Proceedings of the Royal Society of London, Ser. B, 156(965), 500-520.
Crisp, D. J. and P. S. Meadows. 1963. Adsorbed layers: the stimulus to settlement in barnacles. Proceedings of the Royal Society of London, Ser. B, Vol. 158(972), 364-387.
Dame, R.F., E. Koepfler, L. Gregory. 2002. Benthic-Pelagic Coupling in Marsh-Estuarine Ecosystems. In: Concepts and Controversies in Tidal Marsh Ecology. Springer Netherlands, 369-390. Davis, H. C. 1958. Survival and growth of clam and oyster larvae at different salinities. Biological Bulletin, 114, 296-307. Davis, H. C. and Ansell, A. D. 1962. Survival and growth of larvae of the European oyster, O. edulis, at lowered salinities. The Biological Bulletin, 122(1), 33-39. Davis, H. C. and Calabrese, A. 1964. Combined effects of temperature and salinity on development of eggs and growth of larvae of M. mercenaria and C. virginica. Fisheries Bulletin, 63, 643-655. Devakie, M. N., and Ali, A. B. 2000. Salinity–temperature and nutritional effects on the setting rate of larvae of the tropical oyster, Crassostrea iredalei (Faustino). Aquaculture, 184(1), 105-114. Dickson, A. G. 1990. Thermodynamics of the dissociation of boric acid in synthetic seawater from 273.15 to 318.15 K. Deep Sea Research Part A. Oceanographic Research Papers, 37(5), 755-766. Dickinson, G. H., Ivanina, A. V., Matoo, O. B., Pörtner, H. O., Lannig, G., Bock, C., ... & Sokolova, I. M. 2012. Interactive effects of salinity and elevated CO2 levels on juvenile eastern oysters, Crassostrea virginica. Journal of Experimental Biology, 215(1), 29-43.

75
Eierman, L. E., & Hare, M. P. (2013). Survival of oyster larvae in different salinities depends on source population within an estuary. Journal of Experimental Marine Biology and Ecology, 449, 61-68. Enright, C. T., Newkirk, G. F., Craigie, J. S., & Castell, J. D. 1986. Evaluation of phytoplankton as diets for juvenile Ostrea edulis L. Journal of Experimental Marine Biology and Ecology, 96(1), 1-13. Feely, R. A., Klinger, T., Newton, J. A., & Chadsey, M. (Eds.). (2012).Scientific summary of ocean acidification in Washington State marine waters. Fitt, W. K. and S. L. Coon. 1992. Evidence for ammonia as a natural cue for recruitment of oyster larvae to oyster beds in a Georgia salt marsh. Biological Bulletin, 182, 401-408.
Fitt, W. K., Coon, S. L., Walch, M., Weiner, R. M., Colwell, R. R., & Bonar, D. B. 1990. Settlement behavior and metamorphosis of oyster larvae (Crassostrea gigas) in response to bacterial supernatants. Marine Biology, 106(3), 389-394.
Galtsoff, P. S. 1964. The American oyster, Crassostrea virginica Gmelin. Fishery Bulletin 64, 1-480.
Gobler, C. J., and Talmage, S. C. 2014. Physiological response and resilience of early life-stage Eastern oysters (Crassostrea virginica) to past, present and future ocean acidification. Conservation Physiology, 2(1), cou004. Grabowski, J. H., & Peterson, C. H. 2007. Restoring oyster reefs to recover ecosystem services. Theoretical ecology series, 4, 281-298.
Guo, X., He, Y., Zhang, L., Lelong, C., & Jouaux, A. 2015. Immune and stress responses in oysters with insights on adaptation. Fish and Shellfish Immunology, 46(1), 107-119.
Hadfield, M. G., and Paul, V. J. 2001. Natural chemical cues for settlement and metamorphosis of marine invertebrate larvae. Marine chemical ecology, 431-461.
Halsey, L. G., Curran-Everett, D., Vowler, S. L., & Drummond, G. B. 2015. The fickle P value generates irreproducible results. Nature methods, 12(3), 179-185.
Hand, S. C. and Stickle, W. B. 1977. Effects of tidal fluctuations of salinity on pericardial fluid composition of the American oyster, Crassostrea virginica. Marine Biology, 42, 259-272.
Hart, A. (2009). Effects of Biofilm Age and Composition on Oyster Larval Setting. Masters thesis, Virginia Commonwealth University.
76
Hedges, L. V., Gurevitch, J., & Curtis, P. S. 1999. The meta‐analysis of response ratios in experimental ecology. Ecology, 80(4), 1150-1156.
Helm, M. M., Holland, D. L., Utting, S. D., & East, J. 1991. Fatty acid composition of early non-feeding larvae of the European flat oyster, Ostrea edulis. Journal of the Marine Biological Association of the United Kingdom, 71(03), 691-705.
Henderson, B. A. 1983. Handling and remote setting techniques for Pacific oyster larvae Crassostrea gigas. Masters Thesis, Oregon State University.
Hidu, H. 1969. Gregarious setting in the American oyster Crassostrea virginica Gmelin. Chesapeake Science. 10, 85-92.
Hidu, H. and H.H. Haskin. 1971. Setting of the American oyster related to environmental factors and larval behavior. Proceedings of the National Shellfisheries Association, 61, 35-50. Hopkins, A. E. 1931. Factors Influencing the Spawning and Setting of Oysters in Galveston Bay, Texas. US Government Printing Office.
Hopkins. S. H. 1962. Distribution of species of Cliona (boring sponge) on the eastern shore of Virginia in relation to salinity. Chesapeake Science, 3, 121-124.
Hoyaux, J., Gilles, R. and Jeuniaux, C. 1976. "Osmoregulation in molluscs of the intertidal zone." Comparative Biochemistry and Physiology Part A: Physiology, 53(4), 361-365.
Hudson, K., & Murray, T. J. 2016. Virginia Shellfish Aquaculture Situation and Outlook Report. VIMS Marine Resources Report No. 2016–4.
Jackson, J. B., Kirby, M. X., Berger, W. H., Bjorndal, K. A., Botsford, L. W., Bourque, B. J., ... & Hughes, T. P. 2001. Historical overfishing and the recent collapse of coastal ecosystems. Science, 293(5530), 629-637.
Jones, G. and B. Jones. 1983. Methods for setting hatchery produced oyster larvae. British Columbia Ministry of Environment, Marine Resources Branch, Info. Report # ISSN 0229-8120; no.4, 94p.
Jonsson, P. R., Berntsson, K. M., André, C., & Wängberg, S. Å. 1999. Larval growth and settlement of the European oyster (Ostrea edulis) as a function of food quality measured as fatty acid composition. Marine Biology, 134(3), 559-570.
Kemp, W. M., Boynton, W. R., Adolf, J. E., Boesch, D. F., Boicourt, W. C., Brush, G., ... & Harding, L. W. 2005. Eutrophication of Chesapeake Bay: historical trends and ecological interactions. Marine Ecology Progress Series, 303, 1-29.
Kennedy, V. S. 1996. Biology of larvae and spat. In: V.S. Kennedy, R. I.E. Newell, and A. F. Eble (eds). 1996. The eastern oyster Crassostrea virginica. Maryland Sea
77
Grant, College Park, MD. 371-421.
Kennedy, V. S., Breitburg, D. L., Christman, M. C., Luckenbach, M. W., Paynter, K., Kramer, J., ... & Mann, R. 2011. Lessons learned from efforts to restore oyster populations in Maryland and Virginia, 1990 to 2007. Journal of Shellfish Research, 30(3), 719-731.
Kimmel, D. G., & Newell, R. I. 2007. The influence of climate variation on eastern oyster (Crassostrea virginica) juvenile abundance in Chesapeake Bay. Limnology and Oceanography, 52(3), 959-965.
Kirchman, D., Graham, S., Reish, D., & Mitchell, R. (1981). Bacteria induce settlement and metamorphosis of Janua (Dexiospira) brasiliensis Grube (Polychaeta: Spirprbidae). Journal of Experimental Marine Biology and Ecology, 56(2-3), 153-163.
Knight-Jones, E. W. 1953. Laboratory experiments on gregariousness during settlement in Balanus balanoides and other barnacles. Journal of Experimental Biology. 30, 584-598.
Koehn, R. K. and Shumway, S. E. 1982. A genetic/physiological explanation for differential growth rate among individuals of the American oyster, Crassostrea virginica (Gmelin). Marine Biology Letters, 3, 35–42
Korringa, P. 1952. Recent advances in oyster biology. The Quarterly Review of Biology, 27(3), 266-308.
Laing, I. 1995. Effect of food supply on oyster spatfall. Aquaculture, 131(3), 315-324.
Langdon, C. J., & Robinson, A. M. 1996. Aquaculture potential of the Suminoe oyster (Crassostrea ariakensis Fugita 1913). Aquaculture, 144(4), 321-338.
Lannig, G., Cherkasov, A. S., Portner, H. O., Bock, C., Sokolova, I. M., 2008. Cadmium-dependent oxygen limitation affects temperature tolerance in eastern oysters (Crassostrea virginica Gmelin). The American Journal of Physiology – Regulatory, Integrative and Comparative Physiology, 294, 1338-1346.
La Peyre, M. K., A. D. Nickens, A. K. Volety, G. S. Tolley, and J. F. La Peyre. 2003. Environmental significance of freshets in reducing Perkinsus marinus infection in eastern oysters Crassostrea virginica: potential management applications. Marine Ecology Progress Series 248, 165-176.
La Peyre, M., S. Casas, W. Gayle and J. La Peyre. 2010. The combined influence of sub-optimal temperature and salinity on the in vitro viability of Perkinsus marinus, a protistan parasite of the eastern oyster Crassostrea virginica. Journal of Invertebrate Pathology, 105(2), 176–181.
78
La Peyre, M. K., B. S. Eberline, T. M. Soniat & J. F. La Peyre. 2013. Differences in extreme low salinity timing and duration differentially affect eastern oyster (Crassostrea virginica) size class growth and mortality in Breton Sound, LA. Estuarine, Coastal and Shelf Science, 135, 146–157.
Lipcius, R. N., Burke, R. P., McCulloch, D. N., Schreiber, S. J., Schulte, D. M., Seitz, R. D., & Shen, J. 2015. Overcoming restoration paradigms: Value of the historical record and metapopulation dynamics in native oyster restoration. Frontiers in Marine Science, 2, 65.
Lombardi, S. A., Harlan, N. P., & Paynter, K. T. 2013. Survival, Acid—Base Balance, and Gaping Responses of the Asian Oyster Crassostrea ariakensis and the Eastern Oyster Crassostrea virginica During Clamped Emersion and Hypoxic Immersion. Journal of Shellfish Research, 32(2), 409-415.
Loosanoff, V. L. 1953. Behavior of oysters in water of low salinities. Proceedings of the National Shellfisheries Association, 43, 135-151.
Loosanoff V. L. 1965. The American or eastern oyster. United States Department of the Interior Circular, 205, 1-36.
Loosanoff V. L. and Davis H. C. 1963. Rearing of bivalve mollusks. Advances in Marine Biology, 1, 1–136.
Lough, R. G. 1975. A re-evaluation of the combined effects of temperature and salinity on survival and growth of bivalve larvae using response surface techniques. Fisheries Bulletin, 73, 86-94.
Lourenço, S. O., Marquez, U. M. L., Mancini-Filho, J., Barbarino, E., & Aidar, E. 1997. Changes in biochemical profile of Tetraselmis gracilis I. Comparison of two culture media. Aquaculture, 148(2), 153-168. Lund, D. S. 1972. Laboratory studies on the setting of the Pacific oyster (Crassostrea gigas Thunberg). Master’s Thesis, Oregon State University, Corvallis, OR., 85p. Lutz, R. A., Hidu, H., & Drobeck, K. G. (1970). Acute temperature increase as a stimulus to setting in the American oyster, Crassostrea virginica (Gmelin). Proceedings of the National Shellfish Association, 60, 68-71. Maki, J. S., & Mitchell, R. 1985. Involvement of lectins in the settlement and metamorphosis of marine invertebrate larvae. Bulletin of marine science, 37(2), 675-683.
Mann, R., and Powell, E. N. 2007. Why oyster restoration goals in the Chesapeake Bay are not and probably cannot be achieved. Journal of Shellfish Research, 26(4), 905-917.
79
Mann, R., M. Southworth, J. M. Harding & J. Wesson. 2009. Population studies of the native oyster, Crassostrea virginica (Gmelin), in the James River, Virginia, USA. Journal of Shellfish Research, 28, 193–220. Menzel, R. W., N. C. Hulings, and R. R. Hathaway. 1966. Oyster abundance in Apalachicola Bay, Florida in relation to biotic association influenced by salinity and other factors. Gulf Research Reports, 2, 73–96.
Meyer, D. L., Townsend, E. C., Thayer, G. W. 1997. Stabilization and erosion control value of oyster cultch for intertidal marsh. Restoration Ecology, 5, 93-99.
Michaelidis B., Haas D., Grieshaber M. K. 2005. Extracellular and intracellular acid-base status with regard to the energy metabolism in the oyster Crassostrea gigas during exposure to air. Physiological and Biochemical Zoology, 78, 373–383.
Miller, C. A., & Waldbusser, G. G. 2016. A post-larval stage-based model of hard clam Mercenaria mercenaria development in response to multiple stressors: temperature and acidification severity. Marine Ecology Progress Series, 558, 35-49.
Millero, F. J. 2010. Carbonate constants for estuarine waters. Marine and Freshwater Research, 61(2), 139-142.
Nakagawa, S., and Cuthill, I. C. 2007. Effect size, confidence interval and statistical significance: a practical guide for biologists. Biological Reviews, 82(4), 591-605.
Narváez, D. A., Klinck, J. M., Powell, E. N., Hofmann, E. E., Wilkin, J., & Haidvogel, D. B. 2012. Modeling the dispersal of eastern oyster (Crassostrea virginica) larvae in Delaware Bay. Journal of Marine Research, 70(2-3), 381-409.
Natochin, Y. V., Berger, V. Y., Khlebovich, V. V., Lavrova, E. A. and Michailova, O. Y. 1979. The participation of electrolytes in adaptation mechanisms of intertidal molluscs' cells to altered salinity. Comparative Biochemistry and Physiology Part A: Physiology, 63(1), 115-119.
Newell, R. I. E. 1988. Ecological changes in Chesapeake Bay: Are they the result of overharvesting the American oyster, Crassostrea virginica? In: M.P. Lynch and E.C. Krome, (eds.) Understanding the Estuary: Advances in Chesapeake Bay Research. Chesapeake Research Consortium Publication 129 (CBP/TRS 24/88), Gloucester Point, VA. 536-546.
Newell, R. I. E. 1985. Sublethal physiological effects of the parasite MSX (Haplosporidium nelsoni) on the oyster Crassostrea virginica. Journal of Shellfish Research, 5, 91-95. Newell, R. I., Kemp, W. M., Hagy III, J. D., Cerco, C. F., Testa, J. M., & Boynton, W. R. 2007. Top-down control of phytoplankton by oysters in Chesapeake Bay, USA: Comment on Pomeroy et al.(2006). Marine Ecology Progress Series, 341, 293-298.
80
Newell R. I. E. and Koch E. W. 2004. Modeling seagrass density and distribution in response to changes in turbidity stemming from bivalve filtration and seagrass sediment stabilization. Estuaries, 27, 793–806. Newkirk, G. 1978. Interaction of genotype and salinity in larvae of the oyster Crassostrea virginica. Marine Biology, 48(3), 227-234. Newkirk, G. F., Waugh, D. L., & Haley, L. E. 1977. Genetics of larval tolerance to reduced salinities in two populations of oysters, Crassostrea virginica. Journal of the Fisheries Board of Canada, 34(3), 384-387. North, E. W., Schlag, Z., Hood, R. R., Li, M., Zhong, L., Gross, T., & Kennedy, V. S. 2008. Vertical swimming behavior influences the dispersal of simulated oyster larvae in a coupled particle-tracking and hydrodynamic model of Chesapeake Bay. Marine Ecology Progress Series, 359, 99-115.
North, E. W., King, D. M., Xu, J., Hood, R. R., Newell, R. I. E., Paynter, K., ... & Boesch, D. F. 2010. Linking optimization and ecological models in a decision support tool for oyster restoration and management. Ecological applications, 20(3), 851-866.
Nosho, T. Y. and K. K. Chew. 1991 Remote setting and nursery culture for shellfish growers. Washington Sea Grant Workshop Record.
O'Connor, S., Moltschaniwskyj, N., Bolch, C. J., & O'Connor, W. 2015. Assessment of temperature or salinity effects on larval development by catecholamine‐induced metamorphosis of hatchery‐reared flat oyster, Ostrea angasi (Sowerby 1871) larvae. Aquaculture Research, 46(10), 2501-2511.
Officer C. B., Smayda T. J., Mann R. 1982. Benthic filter feeding: a natural eutrophication control. Marine Ecology Progress Series, 9, 203−210.
Osman, R. W. and Abbe, G. E. (1994). Post-settlement factors affecting oyster recruitment in the Chesapeake Bay, USA. In Dyer, K. R. and Orth, R. J., editors, Changes in Fluxes in Estuaries: Implications from Science to Management. Proceedings of Estuarine Research Federation Symposium, 13- 18 September 1992. Institute of Marine Studies, University of Plymouth. 335–340. Osman, R., Whitlatch, R., & Zajac R. 1989. Effects of resident species on recruitment into a community: larval settlement versus post-settlement mortality in the oyster Crassostrea virginica. Marine Ecology Progress Series, 54, 61-73. Pawlik, J. R. 1992. Chemical ecology of the settlement of benthic marine invertebrates. Oceanography and Marine Biology Annual Review, 30, 273-335. Paynter K. T., and Burreson E. M. 1991. Effects of Perkinsus marinus infection in the eastern oyster Crassostrea virginica II. Disease development and impact on growth rate at different salinities. Journal of Shellfish Research, 10, 425–431.
81
Peck, L. S., S. A. Morley, H. O. Portner and M. S. Clark. 2007. Thermal limits of burrowing capacity are linked to oxygen availability and size in the Antarctic clam Laternula elliptica. Oecologia, 154, 479–484. Pierce, S. K., Rowland-Faux, L. M., and O'Brien, S. M. 1992. Different salinity tolerance mechanisms in Atlantic and Chesapeake Bay conspecific oysters: glycine betaine and amino acid pool variations. Marine Biology, 113(1), 107-115. Pierce S. K. and Amende L. M. 1981. Control Mechanisms of Amino Acid Mediated Cell Volume Regulation in Salinity Stressed Mollusks. Journal of Experimental Zoology, 215, 247–257.
Plough, L. V., & Hedgecock, D. 2012. High genotype-dependant mortality at metamorphosis in the Pacific oyster, Crassostrea gigas. In Journal of Shellfish Research, 31(1), 333-333. Proestou, D. A., Vinyard, B. T., Corbett, R. J., Piesz, J., Allen, S. K., Small, J. M., ... & Rawson, P. 2016. Performance of selectively-bred lines of eastern oyster, Crassostrea virginica, across eastern US estuaries. Aquaculture, 464, 17-27.
Prytherch, H. F. 1934. The role of copper in the setting, metamorphosis, and distribution of the American oyster, Ostrea virginica. Ecological Monographs, 4, 47-107.
R Core Team (2013). R: A language and environment for statistical computing. R Foundation for Statistical Computing, Vienna, Austria. URL http://www.R-project.org/. Rodhouse, P. G., & Gaffney, P. M. 1984. Effect of heterozygosity on metabolism during starvation in the American oysterCrassostrea virginica. Marine Biology, 80(2), 179-187. Rodriguez, J. L., Sedano, F. J., Garcia-Martin, L. O., Perez-Camacho, A., Sanchez, J. L., 1990. Energy metabolism of newly settled Ostrea edulis spat during metamorphosis. Marine Biology, 106, 109–111.
Rodriguez, S. R., Ojeda, F. P., & Inestrosa, N. C. 1993. Settlement of benthic marine invertebrates. Marine Ecology Progress Series. 97(2), 193-207. Roegner, G. C. 1991. Temporal analysis of the relationship between settlers and early recruits of the oyster Crassostrea virginica (Gmelin). Journal of Experimental Marine Biology and Ecology, 151(1), 57-69. Roegner, G. C., and Mann, R. 1995. Early recruitment and growth of the American oyster Crassostrea virginica (Bivalvia: Ostreidae) with respect to tidal zonation and season. Marine Ecology Progress Series, 117(1), 91-101.
82
Rosenberg, M. S., Adams, D. C., & Gurevitch, J. 2000. MetaWin: statistical software for meta-analysis. Sunderland, Massachusetts, USA: Sinauer Associates. Rothschild, B. J., J. S. Ault, P. Goulletquer, and M. Heral. 1994. Decline of the Chesapeake Bay oyster population: a century of habitat destruction and overfishing. Marine Ecology Progress Series. 111: 29.
Rumrill, S. S. 1990. Natural mortality of marine invertebrate larvae. Ophelia, 32(1-2), 163-198.
Rybovich, M., Peyre, M. K. L., Hall, S. G., and Peyre, J. F. L. 2016. Increased Temperatures Combined with Lowered Salinities Differentially Impact Oyster Size Class Growth and Mortality. Journal of Shellfish Research, 35(1), 101-113.
Shumway, S. E. 1996. Natural environmental factors. In: V.S. Kennedy, R. I.E. Newell, and A. F. Eble (eds). 1996. The eastern oyster Crassostrea virginica. Maryland Sea Grant, College Park, MD. 467-513. Stafford, J. 1913. The Canadian oyster. Its development, environment, and culture. Commission of Conservation, Canada. Ottawa.
Steppe, C. N., Fredriksson, D. W., Wallendorf, L., Nikolov, M., & Mayer, R. 2016. Direct setting of Crassostrea virginica larvae in a tidal tributary: applications for shellfish restoration and aquaculture. Marine Ecology Progress Series, 546, 97-112.
Soniat, T. M. 1996. Epizootiology of Perkinsus marinus disease of eastern oysters in the Gulf of Mexico. Journal of Shellfish Research 15, 35–43
Soniat, T. M., Finelli, C. M. and Ruiz, J. T., 2004. Vertical structure and predator refuge mediate oyster reef development and community dynamics. Journal of Experimental Marine Biology and Ecology, 310(2), 163-182.
Soniat, T. M., Klinck, J. M., Powell, E. N., Hofmann, E. E., 2012. Understanding the success and failure of oyster populations: periodicities of Perkinsus marinus, and oyster recruitment, mortality, and size. Journal of Shellfish Research 31, 635- 646. Southworth, M., and Mann, R. 2004. Decadal scale changes in seasonal patterns of oyster recruitment in the Virginia sub estuaries of the Chesapeake Bay. Journal of Shellfish Research, 23(2), 391-403. Stokes, S., La, M., Cory-Watson, D., and Lowe, M. 2014. Louisiana Oyster Industry: Building competitiveness and resilience. Reportby Datu Research was funded by the Environmental Defense Fund.
83
Sukhotin, A. A., D. L. Lajus & P. A. Lesin. 2003. Influence of age and size on pumping activity and stress resistance in the marine bivalve Mytilus edulis. Journal of Experimental Marine Biology and Ecology. 284, 129–144. Supan, J. 1991. Using remote setting to produce seed oysters in Louisiana and the gulf coastal region. Louisiana Sea Grant College Program. Louisiana State University, Baton Rouge, Louisiana. 47 p. Talmage, S. C., Gobler, C. J. 2009. The effects of elevated carbon dioxide concentrations on the metamorphosis, size, and survival of larval hard clams (Mercenaria mercenaria), bay scallops (Argopecten irradians), and Eastern oysters (Crassostrea virginica). Limnology and Oceanography, 54(6), 2072. Talmage S. C., Gobler C. J. 2010. Effects of past, present, and future ocean carbon dioxide concentrations on the growth and survival of larval shellfish. Proceedings of the National Academy of Sciences of the USA 107: 17246–17251. Tamburri, M. N., Luckenbach, M. W., Breitburg, D. L., & Bonniwell, S. M. 2008. Settlement of Crassostrea ariakensis larvae: effects of substrate, biofilms, sediment and adult chemical cues. Journal of Shellfish Research, 27(3), 601-608. Taris, N., Boudry, P., Bonhomme, F., Camara, M. D., & Lapègue, S. 2009. Mitochondrial and nuclear DNA analysis of genetic heterogeneity among recruitment cohorts of the European flat oyster Ostrea edulis. The Biological Bulletin, 217(3), 233-241.
Ulanowicz, R. E., Caplins, W. C., & Dunnington, E. A. 1980. The forecasting of oyster harvest in central Chesapeake Bay. Estuarine and Coastal Marine Science, 11(1), 101-106.
Underwood, A. J. and Denley, E. J. 1984. Paradigms, explanations, and generalizations in models for the structure of intertidal communities on rocky shores. In: Strong, D. R.. Simberloff, D., Abele, L. G., Thistle, A. B. (eds.) Ecological communities: conceptual issues and the evidence. Princeton University Press, Princeton, 151-180.
Utting, S. D., 1986. A preliminary study on growth of Crassostrea gigas larvae and spat in relation to dietary protein. Aquaculture 56, 123–138.
U.S. Environmental Protection Agency. 2002. Short-term methods for estimating the chronic toxicity of effluents and receiving waters to marine and estuarine organisms, 3rd ed. EPA-821-R02–014. Washington, DC.
Vlahovich, E. A. 2009. Relationships between larval morphometrics and setting efficiency in the eastern oyster, Crassostrea virginica. Masters thesis, University of Maryland.
84
Volkman, J. K., Jeffrey, S. W., Nichols, P. D., Rogers, G. I., & Garland, C. D. 1989. Fatty acid and lipid composition of 10 species of microalgae used in mariculture. Journal of Experimental Marine Biology and Ecology, 128(3), 219-240.
Waldbusser, G. G., Gray, M. W., Hales, B., Langdon, C. J., Haley, B. A., Gimenez, I., Smith, S. R., Brunner, E. L. and Hutchinson, G. 2016, Slow shell building, a possible trait for resistance to the effects of acute ocean acidification. Limnol. Oceanogr.. doi:10.1002/lno.10348 Waldbusser G. G., Hales B., Langdon C. J., Haley B. A., Schrader P., Brunner E. L., et al. 2015. Ocean Acidification Has Multiple Modes of Action on Bivalve Larvae. PLoS ONE 10(6): e0128376. doi:10.1371/journal.pone.0128376 Waldbusser, G. G., Powell, E. N., & Mann, R. 2013. Ecosystem effects of shell aggregations and cycling in coastal waters: an example of Chesapeake Bay oyster reefs. Ecology, 94(4), 895-903.
Webb, K. L., and Chu, F. E. 1983. Phytoplankton as a food source for bivalve larvae. In Proceedings of the Second International Conference on Aquaculture Nutrition: biochemical and physiological approaches to shellfish nutrition, 27, 272-291.
Weiner, R. M., A. M. Segall and R. R. Colwell. 1985. Characterization of a marine bacterium associated with Crassostrea virginica (the eastern oyster). Applied and Environmental Microbiology. 49, 83-90.
Widdows, J. 1978. Physiological indices of stress in Mytilus edulis. Journal of the Marine Biological Association of the United Kingdom, 58(01), 125-142.
Wikfors, G. H., Patterson, G. W., Ghosh, P., Lewin, R. A., Smith, B. C., Alix, J. H., 1996. Growth of post-set oyster, Crassostrea virginica, on high-lipid strains of algal flagellates Tetraselmis spp. Aquaculture, 143, 411–419.
Wikfors, G. H., Twarog, J. W., & Ukeles, R. 1984. Influence of chemical composition of algal food sources on growth of juvenile oysters, Crassostrea virginica. The Biological Bulletin, 167(1), 251-263.
Wilberg, M. J., Livings, M. E., Barkman, J. S., Morris, B. T., & Robinson, J. M. 2011. Overfishing, disease, habitat loss, and potential extirpation of oysters in upper Chesapeake Bay. Marine Ecology Progress Series, 436, 131-144.
Yuan, W., Walters, L. J., Schneider, K. R., and Hoffman, E. A. 2010. Exploring the survival threshold: a study of salinity tolerance of the nonnative mussel Mytella charruana. Journal of Shellfish Research, 29(2), 415-422.
Zimmerman, R. J., Minello, T. J., Baumer, T., & Castiglione, M. C. 1989. Oyster reef as habitat for estuarine macrofauna. NOAA Technical Memorandum, NMFS- SEFC-249.

85
Zuur, A. F., Ieno, E. N., Walker, N. J., Saveliev, A. A., & Smith, G. M. 2009. Mixed effects models and extensions in ecology with R; Gail M, Krickeberg K, Samet JM, Tsiatis A, Wong W, editors. New York, NY: Spring Science and Business Media.
Copyright © 2022 FDOKUMEN