Root Zone Salinity Management Using Fractional Skimming ...
54
Root Zone Salinity Management Using Fractional Skimming Wells With Pressurized Irrigation WORKING PAPER 40 Muhammad Mazhar Saeed Muhammad Ashraf Muhammad Nadeem Asghari Michael Bruen Muhammad Siddique Shafique Pakistan Country Series No11 SM IWMI is a Future Harvest Center Supported by the CGIAR FARMERS’ SKIMMING WELS TECHNOLOGIES: PRACTICES, PROBLEMS, PERCEPTIONS AND PROSPECTS
-
Upload
khangminh22 -
Category
Documents
-
view
2 -
download
0
Transcript of Root Zone Salinity Management Using Fractional Skimming ...
Root Zone Salinity ManagementUsing Fractional Skimming WellsWith Pressurized Irrigation
WORKING PAPER 40
Muhammad Mazhar Saeed
Muhammad Ashraf
Muhammad Nadeem Asghari
Michael Bruen
Muhammad Siddique Shafique
Pakistan Country Series No11
SM
IWMI is a Future Harvest CenterSupported by the CGIAR
FARMERS’ SKIMMING WELS TECHNOLOGIES:PRACTICES, PROBLEMS, PERCEPTIONS AND PROSPECTS
Working Paper 40
ROOT ZONE SALINITY MANAGEMENT ROOT ZONE SALINITY MANAGEMENT USING FRACTIONAL SKIMMING WELLS USING FRACTIONAL SKIMMING WELLS WITH PRESSURIZED IRRIGATIONWITH PRESSURIZED IRRIGATION
FARMERS’ SKIMMING WELL TECHNOLOGIES: PRACTICES, PROBLEMS, PERCEPTIONS AND PROSPECTS
Muhammad Mazhar Saeed Muhammad Ashraf
Muhammad Nadeem Asghar Michael Bruen
Muhammad Siddique Shafique
International Water Management Institute Regional Office for Pakistan, Central Asia and Middle East, Lahore
Water Resource Research Institute National Agricultural Research Center, Islamabad
Mona Reclamation Experimental Project International Waterlogging and Salinity Research Institute, Water and Power Development Authority, Bhalwal

The authors: Muhammad Mazhar Saeed, Assistant Professor, CEWRE, Lahore Muhammad Ashraf, Water Management Specialist, OFWM, Bhalwal Muhammad Nadeem Asghar, Senior Agricultural Engineer, IWMI
Michael Bruen, Director, CWRR, University College Dublin, Ireland Muhammad Siddique Shafique, International Sub-Consultant, IWMI
Saeed, M. M.; Ashraf, M.; Asghar, M. N.; Bruen, M.; Shafique, M. S. 2002. Farmers’ skimming well technologies: Practices, problems, perceptions and prospects. Working Paper No. 40. Lahore, Pakistan: International Water Management Institute.
ISBN: 92-9090-474-7
Keywords: water management / water supply / canals / groundwater / tubewells / farmers’ attitudes / performance / technology transfer / water quality / pumping / diagnostic techniques / data collection / participatory rural appraisal / Pakistan / Indus Basin
Copyright © 2001, by IWMI. All rights reserved.
Please direct inquiries and comments to: IWMI 12 KM, Multan Road, Chowk Thokar Niaz Baig, Lahore-53700, Pakistan.
In the short water supply environment of Pakistan, farmers try to minimize the gap between demand and supply of canal water extracting groundwater for irrigation purposes. However, saline groundwater upconing may occur in response to fresh groundwater withdrawals from unconfined aquifer underlain by salty groundwater. Skimming well technology can help controlling this upconing phenomenon. However, in most cases, the small discharges of such wells cannot be efficiently applied on surface irrigated croplands. Pressurized irrigation application systems use small discharge effectively, but the cost and availability of equipment in the local market is a significant constraint. Root zone salinity is also expected to increase if this skimmed groundwater is used for irrigation purposes, particularly in the absence of proper salinity management practices. To address these issues, International Water Management Institute (IWMI), and Water Resource Research Institute (WRRI) of National Agricultural Research Centre (NARC), Mona Reclamation Experimental Project (MREP) of Water and Power Development Authority (WAPDA) are collaborating to undertake an applied research under the Project, Root Zone Salinity Management Using Fractional Skimming Wells with Pressurized Irrigation. This project is funded by the World Bank through WAPDA under the Research Sub-Component of the National Drainage Program (NDP). The duration of the project is three years March 1999 – February 2002.

iii
TABLE OF CONTENTS
TABLE OF CONTENTS ....................................................................................................................................................iii
LIST OF FIGURES ..............................................................................................................................................................iv
LIST OF TABLES .................................................................................................................................................................iv
LIST OF PLATES .................................................................................................................................................................iv
EXECUTIVE SUMMARY ..................................................................................................................................................v
ACKNOWLEDGEMENT...................................................................................................................................................vi
1. INTRODUCTION ...................................................................................................................................................... 1
1.1 General ..................................................................................................................................................................1 1.2 Objectives .............................................................................................................................................................2
2. DATA COLLECTION TECHNIQUES ............................................................................................................... 3
2.1 Description of Study Area..................................................................................................................................3 2.2 Participatory Rural Appraisal ............................................................................................................................4
3. FARMERS’ SKIMMING WELL PRACTICES ................................................................................................ 6
3.1 Skimming Well Options.....................................................................................................................................6 3.2 Farmers’ Practices ...............................................................................................................................................6
4. FARMERS’ PERCEPTIONS ON SKIMMING WELL PROBLEMS ......................................................12
4.1 Depth of Well .....................................................................................................................................................12 4.2 Number of Strainers ..........................................................................................................................................15 4.3 Horizontal Distance of Strainers .....................................................................................................................18 4.4 Priming................................................................................................................................................................21 4.5 Water Quality.....................................................................................................................................................21 4.6 Sand in Pumped Water .....................................................................................................................................22 4.7 Reduction in Well Discharge and Suction Break.........................................................................................22
5. DIAGNOSTIC ANALYSIS OF SKIMMING WELL PROBLEMS ..........................................................24
5.1 Depth of Well .....................................................................................................................................................24 5.2 Number of Strainers ..........................................................................................................................................25 5.3 Horizontal Distances of Strainers ...................................................................................................................26 5.4 Priming................................................................................................................................................................26 5.5 Water Quality.....................................................................................................................................................31 5.6 Sand in Pumped Water .....................................................................................................................................31 5.7 Reduction in Well Discharge and Suction Break.........................................................................................32
6. CONCLUSIONS .......................................................................................................................................................34
7. FOLLOW UP STUDIES .........................................................................................................................................35
REFERENCES .....................................................................................................................................................................36
ANNEX-1. QUESTIONNAIRE FOR FARMERS’ INTERVIEWS ............................................................37
ANNEX-II. FARMER’S SKIMMING WELL PRACTICES IN STUDY AREA ....................................39
ANNEX-III. PRICES OF DIFFERENT COMPONENTS OF SKIMMING WELLS ..............................46

iv
LIST OF FIGURES
Figure 1. Location of study area in the Indus Basin of Pakistan. ................................................................................. 3 Figure 2. Schematic presentation of farmer’s shallow tubewell. .................................................................................. 8 Figure 3. Schematic presentation of skimming tubewell. ............................................................................................ 10 Figure 4. Growth of skimming wells over the years in the study area. ..................................................................... 10 Figure 5. Distribution of decision-makers in skimming well design......................................................................... 12 Figure 6. Distribution of depth in shallow tubewells in the study area. .................................................................... 13 Figure 7. Distribution of depth in skimming tubewells in the study area. ................................................................ 13 Figure 8. Temporal trend of depths in shallow tubewells in the study area. ............................................................ 14 Figure 9. Relationship between depth of well and quality of water in the study area. ........................................... 14 Figure 10. Distribution of skimming tubewells in the study area................................................................................. 15 Figure 11. Variation in well discharge with area of strainer. ........................................................................................ 18 Figure 12. Arrangements of horizontal distance in 16-strainers skimming tubewell at Muhammad Akram Farm,
Nabi Shah ........................................................................................................................................................... 19 Figure 13. Arrangements of horizontal distance in 11-strainers skimming tubewell at Muhammad Nawaz Farm,
Nabi Shah............................................................................................................................................................ 20 Figure 14. Farmer’s practice to diagnose the suction problem in skimming tubewell. ............................................. 23 Figure 15. Increase in cost of the shallow tubewell with the depth and diameter. .................................................... 24 Figure 16. Increase in cost of skimming tubewell with number of strainers. ............................................................. 26 Figure 17. Schematic presentation of conventional tubewell. ....................................................................................... 27 Figure 18. Arrangement of step 1 solution of priming problem. .................................................................................. 29 Figure 19. Arrangement of step 2 solution of priming problem. .................................................................................. 29 Figure 20. Schematic presentation of improved design of skimming well. ................................................................ 31 Figure 21. Reduction in discharge of 16-strainers skimming tubewell at Muhammad Akram Farm Nabi Shah. 33
LIST OF TABLES
Table 1. Techniques used for participatory rural appraisal. .......................................................................................... 4 Table 2. Variation in strainer size with depth of shallow tubewells in the study area............................................ 17 Table 3. Variation in length of the strainers within same number of strainers. ....................................................... 17 Table 4. Sand in the pumped water at reported skimming wells in the study area. ................................................ 22 Table 5. Water quality along the profile of test borehole at Tariq Bashir Farm, 7 NB. ......................................... 25 Table 6. Sand particle distribution at different locations in the study area............................................................... 32
LIST OF PLATES
Plate 1. Locally manufactured jute and nylon coir strainers used in skimming wells............................................. 7 Plate 2. Locally manufactured non-return valves used in skimming wells. .............................................................. 7 Plate 3. A 4-strainers tee joint in skimming tubewell. .................................................................................................. 9 Plate 4. A centrifugal pump is being mounted over the non-return valve................................................................. 9 Plate 5. 26-strainers skimming tubewell in the study area. ........................................................................................ 16 Plate 6. 16-strainers skimming tubewell in the study area. ........................................................................................ 16 Plate 7. Priming in skimming well. ................................................................................................................................ 21 Plate 8. Arrangement of step 1 solution of priming..................................................................................................... 30 Plate 9. Arrangement of step 2 solution of priming..................................................................................................... 30

v
EXECUTIVE SUMMARY
The short canal water supply has forced the farmers to extract groundwater for irrigation purposes. Farmers are using skimming wells (both single- and multi-strainers) to supplement their canal supplies. To ensure sustainable groundwater extraction, proper design and operational guidelines for these skimming wells are required. The starting point of such guidelines will be to see the extent of skimming well technologies. Under the Root Zone Salinity Project funded by the World Bank, a field survey was conducted in Tehsil Bhalwal, District Sargodha to see the farmers’ groundwater extraction practices and associated problems with these technologies. For this purpose, four villages with highest number of skimming wells were selected. Different techniques of participatory rural appraisal (PRA) were used to collect field data. These involve semi-structured interviews, trend lines, pie charts, field walks, flow charts, mapping and preference ranking. Group discussion with farmers helped get information, which they were reluctant to share during individual interviews.
The installation of skimming tubewells in the study area started in late 1960s. These wells were installed in uncommanded area along the riverain tract. Later on, farmers used these technologies in canal commanded areas. The field survey showed that about 90% wells were installed between the middle and tail reach of the watercourse command. Initially, the farmers installed shallow tubewells (single -strainer and centrifugal) and then, they opted to skimming tubewells (multi-strainers and centrifugal).
The PRA data revealed that there is a wide variation in farmers’ skimming well designs. The depth of shallow tubewells ranges from 12 to 67 m with diameters of 12.5 to 30 cm. While in skimming tubewells, the depth of wells varies between 10 to 18 m with diameters ranging from 5 to 12.5 cm. The number of strainers in skimming tubewells varies from 2 to 26 but, 10 and 18 strainers were common. Farmers and local drillers had miscomprehension that the well discharge increases with the increase in number of strainers. Anyhow, no trend was found between the well discharge and the area of strainers in farmers skimming wells. The other problems identified during PRA include optimal horizontal distances between strainers, priming in centrifugal pumps, deterioration in water quality, sand in pumped water and reduction in well discharge.
To investigate the reasons related to these problems, diagnostic analysis was carried out at the reported farmers’ tubewells. A test borehole was suggested to get water quality samples along the aquifer depth. The depth of well then, was decided on the basis of these water quality analyses. To decide the number of strainers, a pumping test was conducted at test borehole to estimate the contribution of individual strainer and then, the numbers were increased according to the desired discharge. Two skimming tubewells of 4- and 6-strainers were installed at farmers’ field using the suggested procedure. Similarly, placing non-return valve between blind pipe and strainer solved the priming problem. The data showed that continuous operation of a skimming well for 12 to 14 hours reduced the well discharge up to 30%.
From the present study, it is concluded that there is an imperative need to develop proper design and operation guidelines for skimming wells. The farmers and local drillers are the target groups to be trained for sustainable groundwater management from quantity and quality view point.

vi
ACKNOWLEDGEMENT
The authors gratefully acknowledge the financial assistance provided by the National Drainage Program (NDP) of WAPDA through World Bank for the study under the project “Root Zone Salinity Management Using Fractional Skimming Wells with Pressurized Irrigation”. The authors are also thankful to Dr. Vilma M. Horinkova, Dr. Hammond Murray-Rust, Dr. Asad Sarwar Qureshi, Dr. Muhammad Aslam, Professor Dr. Muhammad Latif, Dr. Ata-ur-Rehman Tariq, Mr. Mushtaq Ahmed Gill and Mr. Manzoor Hussain for their invaluable technical suggestions and comments during the present study. We also grateful to Ms. Shahnaz Akhtar for providing secretarial support for formatting and compiling the report.

1
1. INTRODUCTION
1.1 GENERAL
The most serious problems in the irrigated areas of the Indus Basin of Pakistan are those of soil salinity and waterlogging. Salinity affects 5.8 million hectares (Mha) of land inside and outside the canal commanded area, while 9.0 Mha area has water table within 3.0 m of the soil surface (Ayers et al., 1985). Since early sixties, Government of Pakistan has launched a series of Salinity Control and Reclamation Projects (SCARPs) to control waterlogging and soil salinity. By mid nineties, 6.0 Mha were covered under these projects at the cost of Rs. 21 billion and these facilities were extended to another 2.0 Mha with the investment of Rs. 20 billion (NESPAK-MMI, 1995). In SCARPs, deep tubewell, surface, and sub-surface drainage systems were established. The performance evaluation of these projects revealed that some had been reasonably successful, while others failed to achieve the designed objectives (Knops, 1997). The main causes for failure were:
a. Deficiencies in policy and institutional matters (Bandaragoda and Firdousi, 1992); Low priority for operation and maintenance (World Bank, 1994);
b. Constraints on the public sector investment programs (Masood and Ashraf, 1997);
c. Safe disposal of saline drainage effluent (Knops, 1997); and
d. Social constraints (Rafiq et al., 1997).
The SCARP tubewells served the dual purpose to lower the water table and supplement the canal water supplies in the fresh water zones. While in the saline water zones, the tubewell water was disposed off in the surface drainage and then, drainage effluent into the nearby river. The major constraint with the SCARP tubewells in fresh water zones was their operational inflexibility for farmers to supplement their canal supplies at irrigation turns. The SCARP tubewells are being transferred to farmers’ community under new SCARP Transition Project to shift the responsibilities from public sector to private sector. Socially, the weak partnership among rural people is hindering the concept of community tubewells and farmers prefer to install their own tubewells of small capacity. These farmers’ tubewells are doing what the SCARP tubewells were supposed to do in these areas.
Farmers are using skimming wells to extract upper fresh water layer for supplementing their canal irrigation supplies and thereby achieving drainage objectives by lowering water table. Local farmers and drillers evolved skimming well technologies without any technical guidance. As a result, these wells have some economical, technical, operational management and environmental problems, which reduce the performance of these tubewells. To identify these problems and hence, solve them with farmers’ participation to build farmers’ confidence on these technologies, a case study was conducted in SCARP-II area in the Indus Basin of Pakistan.

2
1.2 OBJECTIVES
The main objective to evaluate farmers’ skimming well technologies was to have insight into their present practices, in the light of possibilities and constraints, which causes the low performance in these systems. The specific objectives of this study were:
a. To assess farmers’ practices and perception to opt skimming well technologies;
b. To document problems associated with farmers’ skimming wells technologies; and
c. To identify technical interventions to improve the performance of the farmers’ skimming wells.

3
2. DATA COLLECTION TECHNIQUES
2.1 DESCRIPTION OF STUDY AREA
The study area is situated in the Tehsil Bhalwal of the District Sargodha, Punjab, Pakistan. It is located at a distance of about 200 km from Lahore and about 145 km from Faisalabad. Figure 1 shows the location of the area in the Indus Basin of Pakistan. The area is a part of SCARP-II.
Figure 1. Location of study area in the Indus Basin of Pakistan.
The climate of the area is characterized by large seasonal variations in temperature and rainfall. From December to February, the temperature drops considerably and the weather becomes cold. Usually, the temperature during winter ranges from 70C to 200C. In summer, the weather is extremely hot with temperature ranges from 200C to above 450C. The mean annual rainfall is about 600 mm.
The area is being irrigated by a large number of distributaries and minors, which offtake from Northern Branch of Lower Jhelum Canal (a perennial canal) and Shahpur Branch Canal (a non-perennial canal). Canal water supplies of almost entire area are augmented by community as well as private tubewells.
Study Area

4
Framers of the area use flood irrigation method. However, basin irrigation is generally practiced for citrus orchards. Irrigation supplies remain surplus during rainy season due to high water table in the area. About 75% of the study area has water table within 3 m from the ground surface.
In the study area, both surface and subsurface (vertical) drainage systems are provided under SCARP. The irregular cleaning of surface drains and reduced operation of tubewells are the point of concern to maintain water table at the favorable depth. To provide drainage relief to the command area, different surface drains were setup. For vertical drainage in the area, 308 SCARP tubewells were provided.
The soils of the area range from coarse to moderately fine, with the predominance of moderately coarse texture soil class. According to a survey conducted in 1999, about 78 percent of the soils were normal (non-saline, non-sodic). The remaining soils were saline or sodic. Out of these, 14 percent soils were classified as saline sodic, 6 percent sodic and 2 percent as saline soil (Kahlown, 2000).
2.2 PARTICIPATORY RURAL APPRAISAL
Participatory rural appraisal (PRA) was used to collect field data for this study. A wide range of PRA techniques was used for this purpose. Before starting the detailed investigation, a preliminary survey was conducted in the study area to see the extent of skimming well technologies, its adaptability and associated constraints in different villages. The survey involved frequent field visits and open discussions with the farmers. On the basis of this survey, four villages having the highest number of skimming wells were selected for detailed investigations in the study area. These villages were 6 M.L., Nabi Shah, 6 S.B., and Thatti Noor in Tehsil Bhalwal, District Sargodha, Punjab, Pakistan. The details of participatory rural appraisal techniques used in the present study are given in Table 1.
Table 1. Techniques used for participatory rural appraisal.
S. No. PRA Technique Purpose 1 Semi-structured
Interview To obtain insights into farmers’ perception, their constraints and possible improvements in skimming wells.
2 Trend Line To identify the months with high water table, peak water demand
for crops and high skimming well operational hours. 3 Pie Chart To observe the change in cropping pattern after installation of
skimming well and percentage contribution of well water.
4 Field Walk To have more insight into the problems mentioned by farmers and help to identify and locate additional problems with the skimming wells.
5 Flow Chart To visualize cause-effect relationship and identify solution to solve the problems with farmers’ skimming wells.
6 Mapping To understand the design of skimming wells, spatial distances between strainers and length of strainers and blind pipe.
7 Preference Ranking To identify and prioritize skimming well problems.

5
For semi-structured interviews, a questionnaire with open questions was developed (Annex 1). During interviews, there was plenty of room for discussion with the farmers and questionnaire helped covering all the topics. Since these interviews were conducted at farmer’s sites in each case, this also provided an opportunity to verify technical data of wells at the spot.
Based on the information collected during PRA, following problems were identified and ranked as; (i) depth of well, (ii) optimal number of strainers, (iii) horizontal distance of strainers from pump, (iv) priming of centrifugal pumps, (v) water quality of the well, (vi) sand in pumped water, and (vii) reduction in well discharge with the passage of time and suction break. It was observed that farmers have their own perceptions on these problems and have developed their own indicators to diagnose problems related to their skimming wells.

6
3. FARMERS’ SKIMMING WELL PRACTICES
3.1 SKIMMING WELL OPTIONS
Skimming well is a general term to represent any well in which the depth of the well is defined by taking into consideration the underlying saline water layer and with an intention to extract relatively fresh water. Skimming wells are partially penetrating wells and screened in the upper freshwater layer of the aquifer. Different types of skimming well are being used in the Indus Basin, including shallow tubewell (single strainer and centrifugal), skimming tubewell (multi-strainer and centrifugal), conventional dugwell, scavenger well, and radial well. In scavenger wells, two casings are lowered in either single borehole or in closely spaced boreholes. One casing is screened at the upper freshwater layer while the second is screened just above the fresh-saline interface. The fresh and saline water are extracted separately and simultaneously. As the freshwater is extracted from the shallow well, the saline water rises in the shape of cone at the fresh-saline interface. The deep well extracts the saline water, which is raised in response to the freshwater pumping. The discharges of these wells have to fix in relative proportions so that saline water may not intrude the freshwater deliveries. This proportion is site specific and mainly depends upon the thickness of freshwater layer, aquifer parameters, etc. In scavenger wells, the disposal of saline water is a problem as well. This option to extract freshwater is being used in lower Indus Basin. The scavenger wells are technically complicated to be installed by local drillers.
Radial wells are used to extract thin freshwater layer. In these wells, perforated pipes are installed horizontally at shallow depths. In most of the cases, the intention of such installations is to lower water table. The water collected in such systems is used to supplement canal irrigation. The radial wells have high installation cost and the discharge depends upon the hydraulic head available or in other words, the depth of the pipes. The tile drains installed in drainage projects are examples of the radial wells.
The dugwells became obsolete due to revolution in pumping technology. So, shallow tubewells and skimming tubewells are most popular among farming community in the study area to extract shallow fresh water. The main factors contributing to their popularity among farming community are:
(i) Availability of local manufactured material; (ii) Availability of local expertise for drilling, installation and maintenance; (iii) Shallow water table, which helps use centrifugal pumping units; (iv) Technically simple system, as compared to deep turbines in scavenger wells; and (v) Economics and affordability.
In the context of this report, the term skimming well is used to represent both shallow and skimming tubewells collectively.
3.2 FARMER S ’ PRACTICES
During PRA, it was noted that the shallow tubewell installation in private sector had been started in the study area since 1968, after the installation of SCARP tubewells in the area. The installation of these shallow tubewells was initially in the uncommanded areas along the riverine tracts of the river Jehlum. Later, to supplement the canal water, these wells were used in the canal command areas. The statistics shows that about 90% wells are installed between the middle and tail reach of the watercourse command.

7
Initially, the shallow tubewells were very common. The depth of shallow tubewells in the study area ranges from 12 to 67 m with diameters ranging from 12.5 to 30 cm. About 60% shallow tubewells are 30 to 36 m deep. The shallow well consists of a bore varying in size penetrating through the permeable layer. The upper 3 to 6 m is used as blind pipe while lower 9 to 61 m is used a strainer. In shallow tubewells, locally manufactured jute or nylon coir strainers are used (Plate 1). The blind pipe is directly coupled with non-return valve (Plate 2). The blind pipe is usually of cost iron. A centrifugal pump is then, used to extract water. Figure 2 shows the schematic presentation of shallow tubewell.
Plate 1. Locally manufactured jute and nylon coir strainers used in skimming wells.
Plate 2. Locally manufactured non-return valves used in skimming wells.

8
Figure 2. Schematic presentation of farmer’s shallow tubewell.
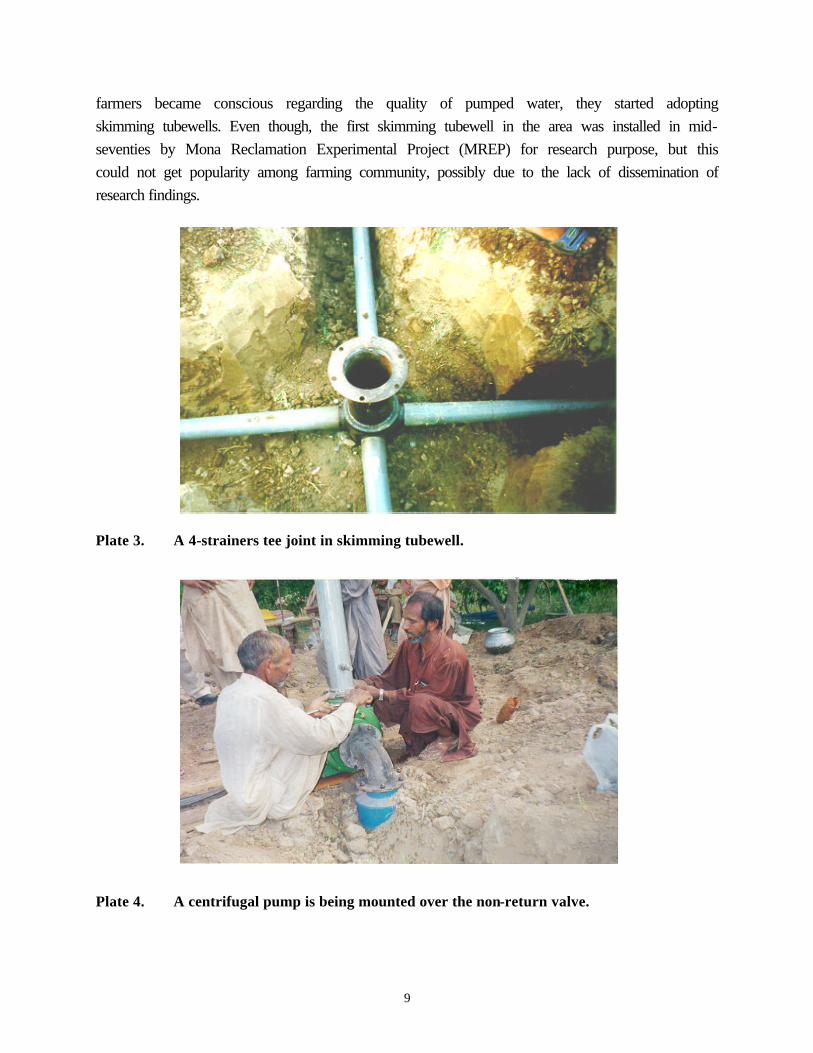
Skimming tubewell consists of number of boreholes of small diameters. These boreholes are drilled around a circle at shallow depth. The number of boreholes decides the angle from the center and hence the spacing among them. For example, a four strainers skimming tubewells will have a 90o angle among each other and a six strainers skimming tubewell will have 60o among each other and so on. In these wells, PVC pipes and strainers are commonly used. The blind pipes from all the boreholes are extended through horizontal pipes toward the center of the circle. Then, these pipes are joined together through a tee joint at the center (Plate 3). A non-return valve is attached above the tee and then, a centrifugal pumping unit is mounted on the non-return valve (Plate 4). Figure 3 shows the schematic representation of a skimming tubewell. The depth of skimming tubewells in the study area ranges from 10 to 18 m with 3 to 4 m blind pipes of diameters ranging from 5 to 12.5 cm. There is a wide range of variation in the design of skimming wells in the study area. Annex 2 summarized the technical information of farmers’ skimming well practices in the area.
The installation of skimming tubewells in the study area increased after 1996. The PRA data collection in the study area shows logarithmic increase in accumulated number of skimming wells (Figure 4). This change in well configuration may be attributed to the awareness among farmers about the water quality. Anyhow, the small number of skimming tubewells as compared to the shallow tubewells in the area represent that only small number of farmers are conscious about the quality. The groundwater in most of the area is saline-sodic or sodic and the adverse effects of groundwater irrigation appear after prolonged use (Javaid et al., 1997). Once the
Non-Return Valve
Suction Pipe
Strainer
Pump Ground Surface
Delivery Pipe
9
farmers became conscious regarding the quality of pumped water, they started adopting skimming tubewells. Even though, the first skimming tubewell in the area was installed in mid-seventies by Mona Reclamation Experimental Project (MREP) for research purpose, but this could not get popularity among farming community, possibly due to the lack of dissemination of research findings.
Plate 3. A 4-strainers tee joint in skimming tubewell.
Plate 4. A centrifugal pump is being mounted over the non-return valve.

10
Figure 3. Schematic presentation of skimming tubewell.
Figure 4. Growth of skimming wells over the years in the study area.
Pump Non-Return Valve
Tee Joint
Suction Pipe
Strainer
Ground Surface
Delivery Pipe
0
10
20
30
40
50
60
70
80
90
100
110
120
130
140
150
1968
1970
1975
1980
1981
1982
1983
1985
1986
1987
1988
1989
1990
1991
1992
1993
1994
1995
1996
1997
1998
1999
2000
Year of Installation
Num
ber
of S
kim
min
g W
ells
Shallow Tubewells
Skimming Tubewells

11
In study area, approximately 40% of the skimming wells were installed during last two years (1999-2000). The proportion of skimming tubewells also increased during these years. The high growth rate of skimming wells may be attributed to closure of SCARP tubewells in the area, and shortage of canal water supplies due to the poor management of irrigation system and the present regional dry spell.
With the passage of time, farmers have developed some know how about the skimming wells technologies. The local drillers and farmers have developed expertise on the installation of shallow and skimming tubewells. They are trained enough to diagnose and solve, to some extent, problems related to their tubewells. The issues like depth of well, number of strainers, distances of strainers, priming, water quality, sand in pumped water and reduction in tubewell discharge with the passage of time need to be refined to make the system more efficient and cost effective. Farmers’ perceptions regarding the above issues are described below.
12
4. FARMERS’ PERCEPTIONS ON SKIMMING WELL PROBLEMS
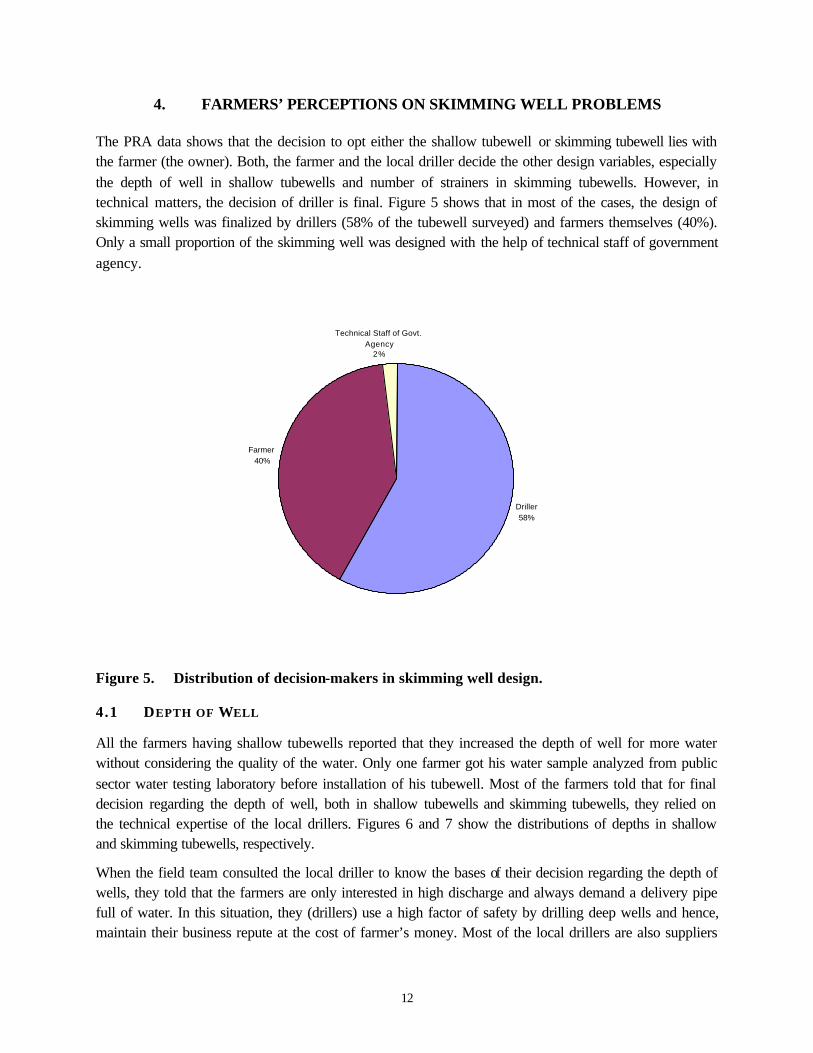
The PRA data shows that the decision to opt either the shallow tubewell or skimming tubewell lies with the farmer (the owner). Both, the farmer and the local driller decide the other design variables, especially the depth of well in shallow tubewells and number of strainers in skimming tubewells. However, in technical matters, the decision of driller is final. Figure 5 shows that in most of the cases, the design of skimming wells was finalized by drillers (58% of the tubewell surveyed) and farmers themselves (40%). Only a small proportion of the skimming well was designed with the help of technical staff of government agency.
Figure 5. Distribution of decision-makers in skimming well design.
4.1 DEPTH OF WELL
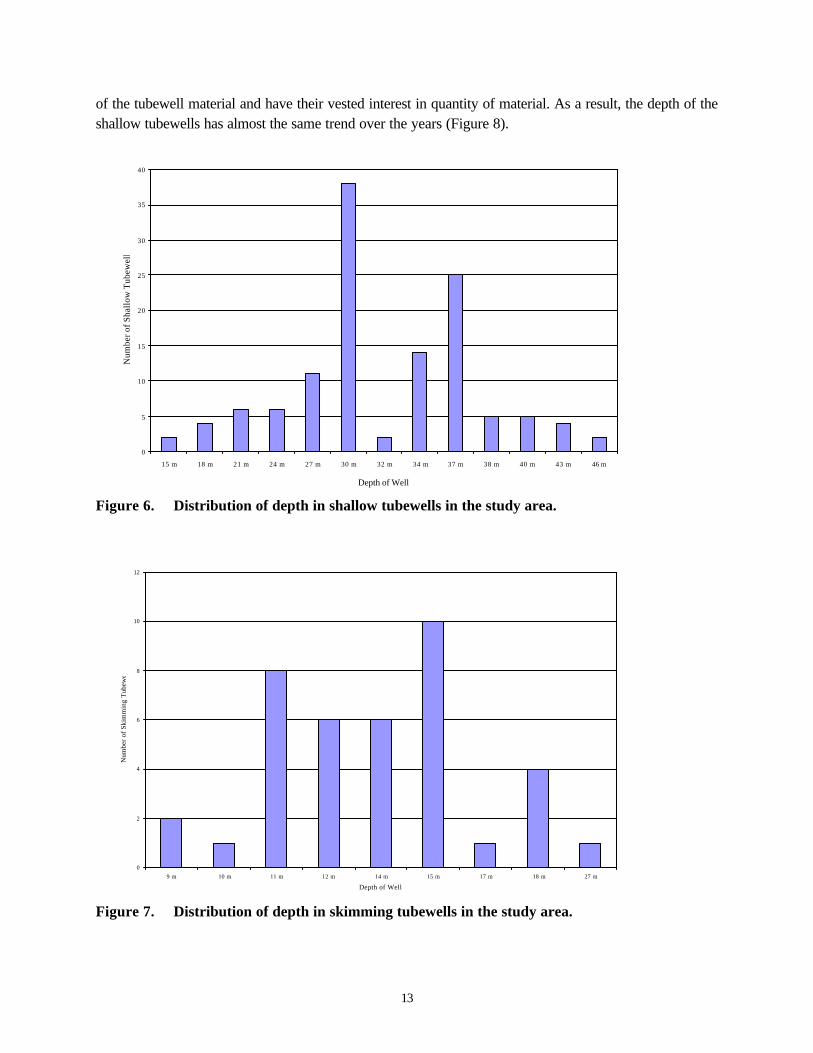
All the farmers having shallow tubewells reported that they increased the depth of well for more water without considering the quality of the water. Only one farmer got his water sample analyzed from public sector water testing laboratory before installation of his tubewell. Most of the farmers told that for final decision regarding the depth of well, both in shallow tubewells and skimming tubewells, they relied on the technical expertise of the local drillers. Figures 6 and 7 show the distributions of depths in shallow and skimming tubewells, respectively.
When the field team consulted the local driller to know the bases of their decision regarding the depth of wells, they told that the farmers are only interested in high discharge and always demand a delivery pipe full of water. In this situation, they (drillers) use a high factor of safety by drilling deep wells and hence, maintain their business repute at the cost of farmer’s money. Most of the local drillers are also suppliers
Driller
58%
Farmer
40%
Technical Staff of Govt.
Agency2%
13
of the tubewell material and have their vested interest in quantity of material. As a result, the depth of the shallow tubewells has almost the same trend over the years (Figure 8).
Figure 6. Distribution of depth in shallow tubewells in the study area.
Figure 7. Distribution of depth in skimming tubewells in the study area.
0
5
10
15
20
25
30
35
40
15 m 18 m 21 m 24 m 27 m 30 m 32 m 34 m 37 m 38 m 40 m 43 m 46 m
Depth of Well
Num
ber
of S
hall
ow T
ubew
ells
0
2
4
6
8
10
12
9 m 10 m 11 m 12 m 14 m 15 m 17 m 18 m 27 m
Depth of Well
Num
ber
of S
kim
min
g T
ubew
ells
14
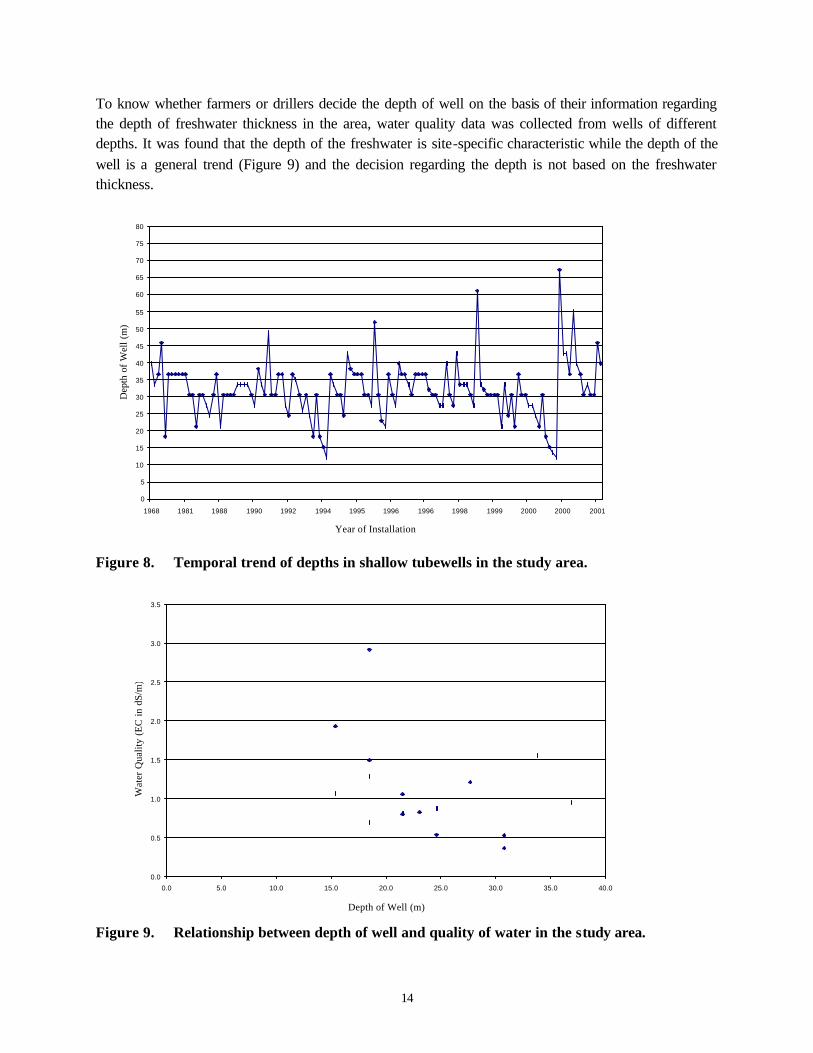
To know whether farmers or drillers decide the depth of well on the basis of their information regarding the depth of freshwater thickness in the area, water quality data was collected from wells of different depths. It was found that the depth of the freshwater is site-specific characteristic while the depth of the well is a general trend (Figure 9) and the decision regarding the depth is not based on the freshwater thickness.
Figure 8. Temporal trend of depths in shallow tubewells in the study area.
Figure 9. Relationship between depth of well and quality of water in the study area.
0
5
10
15
20
25
30
35
40
45
50
55
60
65
70
75
80
1968 1981 1988 1990 1992 1994 1995 1996 1996 1998 1999 2000 2000 2001
Year of Installation
Dep
th o
f W
ell (
m)
0.0
0.5
1.0
1.5
2.0
2.5
3.0
3.5
0.0 5.0 10.0 15.0 20.0 25.0 30.0 35.0 40.0
Depth of Well (m)
Wat
er Q
ualit
y (E
C i
n dS
/m)

15
4.2 NUMBER OF STRAINERS
The number of strainers in the study area varies from 1 to 26. The shallow tubewells are most popular among farmers. Figure 10 shows the distribution of number of strainers in skimming tubewells in the study area. In skimming tubewells, 10 and 18 strainers are also common. Farmers’ decision regarding the number of strainers in skimming tubewells is arbitrary. The farmers do not have any idea about the optimal number of strainers. In most of the cases, they have to depend on the local drillers who decide the number of strainers. Sometimes, farmers follow the neighboring well design taking into consideration the quantity and quality of water from that tubewell.
Figure 10. Distribution of skimming tubewells in the study area.
Most of the farmers and drillers have this miscomprehension that the discharge of well will increase with the number of strainers. Theoretically, this is true but, up to a certain number. The farmers also prefer to install more number of strainers with the intention that if some strainers have to be closed due to one or the other reasons, the remaining strainers will be functional without reducing discharge significantly. In general, farmers are interested to get high discharge. This seems to be a psychological decision rather than based upon the techno-economics. This maximum number of strainers in skimming tubewell in study area is 26 (Plate 5). The farmer reported that due to problem in strainers, he had to close 14 strainers and now only 12 strainers are in operation. He also reported that after closure of more than half strainers, the discharge of the tubewell is unchanged. There is general consensus among farming community that skimming tubewells are more vulnerable to get any sort of operational problem due to higher number of strainers. Plate 6 shows the 16-strainers skimming tubewell in the study area.
0
1
2
3
4
5
6
7
2 3 4 5 6 7 8 9 10 11 12 13 16 18 26
Number of Strainers
Num
ber
of W
ells

16
Plate 5. 26-strainers skimming tubewell in the study area.
Plate 6. 16-strainers skimming tubewell in the study area.
The indicator used by the farmers for tubewell discharge is the jet from the delivery pipe of the tubewell. A long jet was regarded as the high discharge. It is also observed that farmers refer the same discharge as high and low if it is coming out from small and large diameter pipes, respectively.
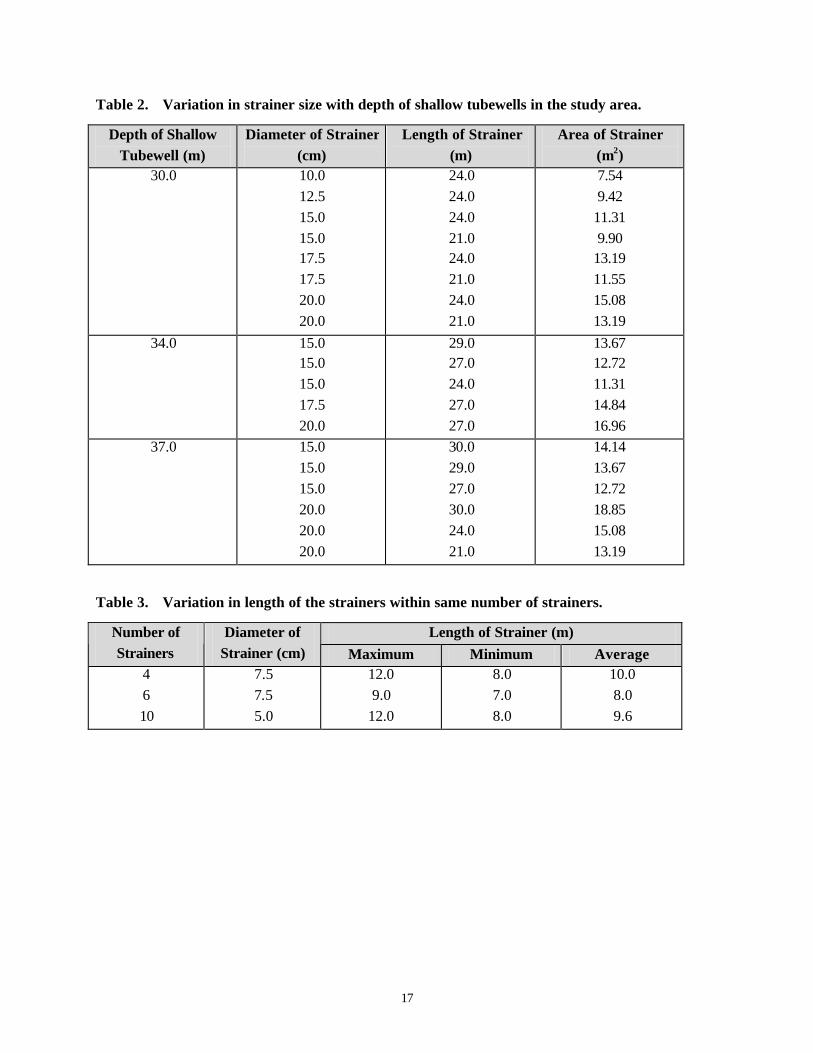
The size of strainer (diameter and length) also varies widely for the same depth of the skimming wells. Tables 2 and 3 show how the strainer diameter and length change with depth of the shallow and skimming tubewells, respectively. Framers and local drillers use large size strainers with the intention to get high discharge. The information regarding the size of the strainer and well discharge was collected in the study area. The data shows an irregular trend between total area of the strainers and well discharge in farmers’ shallow tubewells (Figure 11).
17
Table 2. Variation in strainer size with depth of shallow tubewells in the study area.
Depth of Shallow Tubewell (m)
Diameter of Strainer (cm)
Length of Strainer (m)
Area of Strainer (m2)
30.0
10.0 12.5 15.0 15.0 17.5 17.5 20.0 20.0
24.0 24.0 24.0 21.0 24.0 21.0 24.0 21.0
7.54 9.42
11.31 9.90
13.19 11.55 15.08 13.19
34.0 15.0 15.0 15.0 17.5 20.0
29.0 27.0 24.0 27.0 27.0
13.67 12.72 11.31 14.84 16.96
37.0 15.0 15.0 15.0 20.0 20.0 20.0
30.0 29.0 27.0 30.0 24.0 21.0
14.14 13.67 12.72 18.85 15.08 13.19
Table 3. Variation in length of the strainers within same number of strainers.
Length of Strainer (m) Number of Strainers
Diameter of Strainer (cm) Maximum Minimum Average
4 6 10
7.5 7.5 5.0
12.0 9.0
12.0
8.0 7.0 8.0
10.0 8.0 9.6

18
Figure 11. Variation in well discharge with area of strainer.
It is difficult to derive any conclusion from this, as there might be other factors like energy input, mechanical transmission, condition of strainers, aquifer properties, pump size and prime mover, etc., which could influence the well discharge.
4 .3 HORIZONTAL DISTANCE OF STRAINERS
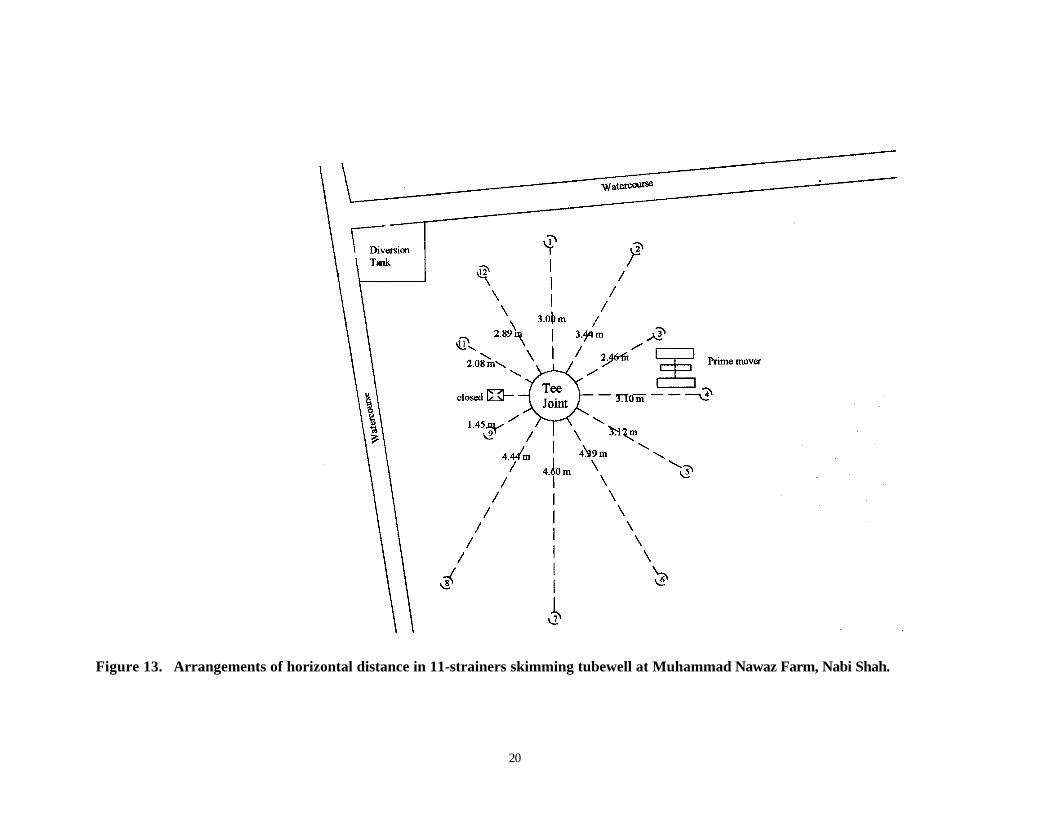
It is a common practice among farming community to install the strainers in skimming tubewells at the same depth but, at varying distances from the pump. In farmers’ perception, if the strainers are installed at the same horizontal distances, they will take the water of each other thereby reducing the overall discharge of the tubewell. In some cases, it is observed that farmers try to install the tubewell near the watercourse to facilitate the diversion of water and hence, install boreholes of that side at shorter distance from the center. Figures 12 and 13 shows the arrangement and horizontal distances in 16- and 11-strainers skimming tubewell, respectively. In 16-strainers, the horizontal distances range from 3.74 to 2.24 m with an average distance of 3.14 m. The reason for shortest distance of strainer no. 10 was due to the foundation of pulley. This pulley is used to transmit power from tractor’s power take off (PTO) shaft to the pump through flat belt. On the opposite side, the strainer lengths (strainer nos. 1, 2, 3, 15, and 16) have been reduced due to storage tank construction for delivery of pumped water. In 11-strainers skimming tubewell, the tee joint consists of 12 openings but, 11 were used. The horizontal distances range from 4.60 to 1.45 m with an average of 3.09 m. The distance of strainer nos. 1, 2, 9, 11 and 12 were reduced due to watercourses at two sides of the tubewell periphery.
0
2
4
6
8
10
12
14
16
0 5 10 15 20 25 30 35
Discharge of Skimming Well (lps)
Are
a of
Stra
iner
(m
2 )
Shallow Tubewell
Skimming Tubewell

19
Figure 12. Arrangements of horizontal distance in 16-strainers skimming tubewell at Muhammad Akram Farm, Nabi Shah .
20
Figure 13. Arrangements of horizontal distance in 11-strainers skimming tubewell at Muhammad Nawaz Farm, Nabi Shah.

21
4.4 PRIMING
The priming has been a major problem of a centrifugal pump and shallow and skimming tubewells in the study area are not exemption. During PRA, most of the farmers (about 62%) reported that they are facing the problem of priming in their skimming wells. This problem is more pronounced in skimming tubewells as compared to shallow tubewells. The PRA statistics shows that 75% of the total skimming well owners are facing problem of priming their wells while in shallow tubewells, this was 48%. During field visits, it was observed that the time taken to lift water in shallow tubewells varied from 5 to 20 minutes while in skimming tubewells it was from 10 to 40 minutes. In priming, the water is pored into the pumping unit through delivery pipe and the air is released through air-vent valve (Plate 7). The pump is then, operated and the practice is repeated until the pump lifts water. Theoretically, if there is no entrance of air into the pumping system or there is no leakage of pressure (suction), there must not be a problem of priming each time. Farmers could not explain the cause of this problem. They are of the view that the problem lies somewhere in the non-return valves. Most of the farmers have accepted this problem as a part of their pumping system.
Plate 7. Priming in skimming well.
4.5 WATER QUALITY
During the discussion, farmers told that the deep groundwater of their area is brackish due to which the lands are being deteriorated. Most of farmers assess the quality of tubewell water from the crop growth (88%), by tasting it (9%) and by laboratory testing (3%). They term the waters sweet and brackish on relative basis and compare it with the quality of canal water.
The saline water badly affects their crops and especially citrus gardens. The source of their knowledge is the white patches on the soil they observe after irrigating the fields with deep water. The other indictors

22
used by the farmers to assess the soil degradation are: (i) soil hardness, (ii) low germination rate, (iii) no crop, (iv) late field capacity condition, (v) stunted crop growth, and (vi) low infiltration rate. Most of the farmers with shallow tubewells complained that the water quality remains acceptable during first one or two years of tubewell installation but, deteriorates later on. They use the growth and fruit of their citrus gardens as an indicator to water quality. Their indicators could not be judged on scientific basis in the present study.
4.6 SAND IN PUMPED WATER
About 39% farmers reported sand in their pumped water. According to their version, the sand in the pumped water is due to large openings in the strainers or some cracks in the polyvinyl chloride (PVC) strainers. Farmers are not very much worried about the minor quantity of sand. They told that only excessive amount of sand might cause land subsidence and hence, collapse of borehole. When asked about the remedial measures to reduce or possibly stop it, they proposed using fine porous synthetic material to wrap the strainers. When the reasons of cracks in the strainers are discussed, they are of the view that large pumping unit (high suction) is the reason along with the low quality material (especially strainer and blind pipes). Regarding the quality of material, almost all the farmers depend upon the local drillers who provide material for farmers’ tubewells. It is observed that most of the tubewells pump fine sand for fraction of a minute only. Table 4 shows the sediments in pumped water during first 2 minutes of tubewell operation in reported skimming wells. In most of the tubewells, in which the sand problem was reported, the amount of sand was minute and could not be detected.
Table 4. Sand in the pumped water at reported skimming wells in the study area.
Strainers Specifications S. No.
Farmer Number Type Lengt
h (m) Year of
Installation
Sediment Load (gm/l)
1 Muhammad Akram 16 PVC 9.0 2000 7.13
2 Muhammad Nawaz 11 PVC 9.0 2000 10.52 3 Nasir Hussain 1 Jute Coir 24.0 1990 4.61
4 Ejaz Hussain 1 Jute Coir 24.0 1995 3.44
4.7 REDUCTION IN WELL DISCHARGE AND SUCTION B REAK
About 28% of the farmers in the study area reported reduction in well discharge after 2 to 4 hours of operation. The problem occurs both in shallow and skimming tubewells but, is more frequent in shallow tubewells. In one case, the problem occurred due to the breakage of blind pipe in skimming tubewell (Tariq Bashir Farm, 7 NB). Both, farmer and driller accepted that this happened due to the use of poor quality pipe. To detect damaged pipe (or strainer) in the skimming tubewells, farmers have developed their own methodology. Two methods are commonly used: (i) Pump is kept running and the hissing sound of the air is listened from the pipes. The pipe that has the leakage give the hissing sound. (ii) The pipe from each strainer is disjoined from the tee-joint and a hand pump assembly is attached to the pipe

23
(Figure 14). The hand pump is operated and if it does not lift water, the strainer is considered as non-functional. The non-functional strainers are repaired, replaced or plugged permanently. This method puts extra economical burden on the farmers as the horizontal pipes have to cut for hand pump installation and then, these pipes are rejoined together or some times have to replace. The authors of this report proposed a method to diagnose the problematic strainers. For this purpose, the pump is dismantled and outlets in the tee joint are closed with the help of some cloth or wooden peg. One outlet is opened and the tee joint is filled with water. If the water level in the tee joint reduces, this will indicate a leakage in the strainer. Otherwise, the next outlet is opened and tee joint is refilled with water. The same procedure is repeated until the defective strainer is found. The present method of using tee joint is economical and reduces the chances of leakage from new joints.
Figure 14. Farmer’s practice to diagnose the suction problem in skimming tubewell.
Pump Non-Return Valve
Tee Joint
Suction Pipe
Strainer
Delivery Pipe
24
5. DIAGNOSTIC ANALYSIS OF SKIMMING WELL PROBLEMS
The most reported problems during PRA were analyzed at farmers’ skimming wells. Local farmers were involved in the learning process. A rational and progressive diagnostic approach was adopted to enhance the farmers understanding regarding the problems with their skimming wells. The reasons of successes and failures were discussed with them. The main objective of this approach was that the farmers must own the outcomes of these diagnostic analyses.
5.1 DEPTH OF WELL
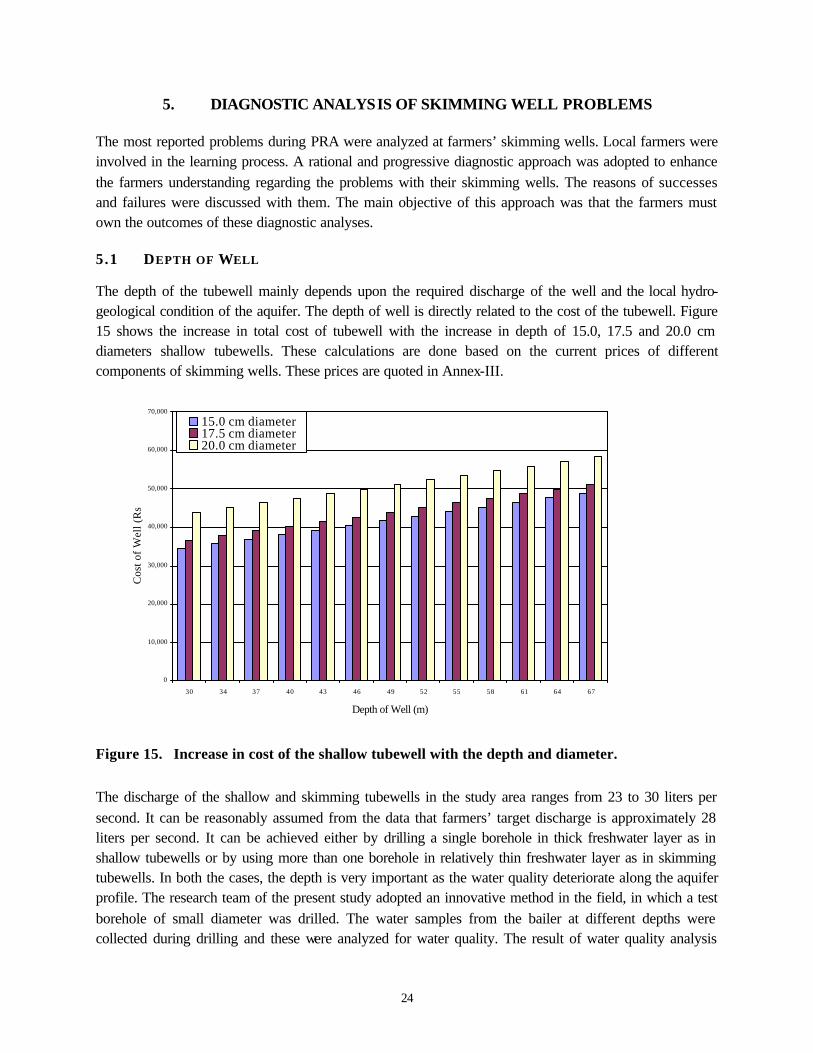
The depth of the tubewell mainly depends upon the required discharge of the well and the local hydro-geological condition of the aquifer. The depth of well is directly related to the cost of the tubewell. Figure 15 shows the increase in total cost of tubewell with the increase in depth of 15.0, 17.5 and 20.0 cm diameters shallow tubewells. These calculations are done based on the current prices of different components of skimming wells. These prices are quoted in Annex-III.
0
10,000
20,000
30,000
40,000
50,000
60,000
70,000
30 34 37 40 43 46 49 52 55 58 61 64 67
Depth of Well (m)
Cos
t of
Wel
l (R
s.)
15.0 cm diameter17.5 cm diameter20.0 cm diameter
Figure 15. Increase in cost of the shallow tubewell with the depth and diameter.
The discharge of the shallow and skimming tubewells in the study area ranges from 23 to 30 liters per second. It can be reasonably assumed from the data that farmers’ target discharge is approximately 28 liters per second. It can be achieved either by drilling a single borehole in thick freshwater layer as in shallow tubewells or by using more than one borehole in relatively thin freshwater layer as in skimming tubewells. In both the cases, the depth is very important as the water quality deteriorate along the aquifer profile. The research team of the present study adopted an innovative method in the field, in which a test borehole of small diameter was drilled. The water samples from the bailer at different depths were collected during drilling and these were analyzed for water quality. The result of water quality analysis
25
determines the depth of the well. If the water quality is acceptable at deeper depth, then a separate borehole of large diameter can be drilled for shallow tubewell. If the water quality is acceptable at shallow depth but deteriorates at deeper depth, then this small diameter test bore can be converted into one of the boreholes in skimming well. The strainer can be lowered up to the depth where the quality is good or marginal.
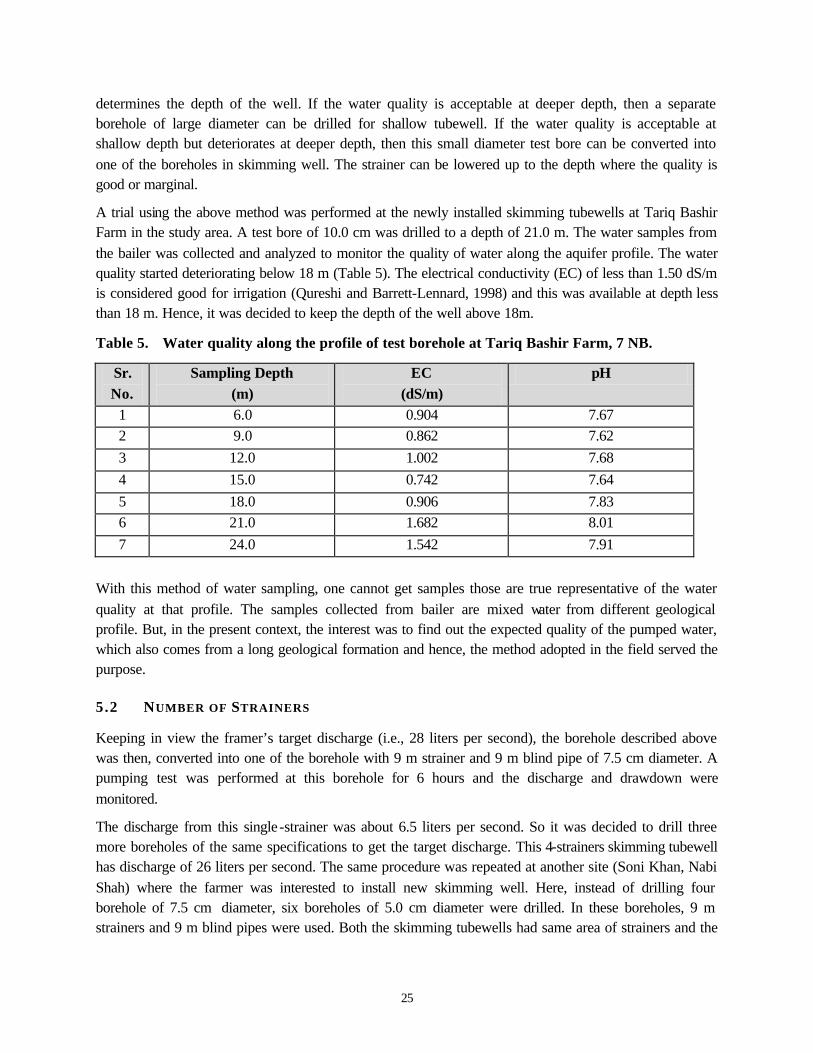
A trial using the above method was performed at the newly installed skimming tubewells at Tariq Bashir Farm in the study area. A test bore of 10.0 cm was drilled to a depth of 21.0 m. The water samples from the bailer was collected and analyzed to monitor the quality of water along the aquifer profile. The water quality started deteriorating below 18 m (Table 5). The electrical conductivity (EC) of less than 1.50 dS/m is considered good for irrigation (Qureshi and Barrett-Lennard, 1998) and this was available at depth less than 18 m. Hence, it was decided to keep the depth of the well above 18m.
Table 5. Water quality along the profile of test borehole at Tariq Bashir Farm, 7 NB.
Sr. No.
Sampling Depth (m)
EC (dS/m)
pH
1 6.0 0.904 7.67 2 9.0 0.862 7.62
3 12.0 1.002 7.68
4 15.0 0.742 7.64
5 18.0 0.906 7.83 6 21.0 1.682 8.01
7 24.0 1.542 7.91 With this method of water sampling, one cannot get samples those are true representative of the water quality at that profile. The samples collected from bailer are mixed water from different geological profile. But, in the present context, the interest was to find out the expected quality of the pumped water, which also comes from a long geological formation and hence, the method adopted in the field served the purpose.
5.2 NUMBER OF STRAINERS
Keeping in view the framer’s target discharge (i.e., 28 liters per second), the borehole described above was then, converted into one of the borehole with 9 m strainer and 9 m blind pipe of 7.5 cm diameter. A pumping test was performed at this borehole for 6 hours and the discharge and drawdown were monitored.
The discharge from this single-strainer was about 6.5 liters per second. So it was decided to drill three more boreholes of the same specifications to get the target discharge. This 4-strainers skimming tubewell has discharge of 26 liters per second. The same procedure was repeated at another site (Soni Khan, Nabi Shah) where the farmer was interested to install new skimming well. Here, instead of drilling four borehole of 7.5 cm diameter, six boreholes of 5.0 cm diameter were drilled. In these boreholes, 9 m strainers and 9 m blind pipes were used. Both the skimming tubewells had same area of strainers and the

26
discharges of these wells were almost the same. The distance of the strainers from center was about 3 m in both the skimming wells.
The number of strainers is also directly related to the cost of the skimming tubewells. Increase in number of strainers also increases the overall cost of the skimming tubewell Figure 16 shows the increase in cost with number of strainers for 5 and 7.5 cm diameters. The above method may help define more economical design of he skimming tubewell.
0
5,000
10,000
15,000
20,000
25,000
30,000
35,000
40,000
45,000
4 6 8 10 12 16
Number of Strainers
Cos
t of
Tub
ewel
l (R
s.)
5.0 cm diameter7.5 cm diameter
Figure 16. Increase in cost of skimming tubewell with number of strainers.
5.3 HORIZONTAL DISTANCES OF STRAINERS
The horizontal distances of the strainers depend upon the allowance, which the designer provides to allow the drawdown to overlap. Different field trials are being conducted in the field with different scenarios to see the effect of variation of horizontal distances of strainers on the well discharge and hence, to find the optimal distance of strainer from the center. The objective would be to spatially distribute the pumping stress so that saline water cone would not rise under any of the borehole.
5.4 PRIMING
It was observed that farmers in the study area are not following the conventional well design (Figure 17). In the conventional well design, the non-return valve is fixed at the lower end of the suction pipe. This valve holds the water in the suction pipe due to the weight of the water column in the pipe. In the farmer's shallow and skimming tubewells, the blind pipe is used directly as suction pipe and the non-return valve is fixed just below the centrifugal pump assembly on the suction side of the system (ref. Figure 1). The

27
present practice of skipping the suction pipe is to reduce the cost of the system. On the other hand, it might be one of the reasons to drop the water level from the blind pipe, as there is nothing to retain water in this pipe and hence, needs priming each time before operation. The use of suction pipes is observed only in the public sector skimming tubewells.
Figure 17. Schematic presentation of conventional tubewell.
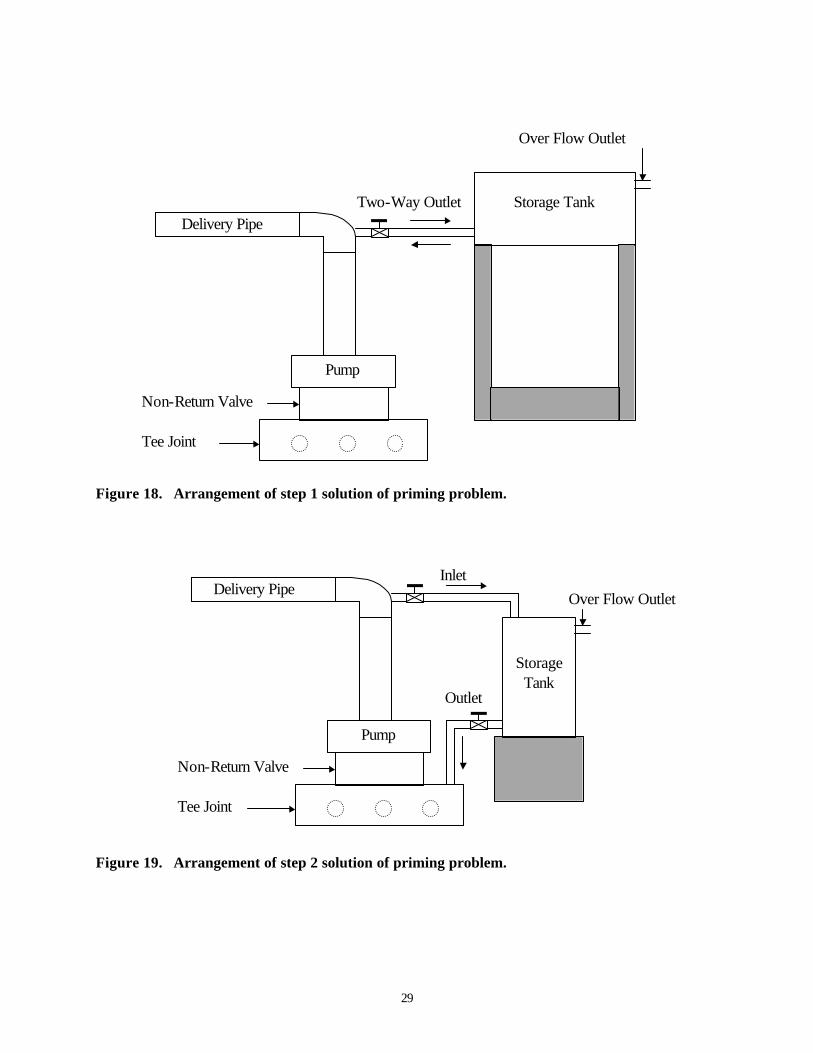
To provide state-of-the-art solution of the priming problem, different field trials were carried out. The possible causes of the drop in water level in blind pipes were discussed with farmers and evaluated accordingly. Starting with their assumption of leakage in non-return valve, a storage tank was attached with the delivery pipe of the well above the pump (Figure 18 and Plate 8). The tank was filled when the well was in operation and the stored water in the tank then, was used for priming purposes in next run. As there was unrestricted flow through the delivery pipe, only a small portion of the tank was filled due to less delivery head available. But, this was not enough to fulfill the need of priming. First, it is suggested that a gate-valve could be provided at the delivery pipe to restrict the flow. This was not recommended as
Non-Return Valve
Pump
Suction Pipe
Strainer
Blind Pipe
Delivery Pipe

28
this might cause damage to the pumping system if the operator was running the pump with delivery side closed by the gate valve. A very coarse method was used to close the delivery pipe with hands to restrict the flow. When this method was applied, there was an increase in the head, which filled the water tank to the level sufficient for priming. In the next run of the pump, the stored water was used instead of pouring the water through delivery pipe.
There was not much success in this system of priming. The time consumed to lift water by the pump was almost the same. This system only facilitated the priming procedure but, did not provide a solution. It was also observed that the water remained in the delivery system above the non-return valve, which clearly rejected the assumption that the leakage was through non-return valve.
The next step was to look below the non-return valve. It was considered that the water level in the blind pipes seeped out of the strainers into the aquifer to maintain water level in the surroundings and air took the place of water in the blind pipes. The source of air was unknown. It might be from some loose joints in the system. The second step to find some solution of the priming problem was based on the above explanation. This time, instead of filling the pump above delivery side, the system was modified to fill the blind pipes. For this, storage tank was attached with the delivery pipe and was filled during pumping (Figure 19 and Plate 9). An outlet from the tank was provided in the tee joint (where all the suction pipes joined together) to refill the blind pipes. Before running the pump, the water from the tank was released into the delivery pipes to fill them. It was observed that the volume of water in the storage tank was not that enough to fill the blind pipes fully (11 strainers of 5 cm diameter and 9 m each blind pipe at Muhammad Nawaz Farm, Nabi Shah). The reason might be the release of water into the aquifer from the strainers as the water tried to maintain the level in the system. This system would have worked if the size of the tank were larger and the water would have been poured instantaneously.
Working on the same problem, a third option very close to the conventional design of the wells was tried. The non-return valve below the pumping assembly was replaced with non-return valves between the blind and the strainer at each strainer (Figure 20). This option was tried at newly installed skimming tubewells of 4-strainers at Tariq Bashir Farm, 7 NB and 6-strainers skimming tubewell at Soni Khan Farm, Nabi Shah. This arrangement worked successfully and solved the problem of priming. The total expenditures on these valves were almost the same as that of conventional non-return valve but, it had benefits in terms of saving in fuel consumption and the time spent to prime tubewells without this arrangement.
29
Figure 18. Arrangement of step 1 solution of priming problem.
Figure 19. Arrangement of step 2 solution of priming problem.
Over Flow Outlet
Tee Joint Non-Return Valve
Pump
Storage Tank Two-Way Outlet
Tee Joint Non-Return Valve
Pump
Storage Tank
Inlet
Outlet
Over Flow Outlet
Delivery Pipe
Delivery Pipe

30
Plate 8. Arrangement of step 1 solution of priming.
Plate 9. Arrangement of step 2 solution of priming.

31
Figure 20. Schematic presentation of improved design of skimming well.
5.5 WATER QUALITY
The water quality of the pumped water mainly depends upon the design and operational parameters of the tubewell with reference to the hydro-geological environment of the region. In the design parameters, the depth of the well is of significant importance. The method adopted for deciding the depth of the well (in previous section) may help getting better quality of water. Moreover, the operational management strategies may help avoid extraction of poor quality water. These may include operating tubewell intermittently rather than continuously. For the study area, maximum six hours pumping per day was proposed (Ashraf et al., 2001). The intermittent pumping not only maintains the water quality but, also a minimum suction lift that helps get a relatively good discharge.
5.6 SAND IN PUMPED WATER
During diagnostic analyses, it was observed that the pumped water had sand in it for a very short period, only one or two minutes at the initial stage of pumping. The sieve analysis of sand collected during pumping showed that the particle size of sand was less than 0.40 mm. The one possible reason might be the use of commercially available strainer for all areas without considering the sand grading of the areas. Table 6 shows the percentage of different sand particles at different locations in the study area. The different proportions of finer sand particle demand customized well screen rather than general one. The
Pump
Non-Return Valve
Suction Pipe
Strainer
Delivery Pipe

32
use of same slot-size strainers may cause sand problem in media having high percentage of finer sand particles as compared to the media where the percentage of fine sand particles is low.
Table 6. Sand particle distribution at different locations in the study area.
MREP Farm
MN-93
MN-80 Nasir Farm Akram Farm
Tariq Farm
Nawaz Farm
Particle Size
(mm) Percentage of Different Sand Particles > 0.85 0 0 0 1 2 2 1
0.85 - 0.40 4 7 8 3 4 2 5
0.40 - 0.30 29 26 34 20 19 7 18
0.30 - 0.25 24 18 19 23 17 9 13 0.25 - 0.18 27 27 19 33 30 23 22
0.18 - 0.15 6 7 5 7 19 7 6
0.15 - 0.088 6 8 10 6 3 34 27
< 0.088 4 6 5 7 7 16 7
The other reasons, which may cause the sand in pumped water; (i) the coir string strainers becomes weak with the passage of time and also due to bacterial action and this result in string breakage, (ii) the joints in strainers and blind pipes become loose as a result of water hammer, (iii) small cracks in PVC pipes, which develop further with the vibration of pumping machinery, and (iv) fine silt particles enlarge the openings of the strainer while passing through them.
The small amount of finer particles cannot be avoided in the present practices and it did not have any significant effect either on pumping unit or on the quality of water (from irrigation point of view). Only in one case, heavy sand in pumped water caused land subsidence in the vicinity of shallow tubewell with jute wrapped coir strainer of 24.0 m length at village 7 NB.
5.7 REDUCTION IN WELL DISCHARGE AND SUCTION B REAK
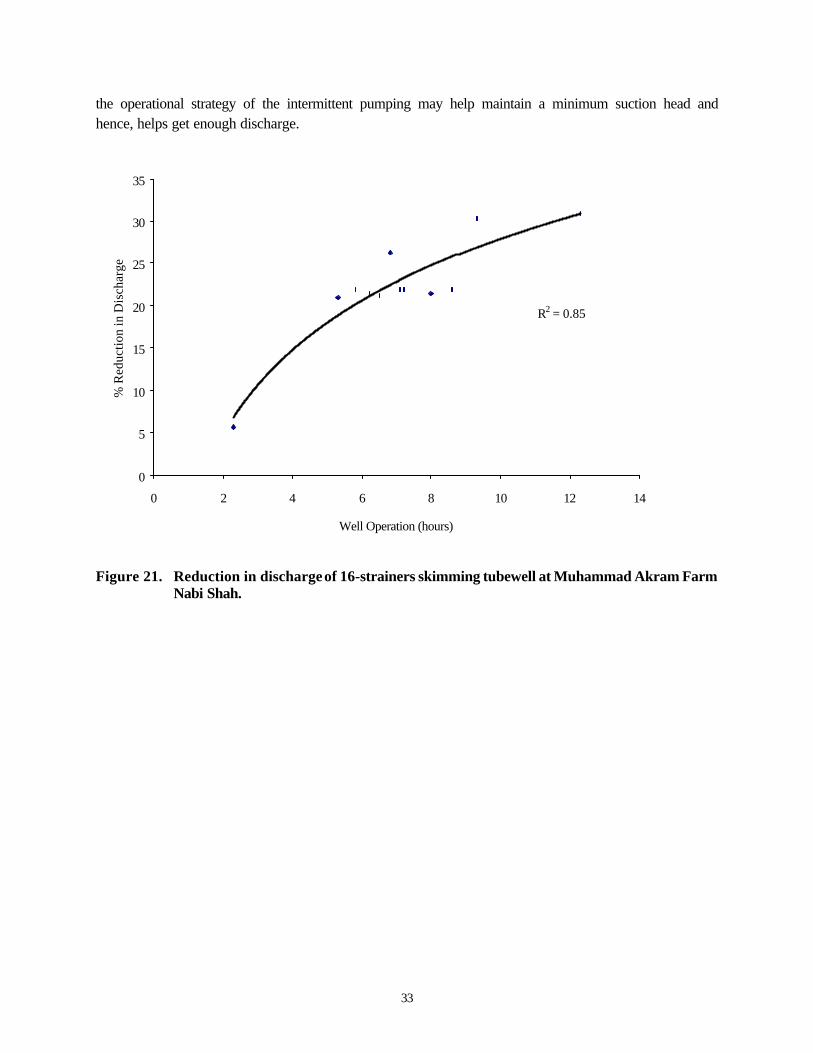
The reduction in well discharge was quantified by observing one skimming tubewell at farmer’s field. The well discharge was measured at the initial stage of pumping and just before closing the well operation. The reduction in discharge increased with the operational hours (Figure 21). The possible explanation is that the drawdown around the well increases for long operational hours and hence, the total head for the pump. From the pump characteristics, it is well established that the discharge of the pump will reduce if the total head is increased.
During well operation, as the drawdown exceeds below the depth of the blind pipe, the strainer may expose to air and suction break occurs in this borehole. In this case, the tubewell may stop lifting water due to entrapped air in the pump and complete suction break may occur. During diagnostic analysis, no single case is observed where the suction break occurred. High transmissivity of the aquifer under Indus basin do not support the farmer’s claim of suction break as well. If this happens at some place, this might be regarded as design problem of the well such as shorter blind pipe than expected drawdown. Moreover,
33
the operational strategy of the intermittent pumping may help maintain a minimum suction head and hence, helps get enough discharge.
Figure 21. Reduction in discharge of 16-strainers skimming tubewell at Muhammad Akram Farm
Nabi Shah.
R2 = 0.85
0
5
10
15
20
25
30
35
0 2 4 6 8 10 12 14
Well Operation (hours)
% R
educ
tion
in D
isch
arge
34
6. CONCLUSIONS
• Two types of skimming wells are used to supplement canal water supplies in the study area: shallow tubewell and skimming tubewells. Shallow tubewell are composed of single-strainer, whereas skimming tubewells are multi-stariners wells. The depth of skimming tubewell is usually half of the depth of shallow tubewell. The density of skimming wells is more between the middle and tail reach of the watercourses. Farmers started installing shallow tubewell in early seventies, and skimming tubewells were introduced after 1995 in the study area. Although, 70% skimming wells are shallow tubewell, but the growth of skimming tubewells increased rapidly recently, as 40% of the total skimming tubewells in the study area were installed during the year 2000-2001.
• There is a wide variation in the design of skimming tubewells: (i) number of strainers in skimming tubewells varies from 2 to 26, (ii) depth of well ranges from 15 to 46 m in shallow tubewell, and 9 to 27 m in skimming tubewells, and (iii) horizontal distance of strainers varies from 1.5 to 4.5 m from suction point in skimming tubewells. This reflects the absence of design code for these wells. Resultantly, farmers have to chose one of the design options provided by the local drillers, which usually have their business interest at priority rather than considering suitability of their design with the local geo-hydrological conditions. Furthermore, farmers are mainly concerned with quantity rather than the quality of pumped water, and their well design is highly influenced by this factor too.
• In skimming wells, though, several operational problems like (i) sand in pumped water, (ii) deterioration of water quality, and (iii) reduction in well discharge, were observed during this study. But, majority of the farmers reported the priming problem as their main operational problem. A systematic and step-by-step approach, similar to the one adopted in this study to diagnose and rectify this priming problem, can help improving skimming well technology. Such approach will enhance the farmers’ understandings regarding the problems with their skimming well technology, and will help developing such a learning environment that the farmers would start owning the outcomes of successes and failures while diagnosing and rectifying any problem associated with skimming well technology. However, any training program to improve skimming well technology must involve both the farmers and the drillers.
• The PRA techniques helped sharing information regarding the performance, practices and constraints with farmers’ skimming wells. Group discussions with farmers gave them confidence and huge information was shared during these group discussions, which farmers were reluctant to share during individual talks. Moreover, arranged group meetings proved more effective than surprise visits to farmers.

35
7. FOLLOW UP STUDIES
The present study identified and quantified problems related to farmers’ skimming wells. Some of these problems were solved with farmers’ participation. Other highly technical problems like well penetration with respect to fresh water thickness, number of strainers under given hydro-geological conditions, and horizontal distance between strainers need to defined and some general design and operational criteria need to be developed. For this purpose, field experimentations to monitor hydraulic performance and hydro-salinity behaviors of skimming wells of different configurations under different pumping regimes will be carried out in the same area. The experimental results will be used to calibrate MODFLOW and MT3D models. These models will be further used to evaluate different scenarios representing different hydrological conditions to formulate design and operational strategies for skimming wells.
36
REFERENCES
Ashraf, M. M. Aslam, M.M. Saeed and M.S. Shafique. 2001. Effect of Intermittent Pumping on the Water Quality of the Multi-Strainer Skimming Wells. Proceeding: Second National Drainage Workshop, 18-19 April, University of Agriculture, Faisalabad, Pakistan.
Ayers, H.D., A.G. Bennett, G.L. Calver, E.H. Hobbs, J.J. Kennelly, M.H. Khan, E.L. Menzie, and M.S. Pal. 1985. Agriculture in Pakistan: A Review of Performance and Prospects. A Report Prepared for Canadian International Development Agency, 200 Promenade Du Portage, Hull. Quebec, Canada.
Bandaragoda, D.J. and G.R. Firdousi. 1992. Institutional Factors Irrigation Performance in Pakistan: Research and Policy Priorities. IIMI – Country Paper – Pakistan No. 4, International Irrigation Management Institute, Colombo, Sri Lanka.
Javaid, M.A., M. Javed, C.K. Ali, and M.I. Khan. 1997. Groundwater Quality Assessment for Monitoring Sodium Hazard of SCARP and Private Tubewell Irrigation. Proceeding International Symposium ‘Water for the 21st Century. Centre of Excellence in Water Resources Engineering, University of Engineering and Technology, Lahore, June 17-19, 1997, pp.503-508.
Knops, J.A.C. 1997. Introduction to the Topic of ‘Farmers’ Participation in Drainage’. Proceedings National Experts Consultation on Farmers’ Participation in Drainage, 10 July, International Waterlogging and Salinity Research Institute (IWASRI), Lahore, Pakistan.
Masood, S. and C.M. Ashraf. 1997. Role of Farmer Organizations in Installation and Management of Community Tubewells under Second SCARP Transition Project. Paper No. 6, Proceedings National Experts Consultation on Farmers’ Participation in Drainage, 10 July, International Waterlogging and Salinity Research Institute (IWASRI), Lahore, Pakistan.
NESPAK-MMI. 1995. Feasibility Study National Drainage Program. Volume 1: Main Report.
Qureshi, R.H. and E.G. Barrett-Lennard. 1998. Saline Agriculture for Irrigated Land in Pakistan: A Handbook. Australian Centre of International Agricultural Research, Canberra, Australia; p. 35.
Rafiq, M., A. Beg, and J.A.C. Knops. 1997. Farmer’s Participation in Drainage. Proceeding International Symposium ‘Water for the 21st Century. Centre of Excellence in Water Resources Engineering, University of Engineering and Technology, Lahore, June 17-19, 1997, pp.5.03-508.
World Bank. 1994. Pakistan Irrigation and Drainage: Issues and Options. World Bank Report No. 11884-Pak, Washington, D.C., USA.

37
ANNEX-1. QUESTIONNAIRE FOR FARMERS’ INTERVIEWS
Interview date: Farmer’s Name: Village: Land holding (acres): Area of citrus garden (if any): Total canal irrigation turn time (hours):
Location of land with reference to canal outlet (Head \ Middle \ Tail):
(a) Technical Data of Skimming Well
Number of strainers: Depth of well (m): Diameter of well (cm): Length of strainer (m): Type of strainer: Distance of strainers from pump: Pump size: Type and horsepower of prime mover (Tractor \ Diesel Engine)
Mode of transmission (Belt Driven \ Mono Block \ PTO): Average fuel consumption (liter per hour): Well discharge (liter per second): Water quality:
EC: pH:
Total installation cost (Rs.): Year of installation:
(b) Farmers’ Perception to Opt Skimming Well Technologies
What is the main reason to install tubewell?
What is the main reason to select shallow tubewell\skimming tubewell\dug well? What is his opinion while comparing different types of skimming wells (shallow tubewell\skimming tubewell\dug well\radial well)? How does he categorize these systems? Does this categorization influence his decision making process? How does he recognize the water quality? How does he recognize the salinity/sodicity problem in soils? How does he manage the salinity/sodicity problem in the soils?

38
(c) Farmers’ Practices to Design and Operate Skimming Wells
How does he decide the depth of well? How does he decide the diameter of the well? How does he decide the number of strainers? How does he decide the horizontal distances between strainers? How does he decide the size of pump and prime mover?
Does the present tubewell serve any specific purpose? Is he satisfied with the canal supplies? If not, what are his comments? How does the canal supplies be improved? What are normal operating hours of the well? How does he manage or mitigate the water quality of the well (in case of poor groundwater quality)?
(d) Problem with Farmers’ Skimming Wells
What is the most pinching problem with his system? How does he manage it? How much time it will take to lift water (priming time)?
Farmers Timing (min):
Physical Verification (min.): Does the well discharge reduce after some time?
Farmers Comments: Physical Verification:
What are other problems with his system (other than discussed above)? Are the local experts available to solve these problems? What sort of help he needs from government/professional organizations?

39
ANNEX-II. FARMER’S SKIMMING WELL PRACTICES IN STUDY AREA
Table A-2.1 Farmers’ Skimming Well Practices at Village 6 ML, Tehsil Bhalwal, District Sargodha, Pakistan
Table A-2.2 Farmers’ Skimming Well Practices at Village Nabi Shah, Tehsil Bhalwal, District Sargodha, Pakistan
Table A-2.3 Farmers’ Skimming Well Practices at Village 6 SB, Tehsil Bhalwal, District Sargodha, Pakistan
Table A-2.4 Farmers’ Skimming Well Practices at Village Thatti Noor, Tehsil Bhalwal, District Sargodha, Pakistan

40
Table A-2.1. Farmers' Skimming Well Practices at Village 6 ML, Tehsil Bhalwal, District Sargodha, Pakistan.
S. Farmer's Name Father's Name Land Location of Well Specifications Prime Mover Year of Apprx. Cost
No. Holding Land from No. of Depth Diameter Strainer Length Pump Size
(Delivery/Suction) Type Horse Fuel
Consumption Installation (Rs.)
(Acres) Canal Outlet Strainers (m) (ft) (cm) (inch) (m) (ft) (cm) (inch) Power (lph)
1 Nazzar Muhammad - 12.5 Tail 1 37 120 20.0 8 30 100 12.5/15.0 5/6 Tractor 50 3.50 1996 28,000
2 Muhammad Anwar Sultan Ahmed 40.0 Tail 1 30 100 20.0 8 24 80 12.5/15.0 5/6 Engine 16 2.00 1996 38,500
3 Khizar Hayyat Panday Khan 37.0 Tail 1 30 100 20.0 8 24 80 12.5/15.0 5/6 Engine 16 2.00 1993 30,000
4 Mian Akram Khan Muhammad 12.5 Head 1 30 100 17.5 7 24 80 12.5/15.0 5/6 Engine 18 2.00 1991 27,000
5 Nassar Ullah Muhammad Inyat 10.0 Middle 1 30 100 17.5 7 21 70 12.5/15.0 5/6 Engine 16 2.00 1992 40,000
6 Mazhar Hayyat Khuda Bukhsh 10.0 Middle 1 30 100 15.0 6 24 80 12.5/15.0 5/6 Tractor 50 3.00 1999 21,000
7 Allah Bukhsh - 4.5 Middle 1 30 100 15.0 6 21 70 12.5/15.0 5/6 Engine 18 2.00 1988 22,000
8 Shamshad Khan Ahmed Sher 50.0 Middle 1 30 100 15.0 6 24 80 12.5/15.0 5/6 Engine 16 2.00 1992 20,000
9 Shamshad Khan Ahmed Sher 12.5 Head 1 30 100 15.0 6 24 80 12.5/15.0 5/6 Engine 16 2.00 2000 30,000
10 Shamshad Khan Ahmed Sher 25.0 Middle 1 30 100 15.0 6 24 80 12.5/15.0 5/6 Engine 16 2.00 1988 28,000
11 Mumtaz Hussain Fazal Hussain 7.0 Tail 1 30 100 10.0 4 24 80 10.0/12.5 4/5 Engine 16 2.00 1982 12,000
12 Muhammad Siddique Sher Muhammad 18.0 Tail 1 27 90 20.0 8 18 60 12.5/15.0 5/6 Engine 16 2.00 1996 40,000
13 Muhammad Hussain Ghulam Hussain 12.5 Middle 1 21 70 20.0 8 15 48 12.5/15.0 5/6 Engine 16 1.50 1999 35,000
14 Ikram Ullah Khan Muhammad Inyat 7.5 Middle 1 18 60 20.0 8 23 75 12.5/15.0 5/6 Engine 16 2.00 1993 29,000
15 Zulifqar Ali - 15.0 Middle 1 18 60 17.5 7 27 90 15.0/17.5 6/7 Tractor 50 2.00 2000 30,000
16 Muhammad Hayyat - 6.0 Head 1 15 50 15.0 6 14 45 12.5/15.0 5/6 Engine 16 1.75 2000 45,000
17 Ghulam Hussain - 5.0 Tail 1 15 50 12.5 5 18 60 10.0/12.5 4/5 Engine 16 2.00 1994 20,000
18 Muhammad Nazir - 9.0 Middle 1 14 45 20.0 8 20 65 12.5/15.0 5/6 Engine 16 2.00 2000 45,000
19 Fayyaz Ahmad Muhammad Hussain 18.0 Middle 1 12 40 20.0 8 23 75 15.0/17.5 6/7 Tractor 50 3.00 1994 20,000
20 Raja Liaqat - 19.0 Middle 1 12 40 15.0 6 18 60 12.5/15.0 5/6 Tractor 50 4.00 2000 40,000
21 Ahmad Sher Sarwar Chitiana 18.0 Tail 3 27 90 10.0 4 12 40 10.0/12.5 4/5 Engine 12 2.00 1991 20,000
22 Muhammad Aslam - 9.0 Middle 5 15 50 10.0 4 8 26 10.0/12.5 4/5 Engine 16 2.00 1999 44,000
23 Muhammad Yar Muhammad Hayyat 12.5 Tail 6 17 55 7.5 3 9 30 12.5/15.0 5/6 Engine 16 2.00 2000 36,000
24 Gulzar Ahmad Ata Muhammad 17.0 Middle 6 14 45 7.5 3 8 25 12.5/15.0 5/6 Tractor 50 3.00 2000 20,000
25 Khushi Muhammad Fazal Hussain 8.0 Middle 6 14 45 7.5 3 8 25 12.5/15.0 5/6 Engine 16 2.00 2000 32,000
26 Mirza Nasir - - Tail 6 12 40 7.5 3 7 22 12.5/15.0 5/6 Engine 12 1.50 1997 50,000
27 Naseer Ahmed - 12.5 Middle 7 14 45 7.5 3 8 26 12.5/15.0 5/6 Tractor 50 3.50 2000 18,000
28 Naseer Ahmed - 57.5 Middle 7 14 45 7.5 3 8 26 12.5/15.0 5/6 Tractor 50 3.50 1998 30,000
29 Muhammad Aslam Sher Muhammad 20.0 Tail 7 12 40 5.0 2 8 25 12.5/15.0 5/6 Engine 16 2.00 2000 28,500
30 Raja Saleem Muhammad Sarwar 12.5 Middle 8 12 40 10.0 4 8 25 12.5/15.0 5/6 Engine 18 2.00 2000 55,000
31 Mian M. Akram Khan Muhammad 37.5 Tail 12 12 40 5.0 2 6 20 12.5/15.0 5/6 Tractor 50 3.00 2000 12,000

41
Table A-2.2 Farmers' Skimming Well Practices at Village Nabi Shah, Tehsil Bhalwal, District Sargodha, Pakistan.
S. Farmer's Name Father's Name Land Location of Well Specifications Prime Mover Year of Apprx. Cost
No. Holding Land from No. of Depth Diameter Strainer Length
Pump Size (Delivery/Suction) Type Horse
Fuel Consumption Installation (Rs.)
(Acres) Canal Outlet Strainers (m) (ft) (cm) (inch) (m) (ft) (cm) (inch) Power (lph)
1 Imtiaz Hussain Ranjha Shah 15.0 Uncommanded 1 46 150 17.5 7 37 120 15.0/17.5 6/7 Tractor 50 4.00 2001 34,700
2 Usman Noon - 19.0 Middle 1 43 140 20.0 8 34 110 15.0/17.5 6/7 Tractor 50 4.00 1998 26,000
3 Usman Noon - 19.0 Middle 1 43 140 20.0 8 34 110 15.0 /17.5 6/7 Engine 22 3.00 1995 45,000
4 Kazam Hussain Haider Shah 13.5 Tail 1 40 130 17.5 7 34 110 15.0/17.5 6/7 Tractor 50 4.00 2001 33,500
5 Najum-ul-Hasan Muhammad Hussain 4.0 Tail 1 40 130 15.0 6 34 110 12.5/15.0 5/6 Engine 16 2.50 1997 36,000
6 Ghulam Abbas - 37.5 Middle 1 38 125 15.0 6 30 100 15.0/15.0 6/6 Tractor 50 3.50 1991 17,500
7 Najum-ul-Hasan Muhammad Hussain 4.0 Middle 1 38 125 15.0 6 32 105 12.5/15.0 5/6 Engine 16 2.00 1995 34,000
8 Munir Hussain Hakim Shah 11.0 Uncommanded 1 37 120 15.0 6 30 100 12.5/15.0 5/6 Engine 16 2.50 1992 28,600
9 Imtiaz Hussain Ranjha Shah 20.0 Tail 1 37 120 15.0 6 27 90 12.5/15.0 5/6 Engine 16 2.50 1996 31,000
10 Riaz Hussain Ranjha Shah 13.5 Tail 1 37 120 15.0 6 27 90 12.5/15.0 5/6 Engine 16 2.50 1993 30,000
11 Imtiaz Hussain Ranjha Shah 17.0 Tail 1 37 120 15.0 6 27 90 12.5/15.0 5/6 Engine 16 2.50 1992 30,000
12 Sajjad Hussain Haider Shah 16.0 Tail 1 37 120 15.0 6 29 95 12.5/15.0 5/6 Engine 16 2.50 1995 31,000
13 Anwar Hussain Najaf Shah 19.0 Tail 1 37 120 15.0 6 29 95 12.5/15.0 5/6 Engine 16 2.50 1995 32,000
14 Taib Shah Nawab Shah 5.0 Tail 1 37 120 15.0 6 30 100 12.5/15.0 5/6 Engine 16 2.50 1995 33,000
15 Sajjad Hussain Haider Shah 25.0 Tail 1 35 115 15.0 6 27 90 12.5/15.0 5/6 Engine 16 2.50 1993 30,000
16 Ameer Hussain Nazzar Hussain 19.5 Middle 1 34 110 17.5 7 27 90 15.0/17.5 6/7 Tractor 50 3.00 1999 24,000
17 Sabir Hussain - 26.0 Middle 1 34 110 17.5 7 27 90 12.5/15.0 5/6 Tractor 50 4.00 1990 16,500
18 Asif Abbas Mulazam Hussain 23.0 Tail 1 34 110 17.5 7 27 90 15.0/17.5 6/7 Tractor 50 4.00 1990 25,000
19 Nisar Hussain - 25.0 Tail 1 34 110 17.5 7 27 90 15.0/17.5 6/7 Tractor 50 4.00 1998 23,000
20 Amir Husaain Nazzar Hussain 20.0 Middle 1 34 110 17.5 7 27 90 15.0/17.5 6/7 Tractor 50 4.00 1998 23,000
21 Munir Hussain Khadam Hussain 9.0 Tail 1 34 110 15.0 6 27 90 12.5/15.0 5/6 Engine 16 2.00 1994 33,000
22 Qasim Ali Fateh Muhammad 4.5 Uncommanded 1 34 110 15.0 6 27 90 12.5/15.0 5/6 Engine 16 1.50 1998 37,500
23 Muhammad Yaqoob Bati Khan 8.0 Tail 1 34 110 15.0 6 27 90 12.5/15.0 5/6 Engine 16 2.00 1990 28,000
24 Ghulam Abbas Riaz Ahmed 8.0 Uncommanded 1 34 110 15.0 6 27 90 12.5/15.0 5/6 Engine 16 2.50 2000 39,000
25 Raza Shah Haider Shah 25.0 Uncommanded 1 34 110 15.0 6 27 90 12.5/15.0 5/6 Engine 16 2.50 1991 28,500
26 Zawar Hussain Karam Shah 30.0 Uncommanded 1 34 110 15.0 6 29 95 12.5/15.0 5/6 Engine 16 2.50 1970 Govt Grant
27 Zia-ul-Hasan Tasadaq Hussain 30.0 Tail 1 34 110 15.0 6 24 80 12.5/15.0 5/6 Engine 16 2.50 1990 27,000
28 Nazzar Hussain Shahabel Shah 7.5 Tail 1 32 105 15.0 6 27 90 12.5/15.0 5/6 Engine 16 2.00 1999 38,000
29 Ashaq Hussain Shahabel Shah 10.5 Middle 1 32 105 15.0 6 24 80 12.5/15.0 5/6 Tractor 50 3.50 1996 14,000
30 Manzer Hussain - 28.0 Tail 1 30 100 17.5 7 24 80 15.0/17.5 6/7 Tractor 50 3.50 1986 15,000
31 Murad Shah Zaman Shah 6.0 Tail 1 30 100 15.0 6 24 80 12.5/15.0 5/6 Tractor 50 4.00 1996 21,000
32 Zawar Hussain - 12.0 Tail 1 30 100 15.0 6 24 80 12.5/15.0 5/6 Engine 16 2.25 1994 32,600
33 Haider Shah Zaman Shah 18.0 Tail 1 30 100 15.0 6 24 80 12.5/15.0 5/6 Engine 16 2.00 1986 24,000
34 Ghulam Raza Muhammad Shah 14.0 Tail 1 30 100 15.0 6 24 80 12.5/15.0 5/6 Engine 16 2.00 1999 37,000

42
Table A-2.2 (continued) S. Farmer's Name Father's Name Land Location of Well Specifications Prime Mover Year of Apprx. Cost
No. Holding Land from No. of Depth Diameter Strainer Length
Pump Size (Delivery/Suction) Type Horse
Fuel Consumption Installation (Rs.)
(Acres) Canal Outlet Strainers (m) (ft) (cm) (inch) (m) (ft) (cm) (inch) Power (lph)
35 Mohsin Hussain Ghulam Shabbir 7.5 Tail 1 30 100 15.0 6 24 80 12.5/15.0 5/6 Engine 16 1.50 1988 28,000
36 Ejaz Hussain - 7.5 Tail 1 30 100 15.0 6 24 80 12.5/15.0 5/6 Engine 16 2.00 1995 33,500
37 Imdad Hussain - 7.5 Tail 1 30 100 15.0 6 24 80 12.5/15.0 5/6 Tractor 50 3.50 1999 25,600
38 Ejaz Hussain - 12.0 Tail 1 30 100 15.0 6 24 80 12.5/15.0 5/6 Tractor 50 3.50 2000 22,000
39 Nazzar Hussain - 7.5 Tail 1 30 100 15.0 6 24 80 12.5/15.0 5/6 Engine 16 2.00 1996 35,000
40 Abu-ul-Hasan Alam Shah 20.0 Uncommanded 1 30 100 15.0 6 24 80 12.5/15.0 5/6 Engine 16 2.25 1989 26,000
41 Ghulam Raza Pehlwan Shah 16.0 Middle 1 30 100 15.0 6 24 80 12.5/15.0 5/6 Engine 16 2.50 1993 22,000
42 Sajjad Hussain Lal Shah 30.0 Middle 1 30 100 15.0 6 24 80 12.5/15.0 5/6 Tractor 50 3.50 1999 15,000
43 Ghulam Hussain Bahader Shah 11.5 Middle 1 30 100 15.0 6 24 80 12.5/15.0 5/6 Engine 12 2.00 1983 15,000
44 Nasir Hussain Khadam Hussain 16.0 Middle 1 30 100 15.0 6 24 80 10.0/12.5 4/5 Engine 16 2.00 2000 CTW
45 Zia-ul-Hasan Tasadaq Hussain 40.0 Tail 1 30 100 15.0 6 24 80 12.5/15.0 5/6 Engine 18 2.00 1997 33,000
46 Naser Abbas Nawab Shah 7.0 Tail 1 30 100 15.0 6 24 80 12.5/15.0 5/6 Engine 16 2.50 1999 31,000
47 Mumtaz Hussain Hussain Shah 32.5 Head 1 30 100 15.0 6 24 80 12.5/15.0 5/6 Engine 16 2.50 1995 32,000
48 Naser Abbas Nawab Hussain 10.0 Head 1 30 100 15.0 6 24 80 12.5/15.0 5/6 Engine 16 2.00 1994 29,000
49 Sarwar Hussain - 3.0 Tail 1 30 100 12.5 5 24 80 10.0/12.5 4/5 Engine 16 2.00 1998 36,600
50 Nasir Hussain Khadam Hussain 9.0 Tail 1 30 100 12.5 5 24 80 12.5/15.0 5/6 Engine 16 2.00 1990 25,000
51 Shah Sultan Sattar Hussain 15.0 Tail 1 30 100 12.5 5 24 80 12.5/15.0 5/6 Engine 16 2.00 1989 21,000
52 Ejaz Hussain - 18.0 Middle 1 27 90 15.0 6 21 70 12.5/15.0 5/6 Engine 16 2.00 1990 27,000
53 Zaman Shah Muhammad Shah 12.5 Middle 1 27 90 15.0 6 21 70 12.5/15.0 5/6 Engine 16 2.50 1996 35,000
54 Altaf Hussain Nazzar Hussain 20.0 Tail 1 27 90 15.0 6 21 70 12.5/15.0 5/6 Engine 16 2.00 1997 35,000
55 Mulazam Hussain Mehdi Hasan Shah 25.0 Uncommanded 1 27 90 15.0 6 21 70 12.5/15.0 5/6 Engine 16 2.00 1992 29,000
56 Mulazam Hussain - 15.5 Tail 1 27 90 15.0 6 21 70 12.5/15.0 5/6 Engine 16 2.00 1996 32,000
57 Mulazam Hussain Najaf Shah 13.0 Tail 1 27 90 15.0 6 21 70 12.5/15.0 5/6 Engine 16 2.00 1995 31,000
58 Nazzar Hussain Zaman Shah 10.0 Head 1 27 90 15.0 6 21 70 12.5/15.0 5/6 Engine 16 2.00 1998 32,000
59 Ibn-ul-Hasan Nawab Shah 4.0 Tail 1 27 90 12.5 5 21 70 10.0/12.5 4/5 Engine 12 2.00 1987 22,000
60 Khadam Hussain Mohsin Ali 12.5 Uncommanded 1 26 85 15.0 6 21 70 12.5/15.0 5/6 Engine 16 2.00 1993 31,000
61 Ghulam Hussain Bahadar Shah 20.0 Uncommanded 1 24 80 15.0 6 18 60 12.5/15.0 5/6 Engine 16 1.50 1987 24,500
62 Sattar Hussain Deewan Shah 9.0 Tail 1 24 80 15.0 6 18 60 12.5/15.0 5/6 Engine 16 2.25 1994 31,500
63 Najaf Shah Murad Shah 7.0 Tail 1 24 80 12.5 5 18 60 10.0/12.5 4/5 Engine 16 2.00 1992 31,000
64 Ghulam Abbas Syed Amir Shah 7.5 Middle 5 18 60 7.5 3 12 40 12.5/15.0 5/6 Tractor 50 4.00 2001 16,000
65 Muhammad Nawaz Ahmed Din 35.0 Middle 10 15 50 5.0 2 8 26 12.5/15.0 5/6 Engine 16 2.50 2000 31,000
66 Muhammad Nawaz Ahmed Din 35.0 Middle 11 15 50 5.0 2 9 30 12.5/15.0 5/6 Tractor 50 4.00 2000 22,000
67 Mohammad Akram Mirza Khan 19.5 Middle 16 15 50 5.0 2 12 39 15.0/17.5 6/7 Tractor 50 3.50 2000 22,000

43
Table A-2.3 Farmers' Skimming Well Practices at Village 6 SB, Tehsil Bhalwal, District Sargodha, Pakistan.
S. Farmer's Name Father's Name Land Location of Well Specifications Prime Mover Year of Apprx. Cost
No. Holding Land from No. of Depth Diameter Strainer Length Pump Size (Delivery/Suction) Type Horse Fuel Consumption Installation (Rs.)
(Acres) Canal Outlet Strainers (m) (ft) (cm) (inch) (m) (ft) (cm) (inch) Power (lph)
1 Muhammad Akram Pir Muhammad 33.0 Tail 1 37 120 15.0 6 30 100 12.5/15.0 5/6 Engine 16 1.50 1988 24,000
2 Asad Ullah Muhammad Afzal 19.0 Middle 1 34 110 12.5 5 21 70 12.5/15.0 5/6 Engine 16 1.50 1999 34,000
3 Muzaffar Hussain Ahmed Khan 15.0 Middle 1 30 100 17.5 7 24 80 12.5/15.0 5/6 Tractor 16 2.00 1996 55,000
4 Muhammad Yaqoob Bugha Khan 12.5 Middle 1 30 100 17.5 7 24 80 12.5/15.0 5/6 Engine 50 2.00 1993 23,000
5 Ghulam Murtaza Ghulam Hussain 16.5 Head 1 30 100 15.0 6 24 80 12.5/15.0 5/6 Tractor 16 2.00 2000 40,000
6 Asad Ullah Ghulam Rasool 6.5 Head 1 30 100 15.0 6 24 80 12.5/15.0 5/6 Tractor 16 2.00 2000 40,000
7 Khuda Dad - 5.5 Tail 1 27 90 15.0 6 21 70 10.0/12.5 4/5 Engine 16 1.00 2000 32,500
8 Muhammad Fayyaz Muhammad Nawaz 8.0 Head 1 27 90 12.5 5 21 70 12.5/15.0 5/6 Engine 16 1.50 2000 35,000
9 Ghulam Hussain Mahla Khan 12.5 Tail 1 24 80 17.5 7 18 60 12.5/15.0 5/6 Tractor 50 3.00 2000 22,000
10 Ejaz Hussain - 25.0 Middle 1 24 80 15.0 6 18 60 12.5/15.0 5/6 Engine 16 1.50 1993 32,000
11 Altaf Hussain - 200.0 Head/Middel/Tail 1 24 80 12.5 5 18 60 10.0/12.5 4/5 Engine 12 1.50 1999 N/A
12 Khalid Mehmood Muhammad Zaman 5.5 Tail 1 23 75 12.5 5 17 55 10.0/12.5 4/5 Engine 16 1.50 1996 31,000
13 Altaf Hussain Same as S. No. 11 1 21 70 15.0 6 12 40 12.5/15.0 5/6 Engine 16 2.00 1985 N/A
14 Altaf Hussain Same as S. No. 11 1 21 70 15.0 6 15 50 12.5/15.0 5/6 Engine 16 2.50 1988 N/A
15 Abid Hussain - 9.5 Middle 1 21 70 12.5 5 12 40 10.0/12.5 4/5 Engine 16 1.50 2000 36,000
16 Gul Muhammad Murrad Bukhsh 12.5 Tail 1 21 70 12.5 5 15 50 10.0/12.5 4/5 Engine 16 1.75 1998 35,000
17 Shabir Hussain - 12.5 Tail 1 21 70 12.5 5 15 50 10.0/12.5 4/5 Engine 16 1.50 1996 30,000
18 Ghulam Haider Buhadar Khan 12.5 Tail 1 18 60 17.5 7 12 40 12.5/15.0 5/6 Engine 50 2.25 1993 20,000
19 Altaf Hussain Same as S. No. 11 1 18 60 15.0 6 12 40 12.5/15.0 5/6 Engine 16 2.00 1981 N/A
20 Raja Auranzeb Muhammad Yaqoob 25.0 Tail 4 18 60 7.5 3 12 40 10.0/12.5 4/5 Engine 12 1.50 2000 23,000
21 Ahmad Ali Mula bukhsh 7.5 Middle 4 15 50 7.5 3 12 40 10.0/12.5 4/5 Tractor 50 3.00 1999 15,000
22 Ghulam Haider Fazal Ahmed 25.0 Head 4 15 50 5.0 2 9 30 10.0/12.5 4/5 Engine 16 2.50 2000 34,000
23 Ali Muhammad Mula bukhsh 11.0 Middle 4 14 45 7.5 3 9 30 10.0/12.5 4/5 Tractor 50 3.00 1999 15,000
24 Altaf Hussain Same as S. No. 11 7 15 50 5.0 2 8 26 10.0/12.5 4/5 Engine 16 2.00 1998 N/A
25 Muhammad Aslam Ghulam Rasool Talip 8.5 Head 10 18 60 5.0 2 8 25 12.5/15.0 5/6 Engine 18 2.00 1999 36,000
26 Ghulam Rasool Ziada Chadar 11.0 Middle 10 15 50 5.0 2 12 40 12.5/15.0 5/6 Engine 50 3.00 2000 32,000
27 Maqsood Ahmed Ghulam Rasool 12.0 Tail 10 15 50 5.0 2 12 40 12.5/15.0 5/6 Tractor 50 3.00 2000 20,000
28 Ahmad Bukhsh Hadayat Ullah 12.5 Tail 10 14 45 5.0 2 8 25 12.5/15.0 5/6 Tractor 16 3.00 2000 28,000
29 Mehr Talib Hussain Muhammad Bukhsh 11.0 Tail 10 12 40 5.0 2 8 25 12.5/15.0 5/6 Tractor 50 3.00 2000 20,000
30 Yar Muhammad Ziada Chadar 5.0 Middle 12 15 50 5.0 2 9 30 12.5/15.0 5/6 Engine 50 3.50 2000 35,000
31 Mehr Mustaq Ahmed Lal Khan 12.0 Tail 12 12 40 5.0 2 8 25 12.5/15.0 5/6 Engine 18 2.50 2000 24,000

44
Table A-2.4 Farmers' Skimming Well Practices at Village Thatti Noor, Tehsil Bhalwal, District Sargodha, Pakistan.
S. Farmer's Name Father's Name Land Location of Well Specifications Prime Mover Year of Apprx. Cost
No. Holding Land from No. of Depth Diameter Strainer Length
Pump Size (Delivery/Suction) Type Horse
Fuel Consumption Installation (Rs.)
(Acres) Canal Outlet Strainers (m) (ft) (cm) (inch) (m) (ft) (cm) (inch) Power (lph)
1 Zia Ullah Gul Sher 45.0 Tail 1 67 220 20 8.0 18 60 15.0/17.5 6/7 Tractor 50 3.00 2000 62,000
2 Ahmed Khan Muhammad Hayat 25.0 Head 1 61 200 20 8.0 24 80 12.5/15.0 5/6 Tractor 50 4.00 1999 55000
3 Gul Sher Soni Gondal 25.0 Head 1 55 180 20 8.0 24 80 15.0/17.5 6/7 Tractor 50 4.00 2000 72000
4 Masood Ashraf Muhammad Ashraf 22.5 Uncommanded 1 52 170 20 8.0 12 40 15.0/17.5 6/7 Tractor 50 3.00 1995 30,000
5 Ummar Hayyat Ghulam Rasool 75.0 Uncommanded 1 49 160 30 12.0 43 140 15.0/17.5 6/7 Tractor 50 3.50 1991 60,000
6 MuhammadYar Khan Muhammad 62.5 Middle 1 46 150 15 6.0 21 70 12.5/15.0 5/6 Tractor 50 3.00 1980 20,000
7 Aurengzeb - 25.0 Head 1 43 140 15 6.0 21 70 12.5/15.0 5/6 Tractor 50 3.00 2000 40,000
8 Ahmed Sher Dost Muhammad 100.0 Middle 1 43 140 6.0 30 100 12.5/15.0 5/6 Tractor 50 3.00 2000 40,000
9 Bakhat Jamal Muhammad Khan 100.0 Uncommanded 1 40 130 20 8.0 34 110 15.0/17.5 6/7 Engine 16 2.00 2000 45000
10 Nassar Ullah Mula Bukhsh 37.5 Tail 1 40 130 17.5 7.0 34 110 15.0/17.5 6/7 Tractor 50 3.00 1996 31,000
11 Muhammad Zaman - 42.0 Uncommanded 1 40 130 15 6.0 30 100 15.0/17.5 6/6 Engine 18 3.00 1968 10,000
12 Muhammad Yar Haji Khan 37.5 Uncommanded 1 37 120 20 8.0 30 100 15.0/17.5 6/7 Tractor 50 4.00 1999 36,000
13 Sarfaraz Ahmad Muhamand Khan 75.0 Uncommanded 1 37 120 20 8.0 30 100 15.0/17.5 6/7 Tractor 50 4.00 1981 58,000
14 Ch. Arshad Muhamand Khan 100.0 Uncommanded 1 37 120 20 8.0 30 100 12.5/15.0 5/6 Engine 20 2.00 1981 60,000
15 Khalid Zaheer Muhamand Khan 50.0 Uncommanded 1 37 120 20 8.0 30 100 12.5/15.0 5/6 Engine 18 2.00 1981 60,000
16 Iftikhar Ahmed Zaka Ullah 75.0 Uncommanded 1 37 120 20 8.0 30 100 15.0/17.5 6/7 Engine 22 4.00 1996 75000
17 Fateh Muhammad Soni 50.0 Uncommanded 1 37 120 20 8.0 30 100 15.0/17.5 6/7 Tractor 16 4.00 2000 35000
18 Ahmad Sher Nazzar Muhammad 50.0 Middle 1 37 120 20 8.0 21 68 15.0/17.5 6/7 Engine 18 2.00 1975 26,000
19 Ahmad Sher Nazzar Muhammad 75.0 Middle 1 37 120 20 8.0 24 80 12.5/15.0 5/6 Tractor 50 3.00 2000 35,000
20 Deldar H ussain Syed Muhammad 50.0 Middle 1 37 120 15 6.0 30 100 12.5/15.0 5/6 Tractor 50 4.00 1981 36000
21 Sajjad Haider Muhammad Khan 100.0 Middle 1 37 120 15 6.0 30 100 12.5/15.0 5/6 Tractor 50 4.00 1994 26000
22 Muhammad Khan Ghulam Rasool 75.0 Head 1 37 120 15 6.0 30 100 12.5/15.0 5/6 Tractor 50 4.00 1996 26000
23 Muhammad Khan Muhammad Hayat 50.0 Uncommanded 1 37 120 15 6.0 30 100 15.0/17.5 6/7 Tractor 50 3.00 1996 34000
24 Nazzar Hayyat Dost Muhammad 125.0 Uncommanded 1 37 120 15 6.0 30 100 12.5/15.0 5/6 Engine 26 2.50 1981 35,000
25 Mumtaz Ahmad Noor Muhammad 12.0 Uncommanded 1 37 120 15 6.0 30 100 12.5/15.0 5/6 Tractor 50 3.00 1996 26,000
26 Aurengzeb Sardar 12.5 Uncommanded 1 37 120 15 6.0 30 100 12.5/15.0 5/6 Tractor 50 3.00 1981 25,000
27 Ghulam Husssain Muhabbat Khan 12.5 Uncommanded 1 37 120 15 6.0 30 100 12.5/15.0 5/6 Tractor 50 4.50 1996 35,000
28 Faiz Ahmad Mula Bukhsh 30.0 Uncommanded 1 34 110 20 8.0 27 90 15.0/17.5 6/7 Tractor 50 3.00 1996 35,000
29 Muhammad Iqbal Muhabbat Khan 25.0 Head 1 30 100 20 8.0 24 80 15.0/17.5 6/7 Tractor 50 3.00 2000 55300
30 Zia Ullah Gul Sher 35.0 Uncommanded 1 30 100 20 8.0 21 70 15.0/17.5 6/7 Engine 22 3.00 1996 85,000
31 Ahmad Sher Nazzar Muhammad 50.0 Middle 2 18 60 10 4.0 12 40 10.0/12.50 4/5 Tractor 50 3.00 1991 22,000

45
Table A-2.4 (continued)
S. Farmer's Name Father's Name Land Location of Well Specifications Prime Mover Year of Apprx. Cost
No. Holding Land from No. of Depth Diameter Strainer Length
Pump Size (Delivery/Suction) Type Horse
Fuel Consumption Installation (Rs.)
(Acres) Canal Outlet Strainers (m) (ft) (cm) (inch) (m) (ft) (cm) (inch) Power (lph)
32 Amjad Ali Manjah Khan 100.0 Tail 2 11 36 5 2.0 4 13 10.0/12.50 4/5 Tractor 16 3.00 2000 40000
33 Muhammad Zaman Lala 12.0 Tail 5 11 35 12.5 5.0 4 13 10.0/12.50 4/5 Tractor 50 4.00 2000 28000
34 Masood Ashraf Muhammad Ashraf 62.5 Middle 9 9 30 5 2.0 4 13 10.0/12.50 4/5 Engine 16 2.00 2000 35,000
35 Masood Ashraf Muhammad Ashraf 62.5 Middle 13 9 30 5 2.0 4 13 10.0/12.50 4/5 Tractor 50 3.00 2000 40,000
36 Shaukat Sher Muhammad 25.0 Tail 18 11 36 5 2.0 4 13 12.5/15.0 5/6 Tractor 50 3.00 1999 24000
37 Saleh Muhammad Lala Gondal 12.5 Tail 18 11 36 5 2.0 4 13 10.0/12.50 4/5 Engine 16 2.00 2000 425000
38 Muhammad Sadique Ghulam Akbar 25.0 Middle 18 11 36 5 2.0 4 13 12.5/15.0 5/6 Tractor 50 3.50 2000 25000
39 Muhammad Ashraf Sardar 4.0 Tail 18 11 35 5 2.0 4 13 10.0/12.50 4/5 Tractor 16 4.00 2000 40000
40 Shamsher Ahmad Muhamand Khan 25.0 Middle 18 11 35 5 2.0 4 13 10.0/12.50 4/5 Engine 16 3.00 1998 45,000
41 Qadir Nawaz Muhamand Khan 25.0 Middle 18 11 35 5 2.0 4 13 10.0/12.50 4/5 Engine 16 2.00 1999 45,300
42 Ahmad Sher Dost Muhammad 100.0 Middle 24 10 33 5 2.0 4 13 10.0/12.50 4/5 Tractor 50 3.00 1998 40,000

46
ANNEX-III. PRICES OF DIFFERENT COMPONENTS OF SKIMMING WELLS
Item Specifications Price (Rs.) Drilling 5.0 cm diameter
7.5 cm diameter 10.0 cm diameter 12.5 cm diameter 15.0 cm diameter 17.5 cm diameter 20.0 cm diameter
23.00 per metre 33.00 per metre 40.00 per metre 100.00 per metre 100.00 per metre 100.00 per metre 100.00 per metre
Blind Pipe (PVC) 5.0 cm diameter 7.5 cm diameter 10.0 cm diameter 12.5 cm diameter
36.00 per metre 80.00 per metre 130.00 per metre 230.00 per metre
Galvanized Pipe (PVC) (16 Gauge)
10.0 cm diameter 12.5 cm diameter 15.0 cm diameter 17.5 cm diameter
180.00 per metre 230.00 per metre 280.00 per metre 525.00 per metre
Strainer (PVC) 5.0 cm diameter 7.5 cm diameter 10.0 cm diameter 12.5 cm diameter
40.00 per metre 82.00 per metre 135.00 per metre 233.00 per metre
Strainer (Jute Coir) 20.0 cm diameter 25.0 cm diameter
300.00 per metre 380.00 per metre
Tee (Joint) For 4-strainers For 6-strainers For 8-strainers For 10-strainers For 12-strainers For 16-strainers
800.00 each 1300.00 each 1500.00 each 2000.00 each 2300.00 each 2500.00 each
Non-Return Valve 15.0 cm diameter 17.5 cm diameter 20.0 cm diameter
550.00 each 800.00 each 1300.00 each
Pump (Centrifugal) 10.0 x 12.5 cm 12.5 x 15.0 cm 15.0 x 17.5 cm 17.5 x 20.0 cm
3500.00 each 3800.00 each 5400.00 each 8500.00 each
Diesel Engine 5 hp 8 hp 10 hp 16 hp 20 hp 23 hp
9000.00 each 11000.00 each 12000.00 each 15500.00 each 19500.00 each 21500.00 each
Fitting Charges For Single-strainer For 4-strainers For 6-strainers For 8-strainers For 12-strainers For 16-strainers
500.00 400.00 600.00 800.00 1000.00 1200.00
Miscellaneous (including belts, engine platform, diversion tanks etc.)
For all types 3000.00
N. B. The prices are those of May 2001.

IWMI Pakistan
Regional Office
Headquarters
Mailing Address
Tel.
Fax
Website
12km
Multan Road
Chowk Thokar Niaz Baig
Lahore 53700
Pakistan
127, Sunil Mawatha
Pelawatta
Battaramulla
Sri Lanka
P O Box 2075
Colombo
Sri Lanka
94-1-867404, 869080
94-1-866854
www.iwmi.org SM
IWMI is a Future Harvest CenterSupported by the CGIAR