Spatial Distribution of Salinity State in Depression
16
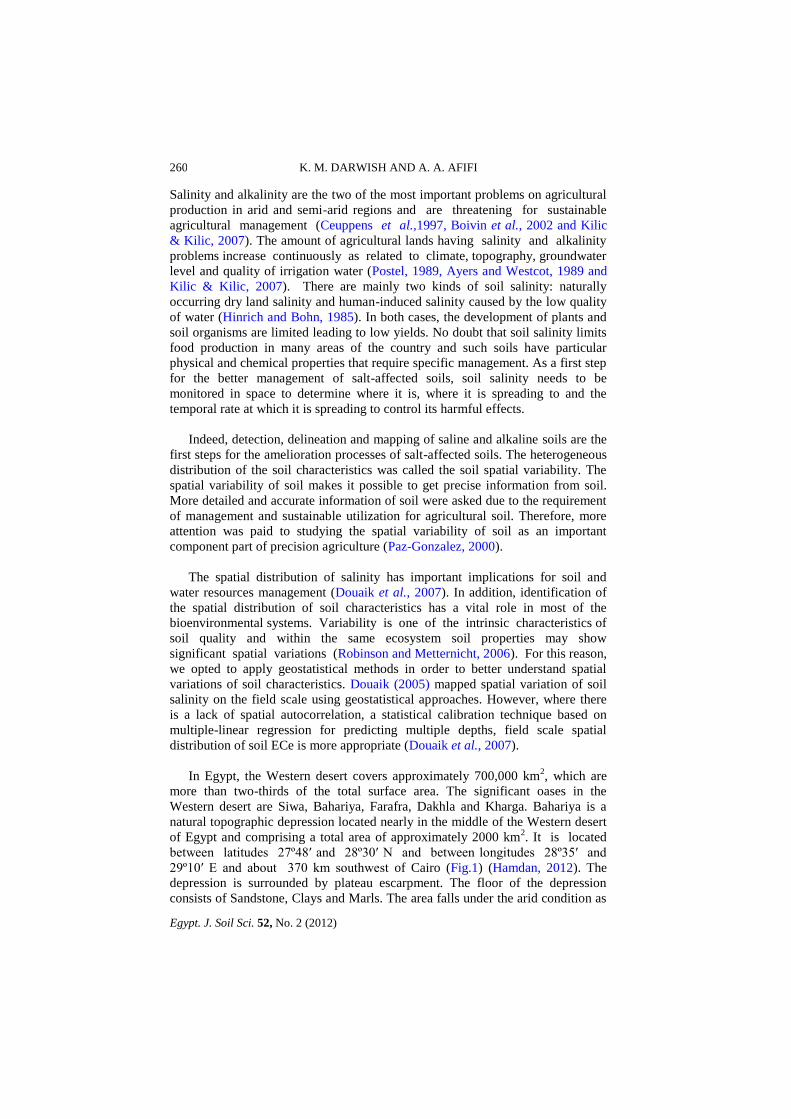
17 Egypt. J. Soil Sci. 52, No. 2, pp. 259 – 274 (2012) ـــــــــــ ــــــــــــــــ ــــــــــــــــــــــــــ ـــــــــــ[email protected] Spatial Distribution of Salinity State in Depression Floor, Western Desert, Egypt K. M. Darwish * and Ahmed A. Afifi ** * Soils and Water Technology Department, Arid Land Research Institute, City of Scientific Research and Technology Applications, Borg El-Arab, Alexandria and ** Soils & Water Use Department, National Research Centre (NRC), Giza, Egypt. SSESSING the vulnerability of soil salinity state is the first step toward careful management of land resources to avoid or, at least, to minimize impacts on agriculture. This requires careful monitoring of the soil salinity status and variation to curb degradation trends, and secure sustainable land use and management. Bahariya depression faces a sever constraint in availability of good agricultural land. The major limitations were associated to high soil salinity. The remote sensing data and field observations show that new reclaimed areas have been recently cultivated and developed widespread water logging, seepage channels and soil salinisation. Geostatistical techniques provide a means to study the heterogeneous nature of spatial distributions of soil salinity. Ordinary kriging was applied to estimate electrical conductivity (EC) measurements in some areas in Bahariya. These EC spatial data were analyzed for autocorrelation and then used to make optimal, statistically rigorous maps of the area sampled. In kriging, more easily measured data sets of electrical conductivity (EC) were incorporated to improve the estimation of salinity state. Skewness and kurtosis were calculated and observed for all data to describe the shape and symmetry of the geochemical data distribution along the study area. The estimated spatial distributions of EC using the geostatistical methods with various reduced data sets were compared with the extensive salinity measurements in the large field. Technically, there were different original factors have influenced the final output of kriging logarithm, especially in the southern part. Improving those factors could obtain more accurate results. The output results suggest that sampling cost can be dramatically reduced and estimation can be significantly improved using kriging technique. It is now much easier for a decision maker to assess the salinity state for agricultural and to locate the most suitable site for extension and drilling wells. The present study demonstrates high efficiency for kriging method to analyze complex spatial changes of salinity mapping. Keywords: Salt affected soils, spatial variability, Semi-variogram, Ordinary kriging. A
Transcript of Spatial Distribution of Salinity State in Depression
17 Egypt. J. Soil Sci. 52, No. 2, pp. 259 – 274 (2012)
ــــــــــــــــــــــــــــــــــــــــــــــــــــــــــــــــ
Spatial Distribution of Salinity State in Depression
Floor, Western Desert, Egypt
K. M. Darwish
* and Ahmed A. Afifi
**
*Soils and Water Technology Department, Arid Land Research
Institute, City of Scientific Research and Technology Applications,
Borg El-Arab, Alexandria and **
Soils & Water Use Department,
National Research Centre (NRC), Giza, Egypt.
SSESSING the vulnerability of soil salinity state is the first step
toward careful management of land resources to avoid or, at least,
to minimize impacts on agriculture. This requires careful monitoring of
the soil salinity status and variation to curb degradation trends, and
secure sustainable land use and management. Bahariya depression
faces a sever constraint in availability of good agricultural land. The
major limitations were associated to high soil salinity. The remote
sensing data and field observations show that new reclaimed areas
have been recently cultivated and developed widespread water logging,
seepage channels and soil salinisation. Geostatistical techniques
provide a means to study the heterogeneous nature of spatial
distributions of soil salinity. Ordinary kriging was applied to estimate
electrical conductivity (EC) measurements in some areas in Bahariya.
These EC spatial data were analyzed for autocorrelation and then used
to make optimal, statistically rigorous maps of the area sampled. In
kriging, more easily measured data sets of electrical conductivity (EC)
were incorporated to improve the estimation of salinity state. Skewness
and kurtosis were calculated and observed for all data to describe the
shape and symmetry of the geochemical data distribution along the
study area. The estimated spatial distributions of EC using the
geostatistical methods with various reduced data sets were compared
with the extensive salinity measurements in the large field.
Technically, there were different original factors have influenced the
final output of kriging logarithm, especially in the southern part.
Improving those factors could obtain more accurate results. The output
results suggest that sampling cost can be dramatically reduced and
estimation can be significantly improved using kriging technique. It is
now much easier for a decision maker to assess the salinity state for
agricultural and to locate the most suitable site for extension and
drilling wells. The present study demonstrates high efficiency for
kriging method to analyze complex spatial changes of salinity
mapping.
Keywords: Salt affected soils, spatial variability, Semi-variogram,
Ordinary kriging.
A
K. M. DARWISH AND A. A. AFIFI
Egypt. J. Soil Sci. 52, No. 2 (2012)
260
Salinity and alkalinity are the two of the most important problems on agricultural
production in arid and semi-arid regions and are threatening for sustainable
agricultural management (Ceuppens et al.,1997, Boivin et al., 2002 and Kilic
& Kilic, 2007). The amount of agricultural lands having salinity and alkalinity
problems increase continuously as related to climate, topography, groundwater
level and quality of irrigation water (Postel, 1989, Ayers and Westcot, 1989 and
Kilic & Kilic, 2007). There are mainly two kinds of soil salinity: naturally
occurring dry land salinity and human-induced salinity caused by the low quality
of water (Hinrich and Bohn, 1985). In both cases, the development of plants and
soil organisms are limited leading to low yields. No doubt that soil salinity limits
food production in many areas of the country and such soils have particular
physical and chemical properties that require specific management. As a first step
for the better management of salt-affected soils, soil salinity needs to be
monitored in space to determine where it is, where it is spreading to and the
temporal rate at which it is spreading to control its harmful effects.
Indeed, detection, delineation and mapping of saline and alkaline soils are the
first steps for the amelioration processes of salt-affected soils. The heterogeneous
distribution of the soil characteristics was called the soil spatial variability. The
spatial variability of soil makes it possible to get precise information from soil.
More detailed and accurate information of soil were asked due to the requirement
of management and sustainable utilization for agricultural soil. Therefore, more
attention was paid to studying the spatial variability of soil as an important
component part of precision agriculture (Paz-Gonzalez, 2000).
The spatial distribution of salinity has important implications for soil and
water resources management (Douaik et al., 2007). In addition, identification of
the spatial distribution of soil characteristics has a vital role in most of the
bioenvironmental systems. Variability is one of the intrinsic characteristics of
soil quality and within the same ecosystem soil properties may show
significant spatial variations (Robinson and Metternicht, 2006). For this reason,
we opted to apply geostatistical methods in order to better understand spatial
variations of soil characteristics. Douaik (2005) mapped spatial variation of soil
salinity on the field scale using geostatistical approaches. However, where there
is a lack of spatial autocorrelation, a statistical calibration technique based on
multiple-linear regression for predicting multiple depths, field scale spatial
distribution of soil ECe is more appropriate (Douaik et al., 2007).
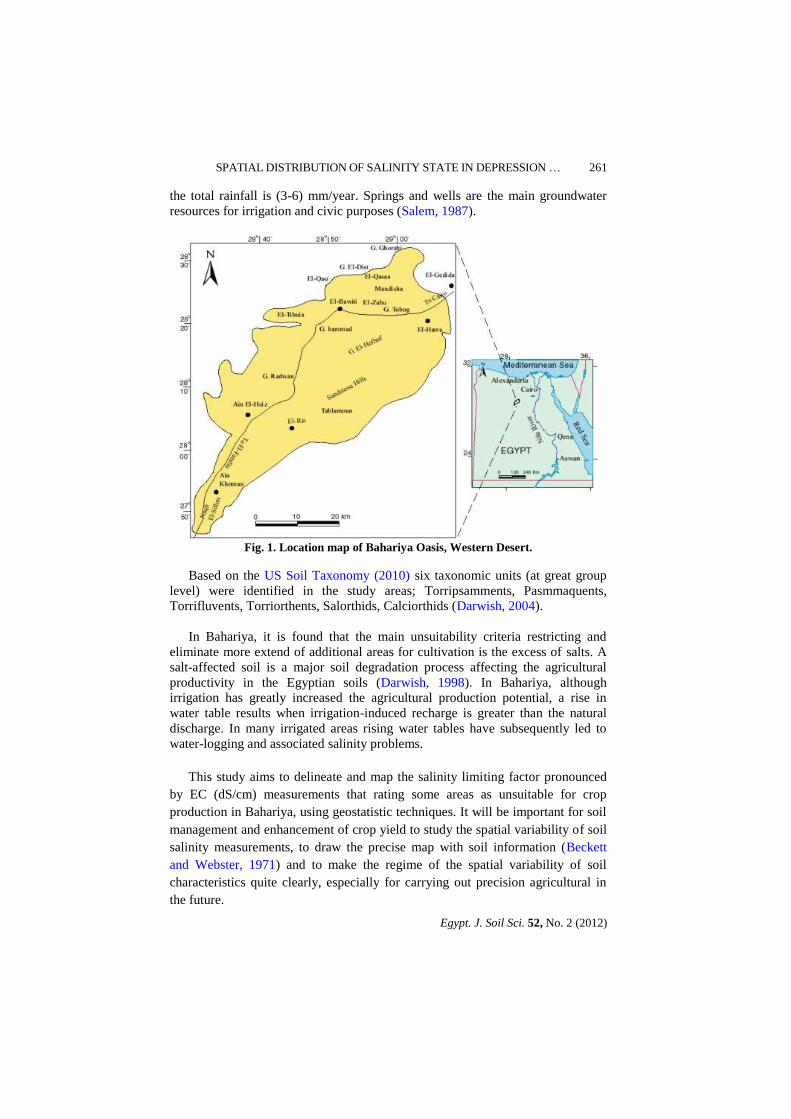
In Egypt, the Western desert covers approximately 700,000 km2, which are
more than two-thirds of the total surface area. The significant oases in the
Western desert are Siwa, Bahariya, Farafra, Dakhla and Kharga. Bahariya is a
natural topographic depression located nearly in the middle of the Western desert
of Egypt and comprising a total area of approximately 2000 km2. It is located
between latitudes 27º48′ and 28º30′ N and between longitudes 28º35′ and
29º10′ E and about 370 km southwest of Cairo (Fig.1) (Hamdan, 2012). The
depression is surrounded by plateau escarpment. The floor of the depression
consists of Sandstone, Clays and Marls. The area falls under the arid condition as
SPATIAL DISTRIBUTION OF SALINITY STATE IN DEPRESSION …
Egypt. J. Soil Sci. 52, No. 2 (2012)
261
the total rainfall is (3-6) mm/year. Springs and wells are the main groundwater
resources for irrigation and civic purposes (Salem, 1987).
Fig. 1. Location map of Bahariya Oasis, Western Desert.
Based on the US Soil Taxonomy (2010) six taxonomic units (at great group
level) were identified in the study areas; Torripsamments, Pasmmaquents,
Torrifluvents, Torriorthents, Salorthids, Calciorthids (Darwish, 2004).
In Bahariya, it is found that the main unsuitability criteria restricting and
eliminate more extend of additional areas for cultivation is the excess of salts. A
salt-affected soil is a major soil degradation process affecting the agricultural
productivity in the Egyptian soils (Darwish, 1998). In Bahariya, although
irrigation has greatly increased the agricultural production potential, a rise in
water table results when irrigation-induced recharge is greater than the natural
discharge. In many irrigated areas rising water tables have subsequently led to
water-logging and associated salinity problems.
This study aims to delineate and map the salinity limiting factor pronounced
by EC (dS/cm) measurements that rating some areas as unsuitable for crop
production in Bahariya, using geostatistic techniques. It will be important for soil
management and enhancement of crop yield to study the spatial variability of soil
salinity measurements, to draw the precise map with soil information (Beckett
and Webster, 1971) and to make the regime of the spatial variability of soil
characteristics quite clearly, especially for carrying out precision agricultural in
the future.
K. M. DARWISH AND A. A. AFIFI
Egypt. J. Soil Sci. 52, No. 2 (2012)
262
Material and Methods
General situation of experimental area(s)
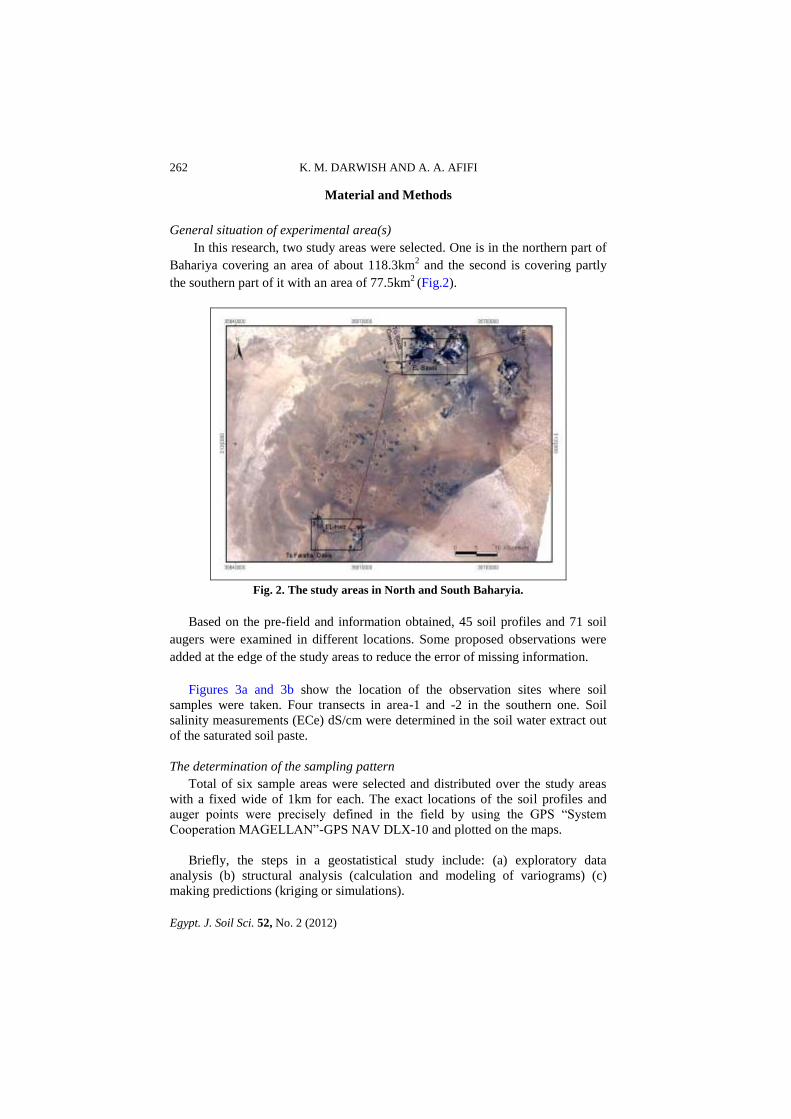
In this research, two study areas were selected. One is in the northern part of
Bahariya covering an area of about 118.3km2 and the second is covering partly
the southern part of it with an area of 77.5km2 (Fig.2).
Fig. 2. The study areas in North and South Baharyia.
Based on the pre-field and information obtained, 45 soil profiles and 71 soil
augers were examined in different locations. Some proposed observations were
added at the edge of the study areas to reduce the error of missing information.
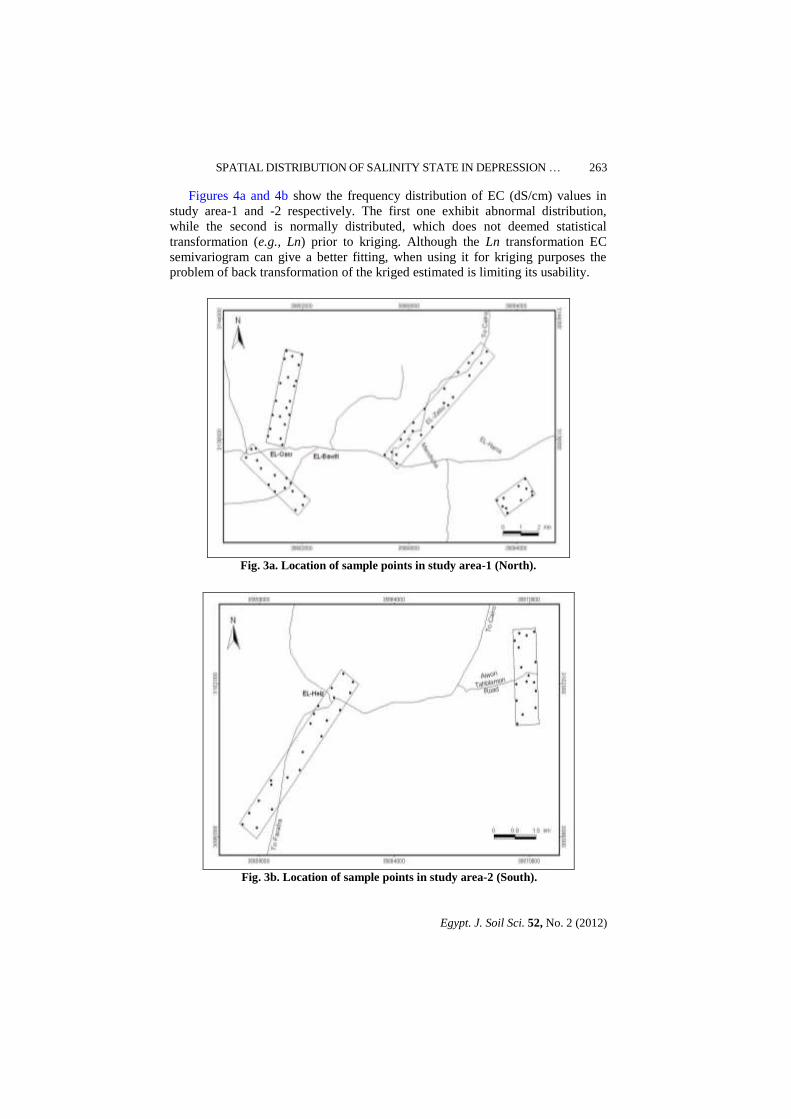
Figures 3a and 3b show the location of the observation sites where soil
samples were taken. Four transects in area-1 and -2 in the southern one. Soil
salinity measurements (ECe) dS/cm were determined in the soil water extract out
of the saturated soil paste.
The determination of the sampling pattern
Total of six sample areas were selected and distributed over the study areas
with a fixed wide of 1km for each. The exact locations of the soil profiles and
auger points were precisely defined in the field by using the GPS “System
Cooperation MAGELLAN”-GPS NAV DLX-10 and plotted on the maps.
Briefly, the steps in a geostatistical study include: (a) exploratory data
analysis (b) structural analysis (calculation and modeling of variograms) (c)
making predictions (kriging or simulations).
SPATIAL DISTRIBUTION OF SALINITY STATE IN DEPRESSION …
Egypt. J. Soil Sci. 52, No. 2 (2012)
263
Figures 4a and 4b show the frequency distribution of EC (dS/cm) values in
study area-1 and -2 respectively. The first one exhibit abnormal distribution,
while the second is normally distributed, which does not deemed statistical
transformation (e.g., Ln) prior to kriging. Although the Ln transformation EC
semivariogram can give a better fitting, when using it for kriging purposes the
problem of back transformation of the kriged estimated is limiting its usability.
Fig. 3a. Location of sample points in study area-1 (North).
Fig. 3b. Location of sample points in study area-2 (South).

K. M. DARWISH AND A. A. AFIFI
Egypt. J. Soil Sci. 52, No. 2 (2012)
264
Fig. 4a. Frequency distribution of ECe values in area-1.
Fig. 4b. Frequency distribution of ECe values in area-2.
Method of geostatistical analysis
The spatial variability of EC data was analyzed using semi-variance function. The
correlation lag range of soil salinity EC values was determined according to the sill of
semivariogam and the spherical models were set up. And then, the spatial distribution
maps of EC in the two areas were drawn by using Kringing interpolation.
Semi-variance function method
Semivariance function is used to measure the degree of variation in soil
characteristics ECe between sampling points and to determine the reasonable
space of sampling. Semivariance is an autocorrelation statistic defined as:
γ(h) = [½ N(h)] Σ [ zi – z
i+h ]
2 (1)
where
γ(h) = Semivariance for interval distance class h;
zi = measured sample value at point i;
SPATIAL DISTRIBUTION OF SALINITY STATE IN DEPRESSION …
Egypt. J. Soil Sci. 52, No. 2 (2012)
265
zi+h
= measured sample value at point i+h; and
N(h) = total number of sample couples for the lag interval h.
Semivariance is evaluated by calculating γ(h) for all possible pairs of points in
the ECe data set and assigning each pair to an interval class h. The Lag Class
Distance Interval defines how pairs of points will be grouped into lag classes.
It is found that the distribution of the ECe measurements in spatial for area-1
and -2 is isotropic or direction-nondependent geometric model. The isotropic
model can be described based on three parameters:
• Nugget Variance or C0
• Sill or C0+C – the model asymptote
• Range or A – the separation distance over which spatial dependence is ap-
parent. Sometimes this is called the effective range in order to distinguish
range (A) from a model’s range parameter (A0).
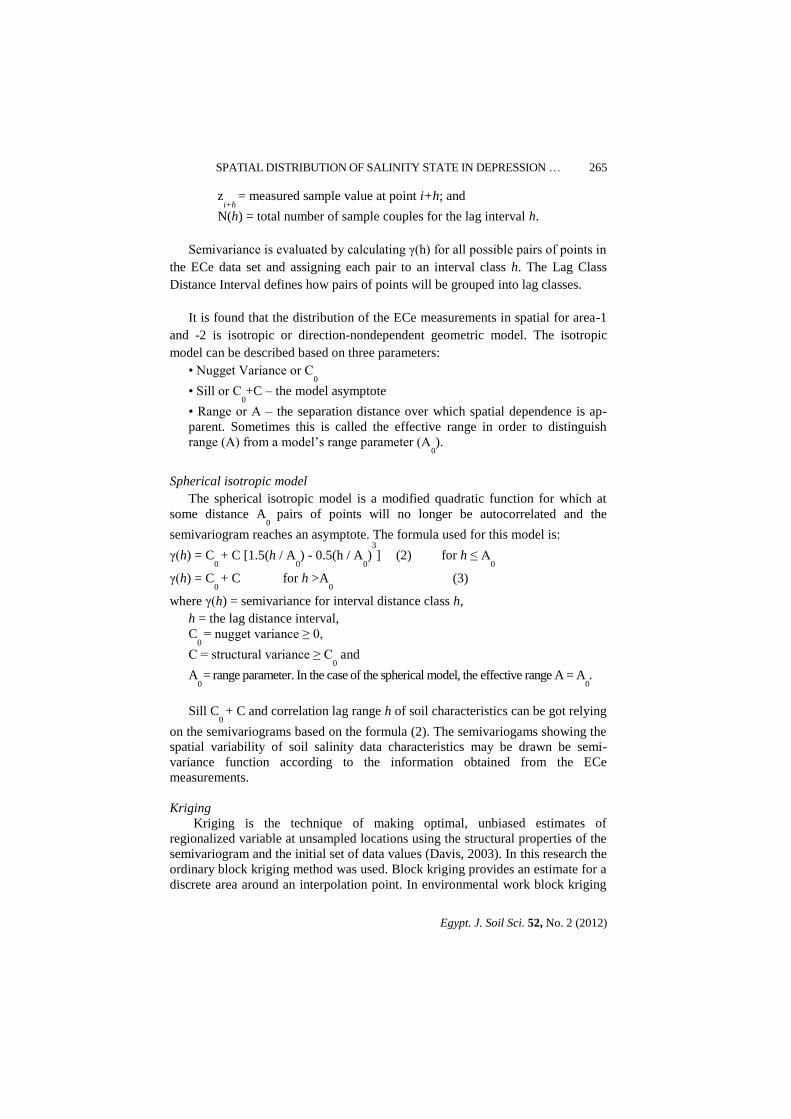
Spherical isotropic model
The spherical isotropic model is a modified quadratic function for which at
some distance A0
pairs of points will no longer be autocorrelated and the
semivariogram reaches an asymptote. The formula used for this model is:
γ(h) = C0 + C [1.5(h / A
0) - 0.5(h / A
0)
3
] (2) for h ≤ A0
γ(h) = C0 + C for h >A
0 (3)
where γ(h) = semivariance for interval distance class h,
h = the lag distance interval,
C0 = nugget variance ≥ 0,
C = structural variance ≥ C0 and
A0 = range parameter. In the case of the spherical model, the effective range A = A
0.
Sill C0 + C and correlation lag range h of soil characteristics can be got relying
on the semivariograms based on the formula (2). The semivariogams showing the
spatial variability of soil salinity data characteristics may be drawn be semi-
variance function according to the information obtained from the ECe
measurements.
Kriging
Kriging is the technique of making optimal, unbiased estimates of
regionalized variable at unsampled locations using the structural properties of the
semivariogram and the initial set of data values (Davis, 2003). In this research the
ordinary block kriging method was used. Block kriging provides an estimate for a
discrete area around an interpolation point. In environmental work block kriging
K. M. DARWISH AND A. A. AFIFI
Egypt. J. Soil Sci. 52, No. 2 (2012)
266
is usually more appropriate. The block is defined as the rectangular area around a
point that is not included in an adjacent block.
Results and Discussion
Spatial variability of ECe values in study areas
The statistical results of the ECe measurements for area-1 and area-2 are listed
in Table 1. The statistical analysis can just explain the sample difference of ECe
characteristics in volume and in homogeneity, but it cannot describe the spatial
variability difference of the salinity data. So, it is necessary to analyze the spatial
variability of the data above by semivariance function.
TABLE 1. Statistical summary of ECe (dS/cm) data .
Items Mean Standard
Deviation Sample variance Min. Max.
Area 1 (N) 37.27 46.51 2163.06 0.96 178.0
Area 2 (S) 51.26 39.41 1552.79 0.86 132.0
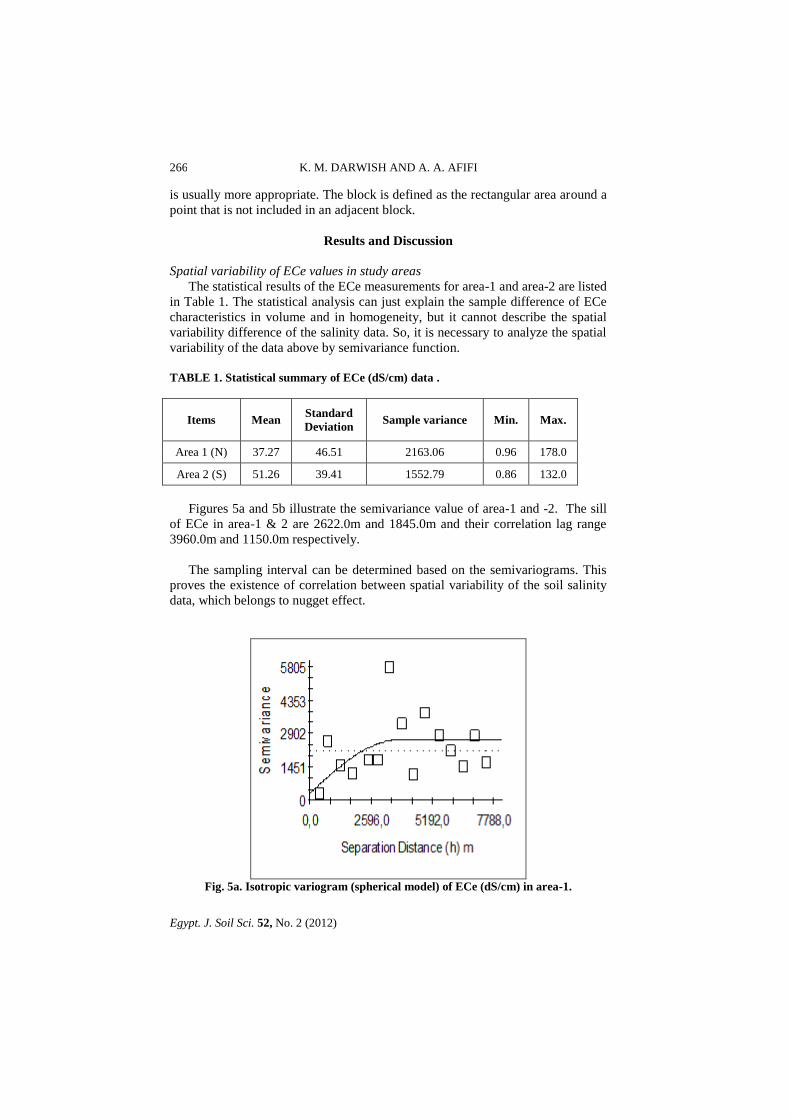
Figures 5a and 5b illustrate the semivariance value of area-1 and -2. The sill
of ECe in area-1 & 2 are 2622.0m and 1845.0m and their correlation lag range
3960.0m and 1150.0m respectively.
The sampling interval can be determined based on the semivariograms. This
proves the existence of correlation between spatial variability of the soil salinity
data, which belongs to nugget effect.
Fig. 5a. Isotropic variogram (spherical model) of ECe (dS/cm) in area-1.
SPATIAL DISTRIBUTION OF SALINITY STATE IN DEPRESSION …
Egypt. J. Soil Sci. 52, No. 2 (2012)
267
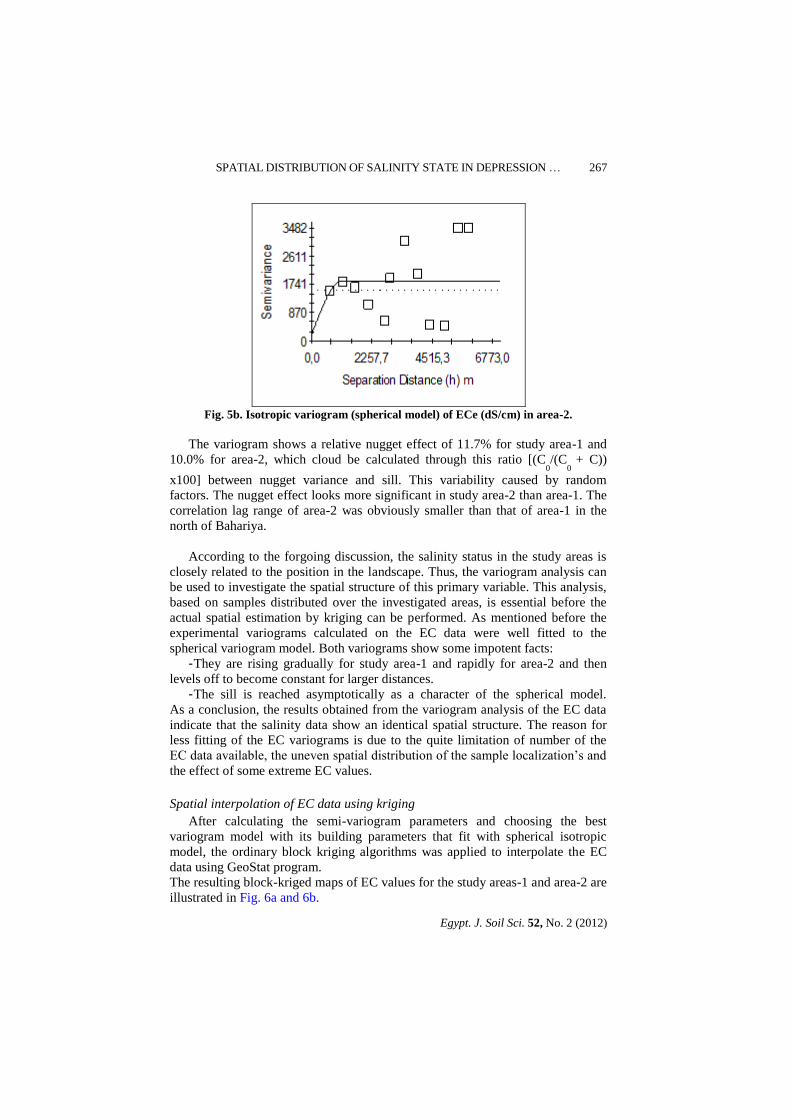
Fig. 5b. Isotropic variogram (spherical model) of ECe (dS/cm) in area-2.
The variogram shows a relative nugget effect of 11.7% for study area-1 and
10.0% for area-2, which cloud be calculated through this ratio [(C0/(C
0 + C))
x100] between nugget variance and sill. This variability caused by random
factors. The nugget effect looks more significant in study area-2 than area-1. The
correlation lag range of area-2 was obviously smaller than that of area-1 in the
north of Bahariya.
According to the forgoing discussion, the salinity status in the study areas is
closely related to the position in the landscape. Thus, the variogram analysis can
be used to investigate the spatial structure of this primary variable. This analysis,
based on samples distributed over the investigated areas, is essential before the
actual spatial estimation by kriging can be performed. As mentioned before the
experimental variograms calculated on the EC data were well fitted to the
spherical variogram model. Both variograms show some impotent facts:
- They are rising gradually for study area-1 and rapidly for area-2 and then
levels off to become constant for larger distances.
- The sill is reached asymptotically as a character of the spherical model.
As a conclusion, the results obtained from the variogram analysis of the EC data
indicate that the salinity data show an identical spatial structure. The reason for
less fitting of the EC variograms is due to the quite limitation of number of the
EC data available, the uneven spatial distribution of the sample localization’s and
the effect of some extreme EC values.
Spatial interpolation of EC data using kriging
After calculating the semi-variogram parameters and choosing the best
variogram model with its building parameters that fit with spherical isotropic
model, the ordinary block kriging algorithms was applied to interpolate the EC
data using GeoStat program.
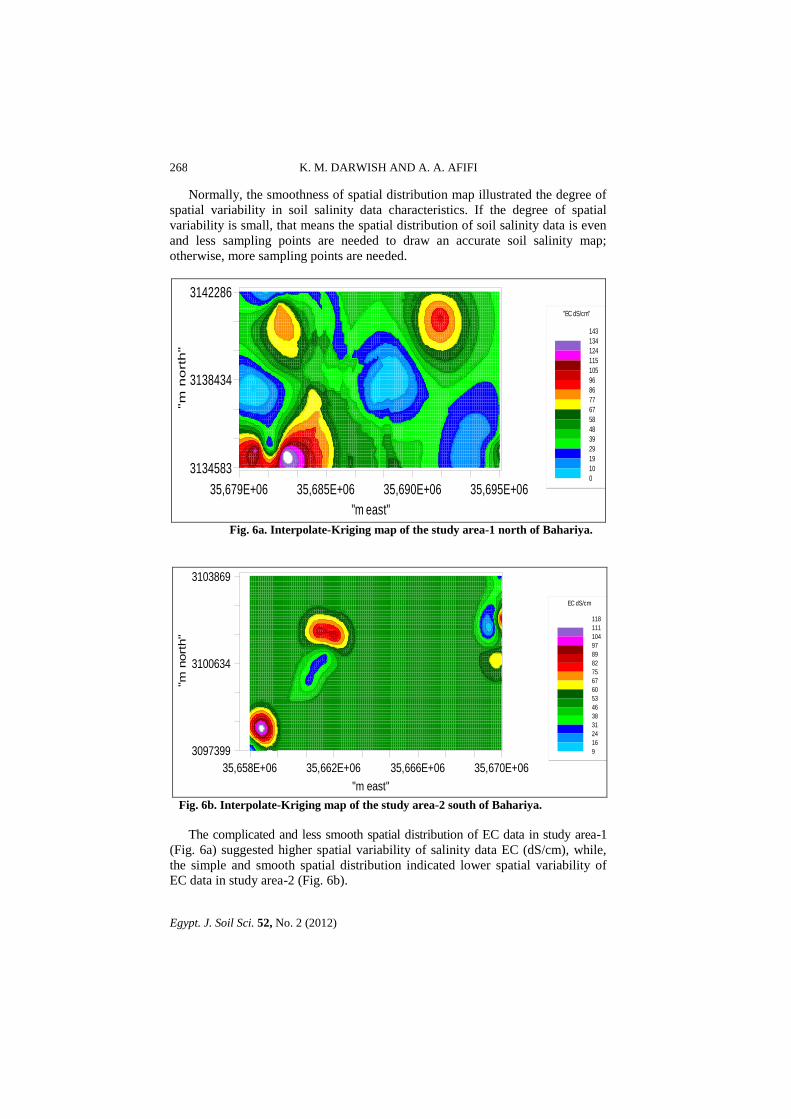
The resulting block-kriged maps of EC values for the study areas-1 and area-2 are
illustrated in Fig. 6a and 6b.
K. M. DARWISH AND A. A. AFIFI
Egypt. J. Soil Sci. 52, No. 2 (2012)
268
Normally, the smoothness of spatial distribution map illustrated the degree of
spatial variability in soil salinity data characteristics. If the degree of spatial
variability is small, that means the spatial distribution of soil salinity data is even
and less sampling points are needed to draw an accurate soil salinity map;
otherwise, more sampling points are needed.
35,679E+06 35,685E+06 35,690E+06 35,695E+06
"m east"
3134583
3138434
3142286
"m
no
rth
"
"EC dS/cm"
143
134
124
115
105
96
86
77
67
58
48
39
29
19
10
0
Fig. 6a. Interpolate-Kriging map of the study area-1 north of Bahariya.
35,658E+06 35,662E+06 35,666E+06 35,670E+06
"m east"
3097399
3100634
3103869
"m n
ort
h"
EC dS/cm
118
111
104
97
89
82
75
67
60
53
46
38
31
24
16
9
Fig. 6b. Interpolate-Kriging map of the study area-2 south of Bahariya.
The complicated and less smooth spatial distribution of EC data in study area-1
(Fig. 6a) suggested higher spatial variability of salinity data EC (dS/cm), while,
the simple and smooth spatial distribution indicated lower spatial variability of
EC data in study area-2 (Fig. 6b).
SPATIAL DISTRIBUTION OF SALINITY STATE IN DEPRESSION …
Egypt. J. Soil Sci. 52, No. 2 (2012)
269
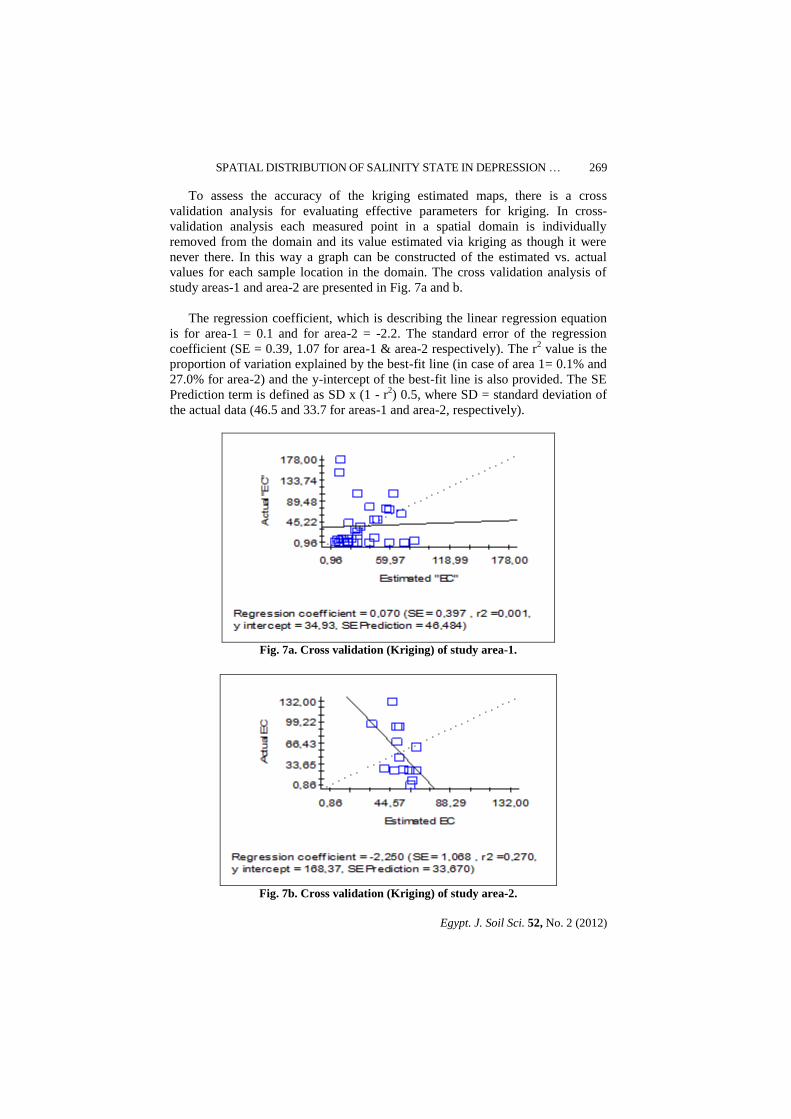
To assess the accuracy of the kriging estimated maps, there is a cross
validation analysis for evaluating effective parameters for kriging. In cross-
validation analysis each measured point in a spatial domain is individually
removed from the domain and its value estimated via kriging as though it were
never there. In this way a graph can be constructed of the estimated vs. actual
values for each sample location in the domain. The cross validation analysis of
study areas-1 and area-2 are presented in Fig. 7a and b.
The regression coefficient, which is describing the linear regression equation
is for area-1 = 0.1 and for area-2 = -2.2. The standard error of the regression
coefficient (SE = 0.39, 1.07 for area-1 & area-2 respectively). The r2 value is the
proportion of variation explained by the best-fit line (in case of area 1= 0.1% and
27.0% for area-2) and the y-intercept of the best-fit line is also provided. The SE
Prediction term is defined as SD x (1 - r2) 0.5, where SD = standard deviation of
the actual data (46.5 and 33.7 for areas-1 and area-2, respectively).
Fig. 7a. Cross validation (Kriging) of study area-1.
Fig. 7b. Cross validation (Kriging) of study area-2.
K. M. DARWISH AND A. A. AFIFI
Egypt. J. Soil Sci. 52, No. 2 (2012)
270
It is clear that the spatial variability of area-2 is comparatively less than that in
area-1. The main reason for this weakness of spatial variability in area-2 could be
referred to the lack of EC sampling points available and to the high influence of
the EC (dS/cm) extreme values on neighboring locations. This results in larger
tendency of the kriged estimates to higher salinity categories.
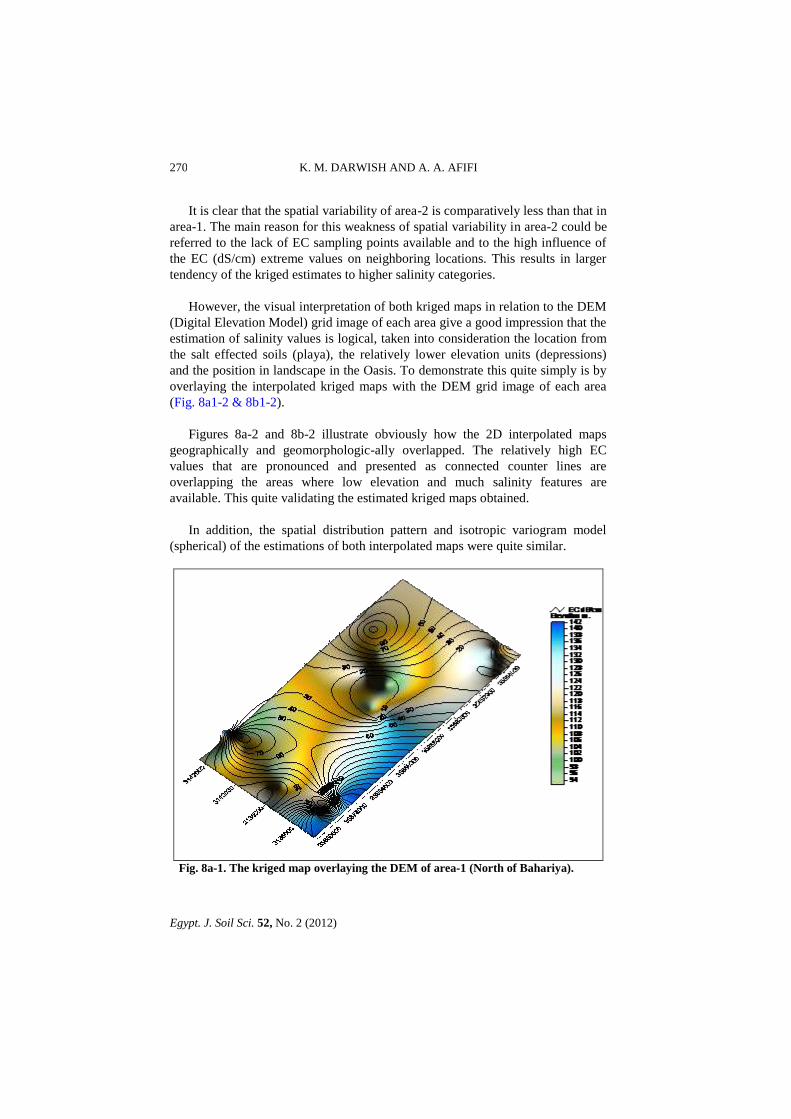
However, the visual interpretation of both kriged maps in relation to the DEM
(Digital Elevation Model) grid image of each area give a good impression that the
estimation of salinity values is logical, taken into consideration the location from
the salt effected soils (playa), the relatively lower elevation units (depressions)
and the position in landscape in the Oasis. To demonstrate this quite simply is by
overlaying the interpolated kriged maps with the DEM grid image of each area
(Fig. 8a1-2 & 8b1-2).
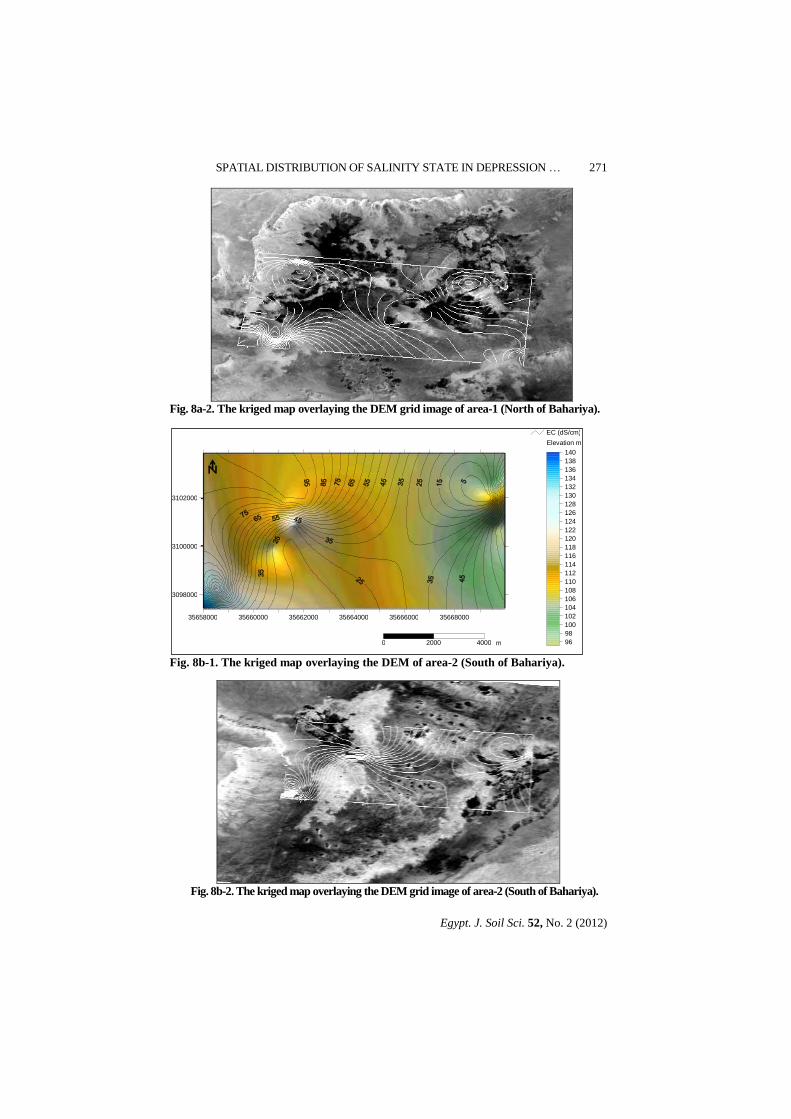
Figures 8a-2 and 8b-2 illustrate obviously how the 2D interpolated maps
geographically and geomorphologic-ally overlapped. The relatively high EC
values that are pronounced and presented as connected counter lines are
overlapping the areas where low elevation and much salinity features are
available. This quite validating the estimated kriged maps obtained.
In addition, the spatial distribution pattern and isotropic variogram model
(spherical) of the estimations of both interpolated maps were quite similar.
Fig. 8a-1. The kriged map overlaying the DEM of area-1 (North of Bahariya).
SPATIAL DISTRIBUTION OF SALINITY STATE IN DEPRESSION …
Egypt. J. Soil Sci. 52, No. 2 (2012)
271
Fig. 8a-2. The kriged map overlaying the DEM grid image of area-1 (North of Bahariya).
Fig. 8b-1. The kriged map overlaying the DEM of area-2 (South of Bahariya).
Fig. 8b-2. The kriged map overlaying the DEM grid image of area-2 (South of Bahariya).
96 98 100 102 104 106 108 110 112 114 116 118 120 122 124 126 128 130 132 134 136 138 140
35658000 35660000 35662000 35664000 35666000 35668000
3098000
3100000
3102000
Elevation m
0 2000 4000 m
EC (dS/cm)
K. M. DARWISH AND A. A. AFIFI
Egypt. J. Soil Sci. 52, No. 2 (2012)
272
Conclusion
The spatial distribution maps drawn based on kriging interpolation method
explain clearly the spatial variability of soil salinity measurements in north and
south study areas of Bahariya Oasis.
Indeed, there are different original factors have influenced the final output of
the kriging logarithm technique. Those factors can be related to the issues of
sampling, the spatial distribution of the soil salinity measurements in the space,
the total number of the observation points and the variability of the EC data set
obtained. Improving those factors especially in the south study area-2 would play
an important role for receiving more accurate results out of this interpolation
method. The spatial distribution characteristics not only related to the processing
of formation, but also related to the result of the specific agricultural production
system and mode in Bahariya.
It is worth to mention, that the results suggest that sampling cost can be
dramatically reduced and estimation can be significantly improved using kriging
technique. Of course, the cost vs. benefit balance of such a detailed approach still
needs to be explored. In addition, consequent studies are recommended relying on
the current results including cokriging geostatistical technique.
At the end of the whole procedure, it is still manage successfully to use the
obtained interpolated EC salinity maps and to suggest better resource
management practices for the selected study areas of Bahariya Oasis.
References
Ayers, R.S. and Westcot, D.W. (1989) "Water Quality for Agriculture", FAO
Irrigation and Drainage, Paper 29: 1–174, Rome.
Beckett, P.H.T. and Webster, R. (1971) Soil variability: a review. Soils Fert. 34:1-15.
Boivin, P., Favre, F., Hammecker, C., Maeght, J.L., Delariviere, J., Poussin,
J.C. and Wopereis, M.C.S. (2002) Processes driving soil solution chemistry in a
fl ooded rice-cropped vertisol: analysis of long-time monitoring data. Geoderma
110: 87–107.
Ceuppens, J., Wopereis, M.C.S. and MieZan, K.M. (1997) Soil salinization
processes in rice irrigation schemes in the Senegal River delta. Soil Sci. Soc. Am. J. 61
(4): 1122–1130.
Darwish, Kh. M. (1998) Integrating soil salinity data with a satellite image using
geostatistics. M.Sc. Thesis, 76 p. Gent University, Belgium,
SPATIAL DISTRIBUTION OF SALINITY STATE IN DEPRESSION …
Egypt. J. Soil Sci. 52, No. 2 (2012)
273
Darwish, Kh. M. (2004) Potential of soil and water resources for agricultural development
in Bahariya oasis, Egypt. Development of a GIS-based Decision support system. Ph.D.
Thesis, Ernst-Moritz-Arndt-Universität Greifswald, Greifswald, Germany.
Davis, J.C. (2003) "Statistics and Data Analysis in Geology", 3rd ed. Kansas Geological
Survey- ISBN: 0-471-17275-8, New York, NY [u.a.]: Wiley.
Douaik, A., Van Meirvenne M. and Tóth, T. (2005) Soil salinity mapping using spatio-
temporal kriging and Bayesian maximum entropy with interval soft data. Geoderma
128 : 234– 248.
Douaik, A., Van Meirvenne, M. and Tóth, T. (2007) Statistical Methods for Evaluating
Soil Salinity Spatial and Temporal Variability. SSSAJ: Volume 71: Number 5.
Hamdan, A. M. (2012) Multivariate Statistical Analysis of Geochemical Data of
Groundwater in El-Bahariya Oasis, Western Desert, Egypt. Research Journal of
Environmental and Earth Sciences 4(6): 665-667.
Hinrich, L. Bohn, 1(985) "Soil Chemistry", 2nd ed., John Wiley and Sons, Canada: 1-341.
Kilic, K. and Kilic, S. (2007) Spatial variability of salinity and alkalinity of a field having
salination risk in semi-arid climate in northern Turkey. Environ. Monitor Assess.
127: 55–65.
Paz-Gonzalez, A. (2000) The effect of cultivation on the spatial variability of selected
properties of an umbric horizon. Geoderma 97: 273-292.
Postel, R. (1989) "Water of Agriculture: Facing the limits", World-Watch Paper,
Washington D.C., Worldwatch Ins.
Robinson, T. P. and Metternicht, G. (2006) Testing the performance of spatial
interpolation techniques for mapping soil properties. Computer and Electronics in
Agriculture 50: 97-108
Salem, M.Z. (1987) Pedological characteristics of Bahariya Oasis soils. Ph.D. Thesis, Fac.
of Agric., Ain Shams Univ., Egypt.
USDA (2010) "Keys to Soil Taxonomy", 11th ed., United State Department of Agriculture,
Natural Resources Conservation Service (NRCS).
(Receive 14/10/2012;
accepted 10/1/2013)
K. M. DARWISH AND A. A. AFIFI
Egypt. J. Soil Sci. 52, No. 2 (2012)
274
بالصحراء ةالتوزيع المكانى لحالة ملوحة التربة فى أراضى منخفض
الغربية, مصر
خالذ دمحم درويش
* عفيفىأحمذ و أحمذ عبذ الفتاح
**
* ــ لس ذىظيا األراض ايا
ــ عذ تؽز األراض اماؼح
ذيح األتؽاز
ــ تزض اعزبــ اعي ارطثيماخ ارىظي
ذريحاألسى**
لس األراض
ــ زازوش ام ثؽ ــ أسرغالي ايا
ــ اعيشج
. صز
يعرثز ذميي اؽساسيح ذرظح ؼح ارزتح اخطاخ األ ؽ إدارج ظيذج
ارد األراضي, ؼيس ذعة أ ع األل ذساعذ ف اؽذ ارأشيزاخ اغيز
طة رصذ دليك ؽاح ذػ األراض ذثاي زغت ع اشراعح. ذا ير
االذعااخ ؽذ ارذر ف األراض اشراعي، ذأي اسرخذا ادارج
سرذا ظيذ ألراضي. ذا اطك عذ ا خفض اثؽزي تاصؽزاء
اصزي اغزتي ياظ ذؽذيا وثيز ف ذافز األراض اصاؽح شراع. ذا
ح ذػ ارزت. ذص تيااخ االسرشعار ع تعذ وذه اشياراخ اؽمي تسثة شى
ااطك اؽذيصح األسرصالغ حدرا وثيز ف ذؽذيذ ااطك ارأشزج تاألالغ خاص
افرمذ ألدارج اعيذ ا ذعث در ف سيادج األراض اغذل, ارسزب
رمياخ األؼصاء اعغزافي ذعرثز ف رزت. , سيادج ذػ ا اائ لاخ از
سي ؼذيص ظيذ ذراسح ارثاياخ ف طثيعح ارسيع اىاي ألراض ارأشز
تاألالغ.
رلع ذمذيز لي لياساخ Ordinary krigingف ذ اذراس ذ ذطثيك ذميح
ااطك في ( وذالح ع ؼاح ذػ ارزت ف تعضECارصي اىزتائي )
ااؼاخ اثؽزيح. لذ اسرخذد اثيااخ اىايح مياساخ ارصي اىزتائي
(EC ع )autocorrelation ش اسرخذد ألراض خزائظ إؼصائيح دليمح ،
ذ ادراض ععح لي تيااخ krigingاطك ازاد دراسرا خالي ذميح
تشى رىا رؽسي ارمذيز ارلع ؽاح (ECلياساخ ارصي اىزتائي )
, ذ ؼح ارزتح ف ااطك ذؽد اذراس. خالي ارؽي األؼصائ ثيااخ
( الؼظر عيع Skewness and kurtosisؼساب ذ ارعاف ارفزطػ )
اثيااخ وذه صف شى ذاش ارسيع األؼصائ اطثيع ثيااخ
يائيح خالي اطك اذراسح ف شاي ظب ااؼ. ذد مارح اعيوي
( تاسرخذا ذمياخ اعيسراذسريه ع ECذسيعاخ اثيااخ امذرج اىايح )
ااؼيح ععاخ أخز لياساخ ؼح ارزتح في اطك اسع أش
اائي ارؽص عي افيح، ان عا خرفح عثد در ف ارأشيز ع ااذط
، خاصح في اعشء اعتي ااؼ. kriging logarithmتأسرخذ ذمي
تأخذ ذ اعا ف األعرثار, يى اؽصي ع رائط أوصز دلح.
ارائط ارؽص عيا ذشيز إ أ ذىفح ذعيع اعياخ اطك اذراسح
ه امي ارلع يى ذؽسا تشى وثيز تاسرخذا يى خفضا تشى وثيز، وذ
. خالي اخزائظ ارائط ارؽص عيا ف ذ اذراسح يس krigingذميح
ع صاع رخذ امزار ذميي ؼاح ؼح ارزتح ف ااطك ذؽد اذراس
الع ؼفز تشى ألع أدق وذه ذؽذيذ اطك ارسع اشراع األسرصالغ
ذ اذراسح ساعذخ ف ذضيػ اىفاءج اىرسث خالي آتار ايا اعفي.
رؽي ارغيزاخ اىايح اعمذج ordinary kriging logarithmذطثيك ذميح
رس خزائظ ارسيعاخ اىاي ؼح ارزت ف ااطك ذؽد اذراسح.