Super-resolution for a point source better than lambda/500 using positive refraction
Upload
khangminh22Category
view
1download
0
King’s Research Portal
DOI:10.1016/j.ultrasmedbio.2019.11.013
Document VersionPublisher's PDF, also known as Version of record
Link to publication record in King's Research Portal
Citation for published version (APA):Christensen-Jeffries, K. M., Couture, O., Dayton, P. A., Eldar, Y. C., Hynynen, K., Kiessling, F., O'Reilly, M.,Pinton, G. F., Schmitz, G., Tang, M-X., Tanter, M., & van Sloun, R. J. G. (2020). Super-resolution UltrasoundImaging. Ultrasound in Medicine and Biology, 46(4), 865–891.https://doi.org/10.1016/j.ultrasmedbio.2019.11.013
Citing this paperPlease note that where the full-text provided on King's Research Portal is the Author Accepted Manuscript or Post-Print version this maydiffer from the final Published version. If citing, it is advised that you check and use the publisher's definitive version for pagination,volume/issue, and date of publication details. And where the final published version is provided on the Research Portal, if citing you areagain advised to check the publisher's website for any subsequent corrections.
General rightsCopyright and moral rights for the publications made accessible in the Research Portal are retained by the authors and/or other copyrightowners and it is a condition of accessing publications that users recognize and abide by the legal requirements associated with these rights.
•Users may download and print one copy of any publication from the Research Portal for the purpose of private study or research.•You may not further distribute the material or use it for any profit-making activity or commercial gain•You may freely distribute the URL identifying the publication in the Research Portal
Take down policyIf you believe that this document breaches copyright please contact [email protected] providing details, and we will remove access tothe work immediately and investigate your claim.
Download date: 22. Jan. 2022

Ultrasound in Med. & Biol., Vol. 46, No. 4, pp. 865�891, 2020Copyright © 2020 Published by Elsevier Inc. on behalf of World Federation for Ultrasound in Medicine & Biology.
This is an open access article under the CC BY license. (http://creativecommons.org/licenses/by/4.0/)Printed in the USA. All rights reserved.
0301-5629/$ - see front matter
https://doi.org/10.1016/j.ultrasmedbio.2019.11.013
� Review Article
SUPER-RESOLUTION ULTRASOUND IMAGING
TAGGEDPKIRSTEN CHRISTENSEN-JEFFRIES,* OLIVIER COUTURE,y PAUL A. DAYTON,z YONINA C. ELDAR,x
KULLERVO HYNYNEN,{,║,# FABIAN KIESSLING,** MEAGHAN O’REILLY,{,║ GIANMARCO F. PINTON,z
GEORG SCHMITZ,yy MENG-XING TANG,zz MICKAEL TANTER,y and RUUD J.G. VAN SLOUNxxTAGGEDEND*Department of Biomedical Engineering, School of Biomedical Engineering and Imaging Sciences, King’s College London,
St Thomas’ Hospital, London, United Kingdom; y Institute of Physics for Medicine Paris, Inserm U1273, ESPCI Paris, CNRS FRE2031, PSL University, Paris, France; z Joint Department of Biomedical Engineering, University of North Carolina at Chapel Hill andNorth Carolina State University, Chapel Hill, North Carolina, USA; xDepartment of Mathematics and Computer Science, Weizmann
Institute of Science, Rehovot, Israel; { Physical Sciences Platform, Sunnybrook Research Institute, Toronto, Ontario, Canada;║Department of Medical Biophysics, University of Toronto, Toronto, Canada; # Institute of Biomaterials and Biomedical
Engineering, University of Toronto, Toronto, Ontario, Canada; ** Institute for Experimental Molecular Imaging, RWTH AachenUniversity, Aachen, Germany; yyChair for Medical Engineering, Faculty for Electrical Engineering and Information Technology,
Ruhr University Bochum, Bochum, Germany; zzDepartment of Bioengineering, Imperial College London, London, United Kingdom;and xxDepartment of Electrical Engineering, Eindhoven University of Technology, Eindhoven, The Netherlands
(Received 4 August 2019; revised 17 November 2019; in final from 20 November 2019)
Ad’ImagINSERE-mail
T
Abstract—The majority of exchanges of oxygen and nutrients are performed around vessels smaller than100 mm, allowing cells to thrive everywhere in the body. Pathologies such as cancer, diabetes and arteriosclerosiscan profoundly alter the microvasculature. Unfortunately, medical imaging modalities only provide indirectobservation at this scale. Inspired by optical microscopy, ultrasound localization microscopy has bypassed theclassic compromise between penetration and resolution in ultrasonic imaging. By localization of individualinjected microbubbles and tracking of their displacement with a subwavelength resolution, vascular and velocitymaps can be produced at the scale of the micrometer. Super-resolution ultrasound has also been performedthrough signal fluctuations with the same type of contrast agents, or through switching on and off nano-sizedphase-change contrast agents. These techniques are now being applied pre-clinically and clinically for imaging ofthe microvasculature of the brain, kidney, skin, tumors and lymph nodes. (E-mail: [email protected]) © 2020 Published by Elsevier Inc. on behalf of World Federation for Ultrasound in Medicine &Biology. This is an open access article under the CC BY license. (http://creativecommons.org/licenses/by/4.0/).
Key Words: Ultrasound, Microvessels, Super-resolution, Localization, Microscopy, Microbubbles, Contrastagents, Brain, Tumor.
INTRODUCTION
Our circulatory system is so vital that the loss of blood
flow is one of the key parameters defining death. This
vessel network created by nature comprises billions of
vessels that carry fundamental nutrients, hormones and
gases at distances longer than simple diffusion in large
living beings (Pugsley and Tabrizchi 2000). Would one
lay out all of the arteries and veins and the 40 billion
capillaries in one human adult, they would reach more
ddress correspondence to Olivier Couture, Laboratoireerie Biomedicale, Sorbonne Universite, CNRS UMR 7571,M U1146, 15 rue de l’Ecole de Medecine, 75006, Paris, France.: [email protected] authors’ names are listed alphabetically
865
than 100,000 km or two times the circumference of the
earth. The tiniest components of our vasculature, the
capillaries, are less than 10 mm in diameter (Lenasi
2016) or about a tenth of the diameter of a human hair.
Some capillaries are even smaller in diameter than blood
cells, forcing cells to distort their shapes to pass through.
From a biomechanical point of view, the circulatory
system is also a piece of extraordinary machinery ensur-
ing rapid transport and complete distribution of blood at
meters per second in our largest arteries down to less
than 1 mm/s in the capillaries feeding the vast territory
of our organs at microscopic scales. To achieve this
amazing feat, the 3-D geometry of our vasculature and
the rigidity of each arterial segment are carefully opti-
mized. The arterial stiffness also adapts itself transiently
866 Ultrasound in Medicine & Biology Volume 46, Number 4, 2020
after a load or arterial pressure changes. This highly non-
linear elastic nature of the arterial walls is essential to
effectively damp the large oscillations in blood flow
coming from the heart. It provides for a better flow
homogeneity in tiny blood vessels distal in the arterial
vascular tree. As a consequence, pathologic changes of
the mechanical properties of arteries strongly affect the
transmission of blood to tiny vessels (Webb et al. 2012).
Today, although the field of regenerative medicine and
biomaterials is rapidly progressing, mimicking the com-
plete vascular system with optimal structural and func-
tional properties remains challenging.
In some noble organs such as the brain, the complex-
ity extends to an even higher level, as tiny vessels are inti-
mately connected and communicating with the neuronal
system via the glial system and particularly astrocytes and
pericytes (Iadecola, 2004). Such communication allows
for precise coupling between neuronal activity and blood
flow, which ensures that activated brain regions are prop-
erly nourished in oxygen, glucose and other nutrients.
This neurovascular coupling is the basis for functional
magnetic resonance imaging (MRI) (Kim and Ogawa
2012) and functional ultrasound (Deffieux et al. 2018). In
the brain, as in other organs, the microvasculature is a
dynamic system that adapts to the constantly changing
metabolism of surrounding cells.
At such a microscopic level, large territories of our
knowledge remain unexplored mainly because of the
lack of imaging methods providing non-invasiveness,
microscopic resolutions, a macroscopic field of view and
sufficient temporal resolution for dynamic imaging.
From a fundamental point of view, it is, for example,
striking to note that scientists do not fully understand the
functioning of the human placental vascular system and
exchanges between maternal and fetal blood systems
(Mayo 2018).
Many discoveries have also shed new light on the
major importance of our vascular system in various dis-
ease processes, ranging from cancer, to diabetes, to
neurodegenerative diseases such as Alzheimer or Par-
kinson diseases (Zlokovic, 2011; Stanimirovic and
Friedman 2012). For example, it has been known for
more than 40 y that angiogenesis, the development of
new blood vessels, is a hallmark of solid tumors (Folk-
man 2006). Angiogenesis is driven by tumors that out-
grow their host tissue’s native blood supply, with the
result of the release of pro-angiogenic factors that
locally stimulate increased microvascular development
to feed the growing malignancy. Pathologic angiogene-
sis is differentiated from the normal microvascular
structure by the lack of hierarchical branching, the pres-
ence of tortuous and erratically shaped vessels and
immature and leaky vessels (Jain 1988).
Dementia also has a microvascular component, as it is
more likely to be present when vascular and Alzheimer dis-
ease lesions co-exist (Jellinger 2008). In elderly individu-
als, the association between stroke and Alzheimer disease
increases in patients with vascular risk factors (Iadecola et
al. 2010; Gorelick et al. 2011). Vascular endothelial growth
factor, one of the most potent mediators of angiogenesis,
can be envisioned as a potential therapeutic for neurode-
generative disorders (Storkebaum et al. 2004).
The diagnosis of these diseases would benefit greatly
if the microcirculation could be characterized in each tis-
sue, organ and patient. Indeed, pathologies leave first their
signature in tiny vessels before becoming detectable
much later in larger vessels by a dramatic domino game.
Unfortunately, the naked eye cannot resolve the
vessels smaller than 100 mm forming the microcircula-
tion. Moreover, most of these vessels lie beyond the pen-
etration depth of coherent light in tissue. Histopathology
can be performed after a biopsy or a surgical resection
and remains the gold standard for cancer diagnosis.
However, such approaches are limited by their invasive-
ness in the clinical setting or pre-clinical research.
Microvascular parameters linked to angiogenesis, such
as microvascular density and intercapillary distance, are
obtained by observing and measuring stained vessels on
highly magnified thin slices under a microscope. Several
types of tissue staining can help reveal microvessels spe-
cifically such as anti-CD31, CD34 and von Willebrand
factor (Weidner 1995; Marien et al. 2016).
Within a few hundred microns depth, microscopy
can also be applied directly on the skin or mucosa to
observe its microcirculation. Techniques such as orthog-
onal polarization spectral imaging and sidestream dark-
field imaging can extract specifically the light from
blood and provide a map of blood vessels under the sur-
face (Leahy 2012). Flow can also be assessed with laser
Doppler either at a single point or on an entire map.
Additionally, retinography can assess the evolution of
the microcirculation, in diabetic patients for example, by
exploiting the clear window provided by the eye
(Pieczynski and Grzybowski 2015).
Various modalities are able to reach microscopic
resolutions such as two-photon imaging (Soeller and
Cannell 1999) or optical coherence tomography (Jia
et al. 2012) at the cost of a limited field of view and pen-
etration depth. Other approaches based on tissue clearing
coupled to light-sheet microscopy lead to high-resolution
volumetric imaging of the microvasculature in organs
but are limited to dead tissues (Ertuk et al. 2012; Ragan
et al. 2012). Additional approaches such as photo-acous-
tics (Wang and Hu 2012) and functional ultrasound
(Deffieux et al. 2018) based on ultrafast Doppler
(Bercoff et al. 2011; Demene et al. 2016) recently

Super-resolution Ultrasound Imaging � K. CHRISTENSEN-JEFFRIES et al. 867
improved our ability to image small vessels (of the order
of 100 mm in diameter) but fail to reach microscopic res-
olution scales.
Moreover, for human diagnostic or animal imaging
in-depth, it is necessary to exploit modalities that can
explore entire organs, at a depth beyond 10 cm. Well-
known medical techniques, such as MRI (Williams et al.
1992), computed tomography (CT) (Miles 1991), nuclear
imaging (Underwood et al. 2004) and ultrasound (Cos-
grove and Lassau 2010) all have versions that are sensi-
tive to blood perfusion. Perfusion CT works by
following a bolus of injected iodinated material in differ-
ent parts of the organ. Parameters such as blood flow,
blood volume, time to peak and mean transit time can be
extracted from the bolus curves. In a similar fashion, per-
fusion MRI can also be performed with a contrast agent
such as gadolinium chelate complex. Furthermore, using
arterial spin labeling, MRI can even provide information
on perfusion without contrast agent injection (Peterson
et al. 2006). With the use of injected radionuclide, sin-
gle-photon emission CT (SPECT) can be made sensitive
to perfusion, which is clinically applied to the cardiac
muscle for instance. However, these techniques provide
only broad generalities on the microcirculation in each
imaging voxel. None of them can define the microvascu-
lar architecture itself because these macroscopic modali-
ties are limited in resolution to the submillimeter and
millimeter scales.
In particular, ultrasound imaging is limited in reso-
lution by diffraction to the scale of its wavelength (wave-
length = speed of sound/frequency, a 5-MHz ultrasound
wave in tissue has a 300-mm wavelength). It relies on
the echo of tissue owing to variation in compressibility
and density to reconstruct anatomic images. In Doppler
mode, it is sensitive to blood vessels through the motion
of red blood cells serving as scatterers. However, small
vessels have a limited number of weak scatterers, which
are also moving slowly, making it particularly difficult
to distinguish vessels from tissue motion. Generally, ves-
sels with blood velocities below 1 cm/s are difficult to
distinguish, making Doppler ultrasound a poor imaging
method for the microvasculature. Even with recent
advances exploiting ultrafast plane-wave imaging and
spatiotemporal filters (Bercoff et al. 2011; Demene et al.
2016), which improved drastically the sensitivity of
Doppler ultrasound, micro-arterioles and microvenules
remain invisible to Doppler ultrasound.
As in other medical imaging techniques, ultrasound
imaging can be made sensitive to unresolved microves-
sels by the introduction of contrast agents (Cosgrove and
Lassau 2010). These agents are microbubbles, smaller
than capillaries, which are injected intravenously and
flow within the entire vasculature for about 3 min
(Ferrara et al. 2000; Ferrara et al. 2007; Blomley et al.
2001; Burns and Wilson 2006). Microbubbles act as res-
onators with a resonance frequency in the range
1�15 MHz, vastly increasing their scattering coefficient
in the clinical frequency range. Moreover, microbubbles
re-emit ultrasound in a non-linear fashion, providing a
tool to separate them from tissue (Frinking et al. 2000;
Stride and Saffari 2003; Dollet et al. 2008). The presence
of these contrast agents highlights the vasculature,
including the capillaries, as the ultrasound scanner is
also sensitive to slowly moving microbubbles. One great
advantage of microbubbles for perfusion imaging is that
they are entirely intravascular because of their microme-
ter size. Hence, after injection, the only compartment to
be taken into account for the calculation of parameters
such as the mean transit time is the vasculature. Cru-
cially, in contrast to optical agents, microbubbles can be
detected deep within the body, making them advanta-
geous as a clinical contrast modality. Furthermore, con-
trast-enhanced ultrasound (CEUS) scans are already an
established and routine clinical procedure in many clin-
ics around the world, making fast clinical translation a
real possibility.
Unfortunately, conventional ultrasound remains
limited by resolution in the same way as MRI, CT or
SPECT. The extracted parameters are linked only indi-
rectly to modifications in the microcirculation. If a medi-
cal imaging technique directly maps microvessels, it
would provide a revolutionary wealth of information,
bridging the gap with histopathology. For instance, such
a technique could measure directly vessel density, inter-
distance, size, unique flow pattern, tortuosity or fractal
factor.
The extensive work on microbubble imaging has
recently inspired a new technique that has caused an
important rupture in a fundamental characteristic of
ultrasound: its resolution. Introduced 10 y ago, super-res-
olution ultrasound can improve the resolving power of
ultrasound imaging by a factor of 10 with respect to the
diffraction limit (wavelength/2).
This review describes super-resolution ultrasound
imaging as it is conceived by several groups, which
introduced several of the precursor works in the field. It
will first detail its origin and its technical aspects, as well
as define its key concepts and technical aspects. It will
detail both ultrasound localization microscopy and other
approaches based on fluctuations imaging. The latter sec-
tion will discuss the current and future applications for
oncology and neurology.
THE ORIGIN OF SUPER-RESOLUTION
ULTRASOUND
Super-resolution ultrasound imaging has been dis-
cussed for several decades (Ikeda et al. 1979; Jones

Fig. 1. Steps in super-resolution ultrasound processing. (a) Acquisition of ultrasound data over time from contrast-enhanced vascular region. (b) Detection of signals from microbubble contrast agents. (c) Isolation of individual micro-bubble signals; overlapping or interfering signals are rejected. (d) Localization of the microbubble at a precision farbeyond the diffraction-limited resolution. (e) Tracking of the microbubbles through consecutive frames to establishvelocity profiles. (f) Mapping of the accumulated localizations gathered over the series of frames produces an image of
the vascular structure far beyond the diffraction limit.
868 Ultrasound in Medicine & Biology Volume 46, Number 4, 2020
1992; Couture et al. 2018). The goal of super-resolution
is to separate echoes coming from sources closer than
the classic diffraction limit. Such a quest was performed
in parallel to the improvement of resolution through the
increase in acquisition frequency (Lockwood et al.
1996).
Approaches such as near-field imaging (Shekhawat
and Dravid 2005) were found to differentiate subwave-
length sources as the resolution close to a probe is pro-
portional to the distance with respect to the object rather
than the wavelength (Fink and Tanter 2010). However,
in the body, organs are several centimeters deep, which
could be a hundred wavelengths away. A far-field
approach is thus required for medical imaging.
In the far field, refocusing on close individual sour-
ces could be performed when a limited number of them
were present (Blomgren et al. 2002; Lehman and
Devaney 2003; Prada and Thomas 2003). A precise
knowledge of the source could also allow subwavelength
imaging (Clement et al. 2005). However, a limited num-
ber of sources or strong a priori knowledge is not appli-
cable to conventional B-mode imaging, which observes
tissue formed by a multitude of scatterers at various
scale: cells, organelles, fibers, and so forth.
Further rupture of the half-wavelength limit in
ultrasonic imaging was inspired by new developments in
optical microscopy. In 2006, fluorescence photoactivated
localization microscopy, photoactivated localization
microscopy (PALM) and stochastic optical reconstruc-
tion microscopy (STORM) were introduced, breaking
the diffraction limit in optics by at an order of magnitude
or more (Betzig et al. 2006; Hess et al. 2006; Rust et al.
2006). It relies on photoswitchable fluorescence sources
and fast cameras, which take sequential images where
only a subset of the sources is lit in each image. By iso-
lating the sources closer to the wavelength, the interfer-
ence of the wave they emitted could be avoided.
Moreover, knowledge of the point-spread function (PSF)
of the system leads to an extremely precise localization
of isolated sources from their intensity map. By col-
lecting thousands of subwavelength localizations, a
picture with a resolution in the tens of nanometer
could be obtained with a microscope using visible
light. These developments were so revolutionary that
they led to the attribution of the 2014 Chemistry
Nobel Prize to Eric Betzig, Stefan Hell and William
E. Moerner.
In 2010, an ultrasonic version of FPALM, now
called ultrasound localization microscopy (ULM), was
proposed (Couture et al. 2010). The fluorescent beacons
were replaced by ultrasound contrast agents, and the
cameras, by an ultrafast programmable ultrasonic scan-
ner (Couture et al. 2009, 2012). Beyond that, the same
principle applied: the interference between different
microbubbles was avoided by observing them sequen-
tially so that isolated sources could be detected in each
image. When the PSF on the radiofrequency channel
data or on the beamformed image is known, a localiza-
tion with a micrometric precision can be obtained for
each microbubble. As these contrast agents are purely
intravascular, the accumulation of these subwavelength
localizations would yield a super-resolved map of the
microvasculature.
The ULM approach (Fig. 1) was rapidly illustrated in
vitro through imaging of a single micro-channel contain-
ing flow microbubbles (Couture et al. 2011). In parallel,
the first in vivo application was reported by Siepmann
et al. (2011), who described a technique to improve maxi-
mum intensity projection images of dilute microbubbles
by implementing centroid detection. By 2013, four of our
teams were already exploring super-resolution imaging.
In vitro, Viessman et al. (2013) reported for the first time
that ULM can distinguish two vessels separated by less
than half a wavelength. Two 3-D super-resolution
approaches were proposed, one with a 1.5-D array
(Desailly et al. 2013) and another with a hemispherical
array through human skull bone (O’Reilly and Hynynen
2013).

Fig. 2. (a) Super-resolution direction map of in vivomouse ear,revealing the direction of blood flow indicated by the colorwheel. Bar = 1 mm. (b) Magnified section of super-resolutiondirection map from (a), alongside corresponding speed map offlow, where speeds >1500 mm/s are set to the maximum on thecolor bar. (c) The graph is the average flow profile over 400-mm sections of these vessels. Here, adjacent vessels haveopposing flows, and are separated by less than half thetransmit frequency of 6.5 MHz (λ/2 » 120 mm). Two ves-sel profiles can be clearly identified by a distinct slow flowseparation, where faster flow is apparent in the centers ofthe vessels. Bar = 500 mm. Reprinted with permission from
Christensen-Jeffries et al. (2015).
Super-resolution Ultrasound Imaging � K. CHRISTENSEN-JEFFRIES et al. 869
Further in vivo applications were rapidly imple-
mented afterward: Christensen-Jeffries et al. (2015)
illustrated the application in the mouse ear, introducing
super-resolved velocity mapping (Fig. 2); Errico et al.
(2015) in the rat brain; and Lin et al. (2017a) in a cancer
model. First-in-human demonstrations of the techniques
with clinical scanners were provided for breast cancer by
Opacic et al. (2018) and imaging in the lower limb by
Harput et al. (2018).
These applications will be detailed in the latter sec-
tions of this review. At this point, it is important to
explain precisely the principle of ultrasound localization
microscopy. Non-ULM approaches will also be intro-
duced.
GENERAL TECHNICAL ASPECTS OF ULM
Like optics, ultrasound faces a limit inherent to all
wave-based imaging processes, where diffraction of the
transmitted and received waves mean point sources
become indistinguishable from one another when closer
than approximately half the transmitted wavelength.
Beyond this, interference of scattered sound results in
acoustic speckle. After the revolutionary developments
seen within the optical field, analogous approaches were
proposed to exploit these same principles, but in the
ultrasound field. Here, instead of utilizing molecules to
provide the individual signal sources required, ultra-
sound contrast agents, called microbubbles, were pro-
posed.
Thus, the super-resolution ultrasound process
requires the introduction of a contrast agent into the
body. Akin to its optical counterpart, it also requires the
acquisition of a sequence of frames. A crucial principle
within localization microscopy techniques is that by lim-
iting the number of sources detected in each image, the
responses do not interfere with each other. Under this
constraint, the location of the underlying scatterers, in
this case, microbubbles, can be estimated to a precision
far higher than the diffraction-limited resolution of the
system. Here, this is exploited to accumulate the locali-
zation of flowing microbubbles over thousands of images
to re-create a super-resolved image of vascular struc-
tures.
Increased worldwide attention within this area of
research means that the contributions of many interna-
tional groups are facilitating rapid progression, diversity
and innovation in this field, which will inevitably
encourage and accelerate clinical implementation.
Despite methodological differences, there are a number
of common steps that form the basis of the technique
throughout the literature. These are (note: post-process-
ing steps are visualized in Fig. 1):
Microbubble introduction
All current single-bubble localization methods for
super-resolution involve the injection of contrast agents
as a bolus or infusion. For localization-based methods,
the concentration of the agent is required to be low
enough that bubbles can be spatially separated by the
image system’s diffraction-limited point spread function
after post-treatment filtering. Recent sparsity-based
approaches (Bar-Zion et al. 2018a) and deep learning-
based methods (van Sloun et al. 2018a, 2018b) can
alleviate these requirements and permit higher
concentrations
Video acquisition
An ultrasound pulse is emitted into a medium con-
taining microbubbles. Then, a video of microbubble
flow is acquired (Fig. 1a). This could be B-mode with or
without contrast-specific pulse sequences, and at conven-
tional or ultrafast frame rates. The received data can be
collected as a matrix of radiofrequency (RF) data
acquired by each channel or as beamformed image data.
Differences may depend on equipment availability,
restrictions with data accessibility or specific clinical
protocols.
Motion correction
Long video acquisitions are often required to
observe the smallest vessels. As super-resolved images
are created from the superposition of many localizations
gathered over time, motion between frames will

870 Ultrasound in Medicine & Biology Volume 46, Number 4, 2020
significantly affect their visualization. Crucially, the
scale of motion present in clinical scanning is often
orders of magnitude larger than the super-resolved ves-
sels themselves. Adequate motion correction techniques
are therefore vital.
Microbubble detection
A crucial part of the super-resolution process is dis-
tinguishing microbubbles from the surrounding tissue
(Fig. 1b). This step creates candidate bubble regions for
subsequent localization. Inadequate bubble detection
will mean that long acquisition times are needed to
obtain sufficient localizations for the final rendering.
Too many erroneous signals may create a challenge for
subsequent filtering processes and result in noise in the
super-resolved image. Techniques to extract microbub-
ble signals from tissue have been thoroughly studied in
the field of CEUS (Cosgrove and Lassau 2010), while
new techniques are also being introduced and developed
within the super-resolution ultrasound field itself.
Microbubble isolation
Once detected, a filtering step can identify isolated
microbubbles in each frame (Fig. 1c). Indeed, the echoes
from two microbubbles that are closer than a few wave-
lengths in an image will interfere, making the corre-
sponding localizations of each microbubble inaccurate.
These signals should, therefore, be rejected at this stage
or at the tracking stage. Consequently, only a limited
number of microbubbles can be detected in each image
to avoid such overlapping.
Localization
A key step in the process is the localization of these
isolated signals (Fig. 1d). Ultrasound waves are coherent
when propagating into tissue. Furthermore, the response
of ultrasound waves to a single isolated point scatterer is
generally well defined by the point spread function of
the imaging system. Under the assumption that these sig-
nals are isolated, this procedure can estimate the location
of the underlying scatterers to a precision far higher than
the diffraction-limited resolution of the system. Locali-
zation of the microbubbles can be performed with a
number of techniques in the RF domain or on beam-
formed images. In reality, the ultimate limit on the reso-
lution in a super-resolved image is determined by the
precision of this localization step.
Tracking
By determining the displacement of a microbubble
between two images, a velocity vector can be created
(Fig. 1e). With sufficient detections, features of the local
vascular velocity can be determined through the creation
of detailed velocity maps. The tracking of these localized
points to define the paths and velocity of microbubbles in
microvessels can vastly improve the quality and infor-
mation content of images and modify their interpreta-
tion. Such microbubble tracking has distinct advantages
over Doppler in spatial resolution and is largely indepen-
dent of the direction of the flow displacements.
Visualization
The visualization of localizations, their density, or
their calculated velocities is performed by creating a
map from the microbubble positions after correcting for
motion to reveal details of the vascular network
(Fig. 1f). This can be performed either by accumulating
bubble detections in fine grids with pixel sizes that
reflect the scale of the super-resolved detail or by plot-
ting each localization as a Gaussian distribution, where
its size accounts for the uncertainty in the localization
procedure.
DEFINITIONS
Super-resolution ultrasound imaging is a new tech-
nique with much promise, but with terminology that
could become confusing. One of the goals of this review
is to establish a common language and provide several
definitions. This can be particularly important to unite
applications that can differ widely, such as the simple
improvement of vascular imaging in deep-seated tissue
in humans or the direct observation of capillaries in the
animal brain.
Resolution
In super-resolution ultrasound imaging, as in any
imaging modality, resolution is the capacity to separate
two objects to be imaged. However, in our case, these
objects are the vessels to be imaged. The separation of
two vessels or the capacity to separate two distinct flows
patterns within the same vessel is the ultimate measure-
ment of resolution in our field. Other approaches from
the optical field should also be exploited such as the
Fourier shell correlation threshold (Van Heel et al.
2005).
Super-resolution
Super-resolution is the capacity to distinguish two
objects, here vessels, beyond the classic limit. Several
classic limits have been proposed, and their relevance
depends ultimately on the application. The lower limit
for resolution is usually considered to be the diffraction
barrier at half the wavelength. One can also use the Ray-
leigh resolution criterion of 1.22λ (focal length/aperture)(Cobbold 2006). The latter definition is more lenient in
the vast majority of cases, but providing a 150-mm reso-
lution at a 15-cm depth with a 5-cm-aperture, 5-MHz

Super-resolution Ultrasound Imaging � K. CHRISTENSEN-JEFFRIES et al. 871
transducer remains an interesting exploit for medical
applications, especially for larger organs. In both cases,
the particular limit should be clearly stated in the article
to allow a better comparison between studies.
It should be noted that post-filtering techniques on
diffraction-limited images are not considered super-reso-
lution as they assume a priori knowledge of the vessels
to be separated. Indeed, prior information on the ultra-
sound echo sources has to be exploited before their accu-
mulation, as it is their physical interference in each
frame that has to be avoided to achieve super-resolution.
Super-resolution ultrasound imaging
Super-resolution ultrasound imaging (SRUS) refers
to a field of study comprising several techniques—using
high-frequency acoustic waves—that can distinguish
objects or structures closer than the diffraction limit,
which is about a half-wavelength. These techniques
include ultrasound localization microscopy, super-reso-
lution fluctuation imaging or structured illumination.
Ultrasound localization microscopy
Ultrasound localization microscopy (ULM) refers
to a super-resolution ultrasound technique. It exploits the
accumulation of sub-wavelength localizations of many
separate sources over a great number of frames to recon-
struct a super-resolved composite image. In each frame,
the localization sources are sufficiently sparse so that
their interference can be disregarded or taken into
account to yield a precise positioning.
Localization precision
Ultrasound localization microscopy relies on the
accumulation of the centroid’s localization of isolated
microbubbles to reconstruct a super-resolved image of
the microvasculature in which they flow. One of the key
aspects is hence the capacity to localize a single source
with a good precision either on the radiofrequency chan-
nel data or on the beamformed image. The localization
precision is the closeness between several measures of
the localized position of a single isolated microbubble. It
depends, for instance, on the signal-to-noise ratio (SNR)
(Desailly et al. 2015). This precision is often close to the
size of the microbubbles and that of the capillaries. This
precision is not the resolution of the imaging system as
the microbubbles are not the structure to be imaged, but
they are rather the probes that highlight that structure.
Isolated microbubbles
A source is deemed isolated if, in a single image, no
other sources can bias significantly the localization of its
center. This depends on the techniques that have been
developed to distinguish non-isolated sources, along
with the contrast-to-tissue ratio (CTR), the SNR and the
PSF of the system.
Temporal resolution
Temporal resolution corresponds to the total time to
display a super-resolved image. It has to be distinguished
from the frame rate of the acquisition. Temporal resolu-
tion and spatial resolution are closely linked because the
accumulation of microbubble localization will yield an
improved image. After injection, microbubbles remain
rare compared with red blood cells (about 1/100,000)
and it takes time for these agents to fill every single cap-
illary.
MICROBUBBLE DIFFERENTIATION VERSUS
TISSUE
The first stage for ULM is the separation of micro-
bubbles from tissue. Fortunately, because the first ultra-
sonic detection of microbubbles in vivo (Gramiak and
Shah 1968), several techniques have been proposed to
highlight the signal of contrast agents. With respect to
tissue or blood, microbubbles have several distinct char-
acteristics.
First, these intravascular microbubbles move with
the blood, allowing them to be separated from static or
slowly moving tissue. The first microbubble detection
technique was hence ultrasound Doppler. For instance,
on continuous Doppler, isolated microbubbles in the
blood make a very distinctive broadband “ploc” as they
pass through the acoustic beam.
As discussed before, microbubbles are clearly dis-
tinct from the blood by the intensity of their echo. Their
scattering cross-section can be three orders of magnitude
greater than their physical size (Wheatley et al. 1990).
This is partly owing to the important acoustic mismatch
between air and an aqueous solution. But it is also owing
to a very beneficial coincidence of nature. Indeed, micro-
bubbles act as a resonator, where the compressible air is
the spring and the surrounding water is the mass. The
resonant frequency of microbubbles small enough to
move in the capillary falls exactly in the megahertz
range within which clinical ultrasound imaging is per-
formed. This resonance increases the echo of microbub-
bles by several orders of magnitude.
However, beyond moving faster than tissue and
scattering more than red blood cells, microbubbles can
also be detected through their non-linear echoes
(Schrope et al. 1992; Shi and Forsberg 2000). Because
of their strong oscillations around their resonance, the
acoustic behavior of microbubbles goes beyond simply
following the incident wave. In the scattered spectrum,
this non-linearity can be detected as a rich harmonic,
subharmonic, superharmonic and ultraharmonic content

872 Ultrasound in Medicine & Biology Volume 46, Number 4, 2020
and microbubbles can be detected as such (Burns et al.
1994; Forsberg et al. 2000; Basude and Wheatley, 2001).
However, multipulse sequences are even more sensitive
to contrast agents, and commercial systems have imple-
mented techniques such as pulse inversion (PI) (Simpson
et al. 1999; Eckersley et al. 2005), amplitude modulation
or a combination to highlight perfusion after microbub-
ble injection.
Finally, beyond a few hundred kilopascals, micro-
bubbles oscillate so violently that they can disrupt, their
shells rupturing and their gas diffusing into the surround-
ing fluid (Postema et al. 2004). The disappearance of the
microbubbles after a short but intense pulse (Chomas
et al. 2001) can be used as a contrast mechanism through
differential imaging (DI), but can also be applied for
flash-replenishment techniques (Johnson and Powers
1995; Greis 2009).
All these approaches have already been exploited to
detect microbubbles for ultrasound localization micros-
copy. Specific techniques depend generally on the fre-
quency used, which itself depends on the depth at which
the imaging is performed. At higher frequencies, micro-
bubbles are poorly resonant and scatter little harmonics,
so techniques based on the motion or disruption of micro-
bubbles are preferable. For instance, spatiotemporal filter-
ing with singular value decomposition (SVD) has,
importantly, increased Doppler sensitivity and has been
exploited to separate microbubbles from tissue (Errico et
al. 2015; Desailly et al. 2017; Song et al. 2017). In addi-
tion, deep learning techniques can be used to solve the
microbubble tissue separation problem through an
unfolded robust principal component scheme (Cohen et
al. 2019). More simply, DI can also highlight the motion
or disruption of microbubbles (Desailly et al. 2013).
Closer to resonance, it is highly beneficial to use
non-linear techniques. Pulse inversion and amplitude
modulation have been used to extract the signal from
microbubbles (Viessman et al. 2013; Christensen-
Jeffries et al. 2015, 2017a, 2017b). These various
approaches were compared in a recent article by Brown
et al. (2019).
For cardiac, abdominal or transcranial applications,
depths on the order of 10 cm are required. However,
detecting separable microbubbles in microvessels at
these depths is challenging because the intensity of the
signal backscattered from microbubbles is low, and
increasing the transmit energy is not a viable option
because of microbubble destruction. Previous studies
have proposed the use of larger microbubbles to increase
the amplitude of the backscattered signals (Lin et al.
2017b); however further improvements are needed to
achieve super-resolution at clinically relevant depths.
Furthermore, the accurate evaluation of microvascular
structure requires imaging in three dimensions where the
small aperture sizes of existing matrix arrays are chal-
lenged in terms of sensitivity and contrast. However, the
volume fraction of tissue that is occupied by vessels is
typically less than 10%; therefore, imaging sequences do
not need to interrogate the entire volume.
A simultaneous multifocus beamforming approach
was proposed to simultaneously sonicate two or more
foci with a single emission (Espindola et al. 2018). This
has the advantage of retaining a high frame rate, yet
achieving improved sensitivity to microbubbles. In the
limit of one target, this beam reduces to a conventional
focused transmission; and for an infinite number of tar-
gets, it converges to plane wave imaging. By interleav-
ing targeting sequences with imaging sequences, only
volumes of tissue that contain visible bubbles can be tar-
geted, thus reducing the number of transmit�receive
events required to construct an image while improving
the sensitivity. Experimental results have indicated that
the adaptive multifocus sequence successfully detects
744 microbubble events at 60 mm, while these are unde-
tectable by the plane wave sequence under the same
imaging conditions. At a shallower depth of 44 mm, the
adaptive multifocus method detected 6.9 times more
bubbles than plane wave imaging (1763 vs. 257 bubble
events).
MICROBUBBLE ISOLATION
A current research area is the method by which the
microbubble signals are separated. Indeed, to make
localization work precisely, scattered signals from
microbubbles need to be isolated in each individual
image. Neighboring echoes that are closer than the Ray-
leigh criterion in a single frame cannot be distinguished
from one another and interference will make the corre-
sponding localizations inaccurate. Notably, in van Sloun
et al. (2019), a deep neural network was specifically
trained to learn the interference patterns of closely
spaced microbubbles and directly infer their locations.
Yet, in most methods, these signals are typically rejected
at this stage.
Super-resolution ultrasound has been illustrated using
relatively high microbubble concentrations in the blood,
where signal separability is achieved by significantly limit-
ing the number of microbubbles detected in each frame. As
early as 2011, Siepman et al. and Couture et al. achieved
microbubble isolation after bolus injection using pairwise
frame subtraction, where preceding frames were subtracted
to detect only the signals from moving or disrupted micro-
bubbles in each image. In Siepman et al., this was per-
formed using a high frequency of 50 MHz, meaning a
considerably smaller diffraction-limited signal size, as well
as the inherent compromise of limited penetration depth.
With a lower frequency suitable for deeper imaging,

Super-resolution Ultrasound Imaging � K. CHRISTENSEN-JEFFRIES et al. 873
Couture et al. (2011) and later Desailly et al. (2013) imple-
mented pairwise frame subtraction, termed differential
imaging (DI), using ultrafast imaging frame rates (up to
20,000 Hz for shallow tissue). This allowed microbubble
isolation by detecting the decorrelation between successive
ultrasound echoes caused by the fast movement or disrup-
tion of bubbles. Although applicable, the disruption of
microbubbles remains undesirable as it restricts microbub-
ble tracking capabilities, as well as the visualization of
microbubbles flowing through small microvessels.
The most direct way to achieve isolated signals is to
reduce the concentration of microbubbles in the blood.
By use of an infusion, a constant microbubble concentra-
tion can be maintained that minimizes the likelihood of
overlapping signals occurring. This method was imple-
mented successfully in some of the earliest demonstra-
tions of ultrasound super-resolution, including those of
Viessman et al. (2013), O’Reilly and Hynynen (2013)
and Christensen-Jeffries et al. (2015), and has been used
extensively in the field since. Notably, detection and iso-
lation techniques are often intertwined, and some detec-
tion procedures may perform both of these steps to some
degree. For example, either B-mode, contrast-specific
imaging techniques (e.g., PI or contrast pulse sequencing
[CPS]) or SVD (Desailly et al. 2017) has been used pri-
marily for detection; however, these also help to isolate
signals because they reduce the number of bubbles that
are visible in each frame. This can be owing to, for
example, some bubbles being off-resonance or weakly
responding in the case of contrast-specific methods, or
slow-moving or stationary bubbles in the case of SVD.
Despite the advantages of infusions for this tech-
nique, standard clinical contrast imaging protocols often
involve a bolus injection. As such, soon after injection,
the bubble concentration in the blood reaches its peak,
and isolated detections are often nearly impossible
(unless detection strategies are such that only a small
proportion of bubbles are visualized). In these instances,
the selection of suitable video segments during both the
inflow and later stages of the acquisition can improve the
separability between individual microbubbles. This
method was implemented in vivo by Ackermann and
Schmitz (2016). Alternatively, multiple lower-volume
bolus injections can be performed to improve the dura-
tion of the desired bubble concentration as implemented
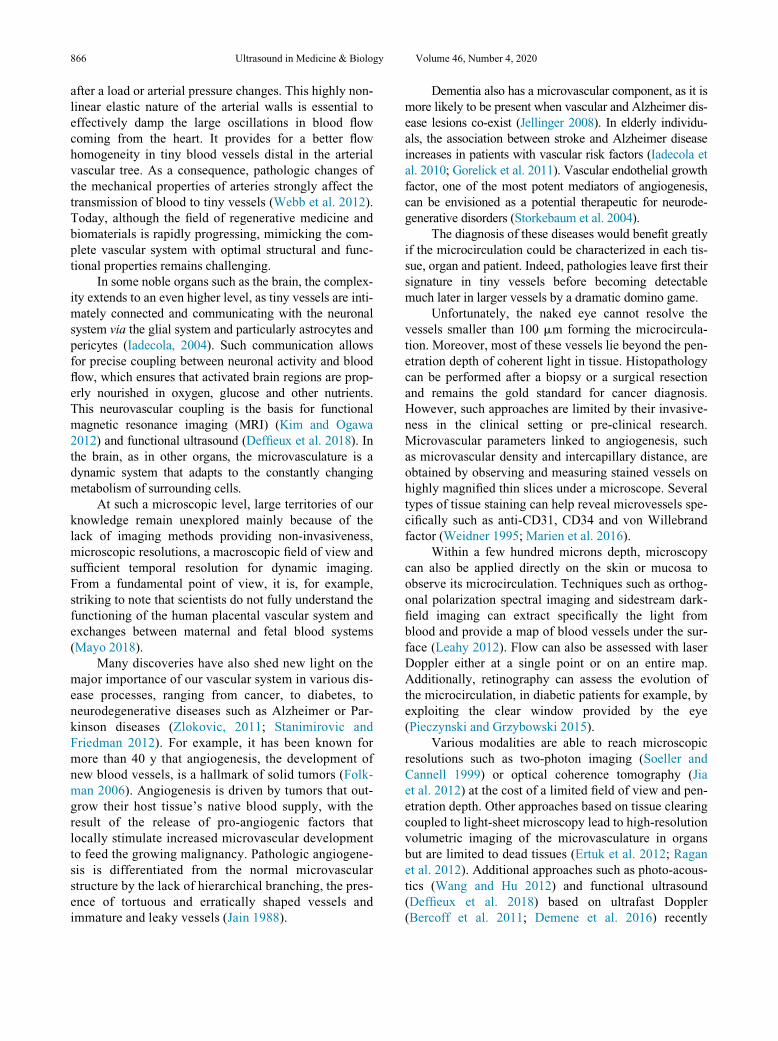
in Errico et al. (2015) and Zhu et al. (2019). Addition-
ally, destruction�replenishment sequences can be per-
formed after contrast injection to capture the reperfusion
of microbubbles into a region before their signals over-
lap, as in Opacic et al. (2018).
Although these methods aim to extract mainly iso-
lated microbubble signals, an additional step is often
required to reject any remaining interfering signals. For
example, in O’Reilly and Hynenen (2013), all in vitro
frames containing too high a sidelobe intensity (�50%
global maximum in frame) were rejected. Most other
methods have involved searching for or rejecting signals
based on their similarity to expected microbubble signa-
tures. In Christensen-Jeffries et al. (2015), the size and
intensity of any connected signal regions were compared
with those of the expected PSF (point-spread function)
based on characterization experiments. In Errico et al.
(2015), after spatiotemporal filtering procedures, a
Gaussian model based on typical microbubble signal
properties was used to perform a 2-D normalized cross-
correlation with each interpolated frame. Similarly, in
Ackermann and Schmitz, (2016), after background sub-
traction, a 2-D convolution of the foreground frame was
performed with a Gaussian kernel to identify single
microbubble signals for subsequent localization.
These methods can be performed at both conven-
tional clinical imaging frame rates (�100 Hz) (O’Reilly
and Hynynen 2013; Viessman et al. 2013; Christensen-
Jeffries et al. 2015; Ackermann and Schmitz (2016);
Harput et al. 2018; Opacic et al. 2018; Kanoulas et al.
2019) and higher frame rates using plane-wave imaging
(>100 Hz) (Errico et al. 2015; Christensen-Jeffries et al.
2017b).
LOCALIZATION
The prior knowledge that the diffraction-limited
image of a microbubble originates from a single source
allows estimation of its location with a precision well
beyond the diffraction limit. Within RF data, a single
echo from a microbubble appears as a hyperbola, deter-
mined by the time-of-flight to arrive at each transducer
element. In beamformed data, which are often more
readily available, particularly in a clinical setting, micro-
bubbles appear as individual “blurs” in an image. Local-
izations from each domain are similar as they both relate
to the fitting of the time-of-flight and, as distinct sources,
can both be determined very precisely. Nevertheless, the
exact equivalence of the localizations in each domain is
yet to be fully examined and may depend on factors such
as the respective SNR, the benefit of phase information
in the RF space and any non-linear processes used to
transfer into the beamformed space.
The localization step requires identification of some
feature of the returned signal that corresponds to the
bubble’s position. In most existing publications regard-
ing ultrasound super-resolution, the position is expected
to coincide with a measure related to the “center” of the
echo because of the assumption that the image is a con-
volution of a point source with the system PSF. In early
work using RF data, Couture et al. (2011) and Desailly
et al. (2013) found a local axial maximum from the trav-
eling hyperboloid in RF data lines by finding the summit

874 Ultrasound in Medicine & Biology Volume 46, Number 4, 2020
of a parabola fit. In some of the earliest studies using
post-beamformed data, localization was performed by
calculating the intensity-weighted center of mass (Siep-
mann et al. 2011; Viessmann et al. 2013; Christensen-
Jeffries et al. 2015), fitting either a 3-D Gaussian func-
tion to the original backscatter signal (O’Reilly and
Hynynen 2013) or a 2-D Gaussian after deconvolving
with a predicted PSF (Errico et al. 2015), or cross-corre-
lation of signals with an expected response (Ackermann
and Schmitz, (2016)).
In optical localization microscopy, provided a suffi-
cient number of emitted photons are sampled, the signal
received from a molecule is well defined, and the inten-
sity centroid is generally used to define its position to
nanometer scale. Likewise, if each microbubble from the
insonated population behaves similarly, generating a sig-
nal close to the system PSF, the aforementioned methods
adequately represent the relative position of the contrast
agents. However, more recently. Christensen-Jeffries
et al. (2017b) demonstrated in vitro and in simulations
that the considerable variability of bubble responses
makes it challenging to predict both their linear and non-
linear responses and that this variability should be taken
into account during localization. It indicated that cen-
troiding, peak detection and 2-D Gaussian fitting meth-
ods introduced hundreds of micrometers in error when
using non-linear imaging at low clinical imaging fre-
quencies. As a result, a new “onset” localization method
was proposed to identify the beginning of the signal in
the axial direction while ignoring ringing or elongated
signal duration. This resulted in considerable improve-
ment in localization error compared with existing meth-
ods and is particularly important in the resonant regime
of microbubbles.
A recent article by Song et al. (2018) described the
influence of the spatial sampling of the beamforming on
the localization error. This study found that the Fourier
analysis of an oversampled spatial profile of the micro-
bubble signal could guide the choice of beamforming
spatial sampling frequency. Furthermore, parametric
Gaussian fitting and centroid-based localization on
upsampled data had better localization performance and
were less susceptible to quantization error than peak
intensity-based localization methods. When spatial sam-
pling resolution was low, parametric Gaussian fitting-
based localization had the best performance in suppress-
ing quantization error, and could produce acceptable
microvessel imaging with no significant quantization
artifacts.
The theoretical limits of ultrasound super-resolu-
tion, and under what conditions these could be achieved,
are of vital importance. Many parameters, including
physiologic ones, influence the separability of microves-
sels or other structures in super-resolution imaging.
However, the best attainable resolution is limited by the
localization precision of each microbubble. This lower
bound is linked to the minimal time delay, which can be
estimated between similar echoes, and is known as the
Cramer�Rao lower bound (Walker and Trahey 1995).
In 2015, Desailly et al. investigated the theoretical reso-
lution limit to which a single, linear, point scatterer can
be localized using hyperboloid fitting and validated this
experimentally. In the far field, Desailly et al. found that
in this situation, the achievable resolution was dependent
on the standard deviation of arrival time estimates on
each channel RF line. These estimates depend on the
pulse bandwidth, the pulse center frequency, the SNR
and the temporal jitter between electronic channels of
the scanner. Both the number of transducer elements
and the speed of sound also influence the resolution,
while the lateral resolution was also dependent on the
depth of the target and the size of the array aperture.
Alongside the extraction and isolation of individual
microbubbles from tissue, the SNR of each microbubble
signal is crucial to the performance of the localization
algorithm. In Foiret et al. (2017), the coherence factor,
the ratio of coherent intensity to incoherent intensity
(Mallart and Fink 1994), was applied to CPS images to
improve the SNR of echoes from individual microbub-
bles. Ghosh et al. (2017) and Lin et al. (2017b) have
reported that selecting a population of larger microbub-
bles improves the SNR from individual microbubbles.
Finally, because of the challenge of separating bubble
signals from noise in images using just spatial informa-
tion, Song et al. (2017) proposed to denoise the micro-
bubble signal in a spatiotemporal domain using a non-
local means filter to improve the separation of microbub-
ble “tracks” from random background noise that does
not resemble any feature or pattern. More robust denois-
ing such as this is beneficial to improve the achievable
isolation and localization precision.
Microbubble localization can also be improved by
modifying the beamforming process, from a delay-and-
sum to a maximum variance approach, for example (Dia-
mantis et al. 2018).
TRACKING
Current ULM techniques usually go beyond the sim-
ple accumulation of microbubbles subwavelength posi-
tions to create an image. The fact that microbubbles
remain exclusively intravascular allows the displacement
of the microbubbles to be interpolated from the various
localizations along a track. Christensen-Jeffries et al.
(2015) and Errico et al. (2015) used such an approach to
establish the direction and the velocity of each microbub-
ble at the micrometer scale. An important advantage of
tracking is the exclusion of artifactual microbubbles.

Super-resolution Ultrasound Imaging � K. CHRISTENSEN-JEFFRIES et al. 875
Indeed, by removing very short tracks (a few images), only
microbubbles with a coherent path are retained, forming an
image with lower noise. Early on, tracking algorithms
were based on the maximum intensity cross correlation
within a search window (Christensen-Jeffries et al. 2015)
or closest-neighbor detector, which identified from the
localized position of a microbubble on image i the most
probable localization on the image i + 1 (Errico et al.
2015). Algorithms have to define several thresholds such
as the maximum distance to the next microbubbles for
starting and ending a track.
Currently, more advanced algorithms can be exploited
such as Monte Carlo based on Markov chain (Ackermann
and Schmitz 2016; Opacic et al. 2018) or joint tracking and
detection in a Kalman framework that is regularized through
optical flow estimates (Solomon et al. 2018). Hungarian
assignment, already exploited in transportation analysis
(Kuhn 1955; Munkres 1957), can also be used to improve
tracking (Song et al. 2018). New approaches to bypassing
the localization process through a dynamic method have
also been discussed (Alberti et al. 2018). Tracking was also
performed in combination with motion correction, which is
discussed in the next section.
The images are often reconstructed by projecting the
detected tracks on an image grid where the pixels are much
smaller than the wavelength, 5£ 5 mm, for example. How-
ever, it is important to note that the size of the vessel where
a single microbubble is detected is misrepresented using this
approach. For instance, a 5-mm “vessel” could simply be a
larger vessel, such as an arteriole, where a single microbub-
ble has passed. In fact, even the aorta would look like a cap-
illary if only a single track is detected inside its lumen. The
true size of a vessel should only be established with a large
number of microbubble tracks, at a minimum sufficient to
cover the vessel diameter. Consequently, the minimal num-
ber of tracks required to reconstruct a vessel was proposed
by Hingot et al. (2019) as the width of the vessel to be
imaged divided by the super-resolved pixel size.
MOTION CORRECTION
Super-resolution ultrasound imaging can achieve
resolution down to 5 mm. However, motion in the body
or from the ultrasound transducer can be several orders
of magnitude beyond this level, especially because
microscopic resolution requires long acquisition times
(Hingot et al. 2019; Christensen-Jeffries et al. 2019)—
sometimes tens of minutes to reconstruct capillaries. A
brute force approach is to fix the organ to be imaged
with a stereotactic frame for the brain (Errico et al.
2015) . However, this approach is limited to organs not
affected by breathing motion, and its implementation is
difficult to imagine in humans apart from neuroimaging.
Christensen-Jeffries et al. (2015) and Lin et al. (2017a)
used respiratory gating to exclude images of tumors that
were affected by breathing. Such an approach requires a
steady motion of the organ, which has to return exactly
to its original position.
Several techniques are now being implemented to
correct the motion based on the ultrasound images them-
selves. The phase correlation of speckle motion can pro-
vide an idea of the collective rigid motion of tissue
(Hingot et al. 2016). It is, however, necessary to remove
the effect of the microbubbles, which can bias the
motion measurement. This can be done directly on B-
mode as has been reported by Foiret et al. (2017). More
advanced non-rigid motion correction can also be imple-
mented to take into account complex motions in the
image (Harput et al. 2018). Indeed, because of its phase
sensitivity, IQ data provide ample information to detect
micrometric motion as reported in the fields of speckle
tracking (Walker and Trahey 1995) and transient elas-
tography (Sandrin et al. 1999). Motion correction pack-
ages already implemented on MATLAB can also be
used directly on the IQ data.
However, because it cannot be tracked on the ultra-
sound data, out-of-plane motion cannot be easily cor-
rected. Hence, motion correction is one of the principal
arguments in favor of 3-D ultrasound localization
microscopy, as displacements in all directions could be
accounted for.
Three dimensions
Super-resolution performed on a 2-D plane will
always be limited for several reasons. First, tissue
motion is inherently 3-D, and its correction necessitates
sampling in all directions, including the elevation axis.
Second, vessels follow tortuous paths in three dimen-
sions, and super-resolved imaging of small sections of
numerous vessels intercepted by the imaging plane
would give a restricted amount of information. Third,
microbubble positions need to be accumulated for a long
time, up to several minutes, to attain the capillary level.
Reconstructing a volume through plane-by-plane imag-
ing as in Errico et al. (2015), Lin et al. (2017b) or Zhu
et al. (2019) is difficult to transfer successfully to the
clinic. Indeed, it could make ultrasound imaging even
more user dependent, as the plane will have to be chosen
and preserved for an extended time to avoid trading off
the underlying resolution.
Because of these 2-D imaging drawbacks, super-
resolution ultrasound imaging was rapidly implemented
with matrix (Desailly et al. 2013) or hemispherical
(O’Reilly and Hynynen 2013) probes to perform ultra-
sound localization over volumes. Both these groups
were able to map, in three dimensions, microbubbles
flowing in microvessels with subwavelength resolution.
However, these approaches were limited either in time

876 Ultrasound in Medicine & Biology Volume 46, Number 4, 2020
resolution or in the reduced imaging volume. The latter
issue also limited another approach exploiting two per-
pendicular probes for 3-D reconstruction (Christensen-
Jeffries et al. 2017a, 2017b).
Appropriate 3-D imaging can be performed with
matrix arrays, where each transducer can be addressed
either through a beamformer in the probe or by connect-
ing each channel to the ultrasound system. However,
matrix arrays are costly and present some technological
hurdles at higher frequencies, making the technology
less available. Heiles et al. (2019) described in vitro a 3-
D super-resolution imaging device in which each of the
1024 channels (32£ 32) was connected to a programma-
ble ultrafast scanner (Provost et al. 2014). In vivo, this
apparatus was able to reconstruct entire super-resolved
volumes of the rat brain, alleviating the previously
described drawbacks with 3-D tracking and motion cor-
rection. Harput et al. (2019b) reduced the number of con-
nected channels by implementing super-resolution on a
2-D sparse array. 3-D super-resolution could even be
performed with a clinical scanner as described by Chris-
tensen-Jeffries et al. (2018).
TRADE-OFFS AND LIMITATIONS
With the potential for spatial resolution to be
improved by orders of magnitude in ultrasound, the per-
formance of the technique now depends on many new
factors, including vascular flow rates, contrast-signal
density, time resolution, SNR, probe geometry, post-
processing algorithms and many more parameters.
Although each of the methodological steps has been
investigated, adapted and improved by various groups,
several new trade-offs have been discovered, and numer-
ous strategies have been introduced to address them.
First, much discussion has arisen in recent years
regarding the requirement for sufficient measurement
times to adequately visualize vascular structures. For all
the aforementioned localization methods, microbubble
signals need to be spatially isolated for accurate localiza-
tion. Thus, there is an upper limit on the number of iso-
lated signals attainable in each frame. The temporal
domain is, therefore, used to gather sufficient localiza-
tions to adequately sample the structure of interest. Yet,
because microbubbles travel within the bloodstream,
slow flow rates associated with the smallest vessels limit
our ability to sample these structures over short periods.
Multiple groups have investigated this fundamental
trade-off between acquisition time and visualization of
the microvasculature, namely, Dencks et al. (2017), Hin-
got et al. (2019) and Christensen-Jeffries et al. (2019).
Dencks et al. (2017) provided an expression for the
acquisition time needed for the localization coverage in
an image to saturate to a value assumed to be
proportional to relative blood volume (rBV). The reli-
ability of rBV estimates from shortened measurement
times is then examined experimentally for bolus scans of
mouse tumors at high frequency and conventional frame
rates (40 MHz, 50 Hz), where approximately 45�170 s
was found to be necessary for a 90% mapping of the
microvessels. In Dencks et al. (2017) the saturation
model was applied to clinical data on breast tumors
(10 MHz, 15 Hz), and 28%�50% filling was found for a
90-s acquisition time. Hingot et al. (2019) aimed to
establish the link between imaging time and microvascu-
lar scale in super-resolved images and found that larger
vessels (>100 mm) are fully reconstructed within 10 s,
while mapping the entire capillary network would take
tens of minutes. This is owing to the limited blood flow
in capillaries, along with their density in tissue. More-
over, the characterization of flow profiles was shown to
be bound by even more stringent temporal limitations.
Christensen-Jeffries et al. (2019) developed a general-
ized model to predict the optimal bubble signal density
and acquisition time for user-defined imaging conditions,
parameters and target vasculature. Similarly, this study
estimated acquisition times longer than 10 min for
microvascular targets at a 5-cm depth and λ/20 super-res-olution. Both studies highlight that super-resolved vascu-
lar imaging is inherently dependent on the physiology of
the vasculature. Nevertheless, the distinct advantages
provided by ultrasound super-resolution, along with the
strengths of this technique over comparable imaging
modalities, mean that several minutes of acquisition
time may be acceptable in the clinical world.
Super-resolution ultrasound techniques have a par-
ticular advantage over high-frequency techniques to
improve resolution without the conventional penetration
trade-off associated with higher frequencies. Neverthe-
less, increased depth still has the capability to degrade
the performance of ultrasound super-resolution. First,
imaging at greater depths will increase the minimum
super-resolution acquisition time. This is because greater
depths require lower transmit frequencies as in conven-
tional imaging. For instance, super-resolution ultrasound
imaging at greater depths (>10 cm) or through the skull
would require 1- to 3-MHz transducers, and at depths of
a few centimeters, this would be achieved around
4�12 MHz, whereas small animal imaging would be
performed at frequencies beyond 15 MHz. Each time,
super-resolution imaging would have an enhanced reso-
lution with respect to conventional imaging, but it would
still be degraded as the frequency is lowered to penetrate
deeper. The resulting larger PSF size decreases the maxi-
mum number of separable signals that can be detected in
each frame. Therefore, the acquisition time required to
create a super-resolved image increases with depth, as
discussed in Christensen-Jeffries et al. (2019). This,

Super-resolution Ultrasound Imaging � K. CHRISTENSEN-JEFFRIES et al. 877
along with the inherent time-of-flight versus depth rela-
tionship, therefore represents a trade-off in minimum
possible super-resolution acquisition time with depth.
Another trade-off is with depth is reduced sensitiv-
ity, particularly using plane-wave imaging. Conventional
focused imaging has a lower frame rate, but because of
the well-established contrast and SNR, it has a higher
sensitivity to microbubble detection than plane waves.
For high-frame-rate sonications, the wide planar beam
used to illuminate the field of view produces poor con-
trast, and the transmitted energy is limited to minimize
microbubble destruction over long imaging times. This
means detecting microbubbles in microvessels at depth
can be challenging. Strategies to improve the sensitivity
of contrast agents at depth are being investigated for
super-resolution imaging, for example, the use of larger
microbubbles (Ghosh et al. 2017; Lin et al. 2017b) and
the use of adaptive multifocus methods, which combine
the high frame rates of plane wave imaging with the
increased bubble detection sensitivity of focused beams
(Espindola et al. 2018).
More generally, the performance of post-processing
techniques and their influence on factors such as SNR
and localization error present potential trade-offs to be
considered when making methodological choices. So
far, Brown et al. (2019) have studied the performance of
various microbubble detection methods using simula-
tions, namely, PI, DI and SVD filtering. They found that
PI is the most appropriate for some applications, but also
the most dependent on transducer bandwidth. PI was
found to be largely independent of flow direction and
speed compared with SVD and DI and, thus, more appro-
priate for visualizing the slowest flows and tortuous vas-
culature. SVD was found to be preferable for high-
frequency acquisitions, where localization precision on
the order of a few microns is possible, but can introduce
localization errors on the order of hundreds of microns
over the speed range 0�2 mm/s, while DI is suitable
only for flow rates >0.5 mm/s or as flow becomes more
axial. Such investigations highlight the need for an
increased understanding of how different techniques can
affect the super-resolution process.
Because of the nature of research progression in this
field, a number of other issues requires increased atten-
tion in the near future. There is an inherent compromise
between the SNR of the signal and the localization preci-
sion. This has been highlighted in studies such as
Desailly et al. (2015), Ghosh et al. (2017), Lin et al.
(2017a) and Espindola et al. (2018). Exploration of the
impact of SNR, specifically in relation to depth and aber-
ration effects, is greatly needed. Additionally, with
increased acquisition time, and with the field moving
increasingly into the 3-D domain, the management and
analysis of large data will become more and more
important in coming years. However, it must be stated
that ultrasound localization is a powerful data-compres-
sion technique. Indeed, radiofrequency channel data—
terabits in size for long 3-D acquisitions—can be con-
verted to an accumulation of hundreds of thousands of
small vectors—a few bits each— representing the super-
resolved path of microbubbles.
Another important trade-off in ultrasound localiza-
tion microscopy-based methods is the concentration of
the injected microbubbles. Too low a concentration
would certainly further prolong the acquisition time, but
increasing the concentration would increase the proba-
bility of having more than one microbubbles in the same
imaging resolution cell, and too high a concentration
would cause many detected signals to be not useful for
super-localization. Such multiple bubble events, if not
rejected, would contribute to the noise of the super-reso-
lution image. Christensen-Jeffries et al. (2019) has
reported that an optimal bubble concentration exists for
super-resolution ultrasound imaging.
Super-resolution ultrasound imaging needs to
demonstrate that it can provide superior microvascular
and microstructural information for clinical applica-
tions to be relevant. In particular, it should be com-
pared with the clinical diagnostic benefit of perfusion
ultrasound imaging. Is there a benefit to displaying
super-resolved microbubble tracks compared with
intensity images or maximum intensity projection?
For instance, if we reconstruct a single microbubble
track, it is impossible to determine if the microbubble
was moving inside a large or a small vessel. Several
microbubbles are hence required in each vessel to
determine its true size and bifurcation. To assess its
accuracy for larger vessels, for mapping subwave-
length flow patterns, super-resolution ultrasound
imaging should be compared with other vascular
imaging modalities such as ultrafast Doppler (Bercoff
et al. 2011) or optical techniques such as microscopy.
The field of ultrasound should explore these concepts
of accuracy more deeply and move beyond the con-
cerns over the smallest observable vessel or the dis-
tinction between two vessels.
SUPER-RESOLUTION ULTRASOUND USING
PHASE-SHIFT AGENTS
A fundamental difference between the localization-
based optical super-resolution methods and the micro-
bubble-based ultrasound counterparts is that there is no
switching on and off of the contrast agents for the ultra-
sound approach. In optical super-resolution such as
PALM (Betzig et al. 2006) and STORM (Rust et al.
2006), some individual contrast agents (i.e., fluorescence
molecules) from a high-concentration population are

878 Ultrasound in Medicine & Biology Volume 46, Number 4, 2020
stochastically switched on and off, creating “blinking” sig-
nals based on which these individual agents can be local-
ized. The accumulation of the localizations depends on the
stochastic on and off switching of different subpopulations
of the agents. On the other hand, microbubbles, once
injected, are already in an “on” state. Therefore, for locali-
zation-based super-resolution ultrasound approaches to
work, low concentration of the bubbles are required to
ensure the spatial distribution of the bubbles are sparse, and
physiologic flow during imaging is also required to displace
the bubbles so that different localizations can be accumu-
lated over space and time.
While localizing the same contrast agent over time
in the presence of flow offers the opportunity to gener-
ate super-resolved velocity maps of microflow (Errico
et al. 2015; Christensen-Jeffries et al. 2015), a limita-
tion of the approach is that they heavily depend on the
agent concentration and presence of flow and, conse-
quently, may take much longer acquisition time.
Regardless of the imaging frame rate, time has to be
spent in waiting for spatially isolated individual bub-
bles to flow past the microvessels of interest (Dencks et
al. 2017; Christensen-Jeffries 2017; Hingot et al. 2019).
Furthermore, the in vivo microbubble concentration is
difficult to control and it can change quickly over time,
which can cause either too few localizations in small
microvessels or, in larger vessels with high agent con-
centrations, too many incorrect localizations of multi-
ple bubbles that, if not discarded, can contribute to
image noise.
Phase-change droplets, typically made from perfluor-
ocarbons, can change phase from liquid to gas (i.e., be
vaporized into bubbles) by ultrasound (Kripfgans et al.
2000; Shpak et al. 2014). Such phase-change agents have
been studied in the past couple of decades for both thera-
peutic and diagnostic applications (Kripfgans 2000;
Kawabata et al. 2005; Rapoport et al. 2009; Reznik et al.
2011; Sheeran et al. 2012) and recently have been
reported to offer subwavelength ultrasound drug delivery
and super-resolution imaging (Hingot et al. 2016). Most
current research in phase-change agents is focused on
nanometric agents, which allow longer circulation and
tumor deposition through the enhanced permeability and
retention effect, while reducing the size of the resulting
microbubbles.
As an alternative ultrasound imaging contrast agent,
nanodroplets offer three potential advantages over
microbubbles. First, the nanodroplets can be selectively
activated, both spatially and temporally, to provide an
ultrasound contrast signal on demand. Second, the nano-
size of nanodroplets potentially allows extravasation, for
example, into cancerous tissue because of its leaky vas-
culature and enhanced permeability and retention
effects, offering contrast beyond vasculature. Third, it
has been found that nanodroplets can last longer during
in vivo circulation than microbubbles (Sheeran et al.
2012; Sheeran et al. 2015). In the past decade it has been
well reported that the vaporization of such phase-change
nanodroplets into microbubbles can be controlled by
acoustic pressure (Sheeran et al. 2012). This phase tran-
sition also depends on nanodroplet characteristics (e.g.,
size distribution and boiling point of the gas) and exter-
nal factors (e.g., microvessel confinement [Lin et al.
2018] and attachment to cells [Zhang et al. 2019b]).
The capability of phase change nanodroplets to be
switched on and off by ultrasound on demand allows
super-resolution ultrasound imaging to mimic STORM
or PALM in optical super-resolution. The switching-off
mechanism can be either the recondensation of the
resulting microbubble back into a nano-agent or its dis-
appearance through disruption or dissolution. This has
recently been observed by Zhang et al. (2018) through
acoustic wave sparsely activated localization microscopy
(AWSALM) in two proof-of-concept studies (Zhang et
al. 2018, 2019a). One of the fundamental distinctions
between bubble- and droplet-based super-resolution
imaging techniques is that, with bubble-based super-res-
olution approaches, accumulated signals are limited by
low bubble concentration and depend on flow decorrela-
tion, which is slow in the smaller vessels. However, with
the droplets being activated and deactivated at the ultra-
sound pulse repetition frequency, signals can be accumu-
lated as quickly as the imaging pulses are sent, being
able to achieve much faster super-resolution imaging. In
the droplet-based super-resolution ultrasound approach,
much higher concentrations of droplets can be used to
pre-populate the vessels (as droplets are invisible to
ultrasound before activation) and localizations can then
be accumulated quickly by switching them on and off
even with very slow or no flow.
In such approaches there are two key factors: droplet
composition and the transmitted ultrasound wave parame-
ters. The transmitted ultrasound amplitude has to match
the vaporization threshold of the droplets to activate
them, and the threshold depends on the boiling point of
the perflurocarbon gas, their size distribution and whether
the droplets are encapsulated by a shell. In its initial reali-
zation, Zhang et al. (2018) used shelled decafluorobutane
(boiling point: �1.7˚C) nanodroplets and focused waves
with relatively high ultrasound amplitude (mechanical
index [MI] = 1.3) were swept through the imaging area to
switch on new droplets, while switching off previously
activated droplets at the same time, followed by lower-
amplitude (MI = 0.25) imaging plane waves. Such an
approach of separate activating and imaging pulses is nec-
essary in this case as the activation of the decafluorobu-
tane droplets requires acoustic pressure that is difficult for
plane-wave to achieve. Consequently, significant time is

Fig. 3. Fast super-resolution ultrasound imaging achievedby fast acoustic wave sparsely activated localizationmicroscopy (AWSALM). (a) Conventional B-mode image.(b) Single value decomposition (SVD)-filtered image. (c)Super-resolution image by a 200-ms data acquisition. (d)Optical image of the 200-mm cross-tube phantom. (e, f)Resolution measurements at different lateral regions ofinterest indicated by the red lines in the images. Reprinted
with permission from Zhang et al. (2019a).
Super-resolution Ultrasound Imaging � K. CHRISTENSEN-JEFFRIES et al. 879
spent on sweeping the focused activating pulses and this
slows down the imaging.
More recently the same authors have developed a
fast version of the AWSALM (Zhang 2019a, Fig. 3), in
which shelled octafluoropropane (boiling point: �37˚C)
nanodroplets are used, which can be activated by ultra-
sound with a relatively low MI that plane wave transmis-
sion can achieve. The study has demonstrated that
octafluoruopropane nanodroplets can be simultaneously
imaged, activated and deactivated at a very high frame
rate (5000 fps) at an intermediate acoustic amplitude
(MI = 0.76) to perform super-resolution ultrasound imag-
ing. Two tubes, which contain high-concentration drop-
lets without flow and are separated by a distance below
the ultrasound diffraction limit, are well resolved within
200 ms, achieving a two-orders-of-magnitude improve-
ment in temporal resolution when compared with exist-
ing ULM techniques.
Photoacoustic super-resolution has been developed
by taking advantage of the non-linear photoacoustic sig-
nal dependence of certain molecules or nanoparticles on
the laser energy (Danielli et al. 2014; Nedosekin et al.
2014). Instead of using ultrasound, perforocarbon nano-
droplets can also undergo phase change under laser exci-
tation, allowing photoacoustic super-resolution. High-
boiling-point phase-change nanodroplets for super-reso-
lution photoacoustic imaging (Luke et al. 2016) have
been used. A unique feature of this approach is that such
droplets can condense back to droplets after being vapor-
ized into bubbles under relatively high intensity laser
pulses, creating “blinking” signals for ultrasound locali-
zation. An advantage of this approach is that the same
droplets can be used repeatedly. Flowing optically
absorbing particles have also been used for photoacous-
tic super-resolution (Vilov et al. 2017; Dean-Ben and
Razansky 2018). Compared with acoustic activation,
such photoacoustic techniques use lasers, and the pene-
tration depth is restricted to regions that can be illumi-
nated optically (typically up to a few centimeters).
Furthermore, as the pulse repetition frequency of photoa-
coustic lasers is usually low (10 Hz), longer acquisition
times are required.
Furthermore, because of their size, nanodroplets
may be able to leak out of the vasculature, and it is possi-
ble to offer in vivo super-resolution beyond the vascular
space (e.g., to visualize greater details of tumor tissue
structure by using targeted nanodroplets).
SUPER-RESOLUTION ULTRASOUNDWITHOUT
LOCALIZATION
Standard localization-based techniques for ULM
rely on sufficient separability of microbubbles, placing
an upper bound on the allowable concentration. Depend-
ing on the desired image fidelity, this in turn places a
substantial lower bound on the acquisition time, typi-
cally being on the order of minutes (Opacic 2018;
Dencks et al. 2018, 2019; Hingot et al. 2019). By intro-
ducing other trade-offs, super-resolution ultrasound can
be performed faster through different strategies exploit-
ing structured illumination (Ilovitsh et al. 2018) or the
signal structure.
In this section, several non-localization-based tech-
niques are described that push this lower bound down
significantly by permitting higher concentrations without
compromising precision. These methods make effective
use of structural signal priors to overcome the limitations
of localization-based techniques for scenarios with over-
lapping PSFs. Such priors are obtained explicitly through
signal models or implicitly by learning from data. An
overview of these approaches is given in Figure 4.
EXPLOITING SIGNAL STRUCTURE
We first assume that the tissue clutter has been
removed. This can be achieved by using high-pass filter-
ing, singular value decomposition or deep learning meth-
ods (Cohen et al. 2019). The image obtained can then be
written as a convolution between the PSF of the system
and the microbubbles. We can express this relation in
matrix-vector form by vectorizing the low-resolution
image frame into a vector y. As reported in Bar-Zion et
al. (2017, 2018b) the resulting vector follows the mea-
surement model
y ¼ Axþ n ð1Þwhere A is the PSF matrix consisting of shifts of the PSF
which relates the vectorized microbubble distribution on

Fig. 4. Overview of several non-localization methods that leverage priors through signal structure or by learning fromdata. An input contrast-enhanced ultrasound (CEUS) sequence (a) can be modeled to derive estimators that exploit signalstructure (b) or to generate realistic data to train data-driven estimators in the form of deep neural networks (c).
MMV =multiple measurement vector.
880 Ultrasound in Medicine & Biology Volume 46, Number 4, 2020
a high-resolution grid x to the image, and n is a noise
vector. The goal is to recover the high-resolution vector-
ized image x.
In its most basic form, signal structure can be
exploited by realizing that the microbubble distribution
within a frame x is highly sparse on such a high-resolu-
tion grid (van Sloun et al. 2017). This implies that the
vector x contains only a few non-zero values and can
therefore be recovered by relying on the compressed-
sensing literature (Eldar and Kutyniok 2012), which pro-
vides methods for recovering sparse vectors from under-
determined linear systems such as that in eqn (1) using
computationally efficient methods. In particular, one can
formulate a convex minimization problem that balances
a data fidelity term and a structural sparsity-promoting
term, which results in sparse solutions to the problem of
eqn (1) on a high-resolution grid.
To allow for increased overlap between microbub-
bles, one can extend beyond single frames by processing
multiple frames of the form (1), leading to what is known
as a multiple measurement vector model (MMV) (Eldar
and Mishali 2009). Such models permit exploitation of
signal structure not only within a frame but also across
frames, by relying on the prior that the non-zero ele-
ments in each of the frames are located in the same posi-
tions. In line with this, Bar-Zion et al. (2017) proposed
computing high-order statistics of the temporal micro-
bubble signals at each pixel, achieving high-resolution
imaging in a fashion that is similar to super-resolution
optical fluctuation imaging (SOFI) in fluorescence
microscopy (Dertinger et al. 2009). This ultrasound vari-
ant of SOFI makes effective use of the statistical inde-
pendence between the fluctuations of CEUS signals
originating from different vessels. The attainable resolu-
tion gain was found to scale with the order of the statis-
tics. In practice, the authors propose to use second-order
moments, as estimation of high-order moments requires
an exponentially increasing number of image frames to
retain the same SNR level.
Sparsity-based super-resolution ultrasound hemo-
dynamic imaging (SUSHI) extends this SOFI-inspired
solution by also exploiting the sparsity of the underlying
vascular architecture, thereby further improving spatial
resolution (Bar-Zion et al. 2018a). This prior can be
incorporated by solving a minimization problem in the
correlation domain with a sparsity-promoting regulariza-
tion term on the high-resolution correlation image, thus
accounting for both the joint sparsity and the statistical
properties of the image. Other than exploiting the spar-
sity of the vasculature itself, sparse representations may
also be used in a transformed domain, for example,
through a wavelet or total variation transformation.
SUSHI was found to effectively exploit the distinct tem-
poral fluctuations of microbubbles in different vessels
when imaging at a sufficiently high frame rate, that is,
when leveraging ultrafast imaging. In this scenario, spa-
tial resolutions beyond the diffraction limit were attained
at an unprecedented temporal resolution of 25 Hz.
When frame rates are low compared with the vascu-
lar flow velocities, the differences between temporal
fluctuations among vessels and their high-order statistics
exploited in CEUS-SOFI and SUSHI are less significant.
To address this, another method that also resides within
the MMV framework, simultaneous sparsity-based
super-resolution and tracking (triple-SAT), has recently
been proposed (Solomon et al. 2018). Triple-SAT com-
bines frame-by-frame weighted sparse recovery for
detection and simultaneous tracking of the microbubbles,
thereby explicitly exploiting flow as a prior in the detec-
tion process. In doing so it leverages both a structural
spatial sparsity prior and a flow-based before resolve
vascular architectures with super-resolution. Although
the tracking and data association methods used in triple-
SAT share similarities with those presented in

Super-resolution Ultrasound Imaging � K. CHRISTENSEN-JEFFRIES et al. 881
Ackermann and Schmitz, (2016), the method distin-
guishes itself by the incorporation of the aforementioned
tracking-based flow prior in the detection stage, in con-
junction with crude optical-flow-based velocity esti-
mates within a Kalman framework.
From an optimization point of view, the methods
presented above can all be cast in a similar form, as solv-
ing regularized least-squares problems of the form
x ¼ argmaxx
kAx�y k 2 þ λR xð Þf g ð2Þ
where the first term represents a data fidelity term, and R
(x) denotes a regularization term that embeds the struc-
tural priors. The fidelity term may represent the image
directly, as in eqn (1), or may represent the image corre-
lation function, as in SUSHI and SOFI. In those settings,
x effectively represents the variance of the pixels in the
underlying high-resolution image. By taking into
account the structure of A, problem (2) may be solved in
the Fourier domain, leading to computationally efficient
methods (Solomon et al. 2019).
In the case of frame-by-frame sparse recovery,
one may choose RðxÞ ¼ k x k 1, promoting sparse solu-
tions. For triple-SAT, RðxÞ ¼ k diagðwÞ ¢ x k 1, with w
being a flow-prior-based weighting vector, promoting
solutions that are both sparse and close to the tracking
predictions. In SUSHI, RðxÞ ¼ kCx k 1, where Cdenotes a basis transformation that maps to a domain in
which the vascular architecture is sparse (e.g., through
the wavelet transform), and x represents the image vari-
ance. In van Sloun et al. (2017) and Bar-Zion et al.
(2018b), eqn (2) was solved through an efficient Four-
ier-domain implementation of the fast iterative shrink-
age and thresholding algorithm (FISTA).
LEVERAGING DEEP LEARNING
Exploiting structural signal priors in some domain,
either at a single-frame level or in an MMV model, has
provided an effective set of tools that can alleviate the
harsh constraints on allowable microbubble concentra-
tion. However, the potential it carries for reducing the
acquisition time comes at the cost of high reconstruction
time; even highly optimized Fourier-domain implemen-
tations of FISTA rely on a time-consuming iterative
procedure. Appropriate optimization settings and the
optimal regularization (thresholding) parameter λ more-
over depend on the actual sparsity of the data, which in
practice varies within and across acquisitions. Further-
more, exact knowledge of the PSF is needed to form the
measurement matrix.
The aforementioned challenges motivate the
development of a solution that is fast, has fixed com-
plexity and is robust across a wide variety of imaging
conditions. To that end, van Sloun et al. (2018a, 2018b,
2019) propose deep-ULM, a method that leverages
recent advances in deep learning to fulfill these desir-
able properties. Deep-ULM uses a deep fully convolu-
tional encoder�decoder neural network to map low-
resolution input frames to sparse localizations on a
high-resolution grid. It is trained using simulations that
reflect a wide variety of imaging conditions, covering
varying microbubble concentrations, backscatter ampli-
tudes, background clutter and noise and variations in
the PSF. Once trained, inference by Deep-ULM is very
fast, recovering more than a thousand high-resolution
patches of 128£ 128 pixels per second using GPU
acceleration. As such, it is about four orders of magni-
tude faster than the iterative FISTA scheme. Beyond
speedup, Deep-ULM also yields improved performance
(in particular for high concentrations), which may be
attributed to its ability to learn the relation between spe-
cific interference patterns of ultrasound waves reflect-
ing off closely spaced microbubbles and their locations
(van Sloun et al. 2019).
DEVELOPING APPLICATIONS
The previous section discussed mostly technical
aspects of super-resolution techniques. We focused on
ULM as it is currently the most common approach for
ultrasound super-resolution. However, the choice of the
appropriate technique depends mostly on the requested
spatial resolution and temporal resolution. ULM still
achieves the highest spatial resolution, but an acquisition
with sufficient microbubble tracks takes an extended
time. Fluctuation-based approaches or structured illumi-
nation could provide an interesting compromise between
resolution and frame-rate—a middle way between ultra-
fast Doppler and ULM. Acoustic switching of phase-
change contrast agents has shown initial promise to
achieve real-time temporal resolution without any signif-
icant compromise to spatial resolution in the localiza-
tion-based approach but further evaluation in vivo is
required.
We now discuss two main fields of applications that
could benefit strongly from super-resolution ultrasound
imaging: oncology and neurology.
ONCOLOGY
Medical imaging is widely recognized as one of the
most significant advances in the war on cancer. Early
detection of lesions through screening, or diagnosis of
suspicious lesions found by other screening methods,
while tumors are still small and before metastasis, drasti-
cally increases the chances of successful treatment
(World Health Organization 2019) Imaging during treat-
ment provides crucial information regarding efficacy of

Fig. 5. Application of microvascular imaging to assess theangiogenic biomarker of cancer. Maximum intensity projec-tions of 3-D acoustic angiography imaging of microvasculaturefor healthy (control) tissue and tissue surrounding fibrosarcomatumors in a rat model. Dotted circles indicate approximatelocation of solid tumor mass, and field of view is approxi-mately 2.5£ 2 cm. Reprinted with permission from Gessner
et al. (2012).�RSNA.
882 Ultrasound in Medicine & Biology Volume 46, Number 4, 2020
the therapeutic approach. Because of its low cost, wide-
spread accessibility and safety, ultrasound has the poten-
tial to be a preferred modality for cancer imaging
(Kiessling et al. 2014). Yet, traditional gray-scale ultra-
sound falls behind other modalities for certain cancer
imaging applications. Breast imaging is one such appli-
cation. Breast cancer is the most common cancer in
women and second most common cancer overall (World
Cancer Research Fund International, 2018). Mammogra-
phy is the first choice for screening for breast cancer,
with a sensitivity typically reported to be between 70%
and 90% (albeit reported with varying ranges) (Heijblom
et al. 2011). Ultrasound can be combined with mammog-
raphy to improve this sensitivity, although the specificity
of this combination is poor, as low as 40% in women
with dense breast tissue (Heijblom et al. 2011). Mam-
mography is even more challenging in women with
saline or silicone implants, which drastically attenuate
X-rays and substantially limit imaging efficacy. The
result is that many imaging results are indeterminate and
biopsy is recommended for pathologic confirmation.
Unfortunately, the biopsy process is associated with
emotional stress, risk of complications and additional
time and cost (Rey et al. 2005; Montgomery and
McCrone 2010; Montgomery 2010). Improved ultra-
sound imaging methods, which provide improved speci-
ficity and sensitivity with respect to cancer, would
provide clear advantages in screening and diagnosis.
These abnormalities provide an opportunity, how-
ever, for a diagnostic imaging technique that can visual-
ize microvascular features.
Although traditional gray-scale or Doppler ultrasound
techniques are challenged to visualize microvascular fea-
tures on the scale of early tumor angiogenesis, it has been
found that biomarkers of angiogenesis can be detected
with the use of high-resolution contrast ultrasound.
Recently, investigators have visualized cancer-associated
microvascular abnormalities through acoustic angiography,
a high-resolution superharmonic imaging technique (Gess-
ner et al. 2012). Acoustic angiography, which requires
dual-frequency transducers to excite ultrasound contrast
agents near resonance and receive higher-order harmonics,
can provide 3-D maps of microvasculature in shallow tis-
sues with a resolution on the order of 150 mm at 2 cm
(Gessner et al. 2010). Using this microvascular imaging
method, investigators have observed clear indicators of
cancer-associated angiogenesis in both xenograft and
spontaneous tumors (Fig. 5) (Rao et al. 2015; Shelton et
al. 2015), and preliminary data suggest that angiogenesis
as a biomarker can improve the sensitivity and specificity
of ultrasound in cancer substantially over gray-scale imag-
ing. Acoustic angiography is fundamentally limited by the
diffraction limit, however, and hence resolution is ulti-
mately limited by the frequency of the imaging system
with its inherent trade-off in frequency-dependent depth
attenuation, which will prohibit acoustic angiography from
ever being a technique that can resolve small vessels
involved in angiogenesis in most tissues deeper than a
few centimeters.
Super-resolution imaging using ultrasound localiza-
tion microscopy, however, is not bound to diffraction-lim-
ited resolution, making this technique a potentially
powerful tool to identify malignancies via their angiogenic
fingerprint, even in deep tissues. Lin et al. (2017a) applied
super-resolution imaging to visualize 3-D microvascular
patterns in fibrosarcoma tumors in rats and compared
microvascular features with control healthy tissue (Fig. 6).
Similar to prior data acquired with acoustic angiography,
super-resolution imaging revealed that tumors exhibited
characteristic signatures of angiogenesis such as a high
degree of tortuosity. Although these early studies were
performed in rodents at shallow depths, data were encour-
aging that this technique would readily translate to deeper
tissues in humans as well. The primary challenge with
microvascular imaging analysis is that it requires 3-D vol-
ume imaging to be most effective, and motion correction
can easily corrupt the accurate mapping of microvessels
on the order of tens of microns.
The lymphatic system, including lymph nodes and
lymphatic vessels, plays a crucial role in oncology. In
patients with cancer, tumor cells often traffic through
lymphatic channels to regional lymph nodes and beyond
to distant sites. Accurate identification and quantification
of metastatic lymph nodes remain essential for prognosis
and treatment planning in cancer patients (Grills et al.
2003). Recently, super-resolution of the micro-vascula-
ture of rabbit popliteal lymph nodes has been performed
(Zhu et al. 2019) (Fig. 7). Some technical aspects of
imaging the slow lymph flow in lymphatic vessels to
track the sentinel lymph nodes were also studied.
Fig. 6. Maximum intensity projections of 3-D super-resolution imaging of healthy microvasculature (a, b) and tumor-associated microvasculature (c, d). The smallest vessels resolved were approximately 25 mm in diameter, an approxi-mately sixfold improvement in what is achievable with acoustic angiography at a similar depth. Reprinted with permis-
sion from Lin et al. (2017a).
Super-resolution Ultrasound Imaging � K. CHRISTENSEN-JEFFRIES et al. 883
A particular challenge for super-resolved imaging
of the tumor vasculature is the complexity of the vessel
morphology with a less organized and sometimes imma-
ture vessel tree. Adding to this is the higher slice thick-
ness in clinical imaging, which projects more
intersecting tracks into a single image, and the lower
Fig. 7. Two-dimensional projection of popliteal lymph nodethrough 17 super-resolution image slices covering 1.7-mmthickness. Left: Depth color-coded super-resolution maximumintensity projection (MIP) images, where the hue encodes theimage slice with the maximum intensity and saturation repre-sents the number of microbubbles localized at that depth.Right: Velocity color-coded MIP, where color representsvelocity and direction. The top and bottom images wereobtained from two different lymph nodes. Adapted, with per-
mission, from Zhu et al. (2019).
frame rates, which make the association to tracks more
ambiguous. To resolve this, tracking algorithms incorpo-
rating linear motion models based on Kalman filters
have been proposed (Ackermann and Schmitz, 2016).
These methods were applied to pre-clinical tumor xeno-
grafts for successful differentiation of tumor types in a
radiomics analysis based on quantitative parameters of
vessel morphology (Opacic et al. 2018). Additionally,
the clinical feasibility of the method was illustrated for
chemotherapy monitoring of breast cancer (Opacic et al.
2018; Dencks et al. 2018, 2019). An example of micro-
bubble tracking analysis of a contrast-enhanced ultra-
sound scan of a patient with breast cancer is illustrated
in Figure 8. Here, the vascular architecture, displayed in
detail, consists of a highly vascularized rim from which
vascular assemblies spoke-like proceed toward the tumor
center. These are connected to vascular hotspots that
exhibit high blood velocities and distribute the blood to
the overall tumor tissue.
There still remain several challenges before micro-
bubble tracking analysis is used in clinical routine. The
different human organs have distinct functional and ana-
tomic vascular properties that need to be considered to
avoid an overload with microbubbles that makes it
impossible to assign individual tracks. Furthermore, the
resolution in clinical ultrasound scanners is usually
lower than in systems used for small animal imaging, as
lower frequencies need to be applied to sufficiently pene-
trate the tissue. Because of the larger voxel sizes and par-
ticularly the thicker image slices, it is more difficult to
calculate the correct position of the microbubbles, and
voxels may even contain several microbubbles at the
same time; both make it more difficult to determine cor-
rect microbubble tracks. Thus, CEUS protocols and

Fig. 8. (a) B-Mode image of a breast cancer patient revealing ahypo-intense, irregular lesion with unsharp margins. (b) Themaximum intensity projection image after microbubble injec-tion confirms the lesion is highly vascularized, but details inthe vascular architecture can hardly be captured. (c�e) Pro-found information on vascularization is available from themicrobubble tracking analysis illustrating microbubble tracks,the directions of blood flow (d) and velocities of individual ves-
sels (e). MB =microbubble.
884 Ultrasound in Medicine & Biology Volume 46, Number 4, 2020
microbubble do need to be carefully adapted, and con-
sideration of pre-knowledge of the vascular anatomy or
the application of deep learning algorithms may help to
correctly assign tracks. Another challenge for clinical
translation is organ motion. This is less critical for super-
ficial lesions in the skin or the muscle as well as for the
brain but becomes highly relevant for abdominal organs
such as liver, kidney, spleen and pancreas. Motion cor-
rection in the image plane has been implemented (Hingot
et al. 2017; Harput et al. 2018; Dencks et al. 2018, 2019)
and needs to be further refined in future studies. How-
ever, motion that occurs orthogonal to the image plane
remains a challenge. In this context, advancing CEUS
imaging from 2-D to true 3-D using matrix transducers,
which has been done in vitro (Harput et al. 2019a; Heiles
et al. 2019), may not only allow display of the vascular
network in much greater comprehensiveness and detail,
but also holds promise for a precise motion correction in
all directions (Harput et al. 2019b).
In conclusion, clinical application of microbubble
tracking analyses is feasible in cancer and provides
encouraging preliminary data. Some vendors of ultra-
sound devices also consider implementing such analysis
methods in their scanners’ software. In addition, in
agreement with research on other non-invasive imaging
modalities, there is high interest in the extraction of mul-
tiple quantitative image features and their radiomic anal-
ysis to receive a disease-specific signature. Recently, it
was reported that the radiomic analyses of CEUS data
reliably allows differentiation of tumor types in mice
(Theek et al. 2018). In this context, approaches to micro-
bubble localization and tracking have several advantages
over the established methods based on intensity�time
curves: (i) the imaging protocols are considerably more
simple and robust; (ii) there is no need to apply complex
pharmacokinetic models based on assumptions that may
not be fulfilled (e.g., stable blood concentration of
microbubbles or one sole feeding vessel); and (iii) signif-
icantly more functional parameters can be extracted than
by other CEUS analysis methods because individual
tracks and vessels are studied. However, there is still sig-
nificant room for further research on hardware, algo-
rithms, software and scan protocols to render the
methods robust and reliable enough to improve diagnos-
tic precision in clinical routine imaging of cancer.
Neurology
The ability to resolve small vessels deep in the brain
has implications in neurology for both diagnostics and
therapeutics. Small vessel pathology is increasingly rec-
ognized as a contributor in disorders such as stroke and
Alzheimer disease (Pantoni 2010; Gorelick et al. 2011;
Wardlaw et al. 2013), while tumors are characterized by
irregular, tortuous vasculature. Anatomic and functional
imaging on a capillary level scale could provide power-
ful new insight into the workings of the healthy and path-
ologic brain.
The skull bone stands as the major hurdle to high-
resolution ultrasound brain imaging. Bone is highly
attenuating and aberrating to sound, particularly at
higher frequencies (Fry and Barger 1978; Pichardo et al.
2011). Thus, ultrasound imaging and therapy must either
be conducted at lower frequencies that better penetrate
bone or be performed through acoustic windows, such as
the temporal and suboccipital windows (Lindsey et al.
2011, 2014). O’Reilly and Hynynen (2013) used a hemi-
spherical array designed for transcranial ultrasound ther-
apy to image single bubbles in a tube phantom through
an ex vivo human skull cap, using the emissions to non-
invasively correct image aberration and fitting the
expected PSF to generate a super-resolution image
(Fig. 9a). This proof-of-concept study illustrated the
ability to image through the intact skull bone and the
potential to image a large volume of the brain with a spa-
tial resolution <50 um. However, the current approach
suffers from long acquisition times because of the low
bubble concentration used and the fact that the focal vol-
ume required steering to generate the larger image.
Employing larger and/or multiple excitation volumes, as
well as simultaneously localizing multiple bubbles
through fitting or deconvolution (Foroozan et al. 2018)
could reduce total acquisition time.

Fig. 9. Left: Micro-computed chromatography (micro-CT)image of a spiral tube phantom with a nominal internal diame-ter of 255 mm. Middle: Super-resolution ultrasound image ofthe phantom through a human skull cap using a hemisphericalarray (transmit: 306 kHz, receive: 612 kHz); Right: Mergedimage revealing agreement between ultrasound and micro-CT.Reprinted with permission from O’Reilly and Hynynen (2013).
Fig. 10. Super-resolution image (15 MHz) of rat brain vascula-ture through thinned skull bone using an ultrafast scanner at500 frames/s. An acquisition time of 150 s was required tolocalize and track approximatively one million separable sour-ces per hemisphere. Reprinted with permission from Errico
et al. (2015).
Super-resolution Ultrasound Imaging � K. CHRISTENSEN-JEFFRIES et al. 885
In contrast, in their landmark publication, Errico
et al. (2015) produced stunning in vivo images of rat
brain vasculature at 15 MHz (Fig. 10), both through cra-
niotomy windows and through thinned skull bone.
Although not performed at a frequency amenable to pen-
etrating the human skull bone, this approach could be
applied in its current form to image the human brain
intra-operatively or in premature infants, where the ante-
rior and posterior fontanelles are still open. This study
leveraged ultrafast plane wave imaging and the move-
ment of bubbles between frames to obtain isolated bub-
bles without having to use very dilute concentrations.
Errico et al. (2015) also noted that in theory a reduction
of their imaging frequency to 2.5 MHz could still yield
6-mm isotropic resolution. At this frequency, imaging
though the thin temporal bone of the human skull could
be possible. In fact, multiple matrix arrays imaging
simultaneously through the two temporal bones have
been used by Lindsey et al. (2011, 2014) to produce 3-D
images of the circle of Willis in human volunteers at nor-
mal resolution. Additionally, Soulioti et al. (2020)
recently performed transcranial super-resolution imaging
of a tube phantom through human temporal bone with a
2.5-MHz diagnostic transducer, achieving an accuracy to
that of O’Reilly and Hynynen (2013) and further sup-
porting the feasibility of this approach. The implementa-
tion of super-resolution methods on such a system could
create a powerful tool for imaging stroke.
A perhaps non-intuitive challenge to be faced in
brain imaging, beyond distortion and signal loss
caused by the skull bone, is organ motion. Human
brain motion, as a result of the cardiac cycle, has
been measured to be as high as 0.5 mm, and varies
by structure (Enzmann and Pelc 1992). Breathing
motion may cause additional lower-frequency shifts
in the echo locations. Such displacements are signifi-
cant relative the structures that super-resolution ultra-
sound aims to resolve. Motion correction algorithms
(Hingot et al. 2017) will thus be necessary to image
smaller vessels in the brain.
Beyond diagnostic imaging, the development of
super-resolution ultrasound methods has great potential
for guiding and monitoring interventions in the brain,
such as ultrasound-mediated opening of the blood�brain
barrier (Hynynen et al. 2001; McDannold et al. 2006;
Carpentier et al. 2016; Lipsman et al. 2018; Mainprize et
al. 2019) and sonothrombolysis (Culp et al. 2011; Pajek
et al. 2014). Super-resolution imaging thus has immense
potential to drastically improve our understanding of the
brain and our ability to treat it.

Fig. 11. Volumetric ultrasound localization microscopy imple-mented on an anesthetized rat brain using a 2-D matrix arraywith center frequency of 9 MHz (Heiles et al. 2019). Thevoxel size is 10 mm; the region of imaging is 13.28 mmdeep, 10.5 mm wide and 11.4 mm long. The “glow” colormap was used to encode microbubble density. The brighterthe color of the voxel, the larger is the amount of micro-
bubbles have passed through that voxel.
886 Ultrasound in Medicine & Biology Volume 46, Number 4, 2020
OUTSTANDING CHALLENGES AND
PERSPECTIVES
As we have seen, super-resolution ultrasound imag-
ing can explore animal and human vasculature in vivo and
in depth at a scale unattainable until recently. Both onco-
logical and neurologic applications have been discussed
here, leaving many promising applications untouched,
such as kidney imaging, which has been explored by sev-
eral authors (Foiret et al. 2017; Song et al. 2017), and
lower-limb imaging, which opens the field of microvascu-
lar imaging to diabetic patients (Harput et al. 2018).
Despite its numerous advantages, super-resolution
ultrasound imaging is still limited by several aspects:
acquisition time, signal-to-noise ratio, dependence on
exogeneous contrast agents, motion, data overdose, lack
of a gold standard, partial reconstruction, exploitation of
ultrafast scanners uncommon in the clinic, restriction to
the vascular network, lack of 3-D reconstruction, and so
forth.
An important challenge to tackle in the field of
super-resolution ultrasound imaging is determination of
its accuracy. In depth and in vivo, no other imaging
modality can provide a similar resolution for vascular
imaging. Hence, it is difficult to determine if the
observed vessels are appropriately reconstructed, espe-
cially with respect to their diameter and velocimetry.
One approach is to observe the same plane of a shallow
microvascular network with ULM and optical means
with an orthogonal setup (Christensen-Jeffries et al.
2015). For this purpose, further studies are needed,
potentially with the help of confocal microscopy, multi-
photon microscopy or optical coherence tomography to
assess the accuracy of ULM at least within the first milli-
meter. For deep organs, ex vivo 3-D tissue clearing
(Renier et al. 2014) could provide further confirmation.
Long imaging times can be partly alleviated
through deep learning, but further development is
required in ULM to separate closer microbubbles so that
injected concentrations can be increased. More localiza-
tion per frame would mean faster and more resolved
images. This is especially true when conventional scan-
ners are used in the clinic. Rapid switching of phase-
change contrast agents could also potentially address
this challenge.
Vast improvement in signal-to-noise and contrast-
to-tissue ratios has been achieved in the last 30 y for per-
fusion imaging with contrast agents. Specific sequences
have been developed, but new ones are probably
required specifically to extract individual microbubbles.
Any gain in SNR and CTR improves drastically the pre-
cision of localization and makes microbubbles more dis-
tinguishable from background.
One of the key advances will probably come from
3-D super-resolution ultrasound. The lack of information
in the elevation direction is particularly limiting in ultra-
sound localization microscopy, making velocimetry
inaccurate and motion correction incomplete and provid-
ing only a single plane per acquisition. Fortunately, new
results (Heiles et al. 2019) on 3-D reconstruction capa-
bilities are encouraging (Fig. 11). However, matrix trans-
ducers with numerous parallel acquisition channels are
still challenging to fabricate and such technology
remains a bottleneck for 3-D ULM, especially at higher
frequencies.
Should the field restrict itself to microbubbles? We
have seen that nanodroplets or photoacoustic sources
could be exploited as localization targets. However,
other targets such as cells expressing gas vesicles could
be conceived (Bourdeau et al. 2018; Farhadi et al. 2019),
allowing the localization of single cells in the body and
possibly opening the field of imaging metastatic cells in
depth.

Super-resolution Ultrasound Imaging � K. CHRISTENSEN-JEFFRIES et al. 887
Should the vasculature remain the only playing field
for super-resolution ultrasound imaging? The lymphatic
system is already being explored (Zhu et al. 2019). But
the extravascular space could be the next frontier using
the natural permeability of tumor vasculature to nano-
agents, which could become localization targets after
acoustic droplet localization.
Finally, the largest challenge remaining is probably
definition of the optimal application of super-resolution
ultrasound imaging, the application that would become
irreplaceable by other imaging modalities. We will only
rest—briefly—when the prognoses of patients have
vastly benefited from the use of super-resolution ultra-
sound imaging.
CONCLUSIONS
In the last 10 y, super-resolution ultrasound has dis-
rupted the diffraction limit of ultrasound imaging
through techniques such as ultrasound localization
microscopy. By observing directly the microvasculature
in the brain, kidney, skin, lymph nodes and tumors in
animals and, in some cases, humans, it has provided a
new window through which to study the physiology and
pathology of tissue. In-depth microscopy is now achiev-
able with a clinical modality, which can provide a wealth
of new information, such as the density and tortuosity of
microvessels or even minute modifications in flow pat-
terns. The authors referred to in this review have partici-
pated in the early development of super-resolution
ultrasound imaging. Its scope has now widened and
international endeavors will define the various clinical
applications of the technique, targeting the major killers,
which affect the smallest blood vessels of the body, such
as cancer, diabetes (Ghosh et al. 2019) artheriosclerosis.
In the future, we foresee new volumetric ultrasound
scanners, which could map the 3-D microvasculature of
an entire organ, allowing precise diagnosis with reduced
user dependency.
Acknowledgments—This project has received funding from the Euro-pean Research Council under European Union HorizonH2020 Programme/ERC Consolidator Grant Agreement No. 772786-ResolveStroke (PI: Olivier Couture). The works of Fabian Kiesslingand Georg Schmitz were supported by German Research Foundation/Deutsche Forschungsgemeinschaft (DFG) Grants KI 1072/5-1, KI1072/11-1, SCHM1171/3-1 and SCHM 1171/4-1. Kullervo Hynynenand Meaghan O’Reilly both received support through the CanadaResearch Chair program. Meng-Xing Tang acknowledges the fundingfrom Engineering and Physical Sciences Research Council EP/N015487/1, Cancer Research UK MDA C53470/A22353 and ImperialCollege Confidence-in-Concepts.
Human studies cited in this article were approved by an institu-tional review board (IRB) except for historical studies. IRBs wereintroduced after the first revision (1975) of the Declaration of Helsinki.Likewise, if animals were studied, there was institutional animal carecommittee approval.
Declaration of Competing Interest—OC and MT declare being co-inventors on a super-resolution patent (PCT FR2011/052810). MT is a
co-founder and shareholder of Iconeus company for ultrasound neuro-imaging. PAD declares co-inventorship on patents and applications forsuper-resolution techniques, dual-frequency imaging (US9,532,769),and phase change nanodroplets (US9,427,410) and is a co-founder ofSonoVol, Inc., and Triangle Biotechnology, Inc., which have licensedsome of these patents. KH and MAO declare being co-inventors on asuper-resolution patent (PCT/US2014/036567).
REFERENCES
Ackermann D, Schmitz G. Detection and tracking of multiple micro-bubbles in ultrasound B-mode images. IEEE Trans Ultrason Fer-roelectr Freq Control 2016;63:72–82.
Alberti GS, Ammari H, Romero F, Wintz T. Dynamic spike super-res-olution and applications to ultrafast ultrasound imaging. arXiv pre-print arXiv:180303251. 2018.
Bar-Zion A, Tremblay-Darveau C, Solomon O, Adam D, Eldar YC. Fastvascular ultrasound imaging with enhanced spatial resolution andbackground rejection. IEEE Trans Med Imaging 2017;36:169–180.
Bar-Zion A, Solomon O, Tremblay-Darveau C, Adam D, Eldar YC.SUSHI: Sparsity-based super-resolution ultrasound hemodynamicimaging. IEEE Trans Ultrason Ferroelectr Freq Control2018;65:2365–2380.
Bar-Zion A, Tremblay-Darveau C, Eldar YC, Solomon O, Adam D.Super-resolution ultrasound imaging of vascular structures withhigh temporal resolution. Sci Rep 2018;8 Article 13918.
Basude R, Wheatley MA. Generation of ultraharmonics in surfactantbased ultrasound contrast agents: Use and advantages. Ultrasonics2001;39:437–444.
Bercoff J, Montaldo G, Loupas T, Savery D, M�ezi�ere F, Fink M, TanterM. Ultrafast compound Doppler imaging: Providing full blood flowcharacterization. IEEE Trans Ultrason Ferroelectr, and Freq Con-trol 2011;58:134–147.
Betzig E, Patterson GH, Sougrat R, Lindwasser OW, Olenych S, Boni-facino JS, Davidson MW, Lippincott-Schwartz J, Hess HF. Imag-ing intracellular fluorescent proteins at nanometer resolution.Science 2006;313:1642–1645.
Blomgren P, Papanicolaou G, Zhao H. Super-resolution in time-rever-sal acoustics. J Acoust Soc Am 2002;111:230–248.
Blomley MJ, Cooke JC, Unger EC, Monaghan MJ, Cosgrove DO.Microbubble contrast agents: a new era in ultrasound. BMJ2001;322:1222–1225.
Bourdeau RW, Lee-Gosselin A, Lakshmanan A, Farhadi A, Kumar SR,Nety SP, Shapiro MG. Acoustic reporter genes for noninvasive imag-ing of microorganisms in mammalian hosts. Nature 2018;553:86.
Brown J, Christensen-Jeffries K, Harput S, Zhang G, Zhu J, Dunsby C,Tang MX, Eckersley RJ. Investigation of microbubble detectionmethods for super-resolution imaging of microvasculature. IEEETrans Ultrason Ferroelectr Freq Control 2019;66:676–691.
Burns PN, Powers JE, Simpson DH, Brezina A, Kolin A, Chin CT,Uhlendorf V, Fritzsch T. Harmonic power mode Doppler usingmicrobubble contrast agents: An improved method for small vesselflow imaging. Proc IEEE Int Ultrason Symp 1994;1547–1550.
Burns PN, Wilson SR. Microbubble contrast for radiological imaging:1. Principles. Ultrasound Q 2006;22:5–13.
Carpentier A, Canney M, Vignot A, Reina V, Beccaria K, HorodyckidC, Karachi C, Leclercq D, Lafon C, Chapelon JY. Clinical trial ofblood�brain barrier disruption by pulsed ultrasound. Sci TranslMed 2016;8:343. re2�343.
Chomas JE, Dayton P, Allen J, Morgan K, Ferrara KW. Mechanisms ofcontrast agent destruction. IEEE Trans Ultrason Ferroelectr FreqControl 2001;48:232–248.
Christensen-Jeffries KM. Super-resolution ultrasound imaging withmicrobubbles. PhD thesis. : King’s College London; 2017.
Christensen-Jeffries K, Browning RJ, Tang MX, Dunsby C, EckersleyRJ. In vivo acoustic super-resolution and super-resolved velocitymapping using microbubbles. IEEE Trans Med Imaging2015;34:433–440.
Christensen-Jeffries K, Brown J, Aljabar P, Tang M, Dunsby C, Eck-ersley RJ. 3-D in vitro acoustic super-resolution and super-resolved

888 Ultrasound in Medicine & Biology Volume 46, Number 4, 2020
velocity mapping using microbubbles. IEEE Trans Ultrason Fer-roelectr Freq Control 2017;64:1478–1486.
Christensen-Jeffries K, Harput S, Brown J, Wells PNT, Aljabar P,Dunsby C, Tang M-X, Eckersley RJ. Microbubble axial localiza-tion errors in super-resolution ultrasound imaging. IEEE TransUltrason Ferroelectr Freq Control 2017;64:1644–1654.
Christensen-Jeffries K, Harput S, Brown J, Zhang G, Zhu J, Tang MX,Dunsby C, Eckersley R. 3D in vitro super-resolution ultrasound imag-ing using a clinical system. Proc IEEE Int Ultrason Symp 2018;1–4.
Christensen-Jeffries K, Brown J, Harput S, Zhang G, Zhu J, Tang MX,..., Eckersley RJ. Poisson Statistical Model of Ultrasound Super-Resolution Imaging Acquisition Time. IEEE transactions on ultra-sonics, ferroelectrics, and frequency control 2019;66:1246–1254.
Clement GT, Huttunen J, Hynynen K. Superresolution ultrasoundimaging using back-projected reconstruction. J Acoust Soc Am2005;118:3953–3960.
Cobbold Richard SC. Foundations of biomedical ultrasound. Oxforduniversity press; 2006.
Cohen R, Zhang Y, Solomon O, Toberman D, Taieb L, van Sloun RJG,Eldar YC. Deep convolutional robust PCA with application toultrasound imaging. In: Proceedings, IEEE International Confer-ence on Acoustics, Speech and Signal Processing (ICASSP). IEEE;2019. p. 3212–3216.
Cosgrove D, Lassau N. Imaging of perfusion using ultrasound. Eur JNucl Med Mol Imaging 2010;37:65–85.
Couture O, Bannouf S, Montaldo G, Aubry JF, Fink M, Tanter M.Ultrafast imaging of ultrasound contrast agents. Ultrasound MedBiol 2009;35:1908–1916.
Couture O, Tanter M, Fink M. Method and device for ultrasound imag-ing. Patent Cooperation Treaty (PCT)/FR2011/052810. 2010.
Couture O, Besson B, Montaldo G, Fink M, Tanter M. Microbubbleultrasound super-localization imaging (MUSLI). Proc IEEE IntUltrason Symp 2011;1285–1287.
Couture O, Fink M, Tanter M. Ultrasound contrast plane wave imaging.IEEE Trans Ultrason Ferroelectr Freq Control 2012;59 6373790.
Couture O, Hingot V, Heiles B, Muleki-Seya P, Tanter M. Ultrasoundlocalization microscopy and super-resolution: A state of the art.IEEE Trans Ultrason Ferroelectr Freq Control 2018;65:1304–1320.
Culp WC, Flores R, Brown AT, Lowery JD, Roberson PK, HenningsLJ, Woods SD, Hatton JH, Culp BC, Skinner RD. Successfulmicrobubble sonothrombolysis without tissue-type plasminogenactivator in a rabbit model of acute ischemic stroke. Stroke2011;42:2280–2285.
Danielli A, Maslov KI, Garcia-Uribe A, Winkler AM, Li C, Wang L,..., Wang LV. Label-free photoacoustic nanoscopy. J Biomed Opt2014;19:086006.
Dean-Ben XL, Razansky D. Localization optoacoustic tomography.Light Sci Appl 2018;7:18004.
Deffieux T, Demene C, Pernot M, Tanter M. Functional ultrasoundneuroimaging: A review of the preclinical and clinical state of theart. Curr Opin Neurobiol 2018;50:128–135.
Demen�e C, Tiran E, Sieu LA, Bergel A, Gennisson JL, Pernot M, Def-fieux T, Cohen I, Tanter M. 4D microvascular imaging based onultrafast Doppler tomography. Neuroimage 2016;127:472–483.
Dencks S, Piepenbrock M, Schmitz G, Opacic T, Kiessling F. Determi-nation of adequate measurement times for super-resolution charac-terization of tumor vascularization. 2017 Proc IEEE Int UltrasonSymp 2017;1–4.
Dencks S, Piepenbrock M, Opacic T, Krauspe B, Stickeler E, KiesslingF, Schmitz G. Clinical pilot application of super-resolution USimaging in breast cancer. IEEE Trans Ultrason Ferroelectr FreqControl 2018;66:517–526.
Dencks S, Piepenbrock M, Opacic T, Krauspe B, Stickeler E, KiesslingF, Schmitz G. Clinical pilot application of super-resolution USimaging in breast cancer. IEEE Trans Ultrason Ferroelectr FreqControl 2019;66:517–526.
Dertinger T, Colyer R, Iyer G, Weiss S, Enderlein J. Fast, background-free, 3D super-resolution optical fluctuation imaging (SOFI). ProcNatl Acad Sci USA 2009;106:22287–22292.
Desailly Y, Couture O, Fink M, Tanter M. Sono-activated ultrasoundlocalization microscopy. Appl Phys Lett 2013;103 174107.
Desailly Y, Pierre J, Couture O, Tanter M. Resolution limits of ultrafastultrasound localization microscopy. Phys Med Biol 2015;60:8723–8740.
Desailly Y, Tissier AM, Correas JM, Wintzenrieth F, Tanter M, Cou-ture O. Contrast enhanced ultrasound by real-time spatiotemporalfiltering of ultrafast images. Phys Med Biol 2017;62:31–42.
Diamantis K, Anderson T, Butler M B, Villag�omez-Hoyos CA, Jensen JA,Sboros V. Resolving ultrasound contrast microbubbles using minimumvariance beamforming. IEEE Trans Med Imaging 2018;38:194–204.
Dollet B, Van Der Meer SM, Garbin V, De Jong N, Lohse D, VersluisM. Nonspherical oscillations of ultrasound contrast agent micro-bubbles. Ultrasound Med Biol 2008;34:1465–1473.
Eckersley RJ, Chin CT, Burns PN. Optimising phase and ampli-tude modulation schemes for imaging microbubble contrastagents at low acoustic power. Ultrasound Med Biol2005;31:213–219.
Eldar YC, Kutyniok G. Compressed sensing: Theory and applications.New York/London: Cambridge University Press; 2012.
Eldar YC, Mishali M. Robust recovery of signals from a structuredunion of subspaces. IEEE Trans Inf Theory 2009;55:5302–5316.
Enzmann DR, Pelc NJ. Brain motion: Measurement with phase-con-trast MR imaging. Radiology 1992;185:653–660.
Errico C, Pierre J, Pezet S, Desailly Y, Lenkei Z, Couture O, Tanter M.Ultrafast ultrasound localization microscopy for deep super-resolu-tion vascular imaging. Nature 2015;527:499.
Erturk A, Becker K, J€ahrling N, Mauch CP, Hojer CD, Egen JG, HellalF, Bradke F, Sheng M, Dodt HU. Three-dimensional imaging ofsolvent-cleared organs using 3 DISCO. Nat Protoc 2012;7:1983.
Esp�ındola D, Lin F, Soulioti DE, Dayton PA, Pinton GF. Adaptivemultifocus beamforming for contrast-enhanced-super-resolutionultrasound imaging in deep tissue. IEEE Trans Ultrason FerroelectrFreq Control 2018;65:2255–2263.
Farhadi A, Ho GH, Sawyer DP, Bourdeau RW, Shapiro MG. Ultra-sound imaging of gene expression in mammalian cells. Science2019;365:1469–1475.
Ferrara KW, Merritt CR, Burns PN, Foster FS, Mattrey RF, WicklineSA. Evaluation of tumor angiogenesis with US: Imaging, Doppler,and contrast agents. Acad Radiol 2000;7:824–839.
Ferrara K, Pollard R, Borden M. Ultrasound microbubble contrastagents: Fundamentals and application to gene and drug delivery.Annu Rev Biomed Eng 2007;9:415–447.
Fink M, Tanter M. Multiwave imaging and super resolution. PhysToday 2010;63:28–33.
Foiret J, Zhang H, Ilovitsh T, Mahakian L, Tam S, Ferrara KW. Ultra-sound localization microscopy to image and assess microvascula-ture in a rat kidney. Sci Rep 2017;7:13662.
Folkman J. Angiogenesis. Annu Rev Med 2006;57:1–18.Foroozan F, O’Reilly MA, Hynynen K. Microbubble localization for
three-dimensional superresolution ultrasound imaging using curvefitting and deconvolution methods. IEEE Trans Biomed Eng2018;65:2692–2703.
Forsberg F, Shi WT, Goldberg BB. Subharmonic imaging of contrastagents. Ultrasonics 2000;38:93–98.
Frinking PJ, Bouakaz A, Kirkhorn J, Ten Cate FJ, De Jong N. Ultra-sound contrast imaging: Current and new potential methods. Ultra-sound Med Biol 2000;26:965–975.
Fry FJ, Barger JE. Acoustical properties of the human skull. J AcoustSoc Am 1978;63:1576–1590.
Gessner R, Lukacs M, Lee M, Cherin E, Foster FS, Dayton PA. High-resolution, high-contrast ultrasound imaging using a prototypedual-frequency transducer: In vitro and in vivo studies. IEEE TransUltrason Ferroelectr Freq Control 2010;57:1772–1781.
Gessner RC, Aylward SR, Dayton PA. Mapping microvasculature withacoustic angiography yields quantifiable differences betweenhealthy and tumor-bearing tissue volumes in a rodent model. Radi-ology 2012;264:733–740.
Ghosh D, Xiong F, Sirsi SR, Shaul PW, Mattrey RF, Hoyt K. Toward opti-mization of in vivo super-resolution ultrasound imaging using size-selected microbubble contrast agents. Med Phys 2017;44:6304–6313.
Ghosh D, Peng J, Brown K, Sirsi S, Mineo C, Shaul PW, Hoyt K.Super�resolution ultrasound imaging of skeletal muscle

Super-resolution Ultrasound Imaging � K. CHRISTENSEN-JEFFRIES et al. 889
microvascular dysfunction in an animal model of type 2 diabetes. JUltrasound Med 2019;38:2589–2599.
Gorelick PB, Scuteri A, Black SE, DeCarli C, Greenberg SM, IadecolaC, Launer LJ, Laurent S, Lopez OL, Nyenhuis D, Petersen RC,Schneider JA, Tzourio C, Arnett DK, Bennett DA, Chui HC, Higa-shida RT, Lindquist R, Nilsson PM, Roman GC, Sellke FW, Sesha-dri S. Vascular contributions to cognitive impairment anddementia. Stroke 2011;42:2672–2713.
Gramiak R, Shah PM. Echocardiography of the aortic root. InvestRadiol 1968;3:356–366.
Greis C. Ultrasound contrast agents as markers of vascularity andmicrocirculation. Clin Hemorheol Microcirc 2009;43:1–9.
Grills IS, Kestin LL, Goldstein N, Mitchell C, Martinez A, Ingold J,Vicini FA. Risk factors for regional nodal failure after breast-con-serving therapy: Regional nodal irradiation reduces rate of axillaryfailure in patients with four or more positive lymph nodes. Int JRadiat Oncol Biol Phys 2003;56:658–670.
Harput S, Christensen-Jeffries K, Brown J, Li Y, Williams KJ,Davies AH, Eckersley RJ, Dunsby C, Tang MX. Two-stagemotion correction for super-resolution ultrasound imaging inhuman lower limb. IEEE Trans Ultrason Ferroelectr Freq Control2018;65:803–814.
Harput S, Christensen-Jeffries K, Brown J, Zhu J, Zhang G, EckersleyRJ, Dunsby C, Tang MX. 3-D motion correction for volumetricsuper-resolution ultrasound (SR-US) imaging. arXiv preprintarXiv:190201928. 2019a.
Harput S, Christensen-Jeffries K, Ramalli A, Brown J, Zhu J, Zhang G,Leow CH, Toulemonde M, Boni E, Tortoli P. 3-D super-resolutionultrasound (SR-US) imaging with a 2-D sparse array. arXiv pre-print arXiv:190201608. 2019b.
Heijblom M, Klaase JM, Van Den Engh FM, van Leeuwen TG, Steen-bergen W, Manohar S. Imaging tumor vascularization for detectionand diagnosis of breast cancer. Technol Cancer Res Treat2011;10:607–623.
Heiles B, Correia M, Hingot V, Pernot M, Provost J, Tanter M, CoutureO. Ultrafast 3D ultrasound localization microscopy using a 32£32matrix array. IEEE Trans Med Imaging 2019;38:2005–2015.
Hess ST, Girirajan TP, Mason MD. Ultra-high resolution imaging byfluorescence photoactivation localization microscopy. Biophys J2006;91:4258–4272.
Hingot V, B�ezagu M, Errico C, Desailly Y, Bocheux R, Tanter M,Couture O. Subwavelength far-field ultrasound drug-delivery. ApplPhys Lett 2016;109:194102.
Hingot V, Errico C, Tanter M, Couture O. Subwavelength motion-cor-rection for ultrafast ultrasound localization microscopy. Ultrasonics2017;77:17–21.
Hingot V, Errico C, Heiles B, Rahal L, Tanter M, Couture O. Micro-vascular flow dictates the compromise between spatial resolutionand acquisition time in ultrasound localization microscopy. SciRep 2019;9:2456.
Hynynen K, McDannold N, Vykhodtseva N, Jolesz FA. NoninvasiveMR imaging�guided focal opening of the blood-brain barrier inrabbits. Radiology 2001;220:640–646.
Iadecola C. Neurovascular regulation in the normal brain and inAlzheimer’s disease. Nat Rev Neurosci 2004;5:347–360.
Iadecola C, Hachinski V, Rosenberg GA. Vascular cognitiveimpairment introduction. Stroke 2010;41:S127–S128.
Ikeda O, Sato T, Suzuki K. Super-resolution imaging system usingwaves with a limited frequency bandwidth. J Acoust Soc Am1979;65:75–81.
Ilovitsh T, Ilovitsh A, Foiret J, Fite BZ, Ferrara KW. Acoustical struc-tured illumination for super-resolution ultrasound imaging. Com-mun Biol 2018;1:3.
Jain RK. Determinants of tumor blood flow: A review. Cancer Res1988;48:2641–2658.
Jellinger KA. The pathology of “vascular dementia”: A critical update.J Alzheimer’s Dis 2008;14:107–123.
Jia Y, Tan O, Tokayer J, Potsaid B, Wang Y, Liu JJ, Kraus MF, Sub-hash H, Fujimoto JG, Hornegger J. Split-spectrum amplitude-decorrelation angiography with optical coherence tomography. OptExpress 2012;20:4710–4725.
Johnson KW, Powers JE. Ultrasonic detection of contrast agents. Pat-ent, 1995; US5456257A.
Jones HW. Superresolution in ultrasonic imaging. Acoustical Imaging.19 Boston: Springer; 1992. p. 71–76.
Kanoulas E, Butler M, Rowley C, Voulgaridou V, Diamantis K, Dun-can WC, McNeilly A, Averkiou M, Wijkstra H, Mischi M. Super-resolution contrast-enhanced ultrasound methodology for the iden-tification of in vivo vascular dynamics in 2D. Invest Radiol2019;54:500–516.
Kawabata K, Sugita N, Yoshikawa H, Azuma T, Umemura S. Nano-particles with multiple perfluorocarbons for controllable ultrasoni-cally induced phase shifting. Jpn J Appl Phys 2005;44:4548.
Kiessling F, Fokong S, Bzyl J, Lederle W, Palmowski M, Lammers T.Recent advances in molecular, multimodal and theranostic ultra-sound imaging. Adv Drug Deliv Rev 2014;72:15–27.
Kim SG, Ogawa S. Biophysical and physiological origins of bloodoxygenation level-dependent fMRI signals. J Cereb Blood FlowMetab 2012;32:1188–1206.
Kripfgans OD, Fowlkes JB, Miller DL, Eldevik OP, Carson P. LAcoustic droplet vaporization for therapeutic and diagnostic appli-cations. Ultrasound Med Biol 2000;26:1177–1189.
Kuhn HW. The Hungarian method for the assignment problem. NavalRes Logistics Q 1955;2:83–97.
Leahy MJ. Microcirculation imaging. New York: Wiley; 2012.Lehman SK, Devaney AJ. Transmission mode time-reversal super-res-
olution imaging. J Acoust Soc Am 2003;113:2742–2753.Lin F, Shelton SE, Esp�ındola D, Rojas JD, Pinton G, Dayton PA. 3-D
ultrasound localization microscopy for identifying microvascular mor-phology features of tumor angiogenesis at a resolution beyond the dif-fraction limit of conventional ultrasound. Theranostics 2017;7:196.
Lin F, Tsuruta JK, Rojas JD, Dayton PA. Optimizing sensitivity ofultrasound contrast-enhanced super-resolution imaging by tailoringsize distribution of microbubble contrast agent. Ultrasound MedBiol 2017;43:2488–2493.
Lin S, Zhang G, Jamburidze A, Chee M, Leow CH, Garbin V, TangMX. Imaging of vaporised sub-micron phase change contrastagents with high frame rate ultrasound and optics. Phys Med Biol2018;63:065002.
Lindsey BD, Light ED, Nicoletto HA, Bennett ER, Laskowitz DT,Smith SW. The ultrasound brain helmet: New transducers and vol-ume registration for in vivo simultaneous multi-transducer 3-Dtranscranial imaging. IEEE Trans Ultrason Ferroelectr Freq Control2011;58:1189–1202.
Lindsey BD, Nicoletto HA, Bennett ER, Laskowitz DT, Smith SW. 3-D transcranial ultrasound imaging with bilateral phase aberrationcorrection of multiple isoplanatic patches: A pilot human studywith microbubble contrast enhancement. Ultrasound Med Biol2014;40:90–101.
Lipsman N, Meng Y, Bethune AJ, Huang Y, Lam B, Masellis M, Herr-mann N, Heyn C, Aubert I, Boutet A. Blood�brain barrier openingin Alzheimer’s disease using MR-guided focused ultrasound. NatCommun 2018;9:2336.
Lockwood GR, Turnball DH, Christopher DA, Foster FS. Beyond30 MHz (applications of high-frequency ultrasound imaging).IEEE Eng Med Biol Mag 1996;15:60–71.
Luke GP, Hannah AS, Emelianov SY. Super-resolution ultrasoundimaging in vivo with transient laser-activated nanodroplets. Nanoletters 2016;16:2556–2559.
Mallart R, Fink M. Adaptive focusing in scattering media throughsound-speed inhomogeneities: The van Cittert Zernike approachand focusing criterion. J Acoust Soc Am 1994;96:3721–3732.
Microcirculation revisited: From molecules to clinical practice. In:Lenasi H, (ed). Microcirculation revisited: From molecules to clini-cal practice. : Books on Demand; 2016.
Mainprize T, Lipsman N, Huang Y, Meng Y, Bethune A, Ironside S,Heyn C, Alkins R, Trudeau M, Sahgal A, Perry J, Hynynen K.Blood�brain barrier opening in primary brain tumors with non-invasive MR-guided focused ultrasound: A clinical safety and fea-sibility study. Sci Rep 2019;9:321.
Marien KM, Croons V, Waumans Y, Sluydts E, De Schepper S,Andries L, Waelput W, Fransen E, Vermeulen PB, Kockx MM, De
890 Ultrasound in Medicine & Biology Volume 46, Number 4, 2020
Meyer GRY. Development and validation of a histological methodto measure microvessel density in whole-slide images of cancer tis-sue. Ribatti D, ed. PLoS One 2016;11 e0161496.
Mayo RP. Advances in human placental biomechanics. Comput StructBiotechnol J 2018;16:298–306.
McDannold N, Vykhodtseva N, Hynynen K. Targeted disruption of theblood�brain barrier with focused ultrasound: Association with cav-itation activity. Phys Med Biol 2006;51:793.
Miles KA. Measurement of tissue perfusion by dynamic computedtomography. Br J Radiol 1991;64:409–412.
Montgomery M. Uncertainty during breast diagnostic evaluation: Stateof the science. Oncol Nurs Forum 2010;37:77–83.
Montgomery M, McCrone SH. Psychological distress associated withthe diagnostic phase for suspected breast cancer: systematic review.J Adv Nurs 2010;66:2372–2390.
Munkres J. Algorithms for the assignment and transportation problems.J Soc Ind Appl Math 1957;5:32–38.
Nedosekin DA, Galanzha EI, Dervishi E, Biris AS, Zharov VP. Super-res-olution nonlinear photothermal microscopy. Small 2014;10:135–142.
OˈReilly MA, Hynynen K. A super-resolution ultrasound method forbrain vascular mapping. Med Phys 2013;40:110701.
Opacic T, Dencks S, Theek B, Piepenbrock M, Ackermann D, Rix A,Lammers T, Stickeler E, Delorme S, Schmitz G. Motion modelultrasound localization microscopy for preclinical and clinical mul-tiparametric tumor characterization. Nat Commun 2018;9:1527.
Pajek D, Burgess A, Huang Y, Hynynen K. High-intensity focusedultrasound sonothrombolysis: The use of perfluorocarbon dropletsto achieve clot lysis at reduced acoustic power. Ultrasound MedBiol 2014;40:2151–2161.
Pantoni L. Cerebral small vessel disease: From pathogenesis and clini-cal characteristics to therapeutic challenges. Lancet Neurol2010;9:689–701.
Petersen ET, Zimine I, Ho YL, Golay X. Non-invasive measurement ofperfusion: A critical review of arterial spin labelling techniques. BrJ Radiol 2006;79:688–701.
Pichardo S, Sin VW, Hynynen K. Multi-frequency characterization ofthe speed of sound and attenuation coefficient for longitudinaltransmission of freshly excised human skulls. Phys Med Biol2011;56:219.
Pieczynski J, Grzybowski A. Review of diabetic retinopathy screeningmethods and programmes adopted in different parts of the world.Eur Ophthalmic Rev 2015;9:49–55.
Postema M, Van Wamel A, Lanc�ee CT, De Jong N. Ultrasound-induced encapsulated microbubble phenomena. Ultrasound MedBiol 2004;30:827–840.
Prada C, Thomas JL. Experimental subwavelength localization of scat-terers by decomposition of the time reversal operator interpreted asa covariance matrix. J Acoust Soc Am 2003;114:235–243.
Provost J, Papadacci C, Arango JE, Imbault M, Fink M, Gennisson -L,Tanter M, Pernot M. 3D ultrafast ultrasound imaging in vivo. PhysMed Biol 2014;59:L1.
Pugsley MK, Tabrizchi R. The vascular system: An overview of struc-ture and function. J Pharmacol Toxicol Methods 2000;44:333–340.
Ragan T, Kadiri LR, Venkataraju KU, Bahlmann K, Sutin J, Taranda J,Arganda-Carreras I, Kim Y, Seung HS, Osten P. Serial two-photontomography for automated ex vivo mouse brain imaging. NatMethods 2012;9:255.
Rao SR, Shelton SE, Dayton PA. The “fingerprint” of cancer extendsbeyond solid tumor boundaries: Assessment with a novel ultrasoundimaging approach. IEEE Trans Biomed Eng 2015;63:1082–1086.
Rapoport NY, Kennedy AM, Shea JE, Scaife CL, Nam KH. Controlledand targeted tumor chemotherapy by ultrasound-activated nanoe-mulsions/microbubbles. J Control Release 2009;138:268–276.
Renier N, Wu Z, Simon DJ, Yang J, Ariel P, Tessier-Lavigne M.iDISCO: A simple, rapid method to immunolabel large tissue sam-ples for volume imaging. Cell 2014;159:896–910.
Rey JE, Gardner SM, Cushing RD. Determinants of surgical site infec-tion after breast biopsy. Am J Infect Control 2005;33:126–129.
Reznik N, Williams R, Burns PN. Investigation of vaporized submi-cron perfluorocarbon droplets as an ultrasound contrast agent.Ultrasound Med Biol 2011;37:1271–1279.
Rust MJ, Bates M, Zhuang X. Sub-diffraction-limit imaging by sto-chastic optical reconstruction microscopy (STORM). Nat Methods2006;3:793.
Sandrin L, Catheline S, Tanter M, Hennequin X, Fink M. Time-resolved pulsed elastography with ultrafast ultrasonic imaging.Ultrason Imaging 1999;21:259–272.
Schrope B, Newhouse VL, Uhlendorf V. Simulated capillary bloodflow measurement using a nonlinear ultrasonic contrast agent.Ultrason Imaging 1992;14:134–158.
Sheeran PS, Luois SH, Mullin LB, Matsunaga TO, Dayton PA. Designof ultrasonically-activatable nanoparticles using low boiling pointperfluorocarbons. Biomaterials 2012;33:3262–3269.
Sheeran PS, Rojas JD, Puett C, Hjelmquist J, Arena CB, Dayton PA.Contrast-enhanced ultrasound imaging and in vivo circulatory kineticswith low-boiling-point nanoscale phase-change perfluorocarbonagents. Ultrasound Med Biol 2015;41:814–831.
Shekhawat GS, Dravid VP. Nanoscale imaging of buried structures viascanning near-field ultrasound holography. Science 2005;310:89–92.
Shelton SE, Lee YZ, Lee M, Cherin E, Foster FS, Aylward SR, DaytonPA. Quantification of microvascular tortuosity during tumor evolu-tion using acoustic angiography. Ultrasound Med Biol2015;41:1896–1904.
Shi WT, Forsberg F. Ultrasonic characterization of the nonlinear proper-ties of contrast microbubbles. Ultrasound Med Biol 2000;26:93–104.
Shpak O, Verweij M, Vos HJ, de Jong N, Lohse D, Versluis M. Acousticdroplet vaporization is initiated by superharmonic focusing. Proceed-ings of the National Academy of Sciences 2014;111:1697–1702.
Siepmann M, Schmitz G, Bzyl J, Palmowski M, Kiessling F. Imagingtumor vascularity by tracing single microbubbles. Proc IEEE IntUltrason Symp 2011;1906–1909.
Simpson DH, Chin CT, Burns PN. Pulse inversion Doppler: A new methodfor detecting nonlinear echoes from microbubble contrast agents. IEEETrans Ultrason Ferroelectr Freq Control 1999;46:372–382.
Soeller C, Cannell MB. Examination of the transverse tubular systemin living cardiac rat myocytes by 2-photon microscopy and digitalimage�processing techniques. Circulation Res 1999;84:266–275.
Solomon O, van Sloun RJ, Wijkstra H, Mischi M, Eldar YC. Exploitingflow dynamics for super-resolution in contrast-enhanced ultra-sound. arXiv preprint arXiv:180403134. 2018;
Solomon O, Eldar YC, Mutzafi M, Segev M. SPARCOM: Sparsitybased super-resolution correlation microscopy. SIAM J ImagingSci 2019;12:392–419.
Song P, Trzasko JD, Manduca A, Huang R, Kadirvel R, Kallmes DF,Chen S. Improved super-resolution ultrasound microvessel imagingwith spatiotemporal nonlocal means filtering and bipartite graph-based microbubble tracking. IEEE Trans Ultrason Ferroelectr FreqControl 2017;65:149–167.
Song P, Manduca A, Trzasko JD, Daigle RE, Chen S. On the effects ofspatial sampling quantization in super-resolution ultrasound micro-vessel imaging. IEEE Trans Ultrason Ferroelectr Freq Control2018;65:2264–2276.
Soulioti DE, Espindola D, Dayton PA, Pinton G. Super-resolutionimaging through the human skull. IEEE Trans Ultrason FerroelectrFreq Control 2020;67:25–36.
Stanimirovic DB, Friedman A. Pathophysiology of the neurovascularunit: Disease cause or consequence? J Cereb Blood Flow Metab2012;32:1207–1221.
Storkebaum E, Lambrechts D, Carmeliet P. VEGF: Once regarded as aspecific angiogenic factor, now implicated in neuroprotection. Bio-essays 2004;26:943–954.
Stride E, Saffari N. Microbubble ultrasound contrast agents: A review.Proc Inst Mech Eng H 2003;217:429–447.
Theek B, Opacic T, Magnuska Z, Lammers T, Kiessling F. Radiomicanalysis of contrast-enhanced ultrasound data. Sci Rep 2018;8:11359.
Underwood SR, Anagnostopoulos C, Cerqueira M, Ell PJ, Flint EJ,Harbinson M, Kelion AD, Al-Mohammad A, Prvulovich EM,Shaw LJ. Myocardial perfusion scintigraphy: The evidence. Eur JNucl Med Mol Imaging 2004;31:261–291.
Van Heel M, Schatz M. Fourier shell correlation threshold criteria. JStruct Biol 2005;151:250–262.
Super-resolution Ultrasound Imaging � K. CHRISTENSEN-JEFFRIES et al. 891
van Sloun RJG, Solomon O, Eldar YC, Wijkstra H, Mischi M. Spar-sity-driven super-resolution in clinical contrast-enhanced ultra-sound. Proc IEEE Int Ultrason Symp 2017; Available at: http://ieeexplore.ieee.org/document/8092945/.
van Sloun RJG, Solomon O, Bruce M, Khaing ZZ, Wijkstra H, Eldar YC,Mischi M. Super-resolution ultrasound localization microscopythrough deep learning. arXiv preprint arXiv:180407661. 2018a.
van Sloun RJG, Demi L, Schalk SG, Caresio C, Mannaerts C, PostemaAW, Molinari F, van der Linden HC, Huang P, Wijkstra H, MischiM. Contrast-enhanced ultrasound tractography for 3D vascularimaging of the prostate. Sci Rep 2018;8:14640.
van Sloun RJG, Solomon O, Bruce M, Khaing ZZ, Eldar YC, MischiM. Deep learning for super-resolution vascular ultrasound imaging.IEEE International Conference on Acoustics, Speech and SignalProcessing—ICASSP 2019. IEEE; 2019.
Viessmann OM, Eckersley RJ, Christensen-Jeffries K, Tang MX,Dunsby C. Acoustic super-resolution with ultrasound and micro-bubbles. Phys Med Biol 2013;58:6447–6458.
Vilov S, Arnal B, Bossy E. Overcoming the acoustic diffraction limit inphotoacoustic imaging by localization of flowing absorbers. OptLett 2017;42:4379–4382.
Walker WF, Trahey GE. A fundamental limit on delay estimationusing partially correlated speckle signals. IEEE Trans Ultrason Fer-roelectr Freq Control 1995;42:301–308.
Wang LV, Hu S. Photoacoustic tomography: In vivo imaging fromorganelles to organs. Science 2012;335:1458–1462.
Wardlaw JM, Smith EE, Biessels GJ, Cordonnier C, Fazekas F, FrayneR, Lindley RI, T O’Brien J, Barkhof F, Benavente OR. Neuroimag-ing standards for research into small vessel disease and its contribu-tion to ageing and neurodegeneration. Lancet Neurol 2013;12:822–838.
Webb AJ, Simoni M, Mazzucco S, Kuker W, Schulz U, Rothwell PM.Increased cerebral arterial pulsatility in patients with leukoaraiosis:Arterial stiffness enhances transmission of aortic pulsatility. Stroke2012;43:2631–2636.
Weidner N. Current pathologic methods for measuring intratumoralmicrovessel density within breast carcinoma and other solidtumors. Breast Cancer Res Treat 1995;36:169–180.
Wheatley MA, Schrope B, Shen P. Contrast agents for diagnostic ultra-sound: Development and evaluation of polymer-coated microbub-bles. Biomaterials 1990;11:713–717.
Williams DS, Detre JA, Leigh JS, Koretsky AP. Magnetic resonanceimaging of perfusion using spin inversion of arterial water. ProcNatl Acad Sci 1992;89:212–216.
World Cancer Research Fund International. Breast cancer statistics.London: Author; 2018. Available at: https://www.wcrf.org/dietand-cancer/cancer-trends/breast-cancer-statistics.
World Health Organization (WHO). Early detection of cancer. Geneva:Author; 2019. Available at: https://www.who.int/cancer/detection/en/.
Zhang G, Harput S, Lin S, Christensen-Jeffries K, Leow CH, Brown J,Dunsby C, Eckersley RJ, Tang MX. Acoustic wave sparsely acti-vated localization microscopy (AWSALM): Super-resolution ultra-sound imaging using acoustic activation and deactivation ofnanodroplets. Appl Phys Lett 2018;113:014101.
Zhang G, Harput S, Hu H, Christensen-Jeffries K, Zhu J, Brown J,Leow CH, Eckersley RJ, Dunsby C, Tang M. Fast acoustic wavesparsely activated localization microscopy: Super-resolution ultra-sound using plane-wave activation of nanodroplets. IEEE TransUltrason Ferroelectr Freq Control 2019;66:1039–1046.
Zhang G, Lin S, Leow CH, Pang KT, Hern�andez-Gil J, Long NJ, Eck-ersley R, Matsunaga T, Tang MX. Quantification of vaporised tar-geted nanodroplets using high-frame-rate ultrasound and optics.Ultrasound Med Biol 2019;45:1131–1142.
Zhu J, Rowland EM, Harput S, Riemer K, Leow CH, Clark B, Cox K,Lim A, Christensen-Jeffries K. 3D super-resolution US imaging ofrabbit lymph node vasculature in vivo by using microbubbles.Radiology 2019;291:642–650.
Zlokovic Berislav V. Neurovascular pathways to neurodegeneration inAlzheimer’s disease and other disorders. Nat Rev Neurosci2011;12:723–738.
Copyright © 2022 FDOKUMEN