Analysis of fast block matching motion estimation algorithms for video super-resolution systems
9
IEEE Transactions on Consumer Electronics, Vol. 54, No. 3, AUGUST 2008 Manuscript received July 14, 2008 0098 3063/08/$20.00 © 2008 IEEE 1430 Analysis of Fast Block Matching Motion Estimation Algorithms for Video Super-Resolution Systems Gustavo M. Callicó, Member, IEEE, Sebastián López, Member, IEEE, Oliver Sosa, José F. Lopez and Roberto Sarmiento Abstract — In general, all the video Super-Resolution (SR) algorithms present the important drawback of a very high computational load, mainly due to the huge amount of operations executed by the Motion Estimation (ME) stage. Commonly, there is a trade-off between the accuracy of the estimated motion, given as a Motion Vector (MV), and the computational cost associated. In this sense, the ME algorithms that explore more exhaustively the search area among images use to deliver better MVs, at the cost of a higher computational load and resources use. Due to this reason, the proper choice of a ME algorithm is a key factor not only to reach real-time applications, but also to obtain high quality video sequences independently of their characteristics. Under the hardware point of view, the preferred ME algorithms are based on matching fixed-size blocks in different frames. In this paper, a comparison of nine of the most representative Fast Block Matching Algorithms (FBMAs) is made in order to select the one which presents the best tradeoff between video quality and computational cost, thus allowing reliable real-time hardware implementations of video super-resolution systems 1 . Index Terms — super-resolution, motion estimation, motion vectors, block-matching, real-time processing, full search, new three step search. I. INTRODUCTION The current consumer market is increasingly being dominated by visual contents, where the resolution of the images steadily gains more importance. There are several ways to increase the resolution of an image. The most direct one is to improve the optics and/or the sensor resolution, but usually this solution supposes a considerable increment in the cost of the system. One smart way to increase the resolution of images beyond the image sensor resolution is using Super- Resolution (SR) algorithms. As this solution changes neither the image sensor nor the camera optics, it supposes a relatively low cost solution. The SR algorithms combine the sub-pixel information contained in several time-correlated frames to form a high resolution frame. The main drawback that jeopardizes the real time execution of a SR algorithm is its huge computational cost. A profile of the execution of the SR algorithm published in [1] reveals that, in average, about 51% 1 This work has been supported by the Spanish Ministry of Education and Sciences (MEC) under the project TEC2005-08138-C02-01/MIC. G.M. Callicó, S. López, O. Sosa, J.F. López and R. Sarmiento are with the Institute of Applied Microelectronics (IUMA) from the University of Las Palmas de Gran Canaria, E–35017, Las Palmas de Gran Canaria, SPAIN. of the computational cost relies on the ME process. Therefore, any effort focused on decreasing the computation load of this process will considerably speed up the overall SR process, allowing a reliable hardware implementation. On the other hand, the ME is a key task in the SR process, where the final quality of the super-resolved sequence critically depends on the accuracy of the MVs. The cost function commonly used is the Summation of the Absolute Differences (SAD) evaluated pixel-by-pixel between the given reference Macro-Block (MB) and every candidate MB. From a hardware perspective, the FBMAs suppose a higher guarantee for implementation, being the Full Search (FS) algorithm the only one that exhaustively evaluates all the MVs in a predefined search area, thus guarantying the lowest cost function used and the minimal distortion. The price to pay for this minimal distortion is a very high computational cost, given as a direct proportion with the square of the size of the search area. However, a tradeoff problem between quality and computational load is encountered, being highly recommendable to find a FBMA where its associated quality loss, compared with the FS algorithm, is negligible with respect to a significant reduction in the number of operations to be performed. At the same time, the ME algorithm must assure a quality above the bilinear interpolation of the image used as reference. In this paper we present an evaluation in depth of the impact of changing the FS algorithm on a SR environment, for another FBMA of high relevance commonly used for video coding. The main problem is that the aforementioned algorithms were designed to work in compression environments, where an accuracy loss in the MVs implies an increase of the transmission bit-rate, but not necessarily a reduction in the quality of the decoded sequence. After a preliminary evaluation of nine FBMAs, only three of them exhibited results good enough for being applied to SR: the New Three Step Search (NTS), the Diamond Search (DS) and the One Time Search (OTS). These three ME algorithms have been exhaustively analyzed in terms of quality and computational load in order to determine the algorithm that delivers the best tradeoff of both factors, super-resolved video quality and associated computational cost. The remainder of this paper is organized as follows: in section II the most important SR algorithms related to this work are reviewed. In section III the proposed test setup to evaluate the different FBMAs is defined while in section IV the most significant obtained results are shown and analyzed. Finally, section V shows the conclusions reached in this paper.
-
Upload
independent -
Category
Documents
-
view
1 -
download
0
Transcript of Analysis of fast block matching motion estimation algorithms for video super-resolution systems

IEEE Transactions on Consumer Electronics, Vol. 54, No. 3, AUGUST 2008
Manuscript received July 14, 2008 0098 3063/08/$20.00 © 2008 IEEE
1430
Analysis of Fast Block Matching Motion Estimation Algorithms for Video Super-Resolution Systems
Gustavo M. Callicó, Member, IEEE, Sebastián López, Member, IEEE, Oliver Sosa, José F. Lopez and Roberto Sarmiento
Abstract — In general, all the video Super-Resolution (SR) algorithms present the important drawback of a very high computational load, mainly due to the huge amount of operations executed by the Motion Estimation (ME) stage. Commonly, there is a trade-off between the accuracy of the estimated motion, given as a Motion Vector (MV), and the computational cost associated. In this sense, the ME algorithms that explore more exhaustively the search area among images use to deliver better MVs, at the cost of a higher computational load and resources use. Due to this reason, the proper choice of a ME algorithm is a key factor not only to reach real-time applications, but also to obtain high quality video sequences independently of their characteristics. Under the hardware point of view, the preferred ME algorithms are based on matching fixed-size blocks in different frames. In this paper, a comparison of nine of the most representative Fast Block Matching Algorithms (FBMAs) is made in order to select the one which presents the best tradeoff between video quality and computational cost, thus allowing reliable real-time hardware implementations of video super-resolution systems1.
Index Terms — super-resolution, motion estimation, motion vectors, block-matching, real-time processing, full search, new three step search.
I. INTRODUCTION The current consumer market is increasingly being
dominated by visual contents, where the resolution of the images steadily gains more importance. There are several ways to increase the resolution of an image. The most direct one is to improve the optics and/or the sensor resolution, but usually this solution supposes a considerable increment in the cost of the system. One smart way to increase the resolution of images beyond the image sensor resolution is using Super-Resolution (SR) algorithms. As this solution changes neither the image sensor nor the camera optics, it supposes a relatively low cost solution. The SR algorithms combine the sub-pixel information contained in several time-correlated frames to form a high resolution frame. The main drawback that jeopardizes the real time execution of a SR algorithm is its huge computational cost. A profile of the execution of the SR algorithm published in [1] reveals that, in average, about 51%
1 This work has been supported by the Spanish Ministry of Education and
Sciences (MEC) under the project TEC2005-08138-C02-01/MIC. G.M. Callicó, S. López, O. Sosa, J.F. López and R. Sarmiento are with the
Institute of Applied Microelectronics (IUMA) from the University of Las Palmas de Gran Canaria, E–35017, Las Palmas de Gran Canaria, SPAIN.
of the computational cost relies on the ME process. Therefore, any effort focused on decreasing the computation load of this process will considerably speed up the overall SR process, allowing a reliable hardware implementation. On the other hand, the ME is a key task in the SR process, where the final quality of the super-resolved sequence critically depends on the accuracy of the MVs. The cost function commonly used is the Summation of the Absolute Differences (SAD) evaluated pixel-by-pixel between the given reference Macro-Block (MB) and every candidate MB. From a hardware perspective, the FBMAs suppose a higher guarantee for implementation, being the Full Search (FS) algorithm the only one that exhaustively evaluates all the MVs in a predefined search area, thus guarantying the lowest cost function used and the minimal distortion. The price to pay for this minimal distortion is a very high computational cost, given as a direct proportion with the square of the size of the search area. However, a tradeoff problem between quality and computational load is encountered, being highly recommendable to find a FBMA where its associated quality loss, compared with the FS algorithm, is negligible with respect to a significant reduction in the number of operations to be performed. At the same time, the ME algorithm must assure a quality above the bilinear interpolation of the image used as reference.
In this paper we present an evaluation in depth of the impact of changing the FS algorithm on a SR environment, for another FBMA of high relevance commonly used for video coding. The main problem is that the aforementioned algorithms were designed to work in compression environments, where an accuracy loss in the MVs implies an increase of the transmission bit-rate, but not necessarily a reduction in the quality of the decoded sequence. After a preliminary evaluation of nine FBMAs, only three of them exhibited results good enough for being applied to SR: the New Three Step Search (NTS), the Diamond Search (DS) and the One Time Search (OTS). These three ME algorithms have been exhaustively analyzed in terms of quality and computational load in order to determine the algorithm that delivers the best tradeoff of both factors, super-resolved video quality and associated computational cost.
The remainder of this paper is organized as follows: in section II the most important SR algorithms related to this work are reviewed. In section III the proposed test setup to evaluate the different FBMAs is defined while in section IV the most significant obtained results are shown and analyzed. Finally, section V shows the conclusions reached in this paper.
G. M. Callicó et al.: Analysis of Fast Block Matching Motion Estimation Algorithms for Video Super-Resolution Systems 1431
II. SUPER-RESOLUTION ALGORITHMS Since its conception, SR has been traditionally divided in
three different and somehow independent processes: registration, fusion and restoration [2]. Image registration is the task of finding the motion between two or more views of the same scene, although it does not necessarily describe the real motion of either the camera or the scene. This paper is mainly focused in this aspect of the SR. The most common way to allow a reliable implementation of the registration is to estimate the motion using only two dimensional translations [3], under the assumption of slowly motion inside the scene. In [4] more elaborated methods are provided including rotation and scaling, basically intended for scanned documents. Although the collection of algorithms on image registration is massive (see [5] and [6] for example) they can be classified into two main approaches: featured based methods and area based methods. The first approach requires only a sparse set of point correspondences to fit the motion model, while the second one uses the information from all the pixels. Because of its regression nature, the featured based methods are not robust against false matches. They also require an over-determined number of point correspondences to achieve a good accuracy [7]. Area based methods, on the other hand, can achieve a high level of accuracy suitable for SR if the initial estimation is good enough. While the featured based methods work only with a small number of points, the area based methods, as the ones proposed in this paper, make use of the entire overlapping areas of the two images. Many area-based methods estimate image motion by minimizing a cost function between two motion-corrected images [8]. These methods are unbiased and they are optimal under Gaussian noise [9]. All these methods, however, suffer from a very high computational cost, precluding them from a real-time execution on embedded systems. That is why in this work, several motion estimation algorithms for video compression [10] are evaluated inside a SR environment, as they have proven to work in real time conditions with very reliable hardware implementations.
III. TEST SETUP In order to evaluate the impact of the FBMAs inside a SR
system, the SR algorithm described in [11] and developed by the authors of this paper has been used.
The current analysis has been divided in two stages. In the first stage, a preliminary selection was performed using nine FBMAs. Based in these results, the three FBMAs that exhibited the best performance in terms of quality and computation load were selected to be evaluated in a second detailed stage. In this second stage, additional simulations were performed in order to obtain a final figure of merit that will help in the decision of which FBMA could better substitute the FS algorithm for SR.
For the first preliminary selection and among all the ME algorithms available in the current literature, nine FBMA algorithms were chosen based on their relevance in
compression environments. These algorithms are: 1. The Three-Step Search (TSS), described in [12]. 2. The New Three Step Search (NTS), described in
[13]. 3. The Four Step Search (FSS), described in [14]. 4. The Two Dimensional Logarithmic (TDL) search,
described in [15]. 5. The Cross Search (CS), described in [16]. 6. The Diamond Search (DS), described in [17]. 7. The Block Based Gradient Descent Search
(BBGDS), described in [18]. 8. The One at a Time Search (OTS), described in [19]. 9. The Parallel Hierarchical One Dimensional Search
(PHODS), described in [20]. These nine algorithms, together with the FS Algorithm as
the reference, have been coded in the C high-level description language and tested inside a SR environment returning data related to quality and computational load for each FBMA. This SR system or SR-core has also been developed using a structured sub-set of ANSI C especially intended for hardware description systems. These descriptions avoid floating point arithmetic, objects, pointers and, in general, all the constructions that are difficult to implement in hardware. In addition, data and parameters are passed using memory structures that emulate the hardware interfaces. The SR-core uses as an input a text configuration file and the video sequence to be enhanced, and generates as an output a results data file and the super-resolved sequence.
In Fig 1, the higher-level block diagram of the SR-core is shown inside the setup environment. Every test starts reading the configuration file where several parameters as the images size, the number of frames to be processed, the FBMA to be used, and the search area, among others, are fixed. Firstly, the input High-Resolution (HR) sequence is decimated in a given integer scale factor (factor 2 in this work) obtaining the Low Resolution (LR) sequence. At the same time, the LR sequence is interpolated using the same scale factor, as it will be used as the lower image quality to surpass. Once here, the SR process starts using the LR sequence as input. Initially, the motion is estimated by the “Motion Estimator”, computing a set of MVs per MB with sub-pixel accuracy (one quarter of pixel in this work) that will be used to shift every new incoming MB towards the MB used as the reference one in every frame-time. A temporal window of a finite number of frames before and after the current processing frame is used together with a search area of pixels around the current macroblock (MB). All the information generated by the sub-pixel shifts is gathered in a higher resolution grid that creates the first super-resolved image. These two processes are performed by the block named “Shift & Add”. Finally, if any pixel is not filled throughout this process, it is interpolated by the “Fill Holes” process using a bilinear surface interpolator. No de-blurring is applied to the final super-resolved image as it could distort the effect of the ME algorithm.
The SR-core is designed in such a way that it is possible to change several parameters of the SR algorithm or the ME

IEEE Transactions on Consumer Electronics, Vol. 54, No. 3, AUGUST 2008 1432
algorithm using a configuration file. This is extremely useful to fully evaluate every ME algorithm, because it is possible to change its behavior with each different parameter set.
HR Sequence DDeecciimmaattee LR
Sequence
SSuuppeerr RReessoolluuttiioonn
Motion Estimator Shift & Add Fill Holes
FBMA
SR Sequence
PPSSNNRR CCoommppuuttaattiioonn
Results: PSNR (dB)
# Operations
Interpolated Sequence
Fig. 1. Test setup used to evaluate the FBMAs inside the SR system.
In order to allow a reliable comparison among all the
FBMAs, nine real-life sequences, commonly used in image processing testing, have been processed. Three of them are in HDTV resolution and the other six are in CIF resolution. The HDTV sequences were used to make a preliminary selection of the best three FBMAs. With these three algorithms, a more detailed evaluation process using the CIF sequences is performed subsequently.
In order to estimate the impact of every FBMA inside the SR process it is necessary to evaluate the quality of the FBMA using an objective figure of merit such as the Peak to Signal Noise Ratio (PSNR), which measures the differences between two images, giving as a result a figure in logarithmic scale or decibels (dB). A high value in dB represents small differences between the two images. Applying this operator to different images or frames from a video sequence, it delivers a figure that increases when the images are more similar. For this test, the original HR sequence is compared with the SR output sequence.
Another important data which is necessary to obtain is the computational load that each FBMA employs to achieve its results. Basically, the ME process consists of comparing multiple MBs with the current one shifted by a MV amount and returning the one with the minor distortion. As stated before, the distortion is calculated by the Sum of Absolutes Differences (SAD) cost function and it gives a numerical idea about how similar two MBs are. This function repeats an operation, which is called Absolute Difference (AD), for every pixel in the current MB as it is shown in (1), where Ci,j is the
current MB in coordinates i, j and Si,j is the corresponding MB in the search area.
, , ,AD =i j i j i jC S− (1)
The SAD is obtained as shown in (2).
,
,
SAD= AD i ji j∑ (2)
The total number of ADs computed by every FBMA is the sum of the ADs in the search area performed in every MB for every frame of the window contained in the sequence. The FS is the algorithm that needs more ADs to obtain the MVs since it evaluates the SAD for every MV in the search area, giving as results a MV with the lower distortion.
As it was commented in the beginning of the section, the study has been divided into two stages. In the first stage, all the FBMAs were evaluated using three real-life HDTV sequences (1152×640 pixels): STOCKHOLM, MOBCAL and PEDESTRIAN. The election of these sequences is justified based on the fact that they cover all the main situations to be encountered in a video: global and local movements, fast and slow movements, small, and large shifts and high and low texture.
In order to evaluate the FBMAs, the SR process is executed for each sequence and for each FBMA and one simulation is done for each set of ME parameters, using all the possible combinations of the parameters shown in Table I. A total of 24 simulations were launched for each FBMA using the three test sequences. Once all the result data were collected, they were analyzed, and the best three FBMAs together with the FS were used in the second detailed stage.
TABLE I
PARAMETERS AND VALUES FOR THE PRELIMINARY FIRST STAGE Parameter Values
MB size (pixels) 4, 8, 16, 32 Frames forward/backward (frames) 2/2, 3/3, 5/5 Search area (pixels) 7, 15
In the second stage, six CIF resolution sequences (352×288
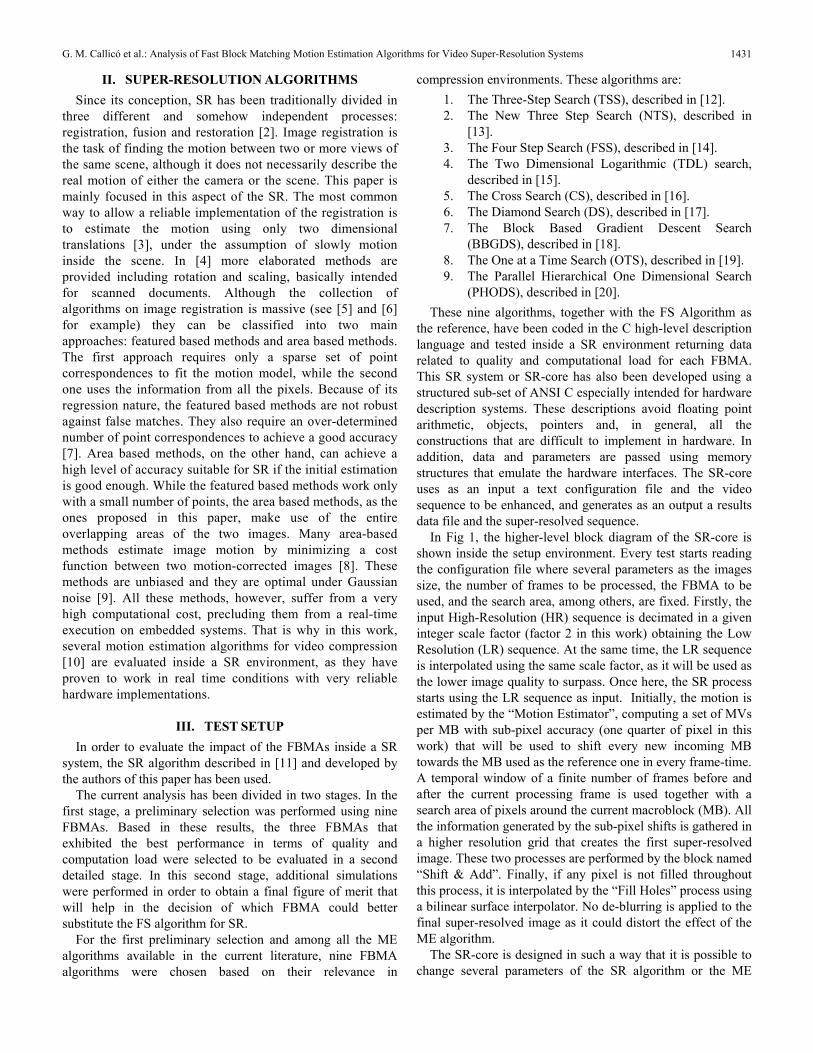
pixels) were used in order to speed up the simulations. These sequences are some of the standard used in the image processing world: FOREMAN, DEADLINE, CHILDREN, NEWS, MOBILE and FLOWERS. The parameters used in this second stage are shown in Table II. All the test sequences are shown in Fig. 2.
TABLE II
PARAMETERS AND VALUES FOR THE DETAILED SECOND STAGE Parameter Values MB size (pixels) 4, 8, 16 Frames forward/backward (frames) 2/2, 5/5 Search area (pixels) 7, 15
A total of 12 runs were processed in the detailed stage for
each FBMA and for each of the 6 sequences, i.e. a total of 72 simulations were performed.
G. M. Callicó et al.: Analysis of Fast Block Matching Motion Estimation Algorithms for Video Super-Resolution Systems 1433
Foreman Deadline
Children News
Mobile Flowers
Detailed test study
Preliminary test study
Stockholm
Mobcal
Pedestrian
Fig. 2. Test sequences for the preliminary and detailed studies.
IV. RESULTS The results are presented following the same steps in which
the simulations were performed: firstly the preliminary study and secondly the detailed stage.
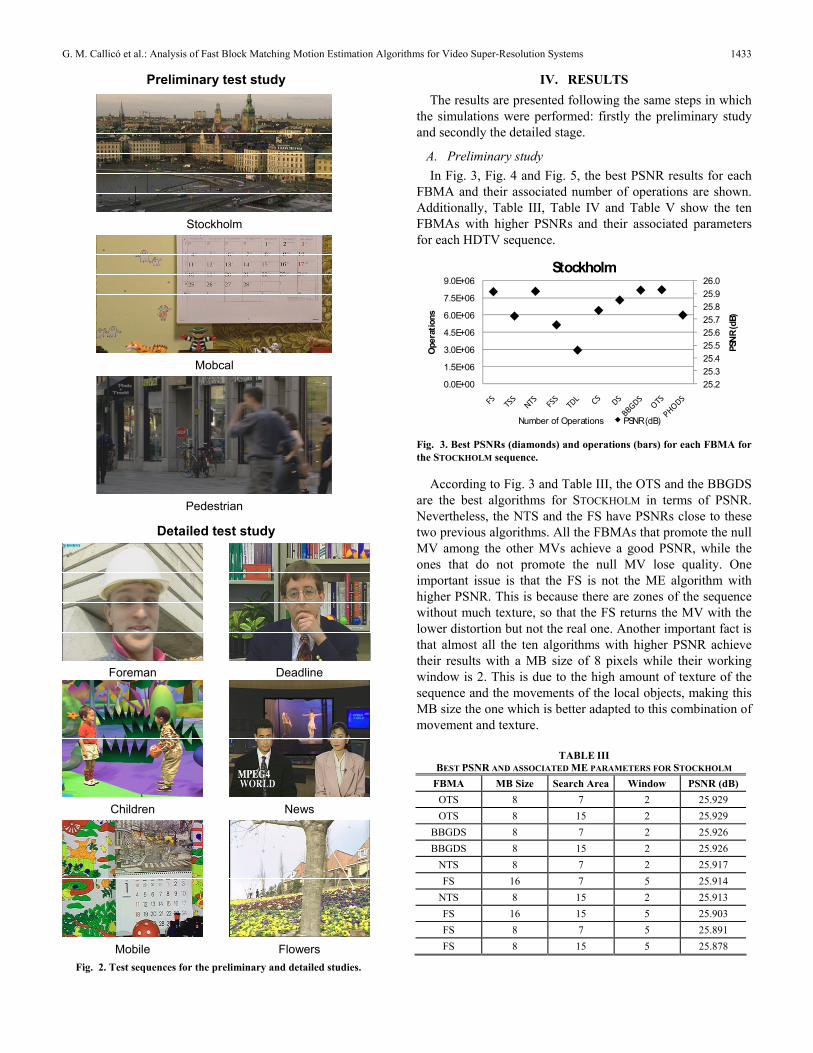
A. Preliminary study In Fig. 3, Fig. 4 and Fig. 5, the best PSNR results for each
FBMA and their associated number of operations are shown. Additionally, Table III, Table IV and Table V show the ten FBMAs with higher PSNRs and their associated parameters for each HDTV sequence.
25.225.325.425.525.625.725.825.926.0
0.0E+00
1.5E+06
3.0E+06
4.5E+06
6.0E+06
7.5E+06
9.0E+06
PSN
R (d
B)
Oper
atio
ns
Stockholm
Number of Operations PSNR (dB)
Fig. 3. Best PSNRs (diamonds) and operations (bars) for each FBMA for the STOCKHOLM sequence.
According to Fig. 3 and Table III, the OTS and the BBGDS are the best algorithms for STOCKHOLM in terms of PSNR. Nevertheless, the NTS and the FS have PSNRs close to these two previous algorithms. All the FBMAs that promote the null MV among the other MVs achieve a good PSNR, while the ones that do not promote the null MV lose quality. One important issue is that the FS is not the ME algorithm with higher PSNR. This is because there are zones of the sequence without much texture, so that the FS returns the MV with the lower distortion but not the real one. Another important fact is that almost all the ten algorithms with higher PSNR achieve their results with a MB size of 8 pixels while their working window is 2. This is due to the high amount of texture of the sequence and the movements of the local objects, making this MB size the one which is better adapted to this combination of movement and texture.
TABLE III
BEST PSNR AND ASSOCIATED ME PARAMETERS FOR STOCKHOLM FBMA MB Size Search Area Window PSNR (dB)
OTS 8 7 2 25.929 OTS 8 15 2 25.929
BBGDS 8 7 2 25.926 BBGDS 8 15 2 25.926
NTS 8 7 2 25.917 FS 16 7 5 25.914
NTS 8 15 2 25.913 FS 16 15 5 25.903 FS 8 7 5 25.891 FS 8 15 5 25.878

IEEE Transactions on Consumer Electronics, Vol. 54, No. 3, AUGUST 2008 1434
The computational load for each FBMA is also shown in Fig. 3 for STOCKHOLM, where the FS clearly has the higher computational load and needs more than four times the average number of operations needed by the other FBMAs.
27.0
27.5
28.0
28.5
29.0
29.5
0.0E+00
2.7E+05
5.3E+05
8.0E+05
1.1E+06
1.3E+06
1.6E+06
PSNR
(dB)
Oper
atio
ns
Mobcal
Number of Operations PSNR (dB)
Fig. 4. Best PSNRs (diamonds) and operations (bars) for each FBMA in the MOBCAL sequence.
TABLE IV BEST PSNR AND ASSOCIATES ME PARAMETERS FOR MOBCAL
FBMA MB Size Search Area Window PSNR (dB) BBGDS 32 7 2 29.182 BBGDS 32 15 2 29.182
OTS 32 7 2 29.158 OTS 32 15 2 29.158 NTS 32 7 2 29.129 NTS 32 15 2 29.096 DS 32 15 3 29.082 DS 32 7 3 29.082 DS 32 15 2 29.073 DS 32 7 2 29.072
In MOBCAL, the BBGDS and the OTS are again the FBMAs
with higher PSNRs, followed by the NTS and the DSA. The results for MOBCAL can be seen in Fig. 4 and Table IV. Once again, as it happened with STOCKHOLM, the FBMAs which promote the null MV get better quality and the FS algorithm does not reach the higher PSNR values. The best MB size for MOBCAL is the largest one, i.e. 32, because this sequence has a very uniform movement. In this case, the search area is not a problem because the movements are small, so the MVs are not greater than 7 pixels.
The best FBMA for PEDESTRIAN in terms of PSNR is the FS, closely followed by the TSS and CS. The results for PEDESTRIAN can be seen in Fig. 5 and Table V. In this sequence, the best MB size is 4. This is because of the predominance of local movements and textured objects in the sequence. Moreover, the FS exhibits the best results due to the non-uniformity and the large size of these movements. It causes that the algorithms that trend to stuck near the null MV do not achieve good PSNR values. The search area must be as large as possible, due to the size of the movements, which causes that much more computation will be needed. This is critical for the FS which, in this case, needs more than ten times the operations needed by the rest of the algorithms.
31.532.032.533.033.534.034.535.0
0.0E+00
5.0E+07
1.0E+08
1.5E+08
2.0E+08
2.5E+08
3.0E+08
PSNR
(dB)
Oper
atio
ns
Pedestrian
Number of Operations PSNR (dB)
Fig. 5. Best PSNRs (diamonds) and operations (bars) for each FBMA in the PEDESTRIAN sequence.
TABLE V BEST PSNR AND ASSOCIATES ME PARAMETERS FOR PEDESTRIAN
FBMA MB Size Search Area Window PSNR (dB) FS 4 15 2 34.393 FS 4 15 3 34.329
TSS 4 15 2 34.289 FS 4 7 2 34.281 FS 4 15 5 34.223
TSS 4 15 3 34.137 CS 4 15 2 34.122 FS 4 7 3 34.109
PHODS 4 15 2 34.074 NTS 4 15 2 34.042
As a result of the preliminary study, we can appreciate that
in average the best three FBMAs in terms of quality and computational load are the BBGDS, the OTS, and the NTS. As the BBGDS and the DS are very similar, the DS is chosen for the next stage as it has a lower computational load. Hence, the FBMAs chosen for the detailed study are the DS, the OTS and the NTS.
B. Detailed study Once the best three FBMAs have been chosen in the
preliminary study, a more detailed analysis is carried out. In this case, six CIF test sequences of 100 frames, shown in the bottom of Fig.2, are used. In the next new set of figures, the number of operations of the FS is so large compared with the rest of FBMAs that it has been eliminated to allow a visual comparison among the other FBMAs.
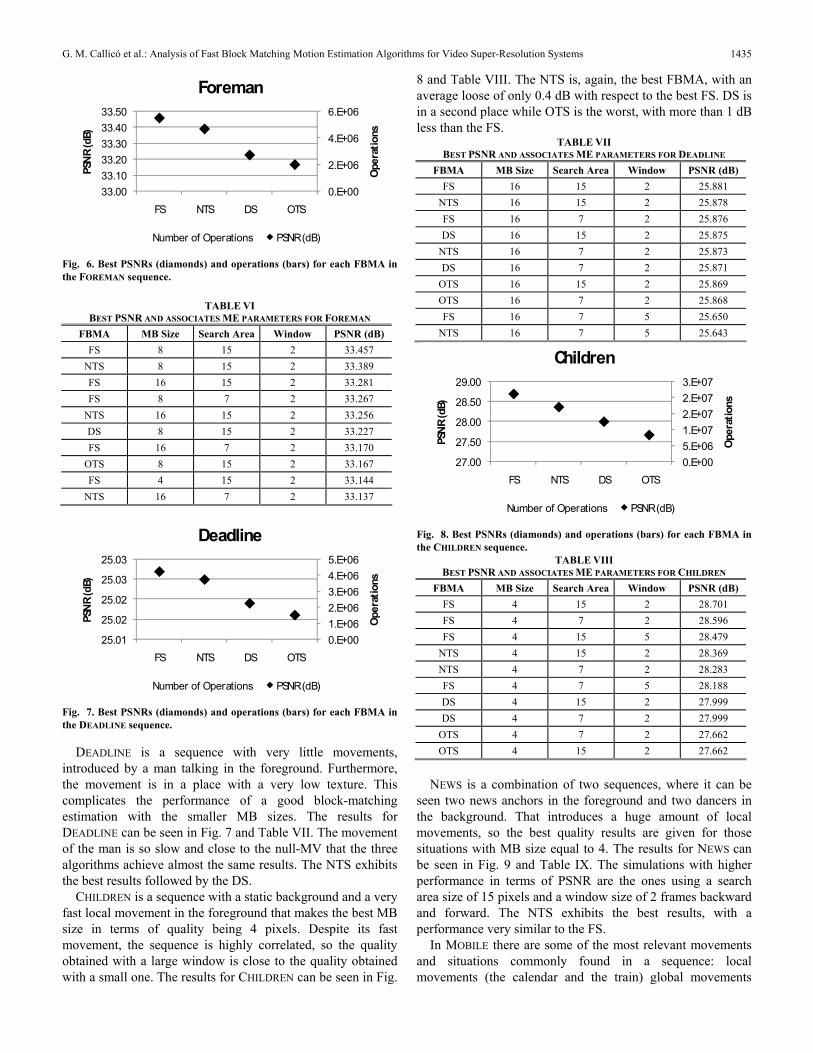
In FOREMAN, a man in the foreground is talking, moving his head in a non-uniform way, while the background is panning. The results for FOREMAN can be seen in Fig. 6 and Table VI. The movements of the head are quite large, thus making it necessary to expand the search area to the maximum allowed. The non-uniform movement produces that the usage of many frames in the SR process introduces higher looses than a smaller window due to the lack of temporal correlation. The best MB size is 8 pixels, which is the intermediate size. This is because in the sequence both classes of movements, local and global as well as low and high textured MBs, are presented. The NTS exhibits the best results with little looses against the FS.
G. M. Callicó et al.: Analysis of Fast Block Matching Motion Estimation Algorithms for Video Super-Resolution Systems 1435
0.E+00
2.E+06
4.E+06
6.E+06
33.0033.1033.2033.3033.4033.50
FS NTS DS OTS
Oper
atio
ns
PSNR
(dB)
Foreman
Number of Operations PSNR (dB)
Fig. 6. Best PSNRs (diamonds) and operations (bars) for each FBMA in the FOREMAN sequence.
TABLE VI
BEST PSNR AND ASSOCIATES ME PARAMETERS FOR FOREMAN FBMA MB Size Search Area Window PSNR (dB)
FS 8 15 2 33.457 NTS 8 15 2 33.389 FS 16 15 2 33.281 FS 8 7 2 33.267
NTS 16 15 2 33.256 DS 8 15 2 33.227 FS 16 7 2 33.170
OTS 8 15 2 33.167 FS 4 15 2 33.144
NTS 16 7 2 33.137
0.E+001.E+062.E+063.E+064.E+065.E+06
25.01
25.02
25.02
25.03
25.03
FS NTS DS OTS
Oper
atio
ns
PSN
R (d
B)
Deadline
Number of Operations PSNR (dB)
Fig. 7. Best PSNRs (diamonds) and operations (bars) for each FBMA in the DEADLINE sequence.
DEADLINE is a sequence with very little movements, introduced by a man talking in the foreground. Furthermore, the movement is in a place with a very low texture. This complicates the performance of a good block-matching estimation with the smaller MB sizes. The results for DEADLINE can be seen in Fig. 7 and Table VII. The movement of the man is so slow and close to the null-MV that the three algorithms achieve almost the same results. The NTS exhibits the best results followed by the DS.
CHILDREN is a sequence with a static background and a very fast local movement in the foreground that makes the best MB size in terms of quality being 4 pixels. Despite its fast movement, the sequence is highly correlated, so the quality obtained with a large window is close to the quality obtained with a small one. The results for CHILDREN can be seen in Fig.
8 and Table VIII. The NTS is, again, the best FBMA, with an average loose of only 0.4 dB with respect to the best FS. DS is in a second place while OTS is the worst, with more than 1 dB less than the FS.
TABLE VII BEST PSNR AND ASSOCIATES ME PARAMETERS FOR DEADLINE
FBMA MB Size Search Area Window PSNR (dB) FS 16 15 2 25.881
NTS 16 15 2 25.878 FS 16 7 2 25.876 DS 16 15 2 25.875
NTS 16 7 2 25.873 DS 16 7 2 25.871
OTS 16 15 2 25.869 OTS 16 7 2 25.868 FS 16 7 5 25.650
NTS 16 7 5 25.643
0.E+005.E+061.E+072.E+072.E+073.E+07
27.00
27.50
28.00
28.50
29.00
FS NTS DS OTS
Ope
ratio
ns
PSNR
(dB)
Children
Number of Operations PSNR (dB)
Fig. 8. Best PSNRs (diamonds) and operations (bars) for each FBMA in the CHILDREN sequence.
TABLE VIII BEST PSNR AND ASSOCIATES ME PARAMETERS FOR CHILDREN
FBMA MB Size Search Area Window PSNR (dB) FS 4 15 2 28.701 FS 4 7 2 28.596 FS 4 15 5 28.479
NTS 4 15 2 28.369 NTS 4 7 2 28.283 FS 4 7 5 28.188 DS 4 15 2 27.999 DS 4 7 2 27.999
OTS 4 7 2 27.662 OTS 4 15 2 27.662
NEWS is a combination of two sequences, where it can be
seen two news anchors in the foreground and two dancers in the background. That introduces a huge amount of local movements, so the best quality results are given for those situations with MB size equal to 4. The results for NEWS can be seen in Fig. 9 and Table IX. The simulations with higher performance in terms of PSNR are the ones using a search area size of 15 pixels and a window size of 2 frames backward and forward. The NTS exhibits the best results, with a performance very similar to the FS.
In MOBILE there are some of the most relevant movements and situations commonly found in a sequence: local movements (the calendar and the train) global movements

IEEE Transactions on Consumer Electronics, Vol. 54, No. 3, AUGUST 2008 1436
(made by the camera panning), zones with high texture and zones with low texture. All the movements are very slow, so the frames are highly correlated making the best window size to be the largest one. This also produces that the MB size which obtains the best results to be the largest one. The NTS is the FBMA that achieves the best results, loosing less than 0.03 dB in average with respect to the FS. All the FBMAs get in general a good MV estimation, making the losses close to null. The results obtained for MOBILE are shown in Fig. 10 and Table X.
0.E+005.E+061.E+072.E+072.E+073.E+07
28.25
28.30
28.35
28.40
FS NTS DS OTSOp
erat
ions
PSNR
(dB)
News
Number of Operations PSNR (dB)
Fig. 9. Best PSNRs (diamonds) and operations (bars) for each FBMA in the NEWS sequence.
TABLE IX BEST PSNR AND ASSOCIATES ME PARAMETERS FOR NEWS
FBMA MB Size Search Area Window PSNR (dB) FS 4 15 2 28.371 FS 4 7 2 28.361
NTS 4 15 2 28.347 NTS 4 7 2 28.34 DS 4 7 2 28.322 DS 4 15 2 28.319 FS 4 15 5 28.304
OTS 4 7 2 28.304 OTS 4 15 2 28.296 FS 4 7 5 28.276
Finally, FLOWERS is dominated by a very patterned texture
and global movements with some occlusions. The FS exhibits great differences against the FBMAs which have almost the same quality. The DS outperforms the NTS for the first time, but with a difference of only 0.004 dB. The results obtained for FLOWERS are shown in Fig. 10 and Table X.
It is noticeable that the average quality (measured as the PSNR) obtained for the CIF test sequences is significantly lower than the one obtained for the HDTV test sequences. This fact appears as a consequence of the test setup used in this work for the evaluation of the different FBMAs, where decimation is applied at the beginning of the process in order to enable a quantitative comparison between the interpolated and the super-resolved video sequence. Obviously, the process of halving the input video sequence in both dimensions has a stronger impact in a CIF sequence than in a HDTV sequence, since the ‘information’ carried out by each pixel of the original sequence is bigger in the first case than in the latter. However, although the PSNR obtained for the CIF test
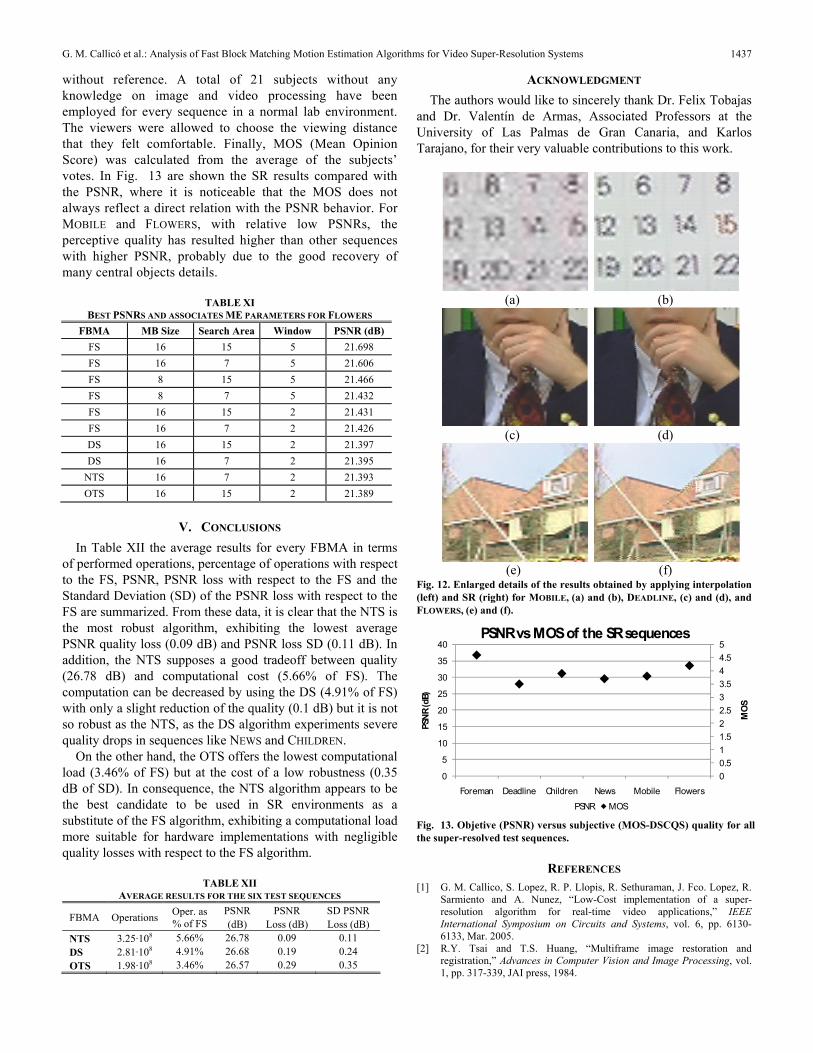
sequences is small (especially for FLOWERS, DEADLINE and MOBILE) the differences obtained in the subjective quality between the super-resolved and the interpolated video sequences are considerable. In this sense, Fig. 12 shows enlarged details of the three aforementioned CIF sequences after the interpolation and the super-resolution process when applying the NTS algorithm, demonstrating the huge performance differences between both methods, and thus, the suitability of the proposed SR algorithm for typical video consumer applications.
0.E+005.E+051.E+062.E+062.E+063.E+06
23.00
23.10
23.20
23.30
23.40
FS NTS DS OTS
Ope
ratio
ns
PSNR
(dB)
Mobile
Number of Operations PSNR (dB)
Fig. 10. Best PSNRs (diamonds) and operations (bars) for each FBMA in the MOBILE sequence.
TABLE X BEST PSNR AND ASSOCIATES ME PARAMETERS FOR MOBILE
FBMA MB Size Search Area Window PSNR (dB) FS 16 7 5 23.339
NTS 16 7 5 23.305 NTS 16 15 5 23.291 DS 16 15 5 23.252 DS 16 7 5 23.25 FS 16 15 5 23.221
OTS 16 7 2 23.127 OTS 16 15 2 23.127 NTS 16 7 2 23.122 NTS 16 15 2 23.107
0.E+002.E+054.E+056.E+058.E+051.E+06
21.2021.3021.4021.5021.6021.7021.80
FS NTS DS OTS
Ope
ratio
ns
PSN
R (d
B)
Flowers
Number of Operations PSNR (dB)Fig. 11. Best PSNRs (diamonds) and operations (bars) for each FBMA in the FLOWERS sequence.
Subjective assessment of visual quality has been performed
by means of the ITU-R Rec.500 [21]. Although this standard is mainly intended for broadcast television, the standard for subjective testing of non-broadcast video [22] is less mature than the methods for broadcast video. Double-Stimulus Continuous Quality Scale (DSCQS) method is used, but
G. M. Callicó et al.: Analysis of Fast Block Matching Motion Estimation Algorithms for Video Super-Resolution Systems 1437
without reference. A total of 21 subjects without any knowledge on image and video processing have been employed for every sequence in a normal lab environment. The viewers were allowed to choose the viewing distance that they felt comfortable. Finally, MOS (Mean Opinion Score) was calculated from the average of the subjects’ votes. In Fig. 13 are shown the SR results compared with the PSNR, where it is noticeable that the MOS does not always reflect a direct relation with the PSNR behavior. For MOBILE and FLOWERS, with relative low PSNRs, the perceptive quality has resulted higher than other sequences with higher PSNR, probably due to the good recovery of many central objects details.
TABLE XI BEST PSNRS AND ASSOCIATES ME PARAMETERS FOR FLOWERS
FBMA MB Size Search Area Window PSNR (dB) FS 16 15 5 21.698 FS 16 7 5 21.606 FS 8 15 5 21.466 FS 8 7 5 21.432 FS 16 15 2 21.431 FS 16 7 2 21.426 DS 16 15 2 21.397 DS 16 7 2 21.395
NTS 16 7 2 21.393 OTS 16 15 2 21.389
V. CONCLUSIONS In Table XII the average results for every FBMA in terms
of performed operations, percentage of operations with respect to the FS, PSNR, PSNR loss with respect to the FS and the Standard Deviation (SD) of the PSNR loss with respect to the FS are summarized. From these data, it is clear that the NTS is the most robust algorithm, exhibiting the lowest average PSNR quality loss (0.09 dB) and PSNR loss SD (0.11 dB). In addition, the NTS supposes a good tradeoff between quality (26.78 dB) and computational cost (5.66% of FS). The computation can be decreased by using the DS (4.91% of FS) with only a slight reduction of the quality (0.1 dB) but it is not so robust as the NTS, as the DS algorithm experiments severe quality drops in sequences like NEWS and CHILDREN.
On the other hand, the OTS offers the lowest computational load (3.46% of FS) but at the cost of a low robustness (0.35 dB of SD). In consequence, the NTS algorithm appears to be the best candidate to be used in SR environments as a substitute of the FS algorithm, exhibiting a computational load more suitable for hardware implementations with negligible quality losses with respect to the FS algorithm.
TABLE XII
AVERAGE RESULTS FOR THE SIX TEST SEQUENCES
FBMA Operations Oper. as % of FS
PSNR (dB)
PSNR Loss (dB)
SD PSNR Loss (dB)
NTS 3.25·108 5.66% 26.78 0.09 0.11 DS 2.81·108 4.91% 26.68 0.19 0.24 OTS 1.98·108 3.46% 26.57 0.29 0.35
ACKNOWLEDGMENT The authors would like to sincerely thank Dr. Felix Tobajas
and Dr. Valentín de Armas, Associated Professors at the University of Las Palmas de Gran Canaria, and Karlos Tarajano, for their very valuable contributions to this work.
(a) (b)
(c) (d)
(e) (f)
Fig. 12. Enlarged details of the results obtained by applying interpolation (left) and SR (right) for MOBILE, (a) and (b), DEADLINE, (c) and (d), and FLOWERS, (e) and (f).
00.511.522.533.544.55
0
5
10
15
20
25
30
35
40
Foreman Deadline Children News Mobile Flowers
MO
S
PSNR
(dB)
PSNR vs MOS of the SR sequences
PSNR MOS Fig. 13. Objetive (PSNR) versus subjective (MOS-DSCQS) quality for all the super-resolved test sequences.
REFERENCES [1] G. M. Callico, S. Lopez, R. P. Llopis, R. Sethuraman, J. Fco. Lopez, R.
Sarmiento and A. Nunez, “Low-Cost implementation of a super-resolution algorithm for real-time video applications,” IEEE International Symposium on Circuits and Systems, vol. 6, pp. 6130-6133, Mar. 2005.
[2] R.Y. Tsai and T.S. Huang, “Multiframe image restoration and registration,” Advances in Computer Vision and Image Processing, vol. 1, pp. 317-339, JAI press, 1984.

IEEE Transactions on Consumer Electronics, Vol. 54, No. 3, AUGUST 2008 1438
[3] M. Elad and Y. Hel-Or, “A fast super-resolution reconstruction algorithm for pure translational motion and common space-invariant blur,” IEEE Trans. on Image Processing, vol. 10, no. 8, pp. 1187-1193, Aug. 2001.
[4] K. Schutte and A.M. Vossepoel, “Accurate mosaicking of scanned maps, or how to generate a virtual A0 scanner”, Proc. of ASCI’95, pp. 353-359, 1995.
[5] L.G.Brown, “A survey of image registration techniques,” ACM Computing Surveys, no. 14, no. 4, pp. 325-376, 1992.
[6] B. Zitova and J. Flusser, “Image registration methods: a survey,” Image and Vision Computing, vol. 21, no. 11, pp. 977-1000, 2003.
[7] R. Hartley and Z. Zisserman, Multiple view geometry in computer vision, Cambridge University Press, 2nd edition, 2003.
[8] B.D. Lucas and T.Kanade, “An iterative image registration technique with an application to stereo vision,” Proc. of DARPA’81, pp. 121-130, 1981.
[9] T.Q.Pham, M. Bezuijen, L.J.van Vliet, K. Schutte and C.L. Luengo Hendriks, “Performance of optimal registration estimators,” Visual Information Processing XIV, vol. 5817 of SPIE, pp. 133-144, 2005.
[10] B.Furth, J. Greenberg, R. Westwater, Motion Estimation algorithms for video compression, Kluwer Academic Publishers, 1997.
[11] G. M. Callico, R. P. Llopis, S. López, José Fco. López, A. Nunez, R. Sethuraman, R. Sarmiento, “Low-cost super-resolution algorithms implementation over a HW/SW video compression platform,” EURASIP Journal on Applied Signal Processing, Special Issue on Super-Resolution, vol. 2006, num. 10, 2006.
[12] T. Koga, K. Iinuma, A. Hirano, Y. Iijima, and T. Ishiguro, “Motion-compensated interframe coding for video conferencing,” Proceedings of the National Telecommunications Conference (NTC), Dec. 1981.
[13] R. Li, B. Zeng, and M. L. Liou, “A new three-step search algorithm for block motion estimation,” IEEE Transactions on Circuits and Systems for Video Technology, vol. 4, no.4, pp. 438-442, Aug. 1994.
[14] L. Po and W. Ma, “A novel four-step search algorithm for fast block motion estimation,” IEEE Transactions on Circuits and Systems for Video Technology, vol. 6, no. 3, pp. 313–317, Jun. 1996.
[15] J.R. Jain and A.K. Jain, “Displacement measurement and its application in interframe image coding,” IEEE Transactions on Communications, vol. 29, no. 12, pp. 1799-1808, Dec. 1981.
[16] M. Ghanbari, “The cross-search algorithm for motion estimation,” IEEE Transactions on Communications, vol. 38, no. 7, pp.950–953, July 1990.
[17] S. Zhu and K.K. Ma, “A new diamond search algorithm for fast block matching motion estimation,” IEEE Transactions on Image Processing, vol. 9, no. 2, pp. 287–290, Feb. 2000.
[18] Lurng-Kuo Liu and Ephraim Feig, “A block-based gradient descent search algorithm for block motion estimation in video coding,” IEEE Transactions on Circuits and Systems for Video Technology, vol. 6, no. 4, pp. 419–422, Aug. 1996.
[19] R. Srinivasan and K. Rao, “Predictive coding based on efficient motion estimation,” IEEE Transactions on Communications, vol. 33, no. 8, pp. 888–896, Aug. 1985.
[20] E. Chan, A. Rodriguez, R. Gandhi, and S. Panchanathan, “Experiments on block matching techniques for video coding,” Multimedia Systems, vol. 24, pp. 228-241, 1994.
[21] “Methodology for the subjective assessment of the quality of television pictures”, ITU-R Recommendation BT.500-11, 2002.
[22] “Subjective video quality assessment methods for multimedia applications”, ITU-T Recommendations P.910, September 1999.
Gustavo M. Callicó was born in Granada, Spain, in 1970. He received the Telecommunication Engineer degree in 1995 and the Ph.D. degree and the European Doctorate in 2003, all from the University of Las Palmas de Gran Canaria (ULPGC) and all with honours. From 1996 to 1997 he was granted with a research grant from the Educational Minister and in 1997 he was hired by the university as an electronic lecturer. In 1994 he joined the
Institute for Applied Microelectronics (IUMA) and from 2000 to 2001 he stayed at the Philips Research Laboratories (NatLab) in Eindhoven, The Netherlands, as a visiting scientist, where he developed his Ph.D. thesis. He is actually an Assistant Professor at the ULPGC and develops his research activities in the Integrated Systems Design Division of the IUMA. He has more than 50 publications in national and international journals and conferences and has participated in 16 research projects funded by the European Community, the Spanish Government and international private industries. His current research fields include real-time super-resolution algorithms, synthesis-based design for SOCs, and circuits for multimedia processing and video coding standards, especially H.264.
Sebastián López was born in Las Palmas de Gran Canaria, Spain, in 1978. He received the Electronic Engineer degree by the University of La Laguna in 2001, obtaining regional and national awards for his CV during his degree. He got his PhD degree by the University of Las Palmas de Gran Canaria in 2006, where he is actually an Assistant Professor, developing his research activities at the Integrated Systems Design Division of Institute for
Applied Microelectronics (IUMA). Since 2008 he is a member of the IEEE Consumer Electronics Society as well as a member of technical program committee of the IEEE International Conference on Consumer Electronics Additionally, he currently serves as an active reviewer of the IEEE Transactions on Circuits and Systems for Video Technology and the Journal of Real Time Image Processing, as well as a member of the Publications Review Committee of the IEEE Transactions on Consumer Electronics. His research interests include motion estimation algorithms and architectures, real-time super-resolution systems, video coding standards and reconfigurable architectures.
Oliver Sosa was born in Telde (Gran Canaria), Spain, in 1984. He received the Telecommunication Engineer degree in 2007 from the University of Las Palmas de Gran Canaria (ULPGC) with honours and currently is working towrds his PhD degree. In 2006 he joined the Integrated Systems Division (DSI) of the Research Institute for Applied Microelectronics (IUMA), where he developed his Master Thesis. He is actually developing
his research activities in the DSI. His current research fields include image processing techniques, especially real-time super-resolution and image registration algorithms, and video coding standards.
José Fco. López obtained the five years degree in Physics (specialized in Electronics) from the University of Seville, Spain, in 1989. Since then, he has conducted his investigations at the Research Institute for Applied Microelectronics (IUMA), where he is part of the Integrated Systems Design Division. In 1994, he obtained the PhD degree, being awarded by the ULPGC for his research in the field of High Speed Integrated Circuits.
Dr. López was with Thomson Composants Microondes (now United Monolithic Semiconductor, UMS), Orsay, France, in 1992. In 1995 he was with the "Center for Broadband Telecommunications" at the Technical University of Denmark (DTU) and in 1996, 1997, 1999 and 2000 he was funded by the Edith Cowan University (ECU), Perth, Western Australia, to make research on low power, high performance integrated circuits and image processing. Dr. López has being actively enrolled in more than 15 research projects funded by the European Community, Spanish Government and international private industries. He has written around 70 papers in national and international journals and conferences.
Roberto Sarmiento is Full-Professor at the Telecommunication Engineering School at University of Las Palmas de Gran Canaria, Spain, in the area of Electronic Engineering. In 1993, he was a Visiting Professor at the University of Adelaida, South Australia, and later at the University of Edith Cowan, also in Australia. He is a founder of the Research Institute for Applied Microelectronics (IUMA) and Director of the
Integrated Systems Design Division of this Institute. Since 1990 he has published over 30 journal papers and book chapters and more than 100 conference papers. Roberto Sarmiento has been awarded with three six years research periods by the National Agency for the Research Activity Evaluation in Spain. He has participated in more than 35 projects and research programmes funded by public and private organizations, from which he has been leader researcher in 15 of them.