Cancer genetics-guided discovery of serum biomarker signatures for diagnosis and prognosis of...
6
Cancer genetics-guided discovery of serum biomarker signatures for diagnosis and prognosis of prostate cancer Igor Cima a,1 , Ralph Schiess b,1 , Peter Wild c , Martin Kaelin d , Peter Schüffler e , Vinzenz Lange b , Paola Picotti b , Reto Ossola b , Arnoud Templeton d , Olga Schubert a , Thomas Fuchs e , Thomas Leippold f , Stephen Wyler f , Jens Zehetner a , Wolfram Jochum g , Joachim Buhmann e , Thomas Cerny d , Holger Moch c,2 , Silke Gillessen d,2 , Ruedi Aebersold b,h,2 , and Wilhelm Krek a,2 a Institute of Cell Biology and b Institute of Molecular Systems Biology, Eidgenössische Technische Hochschule Zurich, 8093 Zurich, Switzerland; c Institute of Surgical Pathology, University Hospital Zurich, 8091 Zurich, Switzerland; d Department of Medical Oncology, f Department of Urology, and g Institute of Pathology, Kantonsspital St. Gallen, 9007 St. Gallen, Switzerland; e Department of Computer Science, Eidgenössische Technische Hochschule Zurich, 8092 Zurich, Switzerland; and h Faculty of Science, University of Zurich, 8057 Zurich, Switzerland Edited by Owen N. Witte, The Howard Hughes Medical Institute, University of California, Los Angeles, CA, and approved January 12, 2011 (received for review September 25, 2010) A key barrier to the realization of personalized medicine for cancer is the identification of biomarkers. Here we describe a two-stage strategy for the discovery of serum biomarker signatures corre- sponding to specific cancer-causing mutations and its application to prostate cancer (PCa) in the context of the commonly occurring phosphatase and tensin homolog (PTEN) tumor-suppressor gene inactivation. In the first stage of our approach, we identified 775 N-linked glycoproteins from sera and prostate tissue of wild-type and Pten-null mice. Using label-free quantitative proteomics, we showed that Pten inactivation leads to measurable perturbations in the murine prostate and serum glycoproteome. Following bio- informatic prioritization, in a second stage we applied targeted proteomics to detect and quantify 39 human ortholog candidate biomarkers in the sera of PCa patients and control individuals. The resulting proteomic profiles were analyzed by machine learning to build predictive regression models for tissue PTEN status and diagnosis and grading of PCa. Our approach suggests a general path to rational cancer biomarker discovery and initial validation guided by cancer genetics and based on the integration of exper- imental mouse models, proteomics-based technologies, and com- putational modeling. serum biomarkers | mass spectrometry | Pten conditional knockout mouse model M olecular and genetic biomarkers play a paramount role in clinical oncology. They can help predict who will develop cancer or detect the disease at an early stage. Biomarkers also can guide treatment decisions and help identify subpopulations of patients who are most likely to respond to a specific therapy (1, 2). However, the noninvasive detection and prognostic eval- uation of a specific tumor by the analysis of indicators in body fluids such as serum remains a formidable challenge. Novel biomarkers represent today an urgent and critical medical need. Serum has long been considered a rich source for biomarkers (3). However, the discovery of serum biomarkers has been technically challenging and ineffectual for reasons that include the particular and variable composition of the serum proteome and its enormous complexity (4). As the genetic alterations that cause cancer are becoming better understood, one strategy to overcome the limitations of the traditional serum proteome comparisons is to use the knowledge about specific cancer- causing mutations and the underlying disrupted signaling path- ways to guide the discovery of novel cancer serum biomarkers. The tumor-suppressor gene phosphatase and tensin homolog (PTEN) is one of the most commonly inactivated genes in hu- man cancer and has been identified as lost or mutated in several sporadic cancers, including endometrial carcinoma, glioblastoma, breast cancer, and prostate cancer (5). An established conse- quence of PTEN inactivation is the constitutive aberrant activa- tion of the PI3K-signaling pathway that drives uncontrolled cell growth, proliferation, and survival (6, 7). It is expected that specific signaling pathway-activating mutations such as PTEN loss will produce changes in the surface and secreted proteomes of the affected tissue (8), and, in principle, these changes should be de- tectable as discrete biomarker signatures in the serum. Based on this conceptual consideration, we developed a two-stage strategy for the discovery and initial validation of serum biomarkers in humans based on a mouse model of prostate cancer (PCa) pro- gression caused by Pten inactivation. Results In the first stage of our approach, we identified PCa candidate biomarkers by applying a large-scale quantitative proteomic screen to detect and quantify N-linked glycoproteins that differ in their amount in the prostate tissue and sera of prostatic Pten- deficient PbCre4-Pten fl/fl (Pten cKO) and littermate control ani- mals (9) (Fig. 1A and Fig. S1 A–C). The choice of an experi- mental mouse model as entry point for the identification of candidate biomarkers was guided by the possibility of collecting tissue samples from a genetically defined and homogeneous population in which variables such as environmental factors, age, and tumor type and stage are controlled and standardized. We selectively analyzed N-glycosylated proteins to maximize their subsequent detectability in the serum (10) and to focus on a subproteome that is enriched for validated serum biomarkers. In fact, 30 of the 38 protein biomarkers currently used in the clinic are glycosylated (11). Author contributions: I.C., R.S., W.J., J.B., T.C., H.M., S.G., R.A., and W.K. designed re- search; I.C., R.S., P.W., M.K., P.S., V.L., P.P., R.O., A.T., O.S., T.L., S.W., and J.Z. performed research; I.C., R.S., P.W., M.K., P.S., V.L., and T.F. analyzed data; and I.C., R.S., S.G., R.A., and W.K. wrote the paper. Conflict of interest statement: W.K., R.A., S.G., T.C., I.C., and R.S. are named as coinventors on a patent application related to the use of serum signatures for the diagnosis of prostate cancer. W.K., T.C., R.A., and R.S. are cofounders of ProteoMediX, a spin-off com- pany with the aim of marketing products related to the diagnosis of prostate cancer. W.K., R.A., T.C., and R.S. own shares in ProteoMediX. This article is a PNAS Direct Submission. Freely available online through the PNAS open access option. 1 I.C. and R.S. contributed equally to this work. 2 To whom correspondence may be addressed. E-mail: [email protected], silke.gillessen@ kssg.ch, [email protected], or [email protected]. This article contains supporting information online at www.pnas.org/lookup/suppl/doi:10. 1073/pnas.1013699108/-/DCSupplemental. 3342–3347 | PNAS | February 22, 2011 | vol. 108 | no. 8 www.pnas.org/cgi/doi/10.1073/pnas.1013699108
-
Upload
independent -
Category
Documents
-
view
1 -
download
0
Transcript of Cancer genetics-guided discovery of serum biomarker signatures for diagnosis and prognosis of...
Cancer genetics-guided discovery of serum biomarkersignatures for diagnosis and prognosis ofprostate cancerIgor Cimaa,1, Ralph Schiessb,1, Peter Wildc, Martin Kaelind, Peter Schüfflere, Vinzenz Langeb, Paola Picottib, Reto Ossolab,Arnoud Templetond, Olga Schuberta, Thomas Fuchse, Thomas Leippoldf, Stephen Wylerf, Jens Zehetnera,Wolfram Jochumg, Joachim Buhmanne, Thomas Cernyd, Holger Mochc,2, Silke Gillessend,2, Ruedi Aebersoldb,h,2,and Wilhelm Kreka,2
aInstitute of Cell Biology and bInstitute of Molecular Systems Biology, Eidgenössische Technische Hochschule Zurich, 8093 Zurich, Switzerland; cInstitute ofSurgical Pathology, University Hospital Zurich, 8091 Zurich, Switzerland; dDepartment of Medical Oncology, fDepartment of Urology, and gInstitute ofPathology, Kantonsspital St. Gallen, 9007 St. Gallen, Switzerland; eDepartment of Computer Science, Eidgenössische Technische Hochschule Zurich, 8092Zurich, Switzerland; and hFaculty of Science, University of Zurich, 8057 Zurich, Switzerland
Edited by Owen N. Witte, The Howard Hughes Medical Institute, University of California, Los Angeles, CA, and approved January 12, 2011 (received for reviewSeptember 25, 2010)
A key barrier to the realization of personalized medicine for canceris the identification of biomarkers. Here we describe a two-stagestrategy for the discovery of serum biomarker signatures corre-sponding to specific cancer-causing mutations and its applicationto prostate cancer (PCa) in the context of the commonly occurringphosphatase and tensin homolog (PTEN) tumor-suppressor geneinactivation. In the first stage of our approach, we identified 775N-linked glycoproteins from sera and prostate tissue of wild-typeand Pten-null mice. Using label-free quantitative proteomics, weshowed that Pten inactivation leads to measurable perturbationsin the murine prostate and serum glycoproteome. Following bio-informatic prioritization, in a second stage we applied targetedproteomics to detect and quantify 39 human ortholog candidatebiomarkers in the sera of PCa patients and control individuals. Theresulting proteomic profiles were analyzed by machine learningto build predictive regression models for tissue PTEN status anddiagnosis and grading of PCa. Our approach suggests a generalpath to rational cancer biomarker discovery and initial validationguided by cancer genetics and based on the integration of exper-imental mouse models, proteomics-based technologies, and com-putational modeling.
serum biomarkers | mass spectrometry | Pten conditional knockout mousemodel
Molecular and genetic biomarkers play a paramount role inclinical oncology. They can help predict who will develop
cancer or detect the disease at an early stage. Biomarkers alsocan guide treatment decisions and help identify subpopulationsof patients who are most likely to respond to a specific therapy(1, 2). However, the noninvasive detection and prognostic eval-uation of a specific tumor by the analysis of indicators in bodyfluids such as serum remains a formidable challenge. Novelbiomarkers represent today an urgent and critical medical need.Serum has long been considered a rich source for biomarkers
(3). However, the discovery of serum biomarkers has beentechnically challenging and ineffectual for reasons that includethe particular and variable composition of the serum proteomeand its enormous complexity (4). As the genetic alterations thatcause cancer are becoming better understood, one strategy toovercome the limitations of the traditional serum proteomecomparisons is to use the knowledge about specific cancer-causing mutations and the underlying disrupted signaling path-ways to guide the discovery of novel cancer serum biomarkers.The tumor-suppressor gene phosphatase and tensin homolog
(PTEN) is one of the most commonly inactivated genes in hu-man cancer and has been identified as lost or mutated in severalsporadic cancers, including endometrial carcinoma, glioblastoma,
breast cancer, and prostate cancer (5). An established conse-quence of PTEN inactivation is the constitutive aberrant activa-tion of the PI3K-signaling pathway that drives uncontrolled cellgrowth, proliferation, and survival (6, 7). It is expected that specificsignaling pathway-activating mutations such as PTEN loss willproduce changes in the surface and secreted proteomes of theaffected tissue (8), and, in principle, these changes should be de-tectable as discrete biomarker signatures in the serum. Based onthis conceptual consideration, we developed a two-stage strategyfor the discovery and initial validation of serum biomarkers inhumans based on a mouse model of prostate cancer (PCa) pro-gression caused by Pten inactivation.
ResultsIn the first stage of our approach, we identified PCa candidatebiomarkers by applying a large-scale quantitative proteomicscreen to detect and quantify N-linked glycoproteins that differin their amount in the prostate tissue and sera of prostatic Pten-deficient PbCre4-Ptenfl/fl (Pten cKO) and littermate control ani-mals (9) (Fig. 1A and Fig. S1 A–C). The choice of an experi-mental mouse model as entry point for the identification ofcandidate biomarkers was guided by the possibility of collectingtissue samples from a genetically defined and homogeneouspopulation in which variables such as environmental factors, age,and tumor type and stage are controlled and standardized. Weselectively analyzed N-glycosylated proteins to maximize theirsubsequent detectability in the serum (10) and to focus ona subproteome that is enriched for validated serum biomarkers.In fact, 30 of the 38 protein biomarkers currently used in theclinic are glycosylated (11).
Author contributions: I.C., R.S., W.J., J.B., T.C., H.M., S.G., R.A., and W.K. designed re-search; I.C., R.S., P.W., M.K., P.S., V.L., P.P., R.O., A.T., O.S., T.L., S.W., and J.Z. performedresearch; I.C., R.S., P.W., M.K., P.S., V.L., and T.F. analyzed data; and I.C., R.S., S.G., R.A.,and W.K. wrote the paper.
Conflict of interest statement: W.K., R.A., S.G., T.C., I.C., and R.S. are named as coinventorson a patent application related to the use of serum signatures for the diagnosis ofprostate cancer. W.K., T.C., R.A., and R.S. are cofounders of ProteoMediX, a spin-off com-pany with the aim of marketing products related to the diagnosis of prostate cancer.W.K., R.A., T.C., and R.S. own shares in ProteoMediX.
This article is a PNAS Direct Submission.
Freely available online through the PNAS open access option.1I.C. and R.S. contributed equally to this work.2To whom correspondence may be addressed. E-mail: [email protected], [email protected], [email protected], or [email protected].
This article contains supporting information online at www.pnas.org/lookup/suppl/doi:10.1073/pnas.1013699108/-/DCSupplemental.
3342–3347 | PNAS | February 22, 2011 | vol. 108 | no. 8 www.pnas.org/cgi/doi/10.1073/pnas.1013699108
Purified tissue and serum samples from wild-type and pros-tate-specific Pten cKO animals were subjected to solid-phaseextraction of N-glycopeptides (SPEG) (12). The enriched N-glycosites from each sample were analyzed in duplicate on alinear ion trap quadrupole-Fourier transform (LTQ-FT) massspectrometer. Glycoprotein enrichment in combination withhigh-throughput MS at a false-discovery rate ≤1% resulted in theidentification of a total of 775 glycoproteins (Fig. 2A and DatasetS1). Seventy-seven percent of proteins detected in prostate tissueand up to 92% of proteins identified in serum were manuallyannotated (13) to be secreted, to reside in/on the plasma mem-brane, or to belong to the secretory or lysosomal compartments,indicating strong enrichment for the intended target population(14) (Fig. S1D). Of the 658 proteins identified in the prostatetissue, 152 (23.1%) were identified exclusively in the Pten cKOprostate cancer tissue, and 91 (13.8%) were identified only in thewild-type tissue (Fig. 2A).To detect Pten-dependent changes in the N-glycosite profiles
of prostate tissue and serum respectively, we compared the liquidchromatography (LC)-MS feature maps of the correspondingsamples using the SuperHirn software (15). The ion chromato-grams for each N-glycosite were used subsequently as the basisfor relative label-free quantification of 352 proteins (213 fromtissue, 105 from serum, and 34 from both samples). The relativeamounts of 68 proteins differed significantly in the tissue of PtencKO mice compared with their age-matched controls. In thematched sera only 12 proteins with significantly altered abun-dance were detected (Fig. 2B and Dataset S2), a result that isin agreement with previous ineffective direct serum–proteomecomparisons. Spectral counting (16) confirmed the quantitativedata derived from the ion counts and identified a further 43proteins with significantly altered abundance between Pten cKOand wild-type prostate tissue (Dataset S2). Moreover, immuno-blotting and immunofluorescence microscopy of selected glyco-sylated proteins verified the quantitative MS data (Fig. 2 C andD). Interestingly, our tissue glycoprotein screen identified dif-
ferential expression of proteins known to be associated withdifferentiation and the stem cell phenotype (Fig. 2D). Furtheranalyses of differentiation and stem cell markers confirmed thishypothesis (Fig S1 D and E), in agreement with previous reports(17) that implicate a role for PTEN in differentiation and stemcell homeostasis during PCa progression. The candidate bio-marker list was analyzed further based on a series of three cri-teria: Pten dependency, prostate specificity, and detectability inserum. This analysis resulted in a list of 126 proteins (DatasetS2), which is expected to contain one or more specific candidatebiomarker signatures that mirror PTEN-loss in human PCa.Therefore, in the second stage of our approach we tested
whether PTEN-inactivation in human PCa is associated witha specific serum signature (Fig. 1B). Between the years 2004 and2007, using a standardized protocol, we collected prostate tissuesamples of consenting patients who underwent biopsy, radicalprostatectomy, or transurethral resection because of PCa andmatched sera from a single source. We collected sera froma total of 143 patients. As control group (n = 66; median age =65.7 y; range, 50.8–90.26 y), we selected patients with histologi-cally confirmed benign prostatic hyperplasia (BPH). The PCagroup (n = 77; median age = 67.7 y; range, 49.1–89.4 y) hadhistologically confirmed localized PCa (locPCa). Patients withother malignancies or with chronic or acute inflammatory con-ditions and patients with advanced prostate cancer were excludedfrom our analysis. From 99 patients (BPH, n = 40; locPCa, n =59) we had also access to the corresponding prostate tissue sam-ples. Of these, 92 samples (BPH, n = 40; locPCa, n = 52) werespotted on a tissue microarray (referred to thereafter as TMA-P92) for genetic and immunohistochemical analyses (Fig. S2A).We analyzed the epithelial PTEN status by dual-color FISH on
the TMA-P92 by calculating the percentage of epithelial cellsthat lost at least one PTEN gene copy number on each spot. Tothis end we compared PTEN gene copy numbers with total
Prostate(n=99)
Serum(n=143)
Serum (n=8)
Prostate (n=8)
LC-MS/(MS), label-free
quantification
N-glycositeextraction
Candidate Biomarkers
Verification, Filtering
Featureselection
(Random Forest)
Biobanking Processing Quantification Modeling
Targetedquantitativeproteomics
N-glycositeextraction
Tissue microarray
FISH and Immuno-
histochemistry
Hypothesis generation using mouse models
Serum Signatures
Wt and PTEN cKO
BPH and localized prostate cancer
Hypothesis testing in human
Modeling(exhaustive searchtraining-test sets)
A
B
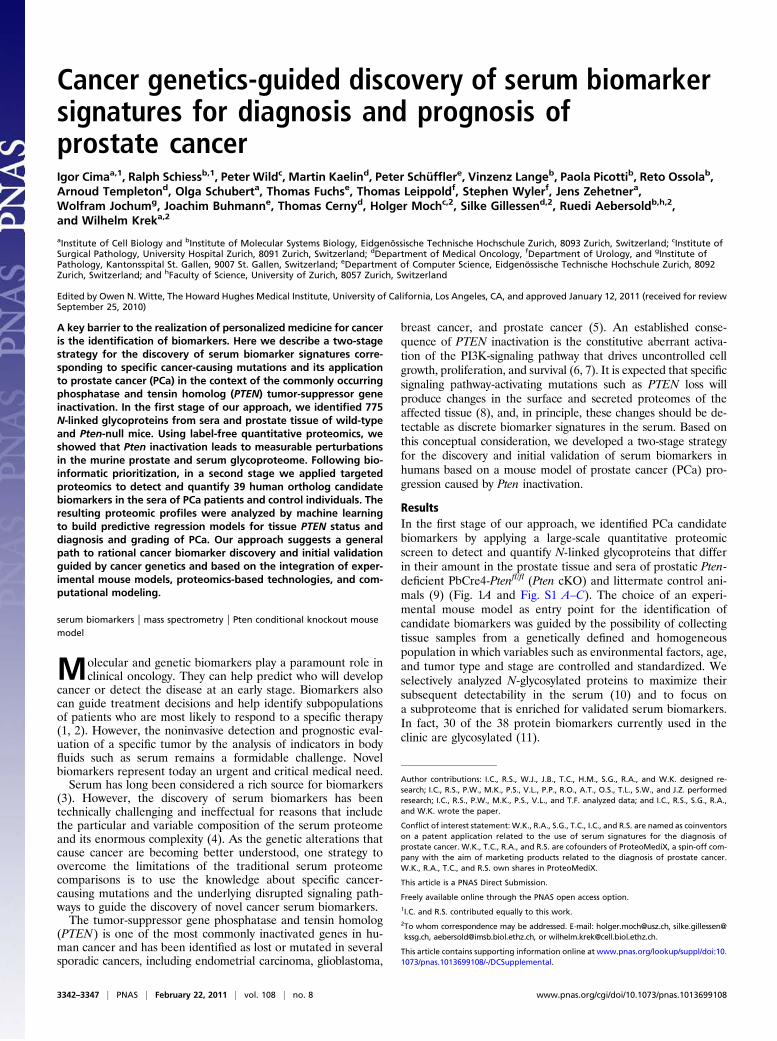
Fig. 1. Translational approach for biomarker discovery and validationworkflow. (A) Candidate biomarkers are discovered using a genetic mousemodel by enriching N-linked glycoproteins to sera and freshly isolated per-fused prostates from wild-type and Pten cKO mice. Tryptic N-glycosites thenare measured by LC-MS/MS. Identification and quantitation of proteins isperformed as described. After a filtering process, candidate biomarkers areselected for the verification phase. (B) Verification phase. Highly standard-ized biobanking and clinical data collection are used for collecting serumand matching tissue samples from patients harboring localized PCa andcontrol patients with BPH. N-linked glycoproteins are extracted as in A, andselected candidates from the discovery phase are measured by targetedproteomics and ELISA. At the same time, tissues are spotted as microarrayand stained for the indicated antigens. Feature selection and modeling thenis performed to find novel biomarkers for diagnosis, patient stratification byGleason score, and PTEN status.
A B
C D
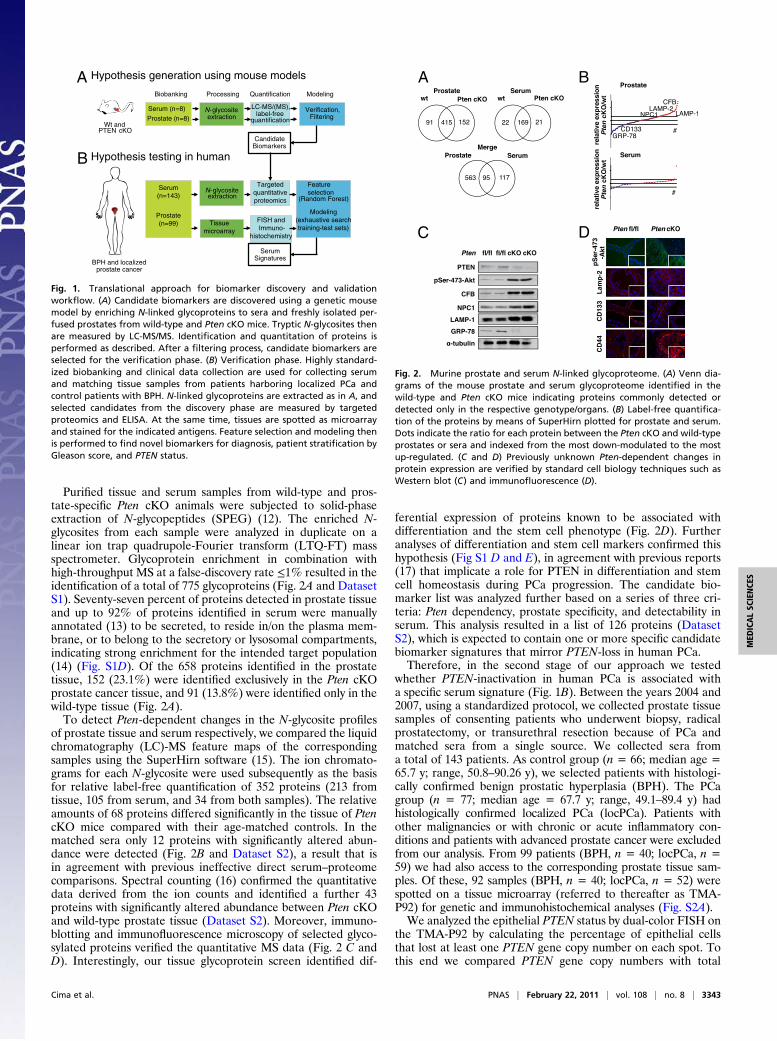
Fig. 2. Murine prostate and serum N-linked glycoproteome. (A) Venn dia-grams of the mouse prostate and serum glycoproteome identified in thewild-type and Pten cKO mice indicating proteins commonly detected ordetected only in the respective genotype/organs. (B) Label-free quantifica-tion of the proteins by means of SuperHirn plotted for prostate and serum.Dots indicate the ratio for each protein between the Pten cKO and wild-typeprostates or sera and indexed from the most down-modulated to the mostup-regulated. (C and D) Previously unknown Pten-dependent changes inprotein expression are verified by standard cell biology techniques such asWestern blot (C) and immunofluorescence (D).
Cima et al. PNAS | February 22, 2011 | vol. 108 | no. 8 | 3343
MED
ICALSC
IENCE
S
chromosome 10 copy numbers per cell using commerciallyavailable fluorescently labeled DNA probes for cytoband 10q23.3and region 10p11.1∼q11.1, respectively. We also stained sectionsfrom the TMA-P92 with antibodies reporting the activation stateof the PI3K-pathway including phospho-serine (pSer)-473-Aktand stathmin (18). Seventy-two percent of prostate cancers dis-played focal loss of PTEN gene copy numbers compared with thecontrol group, indicating deletion of one or both alleles of PTEN(Fig. 3A, and Table S1) in at least 20% of the cells analyzed. Thisresult is in agreement with previous reports using the sametechnique (19, 20). As expected, a significant fraction of thesecancers demonstrated PI3K-pathway activation, as evidenced bythe increased staining of pSer-473-Akt and stathmin (Fig. 3 Band C).Next, we analyzed serum samples from these patients by using
N-glycosite extraction followed by targeted quantitative MS viaselected reaction monitoring (SRM) (21). To this end, we useda hybrid quadrupole/linear ion trap mass spectrometer (22) todetect and quantify 57 N-glycosites, corresponding to 49 candi-date protein biomarkers present on the list of prioritized can-didates. The absolute serum concentrations of these proteins
were determined using stable isotope-labeled reference peptidesas external standards. Of the 57 targeted peptides, 36 peptidesrepresenting 33 different proteins were detected consistently andquantified in 80–105 patients (Dataset S3). The median con-centration of the measured proteins varied from 320 μg/mL to5.5 ng/mL, indicating that our approach allows the quantificationof protein concentrations in sera along six orders of magnitude.The median concentration of various measured proteins wasin the concentration range of prostate-specific antigen (PSA),a widely used diagnostic serum biomarker for prostate cancer.For nine proteins, we also established ELISAs, which confirmedthe validity of the SRM approach for two proteins and providedindependent quantitative data for the other proteins that werenot detected by SRM, thus resulting in a total of 39 proteins thatwere quantified consistently (Dataset S3). Next, we used thisdataset to select the best candidate biomarkers and to buildpredictive models for the discrimination between normal andaberrant PTEN status. First, we applied the random forest (RF)classifier algorithm (23) for variable ranking and subsequentselection. RF is particularly well-suited in this regard, because itdoes not assume that the data are linearly separable. Moreover,the selection of the top-ranked variables reduces the di-mensionality of the feature space and the computing time, thusallowing a subsequent exhaustive screening of the best models.We selected the 20 top-ranked variables resulting from 100 RFs
and screened for all logistic regression models to predict focal lossof PTEN by combining one to five serum proteins. This screeningresulted in 21,699 different models, which were validated by 100-fold bootstrapping (24). For each model we calculated the medianarea under the receiver operating characteristic (ROC) curve(AUC), thereby identifying the best regression models that areable to predict significantly aberrant PTEN status from an over-lapping data set comprising 54 patients derived from the PTENFISH analysis of 82 patients and the SRM and ELISA quantifi-cation of sera from 105 patients (PTEN focal loss <20%: n = 26;PTEN focal loss ≥20%: n = 28) (Fig. S2B). The signature com-prising thrombospondin-1 (THBS1), metalloproteinase inhibitor1 (TIMP-1), complement factor H (CFH), and prolow-densitylipoprotein receptor-related protein 1 (LRP-1) could predict cor-rectly 78% of cases belonging to patients having aberrant ornormal PTEN status with a sensitivity of 79.2% and specificity of76.7% [AUC = 0.82; P = 5.49*10E-5; 95% confidence interval(CI) = 0.704–0.936] (Fig. 3E). Taken together, these results sug-gest that the reduction of PTEN gene copy number in prostatecancer led to a measurable perturbation of the serum proteome.Moreover, they demonstrate the usefulness of computationalvariable selection using RF followed by exhaustive regressionmodel screening as a valid approach to extract information oncandidate biomarkers.To corroborate this analysis, we determined the occurrence of
the 15 RF-selected top-ranked variables in the best 50 boot-strapped models (Fig. 3D). All proteins have been selected inmore than half of all highly predictive models. This approachthus provided the theoretical robustness of discrimination ofindividual candidate biomarkers described in Fig. 3E. To de-termine whether our signature is significantly linked to thePTEN network, we sought curated knowledge-based connectionsbetween our signature and the PTEN network. When testedagainst 50 random signatures, the PTEN signature identifiedhere showed significantly more direct and indirect connections tothe PTEN signaling network, thus providing independent sup-port for our serum signature as a predictor of tissue PTEN status(Fig. S3 A and B). Because PTEN loss is causally associated withaccelerated PCa progression and aggressiveness, as exemplifiedby the association between PTEN loss of function and Gleasonsum score (25, 26), we next asked whether the bioinformaticapproach also could extract serum protein signatures reflectingtumor grading. Examination of our TMA-P92 revealed a corre-
A
pS
er-4
73-A
kt (
stai
nin
g in
ten
sity
) 3.0
2.5
2.0
1.5
1.0
0.5
0.0
locPCaBPH
B
locPCaBPH
Sta
thm
in (
% p
osi
tive
cel
ls)
20
15
10
5
0
C
D Predictor distribution of best 50 models
1-Specificity
Sen
siti
vity
0.0 0.2 0.4 0.6 0.8 1.0
0.0
0.2
0.4
0.6
0.8
1.0E
foca
l PT
EN
loss
(% c
ells
< 2
alle
les
PT
EN
/cel
l)
locPCaBPH
0
20
40
60
80
100
0 10 20 30 40 50
LRP-1
TM9SF3CP
ASPN
ECM1
BGN
CFH
VTN
GOLPH2
ATRN
OLFM4
CADM1
THBS1TIMP-1
LGALS3BP
AUC = 0.82
THBS1, TIMP-1, CFH, LRP-1
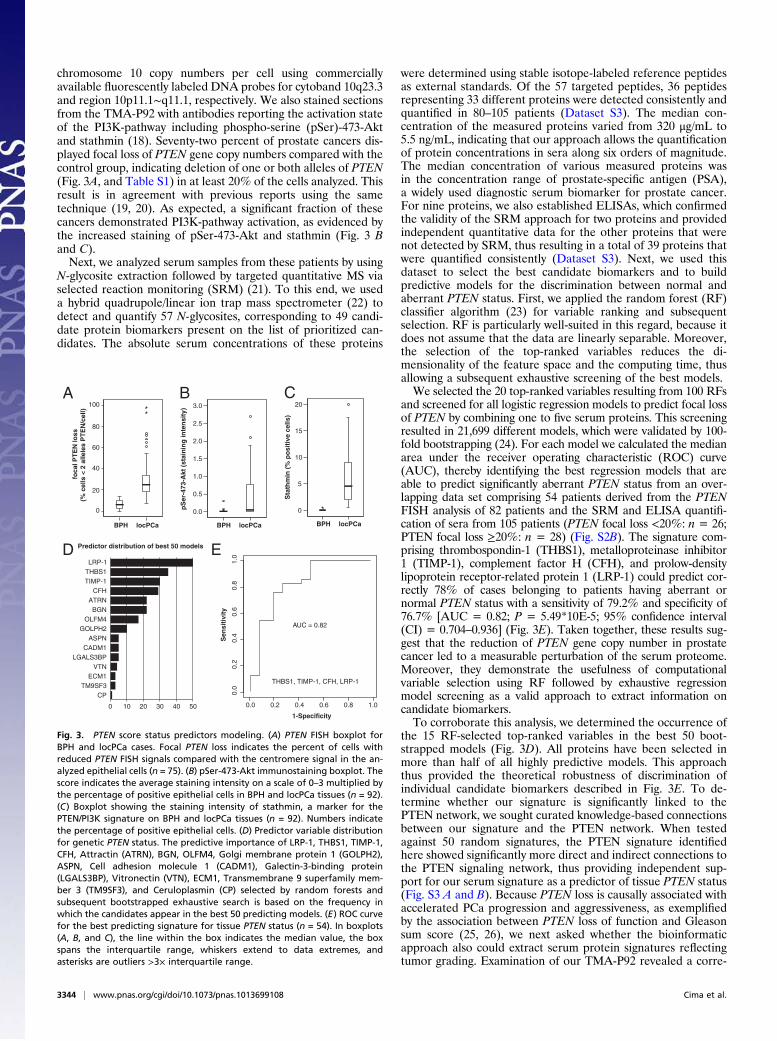
Fig. 3. PTEN score status predictors modeling. (A) PTEN FISH boxplot forBPH and locPCa cases. Focal PTEN loss indicates the percent of cells withreduced PTEN FISH signals compared with the centromere signal in the an-alyzed epithelial cells (n = 75). (B) pSer-473-Akt immunostaining boxplot. Thescore indicates the average staining intensity on a scale of 0–3 multiplied bythe percentage of positive epithelial cells in BPH and locPCa tissues (n = 92).(C) Boxplot showing the staining intensity of stathmin, a marker for thePTEN/PI3K signature on BPH and locPCa tissues (n = 92). Numbers indicatethe percentage of positive epithelial cells. (D) Predictor variable distributionfor genetic PTEN status. The predictive importance of LRP-1, THBS1, TIMP-1,CFH, Attractin (ATRN), BGN, OLFM4, Golgi membrane protein 1 (GOLPH2),ASPN, Cell adhesion molecule 1 (CADM1), Galectin-3-binding protein(LGALS3BP), Vitronectin (VTN), ECM1, Transmembrane 9 superfamily mem-ber 3 (TM9SF3), and Ceruloplasmin (CP) selected by random forests andsubsequent bootstrapped exhaustive search is based on the frequency inwhich the candidates appear in the best 50 predicting models. (E) ROC curvefor the best predicting signature for tissue PTEN status (n = 54). In boxplots(A, B, and C), the line within the box indicates the median value, the boxspans the interquartile range, whiskers extend to data extremes, andasterisks are outliers >3× interquartile range.
3344 | www.pnas.org/cgi/doi/10.1073/pnas.1013699108 Cima et al.
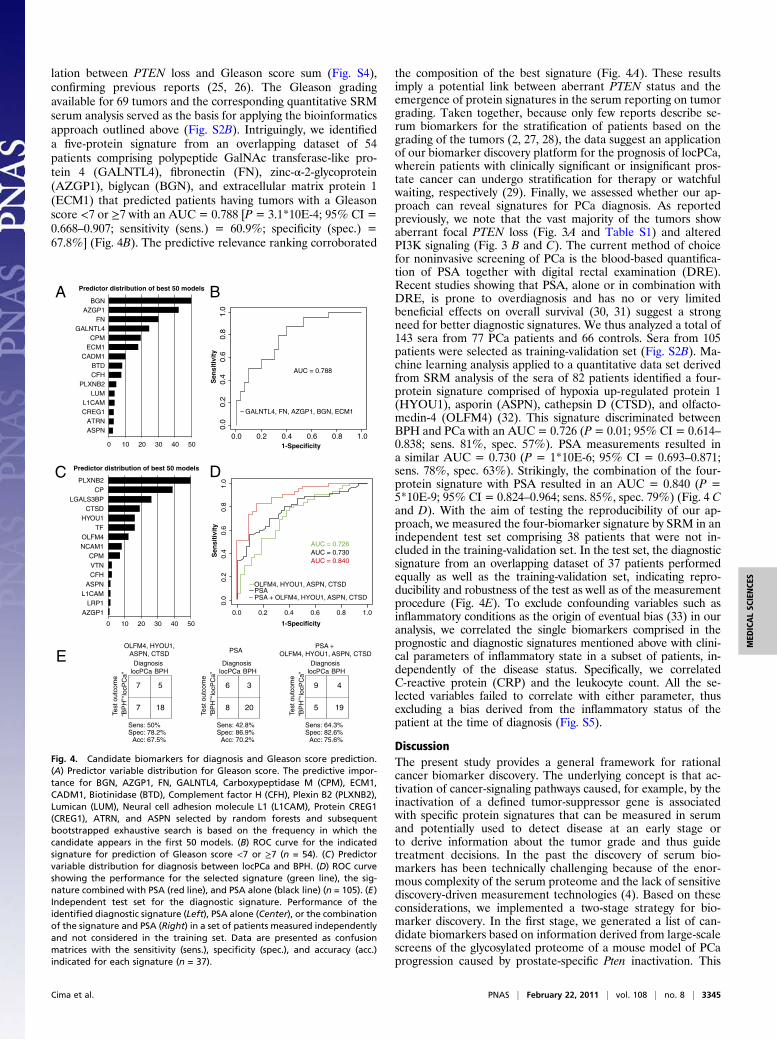
lation between PTEN loss and Gleason score sum (Fig. S4),confirming previous reports (25, 26). The Gleason gradingavailable for 69 tumors and the corresponding quantitative SRMserum analysis served as the basis for applying the bioinformaticsapproach outlined above (Fig. S2B). Intriguingly, we identifieda five-protein signature from an overlapping dataset of 54patients comprising polypeptide GalNAc transferase-like pro-tein 4 (GALNTL4), fibronectin (FN), zinc-α-2-glycoprotein(AZGP1), biglycan (BGN), and extracellular matrix protein 1(ECM1) that predicted patients having tumors with a Gleasonscore <7 or ≥7 with an AUC = 0.788 [P = 3.1*10E-4; 95% CI =0.668–0.907; sensitivity (sens.) = 60.9%; specificity (spec.) =67.8%] (Fig. 4B). The predictive relevance ranking corroborated
the composition of the best signature (Fig. 4A). These resultsimply a potential link between aberrant PTEN status and theemergence of protein signatures in the serum reporting on tumorgrading. Taken together, because only few reports describe se-rum biomarkers for the stratification of patients based on thegrading of the tumors (2, 27, 28), the data suggest an applicationof our biomarker discovery platform for the prognosis of locPCa,wherein patients with clinically significant or insignificant pros-tate cancer can undergo stratification for therapy or watchfulwaiting, respectively (29). Finally, we assessed whether our ap-proach can reveal signatures for PCa diagnosis. As reportedpreviously, we note that the vast majority of the tumors showaberrant focal PTEN loss (Fig. 3A and Table S1) and alteredPI3K signaling (Fig. 3 B and C). The current method of choicefor noninvasive screening of PCa is the blood-based quantifica-tion of PSA together with digital rectal examination (DRE).Recent studies showing that PSA, alone or in combination withDRE, is prone to overdiagnosis and has no or very limitedbeneficial effects on overall survival (30, 31) suggest a strongneed for better diagnostic signatures. We thus analyzed a total of143 sera from 77 PCa patients and 66 controls. Sera from 105patients were selected as training-validation set (Fig. S2B). Ma-chine learning analysis applied to a quantitative data set derivedfrom SRM analysis of the sera of 82 patients identified a four-protein signature comprised of hypoxia up-regulated protein 1(HYOU1), asporin (ASPN), cathepsin D (CTSD), and olfacto-medin-4 (OLFM4) (32). This signature discriminated betweenBPH and PCa with an AUC = 0.726 (P= 0.01; 95% CI = 0.614–0.838; sens. 81%, spec. 57%). PSA measurements resulted ina similar AUC = 0.730 (P = 1*10E-6; 95% CI = 0.693–0.871;sens. 78%, spec. 63%). Strikingly, the combination of the four-protein signature with PSA resulted in an AUC = 0.840 (P =5*10E-9; 95% CI = 0.824–0.964; sens. 85%, spec. 79%) (Fig. 4 Cand D). With the aim of testing the reproducibility of our ap-proach, we measured the four-biomarker signature by SRM in anindependent test set comprising 38 patients that were not in-cluded in the training-validation set. In the test set, the diagnosticsignature from an overlapping dataset of 37 patients performedequally as well as the training-validation set, indicating repro-ducibility and robustness of the test as well as of the measurementprocedure (Fig. 4E). To exclude confounding variables such asinflammatory conditions as the origin of eventual bias (33) in ouranalysis, we correlated the single biomarkers comprised in theprognostic and diagnostic signatures mentioned above with clini-cal parameters of inflammatory state in a subset of patients, in-dependently of the disease status. Specifically, we correlatedC-reactive protein (CRP) and the leukocyte count. All the se-lected variables failed to correlate with either parameter, thusexcluding a bias derived from the inflammatory status of thepatient at the time of diagnosis (Fig. S5).
DiscussionThe present study provides a general framework for rationalcancer biomarker discovery. The underlying concept is that ac-tivation of cancer-signaling pathways caused, for example, by theinactivation of a defined tumor-suppressor gene is associatedwith specific protein signatures that can be measured in serumand potentially used to detect disease at an early stage orto derive information about the tumor grade and thus guidetreatment decisions. In the past the discovery of serum bio-markers has been technically challenging because of the enor-mous complexity of the serum proteome and the lack of sensitivediscovery-driven measurement technologies (4). Based on theseconsiderations, we implemented a two-stage strategy for bio-marker discovery. In the first stage, we generated a list of can-didate biomarkers based on information derived from large-scalescreens of the glycosylated proteome of a mouse model of PCaprogression caused by prostate-specific Pten inactivation. This
Predictor distribution of best 50 models A
0 10 20 30 40 50
B
1-Specificity
Sen
siti
vity
0.0 0.2 0.4 0.6 0.8 1.0
0.0
0.2
0.4
0.6
0.8
1.0
Predictor distribution of best 50 models C
0 10 20 30 40 50
LRP1L1CAM
AZGP1
ASPN
TF
CPM
CFHVTN
HYOU1
NCAM1
CTSD
OLFM4
PLXNB2
LGALS3BPCP
1-Specificity
0.0 0.2 0.4 0.6 0.8 1.0
0.0
0.2
0.4
0.6
0.8
1.0
Sen
siti
vity
PSAOLFM4, HYOU1, ASPN, CTSD
PSA + OLFM4, HYOU1, ASPN, CTSD
AUC = 0.730AUC = 0.840
AUC = 0.726
D
E
BGNAZGP1
FNGALNTL4
CPMECM1
CADM1BTDCFH
PLXNB2LUM
L1CAMCREG1
ATRNASPN
AUC = 0.788
GALNTL4, FN, AZGP1, BGN, ECM1
OLFM4, HYOU1,ASPN, CTSD PSA
PSA + OLFM4, HYOU1, ASPN, CTSD
Sens: 50%Spec: 78.2%
Acc: 67.5%
locPCa BPHDiagnosis
Sens: 42.8%Spec: 86.9%
Acc: 70.2%
locPCa BPHDiagnosis
Sens: 64.3%Spec: 82.6%
Acc: 75.6%
emoctuot seT
locPCa BPHDiagnosis
B
PH
”lo
cPC
a”
7 5
7 18
6 3
8 20
9 4
5 19’’’’
emoct uot seT
B
PH
”lo
cPC
a”
’’’’
emoct uot seT
B
PH
”lo
cPC
a”
’’’’
Fig. 4. Candidate biomarkers for diagnosis and Gleason score prediction.(A) Predictor variable distribution for Gleason score. The predictive impor-tance for BGN, AZGP1, FN, GALNTL4, Carboxypeptidase M (CPM), ECM1,CADM1, Biotinidase (BTD), Complement factor H (CFH), Plexin B2 (PLXNB2),Lumican (LUM), Neural cell adhesion molecule L1 (L1CAM), Protein CREG1(CREG1), ATRN, and ASPN selected by random forests and subsequentbootstrapped exhaustive search is based on the frequency in which thecandidate appears in the first 50 models. (B) ROC curve for the indicatedsignature for prediction of Gleason score <7 or ≥7 (n = 54). (C) Predictorvariable distribution for diagnosis between locPCa and BPH. (D) ROC curveshowing the performance for the selected signature (green line), the sig-nature combined with PSA (red line), and PSA alone (black line) (n = 105). (E)Independent test set for the diagnostic signature. Performance of theidentified diagnostic signature (Left), PSA alone (Center), or the combinationof the signature and PSA (Right) in a set of patients measured independentlyand not considered in the training set. Data are presented as confusionmatrices with the sensitivity (sens.), specificity (spec.), and accuracy (acc.)indicated for each signature (n = 37).
Cima et al. PNAS | February 22, 2011 | vol. 108 | no. 8 | 3345
MED
ICALSC
IENCE
S
approach identified multiple proteins differentially regulatedupon Pten inactivation. In the second, hypothesis-testing stage,the candidate proteins were quantified simultaneously by SRM-based targeted MS in sera of PCa patients and integrated withinformation derived from matched PCa tissue characterized withrespect to PTEN status and PI3K-pathway activation. Usingmachine learning algorithms, we then extracted robust patternssuitable for predicting tissue PTEN status and for the diagnosisand grading of PCa.The current standard biomarker for early detection of PCa is
PSA. However, the effectiveness of systematic PCa screeningwith PSA testing remains controversial, in part because a lack ofsensitivity and specificity results in considerable overdiagnosisand overtreatment (30, 31, 34). The ability of our four-proteinsignature for prostate cancer diagnosis to distinguish accuratelybetween locPCa and BPH makes it potentially suited forscreening tests by reducing false-positive outcomes and thereforeavoiding anxiety and biopsies in men who have an elevated PSAbut do not harbor cancer.Another potential drawback of PSA testing relates to the de-
tection of clinically insignificant prostate cancers in asymptom-atic men. Therefore, overdiagnosis, in this context meaningdetection of cancer that has no clinical impact on an individualduring his lifetime, is a major problem. There are several defi-nitions of insignificant prostate cancer (29); most definitionsexclude patients with any Gleason pattern 4 prostate cancer. Ourfive-protein signature predictive for Gleason score therefore maybe suited for improving screening efficacy by reporting whichmen might harbor insignificant cancers. Such patients might beoffered active surveillance instead of immediate treatment. Ifactive surveillance is chosen as the treatment option, repetitivebiopsies for detection of prostate cancer progression ultimatelycould be replaced by a serum test.The biomarker discovery platform presented here provides an
approach for the discovery and validation of biomarkers with theaim of improving the effectiveness of PCa testing and non-invasive diagnostic of prostate cancer. Ideally this approachcould avoid overdiagnosis and overtreatment and guide treat-ment decision.The simultaneous analysis of a large number of candidate bio-
markers by SRM allows the discovery of new potential biomarkersindependently from the availability of established immunoassays.However, this emerging technology does not yet allow the analysisof large cohorts of patients. The identified candidate biomarkersthus must be validated further in larger, prospective studies,preferably using standardized immunoassays, which are limited inthe amount of proteins analyzed per sample but allow the analysisof much larger cohorts. External independent data sets must beadded as well to confirm further the clinical usefulness of thereported signatures.Because we now are entering an era in which the genetic and
epigenetic abnormalities responsible for specific forms of cancerguide the design of molecularly targeting drugs, efficient strate-gies to evaluate such targeted therapies in patients are critical,especially as more such compounds become available. Bio-markers able to identify reliably the patients who are most likelyto benefit from a specific molecularly targeted therapy thereforewould have significant clinical benefit. In this regard, an in-creasing armamentarium of targeting agents that inhibit keycomponents of the PI3K pathway exists, and many of these in-hibitors already are in clinical testing (35–37). It is conceivablethat signatures reflecting tissue PTEN status may aid in selectingsuitable patients and provide proof of target modulation by theseinhibitors. Thus, a cancer genetics-guided path to biomarkerdiscovery, as described here, may hold the promise for the re-alization of personalized cancer medicines.
MethodsExperimental Mice. PTEN cKO mice were generated as described in ref. 9. TheZurich cantonal veterinary office approved all animal studies. Details areprovided in SI Methods.
Glycoprotein Enrichment from Murine Serum. Glycoproteins were enrichedfrom sera and tissue of mice using the protocol published by Zhang et al. (12).Details about the isolation of sera and tissues from mice and the glycopro-tein enrichment method are explained in SI Methods.
Mass Spectrometry Analysis. Samples were analyzed on a hybrid LTQ-FT massspectrometer (Thermo Electron) equipped with a nanoelectrospray ionsource. Chromatographic separation of peptides was performed on anAgilent 1100 micro HPLC system equipped with a 15-cm fused silica emitter,150-μm inner diameter, packed with a Magic C18 AQ 5 μm resin (MichromBioResources). Further details are provided in SI Methods.
Protein Identification. Proteins were identified following protocols describedin refs. 12 and 36–38. Further details are provided in SI Methods.
Label-Free Quantification of Peptide and Protein Ratios. Data from LC-MS runswere converted from raw to the mzXML data format (38) and processed bythe software tool SuperHirn as described previously (15). JRatio was used forthe calculation and visual assessment of peptide and protein ratios (39).After examining the distribution of the data and assuming normality (FigS1G), we applied a two-tailed Student’s t test with unequal variances sta-tistics to assess the significance of a protein fold-change. Protein fold-changes with a nonstringent P value ≤0.15 were selected for further anal-yses. To verify the results obtained by SuperHirn and JRatio, we performedspectral counting analysis (SI Methods). Prostate specificity was calculatedfrom gene-expression profiles obtained for the BioGPS database (http://biogps.org) (40) by calculating the ratio of average gene expression fromprostate and average gene expression of the remaining tissues. Gene withratios of 10 or more were considered prostate specific.
SDS/PAGE and Western Blotting. Perfused fresh-frozen prostate tissues weresolubilized in RIPA buffer (150 mM NaCl, 10 mM Tris, 0.1% SDS, 1% TritonX-100, 1% deoxycholate, 5 mM EDTA) plus protease inhibitors (1 mMphenylmethylsulfonyl fluoride, 10 mM benzamidine, 10 μg/mL aprotinin).Fifty-microgram protein extracts were resolved on 8–12% SDS/PAGE,blotted on nitrocellulose, and visualized by immunoblotting with thefollowing primary antibodies: anti–phospho-Ser473 AKT (#4058; Cell Sig-naling Technology), anti-complement factor B (#HPA001817; SigmaAldrich), anti-KDEL (#ab12223; Abcam), anti–Niemann-Pick C1 (#NB400-148SS; Novus Biologicals), anti–LAMP-1 (clone 1D4B; DevelopmentalStudies Hybridoma Bank), anti–α-tubulin (clone YL 1/2, #ab6160; Abcam).
Immunofluorescence. Five-micrometer cryostat sections on poly-L-lysine slideswere fixed in PBS/4% paraformaldehyde for 10 min, washed in PBS, andstained using antibodies against the indicated proteins. Further details areprovided in SI Methods.
Real-Time PCR Analysis. Prostate tissues from three wild-type and three PTENcKO animals were isolated as described. Total RNA was prepared frompowdered tissue using the RNeasy Mini Kit (Qiagen), and cDNA was pre-pared using random hexanucleotide primers and Ready-to-go you-primefirst-strand beads (GE Healthcare). Real-time PCR analysis of cDNA wasperformed using LightCycler 480 SYBR Green I Master from Roche andspecific primers reported in SI Methods.
Patients, Sampling, and Handling of Human Sera and Glycoprotein Enrichment.The Ethics Committee of the Kanton St. Gallen, Switzerland, approved allprocedures involving human material, and all patients signed an informedconsent. For the study we included patients with locPCa and BPH. We ex-cluded from the analysis patients with advanced prostate cancer, infectious orinflammatory diseases, or other malignancies. Eight milliliters of blood weredrawn and collected in a serum separator tube containing clot activator andgel (Vacutainer, SSTTM II Advance, REF 367953; Becton Dickinson). Tubeswere inverted eight times and centrifuged within 4 h of collection at 4 °C for10 min at 1,428 × g. The serum was divided into five aliquots of 500 μL eachand stored at −60 °C or lower until use. Glycoprotein extraction was per-formed exactly as described for the murine serum.
3346 | www.pnas.org/cgi/doi/10.1073/pnas.1013699108 Cima et al.
Targeted MS Analysis Using SRM. We used the absolute quantification ofproteins (AQUA) strategy introduced by Gerber et al. (41). Further details arereported in SI Methods.
Tissue Microarray Preparation. A tissue microarray was constructed as de-scribed (42) using formalin-fixed, paraffin-embedded tissue samples derivedfrom 92 patients (BPH, n = 40; locPCa, n = 52) with matched serum samplesthat were used for SRM or ELISA. Details are provided in SI Methods.
Immunohistochemistry. Immunohistochemistry was performed using a VentanaBenchmark automated staining system (Ventana Medical Systems) and the fol-lowing primary antibodies: anti–phospho-Ser473 AKT (dilution 1:150; #ab8932;Abcam) and and anti-Stathmin (dilution 1:50; #3352; Cell Signaling Technology).
FISH. To assess PTEN deletion, we performed dual-color FISH on paraffin-embedded tissue using commercially available fluorescently labeled DNAprobes for cytoband 10q23.3 (SpectrumOrange, PTEN locus-specific probe)and region 10p11.1∼q11.1 (Spectrum-Green centromere of chromosome 10probe; LSI PTEN/CEP 10; Abbott Laboratories) according to the manu-facturer’s instructions. Details are provided in SI Methods.
Bioinformatic Analysis of SRM Data. SRM data were normalized and subjectedto feature selection using random forest followed by signature modelingusing brute force search for all logistic models. AUCs for every model werecalculated by bootstrapping to avoid overfitting. Details are provided inSI Methods.
ELISA. The concentration of selected candidate biomarkers (Dataset S3) wasmeasured by sandwich or competitive ELISA following the manufacturer’sinstructions. Details are given in SI Methods.
ACKNOWLEDGMENTS.We thank all members of our laboratories for helpfuldiscussions and Corina Fusaro-Graf, Doris Kradolfer, Melanie Sticker, andManuela Hitz for technical assistance. The project was supported by Grant3100A0-107679 from the Swiss National Science Foundation (to R.A.), GrantKFP OCS 1262-06-2002 from the Collaborative Cancer Research Project fromOncosuisse (to T.C., S.G., W.K., and H.M.), Smart Inactivity Monitor usingArray Based Detectors Grant 213250 from the Future and Emerging Tech-nologies Programme within the Seventh Framework Programme for Re-search of the European Commission (to P.S., T.F., and J.B.), and by a grantfrom the Vontobel-Stiftung (to W.K.).
1. Tainsky MA (2009) Genomic and proteomic biomarkers for cancer: A multitude ofopportunities. Biochim Biophys Acta 1796:176–193.
2. Ludwig JA, Weinstein JN (2005) Biomarkers in cancer staging, prognosis andtreatment selection. Nat Rev Cancer 5:845–856.
3. Srinivas PR, Kramer BS, Srivastava S (2001) Trends in biomarker research for cancerdetection. Lancet Oncol 2:698–704.
4. Rifai N, Gillette MA, Carr SA (2006) Protein biomarker discovery and validation: Thelong and uncertain path to clinical utility. Nat Biotechnol 24:971–983.
5. Steck PA, et al. (1997) Identification of a candidate tumour suppressor gene, MMAC1,at chromosome 10q23.3 that is mutated in multiple advanced cancers. Nat Genet 15:356–362.
6. Maehama T, Dixon JE (1998) The tumor suppressor, PTEN/MMAC1, dephosphorylatesthe lipid second messenger, phosphatidylinositol 3,4,5-trisphosphate. J Biol Chem 273:13375–13378.
7. Stambolic V, et al. (1998) Negative regulation of PKB/Akt-dependent cell survival bythe tumor suppressor PTEN. Cell 95:29–39.
8. Mehrian-Shai R, et al. (2007) Insulin growth factor-binding protein 2 is a candidatebiomarker for PTEN status and PI3K/Akt pathway activation in glioblastoma andprostate cancer. Proc Natl Acad Sci USA 104:5563–5568.
9. Trotman LC, et al. (2003) Pten dose dictates cancer progression in the prostate. PLoSBiol 1:E59.
10. Zhang H, et al. (2007) Mass spectrometric detection of tissue proteins in plasma. MolCell Proteomics 6:64–71.
11. Schiess R, Wollscheid B, Aebersold R (2009) Targeted proteomic strategy for clinicalbiomarker discovery. Mol Oncol 3(1):33–44.
12. Zhang H, Li XJ, Martin DB, Aebersold R (2003) Identification and quantification of N-linked glycoproteins using hydrazide chemistry, stable isotope labeling and massspectrometry. Nat Biotechnol 21:660–666.
13. Emanuelsson O, Brunak S, von Heijne G, Nielsen H (2007) Locating proteins in the cellusing TargetP, SignalP and related tools. Nat Protoc 2:953–971.
14. Roth J (2002) Protein N-glycosylation along the secretory pathway: Relationship toorganelle topography and function, protein quality control, and cell interactions.Chem Rev 102:285–303.
15. Mueller LN, et al. (2007) SuperHirn - a novel tool for high resolution LC-MS-basedpeptide/protein profiling. Proteomics 7:3470–3480.
16. Liu H, Sadygov RG, Yates JR, 3rd (2004) A model for random sampling and estimationof relative protein abundance in shotgun proteomics. Anal Chem 76:4193–4201.
17. Wang S, et al. (2006) Pten deletion leads to the expansion of a prostatic stem/progenitor cell subpopulation and tumor initiation. Proc Natl Acad Sci USA 103:1480–1485.
18. Saal LH, et al. (2007) Poor prognosis in carcinoma is associated with a gene expressionsignature of aberrant PTEN tumor suppressor pathway activity. Proc Natl Acad SciUSA 104:7564–7569.
19. Sircar K, et al. (2009) PTEN genomic deletion is associated with p-Akt and ARsignalling in poorer outcome, hormone refractory prostate cancer. J Pathol 218:505–513.
20. Yoshimoto M, et al. (2006) Interphase FISH analysis of PTEN in histologic sectionsshows genomic deletions in 68% of primary prostate cancer and 23% of high-gradeprostatic intra-epithelial neoplasias. Cancer Genet Cytogenet 169:128–137.
21. Addona T, et al. (2009) Multi-site assessment of the precision and reproducibilityof multiple reaction monitoring-based measurements of proteins in plasma. NatBiotechnol 27(7):633–641.
22. Lange V, Picotti P, Domon B, Aebersold R (2008) Selected reaction monitoring forquantitative proteomics: A tutorial. Mol Syst Biol 4:222.
23. Breiman L (2001) Random forests. Mach Learn 45:5–32.24. Efron B, Tibshirani R (1993) An Introduction to the Bootstrap (Chapman & Hall, New
York).25. McMenamin ME, et al. (1999) Loss of PTEN expression in paraffin-embedded primary
prostate cancer correlates with high Gleason score and advanced stage. Cancer Res59:4291–4296.
26. Dreher T, et al. (2004) Reduction of PTEN and p27kip1 expression correlates withtumor grade in prostate cancer. Analysis in radical prostatectomy specimens andneedle biopsies. Virchows Arch 444:509–517.
27. Nakanishi H, et al. (2008) PCA3 molecular urine assay correlates with prostate cancertumor volume: Implication in selecting candidates for active surveillance. J Urol 179(5):1804–1809; discussion 1809–1810.
28. Sreekumar A, et al. (2009) Metabolomic profiles delineate potential role for sarcosinein prostate cancer progression. Nature 457:910–914.
29. Bastian PJ, et al. (2009) Insignificant prostate cancer and active surveillance: Fromdefinition to clinical implications. Eur Urol 55:1321–1330.
30. Schröder FH, et al.; ERSPC Investigators (2009) Screening and prostate-cancermortality in a randomized European study. N Engl J Med 360:1320–1328.
31. Andriole GL, et al.; PLCO Project Team (2009) Mortality results from a randomizedprostate-cancer screening trial. N Engl J Med 360:1310–1319.
32. Zhang J, et al. (2002) Identification and characterization of a novel member ofolfactomedin-related protein family, hGC-1, expressed during myeloid lineagedevelopment. Gene 283:83–93.
33. Ransohoff DF (2005) Bias as a threat to the validity of cancer molecular-markerresearch. Nat Rev Cancer 5:142–149.
34. Neal DE, Donovan JL, Martin RM, Hamdy FC (2009) Screening for prostate cancerremains controversial. Lancet 374:1482–1483.
35. Engelman JA (2009) Targeting PI3K signalling in cancer: Opportunities, challengesand limitations. Nat Rev Cancer 9:550–562.
36. Liu P, Cheng H, Roberts TM, Zhao JJ (2009) Targeting the phosphoinositide 3-kinasepathway in cancer. Nat Rev Drug Discov 8:627–644.
37. Sarker D, Reid AH, Yap TA, de Bono JS (2009) Targeting the PI3K/AKT pathway for thetreatment of prostate cancer. Clin Cancer Res 15:4799–4805.
38. Pedrioli PGA, et al. (2004) A common open representation of mass spectrometry dataand its application to proteomics research. Nat Biotechnol 22:1459–1466.
39. Schiess R, et al. (2009) Analysis of cell surface proteome changes via label-free,quantitative mass spectrometry. Mol Cell Proteomics 8(4):624–638.
40. Su AI, et al. (2002) Large-scale analysis of the human and mouse transcriptomes. ProcNatl Acad Sci USA 99:4465–4470.
41. Gerber SA, Rush J, Stemman O, Kirschner MW, Gygi SP (2003) Absolute quantificationof proteins and phosphoproteins from cell lysates by tandem MS. Proc Natl Acad SciUSA 100:6940–6945.
44. Kononen J, et al. (1998) Tissue microarrays for high-throughput molecular profiling oftumor specimens. Nat Med 4:844–847.
Cima et al. PNAS | February 22, 2011 | vol. 108 | no. 8 | 3347
MED
ICALSC
IENCE
S