Collective plasmon modes in a compositionally asymmetric nanoparticle dimer
So
Za
b
a
ARRAA
KCISEH
1
cc[sCio1eHcaaom
t
0d
Talanta 86 (2011) 377– 383
Contents lists available at SciVerse ScienceDirect
Talanta
j ourna l ho me page: www.elsev ier .com/ locate / ta lanta
urface plasmon resonance based immunosensor for the detectionf the cancer biomarker carcinoembryonic antigen
eynep Altintasa,b, Yildiz Uludaga, Yasar Gurbuzb, Ibtisam E. Tothill a,∗
Cranfield University, Cranfield Health, Cranfield, Bedfordshire MK43 0AL, UKSabanci University, Faculty of Engineering and Natural Science, Tuzla, Istanbul 34956, Turkey
r t i c l e i n f o
rticle history:eceived 27 May 2011eceived in revised form 6 September 2011ccepted 12 September 2011vailable online 22 September 2011
eywords:arcinoembryonic antigen
mmunoassayPR
a b s t r a c t
An immunoassay in optimised conditions with a highly sensitive surface plasmon resonance (SPR) basedbiosensor was developed for the detection of the cancer biomarker carcinoembryonic antigen (CEA).Different formats of the immunoassay were initially investigated on the surface of the gold sensor chip.A self-assembled monolayer (SAM) was formed on the gold chip using 11-mercaptoundecanoic acid(MUDA), before the immobilisation of the antibodies was conducted. The assay was then formed in adirect capture and a sandwich assay. In order to increase the sensor signal the CEA antigen was incubatedwith the detection/capture antibody before it was injected to the sensor chip surface and the resultswere recorded in real-time using the Biacore 3000 instrument. A detection limit of 3 ng ml−1 CEA wasobtained with a dynamic detection range from 3 ng ml−1 to 400 ng ml−1 with correlation coefficients of
arly diagnosis of canceromogeneous assay
1.00 and 0.99 for the sandwich and rabbit anti-mouse (RAM) capture assay. Kinetic data analysis wasperformed for the standard capture test and subsequently for the developed assays and Rmax showed anincrease from 215 RU for the standard capture test to 428 RU for the RAM-capture assay and 734 RU forthe sandwich assay, respectively. The developed SPR immunosensor using the sandwich assay formatshowed high sensitivity and reproducibility for CEA detection which makes it a promising procedure forcancer biomarker analysis.
. Introduction
Carcinoembryonic antigen (CEA) has been widely studied inlinical analysis as a tumour biomarker. CEA is a cell adhesion gly-oprotein and is a member of the immunoglobulin super family1]. The protein was first identified from human colon cancer tis-ue extracts in 1965 by Phild Gold and Samuel O. Freedman [2].EA is produced during foetal development and the production of
t terminates before birth. In healthy individuals the normal levelf CEA is between 3 and 5 ng ml−1 and this level may increase up to0 ng ml−1 due to other benign diseases [3]. The protein scarcelyxists in the blood of healthy people except cigarette-smokers.owever, its concentration shows a significant increase in someonditions including lung cancer, colorectal carcinoma, pancre-tic carcinoma and breast carcinoma [4]. Hence, it can be useds a biomarker for diagnosis and prognosis of cancer. CEA levelsver 20 ng ml−1 are usually associated with patients with cancer in
etastatic state [5].The treatment of lung cancer is a long and difficult process andhe survival scarcely reaches 5 years. The most crucial point for the
∗ Corresponding author. Tel.: +44 0 7500766487; fax: +44 0 1234 758380.E-mail address: [email protected] (I.E. Tothill).
039-9140/$ – see front matter © 2011 Elsevier B.V. All rights reserved.oi:10.1016/j.talanta.2011.09.031
© 2011 Elsevier B.V. All rights reserved.
best result is to diagnose the disease at an early stage. To this aim,many methods are now available to diagnose the disease includingchest X-ray, computerised tomography, magnetic resonance imag-ing, positron emission tomography, sputum cytology and biopsy.However, some of these methods are not suitable for all patientsdue to the other pathologies they may have [6]. Moreover, patientscan often experience great pain and complications because of somediagnostic tools such as biopsy. Since the current diagnostic meth-ods are also time consuming, a new sensitive and rapid methodis necessary for both lung and colon cancers detection. CEA is oneof the most investigated tumour markers in certain cancers [7],with several clinical and research-based applications [8]. However,due to the absence of both rapid and sensitive diagnostic tool, CEArelated cancers cannot be detected at an early stage which is vital forsuccessful treatment. Therefore, biosensor technologies can playa crucial role in achieving this aim [9,10]. Though enzyme-linkedimmunoassay (ELISA) has been generally used for both clinical andresearch field, the SPR-based biosensors will provide label-free andreal-time detection system [11]. SPR based biosensors have alsobeen used for other diseases which occur at very high incidence
level using genetic [12] or protein markers [13] which exist in eithertissue or body fluids or in both [14].In the present paper we report on the development of a sur-face plasmon resonance (SPR) based biosensor platform for the
3 lanta
dcmrwBacips
2
2
07ea1cmaaPSrLo(A
2
b(ptattTf
2
pm1iT
2
ei5Bs
78 Z. Altintas et al. / Ta
etection of CEA, the most crucial tumour marker for lung and colonarcinomas. An immunoassay for CEA was developed and opti-ised on the SPR gold sensor surface to achieve high sensitivity for a
eal-time disease diagnosis. Different homogeneous assay formatsere investigated including capture and sandwich immunoassay.y using this label-free real-time biosensor technology we wereble to achieve a low detection limit for CEA which represents theritical CEA level in non-smoker individuals. This will help in thedentification of possible cancer patient. The technique shows aromising future technology for the diagnosis of cancer at inchoatetage without the use of invasive surgical procedures.
. Materials and methods
.1. Materials and reagents
Phosphate buffered saline (PBS, 0.01 M phosphate buffer,.0027 M potassium chloride and 0.137 M sodium chloride, pH.4), bovine serum albumin (BSA), N-hydroxysuccinimide (NHS),thanolamine, Human CEA (cat no. C4835) and its monoclonalntibody (C2331) were purchased from Sigma Aldrich (Poole, UK).-ethyl-3-(3 dimethylaminopropyl)-carbodiimide (EDC) was pur-hased from Pierce-Thermo Scientific (Cramblington, UK). Mouseonoclonal antibody to carcinoembryonic antigen (CEA) (cat no.
b10037) and Mouse Monoclonal (1C11) to cardiac Troponin T:b8295 was purchased from Abcam (Cambridge, UK), monoclonalSA detection antibody (cat no: MCA2561) obtained from AbDerotec (Kidlington, UK). Mouse IgG (cat no. 015-000-003) andabbit anti-mouse IgG (RAM) was bought from Stratech Scientifictd./Jackson ImmunoResearch (Newmarket, UK). In the devel-ped sandwich and RAM-capture assays, Sigma anti-CEA antibodyC2331) was used as the detection antibody to perform the assay.ll other chemicals were of analytical grade.
.2. Instrumentations
A fully automated SPR-based Biacore 3000 biosensor and theare gold sensor chips were supplied by Biacore GE HealthcareUppsala, Sweden). The sensor possesses four sensing spots thatrovide four separate areas for different assay simultaneously. Inhe current study two sensing spots were employed for sandwichnd indirect assay formats while the third spot provided the con-rol surface. The operating temperature of the assays was 25 ◦C andhe flow rate of the buffer was 10 �l min−1 throughout the assay.he data presented in this work are the averages of 3 data pointsor the assays described unless otherwise stated.
.3. Sensor chip cleaning and MUDA coating
Bare gold sensor chips were first cleaned using nitrogenlasma for one minute and then coated with self assembledonolayer (SAM) by immersing the sensors in 2 mM solution of
1-mercaptoundecanoic acid (MUDA) overnight followed by rins-ng with ethanol and Milli-Q water and then dried under nitrogen.he SPR sensor chips were then stored at 4 ◦C until used.
.4. Control surface selection
For the selection of the best control sensor surface, three differ-nt antibodies (mouse IgG, anti-PSA and anti-troponin produced
n mouse) were examined. Since the samples were prepared using�g ml−1 BSA in all experiments, 300 ng ml−1 CEA was diluted inSA and the non-specific binding of this solution to each controlurface was measured. A high concentration of CEA antigen was
86 (2011) 377– 383
used in this confirmation study and the non-specific binding of theantigen to each control surface was recorded during the SPR assay.
2.5. Immobilisation of antibodies
The SAM coated sensor chip was first docked to the Biacoreinstrument and primed with running buffer (10 mM PBS, pH 7.4,0.0027 M potassium chloride, 0.137 M sodium chloride) at a flowrate of 10 �l min−1. Monoclonal mouse anti-CEA antibody was thenimmobilised via one flow path of the instrument for the sandwichassay whereas rabbit anti-mouse and mouse IgG antibodies (con-trol antibody) were immobilized to the second and third sensorarray of the chip, to conduct the capture assay and obtain controlsurface, respectively. The immobilisation stage of the immunoas-say was obtained using conventional amine coupling chemistry.The running buffer in this stage was degassed phosphate bufferedsaline (PBS). During the immobilisation step firstly the sensor chipsurfaces were activated with a mixture of 400 mM EDC and 100 mMNHS (1:1). Both reagents were prepared in deionised water andimmediately mixed before use. EDC–NHS was injected onto thefour sensor surfaces simultaneously for 3 min (30 �l) to activate thesensor chip surface. Then, 30 �g ml−1 coating antibodies (anti-CEAantibodies, rabbit anti-mouse and mouse IgG) prepared in 10 mMsodium acetate buffer (pH 5.5) were immobilized to the sensorsurfaces. After antibody immobilisation, the sensor surfaces wereblocked with 30 �g ml−1 BSA in PBS buffer for 3 min (30 �l). Finally,1 M ethanolamine (pH 8.5) was used to cap the non-reacted NHSesters exist on the sensor surface for 3 min (30 �l). The RU changeswere recorded 2 min after the protein injection was completed.
2.6. CEA detection
First assays were performed using direct assay approachwithout incubation. To increase the signal amplification the homo-geneous assay was then applied as sandwich and capture methodswith an incubation step added before the assay taking place inthe instrument. Different incubation methods were examined,including water bath at 37 ◦C and with/without shaker at roomtemperature applied prior to the assay. The CEA and detectionantibody were incubated in the 1.5 ml Eppendorf tube for eachconcentration of the antigen. The detection antibody concentrationwas chosen as always higher than CEA to prevent any free CEA inthe solution that can interfere with the binding results. The incu-bation conditions were then optimized as time, temperature anddetection/capture antibody concentration. The best results wereachieved through applying incubation at room temperature for 2 husing a shaker. PBS buffer was used as the running buffer duringthe CEA marker detection and 5 �g ml−1 BSA in PBS was used toprepare the CEA samples. For the sandwich assay, two differentmouse anti-CEA antibodies (a coating and detection antibodies)were used while rabbit anti-mouse (RAM) was preferred as coatingantibody for the capture assay. RAM-capture assay is an indirectassay here in which RAM was used to capture either mouse anti-CEA antibody or CEA bound mouse anti-CEA antibody. The sensorsignal difference due to the mass difference of free or antigen (CEA)bound anti-CEA antibody was investigated to obtain the results. Theanti-CEA captured on RAM causes an SPR signal, however the SPRsignal is higher (due to higher mass) when antigen bound anti-CEAantibody is captured on RAM immobilised surface. By subtract-ing the two responses the affect of antigen to the assay can becalculated. Before samples injection, 5 �g ml−1 BSA and anti-CEAdetection antibody were injected to all sensor surfaces as negative
controls in the experiments. Each CEA sample and negative controlswere injected onto the sensor surface for 3 min and RU changeswere recorded. After each binding step the sensor chip surface wasregenerated by injecting 100 mM HCl (1 min, 10 �l) and additional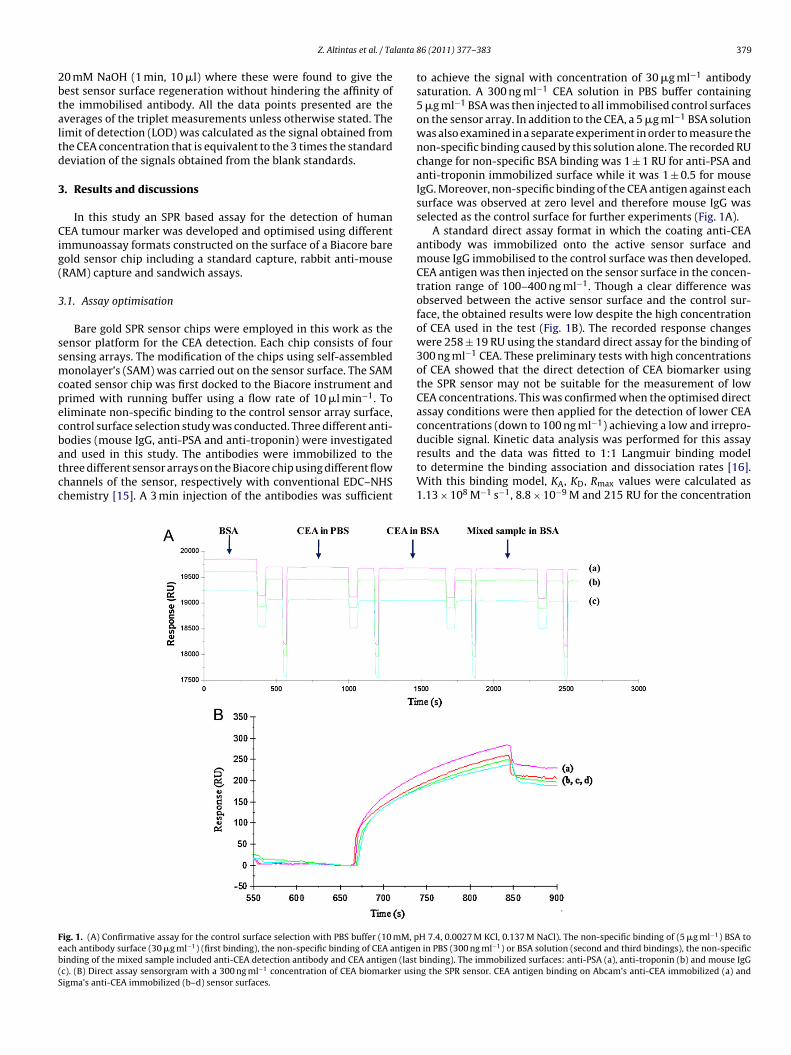
lanta
2btaltd
3
Cig(
3
ssmcpecbatcc
Feb(S
Z. Altintas et al. / Ta
0 mM NaOH (1 min, 10 �l) where these were found to give theest sensor surface regeneration without hindering the affinity ofhe immobilised antibody. All the data points presented are theverages of the triplet measurements unless otherwise stated. Theimit of detection (LOD) was calculated as the signal obtained fromhe CEA concentration that is equivalent to the 3 times the standardeviation of the signals obtained from the blank standards.
. Results and discussions
In this study an SPR based assay for the detection of humanEA tumour marker was developed and optimised using different
mmunoassay formats constructed on the surface of a Biacore bareold sensor chip including a standard capture, rabbit anti-mouseRAM) capture and sandwich assays.
.1. Assay optimisation
Bare gold SPR sensor chips were employed in this work as theensor platform for the CEA detection. Each chip consists of fourensing arrays. The modification of the chips using self-assembledonolayer’s (SAM) was carried out on the sensor surface. The SAM
oated sensor chip was first docked to the Biacore instrument andrimed with running buffer using a flow rate of 10 �l min−1. Toliminate non-specific binding to the control sensor array surface,ontrol surface selection study was conducted. Three different anti-odies (mouse IgG, anti-PSA and anti-troponin) were investigated
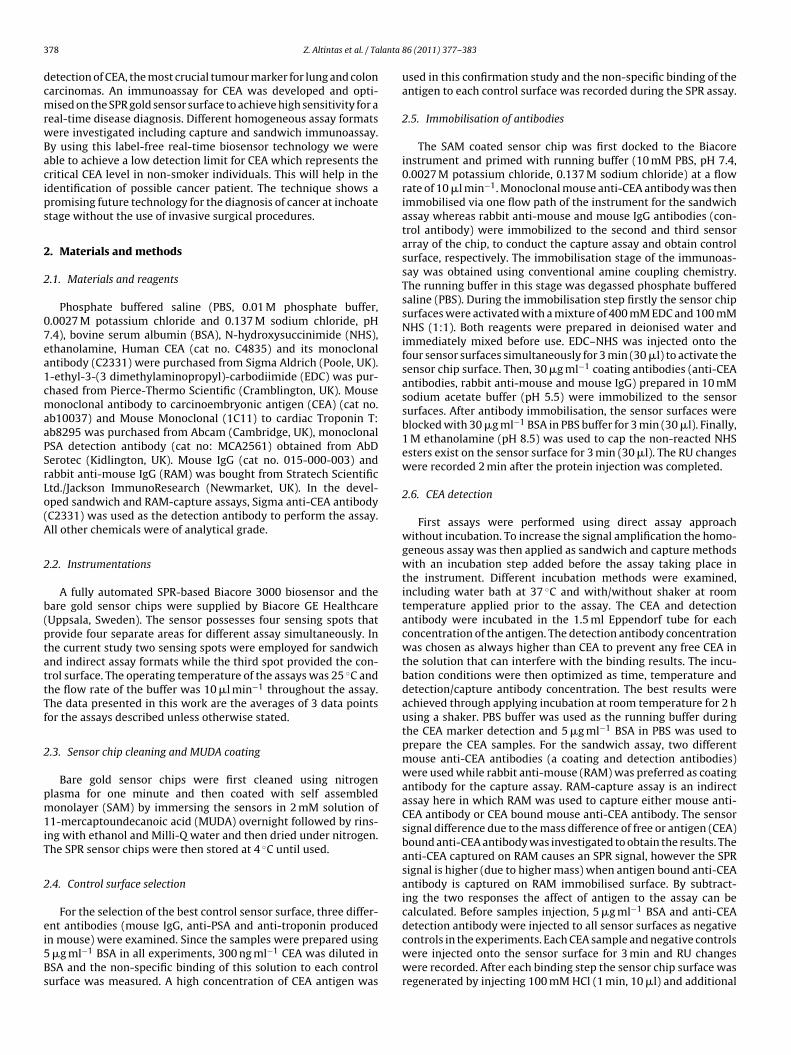
nd used in this study. The antibodies were immobilized to thehree different sensor arrays on the Biacore chip using different flowhannels of the sensor, respectively with conventional EDC–NHShemistry [15]. A 3 min injection of the antibodies was sufficientig. 1. (A) Confirmative assay for the control surface selection with PBS buffer (10 mM, pach antibody surface (30 �g ml−1) (first binding), the non-specific binding of CEA antigeninding of the mixed sample included anti-CEA detection antibody and CEA antigen (lastc). (B) Direct assay sensorgram with a 300 ng ml−1 concentration of CEA biomarker usinigma’s anti-CEA immobilized (b–d) sensor surfaces.
86 (2011) 377– 383 379
to achieve the signal with concentration of 30 �g ml−1 antibodysaturation. A 300 ng ml−1 CEA solution in PBS buffer containing5 �g ml−1 BSA was then injected to all immobilised control surfaceson the sensor array. In addition to the CEA, a 5 �g ml−1 BSA solutionwas also examined in a separate experiment in order to measure thenon-specific binding caused by this solution alone. The recorded RUchange for non-specific BSA binding was 1 ± 1 RU for anti-PSA andanti-troponin immobilized surface while it was 1 ± 0.5 for mouseIgG. Moreover, non-specific binding of the CEA antigen against eachsurface was observed at zero level and therefore mouse IgG wasselected as the control surface for further experiments (Fig. 1A).
A standard direct assay format in which the coating anti-CEAantibody was immobilized onto the active sensor surface andmouse IgG immobilised to the control surface was then developed.CEA antigen was then injected on the sensor surface in the concen-tration range of 100–400 ng ml−1. Though a clear difference wasobserved between the active sensor surface and the control sur-face, the obtained results were low despite the high concentrationof CEA used in the test (Fig. 1B). The recorded response changeswere 258 ± 19 RU using the standard direct assay for the binding of300 ng ml−1 CEA. These preliminary tests with high concentrationsof CEA showed that the direct detection of CEA biomarker usingthe SPR sensor may not be suitable for the measurement of lowCEA concentrations. This was confirmed when the optimised directassay conditions were then applied for the detection of lower CEAconcentrations (down to 100 ng ml−1) achieving a low and irrepro-ducible signal. Kinetic data analysis was performed for this assay
results and the data was fitted to 1:1 Langmuir binding modelto determine the binding association and dissociation rates [16].With this binding model, KA, KD, Rmax values were calculated as1.13 × 108 M−1 s−1, 8.8 × 10⁻⁹ M and 215 RU for the concentrationH 7.4, 0.0027 M KCl, 0.137 M NaCl). The non-specific binding of (5 �g ml−1) BSA to in PBS (300 ng ml−1) or BSA solution (second and third bindings), the non-specific
binding). The immobilized surfaces: anti-PSA (a), anti-troponin (b) and mouse IgGg the SPR sensor. CEA antigen binding on Abcam’s anti-CEA immobilized (a) and
380 Z. Altintas et al. / Talanta 86 (2011) 377– 383
Table 1Results of kinetic calculations for CEA marker detection with standard and optimisedassay formats.
Parameters/assay type
Standardassays
OptimisedRAM-capture assay
Optimisedsandwich assay
ka (1/M s) 8.17 × 10⁴ 1 × 10³ 6.88 × 10⁵
kd(1/s) 7.29 × 10⁻⁴ 1.46 × 10⁻⁶ 2.09 × 10⁻⁵
R 215 RU 428 RU 734 RU
oao
ucwrTsaat
tdCseswhi
taswHtbtat
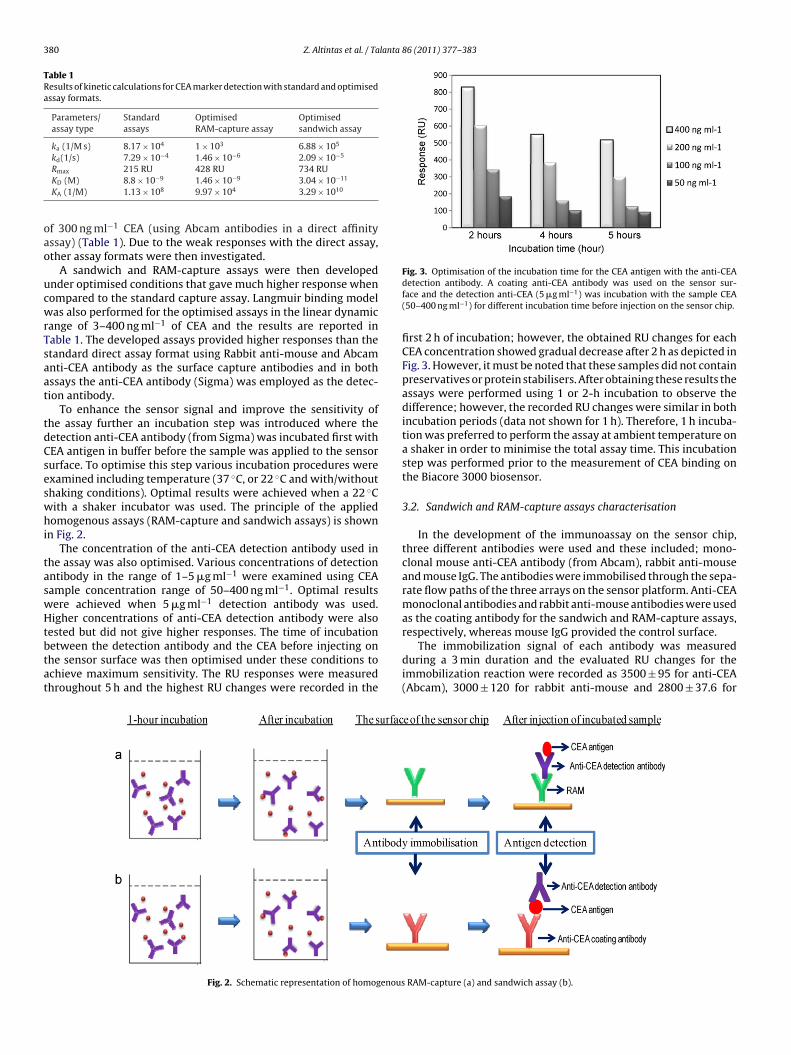
Fig. 3. Optimisation of the incubation time for the CEA antigen with the anti-CEA
max
KD (M) 8.8 × 10⁻⁹ 1.46 × 10⁻⁹ 3.04 × 10⁻¹¹
KA (1/M) 1.13 × 10⁸ 9.97 × 10⁴ 3.29 × 10¹⁰
f 300 ng ml−1 CEA (using Abcam antibodies in a direct affinityssay) (Table 1). Due to the weak responses with the direct assay,ther assay formats were then investigated.
A sandwich and RAM-capture assays were then developednder optimised conditions that gave much higher response whenompared to the standard capture assay. Langmuir binding modelas also performed for the optimised assays in the linear dynamic
ange of 3–400 ng ml−1 of CEA and the results are reported inable 1. The developed assays provided higher responses than thetandard direct assay format using Rabbit anti-mouse and Abcamnti-CEA antibody as the surface capture antibodies and in bothssays the anti-CEA antibody (Sigma) was employed as the detec-ion antibody.
To enhance the sensor signal and improve the sensitivity ofhe assay further an incubation step was introduced where theetection anti-CEA antibody (from Sigma) was incubated first withEA antigen in buffer before the sample was applied to the sensorurface. To optimise this step various incubation procedures werexamined including temperature (37 ◦C, or 22 ◦C and with/withouthaking conditions). Optimal results were achieved when a 22 ◦Cith a shaker incubator was used. The principle of the appliedomogenous assays (RAM-capture and sandwich assays) is shown
n Fig. 2.The concentration of the anti-CEA detection antibody used in
he assay was also optimised. Various concentrations of detectionntibody in the range of 1–5 �g ml−1 were examined using CEAample concentration range of 50–400 ng ml−1. Optimal resultsere achieved when 5 �g ml−1 detection antibody was used.igher concentrations of anti-CEA detection antibody were also
ested but did not give higher responses. The time of incubation
etween the detection antibody and the CEA before injecting onhe sensor surface was then optimised under these conditions tochieve maximum sensitivity. The RU responses were measuredhroughout 5 h and the highest RU changes were recorded in theFig. 2. Schematic representation of homogenous
detection antibody. A coating anti-CEA antibody was used on the sensor sur-face and the detection anti-CEA (5 �g ml−1) was incubation with the sample CEA(50–400 ng ml−1) for different incubation time before injection on the sensor chip.
first 2 h of incubation; however, the obtained RU changes for eachCEA concentration showed gradual decrease after 2 h as depicted inFig. 3. However, it must be noted that these samples did not containpreservatives or protein stabilisers. After obtaining these results theassays were performed using 1 or 2-h incubation to observe thedifference; however, the recorded RU changes were similar in bothincubation periods (data not shown for 1 h). Therefore, 1 h incuba-tion was preferred to perform the assay at ambient temperature ona shaker in order to minimise the total assay time. This incubationstep was performed prior to the measurement of CEA binding onthe Biacore 3000 biosensor.
3.2. Sandwich and RAM-capture assays characterisation
In the development of the immunoassay on the sensor chip,three different antibodies were used and these included; mono-clonal mouse anti-CEA antibody (from Abcam), rabbit anti-mouseand mouse IgG. The antibodies were immobilised through the sepa-rate flow paths of the three arrays on the sensor platform. Anti-CEAmonoclonal antibodies and rabbit anti-mouse antibodies were usedas the coating antibody for the sandwich and RAM-capture assays,respectively, whereas mouse IgG provided the control surface.
The immobilization signal of each antibody was measuredduring a 3 min duration and the evaluated RU changes for theimmobilization reaction were recorded as 3500 ± 95 for anti-CEA(Abcam), 3000 ± 120 for rabbit anti-mouse and 2800 ± 37.6 for
RAM-capture (a) and sandwich assay (b).
Z. Altintas et al. / Talanta 86 (2011) 377– 383 381
24000
26000
28000
30000
32000
34000
36000
38000
40000
300025002000150010005000Time (s)
Res
pons
e (R
U)
EDC/NHS
Anti-CEA
Ethanolamine
Ethanolamine
Mouse IgG
RAM
BSA
BSA
EDC/NHS
-100
0
100
200
300
400
500
180160140120100806040200
Time (s)
Res
pons
e (R
U)
Res
pons
e (R
U)
-100
0
100
200
300
400
500
600
700
1751551351159575553515-5Time (s)
(a) 400 ngml -1
(b) 200 ngml -1
(c) 100 ngml -1
(d) 50 ngml -1
(e) 25 ngml -1
(f) 12.5 ngml -1
(g) 6.25 ngml -1
(h) 3 ngml -1
(i) 0 ngml -1
A
B C
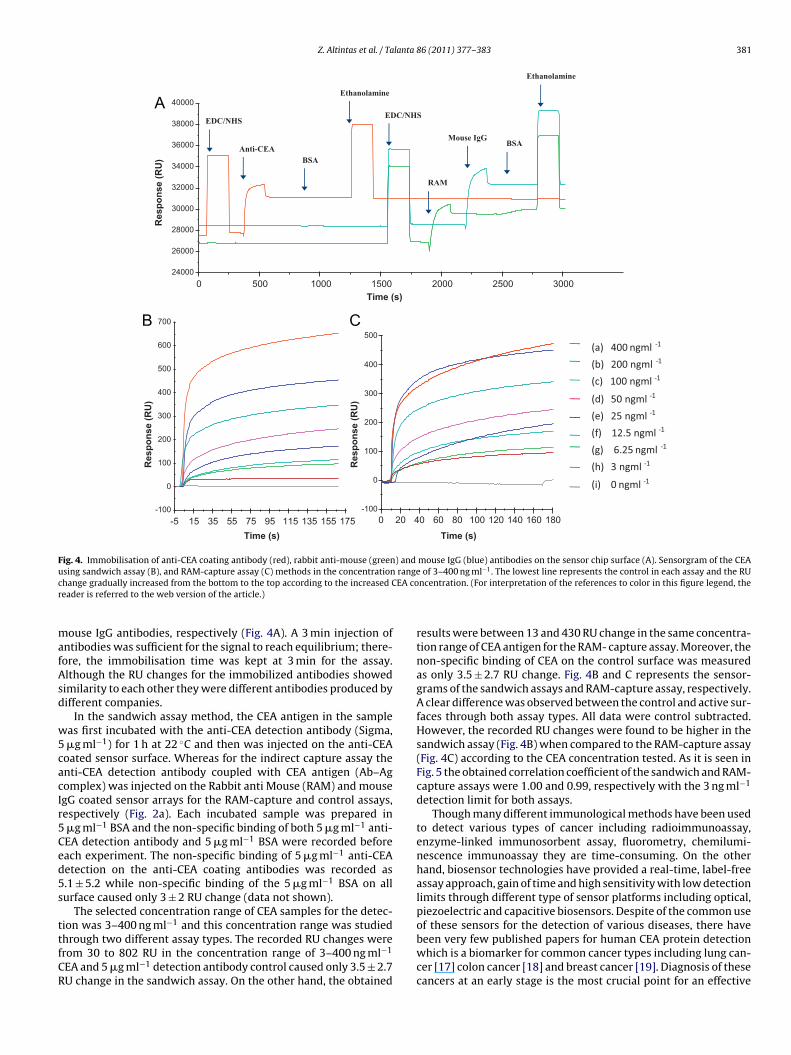
Fig. 4. Immobilisation of anti-CEA coating antibody (red), rabbit anti-mouse (green) and mouse IgG (blue) antibodies on the sensor chip surface (A). Sensorgram of the CEAusing sandwich assay (B), and RAM-capture assay (C) methods in the concentration range of 3–400 ng ml−1. The lowest line represents the control in each assay and the RUc EA cor
mafAsd
w5cacIr5Ced5s
ttfCR
hange gradually increased from the bottom to the top according to the increased Ceader is referred to the web version of the article.)
ouse IgG antibodies, respectively (Fig. 4A). A 3 min injection ofntibodies was sufficient for the signal to reach equilibrium; there-ore, the immobilisation time was kept at 3 min for the assay.lthough the RU changes for the immobilized antibodies showedimilarity to each other they were different antibodies produced byifferent companies.
In the sandwich assay method, the CEA antigen in the sampleas first incubated with the anti-CEA detection antibody (Sigma,
�g ml−1) for 1 h at 22 ◦C and then was injected on the anti-CEAoated sensor surface. Whereas for the indirect capture assay thenti-CEA detection antibody coupled with CEA antigen (Ab–Agomplex) was injected on the Rabbit anti Mouse (RAM) and mousegG coated sensor arrays for the RAM-capture and control assays,espectively (Fig. 2a). Each incubated sample was prepared in
�g ml−1 BSA and the non-specific binding of both 5 �g ml−1 anti-EA detection antibody and 5 �g ml−1 BSA were recorded beforeach experiment. The non-specific binding of 5 �g ml−1 anti-CEAetection on the anti-CEA coating antibodies was recorded as.1 ± 5.2 while non-specific binding of the 5 �g ml−1 BSA on allurface caused only 3 ± 2 RU change (data not shown).
The selected concentration range of CEA samples for the detec-ion was 3–400 ng ml−1 and this concentration range was studied
hrough two different assay types. The recorded RU changes wererom 30 to 802 RU in the concentration range of 3–400 ng ml−1EA and 5 �g ml−1 detection antibody control caused only 3.5 ± 2.7U change in the sandwich assay. On the other hand, the obtained
ncentration. (For interpretation of the references to color in this figure legend, the
results were between 13 and 430 RU change in the same concentra-tion range of CEA antigen for the RAM- capture assay. Moreover, thenon-specific binding of CEA on the control surface was measuredas only 3.5 ± 2.7 RU change. Fig. 4B and C represents the sensor-grams of the sandwich assays and RAM-capture assay, respectively.A clear difference was observed between the control and active sur-faces through both assay types. All data were control subtracted.However, the recorded RU changes were found to be higher in thesandwich assay (Fig. 4B) when compared to the RAM-capture assay(Fig. 4C) according to the CEA concentration tested. As it is seen inFig. 5 the obtained correlation coefficient of the sandwich and RAM-capture assays were 1.00 and 0.99, respectively with the 3 ng ml−1
detection limit for both assays.Though many different immunological methods have been used
to detect various types of cancer including radioimmunoassay,enzyme-linked immunosorbent assay, fluorometry, chemilumi-nescence immunoassay they are time-consuming. On the otherhand, biosensor technologies have provided a real-time, label-freeassay approach, gain of time and high sensitivity with low detectionlimits through different type of sensor platforms including optical,piezoelectric and capacitive biosensors. Despite of the common useof these sensors for the detection of various diseases, there have
been very few published papers for human CEA protein detectionwhich is a biomarker for common cancer types including lung can-cer [17] colon cancer [18] and breast cancer [19]. Diagnosis of thesecancers at an early stage is the most crucial point for an effective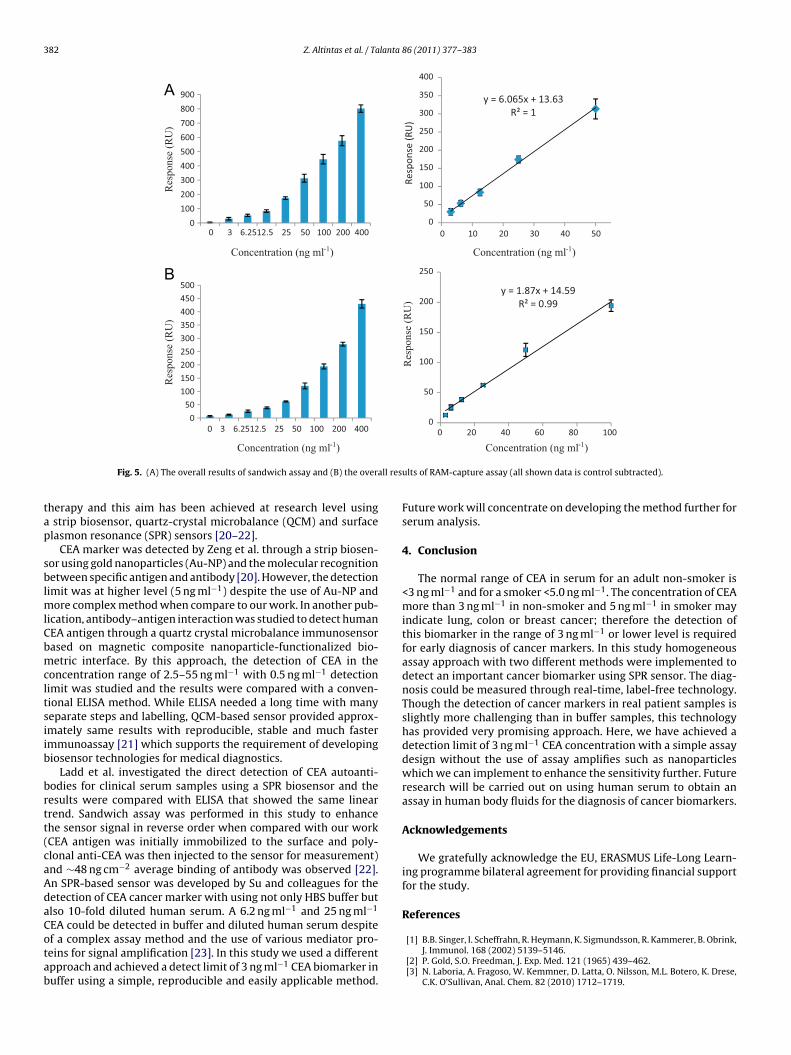
382 Z. Altintas et al. / Talanta 86 (2011) 377– 383
0
100
200
300
400
500
600
700
800
900
40020010050256.2512.530
Res
pons
e (R
U)
Concentration (ng ml-1 ) Concentration (ng ml-1 )
y = 6.065x + 13.63R² = 1
0
50
100
150
200
250
300
350
400
50403020100
Resp
onse
(RU
)0
50100150200250300350400450500
40020010050256.2512.530
Res
pons
e (R
U)
Concentration (ng ml-1 ) Concentration (ng ml-1 )
y = 1.87x + 14.59R² = 0.99
0
50
100
150
200
250
100806040200
Res
pons
e (R
U)
A
B
all res
tap
sblmlCbmcltsiib
brtt(caAdaCotab
Fig. 5. (A) The overall results of sandwich assay and (B) the over
herapy and this aim has been achieved at research level using strip biosensor, quartz-crystal microbalance (QCM) and surfacelasmon resonance (SPR) sensors [20–22].
CEA marker was detected by Zeng et al. through a strip biosen-or using gold nanoparticles (Au-NP) and the molecular recognitionetween specific antigen and antibody [20]. However, the detection
imit was at higher level (5 ng ml−1) despite the use of Au-NP andore complex method when compare to our work. In another pub-
ication, antibody–antigen interaction was studied to detect humanEA antigen through a quartz crystal microbalance immunosensorased on magnetic composite nanoparticle-functionalized bio-etric interface. By this approach, the detection of CEA in the
oncentration range of 2.5–55 ng ml−1 with 0.5 ng ml−1 detectionimit was studied and the results were compared with a conven-ional ELISA method. While ELISA needed a long time with manyeparate steps and labelling, QCM-based sensor provided approx-mately same results with reproducible, stable and much fastermmunoassay [21] which supports the requirement of developingiosensor technologies for medical diagnostics.
Ladd et al. investigated the direct detection of CEA autoanti-odies for clinical serum samples using a SPR biosensor and theesults were compared with ELISA that showed the same linearrend. Sandwich assay was performed in this study to enhancehe sensor signal in reverse order when compared with our workCEA antigen was initially immobilized to the surface and poly-lonal anti-CEA was then injected to the sensor for measurement)nd ∼48 ng cm−2 average binding of antibody was observed [22].n SPR-based sensor was developed by Su and colleagues for theetection of CEA cancer marker with using not only HBS buffer butlso 10-fold diluted human serum. A 6.2 ng ml−1 and 25 ng ml−1
EA could be detected in buffer and diluted human serum despite
f a complex assay method and the use of various mediator pro-eins for signal amplification [23]. In this study we used a differentpproach and achieved a detect limit of 3 ng ml−1 CEA biomarker inuffer using a simple, reproducible and easily applicable method.ults of RAM-capture assay (all shown data is control subtracted).
Future work will concentrate on developing the method further forserum analysis.
4. Conclusion
The normal range of CEA in serum for an adult non-smoker is<3 ng ml−1 and for a smoker <5.0 ng ml−1. The concentration of CEAmore than 3 ng ml−1 in non-smoker and 5 ng ml−1 in smoker mayindicate lung, colon or breast cancer; therefore the detection ofthis biomarker in the range of 3 ng ml−1 or lower level is requiredfor early diagnosis of cancer markers. In this study homogeneousassay approach with two different methods were implemented todetect an important cancer biomarker using SPR sensor. The diag-nosis could be measured through real-time, label-free technology.Though the detection of cancer markers in real patient samples isslightly more challenging than in buffer samples, this technologyhas provided very promising approach. Here, we have achieved adetection limit of 3 ng ml−1 CEA concentration with a simple assaydesign without the use of assay amplifies such as nanoparticleswhich we can implement to enhance the sensitivity further. Futureresearch will be carried out on using human serum to obtain anassay in human body fluids for the diagnosis of cancer biomarkers.
Acknowledgements
We gratefully acknowledge the EU, ERASMUS Life-Long Learn-ing programme bilateral agreement for providing financial supportfor the study.
References
[1] B.B. Singer, I. Scheffrahn, R. Heymann, K. Sigmundsson, R. Kammerer, B. Obrink,J. Immunol. 168 (2002) 5139–5146.
[2] P. Gold, S.O. Freedman, J. Exp. Med. 121 (1965) 439–462.[3] N. Laboria, A. Fragoso, W. Kemmner, D. Latta, O. Nilsson, M.L. Botero, K. Drese,
C.K. O’Sullivan, Anal. Chem. 82 (2010) 1712–1719.

lanta
[[
[
[
[
[[
[[
[[
Z. Altintas et al. / Ta
[4] W. Limbut, P. Kanatharana, B. Mattiasson, P. Asawatreratanakul, P.Thavarungkul, Anal. Chim. Acta 561 (2006) 55–61.
[5] J.S. Macdonald, Semin. Oncol. 26 (1999) 556–560.[6] National Cancer Institute (NCI). www.cancer.gov.[7] Y. Sakao, S. Tomimitsu, Y. Takeda, M. Natsuaki, T. Itoh, Eur. J. Cardiothorac. Surg.
25 (2004) 520–522.[8] K. Matsuoka, S. Sumitomo, N. Nakashima, D. Nakajima, N. Misaki, Eur. J. Car-
diothorac. Surg. 32 (2007) 435–439.[9] H.S. Jang, K.O. Park, C.D. Kang, J.P. Kim, S.J. Sim, K.S. Lee, Opt. Commun. 282
(2009) (2009) 2827–2830.10] I.E. Tothill, Seminars in Cell & Developmental Biology, vol. 20, 2009, pp. 55–62.
11] D.A. Healy, C.J. Hayes, P. Leonard, L. McKenna, R.O. Kennedy, Trends Biotechnol.25 (2007) 127–133.12] S. Tombelli, M. Minunni, E. Luzi, M. Mascini, Bioelectrochemistry 67 (2005)
135–141.13] Z. Gao, J. Zhang, B.P. Ting, Biosens. Bioelectron. 24 (2009) 1825–1830.
[[
[
86 (2011) 377– 383 383
14] A. Quershi, Y. Gurbuz, W.P. Kang, J.L. Davidson, Biosens. Bioelectron. 25 (2009)877–882.
15] Y. Uludag, I.E. Tothill, Talanta 82 (2010) 277–282.16] R.L. Rich, D.G. Myszka, in: M. Cooper (Ed.), Label-Free Biosensors Techniques
and Applications, Cambridge University Press, 2009.17] T. Iwazawa, T. Kanoh, S. Matsui, T. Monden, Lung Cancer 29 (2000) 254.18] M.J. Duffy, A. van Dalen, C. Haglund, L. Hansson, R. Klapdor, R. Lamerz, O. Nilsson,
C. Sturgeon, O. Topolcan, Eur. J. Cancer 39 (2003) 718–727.19] B. Sahin, V. Paydak, S. Paydas, Eur. J. Cancer 32 (1996) S24.20] Q. Zeng, X. Mao, H. Xu, S. Wang, G. Liu, Am. J. Biomed. Sci. 1 (1) (2009)
70–79.
21] Z.-G. Chen, D.-Y. Tang, Bioprocess Biosyst. Eng. 30 (2007) 243–249.22] J. Ladd, H. Lu, A.D. Taylor, V. Goodell, M.L. Disis, S. Jiang, Colloids Surf. B: Bioin-terfaces 70 (2009) 1–6.23] F. Su, C. Xu, M. Taya, K. Murayama, Y. Shinohara, S. Nishimura, Sensors 8 (2008)
4282–4295, doi:10.3390/s8074282.
Copyright © 2022 FDOKUMEN