Tunable Plasmon Resonances in Two-Dimensional Molybdenum Oxide Nanoflakes
31
1 DOI: 10.1002/((please add manuscript number)) Article type: Communication Tunable Plasmon Resonances in Two-Dimensional Molybdenum Oxide Nanoflakes Manal M. Y. A. Alsaif * , Kay Latham, Matthew R. Field, David D. Yao, Nikhil Medehka, Gary A. Beane, Richard B. Kaner, Salvy Russo, Jian Zhen Ou * , Kourosh Kalantar-zadeh * *Ms. Manal M. Y. A. Alsaif, Mr. David D. Yao, *Dr. Jian Zhen Ou, and *Prof. Kourosh Kalantar-zadeh School of Electrical and Computer Engineering RMIT University, Melbourne, Victoria, Australia E-mail:[email protected], [email protected] and [email protected] Associate Prof. Kay Latham, Prof Salvy Russo and Dr. Matthew R. Field School of Applied Sciences, RMIT University, Melbourne, Victoria, Australia Dr. Nikhil Medehka Department of Materials Engineering, Monash University, Clayton, Victoria, Australia Mr. Gary A. Bean School of Chemistry & Bio21 Institute, University of Melbourne, Parkville, Victoria, Australia Prof. Richard B. Kaner Department of Chemistry & Biochemistry, University of California Los Angeles (UCLA), Los Angeles, CA, USA Keywords: Two dimensional materials; Tunable plasmon resonance; Molybdenum oxide; Solar light; Nanostructure. Abstract: The demonstration of tunable plasmon resonances in two-dimensional (2D) materials is important for the development of future sensors and optical systems based on such nanostructures. Here, we present that in suspended 2D molybdenum oxide flakes, the configuration generates a large depolarization factor and this together with the possibility of ultra-doping enable the realization of visible light plasmon resonances. Ultra-doping process is conducted by exposing the semiconducting 2D MoO 3 flakes to simulated sun, which reduces the flakes’ lateral dimensions by 30%. These flakes are
Transcript of Tunable Plasmon Resonances in Two-Dimensional Molybdenum Oxide Nanoflakes

1
DOI: 10.1002/((please add manuscript number)) Article type: Communication Tunable Plasmon Resonances in Two-Dimensional Molybdenum Oxide Nanoflakes Manal M. Y. A. Alsaif*, Kay Latham, Matthew R. Field, David D. Yao, Nikhil Medehka, Gary A. Beane, Richard B. Kaner, Salvy Russo, Jian Zhen Ou*, Kourosh Kalantar-zadeh* *Ms. Manal M. Y. A. Alsaif, Mr. David D. Yao, *Dr. Jian Zhen Ou, and *Prof. Kourosh Kalantar-zadeh School of Electrical and Computer Engineering RMIT University, Melbourne, Victoria, Australia E-mail:[email protected], [email protected] and [email protected] Associate Prof. Kay Latham, Prof Salvy Russo and Dr. Matthew R. Field School of Applied Sciences, RMIT University, Melbourne, Victoria, Australia Dr. Nikhil Medehka Department of Materials Engineering, Monash University, Clayton, Victoria, Australia Mr. Gary A. Bean School of Chemistry & Bio21 Institute, University of Melbourne, Parkville, Victoria, Australia Prof. Richard B. Kaner Department of Chemistry & Biochemistry, University of California Los Angeles (UCLA), Los Angeles, CA, USA Keywords: Two dimensional materials; Tunable plasmon resonance; Molybdenum oxide; Solar light; Nanostructure. Abstract:
The demonstration of tunable plasmon resonances in two-dimensional (2D) materials is
important for the development of future sensors and optical systems based on such
nanostructures. Here, we present that in suspended 2D molybdenum oxide flakes, the
configuration generates a large depolarization factor and this together with the
possibility of ultra-doping enable the realization of visible light plasmon resonances.
Ultra-doping process is conducted by exposing the semiconducting 2D MoO3 flakes to
simulated sun, which reduces the flakes’ lateral dimensions by 30%. These flakes are

2
consequently transformed into metallic molybdenum oxide, which meets the plasmon
resonance generation conditions, while their 2D morphology is retained. We
demonstrate that the generated plasmon resonances can be tuned by controlling the
doping levels, lateral dimensions of the flakes as well as the exposure to a model protein.
2D materials exhibit certain physical and chemical properties that are fundamentally different
from their bulk counterparts.[1, 2] The electronic and optical properties seen in the selected 2D
materials may lead to significantly altered plasmon dispersion relationships, which provide
opportunities to create new optical systems. Due to such prospects, the field of plasmonics in
2D materials has recently gained increased attention, especially after the recent
demonstrations of plasmon resonances in graphene and topological insulators such as
Bi2Te3.[3, 4] However for graphene and Bi2Te3, such observations are generally limited to the
far infrared (IR) or longer wavelength regions due to insufficient carrier densities and other
intrinsic properties.[4] Obtaining plasmon resonances in the near IR and visible regions is an
importance goal for the development of future sensing and plasmonic data processing units, as
these wavelengths are commonly used in standard optical systems.
In certain nanostructured semiconducting materials, it has been shown that plasmon
resonances in the near IR and visible regions can be achieved by ultra-doping to generate an
appreciable free carrier concentration.[5-7] The same strategy can potentially be implemented
in selected 2D semiconductors. Another concern is the damping losses that should be kept low
for applications such as optical communications, in which a long propagation of waves is
necessary.[7] Reducing such damping losses requires that the product of the effective electron
mass and the free charge mobility must be large in the 2D material. As a result, finding
favorable materials that satisfy the aforementioned conditions are necessary for advancing the
field of 2D plasmonics.

3
The creation of stable 2D semiconducting oxides of tungsten and molybdenum is possible, as
we demonstrated previously.[8, 9] In a recent topical feature article, Gregorieva and Geim have
separated out these oxides as a unique group of 2D materials and predicted their significant
role in the future of planar structures.[10] The impact of these two metal oxides can be
extended into the plasmonic realm, and, in fact, plasmon resonances in the one-dimensional
(1D) morphologies of these two oxides have recently been demonstrated. Manthiram and
Alivisatos reported plasmon resonances in 1D sub-stoichiometric semiconducting tungsten
oxide,[6] while Huang et al. have shown the generation of plasmon resonances in 1D tubular
reduced molybdenum oxide suspensions.[5] Advantageously both tungsten and molybdenum
oxides can be ultra-doped and have also large dielectric constants, which both are important
factors for obtaining plasmon resonances in the near IR and visible regions.[2] In 1D sub-
stoichiometric tungsten and molybdenum oxides, the plasmon resonances are a function of
two modest depolarization factors along the cross section of the 1D structure (Figure 1a -
Supporting Information Section S1 for the equations). However, the existence of one large
depolarization factor reduces the wavelength of the plasmon resonances in 2D structures of
similar stoichiometry.
Accordingly, here, we explore tunable plasmonics in sub-stoichiometric 2D molybdenum
oxide nanoflakes in the visible range. The unique properties of 2D molybdenum oxide such as
the possibility of high level ionic intercalation (hence ultra-doping), large permittivity and the
effect of the depolarization factor in 2D flakes are used for demonstrating tunable plasmon
resonance in this range. We investigate the effect of intercalating ions and changing the lateral
dimensions of the flakes on the plasmon resonance peaks of a reduced quasi-metallic form of
molybdenum oxide.
Molybdenum trioxide (MoO3) is a stable n-type semiconductor under a wide range of
conditions with a band gap of ~3.2 eV, which is capable of adsorbing energy from a small

4
portion of the visible light spectrum.[5, 11] The most frequently observed crystal phases for
MoO3 are the stable orthorhombic α-phase and the metastable monoclinic β-phase.[11] α-MoO3
is of particular interest for the creation of 2D morphologies due to its unique layered structure
(Figure 1b). Its planar units are made of atomically thin double layers that have a thickness of
~1.4 nm, consisting of linked distorted MoO6 octahedra.[11] In each double layer, MoO6
octahedra form corner sharing rows along the a-axis and edge-sharing zigzag rows along the
c-axis.[8] The layers stack up along the b-axis by weak van der Waals’ forces, while
interactions between atoms within the double-layers are dominated by strong covalent
bonding.[12] Due to this unique layered structure, a remarkable compound known as
“molybdenum bronze” can be produced by the intercalation of ions into the van der Waals’
gaps, which is accompanied by the partial reduction of Mo to a lower oxidation state.[5]
Molybdenum bronze displays an intense Prussian blue color, with a metallic luster, and a
range of semiconducting to metallic properties depending on the degree of ion intercalation.
We show that these intercalating ions eventually take oxygen atoms from the 2D crystal,
forming sub-stoichiometric molybdenum trioxide (MoO3-x), which also displays a strong
Prussian blue color and has ordered phases with a highly controlled stoichiometry.
The suspensions of 2D molybdenum oxide in a mixture of DI water and ethanol are produced
using a facile two-step process (see the Experimental Section for details). In brief, the 2D
MoO3 flakes are first produced by a liquid phase exfoliation method from bulk α-MoO3
powder with a combination of mechanical grinding and sonication. The transition process
from 2D MoO3 to intercalated, eventually reduced 2D molybdenum oxide is carried out by
illuminating the 2D flakes in water, under simulated solar light for controlled durations,
producing H+, free electrons and O2 gas.[13] The lateral dimensions and thicknesses of the
flakes are assessed using atomic force microscopy (AFM) and dynamic light scattering (DLS).
Figure 1c represents a typical AFM image of the 2D flakes (Figure S1 in Supporting

5
Information presents an example produced after 5 h of solar light irradiation). Suspensions of
2D MoO3 flakes with average lateral dimensions of ~140, ~70 and ~40 nm are produced.
Their thicknesses typically range from 4 and 6 nm, corresponding to 3 and 4 fundamental
layers.[8] Interestingly, the average lateral dimensions of the flakes after 5 h were reduced by
approximately 30% (Figure 1d), but their thicknesses remained unchanged (Figure S1). The
transmission electron microscopy (TEM) measurements further verify this observation
(Figure S2 and the details are presented in Supporting Information Section S3).
High resolution transmission electron microscopy (HRTEM) is utilized to assess the lattice
arrangement of 2D molybdenum oxide flakes before and after the intercalation process.
Figure 1e shows lattice fringes of the initial 2D molybdenum oxide nanoflakes with a spacing
of 0.39 nm, which is associated with the (1 0 0) plane of α-MoO3. The corresponding
selective area electron diffraction (SAED) pattern is presented in Figure 1f with clearly
distinguishable diffraction spots representing the (2 0 0) and (0 0 2) planes of α-MoO3.[8]
Interestingly, the lattice fringes of the 2D flakes after 5 h of exposure to the solar light are
reduced to 0.34 and 0.36 nm (Figure 1g), which can be indexed to the (4 1 1) and (-6 0 1)
planes of monoclinic Mo4O11, respectively. Figure 1h shows the corresponding SAED pattern
which is attributed to the (0 2 0) and (4 2 2) planes of monoclinic Mo4O11.[14] We believe that
such reduction in the d spacing of the flakes is due to the presence of oxygen vacancies in the
crystal lattice. We suggest that this can explain the lateral dimensional reduction that is
observed in DLS measurements.
The Raman spectra of 2D molybdenum oxide suspensions under different solar light
illumination durations were obtained to investigate the evolution of intercalation (Figure 2a).
Strong Raman peaks are observed at 280, 667, 816 and 991 cm-1 for the starting material,
which are all in good agreement with orthorhombic α-MoO3 (see Supporting Information
Section S4).[15] After 5 min of irradiation, four new Raman peaks appear at 169, 415, 780 and
6
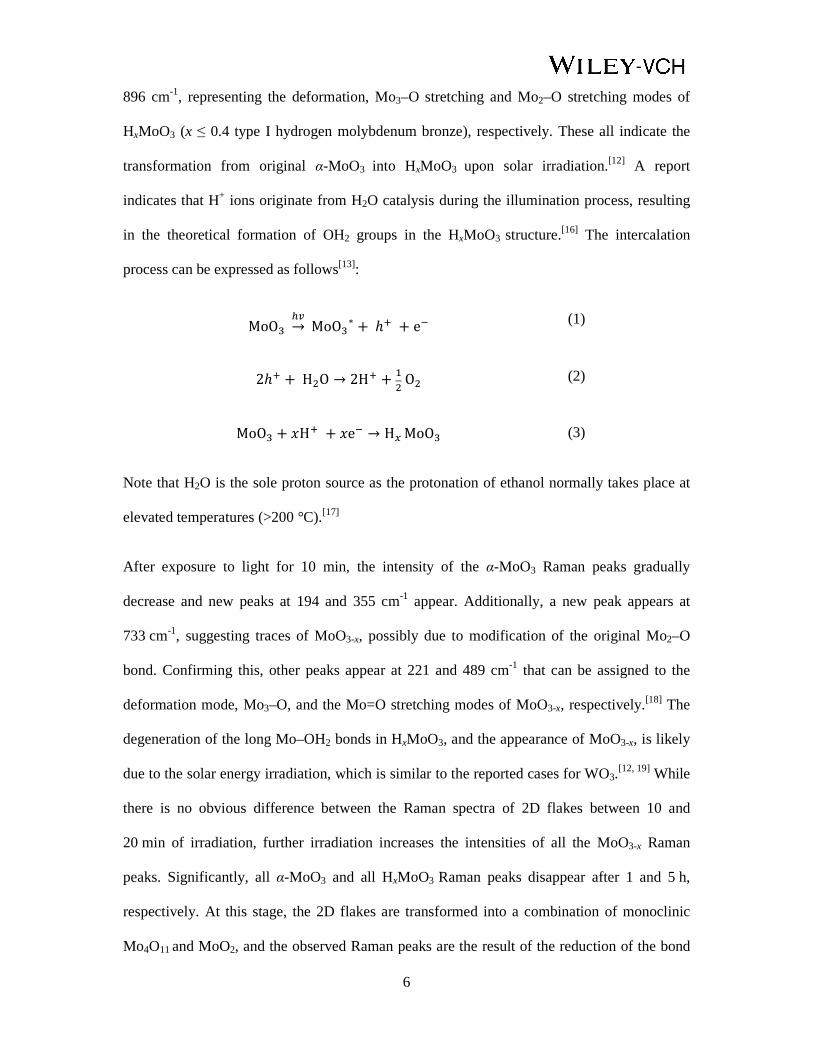
896 cm-1, representing the deformation, Mo3–O stretching and Mo2–O stretching modes of
HxMoO3 (x ≤ 0.4 type I hydrogen molybdenum bronze), respectively. These all indicate the
transformation from original α-MoO3 into HxMoO3 upon solar irradiation.[12] A report
indicates that H+ ions originate from H2O catalysis during the illumination process, resulting
in the theoretical formation of OH2 groups in the HxMoO3 structure.[16] The intercalation
process can be expressed as follows[13]:
MoO MoO∗ +ℎ + e (1)
2ℎ + HO → 2H + O (2)
MoO + H + e → HMoO (3)
Note that H2O is the sole proton source as the protonation of ethanol normally takes place at
elevated temperatures (>200 °C).[17]
After exposure to light for 10 min, the intensity of the α-MoO3 Raman peaks gradually
decrease and new peaks at 194 and 355 cm-1 appear. Additionally, a new peak appears at
733 cm-1, suggesting traces of MoO3-x, possibly due to modification of the original Mo2–O
bond. Confirming this, other peaks appear at 221 and 489 cm-1 that can be assigned to the
deformation mode, Mo3–O, and the Mo=O stretching modes of MoO3-x, respectively.[18] The
degeneration of the long Mo–OH2 bonds in HxMoO3, and the appearance of MoO3-x, is likely
due to the solar energy irradiation, which is similar to the reported cases for WO3.[12, 19] While
there is no obvious difference between the Raman spectra of 2D flakes between 10 and
20 min of irradiation, further irradiation increases the intensities of all the MoO3-x Raman
peaks. Significantly, all α-MoO3 and all HxMoO3 Raman peaks disappear after 1 and 5 h,
respectively. At this stage, the 2D flakes are transformed into a combination of monoclinic
Mo4O11 and MoO2, and the observed Raman peaks are the result of the reduction of the bond

7
lengths between metal and oxygen atoms.[20] This is again in agreement with our DLS and
HRTEM observations.
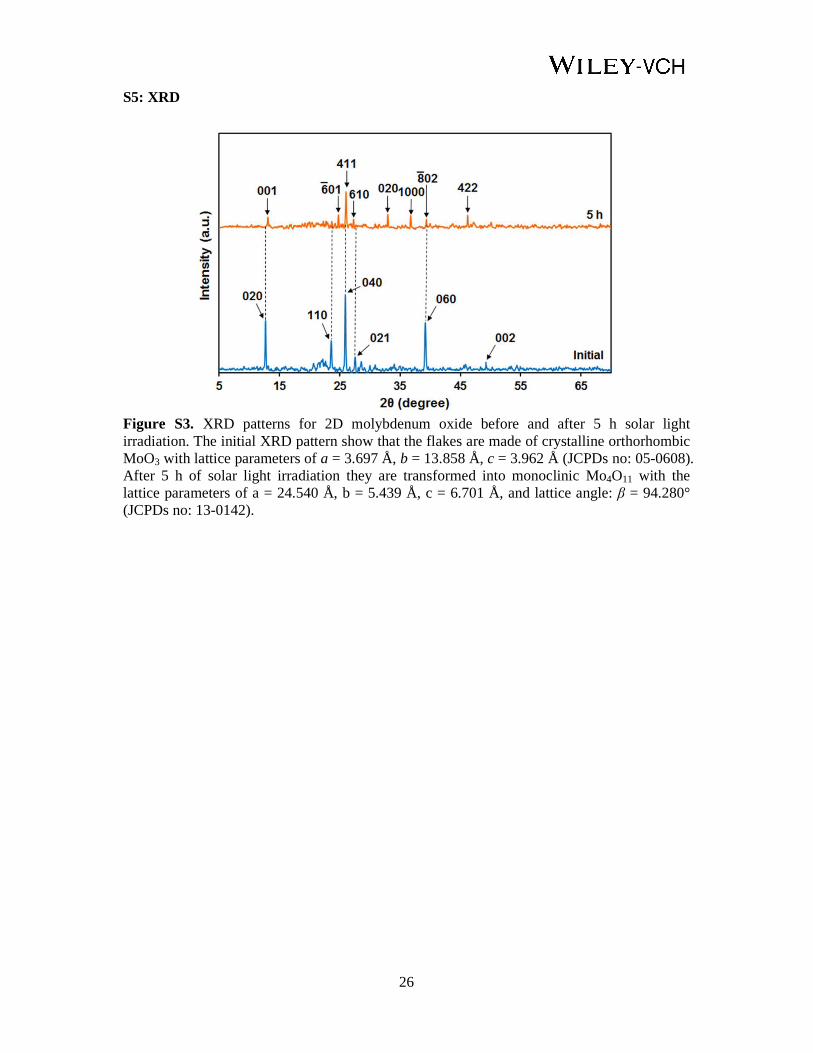
In addition to Raman spectroscopy, the crystal structures of the 2D flakes before and after the
solar light irradiation are investigated using X-ray diffraction (XRD) analysis. According to
Figure S3, while the peaks of the initial flakes are perfectly matched to orthorhombic α-MoO3,
it is found that the illuminated 2D flakes after 5 hours exhibit a dominant crystal phase of
monoclinic Mo4O11, as new peaks appear at 24.7, 33, 36.7 and 46.2° 2θ, corresponding to the
( 6 1 0), (0 2 0), (10 0 0), and (4 2 2) planes of this compound, respectively.[21] X-ray
photoelectron spectroscopy (XPS) is used to identify the stoichiometry of the 2D flakes as
shown in Figures 2b,c. The doublets at 235.98 and 232.68 eV are attributed to the binding
energies of the 3d3/2 and the 3d5/2 orbital electrons of Mo6+, respectively. The integral areas
between the two doublets are in a 2:3 ratio and the energy gap between them is 3.1 eV, in
agreement with α-MoO3 as reported by Hu et al.[22] After 5 min of solar light irradiation, two
new peaks centered at 234.58 and 231.28 eV appear in the Mo 3d core level spectrum
(Figure 2b). These peaks are at lower binding energy compared to Mo6+, indicating the
appearance of the Mo5+ oxidation state in the flakes. The intensities of these Mo5+ peaks
increase with the irradiation duration and become comparable to the intensities of the Mo6+
peaks after 5 h, suggesting a significant sub-stoichiometry for the 2D flakes. Figure 2c
represents valence band information of the flakes. A weak peak (small hump) close to the
Fermi energy is found after 10 min of solar light irradiation. This weak peak corresponds to
the overlap of the electron wave functions in oxygen vacancies associated with the occupied
Mo 4d states.[23, 24] By increasing the irradiation duration, the small hump shifts towards the
valence band region and its intensity increases, suggesting that the initial molybdenum oxide
flakes gradually lose their semiconducting properties and become metallic.[24, 25] These
observations are consistent with the Raman spectra and XRD analyses.

8
The semiconductor to metal transition is also evident from resistivity and photoluminescence
(PL) measurements. The resistivity measurements show a strong transformation of the flakes
from semiconducting to metallic when they are reduced from MoO3 to Mo4O11 (Figure S4 and
the details are presented in Supporting Information Section S6). Moreover, Figure S6 shows
PL spectra of 2D molybdenum oxide flakes at different time intervals under the excitation
wavelength of 300 nm. For the pristine MoO3 flakes, three strong PL peaks can be seen at
435 nm (2.86 eV), 450 nm (2.76 eV) and 465 nm (2.67 eV),[26] all representing radiative
recombination of interband electrons and holes in MoO3 crystals.[27] Interestingly, the
intensities of these PL peaks gradually decrease and eventually vanish as the solar light
irradiation continues. This provides evidence for the metallic nature of the irradiated flakes.
Density functional theory (DFT) calculations are also carried out to further elucidate the
transition from semiconducting α-MoO3 to metallic Mo4O11 (see Figure S5 and the details are
presented in Supporting Information Section S7). The theoretical results confirm that Mo4O11
is metallic and MoO2 has a bandgap, suggesting that after the reduction process using the
solar light, Mo4O11 is the only substoichiometric molybdenum oxide option that can produce
plasmon resonances.
The optical properties of the molybdenum oxide flakes upon solar light irradiation are also
investigated using UV-vis spectroscopy. Figure 3a shows the optical images of the samples
before, during and after illumination for different durations. The suspension containing 2D
molybdenum oxide flakes starts with a bright yellow/blue color and gradually turns dark blue
as the irradiation time increases. Figure 3b represents the UV-vis spectra of the corresponding
samples. While there is no obvious absorption peak in the visible light region for pristine 2D
MoO3 flakes, an optical absorption band centered at 760 nm appears after 5 min of irradiation.
The intensity of this absorption band gradually increases and blue-shifts when the solar light
irradiation duration increases and eventually the center of the absorption band reaches

9
~700 nm after 5 h of irradiation. The results from XPS, resistivity and PL measurements
confirm the augmentation of the free electron concentration in the flakes and the increase of
the oxygen vacancies after solar light irradiation. As such, we ascribe this absorption band to
the plasmonic resonance of the quasi-metallic 2D flakes. The broad features of these
plasmonic bands are mainly associated with the polydispersity of the 2D flakes as being
evident in Figure 1d.
The measured plasmonic resonance peak of the flakes is consistent with the calculations based
on Mie-Gans theory (Details are presented in Supporting Information Section S1) for
scattering and absorption in 2D materials, further confirming the existence of the plasmonic
band.[6, 7, 28] In these calculations the lateral dimensions of the flakes are assumed to be
~100 nm, the thickness of the flake ~6 nm, the high-frequency relative dielectric constant
( ) for the reduced molybdenum oxide to be 20, the charge carrier density (N) 8.5 × 10²¹
cm−3 and the effective mass of an electron 0.2m0.2 The values suggest the importance of the
high permittivity, the effect of the 2D morphology (hence the depolarization factor) and the
ultra-doping to obtain plasmonic resonance peaks in the visible region. If the same numbers
are fed into the parameters of the 1D reduced molybdenum oxide structure reported by Huang
et al.[5] a 1.51 times reduction in the wavelength is calculated. The measured reduction in the
wavelength is 1.45 times, which strongly supports the initial hypothesis.
The plasmonic response is also known to be strongly size-dependent.[29] In order to explore
these unique plasmonic features in molybdenum oxides, the optical properties of flakes (after
2 h of solar light irradiation) with different average lateral dimensions of ~100, ~50 and
~25 nm were investigated (see Methods Section for synthesis details). According to Figure 3c,
the plasmonic band red-shifts from ~730 to ~750 nm as the lateral dimension is reduced. This
again agrees with the Mie-Gans calculation (inset in Figure 3c) and this phenomenon has also
been seen in the case of heavily doped semiconductors and WO2.82 nanorods.[6, 29, 30]

10
In order to further exploit the applicability of these 2D plasmonic molybdenum oxide flakes,
an optical biosensing system is devised in which bovine serum albumin (BSA) is chosen as a
model protein for assessing the sensitivity. We have previously shown that BSA has a very
high affinity to molybdenum oxide and is readily immobilized onto the surface of oxide
flakes.[31] The suspended 2D flakes obtained after 2 h of solar irradiation are used in these
experiments. From Figure 4a, it is found that the intensity of plasmonic absorption peak of
the suspended 2D flakes is significantly reduced in the presence of BSA (after 1 h of
incubation together with the flakes) with the concentration as low as ~0.15 mg ml-1. Further
increase of the BSA concentration up to ~15 mg ml-1 results in the rapid decrease of the
plasmonic peak intensity, which is evident in Figures 4a ,b.
The BSA immobilization on the oxide surface is achieved via collective van der Waals’ forces
and electrostatic interactions between the protein functional groups and the surface of
flakes.[31, 32] As such, the alternation of the plasmonic features in the 2D flakes is likely not
due to the chemical modification of the oxide crystal but the manipulation of the boundaries
that alters the electronic properties. The negatively charged immobilized BSA repels the free
electrons that are originally accommodated on the ultra-doped flakes surface.[31] This leads to
a decrease in the free electron density near the surface of the flakes, hence the reduction in the
intensity of the surface plasmon resonance peak.
In summary, the presented facile, solar light driven process demonstrates that by controlling
the oxygen vacancies in molybdenum flakes, active tuning of the plasmonic response in 2D
molybdenum oxide is possible. Simply by irradiating the suspension of 2D flakes in the
presence of water with solar energy, we induce oxygen deficiencies in the 2D flakes which
are completely stable both before and after the process. Interestingly, the dimensions of the
flakes shrink by ~30% after losing oxygen, while the structure still remains stable 2D. The
application of these 2D plasmonic flakes was also demonstrated in a model biosensing system.

11
Several unique properties of molybdenum oxide provide the key features to obtain the tunable
2D plasmon resonance in the visible region. This includes the ability of molybdenum oxide
flakes to accept a large number of intercalating ions (hence the possibility of ultra-doping),
their high permittivity, and morphological aspects resulting in a favorable depolarization
factor. These properties create strong plasmonics in reduced 2D molybdenum oxides. The 2D
molybdenum oxide presented is a novel material for developing 2D plasmonic systems with a
high degree of controllability. Such systems could be efficiently incorporated into future low-
dimensional sensing and optical systems.
Experimental Section
3 g of the MoO3 powder (99% purity, from China Rare Metal Material Co.) was grounded
with 0.6 ml acetonitrile for 30 min. The powder was then dispersed in a 50 vol %
ethanol/water mixture (45 ml), probe-sonicated (Ultrasonic Processor GEX500) for 120 min
at the power of 125 W, and then centrifuged at 6000 rpm for 30 min at room temperature. The
yellow/blue supernatant containing high concentration of 2D molybdenum oxide flakes was
collected and drop-casted onto eight small containers with 3 ml of the suspension in each
eight samples. Then, the samples were irradiated under the sun simulator (Abet Technologies
LS-150), at the power of 100 mW cm-2 for different time intervals of 5 min, 10 min, 20 min,
30 min, 1 h, 2 h and 5 h. Flakes with different lateral dimensions were obtained by putting the
suspension through filters with different pore sizes. Suspensions of 2D flakes with average
lateral dimensions of ~140, ~70, and ~40 nm were obtained. These lateral dimensions of these
flakes were reduced to ~100, ~50 and ~25 nm after 2 h of illumination.
Bruker Multimode 8 AFM was used for analyzing the surface topography. The SEM images
were obtained using a FEI Nova NanoSEM. The Raman measurements were performed using

12
a Horiba TRIAX 320 Raman spectroscopy. The DLS analysis was obtained using an ALV
5022F spectroscopy. The XRD patterns were collected using a Bruker D4 ENDEAVOR. The
2D molybdenum oxide flakes supernatant samples (at initial stage and after 5 h solar light
irradiation), were dropped onto Cu grids for TEM (JEOL 1010) and HRTEM (JEOL 2100F)
characterization. The XPS was performed using a Thermo Scientific K-alpha instrument with
an Al Kα source. The PL spectra were obtained using a Horiba Jobin Yvon Fluorolog-3 at the
excitation wavelength of 300 nm. The absorbance spectra of the 2D molybdenum oxide
nanoflakes were examined using a spectrophotometric system consisting of a Micropack DH-
2000 UV-vis-NIR light source and an Ocean Optics HR4000 spectrophotometer. To assess
the biosensing capability of 2D molybdenum oxide flakes, 2 ml of BSA solutions (Invitrogen)
with concentrations of 0.15, 1.5 and 15 mg ml-1 were incubated with 1 ml of suspended
nanoflakes solution (after 2 h solar light irradiation) for 1 h. Their absorption spectra were
measured subsequently.
Supporting Information
Supporting Information is available from the Wiley Online Library or from the author
Acknowledgements
The authors would like to acknowledge the facilities, scientific and technical assistances of
the Australian Microscopy and Microanalysis Research Facility, Microscopy and
Microanalysis Facility at RMIT University and Australian Centre for Materials Science and
Engineering (CMSE) of the Commonwealth Scientific and Industrial Research Organization
(CSIRO).
Received: ((will be filled in by the editorial staff)) Revised: ((will be filled in by the editorial staff))
Published online: ((will be filled in by the editorial staff))

13
[1] Q. H. Wang, K. Kalantar-Zadeh, A. Kis, J. N. Coleman, M. S. Strano, Nature
Nanotech. 2012, 7, 699; M. Xu, T. Liang, M. Shi, H. Chen, Chem. Rev. 2013, 113, 3766.
[2] S. Balendhran, S. Walia, H. Nili, J. Z. Ou, S. Zhuiykov, R. B. Kaner, S. Sriram, M.
Bhaskaran, K. Kalantar-Zadeh, Adv. Funct. Mater. 2013, 23, 3952.
[3] Z. Fei, A. S. Rodin, G. O. Andreev, W. Bao, A. S. McLeod, M. Wagner, L. M. Zhang,
Z. Zhao, M. Thiemens, G. Dominguez, M. M. Fogler, A. H. C. Neto, C. N. Lau, F. Keilmann,
D. N. Basov, Nature 2012, 487, 82; P. Di Pietro, M. Ortolani, O. Limaj, A. Di Gaspare, V.
Giliberti, F. Giorgianni, M. Brahlek, N. Bansal, N. Koirala, S. Oh, P. Calvani, S. Lupi, Nature
Nanotech. 2013, 8, 556.
[4] L. Ju, B. Geng, J. Horng, C. Girit, M. Martin, Z. Hao, H. A. Bechtel, X. Liang, A.
Zettl, Y. R. Shen, F. Wang, Nature Nanotech. 2011, 6, 630.
[5] Q. Huang, S. Hu, J. Zhuang, X. Wang, Chem. Eur. J. 2012, 18, 15283.
[6] K. Manthiram, A. P. Alivisatos, J. Am. Chem. Soc. 2012, 134, 3995.
[7] G. V. Naik, V. M. Shalaev, A. Boltasseva, Adv. Mater. 2013, 25, 3264.
[8] K. Kalantar-Zadeh, J. Tang, M. Wang, K. L. Wang, A. Shailos, K. Galatsis, R. Kojima,
V. Strong, A. Lech, W. Wlodarski, R. B. Kaner, Nanoscale 2010, 2, 429.
[9] K. Kalantar-zadeh, A. Vijayaraghavan, M.-H. Ham, H. Zheng, M. Breedon, M. S.
Strano, Chem. Mater. 2010, 22, 5660.
[10] A. K. Geim, I. V. Grigorieva, Nature 2013, 499, 419.
[11] D. D. Yao, J. Z. Ou, K. Latham, S. Zhuiykov, A. P. O’Mullane, K. Kalantar-zadeh,
Cryst. Growth Des. 2012, 12, 1865.
[12] J. Z. Ou, J. L. Carnpbell, D. Yao, W. Wlodarski, K. Kalantar-zadeh, J. Phys. Chem. C
2011, 115, 10757.
[13] L. Zheng, Y. Xu, D. Jin, Y. Xie, Chem. Mater. 2009, 21, 5681.

14
[14] J. Słoczyn´ski, W. Bobin´ski, J. Solid State Chem. 1991, 92, 436; T. Ressler, R. E.
Jentoft, J. Wienold, O. Timpe, J. Synchrotron Rad 2001, 8, 683.
[15] K. Eda, J. Solid State Chem. 1992, 98, 350.
[16] S. Adams, J. Solid State Chem. 2000, 149, 75.
[17] R. L. Smith, G. S. Rohrer, J. Catal. 1998, 173, 219.
[18] G. Mestl, P. Ruiz, B. Delmon, H. Knozinger, J. Phys. Chem. 1994, 98, 11269; P. A.
Spevack, N. S. McIntyre, J. Phys. Chem. 1993, 97, 11020.
[19] J. Y. Luo, S. Z. Deng, Y. T. Tao, F. L. Zhao, L. F. Zhu, L. Gong, J. Chen, N. S. Xu, J.
Phys. Chem. C 2009, 113, 15877.
[20] M. Dieterle, G. Weinberg, G. Mestl, Phys. Chem. Chem. Phys. 2002, 4, 812; M.
Dieterle, G. Mestl, Phys. Chem. Chem. Phys. 2002, 4, 822.
[21] T. Ressler, R. E. Jentoft, J. Wienold, M. M. Gunter, O. Timpe, J. Phys. Chem. B 2000,
104, 6360; A. Khademi, R. Azimirad, Y.-T. Nien, A. Moshfegh, J. Nanopart. Res. 2011, 13,
115.
[22] X. K. Hu, Y. T. Qian, Z. T. Song, J. R. Huang, R. Cao, J. Q. Xiao, Chem. Mater. 2008,
20, 1527.
[23] D. O. Scanlon, G. W. Watson, D. J. Payne, G. R. Atkinson, R. G. Egdell, D. S. L. Law,
J. Phys. Chem. C 2010, 114, 4636.
[24] J. W. Rabalais, R. J. Colton, A. M. Guzman, Chem. Phys. Lett. 1974, 29, 131.
[25] T. H. Fleisch, G. W. Zajac, J. O. Schreiner, G. J. Mains, Appl. Surf. Sci. 1986, 26, 488.
[26] I. Navas, R. Vinodkumar, V. P. Mahadevan Pillai, Appl. Phys. A: Mater. Sci. Process.
2011, 103, 373.
[27] L. X. Song, J. Xia, Z. Dang, J. Yang, L. B. Wang, J. Chen, CrystEngComm 2012, 14,
2675; J. Song, X. Ni, D. Zhang, H. Zheng, Solid State Sci. 2006, 8, 1164.
[28] G. C. Papavassiliou, Prog. Solid State Chem. 1979, 12, 185.
[29] P. K. Jain, J. Luther, T. Ewers, A. P. Alivisatos, Nat. Mater. 2011, 10, 361.

15
[30] S. Link, M. A. El-Sayed, Int. Rev. Phys. Chem. 2000, 19, 409.
[31] S. Balendhran, S. Walia, M. Alsaif, E. P. Nguyen, J. Z. Ou, S. Zhuiykov, S. Sriram, M.
Bhaskaran, K. Kalantar-zadeh, ACS Nano 2013, 7, 9753.
[32] P. Silva-Bermudez, S. E. Rodil, S. Muhl, Appl. Surf. Sci. 2011, 258, 1711; L. Song, K.
Yang, W. Jiang, P. Du, B. Xing, Colloids Surf., B 2012, 94, 341.

16
Figure 1. (a) Shifts in the plasmon resonance peak of 1D and 2D tungsten oxides at various aspect ratios based on parameters suggested by Manthiram and Alivisatos (see Supporting Information Section S1).[6] (b) Crystal structure of α-MoO3. (c) The AFM image of a 2D molybdenum oxide flake. (d) The DLS graph of 2D flakes before and after simulated solar light irradiation. (e) and (f) A HRTEM image and the corresponding SAED pattern of a non-intercalated 2D flake. (g) and (h) A HRTEM image and the corresponding SAED pattern of a 2D flake after 5 h of solar light irradiation.

17
Figure 2. (a) The Raman spectra of 2D molybdenum oxide flakes exposed to simulated solar light for different durations. (b) XPS Mo 3d spectra of 2D molybdenum oxide flakes at different solar light irradiation durations. (c) The corresponding XPS valence bands at different solar light irradiation durations.

18
Figure 3. (a) Optical images of the 2D flakes suspensions at different solar light irradiation durations. (b) UV-vis absorbance spectra of the samples before and after solar light irradiation. (c) Normalized absorption spectra of 2D flakes with different lateral dimensions after 2 h of irradiation. The inset shows the comparison between measured and theoretically calculated plasmon resonance peaks for the short-axis mode of 2D molybdenum oxides.

19
Figure 4. (a) Normalized absorption spectra of 2D molybdenum oxide flakes after 2 h solar light irradiation and after being incubated with different BSA concentrations of 0 (green line), 0.15 (pink line), 1.5 (yellow line) and 15 mg ml-1 (blue line) for 1 h. (b) The corresponding response factors of the biosensor as a function of the BSA concentration. The response factor is defined as the ratio of the absorbance value of the initial flakes at the resonance peak over that of the flakes’ absorbance after the incubation of BSA for 1 h.

20
We demonstrate tunable plasmon resonances in suspended 2D molybdenum oxide flakes. The
2D configuration generates a large depolarization factor and the possibility of ultra-doping
produce visible light plasmon resonances. Ultra-doping process is conducted by reducing the
semiconducting 2D MoO3 flakes using simulated sun. The generated plasmon resonances can
be controlled by the doping levels, the flakes’ lateral dimensions as well as exposure to a
model protein.
Keyword: Two dimensional materials; Tunable plasmon resonance; Molybdenum oxide; Solar light; Nanostructure. Manal M. Y. A. Alsaif*, Kay Latham, Matthew R. Field, David D. Yao, Nikhil Medehka, Gary A. Beane, Richard B. Kaner, Salvy Russo, Jian Zhen Ou*, Kourosh Kalantar-zadeh* Title : Tunable Plasmon Resonances in Two-Dimensional Molybdenum Oxide Nanoflakes
ToC figure

21
Copyright WILEY-VCH Verlag GmbH & Co. KGaA, 69469 Weinheim, Germany, 2013.
Supporting Information
Tunable Plasmon Resonances in Two-Dimensional Molybdenum Oxide Nanoflakes Manal M. Y. A. Alsaif*, Kay Latham, Matthew R. Field, David D. Yao, Nikhil Medehka, Gary A. Beane, Richard B. Kaner, Salvy Russo, Jian Zhen Ou*, Kourosh Kalantar-zadeh*
S1: Theoretical plasmon resonance peak calculations
According to Mie-Gans theory the extinction coefficient is given by[S1]:
ωε 1"#$ + 1 − "#"# $ + # &S1(
whereω is the angular frequency of incident light; ε is the dielectric constant of the
medium, ε and ε are the real and imaginary terms of the dielectric function ε (ω) of the
suspended material, respectively and the "# are the depolarization factors for axes (a, b and c).
The depolarization factors for a one-dimensional (1D) material are[S1]:
P* = 1 − ,, 12, ln /1 + ,1 − ,0 − 1$&S2(
P1 = P2 = 1 − P*2 &S3( in which the , factor is:
, = 4a − ba 7/ &S4(

22
The depolarization factors for a two-dimensional (2D) material are[S1]:
P1 = 1, :1 − 41 − ,, 7 sin ,=&S5( P* = P2 = 1 − P12 &S6(
in which the , factor is:
, = 4a − ba 7/ &S7( Both parameters for 1D and 2D calculations are based on the values suggested by Manthiram
and Alivisatos.[S2] Aspect ratios in both 1D and 2D systems are defined as the length over
thickness. The lateral dimensions are considered to be equal in the 2D system.
The dielectric function is described by the Lorentz model[S1]:
&A( = + i = − ABA + iγA&S8(
in which AB is the bulk plasma frequency, is the high-frequency relative dielectric constant
which is equal to 1 and γ is the damping coefficient of the resonance.
AB = E FGHIJ &S9( where the charge carrier density (F ) is 6 × 1021 cm-3, H is the permittivity of free space, and
the effective mass of an electron isIJ=IL
γ = 1M = GNIJ &S10( where τ is the scattering time of an electron and the conductivity (σ ) is 2 × 10³
Ω-1 cm-1.

23
S2: AFM
Figure S1. The AFM images of drop casted 2D molybdenum oxide flakes (a) before solar light irradiation and (b) after 5 h solar light irradiation.

24
S3: TEM and HRTEM
Our statistical analysis shows that the lateral dimensions of the nanoflakes were reduced by an
average value of 30% after the solar light irradiation. Figures S2a,b present some typical
examples of the TEM images. A HRTEM image in Figure S2c shows the layered nature of the
2D nanoflakes.
Figure S2. (a) A TEM image of 2D flakes before solar light irradiation. (b) A TEM image of 2D flakes after 5 h solar light irradiation. (c) A HRTEM image showing the layered nature of a 2D flake.

25
S4: Raman peak shifts of MoO3
The 280 cm-1 peak represents the bending mode for the double bond (Mo=O) vibration. The
667 cm-1 peak is assigned to the triply coordinated oxygen (Mo3–O) stretching mode, which
results from edge-shared oxygen atoms in common to the three adjacent octahedra. The
816 cm-1 peak is related to the doubly coordinated oxygen (Mo2–O) stretching mode, which
results from corner-sharing oxygen atoms common to the two octahedra, The 991 cm-1 peak is
assigned to the terminal oxygen (Mo6+=O) stretching mode, which resulted from an unshared
oxygen. Other peaks at 334 and 373 cm-1 can be assigned to Mo3–O and Mo=O bending
modes, respectively. In addition, the weak peak at 240 cm-1 is assigned to the bending mode
of Mo2–O and finally the three peaks at 122, 146 and 194 cm-1 are all represent the lattice
deformation modes.[S3]
26
S5: XRD
Figure S3. XRD patterns for 2D molybdenum oxide before and after 5 h solar light irradiation. The initial XRD pattern show that the flakes are made of crystalline orthorhombic MoO3 with lattice parameters of a = 3.697 Å, b = 13.858 Å, c = 3.962 Å (JCPDs no: 05-0608). After 5 h of solar light irradiation they are transformed into monoclinic Mo4O11 with the lattice parameters of a = 24.540 Å, b = 5.439 Å, c = 6.701 Å, and lattice angle: β = 94.280° (JCPDs no: 13-0142).

27
S6: Resistivity measurements
In order to measure the resistivity of the 2D molybdenum oxides as a function of solar light
irradiation duration, the supernatants containing the 2D nanoflakes are drop-casted onto glass
substrates with the area of 10 × 10 mm2 and dried at room temperature. The film thicknesses
of the samples are measured to be approximately 500 nm by SEM cross sectional assessments
as shown in the Figure S4b. The resistances of the samples are measured using a digital
source meter (Keithley 2602).
Figure S4a presents the resistivity of the 2D molybdenum oxides flakes upon exposure to
solar light up to 5 h. The resistivity of the initial sample (pristine α-MoO3) was in the range of
~102103 Ω cm, which is close to the values of nanostructured MoO3 reported in literature.[S4]
Upon the exposure of solar light, the resistivity of the flakes decreased exponentially and
finally reached ~10-210-3 Ω cm for 5 h irradiation, which is more than four orders of
magnitude reduction as compared to pristine α-MoO3. Although the measured resistivity is
slightly higher than those reported in monoclinic Mo4O11 possibly due to the existence of
inter-flakes resistances,[S5] this does not affect the conclusion that a significant amount of free
electrons were introduced into the molybdenum oxide flakes upon the solar light irradiation.
Figure S4. (a) Resistivity plot of the nanostructured thin films made of 2D molybdenum oxide flakes in relation to the solar light exposure duration. (b) The cross-sectional SEM image of the nanostructured thin film.

28
S7: DFT calculations
Spin-dependent hybrid density functional theory (DFT) calculations are performed using
Gaussian basis set ab initio package CRYSTAL09.[S6] A hybrid exchange-correlation
functional is used based on the PBE0 model with the Hartree - Fock to density functional
exchange ratio set to 0.2.[S7] The Mo basis set used a Hay-Wadt type effective core pseudo-
potential to account for the core Mo electrons (1s22s22p63s23p63d10) and a 311-31G basis set
for the valance electrons. This basis set is previously used by Cora et.al. to study α-MoO3.[S8]
For an oxygen atom, all electrons 8-411d1 basis set is used as previously by Cora.[S9] The
initial structures for monoclinic MoO2,[S10] α-MoO3
[S11] and monoclinic Mo4O11[S12]
are
obtained from the published literature and then geometry-optimized using CRYSTAL09. The
forces on all atoms after optimization are less than 18 meV/A.
Figures S5a-c shows the atom projected electronic density of states (e-dos) for MoO3, MoO2
and Mo4O11, respectively. In this figure the energy scale for density of states is shifted so that
the Fermi level is at zero in each case. For MoO3 and MoO2 the calculated band-gaps are 3.5
and 1.6 eV, respectively. Mo4O11 however is predicted to be metallic with occupied bands
corresponding to Mo and O across the Fermi-level. Atomic orbital decomposition of the e-
doss is also performed. It is noted that the 3d orbitals in the Mo basis set for these calculations
are part of the pseudo-potential and are not observed. The projections indicate that for MoO2
and MoO3 major orbitals that contributed near the valance band maximum region are the 5p
orbitals for Mo and the 2p orbitals for O. For Mo4O11 the major orbitals contributed to the
bands which spanned the Fermi level are also 5p for Mo and 2p for O.

29
Figure S5. Density of states calculated by DFT of (a) α-MoO3, (b) Monoclinic Mo4O11 and (c) Monoclinic MoO2.

30
S8: PL measurements
Figure S6. PL spectra of suspensions containing 2D molybdenum oxide flakes after different solar light irradiation durations at the excitation wavelength of 300 nm.

31
References:
[S1] G. C. Papavassiliou, Prog. Solid State Chem. 1979, 12, 185.
[S2] K. Manthiram, A. P. Alivisatos, J. Am. Chem. Soc. 2012, 134, 3995.
[S3] K. Eda, J. Solid State Chem. 1992, 98, 350; G. Mestl, P. Ruiz, B. Delmon, H.
Knozinger, J. Phys. Chem. 1994, 98, 11269.
[S4] X. K. Hu, Y. T. Qian, Z. T. Song, J. R. Huang, R. Cao, J. Q. Xiao, Chem. Mater. 2008,
20, 1527; L. Mai, F. Yang, Y. Zhao, X. Xu, L. Xu, B. Hu, Y. Luo, H. Liu, Mater. Today 2011,
14, 346; B. Hu, L. Mai, W. Chen, F. Yang, ACS Nano 2009, 3, 478.
[S5] R. L. Smith, G. S. Rohrer, J. Solid State Chem. 1996, 124, 104.
[S6] R. Dovesi, R. Orlando, B. Civalleri, C. Roetti, V. R. Saunders, C. M. Zicovich-Wilson,
Z. Kristallogr 2005, 220, 571.
[S7] C. Adamo, V. Barone, J. Chem. Phys. 1999, 110, 6158.
[S8] F. Cora, A. Patel, N. M. Harrison, C. Roetti, C. R. A. Catlow, J. Mater. Chem. 1997, 7,
959.
[S9] F. Cora, Mol. Phys. 2005, 103, 2483.
[S10] D. E. Cox, R. J. Cava, D. B. McWhan, D. W. Murphy, J. Phys. Chem. Solids 1982, 43,
657.
[S11] H. Negishi, S. Negishi, Y. Kuroiwa, N. Sato, S. Aoyagi, Phys. Rev. B 2004, 69,
064111.
[S12] M. Ghedira, H. Vincent, M. Marezio, J. Marcus, G. Furcaudot, J. Solid State Chem.
1985, 56, 66.