Temperature-dependent sensitivity of surface plasmon resonance sensors at the gold–water interface
9
Sensors and Actuators B 134 (2008) 854–862 Contents lists available at ScienceDirect Sensors and Actuators B: Chemical journal homepage: www.elsevier.com/locate/snb Temperature-dependent sensitivity of surface plasmon resonance sensors at the gold–water interface C.S. Moreira a,b , A.M.N. Lima a,∗ , H. Neff a , C. Thirstrup c a Universidade Federal de Campina Grande (UFCG), Department of Electrical Engineering, 58109-970 Campina Grande, PB, Brazil b CEFET-AL, Department of Electronic, 57020-510 Maceió, AL, Brazil c Coloplast A/S, Holtedam 1, 3050 Humlebæk, Denmark article info Article history: Received 25 October 2007 Received in revised form 24 May 2008 Accepted 20 June 2008 Available online 5 July 2008 Keywords: Surface plasmon resonance Line broadening Temperature dependence Drude model abstract Instrumental performance and sensitivity of surface plasmon polariton or resonance (SPR) sensors are cru- cially affected by ambient temperature fluctuations. Apart from temperature-induced opto-mechanical displacements, resonance conditions and associated output quantities vary, due to thermo-physical prop- erties of optical components, like prism, semi-transparent metal-film and aqueous analyte solution. The variation of instrumental sensitivity S as function of environmental temperature has been exploited exper- imentally in the temperature region 275 K <T< 320 K. A compact, robust commercial SPR device has been used, operating in the angular interrogation mode. At temperature < 300 K, S steadily deteriorates from 120 ◦ /RIU to 30 ◦ /RIU. For comparison, the thermal device characteristics also has been evaluated the- oretically within the range 273 K <T< 370 K for both, angular interrogation mode (AIM) and wavelength interrogation mode (WIM). Fresnel’s equation system and established analytical sensitivity expressions have been elaborated, and differences assigned to simplifications in the analytical form. An appropriate thermo-physical data set of experimentally verified optical materials parameters n(, T ) and ε(, T ) for all, BK7 glass prism, gold metal film, and aqueous analyte has been used. A singularity has been identified in the simulations near the freezing point of water, while a soft transition appears in the experiment. Towards higher device temperatures at 300 K <T< 370 K,S , decreases weakly. The effect is more pro- nounced at shorter wavelength ≤550nm, and in the wavelength interrogation mode. A steady increase towards higher T was observed for the SPR-line broadening parameter in the AIM, but a distinct maximum resolved at 305 K for wavelength interrogation. © 2008 Elsevier B.V. All rights reserved. 1. Introduction The resonant optical excitation and propagation of coherent charge density oscillations at the metal–dielectric interface is a well-known physical effect, denoted as the surface plasmon polari- ton or resonance (SPR) [1,2]. Since Turbadar’s early work [3], the SPR phenomenon has been identified as a highly sensitive tool for thin film characterization and other applications. Initially, Liedberg et al. [4] used the sensing principle for gas detection, followed by numerous applications, ranging from biochemical binding analy- sis to environmental monitoring [5–7]. The technical complexity of state of the art SPR devices, considered as high precision opti- cal instruments and integrated with a microfluidic system, puts serious restrictions on their use, where special care is required for reliable operation [8,9]. Being considered as a general rule for ∗ Corresponding author. Tel: +55 83 3310 1135; fax: +55 83 3310 1418. E-mail address: [email protected] (A.M.N. Lima). almost all physical sensors, temperature has a pronounced impact on the performance of SPR sensors. The large physical size and sig- nificant thermal mass of most commercial SPR instruments makes experimental observations a demanding issue, where it appears very difficult to fully identify the origin of any temperature effects. A typical SPR sensor in the attenuated total reflection (ATR) con- figuration comprises a set of three basic optical components as: a glass prism, a semi-transparent metal (gold) film and the adja- cent analyte (water). The resonance can be optically excited by p-polarized light under specific boundary conditions and tracked with two operation modes: via wavelength interrogation, where the entrance angle is maintained and the wavelength changed, or by angular interrogation, where the entrance wavelength is maintained, and the input angle changed. Commercial instruments employ angular interrogation, originally based on the Kretschmann configuration [10], where the use of a one- or two-dimensional digital camera for image capture avoids any moving parts in the instrumental design. Due to well-established thermo-physical properties of the implemented optical materials (optical prism, 0925-4005/$ – see front matter © 2008 Elsevier B.V. All rights reserved. doi:10.1016/j.snb.2008.06.045
Transcript of Temperature-dependent sensitivity of surface plasmon resonance sensors at the gold–water interface

Ta
Ca
b
c
a
ARRAA
KSLTD
1
cwtStensocsf
0d
Sensors and Actuators B 134 (2008) 854–862
Contents lists available at ScienceDirect
Sensors and Actuators B: Chemical
journa l homepage: www.e lsev ier .com/ locate /snb
emperature-dependent sensitivity of surface plasmon resonance sensorst the gold–water interface
.S. Moreiraa,b, A.M.N. Limaa,∗, H. Neff a, C. Thirstrupc
Universidade Federal de Campina Grande (UFCG), Department of Electrical Engineering, 58109-970 Campina Grande, PB, BrazilCEFET-AL, Department of Electronic, 57020-510 Maceió, AL, BrazilColoplast A/S, Holtedam 1, 3050 Humlebæk, Denmark
r t i c l e i n f o
rticle history:eceived 25 October 2007eceived in revised form 24 May 2008ccepted 20 June 2008vailable online 5 July 2008
eywords:urface plasmon resonanceine broadeningemperature dependencerude model
a b s t r a c t
Instrumental performance and sensitivity of surface plasmon polariton or resonance (SPR) sensors are cru-cially affected by ambient temperature fluctuations. Apart from temperature-induced opto-mechanicaldisplacements, resonance conditions and associated output quantities vary, due to thermo-physical prop-erties of optical components, like prism, semi-transparent metal-film and aqueous analyte solution. Thevariation of instrumental sensitivity S as function of environmental temperature has been exploited exper-imentally in the temperature region 275 K < T < 320 K. A compact, robust commercial SPR device hasbeen used, operating in the angular interrogation mode. At temperature < 300 K, S� steadily deterioratesfrom 120◦/RIU to 30◦/RIU. For comparison, the thermal device characteristics also has been evaluated the-oretically within the range 273 K < T < 370 K for both, angular interrogation mode (AIM) and wavelengthinterrogation mode (WIM). Fresnel’s equation system and established analytical sensitivity expressionshave been elaborated, and differences assigned to simplifications in the analytical form. An appropriate
thermo-physical data set of experimentally verified optical materials parameters n(�, T) and ε(�, T) forall, BK7 glass prism, gold metal film, and aqueous analyte has been used. A singularity has been identifiedin the simulations near the freezing point of water, while a soft transition appears in the experiment.Towards higher device temperatures at 300 K < T < 370 K,S�,� decreases weakly. The effect is more pro-nounced at shorter wavelength ≤550 nm, and in the wavelength interrogation mode. A steady increasetowards higher T was observed for the SPR-line broadening parameter in the AIM, but a distinct maximumlengt
aonev
fiacpw
resolved at 305 K for wave
. Introduction
The resonant optical excitation and propagation of coherentharge density oscillations at the metal–dielectric interface is aell-known physical effect, denoted as the surface plasmon polari-
on or resonance (SPR) [1,2]. Since Turbadar’s early work [3], thePR phenomenon has been identified as a highly sensitive tool forhin film characterization and other applications. Initially, Liedbergt al. [4] used the sensing principle for gas detection, followed byumerous applications, ranging from biochemical binding analy-is to environmental monitoring [5–7]. The technical complexity
f state of the art SPR devices, considered as high precision opti-al instruments and integrated with a microfluidic system, putserious restrictions on their use, where special care is requiredor reliable operation [8,9]. Being considered as a general rule for∗ Corresponding author. Tel: +55 83 3310 1135; fax: +55 83 3310 1418.E-mail address: [email protected] (A.M.N. Lima).
tomecdtp
925-4005/$ – see front matter © 2008 Elsevier B.V. All rights reserved.oi:10.1016/j.snb.2008.06.045
h interrogation.© 2008 Elsevier B.V. All rights reserved.
lmost all physical sensors, temperature has a pronounced impactn the performance of SPR sensors. The large physical size and sig-ificant thermal mass of most commercial SPR instruments makesxperimental observations a demanding issue, where it appearsery difficult to fully identify the origin of any temperature effects.
A typical SPR sensor in the attenuated total reflection (ATR) con-guration comprises a set of three basic optical components as:glass prism, a semi-transparent metal (gold) film and the adja-
ent analyte (water). The resonance can be optically excited by-polarized light under specific boundary conditions and trackedith two operation modes: via wavelength interrogation, where
he entrance angle is maintained and the wavelength changed,r by angular interrogation, where the entrance wavelength isaintained, and the input angle changed. Commercial instruments
mploy angular interrogation, originally based on the Kretschmannonfiguration [10], where the use of a one- or two-dimensionaligital camera for image capture avoids any moving parts inhe instrumental design. Due to well-established thermo-physicalroperties of the implemented optical materials (optical prism,

d Actu
gcw
tttopfiaarpcira
bmetetSCta
asraabSti
S
w
nneamdESm
2
liaeoam4Dwt
peamtotatithc
FwS
C.S. Moreira et al. / Sensors an
old film, aqueous analyte) the variation of the optical resonanceondition with temperature can be treated in a physically accessibleay.
Likewise, the mounting geometry of all optical components ofhe instrumental housing is thermally affected, in relation withheir specific thermal expansion coefficients and local tempera-ures. Thus all, location and emission/transmission characteristicsf the (LED) light source, lenses, optical chip and chip holder, glassrism, index matching gel, camera and camera-holder do not retainxed geometric positions, emission wavelength or sensitivity, butre vulnerable to minute thermo-mechanical displacements, usu-lly on micrometer scaling. This leads to small- not necessarily fullyeversible- but generally poorly defined distortions of the opticalropagation path, along with a deteriorating effect onto resonanceonditions. Instrumental sensitivity to temperature fluctuationsncreases with the technical complexity, usually required for high-esolution instruments. All of these thermal effects superimpose,nd usually cause a temperature-induced drift of the output signal.
Temperature compensation and regulation approaches haveeen developed to cope with this problem [11,12]. A theoreticalodel of the achievable sensitivity at elevated T has been reported
arlier [13,14] excluding, however, thermal effects resulting fromhe glass prism and aqueous analyte. The utilization of temperatureffects onto the SPR resonance as a tool for remote tempera-ure sensing has been evaluated recently, and includes fiber-opticPR spectrometry [15,16]. Experimental results were shown byhiang et al. [17,18] via phase measurement of a silver/silicon junc-ion. However, reliable experimental verifications that include thechievable figures of merit of a SPR sensor have not been reported.
In this work, an attempt has been made to experimentallynd theoretically address the influence of temperature onto theensitivity of SPR instrumentation. Experimental data have beenecorded within the temperature region 276 K < T < 333 K, usingcompact commercial SPR evaluation kit [20,22], connected to anqueous solution. The experimental findings have been supportedy theoretical analysis of angular wavelength and interrogationPR-sensing modes. There has been some early speculation abouthe existence of a singularity related to the vanishing denominatorn the sensitivity expression [21,23], where:
P� = d�
dna= εmr
√−εmr
(εmr + n2a)
√εmr(n2
a − n2p) − n2
pn2a
(1)
ith εm = εmr + iεmi considering εmi � εmr .
ttbat
ig. 1. Schematic diagram of the experimental set-up, where a peristaltic pump has beenhich is immersed into a ice–water mixture. Output sensor signal is connected to a con
PREETA sensor internal elements, DSP processor functions and the temperature signal ar
ators B 134 (2008) 854–862 855
Both, an established analytical sensitivity formula (1) andumerical results, derived from an appropriately defined Fres-el’s equation system in a 3-layer matrix representation have beenmployed, comprising a glass prism, semi-transparent gold filmnd aqueous solution. However, it should be noted that theseodels are not fully equivalent, since the analytical approach
isregards the complex part of the metal dielectric function.ventually, on bases of the present data, figures of merit of anPR-based temperature sensor can be been elaborated for bothodes.
. Experimental
The SPREETA evaluation kit, operating exclusively in the angu-ar interrogation mode, has been employed for the experimentalnvestigation, where the simple and robust design allows for reli-ble investigations of temperature effects. The disposable sensorlement integrates a LED light source with emission at a wavelengthf 830 nm, a polarizer, the sensing surface, a reflecting mirror andone-dimensional array light detector into a single, molded poly-er structure. The compact device of approximate size of 3 cm ×cm × 1 cm was fully dipped into a water-filled, thermally isolatedewar container. The experimental set-up is illustrated in Fig. 1,here a peristaltic pump has been used for analyte transport to
he SPREETA sensing surface.Experiments have been performed during the slow cool down
hase at (dT/dt ≈ 0.4 K/min), from hot water (≈ 350 K) to ambi-nt T, and during the warm-phase from an ice–water mixture tombient temperature around 300 K. The relatively small thermalass of the SPREETA device allowed sufficiently fast approach to
hermal equilibration. The refractive index variation �n has beenbtained by admission of a diluted, 0.05 molar NaOH solution tohe sensor at the desired temperature. Teflon tubes were used fornalyte transport, fed through the Dewar to maintain the desiredemperature. The temperature variation of the absolute refractivendex of the weak NaOH-solution corresponds to plain water, thushe temperature variation �n(T) can be neglected. The experimentsave been performed by first calibrating the instrument with a dryell recording at given sensor temperature T, then pure water solu-
ion has been admitted, followed by the NaOH-solution to establishhe �n step. The initial value of the refractive index variation haseen confirmed independently, using refractometric reading. Thessociated angular variations of the resonance angle �� have beenaken from the instrumental output readings with high accuracy.used for analyte (pure water or NaOH solution) transport to the SPREETA sensor,trol and processing system with a DSP processor and general-purpose computer.e also indicated.

8 d Actu
Apr
S
acim
memcf
3
istwu
•
•
•
oataea
mtasaoci
3
on
�
)⎤
Itm
|
Fl
|
R
S
Todv
Tcplri
taittrlqpi
3
3
itthoac
εm mr mi ω(ω + iωc)
where ωp is the electron plasma frequency, ωc is the collision fre-quency and ω is the frequency of the incident light. The plasma andcollision frequencies are temperature-dependent parameters.
56 C.S. Moreira et al. / Sensors an
time interval of 5 min was required for monitoring of each dataoint, causing a temperature uncertainty of approximately 2 K. Theecorded sensitivity expression is defined as
= �NaOH − �H2O
nNaOH − nH2O(2)
nd recorded at several points throughout the cooling/warmingycles. The maximum Dewar and sensor temperature has been lim-ted to 350 K, to avoid irreversible damage of the device during
onitoring.Experimental investigation in the wavelength interrogation
ode were not performed in this work, because the requiredxperimental set-up was not available to us during the experi-ents. However, a fiber optic SPR sensor set-up is presently under
onstruction, where experimental results will be reported in aorth-coming publication.
. Theory
As mentioned before, SPR sensors in the ATR configuration,n absence of an addition adsorption film, comprise a 3-layerystem. The ATR set-up can be arranged in a variety of configura-ions, depending on the selected light coupling mechanism (prism,aveguide, diffraction grating, optical fiber, etc.). The SPR devicender consideration is described as follows [19]:
Medium 1, Prism: optical substrate material with a thickness,considered to be infinite.Medium 2, Metal: semi-transparent gold film with a thickness of50 nm, much smaller than the wavelength of the incident light.Medium 3, Analyte: aqueous fluid, where the analyte is located.adjacent to the metal film.
The photon–surface plasmon interaction – towards exploitationf the resonance conditions – can be treated by two approaches:nalytically, based on momentum/energy conservation law of pho-on and plasmon waves, via the corresponding dispersion relationsnd numerically, based on solving the electrodynamic Fresnel’squation system. In the former case, the resonance condition readss [2]:
2�
�
√ε2 sin �RES = Re
{2�
�
√ε3εm
ε3 + ε3
}(3)
atching photon and surface plasmons wave vectors, where � ishe wavelength of the p-polarized incident radiation, and εp, εd
nd εm are the dielectric functions of an optically transparent sub-trate, the semi-transparent gold metal film, and adjacent aqueousnalyte solution, respectively. For simplification, only the real partf the dielectric functions is used in this approximation. Opticalonstants of water and BK7 were obtained from the NIST technicalnformation service and Schott AG.
.1. Temperature-dependent sensitivity
Solving (3) for �RES yields the resonance angle, and in absencef the previously mentioned approximation |εmr | � εmi, the reso-ance angle reads as [1,2,19]:⎡√√ (√
RES = arcsin⎢⎢⎢⎣√√√n2
3 (εmr(n23 + εmr) + ε2
mi)2 + n4
3ε2mi
+ εmr(n23 + εmr)
2(n23 + εmr)
2 + ε2mi
ators B 134 (2008) 854–862
ntroducing the differential variation of the resonance angle withemperature leads to the SPR sensitivity in the angular interrogation
ode:
S�(T)| = d�RES/dT
dn3/dT(5)
or the wavelength interrogation mode, the SPR sensitivity simi-arly reads as
S�(T)| = d�RES/dT
dn3/dT(6)
earrangement of (6) yields:
�(�, T) = (d�RES/dT)(d�RES/d�)dn3/dT
(7)
he variation of the resonance angle with the relevant thermo-ptical parameters of (4) is adequately described by the totalifferential of �RES for wavelength and temperature wavelengthariations:
d�RES
d�= d�RES
dεm
dεm
d�+ d�RES
dn2
dn2
d�+ d�RES
dn3
dn3
d�(8)
d�RES
dT= d�RES
dεm
dεm
dT+ d�RES
dn2
dn2
dT+ d�RES
dn3
dn3
dT(9)
he thermo-optical properties of all materials comprising the ATRonfiguration are treated by introduction of the full set of thermo-hysical parameters εm(�, T), ε2(�, T), ε3(�, T) from appropriate
iterature data and available data bases of the individual dispersionelations. The data set reduces to a single wavelength for angularnterrogation.
As stated before, the numerical approach via Fresnel’s equa-ions fully describes the photon–plasmon interaction, in absence ofny approximation or simplification. Fresnel’s approach thus takesnto account both, real and imaginary parts of the dielectric func-ions and is considered as a general, more precise solution thanhe above-mentioned analytical approach. The Fresnel multilayereflection model is described in detail in [19], employed to calcu-ate the optical reflectivity in an ATR set-up. Among other opticaluantities, relevant SPR curve parameters as minimum reflectanceositions, line broadening, asymmetry characteristics and sensitiv-
ty can be derived.
.2. Thermo-optical materials properties
.2.1. Thin gold filmAlthough the optical properties of the noble metals have been
nvestigated over an extended period of time, a reliable experimen-al data base regarding the variation of the dielectric function withemperature is not available in the open literature. The Drude modelas been widely used to calculate the complex dielectric functionf free electron type metals. For a certain wavelength range, it alsopplies to the optical properties of thin gold films, [27]. Thus, theomplex dielectric function of gold εm can be expressed as
= ε + iε = 1 − ω2p (10)
+ ε2mi ⎥⎥⎥⎦ (4)
C.S. Moreira et al. / Sensors and Actuators B 134 (2008) 854–862 857
F tric fu(
d
ω
w
pωt
ω
L[
ω
wts
a
ω
witcapt�tf
3
sif
owTg
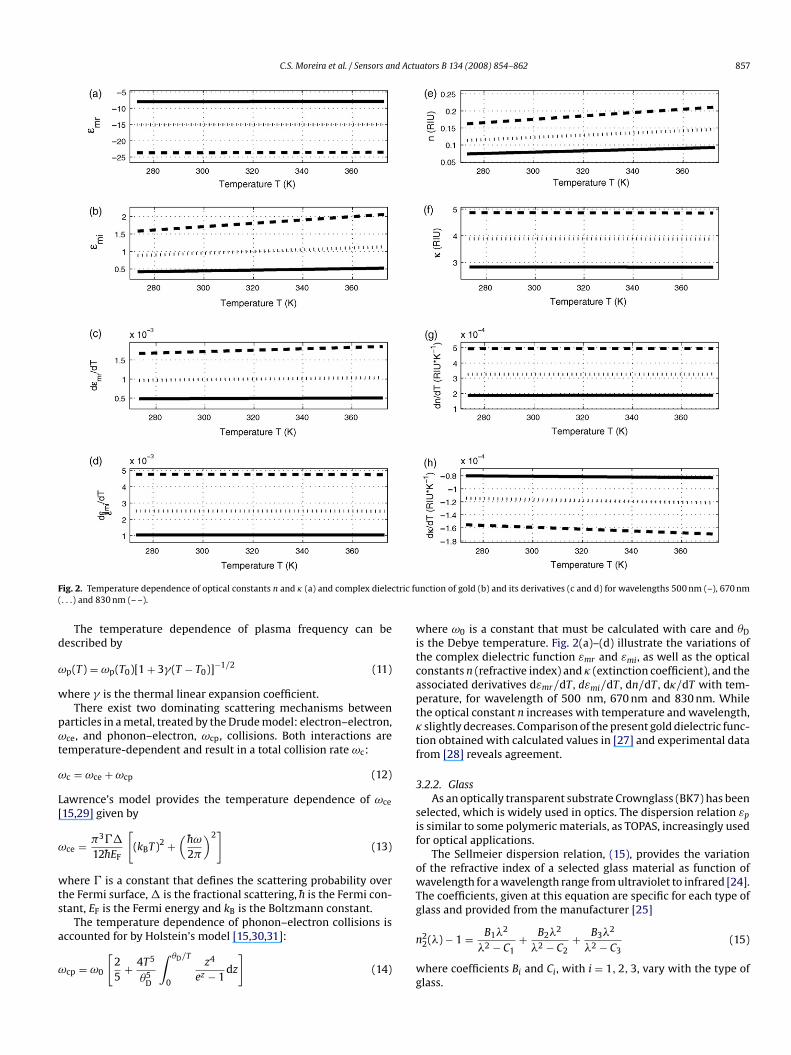
ig. 2. Temperature dependence of optical constants n and � (a) and complex dielec. . .) and 830 nm (– –).
The temperature dependence of plasma frequency can beescribed by
p(T) = ωp(T0)[1 + 3(T − T0)]−1/2 (11)
here is the thermal linear expansion coefficient.There exist two dominating scattering mechanisms between
articles in a metal, treated by the Drude model: electron–electron,ce, and phonon–electron, ωcp, collisions. Both interactions are
emperature-dependent and result in a total collision rate ωc:
c = ωce + ωcp (12)
awrence’s model provides the temperature dependence of ωce
15,29] given by
ce = �3�
12h̄EF
[(kBT)2 +
(h̄ω
2�
)2]
(13)
here is a constant that defines the scattering probability overhe Fermi surface, � is the fractional scattering, h̄ is the Fermi con-tant, EF is the Fermi energy and kB is the Boltzmann constant.
The temperature dependence of phonon–electron collisions isccounted for by Holstein’s model [15,30,31]:
cp = ω0
[25
+ 4T5
�5D
∫ �D/T
0
z4
ez − 1dz
](14)
n
wg
nction of gold (b) and its derivatives (c and d) for wavelengths 500 nm (–), 670 nm
here ω0 is a constant that must be calculated with care and �Ds the Debye temperature. Fig. 2(a)–(d) illustrate the variations ofhe complex dielectric function εmr and εmi, as well as the opticalonstants n (refractive index) and � (extinction coefficient), and thessociated derivatives dεmr/dT , dεmi/dT , dn/dT , d�/dT with tem-erature, for wavelength of 500 nm, 670 nm and 830 nm. Whilehe optical constant n increases with temperature and wavelength,slightly decreases. Comparison of the present gold dielectric func-
ion obtained with calculated values in [27] and experimental datarom [28] reveals agreement.
.2.2. GlassAs an optically transparent substrate Crownglass (BK7) has been
elected, which is widely used in optics. The dispersion relation εp
s similar to some polymeric materials, as TOPAS, increasingly usedor optical applications.
The Sellmeier dispersion relation, (15), provides the variationf the refractive index of a selected glass material as function ofavelength for a wavelength range from ultraviolet to infrared [24].
he coefficients, given at this equation are specific for each type oflass and provided from the manufacturer [25]
22(�) − 1 = B1�2
�2 − C1+ B2�2
�2 − C2+ B3�2
�2 − C3(15)
here coefficients Bi and Ci, with i = 1, 2, 3, vary with the type oflass.

858 C.S. Moreira et al. / Sensors and Actuators B 134 (2008) 854–862
deriv
rt[lo
wbta
norr
3
wNL
wao−0r
t
vm
st
d6nd[m
4
smatrobipbaioac1rT
a
Fig. 3. Temperature dependence of refractive index of glass (a) and its
The refractive index of glass also varies with temperature. Theelationship between refractive index change of, np, and tempera-ure is utilized through determination of thermal-optics coefficient26]. Instead of use data lists, valid for a limited range of wave-ength and temperature, here a dispersion formula is used, basedn a derivative of Sellmeier equation, i.e.:
dnabs(�, T)dT
= n2(�, T0) − 12n(�, T0)
(D0 + 2D1�T + 3D2�T2 + E0 + 2E1�T
�2 − �2TK
)(16)
here T0 is reference temperature (20 ◦C), �T is the differenceetween T and T0, and D0, D1, D2, E0, E1 and �TK are constants. Equa-ion (16) is valid for a temperature range from −100 ◦ C to 140 ◦ Cnd a wavelength range from 0.3650 � m to 1.014 �m.
Fig. 3 illustrates the associated variation of the refractive index2 and the derivative dn2/dT with temperature at wavelengthsf 500 nm, 670 nm and 830 nm, where � can be neglected. Theefractive index increases weakly with temperature. The derivativeemains almost two orders of magnitude lower, compared to gold.
.2.3. WaterLikewise, the refractive index of water varies as a function of
avelength, density and temperature. Here, we use the availableIST data set, based on molar refraction in connection with theorentz-Lorenz function [32]:
n23 − 1
n23 + 2
(1�̄
)= a0 + a1�̄ + a2T̄ + a3�̄2T + a4
�̄2+ a5
�̄2 − �̄2UV
+ a6
�̄2 − �̄2IR
+ a7�̄2 (17)
here the terms �̄, �̄ and T̄ are dimensionless vari-bles and a0 to a7, �̄UV and �̄IR are constants at valuesf 0.244257733, 9.74634476 × 10⁻³, −3.73234996 × 10⁻³,
3.73234996 × 10⁻³, 1.58920570 × 10⁻³, 2.45934259 × 10⁻³,.900704920, −1.66626219 × 10⁻², 0.229202 and 5.432937,espectively [32].Eq. (17) has been validated earlier by the International Associa-ion Properties Water and Steam (IAPWS) for a temperature range
mn6ro
atives (b) for wavelengths 500 nm (–), 670 nm (. . .) and 830 nm (– –).
arying from 261 K to 773 K, wavelength range from 0.2 � m to 1.1 �and a density range from 0 kg m−3 to 1060 kg m−3.It should be noted that accurate calculations also required con-
ideration the change of the water density with temperature, asaken from the NIST Chemistry WebBook [33,34].
Fig. 4 illustrates the variation of the refractive index n3 and theerivative dn3/dT with temperature at wavelength of 500 nm,70 nm and 830 nm, where the extinction coefficient � can beeglected. The refractive index of water reveals a quasi-exponentialecrease with temperature, similar to the change in water density34]. The magnitude of the derivative dn3/dT is comparable to gold
etal.
. Results and discussion
Fig. 5 illustrates the experimentally determined variation of theensitivity as a function of sensor temperature, utilizing the aboveentioned SPREETA device. Two data sets are displayed, coveringtemperature range from 277 K to 320 K. Data set 1 represents
he instrumental sensitivity, obtained from direct instrumentaleadings of angle and refractive index variations. Data set 2 wasbtained from the instrumental resonance angle readings, but com-ined with an independently determined refractometric refractive
ndex reading for the hydroxyl solution. The associated weak tem-erature variation as taken from the earlier mentioned NIST dataase. At lower T, within a transition region of 10 K, S� drops tostable value S� = 30◦ /RIU at T < 295 K. An interesting feature
s the sensitivity value, obtained directly from the instrumentalutput channel. Utilizing the recorded resonance angle variation,nd associated instrumental refractive index change, S�(T) remainsonstant, temperature independent, at a value of approximately20◦/RIU. This behavior clearly indicates incorrect instrumental RIUeadings towards decreasing instrumental temperature. At higher, both recordings agree.
Fig. 6(a) and (b) illustrates calculated SPR sensitivities, displayeds a function of sensor temperature in the angular interrogation
ode S�(T), using the above-mentioned analytical [6(a)] and Fres-el [6(b)] approaches, at selected wavelength of 500 nm, 550 nm,70 nm and 830 nm. In both simulation approaches, the analysisesolves a clear singularity at temperatures near the freezing pointf water at wavelength ≤550 nm, thus partly confirming earlier

C.S. Moreira et al. / Sensors and Actuators B 134 (2008) 854–862 859
s deriv
sntnahTpOfp
iboa7i
FtSr
ifiSo3ae
mocr
Fig. 4. Temperature dependence of refractive index of water (a) and it
peculations [21]. The singularity disappears at wavelength of 500m in both simulation approaches, where small differences exist inhe magnitude of S�(T) at wavelength >550 nm. At � = 500 nm, sig-ificant deviations between Fresnel and analytical approach appeart low T. Eventually, the device sensitivity steadily decreases withigher slope towards higher T at short wavelength of 500 nm [35].he inset to Fig. 6(a) reveals a magnified section of S�(T), for com-arison with the data of Fig. 6(b), obtained in the Fresnel approach.nly minor differences in the absolute magnitudes were resolved
or both simulation approaches, with the analytical formula dis-laying slightly higher values at � ≤ 550 nm.
Fig. 7(a) and (b) illustrates the thermal sensitivity character-stics under conditions of wavelength interrogation. Comparison
etween Fresnel and analytical approach at a selected wavelengthf 670 nm, and incident angle of 69◦ is provided in Fig. 7(a). Thessociated variation of S�(T) with the incident angle is shown in(b). As shown before for angular interrogation, a clear singularityn exists at low temperatures displaying, however, opposite behav-
ig. 5. Experimentally determined variation of the sensitivity as a function of sensoremperature, utilizing the SPREETA device in the AIM. Data set 1 utilizes originalPREETA data. Data set 2 combines the angular SPREETA readings with experimentalefractometric data.
thtaefofiaa
tm[rtiwsdttdr
ag
atives (b) for wavelengths 500 nm (–), 670 nm (. . .) and 830 nm (– –).
or for the two simulation approaches. Comparable to the propertiesor angular interrogation, the sensitivity slowly decreases withncreasing temperature. An interesting feature is the variation of�(T) for different angles of incidence in Fig. 7(b), where a changef only 4◦ from 71◦ to 67◦ results in an increase of a factor of 2 from000 nm/RIU to 6200 nm/RIU. The distinct sensitivity of S� to vari-tions of the incident angle is in accord with earlier theoretical andxperimental findings of Akimoto et al. [36].
While in the findings given in Figs. 6 and 7 all, glass prism, goldetal film and analyte (water) contribute to the total magnitudes
f S�(T) and S�(T), Fig. 8(a) and (b) are illustrating their individualontributions for both operation modes. The present approach thusepresents a substantial extension to earlier studies, where onlyhermal variations in the dielectric function of the thin gold filmave been taken into consideration [13,14]. To account for accuracy,he calculations have been performed with Fresnel’s numericalpproach, upon maintaining two thermo-optical materials param-ters, and varying the properties of the remaining optical device asunction of temperature. In both operation modes, the contributionf the aqueous analyte is dominant, while the influence of the metallm becomes significant at low T, revealing a slightly positive slopet higher T. Thermal effects of the glass prism can be neglected forngular interrogation, but contribute to S�(T) at low T [13].
Fig. 9(a) and (b) outlines the influence of temperature ontohe SPR line broadening parameter (FWHM, full width at half
aximum) for both operation modes. For angular interrogationFig. 5(a)], increases steadily at small rate towards higher T,evealing saturation at around 360 K. The inset to Fig. 9(a) also illus-rates the associated temperature-dependent reflectivity curves,ndicating that the resonant angle decreases with increasing T,
hile the curve asymmetry and SPR depth remain constant. Con-iderable variations were found for wavelength interrogation ,isplaying a clear maximum in the SPR line broadening parame-er at 305 K, followed by a steady decrease for increasing deviceemperature. Similarly to angular interrogation, the resonant angle
ecreases at higher T, while the curve asymmetry and SPR depthemain constant, as shown in the inset to Fig. 9(b).The presented experimental and theoretical analysis of temper-ture effects onto the performance of SPR sensor devices at theold–water interface roughly confirms the earlier proposed exis-

860 C.S. Moreira et al. / Sensors and Actuators B 134 (2008) 854–862
F analy( tivity
tegtTeidtsstpd
ite−dlmbw
Ff
ig. 6. Theoretically determined sensitivity at the angular interrogation mode using-.) (a)and inset to figure, a section magnified of three wavelengths; (b) shows sensi
ence of a singularity in device sensitivity at low T. However, for themployed angular interrogation device, the experimental investi-ation revealed at low T instead a slow transition from 120◦/RIUo 30◦/RIU within a relatively narrow temperature interval of 15 K.he theoretically proposed full singularity has not been observed byxperiment. The deviation between theory and experimental find-ngs is attributed primarily to the presence of thermo-mechanicalistortions and displacements of all components that pertain tohe compact SPR sensor, molded into a single plastic substrate. Theyuperimpose with the thermo-optical variations of the primary ATR
et-up of the SPR sensor, as mathematically treated in this work. All,he position of the LED embedded into the device, the polarizer, theosition of the sensing glass plate, the reflecting mirror and the lightetector slightly change position, as temperature changes.eSrt
ig. 7. Comparison of theoretically determined sensitivities at the wavelength interrogatour different incident angles of light (b).
tical approach for wavelengths 500 nm (–), 550 nm (– –), 670 nm (. . .) and 830 nmusing Fresnel approach for selected wavelengths.
A further deteriorating effect originates from the temperature-nduced change of the LED emission characteristics. Since theemperature of the embedded light source is not controlled, themission wavelength blueshifts approximately at a rate d�/dT ≈0.4 nm/K towards decreasing temperatures. All contribute toistortions in beam propagation and the angular reading at the
ight detector array, thus modifying the output signal. Thermo-echanical displacements are difficult to assess theoretically,
asically requiring finite element analysis of the complete device,hich is out of the scope of the present investigation. It is inter-
sting to note that the sensitivity value, directly provided by thePR-device, yields a temperature independent characteristic. Itesults from the use of (4) for the 3-layer model, where the refrac-ive index variation dn3 is determined via the resonance angle d�.
ion mode using analytical and Fresnel approaches (a) and sensitivities considering

C.S. Moreira et al. / Sensors and Actuators B 134 (2008) 854–862 861
retical
Stt
roHhmwSftw
iidS
gCtid
Ft
Fig. 8. Individual sensor materials contributions to the theo
ince thus both quantities follow the same temperature variation,he ratio for the instrumental sensitivity S�(T) = d�/dn remainsemperature independent.
The present findings are not necessarily in conflict with earlieresults of Chiang et al. [13,14], where a steady increase of sensitivityver a broad range of temperatures up to 973 K has been reported.owever, since in their investigations only the gold–gas interfaceas been considered – in absence of an aqueous analyte – the aboveentioned singularity does not appear. An important result of thisork concerns to the requirements for temperature regulation of
PR instruments. Apart from operation at low ambient T < 275 Kor angular interrogation, and T < 280 K for wavelength interroga-ion, instrumental sensitivities of the implemented ATR set-up varyeakly with moderate changes of ambient temperatures. Compar-
eaao
ig. 9. Theoretically determined SPR line broadening parameter (FWHM, full width athese figures there are reflectivity curves for selected temperatures.
ly obtained sensitivity variations for both operation modes.
son of S�(T) and S�(T) of Fig. 8(a) and (b) indicates that wavelengthnterrogation is slightly more vulnerable to temperature relatedegradation towards higher temperature, than angularly resolvedPR recordings.
The largest effect originates from the aqueous analyte, sug-esting precise thermal fluid control in both operation modes.omparison between the experimental data of Fig. 5 and theheoretical analysis indicates a significant impact of temperature-nduced instrumental distortions that contribute to thermaleterioration. A temperature-resistant instrumental design thus is
ssential for optimum performance, which would include: temper-ture control of the light source, temperature control of the analytend use of materials with low thermal expansion coefficients for allptical components. This shall be combined with an optical align-half maximum) for angular (a) and wavelength (b) interrogation modes. Inset to

8 d Actu
mom
tiaimBacmS
A
r
R
[
[
[
[
[
[
[
[
[
[
[
[
[
[
[
[[
[
[
[
[
[
[
[[[
[
B
Ct–Fibais
AHerIt1fDd2oEmi
Fa1aPia
Ca
62 C.S. Moreira et al. / Sensors an
ent/mechanical arrangement of all, light source, lenses, prism,ptical chip, chip holder and camera, being insensitive to thermo-echanical displacements.Eventually, observed differences in S�(T) and S�(T) for the two
heoretical evaluation routes are largely attributed to the neglectedmaginary part of the metal dielectric function in the analyticalpproach. The differences are more pronounced towards decreas-ng wavelength < 550 nm, where also the application of the Drude
odel for the metal dielectric function approaches its limitations.oth, the temperature-induced shift of the resonance and associ-ted SPR line broadening are substantially higher for wavelengthompared to angular interrogation. Thus, the former operationode would be superior and preferred for implementation into
PR-based temperature sensors.
cknowledgements
The authors would like to thank CNPq, FAPESQ and CAPES for theesearch grant, financial support and study fellowship, respectively.
eferences
[1] H. Raether, Surface Plasmons on Smooth and Rough Surfaces and on Grat-ings, Springer Tracts in Modern Physics, vol. 111, Springer Verlag, New York,1988.
[2] J. Homola, Surface Plasmon Resonance Based Sensors, Springer, New York, 2006.[3] T. Turbadar, Complete absorption of light by thin metal films, Proceedings of
the Physical Society 73 (1959) 40–44.[4] B. Liedberg, C. Nylander, I. Lunström, Surface plasmon resonance for gas detec-
tion and biosensing, Sensors and Actuators 14 (1983) 299–304.[5] L. Fägerstam, A non-labeled technology for real-time biospecific analysis, in: J.J.
Villafranca (Ed.), Techniques in Protein Chemistry, vol. 2, Academic Press, NewYork, 1991, p. 65.
[6] S. Rodrigues-Mozaza, Biosensors for environmental monitoring: a global per-spective, Talanta 65 (2005) 291–297.
[7] E. Mauriz, A. Calle, A. Montoya, L.M. Lechuga, Determination of environmentalorganic pollutants with a portable optical immunosensor, Talanta 69 (2006)359–364.
[8] A.B. Biacore, BIAtechnology Handbook, RAK Design, Upsala, Sweden, 1998.[9] J.M. Tritz, Temperature controlled microfluidics for portable biosensors, Master
Thesis, University of Washington, 2006.10] E. Kretschmann, Untersuchungen zur anregung und Streuung von Ober-
flaechenplasmaschwingungen an Silberschichten, PhD Thesis, University ofHamburg, Germany, 1972.
11] A.N. Naimushin, S.D. Soelberg, D.U. Bartholomew, J.L. Elkind, C.E. Furlong, Aportable surface plasmon resonance (SPR) sensor system with temperatureregulation, Sensors and Actuators B 96 (2003) 253–260.
12] A.N. Naimushin, C.B. Spinelli, S.D. Soelberg, T. Mann, R.C. Stevens, T. Chinowsky,P. Kauffman, S. Yee, C.E. Furlong, Airborne analyte detection with an aircraft-adapted surface plasmon resonance sensor system, Sensors and Actuators B104 (2005) 237–248.
13] H.P. Chiang, P.T. Leung, W.S. Tse, The surface plasmon enhancement effect onadsorbed molecules at elevated temperatures, Journal of Chemical Physics 108(1998) 2659–2660.
14] H.P. Chiang, Y.C. Wang, P.T. Leung, W.S. Tse, A theoretical Model for thetemperature-dependent sensitivity of the optical sensor based on surface plas-mon resonance, Optics Communications 188 (2001) 283–289.
15] S.K. Ozdemir, G. Turhan-Sayan, Temperature effects on surface plasmon res-onance: design considerations for an optical temperature sensor, Journal ofLightwave Technology 21 (2003) 805–814.
16] A.K. Sharma, B.D. Gupta, Theoretical model of a fiber optic sensor based onsurface plasmon resonance for temperature detection, Optical Fiber Technology12 (2006) 87–100.
17] H.P. Chiang, H.-T. Yeh, C.-M. Chen, J.-C. Wu, S.-Y. Su, R. chang, Y.-J. Wu, D.P. Tsai,S.U. Jen, P.T. Leung, Surface plasmon resonance monitoring of temperature viaphase measurement, Optics Communications 241 (2004) 409–418.
18] H.P. Chiang, C.-W. Chen, J.J. Wu, H.L. Li, t.Y. Lin, E.J. Sánchez, P.T. Leung, Effectsof temperature on the surface plasmon resonance at a metal-semiconductor
interface, Thin Solid Films 515 (2007) 6953–6961.19] H. Neff, W. Zong, A.M.N. Lima, M. Borre, G. Holzhüter, Optical properties andinstrumental performance of thin gold films near the surface plasmon reso-nance, Thin Solid Films 496 (2006) 688–697.
20] ICX Nomadics, SPR Evaluation Kit, http://nomadics.icxt.com/products/spr-evaluation-kit.
CVDabs
ators B 134 (2008) 854–862
21] J. Homola, S.S. Yee, G. Gauglitz, Surface plasmon resonance: review, Sensorsand Actuators B 54 (1999) 3–15.
22] A. Marquart, SPR Pages - Suppliers, http://www.sprpages.nl//WebLinks/Suppliers.htm.
23] T.M. Chinowsky, Optical multisensors based on surface plasmon resonance,Ph.D. Dissertation, University of Washington, Seattle, WA, 2000.
24] A.G. Schott, Refractive index and dispersion, Technical Information 29 (2005)1–15.
25] A.G. Schott, Schott - Optical Glass, http://www.schott.com.26] H. Hoffmann, Differential changes of the refractive index, in: H. Bach, N. Neuroth
(Eds.), The Properties of Optical Glass, Springer, 1995, pp. 95–123.27] K. Ujihara, Reflectivity of metals at high temperatures, Journal of Applied
Physics 43 (1972) 2376–2383.28] L.N. Aksyutov, Temperature dependence of the optical constants of tungsten
and gold, Journal of Applied Spectroscopy 26 (1977) 656–660.29] W.E. Lawrence, Electron–electron scattering in the low-temperature resistivity
of the noble metals, Physical Review B 13 (1976) 5316–5319.30] T. Holstein, Optical and infrared volume absorbity of metals, Physical Review
96 (1954) 535–536.31] R.T. Beach, R.W. Christy, Electron–electron scattering in the intraband optical
conductivity of Cu, Ag and Au, Physical Review B 16 (1977) 5277–5284.32] A.H. Harvey, J.S. Gallagher, J.M.H.L. Sengers, Revised formulation for the refrac-
tive index of water and steam as a function of wavelength, temperature anddensity, Journal of Physical Chemistry Reference Data 27 (1998) 761–774.
33] Dr. Allan Harvey, personal communication (2006).34] NIST, NIST Chemistry WebBook, http://webbook.nist.gov/chemistry/.35] K. Johansen, H. Arwin, I. Lundström, B. Liedberg, Imaging surface plasmon
resonance sensor based on multiple wavelengths: sensitivity considerations,Review of Scientific Instruments 71 (2000) 3530–3538.
36] T. Akimoto, S. Sasaki, K. Ikebukuro, I. Karube, Effect of incident angle of lighton sensitivity and detection limit for layers of antibody with surface plasmonresonance spectroscopy, Biosensors and Bioelectronics 15 (2000) 355–436.
iographies
leumar da Silva Moreira was born in Santarém, Para, Brazil, in 1974. He receivedhe Bachelor’s degree in electrical engineering from the Federal University of Para
UFPA, Para, Brazil, in 1998, and Master’s degree in electrical engineering fromederal University of Paraiba – UFPB, Campina Grande, Paraiba, Brazil, in 2000. Hes currently working towards the DSc degree at the UFCG. Since March 2000 he haseen with the Electronic Department of Federal Centre of Technological Educationt Maceio – CEFET-AL, Maceio, Alagoas, where is Professor. His current researchnterests are in the fields of Biosensors, electronic instrumentation and fpga-basedystems.
ntonio Marcus Nogueira Lima was born in Recife, Pernambuco, Brazil, in 1958.e received the Bachelor’s and Master’s degrees in electrical engineering from Fed-ral University of Paraíba - UFPB, Campina Grande, Paraíba, Brazil in 1982 and 1985,espectively. He received his doctoral degree in electrical engineering in 1989 fromnstitut National Polytechnique de Toulouse – INPT, Toulouse, France. He was withhe Escola Técnica Redentorista – ETER, Campina Grande, Paraíba, Brazil from 1977 to982 and was a Project Engineer at Sul-América Philips, Recife, Pernambuco, Brazil,rom 1982 to 1983. From 1983 to March 2002 he was with the Electrical Engineeringepartment of UFPB where he became Full Professor in 1996. At UFPB he was Coor-inator of Graduate Studies from 1991 to 1993 and from 1997 to 2002. Since April002 he has been with the Electrical Engineering Department of Federal Universityf Campina Grande where he is currently Full Professor and Head of the Electricalngineering Department. His current research interests are in the fields of electricalachines and drive systems, industrial automation, embedded systems, electronic
nstrumentation, control systems and system identification.
ranz Helmut Neff was born in Karlsruhe, Germany, in 1948. He received his MSnd PhD degree in Physics from Technische Universitat Berlin, Berlin, Germany, in978 and 1981, respectively. He was a Senior Scientist of Vir Biosensor, Denmarknd is a guest professor of Federal University of Campina Grande, Campina Grande,araíba, Brazil. His research interests are in the fields of Biosensors, surface chem-stry, materials science, microelectronics, biophysics and photovoltaics. He is authornd co-author of 120 peer reviewed scientific articles and has filed 22 patents.
arsten Thirstrup was born in Copenhagen, Denmark, in 1964. He received his MSnd PhD degree in Electrical Engineering from Technical University of Denmark,
openhagen, Denmark, in 1987 and 1991, respectively. He was a Chief Scientist ofir Biosensor, Denmark and is a Materials Scientist of Coloplast A/S, Humlebæk,enmark. He is the recipient of the AEG Electron Prize 1990 and his research interestsre in the fields of Biosensors, surface chemistry, materials science, microelectronics,iophysics and non-linear optics. He is author and co-author of 32 peer reviewedcientific articles and has filed 10 patents.