9 BIOMEDICAL SENSORS
44
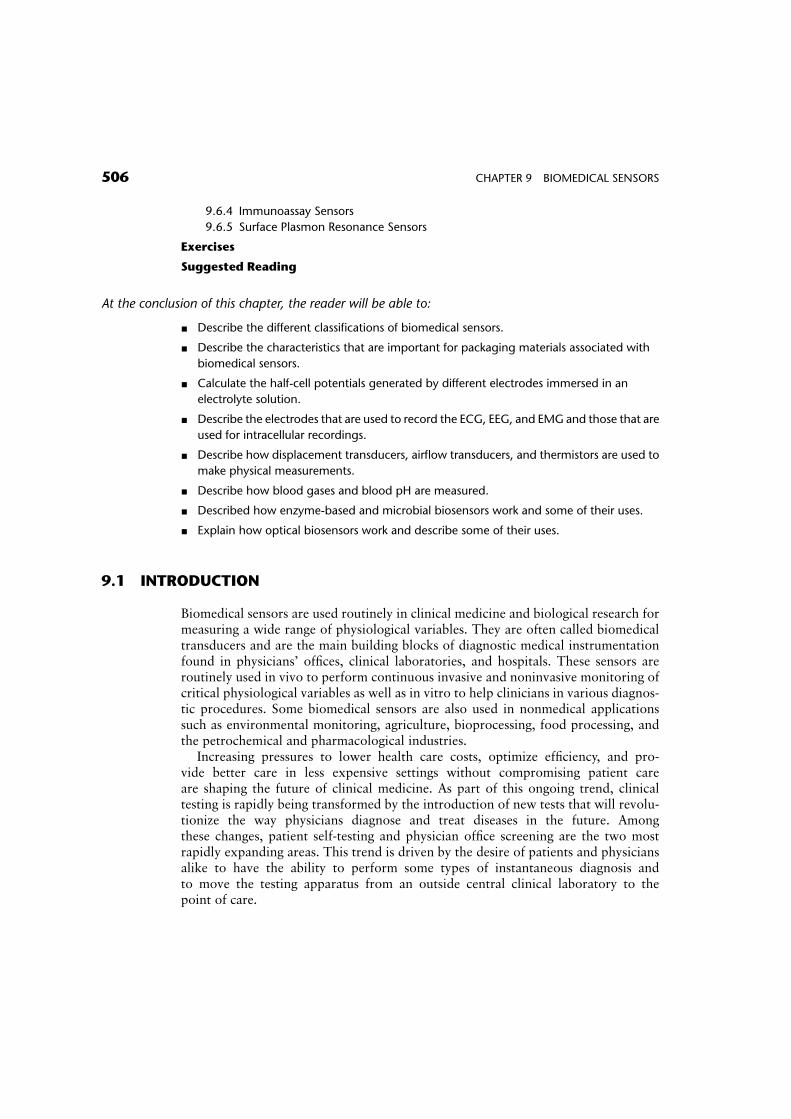
9 BIOMEDICAL SENSORS Yitzhak Mendelson, PhD Chapter Contents 9.1 Introduction 9.1.1 Sensor Classifications 9.1.2 Sensor Packaging 9.2 Biopotential Measurements 9.2.1 The Electrolyte/Metal Electrode Interface 9.2.2 ECG Electrodes 9.2.3 EMG Electrodes 9.2.4 EEG Electrodes 9.2.5 Microelectrodes 9.3 Physical Measurements 9.3.1 Displacement Transducers 9.3.2 Airflow Transducers 9.3.3 Temperature Measurement 9.4 Blood Gases and pH Sensors 9.4.1 Oxygen Measurement 9.4.2 pH Electrodes 9.4.3 Carbon Dioxide Sensors 9.5 Bioanalytical Sensors 9.5.1 Enzyme-Based Biosensors 9.5.2 Microbial Biosensors 9.6 Optical Biosensors 9.6.1 Optical Fibers 9.6.2 Sensing Mechanisms 9.6.3 Indicator-Mediated Fiber Optic Sensors 505
-
Upload
independent -
Category
Documents
-
view
0 -
download
0
Transcript of 9 BIOMEDICAL SENSORS
9 BIOMEDICAL SENSORS
Yitzhak Mendelson, PhD
Chapter Contents
9.1 Introduction
9.1.1 Sensor Classifications
9.1.2 Sensor Packaging
9.2 Biopotential Measurements
9.2.1 The Electrolyte/Metal Electrode Interface
9.2.2 ECG Electrodes
9.2.3 EMG Electrodes
9.2.4 EEG Electrodes
9.2.5 Microelectrodes
9.3 Physical Measurements
9.3.1 Displacement Transducers
9.3.2 Airflow Transducers
9.3.3 Temperature Measurement
9.4 Blood Gases and pH Sensors
9.4.1 Oxygen Measurement
9.4.2 pH Electrodes
9.4.3 Carbon Dioxide Sensors
9.5 Bioanalytical Sensors
9.5.1 Enzyme-Based Biosensors
9.5.2 Microbial Biosensors
9.6 Optical Biosensors
9.6.1 Optical Fibers
9.6.2 Sensing Mechanisms
9.6.3 Indicator-Mediated Fiber Optic Sensors
505
9.6.4 Immunoassay Sensors
9.6.5 Surface Plasmon Resonance Sensors
Exercises
Suggested Reading
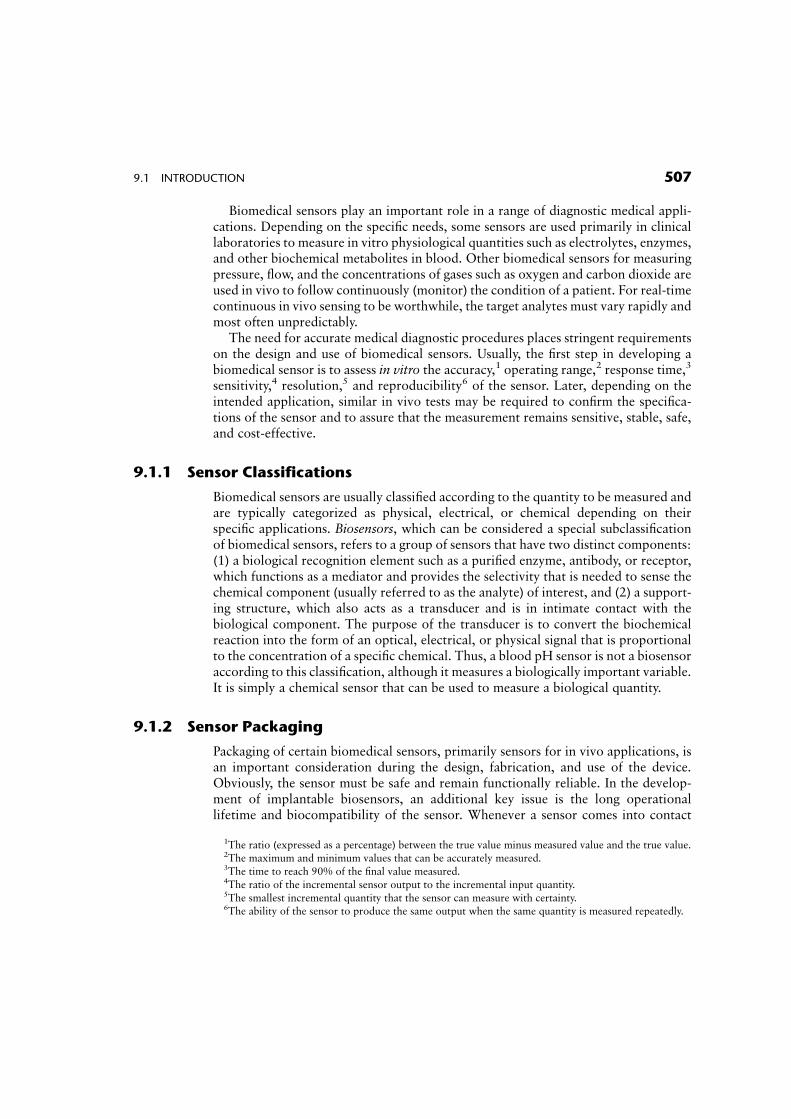
At the conclusion of this chapter, the reader will be able to:
& Describe the different classifications of biomedical sensors.
& Describe the characteristics that are important for packaging materials associated with
biomedical sensors.
& Calculate the half-cell potentials generated by different electrodes immersed in an
electrolyte solution.
& Describe the electrodes that are used to record the ECG, EEG, and EMG and those that are
used for intracellular recordings.
& Describe how displacement transducers, airflow transducers, and thermistors are used to
make physical measurements.
& Describe how blood gases and blood pH are measured.
& Described how enzyme-based and microbial biosensors work and some of their uses.
& Explain how optical biosensors work and describe some of their uses.
9.1 INTRODUCTION
Biomedical sensors are used routinely in clinical medicine and biological research formeasuring a wide range of physiological variables. They are often called biomedicaltransducers and are the main building blocks of diagnostic medical instrumentationfound in physicians’ offices, clinical laboratories, and hospitals. These sensors areroutinely used in vivo to perform continuous invasive and noninvasive monitoring ofcritical physiological variables as well as in vitro to help clinicians in various diagnos-tic procedures. Some biomedical sensors are also used in nonmedical applicationssuch as environmental monitoring, agriculture, bioprocessing, food processing, andthe petrochemical and pharmacological industries.
Increasing pressures to lower health care costs, optimize efficiency, and pro-vide better care in less expensive settings without compromising patient careare shaping the future of clinical medicine. As part of this ongoing trend, clinicaltesting is rapidly being transformed by the introduction of new tests that will revolu-tionize the way physicians diagnose and treat diseases in the future. Amongthese changes, patient self-testing and physician office screening are the two mostrapidly expanding areas. This trend is driven by the desire of patients and physiciansalike to have the ability to perform some types of instantaneous diagnosis andto move the testing apparatus from an outside central clinical laboratory to thepoint of care.
506 CHAPTER 9 BIOMEDICAL SENSORS
Biomedical sensors play an important role in a range of diagnostic medical appli-cations. Depending on the specific needs, some sensors are used primarily in clinicallaboratories to measure in vitro physiological quantities such as electrolytes, enzymes,and other biochemical metabolites in blood. Other biomedical sensors for measuringpressure, flow, and the concentrations of gases such as oxygen and carbon dioxide areused in vivo to follow continuously (monitor) the condition of a patient. For real-timecontinuous in vivo sensing to be worthwhile, the target analytes must vary rapidly andmost often unpredictably.
The need for accurate medical diagnostic procedures places stringent requirementson the design and use of biomedical sensors. Usually, the first step in developing abiomedical sensor is to assess in vitro the accuracy,1 operating range,2 response time,3
sensitivity,4 resolution,5 and reproducibility6 of the sensor. Later, depending on theintended application, similar in vivo tests may be required to confirm the specifica-tions of the sensor and to assure that the measurement remains sensitive, stable, safe,and cost-effective.
9.1.1 Sensor Classifications
Biomedical sensors are usually classified according to the quantity to be measured andare typically categorized as physical, electrical, or chemical depending on theirspecific applications. Biosensors, which can be considered a special subclassificationof biomedical sensors, refers to a group of sensors that have two distinct components:(1) a biological recognition element such as a purified enzyme, antibody, or receptor,which functions as a mediator and provides the selectivity that is needed to sense thechemical component (usually referred to as the analyte) of interest, and (2) a support-ing structure, which also acts as a transducer and is in intimate contact with thebiological component. The purpose of the transducer is to convert the biochemicalreaction into the form of an optical, electrical, or physical signal that is proportionalto the concentration of a specific chemical. Thus, a blood pH sensor is not a biosensoraccording to this classification, although it measures a biologically important variable.It is simply a chemical sensor that can be used to measure a biological quantity.
9.1.2 Sensor Packaging
Packaging of certain biomedical sensors, primarily sensors for in vivo applications, isan important consideration during the design, fabrication, and use of the device.Obviously, the sensor must be safe and remain functionally reliable. In the develop-ment of implantable biosensors, an additional key issue is the long operationallifetime and biocompatibility of the sensor. Whenever a sensor comes into contact
1The ratio (expressed as a percentage) between the true value minus measured value and the true value.2The maximum and minimum values that can be accurately measured.3The time to reach 90% of the final value measured.4The ratio of the incremental sensor output to the incremental input quantity.5The smallest incremental quantity that the sensor can measure with certainty.6The ability of the sensor to produce the same output when the same quantity is measured repeatedly.
9.1 INTRODUCTION 507
with body fluids, the host itself may affect the function of the sensor or the sensor mayaffect the site in which it is implanted. For example, protein absorption and cellulardeposits can alter the permeability of the sensor packaging which is designed to bothprotect the sensor and allow free chemical diffusion of certain analytes between thebody fluids and the biosensor. Improper packaging of implantable biomedical sensorscould lead to drift and a gradual loss of sensor sensitivity and stability over time.Furthermore, inflammation of tissue, infection, or clotting in a vascular site mayproduce harmful adverse effects (see Chapter 6). Hence, the materials used in theconstruction of the sensor’s outer body must be nonthrombogenic and nontoxic sincethey play a critical role in determining the overall performance and longevity of animplantable sensor. One convenient strategy is to utilize various polymeric coveringmaterials and barrier layers to minimize leaching of potentially toxic sensor compon-ents into the body. It is also important to keep in mind that once the sensor ismanufactured, common sterilization practices by steam, ethylene oxide, or gammaradiation must not alter the chemical diffusion properties of the sensor packagingmaterial.
This chapter will examine the operation principles of biomedical sensors includingexamples of invasive and noninvasive sensors for measuring biopotentials and otherphysical and biochemical variables encountered in different clinical and researchapplications.
9.2 BIOPOTENTIAL MEASUREMENTS
Biopotential measurements are made using different kinds of specialized electrodes.The function of these electrodes is to couple the ionic potentials generated inside thebody to an electronic instrument. Biopotential electrodes are classified either asnoninvasive (skin surface) or invasive (e.g., microelectrodes or wire electrodes).
9.2.1 The Electrolyte/Metal Electrode Interface
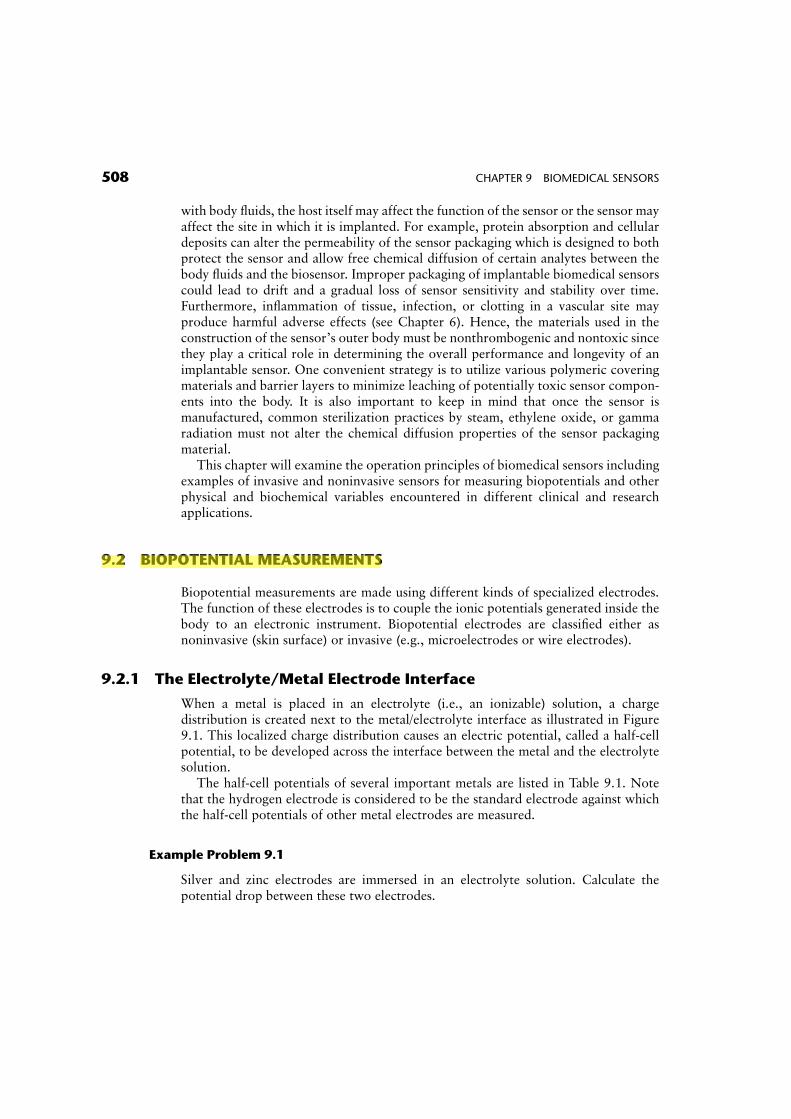
When a metal is placed in an electrolyte (i.e., an ionizable) solution, a chargedistribution is created next to the metal/electrolyte interface as illustrated in Figure9.1. This localized charge distribution causes an electric potential, called a half-cellpotential, to be developed across the interface between the metal and the electrolytesolution.
The half-cell potentials of several important metals are listed in Table 9.1. Notethat the hydrogen electrode is considered to be the standard electrode against whichthe half-cell potentials of other metal electrodes are measured.
Example Problem 9.1
Silver and zinc electrodes are immersed in an electrolyte solution. Calculate thepotential drop between these two electrodes.
508 CHAPTER 9 BIOMEDICAL SENSORS
Ken Chen
螢光標示
Solution
From Table 9.1, the half-cell potentials for the silver and zinc electrodes are 0.799 and�0.763V, respectively. Therefore, the potential drop between these two metal elec-trodes is equal to
0:799� (�0:763) ¼ 1:562V
Typically, biopotential measurements are made by utilizing two similar electrodescomposed of the same metal. Therefore, the two half-cell potentials for these elec-trodes would be equal in magnitude. For example, two similar biopotential electrodescan be taped to the chest near the heart to measure the electrical potentials generatedby the heart (electrocardiogram, or ECG). Ideally, assuming that the skin-to-electrodeinterfaces are electrically identical, the differential amplifier attached to these twoelectrodes would amplify the biopotential (ECG) signal but the half-cell potentials
Figure 9.1 Distribution of charges at a metal/electrolyte interface.
TABLE 9.1 Half-cell Potentials of Important Metals
Primary Metal and Chemical Reaction Half-cell Potential
Al �! Al3þ þ 3e� �1:706Cr �! Cr3þ þ 3e� �0:744Cd �! Cd2þ þ 2e� �0:401Zn �! Zn2þ þ 2e� �0:763Fe �! Fe2þ þ 2e� �0:409Ni �! Ni2þ þ 2e� �0:230Pb �! Pb2þ þ 2e� �0:126H2 �! 2Hþ þ 2e� 0.000 (standard by definition)
Ag �! Agþ þ e� þ0:799Au �! Au3þ þ 3e� þ1:420Cu �! Cu2þ þ 2e� þ0:340Agþ Cl� �! AgClþ 2e� þ0:223
9.2 BIOPOTENTIAL MEASUREMENTS 509
would be canceled out. In practice, however, disparity in electrode material or skincontact resistance could cause a significant DC offset voltage that would cause acurrent to flow through the two electrodes. This current will produce a voltagedrop across the body. The offset voltage will appear superimposed at theoutput of the amplifier and may cause instability or base line drift in the recordedbiopotential. &
Example Problem 9.2
Silver and aluminum electrodes are placed in an electrolyte solution. Calculate thecurrent that will flow through the electrodes if the equivalent resistance of thesolution is equal to 2 kV.
Solution
0:799� (�1:706) ¼ 2:505V
2:505V=2 kV ¼ 1:252mA &
9.2.2 ECG Electrodes
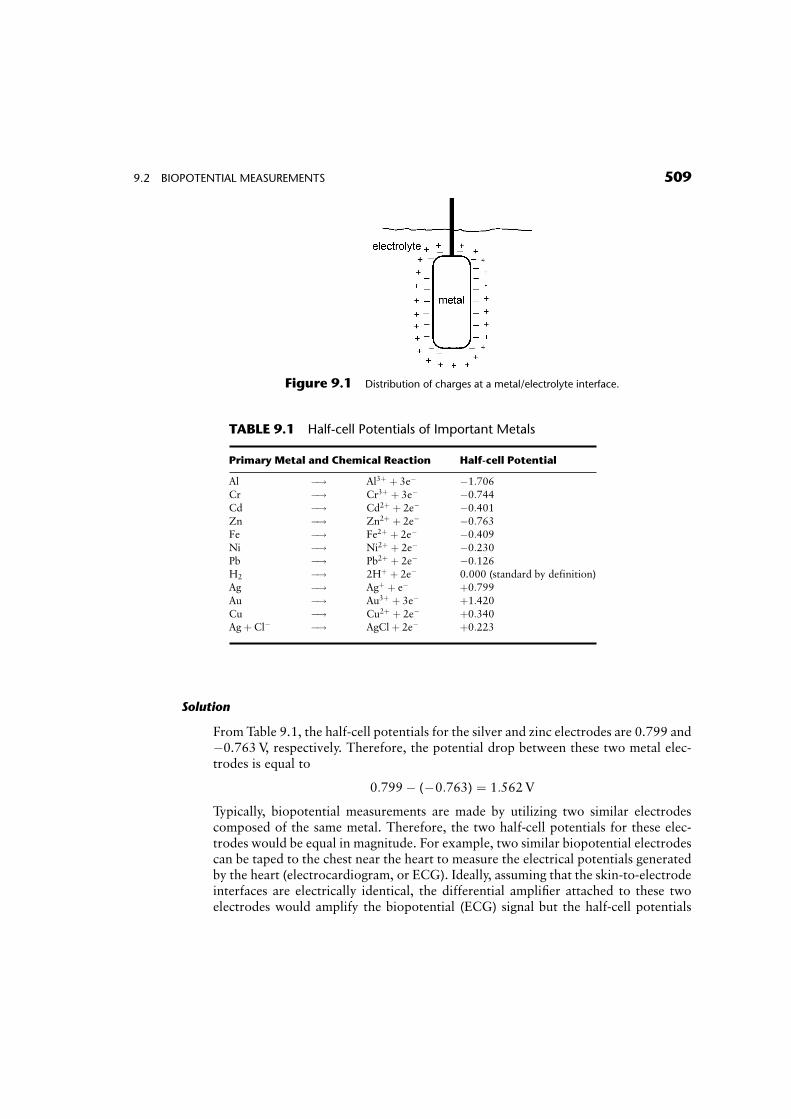
Examples of different types of noninvasive biopotential electrodes used primarily forECG recording are shown in Figure 9.2.
A typical flexible biopotential electrode for ECG recording is composed of certaintypes of polymers or elastomers which are made electrically conductive by theaddition of a fine carbon or metal powder. These electrodes (Fig. 9.2a) are availablewith prepasted AgCl gel for quick and easy application to the skin using a double-sided peel-off adhesive tape.
The most common type of biopotential electrode is the ‘‘floating’’ silver/silverchloride electrode (Ag/AgCl), which is formed by electrochemically depositing a very
Figure 9.2 Biopotential skin surface ECG electrodes: (a) flexible Mylar electrode, and (b) dispos-able snap-type Ag/AgCl electrode.
510 CHAPTER 9 BIOMEDICAL SENSORS
thin layer of silver chloride onto a silver electrode (Fig. 9.2b). These electrodesare recessed and imbedded in foam that has been soaked with an electrolytepaste to provide good electrical contact with the skin. The electrolyte saturatedfoam is also known to reduce motion artifacts which could be produced,for example, during stress testing when the layer of the skin moves relative to thesurface of the Ag/AgCl electrode. This motion artifact could cause large interferencein the recorded biopotential and, in extreme cases, could severely degrade the mea-surement.
9.2.3 EMG Electrodes
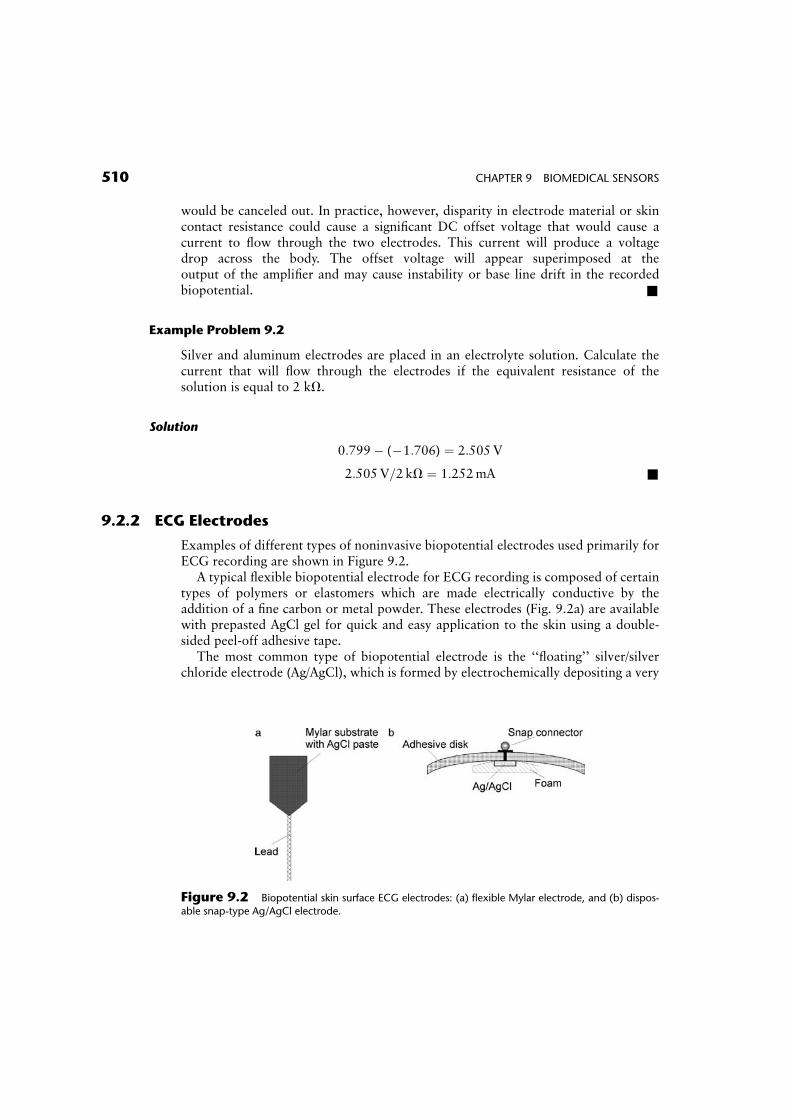
A number of different types of biopotential electrodes are used in recording electro-myographic (EMG) signals from different muscles in the body. The shape and sizeof the recorded EMG signals depends on the electrical property of these electrodesand the recording location. For noninvasive recordings, proper skin preparation,which normally involves cleansing the skin with alcohol or the application ofa small amount of an electrolyte paste, helps to minimize the impedance ofthe skin–electrode interface and improve the quality of the recorded signal consider-ably. The most common electrodes used for surface EMG recording and nerveconduction studies are circular discs, about 1 cm in diameter, that are made of silveror platinum. For direct recording of electrical signals from nerves and muscle fibers, avariety of percutaneous needle electrodes are available, as illustrated in Figure 9.3.The most common type of needle electrode is the concentric bipolar electrodeshown in Figure 9.3a. This electrode is made from thin metallic wires encased insidea larger canula or hypodermic needle. The two wires serve as the recording andreference electrodes. Another type of percutaneous EMG electrode is theunipolar needle electrode (Fig. 9.3b). This electrode is made of a thin wire that ismostly insulated by a thin layer of Teflon except about 0.3mm near the distaltip. Unlike a bipolar electrode, this electrode requires a second unipolar referenceelectrode to form a closed electrical circuit. The second recording electrode is nor-mally placed either adjacent to the recording electrode or attached to the surface ofthe skin.
Figure 9.3 Intramascular biopotential electrodes: (a) bipolar and (b) unipolar configuration.
9.2 BIOPOTENTIAL MEASUREMENTS 511
9.2.4 EEG Electrodes
The most commonly used electrodes for recording electroencephalographic (EEG)signals from the brain are cup electrodes and subdermal needle electrodes. Cupelectrodes are made of platinum or tin and are approximately 5–10mm in diameter.These cup electrodes are filled with a conducting electrolyte gel and can be attached tothe scalp with an adhesive tape.
Recording of electrical potentials from the scalp is difficult because hair and oilyskin impede good electrical contact. Therefore, clinicians sometimes prefer to usesubdermal EEG electrodes instead of metal surface electrodes for EEG recording.These are basically fine platinum or stainless-steel needle electrodes about 10mm longby 0.5mm wide, which are inserted under the skin to provide a better electricalcontact.
9.2.5 Microelectrodes
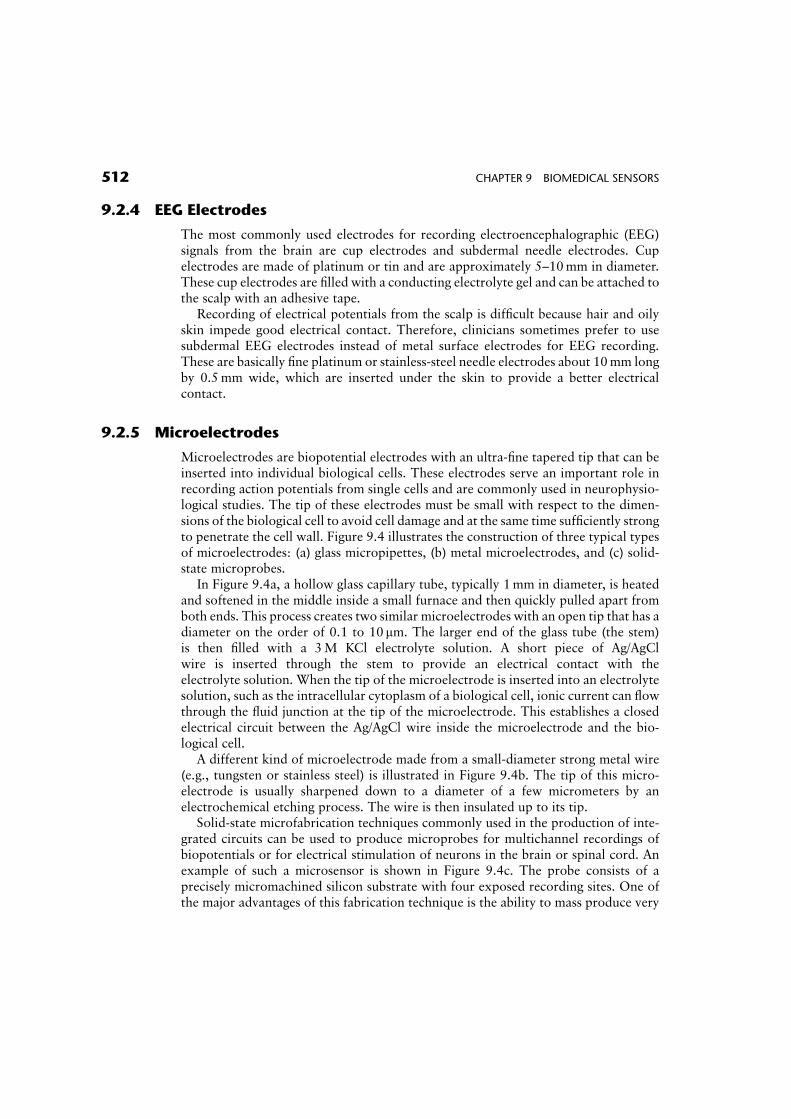
Microelectrodes are biopotential electrodes with an ultra-fine tapered tip that can beinserted into individual biological cells. These electrodes serve an important role inrecording action potentials from single cells and are commonly used in neurophysio-logical studies. The tip of these electrodes must be small with respect to the dimen-sions of the biological cell to avoid cell damage and at the same time sufficiently strongto penetrate the cell wall. Figure 9.4 illustrates the construction of three typical typesof microelectrodes: (a) glass micropipettes, (b) metal microelectrodes, and (c) solid-state microprobes.
In Figure 9.4a, a hollow glass capillary tube, typically 1mm in diameter, is heatedand softened in the middle inside a small furnace and then quickly pulled apart fromboth ends. This process creates two similar microelectrodes with an open tip that has adiameter on the order of 0.1 to 10 mm. The larger end of the glass tube (the stem)is then filled with a 3M KCl electrolyte solution. A short piece of Ag/AgClwire is inserted through the stem to provide an electrical contact with theelectrolyte solution. When the tip of the microelectrode is inserted into an electrolytesolution, such as the intracellular cytoplasm of a biological cell, ionic current can flowthrough the fluid junction at the tip of the microelectrode. This establishes a closedelectrical circuit between the Ag/AgCl wire inside the microelectrode and the bio-logical cell.
A different kind of microelectrode made from a small-diameter strong metal wire(e.g., tungsten or stainless steel) is illustrated in Figure 9.4b. The tip of this micro-electrode is usually sharpened down to a diameter of a few micrometers by anelectrochemical etching process. The wire is then insulated up to its tip.
Solid-state microfabrication techniques commonly used in the production of inte-grated circuits can be used to produce microprobes for multichannel recordings ofbiopotentials or for electrical stimulation of neurons in the brain or spinal cord. Anexample of such a microsensor is shown in Figure 9.4c. The probe consists of aprecisely micromachined silicon substrate with four exposed recording sites. One ofthe major advantages of this fabrication technique is the ability to mass produce very
512 CHAPTER 9 BIOMEDICAL SENSORS
small and highly sophisticated microsensors with highly reproducible electrical andphysical properties.
9.3 PHYSICAL MEASUREMENTS
9.3.1 Displacement Transducers
Inductive displacement transducers are based on the inductance L of a coil given by
L ¼ n2 �G� m (9:1)
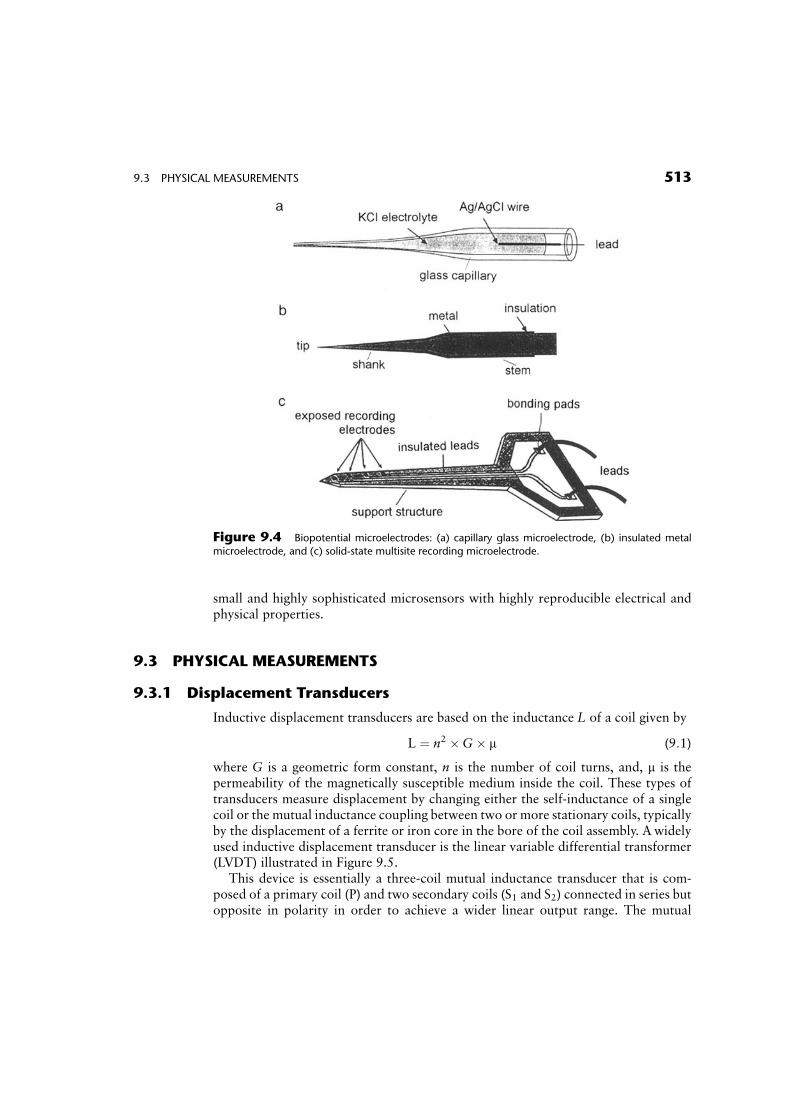
where G is a geometric form constant, n is the number of coil turns, and, m is thepermeability of the magnetically susceptible medium inside the coil. These types oftransducers measure displacement by changing either the self-inductance of a singlecoil or the mutual inductance coupling between two or more stationary coils, typicallyby the displacement of a ferrite or iron core in the bore of the coil assembly. A widelyused inductive displacement transducer is the linear variable differential transformer(LVDT) illustrated in Figure 9.5.
This device is essentially a three-coil mutual inductance transducer that is com-posed of a primary coil (P) and two secondary coils (S1 and S2) connected in series butopposite in polarity in order to achieve a wider linear output range. The mutual
Figure 9.4 Biopotential microelectrodes: (a) capillary glass microelectrode, (b) insulated metal
microelectrode, and (c) solid-state multisite recording microelectrode.
9.3 PHYSICAL MEASUREMENTS 513
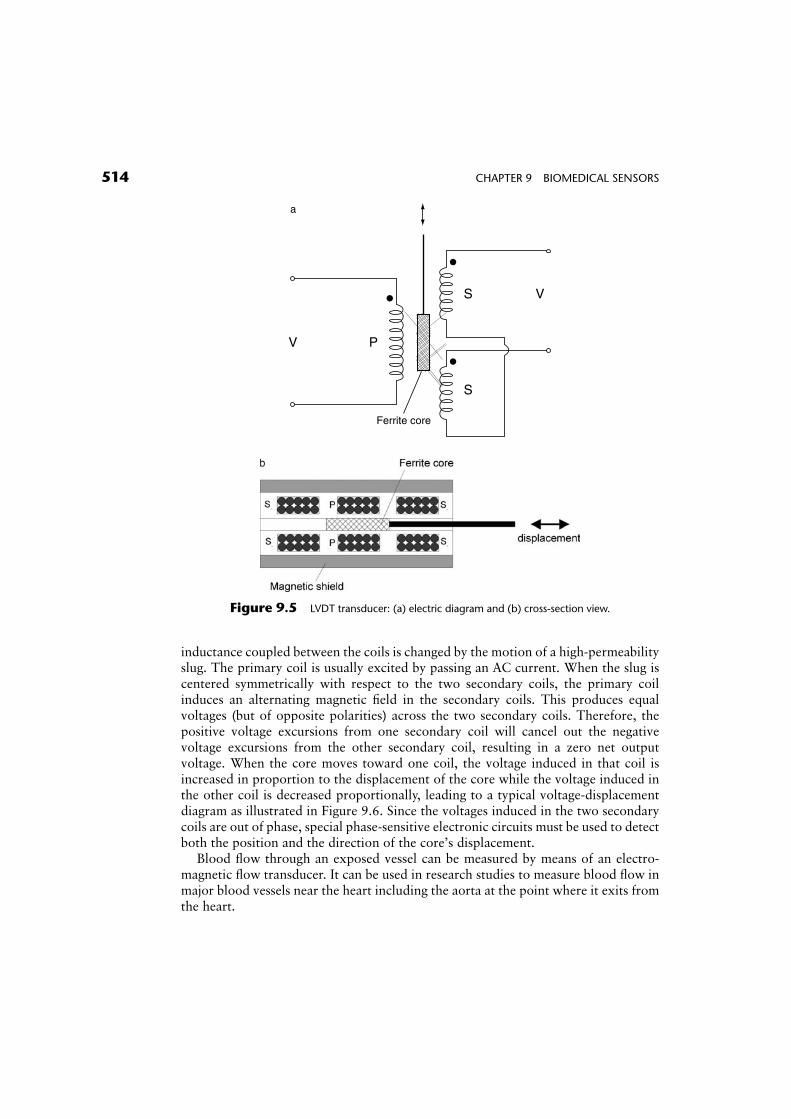
inductance coupled between the coils is changed by the motion of a high-permeabilityslug. The primary coil is usually excited by passing an AC current. When the slug iscentered symmetrically with respect to the two secondary coils, the primary coilinduces an alternating magnetic field in the secondary coils. This produces equalvoltages (but of opposite polarities) across the two secondary coils. Therefore, thepositive voltage excursions from one secondary coil will cancel out the negativevoltage excursions from the other secondary coil, resulting in a zero net outputvoltage. When the core moves toward one coil, the voltage induced in that coil isincreased in proportion to the displacement of the core while the voltage induced inthe other coil is decreased proportionally, leading to a typical voltage-displacementdiagram as illustrated in Figure 9.6. Since the voltages induced in the two secondarycoils are out of phase, special phase-sensitive electronic circuits must be used to detectboth the position and the direction of the core’s displacement.
Blood flow through an exposed vessel can be measured by means of an electro-magnetic flow transducer. It can be used in research studies to measure blood flow inmajor blood vessels near the heart including the aorta at the point where it exits fromthe heart.
PV
Ferrite core
S
S V
a
Figure 9.5 LVDT transducer: (a) electric diagram and (b) cross-section view.
514 CHAPTER 9 BIOMEDICAL SENSORS
Consider a blood vessel of diameter l filled with blood flowing with a uniformvelocity ~uu. If the blood vessel is placed in a uniform magnetic field ~BB that is perpen-dicular to the direction of blood flow, the negatively charged anion and positivelycharged cation particles in the blood will experience a force ~FF that is normal to boththe magnetic field and blood flow directions and is given by
~FF ¼ q(~uu�~BB) (9:2)
where q is the elementary charge (1:6� 10�19 C). As a result, these charged particleswill be deflected in opposite directions and will move along the diameter of the bloodvessels according to the direction of the force vector ~FF. This movement will producean opposing force ~FFo which is equal to
~FFo ¼ q�~EE ¼ q� V
l(9:3)
where ~EE is the net electrical field produced by the displacement of the chargedparticles and V is the potential produced across the blood vessel. At equilibrium,these two forces will be equal. Therefore, the potential difference V is given by
V ¼ B� l� u (9:4)
and is proportional to the velocity of blood through the vessel.
Figure 9.6 Output voltage versus core displacement of a typical LVDT transducer.
9.3 PHYSICAL MEASUREMENTS 515
Example Problem 9.3
Calculate the voltage induced in a magnetic flow probe if the probe is applied across ablood vessel with a diameter of 0.5 cm and the flow rate of blood is 5 cm/s. Assumethat the magnitude of the magnetic field, B, is equal to 1:5� 10�5 Wb=m2.
Solution
From Eq. 9.4,
V ¼ B� l� u ¼ (1:5� 10�5 Wb=m2)� (0:5� 10�2 m)� (5� 10�2 m=s)
¼ 3:75� 10�9 V
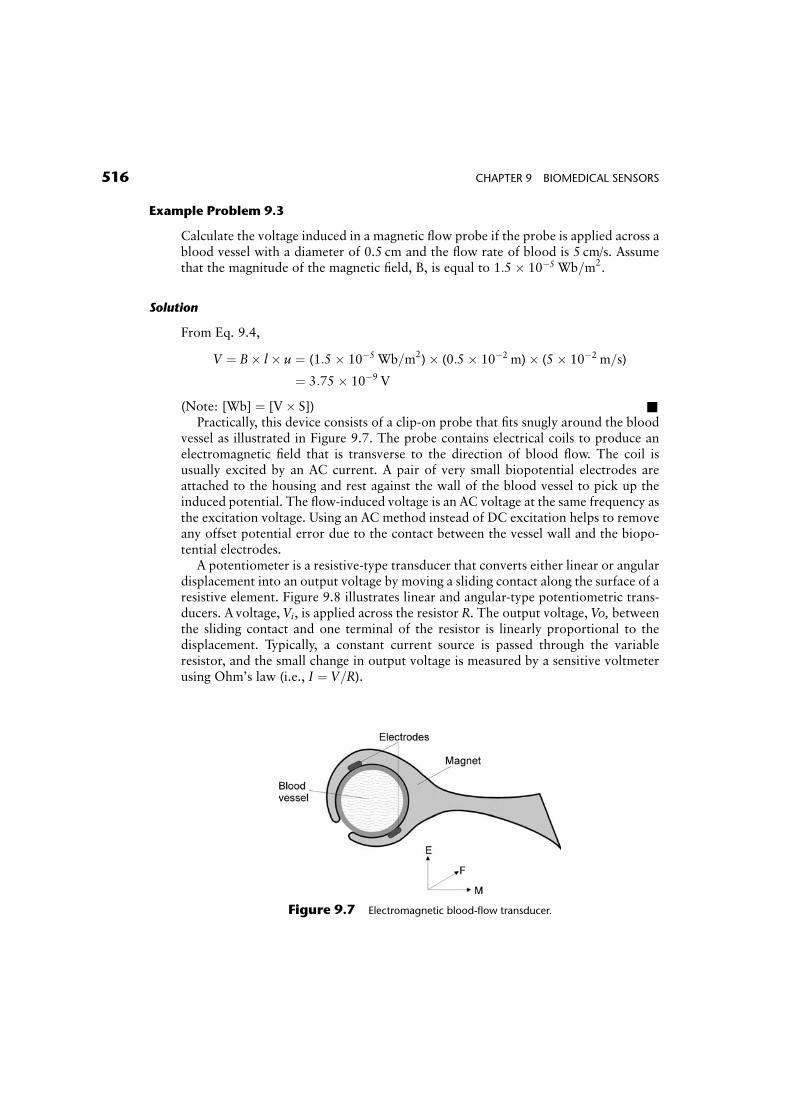
(Note: [Wb] ¼ [V� S]) &Practically, this device consists of a clip-on probe that fits snugly around the blood
vessel as illustrated in Figure 9.7. The probe contains electrical coils to produce anelectromagnetic field that is transverse to the direction of blood flow. The coil isusually excited by an AC current. A pair of very small biopotential electrodes areattached to the housing and rest against the wall of the blood vessel to pick up theinduced potential. The flow-induced voltage is an AC voltage at the same frequency asthe excitation voltage. Using an AC method instead of DC excitation helps to removeany offset potential error due to the contact between the vessel wall and the biopo-tential electrodes.
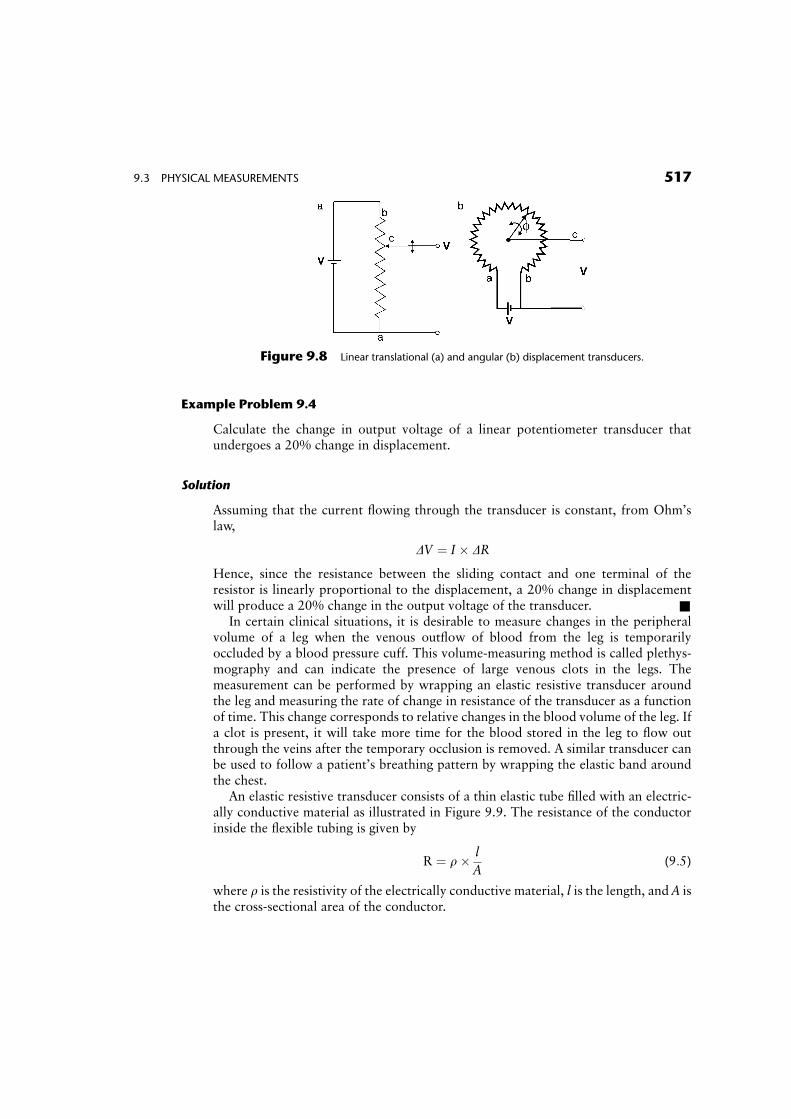
A potentiometer is a resistive-type transducer that converts either linear or angulardisplacement into an output voltage by moving a sliding contact along the surface of aresistive element. Figure 9.8 illustrates linear and angular-type potentiometric trans-ducers. A voltage, Vi, is applied across the resistor R. The output voltage, Vo, betweenthe sliding contact and one terminal of the resistor is linearly proportional to thedisplacement. Typically, a constant current source is passed through the variableresistor, and the small change in output voltage is measured by a sensitive voltmeterusing Ohm’s law (i.e., I ¼ V=R).
Figure 9.7 Electromagnetic blood-flow transducer.
516 CHAPTER 9 BIOMEDICAL SENSORS
Example Problem 9.4
Calculate the change in output voltage of a linear potentiometer transducer thatundergoes a 20% change in displacement.
Solution
Assuming that the current flowing through the transducer is constant, from Ohm’slaw,
DV ¼ I � DR
Hence, since the resistance between the sliding contact and one terminal of theresistor is linearly proportional to the displacement, a 20% change in displacementwill produce a 20% change in the output voltage of the transducer. &
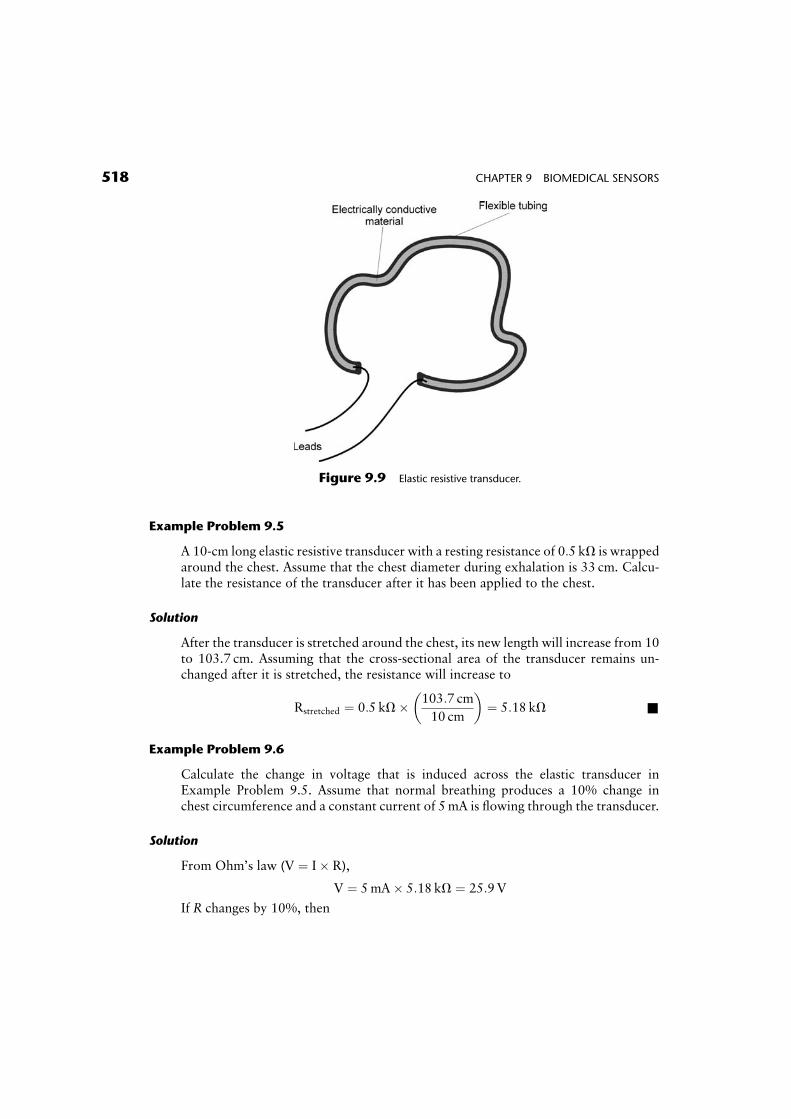
In certain clinical situations, it is desirable to measure changes in the peripheralvolume of a leg when the venous outflow of blood from the leg is temporarilyoccluded by a blood pressure cuff. This volume-measuring method is called plethys-mography and can indicate the presence of large venous clots in the legs. Themeasurement can be performed by wrapping an elastic resistive transducer aroundthe leg and measuring the rate of change in resistance of the transducer as a functionof time. This change corresponds to relative changes in the blood volume of the leg. Ifa clot is present, it will take more time for the blood stored in the leg to flow outthrough the veins after the temporary occlusion is removed. A similar transducer canbe used to follow a patient’s breathing pattern by wrapping the elastic band aroundthe chest.
An elastic resistive transducer consists of a thin elastic tube filled with an electric-ally conductive material as illustrated in Figure 9.9. The resistance of the conductorinside the flexible tubing is given by
R ¼ r� l
A(9:5)
where r is the resistivity of the electrically conductive material, l is the length, and A isthe cross-sectional area of the conductor.
Figure 9.8 Linear translational (a) and angular (b) displacement transducers.
9.3 PHYSICAL MEASUREMENTS 517
Example Problem 9.5
A 10-cm long elastic resistive transducer with a resting resistance of 0:5 kV is wrappedaround the chest. Assume that the chest diameter during exhalation is 33 cm. Calcu-late the resistance of the transducer after it has been applied to the chest.
Solution
After the transducer is stretched around the chest, its new length will increase from 10to 103.7 cm. Assuming that the cross-sectional area of the transducer remains un-changed after it is stretched, the resistance will increase to
Rstretched ¼ 0:5 kV� 103:7 cm
10 cm
� �¼ 5:18 kV &
Example Problem 9.6
Calculate the change in voltage that is induced across the elastic transducer inExample Problem 9.5. Assume that normal breathing produces a 10% change inchest circumference and a constant current of 5mA is flowing through the transducer.
Solution
From Ohm’s law (V ¼ I� R),
V ¼ 5mA� 5:18 kV ¼ 25:9V
If R changes by 10%, then
Figure 9.9 Elastic resistive transducer.
518 CHAPTER 9 BIOMEDICAL SENSORS
V ¼ 5mA� 1:1� 5:18 kV ¼ 28:5V
DV ¼ 2:6V&
Strain gauges are displacement-type transducers that measure changes in the length ofan object as a result of an applied force. These transducers produce a resistancechange that is proportional to the fractional change in the length of the object, alsocalled strain, S, which is defined as
S ¼ Dl
l(9:6)
where Dl is the fractional change in length and l is the initial length of the object.Examples include resistive wire elements and certain semiconductor materials.
To understand how a strain gauge works, consider a fine wire conductor of length l,cross-sectional area A, and resistivity r. The resistance of the unstretched wire is givenby Eq. 9.5. Now suppose that the wire is stretched within its elastic limit by a smallamount, Dl, such that its new length becomes (lþ Dl). Because the volume of thestretched wire must remain constant, the increase in the wire length results in asmaller cross-sectional area, Astretched. Thus,
lA ¼ (lþ Dl)� Astretched (9:7)
The resistance of the stretched wire is given by
Rstretched ¼ r� lþ Dl
Astretched(9:8)
The increase in the resistance of the stretched wire DR is
DR ¼ Rstretched � r� l
A(9:9)
Substituting Eq. 9.8 and the value for Astretched from Eq. 9.7 into Eq. 9.9 gives
DR ¼ r� (lþ Dl)2
l� A� r� l
A¼ r� (l2 þ 2lDlþ Dl2 � l2)
l� A(9:10)
Assume that for small changes in length, Dl << l, this relationship simplifies to
DR ¼ r� 2� Dl
A¼ 2� Dl
l� R (9:11)
The fractional change in resistance (DR=R) divided by the fractional change in length(Dl=l) is called the gauge factor, G. For a common metal wire strain gauge madeof constantan, G is approximately equal to 2. Semiconductor strain gauges made ofsilicon have a gauge factor about 70 to 100 times higher and are therefore much moresensitive than metallic wire strain gauges.
Example Problem 9.7
Calculate the strain in a metal wire gauge for a fractional change in resistance of 10%.
9.3 PHYSICAL MEASUREMENTS 519
Solution
Combine Eqs. (9.6) and (9.11) to obtain
DR
R¼ 2� Dl
l¼ 2� S
0:1
R¼ 2� S
S ¼ 0:05
R&
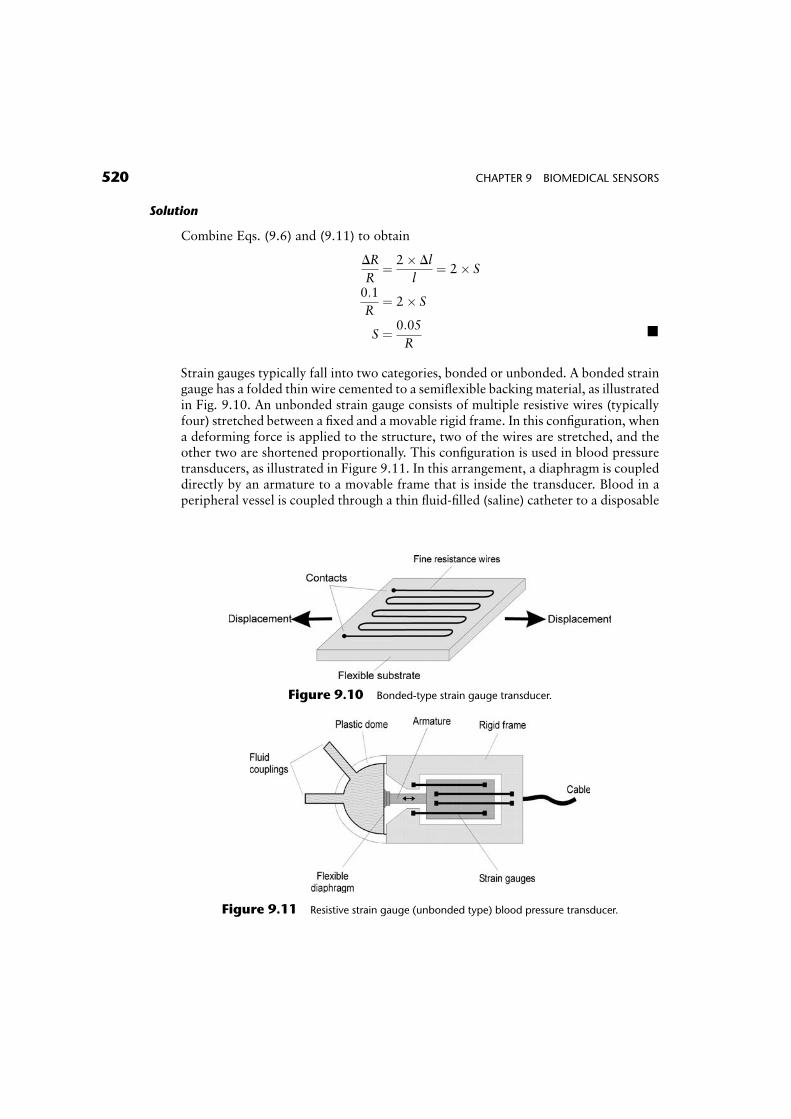
Strain gauges typically fall into two categories, bonded or unbonded. A bonded straingauge has a folded thin wire cemented to a semiflexible backing material, as illustratedin Fig. 9.10. An unbonded strain gauge consists of multiple resistive wires (typicallyfour) stretched between a fixed and a movable rigid frame. In this configuration, whena deforming force is applied to the structure, two of the wires are stretched, and theother two are shortened proportionally. This configuration is used in blood pressuretransducers, as illustrated in Figure 9.11. In this arrangement, a diaphragm is coupleddirectly by an armature to a movable frame that is inside the transducer. Blood in aperipheral vessel is coupled through a thin fluid-filled (saline) catheter to a disposable
Figure 9.10 Bonded-type strain gauge transducer.
Figure 9.11 Resistive strain gauge (unbonded type) blood pressure transducer.
520 CHAPTER 9 BIOMEDICAL SENSORS
dome that is sealed by the flexible diaphragm. Changes in blood pressure during thepumping action of the heart apply a force on the diaphragm that causes the movableframe to move from its resting position. This movement causes the strain gauge wiresto stretch or compress and results in a cyclical change in resistance that is proportionalto the pulsatile blood pressure measured by the transducer.
In general, the change in resistance of a strain gauge is quite small. In addition,changes in temperature can also cause thermal expansion of the wire and thus lead tolarge changes in the resistance of a strain gauge. Therefore, very sensitive electronicamplifiers with special temperature compensation circuits are typically used in appli-cations involving strain gauge transducers.
The capacitance C between two equal-size parallel plates of cross-sectional area Aseparated by a distance d is given by
C ¼ eo � er � A
d(9:12)
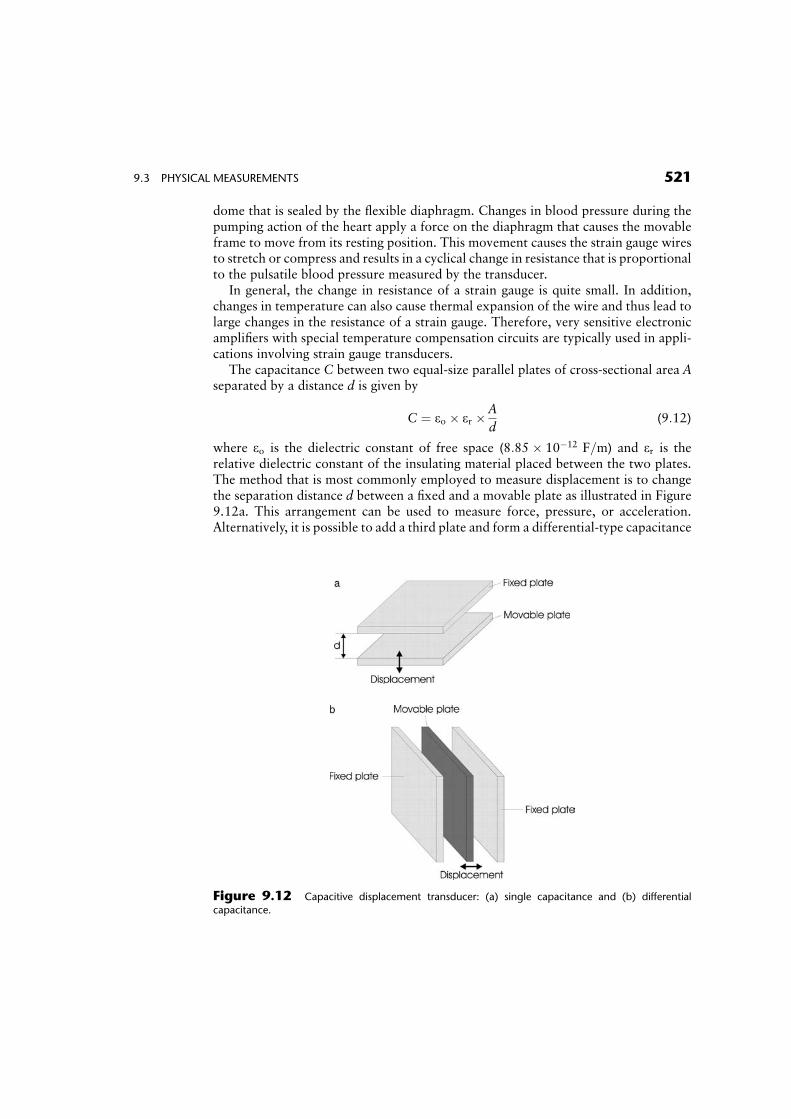
where eo is the dielectric constant of free space (8:85� 10�12 F=m) and er is therelative dielectric constant of the insulating material placed between the two plates.The method that is most commonly employed to measure displacement is to changethe separation distance d between a fixed and a movable plate as illustrated in Figure9.12a. This arrangement can be used to measure force, pressure, or acceleration.Alternatively, it is possible to add a third plate and form a differential-type capacitance
Figure 9.12 Capacitive displacement transducer: (a) single capacitance and (b) differential
capacitance.
9.3 PHYSICAL MEASUREMENTS 521
transducer (Fig. 9.12b). In this configuration, two of the plates are stationarywhereas the middle plate can be moved freely relative to the position of theother plates, thus creating two variable-size capacitors. Accordingly, movement ofthe middle plate which will change the initial distance d by �Dd will change thedistance between two adjacent plates such that one capacitor will increase whilethe other will decrease in value. This double-capacitor arrangement provides im-proved sensitivity and can be incorporated into a Wheatstone bridgeconfiguration (see Chapter 8). Capacitance sensors can be mass produced usingsolid-state microfabrication techniques that are commonly employed in making inte-grated circuits.
Example Problem 9.8
Two metal plates with an area of 4 cm2 and separation distance of 0.1mm are used toform a capacitance transducer. If the material between the two plates has a dielectricconstant er ¼ 2:5, calculate the capacitance of the transducer.
Solution
C ¼ eo � erA
d¼ 8:85� 10�12F=m� 2:5� 4� 10�4m2=(0:1� 10�3m) ¼ 0:885 F &
Capacitive displacement transducers can be used to measure respiration or movementby attaching multiple transducers to a mat that is placed on a bed. A capacitivedisplacement transducer can also be used as a pressure transducer by attaching themovable plate to a thin diaphragm that is in contact with a fluid or air. By applying avoltage across the capacitor and amplifying the small AC signal generated by themovement of the diaphragm, it is possible to obtain a signal that is proportional to theapplied external pressure source.
Piezoelectric transducers are used in cardiology to listen to heart sounds (phono-cardiography), in automated blood pressure measurements, and for measurement ofphysiological forces and accelerations. They are also commonly employed in generat-ing ultrasonic waves (high-frequency sound waves typically above 20 kHz) which areused for measuring blood flow or imaging internal soft structures in the body (seeChapter 16).
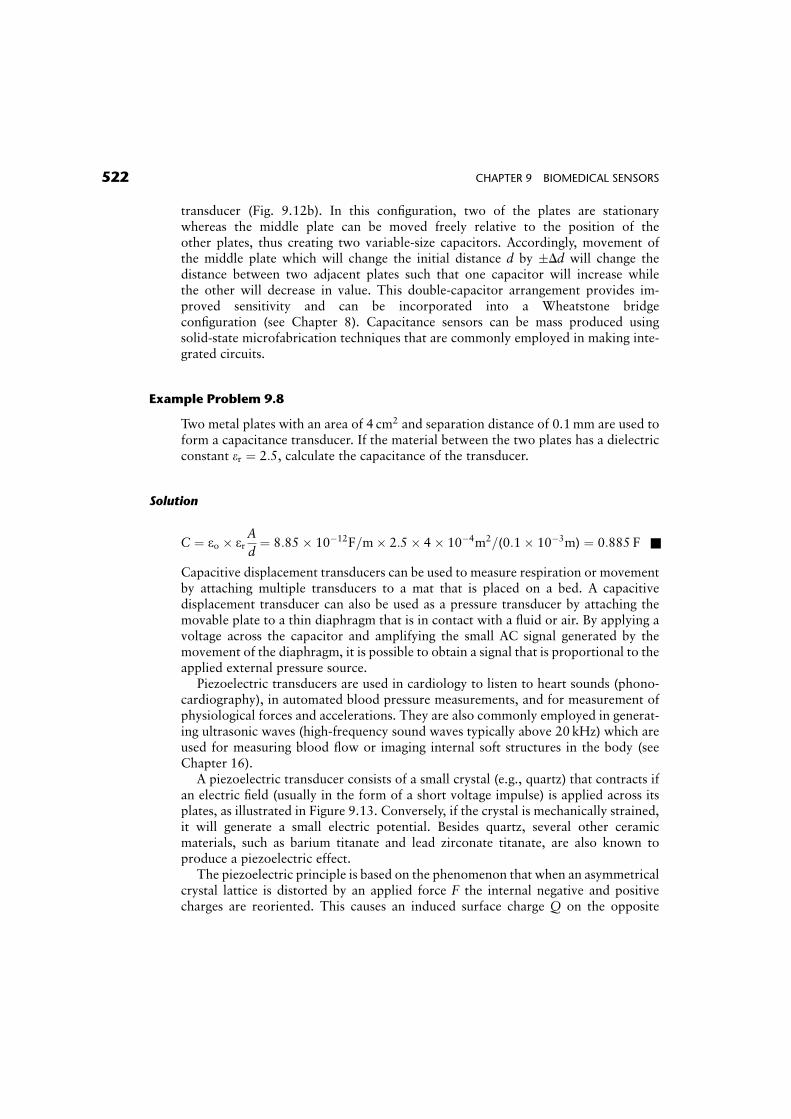
A piezoelectric transducer consists of a small crystal (e.g., quartz) that contracts ifan electric field (usually in the form of a short voltage impulse) is applied across itsplates, as illustrated in Figure 9.13. Conversely, if the crystal is mechanically strained,it will generate a small electric potential. Besides quartz, several other ceramicmaterials, such as barium titanate and lead zirconate titanate, are also known toproduce a piezoelectric effect.
The piezoelectric principle is based on the phenomenon that when an asymmetricalcrystal lattice is distorted by an applied force F the internal negative and positivecharges are reoriented. This causes an induced surface charge Q on the opposite
522 CHAPTER 9 BIOMEDICAL SENSORS
sides of the crystal. The induced charge is directly proportional to the applied force andis given by
Q ¼ k� F (9:13)
where k is a proportionality constant for the specific piezoelectric material. Byassuming that the piezoelectric crystal acts like a parallel plate capacitor, the voltageacross the crystal, V, is given by
DV ¼ DQ
C(9:14)
where C is the equivalent capacitance of the crystal.
Example Problem 9.9
Derive a relationship for calculating the output voltage across a piezoelectric trans-ducer that has a thickness d and area A in terms of an applied force F.
Solution
The capacitance of a piezoelectric transducer can be approximated by Eq. 9.12. Eq.9.14 is combined with the relationship given by Eq. 9.13 and 9.14 to give
DV ¼ DQ
C¼ k� F
C¼ k� F� d
e0 � er � A&
Since the crystal has an internal leakage resistance, any steady charge produced acrossits surfaces will eventually be dissipated. Consequently, these piezoelectric trans-ducers are not suitable for measuring a steady or low-frequency DC force. Instead,they are used either as variable force transducers or as mechanically resonatingdevices to generate high frequencies (typically from 1 to 10MHz) either in crystal-controlled oscillators or as ultrasonic pulse transducers.
Piezoelectric transducers are commonly used in biomedical applications to mea-sure the thickness of an object or in noninvasive blood pressure monitors. Forinstance, if two similar crystals are placed across an object (e.g., a blood vessel), onecrystal can be excited to produce a short burst of ultrasound. The time it takes for thissound to reach the other transducer can be measured. Assuming that the velocity of
Figure 9.13 Ultrasonic transducer.
9.3 PHYSICAL MEASUREMENTS 523
sound propagation in soft tissue, ct, is known (typically 1500m/s), the time, t, it takesthe ultrasonic pulse to propagate across the object can be measured and used tocalculate the separation distance, d, of the two transducers from the followingrelationship
d ¼ ct � t (9:15)
9.3.2 Airflow Transducers
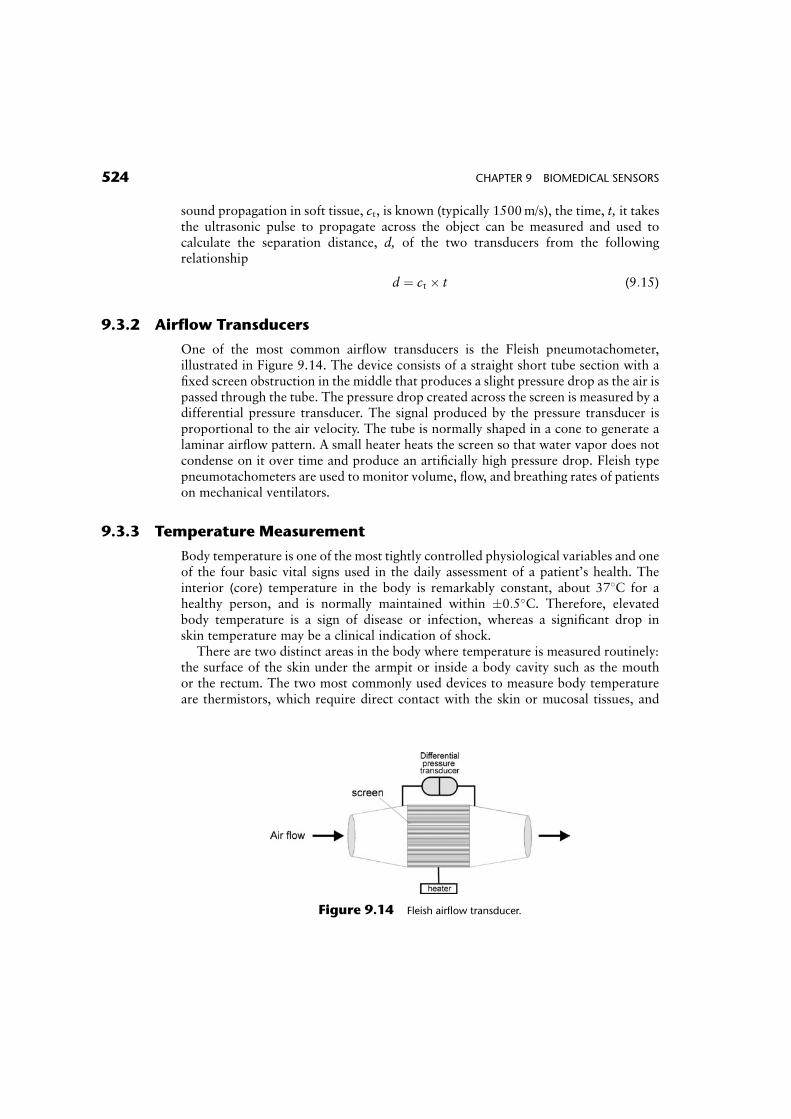
One of the most common airflow transducers is the Fleish pneumotachometer,illustrated in Figure 9.14. The device consists of a straight short tube section with afixed screen obstruction in the middle that produces a slight pressure drop as the air ispassed through the tube. The pressure drop created across the screen is measured by adifferential pressure transducer. The signal produced by the pressure transducer isproportional to the air velocity. The tube is normally shaped in a cone to generate alaminar airflow pattern. A small heater heats the screen so that water vapor does notcondense on it over time and produce an artificially high pressure drop. Fleish typepneumotachometers are used to monitor volume, flow, and breathing rates of patientson mechanical ventilators.
9.3.3 Temperature Measurement
Body temperature is one of the most tightly controlled physiological variables and oneof the four basic vital signs used in the daily assessment of a patient’s health. Theinterior (core) temperature in the body is remarkably constant, about 378C for ahealthy person, and is normally maintained within �0:5�C. Therefore, elevatedbody temperature is a sign of disease or infection, whereas a significant drop inskin temperature may be a clinical indication of shock.
There are two distinct areas in the body where temperature is measured routinely:the surface of the skin under the armpit or inside a body cavity such as the mouthor the rectum. The two most commonly used devices to measure body temperatureare thermistors, which require direct contact with the skin or mucosal tissues, and
Figure 9.14 Fleish airflow transducer.
524 CHAPTER 9 BIOMEDICAL SENSORS
non-contact thermometers, which measure body core temperature inside the auditorycanal.
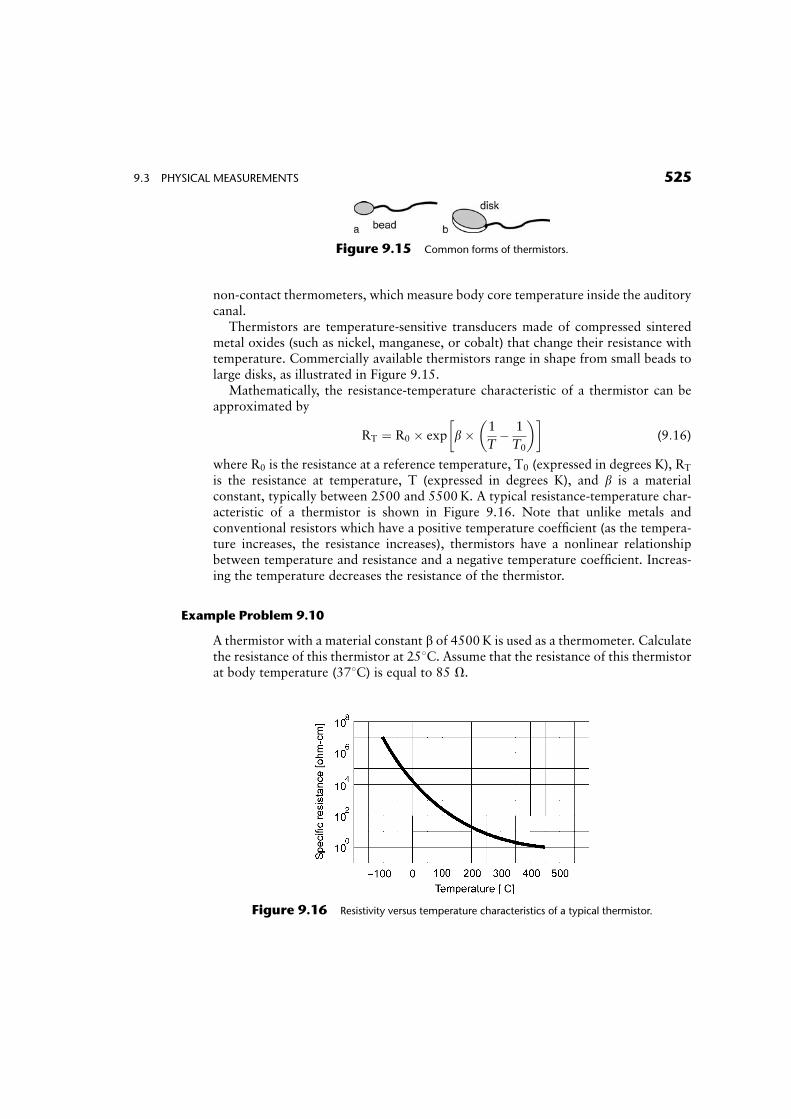
Thermistors are temperature-sensitive transducers made of compressed sinteredmetal oxides (such as nickel, manganese, or cobalt) that change their resistance withtemperature. Commercially available thermistors range in shape from small beads tolarge disks, as illustrated in Figure 9.15.
Mathematically, the resistance-temperature characteristic of a thermistor can beapproximated by
RT ¼ R0 � exp b� 1
T� 1
T0
� �� �(9:16)
where R0 is the resistance at a reference temperature, T0 (expressed in degrees K), RT
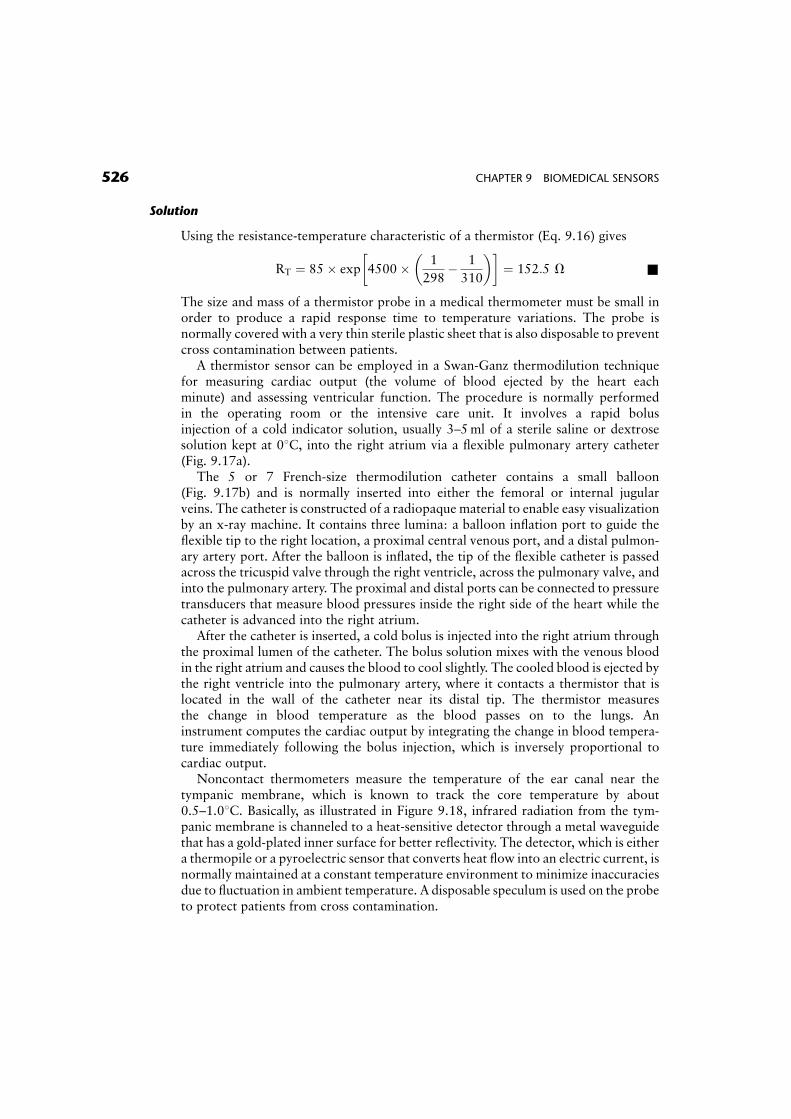
is the resistance at temperature, T (expressed in degrees K), and b is a materialconstant, typically between 2500 and 5500K. A typical resistance-temperature char-acteristic of a thermistor is shown in Figure 9.16. Note that unlike metals andconventional resistors which have a positive temperature coefficient (as the tempera-ture increases, the resistance increases), thermistors have a nonlinear relationshipbetween temperature and resistance and a negative temperature coefficient. Increas-ing the temperature decreases the resistance of the thermistor.
Example Problem 9.10
A thermistor with a material constant b of 4500K is used as a thermometer. Calculatethe resistance of this thermistor at 258C. Assume that the resistance of this thermistorat body temperature (378C) is equal to 85 V.
Figure 9.15 Common forms of thermistors.
Figure 9.16 Resistivity versus temperature characteristics of a typical thermistor.
9.3 PHYSICAL MEASUREMENTS 525
Solution
Using the resistance-temperature characteristic of a thermistor (Eq. 9.16) gives
RT ¼ 85� exp 4500� 1
298� 1
310
� �� �¼ 152:5 V &
The size and mass of a thermistor probe in a medical thermometer must be small inorder to produce a rapid response time to temperature variations. The probe isnormally covered with a very thin sterile plastic sheet that is also disposable to preventcross contamination between patients.
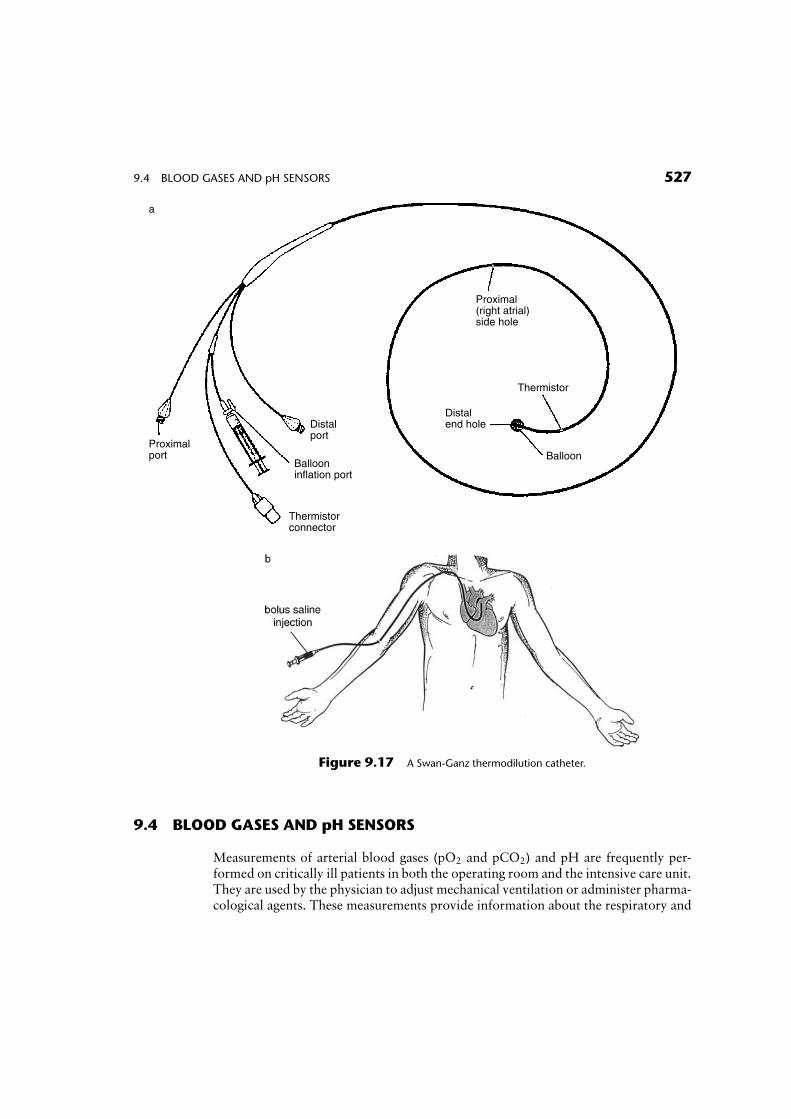
A thermistor sensor can be employed in a Swan-Ganz thermodilution techniquefor measuring cardiac output (the volume of blood ejected by the heart eachminute) and assessing ventricular function. The procedure is normally performedin the operating room or the intensive care unit. It involves a rapid bolusinjection of a cold indicator solution, usually 3–5ml of a sterile saline or dextrosesolution kept at 08C, into the right atrium via a flexible pulmonary artery catheter(Fig. 9.17a).
The 5 or 7 French-size thermodilution catheter contains a small balloon(Fig. 9.17b) and is normally inserted into either the femoral or internal jugularveins. The catheter is constructed of a radiopaque material to enable easy visualizationby an x-ray machine. It contains three lumina: a balloon inflation port to guide theflexible tip to the right location, a proximal central venous port, and a distal pulmon-ary artery port. After the balloon is inflated, the tip of the flexible catheter is passedacross the tricuspid valve through the right ventricle, across the pulmonary valve, andinto the pulmonary artery. The proximal and distal ports can be connected to pressuretransducers that measure blood pressures inside the right side of the heart while thecatheter is advanced into the right atrium.
After the catheter is inserted, a cold bolus is injected into the right atrium throughthe proximal lumen of the catheter. The bolus solution mixes with the venous bloodin the right atrium and causes the blood to cool slightly. The cooled blood is ejected bythe right ventricle into the pulmonary artery, where it contacts a thermistor that islocated in the wall of the catheter near its distal tip. The thermistor measuresthe change in blood temperature as the blood passes on to the lungs. Aninstrument computes the cardiac output by integrating the change in blood tempera-ture immediately following the bolus injection, which is inversely proportional tocardiac output.
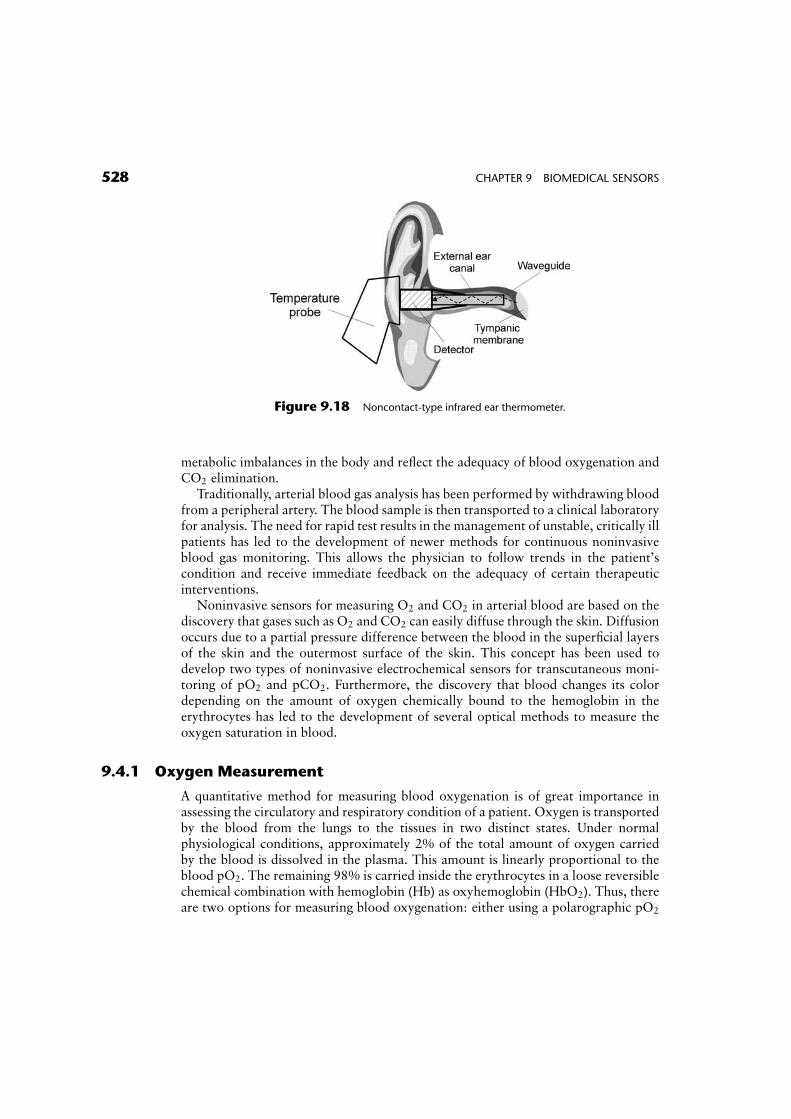
Noncontact thermometers measure the temperature of the ear canal near thetympanic membrane, which is known to track the core temperature by about0.5–1.08C. Basically, as illustrated in Figure 9.18, infrared radiation from the tym-panic membrane is channeled to a heat-sensitive detector through a metal waveguidethat has a gold-plated inner surface for better reflectivity. The detector, which is eithera thermopile or a pyroelectric sensor that converts heat flow into an electric current, isnormally maintained at a constant temperature environment to minimize inaccuraciesdue to fluctuation in ambient temperature. A disposable speculum is used on the probeto protect patients from cross contamination.
526 CHAPTER 9 BIOMEDICAL SENSORS
9.4 BLOOD GASES AND pH SENSORS
Measurements of arterial blood gases (pO2 and pCO2) and pH are frequently per-formed on critically ill patients in both the operating room and the intensive care unit.They are used by the physician to adjust mechanical ventilation or administer pharma-cological agents. These measurements provide information about the respiratory and
Proximal(right atrial)side hole
Thermistor
Balloon
Distalend holeDistal
port
Ballooninflation port
Thermistorconnector
Proximalport
a
Figure 9.17 A Swan-Ganz thermodilution catheter.
9.4 BLOOD GASES AND pH SENSORS 527
metabolic imbalances in the body and reflect the adequacy of blood oxygenation andCO2 elimination.
Traditionally, arterial blood gas analysis has been performed by withdrawing bloodfrom a peripheral artery. The blood sample is then transported to a clinical laboratoryfor analysis. The need for rapid test results in the management of unstable, critically illpatients has led to the development of newer methods for continuous noninvasiveblood gas monitoring. This allows the physician to follow trends in the patient’scondition and receive immediate feedback on the adequacy of certain therapeuticinterventions.
Noninvasive sensors for measuring O2 and CO2 in arterial blood are based on thediscovery that gases such as O2 and CO2 can easily diffuse through the skin. Diffusionoccurs due to a partial pressure difference between the blood in the superficial layersof the skin and the outermost surface of the skin. This concept has been used todevelop two types of noninvasive electrochemical sensors for transcutaneous moni-toring of pO2 and pCO2. Furthermore, the discovery that blood changes its colordepending on the amount of oxygen chemically bound to the hemoglobin in theerythrocytes has led to the development of several optical methods to measure theoxygen saturation in blood.
9.4.1 Oxygen Measurement
A quantitative method for measuring blood oxygenation is of great importance inassessing the circulatory and respiratory condition of a patient. Oxygen is transportedby the blood from the lungs to the tissues in two distinct states. Under normalphysiological conditions, approximately 2% of the total amount of oxygen carriedby the blood is dissolved in the plasma. This amount is linearly proportional to theblood pO2. The remaining 98% is carried inside the erythrocytes in a loose reversiblechemical combination with hemoglobin (Hb) as oxyhemoglobin (HbO2). Thus, thereare two options for measuring blood oxygenation: either using a polarographic pO2
Figure 9.18 Noncontact-type infrared ear thermometer.
528 CHAPTER 9 BIOMEDICAL SENSORS
sensor or measuring oxygen saturation (the relative amount of HbO2 in the blood) bymeans of an optical oximeter.
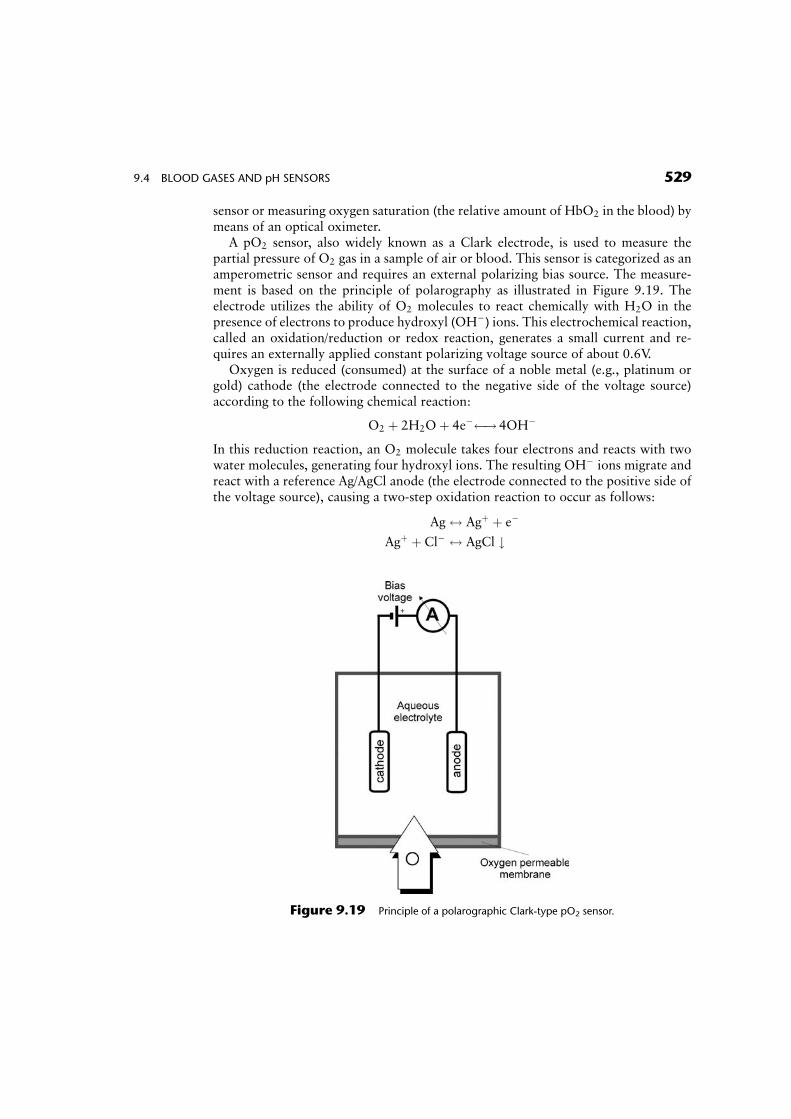
A pO2 sensor, also widely known as a Clark electrode, is used to measure thepartial pressure of O2 gas in a sample of air or blood. This sensor is categorized as anamperometric sensor and requires an external polarizing bias source. The measure-ment is based on the principle of polarography as illustrated in Figure 9.19. Theelectrode utilizes the ability of O2 molecules to react chemically with H2O in thepresence of electrons to produce hydroxyl (OH�) ions. This electrochemical reaction,called an oxidation/reduction or redox reaction, generates a small current and re-quires an externally applied constant polarizing voltage source of about 0.6V.
Oxygen is reduced (consumed) at the surface of a noble metal (e.g., platinum orgold) cathode (the electrode connected to the negative side of the voltage source)according to the following chemical reaction:
O2 þ 2H2Oþ 4e� ! 4OH�
In this reduction reaction, an O2 molecule takes four electrons and reacts with twowater molecules, generating four hydroxyl ions. The resulting OH� ions migrate andreact with a reference Ag/AgCl anode (the electrode connected to the positive side ofthe voltage source), causing a two-step oxidation reaction to occur as follows:
Ag$ Agþ þ e�
Agþ þ Cl� $ AgCl #
Figure 9.19 Principle of a polarographic Clark-type pO2 sensor.
9.4 BLOOD GASES AND pH SENSORS 529
In this oxidation reaction, silver from the electrode is first oxidized to silver ions, andelectrons are liberated to the anode. These silver ions are immediately combined withchloride ions to form silver chloride which precipitates on the surface of the anode.The current flowing between the anode and the cathode in the external circuitproduced by this reaction is directly (i.e., linearly) proportional to the number ofO2 molecules constantly reduced at the surface of the cathode. The electrodes in thepolarographic cell are immersed in an electrolyte solution of potassium chloride andsurrounded by an O2-permeable Teflon or polypropylene membrane that permitsgases to diffuse slowly into the electrode. Thus, by measuring the change in currentbetween the cathode and the anode, the amount of oxygen that is dissolved in thesolution can be determined.
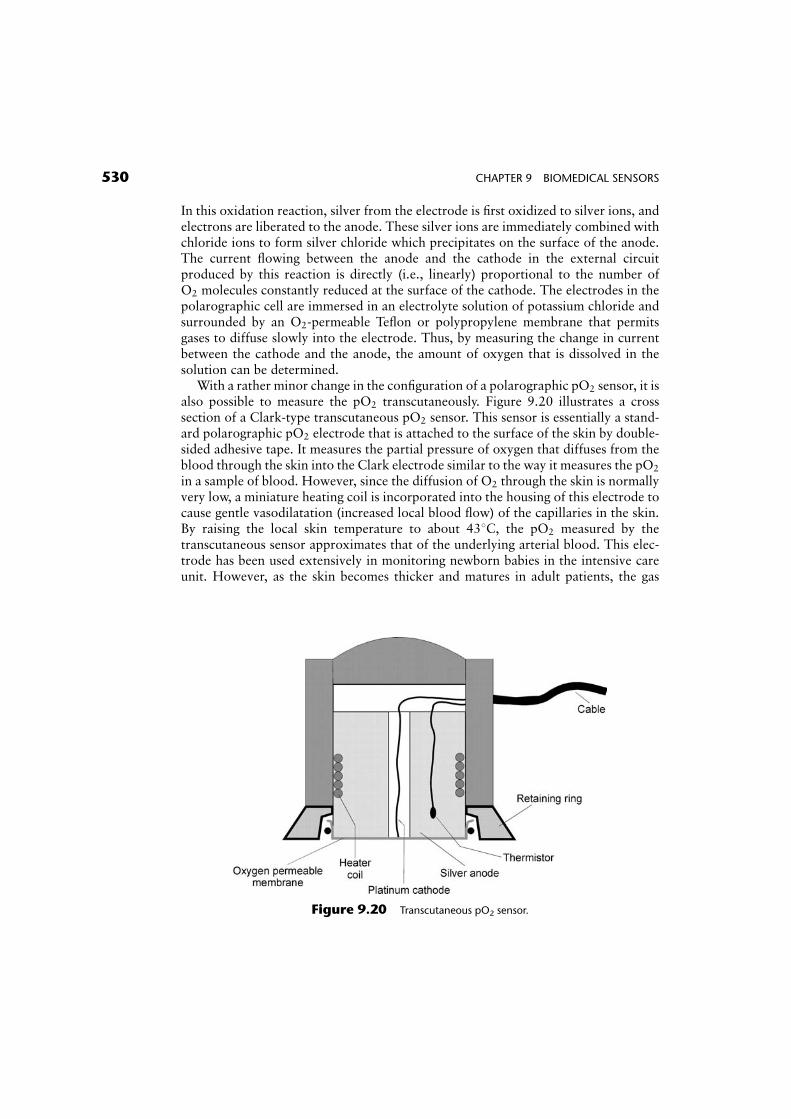
With a rather minor change in the configuration of a polarographic pO2 sensor, it isalso possible to measure the pO2 transcutaneously. Figure 9.20 illustrates a crosssection of a Clark-type transcutaneous pO2 sensor. This sensor is essentially a stand-ard polarographic pO2 electrode that is attached to the surface of the skin by double-sided adhesive tape. It measures the partial pressure of oxygen that diffuses from theblood through the skin into the Clark electrode similar to the way it measures the pO2
in a sample of blood. However, since the diffusion of O2 through the skin is normallyvery low, a miniature heating coil is incorporated into the housing of this electrode tocause gentle vasodilatation (increased local blood flow) of the capillaries in the skin.By raising the local skin temperature to about 438C, the pO2 measured by thetranscutaneous sensor approximates that of the underlying arterial blood. This elec-trode has been used extensively in monitoring newborn babies in the intensive careunit. However, as the skin becomes thicker and matures in adult patients, the gas
Figure 9.20 Transcutaneous pO2 sensor.
530 CHAPTER 9 BIOMEDICAL SENSORS
diffusion properties of the skin change significantly and cause large errors that resultin inconsistent readings.
Various methods for measuring the oxygen saturation, SO2 (the relative amount ofoxygen carried by the hemoglobin in the erythrocytes), of blood in vitro or in vivo inarterial blood (SaO2) or mixed venous blood (SvO2), have been developed. Thismethod, referred to as oximetry, is based on the light absorption properties ofblood and, in particular, the relative concentration of Hb and HbO2 since thecharacteristic color of deoxygenated blood is blue, whereas fully oxygenated bloodhas a distinct bright red color.
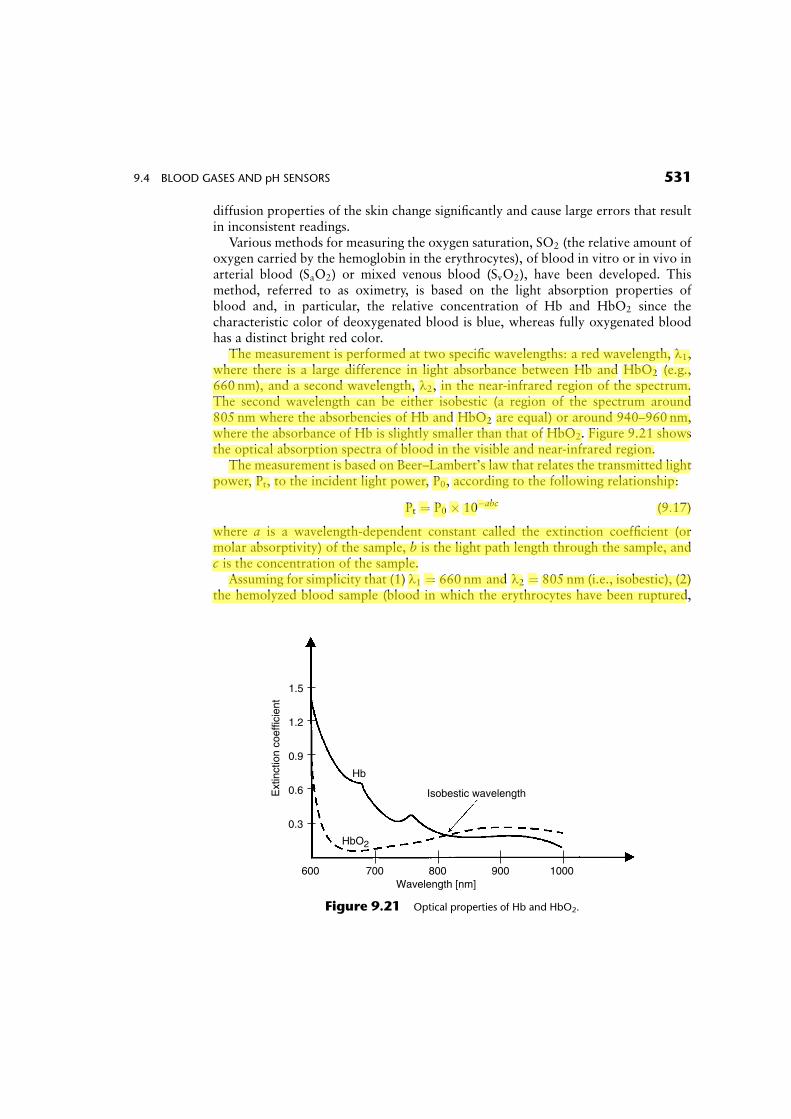
The measurement is performed at two specific wavelengths: a red wavelength, l1,where there is a large difference in light absorbance between Hb and HbO2 (e.g.,660 nm), and a second wavelength, l2, in the near-infrared region of the spectrum.The second wavelength can be either isobestic (a region of the spectrum around805 nm where the absorbencies of Hb and HbO2 are equal) or around 940–960 nm,where the absorbance of Hb is slightly smaller than that of HbO2. Figure 9.21 showsthe optical absorption spectra of blood in the visible and near-infrared region.
The measurement is based on Beer–Lambert’s law that relates the transmitted lightpower, Pt, to the incident light power, P0, according to the following relationship:
Pt ¼ P0 � 10�abc (9:17)
where a is a wavelength-dependent constant called the extinction coefficient (ormolar absorptivity) of the sample, b is the light path length through the sample, andc is the concentration of the sample.
Assuming for simplicity that (1) l1 ¼ 660 nm and l2 ¼ 805 nm (i.e., isobestic), (2)the hemolyzed blood sample (blood in which the erythrocytes have been ruptured,
600 700 800 900 1000Wavelength [nm]
0.3
0.6
0.9
1.2
1.5
Ext
inct
ion
coef
ficie
nt
Hb
HbO2
Isobestic wavelength
Figure 9.21 Optical properties of Hb and HbO2.
9.4 BLOOD GASES AND pH SENSORS 531
Ken Chen
螢光標示
i.e., the hemoglobin has been released and uniformly mixed with the plasma) consistsof a two-component mixture of Hb and HbO2, and (3) the total light absorbance bythe mixture of these two components is additive, a simple mathematical relationshipcan be derived for computing the oxygen saturation of blood:
SO2 ¼ A� B� OD(l1)OD(l2)
� �(9:18)
where A and B are two coefficients that are functions of the specific absorptivity of Hband HbO2, OD (or absorbance) is defined as the optical density [i.e., log10 (1=T)],where T represents the light transmission through the sample and is given by Pt=P0,and SO2 is defined as cHB=(cHB þ cHBO2
).The measurement of SO2 in blood can be performed either in vitro or in vivo. In
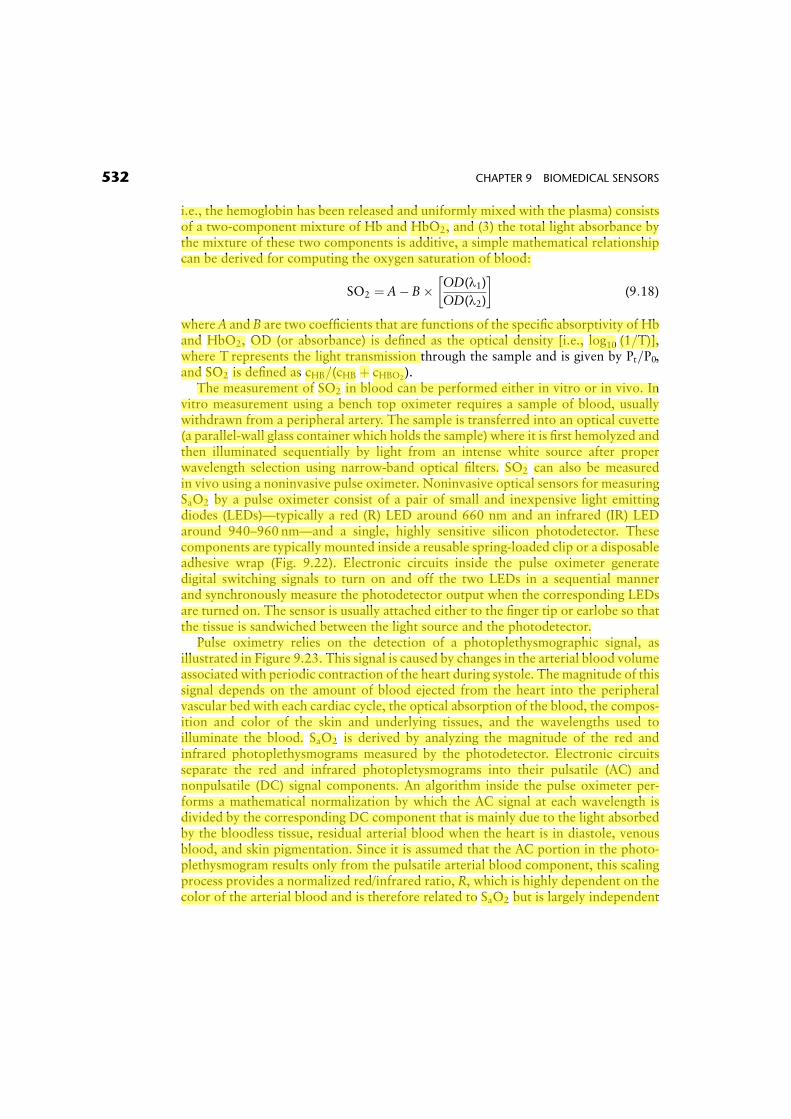
vitro measurement using a bench top oximeter requires a sample of blood, usuallywithdrawn from a peripheral artery. The sample is transferred into an optical cuvette(a parallel-wall glass container which holds the sample) where it is first hemolyzed andthen illuminated sequentially by light from an intense white source after properwavelength selection using narrow-band optical filters. SO2 can also be measuredin vivo using a noninvasive pulse oximeter. Noninvasive optical sensors for measuringSaO2 by a pulse oximeter consist of a pair of small and inexpensive light emittingdiodes (LEDs)—typically a red (R) LED around 660 nm and an infrared (IR) LEDaround 940–960 nm—and a single, highly sensitive silicon photodetector. Thesecomponents are typically mounted inside a reusable spring-loaded clip or a disposableadhesive wrap (Fig. 9.22). Electronic circuits inside the pulse oximeter generatedigital switching signals to turn on and off the two LEDs in a sequential mannerand synchronously measure the photodetector output when the corresponding LEDsare turned on. The sensor is usually attached either to the finger tip or earlobe so thatthe tissue is sandwiched between the light source and the photodetector.
Pulse oximetry relies on the detection of a photoplethysmographic signal, asillustrated in Figure 9.23. This signal is caused by changes in the arterial blood volumeassociated with periodic contraction of the heart during systole. The magnitude of thissignal depends on the amount of blood ejected from the heart into the peripheralvascular bed with each cardiac cycle, the optical absorption of the blood, the compos-ition and color of the skin and underlying tissues, and the wavelengths used toilluminate the blood. SaO2 is derived by analyzing the magnitude of the red andinfrared photoplethysmograms measured by the photodetector. Electronic circuitsseparate the red and infrared photopletysmograms into their pulsatile (AC) andnonpulsatile (DC) signal components. An algorithm inside the pulse oximeter per-forms a mathematical normalization by which the AC signal at each wavelength isdivided by the corresponding DC component that is mainly due to the light absorbedby the bloodless tissue, residual arterial blood when the heart is in diastole, venousblood, and skin pigmentation. Since it is assumed that the AC portion in the photo-plethysmogram results only from the pulsatile arterial blood component, this scalingprocess provides a normalized red/infrared ratio, R, which is highly dependent on thecolor of the arterial blood and is therefore related to SaO2 but is largely independent
532 CHAPTER 9 BIOMEDICAL SENSORS
Ken Chen
螢光標示
Ken Chen
螢光標示
Ken Chen
螢光標示
Ken Chen
螢光標示
Ken Chen
螢光標示
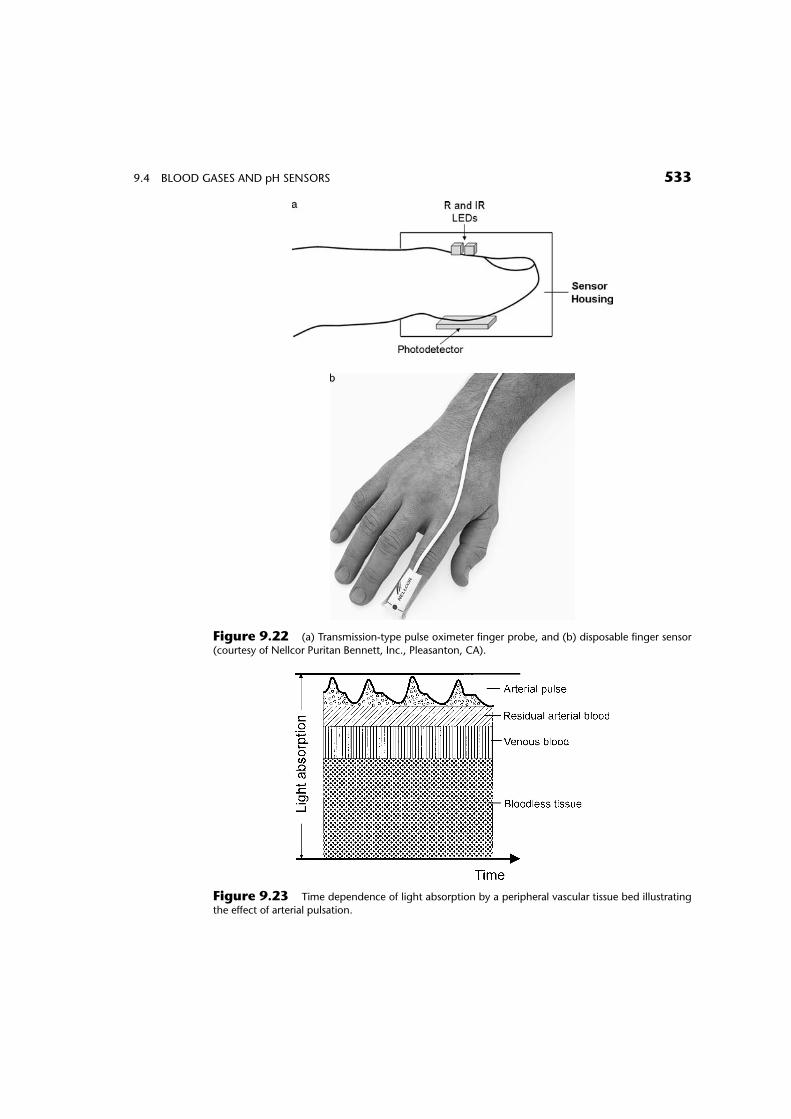
Figure 9.22 (a) Transmission-type pulse oximeter finger probe, and (b) disposable finger sensor
(courtesy of Nellcor Puritan Bennett, Inc., Pleasanton, CA).
Figure 9.23 Time dependence of light absorption by a peripheral vascular tissue bed illustrating
the effect of arterial pulsation.
9.4 BLOOD GASES AND pH SENSORS 533
of the volume of arterial blood entering the tissue during systole, skin pigmentation,and thickness. Hence, the instrument does not need to be recalibrated for measure-ments on different patients. The mathematical relationship between SaO2 and R isprogrammed by the manufacturer into the pulse oximeter.
9.4.2 pH Electrodes
pH describes the balance between acid and base in a solution. Acid solutions have anexcess of hydrogen ions (Hþ), whereas basic solutions have an excess of hydroxyl ions(OH�). In a dilute solution, the product of these ion concentrations is a constant(1:0� 10�14). Therefore, the concentration of either ion can be used to express theacidity or alkalinity of a solution. All neutral solutions have a pH of 7.0.
The measurement of blood pH is fundamental to many diagnostic procedures. Innormal blood, pH is maintained under tight control and is typically around 7.40(slightly basic). By measuring blood pH, it is possible to determine whether the lungsare removing sufficient CO2 gas from the body or how well the kidneys regulate theacid–base balance.
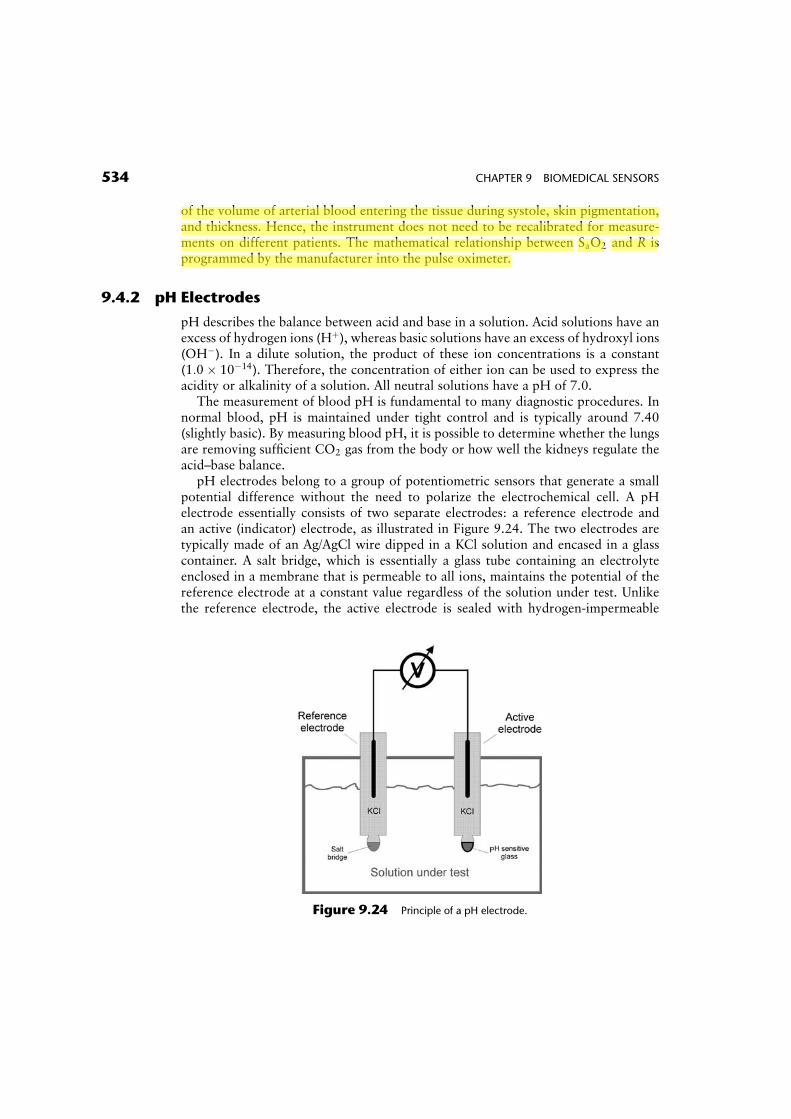
pH electrodes belong to a group of potentiometric sensors that generate a smallpotential difference without the need to polarize the electrochemical cell. A pHelectrode essentially consists of two separate electrodes: a reference electrode andan active (indicator) electrode, as illustrated in Figure 9.24. The two electrodes aretypically made of an Ag/AgCl wire dipped in a KCl solution and encased in a glasscontainer. A salt bridge, which is essentially a glass tube containing an electrolyteenclosed in a membrane that is permeable to all ions, maintains the potential of thereference electrode at a constant value regardless of the solution under test. Unlikethe reference electrode, the active electrode is sealed with hydrogen-impermeable
Figure 9.24 Principle of a pH electrode.
534 CHAPTER 9 BIOMEDICAL SENSORS
Ken Chen
螢光標示
Ken Chen
螢光標示
Ken Chen
螢光標示
glass except at the tip. The reference electrode may also be combined with theindicator electrode in a single glass housing.
The boundary separating two solutions has a potential proportional to the hydrogenion concentration of one solution and, at a constant temperature of 258C, is given by
V ¼ �59mV� log10 [Hþ]þ C (9:19)
where C is a constant. Since pH is defined as
pH ¼ � log10 [Hþ] (9:20)
the potential of the active pH electrode V is proportional to the pH of the solutionunder test and is equal to
V ¼ 59mV� pHþ C (9:21)
The value of C is usually compensated for electronically when the pH electrode iscalibrated by placing the electrode inside different buffer solutions with known pHvalues.
9.4.3 Carbon Dioxide Sensors
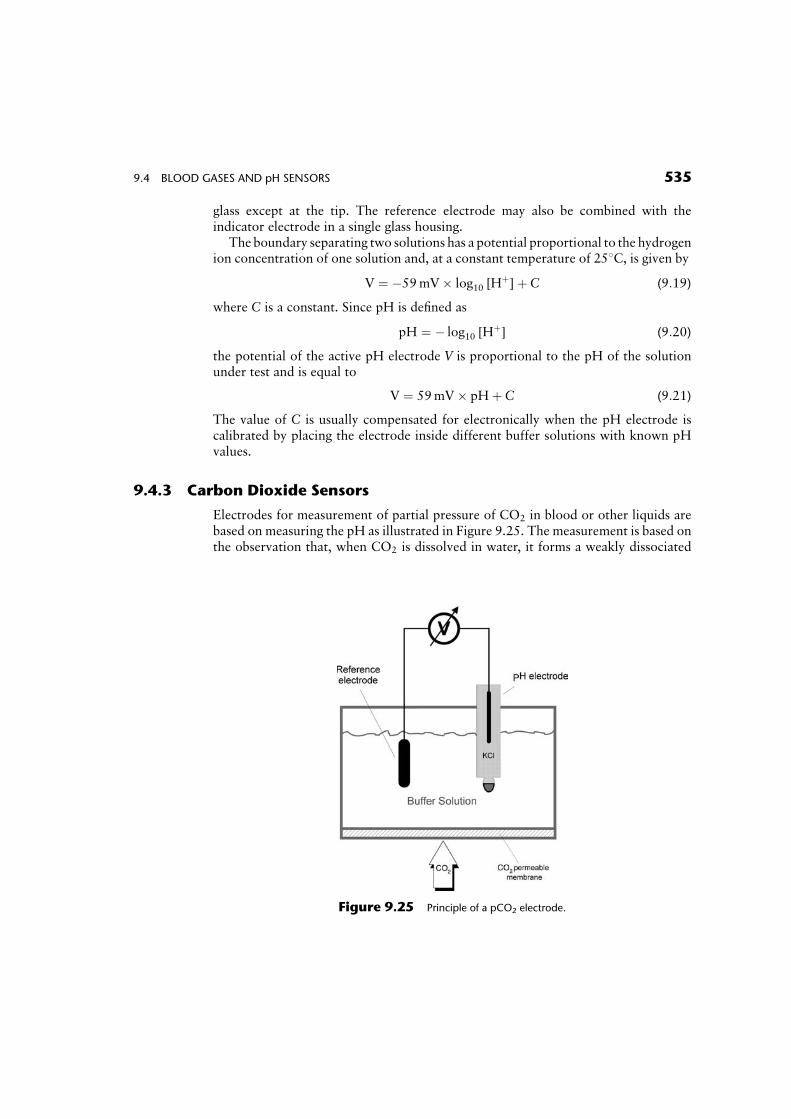
Electrodes for measurement of partial pressure of CO2 in blood or other liquids arebased on measuring the pH as illustrated in Figure 9.25. The measurement is based onthe observation that, when CO2 is dissolved in water, it forms a weakly dissociated
Figure 9.25 Principle of a pCO2 electrode.
9.4 BLOOD GASES AND pH SENSORS 535
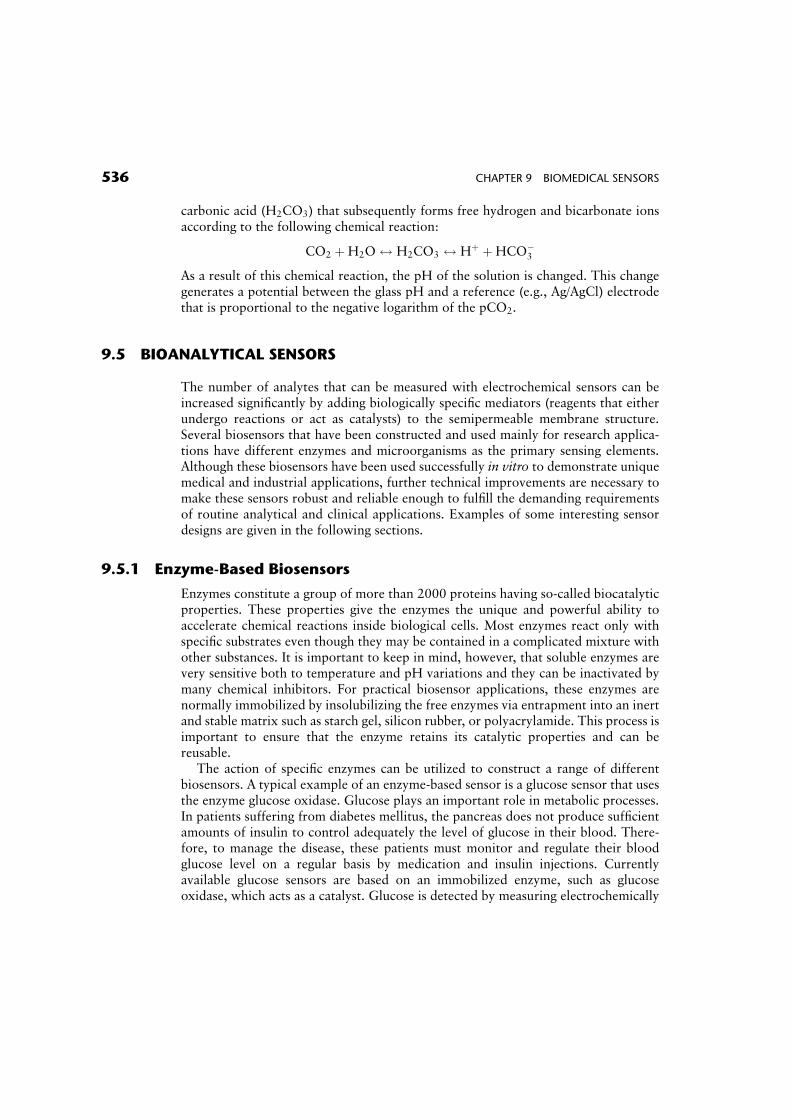
carbonic acid (H2CO3) that subsequently forms free hydrogen and bicarbonate ionsaccording to the following chemical reaction:
CO2 þH2O$ H2CO3 $ Hþ þHCO�3
As a result of this chemical reaction, the pH of the solution is changed. This changegenerates a potential between the glass pH and a reference (e.g., Ag/AgCl) electrodethat is proportional to the negative logarithm of the pCO2.
9.5 BIOANALYTICAL SENSORS
The number of analytes that can be measured with electrochemical sensors can beincreased significantly by adding biologically specific mediators (reagents that eitherundergo reactions or act as catalysts) to the semipermeable membrane structure.Several biosensors that have been constructed and used mainly for research applica-tions have different enzymes and microorganisms as the primary sensing elements.Although these biosensors have been used successfully in vitro to demonstrate uniquemedical and industrial applications, further technical improvements are necessary tomake these sensors robust and reliable enough to fulfill the demanding requirementsof routine analytical and clinical applications. Examples of some interesting sensordesigns are given in the following sections.
9.5.1 Enzyme-Based Biosensors
Enzymes constitute a group of more than 2000 proteins having so-called biocatalyticproperties. These properties give the enzymes the unique and powerful ability toaccelerate chemical reactions inside biological cells. Most enzymes react only withspecific substrates even though they may be contained in a complicated mixture withother substances. It is important to keep in mind, however, that soluble enzymes arevery sensitive both to temperature and pH variations and they can be inactivated bymany chemical inhibitors. For practical biosensor applications, these enzymes arenormally immobilized by insolubilizing the free enzymes via entrapment into an inertand stable matrix such as starch gel, silicon rubber, or polyacrylamide. This process isimportant to ensure that the enzyme retains its catalytic properties and can bereusable.
The action of specific enzymes can be utilized to construct a range of differentbiosensors. A typical example of an enzyme-based sensor is a glucose sensor that usesthe enzyme glucose oxidase. Glucose plays an important role in metabolic processes.In patients suffering from diabetes mellitus, the pancreas does not produce sufficientamounts of insulin to control adequately the level of glucose in their blood. There-fore, to manage the disease, these patients must monitor and regulate their bloodglucose level on a regular basis by medication and insulin injections. Currentlyavailable glucose sensors are based on an immobilized enzyme, such as glucoseoxidase, which acts as a catalyst. Glucose is detected by measuring electrochemically
536 CHAPTER 9 BIOMEDICAL SENSORS
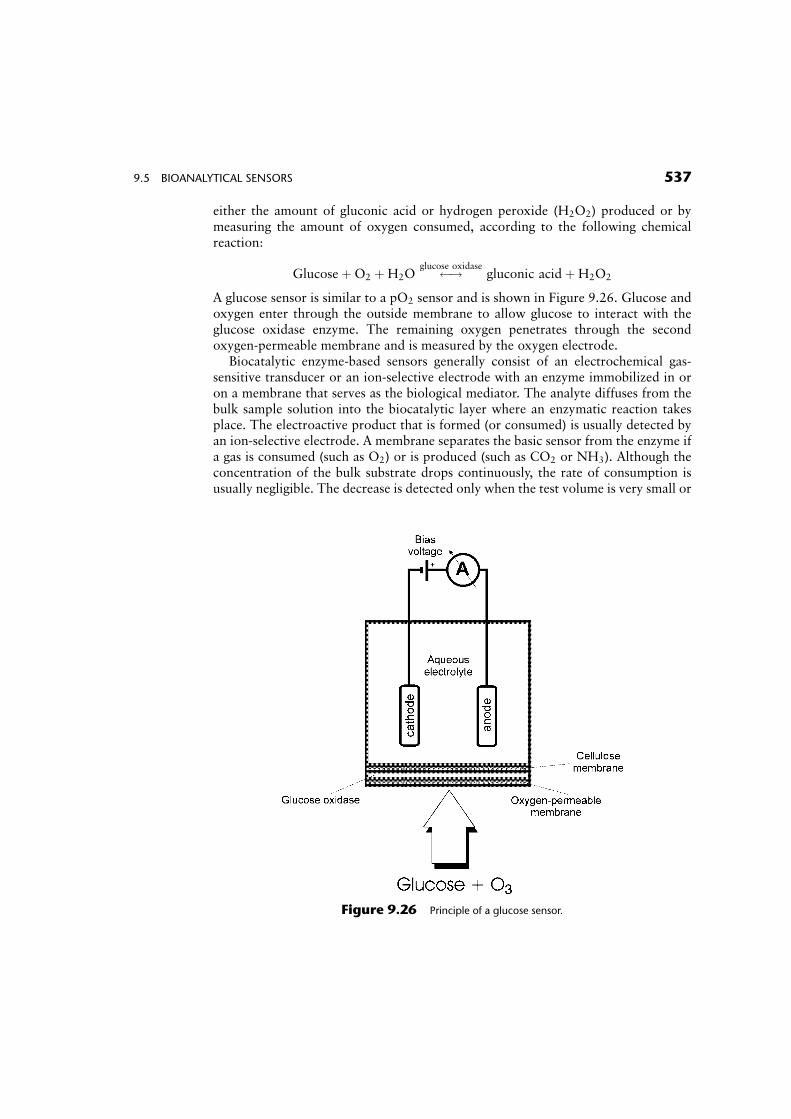
either the amount of gluconic acid or hydrogen peroxide (H2O2) produced or bymeasuring the amount of oxygen consumed, according to the following chemicalreaction:
GlucoseþO2 þH2O !glucose oxidasegluconic acid þH2O2
A glucose sensor is similar to a pO2 sensor and is shown in Figure 9.26. Glucose andoxygen enter through the outside membrane to allow glucose to interact with theglucose oxidase enzyme. The remaining oxygen penetrates through the secondoxygen-permeable membrane and is measured by the oxygen electrode.
Biocatalytic enzyme-based sensors generally consist of an electrochemical gas-sensitive transducer or an ion-selective electrode with an enzyme immobilized in oron a membrane that serves as the biological mediator. The analyte diffuses from thebulk sample solution into the biocatalytic layer where an enzymatic reaction takesplace. The electroactive product that is formed (or consumed) is usually detected byan ion-selective electrode. A membrane separates the basic sensor from the enzyme ifa gas is consumed (such as O2) or is produced (such as CO2 or NH3). Although theconcentration of the bulk substrate drops continuously, the rate of consumption isusually negligible. The decrease is detected only when the test volume is very small or
Figure 9.26 Principle of a glucose sensor.
9.5 BIOANALYTICAL SENSORS 537
when the area of the enzyme membrane is large enough. Thus, this electrochemicalanalysis is nondestructive, and the sample can be reused. Measurements are usuallyperformed at a constant pH and temperature either in a stirred medium solution or ina flowthrough solution.
9.5.2 Microbial Biosensors
A number of microbial sensors have been developed, mainly for online control ofbiochemical processes in various environmental, agricultural, food, and pharmaceut-ical applications. Microbial biosensors typically involve the assimilation of organiccompounds by the microorganisms, followed by a change in respiration activity(metabolism) or the production of specific electrochemically active metabolites,such as H2, CO2, or NH3, that are secreted by the microorganism.
A microbial biosensor is composed of immobilized microorganisms that serve asspecific recognition elements and an electrochemical or optical sensing device that isused to convert the biochemical signal into an electronic signal that can be processed.The operation of a microbial biosensor can be described by the following five-stepprocess: (1) the substrate is transported to the surface of the sensor, (2) the substratediffuses through the membrane to the immobilized microorganism, (3) a reactionoccurs at the immobilized organism, (4) the products formed in the reaction aretransported through the membrane to the surface of the detector, and (5) the productsare measured by the detector.
Examples of microbial biosensors include ammonia (NH3) and nitrogen dioxide(NO2) sensors that utilize nitrifying bacteria as the biological sensing component.An ammonia biosensor can be constructed based on nitrifying bacteria, such asNitrosomonas sp., that use ammonia as a source of energy and oxidize ammonia asfollows:
NH3 þ 1:5O2 �!Nitrosomonas sp:NO2 þH2OþHþ
This oxidation process proceeds at a high rate, and the amount of oxygen consumedby the immobilized bacteria can be measured directly by a polarographic oxygenelectrode placed behind the bacteria.
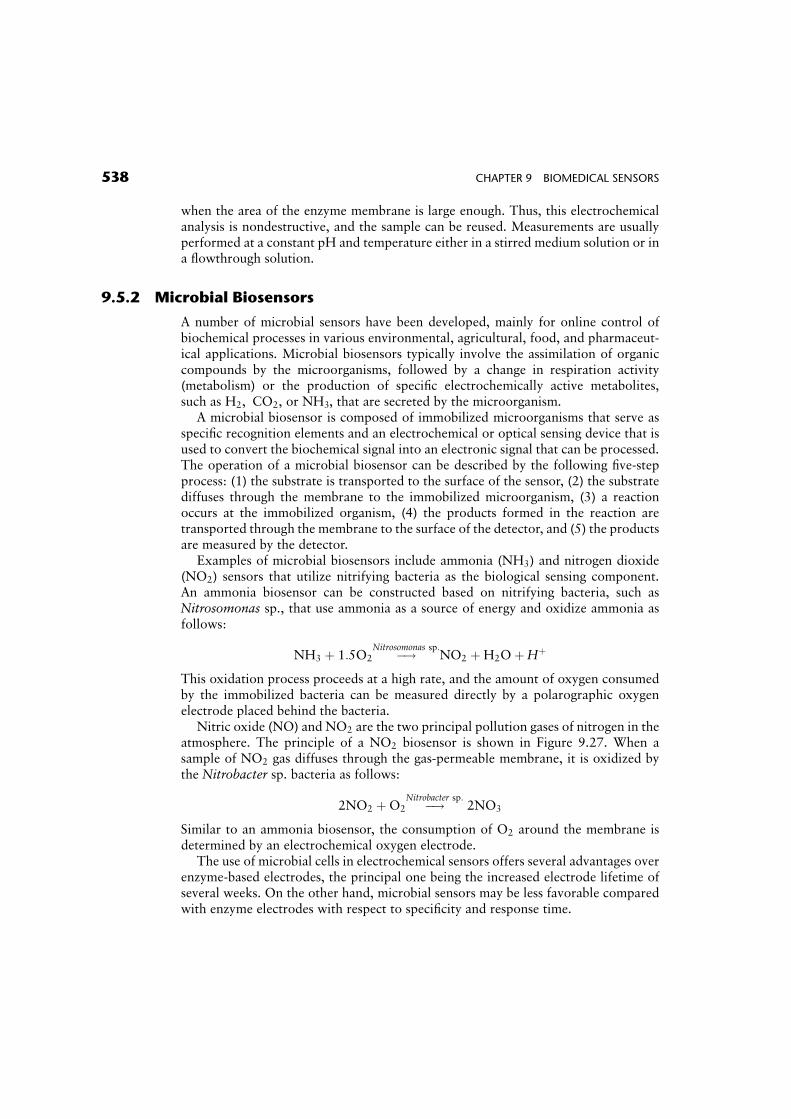
Nitric oxide (NO) and NO2 are the two principal pollution gases of nitrogen in theatmosphere. The principle of a NO2 biosensor is shown in Figure 9.27. When asample of NO2 gas diffuses through the gas-permeable membrane, it is oxidized bythe Nitrobacter sp. bacteria as follows:
2NO2 þO2 �!Nitrobacter sp:2NO3
Similar to an ammonia biosensor, the consumption of O2 around the membrane isdetermined by an electrochemical oxygen electrode.
The use of microbial cells in electrochemical sensors offers several advantages overenzyme-based electrodes, the principal one being the increased electrode lifetime ofseveral weeks. On the other hand, microbial sensors may be less favorable comparedwith enzyme electrodes with respect to specificity and response time.
538 CHAPTER 9 BIOMEDICAL SENSORS
9.6 OPTICAL BIOSENSORS
Optical biosensors play an important role in the development of highly sensitive andselective methods for biochemical analysis. The fundamental principle employed isbased on the change in optical properties of a biological or physical medium. Thechange produced can be the result of intrinsic changes in absorbance, reflectance,scattering, fluorescence, polarization, or refractive index of the biological medium.
9.6.1 Optical Fibers
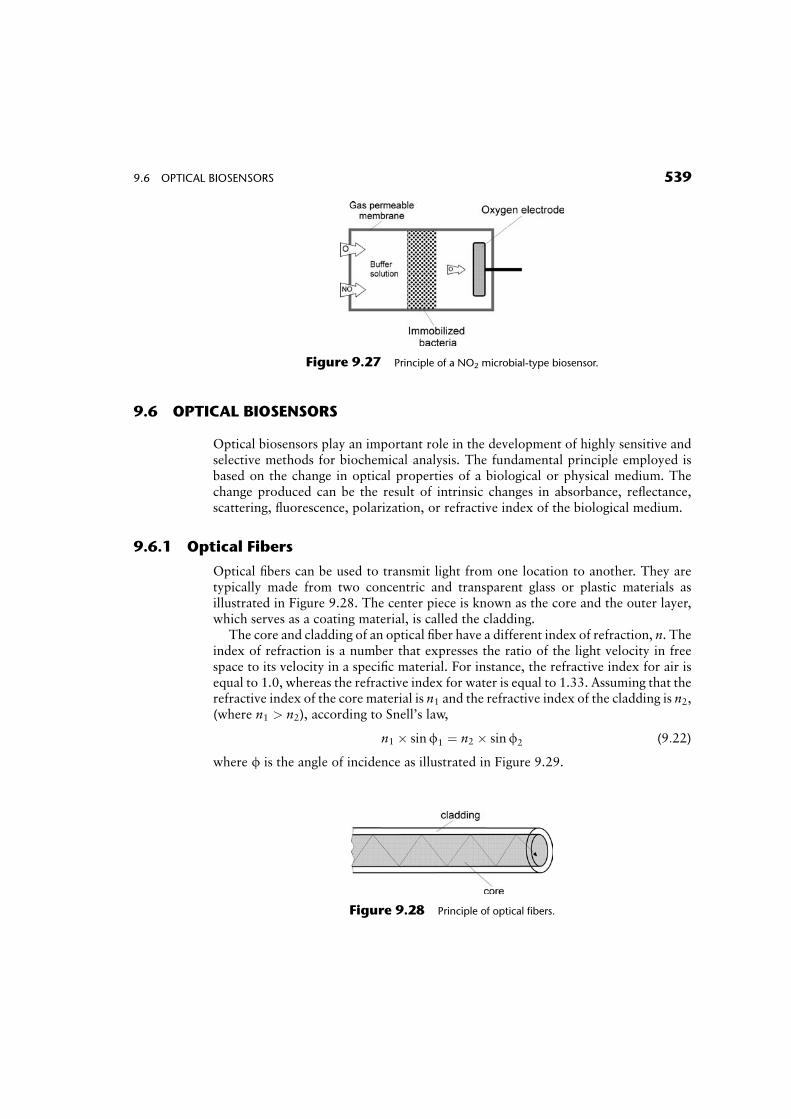
Optical fibers can be used to transmit light from one location to another. They aretypically made from two concentric and transparent glass or plastic materials asillustrated in Figure 9.28. The center piece is known as the core and the outer layer,which serves as a coating material, is called the cladding.
The core and cladding of an optical fiber have a different index of refraction, n. Theindex of refraction is a number that expresses the ratio of the light velocity in freespace to its velocity in a specific material. For instance, the refractive index for air isequal to 1.0, whereas the refractive index for water is equal to 1.33. Assuming that therefractive index of the core material is n1 and the refractive index of the cladding is n2,(where n1 > n2), according to Snell’s law,
n1 � sinf1 ¼ n2 � sinf2 (9:22)
where f is the angle of incidence as illustrated in Figure 9.29.
Figure 9.27 Principle of a NO2 microbial-type biosensor.
Figure 9.28 Principle of optical fibers.
9.6 OPTICAL BIOSENSORS 539
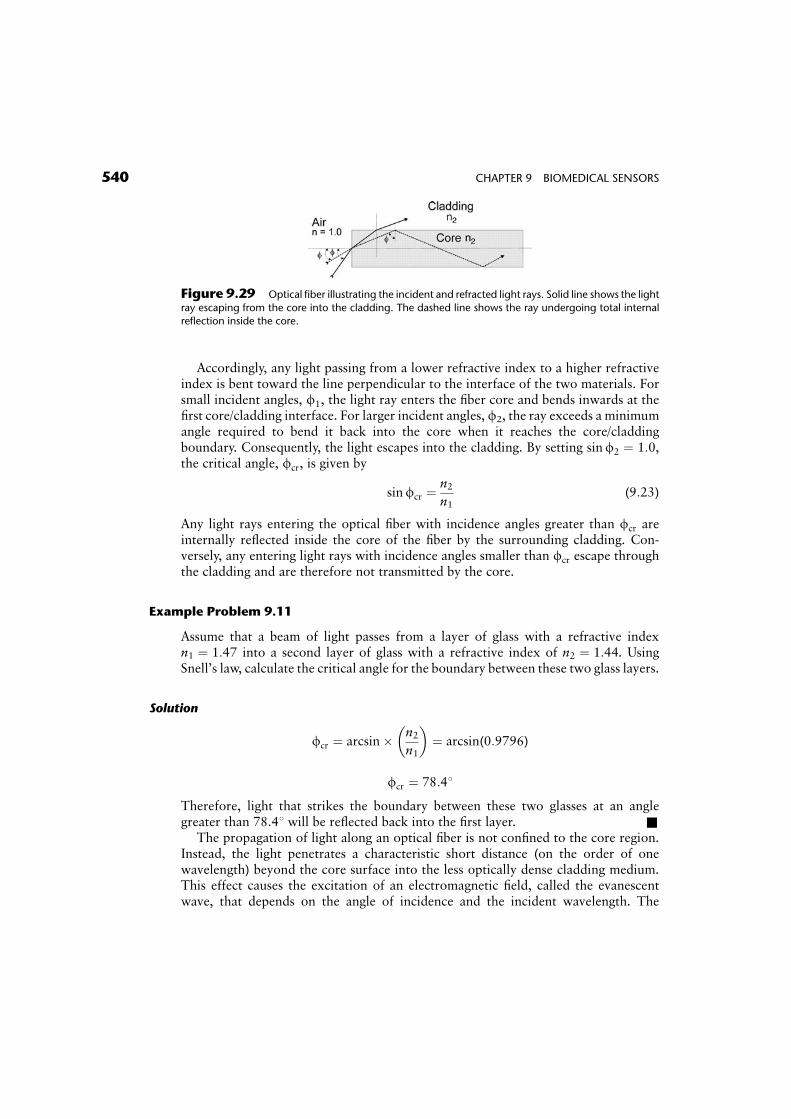
Accordingly, any light passing from a lower refractive index to a higher refractiveindex is bent toward the line perpendicular to the interface of the two materials. Forsmall incident angles, f1, the light ray enters the fiber core and bends inwards at thefirst core/cladding interface. For larger incident angles, f2, the ray exceeds a minimumangle required to bend it back into the core when it reaches the core/claddingboundary. Consequently, the light escapes into the cladding. By setting sinf2 ¼ 1:0,the critical angle, fcr, is given by
sinfcr ¼n2n1
(9:23)
Any light rays entering the optical fiber with incidence angles greater than fcr areinternally reflected inside the core of the fiber by the surrounding cladding. Con-versely, any entering light rays with incidence angles smaller than fcr escape throughthe cladding and are therefore not transmitted by the core.
Example Problem 9.11
Assume that a beam of light passes from a layer of glass with a refractive indexn1 ¼ 1:47 into a second layer of glass with a refractive index of n2 ¼ 1:44. UsingSnell’s law, calculate the critical angle for the boundary between these two glass layers.
Solution
fcr ¼ arcsin� n2n1
� �¼ arcsin(0:9796)
fcr ¼ 78:48
Therefore, light that strikes the boundary between these two glasses at an anglegreater than 78.48 will be reflected back into the first layer. &
The propagation of light along an optical fiber is not confined to the core region.Instead, the light penetrates a characteristic short distance (on the order of onewavelength) beyond the core surface into the less optically dense cladding medium.This effect causes the excitation of an electromagnetic field, called the evanescentwave, that depends on the angle of incidence and the incident wavelength. The
Figure 9.29 Optical fiber illustrating the incident and refracted light rays. Solid line shows the light
ray escaping from the core into the cladding. The dashed line shows the ray undergoing total internal
reflection inside the core.
540 CHAPTER 9 BIOMEDICAL SENSORS
intensity of the evanescent wave decays exponentially with distance according toBeer–Lambert’s law. It starts at the interface and extends into the cladding medium.
9.6.2 Sensing Mechanisms
Two major optical techniques are commonly available to sense the optical changeacross a biosensor interface. These are usually based on evanescent wave spectros-copy, which plays a major role in fiber optic sensors, and a surface plasmon resonanceprinciple.
Optical fibers can be used to develop a whole range of sensors for biomedicalapplications. These optical sensors are small, flexible, and free from electrical inter-ference. They can produce an instantaneous response to microenvironments thatsurround their surface.
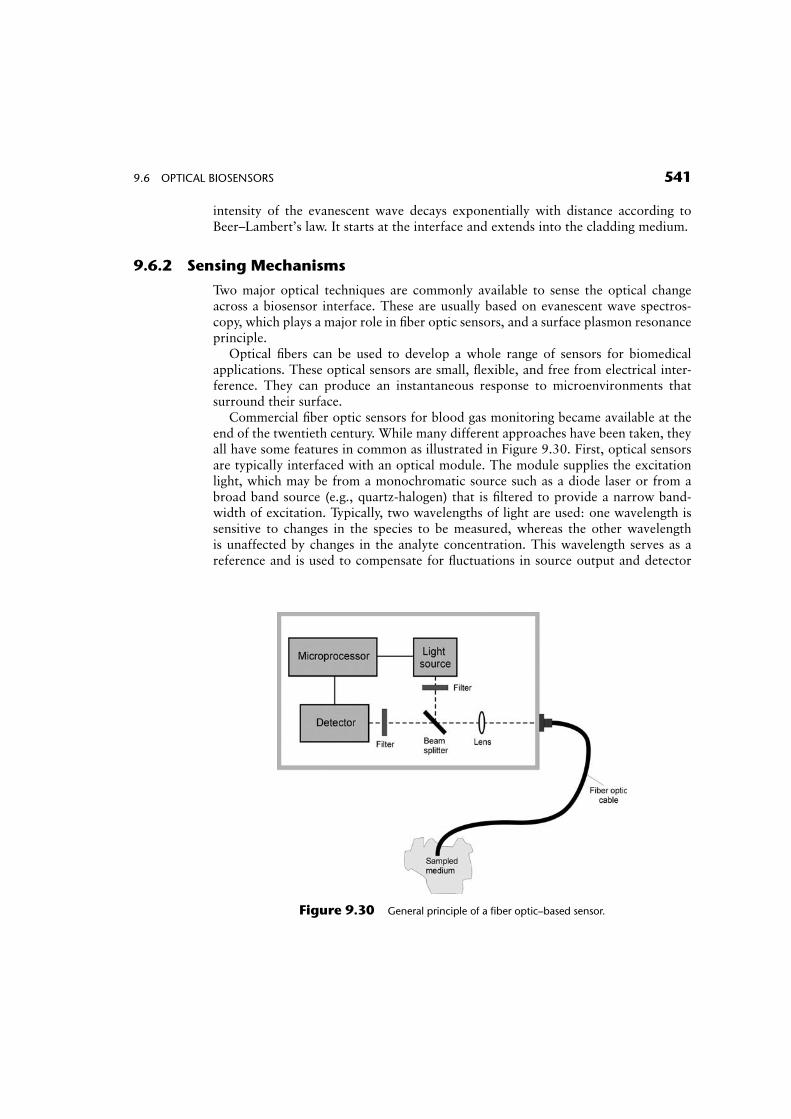
Commercial fiber optic sensors for blood gas monitoring became available at theend of the twentieth century. While many different approaches have been taken, theyall have some features in common as illustrated in Figure 9.30. First, optical sensorsare typically interfaced with an optical module. The module supplies the excitationlight, which may be from a monochromatic source such as a diode laser or from abroad band source (e.g., quartz-halogen) that is filtered to provide a narrow band-width of excitation. Typically, two wavelengths of light are used: one wavelength issensitive to changes in the species to be measured, whereas the other wavelengthis unaffected by changes in the analyte concentration. This wavelength serves as areference and is used to compensate for fluctuations in source output and detector
Figure 9.30 General principle of a fiber optic–based sensor.
9.6 OPTICAL BIOSENSORS 541
stability. The light output from the optic module is coupled into a fiber optic cablethrough appropriate lenses and an optical connector.
Several sensing mechanisms can be utilized to construct optical fiber sensors. Influorescence-based sensors, the incident light excites fluorescence emission, whichchanges in intensity as a function of the concentration of the analyte to be measured.The emitted light travels back down the fiber to the monitor where the light intensityis measured by a photodetector. In other types of fiber optic sensors, the lightabsorbing properties of the sensor chemistry change as a function of analyte chemis-try. In the absorption-based design, a reflective surface near the tip or some scatteringmaterial within the sensing chemistry itself is usually used to return the light backthrough the same optical fiber. Other sensing mechanisms exploit the evanescentwave interaction with molecules that are present within the penetration depth dis-tance and lead to attenuation in reflectance related to the concentration of themolecules. Because of the short penetration depth and the exponentially decayingintensity, the evanescent wave is absorbed by compounds that must be present veryclose to the surface. The principle has been used to characterize interactions betweenreceptors that are attached to the surface and ligands that are present in solutionabove the surface.
The key component in the successful implementation of evanescent wave spectros-copy is the interface between the sensor surface and the biological medium. Receptorsmust retain their native conformation and binding activity and sufficient binding sitesmust be present for multiple interactions with the analyte. In the case of particularlyweak absorbing analytes, sensitivity can be enhanced by combining the evanescent-wave principle with multiple internal reflections along the sides of an unclad portionof a fiber optic tip. Alternatively, instead of an absorbing species, a fluorophore (acompound that produces a fluorescent signal in response to light) can also be used.Light that is absorbed by the fluorophore emits detectable fluorescent light at a higherwavelength, thus providing improved sensitivity.
9.6.3 Indicator-Mediated Fiber Optic Sensors
Since only a limited number of biochemical substances have an intrinsic opticalabsorption or fluorescence property that can be measured directly with sufficientselectivity by standard spectroscopic methods, indicator-mediated sensors have beendeveloped to use specific reagents that are immobilized either on the surface or nearthe tip of an optical fiber. In these sensors, light travels from a light source to the endof the optical fiber where it interacts with a specific chemical or biological recognitionelement. These transducers may include indicators and ion-binding compounds(ionophores) as well as a wide variety of selective polymeric materials. After thelight interacts with the biological sample, it returns either through the same opticalfiber (in a single-fiber configuration) or a separate optical fiber (in a dual-fiber config-uration) to a detector, which correlates the degree of light attenuation with theconcentration of the analyte.
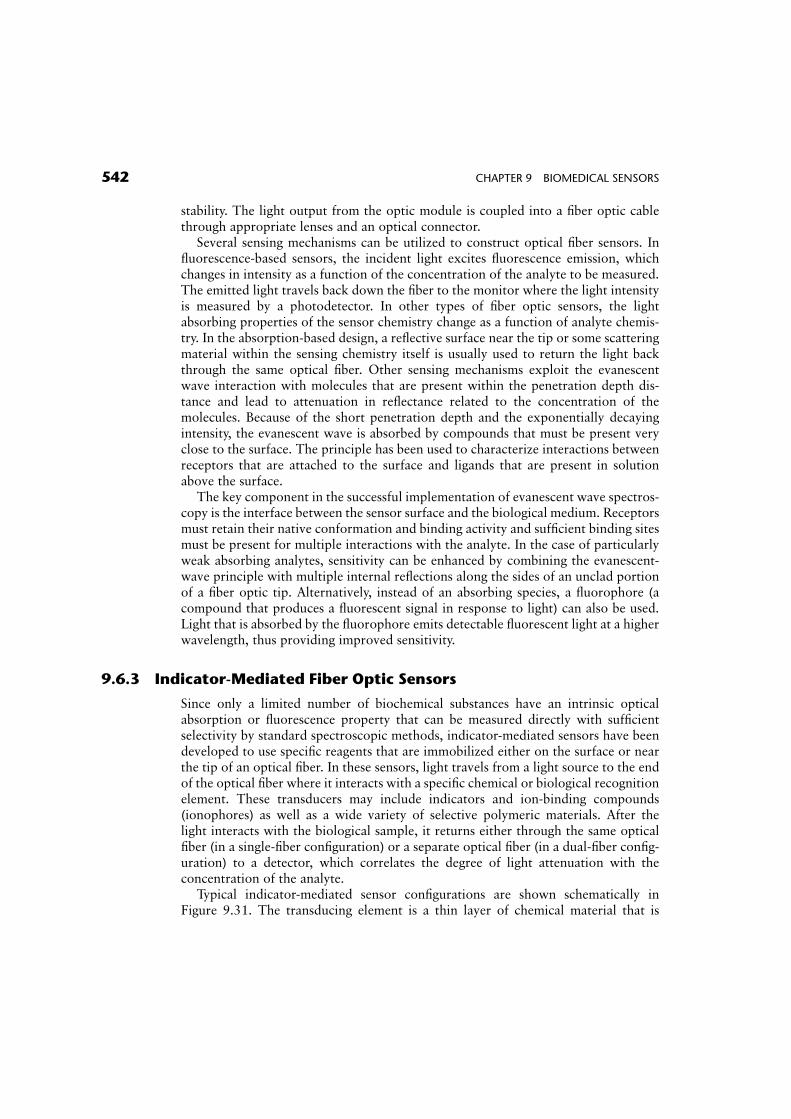
Typical indicator-mediated sensor configurations are shown schematically inFigure 9.31. The transducing element is a thin layer of chemical material that is
542 CHAPTER 9 BIOMEDICAL SENSORS
placed near the sensor tip and is separated from the blood medium by a selectivemembrane. The chemical-sensing material transforms the incident light into a returnlight signal with a magnitude that is proportional to the concentration of the speciesto be measured. The stability of the sensor is determined by the stability of thephotosensitive material that is used and also by how effectively the sensing materialis protected from leaching out of the probe. In Figure 9.31a, the indicator is immo-bilized directly on a membrane that is positioned at the end of the fiber. An indicatorin the form of a powder can also be physically retained in position at the end of thefiber by a special permeable membrane as illustrated in Figure 9.31b, or a hollowcapillary tube as illustrated in Figure 9.31c.
9.6.4 Immunoassay Sensors
The development of immunosensors is based on the observation of ligand-bindingreaction products between a target analyte and a highly specific binding reagent. Thekey component of an immunosensor is the biological recognition element, whichtypically consists of antibodies or antibody fragments. Immunological techniquesoffer outstanding selectivity (the sensor’s ability to detect a specific substance in amixture containing other substances) and sensitivity through the process of antibody–antigen interaction. This is the primary recognition mechanism by which the immunesystem detects and fights foreign matter, which has allowed the measurement of many
Figure 9.31 Different indicator-mediated fiber optic sensor configurations.
9.6 OPTICAL BIOSENSORS 543
important compounds at micromolar and even picomolar concentrations in complexbiological samples.
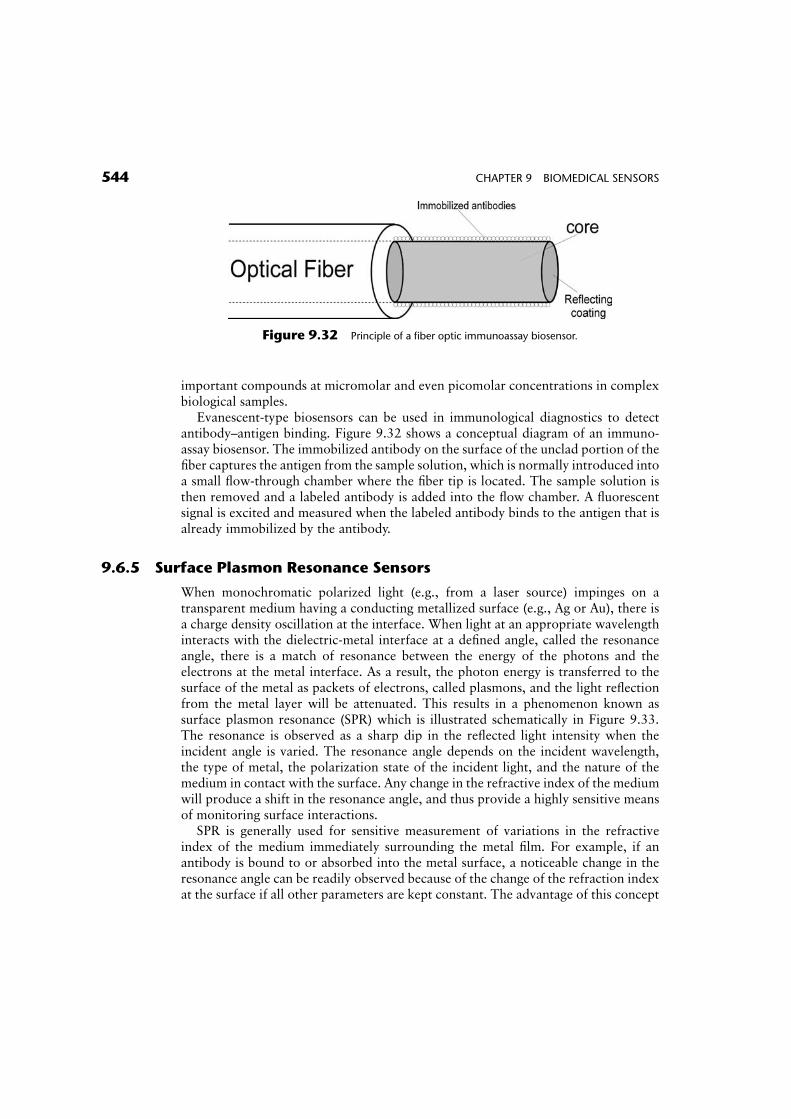
Evanescent-type biosensors can be used in immunological diagnostics to detectantibody–antigen binding. Figure 9.32 shows a conceptual diagram of an immuno-assay biosensor. The immobilized antibody on the surface of the unclad portion of thefiber captures the antigen from the sample solution, which is normally introduced intoa small flow-through chamber where the fiber tip is located. The sample solution isthen removed and a labeled antibody is added into the flow chamber. A fluorescentsignal is excited and measured when the labeled antibody binds to the antigen that isalready immobilized by the antibody.
9.6.5 Surface Plasmon Resonance Sensors
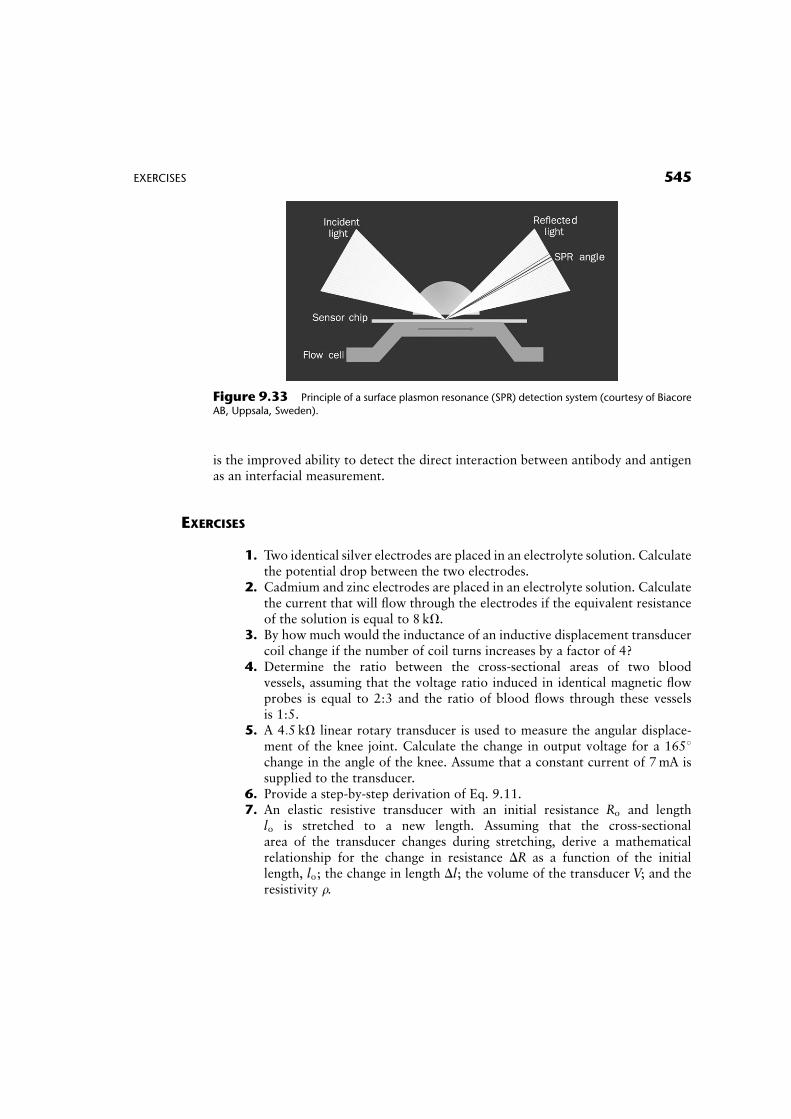
When monochromatic polarized light (e.g., from a laser source) impinges on atransparent medium having a conducting metallized surface (e.g., Ag or Au), there isa charge density oscillation at the interface. When light at an appropriate wavelengthinteracts with the dielectric-metal interface at a defined angle, called the resonanceangle, there is a match of resonance between the energy of the photons and theelectrons at the metal interface. As a result, the photon energy is transferred to thesurface of the metal as packets of electrons, called plasmons, and the light reflectionfrom the metal layer will be attenuated. This results in a phenomenon known assurface plasmon resonance (SPR) which is illustrated schematically in Figure 9.33.The resonance is observed as a sharp dip in the reflected light intensity when theincident angle is varied. The resonance angle depends on the incident wavelength,the type of metal, the polarization state of the incident light, and the nature of themedium in contact with the surface. Any change in the refractive index of the mediumwill produce a shift in the resonance angle, and thus provide a highly sensitive meansof monitoring surface interactions.
SPR is generally used for sensitive measurement of variations in the refractiveindex of the medium immediately surrounding the metal film. For example, if anantibody is bound to or absorbed into the metal surface, a noticeable change in theresonance angle can be readily observed because of the change of the refraction indexat the surface if all other parameters are kept constant. The advantage of this concept
Figure 9.32 Principle of a fiber optic immunoassay biosensor.
544 CHAPTER 9 BIOMEDICAL SENSORS
is the improved ability to detect the direct interaction between antibody and antigenas an interfacial measurement.
EXERCISES
1. Two identical silver electrodes are placed in an electrolyte solution. Calculatethe potential drop between the two electrodes.
2. Cadmium and zinc electrodes are placed in an electrolyte solution. Calculatethe current that will flow through the electrodes if the equivalent resistanceof the solution is equal to 8 kV.
3. By how much would the inductance of an inductive displacement transducercoil change if the number of coil turns increases by a factor of 4?
4. Determine the ratio between the cross-sectional areas of two bloodvessels, assuming that the voltage ratio induced in identical magnetic flowprobes is equal to 2:3 and the ratio of blood flows through these vesselsis 1:5.
5. A 4:5 kV linear rotary transducer is used to measure the angular displace-ment of the knee joint. Calculate the change in output voltage for a 1658change in the angle of the knee. Assume that a constant current of 7mA issupplied to the transducer.
6. Provide a step-by-step derivation of Eq. 9.11.7. An elastic resistive transducer with an initial resistance Ro and length
lo is stretched to a new length. Assuming that the cross-sectionalarea of the transducer changes during stretching, derive a mathematicalrelationship for the change in resistance DR as a function of the initiallength, lo; the change in length Dl; the volume of the transducer V; and theresistivity r.
Figure 9.33 Principle of a surface plasmon resonance (SPR) detection system (courtesy of Biacore
AB, Uppsala, Sweden).
EXERCISES 545
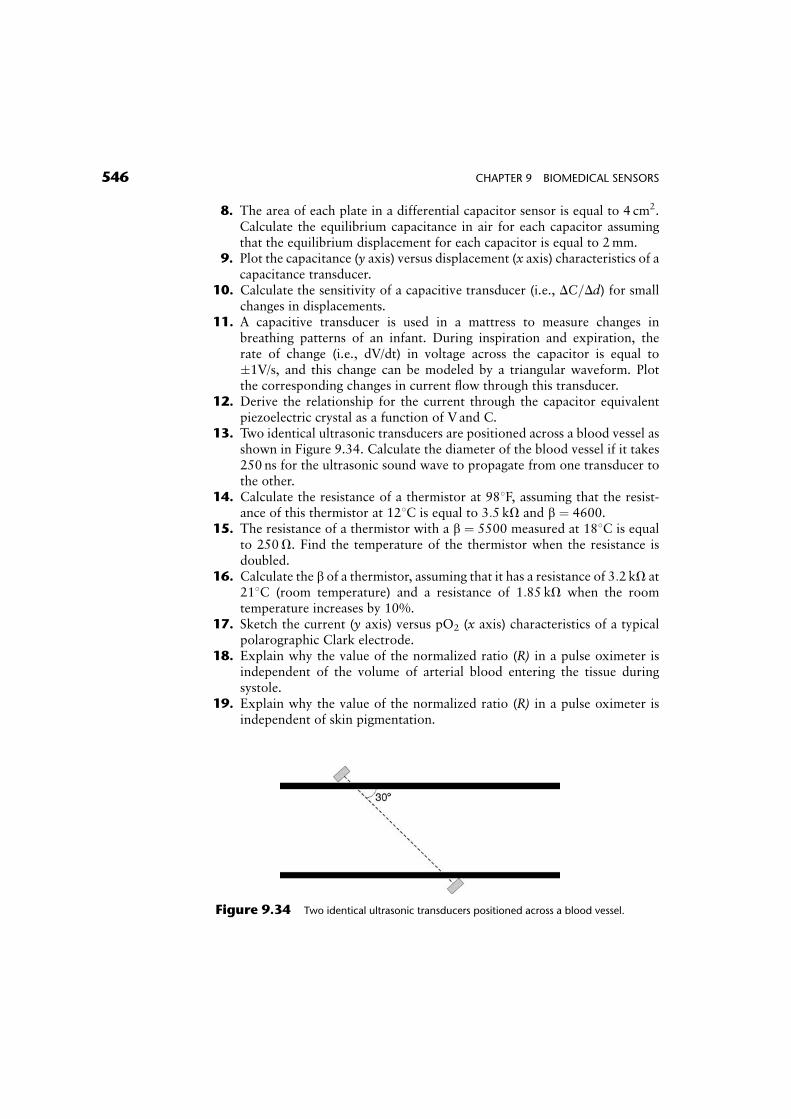
8. The area of each plate in a differential capacitor sensor is equal to 4 cm2.Calculate the equilibrium capacitance in air for each capacitor assumingthat the equilibrium displacement for each capacitor is equal to 2mm.
9. Plot the capacitance (y axis) versus displacement (x axis) characteristics of acapacitance transducer.
10. Calculate the sensitivity of a capacitive transducer (i.e., DC=Dd) for smallchanges in displacements.
11. A capacitive transducer is used in a mattress to measure changes inbreathing patterns of an infant. During inspiration and expiration, therate of change (i.e., dV/dt) in voltage across the capacitor is equal to�1V/s, and this change can be modeled by a triangular waveform. Plotthe corresponding changes in current flow through this transducer.
12. Derive the relationship for the current through the capacitor equivalentpiezoelectric crystal as a function of V and C.
13. Two identical ultrasonic transducers are positioned across a blood vessel asshown in Figure 9.34. Calculate the diameter of the blood vessel if it takes250 ns for the ultrasonic sound wave to propagate from one transducer tothe other.
14. Calculate the resistance of a thermistor at 988F, assuming that the resist-ance of this thermistor at 128C is equal to 3:5 kV and b ¼ 4600.
15. The resistance of a thermistor with a b ¼ 5500 measured at 188C is equalto 250V. Find the temperature of the thermistor when the resistance isdoubled.
16. Calculate the b of a thermistor, assuming that it has a resistance of 3:2 kV at218C (room temperature) and a resistance of 1:85 kV when the roomtemperature increases by 10%.
17. Sketch the current (y axis) versus pO2 (x axis) characteristics of a typicalpolarographic Clark electrode.
18. Explain why the value of the normalized ratio (R) in a pulse oximeter isindependent of the volume of arterial blood entering the tissue duringsystole.
19. Explain why the value of the normalized ratio (R) in a pulse oximeter isindependent of skin pigmentation.
Figure 9.34 Two identical ultrasonic transducers positioned across a blood vessel.
546 CHAPTER 9 BIOMEDICAL SENSORS
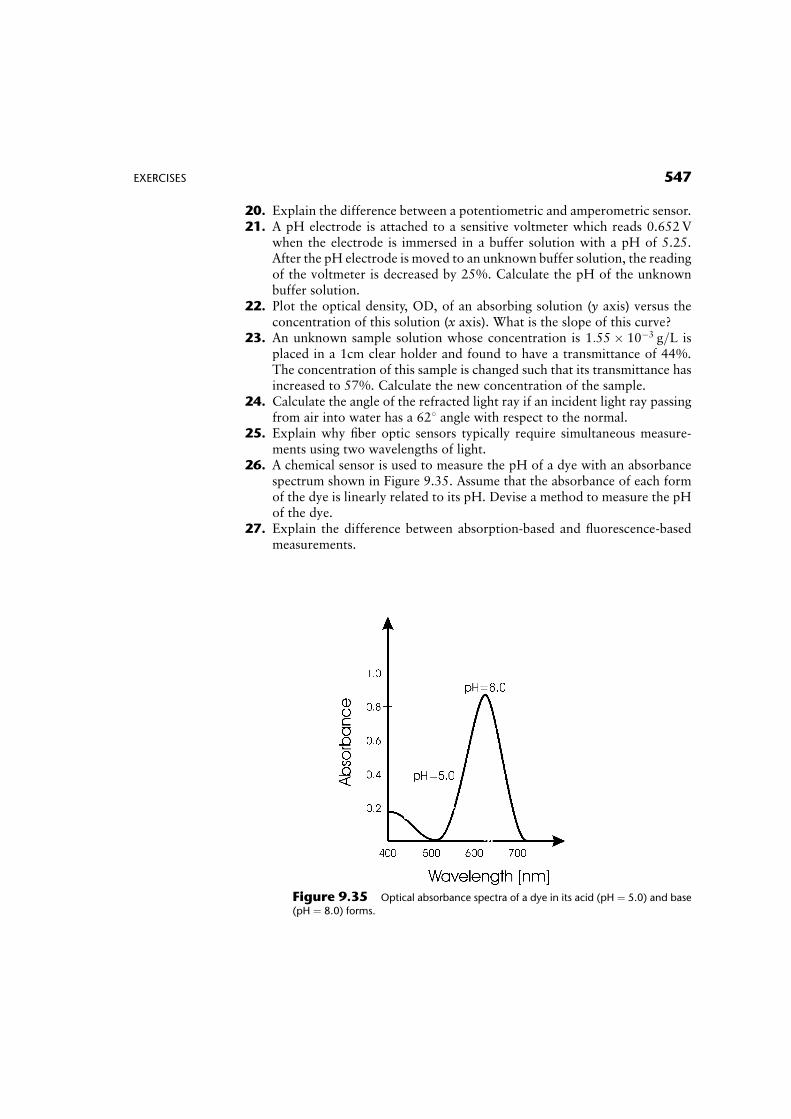
20. Explain the difference between a potentiometric and amperometric sensor.21. A pH electrode is attached to a sensitive voltmeter which reads 0.652V
when the electrode is immersed in a buffer solution with a pH of 5.25.After the pH electrode is moved to an unknown buffer solution, the readingof the voltmeter is decreased by 25%. Calculate the pH of the unknownbuffer solution.
22. Plot the optical density, OD, of an absorbing solution (y axis) versus theconcentration of this solution (x axis). What is the slope of this curve?
23. An unknown sample solution whose concentration is 1:55� 10�3 g=L isplaced in a 1cm clear holder and found to have a transmittance of 44%.The concentration of this sample is changed such that its transmittance hasincreased to 57%. Calculate the new concentration of the sample.
24. Calculate the angle of the refracted light ray if an incident light ray passingfrom air into water has a 628 angle with respect to the normal.
25. Explain why fiber optic sensors typically require simultaneous measure-ments using two wavelengths of light.
26. A chemical sensor is used to measure the pH of a dye with an absorbancespectrum shown in Figure 9.35. Assume that the absorbance of each formof the dye is linearly related to its pH. Devise a method to measure the pHof the dye.
27. Explain the difference between absorption-based and fluorescence-basedmeasurements.
Figure 9.35 Optical absorbance spectra of a dye in its acid (pH ¼ 5.0) and base
(pH ¼ 8.0) forms.
EXERCISES 547
SUGGESTED READING
Allocca, J.A. and Stuart A. (1984). Transducers: Theory and Applications. Reston Publishing,Reston, VA.
Aston R. (1990). Principles of Biomedical Instrumentation and Measurement. MacMillan,New York.
Buerk, D. (1995). Biosensors: Theory and Applications. CRC, Boca Raton, FL.Cobbold R.S.C. (1974). Transducers for Biomedical Measurement: Principles and Applica-
tions. Wiley, New York.Cooper, J. and Cass A.E.G. (2004). Biosensors, Oxford University Press.Cromwell, L., Weibell. F.J. and Pfeiffer, E.J. (1980). Biomedical Instrumentation and Mea-
surements. Prentice Hall, Englewood Cliffs, NJ.Eggins, B. (1997). Biosensors: An Introduction. Wiley, New York.Eggins, B.R. (2002). Chemical Sensors and Biosensors for Medical and Biological Applica-
tions. John Wiley, New York.Geddes L.A. and Baker L.E. (1989). Principles of Applied Biomedical Instrumentation, 3rd
Ed. Wiley-Interscience, New York.Hall, E.A.H. (1991). Biosensors. Prentice Hall, Englewood Cliffs.Harsanyi, G. (2000). Sensors in Biomedical Applications: Fundamental Technology and
Applications. CRC, Boca Raton, FL.Neuman M.R. (1999). Biomedical Sensors. In The Biomedical Engineering Handbook, 2nd
Ed. (J. D. Bronzino, Ed.). CRC/IEEE, Boca Raton, FL.Togawa T., Tamura T. and Oberg P.A. (1997). Biomedical Transducers and Instruments.
CRC, Boca Raton, FL.Webster, J.G. (1988). Encyclopedia of Medical Devices and Instrumentation. John Wiley,
New York.Webster, J.G. (1998).Medical Instrumentation: Application and Design, 3rd Ed. JohnWiley,
New York.Wise, D.L. (1991). Bioinstrumentation and Biosensors. Marcel Dekker, New York.
548 CHAPTER 9 BIOMEDICAL SENSORS