
sensors - CiteSeerX
38
Sensors 2015, 15, 9481-9518; doi:10.3390/s150409481 OPEN ACCESS sensors ISSN 1424-8220 www.mdpi.com/journal/sensors Article Design and Field Test of a WSN Platform Prototype for Long-Term Environmental Monitoring Mihai T. Lazarescu Politecnico di Torino, Dipartimento di Elettronica e Telecomunicazioni, Corso Duca degli Abruzzi 24, I-10129 Torino (TO), Italy; E-Mail: [email protected]; Tel.: +39-011-090-4111 Academic Editor: Leonhard M. Reindl Received: 2 December 2014 / Accepted: 15 April 2015 / Published: 22 April 2015 Abstract: Long-term wildfire monitoring using distributed in situ temperature sensors is an accurate, yet demanding environmental monitoring application, which requires long-life, low-maintenance, low-cost sensors and a simple, fast, error-proof deployment procedure. We present in this paper the most important design considerations and optimizations of all elements of a low-cost WSN platform prototype for long-term, low-maintenance pervasive wildfire monitoring, its preparation for a nearly three-month field test, the analysis of the causes of failure during the test and the lessons learned for platform improvement. The main components of the total cost of the platform (nodes, deployment and maintenance) are carefully analyzed and optimized for this application. The gateways are designed to operate with resources that are generally used for sensor nodes, while the requirements and cost of the sensor nodes are significantly lower. We define and test in simulation and in the field experiment a simple, but effective communication protocol for this application. It helps to lower the cost of the nodes and field deployment procedure, while extending the theoretical lifetime of the sensor nodes to over 16 years on a single 1 Ah lithium battery. Keywords: WSN; IoT; pervasive environmental monitoring; long-term operation; low maintenance; low-cost WSN nodes; low-cost WSN deployment; protocol design; low power 1. Introduction Since the Internet of Things (IoT) paradigm was first coined more than a decade ago [1], wireless sensor networks (WSNs) were included among its enabling technologies as flexible, low-cost systems suitable to build dense and cost-effective monitoring infrastructures [2]. WSNs have relatively low
-
Upload
khangminh22 -
Category
Documents
-
view
0 -
download
0
Transcript of sensors - CiteSeerX
Sensors 2015, 15, 9481-9518; doi:10.3390/s150409481OPEN ACCESS
sensorsISSN 1424-8220
www.mdpi.com/journal/sensors
Article
Design and Field Test of a WSN Platform Prototype forLong-Term Environmental MonitoringMihai T. Lazarescu
Politecnico di Torino, Dipartimento di Elettronica e Telecomunicazioni, Corso Duca degli Abruzzi 24,I-10129 Torino (TO), Italy; E-Mail: [email protected]; Tel.: +39-011-090-4111
Academic Editor: Leonhard M. Reindl
Received: 2 December 2014 / Accepted: 15 April 2015 / Published: 22 April 2015
Abstract: Long-term wildfire monitoring using distributed in situ temperature sensors isan accurate, yet demanding environmental monitoring application, which requires long-life,low-maintenance, low-cost sensors and a simple, fast, error-proof deployment procedure.We present in this paper the most important design considerations and optimizations of allelements of a low-cost WSN platform prototype for long-term, low-maintenance pervasivewildfire monitoring, its preparation for a nearly three-month field test, the analysis of thecauses of failure during the test and the lessons learned for platform improvement. Themain components of the total cost of the platform (nodes, deployment and maintenance) arecarefully analyzed and optimized for this application. The gateways are designed to operatewith resources that are generally used for sensor nodes, while the requirements and cost ofthe sensor nodes are significantly lower. We define and test in simulation and in the fieldexperiment a simple, but effective communication protocol for this application. It helps tolower the cost of the nodes and field deployment procedure, while extending the theoreticallifetime of the sensor nodes to over 16 years on a single 1 Ah lithium battery.
Keywords: WSN; IoT; pervasive environmental monitoring; long-term operation; lowmaintenance; low-cost WSN nodes; low-cost WSN deployment; protocol design; low power
1. Introduction
Since the Internet of Things (IoT) paradigm was first coined more than a decade ago [1], wirelesssensor networks (WSNs) were included among its enabling technologies as flexible, low-cost systemssuitable to build dense and cost-effective monitoring infrastructures [2]. WSNs have relatively low
Sensors 2015, 15 9482
material and deployment costs, since they do not need wiring, can self-configure and can operatefor extended periods of time with very low, if any, scheduled maintenance. Sensor networks are alsoconsidered among the best techniques for environmental data collection for a variety of open-spaceapplications, either close to human daily activities or remote, in the wild.
WSNs are typically made of multiple nodes, which are small and portable embedded computingsystems interfaced with specialized transducers and radios for short-range communication. Theyare capable of autonomously monitoring, processing and transmitting various parameters at diverselocations for extended periods of time, using very limited energy and often without any maintenancein their lifetime.
More than a decade after the WSN vision, the application domain experts expect the technology tosolve application demands inexpensively and with low effort. However, the multidisciplinary challengesraised by WSN optimization to multiple application needs have been constantly acknowledged overthe past decade, especially for outdoor applications [3–5]. Most networks remain relatively small insize and/or are deployed for short periods of time, and node programming often requires experiencedsoftware engineers [6]. High cost and perceived low reliability are still important barriers [7], out ofwhich maintenance cost may significantly increase in the case of remote deployments or in locationsthat are difficult to access.
As for most maturing technologies, WSNs reached the stage where standards consolidate mostexisting achievements. IEEE 802.15.4 and 6LoWPAN set the groundwork for applications withIPv6 support. Software-defined radio efforts build on these, aiming at more robust and versatilecommunication architectures through antenna-, frequency-, modulation- and data-rate diversity, onwhich services for diverse application spaces can be built.
At the same time, environmental monitoring has constantly grown in importance. Routinely collecteddata about the state and the evolution of the environment can help to detect and alert of hazardous eventsand to assess and optimize the long-term sustainability of, e.g., population growth, urban sprawl, invasivespecies, climate change and habitat destruction.
Nevertheless, the outdoor monitoring application domain is often challenging [8]. The quality ofradio communication between nodes can be unpredictable, especially during atmospheric events (e.g.,heavy rain, snow, frost, fog), due to plant and foliage growth or their movement due to wind, or dueto the accumulation of dirt or insect nests on nodes. Repeated mechanical stress induced by largedaily temperature variations may prematurely break the nodes, increasing the operating cost, sincemaintenance in open nature is usually difficult. Communication protocol scalability and the cost of nodesand field deployment may be stretched for applications that require thousands or tens of thousands ofnodes for pervasive monitoring.
WSN platforms typically rely on existing hardware and software components to support a broadrange of applications, often using some cross-layer optimizations. However, applications with stringentrequirements, such as low cost, a large number of nodes, long service time, fast field deployment andreduced maintenance, can motivate custom design and optimization of the entire WSN platform.
In this paper, we focus on the needs of a demanding application, pervasive wildfire monitoring usingin situ distributed temperature sensors. Early detection of forest wildfires is very important for firefighting success and to effectively limit damage and cost. We comparatively analyze existing detection

Sensors 2015, 15 9483
and alert solutions and define the design objectives of a WSN platform that can overcome most of theirweaknesses. Then, we present the main design phases, the effort spent, the major pitfalls building thefirst prototype and the lessons learned from its field test. We also show how the resulting WSN platformcan support a large class of environmental monitoring applications, increasing its value and reducing itsreturn on investment.
Platform specifications were defined in collaboration with an industrial beneficiary and respond topragmatic and stringent requirements for pervasive wildfire detection and alerting. For this purpose, thecompany consulted several actors in areas subject to wildfires, such as firefighters, state forestry corps,civil protection and forest rangers.
The main contributions of the paper can be summarized as follows:
(1) A methodical holistic analysis of the effects of the application requirements and of the availabledesign options for the platform hardware, software, communication protocols and field deploymentprocedures on the overall platform performance, the cost and the reliability of its nodes, of theplatform commissioning and exploitation. This method can be applied for the analysis of otherWSN platforms in the context of different application requirements.
(2) Design criteria, optimization and field validation of cost-effective sensor nodes and gatewaysthat use much lower resources and energy than the typical nodes in the literature based onoff-the-shelf components.
(3) Analysis, definition and field test of a cost-effective and reliable field deployment procedure forthe network nodes that minimizes human-introduced errors.
(4) Design, optimization and field test of a simple, yet effective field communication protocol thatmatches application requirements well, significantly contributes to the reduction of node energyconsumption and cost and supports an effective field deployment procedure for the nodes. It canalso scale up to support networks with a very large number of nodes.
(5) Analysis and selection of the hardware and software features to implement on node prototypesdesigned for laboratory testing in order to adapt them, in a short time and with reduced effort, fora relatively long, unattended field experiment with two equally important purposes: to check anddemonstrate the autonomous operation of the platform and to acquire sufficient visibility of nodeand system behavior that can be used to improve the design of the platform.
The rest of the paper is organized as follows. Section 2 reviews related published works and defines thespecifications of the system through comparative analysis of the strengths and weaknesses of existingmethods. Section 3 outlines the design criteria, which drive the platform design decisions. Section 4explores the most important design decisions made for the implementation of the WSN platformcomponents. Section 5 presents how the prototype platform was prepared for a field test, on short notice.Section 6 presents the unfolding of the field test, the major issues during its various phases and the mostimportant lessons learned to improve the WSN platform. Section 7 presents a summary of the futurework and concludes the paper.
Sensors 2015, 15 9484
2. System Definition
To better define the specifications of the proposed wildfire monitoring method, we will briefly reviewseveral of the most representative existing techniques with a focus on cost, detection reliability andeffectiveness for early alerting.
2.1. Wildfire Detection Methods
Wildfires are quasi-natural hazards likely to occur under specific climatic, weather and vegetationconditions [9]. A small fraction ignite from natural causes that include lightning, volcanic eruption,sparks from rockfalls and spontaneous combustion, but most ignite from human activities, such as arson,discarded cigarettes, sparks from equipment, power line arcs and controlled field burning [10–12].
While most common wildfire causes may vary throughout the world [13,14], early detection isalways very important, because fires may spread fast and escape firefighters’ control, potentially causingsignificant economic damage, threatening human lives, homes and resources and devastating wildlife,habitats and ecosystems [15].
Wildfire frequency and devastation make the continuous monitoring of the areas at risk one of the mostwell-known environmental monitoring activities. Although many detection techniques were proposed,cost-effective and reliable early wildfire alerting is still difficult to achieve.
2.1.1. Ground-Based Remote Detection Methods
Traditionally, wildfire monitoring is based on continuous human surveillance from selected vantagepoints in the field attempting to recognize smoke patterns during the day or the light from fire flamesduring the night using visible light [16,17]. The authors argue in [18] that observers’ reports are ofteninsufficient to define an effective firefighting strategy and that the field video surveillance monitored inthe operational center can provide richer, actionable information and increase the surveyed area by theoperator. However, since remote field monitoring increasingly subjects the operators to fatigue, boredomand loss of concentration, several semiautomated wildfire recognition systems are proposed [19–34].These systems reduce the effort of the analysts, which basically need to validate the positives triggeredby the automated detection methods [22].
A class of detection methods look for combustion-generated heat using infrared (IR) imaging. Theequipment is rather expensive, has reduced spatial resolution and is prone to false positives [21,23].Accuracy can be improved by automated cross-matching of IR images with visible or ultraviolet (UV)ones or with meteorological and geographical data using various processing and decision makingtechniques, but at a higher equipment and maintenance cost [24].
Optical spectrometry can detect combustion-specific products in smoke [25,26] by analyzing itssunlight absorption patterns. It has good reliability, but is limited to scans above the horizon (thus, forsmoke that clears the tree line), and at night, it switches to the less effective flame detection [27]. Strongwinds may lower or disperse the smoke, delaying detection. However, wind significantly increases thespeed of fire spreading; thus, early alerting of firefighters becomes crucial for blaze containment.
Sensors 2015, 15 9485
Light detection and ranging systems (LiDAR) analyze the laser light backscattered bysmoke [28,29]. High-power laser beams may be expensive to produce, although, recently, researchersproposed lower cost techniques [30], and they can also be a public health hazard. Its effectiveness maybe limited by obstacles in the line-of-sight, fog or low altitude clouds, which are a likely occurrence inmountain climate.
Radio-acoustic sounding detection (RASS) can detect crown and surface wildfires from thermal mapsbuilt by inferring air temperature from shifts in the propagation time of acoustic waves [31]. The systemcan account for atmospheric events, like wind and some static echoes from vegetation or landscape, butit requires a clear line-of-sight right above the tree tops for proper operation. Moreover, its deploymentand calibration can be complex.
Remote detection systems tend to generate false positives (especially those based on visible lightimage analysis) and need the support of human analysts. Those that are more accurate are also moreexpensive due to higher equipment and maintenance cost [35].
2.1.2. Overhead Remote Detection Methods
Satellite-based wildfire detection can reach low false alarm rates in near real time. However,geostationary satellites may have limited spatial resolution, while polar orbiting satellites have limitedtemporal resolution, which can be significant for rapidly-evolving wildfires [36,37]. The accuracy of theautomated methods based on satellite monitoring can be further reduced by image acquisition problemsand image navigation errors, which can compromise the monitoring of individual fire events that wouldotherwise be correctly identified by analysts [38].
Unmanned aerial vehicles (UAV) can efficiently monitor for wildfires over large areas [39,40].Equipped with various fire detection techniques, they can survey the area continuously and costeffectively from a diversity of vantage points, much closer than the satellites. UAVs operation can beaffected by local weather conditions (fog, strong wind, low altitude clouds), wind being a well-knownrisk factor during their takeoff and landing [41].
These methods also share most operating limitations of the ground-based remote detection techniquesmentioned in Section 2.1.1, like unfavorable weather, obstructions of the direct line-of-sight, ambientlight quality and incidence angle.
2.1.3. Pervasive In Situ Detection Methods
In situ pervasive wildfire detection has several advantages over remote detection [42]. First, thesensors are closer to the events (e.g., combustion); thus, their sensing is generally less susceptible tointerference from external factors (e.g., wind, fog, obstructions). Second, in situ detection is implicitlyredundant to some extent, since the higher sensor density makes it likely that more than one of themdetects an event within a short time window. Nevertheless, natural occurring, non-fire-related phenomena(such as fog, dust or insect nests) may still trigger false alerts, even for pervasive methods, or theeffectiveness of some detection methods may be limited at night or in low visibility conditions.
Moreover, it is important to note that the cost per unit of surface of in situ monitoring is usuallyhigher than that of remote sensing, both for the initial deployment and for the maintenance [43]. Thus,

Sensors 2015, 15 9486
reducing these costs can significantly extend the application range that can be economically addressedusing pervasive methods. Their finer spatial and temporal resolution and the generally higher detectionaccuracy can complement the remote detection methods and can be justified for areas with higher risk offire or where humans or goods are more exposed, such as along roads or trails that cross forests or at theinterface between human habitat or resources and forests.
WSNs are among the best-suited systems for pervasive in situ long-term environmental monitoring,even in wild and harsh conditions [44–50], although other techniques have been reported, as well,e.g., based on optical fiber [31]. WSN nodes typically include the transducers and processing powerto autonomously detect specific fire effects within their range, such as light, smoke, heat andnoise [51–55]. The nodes are deployed within the area to monitor using application-specificcriteria [56] and periodically check for fire signatures using their on-board sensing and processingcapabilities. The control center is notified of positive matches by using radio messages sent either directlyto gateways or forwarded through a mesh network made by their neighboring nodes.
Most fire detection techniques used by pervasive WSNs are shared with the remote methods (seeSections 2.1.1 and 2.1.2) with various degrees of detection confidence, power profile and cost [49,57].Low-power techniques are preferred, since the limited sensor node energy is an important selectionfactor, energy being a direct and indirect contributor to WSN solution cost (we will analyze this in detailin Section 3.1.1).
Techniques based on low-power image processing [58] or radio-acoustic detection of the sound ofburning fire [31] performed on board the sensor nodes are reported, but they generally require higherprocessing energy. Detection of infrared [59] or ultraviolet radiation [60] that are correlated with fireshave a lower energy consumption profile and can be used alone or in conjunction with smoke detectionfor increased accuracy. Smoke particle detection can be combined with temperature sensing [53] (eitheras absolute value or variation speed). The detection of temperature patterns can be used alone (andthis is arguably one of the most cost- and energy-effective techniques) [61], or correlated with humidityreadings [44], or with humidity, wind and rainfall data that are periodically retrieved from the applicationserver [48]. In general, techniques based on data fusion from multiple transducer types can increasedetection reliability [35,62,63]. Reliability can be increased also using adaptive methods on sensornodes [64,65] or on sensor and gateway nodes, the latter benefiting from data aggregation from multiplesensor nodes [66].
Other methods are based on the detection of abnormal levels of combustion gases, standalone orcombined with temperature detection [67]. However, gas transducers may require higher power andperiodic recalibration. WSN detection can also be combined with UAV monitoring [50] to increase thedetection accuracy and to collect the necessary data to define and coordinate the actions of the firefighters.While most WSN deployments are designed for long-term monitoring, they can be deployed in theaffected areas for the short term to continuously collect data to help support firefighters’ operations inthe field [68].
Meeting the stringent requirements for effective long-term outdoor environmental monitoring isgenerally challenging for WSN technologies [69–71]. Nodes need to reliably operate for very long timeswithout or with minimal maintenance in variable and sometimes extreme climatic conditions. Outdoorapplications demanding a high number of nodes put additional emphasis on node cost and reliability.
Sensors 2015, 15 9487
Node weight, size and ruggedness become also important for deployments in fields that are difficult toreach, e.g., when nodes are transported in backpacks [8].
2.2. System Specifications
The analysis in Section 2.1 shows that in situ pervasive sensing is among the fastest and most reliablemonitoring methods. A low false alert rate due to higher detection reliability can reduce the need forhuman analysis and the effort of the field personnel, thus reducing the exploitation cost. Earlier firedetection can help the firefighters to contain the risks and damages, increasing safety and reducing costs.
WSN technology looks well suited for distributed sensing and reporting, but to be economicallyviable, it needs to scale well for large deployments and to have reduced initial and operation cost:low sensor node cost, reliable operation for extended periods and to require very few or no maintenanceat all.
Transducers on board the WSN nodes typically use energy sparingly to preserve their reserves andlife time. Among the effects of the fire, heat is always present, and high temperatures are among itsmost devastating effects. The temperature of the surrounding air can be energy- and cost-effectivelymeasured (e.g., using inexpensive negative temperature coefficient (NTC)transducers), and the WSNnodes can periodically sample it looking for abnormal temperature patterns that are highly correlatedwith convection heating from fires. For example, the nodes can alert when the absolute temperature valueor its rate of increase rises above specific thresholds [53]. The thresholds should be set high enough toprevent false alerts due to naturally occurring temperature patterns and as low as possible to improvedetector sensitivity and timely alerting.
As discussed in Section 2.1.3, fire detection accuracy can increase by combining measurements fromdifferent types of transducers, each sensitive to different effects of the fire. For instance, abnormal airtemperatures can be correlated with the levels of infrared radiation on wavelengths closely related to thepresence of fire, for the same monitored area.
Transducers of different types can be mounted on the same sensor node or on different, specializednodes. A node with multiple transducers can correlate the measurements on board, reducing networktraffic. However, multiple transducers also increase the node cost, energy consumption and resourcerequirements. They may also add deployment constraints, increasing its complexity and cost.
Specializing the nodes by transducer type allows one to differentiate their deployment requirements tooptimize their operation. For instance, nodes that sense infrared radiation can be attached to the undersideof the lower branches of the trees, facing down, at heights of a few meters above the ground, while thetemperature sensors can be attached on tree trunks, at 0.5–1 m from the ground, to have good thermalcontact with the hot air rising from nearby fires. The deployment density may also differ by node type.Field data from nodes can be correlated upstream, e.g., on the gateway or server for a typical tieredstructure, like the one shown in Figure 1.
Application-specific trade-offs are usually made between the required detection accuracy and theimplementation cost. The industrial partner initially considered fire detection solutions based on low-costsensors, which consume no energy in standby mode and that are activated by fire (e.g., heat-activatedpower supplies [72] or conventional small batteries that supply the node through a bimetallic switch only
Sensors 2015, 15 9488
when heated above a threshold [73]). However, the quality of service (QoS) cannot be monitored forthese solutions, thus they cannot be considered reliable in the general case.
SensorNode
Tra
nsdu
cer
GatewayNode
Server
Field comm.
Out-of-field comm.
Sensor Nodes
Gateways,Repeaters
ApplicationServers
Backend,Alerts
GPRS
Tie
rs
IoT
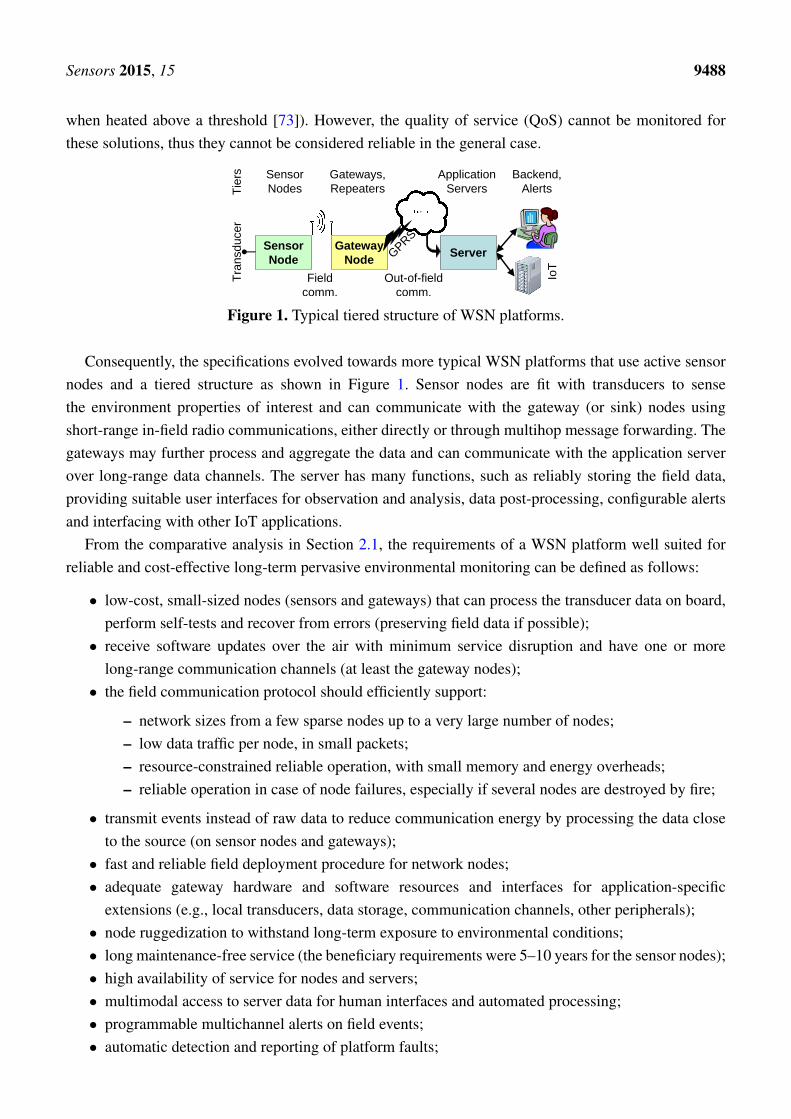
Figure 1. Typical tiered structure of WSN platforms.
Consequently, the specifications evolved towards more typical WSN platforms that use active sensornodes and a tiered structure as shown in Figure 1. Sensor nodes are fit with transducers to sensethe environment properties of interest and can communicate with the gateway (or sink) nodes usingshort-range in-field radio communications, either directly or through multihop message forwarding. Thegateways may further process and aggregate the data and can communicate with the application serverover long-range data channels. The server has many functions, such as reliably storing the field data,providing suitable user interfaces for observation and analysis, data post-processing, configurable alertsand interfacing with other IoT applications.
From the comparative analysis in Section 2.1, the requirements of a WSN platform well suited forreliable and cost-effective long-term pervasive environmental monitoring can be defined as follows:
• low-cost, small-sized nodes (sensors and gateways) that can process the transducer data on board,perform self-tests and recover from errors (preserving field data if possible);
• receive software updates over the air with minimum service disruption and have one or morelong-range communication channels (at least the gateway nodes);
• the field communication protocol should efficiently support:
– network sizes from a few sparse nodes up to a very large number of nodes;– low data traffic per node, in small packets;– resource-constrained reliable operation, with small memory and energy overheads;– reliable operation in case of node failures, especially if several nodes are destroyed by fire;
• transmit events instead of raw data to reduce communication energy by processing the data closeto the source (on sensor nodes and gateways);
• fast and reliable field deployment procedure for network nodes;• adequate gateway hardware and software resources and interfaces for application-specific
extensions (e.g., local transducers, data storage, communication channels, other peripherals);• node ruggedization to withstand long-term exposure to environmental conditions;• long maintenance-free service (the beneficiary requirements were 5–10 years for the sensor nodes);• high availability of service for nodes and servers;• multimodal access to server data for human interfaces and automated processing;• programmable multichannel alerts on field events;• automatic detection and reporting of platform faults;
Sensors 2015, 15 9489
• extensible server architecture for integration in IoT applications.
These specifications would also allow the reuse of the platform for several event-based long-termapplications besides wildfire monitoring, such as:
• water level of lakes, streams, sewage. Sensor nodes can detect and alert about extreme levels (highor low) and periodically report level statistics;
• gas concentration in air for laboratories, deposits, ship holds, cities. Sensor nodes can detectpotentially harmful concentrations of one or more gases;
• soil properties for precision agriculture;• static or dynamic parameters for structures, e.g., the inclination of dams;• position changes, e.g., land slides;• lighting level, e.g., for intrusion detection in dark spaces, like cable channels;• infrared radiation from combustion (fire) or human or animal presence, for security or habitat
monitoring. On-node analysis using thresholds and speed of variation can screen alerts fromnatural-occurring patterns.
Platform reuse can improve the economic sustainability of its development and maintenance. Thisis important, since cost can be a major factor that prevents commercial adoption of in situ pervasivemonitoring solutions.
The overall cost of the platform has several components that we consider in detail during platformdesign in Section 3:
• Node cost, which is roughly proportional to the monitored area and can significantly weigh on thetotal cost. Generally, a WSN has fewer gateways than sensor nodes; thus, platform design needs tocarefully optimize at least the cost of the latter.
• Exploitation cost basically made up of the cost of the analysts to validate the alerts and thecost of node and network maintenance. The rate of false alerts can be kept low through severaltechniques: performing the sensing close to the event source, using selective sensing methodsless susceptible to interference from unrelated events and using data fusion from multiple sensortypes [74]. Maintenance may be needed to periodically clean the nodes to restore their nominalsensing or energy harvesting levels or to replace exhausted batteries. This can be reduced by usingmaintenance-free transducers and low-energy long-life sensor nodes. Nodes can fail for variousreasons, including mechanical stress due to daily temperature variations or extreme climaticconditions. Adequate node hardware design and ruggedization should minimize the effects oflong-term environmental exposure.
• Deployment cost, which can significantly increase when the monitored area is difficult to accessor if deployment errors are discovered later, during network exploitation, requiring additional fieldexpeditions to correct them. Deployment cost depends also on other factors, such as the complexityand time needed for the deployment of the network nodes, the level of specific knowledge expectedfrom the deployment personnel and node size and weight (if they are manually transported in field).
Most platform costs can be reduced through optimizations of the design of its components with aholistic view of the full system, as will be shown in Section 3.

Sensors 2015, 15 9490
3. Platform Design Criteria
We will present in the following the most important node design considerations and decisions basedon the specifications in Section 2.2.
3.1. Sensor Node Design Criteria
WSN platforms for pervasive in situ monitoring may need to deploy many sensor nodes, which canaffect several cost components of the platform. In the following, we will analyze the design options forthe major contributors to sensor node cost, as well as their contributions to the various components ofthe platform cost that were presented in Section 2.2.
3.1.1. Sensor Node Energy Supply
Energy supply can be an important cost of the sensor nodes. Its role is to provide energy for nodeoperation between maintenance (e.g., for battery replacement or node cleaning), with the continuitynecessary for the expected node quality of service (QoS).
An important decision is whether to use a regenerative supply. Energy harvesting can be effectivewhen ambient energy is available, such as vibration, fluid flow, temperature differences and light [75].Although their cost and QoS are difficult to estimate in the general case, combined energy harvesting canincrease the availability [76]. These supplies may add to node or platform cost, for instance by increasingthe physical dimensions of the node, by additional casing requirements (e.g., a waterproof transparentwindow for light harvesting), by additional restrictions for field placement for effective ambient energyharvesting or by increasing the complexity of the deployment procedure.
Primary batteries, on the other hand, store all of the energy needed for the entire node lifespan or theperiod between scheduled maintenance. The minimum battery capacity can be obtained by multiplyingthe node average energy consumption and the expected lifespan. Battery cost is roughly proportionalto its capacity, but the scheduled maintenance for replacement of depleted batteries can be a majorcontributor to the overall solution cost.
3.1.2. Sensor Node Communication Protocol and Radio Device
Radio communication is widely recognized as one of the major energy drains on sensor nodes. Thus,it influences the selection of the energy supply (with the criteria presented in Section 3.1.1) and someother node costs that we will analyze in the following.
The largest part of the communication energy is typically spent by the receiver while listening forincoming data packets. For this reason, most communication protocols operate the receiver with very lowduty cycles (typically 1%–3% for random MACs [77,78] and much less for synchronous MACs [79]).Even more, the receiver can be eliminated altogether for random access unidirectional communicationin star topologies.
Multihop message forwarding typically uses less energy to cover the same distance and may beless affected by node faults or changing propagation conditions. However, mesh networks require moremicrocontroller resources and involve regular packet exchanges to maintain network connectivity. These

Sensors 2015, 15 9491
may increase both node energy consumption and cost. Moreover, message routing in large mesh networksmay be affected by dynamic effects that are hard to detect, such as bottlenecks or instabilities [8,80,81],which may increase deployment complexity and cost. Synchronous protocols also need an accurate timerconstantly running on the nodes, which further increases their cost and energy consumption.
Transmit-only nodes in star topologies can use very small protocol stacks and have much more relaxedrequirements for on-node timing accuracy. Thus, they need less microcontroller resources and energy, butthey cannot create mesh topologies to improve robustness and reduce transmit power. Furthermore, thesenodes cannot actively avoid message conflicts or receive confirmations, queries, configuration changesor in-field updates for node software.
3.1.3. Sensor Node Functions
Besides the main function of environment sensing and processing, sensor nodes can implementfunctions that improve the overall system reliability and cost.
Periodic node self-test and error recovery functions increase the reliability and QoS of the monitoringplatform and reduce maintenance requirements and cost. Nodes that aggregate peer messages beforeforwarding should implement suitable redundancy policies to prevent data loss if they reset themselvesin order to recover from errors or if they fail.
Normally, the sensor nodes do not have user interface elements, such as buttons, LEDs and displays,which can increase the bill for materials, the ruggedization cost and the energy consumption. Thus,for interactive operations, like checking the quality of an installation position in the application fieldor retrieving their ID, the nodes should provide the operator simple, yet effective means to selectivelyaddress and communicate with them while in close physical vicinity. Moreover, specific node self-testingand reporting functions should be used at the end of the production line to lower production cost.
However, additional functions increase the complexity of the node program, thus the probability ofdefects [82], which can adversely impact the overall system reliability and increase the maintenance cost.Programming the nodes using high-level, clean, application-optimized code and component reuse mayrequire less resources and energy, thus reducing the cost and improving the reliability of the node.
3.1.4. Sensor Node Hardware Components
In the following, we examine some criteria that guide the sensor node hardware selection.Smaller bills for materials generally increase the production and operation reliability and reduce costs.Transducer selection closely depends on the detection method. For instance, fire can be sensed through
smoke or heat, and the latter can be sensed by temperature (e.g., using an NTC) or by radiation (e.g.,using passive infrared transducers). Low-cost and power-efficient transducers, which can operate on verylow duty cycles and with less energy, can significantly reduce node and maintenance cost.
Radio devices with a baseband modem may reduce the software complexity and energy consumption.The microcontroller resources should fit the application needs closely, since oversizing it may increase
the cost and energy consumption on most power levels.
Sensors 2015, 15 9492
3.2. Gateway Design Criteria
In typical WSN deployments, there are significantly fewer gateways than sensor nodes. Hence, thenode cost of the gateways contributes less than the cost of the sensor nodes to the overall cost of theWSN platform. However, the features of the gateways can indirectly influence the cost of the platformin several ways, as we will show in the following.
3.2.1. Gateway Communication
The gateways typically have two types of communication capabilities: long range and short range. Thelong-range communications are used to connect with the application server either directly or through theInternet. The short-range communications are mainly used to connect with the field nodes, either sensornodes or peer gateways.
Long-range communication can use several technologies. A cellular data network is commonly usedin outdoor fields that are covered by mobile data services [83]. Alternatively, dedicated communicationlinks on either a private or public radio spectrum can be used, e.g., the 868-MHz short range devices(SRD) band allows ranges up to 40 km [84], and long-range Wi-Fi links can exceed 100 km [85]. Satellitelinks may also be used [86], especially for remote, isolated fields.
The constraints for the short-range in-field communications are less stringent for the gatewaysthan for the sensor nodes (which were discussed in Section 3.1.2). The gateways have more energyreserves and computing resources, thus they can support most communication protocols: from simplelow power listening (LPL) for random access MACs in star topologies and up to complex routing andsynchronization schemes.
Thus, the gateways can help reduce the overall cost of the WSN application by supporting theshort-range communication protocol that optimizes the cost of the sensor nodes, which is a significantcomponent of the overall cost of the solution.
3.2.2. Gateway Energy Supply
Long-distance communication of the gateways typically requires much more energy than theshort-range in-field one of the sensor nodes. Gateways also have more hardware resources, such as largerprogram and data storage capacity, more powerful microcontrollers or microprocessors and accurate,always-running timers. All of these combined require significantly more energy than the sensor nodes.
Thus, the gateways generally have higher energy reserves and may also have ambient energyharvesting devices to increase their lifespan between scheduled maintenance (which may be needed for,e.g., the replacement of the (rechargeable) battery or for the cleaning of the energy harvesting devices).Even if the gateways may require scheduled maintenance more often than the sensor nodes, its cost maybe acceptable: a WSN deployment for pervasive environmental monitoring typically has fewer gatewaysthan sensor nodes, and the gateways are generally deployed in locations that are more accessible thanthe sensor nodes (see Section 2.2), which further reduces the cost of gateway maintenance.
Given that gateway energy reserves are far larger than those of the sensor nodes and that gatewaymaintenance is less expensive than the maintenance of the sensor nodes, it can be cost-effective at the

Sensors 2015, 15 9493
network-level to bias the energy consumption towards the gateways if this helps with reducing the costof the sensor nodes and their scheduled maintenance requirements.
3.2.3. Gateway Functions
Besides the main function to collect and forward to the application server the field data from thesensor nodes (and from the on-board sensors, if any), the gateways can implement other functions thatimprove the overall system reliability and cost.
The gateways should prevent the loss of the aggregated field data in case of non-fatal hardware faultsor of self-resets due to software defects. Moreover, in case of repeated or fatal software errors, thegateways should fall back to a safe operation mode, which allows remote debugging or recovery toreduce service interruptions and the cost of in-field maintenance.
During field deployment, the gateways should assess the suitability of the installation position in termsof network reachability and link quality with the other nodes and the server, as well as the effectivenessof the energy harvesting (if available).
3.3. Server Design Criteria
The main purpose of the application server is to receive field data and store them reliably forlater access upon request. It bridges the low-power communication segments (that operate under strictlatency-energy trade-offs) with the fast and ubiquitous data access needed by human interfaces orIoT applications. As shown in Figure 1, the server provides interfaces for field nodes, operators andsupervisors of the field, alert channels and for external systems.
For a high QoS, the server should implement high-availability techniques, e.g., a secondary servershould be kept in sync and automatically take over the service if the main server fails.
The protocol between the nodes and the server should be simple to reduce the resource requirementsfor the nodes and, as much as possible, stateless, because the long-range connections at the fringe ofmobile data coverage can be often unstable and the overhead for resuming an interrupted transfer shouldbe minimized. For the same reason, the protocol should provide acknowledgments for data reception,and these should be sent only when the data are successfully replicated on the secondary server to avoidfield data loss due to single points of failure.
Gateways that need to enter the fail-safe operation mode may use a communication protocol withthe server that is optimized for the operations executed in this mode (e.g., software update). The servershould implement this protocol and the associated operations, as well as promptly notify the operatorswhen a gateway connects using this channel, to take corrective actions.
4. Platform Design
Platform design aims at a cost-effective implementation that closely follows the specifications inSection 2 and the design criteria in Section 3.

Sensors 2015, 15 9494
Considering the multi-objective optimization needed to satisfy sensor node specifications and designcriteria, we decided for a custom design and development of communication protocols (both for in-fieldcommunications and with the server) and node hardware and software.
In the following, we describe the design of the prototype platform, the field test preparation andunfolding, the lessons learned from the test and how we can use them for improvements.
4.1. Communication Protocol Design
The communication protocol can affect the performance of a WSN platform in several importantways. First, the protocol is mostly responsible for propagating the data across the network accordingto application requirements. Consequently, it controls the most part of the radio activity of the nodes,which is generally recognized as a major energy consumer. Thus, the protocol can significantly influencethe selection of energy supply type and size, which relate closely to its cost and to the schedulednode maintenance. Moreover, the characteristics of the communication protocol may also affect thecomplexity and quality of the field deployment of the network, thus its duration, cost and the need forsubsequent corrective network maintenance [6].
Most WSN deployments tend to use simple communication protocols that are enough to satisfy therequirements of the applications [87]. However, very few appear to consider during network designthe effects of the protocol on the complexity, quality, maintenance requirements and cost of networkdeployment [43]. Deployment and deployment-related maintenance can add up to significant costs forpervasive environmental monitoring applications.
The analysis in Section 3.1.2 presents some of the most significant trade-offs to consider whenselecting the protocol for a specific application. For instance, using a radio receiver can increase the costof the sensor node and of the application by adding to the cost of components, of the microcontroller(may require more resources), increases node energy consumption, thus adding to the cost of energysupply and/or the scheduled maintenance to change node batteries. However, a receiver also allowsa better management of the communication channel, can increase the reliability of message delivery,can reduce the transmission power per node through multihop message forwarding and can supportbidirectional network communication that allows one to remotely query or reconfigure the nodesin the field.
To define the specifications of the communication protocol, we started from the analysis of applicationrequirements. The communication needs of sensor nodes by state can be summarized as follows:
normal state: the node periodically communicates its health status and, if possible, somebackground environmental measurements;fault state: the node communicates the nature of the fault (if the fault does not affect the radio);alert state: the node detected a fire and reports the event in the shortest time, with thehighest priority.
If the nodes periodically communicate their health status and some background environmentalmeasurements, remote node interrogation becomes less important or even impractical for a large numberof nodes, which are typical for pervasive monitoring methods (from hundreds to tens of thousands of

Sensors 2015, 15 9495
nodes per application). Thus, for such applications, a bidirectional communication may be less importantthan the optimization of node cost.
Multihop message propagation through the network using a mesh topology can reduce the transmitpower of the nodes, which may lead to lower energy consumption at the node level. However, twoother factors should be considered. First, operating a radio receiver, even with very low duty cycles,can still significantly raise the energy consumption of the node. Second, lower radio frequencies, whichpropagate better in forest environments [88,89], have also a considerably longer communication rangefor the same transmit power, thus making the use of a star topology more practical. Moreover, a networkwith a star topology can be functional, even with sensor nodes with no receive capabilities, which canlead to multiple cost reductions, as we have shown.
Thus, on the one hand, we decided to use the 433-MHz UHF industrial, scientific and medical(ISM)band for its better propagation in forests. On the other hand, we analyzed if a communicationprotocol based on unscheduled channel access can satisfy the requirements of the application.
Communication protocols with unscheduled channel access are well known in the literature [77].In the following, we will analyze if we can completely remove the receiver from the sensor nodes toachieve multiple cost reductions.
Without receive capabilities, the sensor nodes have no means to know if a message reached itsdestination or was lost. Thus, sufficient communication redundancy should be built into the protocolto keep message loss to acceptable levels for the application. It should be noted that the application ismore tolerant to the potential loss of low-priority periodic health status messages than to high-priorityand delay-sensitive fire alerts.
Higher transmission redundancy may increase the delivery probability of the messages, but it alsoincreases the energy consumption of the node and the probability of collisions. Thus, protocol designshould consider the effects of redundancy on message loss and on the delay of the detection of faultynodes that are no longer able to transmit their status, for various network sizes.
For this purpose, we have set up a network simulation model in SystemC [90] as follows. The sensornodes were modeled as transmitters that periodically send a health status (heartbeat) message. Thetransmission period is affected by a static error that is initialized randomly in the range +10–+30%,corresponding to the error range of the watchdog timer of the microcontroller that was used to controlthe timing on the sensor node.
The gateway node was modeled as a receiver implementing LPLto listen for incoming messagesfrom the sensor nodes. The wakeup period for RF sampling was set slightly shorter than the length of amessage, 0.3 s (including the preamble). Normally, the radio receivers can correctly decode the strongestof two overlapping messages if the amplitude difference exceeds the receiver signal-to-noise ratio, thuslosing only one of the two. The same stands for messages that overlap only partially over the preamble.However, for the purpose of the simulation, we opted to pessimistically consider that two overlappingmessages are both lost, regardless of the amplitude ratio or the extent of the collision.
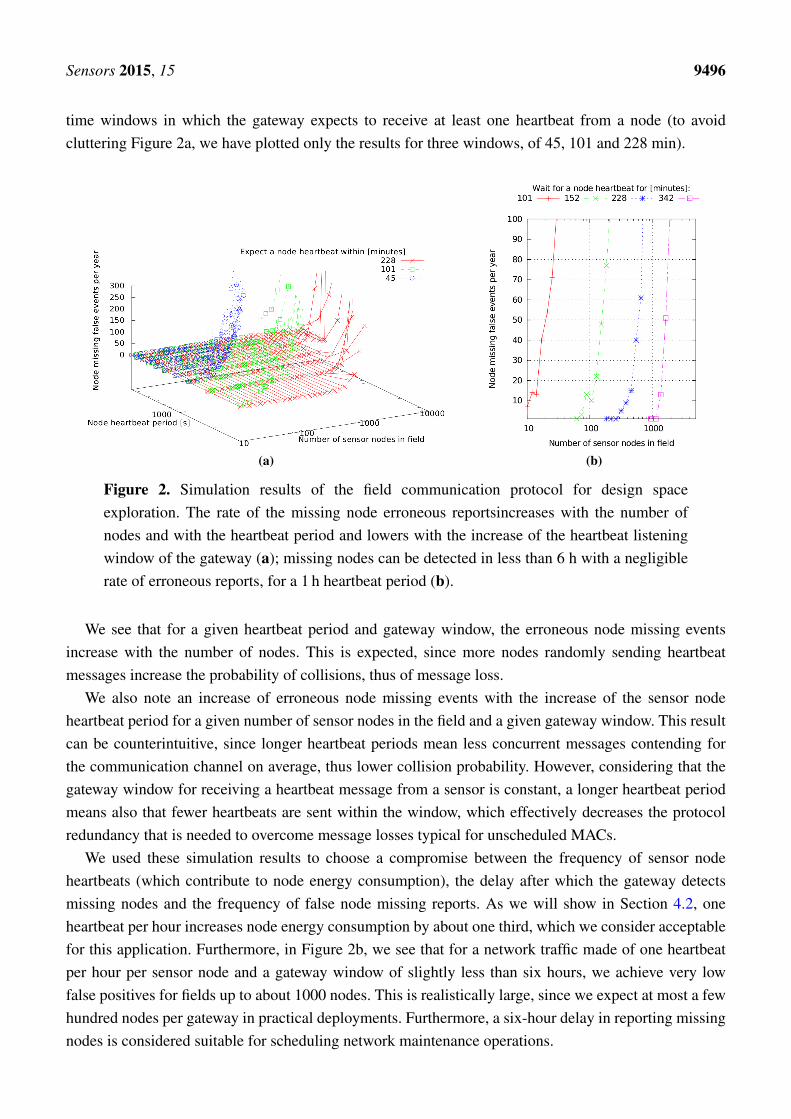
Figure 2a shows the simulation results for a year of operation for fields with one gateway that receivesheartbeats from 10–5000 nodes. The node heartbeat period varies from six minutes to one hour, and wecount the number of times that a sensor node is declared missing over one year of operation for different
Sensors 2015, 15 9496
time windows in which the gateway expects to receive at least one heartbeat from a node (to avoidcluttering Figure 2a, we have plotted only the results for three windows, of 45, 101 and 228 min).
(a) (b)
Figure 2. Simulation results of the field communication protocol for design spaceexploration. The rate of the missing node erroneous reportsincreases with the number ofnodes and with the heartbeat period and lowers with the increase of the heartbeat listeningwindow of the gateway (a); missing nodes can be detected in less than 6 h with a negligiblerate of erroneous reports, for a 1 h heartbeat period (b).
We see that for a given heartbeat period and gateway window, the erroneous node missing eventsincrease with the number of nodes. This is expected, since more nodes randomly sending heartbeatmessages increase the probability of collisions, thus of message loss.
We also note an increase of erroneous node missing events with the increase of the sensor nodeheartbeat period for a given number of sensor nodes in the field and a given gateway window. This resultcan be counterintuitive, since longer heartbeat periods mean less concurrent messages contending forthe communication channel on average, thus lower collision probability. However, considering that thegateway window for receiving a heartbeat message from a sensor is constant, a longer heartbeat periodmeans also that fewer heartbeats are sent within the window, which effectively decreases the protocolredundancy that is needed to overcome message losses typical for unscheduled MACs.
We used these simulation results to choose a compromise between the frequency of sensor nodeheartbeats (which contribute to node energy consumption), the delay after which the gateway detectsmissing nodes and the frequency of false node missing reports. As we will show in Section 4.2, oneheartbeat per hour increases node energy consumption by about one third, which we consider acceptablefor this application. Furthermore, in Figure 2b, we see that for a network traffic made of one heartbeatper hour per sensor node and a gateway window of slightly less than six hours, we achieve very lowfalse positives for fields up to about 1000 nodes. This is realistically large, since we expect at most a fewhundred nodes per gateway in practical deployments. Furthermore, a six-hour delay in reporting missingnodes is considered suitable for scheduling network maintenance operations.

Sensors 2015, 15 9497
Thus, the main characteristics of the communication protocol can be summarized as:
• under normal conditions, the sensor nodes send one heartbeat per hour;• fire alert messages are sent with much higher frequency (every few seconds) to ensure their timely
propagation, even at the cost of losing concurrent heartbeat messages. The communication channelcapacity can support the alert traffic well, since, assuming no collisions, 1000 nodes sending one0.3 s heartbeat message per hour each occupy at most 8.3% of the channel capacity;
• the gateways can detect a missing node in less than six hours.
This simple protocol satisfies the requirements of the application well. It does not need a receiveron the sensor nodes, which primarily lowers node cost and energy consumption. Moreover, withouta receiver, the operation of the sensor nodes is defined only by their own programming. This meansthat the energy consumption for each node in normal conditions is predictable, and we calculate it inSection 4.2. In the alert state, the node will spend much more energy in order to propagate in a timelymanner the alert messages to the gateways, which can significantly reduce its energy reserves. However,this is not an issue, since the heat of a fire will very likely destroy the node shortly after detection.
4.2. Sensor Node Design
Early node prototypes were based on zero standby energy designs discussed in Section 2.2. Sincetheir health status (QoS) cannot be observed, they were abandoned for a typical WSN node architecture: amicrocontroller communicating with a radio device and powered by a primary cell, as shown in Figure 3.
(a) PCB top view (31 × 14 mm) (b) PCB side view with battery, NTC, NMHA
Figure 3. Sensor node prototype: PCB for laboratory tests (a); and prepared for field testswith manually soldered NTC , normal mode helix antenna (NMHA) and battery (b); theRF performance is limited by the balun layout (a) and the proximity to the antenna offerromagnetic crystal case and battery seal (b).
The prototype was designed mainly to test the operation of the low-resource microcontroller and radioin a compact format, including the radio frequency (RF) performance, and to develop the node firmware,software and in-field communication protocol. Thus, the node printed circuit board (PCB)did not includethe transducer, the power supply pads did not fit a standard battery size and it had just generic solderingpads for the antenna (all of these elements were still to be decided).
According to application specifications, the node prototype was primarily optimized for cost and size.In this regard, it is worth noting that it has significantly lower resources than a typical WSN node: themicrocontroller is an ATtiny25 (2 KiB FLASH, 128 bytes SRAM, 128 bytes EEPROM, one analog to
Sensors 2015, 15 9498
digital converter (ADC), one serial peripheral interface (SPI)); the radio for in-field communication isa TI CC1150 with a baseband modem (transmit-only for the 315-/433-/868-/915-MHz bands); and theexternal accurate resonator for the radio is a 27 MHz quartz crystal. The microcontroller uses its internaloscillators (8 MHz main clock and 128 kHz watchdog clock) to reduce the external components, thewake-up time and the energy consumption.
The average standby current of the sensor node is about 4.7µA, largely due to the watchdog timer.It samples the temperature once per second with an NTC transducer (discussed in Section 5.1), keepingboth the microcontroller and the transducer active for less than 0.05% of the time. The former consumesabout 600µA in active state and the latter a few tens of microamperes; thus, their contribution to nodeaverage energy consumption is negligible. The transmission of one packet consumes about 27 mA for lessthan 0.3 s. Thus, in normal operation (sending one heartbeat packet per hour, as discussed in Section 4.1),the average current consumption is less than 7µA, and the node theoretical lifespan with a 1 Ah 1/2-AAsize lithium battery exceeds 16 years.
4.3. Gateway Node Design
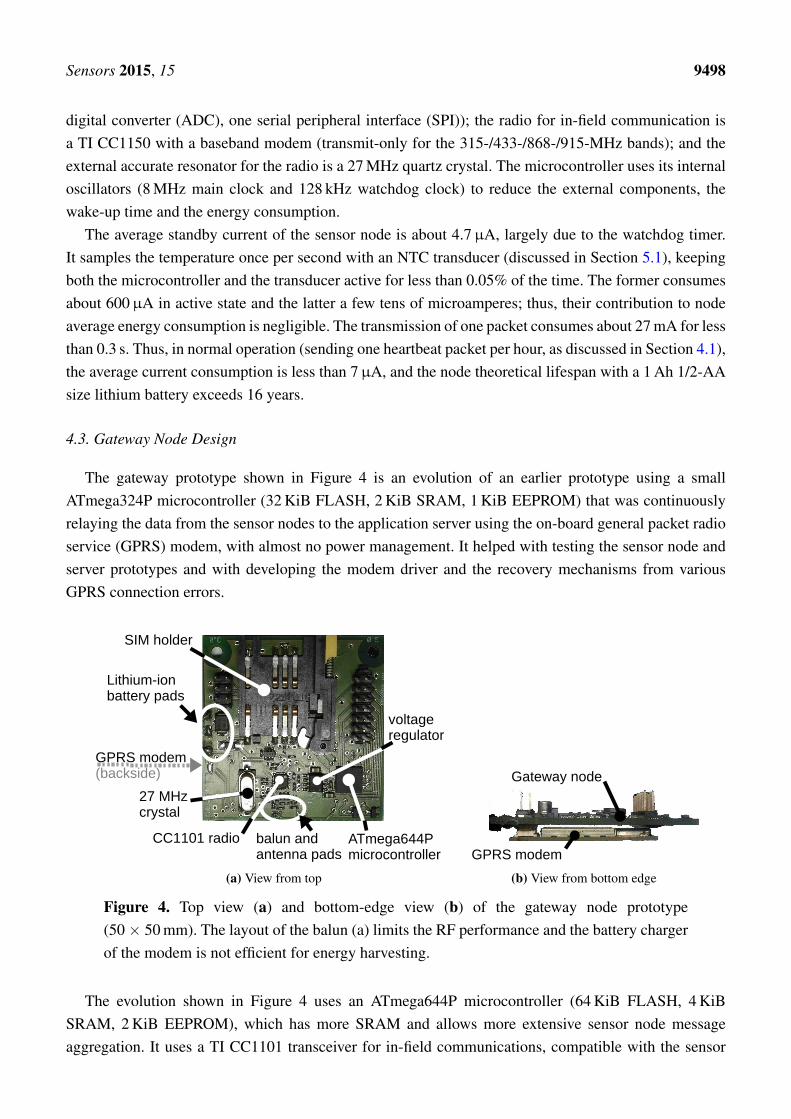
The gateway prototype shown in Figure 4 is an evolution of an earlier prototype using a smallATmega324P microcontroller (32 KiB FLASH, 2 KiB SRAM, 1 KiB EEPROM) that was continuouslyrelaying the data from the sensor nodes to the application server using the on-board general packet radioservice (GPRS) modem, with almost no power management. It helped with testing the sensor node andserver prototypes and with developing the modem driver and the recovery mechanisms from variousGPRS connection errors.
(a) View from top (b) View from bottom edge
Figure 4. Top view (a) and bottom-edge view (b) of the gateway node prototype(50 × 50 mm). The layout of the balun (a) limits the RF performance and the battery chargerof the modem is not efficient for energy harvesting.
The evolution shown in Figure 4 uses an ATmega644P microcontroller (64 KiB FLASH, 4 KiBSRAM, 2 KiB EEPROM), which has more SRAM and allows more extensive sensor node messageaggregation. It uses a TI CC1101 transceiver for in-field communications, compatible with the sensor
Sensors 2015, 15 9499
node transmitter. The GPRS modem (on the back side of the board; see Figure 4b) is a Siemens TC65iwith an embedded TCP/IP stack and a charge regulator for lithium-ion batteries, which can be used forenergy harvesting.
It is worth noting that the gateway node prototype is cost- and energy-effective, since it uses hardwareresources that are typical for a low-end WSN sensor node (except for the GPRS modem).
5. Platform Preparation for the Field Test
While the platform prototype was still in the early stages of development, it became unexpectedlynecessary to prepare all of its components (the sensor and gateway nodes and the server) for an extendedtwo and a half month field test (end of June to early September). The test was set to start in less thantwo months using 50 sensor nodes and two gateways deployed in an olive tree field in the south-west ofGreece. In the following, we will present how we selected, developed and assembled in this short time aplatform prototype with the most important features to test in the field. We will also show how we usedthe results and experience from the test to refine and enhance platform functionality and reliability.
The time to field test was too short to design, produce and test new sensor nodes, and we decidedto adapt the functionality and ruggedize the node prototypes designed for laboratory tests (describedin Section 4). As expected, this adaptation has led to several issues during the test, but also fostered athorough analysis of the platform operation before, during and after the test, ultimately helping us tosignificantly improve its reliability and cost, as we will show below.
Because the test field was located far away (nearly 2000 km), on-site maintenance would have beencostly and time-consuming. On the other hand, since the components of the platform were not developedwith the quality necessary to withstand an extended environmental exposure in field, we expected toencounter hardware issues during the test.
Thus, we made a development priority to add the necessary monitoring features to collect enoughdata about defects and anomalies that may manifest during the test, in order to understand their causesand effectively help with improving the future versions of the platform. Most of these features would beneeded anyway, since QoS control is always important for long-term outdoor environmental monitoringplatforms, especially when monitoring for potentially dangerous events, like wildfires, as was discussedin Sections 3.1.3 and 3.2.3.
Based on the analysis in Sections 3.1.2 and 4.1, we chose a star network topology and a verysimple communication protocol, because they can considerably simplify the sensor nodes: reduce therequirements for hardware resources, the size and complexity of the communication protocol stack, theenergy consumption and the cost. All of these are important specifications for pervasive monitoringplatforms and, most importantly, they simplify network deployment to a level where it can be efficientlydone by application domain experts or low-skill workers.
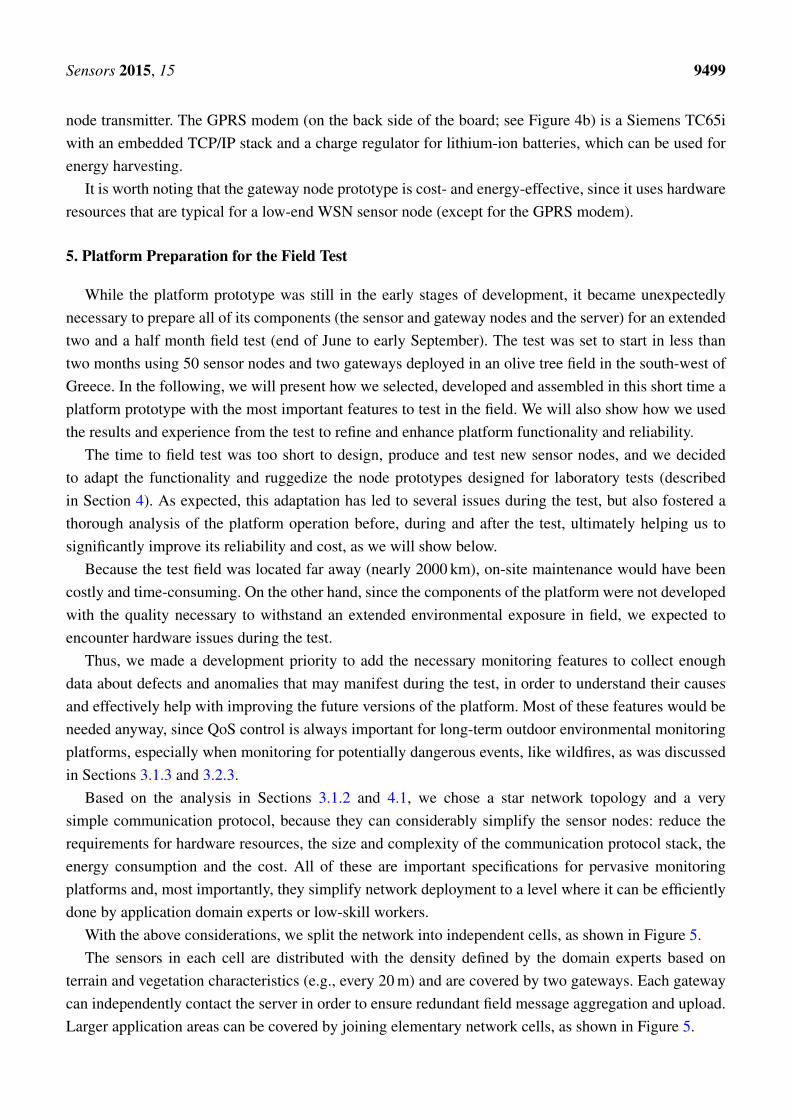
With the above considerations, we split the network into independent cells, as shown in Figure 5.The sensors in each cell are distributed with the density defined by the domain experts based on
terrain and vegetation characteristics (e.g., every 20 m) and are covered by two gateways. Each gatewaycan independently contact the server in order to ensure redundant field message aggregation and upload.Larger application areas can be covered by joining elementary network cells, as shown in Figure 5.
Sensors 2015, 15 9500
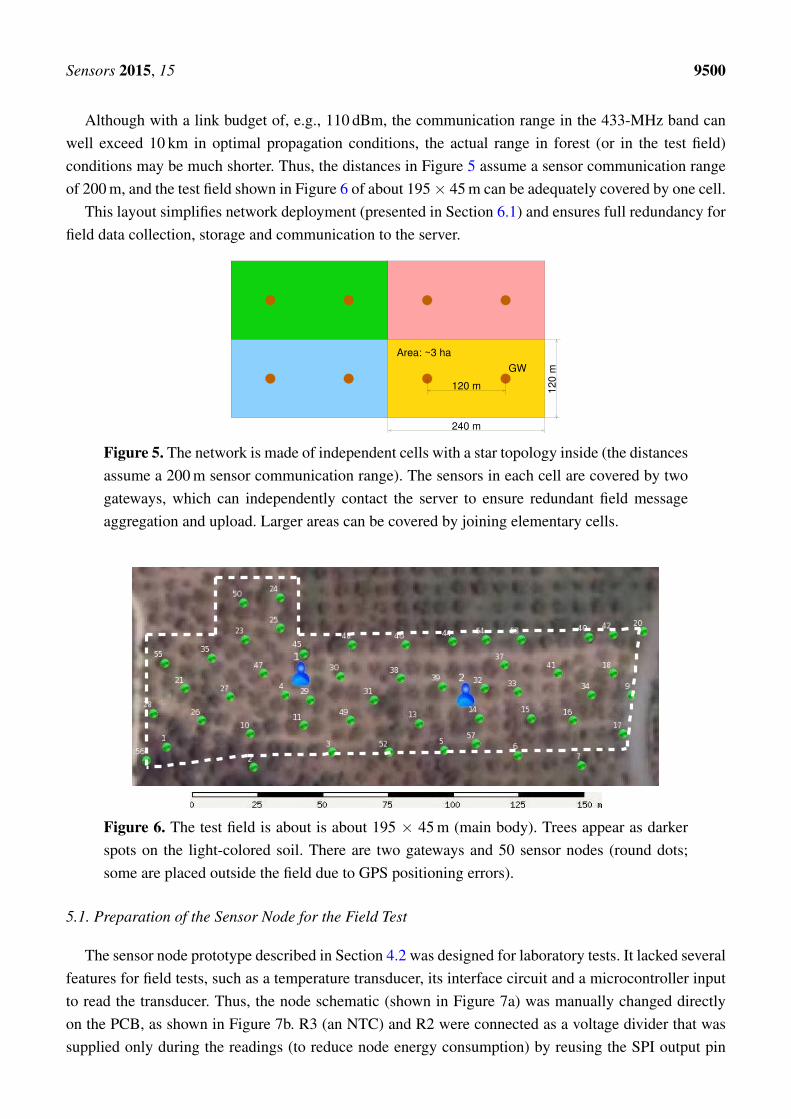
Although with a link budget of, e.g., 110 dBm, the communication range in the 433-MHz band canwell exceed 10 km in optimal propagation conditions, the actual range in forest (or in the test field)conditions may be much shorter. Thus, the distances in Figure 5 assume a sensor communication rangeof 200 m, and the test field shown in Figure 6 of about 195 × 45 m can be adequately covered by one cell.
This layout simplifies network deployment (presented in Section 6.1) and ensures full redundancy forfield data collection, storage and communication to the server.
120 m
240 m
12
0 m
GW
Area: ~3 ha
Figure 5. The network is made of independent cells with a star topology inside (the distancesassume a 200 m sensor communication range). The sensors in each cell are covered by twogateways, which can independently contact the server to ensure redundant field messageaggregation and upload. Larger areas can be covered by joining elementary cells.
Figure 6. The test field is about is about 195 × 45 m (main body). Trees appear as darkerspots on the light-colored soil. There are two gateways and 50 sensor nodes (round dots;some are placed outside the field due to GPS positioning errors).
5.1. Preparation of the Sensor Node for the Field Test
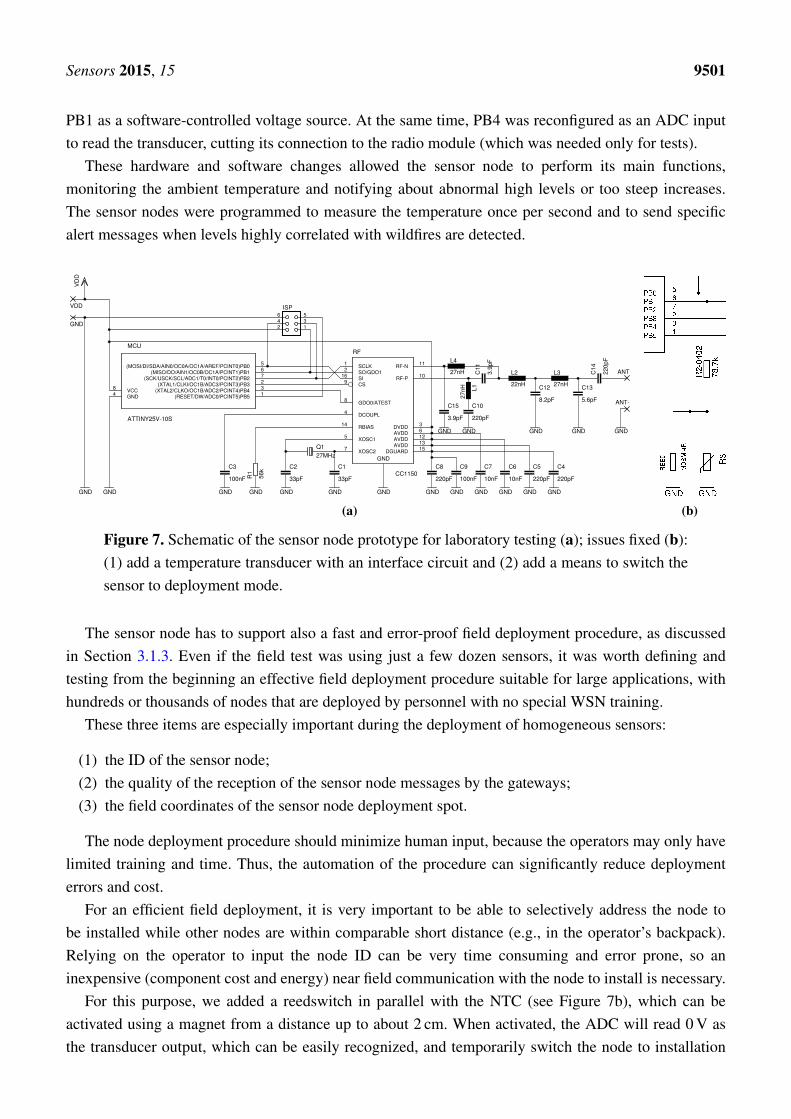
The sensor node prototype described in Section 4.2 was designed for laboratory tests. It lacked severalfeatures for field tests, such as a temperature transducer, its interface circuit and a microcontroller inputto read the transducer. Thus, the node schematic (shown in Figure 7a) was manually changed directlyon the PCB, as shown in Figure 7b. R3 (an NTC) and R2 were connected as a voltage divider that wassupplied only during the readings (to reduce node energy consumption) by reusing the SPI output pin
Sensors 2015, 15 9501
PB1 as a software-controlled voltage source. At the same time, PB4 was reconfigured as an ADC inputto read the transducer, cutting its connection to the radio module (which was needed only for tests).
These hardware and software changes allowed the sensor node to perform its main functions,monitoring the ambient temperature and notifying about abnormal high levels or too steep increases.The sensor nodes were programmed to measure the temperature once per second and to send specificalert messages when levels highly correlated with wildfires are detected.
GND GND GND
33pF33pF100nF
27MHz
56k
GND GND
220pF220pF10nF10nF220pF 100nF
GNDGNDGNDGNDGND GNDGND
220pF
3.9p
F
8.2pF 5.6pF
220p
F
3.9pF
27nH
22nH 27nH
27nH
GND GNDGNDGND GND
GND
VD
D
MCU
ATTINY25V-10S
(MOSI/DI/SDA/AIN0/OC0A/OC1A/AREF/PCINT0)PB0 5
(MISO/DO/AIN1/OC0B/OC1A/PCINT1)PB1 6
(SCK/USCK/SCL/ADC1/T0/INT0/PCINT2)PB2 7
(XTAL1/CLKI/OC1B/ADC3/PCINT3)PB3 2
(XTAL2/CLKO/OC1B/ADC2/PCINT4)PB4 3
(RESET/DW/ADC0/PCINT5)PB5 1GND4VCC8
RF
CC1150
SCLK1
SO/GDO12
DVDD 3
DCOUPL4
XOSC15AVDD 6
XOSC27
GDO0/ATEST8
CS9RF-P 10
RF-N 11
AVDD 12
AVDD 13
RBIAS14
DGUARD 15
SI16
C1C2C3
Q1
R1
C4C5C6C7C8 C9
C10
C11
C12 C13
C14
C15
L1
L2 L3
L4
ANT
ANT-
VDD
GND
ISP
123456
GND
(a) (b)
Figure 7. Schematic of the sensor node prototype for laboratory testing (a); issues fixed (b):(1) add a temperature transducer with an interface circuit and (2) add a means to switch thesensor to deployment mode.
The sensor node has to support also a fast and error-proof field deployment procedure, as discussedin Section 3.1.3. Even if the field test was using just a few dozen sensors, it was worth defining andtesting from the beginning an effective field deployment procedure suitable for large applications, withhundreds or thousands of nodes that are deployed by personnel with no special WSN training.
These three items are especially important during the deployment of homogeneous sensors:
(1) the ID of the sensor node;(2) the quality of the reception of the sensor node messages by the gateways;(3) the field coordinates of the sensor node deployment spot.
The node deployment procedure should minimize human input, because the operators may only havelimited training and time. Thus, the automation of the procedure can significantly reduce deploymenterrors and cost.
For an efficient field deployment, it is very important to be able to selectively address the node tobe installed while other nodes are within comparable short distance (e.g., in the operator’s backpack).Relying on the operator to input the node ID can be very time consuming and error prone, so aninexpensive (component cost and energy) near field communication with the node to install is necessary.
For this purpose, we added a reedswitch in parallel with the NTC (see Figure 7b), which can beactivated using a magnet from a distance up to about 2 cm. When activated, the ADC will read 0 V asthe transducer output, which can be easily recognized, and temporarily switch the node to installation
Sensors 2015, 15 9502
mode. In this mode, the node sends a few messages prompting the gateways in range to generate specialacknowledgments that include the quality of the signal received from the node and the node ID. Thesedata can be displayed on a handheld device to provide immediate feedback to the operator on the qualityof the node installation position under evaluation. The handheld device can also determine the positionof the node using an on-board GPS receiver and send all of the data to the server once validated bythe operator.
This node installation flow requires minimum input from the operator, specifically:
• trigger the deployment mode of the node by rubbing a magnet on its case. This is an intuitive anderror-proof way to address the node under installation;
• read on a handheld device the quality of the current deployment position;• tap a button on the handheld display to validate the deployment and send the data to the server.
Because of the short time available to prepare the field test, we implemented this flow only partially.We mounted the reed switches on the sensor nodes and changed the gateway protocol to provide thereception quality in the acknowledgments. The handheld device was implemented using a modifiedgateway that was displaying only the lowest reception level of the gateways in range on three LEDs.
During normal operation, the sensor node periodically tests the on-board temperature transducer givenits importance for the detection of the fire. The node can detect short-circuits of the transducer (decodedas installation requests, as described above) and open-circuits. The node notifies to the gateways bothfaults in order to propagate them to the server which warns the operators about the fault.
Besides recognizing the extreme cases of short- and open-circuit, the selection of the temperaturethresholds for alerts is very important. Low thresholds ensure timely alerts, but they also increase thesensor susceptibility to false alerts triggered by natural phenomena, such as sensor heating by directexposure to sunlight. These considerations are especially important for fields with high solar exposure,as is the test field during summer time. After some testing, we decided that the fire alert threshold can beset to 60 ◦C and the threshold for warning of possible fire to a temperature increase rate of 1 ◦C/s.
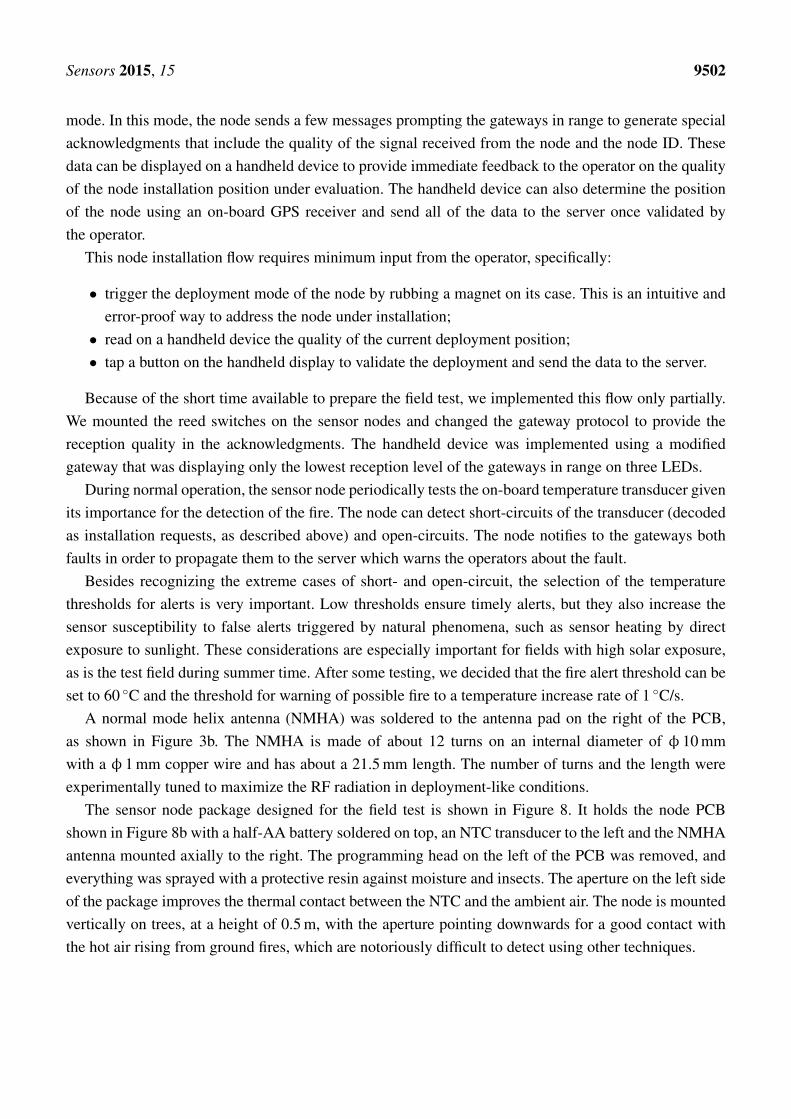
A normal mode helix antenna (NMHA) was soldered to the antenna pad on the right of the PCB,as shown in Figure 3b. The NMHA is made of about 12 turns on an internal diameter of φ 10 mmwith a φ 1 mm copper wire and has about a 21.5 mm length. The number of turns and the length wereexperimentally tuned to maximize the RF radiation in deployment-like conditions.
The sensor node package designed for the field test is shown in Figure 8. It holds the node PCBshown in Figure 8b with a half-AA battery soldered on top, an NTC transducer to the left and the NMHAantenna mounted axially to the right. The programming head on the left of the PCB was removed, andeverything was sprayed with a protective resin against moisture and insects. The aperture on the left sideof the package improves the thermal contact between the NTC and the ambient air. The node is mountedvertically on trees, at a height of 0.5 m, with the aperture pointing downwards for a good contact withthe hot air rising from ground fires, which are notoriously difficult to detect using other techniques.
Sensors 2015, 15 9503
(a) (b)
Figure 8. Sensor node package hosting the PCB, a half-AA battery and the normal modehelix antenna (NMHA) antenna. The aperture on the left improves the NTC thermalcontact (a); fixed on trees with screws (b).
5.2. Preparation of the Gateway for the Field Test
To reduce the cost, the gateway node prototype for laboratory tests (described in Section 4.3) isimplemented using resources that are typical for a WSN sensor node. The prototype can be used for thefield test, although it is not optimized for low energy, as we will show below.
The resources of the microcontroller are sufficient for the gateway tasks. However, more SRAM wouldallow it to aggregate additional field messages, reducing the frequency of connections to the server andthe energy consumption.
The transceiver for in-field communication is used to receive messages from sensor nodes and tocommunicate with peer gateways for health checks and to increase the availability of service, e.g.:
• in case of failure of the GPRS link of a gateway:
– it can send its field messages to peers, so that they forward them to the server;– send self-diagnostic data to the server through peers to provide the remote operators the
necessary information for corrective actions;
• failures of the field receiver would prevent the gateway from receiving hello messages frompeers; thus, the gateway would eventually declare all peers “missing”; however, since the peerswould regularly contact the server without reporting errors, this condition can be detected andappropriately flagged on the server;
• failures of the field transmitter would prevent the peers from receiving the gateway hellos, whichthey will report to the server; the faulty gateway itself would not report any anomaly.
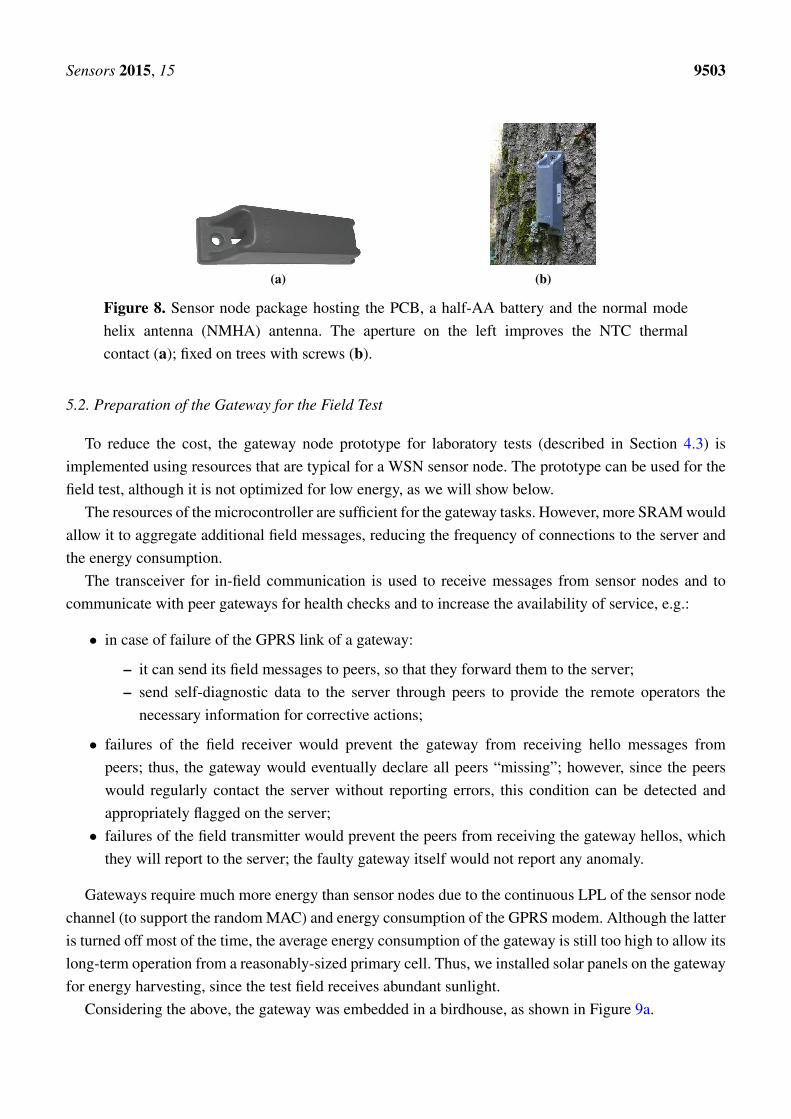
Gateways require much more energy than sensor nodes due to the continuous LPL of the sensor nodechannel (to support the random MAC) and energy consumption of the GPRS modem. Although the latteris turned off most of the time, the average energy consumption of the gateway is still too high to allow itslong-term operation from a reasonably-sized primary cell. Thus, we installed solar panels on the gatewayfor energy harvesting, since the test field receives abundant sunlight.
Considering the above, the gateway was embedded in a birdhouse, as shown in Figure 9a.
Sensors 2015, 15 9504
(a) The birdhouse has solar panels onthe roof and the gateway, battery andGPRSmodem in a sealed package atthe bottom. The antenna between thesolar panels has low RF performance.
(b) Gateway 2 is deployed inthe field high above the groundto improve its RF coverage. Theground of the test field is clean,facilitating navigation and sensordeployment and retrieval.
Figure 9. Gateway package elements (a) and field placement of Gateway 2 (b).
The solar panels for energy harvesting were placed on the roof, and the internal space of the birdhousewas divided horizontally into two compartments using a wooden separator. In the lower one were placedthe gateway, the rechargeable battery and the GPRS modem in a sealed plastic package. The antenna ofthe GPRS modem was left inside the plastic package, because the test field had good cellular coverage.The antenna for in-field UHF communications, a λ /4 whip, was kept inside the birdhouse for aestheticreasons. As expected, this position reduced the RF sensitivity, as we will discuss below.
5.3. Preparation of the Server for the Field Test
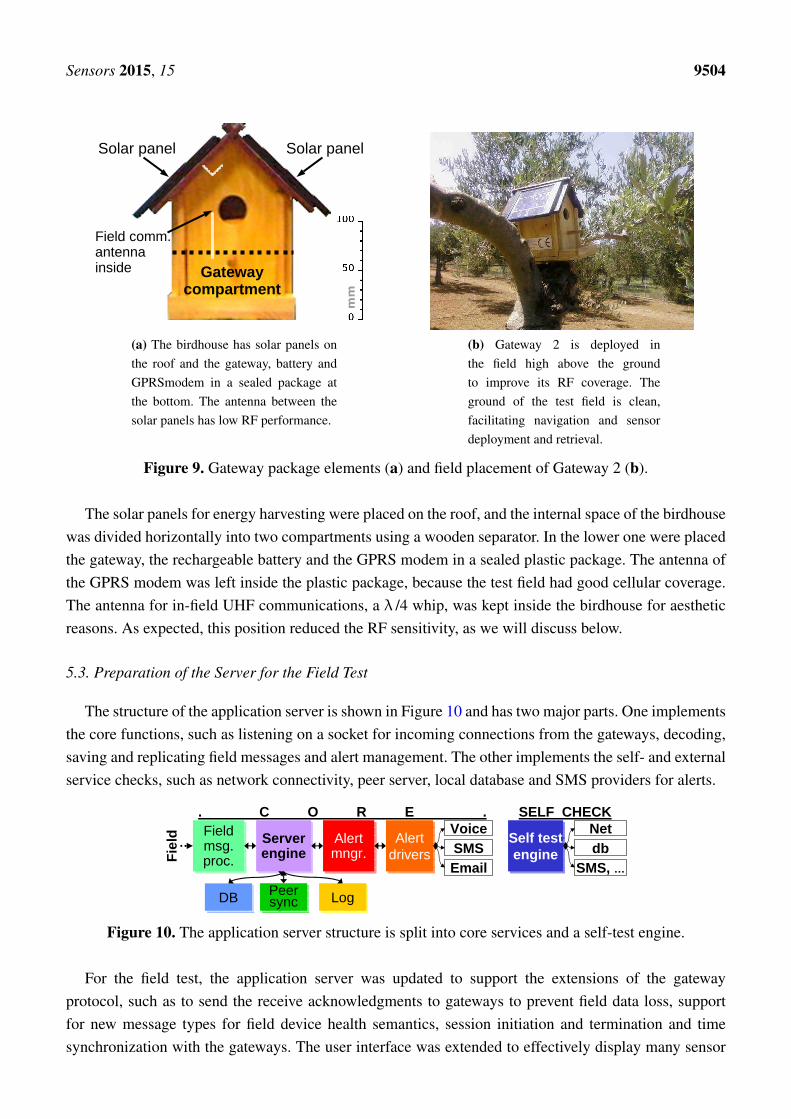
The structure of the application server is shown in Figure 10 and has two major parts. One implementsthe core functions, such as listening on a socket for incoming connections from the gateways, decoding,saving and replicating field messages and alert management. The other implements the self- and externalservice checks, such as network connectivity, peer server, local database and SMS providers for alerts.
Fieldmsg.proc.
Fieldmsg.proc.
Alertmngr.Alertmngr.
AlertdriversAlert
driversServerengineServerengine
DBDB LogLog
VoiceSMSEmail
Self testengine
Self testengine
PeersyncPeersync
Fie
ld
Netdb
SMS, …
. C O R E . SELF CHECK
Figure 10. The application server structure is split into core services and a self-test engine.
For the field test, the application server was updated to support the extensions of the gatewayprotocol, such as to send the receive acknowledgments to gateways to prevent field data loss, supportfor new message types for field device health semantics, session initiation and termination and timesynchronization with the gateways. The user interface was extended to effectively display many sensor
Sensors 2015, 15 9505
nodes with multiple health states, to improve responsiveness and usability and provide several operatorauthorization levels.
6. Field Test of the WSN Platform
Field deployment was scheduled on two days. On the first day, the field planning that was preparedin advance (remotely) was checked, followed by the actual field deployment. During the second day,the operation of the system was checked in the field for final tunings before commissioning to field test.Larger deployments may take more effort and time to complete, but they can follow the same sequenceof operations.
6.1. Field Deployment of the WSN Nodes
Because the system was experimental and the field was rather small, we decided to monitor allcommunications between the nodes during field deployment from a fixed location near the field, usinga modified gateway that was programmed to decode and display the messages as they were sent in thefield. To detect abnormal behaviors during deployment and to improve the procedure, the meaning ofthese messages was manually compared with the state of the field displayed by the server, which wasbuilt using the field information received from gateways.
6.1.1. Field Deployment of Gateway Nodes
The gateways were deployed in the locations shown in Figure 6. Gateways are always deployed beforesensor nodes for star topologies to allow checking the connectivity of the nodes during installation.
While the sensor node deployment procedure described in Section 5.1 provides the means to checkthe quality of its connectivity within the network, no such provision was made for the gateways, becauseof the short time we had to prepare the field test. The assessment of the quality of a gateway deploymentwould include cellular coverage for the GPRS modem, light exposure for energy harvesting and thecoverage of the sensor nodes in the field.
For this test deployment, we checked manually in the server log that the gateways were able tosuccessfully connect. Furthermore, we monitored the field messages in real time for reports of success (orerrors and retries) of the connection steps performed by the gateways: register with the cellular operator,access the GPRS service and open a socket with the server over the Internet.
The deployment places for the gateways were chosen so that one solar panel was roughly directedtowards south or on the east-west axis, and the sunlight was reaching them without major obstructions.Figure 9b shows an overview of part of the test field and the deployment position of Gateway 2.
6.1.2. Field Deployment of Sensor Nodes
Once the gateways were in place and operational, we started to deploy the 50 sensor nodes in thelocations shown in Figure 6 with the procedure described in Section 5.1. Due to the limited time we hadto prepare the field test, the deployment procedure was only partly automated. While the deploymentmode of the sensor nodes can be quickly activated using a magnet, the operator would still need to
Sensors 2015, 15 9506
manually record the node ID and position coordinates read from a handheld GPS. These operationsproved to be time-consuming and error-prone and required us to make several passes through the field torecheck node IDs and positions. Moreover, as can be seen in Figure 6, some positions were still slightlyout of the field (e.g., Sensor Nodes 2, 6, 7) due to the limited accuracy of the GPS receiver.
Using the node deployment procedure presented in Section 5.1 (only partly automated, as we havementioned), we needed about 4–5 min to install one sensor node in a relatively simple field (see Figures 6and 9b): the trees were well spaced and organized in rows; most ground vegetation and obstacles werecleared; and the GPS signal was received without the typical attenuation from dense tree crowns.
Nevertheless, it took us about four hours to deploy all 50 sensor nodes. This means that nodedeployment is generally effort intensive and can significantly increase the cost of larger applications.
6.2. Issues during Field Deployment
6.2.1. RF Range Issues
Although the size of the test field was relatively small compared to the communication range inideal conditions of about 17 km for the 433-MHz band with a 110 dBm link budget, we noticed duringdeployment that some nodes at more than 50–70 m from gateways were received little or not at all.
Several design decisions reduced the communication range. First, the placement of the gatewayantenna for field communications between the solar panels of the birdhouse (see Figure 9a) reducedits efficiency. We expected this, but aesthetic considerations prevailed, since we had not the time tomeasure the actual loss before the test. After the test, we measured about a 24–26 dBm loss, a penaltythat led us to install external sockets for all aerials in the new birdhouse project.
After the test, we discovered two additional RF attenuation causes on the PCB of the sensor node.As shown in Figure 3b, the antenna is just a few millimeters away from two large ferromagnetic items:the battery side seal and the case of the quartz crystal resonator. The typical loss of the NMHA is about6–8 dBm, but these two elements combined were adding about a 10 dBm loss. Thus, in the next versionof the sensor node PCB, we will use a different case for the crystal resonator and move the battery awayfrom the antenna to reduce its RF attenuation.
The layout of the baluns of both the sensor node and the gateway (shown in Figures 3a and 4a) wascompacted to reduce the size of the nodes, size being especially important for the sensor node. Oneof the purposes of the node prototype was to determine the loss of the compact balun layout, which wedetermined after the test to be around 3 dBm. Thus, we accepted the larger size of a straight balun layout.
The package of the sensor node (shown in Figure 8) was introducing an attenuation of about 2 dBm,but this cannot be easily avoided.
Another attenuation cause was due to terrain geometry. The test field shown in Figure 6 had a verygently slope at the bottom-left corner, almost imperceptible to the eye. To increase the sensitivity toheat released by ground fire, we installed the sensor nodes low on the tree trunks, about 0.5 m abovethe ground. The gateways, on the other hand, were placed higher in the trees to improve both energyharvesting from sunlight and RF reception from low-placed sensor nodes. However, Node 1 and, evenmore, Node 56 were attenuated too much by this small terrain undulation, which was easily discoveredby the checks performed during deployment. Thus, we decided to install the affected nodes higher, at
Sensors 2015, 15 9507
1 m from the ground. Nevertheless, this incident shows that even small terrain undulations may restrictthe coverage of the gateways, especially for distant nodes, and this should be taken into account whenchoosing the positions of the gateways in the field. We also decided to develop a repeater node that canbe deployed to improve the gateway coverage of the field.
In general, the deployment positions of the gateways on hilly terrain should be carefully analyzedduring planning. Nevertheless, there can always be propagation issues that are discovered only duringdeployment (e.g., due to fading from multipath propagation or obstacles). Some of these issues can befixed by changing the position of the sensors (a different position on the tree trunk, higher from theground or on a nearby tree). In other cases, we can always add a gateway to cover these areas or, evenbetter cost-wise, a repeater device.
6.2.2. Temperature Issues for Sensor Nodes
As the deployment of the sensor nodes progressed and the Sun approached the zenith, some of thesensor nodes waiting to be deployed started to send fire alerts. Apparently, this was because the nodeswere transported in a dark color backpack which excessively heated them while lying idle in directsunlight (the test field had only a few patches of shadow, as can be seen in Figure 9b).
Rising the alert threshold of the sensor nodes would avoid false alerts, but it would also reduce thedetection sensitivity of fires, delaying the alerts. Since timely alerting is an important feature of thesystem, we chose to revise the transport and deployment procedure to prevent sensor node overheating(e.g., by using lighter colors for packs during transport and avoiding extended exposure to sun heat).
6.3. Long-Run Test of the WSN Platform
After all nodes were deployed and the operation of all platform components was checked, the fieldtest started for two and a half months.
6.3.1. Gateway Issues during the Long-Run Test
Post-deployment checks missed a very important fault. The battery charging circuit of the GPRSmodem of Gateway 2 failed during deployment and was not charging the battery. We discovered thistoo late, after we left the field, because we were monitoring the battery voltage (measured by the GPRSmodem), and the potential vs. charge relationship, shown in Figure 11, has an extended, almost flatplateau that makes it difficult to determine changes in battery charge from voltage readings.
The battery charger of the modem of Gateway 2 may have failed because of overheating duringdeployment due to a combination of the following three factors. First, Gateway 2 was the first deployed,thus it received more sun heat, which increased its internal temperature. Second, it received andforwarded to the server most of the false fire alerts generated by the sensor nodes, which additionallyincreased the temperature of the modem. Third, since the solar panels were well illuminated, they werecharging the battery, thus increasing the temperature of the charging circuit even more.
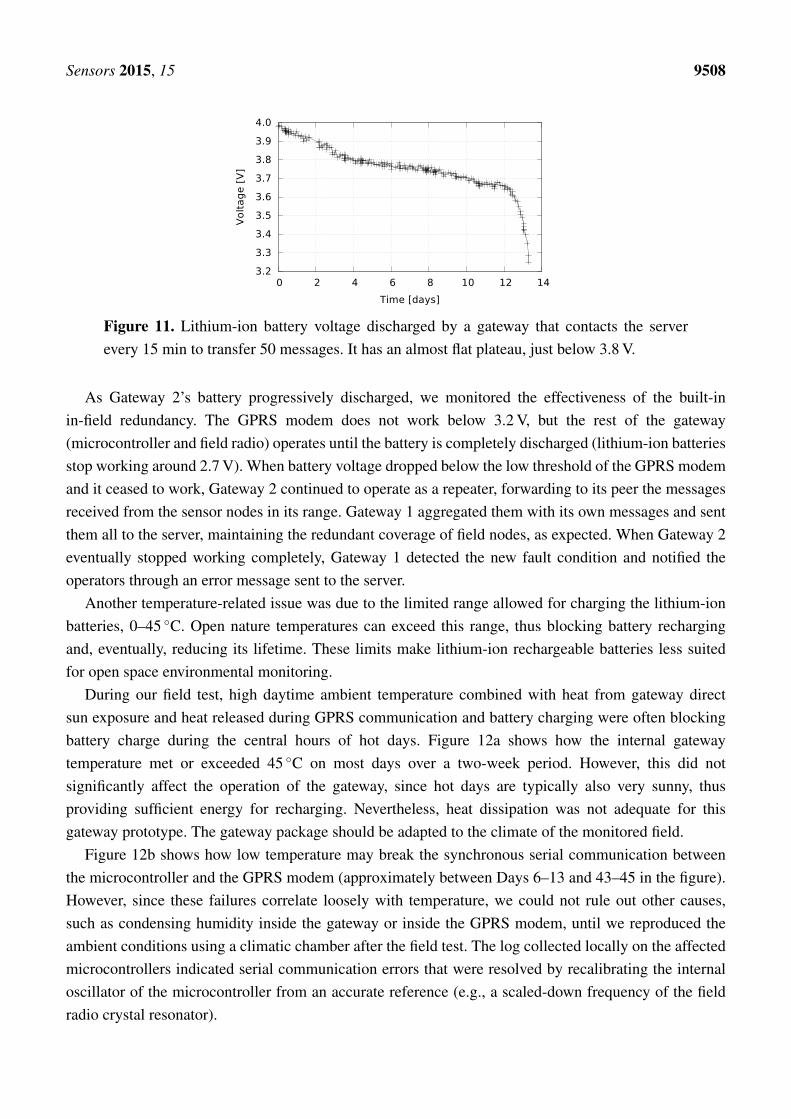
Sensors 2015, 15 9508
3.2
3.3
3.4
3.5
3.6
3.7
3.8
3.9
4.0
0 2 4 6 8 10 12 14
Volt
ag
e [
V]
Time [days]
Figure 11. Lithium-ion battery voltage discharged by a gateway that contacts the serverevery 15 min to transfer 50 messages. It has an almost flat plateau, just below 3.8 V.
As Gateway 2’s battery progressively discharged, we monitored the effectiveness of the built-inin-field redundancy. The GPRS modem does not work below 3.2 V, but the rest of the gateway(microcontroller and field radio) operates until the battery is completely discharged (lithium-ion batteriesstop working around 2.7 V). When battery voltage dropped below the low threshold of the GPRS modemand it ceased to work, Gateway 2 continued to operate as a repeater, forwarding to its peer the messagesreceived from the sensor nodes in its range. Gateway 1 aggregated them with its own messages and sentthem all to the server, maintaining the redundant coverage of field nodes, as expected. When Gateway 2eventually stopped working completely, Gateway 1 detected the new fault condition and notified theoperators through an error message sent to the server.
Another temperature-related issue was due to the limited range allowed for charging the lithium-ionbatteries, 0–45 ◦C. Open nature temperatures can exceed this range, thus blocking battery rechargingand, eventually, reducing its lifetime. These limits make lithium-ion rechargeable batteries less suitedfor open space environmental monitoring.
During our field test, high daytime ambient temperature combined with heat from gateway directsun exposure and heat released during GPRS communication and battery charging were often blockingbattery charge during the central hours of hot days. Figure 12a shows how the internal gatewaytemperature met or exceeded 45 ◦C on most days over a two-week period. However, this did notsignificantly affect the operation of the gateway, since hot days are typically also very sunny, thusproviding sufficient energy for recharging. Nevertheless, heat dissipation was not adequate for thisgateway prototype. The gateway package should be adapted to the climate of the monitored field.
Figure 12b shows how low temperature may break the synchronous serial communication betweenthe microcontroller and the GPRS modem (approximately between Days 6–13 and 43–45 in the figure).However, since these failures correlate loosely with temperature, we could not rule out other causes,such as condensing humidity inside the gateway or inside the GPRS modem, until we reproduced theambient conditions using a climatic chamber after the field test. The log collected locally on the affectedmicrocontrollers indicated serial communication errors that were resolved by recalibrating the internaloscillator of the microcontroller from an accurate reference (e.g., a scaled-down frequency of the fieldradio crystal resonator).
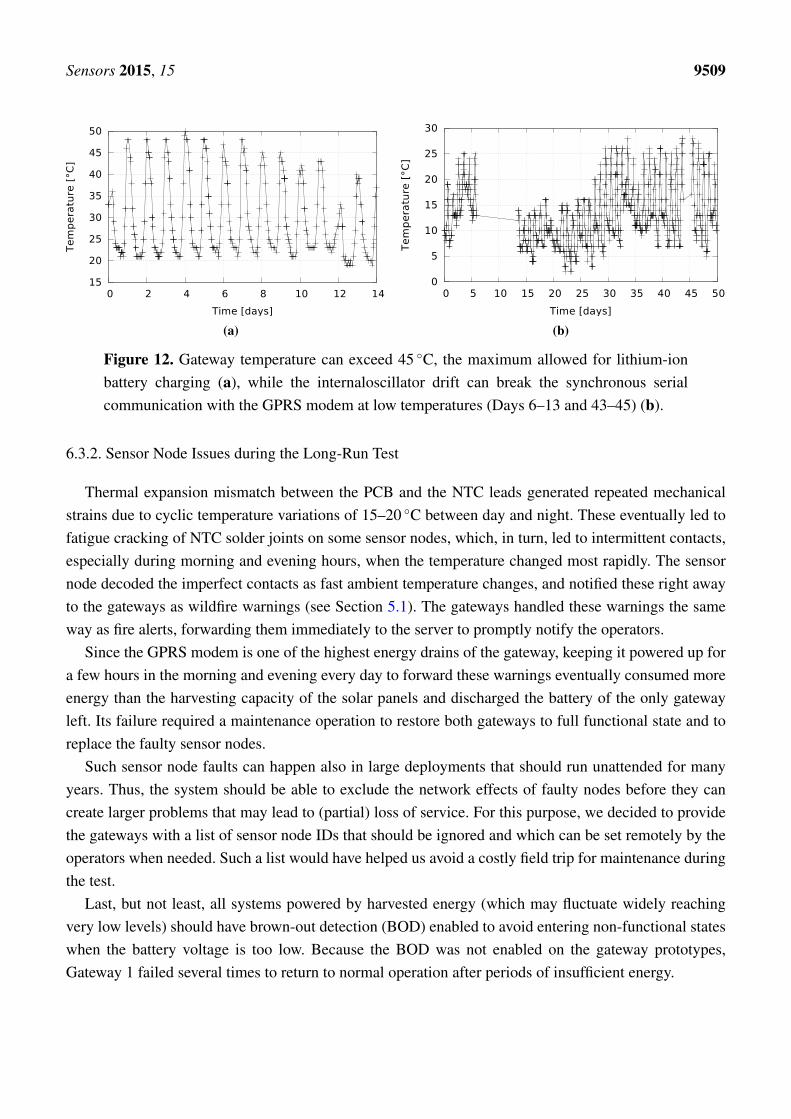
Sensors 2015, 15 9509
15
20
25
30
35
40
45
50
0 2 4 6 8 10 12 14
Te
mp
era
ture
[°C
]
Time [days]
(a)
0
5
10
15
20
25
30
0 5 10 15 20 25 30 35 40 45 50
Te
mp
era
ture
[°C
]
Time [days]
(b)
Figure 12. Gateway temperature can exceed 45 ◦C, the maximum allowed for lithium-ionbattery charging (a), while the internaloscillator drift can break the synchronous serialcommunication with the GPRS modem at low temperatures (Days 6–13 and 43–45) (b).
6.3.2. Sensor Node Issues during the Long-Run Test
Thermal expansion mismatch between the PCB and the NTC leads generated repeated mechanicalstrains due to cyclic temperature variations of 15–20 ◦C between day and night. These eventually led tofatigue cracking of NTC solder joints on some sensor nodes, which, in turn, led to intermittent contacts,especially during morning and evening hours, when the temperature changed most rapidly. The sensornode decoded the imperfect contacts as fast ambient temperature changes, and notified these right awayto the gateways as wildfire warnings (see Section 5.1). The gateways handled these warnings the sameway as fire alerts, forwarding them immediately to the server to promptly notify the operators.
Since the GPRS modem is one of the highest energy drains of the gateway, keeping it powered up fora few hours in the morning and evening every day to forward these warnings eventually consumed moreenergy than the harvesting capacity of the solar panels and discharged the battery of the only gatewayleft. Its failure required a maintenance operation to restore both gateways to full functional state and toreplace the faulty sensor nodes.
Such sensor node faults can happen also in large deployments that should run unattended for manyyears. Thus, the system should be able to exclude the network effects of faulty nodes before they cancreate larger problems that may lead to (partial) loss of service. For this purpose, we decided to providethe gateways with a list of sensor node IDs that should be ignored and which can be set remotely by theoperators when needed. Such a list would have helped us avoid a costly field trip for maintenance duringthe test.
Last, but not least, all systems powered by harvested energy (which may fluctuate widely reachingvery low levels) should have brown-out detection (BOD) enabled to avoid entering non-functional stateswhen the battery voltage is too low. Because the BOD was not enabled on the gateway prototypes,Gateway 1 failed several times to return to normal operation after periods of insufficient energy.

Sensors 2015, 15 9510
7. Conclusions and Future Work
In situ pervasive environmental monitoring for wildfires has important advantages, but the relativelyhigh area cost may limit its use. We have shown in this paper several domain-specific platformoptimizations that reduce the cost and increase its economic viability.
Sensor node hardware and a communication protocol optimized for application requirements canexceed 10 years of life time using a small, low-cost primary cell. Long node life significantly reduces thecost of the scheduled maintenance of the network, which can be important for large networks. The nodesand the communication protocol also speed up field deployment. The deployment procedure preventsmost human errors, significantly reducing the cost, especially for networks with a large number of nodes.
Field experiment preparation and unfolding highlighted several aspects that can improve the cost andreliability of the network components, their deployment, operation and maintenance.
Long-term direct node exposure to climatic conditions increases the failure probability. Additionally,large networks are more likely to experience node failures. As we have seen during the field experiment,failed nodes may adversely affect network operation or strain the resources of the gateways in range,increasing maintenance cost. Thus, it is important to increase node and network robustness during design,production testing, functional and self-test specifications and run-time monitoring.
As we have shown, node hardware design and production testing were not adequate for the fieldexperiment and led to several node failures. Accumulation of mechanical stress should be reducedby design and during production, since it compounds, e.g., with the stress from daily and seasonaltemperature variations or unforeseen mechanical interaction with wild animals. Manual solderingshould be avoided, since it can inadvertently create strains in solder joints in the interaction withcomponent leads.
Faulty nodes should be detected as soon as possible to reduce production costs, e.g., by runningspecific self-test programs at the end of the production line.
Lithium primary batteries have shelf lives in excess of 10 years. Compared to ambient energyharvesting techniques suitable for open nature, primary cells can reduce node cost, increase reliabilityand reduce node deployment complexity. These cells can supply very low power nodes cost effectivelyand maintenance free for more than 10 years, a life time suitable for many WSN applications.
Brown-out detectors may consume too much energy and should not be needed for long lifetime nodeswith soldered batteries. However, it is important to reset the nodes right after the battery is soldered toavoid leaving them in abnormal states that may excessively drain the battery.
Sensor node functions and a communication protocol carefully tailored to the applicationrequirements can bring important cost reductions. For instance, transmit-only nodes in star topologiescan reduce the protocol stack and relax the accuracy requirements for on-node timing. In turn,these reduce microcontroller resources and energy consumption, significantly lowering the cost ofcomponents, battery and node maintenance. However, without a receiver, the nodes cannot create meshtopologies to improve network robustness and to reduce transmit power. Thus, the cost and benefits ofsuch optimizations should be evaluated in the context of the specific application or application class.
Periodic node self-testing and automatic error recovery increase the reliability and the QoS of themonitoring platform, reducing maintenance requirements and cost. In case of critical failures (e.g., failing
Sensors 2015, 15 9511
contact with the NTC), the nodes may disable themselves after reporting the fault to avoid reporting falseevents or impairing the operation of the network or the gateway nodes, as we have witnessed during thefield experiment.
Small sensor node physical dimensions and protection from environmental conditions may reducethe RF efficiency in several ways. For instance, the antenna may end up too close to large ferromagneticbodies, like the battery side seal or the case of the quartz crystal resonator in our experiment. Whilewe could use a different case for the crystal resonator to avoid changing the node geometry, we had toincrease node length to leave enough distance between the antenna and the battery seal. Furthermore,protecting the antenna inside the node package reduced its efficiency by 2 dB, but we found nocost-effective way to avoid it. However, component cost is less important for gateways, and we planto install their antennas clear of the package or solar panel shielding, which have markedly reduced theirperformance during the field test.
Changes in gateway behavior in the case of failures (e.g., GPRS link or field radio receiver failures)need to be detected at the gateway or network level and reported to network operators to schedulecorrective actions. Remote configuration or reprogramming should be available, at least for the gateways,in order to be able to remotely add functions, correct errors or protect the network against occasionalfaulty node behavior. As we have seen during the field experiment, this feature would have spared us anunscheduled maintenance, whose cost can be important for remote fields or large networks.
Nodes that store field messages before forwarding (e.g., gateway nodes) should implement suitablein-field redundancy to avoid loss in case of self-reset or failure. Additionally, we plan to implement asave-restore function on gateways to preserve node data across watchdog-triggered resets.
Gateway nodes handle higher energies, which can generate significant heat, both during harvestingand consumption peaks (e.g., during GPRS data connections with the server). Thus, as we haveseen during the field experiment, an adequate thermal dimensioning considering the climate andthe internal and external heat sources is important. For some applications, we may consider otherenergy accumulation techniques instead of the widely-used lithium-ion batteries, which have limitedcharge-discharge cycles and temperature restrictions for charging and operation.
We also consider redesigning the power supply of the gateways to automatically switch to a primarycell whenever the harvested energy reserves are too low, to increase the node QoS. Unlike the sensornodes, which are reliably supplied by the battery soldered on-board, the energy reserves of the gatewayscan fluctuate due to unpredictable harvesting and consumption patterns. Moreover, the rechargeablebatteries can be changed when they loose storage capacity. Hence, the use of the embedded brown-outdetector can considerably improve gateway stability.
The field experiment showed us that the deployment of the network can be very time-consuming, evenfor networks with just a few dozens of nodes. Thus, the procedure should be simple and automated asmuch as possible to be accessible to domain operators, to reduce human errors and cost. Nevertheless,it should allow one to thoroughly check the quality of node installations, since RF propagation in opennature can be unpredictable, not the least due to small and difficult to notice terrain features. We planto improve the user interface of the handheld installation device, automate position collection and datareporting and extend it to the installation of the gateways. For the latter, it should assess cellular coveragefor the GPRS modem, light exposure for energy harvesting and the coverage of the sensor nodes in the
Sensors 2015, 15 9512
field. We also decided to develop a repeater node that can improve gateway coverage of the field indifficult propagation conditions.
WSN platform design, development and maintenance has a high cost, which can be recovered fasterif the platform can be reused for several related application domains. While the sensor nodes do nothave sufficient resources to support an IP-based protocol, the gateways are IP-enabled, albeit theyare sporadically connected. The server, however, is always accessible over the Internet, and in futureversions, it can implement suitable interfaces (e.g., based on OGC R© Sensor Web Enablement [91–94])to facilitate the discovery and access to sensor and field data by authorized IoT applications.
Acknowledgments
Most part of this work was done in collaboration with Minteos (Minteos s.r.l.http://www.minteos.com/) and the Artemis WSN-DPCM project. The company contributed mostly toapplication specification, field testing and production.
Conflicts of Interest
The authors declare no conflict of interest.
References
1. Ashton, K. That “Internet of Things” Thing. Expert View, RFID Journal, 2009. Available online:http://www.rfidjournal.com/article/view/4986 (accessed on 17 April 2015).
2. Oppermann, F.; Boano, C.; Römer, K. A Decade of Wireless Sensing Applications: Surveyand Taxonomy. In The Art of Wireless Sensor Networks; Ammari, H.M., Ed.; Signals andCommunication Technology, Springer: Berlin/Heidelberg, Germany, 2014; pp. 11–50.
3. Romer, K.; Mattern, F. The design space of wireless sensor networks. IEEE Wirel. Commun. 2004,11, 54–61.
4. Corke, P.; Wark, T.; Jurdak, R.; Hu, W.; Valencia, P.; Moore, D. Environmental Wireless SensorNetworks. IEEE Proc. 2010, 98, 1903–1917.
5. Rault, T.; Bouabdallah, A.; Challal, Y. Energy efficiency in wireless sensor networks: A top-downsurvey. Comput. Netw. 2014, 67, 104–122.
6. Strazdins, G.; Elsts, A.; Nesenbergs, K.; Selavo, L. Wireless Sensor Network Operating SystemDesign Rules Based on Real-World Deployment Survey. J. Sens. Actuator Netw. 2013, 2, 509–556.
7. Harrop, P.; Das, R. Wireless Sensor Networks 2010–2020; Technical Report; IDTechEx Ltd:Cambridge, UK, 2010.
8. Rousselot, J.; Dallemagne, P.; Decotignie, J. Deployments of wireless sensor networks performedby CSEM. In Proceedings of the COGIS 2009—COGnitive Systems with Interactive SensorsConference, Paris, France, 16–18 November 2009.
9. Kumagai, Y.; Carroll, M.S.; Cohn, P. Coping with Interface Wildfire as a Human Event: Lessonsfrom the Disaster/Hazards Literature. J. For. 2004, 102, 28–32.
10. Stephens, S.L. Forest fire causes and extent on United States Forest Service lands. Int. J.Wildland Fire 2005, 14, 213–222.
Sensors 2015, 15 9513
11. Genton, M.G.; Butry, D.T.; Gumpertz, M.L.; Prestemon, J.P. Spatio-temporal analysis of wildfireignitions in the St Johns River water management district, Florida. Int. J. Wildland Fire 2006, 15,87–97.
12. Arvai, J.; Gregory, R.; Ohlson, D.; Blackwell, B.; Gray, R. Letdowns, wake-up calls, andconstructed preferences: People’s responses to fuel and wildfire risks. J. For. 2006, 104, 173–181.
13. Leone, V.; Lovreglio, R.; Martín, M.P.; Martínez, J.; Vilar, L. Human Factors of Fire Occurrencein the Mediterranean. In Earth Observation of Wildland Fires in Mediterranean Ecosystems;Chuvieco, E., Ed.; Springer: Berlin Heidelberg, Germany, 2009; pp. 149–170.
14. Shroder, J.F.; Paton, D. Wildfire Hazards, Risks, and Disasters; Elsevier: Philadelphia, PA, USA,2014.
15. Salis, M.; Arca, B.; Ager, A.; Fois, C.; Bacciu, V.; Duce, P.; Spano, D. Extreme Wildfire Spread andBehaviour: Case Studies from North Sardinia, Italy. In Proceedings of the EGU General AssemblyConference, Vienna, Austria, 22–27 April 2012; Volume 14.
16. Hefeeda, M.; Bagheri, M. Forest fire modeling and early detection using wireless sensor networks.Ad Hoc Sens. Wirel. Netw. 2009, 7, 169–224.
17. Stipanicev, D.; Štula, M.; Krstinic, D.; Šeric, L.; Jakovcevic, T.; Bugaric, M. Advanced automaticwildfire surveillance and monitoring network. In Proceedings of the VI International Conferenceon Forest Fire Research, Coimbra, Portugal, 15–18 November 2010; pp. 15–18.
18. Šeric, L.; Stipanicev, D.; Štula, M. Observer network and forest fire detection. Inf. Fusion 2011,12, 160–175.
19. Ma, L.; Wu, K.; Zhu, L. Fire Smoke Detection in Video Images Using Kalman Filter andGaussian Mixture Color Model. In Proceedings of the International Conference on ArtificialIntelligence and Computational Intelligence, Sanya, China, 23–24 October 2010; Volume 1,pp. 484–487.
20. Tsiourlis, G.; Andreadakis, S.; Konstantinidis, P. SITHON: A Wireless Network of in Situ OpticalCameras Applied to the Early Detection-Notification-Monitoring of Forest Fires. Sensors 2009,9, 4465–4482.
21. Arrue, B.; Ollero, A.; Matinez de Dios, J. An intelligent system for false alarm reduction in infraredforest-fire detection. IEEE Intell. Syst. Their Appl. 2000, 15, 64–73.
22. Yoon, S.H. An intelligent automatic early detection system of forest fire smoke signatures usingGaussian mixture model. J. Inf. Process. Syst. 2013, 9, 621–632.
23. He, L.; Li, Z. Enhancement of a fire detection algorithm by eliminating solar reflection in themid-IR band: Application to AVHRR data. Int. J. Remote Sens. 2012, 33, 7047–7059.
24. Çetin, A.E.; Dimitropoulos, K.; Gouverneur, B.; Grammalidis, N.; Günay, O.; Habiboglu, Y.H.;Töreyin, B.U.; Verstockt, S. Video fire detection—A review. Digit. Signal Process. 2013, 23,1827–1843.
25. Vodacek, A.; Kremens, R.L.; Fordham, A.J.; Vangorden, S.C.; Luisi, D.; Schott, J.R.; Latham, D.J.Remote optical detection of biomass burning using a potassium emission signature. Int. J.Remote Sens. 2002, 23, 2721–2726.
26. Dennison, P.E. Fire detection in imaging spectrometer data using atmospheric carbon dioxideabsorption. Int. J. Remote Sens. 2006, 27, 3049–3055.

Sensors 2015, 15 9514
27. Veraverbeke, S.; Stavros, E.N.; Hook, S.J. Assessing fire severity using imaging spectroscopydata from the Airborne Visible/Infrared Imaging Spectrometer (AVIRIS) and comparison withmultispectral capabilities. Remote Sens. Environ. 2014, 154, 153–163.
28. Utkin, A.B.; Fernandes, A.; Simões, F.; Lavrov, A.; Vilar, R. Feasibility of forest-fire smokedetection using lidar. Int. J. Wildland Fire 2003, 12, 159–166.
29. Lavrov, A.; Utkin, A.B.; Vilar, R.; Fernandes, A. Evaluation of smoke dispersion from forest fireplumes using lidar experiments and modelling. Int. J. Therm. Sci. 2006, 45, 848–859.
30. Utkin, A.B.; Piedade, F.; Beixiga, V.; Mota, P.; Lousã, P. Scalable lidar technique for fire detection.Proc. SPIE 2014, 9286, 92860D–92860D–12.
31. Sahin, Y.G.; Ince, T. Early Forest Fire Detection Using Radio-Acoustic Sounding System. Sensors2009, 9, 1485–1498.
32. Stipanicev, D. Intelligent Forest Fire Monitoring System—From idea to realization. In Annual2010/2011 of the Croatian Academy of Engineering; Kluwer Academic Publishers: Hingham, MA,USA, 2012.
33. Surit, S.; Chatwiriya, W. Forest Fire Smoke Detection in Video Based on Digital Image ProcessingApproach with Static and Dynamic Characteristic Analysis. In Proceedings of the 2011 FirstACIS/JNU International Conference on Computers, Networks, Systems and Industrial Engineering(CNSI), Jeju, Island, 23–25 May 2011; pp. 35–39.
34. Stula, M.; Krstinic, D.; Seric, L. Intelligent forest fire monitoring system. Inf. Syst. Front. 2012,14, 725–739.
35. Owayjan, M.; Freiha, G.; Achkar, R.; Abdo, E.; Mallah, S. Firoxio: Forest fire detection and alertingsystem. In Proceedings of the IEEE Mediterranean Electrotechnical Conference (MELECON),Beirut, Lebanon, 13–16 April 2014; pp. 177–181.
36. Mazzeo, G.; Filizzola, C.; Coviello, I.; Marchese, F.; Corrado, R.; Lacava, T.; Paciello, R.; Pergola,N.; Tramutoli, V. Performance assessment of a Robust Satellite Techniques (RST-FIRES) for forestfire detection and monitoring. In Proceedings of the EGU General Assembly Conference, Vienna,Austria, 22–27 April 2012; Volume 14.
37. Milz, M.; Rymdteknik, A. Study on Forest Fire Detection with Satellite Data; Working Paper;Luleås Tekniska Universitet: LULEA, Sweden, 2013.
38. Schroeder, W.; Ruminski, M.; Csiszar, I.; Giglio, L.; Prins, E.; Schmidt, C.; Morisette, J. Validationanalyses of an operational fire monitoring product: The Hazard Mapping System. Int. J.Remote Sens. 2008, 29, 6059–6066.
39. Phan, C.; Liu, H. A cooperative UAV/UGV platform for wildfire detection and fighting.In Proceedings of the Asia Simulation Conference—7th International Conference on SystemSimulation and Scientific Computing, Beijing, China, 10–12 October 2008; pp. 494–498.
40. Ambrosia, V.G.; Wegener, S.; Zajkowski, T.; Sullivan, D.V.; Buechel, S.; Enomoto, F.; Lobitz, B.;Johan, S.; Brass, J.; Hinkley, E. The Ikhana unmanned airborne system (UAS) western states fireimaging missions: from concept to reality (2006–2010). Geocarto Int. 2011, 26, 85–101.
41. Merino, L.; Caballero, F.; Martínez-de Dios, J.R.; Maza, I.; Ollero, A. An Unmanned AircraftSystem for Automatic Forest Fire Monitoring and Measurement. J. Intell. Robot. Syst. 2012, 65,533–548.
Sensors 2015, 15 9515
42. Katzis, K.; Grondoudis, A.; Boustras, G.; Papazoglou, P. Forest fires: Proactive andreactive surveillance employing in-situ, aerial, and space technology. Proc. SPIE 2013, 8795,87951K–87951K–11.
43. Navarro, M.; Davis, T.W.; Villalba, G.; Li, Y.; Zhong, X.; Erratt, N.; Liang, X.; Liang, Y. TowardsLong-Term Multi-Hop WSN Deployments for Environmental Monitoring: An ExperimentalNetwork Evaluation. J. Sens. Actuator Netw. 2014, 3, 297–330.
44. Kosucu, B.; Irgan, K.; Kucuk, G.; Baydere, S. FireSenseTB: A Wireless Sensor NetworksTestbed for Forest Fire Detection. In Proceedings of the 2009 International Conference on WirelessCommunications and Mobile Computing: Connecting the World Wirelessly, Leipzig, Germany,21–24 June 2009; pp. 1173–1177.
45. Isaac, S.; Hancke, G.; Madhoo, H.; Khatri, A. A survey of wireless sensor network applicationsfrom a power utility’s distribution perspective. In Proceedings of the AFRICON, Livingstone,Zambia, 13–15 September 2011; pp. 1–5.
46. Rosi, A.; Berti, M.; Bicocchi, N.; Castelli, G.; Corsini, A.; Mamei, M.; Zambonelli, F. Landslidemonitoring with sensor networks: Experiences and lessons learnt from a real-world deployment.Int. J. Sens. Netw. 2011, 10, 111–122.
47. Strazdins, G.; Elsts, A.; Nesenbergs, K.; Selavo, L. Wireless Sensor Network Operating SystemDesign Rules Based on Real-World Deployment Survey. J. Sens. Actuator Netw. 2013, 2, 509–556.
48. Bouabdellah, K.; Noureddine, H.; Larbi, S. Using Wireless Sensor Networks for Reliable ForestFires Detection. Procedia Comput. Sci. 2013, 19, 794–801.
49. Bahrepour, M.; Meratnia, N.; Havinga, P. Automatic Fire Detection: A Survey from WirelessSensor Network Perspective; Technical Report TR-CTIT-08-73; University of Twente, Centre forTelematics and Information Technology: Enschede, The Netherlands, 2008.
50. Teguh, R.; Honma, T.; Usop, A.; Shin, H.; Igarashi, H. Detection and Verification of PotentialPeat Fire Using Wireless Sensor Network and UAV. In Proceedings of the International ConferenceInformation Technology and Electrical Engineering, Yogyakarta, Indonesia, 12 July 2012; pp. 6–10.
51. Sanchez-Matamoros, J.; Dios, J.d.; Ollero, A. Cooperative localization and tracking with acamera-based WSN. In Proceedings of the IEEE International Conference on Mechatronics,Malaga, Spain, 14–17 April 2009; pp. 1–6.
52. Aslan, Y.E.; Korpeoglu, I.; Ulusoy, Ö. A framework for use of wireless sensor networks in forestfire detection and monitoring. Comput. Environ. Urban Syst. 2012, 36, 614–625.
53. Kovács, Z.G.; Marosy, G.E.; Horváth, G. Case study of a simple, low power WSN implementationfor forest monitoring. In Proceedings of the 12th Biennial Baltic Electronics Conference (BEC),Tallinn, Estonia, 4–6 October 2010; pp. 161–164.
54. Bayo, A.; Antolin, D.; Medrano, N.; Calvo, B.; Celma, S. Development of a Wireless SensorNetwork System for Early Forest Fire Detection. In Proceedings of the 2010 European Workshopon Smart Objects: Systems, Technologies and Applications (RFID Sys Tech), Ciudad, Spain, 15–16June 2010; pp. 1–7.
55. Lazarescu, M.T. Design of a WSN Platform for Long-Term Environmental Monitoring for IoTApplications. IEEE J. Emerg. Sel. Top. Circuits Syst. 2013, 3, 45–54.

Sensors 2015, 15 9516
56. Fierens, P.I. Number of wireless sensors needed to detect a wildfire. Int. J. Wildland Fire 2009,18, 625–629.
57. Bogue, R. Sensors for fire detection. Sens. Rev. 2013, 33, 99–103.58. Fernández-Berni, J.; Carmona-Galán, R.; Leñero-Bardallo, J.A.; Kleihorst, R.;
Rodríguez-Vázquez, Á. Towards an Ultra-Low-Power Low-Cost Wireless Visual Sensor Nodefor Fine-Grain Detection of Forest Fires; Imprensa da Universidade de Coimbra: Coimbra,Portugal, 2014.
59. Lloret, J.; Garcia, M.; Bri, D.; Sendra, S. A wireless sensor network deployment for rural and forestfire detection and verification. Sensors 2009, 9, 8722–8747.
60. Cheong, P.; Chang, K.F.; Lai, Y.H.; Ho, S.K.; Sou, I.K.; Tam, K.W. A ZigBee-Based WirelessSensor Network Node for Ultraviolet Detection of Flame. IEEE Trans. Ind. Electron. 2011, 58,5271–5277.
61. Manolakos, E.; Logaras, E.; Paschos, F. Wireless Sensor Network Application for Fire HazardDetection and Monitoring. In Sensor Applications, Experimentation, and Logistics; Lecture Notesof the Institute for Computer Sciences, Social Informatics and Telecommunications Engineering;Komninos, N., Ed.; Springer: Berlin/Heidelberg, Germany, 2010; Volume 29, pp. 1–15.
62. Shixing, L.; Defeng, T.; Yongming, Z. Multiparameter fire detection based on wireless sensornetwork. In Proceedings of the IEEE International Conference on Intelligent Computing andIntelligent Systems, Shanghai, China, 20–22 November 2009; Volume 3, pp. 203–206.
63. Zervas, E.; Mpimpoudis, A.; Anagnostopoulos, C.; Sekkas, O.; Hadjiefthymiades, S. Multisensordata fusion for fire detection. Inf. Fusion 2011, 12, 150–159.
64. Sathik, M.M.; Mohamed, M.S.; Balasubramanian, A. Fire detection using support vector machinein wireless sensor network and rescue using pervasive devices. Int. J. Adv. Netw. Appl. 2010,2, 636–639.
65. Soliman, H.; Sudan, K.; Mishra, A. A smart forest-fire early detection sensory system: Anotherapproach of utilizing wireless sensor and neural networks. In Proceedings of IEEE SensorsConference, Kona, HI, USA, 1–4 November 2010; pp. 1900–1904.
66. Bahrepour, M.; Meratnia, N.; Havinga, P. Sensor fusion-based event detection in Wireless SensorNetworks. In Proceedings of the Annual International Mobile and Ubiquitous Systems: NetworkingServices, Toronto, ON, Canada, 13–16 July 2009; pp. 1–8.
67. Somov, A.; Spirjakin, D.; Ivanov, M.; Khromushin, I.; Passerone, R.; Baranov, A.; Savkin, A.Combustible Gases and Early Fire Detection: An Autonomous System for Wireless SensorNetworks. In Proceedings of the 1st International Conference on Energy-Efficient Computing andNetworking, Passau, Germany, 13–15 April 2010; pp. 85–93.
68. Hartung, C.; Han, R.; Seielstad, C.; Holbrook, S. FireWxNet: A Multi-tiered Portable WirelessSystem for Monitoring Weather Conditions in Wildland Fire Environments. In Proceedings of the4th International Conference on Mobile Systems, Applications and Services, Uppsala, Sweden,19–22 June 2006; pp. 28–41.
69. Bapat, S.; Kulathumani, V.; Arora, A. Analyzing the yield of ExScal, a large-scale wireless sensornetwork experiment. In Proceedings of the IEEE International Conference on Network Protocols,Boston, MA, USA, 6–9 November 2005; p. 10.
Sensors 2015, 15 9517
70. Dutta, P.; Hui, J.; Jeong, J.; Kim, S.; Sharp, C.; Taneja, J.; Tolle, G.; Whitehouse, K.; Culler, D. Trio:Enabling Sustainable and Scalable Outdoor Wireless Sensor Network Deployments. In Proceedingsof the 5th International Conference on Information Processing in Sensor Networks, Nashville, TN,USA, 19–21 April 2006; pp. 407–415.
71. Wark, T.; Hu, W.; Corke, P.; Hodge, J.; Keto, A.; Mackey, B.; Foley, G.; Sikka, P.;Brunig, M. Springbrook: Challenges in developing a long-term, rainforest wireless sensor network.In Proceedings of the International Conference on Intelligent Sensors, Sensor Networks andInformation Processing, Sydney, NSW, Australia, 15–18 December 2008; pp. 599–604.
72. Neubauer, B.; Sidén, J.; Olofsson, C.; Gulliksson, M.; Koptyug, A.; Nilsson, H.E.; Norgren, M.A new thermally activated battery cellbased forest fire detection and monitoring system.Model. Monit. Manag. For. Fires III 2012, 158, doi:10.2495/FIVA120101.
73. Tu, Y.F. Assessment of the Current False Alarm Situation from Fire Detection Systems in NewZealand and the Development of an Expert System for Their Identifications; Research Report02/10; University of Canterbury, Civil Engineering: Christchurch, New Zealand, 2002.
74. Díaz-Ramírez, A.; Tafoya, L.A.; Atempa, J.A.; Mejía-Alvarez, P. Wireless Sensor Networks andFusion Information Methods for Forest Fire Detection. Procedia Technol. 2012, 3, 69–79.
75. Sudevalayam, S.; Kulkarni, P. Energy Harvesting Sensor Nodes: Survey and Implications.Commun. Surv. Tutor. 2011, 13, 443–461.
76. Bandyopadhyay, S.; Chandrakasan, A. Platform architecture for solar, thermal and vibration energycombining with MPPT and single inductor. In Proceedings of the VLSI Circuits, VLSIC, Honolulu,HI, USA, 15–17 June 2011; pp. 238–239.
77. Cano, C.; Bellalta, B.; Sfairopoulou, A.; Barcelo, J. A low power listening MAC with scheduledwake up after transmissions for WSNs. Commun. Lett. 2009, 13, 221–223.
78. El-Hoiydi, A. Aloha with preamble sampling for sporadic traffic in ad hoc wireless sensor networks.IEEE Int. Conf. Commun. 2002; 5, 3418–3423.
79. Watteyne, T.; Vilajosana, X.; Kerkez, B.; Chraim, F.; Weekly, K.; Wang, Q.; Glaser, S.; Pister, K.OpenWSN: A standards-based low-power wireless development environment. Trans. Emerg.Telecommun. Technol. 2012, 23, 480–493.
80. Kuorilehto, M.; Kohvakka, M.; Suhonen, J.; Hämäläinen, P.; Hännikäinen, M.; Hämäläinen, T.D.Ultra-Low Energy Wireless Sensor Networks in Practice; John Wiley & Sons, Ltd: New York, NY,USA, 2007.
81. Liu, Y.; He, Y.; Li, M.; Wang, J.; Liu, K.; Mo, L.; Dong, W.; Yang, Z.; Xi, M.; Zhao, J.; Li, X.Y.Does wireless sensor network scale? A measurement study on GreenOrbs. In Proceedings of theIEEE INFOCOM, Shanghai, China, 10–15 April 2011; pp. 873–881.
82. Rahman, F.; Devanbu, P. How, and Why, Process Metrics Are Better. In Proceedings of the 2013International Conference on Software Engineering, San Francisco, CA, USA, 18–26 May 2013;pp. 432–441.
83. Sun, D.; Lu, J.; Wang, W.; Lin, Z. Design of WSN nodes and network performance analysis in a teaplantation. In Proceedings of IET International Conference on Wireless Sensor Network, Beijing,China, 15–17 November 2010; pp. 144–147.

Sensors 2015, 15 9518
84. Micek, J.; Kapitulik, J. WSN sensor node for protected area monitoring. In Proceedings of2012 Federated Conference on Computer Science and Information Systems (FedCSIS), Wroclaw,Poland, 9–12 September 2012; pp. 803–807.
85. Flickenger, R.; Okay, S.; Pietrosemoli, E.; Zennaro, M.; Fonda, C. Very long distance Wi-Finetworks. In Proceedings of the Second ACM SIGCOMM Workshop on Networked Systems forDeveloping Regions, Seattle, WA, USA, 17–22 August 2008; pp. 1–6.
86. Celandroni, N.; Ferro, E.; Gotta, A.; Oligeri, G.; Roseti, C.; Luglio, M.; Bisio, I.; Cello, M.; Davoli,F.; Panagopoulos, A.D.; et al. A survey of architectures and scenarios in satellite-based wirelesssensor networks: System design aspects. Int. J. Satell. Commun. Netw. 2013, 31, 1–38.
87. Raman, B.; Chebrolu, K. Censor networks: A critique of “sensor networks” from a systemsperspective. SIGCOMM Comput. Commun. Rev. 2008, 38, 75–78.
88. Boan, J. Radio Experiments With Fire. IEEE Antennas Wirel. Propag. Lett. 2007, 6, 411–414.89. Figueiredo, C.; Nakamura, E.; Ribas, A.; de Souza, T.; Barreto, R. Assessing the communication
performance of wireless sensor networks in rainforests. In Proceedings of 2009 2nd IFIP WirelessDays (WD), Paris, France, 15–17 December 2009; pp. 1–6.
90. SystemC. Available online: http://www.systemc.org/ (accessed on 17 April 2015).91. Reed, C.; Botts, M.; Davidson, J.; Percivall, G. OGC R© sensor web enablement: overview and
high level achhitecture. In Proceedings of the IEEE Autotestcon, Baltimore, MD, USA, 17–20September 2007; pp. 372–380.
92. Botts, M.; Percivall, G.; Reed, C.; Davidson, J. OGC R© Sensor Web Enablement: Overview andHigh Level Architecture. In GeoSensor Networks; Lecture Notes in Computer Science; Nittel, S.,Labrinidis, A., Stefanidis, A., Eds.; Springer: Berlin Heidelberg, Germany, 2008; Volume 4540,pp. 175–190.
93. Jirka, S.; Bröring, A.; Stasch, C. Discovery Mechanisms for the Sensor Web. Sensors 2009,9, 2661–2681.
94. Rouached, M.; Baccar, S.; Abid, M. RESTful Sensor Web Enablement Services for Wireless SensorNetworks. In Proceedings of the IEEE Eighth World Congress on Services, Honolulu, HI, USA,24–29 June 2012; pp. 65–72.
c© 2015 by the author; licensee MDPI, Basel, Switzerland. This article is an open access articledistributed under the terms and conditions of the Creative Commons Attribution license(http://creativecommons.org/licenses/by/4.0/).