electrochemical and surface plasmon - ShareOK
160
ELECTROCHEMICAL AND SURFACE PLASMON BIOASSAYS FOR CIRCULATING BIOMARKERS By ALUTH GEDARA GAYAN CHANDIMA PREMARATNE Bachelor of Science St. Joseph’s College of Arts and Science (Affiliated to Bangalore University) Bangalore, India 2010 Master of Science in Analytical Chemistry University of Colombo Colombo, Sri Lanka 2014 Submitted to the Faculty of the Graduate College of the Oklahoma State University in partial fulfillment of the requirements for the Degree of DOCTOR OF PHILOSOPHY July, 2018
-
Upload
khangminh22 -
Category
Documents
-
view
0 -
download
0
Transcript of electrochemical and surface plasmon - ShareOK

i
ELECTROCHEMICAL AND SURFACE PLASMON
BIOASSAYS FOR CIRCULATING BIOMARKERS
By
ALUTH GEDARA GAYAN CHANDIMA
PREMARATNE
Bachelor of Science
St. Joseph’s College of Arts and Science
(Affiliated to Bangalore University)
Bangalore, India
2010
Master of Science in Analytical Chemistry
University of Colombo
Colombo, Sri Lanka
2014
Submitted to the Faculty of the
Graduate College of the
Oklahoma State University
in partial fulfillment of
the requirements for
the Degree of
DOCTOR OF PHILOSOPHY
July, 2018

ii
ELECTROCHEMICAL AND SURFACE PLASMON
BIOASSAYS FOR CIRCULATING BIOMARKERS
Dissertation Approved:
Dr. Sadagopan Krishnan
Dissertation Adviser
Dr. Ziad El Rassi
Committee Member
Dr. Richard A. Bunce
Committee Member
Dr. Toby Larue Nelson
Committee Member
Dr. Edralin Aguinaldo Lucas
Outside Committee Member

iii Acknowledgements reflect the views of the author and are not endorsed by committee members
or Oklahoma State University.
ACKNOWLEDGEMENTS
There is a number of special people without whose support this doctoral journey might
have not been possible, and to whom I am greatly indebted. Firstly, I would like to express
my deepest gratitude to my PhD advisor Dr. Sadagopan Krishnan, for his full support,
patience, motivation, guidance and the immense amount of opportunities given to succeed
in my graduate career. I could not have imagined having a better advisor and mentor for
my doctoral study. Also I would like to thank my thesis committee members: Dr. Ziad El
Rassi, Dr. Richard Bunce and Dr. Toby Nelson of the Department of Chemistry, and Dr.
Edralin Lucas of the Department of Nutritional Sciences for their insightful comments and
support provided to develop my research. I would like to thankfully remember the former
committee members Dr. John Gelder and Dr. Gabriel Cook of the Department of Chemistry
for their support.
A special thank goes to the faculty members, staff of the Department of Chemistry for their
continuous assistance, and Chemistry and Physics Machine Shop for their tremendous
support in designing the microfluidic systems for different projects. I would like to express
my heartiest thank to the Department of Chemistry, the Graduate College and the Service
and Learning Volunteer Center of Oklahoma State University for rendering numerous
awards, scholarships and fellowships. Furthermore, I would like to thank the
Electrochemical Society and the American Chemical Society for awarding me with travel
awards to present at their national research conferences.
I would like to thank the past and present members of our group: Dr. Charuksha Walgama,
Dr. Manoj K. Patel, Dr. Rajasekhar Nerimetla, Dr. Vini Singh, Dr. K. Sudakar Prasad,
Asantha Dharmaratne, Jinesh Niroula, Zainab Al Mubarak, James Moulton, Sabrina Farias,
Jimmy Dickinson, Mayowa Akinwale, Ryan Matlock, Trey Sunday and Anuruddha
Pathiranage. Without their enthusiasm and corporation, research would have been a
frustrating and overwhelming pursuit.

iv Acknowledgements reflect the views of the author and are not endorsed by committee members
or Oklahoma State University.
I should make a special note of thanks the faculty members of St. Joseph’s College of Arts
and Science, Bangalore, India and the Department of Chemistry of University of Colombo,
Sri Lanka for setting a solid foundation in science education, which motivated me to pursue
a PhD. I would also like to remember all my teachers and mentors from Mahanama
College, Colombo 03, Sri Lanka who have truly been an inspiration during my primary,
middle and high school education. A heartiest thank goes to the management and the staff
members of the S.G.S Lanka (Pvt) Ltd for giving me enormous number of opportunities
for professional growth.
I am truly grateful and thankful to my loving mother (Indumathi Aponso), father (Aluth
Gedara Premaratne), and my siblings for their love and continuous encouragement. Most
of all, a heartiest thank goes to my wonderful wife, Krishani Rajapaksa, who has been
loving, supportive, encouraging and patient all throughout my PhD. Last but not least, I
would like to dedicate this PhD dissertation to my loving son, Nisith Sudam Premaratne.
Gayan Premaratne
Oklahoma State University, Stillwater
July, 2018

v
Name: ALUTH GEDARA GAYAN CHANDIMA PREMARATNE
Date of Degree: JULY, 2018
Title of Study: ELECTROCHEMICAL AND SURFACE PLASMON BIOASSAYS
FOR CIRCULATING BIOMARKERS
Major Field: CHEMISTRY
Abstract: To address analytical detection needs, sensitive and selective assay
methodologies are of great importance. Compared to simple buffer medium, a great
challenge exists in detecting ultra-low levels of biomarkers in clinical matrices due to their
inherent complexity and interferences posed by non-specific molecules. In addition, small
molecules do not yield measurable assay signal changes compared to large biomolecules.
My thesis research is focused on designing nano-biological interfaces to detect small and
large molecules at low parts-per-billion and femto/picomolar concentrations in complex
biofluids (serum and urine samples). Compared to harsh and tedious chemical
carboxylation, non-covalent carboxylation of multiwalled carbon nanotubes by π-π
stacking 1-pyrenebutyric acid retains the innate sp2 structure and electronic properties of
the nanotubes and offers surface carboxyl groups for stable covalent amine coupling of a
large amount of enzymes, thus improving the sensitivity of the assay. Chapter 2
demonstrates the first pyrenyl carbon nanostructure modified enzymatic bioelectrode for
amperometric detection of urine formaldehyde at clinically relevant parts-per-billion levels
with selectivity and wide dynamic range. Subsequently, we explored the low dielectric
permittivity and intrinsic plasmonics of graphene for the detection of serum glutamic acid
decarboxylase autoantibody (GADA). Graphene-based electrochemical immunosensing
approach is advantageous due to its additional applicability for surface plasmon based
validation and binding strength analysis with surface immobilized GAD-65 antigens
(Chapter 3). My thesis focused on the third class of biomarkers, microRNAs, which are
small oligonucleotides with 21-25 bases. To develop the microRNA assay with quantitative
characterization, surface plasmon resonance imaging (SPRi) coupled with quartz crystal
microbalance (QCM) was designed (Chapter 4). Gold nanoparticles (Au NPs) were linked
to the oligonucleotides to increase the detection sensitivity upon hybridization with the
selective capture oligonucleotide immobilized on the sensor surface with minimal non-
specific signals. Often, cancer and other similar health disorders have been shown to be
related to various types of biomarkers. Hence, in Chapter 5, we designed a multiplex assay
platform for combined measurement of proteins and microRNAs. For this multiplex assay,
we synthesized iron-gold bimetallic core/shell nanoparticles (Fe3O4@Au NPs) that
displayed a greater plasmonic signal amplification than either Fe3O4 or Au NPs.
.
vi
TABLE OF CONTENTS
CHAPTER 1 PAGE
ELECTROCHEMICAL AND SURFACE PLASMON BIOASSAYS FOR
CIRCULATING BIOMARKERS ...........................................................................1
1.1 Introduction ..............................................................................................................1
1.2 Nanostructure-modified enzyme electrodes ............................................................3
1.3 Pyrenyl carbon nanostructures for ultrasensitive measurements of formaldehyde in
urine (Chapter 2) ......................................................................................................5
1.3.1 Approach and novelty .....................................................................................5
1.3.2 Outcomes and significance .............................................................................6
1.4 Ultrasensitive electrochemical immunoassays ........................................................7
1.5 Electrochemical and surface plasmon correlation of serum autoantibody
immunoassay with binding insights: graphenyl vs. mercapto-monolayer surface
(Chapter 3) ...............................................................................................................9
1.5.1 Approach and novelty .....................................................................................9
1.5.2 Outcomes and significance ...........................................................................10
1.6 SPRi bioassays for protein and nucleotide biomarkers .........................................11
1.7 Measuring ultra-low levels of nucleotide biomarkers using quartz crystal
microbalance and SPR microarray imaging methods: a comparative analysis (Chapter
4) ............................................................................................................................12
1.7.1 Approach and novelty ...................................................................................12
1.7.2 Outcomes and significance ...........................................................................13
1.8 Multiplexed surface plasmon assay for serum proteins and micro-ribonucleic acids:
signal amplification by bimetallic Fe3O4@Au nanoparticles (Chapter 5) .............14

vii
1.8.1 Approach and novelty ...................................................................................14
1.8.2 Outcomes and significance ...........................................................................16
1.9 Conclusions and future directions .........................................................................16
1.10 References ............................................................................................................18
CHAPTER 2 PAGE
PYRENYL CARBON NANOSTRUCTURES FOR ULTRASENSITIVE
MEASUREMENTS OF FORMALDEHYDE IN URINE ....................................23
2.1 Introduction ............................................................................................................23
2.2 Experimental ..........................................................................................................25
2.2.1 Materials and chemicals ................................................................................25
2.2.2 Instrumentation .............................................................................................26
2.2.3 Surface modification of AuSPE ....................................................................27
2.2.4 Chronoamperometric detection of formaldehyde in urine samples ..............28
2.3 Results and Discussion ..........................................................................................29
2.3.1 FTIR characterization of the modified electrodes ........................................29
2.3.2 Raman characterization of the nano-bioelectrode fabrication steps .............30
2.3.3 Electrochemical impedance spectroscopy characterization ..........................31
2.3.4 Amperometric response for the stirred vs flow injection analysis ................32
2.3.5 LC-MS confirmation of the presence of HCHO in the prepared urine samples by
derivatization with DNPH......................................................................................37
2.3.6 Stability and selectivity of the electrode .......................................................38
2.4 Conclusions ............................................................................................................43
2.5 References .............................................................................................................44
CHAPTER 3 PAGE
ELECTROCHEMICAL AND SURFACE PLASMON CORRELATION OF SERUM
AUTOANTIBODY IMMUNOASSAY WITH BINDING INSIGHTS:
GRAPHENYL VS. MERCAPTO-MONOLAYER SURFACE............................52

viii
3.1 Introduction ............................................................................................................52
3.2 Experimental ..........................................................................................................55
3.2.1 Materials and chemicals ................................................................................55
3.2.2 Instrumentation .............................................................................................55
3.2.3 Fabrication of the electrochemical immunosensor .......................................56
3.2.4 Magnetic bead-protein A/G capturing of autoantibody from 10% human serum
(MAG-protein A/G-GADA) ..................................................................................57
3.2.5 SPRi microarray modification ......................................................................58
3.2.6 Quantitation of GAD-65 on the immunoassay surface .................................59
3.2.7 Quantitation of surface carboxyl groups based on electroactive aminoferrocene
functionalization of graphene-COOH or MPA monolayer surface on 8xSPEs .....59
3.2.8 Electrochemical measurements of serum GADA by an immunoassay ........60
3.3 Results and Discussion ..........................................................................................60
3.3.1 Optimization of GAD-65 concentration on the immunosensor surface ......60
3.3.2 Hydrodynamic size and zeta potential measurements ..................................61
3.3.3 Microscopic characterization of the graphene immunosensor ......................62
3.3.4 Spectroscopic characterization of the graphene immunosensor ...................63
3.3.5 Electrochemical impedance spectroscopy characterization of the immunosensor
fabrication ..............................................................................................................64
3.3.6 Estimation of signal enhancement and reduction of non-specific signals by the
MAG-protein A/G beads over the direct use of serum GADA solution................66
3.3.7 Serum GADA concentration dependent increase in charge-transfer resistance
................................................................................................................................67
3.3.8 Comparison of SPR responses for graphene-COOH and MPA modified
immunosensor and bimolecular kinetic analysis ...................................................68
3.3.9 Validation of the graphene-COOH and MPA modified serum GADA .......71
3.3.10 Estimation of the relative surface carboxyl groups on graphene-COOH and
MPA modified gold surfaces .................................................................................72
3.3.11 Application to T1D patient samples and validation by a commercial ELISA kit
................................................................................................................................76
3.4 Conclusions ............................................................................................................77

ix
3.5 References .............................................................................................................78
CHAPTER 4 PAGE
MEASURING ULTRA-LOW LEVELS OF NUCLEOTIDE BIOMARKERS USING
QUARTZ CRYSTAL MICROBALANCE AND SPR MICROARRAY IMAGING
METHODS: A COMPARATIVE ANALYSIS.....................................................82
4.1 Introduction ............................................................................................................82
4.2 Experimental ..........................................................................................................84
4.2.1 Materials and chemicals ................................................................................84
4.2.2 Instrumentation .............................................................................................85
4.2.3 AuNP-linked oligonucleotide preparation ....................................................86
4.2.4 Quartz crystal surface modification and detection........................................87
4.2.5 Modification of the SPR microarray surface and detection ..........................87
4.3 Results and Discussion ..........................................................................................89
4.3.1 Spectroscopic analysis of AuNP-linked oligonucleotides ............................89
4.3.2 Assessment of target hybridization and signal amplification by the mass sensor
................................................................................................................................91
4.3.3 Pixel intensity changes in the SPR microarray in response to target or control
nucleotide hybridization with the surface capture probe .......................................93
4.3.4 Comparison of QCM and SPRi methods ......................................................95
4.3.5 Assessment of selectivity ..............................................................................96
4.4 Conclusions ..........................................................................................................100
4.5 References ...........................................................................................................101
CHAPTER 5 PAGE
MULTIPLEXED SURFACE PLASMON ASSAY FOR SERUM PROTEINS AND
MICRO-RIBONUCLEIC ACIDS: SIGNAL AMPLIFICATION BY BIMETALLIC
Fe3O4@Au NANOPARTICLES .........................................................................107

x
5.1 Introduction ..........................................................................................................107
5.2 Experimental ........................................................................................................109
5.2.1 Materials and chemicals ..............................................................................109
5.2.2 Instrumentation ...........................................................................................111
5.2.3 Synthesis and characterization of Fe3O4@Au bimetallic nanoparticles .....112
5.2.4 Preparation of the covalent conjugates of Fe3O4@Au NPs with detection
antibodies .............................................................................................................113
5.2.5 Preparation of the conjugates of Fe3O4@Au with detection DNA molecules
..............................................................................................................................113
5.2.6 Preparation of the four-channel microarray and multiplexed analysis .......114
5.3 Results and Discussion ........................................................................................116
5.3.1 Hydrodynamic size and zeta potential of Fe3O4@Au NPs and conjugates
..............................................................................................................................116
5.3.2 Elemental composition of the Fe3O4@Au NPs...........................................118
5.3.3 Estimation of SPRi signal amplification by Fe3O4@Au NPs over Fe3O4 or Au
NPs of similar sizes ..............................................................................................118
5.3.4 Microscopic characterization of the NPs and surface binding event of the
conjugates made with detection probes ...............................................................119
5.3.5 Quantitation of capture and detection molecules used in the designed SPRi
microarray for multiplexed detection of miRNAs and ILs ..................................120
5.3.6 Real-time analysis of serum biomarkers .....................................................121
5.3.7 Analysis of binding strength of protein and miRNA markers ....................123
5.4 Conclusions ..........................................................................................................129
5.5 References ...........................................................................................................130
CHAPTER 6 PAGE
SUMMARY ...............................................................................................................134
xi
LIST OF TABLES
CHAPTER 2
TABLE PAGE
Table 1. Comparison of the present MWNT/PBA-FDH nano-bioelectrode with relevant
reported studies. ................................................................................................................ 40
CHAPTER 3
TABLE PAGE
Table 1. Hydrodynamic size and Zeta potential values of MAG-protein A/G and MAG-
protein A/G-GADA beads (five times diluted in PBS, pH 7.4), temperature 25 oC. ....... 62
Table 2. Kinetic parameters for the MAG-protein A/G beads captured serum GADA
binding onto a surface immobilized GAD-65 antigen. ..................................................... 71
Table 3. Estimated electroactive amounts of aminoferrocene on graphene-COOH and
MPA modified electrodes. The estimations were based on anodic peak area (Q in nC) or
peak currents (Ip in nA) from cyclic voltammograms shown in Fig. 9. ............................ 75
Table 4. A. Results from the analysis of patient samples (10% serum) on the designed
graphene-COOH electrochemical immunosensor and ELISA (N = 3). B. Recovery data
of the designed EIS immunoassay with the ELISA method for a patient serum sample
spiked with GADA. .......................................................................................................... 76

xii
CHAPTER 4
TABLE PAGE
Table 1. Sequences of designed oligonucleotides. ............................................................ 84
Table 2. Quantitation of oligonucleotides immobilized on the QCM or SPR gold surface
and conjugated to AuNPs (N = 3 replicates). ................................................................... 90
Table 3. Analysis of the target oligonucleotide in different percentages of serum samples
(diluted in PBS, pH 7.4) using the QCM and SPR microarray......................................... 97
Table 4. Summary of recent studies related to nucleic acid detection. ............................. 98
CHAPTER 5
TABLE PAGE
Table 1. Sequences of the custom-designed DNA oligonucleotides employed in this
study. (In the hairpin capture DNA, the sequences in italics (underlined) are
complementarity to the target miRNA sequence, the sequences in bold are the hairpin
forming sequence, and those highlighted in gray are complementary to the sequence of
the bimetallic NPs attached detection DNA. The detection DNA partially hybridizes with
the exposed region of the hairpin surface DNA when pre-hybridized with the miRNA
marker) ............................................................................................................................ 110
Table 2. The hydrodynamic diameters and ζ-potentials of Fe3O4@Au NPs and their
conjugates with a detection antibody (shown here for IL-6 second antibody) or a
detection DNA probe. ..................................................................................................... 117

xiii
Table 3. The quantitation of capture molecules immobilized on the microarray and
detection molecules conjugated to the Fe3O4@Au NPs. ................................................ 121
Table 4. Detection performance comparison of our method with other SPR methods . 126

xiv
LIST OF FIGURES
CHAPTER 1
FIGURE PAGE
Figure 1. Types of biomarkers and the categories they fall under according to their
potential roles (according to FDA, NIH and JDRF Biomarker Working Group
categorization)..................................................................................................................... 2
Figure 2. A. Schematic of different assay strategies designed in this thesis to measure
biomarkers in clinical matrices: (1) small molecules, (2) antigens, (3) antibodies and (4)
microRNAs. B. Various electrochemical and surface plasmon imaging-based detection
strategies were utilized. ....................................................................................................... 3
Figure 3. Pyrenyl-carbon nanostructure-modified disposable electrode for urine
formaldehyde detection. ...................................................................................................... 6
Figure 4. Immunosensor containing Graphene-COOH and MPA monolayers for serum
GADA measurement and binding kinetic determination. ................................................. 10
Figure 5. The QCM and SPRi sensors for selective detection of oligonucleotides of
miRNA-21 mimic (Target) from a sequence containing five mismatches (Control) with
AuNPs-based signal amplification. ................................................................................... 14

xv
Figure 6. Bimetallic Fe3O4@Au core/shell nanoparticles enhanced multiplexed SPRi
bioassay to measure four serum cancer biomarkers. ........................................................ 15
CHAPTER 2
FIGURE PAGE
Figure 1. Representation of the crystal structure of FDH from Pseudomonas aeruginosa
(PDB 4JLW). The surface lysine (Lys) residues available for covalent attachment to
surface carboxylic acid groups of PBA and MWNT are highlighted in red. .................... 27
Figure 2. (A) Schematic of the microfluidics system used in this study. (B) Fabrication
steps of the AuSPEs with FDH and the reaction sequence for catalyzing HCHO and
detection by flow injection or stirred solution amperometry. ........................................... 28
Figure 3. FTIR spectra of AuSPE coated with (a) carboxylated MWNTs, (b) after PBA
stacking, and (c) after covalent immobilization of FDH .................................................. 30
Figure 4. Raman spectra of AuSPEs coated with (a) Carboxylated MWNTs, (b) after
PBA stacking, and (c) after covalent immobilization of FDH.......................................... 30
Figure 5. Faradaic impedance spectroscopic measurements of Rct values in an aqueous
solution containing 0.1 M KCl and 10 mM of Fe(CN)63-/4- for stepwise modification of
(a) AuSPE (1792 Ω), (b) after dry-coating of MWNT (154 Ω), (c) after pi-pi stacking of
PBA (67 Ω), and (d) after covalent immobilization of FDH (410 Ω). Experimental
conditions: 0.2 V vs Ag/AgCl, amplitude 10 mV, and frequency range 0.1-100 kHz. .... 32
Figure 6. Amperometric responses (after subtraction of signals for control urine sample
with no spiked HCHO) of flow injection analysis of 1 ppm HCHO at various dilutions of

xvi
urine samples with PBS (pH 7.4) containing 5 mM NAD+ and 1 mM Q delivered a flow
rate of 100 µL min–1 at an applied potential of + 0.35 V at 23 oC. ................................... 33
Figure 7. (A) Stirred solution method: (a) Amperometric responses of the
AuSPE/MWNT/PBA-FDH bioelectrode for various concentrations of HCHO in 10-times
diluted urine in PBS, pH 7.4, containing 5 mM NAD+ and 1 mM Q at an applied potential
of + 0.35 V at 23 oC and a constant stirring of solution using a magnetic stirrer at 150
rpm. Inset shows the enlarged view for lower HCHO concentrations. (b) Michaelis-
Menten fit of the designed bioelectrode in oxidizing HCHO. (B) Flow injection analysis:
(a) Amperometric responses for the AuSPE/MWNT/PBA enzyme bioelectrode upon
injection of various concentrations of HCHO at a flow rate of 100 µL min–1. Inset shows
the enlarged view for lower HCHO concentrations. (b) The corresponding Michaelis-
Menten fit of the experimental data. ................................................................................. 35
Figure 8. Selectivity of the designed AuSPE/MWNT/PBA-FDH bioelectrode for HCHO
over other similar analytes in stirred solutions. Current signals for 5 ppm of analytes (x-
axis) in 10-times diluted urine solutions in PBS are shown. ............................................ 36
Figure 9. (A) LC-MS analysis of the presence of HCHO (5 ppm) in the prepared urine
samples (10-times diluted) by DNPH derivatization method. Separation of (a) DNPH
derivatized urine sample containing HCHO (5 ppm), (b) diluted urine sample with only
DNPH, (c) diluted urine sample alone, and (d) standard DNPH-HCHO derivative (20
ppm). (B) MS analysis showing the 209 Da peak for the formed DNPH-HCHO derivative
in the urine sample. ........................................................................................................... 38
Figure 10. Film stability assessment of the designed AuSPE/MWNT/ PBA-FDH
bioelectrode for 40 h using electrochemical non-faradaic impedance spectroscopy at an
applied frequency of 5 Hz in PBS, pH 7.4, room temperature (23 oC). ........................... 39

xvii
CHAPTER 3
FIGURE PAGE
Figure 1. Design of graphenyl and mercapto monolayer based immunosensors for
biosensing and binding kinetics analysis. Three electrode system in the 8xSPE array:
gold working electrode (WE) and counter electrode (CE), pseudo Ag-reference electrode
(RE). .................................................................................................................................. 53
Figure 2. Rct values for increasing solution concentration of GAD-65 (in PBS solution)
used for immobilization onto the carbodiimide activated graphene-COOH/gold surface,
and followed by the binding of a constant concentration of 10% serum GADA (4 ng mL-
1) captured onto MAG-protein A/G beads. ....................................................................... 61
Figure 3. SEM images of A. rough AuSPE surface, B. after dry coating of an aqueous
suspension of graphene-COOH, C. after covalent attachment of GAD-65 antigen and
surface blocking with 1% BSA, and D. after the binding of GADA spiked in 10% human
serum (0.05 ng mL-1) and captured onto MAG-protein A/G beads. ................................. 63
Figure 4. FTIR spectra of a. rough gold 8xSPE, b. after dry-coating with graphene-
COOH, c. after EDC/NHS activation, d. after GAD-65 immobilization, and e. after the
binding of 5 ng mL-1 concentration of 10% serum GADA captured by the MAG-protein
A/G beads.......................................................................................................................... 64
Figure 5. Faradaic impedance spectroscopic measurements in an aqueous solution
containing 0.1 M KCl and 10 mM each of Fe(CN)63-/4- mixture: (a) AuSPE (3310 ± 101
Ω), (b) after dry-coating of graphene-COOH (1054 ± 154 Ω), (c) after covalently
attaching GAD-65 by the carbodiimide coupling chemistry (2108 ± 67 Ω), (d) after
blocking the free surface with 1% BSA (4190 ± 410 Ω), and (e) after the binding of
serum GADA (0.04 ng mL-1) captured onto the MAG-protein A/G beads (9290 ± 580 Ω).

xviii
Experimental conditions: 0.2 V vs Ag/AgCl, amplitude 10 mV, and frequency range 0.1 -
100 kHz. ............................................................................................................................ 65
Figure 6. A. Rct values for the BSA blocked, graphene-COOH coated gold surface
immobilized with GAD-65 upon the binding of MAG-protein A/G beads alone (1.25 mg
mL-1), GADA (2 ng mL-1) spiked in 10% serum in PBS (pH 7.4), and serum GADA (2 ng
mL-1) captured onto the MAG-protein A/G beads. B. Reduced non-specific background
signals for MAG-protein A/G added toGADA unspiked serum compared to the GADA
unspiked free serum solution. ........................................................................................... 66
Figure 7. Nyquist plots obtained from the Faradaic impedance measurements in an
aqueous solution containing 0.1 M KCl and 10 mM each of Fe(CN)63-/Fe(CN)6
4- for
various concentrations of surface bound serum GADA immunoassembly : A. Graphene-
COOH (0.02, 0.05, 0.1, 0.25, 0.5, 0.75, 1, and 2 ng mL-1) and B. MPA (0.02, 0.05, 0.1,
0.25, 0.5, and 0.8 ng mL-1) modified immunosensors.C and D represent the dynamic
range of respective response plots for Rct changes with concentration of GADA for N = 3
replicates. Ten percent serum not spiked with any GADA but treated with the MAG-
protein A/G beads was used as the control sample, and its Rct value was subtracted from
each of the GADA spiked serum sample responses. (Experimental conditions: 0.2 V
vs pseudo-Ag reference electrode, amplitude 10 mV, and frequency range 0.1–100 kHz.)
........................................................................................................................................... 68
Figure 8. Simulated (red) and real-time SPR sensograms (black) for different
concentrations (a to c) of 10% serum GADA, 0.05, 0.10, and 0.50 ng mL-1, captured with
MAG-protein A/G beads and bound onto GAD-65 immobilized sensor surfaces modified
with A. graphene-COOH and B. MPA. ............................................................................ 70
Figure 9. DPV responses showing the decrease in currents for 10% serum containing
GADA concentrations of a. 0.0, b. 0.02, c. 0.05, d. 0.1, e. 0.2, f. 0.5, and g. 0.75 ng mL-1
captured with MAG-protein A/G beads, and upon binding with the surface GAD-65
antigen on A. graphene-COOH and B. MPA modified immunosensors. Experimental

xix
conditions: aqueous mixture containing 0.1 M KCl and 10 mM each of Fe(CN)63-
/Fe(CN)64- with potential scanned from + 0.6 to - 0.1 V vs a pseudo-Ag reference
electrode. C and D represent the linear DPV responses of the immunosensors modified
with graphene-COOH and MPA, respectively. ................................................................ 72
Figure 10. Background subtracted CVs of A. graphene-COOH, B. MPA modified gold
electrodes with a. covalently attached, and b. adsorbed films of aminoferrocene in argon
purged PBS buffer, pH 7.4, 23 °C. The scan rate was 0.1 V s−1. ...................................... 73
Figure 11. Background subtracted scan rate dependent CVs of the covalently attached
aminoferrocene on A. graphene-COOH and C. MPA modified Au 8xSPEs and the
respective plots of peak current vs scan rate (B and D). The scan rate inner to outer: 0.075
- 1.2 V s-1 at 23 oC, in PBS, pH 7.4................................................................................... 74
CHAPTER 4
FIGURE PAGE
Figure 1. Fabrication procedure of the SPR microarray chip for selective detection of the
target miRNA-21 mimic (T) from the control (C) oligonucleotide sequence by
hybridization in a dual channel SPRi system. ................................................................... 88
Figure 2. UV-visible spectra of (a) AuNPs before conjugation to oligonucleotides and
AuNPs linked to (b) target or (c) control oligonucleotide present in 0.1 M NaCl/ 0.1 M
sodium phosphate buffer (pH 7.4). ................................................................................... 89
Figure 3. SEM images of (A) a bare gold spot of the SPR microarray before modification
and (B) the gold spot self-assembled with the thiol-activated surface capture probe. (C)
Higher magnification image of (B). .................................................................................. 91

xx
Figure 4. A. Mass changes for the gold-coated quartz crystals modified with the surface
capture probe upon addition of increasing concentration (in pM) of (a) target
oligonucleotide captured onto AuNPs, (b) target oligonucleotide not linked to AuNPs, (c)
control oligonucleotide linked to AuNPs, and (d) the control not linked to AuNPs. B.
Mass changes shown for (a) control and (b) target oligonucleotides (0.5 pM) with or
without linking to AuNPs. Data shown are mean ± standard deviations represented by
error bars for N = 3 replicates. Relative standard deviations (RSDs) for the control were
17% with no AuNPs and 22% with AuNPs linkage. The RSDs for the target were 11%
(no AuNPs) and 7% (with AuNPs). .................................................................................. 92
Figure 5. Real-time SPR response (average of eight array spots) for the binding of 0.5 pM
of (a) target or (b) control oligonucleotide linked with AuNPs onto the surface
immobilized capture probes at a flow rate of 50 μL/min. Sample injection and buffer
wash points are labeled. .................................................................................................... 93
Figure 6. Representations of SPRi responses: the 3D representation (left) and the line
profile (right) that depicts the SPR pixel intensities for various concentrations of target
and control nucleotides. The spot labeled as (a) is the bare gold surface treated with 5
mM MHOH and that of (b) are the test spots containing the immobilized capture probes.
(A)-b: control oligonucleotide of (i) 0.1, (ii) 0.5, (iii) 1, (iv) 10, (v) 30, and (vi) 50 pM
concentrations conjugated with AuNPs; and (B)-b: target oligonucleotide of
concentrations similar to those of the control allowed to bind with the surface capture
probe……………………………………………………………………………………94
Figure 7. Double logarithmic calibration plots of (A) QCM response (control response is
subtracted) and (B) SPRi response (control response is subtracted) upon hybridization of
various concentrations of the AuNP-conjugated target oligonucleotide with the surface
capture probe. (mean ± standard deviation for three replicates). ...................................... 96

xxi
CHAPTER 5
FIGURE PAGE
Figure 1. Schematic illustration of the synthesis of Fe3O4@Au bimetallic NPs using the
reaction mixture consisting of 1. HAuCl4.3H2O, 2. Fe3O4 NPs, and 3. sodium citrate. . 112
Figure 2. A. The experimental set-up for multiplexed SPRi analysis using a four-channel
flow injection system. B. The SPRi chip was modified with capture probes (CAb: capture
antibodies or CDNA: capture DNA) and the analytes were assayed as follows: Two lanes
(4 spots each) of the SPRi microarray were self-assembled with a monolayer of MPA.
The remaining two lanes were self-assembled with thiol-activated hairpin capture DNAs
of miRNA-21 and miRNA-155 (4 spots each) followed by blocking the free surface with
MHOH. The IL-6 and IL-8 capture antibodies were covalently attached to the -COOH
activated MPA surface (4 spots each) followed by blocking of the free surface with 1%
BSA. Various concentrations of the protein and miRNA markers were spiked in 10%
human serum and allowed to bind their respective capture molecules on the chip using
the designated individual flow channels. The signal amplification step of the bioassay
was subsequently followed by introducing the respective detection molecules (DAb:
detection antibodies or DDNA: detection DNA) conjugated to Fe3O4@Au NPs yielding
detection DNA-Fe3O4@Au or detection antibody-Fe3O4@Au NPs. .............................. 115
Figure 3. The SPRi responses of A. 100 nm Fe3O4 NPs, B. 75 nm Fe3O4@Au NPs, C. 100
nm Au NPs, and D. 105 nm Fe3O4@Au NPs adsorbed onto 0.1 mg mL-1 PEI coated gold
surface. (a) Schematic and experimental 3D images of SPR pixel intensity, (b) only the
PEI adsorbed gold surface. The corresponding line profiles, and difference images (in
grey) are shown on the right. .......................................................................................... 119
Figure 4. TEM image of A. Fe3O4@Au NPs. SEM images of B. bare Au surface of the
microarray, C. IL-6 capture antibody/IL-6/Fe3O4@Au NP-IL-6 detection antibody
xxii
assembly, and D. miRNA-155 capture DNA/miRNA-155/Fe3O4@Au NP-miRNA-155
detection DNA assembly. ............................................................................................... 120
Figure 5. SPRi responses for a multiplexed assay by the 4-channel flow injection analysis
A. Real-time pixel intensity changes for 10% serum spiked with a. IL-8 (10 nM), b. IL-6
(10 nM), c. miRNA-21 (0.25 nM), and d. miRNA-155 (0.25 nM). I. Represents the
introduction of the 10% serum spiked with the markers to the capture probe coated
microarray and II. represents the introduction of the detection probes conjugated to
Fe3O4@Au NPs. B. Final difference image of the test spots after detection of protein and
miRNA markers in a single microarray. C and D. Corresponding 3-D representation and
line profile, respectively.................................................................................................. 122
Figure 6. SPRi calibration plots for A. protein markers (IL-6 and IL-8) and B. miRNA
markers (miRNA-21 and miRNA-155) in 10% human serum. (N = 3 replicates). ........ 123
Figure 7. Representative plots of the relative surface coverage (θ) as a function of the
concertation of A. IL-6, B. IL-8, C. miRNA-21, and D. miRNA-155. The solid line
represents the Langmuir isotherm fit to the data. All measurements were made in
triplicates. ........................................................................................................................ 125

1
CHAPTER 1
ELECTROCHEMICAL AND SURFACE PLASMON BIOASSAYS FOR CIRCULATING
BIOMARKERS
1.1 Introduction
Designing highly sensitive and selective bioassay methodologies is imperative to overcome the
analytical challenge of not only determining the ultra-low concentrations of biomarkers that are
present in complex matrices (blood, serum, urine, saliva, etc.), but also to assess slight variations
occurring during physiological abnormalities. Biomarkers are specific molecules whose
concentration levels in blood, tissues and other organs/body fluids can be related to a normal or
abnormal process, or a condition or disease.1 Assaying clinically relevant biomarkers present in
complex body fluids can enable early diagnosis and monitoring response to treatments as well as
recurrence. An outline of various types of biomarkers and their applicability with relevance to
different stages of disease depending on their biological function is shown in Figure 1.
Even though many sensitive techniques including chromatography-mass spectrometry, radioactive
assays, and molecular biology techniques are known, high cost, complexity of assay steps for
clinical samples, limitation of assaying in a multiplex format, no feature of real-time binding
analysis (useful for sensitive biosensor development by facilitating conditions to attain strong
interactions), and the need of expensive labels for the detection steps.
Electrochemical techniques have received immense attention because they are simple to operate,
easy to fabricate, produce rapid detection signals, cost effective, and can be used as miniaturized

2
platforms for onsite measurements.2,3 Surface plasmon resonance (SPR) has been predominantly
used as a sensitive technique that could measure real-time ligand-receptor binding events and the
kinetics associated with them.4,5 Combining electrochemical and SPR techniques can provide
complementing information useful for any new bioanalytical assay development.
Figure 1. Types of biomarkers and the categories they fall under according to their potential roles
(according to FDA, NIH and JDRF Biomarker Working Group categorization)
Both electrochemical and SPR biosensors carry or consist of the same basic elements as of a general
biosensor. A bio-recognition molecule, specific for the target analyte, is immobilized on the surface
and a transducer producing the desired signal change when the target analyte binds to the surface
receptor.6 These biosensors face the general limitations of suffering from non-specific signals,
orientation issues of surface receptors affecting the extent of analyte binding sites, and long-term
stability. To mitigate some of these drawbacks, various nanomaterials and surface bioconjugation
chemistries to improve the detection sensitivity, orientation, and stability. In addition to addressing
these common pitfalls, we have initiated a research direction focusing on binding constant based
biosensor optimization to increase detection sensitivity and thus lower the detection limits.

3
This chapter provides an overview of recent trends in electrochemical and surface plasmon
resonance (SPR) bioassays for small and large biomolecule markers. A summary of contribution
from my thesis research on the design of various bioassay strategies is presented (Figure 2).
Furthermore, the use of appropriate surface recognition elements and incorporation of different
nanomaterial-based approaches for signal amplification and non-specific signal reduction are
discussed.
Figure 2. A. Schematic of different assay strategies designed in this thesis to measure biomarkers
in clinical matrices: (1) small molecules, (2) antigens, (3) antibodies and (4) microRNAs. B.
Various electrochemical and surface plasmon imaging-based detection strategies were utilized.
1.2 Nanostructure-modified enzyme electrodes
Enzyme-based electrochemical sensors are a sub-class of biosensors that are built by immobilizing
substrate-specific enzymes on the working electrode surface. Electrochemical signals are produced
as a result of the enzyme catalyzing the small molecule of interest. As the most critical component
of the sensor, enzymes can be stably immobilized on the sensor by use of various nanomaterials

4
and nanocomposites as a type to improve sensitivity.7 The analyte small molecule can be selectively
probed as the substrate for a specific enzyme irrespective of the matrix it is available.
Thulium oxide nanorods (n-Tm2O3) electrophoretically-deposited onto indium-tin oxide glass
electrode for total cholesterol detection in clinical samples through a dual enzyme functionalization
(with cholesterol esterase (ChEt) and cholesterol oxidase (ChOx)) has been reported.8 Tm2O3
improved the electroactive area, diffusion of substrates to the enzymes and electron transfer kinetics
that resulted in a broad linear range for cholesterol detection. A poly(phenylenediamine)
biomembrane with a molecular sieving feature was developed to amperometrically determine the
glutamate uptake and accumulation in the nerve terminals at millimolar levels.9 The biomembrane
resulted storage stability up to 11 days at 4 oC with a loss of 25% of initial activity. Without the
biomembrane, the sensor showed a large cross-reactivity with ascorbic acid, which was not clearly
addressed. A reagentless amperometric biosensor was developed by Hughes et al. following a
layer-by-layer process by alternatively depositing chitosan and multiwalled carbon nanotubes
(MWNTs) on Meldola’s Blue screen printed carbon electrodes.10 The layers encapsulated the
glutamate dehydrogenase enzyme and the cofactor nicotinamide adenine dinucleotide (NAD+).
The sensor had the capacity to determine glutamate concentrations in food and serum samples with
less than 10% coefficient of variation among five replicates. Reagentless enzymatic amperometric
biosensor eliminates the requirement for additional redox probes during the detection step, which
decreases the assay duration. However, the effectiveness of layer-by-layer modification on the
reproducibility and shelf-life of the sensor needs to be further investigated.
As another mechanistic approach to entrap large quantities of enzymes, Reuillard and coworkers
developed an amperometric glucose sensor, which was efficiently built by polypyrrolic bipyridine
bis(phenantrolinequinone) Ru(II) complex ([RuII(PhQ)2(bpy-pyrrole)]) formed by
eletropolymerization on a MWNT-modified glassy carbon electrode (GCE).11 This one-step

5
development of [RuII(PhQ)2(bpy-pyrrole)] nano-polymer composite was compared to a layer-by-
layer deposition of [RuII(PhQ)2(bpy-pyrrole)] and poly[12-(pyrrol-1-yl) dodecyl]triethylamnonium
tetrafluoroborate. Even though the layer-by-layer method entrapped more enzymes, the sensor
performance was poor due to additional steric effects imposed on cofactor permeation towards the
electrocatalytic layer. Recently, a nanostructured enzyme-less glucose sensor was developed on a
glassy carbon electrode modified with a nanohybrid mixture of MWNTs/Au NPs/iron oxide
nanoparticles (Fe2O3 NPs).12 The aggregation of Fe2O3 NPs above an optimum concentration
hindered the electron transfer through MWNTs, which in turn lowered the sensitivity of the sensor
by 2-folds.
1.3 Pyrenyl carbon nanostructures for ultrasensitive measurements of formaldehyde in urine
(Chapter 2)
1.3.1 Approach and novelty
We recently demonstrated a novel approach for enzyme-selective detection of formaldehyde in
urine using a flow injection amperometric sensor (Figure 3).13 An amperometric nano-bioelectrode
design that uniquely combined 1-pyrenebutyric acid (PBA) units pi-pi stacked with carboxylated
MWNTs on the surface of gold screen printed electrodes was used for covalent attachment of NAD+
dependent formaldehyde dehydrogenase (FDH). Based on our prior reports, the large number of
–COOH groups made available by MWNT/PBA modification promotes greater covalent
attachment of surface biomolecules,14-16 and is convenient to perform compared to the tedious
chemical functionalization of MWNTs that could potentially alter their electronic properties. FDH
is a selective enzyme towards formaldehyde oxidation, which minimized non-specific
interferences. Fourier transform infrared, Raman, and electrochemical impedance spectroscopic
characterizations confirmed the successful design of the FDH bioelectrode. An electron transfer
mediator-based efficient approach using quinone compound (Q: 1, 2-naphthaquinone-4-sulfonic

6
acid sodium salt) was followed to obtain electrochemical signals that are proportional to
formaldehyde concentration.
1.3.2 Outcomes and significance
The non-covalent functionalization of MWNTs with PBA offered a larger amount of carboxyl
functionalities, which in turn was useful to covalently immobilize a large amount of FDH on the
electrode surface to increase the sensitivity. Flow injection analysis provided greater affinity for
formaldehyde (apparent KM 9.6 ± 1.2 ppm) when compared with stirred solution method (apparent
KM 19.9 ± 4.6 ppm). The flow injection analysis demonstrated a lower detection limit and wider
dynamic range than the stirred solution method in 10-times diluted urine matrix. This could be
likely due to the better diffusion of reactants to products on the electrode surface by use of a
continuous sample flow. The sensor offered a superior selectivity over other homologous aldehydes
except for a moderate cross-reaction with acetaldehyde (~25%) possibly due to its partial affinity
to the enzyme’s binding pocket.17
Figure 3. Pyrenyl-carbon nanostructure-modified disposable electrode for urine formaldehyde
detection.

7
Our results demonstrated that pyrenyl carbon nanostructure-based FDH bioelectrode design
represent a novel and simple for enzyme-selective electrochemical quantitation of small 30 Da
formaldehyde. Broader applicability of our approach to other small-molecule markers is feasible
depending on the design of appropriate marker-specific enzyme systems or receptor molecules.
1.4 Ultrasensitive electrochemical immunoassays
Nano-modified electrochemical immunoassays have received a sound attention in past few years
in the rapidly growing biomarker sensing applications.18 A typical electrochemical immunoassay
consists of a reporter molecule which is responsible to produce the corresponding electrical signal
upon the target molecule is bound to the specific receptor. Dutta and coworkers reported a sandwich
type immunosensor to determine the low femtogram per milliliter concentration of Plasmodium
falciparum histidine-rich protein-2 in plasma.19 A highly sensitive redox-cycling approach was
followed by using methylene blue tagged second antibodies to produce chronocoulometric signals
after going through an endergonic reaction with Ru(NH3)63+ and a highly exergonic reaction with
tris (2-carboxyethyl)phosphine (TCEP). This eliminated the requirement for expensive enzymatic
labels and demonstrated high specificity, excellent reproducibility and good stability. Another
highly sensitive immunosensing platform, which measured femtogram per milliliter levels of a
food-borne pathogen marker Enteropathogenic coli (E. coli) antigen, a unique and highly sensitive
redox-cycling detection mechanism was followed.20 The outersphere reaction-philic/innersphere
reaction-philic transfer from Ru(NH3)63+/2+/immunosensor to ferritin-H2O2 redox system resulted in
a higher signal to noise ratio than a traditional ferritin labeled immunoassay. While this redox-
cycling scheme offered similar sensitivity to the methylene blue-TCEP redox system, it has the
advantage of having negligible interference from dissolved oxygen in the electro-reduction process.
A major number of immunosensors developed recently have been focused on determining
biomarkers related to various cancer conditions. In this effort, an enzyme cascade reaction was

8
employed to measure serum concentration of a tumor marker neuron-specific enolase (NSE)
utilizing a multifunctional conductive hydrogel containing polypyrrole-polythionine-Au NPs with
glucose oxidase due to its ease of synthesis through a one-pot reaction, large specific surface area
offered and high conductivity and signal to noise ratio.21 However, the inherent mechanical
weakness and non-adherence to certain surfaces could limit the use of hydrogels in biosensors.
Carvajal and coworkers reported a low-cost disposable inkjet-printed electrode array (< $0.25) to
detect clinically relevant levels of a breast cancer biomarker human epidermal growth factor
receptor 2 (HER-2).22 Even though a relatively faster assay time (15 min) were achieved by an
integrated flow of HER-2, biotinylated antibody, and polymerized horseradish peroxide labels via
a microfluidic system, this study did not demonstrate any evidence that mimics the real-use of
determining HER-2 in human serum. A direct immunoassay was built on disposable graphene
screen-printed electrode modified with branched polyethylenimine to detect serum glial fibrillary
acidic protein, a central nervous system injury biomarker.23 The simple adsorption of PEI provided
enriched amounts of primary and secondary amine functional groups for the immobilization of a
large amount of capture antibody via a Schiff base reaction using glutaraldehyde. This was
advantageous over the creation of self-assembled monolayers, electropolymerization, plasma-
polymerization, and salts with functional groups that have complex protocols with several time-
consuming functionalization steps. Nonetheless, adsorbed layers of polymers are prone to
desorption due to strong mechanical stress applied on the sensor, which in turn, could hamper the
sensitivity.
Recently, significant efforts have been put by scientists in regard to measurements of insulin levels
in clinical matrices to draw plausible conclusions on diabetic conditions. Krishnan and coworkers
reported electrochemical immunosensor designs that employed MWNTs non-covalently
functionalized with 1-pyrenebutyric acid by pi-pi stacking to increase the surface carboxyl

9
functional groups, which in turn improved the amount of immobilized anti-insulin second
antibodies to detect low picomolar levels of insulin in diluted human serum.24,25 Magnetic
nanoparticles covalently linked with anti-insulin capture antibodies were used to conveniently
capture the serum insulin, which reduced the possible non-specific signals and increased the
sensitivity of the detection signals.
1.5 Electrochemical and surface plasmon correlation of serum autoantibody immunoassay
with binding insights: graphenyl vs. mercapto-monolayer surface (Chapter 3)
1.5.1 Approach and novelty
Conventionally, radioimmunoassay (RIA), enzyme-linked immunosorbent assay (ELISA),
chemiluminescent immunoarray (CLIA), and electrochemiluminescence assays have been used by
the researchers for clinical diagnosis of type 1 diabetes (T1D). These analytical techniques are
tedious to perform, lacked quality check parameters and required expensive labels. We developed
an immunosensor design on carboxylated graphene (graphene-COOH) or self-assembled
monolayer of mercaptopropionic acid (MPA)-modified screen printed eight electrode array
(8xAuSPE). We used an inexpensive ferricyanide reagent to accomplish the simple electrochemical
detection of serum glutamic acid decarboxylase autoantibody (GADA) (Figure 4).26 According to
prior studies, both graphene27-29 and mercapto monolayers30-32 have been widely used to effectively
functionalize immunoassay surfaces in order to immobilize biomolecules.
Graphene is an excellent alternative to surface chemistries that cannot be directly used on surface
plasmon resonance imager (SPRi) array surface due to optical limitations (e.g., carbon nanotubes).
With its conductive 2D nanostructure and intrinsic plasmonic activity, graphene can be used for
both electrochemical and SPR surface modification. Herein, we used SPRi as a complementary
method to the electrochemical methods to evaluate binding constants (KD) associated with GADA
interaction with its antigen, GAD-65. A unique approach was followed to isolate the GAD antibody

10
from serum samples by protein A/G modified magnetic beads to minimize non-specific
interactions. This comparative analysis of the graphene-COOH and MPA provided useful
fundamental information regarding immunosensing of serum GADA and binding insights on
GADA-GAD65 interaction, which are discussed in detail in Chapter 3.
Figure 4. Immunosensor containing Graphene-COOH and MPA monolayers for serum GADA
measurement and binding kinetic determination.
1.5.2 Outcomes and significance
The graphene surface offered a lower detection limit with a wider dynamic range compared to the
MPA monolayer surface, and exhibited a good statistical correlation with the commercial ELISA
method. The lower KD value for the graphene-COOH modified surface suggests that graphene
provides a stronger GADA-GAD-65 binding interaction, which in turn relates to a more sensitive
platform. Through electrochemical quantitation, it was found that the number of surface carboxyl
groups available for covalent interaction was about 9-times greater in graphene-COOH than the
mercapto monolayer surface. The larger number of carboxyl groups on graphene provided room to
immobilize a greater amount of GAD-65 antigen combined with the reduction of non-specific

11
binding occurring on the immunosensor surface, which improved sensitivity. The combined
sensing and binding assessment studies provided useful insights for broader applications on
developing reliable, and better throughput clinical immunosensors for biomarker based diagnostic
assays.
1.6 SPRi bioassays for protein and nucleotide biomarkers
SPRi is one of the many SPR techniques that have been established, and can operate as a high-
throughput and label-free technique for the analysis of variety of molecular interactions. Typical
SPRi works based on Kretschmann configuration in which a monochromatic light source is used
to generate surface plasmons across an array consisting of a thin plasmonic metal film in contact
with a dielectric medium. A CCD camera is used to acquire digital images to monitor the intensity
of light reflected as a result of refractive index changes occurring at the metal-dielectric interface.33
To increase the sensitivity of the SPRi-based detection, various surface nanomaterial assemblies,
enzymatic amplification, self-assembly of proteins and DNAs and plasmonic nanoparticle coupling
have been followed.34
Sankiewicz and coworkers developed an SPR assay to measure fibronectin in blood samples of
children with thermal injuries.35 The assay used a simple immunoassay strategy by immobilizing
fibronectin specific monoclonal antibodies on a mercapto monolayer formed on the gold SPRi array
and did not require any tags, dyes or specialized reagents. However, the assay sensitivity was only
moderate with the detection limit of 1.5 ng mL-1, limiting its use to measure biomarkers of clinical
relevance in ultralow picogram or femtogram per milliliter levels. In another work, an orthogonal
signal amplification strategy was followed by coupling a miRNA-initiated surficial cyclic DNA-
DNA hybridization reaction with a DNA-initiated upward cyclic polymerization reaction.36 In this
way the sensitivity was improved to sub-femtomolar concentration detection. However, this

12
method has an intrinsic limitation while applying to a multiplexing platform as it would require the
design of multiple DNA oligonucleotides if a panel of miRNA markers are to be tested.
Multiplexing combined with a microfluidic format allows a rapid and efficient analysis of multiple
biomarkers, minimizing the need for multiple experiments. Hendriks and coworkers recently
developed a multiplexed SPRi detection cascade using neutravidin and gold nanoparticles to
measure IL-1β, IL-6, IFN-γ, and TNF-α in femtogram and picogram per milliliter range.37 Though
the enhancement cascade improved the sensitivity by about 40,000 times in a buffer medium, when
applied to complex fluids, large non-specific interactions of the surface receptor antibodies led to
a 1000-fold decrease in the overall sensitivity of the assay. In another recent report, a competitive
multiplexed SPRi immunoassay was developed to measure insulin, glucagon and somatostatin in
buffer medium.38 The indirect assay was useful to overcome the limitation arising from small
molecule detection signals by SPRi, which would often result in no measurable signal changes at
ultralow concentrations. The drawback in such assay is that it has detection limits in the nanomolar
range and has not achieved measurements of markers under study in any complex matrix.
SPRi can become a vital complementary technique to electrochemical methods by enabling real-
time binding insights on various types of molecules associated with appropriate receptor molecules
immobilized on the array surface. Also, SPRi can be used as a better throughput platform at
instances where the electrochemical methods cannot measure more than a single sample at a time.
1.7 Measuring ultra-low levels of nucleotide biomarkers using quartz crystal microbalance
and SPR microarray imaging methods: a comparative analysis (Chapter 4)
1.7.1 Approach and novelty
Circulating serum nucleotide biomarkers are useful indicators for early diagnosis of various deadly
diseases. In particular, miRNA-21 (miRNA-21) has been found to be relevant to infectious
diseases, such as viral and bacterial infections, as well as non-infectious diseases such as

13
cardiovascular disorders and cancer. A combination of mass sensor and SPRi methods that utilize
the same assay chemistry on gold are useful detection with quantitative insights. In this work, we
compared detection performances of a quartz crystal microbalance (QCM), which is a mass sensor,
with that of a SPRi microarray for an oligonucleotide mimic of the miRNA-21 biomarker (Figure
5).39
A surface immobilized capture oligonucleotide probe was designed and custom synthesized to
hybridize with the target oligonucleotide (i.e., the miRNA-21 mimic) to facilitate selective
detection. The direct method of forming a self-assembled monolayer of capture probes on the gold
surface eliminated the need for additional surface functionalization steps. Gold nanoparticles (Au
NPs, 50 nm) were conjugated with the target oligonucleotide to increase the detection sensitivity
by adding more mass on the surface on the QCM sensor as well as enhancing the plasmonic signals
in an SPRi microarray. To assess the selectivity of the capture probes towards the target
oligonucleotide, an Au NP-linked control oligonucleotide containing five base-pair mismatches to
the target oligonucleotide was used. Additionally, sample recovery studies were performed to
analyze the serum matrix effect.
1.7.2 Outcomes and significance
We achieved detection limits of 28 and 47 fM for the target oligonucleotide by the QCM and SPRi
microarray approaches, respectively. Although the QCM was more sensitive and had a lower
detection limit, it was throughput limited. The microarray approach offered better throughput for
analysis of up to 16 samples, thus the analysis of sample and controls in a single experiment using
a dual channel microfluidic system was possible.
The combination of QCM with SPRi can be practically significant as it is useful for quantitative
characterization and assay step optimization before applying for a high-throughput platform. We
confirmed that the designed assay was selective for the target oligonucleotide and did not show

14
signals for the control base mismatch oligonucleotide. According to the sample recovery studies (>
90%), there was a negligible interference from the serum matrix up to 25% in buffer. QCM studies
revealed the effectiveness of conjugating Au NPs with the target oligonucleotides to increase the
sensitivity of the detection signal by about three times. The strategy discussed above opens up an
avenue in developing a SPRi-based multiplexed platform to measure multiple biomarkers in
clinical matrices.
Figure 5. The QCM and SPRi sensors for selective detection of oligonucleotides of miRNA-21
mimic (Target) from a sequence containing five mismatches (Control) with AuNPs-based signal
amplification.
1.8 Multiplexed surface plasmon assay for serum proteins and micro-ribonucleic acids:
signal amplification by bimetallic Fe3O4@Au nanoparticles (Chapter 5)
1.8.1 Approach and Novelty
Highly expressed circulating protein and miRNA markers play a significant role in indicating
critical health conditions and measuring them together in one assay platform offers the advantages
of increasing the prediction rates and reduction of false positive diagnoses. We recently expanded

15
our existing dual channel SPRi microfluidic system into a four-channel system to develop a
multiplexed assay to simultaneously measure four circulating cancer biomarkers (two proteins: IL-
6 and IL-8, and two miRNAs: miRNA-21 and miRNA-155) in human serum (Figure 6).40 The SPRi
microarray uniquely employed citrate-stabilized bimetallic iron-gold bimetallic core/shell
nanoparticles (Fe3O4@Au NPs) as signal amplification labels covalently linked with secondary
detection molecules. Various bimetallic NPs have been built by combining the beneficial properties
of two metals and have been employed in biosensing applications.41 In particular, the Fe3O4@Au
NPs offered the distinctive benefits of easy conjugation and magnetic separation of desired
compounds for subsequent detection in the assay.42 The plasmonic properties of the gold shell were
useful for amplifying the SPR detection signals.43 SPRi allowed the real-time monitoring of the
binding events of the protein and miRNA biomarkers to their surface receptors. Multiplexing was
useful to directly assay the two protein markers by a sandwich immunoassay and the two serum
miRNA markers by a double hybridization assay in a serum sample.
Figure 6. Bimetallic Fe3O4@Au core/shell nanoparticles enhanced multiplexed SPRi bioassay to
measure four serum cancer biomarkers.

16
1.8.2 Outcomes and significance
The Fe3O4@Au (105 nm) NPs exhibited 13-times higher plasmon signal intensities than that of
only Fe3O4 NPs (100 nm) and 6-times greater signals than Au only NPs (100 nm). The magnetic
feature of Fe3O4@Au NPs was useful for convenient separation of the detection probes that were
covalently linked (binding efficiency > 70%). The plasmon enhancing features of Fe3O4@Au NPs
aided in amplifying the SPRi signal output for analyte markers while minimizing the non-specific
signals arising from the serum matrix. The detection limits achieved for the markers were in the
pM to sub-pM concentration range.
In 10% serum, the dynamic range of detection for the proteins was from pM to nM (~104 orders of
magnitude), and for the miRNAs, the dynamic range was from fM to nM (~106 orders of
magnitude). The binding constants determined from Langmuir-type binding kinetics was from µM
to nM range, which provided evidence of strong affinities between the analyte biomarkers and their
receptor molecules on the designed sensor surface. This feature is vital in understanding the degree
of interaction of the chosen receptors with the target analytes in bioassays. Further, this SPRi array
has the potential to be adopted as a tool for analysis of other biomarkers present in clinical samples.
1.9 Conclusions and future directions
In summary, this chapter mainly attempted on discussing various electrochemical and SPRi assay
methodologies developed recently to measure biomarkers in complex matrices, and the
contributions of the research presented in this dissertation have added new knowledge on
combining electrochemical and SPRi methods to determine quality check parameters in devising
clinical biosensors with high sensitivity and selectivity. Up to date, scientists have been working
tirelessly to advance the field of sensors by developing many impressive electrochemical and SPR
based biosensor technologies and have disseminated their findings through a plethora of research
publications. However, so far, only a handful of electrochemical biosensors have reached the

17
commercialization stage. A similar trend can be observed with the reported superior SPR diagnostic
assays for biomarker measurement that have still not made it to a clinical setting. Of course, it
should be noted that significant research efforts are needed to increase the efficiency, robustness
and reproducibility of bioassay designs, and applicability for a large number of samples in order to
translate them from laboratory bench into practically implementable methods.
With the increasing population suffering from numerous types of deadly diseases, advanced
biosensor technologies are critical for early-diagnosis and prognosis, in order to commence suitable
therapeutic regimes in a timely manner. In particular, the advantages of electrochemical sensor
technologies and nanotechnology can be combined to develop potential miniaturized devices for
personalized continuous biomarker measurements. Future developments in embroidered
electrochemical sensors, contact-lens based sensors, sweat sensors and edible biosensors would
shift the diagnostic world to a new paradigm. Similarly, besides the biosensing feature, the ability
to determine binding insights of various biomolecule interactions by SPRi can be utilized in
selecting appropriate surface designs and biorecognition elements for a wide range of biosensors.
In parallel to electrochemical techniques, SPR is expected to transform to a user friendly technology
by appropriate tuning of the portability and interfacial sensing features. The outlook for
electrochemical and SPR research certainly remains positive and many breakthroughs are realizable
with continuous explorations.

18
1.10 References
1. Myers, M.J., Smith, E.R., and Turfle, P.G., Biomarkers in Veterinary Medicine. Annual
Review of Animal Biosciences, 2017, 5, 65-87.
2. Ronkainen, N.J., Halsall, H.B., and Heineman, W.R., Electrochemical biosensors. Chemical
Society Reviews, 2010, 39, 1747-1763.
3. Abdulbari, H.A., and Basheer, E.A., Electrochemical Biosensors: Electrode Development,
Materials, Design, and Fabrication. ChemBioEng Reviews, 2017, 4, 92-105.
4. Guo, X., Surface plasmon resonance based biosensor technique: a review. Journal of
Biophotonics, 2012, 5, 483-501.
5. Masson, J.F., Surface plasmon resonance clinical biosensors for medical diagnostics. ACS
Sensors, 2017, 2, 16-30.
6. Perumal, V., and Hashim, U., Advances in biosensors: Principle, architecture and applications.
Journal of Applied Biomedicine, 2014, 12, 1-15.
7. Xiao, F., Wang, L., and Duan, H., Nanomaterial based electrochemical sensors for in vitro
detection of small molecule metabolites. Biotechnology Advances, 2016, 34, 234-249.
8. Singh, J., Roychoudhury, A., Srivastava, M., Solanki, P.R., Lee, D.W., Lee, S.H., and
Malhotra, B.D., A dual enzyme functionalized nanostructured thulium oxide based interface
for biomedical application. Nanoscale, 2014, 6, 1195-1208.
9. Soldatkin, O., Nazarova, A., Krisanova, N., Borуsov, A., Kucherenko, D., Kucherenko, I.,
Pozdnyakova, N., Soldatkin, A., and Borisova, T., Monitoring of the velocity of high-affinity
glutamate uptake by isolated brain nerve terminals using amperometric glutamate biosensor.
Talanta, 2015, 135, 67-74.
10. Hughes, G., Pemberton, R.M., Fielden, P.R. and Hart, J.P., Development of a novel
reagentless, screen-printed amperometric biosensor based on glutamate dehydrogenase and

19
NAD+, integrated with multi-walled carbon nanotubes for the determination of glutamate in
food and clinical applications. Sensors and Actuators B: Chemical, 2015, 216, 614-621.
11. Reuillard, B., Le Goff, A., and Cosnier, S., Polypyrrolic bipyridine bis (phenantrolinequinone)
Ru (II) complex/carbon nanotube composites for nad-dependent enzyme immobilization and
wiring. Analytical Chemistry, 2014, 86, 4409-4415.
12. Mohammadi, F., Vesali‐Naseh, M., Khodadadi, A.A. and Mortazavi, Y., A Comparison of a
Nanostructured Enzymeless Au/Fe2O3/MWCNTs/GCE Electrode and a GOx Modified One in
Electrocatalytic Detection of Glucose. Electroanalysis, 2018,
(doi.org/10.1002/elan.201800164)
13. Premaratne, G., Farias, S. and Krishnan, S., Pyrenyl carbon nanostructures for ultrasensitive
measurements of formaldehyde in urine. Analytica Chimica Acta, 2017, 970, 23-29.
14. Krishnan, S., and Armstrong, F.A., Order-of-magnitude enhancement of an enzymatic
hydrogen-air fuel cell based on pyrenyl carbon nanostructures. Chemical Science, 2012, 3,
1015-1023.
15. Singh, V., and Krishnan, S., Voltammetric immunosensor assembled on carbon-pyrenyl
nanostructures for clinical diagnosis of type of diabetes. Analytical Chemistry, 2015, 87, 2648-
2654.
16. Niroula, J., Premaratne, G., Shojaee, S.A., Lucca, D.A., and Krishnan, S., Combined covalent
and noncovalent carboxylation of carbon nanotubes for sensitivity enhancement of clinical
immunosensors. Chemical Communications, 2016, 52, 13039-13042.
17. Ma, B., Shatsky, M., Wolfson, H.J., and Nussinov, R., Multiple diverse ligands binding at a
single protein site: A matter of pre‐existing populations. Protein Science, 2002, 11, 184-197.
18. Tang, Z., and Ma, Z., Multiple functional strategies for amplifying sensitivity of amperometric
immunoassay for tumor markers: A review. Biosensors and Bioelectronics, 2017, 98, 100-112.

20
19. Dutta, G., and Lillehoj, P.B., An ultrasensitive enzyme-free electrochemical immunosensor
based on redox cycling amplification using methylene blue. Analyst, 2017, 142, 3492-3499.
20. Akanda, M.R., and Ju, H., Ferritin-Triggered Redox Cycling for Highly Sensitive
Electrochemical Immunosensing of Protein. Analytical Chemistry. 2018, 90 , 8028–8034.
21. Wang, H., and Ma, Z., A cascade reaction signal-amplified amperometric immunosensor
platform for ultrasensitive detection of tumour marker. Sensors and Actuators B: Chemical,
2018, 254, 642-647.
22. Carvajal, S., Fera, S.N., Jones, A.L., Baldo, T.A., Mosa, I.M., Rusling, J.F., and Krause, C.E.,
Disposable InkJet-Printed Electrochemical Platform for Detection of Clinically Relevant HER-
2 Breast Cancer Biomarker. Biosensors and Bioelectronics, 2018, 104, 158-162.
23. Khetani, S., Ozhukil Kollath, V., Kundra, V., Nguyen, M.D., Debert, C., Sen, A., Karan, K.,
and Sanati-Nezhad, A., bPolyethylenimine Modified Graphene-Oxide Electrochemical
Immunosensor for the Detection of Glial Fibrillary Acidic Protein in Central Nervous System
Injury. ACS Sensors, 2018, 3, 844-851.
24. Singh, V., and Krishnan, S., Voltammetric immunosensor assembled on carbon-pyrenyl
nanostructures for clinical diagnosis of type of diabetes. Analytical Chemistry, 2015, 87, 2648-
2654.
25. Niroula, J., Premaratne, G., Shojaee, S.A., Lucca, D.A., and Krishnan, S., Combined covalent
and noncovalent carboxylation of carbon nanotubes for sensitivity enhancement of clinical
immunosensors. Chemical Communications, 2016, 52, 13039-13042.
26. Premaratne, G., Niroula, J., Patel, M. K., Zhong, W., Suib, S.L., Kalkan, A.K., and Krishnan,
S., Electrochemical and Surface Plasmon Correlation of Serum Autoantibody Immunoassay
with Binding Insights: Graphenyl vs. Mercapto-Monolayer Surface, 2018, In revision.
27. Chiu, N.F., Huang, T.Y., Lai, H.C., and Liu, K.C., Graphene oxide-based SPR biosensor chip
for immunoassay applications. Nanoscale Research Letters, 2014, 9, 445.

21
28. Patil, A.V., Fernandes, F.B., Bueno, P.R., and Davis, J.J., Graphene-based protein biomarker
detection. Bioanalysis, 2015, 7, 725-742.
29. Wang, Y., Zhang, Y., Wu, D., Ma, H., Pang, X., Fan, D., Wei, Q., and Du, B., Ultrasensitive
label-free electrochemical immunosensor based on multifunctionalized graphene
nanocomposites for the detection of alpha fetoprotein. Scientific Reports, 2017, 7, 42361.
30. Luna, D.M., Avelino, K.Y., Cordeiro, M.T., Andrade, C.A., and Oliveira, M.D.,
Electrochemical immunosensor for dengue virus serotypes based on 4-mercaptobenzoic acid
modified gold nanoparticles on self-assembled cysteine monolayers. Sensors and Actuators B:
Chemical, 2015, 220, 565-572.
31. Singh, V., and Krishnan, S., An electrochemical mass sensor for diagnosing diabetes in human
serum. Analyst, 2014, 139, 724-728.
32. Krishnan, S., Mani, V., Wasalathanthri, D., Kumar, C.V., and Rusling, J.F., Attomolar
detection of a cancer biomarker protein in serum by surface plasmon resonance using
superparamagnetic particle labels. Angewandte Chemie International Edition, 2011, 50, 1175-
1178.
33. Hinman, S.S., McKeating, K.S., and Cheng, Q., Surface Plasmon Resonance: Material and
Interface Design for Universal Accessibility. Analytical Chemistry, 2017, 90, 19-39.
34. Fasoli, J.B., and Corn, R.M., Surface enzyme chemistries for ultrasensitive microarray
biosensing with SPR imaging. Langmuir, 2015, 31, 9527-9536.
35. Sankiewicz, A., Romanowicz, L., Pyc, M., Hermanowicz, A., and Gorodkiewicz, E., SPR
imaging biosensor for the quantitation of fibronectin concentration in blood samples. Journal
of Pharmaceutical and Biomedical Analysis, 2018, 150, 1-8.
36. Hu, F., Xu, J., and Chen, Y., Surface Plasmon Resonance Imaging Detection of Sub-
femtomolar MicroRNA. Analytical Chemistry, 2017, 89, 10071-10077.

22
37. Hendriks, J., Stojanovic, I., Schasfoort, R.B., Saris, D.B., and Karperien, M., Nanoparticle
Enhancement Cascade for Sensitive Multiplex Measurements of Biomarkers in Complex
Fluids with Surface Plasmon Resonance Imaging. Analytical Chemistry, 2018, 90, 6563-6571.
38. Castiello, F.R., and Tabrizian, M., Multiplex Surface Plasmon Resonance Imaging-Based
Biosensor for Human Pancreatic Islets Hormones Quantification. Analytical Chemistry, 2018,
90, 3132-3139.
39. Premaratne, G., Al Mubarak, Z.H., Senavirathna, L., Liu, L,. and Krishnan, S., Measuring
ultra-low levels of nucleotide biomarkers using quartz crystal microbalance and SPR
microarray imaging methods: A comparative analysis. Sensors and Actuators B: Chemical,
2017, 253, 368-375.
40. Premaratne, G., Dharmaratne, A.C., Al Mubarak, Z.H., and Krishnan, S., Multiplexed surface
plasmon assay for serum proteins and microRNAs: signal amplification by bimetallic
Fe3O4@Au nanoparticles. 2018, submitted.
41. Srinoi, P., Chen, Y.T., Vittur, V., Marquez, M.D., and Lee, T.R., Bimetallic Nanoparticles:
Enhanced Magnetic and Optical Properties for Emerging Biological Applications. 2018,
(doi:10.20944/preprints201804.0104.v1)
42. Pham, T.T.H., Cao, C., and Sim, S.J., Application of citrate-stabilized gold-coated ferric oxide
composite nanoparticles for biological separations. Journal of Magnetism and Magnetic
Materials, 2008, 320, 2049-2055.
43. Jain, P.K., Xiao, Y., Walsworth, R., and Cohen, A.E., Surface plasmon resonance enhanced
magneto-optics (SuPREMO): Faraday rotation enhancement in gold-coated iron oxide
nanocrystals. Nano Letters, 2009, 9, 1644-165.

23
CHAPTER 2
PYRENYL CARBON NANOSTRUCTURES FOR ULTRASENSITIVE MEASUREMENTS
OF FORMALDEHYDE IN URINE
2.1 Introduction
Biomarkers are molecular indicators that play a crucial role in the diagnosis, prognosis, and
theranostics of diseases such as cancer.1 As a result, bioanalytical methods that allow sensitive and
selective measurements of biomarkers are significant for clinical applications and therapeutics
development. In view of diagnostic challenges, the molecular size of a biomarker present in
complex body fluid matrices inversely affects the detection sensitivity. This is because small
molecules do not yield measurable assay signal changes compared to large biomolecules.
Additionally, dilution of samples to minimize clinical matrix effects can further lower the
biomarker concentration and its detection. False-positive signals, tedious extraction procedures of
analytes from the matrices, simplicity of the assay and detection protocol, and selectivity are other
related problems.
Despite the issues described, nanotechnology-based optical and electrochemical methods have
allowed detection of large proteins, receptors, antibodies, DNA, and RNA biomarkers at clinically
relevant pM to aM concentrations in body fluids.2 However, development of such analytical assays
with simplicity, selectivity, sensitivity, and low-cost for detecting small-molecule markers of
Adapted from G. Premaratne, S. Farias, and S. Krishnan, Pyrenyl carbon nanostructures for ultrasensitive
measurements of formaldehyde in urine, Analytica Chimica Acta, 2017, 970, 23 –29 with permission from
Elsevier.

24
cancer and other diseases non-invasively remains to be a significant challenge. In particular,
bioanalytical methods for detection of ultra-low ppb levels of formaldehyde (HCHO) in a complex
clinical matrix (e.g., plasma, serum, urine) suffer by interferences from non-analyte components
present in the matrix (non-specific signals), poor detection capability, and issues of enzyme
instability and loss of enzyme activity. Furthermore, non-invasive detection of biomarker levels is
advantageous for routine diagnosis of these diseases at an early stage as it eliminates painful
invasive procedures (e.g., biopsy, bronchoscopy), which are known to cause tissue and organ
damage.3 Moreover, we can eliminate minimally invasive procedures, such as drawing of blood
from patients for analysis.4 In this study, we demonstrate for the first time the design of pyrenyl
carbon nanostructure modified electrodes for formaldehyde dehydrogenase (FDH) immobilization
and electrochemical quantitation of HCHO in a urine matrix with a 6 ppb detection limit.
Aldehydes, including HCHO, have received considerable attention as a key class of volatile organic
compound markers that exhibit toxic effects in humans, and are suggested to be relevant for cancer
and neural diseases.5-8 Many techniques have been developed to detect HCHO, including
spectrophotometric,9 electrochemical,10,11 optical,12 electronic,13 and colorimetric14 methods.
Sensitive detection of urine HCHO by chromatography-mass spectrometry methods is known.
However, these methods involve expensive instrumentation, and time consuming laborious sample
preparation, measurement, and analysis steps.5 In contrast, electrochemical methods are
straightforward and cost effective.15,16 In particular, electrochemical enzymatic amperometric
biosensors offer the advantages of direct and quick detection of analytes with simplicity. By
appropriate design of surface strategies, high sensitivity, robustness, and excellent reproducibility
can be attained.
FDH (~ 170 kDa), an enzyme of the oxidoreductase family,17,18 is a homotetrameric enzyme
containing 398 amino acids per subunit. Ali et al. developed a biosensor made from NAD+ and
glutathione-dependent recombinant FDH immobilized on the surface of a Si/SiO2/Si3N4 structure.11

25
A mediator-based amperometric biosensor was constructed on disks of woven graphite gauze
coated with NAD+ and glutathione-independent FDH from Hyphomicrobium zavarzinii strain ZV
58.19 Demkiv et al. modified platinized graphite electrodes with NAD+ and glutathione-dependent
FDH isolated from a genetically engineered strain H. polymorpha. In that study, electron transfer
between the enzyme and the electrode was established using low molecular weight redox mediators
or positively charged cathodic electrodeposition paints modified with Os-bis-N,N-(2,2'-bipyridyl)-
chloride ([Os(bpy)2Cl]).20 FDH from Pseudomonas sp. immobilized on mesoporous silica
materials21 and multiwalled carbon nanotube-modified screen printed electrodes22 for HCHO
detection in buffer solution have been developed.
Herein, we report for the first-time 1-pyrenebutyric acid (PBA) pi-pi stacked with carboxylated
multiwalled carbon nanotubes (MWNTs) on the surface of the gold screen printed electrodes
(AuSPEs) for covalent FDH immobilization offering highly sensitive and selective ultra-low
detection HCHO concentration in a 10-times buffer diluted urine. We combined here the –COOH
groups of MWNTs with the non-covalently attached PBA because this combination approach,
discovered by us recently, offered 3-fold improved sensitivity for a serum insulin immunosensor
compared to the use of only carboxylated MWNTs.23 HCHO was quantitated using a quinone
compound (Q: 1, 2-naphthaquinone-4-sulfonic acid sodium salt) as an electron transfer mediator to
obtain electrochemical signals in proportion to HCHO concentration. To our knowledge, this is the
first report of a pyrenyl carbon nanostructure based enzymatic bioelectrode for urine HCHO
quantitation.
2.2 Experimental
2.2.1 Materials and chemicals
Gold screen printed electrodes (AuSPEs) with a three-electrode cell configuration integrated on a
ceramic substrate (Model: 250 BT, 4 mm diameter Au working electrode, Pt counter electrode, and

26
Ag pseudo reference electrode) were purchased from DropSens Inc. (Spain). Multiwalled
carboxylic acid functionalized carbon nanotubes (MWNTs, > 8% carboxylic acid functionalized,
avg. diam. 9.5 nm, length 1.5 µm), β-nicotinamide adenine dinucleotide sodium salt (NAD+), FDH
from Pseudomonas sp., PBA, 1,2-naphthaquinone-4-sulfonic acid sodium salt (Q), HCHO solution
(36.5 – 38% in water), 1-ethyl-3-[3-dimethylaminopropyl]carbodiimide hydrochloride (EDC),
N-hydroxysuccinimide (NHS), and formaldehyde-2,4-dinitrophenylhydrazone analytical standard
(HCHO-DNPH) for liquid chromatography were purchased from Sigma and were used as received.
Vivaspin 6 ultrafiltration cartridges (molecular weight cut off: 3 kDa, GE Healthcare, Little
Chalfont, Buckinghamshire, UK) were used for filtration of urine. All aqueous reagents were
prepared in deionized water (DI H2O) using a Milli-DI water purification system (Millipore Ltd.,
Billerica, Massachusetts, USA). All other chemicals were high purity analytical grade.
2.2.2 Instrumentation
Amperometric measurements were performed at room temperature (23 oC) using a CHI 6017E
electrochemical workstation coupled to a faraday cage and a picoamp booster (Austin, TX, USA).
The flow-cell was connected to a syringe pump system (New Era Pump Systems Inc., NY, USA)
and a sample injector valve (Rheodyne model 9725i PEEK injector, IDEX Health & Science LLC,
CA, USA). The sample loop volume was 200 μL. Spectroscopic characterizations of the
bioelectrode fabrication steps were carried out using Fourier transform infrared spectroscopy
(FTIR, Thermo Scientific Nicolet iS50) in the attenuated total reflectance (ATR) mode. The
bioelectrodes were placed directly on the ATR diamond crystal and 32 scans were taken and
averaged to obtain a good signal-to-noise ratio. In addition, Raman spectroscopy (Nicolet NXR
FT-Raman module, Nd:YVO4 laser, 1064 nm, 0.2 W, resolution 4 cm-1) and electrochemical
impedance spectroscopy (Interface 1000 potentiostat/galvanostat/ZRA, Gamry instruments,
Warminster, PA) were used for the characterization of the designed bioelectrode. Liquid
chromatography-mass spectrometry (LC-MS) with an electrospray ionization source (Shimadzu
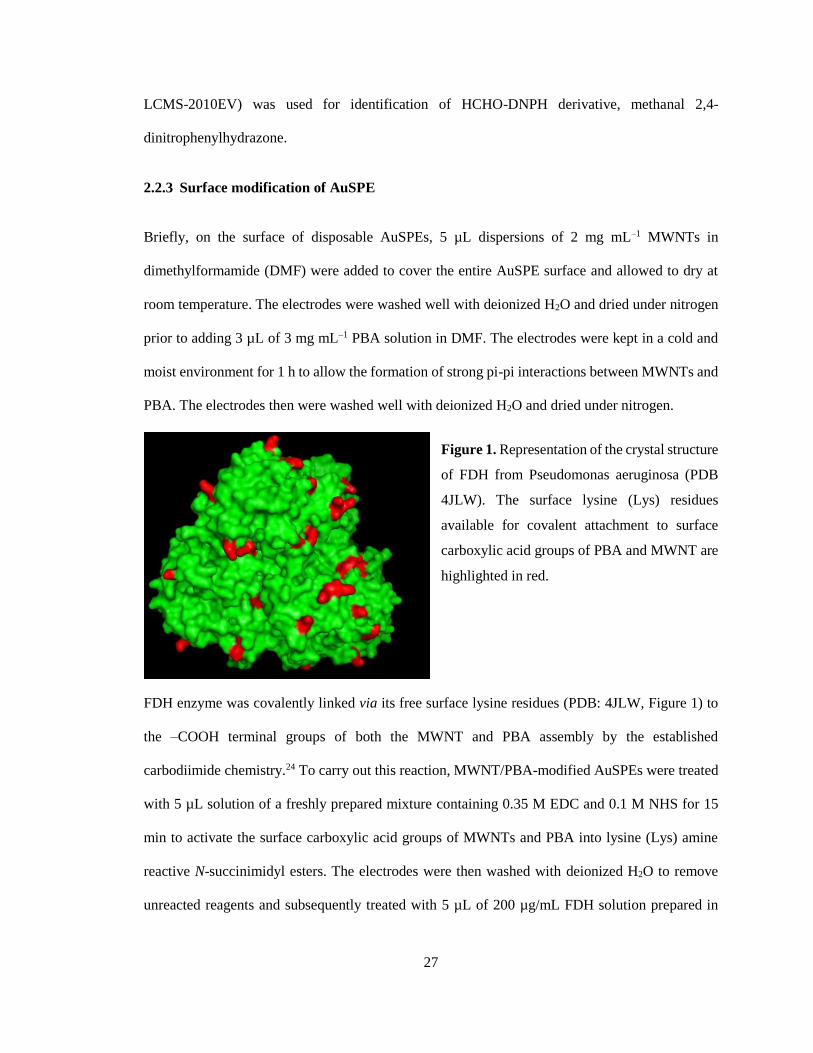
27
LCMS-2010EV) was used for identification of HCHO-DNPH derivative, methanal 2,4-
dinitrophenylhydrazone.
2.2.3 Surface modification of AuSPE
Briefly, on the surface of disposable AuSPEs, 5 µL dispersions of 2 mg mL–1 MWNTs in
dimethylformamide (DMF) were added to cover the entire AuSPE surface and allowed to dry at
room temperature. The electrodes were washed well with deionized H2O and dried under nitrogen
prior to adding 3 µL of 3 mg mL–1 PBA solution in DMF. The electrodes were kept in a cold and
moist environment for 1 h to allow the formation of strong pi-pi interactions between MWNTs and
PBA. The electrodes then were washed well with deionized H2O and dried under nitrogen.
Figure 1. Representation of the crystal structure
of FDH from Pseudomonas aeruginosa (PDB
4JLW). The surface lysine (Lys) residues
available for covalent attachment to surface
carboxylic acid groups of PBA and MWNT are
highlighted in red.
FDH enzyme was covalently linked via its free surface lysine residues (PDB: 4JLW, Figure 1) to
the –COOH terminal groups of both the MWNT and PBA assembly by the established
carbodiimide chemistry.24 To carry out this reaction, MWNT/PBA-modified AuSPEs were treated
with 5 µL solution of a freshly prepared mixture containing 0.35 M EDC and 0.1 M NHS for 15
min to activate the surface carboxylic acid groups of MWNTs and PBA into lysine (Lys) amine
reactive N-succinimidyl esters. The electrodes were then washed with deionized H2O to remove
unreacted reagents and subsequently treated with 5 µL of 200 µg/mL FDH solution prepared in

28
phosphate buffered saline (PBS) and incubated for 1 h to obtain covalently linked FDH films. The
prepared electrodes were used immediately for measuring HCHO in urine.
2.2.4 Chronoamperometric detection of formaldehyde in urine samples
Urine samples were collected from a healthy male adult volunteer in a 50 mL sterile polyethylene
vial. Samples were then immediately vortexed and divided into 10 mL aliquots and stored at -20
oC for up to 30 days to avoid any storage loss. Before use, the frozen samples were thawed at
room temperature. Prior to spiking with formaldehyde, a 6 mL aliquot of the urine sample was
subjected to centrifugal filtration using Vivaspin-6 cartridges at a speed of 4000 rpm for 30 min at
room temperature.25 Filtered urine samples were diluted 10-times in PBS. Various concentrations
of formaldehyde were spiked in the 10-times diluted urine and were used for analysis.
Figure 2. (A) Schematic of the microfluidics system used in this study. (B) Fabrication steps of the
AuSPEs with FDH and the reaction sequence for catalyzing HCHO and detection by flow injection
or stirred solution amperometry.
FDH-immobilized AuSPE/MWNT/PBA electrodes were attached to an in-house designed flow cell
that was connected to a syringe pump and a sample injector (Figure 2A). The running buffer was
made up of PBS containing 5 mM NAD+ and 1 mM Q. Various concentrations of HCHO prepared
in 10-times diluted urine in PBS were injected via a manual injector valve onto the bioelectrode
surface. Real-time measurements of the oxidation currents of QH2 formed from NADH as a result

29
of FDH catalyzed HCHO oxidation were performed at an applied constant potential of + 0.35 V
(Figure 2B).21,26 The current versus HCHO concentration was plotted and the resulting curve was
fit by the Michaelis-Menten non-linear regression equation available with the K-graph software
used.
2.3 Results and Discussion
2.3.1 FTIR characterization of the modified electrodes
Figure 3 shows the baseline corrected FTIR-ATR results for the modified bioelectrode surface that
confirmed the covalent immobilization of FDH onto the –COOH groups of AuSPE/MWNT/PBA
electrodes. A strong vibrational peak at 1714 cm–1 indicated the presence of carbonyl stretching
from the –COOH groups of MWNTs. Pi-pi stacking of PBA with MWNTs red shifted the C=O
stretching vibration to 1698 cm–1, which has been attributed to the partial electron transfer from
PBA to MWNT resulting in a relatively weaker C-C bond strength in the MWNT/PBA complex
than the MWNT alone.27 Additionally, a broad peak at 3136 cm–1 for the O-H stretching was
observed.28 Following covalent FDH attachment via coupling of Lys amines with surface
carbodiimide activated (EDC/NHS) -COOH groups of PBA and MWNTs forming amide bonds,
typical amide-I and amide-II bands from the peptide backbone of FDH were observed at 1683 and
1603 cm–1, respectively.29 The disappearance of the prior O-H stretching and appearance of a new
broad band at 3472 cm–1 arising from N-H stretching of FDH indicated amide bond formation and
thus the enzyme immobilization. Furthermore, it is possible that a partial non-covalent adsorption
of the FDH onto the MWNT/PBA surface cannot be ruled out. Despite this, based on the observed
FTIR spectral changes of the surface carboxylic acids the covalent FDH attachment is evident.

30
Figure 3. FTIR spectra of AuSPE coated
with (a) carboxylated MWNTs, (b) after
PBA stacking, and (c) after covalent
immobilization of FDH
2.3.2 Raman characterization of the nano-bioelectrode fabrication steps
Figure 4 represents the Raman spectra of AuSPE coated with MWNT, after pi-pi stacking with
PBA, and subsequent covalent immobilization of FDH by Lys amine-carboxylic acid coupling
chemistry using EDC/NHS reagents. The Raman spectrum of carboxylated MWNT-coated
AuSPEs showed the characteristics D, G, and G′ bands at 1316, 1594, and 2614 cm-1,
respectively.30,31 Decrease in frequency of these bands to 1304, 1585, and 2605 cm-1, respectively,
as a result of pi-pi stacking of the PBA molecules was observed.32,33
Figure 4. Raman spectra of AuSPEs
coated with (a) Carboxylated
MWNTs, (b) after PBA stacking, and
(c) after covalent immobilization of
FDH.

31
Another band at 2902 cm-1 can be attributed to the aromatic C-H groups arising from PBA
molecules. A further shift in the G band and the appearance of new peaks at 1634 and 3310 cm-1
indicated the presence of amide groups confirming the covalent attachment of FDH onto
MWNT/PBA assembly on AuSPEs.
2.3.3 Electrochemical impedance spectroscopy characterization
Figure 5 represents the Nyquist plots corresponding to the faradaic impedance measurements for
each step of the FDH bioelectrode construction in an aqueous solution containing 0.1 M KCl and
a mixture of 10 mM of each potassium ferricyanide and potassium ferrocyanide redox probe
[Fe(CN)63-/4-]. The Randles equivalent circuit model was used to fit the experimental impedance
spectra to estimate the charge transfer resistance (Rct) similar to our prior report.34 MWNT/PBA
modification of AuSPE surface decreased the Rct and thus made the surface more conductive (inset
of Figure 5 for clarity). This is suitable for facilitating interfacial charge transport. Subsequent
covalent attachment of the FDH enzyme onto the EDC/NHS activated surface –COOH groups of
PBA and MWNT increased the Rct value, as would be expected for non-conductive enzyme
molecules.

32
Figure 5. Faradaic impedance spectroscopic measurements of Rct values in an aqueous solution
containing 0.1 M KCl and 10 mM of Fe(CN)63-/4- for stepwise modification of (a) AuSPE (1792
Ω), (b) after dry-coating of MWNT (154 Ω), (c) after pi-pi stacking of PBA (67 Ω), and (d) after
covalent immobilization of FDH (410 Ω). Experimental conditions: 0.2 V vs Ag/AgCl, amplitude
10 mV, and frequency range 0.1-100 kHz.
2.3.4 Amperometric response for the stirred vs flow injection analysis
The enzyme fabricated SPEs were assessed for HCHO oxidation in a 10-times diluted urine matrix.
The ability of the enzyme to function well in the urine matrix was very important, and thus adequate
NAD+ cofactor (5 mM) was supplied. Ten times dilution of urine provided the optimum
performance of the FDH bioelectrode with minimal non-specific signals in the working potential
region as discussed below. FDH-catalyzed detection of HCHO was performed according to the
reaction sequence shown in Figure 2B. Q was used as the electron transfer mediator to transfer
electrons to the electrode from NADH formed in solution as a result of the FDH-catalyzed HCHO
oxidation.21 This in turn regenerates NAD+ to receive subsequent protons upon HCHO oxidation.

33
Upon dilution of the urine matrix, an increase in the amperometric current was observed (Figure 6,
tested using 1 ppm of HCHO for method optimization). This could be attributed to the reduction in
high salt concentration and other interfering agents for the optimum performance of the sensor
and/or the FDH enzyme.35 Diluting the urine samples more than ten times did not significantly
increase the amperometric response. Hence, ten times dilution of the urine was selected for further
studies.
Figure 6. Amperometric responses (after subtraction of signals for control urine sample with no
spiked HCHO) of flow injection analysis of 1 ppm HCHO at various dilutions of urine samples
with PBS (pH 7.4) containing 5 mM NAD+ and 1 mM Q delivered a flow rate of 100 µL min–1 at
an applied potential of + 0.35 V at 23 oC.
Figure 7A-a shows the increase in currents of the bioelectrode in stirred solutions containing
various concentrations of HCHO from ppb to ppm levels in 10-times diluted urine matrix at an
optimum solution stirring rate of 150 rpm. Linearity of the currents vs. concentration of HCHO
was observed between 100 ppb and 16 ppm (initial range in Fig. 7A-b), which is a wide dynamic
range useful for clinical assay of such markers. A deviation from the linearity was observed at
higher concentrations of HCHO (i.e., > 16 ppm) and followed typical electrochemical Michaelis-
Menten enzyme kinetics (Fig. 7A-b).36 The estimated apparent Michaelis-Menten constant (KMapp)
using KaleidaGraph software (version 4.1) was 19.9 ± 4.6 ppm. The limit of detection (LOD) (the

34
signal at three times the standard deviation of the mean of the HCHO unspiked control urine
sample37) of the described stirred solution-based HCHO detection was 73 ppb.
To examine improvements on the detection sensitivity of the stirred solution method by facilitating
better mass transport of HCHO and other assay reagents, we used flow injection analysis.38
The cofactor and electron transfer mediator containing solution mixture (5 mM NAD+ and 1 mM
Q in PBS, pH 7.4) was delivered at an optimum flow rate of 100 µL min–1 onto the FDH
bioelectrode surface using a syringe pump. Various concentrations of HCHO spiked in 10-times
diluted urine in PBS (pH 7.4) then were injected via a manual injection valve, and the resulting
oxidation currents were measured (Figure 7B-a).
The sensitivity of HCHO detection was only moderately enhanced (by two times) in the flow
injection method compared to the stirred solution (calculated from the slopes of the initial linear
range in Fig. 7A-b and 7B-b). A possible reason could be that the HCHO and mediators used are
small molecules. As a result the mass transport by convection (stirring vs fluid flow) does not seem
to be greatly different in view of sensitivity (i.e., the slope of response plots covering the linear
range of HCHO concentrations). Nevertheless, the flow injection analysis significantly decreased
the LOD to 6 ppb, which is 12-fold smaller than the stirred-solution method. This is likely because
diffusion of reactants to products (cofactor, urine matrix, and mediator reaching the electrode and
the product diffusing away) becomes much more prominent at the lowest concentration
corresponding to the LOD. As a result, the flow injection method for the designed bioelectrode
seems to be better than the stirred-solution analysis in facilitating effective electronic
communication of the low levels of urine HCHO with the surface of the AuSPE/MWNT/PBA
enzyme electrode.

35
Figure 7. (A) Stirred solution method: (a) Amperometric responses of the AuSPE/MWNT/PBA-
FDH bioelectrode for various concentrations of HCHO in 10-times diluted urine in PBS, pH 7.4,
containing 5 mM NAD+ and 1 mM Q at an applied potential of + 0.35 V at 23 oC and a constant
stirring of solution using a magnetic stirrer at 150 rpm. Inset shows the enlarged view for lower
HCHO concentrations. (b) Michaelis-Menten fit of the designed bioelectrode in oxidizing HCHO.
(B) Flow injection analysis: (a) Amperometric responses for the AuSPE/MWNT/PBA enzyme
bioelectrode upon injection of various concentrations of HCHO at a flow rate of 100 µL min–1.
Inset shows the enlarged view for lower HCHO concentrations. (b) The corresponding Michaelis-
Menten fit of the experimental data.
Reported studies based on chromatography and mass spectrometry methods identified increased
levels of HCHO present in the urine samples of patients with dementia and bladder cancer
conditions compared to healthy individuals. Thus, the obtained LOD of the FDH bioelectrode for
measuring HCHO in urine meets the reported clinically relevant range [e.g., bladder cancer (> 85

36
ppb),39 dementia (> 5.8 ppm),8a and early stages of cognitive impairments in older adults (> 330
ppb)8b]. The lower LOD illustrates the advantages of flow injection analysis in improving analyte
mass transport and minimizing noise levels, resulting in an enhanced signal-to-noise ratio and thus
an improved detection limit. The linear dynamic range of our flow analysis for HCHO in 10-times
diluted urine was from 10 ppb to 10 ppm.
The relationship between current signal and HCHO concentration was fit by the Michaelis-Menten
non-linear regression curve (Figure 7A-b and 7B-b) using KaleidaGraph software (version 4.1).
The estimated KMapp of flow injection method was 9.6 ± 1.2 ppm, which is better than the stirred-
solution method and likely due to enhanced substrate mass transport facilitating kinetically faster
steady state conditions in the flow system. The observed difference between the affinity constants
was calculated to be significant at 95% confidence level. Previously reported KM values of HCHO
solution bioassays were 5.4 ppm for FDH from genetically engineered H. polymorpha,20 7.5–8.7
ppm for a homologous enzyme from Candida boidinii,40 6.3 ppm for FDH from H. polymorpha,41
and 12.9 ppm for FDH from Pichia pastoris.42 Results indicate that the KMapp values obtained in
the present work are comparable with the reported bioassays.
Figure 8. Selectivity of the designed
AuSPE/MWNT/PBA-FDH bioelectrode
for HCHO over other similar analytes in
stirred solutions. Current signals for 5
ppm of analytes (x-axis) in 10-times
diluted urine solutions in PBS are shown.

37
The presented FDH bioelectrode design offers sensitivity, ultra-low clinically useful LOD, and
simplicity, but it is also essential to meet selectivity criteria for clinical diagnosis of small-molecule
disease markers. Figure 8 depicts the current signals for HCHO with two immediate aldehyde
homologues and with acetone and two types of alcohol. The current responses confirm the high
selectivity for HCHO, with ~ 25% cross-reactivity for acetaldehyde (CH3CHO) and negligible
cross-reactivity for propanaldehyde, acetone, methanol, and ethanol. The moderate cross-reactivity
for acetaldehyde suggests that the substrate binding pocket of the FDH enzyme has a slight affinity
for this immediate homologue of HCHO that does not vary significantly in size.
2.3.5 LC-MS confirmation of the presence of HCHO in the prepared urine samples by
derivatization with DNPH
The presence of spiked HCHO in the urine samples was independently verified by LC-MS (Figure
9).43-45 In brief, to a vial containing 5 mL of HCHO (5 ppm) in 10-times diluted urine, 2 mL of 1
mg mL-1 DNPH and 0.2 mL of 5 N H3PO4 were added and the solution was thoroughly mixed. The
solution was allowed to stand for 30 min for DNPH derivatization of HCHO forming a Schiff base
(methanal 2,4-dinitrophenylhydrazone derivative: HCHO-DNPH)). The samples were then filtered
using a 0.22 µm PTFE syringe membrane filter before analysis by LC-MS. A Premier C18, 3 µ
100 x 4.6 mm column (Schimadzu) was used with a mobile phase composition of acetonitrile:water
mixture (60:40) and a flow rate of 0.3 mL min-1. The LC peaks were detected using a photodiode
array detector operating in the wavelength range of 200-800 nm with a selected wavelength of 354
nm that corresponds to the HCHO-DNPH derivative. Mass spectra were recorded in the m/z range
of 100 to 350 Da using an electrospray ionization operated in negative ion mode. As shown in
Figure 9-A(a), the HCHO-DNPH derivative appears around 5.8 min in agreement with the peak of
the derivative standard [Figure 9-A(d)]. The peak at 4.5 min corresponds to the underivatized
DNPH in the sample [Figure 9-A(a and b)]. It can be noted that the blank urine sample does not

38
interfere with the derivative detection [Figure 9-A(c)]. The 209 m/z corresponds to the HCHO-
DNPH derivative that is in agreement with the prior report in literature (Figure 9-B).45
Figure 9. (A) LC-MS analysis of the presence of HCHO (5 ppm) in the prepared urine samples
(10-times diluted) by DNPH derivatization method. Separation of (a) DNPH derivatized urine
sample containing HCHO (5 ppm), (b) diluted urine sample with only DNPH, (c) diluted urine
sample alone, and (d) standard DNPH-HCHO derivative (20 ppm). (B) MS analysis showing the
209 Da peak for the formed DNPH-HCHO derivative in the urine sample.
2.3.6 Stability and selectivity of the electrode
The fabricated FDH bioelectrodes were tested for film stability in PBS (pH 7.4 at 23 oC) for 40 h
by non-faradaic impedance spectroscopy at an applied constant frequency of 5 Hz (Figure 10).46 A
stable impedance magnitude of 232 Ω was noted for more than 40 h. It is worth mentioning that
AuSPEs are intended to be for disposable use and hence the observed stability upon continuous
soaking of the modified, FDH attached SPE surface in a buffer solution is reasonably good.

39
Figure 10. Film stability assessment
of the designed AuSPE/MWNT/
PBA-FDH bioelectrode for 40 h
using electrochemical non-faradaic
impedance spectroscopy at an
applied frequency of 5 Hz in PBS,
pH 7.4, room temperature (23 oC).
Excluding the MWNT/PBA surface modification of AuSPEs, the bioelectrode design only required
one step for FDH immobilization and subsequent detection and quantitation of HCHO in 10-times
diluted urine. The various sample matrices used in the literature for HCHO and the reported linear
dynamic range, detection limit, sensitivity, and bioelectrode stability are presented in Table 1. This
comparison shows better performance of the pyrenyl-cabon nanostructure bioelectrode than simple
buffer solution-based HCHO quantitation methods.

40
Table 1. Comparison of the present MWNT/PBA-FDH nano-bioelectrode with relevant reported studies.
Sensor type Construction material Sensing method Sensing element Matrix Linear dynamic
range/ Sensitivity/
Detection limit
Ref.
Planar
electrochemical
transducers
Potentiometric sensor –
Si3N4-ISFET
Conductometric and
amperometric sensor – gold
interdigitated electrodes
vacuum deposited with
sintered aluminum oxide
Potentiometry,
conductometry,
and amperomety
Alcohol oxidase from
Hansenula polymorpha
10 mM Phosphate
buffer (pH 7.7)
150 – 9000 ppm
47
Enzyme biosensor Si/SiO2/Si3N4 structure as
physical transducers
Capacitance NAD+ and glutathione-
dependent recombinant
formaldehyde
dehydrogenase
2.5 mM Borate
buffer (pH 8.40)
0.3 – 600 ppm
Sensitivity
31 mV/ decade
Detection limit
0.3 ppm
11
Amperometric
enzyme sensor
Disks of woven graphite
gauze
Amperometry NAD+ and glutathione-
independent
formaldehyde
dehydrogenase from
0.1 M KCl,
80mM KH2PO4
(pH 8.0)
0.5 – 15 ppm
Sensitivity
0.39 µA/ppm
19

41
Hyphomicrobium
zavarzinii strain ZV 58
Amperometric
biosensor
Platinized graphite electrode
modified with low-molecular
free-diffusing redox
mediators or positively
charged cathodic
electrodeposition paints
modified with Os-bis-N,N-
(2,2’-bipyridil)-chloride
([Os(bpy)2Cl])
Amperometry NAD+ and glutathione-
dependent
formaldehyde
dehydrogenase isolated
from a gene-engineered
strain of the
methylotrophic
yeast Hansenula
polymorpha
20 mM Phosphate
buffer (pH 8.2)
0.3 – 3 ppm
Sensitivity
358 Am−2 M−1
Detection limit
90 ppb
20
Electrochemical
biosensor
Glassy carbon electrode
containing a membrane
constructed with
mesoporous silica materials
Amperometry Formaldehyde
dehydrogenase
from Pseudomonas sp.
Phosphate buffer
(pH 7.4)
30 ppb – 30 ppm
Detection limit
36 ppb
21
Electrochemical
biosensor
Screen-printed carbon
electrode modified with
MWCNT
Amperometry Formaldehyde
dehydrogenase
from Pseudomonas
putida
PBS (based on in
situ released
HCHO from a
prodrug treated
cancer cells in
PBS)
3 ppb – 3 ppm
Detection limit
300 ppb
22

42
Electrochemical
biosensor
Screen printed gold
electrodes modified with
MWNT/PBA-FDH via the –
COOH groups of both
MWNT and PBA
Amperometry Formaldehyde
dehydrogenase from
Pseudomonas sp.
10-times diluted
urine (in PBS, pH
7.4)
Stirred solution
analysis:
100 ppb - 16 ppm
Sensitivity (based on
the initial linear range,
Fig. 3)
174 nA/ppm
Detection limit
73 ppb
Flow injection
analysis:
10 ppb – 10 ppm
Sensitivity (based on
the initial linear range,
Fig. 3)
342 nA/ppm
Detection limit
6 ppb
This
work

43
2.4 Conclusions
Ther results presented confirm the analytical detection features of pyrenyl carbon nanostructure-
modified FDH bioelectrode for sensitive and selective quantitation of urine HCHO related to
abnormal conditions that are known to result in elevated urine HCHO. The presented approach
provides a viable nano-bioelectrode design for non-invasive detection of small-molecule markers
for cancer and other diseases at clinically relevant ultra-low levels in complex matrices. Combining
the current method with measurements of other biomarkers and assays of significance is expected
to allow successful diagnostic outcome of an abnormal condition. By appropriate immobilization
of marker specific-receptor molecules or enzymes coupled with a detection probe or mechanism,
the proposed methodology is expected to allow broader applicability for quantitative measurement
of any other small-molecule markers with selectivity.
Author contribution
Gayan Premaratne performed the majority of experiments, data analysis and drafted the manuscript.
Sabrina Farias performed the repeats of the amperometric experiments. Dr. Sadagopan Krishnan
provided thoughtful insights into this research project and reviewed the manuscript.

44
2.5 References
1. a) J.A. Ludwig, J.N. Weinstein, Biomarkers in cancer staging, prognosis and treatment
selection, Nat. Rev. Cancer. 5 (2005) 845-856; b A. de Gramont, S. Watson, L.M. Ellis, J.
Rodón, J. Tabernero, A. de Gramont, S.R. Hamilton, Pragmatic issues in biomarker evaluation
for targeted therapies in cancer, Nat. Rev. Clin. Oncol. 12 (2015) 197-212; c) M. Kalia,
Biomarkers for personalized oncology: recent advances and future challenges, Metabolism 64
(2015) S16-S21; d) S. Surinova, L. Radová, M. Choi, J. Srovnal, H. Brenner, O. Vitek, M.
Hajdúch, R. Aebersold, Non‐invasive prognostic protein biomarker signatures associated with
colorectal cancer, EMBO Mol. Med. 7 (2015) 1153-1165.
2. G. Shipp, Ultrasensitive measurement of protein and nucleic acid biomarkers for earlier disease
detection and more effective therapies, Biotechnol. Healthc. 3 (2006) 35-40; b) M.
Swierczewska, G. Liu, S. Lee, X. Chen, High-sensitivity nanosensors for biomarker detection,
Chem. Soc. Rev. 41 (2012) 2641-2655; c) S.B. Nimse, M.D. Sonawane, K. S. Song, T. Kim,
Biomarker detection technologies and future directions, Analyst 141 (2016) 740-755; d) J.F.
Rusling, C.V. Kumar, J.S. Gutkind and V. Patel, Measurement of biomarker proteins for point-
of-care early detection and monitoring of cancer, Analyst 135 (2010) 2496-2511; e) S.
Krishnan, V. Mani, D. Wasalathanthri, C.V. Kumar, J.F. Rusling, Attomolar detection of a
cancer biomarker protein in serum by surface plasmon resonance using superparamagnetic
particle labels, Angew. Chem. Int. Ed. 50 (2011) 1175 –1178; f) V. Singh, S. Krishnan,
Voltammetric immunosensor assembled on carbon-pyrenyl nanostructures for clinical
diagnosis of type of diabetes, Anal. Chem., 87 (2015) 2648-2654.
3. Y.S.L. Cheng, T. Rees, J. Wright, A review of research on salivary biomarkers for oral cancer
detec-tion, Clin. Transl. Med. 3 (2014) 1.
4. a) H. M. Heneghan, N. Miller, A.J. Lowery, K. J. Sweeney, J. Newell, M.J. Kerin, Circulating
microRNAs as novel minimally invasive biomarkers for breast cancer, Ann. Surg. 251 (2010)

45
499-505; b) J. Wang, J. Chen, P. Chang, A. LeBlanc, D. Li, J.L. Abbruzzesse, M. L. Frazier,
A.M. Killary and S. Sen, MicroRNAs in plasma of pancreatic ductal adenocarcinoma patients
as novel blood-based biomarkers of disease, Cancer Prev. Res. 2 (2009) 807-813; c) N.
Goossens, S. Nakagawa, X. Sun and Y. Hoshida, Cancer biomarker discovery and validation,
Transl. Cancer Res. 4 (2015) 256.
5. J. Zhang, R. Sun, Y. Chen, K. Tan, H. Wei, L. Yin, Y. Pu, Small Molecule Metabolite
Biomarker Candidates in Urine from Mice Exposed to Formaldehyde, Int. J. Mol. Sci. 15
(2014) 16458-16468.A. Songur, O.A. Ozen, M. Sarsilmaz, The toxic effects of formaldehyde
on the nervous system. In Reviews of environmental contamination and toxicology, Springer
New York, (2010) 105-118.
6. A. Songur, O.A. Ozen, M. Sarsilmaz, The toxic effects of formaldehyde on the nervous system.
In Reviews of environmental contamination and toxicology, Springer New York, (2010) 105-
118.
7. a) B. Buszewski, M. Kęsy, T. Ligor, A. Amann, Human exhaled air analytics: biomarkers of
diseases, Biomed. Chrom. 21 (2007) 553-566; b) P. Fuchs, C. Loeseken, J. K. Schubert, W.
Miekisch, Breath gas aldehydes as biomarkers of lung cancer, Int. J. Cancer. 126 (2010) 2663-
2670; c) A. Wehinger, A. Schmid, S. Mechtcheriakov, M. Ledochowski, C. Grabmer, G.A.
Gastl, A. Amann, Lung cancer detection by proton transfer reaction mass-spectrometric
analysis of human breath gas, Int. J. Mass Spectrom. 265 (2007) 49-59.
8. a) Z. Tong, J. Zhang, W. Luo, W. Wang, F. Li, H. Li, H. Luo, J. Lu, J. Zhou, Y. Wan, R. He,
Urine formaldehyde level is inversely correlated to mini mental state examination scores in
senile dementia, Neurobiol. Aging 32 (2011) 31-41; b) J. Yu, T. Su, T. Zhou, Y. He, J. Lu, J.
Li, R. He, Uric formaldehyde levels are negatively correlated with cognitive abilities in healthy
older adults, Neurosci. Bull. 30 (2014) 172-184; c) Z.H. Hao, W.J. Li, M. Li, R. He, Correlation
of urine formaldehyde levels and mini mental state examination scores in Alzheimer’s disease,
Chin. J. Gerontol. 31 (2011) 3442-3444.

46
9. Y.Y. Maruo, J. Nakamura, M. Uchiyama, M. Higuchi, K. Izumi, Development of formaldehyde
sensing element using porous glass impregnated with Schiff's reagent, Sens. Actuators B Chem.
129 (2008) 544-550.
10. a) F. Vianello, A. Stefani, M.L. Di Paolo, A. Lui, B. Margesin, M. Zen, M. Scarpa, G. Soncini,
Potentiometric detection of formaldeyde in air by an aldehyde de-hydrogenase FET Sens.
Actuators B. 37 (1996) 49–54; b) R. L. Bunde, E. J. Jarvi and J. J. Rosebtreter, A piezoelectric
method for monitoring formaldehyde induced cross-link formation between poly-lysine and
poly-deoxyguanosine, Talanta 51 (2000) 159–171; c) T. Kida, N. Morinaga, S. Kishi, K.M.
An, K.W. Sim, B.Y. Chae, J.K. Kim, B.K. Bong-Ki Ryu, K. Shimanoe, Electrochemical
detection of volatile organic compounds using a Na3Zr2Si2PO12/Bi2Cu0.1V0.9O5.35
heterojunction device, Electrochim. Acta. 56 (2011) 7484-7490; d) W. Vastarella, R. Nicastri,
Enzyme/semiconductor nanoclusters combined systems for novel amperometric biosensors,
Talanta, 66 (2005) 627-633; e) T. Chen, Q. Liu, Z. Zhou, Y. Wang, The fabrication and gas-
sensing characteristics of the formaldehyde gas sensors with high sensitivity, Sens. Actuators
B Chem. 131 (2008) 301-305; f) J. Wang, P. Zhang, J.Q. Qi, P.J. Yao, Silicon-based micro-gas
sensors for detecting formaldehyde, Sens. Actuators B Chem. 136 (2009) 399-404; g) H. Dai,
L. Gong, G. Xu, X. Li, S. Zhang, Y. Lin, B. Zeng, C. Yang, G. Chen, An electrochemical
impedimetric sensor based on biomimetic electrospun nanofibers for formaldehyde, Analyst
140 (2015) 582-589.
11. M.B. Ali, M. Gonchar, G. Gayda, S. Paryzhak, M. Maaref, N. Jaffrezic-Renault, Y. Korpan,
Formaldehyde-sensitive sensor based on recombinant formaldehyde dehydrogenase using
capacitance versus voltage measurements. Biosens. Bioelectron. 22 (2007) 2790-2795.
12. a) S. Friedfeld, M. Fraser, D. Lancaster, D. Leleux, D. Rehle, F. Tittel, Field intercomparison
of a novel optical sensor for formaldehyde quantification, Geophys. Res. Lett. 27 (2000) 2093–
2096; b) H. Kudo, Y. Suzuki, T. Gessei, D. Takahashi, T. Arakawa, K. Mitsubayashi,

47
Biochemical gas sensor (bio-sniffer) for ultrahigh-sensitive gaseous formaldehyde monitoring,
Biosens. Bioelectron. 26 (2010) 854-858.
13. a) J.A. Dirksen, K. Duval, T.A. Ring, NiO thin-film formaldehyde gas sensor, Sens. Actuators
B Chem. 80 (2001) 106-115; b) P. Lv, Z.A. Tang, J. Yu, F.T. Zhang, G.F. Wei, Z.X. Huang,
Y. Hu, Study on a micro-gas sensor with SnO2–NiO sensitive film for in-door formaldehyde
detection, Sens. Actuators B Chem. 132 (2008) 74-80; c) J. Wang, L. Liu, S.Y. Cong, J. Q. Qi,
B.K. Xu, An enrichment method to detect low concentration formaldehyde, Sens. Actuators B
Chem. 134 (2008) 1010-1015.
14. X. Qin, R. Wang, F. Tsow, E. Forzani, X. Xian and N. Tao, Colorimetric chemical sensing
platform for real-time monitoring of indoor formaldehyde. IEEE Sens. J. 15 (2015) 1545-1551.
15. L. Nyholm, Electrochemical techniques for lab-on-a-chip applications, Analyst, 130 (2005)
599-605.
16. O. A. Sadik, A.O. Aluoch, A. Zhou, Status of biomolecular recognition using electrochemical
techniques, Biosens. Bioelectron. 24 (2009,) 2749-2765.
17. B. Persson, J. Hedlund, H. Jornvall, Medium-and short-chain dehydrogenase/ reductase gene
and protein families. Cell. Mol. Life Sci. 65 (2008) 3879.
18. N. Tanaka, Y. Kusakabe, K. Ito, T. Yoshimoto, K.T. Nakamura, Crystal structure of
formaldehyde dehydrogenase from Pseudomonas putida: the structural origin of the tightly
bound cofactor in nicotinoprotein dehydrogenases. J. Mol. Biol. 324 (2002) 519.
19. S. Achmann, M. Hermann, F. Hilbrig, V. Jérôme, M. Hämmerle, R. Freitag, R. Moos, Direct
detection of formaldehyde in air by a novel NAD+ and glutathione-independent formaldehyde
dehydrogenase-based biosensor, Talanta 75 (2008) 786-791.
20. O. Demkiv, O. Smutok, S. Paryzhak, G. Gayda, Y. Sultanov, D. Guschin, H. Shkil, W.
Schuhmann, M. Gonchar, Reagentless amperometric formaldehyde-selective biosensors based
on the recombinant yeast formaldehyde dehydrogenase, Talanta 76 (2008) 837-846.

48
21. T. Shimomura, T. Itoh, T. Sumiya, F. Mizukami, M. Ono, Electrochemical biosensor for the
detection of formaldehyde based on enzyme immobilization in mesoporous silica materials,
Sens. Actuators B Chem. 135 (2008) 268-275.
22. L. Bareket, A. Rephaeli, G. Berkovitch, A. Nudelman, J. Rishpon, Carbon nanotubes based
electrochemical biosensor for detection of formaldehyde released from a cancer cell line treated
with formaldehyde releasing anticancer prodrugs, Bioelectrochemistry 77 (2010) 94-99.
23. J. Niroula, G. Premaratne, S. A. Shojaee, D.A. Lucca, S. Krishnan, Combined Covalent and
Noncovalent Carboxylations of Carbon Nanotubes for Sensitivity Enhancement of Clinical
Immunosensors, Chem. Comm. 52 (2016) 13039-13042.
24. a) S. Krishnan, F.A. Armstrong, Order-of-magnitude enhancement of an enzymatic hydrogen-
air fuel cell based on pyrenyl carbon nanostructures, Chem. Sci., 3 (2012) 1015-1023; b) R.A.
Kamin, G.S. Wilson, Rotating ring-disk enzyme electrode for biocatalysis kinetic studies and
characterization of the immobilized enzyme layer, Anal. Chem. 52 (1980) 1198–1205; c) J.J.
Gooding, V.G. Praig, E.A.H. Hall, Platinum-catalyzed enzyme electrodes immobilized on gold
using self-assembled layers, Anal. Chem. 70 (1998) 2396-2402.
25. C. E. Baños, M. A Silva, A novel clean-up method for urine analysis of low-molecular mass
aldehydes by capillary electrophoresis with laser-induced fluorescence detection, J.
Chromatogr. B, 879 (2011) 1412-1418.
26. P. N. Bartlett, R. G. Whitaker, Strategies for the development of amperometric enzyme
electrodes, Biosensors 3 (1987) 359-79.
27. V. A. Karachevtsev, S. G. Stepanian, A. Y. Glamazda, M. V. Karachevtsev, V. V. Eremenko,
O. S. Lytvyn and L. Adamowicz, Noncovalent interaction of single-walled carbon nanotubes
with 1-pyrenebutanoic acid succinimide ester and glucoseoxidase, J. Phys. Chem. C 115 (2011)
21072.

49
28. S. Majeed, V. Filiz, S. Shishatskiy, J. Wind, C. Abetz, V. Abetz, Pyrene-POSS nanohybrid as
a dispersant for carbon nanotubes in solvents of various polarities: its synthesis and application
in the preparation of a composite membrane. Nanoscale Res. Lett. 7 (2012) 1.
29. M. Zhang, A. Smith, W. Gorski, Carbon nanotube-chitosan system for electrochemical sensing
based on dehydrogenase enzymes, Anal. Chem. 76 (2004) 5045-5050.
30. V. Datsyuk, M. Kalyva, K. Papagelis, J. Parthenios, D. Tasis, A. Siokou, I. Kallitsis, C.
Galiotis, Chemical oxidation of multiwalled carbon nanotubes. Carbon 46 (2008) 833-840.
31. M. Zdrojek, W. Gebicki, C. Jastrzebski, T. Melin, A. Huczko, Photoexcitations in fully organic
nanocomposites of poly (3-hexylthiophene) and multiwalled carbon nanotubes. In Solid State
Phen. 99 (2004) 265-268.
32. Choi, E. Y., Roh, S. C., Kim, C. K. Noncovalent functionalization of multi-walled carbon
nanotubes with pyrene-linked nylon66 for high performance nylon66/multi-walled carbon
nanotube composites. Carbon, 2014, 72, 160-168.
33. K. S. Prasad, C.Walgama, S. Krishnan, Enhanced electroactivity and substrate affinity of
microperoxidase-11 attached to pyrene-linkers π–π stacked on carbon nanostructure electrodes.
RSC Adv., 5 (2015) 11845-11849.
34. V. Singh, S. Krishnan, An electrochemical mass sensor for diagnosing diabetes in human
serum. Analyst 139 (2014) 724 – 728.
35. M. W. Wood, S. K. Nordone, S. L. Vaden, E. B. Breitschwerdt, Assessment of urine solute and
matrix effects on the performance of an enzyme-linked immunosorbent assay for measurement
of interleukin-6 in dog urine. J. Vet. Diagn. Invest. 23 (2011) 316-320.
36. S. Krishnan, C. Walgama, Electrocatalytic features of a heme protein attached to polymer-
functionalized magnetic nanoparticles, Anal. Chem. 85 (2013) 11420−11426.
37. T. Bryan, X. Luo, P. R. Bueno, J. J. Davis, An optimised electrochemical biosensor for the
label-free detection of C-reactive protein in blood, Biosens. Bioelectron. 39 (2013) 94-98.

50
38. a) J. Lankelma, Z. Nie, E. Carrilho, G. M. Whitesides, Paper-based analytical device for
electrochemical flow-injection analysis of glucose in urine, Anal. Chem. 84 (2012) 4147-4152.
b) J. Wang, R. Krause, K. Block, M. Musameh, A. Mulchandani, M.J. Schöning, Flow injection
amperometric detection of OP nerve agents based on an organophosphorus–hydrolase
biosensor detector, Biosens. Bioelectron. 18 (2003) 255-260. c) J.A. Cox, T. Gray, K.R.
Kulkarni, Stable modified electrodes for flow-injection amperometry: application to the
determination of thiocyanate, Anal. Chem. 60 (1988) 1710-1713.
39. P. Španěl, D. Smith, T. A. Holland, W.A. Singary, J.B. Elder, Analysis of formaldehyde in the
headspace of urine from blad-der and prostate cancer patients using selected ion flow tube mass
spectrometry. Rapid Commun. Mass Spectrom. 13 (1999) 1354-1359.
40. H. Schutte, J. Flossorf, H. Sahm, M.R. Kula, Immobilized formaldehyde-metabolizing
enzymes from Hansenula polymorpha for removal and control of airborne formaldehyde, J.
Eur. Biochem. 62 (1976) 151.
41. J.J. Allais, A. Louktibi, J. Baratti, Oxidation of methanol by the yeast, Pichia pastoris,
purification and properties of the formaldehyde dehydrogenase, Agric. Biol. Chem. 47 (1983)
1509.
42. R.J.S. Baerends, G.J. Sulter, T.W. Jeffries, J.M. Cregg, M. Veenhuis, Molecular
characterization of the Hansenula polymorphaFLD1 gene encoding formaldehyde
dehydrogenase, Yeast 19 (2002) 37.
43. Van Leeuwen, S. M.; Hendriksen, L.; Karst, U. Determination of aldehydes and ketones using
derivatization with 2, 4-dinitrophenylhydrazine and liquid chromatography–atmospheric
pressure photoionization-mass spectrometry. J. Chromatogr. A. 1058 (2004) 107-112.
44. A. Soman, Y. Qiu, Q. C. Li, HPLC-UV method development and validation for the
determination of low level formaldehyde in a drug substance. J. Chromatogr. Sci. 46 (2008)
461-465.

51
45. J. H. Miller, W. P. Gardner, R. R. Gonzalez, UHPLC separation with MS analysis for eight
carbonyl compounds in mainstream tobacco smoke. J. Chromatogr. Sci. 48 (2010) 12-17.
46. J. Rickert, W. Göpel, W. Beck, G. Jung, P. Heiduschka, A ‘mixed’self-assembled monolayer
for an impedimetric immunosensor, Biosens. Bioelectron. 11 (1996) 757-768.
47. Y. Korpan, S. Dzyadevich, V. Arkhipova, A. El'skaya, M. Gonchar, T. Gibson, N. Jaffrezic-
Renault, C. Martelet, A. Soldatkin, Enzyme-based electrochemical sensors for formaldehyde
detection, Sensor. Mater. 12 (2000) 79-87.

52
CHAPTER 3
ELECTROCHEMICAL AND SURFACE PLASMON CORRELATION OF SERUM
AUTOANTIBODY IMMUNOASSAY WITH BINDING INSIGHTS: GRAPHENYL VS.
MERCAPTO-MONOLAYER SURFACE
3.1 Introduction
The design of a reliable and reproducible biosensing assay platform with molecular insights into
binding and quantitative nano-bio surface designs is significant for successful diagnostic
applications. Serum concentration of autoantibodies has been proposed to associate with the
occurrence of type 1 diabetes (T1D).1,2 T1D is a chronic immune disorder that results from the
destruction of β-cell function in the islets of Langerhans, causing deficient insulin production and
hyperglycemia.3 The etiology of T1D is largely unknown, but a combination of genetic
predisposition, environmental factors, and a dysregulated immune system is believed to be the
cause of the disorder.4-6 Over recent years, the prevalence of diabetes, in particular T1D has
significantly increased from 5% to 10%. This has in turn affected the incidence of associated health
complications on a large population of children and adults worldwide.7,8
Pociot and Lernmark recently reported that T1D could be characterized by the appearance of β-cell
autoantibodies at an early stage, and glutamic acid decarboxylase autoantibody (GADA) is one of
them.9 In the early 1990s, GADA was recognized to interact with a 65-kDa autoantigen known as
the glutamic acid decarboxylase-65 (GAD-65).
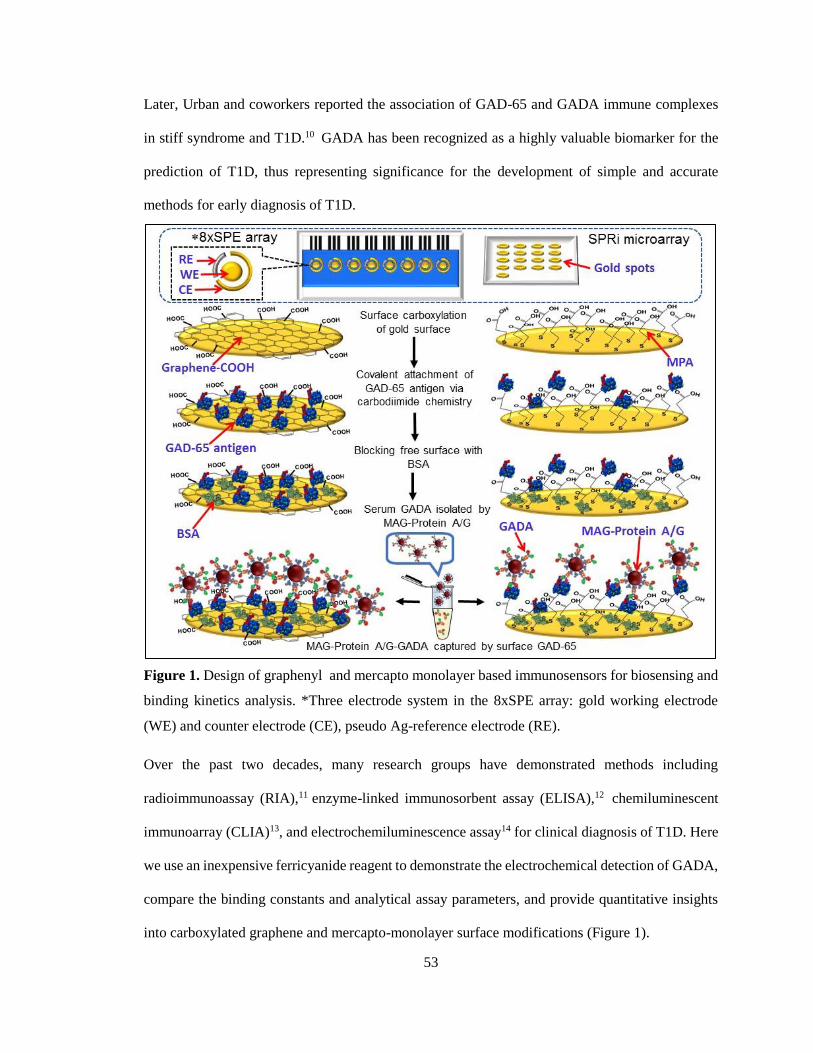
53
Later, Urban and coworkers reported the association of GAD-65 and GADA immune complexes
in stiff syndrome and T1D.10 GADA has been recognized as a highly valuable biomarker for the
prediction of T1D, thus representing significance for the development of simple and accurate
methods for early diagnosis of T1D.
Figure 1. Design of graphenyl and mercapto monolayer based immunosensors for biosensing and
binding kinetics analysis. *Three electrode system in the 8xSPE array: gold working electrode
(WE) and counter electrode (CE), pseudo Ag-reference electrode (RE).
Over the past two decades, many research groups have demonstrated methods including
radioimmunoassay (RIA),11 enzyme-linked immunosorbent assay (ELISA),12 chemiluminescent
immunoarray (CLIA)13, and electrochemiluminescence assay14 for clinical diagnosis of T1D. Here
we use an inexpensive ferricyanide reagent to demonstrate the electrochemical detection of GADA,
compare the binding constants and analytical assay parameters, and provide quantitative insights
into carboxylated graphene and mercapto-monolayer surface modifications (Figure 1).

54
As a novel class of two-dimensional nanocarbon material, graphene has recently attracted
researchers in biomedical sciences for the development of sensitive electrochemical and optical
devices.15-17 The high surface area to volume ratio, electrical conductivity, aqueous dispersibility
suitable for screen-printed electrode surfaces, thin structure and apparent biocompatibility of
carboxylated graphene makes it a unique carbon nanomaterial for biorecognition events and
biosensing applications.18-20 Although, glucose and insulin biosensors are useful for diabetes
management, non-glucose biomarkers are critical for enabling early diabetes prediction in children
and adults.21-23
To increase detection sensitivity, sensor surface modifications with various nanomaterials and
selective isolation of analytes from complex sample matrices (e.g., blood, saliva, urine) by
nanomaterials for amplified detection have been demonstrated.24-29 In particular, magnetic (MAG)
beads are unique for the ease of magnetic isolation, separation, and highly sensitive detection of
proteins, nucleic acids, and cells due to their high surface area and intrinsic magnetic properties.30-
34 Appropriate designs of the surface of MAG beads with specific capture molecules can be used
to separate biomolecules selectively from complex clinical matrices to facilitate ultra-low detection
with reduced nonspecific signals.30,31,35-37 In the present study, we demonstrate that by combining
electrochemical immunosensing with surface plasmon resonance (SPR) spectroscopy, we can
validate the electrochemical platform, and use the binding constant as a quality control checkpoint
for large-scale production of the relatively inexpensive electrochemical sensors.
Furthermore, in this work, a carboxylated graphenyl surface is quantitatively compared with the
conventional mercapto-monolayer surface to obtain insights into analytical assay performance. The
knowledge gained from the combined sensing and binding assessment is useful for developing
reliable and better throughput clinical immunosensors for biomarker based diagnostic assays.

55
3.2 Experimental
3.2.1 Materials and chemicals
Eight-channel screen-printed gold electrodes (8xSPE) were purchased from DropSens, Spain
(Product No. 8x220BT). SPR imaging (SPRi) gold array chips (Spot Ready 16, 1 mm diameter
gold spots) were purchased from GWC Technologies (Madison, WI). Carboxylated graphene
(graphene-COOH) was purchased from ACS materials (Medford, MA). Glutamic acid
decarboxylase-65 antigen (GAD-65) was bought from Creative Diagnostics (Shirley, NY, USA).
Monoclonal glutamic acid decarboxylase autoantibody (GADA), bovine serum albumin (BSA, ≥
98%), aminoferrocene, 3-mercaptopropionic acid (MPA, ≥99%), 1-ethyl-3-[3-(dimethylamino)
propyl] carbodiimide (EDC), and N-hydroxysuccinimide (NHS) were purchased from Sigma (St.
Louis, MO, USA). Normal human serum was purchased from Atlanta Biologicals (Flowery
Branch, GA, USA).
Human serum samples were diluted 10-times in phosphate buffered saline (PBS), pH 7.4. Protein
A/G coated magnetic beads (MAG-protein A/G, 2 µm, 10 mg mL-1) were purchased from Biotool
(Houston, TX, USA). The beads contain 9.3×10¹³ protein A/G molecules/cm2 (Biotool). All other
chemicals used were analytical grade. A NanoOrange Protein Quantitation Kit was purchased from
Thermo Fisher Scientific (Waltham, MA, USA). The commercial GADA ELISA kit was
purchased from MyBioSource, Inc. (San Diego, CA, USA). The reagents were prepared using ultra-
pure water (Invitrogen Corporation, Grand Island, NY, USA). All measurements were carried out
at room temperature (23 ˚C).
3.2.2 Instrumentation
Electrochemical impedance spectroscopy (EIS) measurements were performed to characterize the
sensor surface modification as well as measure the GADA concentration dependent increase in
charge transfer resistance (Rct) for ferricyanide/ferrocyanide redox probe added in solution. For the

56
EIS, an Interface 1000 potentiostat/galvanostat/ZRA from Gamry Instruments was used
(Warminster, PA, USA).
Surface plasmon measurements of GADA-GAD-65 interaction were made using GWC SPR
imager-II (Horizon SPR imager model, GWC Technologies, Madison, WI). A light source with an
operating wavelength of 800 nm was used. Real-time reflectivity changes followed by imaging of
these changes as pixel intensity was completed using a charge-coupled device. The SPR curves
were fit for kinetic analysis using TraceDrawer Software (Ridgeview Instruments AB, Vänge,
Sweden).
ELISA measurements were performed using a Biotek Synergy H1 Plate Reader based on
UV/VIS/Fluorescence quantitation (BioTek Instruments, Inc., Winooski, VT, USA).
Characterization of each step of the surface modification was conducted by scanning electron
microscopy (SEM, Model: FEI Quanta 600FE) at an accelerating voltage of 20 kV. The images
were acquired using FEIxT Microscope Control Software. Additional characterization of the sensor
designs was conducted by Fourier transform infrared spectroscopy (FTIR, Thermo Scientific
Nicolet iS50) operated in the attenuated total reflection mode using a diamond crystal.
NanoOrange protein quantitation kit that works based on fluorescence was employed for
quantifying the surface immobilized GAD-65 by measuring the difference in GAD-65
concentration in solution before and after the immobilization step (Varian Cary Eclipse
Fluorescence Spectrophotometer).
3.2.3 Fabrication of the electrochemical immunosensor
Each gold disk working electrode (geometric area = 0.2 cm2) of 8xSPE arrays were drop-coated
with a 3.5 µL aliquot of a well-dispersed aqueous solution of carboxylated graphene (2.0 mg
mL-1). The electrodes were placed in an oven (50 oC) for 30 mins in order to dry-coat the graphene
57
on the gold surface. The electrodes were then washed well with deionized water. For comparison,
a conventional monolayer of MPA on 8xSPE arrays was prepared by incubating the working
electrodes with 3.5 µL of 2 mg mL-1 solution of MPA in ethanol for 4 h in a cold and moist
environment. All further assay steps were carried out under ice cold conditions. Carbodiimide
chemistry was followed to covalently link the surface lysine groups of GAD-65 (PDB: 2OKK, ~29
surface lysine residues) to the electrode surface via surface carboxyl groups of graphene or a MPA
monolayer.38-40 For this, the 8xSPEs were treated with 4 µL of a freshly prepared solution mixture
of EDC (0.35 M) and NHS (0.1 M) in deionized water for 20 min to activate the carboxyl groups
to converting them to amine reactive N-succinimidyl esters. Following removal of unreacted
reagents with deionized water, 3.5 µL of GAD-65 solution (6.5 µg mL-1 in PBS) was placed on
each electrode of the arrays to covalently link GAD-65 through formation of amide bonds with the
activated surface carboxyl groups for a duration of 30 min. After washing the unbound antigens
with PBS, the free graphene surface was blocked for 15 min using 3 µL of a 1% BSA solution
prepared in PBS. Finally, 3.5 µL of MAG-protein A/G-captured 10% serum GADA samples of
various concentrations were added on the electrodes and allowed to incubate for 1 h. The modified
immunosensor was rinsed in PBS to remove any unbound molecules and used for electrochemical
measurements.
3.2.4 Magnetic bead-protein A/G capturing of autoantibody from 10% human serum (MAG-
protein A/G-GADA)
MAG beads functionalized with surface protein A/G molecules offer binding sites with orientation
for capturing antibodies from serum. The capturing procedure followed the instructions provided
by the manufacturer with slight modifications. In brief, 25 µL of MAG-protein A/G beads were
washed twice with 150 µL of phosphate buffered saline (PBS, pH 7.4, 10 mM phosphate, 0.14 M
NaCl, 2.7 mM KCl), and separated out using a small piece of magnet after each wash. The beads
were then washed twice in 150 µL of binding buffer (50 mM tris, 150 mM NaCl, 0.1% Tween 20,

58
pH 7.5). Different concentrations of GADA spiked in 10% normal human serum in the binding
buffer (250 µL) were added to separate aliquots of MAG-protein A/G beads and rotated in a tube
rotor (Fisher Scientific) for 1 h at room temperature. Upon completion of the incubation, the
contents were suspended by pipetting in and out for 10 times, and the supernatant was removed
immediately from the magnetically separated beads. The beads were washed two times with 300
µL of the binding buffer. Finally, the beads were suspended to a final volume of 200 µL in the
binding buffer. The MAG-protein A/G captured serum GADA samples were stored at 4 oC and
used for up to 5 days.
3.2.5 SPRi microarray modification
Prior to use, the SPRi gold array chip was cleaned in piranha solution (3:1 mixture of concentrated
H2SO4 and 30% H2O2 for 10 seconds. Caution: Piranha solution is highly corrosive and a strong
oxidizer). First, 0.30 µL of 0.1 mg mL-1 of carboxyl-functionalized graphene (graphene-COOH)
was dry-coated on each gold spot of the SPRi chip (1 mm diameter) and dried at 50 °C for 30
minutes. The chip was then washed thoroughly with deionized water to remove any unbound
material. Following the dry-coating, the immobilization of GAD-65 and BSA blocking steps were
similar to that described above for the electrochemical immunoassay. The chip was then mounted
in the SPRi instrument to monitor real-time reflectivity changes upon the binding of various
concentrations of serum GADA captured onto MAG-protein A/G beads. Once the steady state
response was reached, the SPR chip surface was rinsed well with PBS (pH 7.4) to remove any
unbound molecules present in the bulk solution and to attain a new baseline signal. Similar SPR
measurements were taken for an immunosensor prepared with a self-assembled monolayer of MPA
instead of the graphene-COOH modification.

59
3.2.6 Quantitation of GAD-65 on the immunoassay surface
The amount of GAD-65 bound per electrode was quantified using a NanoOrange protein
quantitation kit as follows: A calibration curve was obtained for various concentrations (2 – 10 ng
mL-1) of GAD-65 prepared in the NanoOrange working solution provided in the assay kit. The
solutions were heated at 95 oC for 10 min in the dark followed by cooling to room temperature for
20 min before measuring fluorescence intensity. GAD-65 (3.5 µL of 6.5 µg mL-1) was then coated
onto each carboxyl activated graphene working electrode for 30 min and washed twice with 5 µL
aliquots of PBS. The wash solutions were collected and made up to 2 mL with the NanoOrange
working solution. A similar heating and cooling protocol as described above was followed before
measuring the fluorescence intensity (excitation at 465 nm and emission at 603 nm). From the
difference in fluorescence of free GAD-65 before and after surface immobilization, the amounts of
GAD-65 immobilized on the graphene-COOH and MPA surfaces were estimated.
3.2.7 Quantitation of surface carboxyl groups based on electroactive aminoferrocene
functionalization of graphene-COOH or MPA monolayer surface on 8xSPEs
8xSPEs were dry-coated with graphene-COOH or with a self-assembled monolayer of MPA (one
8xSPE was used for each modification) followed by carbodiimide activation of the surface carboxyl
groups using the EDC (0.35 M)/NHS (0.1 M) solution mixture. A 4.5-µL solution of 1 mM
aminoferrocene in PBS, pH 7.4 was then placed on the –COOH activated electrodes and incubated
for 45 min in a cold and moist atmosphere. To ensure the covalent strategy of linking, we prepared
graphene-COOH or MPA modified 8xSPEs with an electrostatically adsorbed layer of
aminoferrocene. The electrodes were then rinsed with deionized water to remove any unbound
molecules. Cyclic voltammograms (CVs) were recorded to calculate the electroactive
aminoferrocene molecules, and in turn, the relative amounts of –COOH groups on graphene-COOH
and MPA surfaces.

60
3.2.8 Electrochemical measurements of serum GADA by an immunoassay
Faradaic impedance measurements for various concentrations of MAG-protein A/G captured serum
GADA (10% normal human serum) bound onto GAD-65 were performed at room temperature (23
oC) in an aqueous electrolyte solution containing 0.1 M KCl and 10 mM each of Fe(CN)63-
/Fe(CN)64- as the redox probe. A potential of 0.2 V vs a pseudo Ag reference electrode was applied
at an AC amplitude of 10 mV, and the frequency was scanned from 0.1-100 kHz. The experimental
impedance data were fit by the Randles equivalent circuit model to determine the charge transfer
resistance (Rct) values. Differential pulse voltammetry (DPV) was employed as a complementary
technique that measured current signals. The same redox solution as of the EIS assay was used to
measure the currents upon scanning the potential from +0.6 to -0.1 V vs a pseudo-Ag reference
electrode (50 mV for amplitude, 10 mV step potential, 20 ms sampling width, and 50 ms pulse
width). Each experiment was replicated five times to obtain the average responses with good
reproducibility.
3.3 Results and Discussion
3.3.1 Optimization of GAD-65 concentration on the immunosensor surface
The immunosensor responses for various concentrations of GAD-65 used for surface
immobilization (325 ng mL-1 – 13 µg mL-1 in PBS, pH 7.4) (Fig. 2) upon binding of a constant
serum concentration of GADA (4 ng mL-1 in 10% human serum) captured onto the MAG-protein
A/G beads were measured. This procedure allowed us to identify the optimum GAD-65
concentration that provided the maximum Rct signals for GADA binding. The Rct values measured
by Faradaic impedance spectroscopy for increasing concentration of surface immobilized GAD-65
antigen, are shown in Figure 2. No appreciable change in the Rct was observed beyond 6.5 µg mL−1
of GAD-65 concentration. Therefore, we chose this solution concentration of GAD-65 to
immobilize on the designed graphene-COOH surface for the immunosensor.

61
The amount of surface immobilized GAD-65 on the graphene-COOH modified surface was
estimated to be 17 ± 2 pmol cm-2 when using a solution concentration of 6.5 µg mL-1 of GAD-65.
This estimation was based on the difference in free GAD-65 amount in solution before and after
immobilization (NanoOrange protein quantitation kit). The immobilization efficiency of GAD-65
was 76 ± 4% under the experimental conditions followed.
Figure 2. Rct values for increasing solution concentration of GAD-65 (in PBS solution) used for
immobilization onto the carbodiimide activated graphene-COOH/gold surface, and followed by the
binding of a constant concentration of 10% serum GADA (4 ng mL-1) captured onto MAG-protein
A/G beads.
3.3.2 Hydrodynamic size and zeta potential measurements
We noted that the capturing of GADA from 10% human serum onto the MAG-protein A/G beads
caused an increase in the average hydrodynamic size, and a negative shift in the Zeta potential of
the beads (Table 1). This shift is reasonable because the IgG antibody has a net negative charge at
pH 7.4 (isoelectric point is 6.1-6.5).41

62
Table 1. Hydrodynamic size and Zeta potential values of MAG-protein A/G and MAG-protein
A/G-GADA beads (five times diluted in PBS, pH 7.4), temperature 25 oC.
Particle type Hydrodynamic size
(nm)
Zeta potential
(mV)
MAG-protein A/G 1980 ± 49 -16 ± 1
MAG-protein A/G-serum GADA 2061 ± 37 -22 ± 2
The samples used for the hydrodynamic and Zeta potential analysis were five times diluted in
PBS. This dilution was required to facilitate measurements within the saturating limit of the
detector in the instrument.
3.3.3 Microscopic characterization of the graphene immunosensor
The SEM images acquired at each step of the immunoassembly on an 8xSPE array are presented
in Figure 3 – A to D. We identified that a rough Au surface (gold-ink cured on a ceramic substrate
at low temperatures, DropSens Inc.) provided better reproducibility of the immunoassay than a
smooth gold surface (DRP-8x220BT- U20, DropSens Inc.). This is likely due to the stronger
adhesion of the graphene-COOH onto the rough Au over a smooth Au surface. Also, we determined
that the aqueous suspension of graphene-COOH is more suitable for dry coating on screen printed
electrodes than an organic solvent dispersion based carbon nanomaterials. This is because the
screen-printed electrode surface tends to wear away when exposed for longer duration in organic
solvents during the dry-coating process of nanomaterials.

63
Figure 3. SEM images of A. rough
AuSPE surface, B. after dry coating
of an aqueous suspension of
graphene-COOH, C. after covalent
attachment of GAD-65 antigen and
surface blocking with 1% BSA, and
D. after the binding of GADA spiked
in 10% human serum (0.05 ng mL-1)
and captured onto MAG-protein A/G
beads.
Fig. 3-A shows the image for the rough Au surface of an 8xSPE array. Dry coating of graphene-
COOH on the AuSPE surface resulted in spherical mesh-like and thread-like features (Fig. 3-B).42
The graphene surface features became denser upon the covalent immobilization of GAD-65 antigen
followed by blocking with a solution of 1% BSA in PBS (Fig. 3-C). After the binding of the MAG-
protein A/G-GADA conjugate onto the surface GAD-65 sites, the appearance of spherical MAG
bead features on the electrode surface can be seen (Fig. 3-D).
3.3.4 Spectroscopic characterization of the graphene immunosensor
FTIR spectra further confirmed the results obtained from the SEM image analysis. The bare AuSPE
surface did not show any peak in the measured region of the IR spectrum (Fig. 4-a). Upon coating
with graphene-COOH (Fig 4-b), the appearance of a strong and broad peak at about 3219 cm-1 was
attributed to the hydroxyl vibration of surface carboxyl groups.43 Additionally, the peaks at 1719
cm-1 and 1078 cm-1 are characteristics of the stretching vibrations of carboxylic acid and other
surface carbonyl groups.44 Upon activation of the surface carboxyl groups using EDC/NHS
chemistry, the characteristic decrease in the O-H stretching vibration was observed (Fig 4-c).

64
Additionally, new peaks centered at 1764 and 1043 cm-1 corresponding to the C=O and C-O
stretching vibrations of the succinimidyl esters from the EDC/NHS modification were present.45,46
Figure 4. FTIR spectra of a.
rough gold 8xSPE, b. after
dry-coating with graphene-
COOH, c. after EDC/NHS
activation, d. after GAD-65
immobilization, and e. after
the binding of 5 ng mL-1
concentration of 10% serum
GADA captured by the
MAG-protein A/G beads.
The protein amide-I band at 1639 cm-1 and amide-II band at 1547 cm-1 were observed due to the
formation of amide bonds after the covalent attachment of the GAD-65 antigen with the graphene-
COOH surface (Fig 4-d).46,47 In addition, a new peak at 3324 cm-1 indicated the N-H stretching
vibration of the protein. Once the serum GADA carried by the MAG-protein A/G beads was bound
to the surface GAD-65 antigen, a new peak appearing at 602 cm-1 was assigned to the Fe-O
stretching of Fe3O4 magnetic beads (Fig. 4-e).48 Furthermore, a slight shift in the amide-I and
amide-II bands was possibly the result of complexation of GAD-65 with GADA. In addition, the
N-H bending vibration peak at 794 cm-1 became more prominent due to the overall increase in the
total protein molecules on the surface as the result of GADA-GAD 65 immunoassembly formation.
3.3.5 Electrochemical impedance spectroscopy characterization of the immunosensor
fabrication
The stepwise construction of the immunosensor assembly starting from the bare gold 8xSPE to the
GADA binding measurement step was characterized by Faradaic EIS as shown in Figure 5 with

65
Nyquist plots. An aqueous solution containing 0.1 M KCl and a mixture of 10 mM of each
potassium ferricyanide and potassium ferrocyanide [Fe(CN)63-/4-] was employed as the redox probe
in solution. The Randles equivalent circuit model was used to fit the experimental impedance
spectra and obtain the Rct values. The Rct corresponds to the diameter of the semicircular region in
the Nyquist plot.49
Figure 5. Faradaic impedance spectroscopic measurements in an aqueous solution containing 0.1
M KCl and 10 mM each of Fe(CN)63-/4- mixture: (a) AuSPE (3310 ± 101 Ω), (b) after dry-coating
of graphene-COOH (1054 ± 154 Ω), (c) after covalently attaching GAD-65 by the carbodiimide
coupling chemistry (2108 ± 67 Ω), (d) after blocking the free surface with 1% BSA (4190 ± 410
Ω), and (e) after the binding of serum GADA (0.04 ng mL-1) captured onto the MAG-protein A/G
beads (9290 ± 580 Ω). Experimental conditions: 0.2 V vs Ag/AgCl, amplitude 10 mV, and
frequency range 0.1 - 100 kHz.
Figure 5 (curve a) corresponds to the Nyquist plot of a rough Au surface of 8xSPE. Carboxylated
graphene modification of the Au surface decreased the Rct, implying an increased surface
conductivity favorable for the redox probe to communicate with the electrode (Fig. 5-curve b). This
higher conductivity is advantageous to increase interfacial charge transport from the redox probe
to the electrode, and subsequently facilitate sensitive monitoring of Rct changes. Immobilization of
the GAD-65 antigen (Fig. 5-curve c), subsequent BSA blocking of the free electrode surface (Fig.

66
5-curve d), and the binding of serum GADA (0.04 ng mL-1) carrying MAG-protein A/G beads onto
the surface GAD-65 increased the Rct values (Fig. 5-curve e).
3.3.6 Estimation of signal enhancement and reduction of non-specific signals by the MAG-
protein A/G beads over the direct use of serum GADA solution
Results indicate that the MAG-protein A/G bead strategy to isolate GADA from serum reduced the
non-specific background signals from proteins and other components present in the free serum
matrix, and thus offered an enhanced sensitivity (Fig. 6-A).50-52 Although protein A/G is not
selective for capturing GADA alone, but to all serum antibodies, the designed immunosensor is
successful in measuring the low GADA concentration above the nonspecific control serum-treated
MAG-bead signals (no spiked GADA).
Figure 6. A. Rct values for the BSA blocked, graphene-COOH coated gold surface immobilized
with GAD-65 upon the binding of MAG-protein A/G beads alone (1.25 mg mL-1), GADA (2 ng
mL-1) spiked in 10% serum in PBS (pH 7.4), and serum GADA (2 ng mL-1) captured onto the MAG-
protein A/G beads. B. Reduced non-specific background signals for MAG-protein A/G added to
GADA unspiked serum compared to the GADA unspiked free serum solution.
Furthermore, Fig. 6-A shows that the Rct signal enhancement for the binding of 2 ng mL−1 serum
GADA captured with MAG-protein A/G beads was ~3-times greater than the direct use of GADA
spiked 10% serum samples not captured onto the beads. This is the result of reduced nonspecific

67
signals from the MAG-protein A/G strategy over the free serum background signals (Fig. 6-B). The
simplicity of magnetic capturing and isolation of the bound GADA from free serum by the MAG-
protein A/G beads is not feasible with other non-magnetic nanomaterials,53, which would require
centrifugation and other tedious separation procedures.
3.3.7 Serum GADA concentration dependent increase in charge-transfer resistance
The Faradaic impedance responses and the respective calibration plots are presented in Fig. 7-A to
D. The Rct of GAD-65 sensor surface increased with the binding of increasing serum GADA
concentration (10% serum in PBS) captured with the MAG-protein A/G beads. This trend suggests
that the increase in surface bound GADA carried by the MAG-protein A/G beads from the specific
complexation with GAD-65 antigen sites increased the resistance to the ferri/ferrocyanide redox
probe added in solution over the control serum treated with magnetic-protein A/G beads (no spiked
GADA).
The results infer that the graphenyl sensor compared to the MPA monolayer modified sensor (0.04–
0.75 ng mL−1) displayed a wider dynamic range of 0.02 - 2 ng mL−1 and several thousands enhanced
Rct values for the same GADA concentration. The slope of the response curve in the linear range
corresponds to the sensitivity of the sensor. A sensitivity enhancement of about 3-fold was observed
for the graphenyl surface over the MPA modified surface (slopes in Figures-6C and 1D). The
detection limits (three times the standard deviation of the control response/slope of the calibration
graph) were 48 and 124 pg mL−1 for the graphenyl and MPA modified immunosensors,
respectively. It is evident that the large surface area and -COOH functional groups on graphene-
COOH are favorable for high-density immobilization of surface biomolecules to detect lower
concentrations of analytes than the MPA monolayer sensor. The clinically relevant serum GADA
concentration range has been reported to be 0.03–19.9 nM, or 1.95 ng mL−1–1.29 µg mL−1.54
Saturation behavior on the assay response was observed beyond 2 ng mL−1 serum GADA.

68
Although, higher concentrations of GADA will require a dilution to measure in the designed assay
platform, several biomarkers with clinically relevant low nM concentrations can directly benefit
from the assay.
Figure 7. Nyquist plots obtained from the Faradaic impedance measurements in an aqueous
solution containing 0.1 M KCl and 10 mM each of Fe(CN)63-/Fe(CN)6
4- for various concentrations
of surface bound serum GADA immunoassembly : A. Graphene-COOH (0.02, 0.05, 0.1, 0.25, 0.5,
0.75, 1, and 2 ng mL-1) and B. MPA (0.02, 0.05, 0.1, 0.25, 0.5, and 0.8 ng mL-1) modified
immunosensors.C and D represent the dynamic range of respective response plots for Rct changes
with concentration of GADA for N = 3 replicates. Ten percent serum not spiked with any GADA
but treated with the MAG-protein A/G beads was used as the control sample, and its Rct value was
subtracted from each of the GADA spiked serum sample responses. (Experimental conditions:
0.2 V vs pseudo-Ag reference electrode, amplitude 10 mV, and frequency range 0.1–100 kHz.)
3.3.8 Comparison of SPR responses for graphene-COOH and MPA modified immunosensor
and bimolecular kinetic analysis
The kinetic parameters from the real-time binding of surface immobilized GAD-65 with MAG-
protein A/G beads captured with serum GADA were determined by use of an SPRi assay. The

69
experimentally obtained SPR sensograms (Figure 8A and B) for different concentrations of GADA
were fit into a 1:1 bimolecular kinetic model.33,55 The equations presented below were used to
calculate the association rate (ka), the dissociation rate (kd), and the binding constant (KD) (Table
2). The kinetic analysis was performed for the biomolecule interaction by assuming a 1:1 binding
reaction as detailed below:
A+B ⇌ AB (1)
Rate of association: d[AB]
dt= ka[A][B]- kd[AB] (2)
Rate of dissociation: d[AB]
dt= - kd[AB] (3)
where A is the GAD-65 antigen immobilized on the SPR chip, B is the GADA captured MAG-
protein A/G beads, and AB is the antigen-antibody complex formed. Since the concentration of A
is constant, the antigen-antibody complex formation is considered to follow pseudo first order
kinetics, where the SPR responses of the interaction with time is given as:
dRdt
= kaCRmax- (kaC+ kd)Rt (4)
The integrated form of (4) is given as:
Rt= kaCRmax[1-e-(kaC+ kd)t]
kaC+ kd+ R0 (5)
KDapp
= kdka
(6)
Where, Rt and Ro are the SPR responses at any time t and at t = 0 respectively, Rmax is the maximum
reflectivity change, C is the concentration of serum GADA captured onto the MAG-protein A/G
beads, ka is the apparent association rate, kd is the apparent dissociation rate, and KDapp
is the
apparent binding constant. The values of ka and kd were obtained by fitting the experimental SPR
curves using the TraceDrawer kinetics software.

70
Figure 8. Simulated (red) and real-time SPR sensograms (black) for different concentrations (a to
c) of 10% serum GADA, 0.05, 0.10, and 0.50 ng mL-1, captured with MAG-protein A/G beads and
bound onto GAD-65 immobilized sensor surfaces modified with A. graphene-COOH and B. MPA.
The lower KD value for the graphene-COOH modified SPRi chip suggests that graphene provides
a stronger GADA-GAD-65 binding interaction [i.e., a more sensitive platform from an analytical
perspective] through its increased number of surface carboxyl groups and plasmon enhancing
feature when compared to the MPA modified chip. Moreover, the KD values of both MPA and
graphene-COOH modified chips are smaller (better affinity) in comparison to the previously
reported SPR assay value (KD = 1.37 nM) in PBS buffer medium on the surface of a mixed self-
assembled monolayer.56 This is more likely due to the signal enhancements from the MAG-protein
A/G bead strategy offering a highly enhanced signal output than free GADA present in solution.
Moreover, the MAG-bead based strategy was shown to allow a significantly greater amount of
immobilization of surface antibodies due to the large number of particles with a net high surface
area.57 This high-density antibody carrying beads are expected to facilitate a greater rate of
association with surface GAD-65 molecules and a slower dissociation rate for graphene-COOH
than the MPA surface (Table 2). A prior report estimated that over 100,000 molecules of antibody
can be bound selectively to MAG-beads to obtain attomolar detection limits of prostate specific
antigen.52,57

71
Table 2. Kinetic parameters for the MAG-protein A/G beads captured serum GADA binding onto
a surface immobilized GAD-65 antigen.
Kinetic parameters Graphene-COOH MPA
Association rate constant, ka [M-1 s−1] 1.05 (± 0.13) × 109 0.90 (± 0.13) × 109
Dissociation rate constant, kd [s−1] 3.2 (± 0.4) × 10−3 5.0 (± 0.6) × 10−3
Binding constant, KD [pM] 3.0 ± 0.5 5.6 ± 1.0
3.3.9 Validation of the graphene-COOH and MPA modified serum GADA
DPV was employed as a complementary method to the impedimetric immunosensor. Decrease in
DPV peak currents was observed with the increase in serum GADA MAG-beads binding to surface
GAD-65. This is because the insulating character imparted on the electrode surface by the bound
MAG-protein A/G-GADA beads onto GAD-65 is expected to decrease the redox currents of the
added ferri/ferrocyanide probe in solution (Figure 9). The DPV results are in correlation with EIS.
The limits of detection were 34 and 92 pg mL−1 for the graphene-COOH and MPA modified
immunosensors, respectively, which are slightly lower than the EIS method.

72
Figure 9. DPV responses showing the decrease in currents for 10% serum containing GADA
concentrations of a. 0.0, b. 0.02, c. 0.05, d. 0.1, e. 0.2, f. 0.5, and g. 0.75 ng mL-1 captured with
MAG-protein A/G beads, and upon binding with the surface GAD-65 antigen on A. graphene-
COOH and B. MPA modified immunosensors. Experimental conditions: aqueous mixture
containing 0.1 M KCl and 10 mM each of Fe(CN)63-/Fe(CN)6
4- with potential scanned from + 0.6
to - 0.1 V vs a pseudo-Ag reference electrode. C and D represent the linear DPV responses of the
immunosensors modified with graphene-COOH and MPA, respectively.
3.3.10 Estimation of the relative surface carboxyl groups on graphene-COOH and MPA
modified gold surfaces
Figure 10-A and B show the cyclic voltammograms of the graphene-COOH and MPA coated
electrodes covalently attached and electrostatically adsorbed with redox active aminoferrocene
molecules (a and b, respectively, in each plot). Resulting peak currents and integrated peak areas

73
(charge in Coulombs) are directly proportional to the number of aminoferrocene molecules bound
to either graphene-COOH or MPA surface. No redox peaks were shown by either the graphene-
COOH or MPA surfaces not immobilized with aminoferrocene, confirming no interferences from
the surface modifications on the –COOH estimation (Insets of Figure 11-A and B). The linear
dependence of the anodic current with scan rate suggested that the voltammetry of aminoferrocene
molecules exhibited a surface confined redox process (Figure 11-C and D).
Figure 10. Background subtracted CVs of A. graphene-COOH, B. MPA modified gold electrodes
with a. covalently attached, and b. adsorbed films of aminoferrocene in argon purged PBS buffer,
pH 7.4, 23 °C. The scan rate was 0.1 V s−1.
The average formal potentials of the covalently attached aminoferrocene film on the graphene-
COOH and MPA surfaces were 112 ± 5 and 114 ± 8 mV, respectively. The electrostatically
adsorbed films of aminoferrocene on each of the modified surfaces exhibited a similar formal
potential as the covalent films. However, the covalent films enabled higher electroactive
aminoferrocene immobilization than the electrostatic films as discussed below.

74
Figure 11. Background subtracted scan rate dependent CVs of the covalently attached
aminoferrocene on A. graphene-COOH and C. MPA modified Au 8xSPEs and the respective plots
of peak current vs scan rate (B and D). The scan rate inner to outer: 0.075 - 1.2 V s-1 at 23 oC, in
PBS, pH 7.4.
From the measured oxidation peak area, the electroactive surface coverage (Г, Eq. 1) of
aminoferrocene and in turn the relative extent of carboxyl groups were determined.58 Q is the area
of the oxidation peak of aminoferrocene, n is the number of electrons involved in the
aminoferrocene oxidation (n = 1), F is the Faraday constant, and A is the area of the working
electrode (A = 0.2 cm2).
Г = Q / nFA (Eq. 1)
The Г values were also calculated from the anodic peak current by using Eq. 2,59 where Ip is the
anodic peak current, ʋ is the scan rate, R is the universal gas constant (8.314 J mol−1 K−1), and T
(296 K) is the temperature in Kelvin.
Ip = n2F2ʋAГ/4RT (Eq. 2)

75
The peak area and peak current based estimations of Г agreed well with each other. The graphene-
COOH surface provided 9-fold greater surface carboxyl groups than the MPA monolayer surface
(Table 3).
Table 3. Estimated electroactive amounts of aminoferrocene on graphene-COOH and MPA
modified electrodes. The estimations were based on anodic peak area (Q in nC) or peak currents
(Ip in nA) from cyclic voltammograms shown in Fig. 9.
Parameter Graphene-COOH MPA
Covalently attached
aminoferrocene
Q (nC) 920.3 ± 86.6 98.1 ± 5.9
Calculated Г
(pmoles/cm2)
47.6 ± 5.1 5.1 ± 0.3
Ip (nA) 918.2 ± 76.2 108.3 ± 5.9
Calculated Г
(pmoles/cm2)
48.6 ± 4.2 5.7 ± 0.6
Adsorbed
aminoferrocene
Q (nC) 189.4 ± 15.4 31.0 ± 1.9
Calculated Г
(pmoles/cm2)
9.8 ± 1.3 1.6 ± 0.11
Ip (nA) 208.2 ± 28.3 34.2 ± 1.3
Calculated Г
(pmoles/cm2)
11.2 ± 2.5 1.8 ± 0.2

76
3.3.11 Application to T1D patient samples and validation by a commercial ELISA kit
We determined that the designed immunosensor platform is applicable to measure serum GADA
concentrations in T1D patient serum samples. The samples were prepared in a similar manner as
the spiked GADA serum standards, and captured onto MAG-protein A/G beads for detection upon
binding onto surface immobilized GAD-65. A good correlation was obtained between our
electrochemical immunoassay and the commercial ELISA kit (paired t-test performed at 95%
confidence level). The dynamic range was sufficient to determine the sample GADA concentrations
with a good precision (Table 4-A).
Table 4. A. Results from the analysis of patient samples (10% serum) on the designed graphene-
COOH electrochemical immunosensor and ELISA (N = 3). B. Recovery data of the designed EIS
immunoassay with the ELISA method for a patient serum sample spiked with GADA.
A. T1D
patient samples
EIS immunosensor
(ng mL-1)
ELISA
(ng mL-1)
1 3.4 ± 0.2 3.0 ± 0.1
2 2.2 ± 0.3 1.9 ± 0.2
B. Method Spiked [GADA]
(ng mL-1)
Measured [GADA]
(ng mL-1)
Recovery %
EIS 0.50
2.50
0.45
2.34
90%
94%
ELISA 0.50
2.50
0.46
2.43
92%
97%

77
To assess the accuracy of our electrochemical assay, a known concentration of GADA was spiked
to one of the patient serum samples. A recovery percentage of ≥90% was obtained from the
electrochemical assay, which is comparable to the recovery in ELISA (Table 4-B). The
electrochemical immunoassay presented takes less time than the ELISA method (EIS immunoassay
~2 h 30 min, ELISA ~4h), requires smaller sample volumes (EIS immunoassay 3.5 μL per
electrode, ELISA 100 μL sample per well), and with a reasonably good linear range (EIS
immunoassay 0.02–2.0 ng mL−1, ELISA 0.16–5.0 ng mL−1). However, the EIS approach is
throughput limited, because each impedance channel needs a separate potentiostat unit, hence an
array-based impedance detection is an expensive approach. Therefore, our ongoing research
direction is to translate the fundamental knowledge and assay designs derived from this work to
develop a high-throughput cost-effective assay format.
3.4 Conclusions
The presented graphene modified immunosensor array successfully measured serum GADA levels
at clinically relevant concentrations. The selectivity of GAD-65 on the sensor surface was useful
to capture GADA carried by MAG-protein A/G beads. The combination of protein A/G coated
MAG beads to separate GADA from serum samples minimized the effect of interferences from the
serum matrix, and thus enhanced the detection sensitivity. Electrochemical and surface plasmon
methods correlated with each other. Plasmon enhancing graphene-COOH offered better analytical
detection features compared to a self-assembled monolayer of MPA. A good, statistically valid
correlation was obtained for the electrochemical immunosensor with the commercial ELISA.
Overall, the binding kinetics parameters can be used as an excellent quality control checkpoint for
large-scale production of graphenyl biosensors for reliable applications in clinical diagnostic
assays.

78
3.5 References
1. Wasserfall, C.H.; Atkinson, M.A. Autoimmun. Rev. 2006, 5, 424–428.
2. Morran, M. P.; Vonberg, A.; Khadra, A.; Pietropaolo, M. Mol. Aspects Med. 2015, 42, 42–60.
3. Pihoker, C.; Gilliam, L. K.; Hampe, C. S.; Lernmark, Å. Diabetes 2005, 54, S52–S61.
4. Atkinson, M. A.; Eisenbarth, G. S. The Lancet 2001, 358, 221–229.
5. Akerblom, H. K.; Vaarala, O.; Hyöty, H.; Ilonen, J.; Knip, M. Am. J. Med. Genet. 2002, 115,
18–29.
6. Ziegler, A.-G.; Nepom, G. T. Immunity 2010, 32, 468–478.
7. Gan, M. J.; Albanese-O’Neill, A.; Haller, M. J. Curr. Probl. Pediatr. Adolesc. Health Care.
2012, 42, 269–291.
8. Lehuen, A.; Diana, J.; Zaccone, P.; Cooke, A. Nat. Rev. Immunol. 2010, 10, 501–513.
9. Pociot, F.; Lernmark, Å. The Lancet 2016, 387, 2331–2339.
10. Urban, G. J. G.; Friedman, M.; Ren, P.; Törn, C.; Fex, M.; Hampe, C. S.; Lernmark, Å.;
Landegren, U.; Kamali-Moghaddam, M. Sci. Rep. 2015, 5.
11. Heding, L. G. Diabetologia 1975, 11, 541–548.
12. Andersen, L.; Dinesen, B.; Jorgensen, P. N.; Poulsen, F.; Roder, M. E. Clin. Chem. 1993, 39, 578–
582.
13. Forest, J. C.; Masse, J.; Lane, A. Clin. Biochem. 1998, 31, 81–88.
14. Miao, D.; Guyer, K. M.; Dong, F.; Jiang, L.; Steck, A. K.; Rewers, M.; Eisenbarth, G. S.; Yu,
L. Diabetes 2013, 62, 4174–4178.
15. Bonaccorso, F.; Sun, Z.; Hasan, T.; Ferrari, A. Nat. Photon. 2010, 4, 611–622.
16. Chiu, N.-F.; Huang, T.-Y.; Lai, H.-C.; Liu, K.-C. Nanoscale Res. Lett. 2014, 9, 1.
17. Lee, H.; Choi, T. K.; Lee, Y. B.; Cho, H. R.; Ghaffari, R.; Wang, L.; Choi, H. J.; Chung, T. D.;
Lu, N.; Hyeon, T.; Choi, S. H.; Kim, D.-H. Nat. Nanotechnol. 2016, 11, 566–572.
18. Patil, A. V.; Fernandes, F. B.; Bueno, P. R.; Davis, J. J. Bioanalysis 2015, 7, 725–742.

79
19. Yang, W.; Ratinac, K. R.; Ringer, S. P.; Thordarson, P.; Gooding, J. J.; Braet, F. Angew. Chem.
Int. Ed. 2010, 49, 2114–2138.
20. Ma, H.; Wu, D.; Cui, Z.; Li, Y.; Zhang, Y.; Du, B.; Wei, Q. Anal. Lett. 2013, 46, 1–17.
21. Shanbhag, V. K. L.; Prasad, K. S. Anal. Methods 2016, 8, 6255–6259.
22. Pu, Y.; Zhu, Z.; Han, D.; Liu, H.; Liu, J.; Liao, J.; Zhang, K.; Tan, W. Analyst 2011, 136, 4138–
4140.
23. Yagati, A. K.; Park, J.; Cho, S. Sensors 2016, 16, 109.
24. Son, S.J.; Reichel, J.; He, B.; Schuchman, M.; Lee, S. B. J. Am. Chem. Soc. 2005, 127, 7316–
7317.
25. Connolly, D.; Currivan, S.; Paull, B. Proteomics, 2012, 12, 2904–2917.
26. Zeng, S.; Baillargeat, D.; Ho, H. P.; Yong, K.T. Chem. Soc. Rev. 2014, 43, 3426–3452.
27. Singh, V.; Krishnan, S. Anal. Chem. 2015, 87, 2648–2654.
28. Ríos, A.; Zougagh, M.; Bouri, M. Anal. Methods, 2013, 5, 4558–4573.
29. Bao, F.; Yao, J. L.; Gu, R. A. Langmuir, 2009, 25, 10782–10787.
30. Nam, J. M.; Thaxton, C. S.; Mirkin, C. A. Science, 2003, 301, 1884–1886.
31. Shad, T. C.; Elghanian, R.; Thomas, A. D.; Stoeva, S. I.; Lee, J-. S.; Smith, N. D.; Schaeffer,
A. J.; Klocker, H.; Horninger, W.; Bartsch, G.; Mirkin, C. A. Proc. Natl. Acad. Sci. 2009, 106,
18437–18442.
32. Zhao, X.; Shippy, S. A. Anal. Chem. 2004, 76, 1871–1876.
33. Singh, V.; Nerimetla, R.; Yang, M.; Krishnan, S. ACS Sensors, 2017, 2, 909–915.
34. Mani, V.; Chikkaveeraiah, B. V.; Rusling, J. F., Expert. Opin. Med. Diagn. 2011, 5, 381–391.
35. Paleček, E.; Fojta, M. Talanta, 2007, 74, 276–290.
36. Adam, V.; Huska, D.; Hubalek, J.; Kizek, R. Microfluid. Nanofluidics, 2010, 8, 329–339.
37. Laschi, S.; Centi, S.; Mascini, M.; Bioanal. Rev. 2011, 3, 11–25.
38. Kamin, R. A.; Wilson, G. S. Anal. Chem. 1980, 52, 1198–1205.

80
39. Premaratne, G.; Nerimetla, R.; Matlock, R.; Sunday, L.; Hikkaduwa Koralege, R. S.; Ramsey,
J. D.; Krishnan, S. Catal. Sci. Technol. 2016, 6, 2361–2369.
40. Niroula, J.; Premaratne, G.; Shojaee, S. A.; Lucca, D. A.; Krishnan, S. Chem. Commun. 2016,
52, 13039-13042.
41. Wu, X. Z.; Huang, T.; Mullett, W. M.; Yeung, J. M.; Pawliszyn, J. J. Microcolumn Sep. 2001,
13, 322-326.
42. Wang, H.; Shi, L.; Yan, T.; Zhang, J.; Zhong, Q.; Zhang, D. J. Mater. Chem. A. 2014, 2, 4739-
4750.
43. Wu, H.; Zhao, W. F.; Hu, H. W.; Chen, G. H. J. Mater. Chem. 2011, 21, 8626.
44. Wu, N.; She, X.; Yang, D.; Wu, X.; Su, F.; Chen, Y. J. Mater. Chem. 2012, 22, 17254-17261.
45. Ding, W.; Cai, J.; Yu, Z.; Wang, Q.; Xu, Z.; Wang, Z.; Gao, C. J. Mater. Chem. A. 2015, 3,
20118-20126.
46. Falahati‐Pour, S. K.; Lotfi, A. S.; Ahmadian, G.; Baghizadeh, A. J. Appl. Microbiol. 2015, 118,
976-988.
47. Song, X.; Wang, L.; Tang, C. Y.; Wang, Z.; Gao, C. Desalination 2015, 369, 1-9.
48. Liao, T.; Yuan, F.; Yu, H.; Li, Z. Anal. Methods, 2016, 8, 1577-1585.
49. Lee, K. Willner, I.; Throckmorton, D. J.; Singh, A. K. Anal. Chem. 2001, 73, 5287 −5295.
50. Lee, K. B.; Park, S.; Mirkin, C. A. Angew. Chem. 2004, 116, 3110-3112.
51. Shen, M.; Joshi, A. A.: Vannam, R.; Dixit, C. K.; Hamilton, R. G.; Kumar, C.V.; Rusling, J.
F.; Peczuh, M. W. ChemBioChem, 2017, DOI:10.1002/cbic.201700513
52. Krishnan, S.; Mani, V.; Wasalathanthri, D.; Kumar, C. V.; Rusling, J. F., Angew. Chem. Int.
Ed., 2011, 50, 1175-1178.
53. Stoeva, S. I.; Lee, J. S.; Smith,J. E.; Rosen, S. T.; Mirkin, C. A. J. Am. Chem. Soc., 2006, 128,
8378-8379.
54. Walikonis, J. E.; Lennon, V. A. Mayo Clin. Proc. 1998, 73, 1161–1166.

81
55. Walgama, C.; Al Mubarak, Z. H.; Zhang, B.; Akinwale, M.; Pathiranage, A.; Deng, J.; Berlin,
K. D.; Benbrook, D. M.; Krishnan, S. Anal. Chem. 2016, 88, 3130–3135.
56. Nogues, C.; Leh, H.; Langendorf, C. G.; Law, R. H. P.; Buckle, A. M.; Buckle, M. PLoS ONE
2010, 5, e12152.
57. Mani, V.; Wasalathanthri, D. P.; Joshi, A. A.; Kumar, C. V.; Rusling, J. F. Anal. Chem. 2012,
84, 10485–10491.
58. Booth, M.A.; Kannappan, K.; Hosseini, A.; Partridge, A. Langmuir, 2015, 31, 8033–8041.
59. R.W. Murray, in: A.J. Bard (Ed.), Electroanal. Chem., Marcel Dekker, NewYork, 1984, 13,
53–157.

82
CHAPTER 4
MEASURING ULTRA-LOW LEVELS OF NUCLEOTIDE BIOMARKERS USING QUARTZ
CRYSTAL MICROBALANCE AND SPR MICROARRAY IMAGING METHODS: A
COMPARATIVE ANALYSIS
4.1 Introduction
In recent years, DNA-based biosensors have received immense attention due to their applicability
in the fields of gene sequencing,1 therapeutic and delivery systems,2 pathogen detection,3-5 and
forensic studies.6 Single stranded DNA molecules can be used as inexpensive molecular analogs of
RNA for assay methodology development for complex sample matrices. Recently, microRNAs
(miRNAs) have become important genetic biomarkers for early diagnosis of various diseases,
including cancer,7,8 and lung diseases.9,10 miRNAs are a group of small RNAs approximately 21–
25 nucleotides in length that function mainly by binding the 3ʹ-untranslated regions of specific
target messenger RNAs (mRNAs) to repress protein translation or cleave mRNAs.11 In particular,
miRNA-21 has been found to be relevant to infectious diseases, such as viral12 and bacterial13
infections, as well as non-infectious diseases such as cardiovascular disorder14 and cancer.15 Hence,
ultra-sensitive and selective detection of miRNA biomarkers present in a complex clinical matrix
such as blood, plasma, or serum is significant for diagnostic applications.
Adapted from G. Premaratne, Z. H. Al Mubarak, L. Senavirathna, L. Liu, and S. Krishnan, Measuring Ultra-
low Levels of Nucleotide Biomarkers Using Quartz Crystal Microbalance and SPR Microarray Imaging
Methods: A Comparative Analysis, Sensors & Actuators: B. Chemical, 2017, 253,368–375 with permission
from Elsevier.

83
Suitable structural features of a capture oligonucleotide probe are essential for selective
hybridization with a target miRNA in the presence of other nucleotides. A quartz crystal
microbalance (QCM) is a mass sensor that provides both qualitative and quantitative measurements
by translating changes in the oscillation frequency of the quartz crystal to the corresponding mass
changes.16 Surface plasmon resonance imaging (SPRi)17-19 is an emerging technique that is superior
to conventional SPR for in situ detection of biomolecular interactions in real-time in a single
microarray platform.20,21 SPRi offers simplicity and higher throughput compared to the
conventional single sample analysis by allowing measurements at a fixed angle of incidence to
directly collect reflectivity changes (ΔR%) across an array of gold spots.22 Furthermore, the SPRi
microarray requires less assay time than conventional SPR to analyze several replicates at once
leading to high precision.23,24 The hybridization of oligonucleotides with the SPR surface-
immobilized capture probe results in an increase in the refractive index. The use of gold
nanoparticles (AuNPs) has been shown to increase the reflectivity changes of a hybridization
reaction due to their effect on enhancing the surface plasmon signals.25-27
In this study, an inexpensive target oligonucleotide containing a similar number of nucleotides to
that of the miRNA-21 marker with thymine in place of uracil and with a poly-T tail and a free thiol
group was designed to covalently attach to AuNPs via the well-known Au-thiol chemisorption.28
The AuNP-linked mimic oligonucleotide was hybridized with a complementary surface
immobilized capture probe. The effect of serum matrix percentage on the resulting detection signals
for the miRNA-21 mimic was evaluated. Selectivity of the assay also was assessed using a five
base pair mismatch-containing sequence as the control. Furthermore, we measured the changes in
SPR reflectivity with an image output in the designed hybridization assay along with quantitative
QCM mass analysis. Such oligonucleotide models are a cost-effective way to develop sensitive
assay strategies for complex sample matrices, compare two analytical methods, and evaluate the

84
efficiency of a hybridization strategy that may be useful for measuring ultra-low levels of miRNA
markers in circulating body fluids.
4.2 Experimental
4.2.1 Materials and chemicals
Thiol-modified custom-designed oligonucleotides (sequences are presented in Table 1),
dithiothreitol (DTT), 6-mercaptohexanol (MHOH), and NAP-10 columns were obtained from
Sigma-Aldrich (Woodlands, TX, USA). AuNPs (50 nm diameter) were purchased from BBI
Solutions (Cardiff, UK). Human serum samples were purchased from Fitzgerald Industries
International Inc. (North Acton, MA, USA). SpotReady-16 gold spotted glass microarray chips
(spot size 1 mm diameter, SPR-1000-016) were obtained from GWC Technologies (Madison, WI,
USA).Gold disc infused quartz crystals (gold diameter 0.2 inch) used for the QCM were purchased
from International Crystal Manufacturing Co, Inc.(Oklahoma City, OK, USA). All other chemicals
were of high-purity analytical grade. To prepare all solutions, ultrapure distilled water (DNAse and
RNAse free) purchased from Life Technologies (Carlsbad, CA, USA) was used.
Table 1. Sequences of designed oligonucleotides.
Surface capture
Probe
5′-HS-
TGTCAGACAGCCCATCGACTGGTGTTGCCATGAGATTCAACAG
TCAACATCAGTCTGATAAGCTACCCGACA-3ʹ
Target 5′-HS-
TTTTTTTTTTTTTTTTTTTTTTTTTTTTTTTTTTTTTTTTTTTTTTTT
TTTAGCTTATCAGACTGATGTTGA-NH2-3ʹ
Control 5′-HS-
TTTTTTTTTTTTTTTTTTTTTTTTTTTTTTTTTTTTTTTTTTTTTTTT
TTTAGGATATCACACTGATGAAGA-NH2-3ʹ
The hybridization sequences for probe, target, and control are highlighted. Base pair mismatches
of the control with respect to the target are highlighted in red. The addition of Poly-T50 segments to
the target and control sequences provides stability and flexibility to the strands.29

85
4.2.2 Instrumentation
The optical imaging experiments were performed using a SPRimagerII array instrument at room
temperature (GWC Technologies). The experiments were conducted using a dual-channel set-up
equipped with two syringe pumps (100 µL sample loop, New Era Pump System, Inc., Farmingdale,
NY, USA) in order to assess hybridization of the target and control oligonucleotides with the
surface capture probe. The Digital Optics V++ software package provided with the instrument was
used to collect SPRi difference images (i.e., differences of the pixel intensities before and after
hybridization events), and the images were visualized using ImageJ 1.49v software (National
Institutes of Health, USA).
The mass changes resulting from hybridization were measured using a QCM instrument (Gamry
Instruments Inc., Warminster, PA, USA). Each modification step on the gold quartz crystal was
performed offline, and the frequency changes were measured in the QCM system at a sample
measurement interval of 0.1 s until a constant frequency response with time was reached. The
fundamental oscillation frequency of the crystals was 10 MHz, and the QCM sensor surface was
immersed in 0.1 M NaCl/0.1 M sodium phosphate buffer (pH 7.4) during measurements.
A Nanodrop ND1000 spectrophotometer (Thermo Scientific, Waltham, MA, USA) was used to
quantify the surface capture probes immobilized on the SPR array or quartz crystal surface and
additionally to quantify the target and control oligonucleotides linked to AuNPs. Surface
characterization of the gold surface of the SPR microarray before and after coating with the surface
capture probe was conducted by scanning electron microscopy (SEM, Model: FEI Quanta 600FE).
An accelerating voltage of 20 kV was applied. The images were acquired using the FEIxT
Microscope Control Software.

86
4.2.3 AuNP-linked oligonucleotide preparation
The disulfide-modified oligonucleotide reduction protocol provided by the manufacturer (Sigma-
Aldrich) was followed to activate the oligonucleotides to link with the AuNPs. For thiol activation,
the dry oligonucleotide samples were treated with an aqueous solution of DTT (100 mM) at a 10:1
ratio (µL DTT to A260 units of oligonucleotides), which is sufficient to activate the thiol groups of
the oligonucleotides.30 The reaction mixture was incubated for 1 h at room temperature. DTT and
other reaction byproducts were removed using a NAP-10 column that was pre-equilibrated with
approximately 15 mL of 50 mM sodium phosphate buffer (pH 6.0). The purified oligonucleotides
were quantified by measuring absorbance at 260 nm using a Nanodrop spectrophotometer (1 mm
path length light source; CCD array detector).31,32 The molar extinction coefficient of each
oligonucleotide sequence was used to calculate concentrations (εprobe: 698.2, εtarget: 637.9, εcontrol:
622.7 mM–1 cm–1, Sigma-Aldrich).
AuNP-linked oligonucleotides were prepared with slight modifications to previously described
methods.33-35 Briefly, 250 µL of test concentrations (50 fM – 50 pM) of the target and control
oligonucleotides were prepared in sodium phosphate buffer (pH 6.0), mixed with 100 µL of 50 nm
AuNP solution, and incubated for 4 h at 37 oC. At the completion of incubation, 150 µL of 1 M
NaCl/0.1 M sodium phosphate buffer (pH 7.4) and 350 µL of distilled water were added, and the
samples were left to age in an incubator for 24 h at 37 oC. The samples then were centrifuged at
12,500 rpm for 45 min to remove the supernatant, and the precipitate obtained was rinsed twice
with 0.1 M NaCl/0.1 M sodium phosphate buffer (pH 7.4). Samples were resuspended to the
original volume of 250 µL using the same buffer solution for both SPRi and QCM analysis. The
calibration plot generated for the AuNP-target oligonucleotide conjugates was used to assess the
recovery when the target oligonucleotide was dissolved in various percentages of human serum.

87
4.2.4 Quartz crystal surface modification and detection
New gold-coated quartz crystals were washed with ethanol followed by distilled water and dried
under N2 gas prior to surface modification steps. Each crystal was incubated with 20 µL of thiol-
activated probes for 4 h in a moist and cold environment (4 oC) following a wash with phosphate
buffer (pH 7.4). The free surface was blocked using 25 µL of 5 mM MHOH, followed by a wash
with distilled water after a 30 min incubation. The initial oscillation frequency was measured by
QCM in solution mode. The surface capture probe-modified quartz crystals were exposed to 20 µL
of AuNP-linked control oligonucleotide for 45 min and then washed with 0.1 M NaCl/0.1 mM
sodium phosphate buffer (pH 7.4) to remove any unbound material from the crystal surface.
Decrease in the oscillation frequency was measured on the modified quartz crystal surface. The
same crystals were exposed to 20 µL of AuNP-linked target oligonucleotide (miRNA-21 mimic)
and incubated for 45 min. Decrease in the frequency of the quartz crystal was measured after
washing with 0.1 M NaCl/0.1 M sodium phosphate buffer (pH 7.4) to remove any unbound target
oligonucleotide. Separate experiments were conducted using the target and control
oligonucleotides that were devoid of AuNP conjugation to assess the signal amplification resulting
from the AuNP linkage strategy.
4.2.5 Modification of the SPR microarray surface and detection
After an initial wash step of the SPR gold array chip with ethanol, 20 µL of thiol-activated capture
probes (Figure 1) were added to 12 spots and incubated for 4 h in a moist and cold environment (4
oC), followed by washing with phosphate buffer (pH 7.4). The free surface of the whole array was
blocked by incubation with 25 µL of 5 mM MHOH for 30 min to minimize nonspecific binding
interactions. The modified chip was immediately placed on the SPRi dual flow channel system.
The chip-prism contact surface was filled with a layer of index matching fluid (Cargille Labs, Cedar
Grove, NJ, USA). Two sample injector units and two syringe pump systems were connected to the

88
flow channels. Real-time measurements were taken using the running buffer, 0.1 M NaCl/0.1 M
sodium phosphate buffer (pH 7.4).
Figure 1. Fabrication procedure of the SPR microarray chip for selective detection of the target
miRNA-21 mimic (T) from the control (C) oligonucleotide sequence by hybridization in a dual
channel SPRi system.
The running buffer was pumped at a flow rate of 50 µL/min, and a reference image of the array
was taken. The dual sample injector loops (100 μL volume) were then separately filled with
suspensions of target or control oligonucleotide-conjugated AuNPs in 0.1 M NaCl/0.1 M sodium
phosphate buffer (pH 7.4) and allowed to pass onto the capture probe-modified array surface for
45 min. Upon completion of the incubation, the chip surface was washed for 10 min with the
running buffer to remove all unhybridized oligonucleotides present in solution. The final images
of the microarray, after introducing target and control oligonucleotides, were acquired using a CCD
camera. The difference between the images taken before and after the hybridization events were
obtained as SPR pixel intensity changes, which can be represented in a 3D format using ImageJ
software. Gold spots treated with only the blocking reagent were used to assess nonspecific signals.

89
Two control spots and six test spots each for detecting the target and control nucleotides were
designed within the same microarray chip, which minimized spot-to-spot variations among
different chips. The average SPR pixel intensities and standard deviations were calculated from the
results obtained for six test spots with three replicate measurements.
4.3 Results and Discussion
4.3.1 Spectroscopic analysis of AuNP-linked oligonucleotides
Figure 2 shows the UV-vis spectra of unmodified AuNPs in aqueous solution and AuNPs linked
with 5′- thiol modified control and target oligonucleotides in 0.1 M NaCl/0.1 M sodium phosphate
buffer (pH 7.4). After linking AuNPs to the target and control oligonucleotides, the Soret band
absorbance shifted from 517 nm to 526 and 524 nm, respectively.
Figure 2. UV-visible spectra of (a) AuNPs
before conjugation to oligonucleotides and
AuNPs linked to (b) target or (c) control
oligonucleotide present in 0.1 M NaCl/ 0.1
M sodium phosphate buffer (pH 7.4).
The shift could be a result of surface modifications that occurred on the AuNPs and/or the
centrifugation step used to separate the AuNP-linked oligonucleotides affecting the particle size
distribution.36 The oligonucleotide linking to AuNPs was free of aggregate formation, as no drastic
changes in the absorption band or decrease in peak intensity were detected. Aggregation of 13 nm
AuNPs upon conjugation with thiolated oligonucleotides has been shown to red shift the Soret

90
band.37 Thus, the absence of notable aggregation in our system was possibly facilitated by the
relatively larger AuNPs (50 nm) and/or negatively charged citrate stabilization of the AuNPs that
repel particle aggregation.38
Table 2 presents the results of quantitation of thiol-activated oligonucleotides before and after
attachment to gold surfaces, which was performed to estimate binding efficiency. The
immobilization efficiency of the surface capture probe was slightly greater for the QCM than for
the SPR microarray. This can be attributed to the larger surface area provided by the gold disc of
the QCM crystal (0.2 cm2) compared to the gold spots of the SPR microarray (0.008 cm2). Binding
of the surface capture probe to the gold surface of the quartz crystal resulted in a frequency change
of 979 ± 18 Hz, which corresponded to a mass change of 662 ± 12 ng. This correlates with the
results obtained from Nanodrop analysis of the surface capture probes that were bound to the quartz
crystal.
Table 2. Quantitation of oligonucleotides immobilized on the QCM or SPR gold surface and
conjugated to AuNPs (N = 3 replicates).
Molecule
type
Surface used to
bind
Amount
introduced
(pmoles)
Amount
bound
(pmoles)
Average
percentage
binding
Surface
capture probe
(9.3 nM)
SPR microarray 461.4 ± 26.8 375.3 ± 39.6 81%
Quartz crystal 461.4 ± 26.8 406.5 ± 41.7 88%
Target
(10 nM)
AuNPs 2.48 ± 0.35 2.17 ± 0.23 87%
Control
(10 nM)
AuNPs 2.52 ± 0.41 2.27 ± 0.16 91%

91
Capture efficiencies of >80% suggest that the design of the surface capture probe on the gold
surface of the quartz crystal and microarray was efficient and that the strategy for AuNP
conjugation of target and control oligonucleotides was effective. The globular morphologies that
appeared after modifying the SPR microarray surface with capture probes are presented as SEM
images (Fig. 3A–C).
Figure 3. SEM images of (A) a bare gold spot of the SPR microarray before modification and (B)
the gold spot self-assembled with the thiol-activated surface capture probe. (C) Higher
magnification image of (B).
4.3.2 Assessment of target hybridization and signal amplification by the mass sensor
We quantified the mass changes that occurred on the quartz crystal (Δm) based on the observed
decrease in oscillation frequency for successive modification steps and by using the Sauerbrey
equation:
∆𝑓 = − 2 𝑓𝑜
2 ∆𝑚
𝐴 √𝜇𝜌
where Δf is the frequency change from the mass adsorbed, fo is the fundamental frequency of
oscillation (10 MHz), A is the geometric area of the gold disc bonded to the quartz crystal (0.2
cm2), μ is the shear modulus of the quartz crystal (2.947 × 10¹¹ dyn cm−2), and ρ is the density of
the quartz crystal (2.648 g cm−3).39-41 The Sauerbrey equation, used to calculate the mass bound on

92
to the quartz crystal, has a thousand times greater sensitivity compared to an electronic balance
with 0.1 µg sensitivity.42
Figure 4. A. Mass changes for the gold-coated quartz crystals modified with the surface capture
probe upon addition of increasing concentration (in pM) of (a) target oligonucleotide captured
onto AuNPs, (b) target oligonucleotide not linked to AuNPs, (c) control oligonucleotide linked to
AuNPs, and (d) the control not linked to AuNPs. B. Mass changes shown for (a) control and (b)
target oligonucleotides (0.5 pM) with or without linking to AuNPs. Data shown are mean ±
standard deviations represented by error bars for N = 3 replicates. Relative standard deviations
(RSDs) for the control were 17% with no AuNPs and 22% with AuNPs linkage. The RSDs for
the target were 11% (no AuNPs) and 7% (with AuNPs).
The QCM showed a significant mass change when the crystal was exposed to MHOH, suggesting
that this reagent has an efficient free surface blocking ability to minimize non-specific interactions.
The AuNP bioconjugation with the target oligonucleotide amplified the mass changes by ~2.5 times
in comparison to the hybridization signals without the AuNPs strategy (Fig. 4A–B). The small
QCM signal responses for the control oligonucleotide suggest good selectivity and specificity for
the surface capture probe to the target miRNA-21 mimic sequence. Even after linking with AuNPs,
the responses were quite negligible in the control, which had five base pair mismatches relative to
the target (~13 times less signal than the target). With the signal amplification strategy, we were
able to detect the target concentrations from 0.05 to 50 pM.
A B

93
4.3.3 Pixel intensity changes in the SPR microarray in response to target or control
nucleotide hybridization with the surface capture probe.
Selective hybridization of the target over the control oligonucleotide with the surface capture probe
coated on the SPR gold microarray was observed, similar to the mass sensor results. Figure 5 shows
the real-time response plots of the SPR imager. Measurements were made from the new steady
state baseline observed after washing the microarray surface with phosphate-buffered saline (PBS)
for 10 minutes, which was sufficient to remove bulk and unhybridized oligonucleotides in solution.
Figure 5. Real-time SPR response (average of eight array spots) for the binding of 0.5 pM of (a)
target or (b) control oligonucleotide linked with AuNPs onto the surface immobilized capture
probes at a flow rate of 50 μL/min. Sample injection and buffer wash points are labeled.
The blocking agent-treated SPR spots that contained only MHOH (Fig. 6) showed no nonspecific
hybridization signals after exposure to the AuNP-linked target or control oligonucleotide. The dual-
channel SPR microarray allowed measurement of the pixel intensity changes with the simultaneous
introduction of similar concentrations of the target and control oligonucleotides. The observed
changes in the pixel intensities for various concentrations of AuNP-linked target oligonucleotides
(0.1 – 50 pM) are summarized in Figure 6 as 3D image representations, and line profiles. These
data show that the small gold spot array surface with about 0.008 cm2 of geometric area allows

94
sufficient immobilization of surface capture probe molecules to hybridize with the low
concentration of target oligonucleotide.
Figure 6. Representations of SPRi responses: the 3D representation (left) and the line profile (right)
that depicts the SPR pixel intensities for various concentrations of target and control nucleotides.
The spot labeled as (a) is the bare gold surface treated with 5 mM MHOH and that of (b) are the
test spots containing the immobilized capture probes. (A)-b: control oligonucleotide of (i) 0.1, (ii)
0.5, (iii) 1, (iv) 10, (v) 30, and (vi) 50 pM concentrations conjugated with AuNPs; and (B)-b: target
oligonucleotide of concentrations similar to those of the control allowed to bind with the surface
capture probe.
The surface capture probe demonstrated excellent selectivity for the target oligonucleotide over the
control oligonucleotide (with five base pair mismatches). The observed changes in the pixel
intensities for the control spots were very low, illustrating that there was minimal non-specific
interaction between the control oligonucleotide and the surface capture probe. The spots that were
completely blocked with MHOH showed negligible non-specific binding to the target or the control
oligonucleotide, suggesting no false-positive signals in the absence of the surface capture probe.

95
4.3.4 Comparison of QCM and SPRi methods
QCM is an excellent quantitation method, and it can provide high sensitivity and selectivity with
use of an appropriate signal amplification strategy and surface chemistry. Results described herein
are similar to those of our prior demonstration of an electrochemical QCM immunosensor for serum
insulin measurements based on magnetic nanoparticle conjugation.40 The double logarithmic
response plot shown in Figure 7A shows a linear correlation (R2=0.99) between the mass change
and concentration of the target oligonucleotide. The limit of detection (LOD)43,44 for QCM-based
quantification was 28 fM, which is a promising detection level and indicates the uniqueness of the
designed experimental conditions in achieving ultra-low detection resulting from minimal
nonspecific and false-positive signals.
Although the QCM method provides sensitivity, quantitative details, and is useful for optimization
of assay conditions, it is a low throughput approach (i.e., one sample at a time, and the most
commonly available form is single quartz crystals). This is because designing a QCM crystal array
is challenging due to engineering difficulties arising from the need to control piezoelectric
properties across the array.45,46 Better throughput can be achieved by using the SPR microarray
strategy. The advantage of using the SPR microarray is that several concentrations can be studied
on the same array platform without the need for multiple experiments. Thus, samples and controls
can be analyzed in the same array in one experiment. Another advantage is that the required volume
of samples is low (200 nL per SPR array spot are sufficient, whereas a QCM crystal needs several
μL of sample). The use of AuNPs contributes to enhancement of the SPRi reflectivity changes due
to the electronic coupling between the plasmons of AuNPs and that of the gold sensor surface upon
hybridization of the nucleotides.47,48 The LOD for the SPRi method in this study was 47 fM.
Although this LOD is slightly higher than that of QCM, our assay in a microarray format displays
a better throughput and similar sensitivity (Fig. 7B).

96
Figure 7. Double logarithmic calibration plots of A. QCM response (control response is subtracted)
and B. SPRi response (control response is subtracted) upon hybridization of various concentrations
of the AuNP-conjugated target oligonucleotide with the surface capture probe. (mean ± standard
deviation for three replicates).
4.3.5 Assessment of selectivity
A recovery test was performed to evaluate the efficiency of the QCM and the SPRi microarray in
detecting the AuNP-linked target oligonucleotide marker prepared in various concentrations of
human serum. Prior to conjugation with AuNPs, 1 pM of the target and control oligonucleotides
were suspended in different concentrations of human serum (10, 25, 50, and 75%) diluted in PBS
solution (pH 7.4). A protocol similar to that described under the Experimental methods was
followed to prepare AuNP-linked target or control oligonucleotides. Table 3 presents the sample
recovery results for analyzing serum samples. Recovery was calculated as a percentage from the
fraction of spiked nucleotide concentration detected after subtracting the control signals. The SPR
microarray offered a reasonably good recovery until 25% serum was reached (> 90%), whereas for
the QCM sensor analyte recovery (> 90%) was significantly affected above 10% serum. The results
obtained suggest the likely applicability of calibration plots generated from buffer nucleotide

97
standards for the determination of nucleotide concentrations present in 10 - 25% serum samples. A
lower dilution factor for serum sample analysis is preferred, as it would minimize dilution of the
nucleotide marker in serum and facilitate easier detection when applied to patient samples.
Table 3. Analysis of the target oligonucleotide in different percentages of serum samples (diluted
in PBS, pH 7.4) using the QCM and SPR microarray.
Serum % [Actual] (pM) [Detected] from
calibration (pM)
Recovery
(%)
QCM
10 1.00 0.93 93%
25 1.00 0.82 82%
50 1.00 0.76 76%
75 1.00 0.67 67%
SPR microarray
10 1.00 0.95 95%
25 1.00 0.93 93%
50 1.00 0.84 84%
75 1.00 0.64 64%

98
Table 4 provides a short comparative summary of previous studies that measured various nucleic acids using AuNPs as a source of signal
amplification. Our SPR microarray (LOD: 47 fM) and QCM (LOD: 28 fM) results are better than or comparable with the detection levels
reported in prior studies.
Table 4. Summary of recent studies related to nucleic acid detection.
Technique Tested molecules Sample matrix Detection limit Ref.
Multiplexed miRNA detection using
AuNP-modified poly-T DNA
hybridization SPR microarray
miRNA-16, miRNA-
122b, miRNA-23b
0.3 M NaCl/ 10 mM
phosphate buffer (pH 7.4)
10 fM Fang et al.,
200649
DNA sensing using catalytic growth of
AuNP-enhanced SPR
cDNA, ssDNA 0.3 M NaCl/ 10 mM
phosphate buffer (pH 7.0)
4.8 pM Yang et al.,
200750
AuNP-amplified SPR interfaces for the
detection of mercury ions using hairpin
DNA probes containing a 21mer T-
rich Hg2+ binding sequence loop
Hairpin DNA TE buffer (10 mM Tris–
HCl, 50 mM
NaCl, 1 mM EDTA, pH
8)
1 nM Chang et al.,
201151
Label free multiplexed detection of
miRNA using silicon photonic
microring resonator arrays
miRNA-24-1 PBS
150 fM Qavi et al.,
201052

99
Nanopore-based programmable
oligonucleotide probe for circulating
miRNA quantification
miRNA-155 1 M KCl buffered with 10
mM Tris (pH 8.0)
100 fM Wang et al.,
201153
Gold nanoprism based localized SPR
sensor for miRNA detection
miRNA-21, miRNA-
10b
PBS buffer (pH 7.4) and
40% human plasma
50 fM Joshi et al.,
201454
3D tetrahedral DNA nanostructure for
DNA recognition and amplification by
hybridization chain reaction using
QCM
Synthetic DNA targets TM buffer (10
mM Tris-HCl and 50 mM
MgCl2, pH 8.0)
0.1fM Ge et al.,
201455
Carboxy-polyethylene glycol
microarray for AuNP-based detection
of miRNA using differential
interference contrast microscopy
let-7a
let-7b
let-7f
let-7g
Saline sodium citrate 10 fM Roy et al.,
201656
Mass sensor
SPR microarray
miRNA-21 mimic Phosphate buffer (pH 7.4) 28 fM
47 fM
This study

100
4.4 Conclusions
We have designed highly sensitive sensors that provide a platform for detecting specific
oligonucelotide biomarkers at femtomolar levels by linking them with AuNPs to enhance
plasmonic sensitivity. The SPR microarray offers better throughput with a comparable LOD than
a QCM sensor provides. Compared to the QCM sensor, the SPR microarray allows multiple
experiments to be run with suitable controls using the dual-channel syringe pump system,
minimizing assay time and offering improved precision. Thus, the SPR microarray approach is
promising for clinical applications to accomplish early diagnosis, treatment, and monitoring of
recurrence of diseases based on circulating miRNAs as biomarkers.
Author contributions
Gayan Premaratne performed the majority of experiments, data analysis and drafeted the
manuscript. Zainab H. Al Mubarak contributed in performing the SPRi measurements. Lakmini
Senavirathna provided support in designing the ssDNA sequences. Dr. Sadagopan Krishnan and
Dr. Lin Liu provided thoughtful insights into the project and reviewed the manuscript.

101
4.5 References
1. J. Labuda, A.M.O Brett, G. Evtugyn, M. Fojta, M. Mascini, M. Ozsoz, I. Palchetti, E. Palecek,
J. Wang, Electrochemical nucleic acid-based biosensors: concepts, terms, and methodology
(IUPAC Technical Report), Pure. Appl. Chem. 82 (2010) 1116–1187.
2. S.D. Patil, D. G. Rhodes, D.J. Burgess, DNA-based therapeutics and DNA delivery systems: a
comprehensive review. The AAPS journal 7 (2005) E61–E77.
3. Z. Shakoori, S. Salimian, S. Kharrazi, M. Adabi, R. Saber, Electrochemical DNA biosensor
based on gold nanorods for detecting hepatitis B virus. Anal. Bioanal. Chem. 407 (2015) 455–
461.
4. J.R. Urbez-Tones, P. Haag, P. Bowen, T. Lowery, D.T. O'Gorman, Development of a DNA
macroarray for the detection and identification of fungal pathogens causing decline of young
grapevines. Phytopathology 105 (2015) 1373–1388.
5. C. Frederickx, F.J. Verheggen, E. Haubruge, Biosensors in forensic sciences/Les biodétecteurs
en sciences forensiques. Biotechnol. Agron. Soc. Environ. 15 (2011) 449–458.
6. M. Kasu, K. Shires, The validation of forensic DNA extraction systems to utilize soil
contaminated biological evidence. Leg. Med. 17 (2015) 232–238.
7. M. Boeri, C. Verri, D. Conte, L. Roz, P. Modena, F. Facchinetti, E. Calabrò, C.M. Croce, U.
Pastorino, G. Sozzi, MicroRNA signatures in tissues and plasma predict development and
prognosis of computed tomography detected lung cancer. Proc. Natl. Acad. Sci. U.S.A., 108
(2011) 3713-3718.
8. Z. Hu, X. Chen, Y. Zhao, T. Tian, G. Jin, Y. Shu, Y. Chen, L. Xu, K. Zen, C. Zhang, H. Shen,
Serum MicroRNA signatures identified in a genome-wide serum MicroRNA expression
profiling predict survival of non–small-cell lung cancer. J. Clin. Oncol. 28 (2010) 1721-1726.

102
9. G.R.V. Pottelberge, P. Mestdagh, K.R. Bracke, O. Thas, Y.M.V. Durme, G.F. Joos, J.
Vandesompele, G.G. Brusselle, MicroRNA expression in induced sputum of smokers and
patients with chronic obstructive pulmonary disease. Am. J. Respir. Crit., 183 (2011) 898-906.
10. G. Liu, A. Friggeri, Y. Yang, J. Milosevic, Q. Ding, V.J. Thannickal, N. Kaminski, E.
Abraham, miR-21 mediates fibrogenic activation of pulmonary fibroblasts and lung fibrosis. J.
Exp. Med., 207 (2010) 1589-1597.
11. M.A. Cortez, G.A. Calin, MicroRNA identification in plasma and serum: a new tool to
diagnose and monitor diseases. Expert. Opin. Biol. Ther. 9 (2009) 703–711.
12. G.Swaminathan, J.Martin-Garcia, S.Navas-Martin, RNA viruses and microRNAs: challenging
discoveries for the 21st century. Physiol. Genomics, 45 (2013) 1035–1048.
13. P. T.Liu, M.Wheelwright,R.Teles, E. Komisopoulou, K.Edfeldt, B.Ferguson, M. D. Mehta, A.
Vazirnia, T. H. Rea, E. N. Sarno, MicroRNA-21 targets the vitamin D-dependent antimicrobial
pathway in leprosy. Nat. Med. 18 (2012) 267–273.
14. Y. Cheng, C. Zhang, MicroRNA-21 in cardiovascular disease. J. Cardiovasc. Trans. Res.3 (3)
(2010) 251–255.
15. N. Yanaihara, N. Caplen, E. Bowman, M. Seike, K. Kumamoto, M. Yi, R. M. Stephens, A.
Okamoto, J. Yokota, T. Tanaka, Unique microRNA molecular profiles in lung cancer diagnosis
and prognosis. Cancer cell 9 (2006) 189–198.
16. C. I.Cheng, Y.-P.Chang,Y.-H. Chu, Biomolecular interactions and tools for their recognition:
focus on the quartz crystal microbalance and its diverse surface chemistries and applications.
Chem. Soc. Rev. 41 (2012) 1947–1971.
17. C. L. Wong, M. Olivo, Surface plasmon resonance imaging sensors: a review. Plasmonics 9
(2014) 809–824.
18. X. Wang, S. Zhan, Z. Huang, X. Hong, Review: advances and applications of surface plasmon
resonance biosensing instrumentation. Instrum. Sci. Technol. 41 (2013) 574–607.

103
19. Y. Liu, Q. Liu, S. Chen, F. Cheng, H. Wang, W. Peng, Surface plasmon resonance biosensor
based on smart phone platforms. Sci. Rep. 5 (2015) 12864.
20. M. Puiu, C. Bala, SPR and SPR imaging: Recent trends in developing nanodevices for detection
and real-time monitoring of biomolecular events. Sensors 16 (2016) 870.
21. C. Lausted, Z. Hu, L. Hood, Label-free detection with surface plasmon resonance imaging.
Protein Microarray for Disease Analysis: Methods and Protocols (2011) 321–333.
22. H. H. Nguyen, J. Park, S.Kang, M. Kim, Surface plasmon resonance: a versatile technique for
biosensor applications. Sensors 15 (2015) 10481–10510.
23. J.M. Brockman, B.P. Nelson, R.M. Corn, Surface plasmon resonance imaging measurements
of ultrathin organic films, Annu. Rev. Phys. Chem. 51 (2000) 41–63.
24. G. Spoto, M. Minunni, Surface plasmon resonance imaging: what next?, J Phys. Chem. Lett. 3
(2012) 2682–2691.
25. G. Li, X. Li, M. Yang, M. M. Chen, L. C. Chen, X. L. Xiong, A gold nanoparticles enhanced
surface plasmon resonance immunosensor for highly sensitive detection of ischemia-modified
albumin. Sensors, 13 (2013) 12794–12803.
26. E. E. Bedford, J. Spadavecchia, C. M. Pradier, F. X. Gu, Surface plasmon resonance biosensors
incorporating gold nanoparticles. Macromol. Biosci. 12 (2012) 724–739.
27. Y. Li, A. W. Wark, H. J. Lee, R.M. Corn, Single-nucleotide polymorphism genotyping by
nanoparticle-enhanced surface plasmon resonance imaging measurements of surface ligation
reactions. Anal. Chem. 78 (2006) 3158–3164.
28. P.M. Tiwari, K. Vig, V.A. Dennis, S.R. Singh, Functionalized gold nanoparticles and their
biomedical applications. Nanomaterials 1 (2011) 31-63.
29. J. B. Mills, E.Vacano, P. J. Hagerman, Flexibility of single-stranded DNA: use of gapped
duplex helices to determine the persistence lengths of poly (dT) and poly (dA). J. Mol. Biol.
285 (1999) 245–257.

104
30. Y. Wang, T. Prokein, M. Hinz, H. Seliger, W. A. Goedel, Immobilization and hybridization of
oligonucleotides on maleimido-terminated self-assembled monolayers. Anal. Biochem. 344
(2005) 216–223.
31. J. Z. Porterfield, A. Zlotnick, A simple and general method for determining the protein and
nucleic acid content of viruses by UV absorbance. Virology 407 (2010) 281–288.
32. L. Soares, A. Csáki, J. Jatschka, W.Fritzsche, O. Flores, R. Franco, E. Pereira, Localized
surface plasmon resonance (LSPR) biosensing using gold nanotriangles: detection of DNA
hybridization events at room temperature. Analyst 139 (2014) 4964–4973.
33. K. C. Grabar, K. J. Allison, B. E. Baker, R. M. Bright, K. R. Brown, R. G. Freeman,A. P. Fox,
C. D. Keating, M. D. Musick, M. J. Natan, Two-dimensional arrays of colloidal gold particles:
a flexible approach to macroscopic metal surfaces. Langmuir 12 (1996) 2353–2361.
34. C. A. Mirkin, R. L. Letsinger, R. C. Mucic, J. J. Storhoff, A DNA-based method for rationally
assembling nanoparticles into macroscopic materials. Nature 382 (1996) 607–609.
35. S. R. Nicewarner Peña, S. Raina, G. P. Goodrich, N. V. Fedoroff, C. D. Keating, Hybridization
and enzymatic extension of Au nanoparticle-bound oligonucleotides. J. Am. Chem. Soc. 124
(2002) 7314–7323.
36. M. A. Hayat, Colloidal gold: principles, methods, and applications. Elsevier. (2012).
37. J. J. Storhoff, R. Elghanian, R. C. Mucic, C. A. Mirkin, R. L. Letsinger, One-pot colorimetric
differentiation of polynucleotides with single base imperfections using gold nanoparticle
probes. Journal of the American Chemical Society, 120 (1998) 1959–1964.
38. N. Bayat, V. R. Lopes, M. Sanchez-Dominguez, R. Lakshmanan, G. K. Rajarao, S. Cristobal,
Assessment of functionalized iron oxide nanoparticles in vitro: introduction to integrated
nanoimpact index. Environ. Sci. Nano. 2 (2015) 380–394.
39. V. Singh, S. Krishnan, Voltammetric immunosensor assembled on carbon-pyrenyl
nanostructures for clinical diagnosis of type of diabetes, Anal. Chem. 87 (2015) 2648–2654.

105
40. V.Singh, S.Krishnan, An electrochemical mass sensor for diagnosing diabetes in human serum.
Analyst 139 (2014) 724–728.
41. B. Della Ventura, M. Iannaccone, R. Funari, M. P. Ciamarra, C. Altucci, R. Capparelli, R.
Velotta, Effective antibodies immobilization and functionalized nanoparticles in a quartz-
crystal microbalance-based immunosensor for the detection of parathion. PloS one, 12 (2017)
e0171754.
42. K. A. Marx, Quartz crystal microbalance: a useful tool for studying thin polymer films and
complex biomolecular systems at the solution-surface interface. Biomacromolecules 4 (5)
(2003) 1099–1120.
43. D. A. Armbruster, T.Pry, Limit of blank, limit of detection and limit of quantitation. Clin.
Biochem. Rev. 29 (2008) S49–52.
44. F. T.Peters, O. H. Drummer, F. Musshoff, Validation of new methods. Forensic Sci. Int. 165
(2007) 216–224.
45. N. C.Speller, N. Siraj, S. Vaughan, L. N. Speller, I. M. Warner, Assessment of QCM array
schemes for mixture identification: citrus scented odors. RSC Advances 6 (2016) 95378–
95386.
46. K. Jaruwongrungsee, T. Maturos, P. Sritongkum, A. Wisitsoraat, M. Sangworasil, A.
Tuantranont, Analysis of quartz crystal microbalance sensor array with circular flow chamber.
Int. J.Appl. Biomed. Eng. 2 (2009) 51.
47. F. Salam, Y. Uludag, I. E. Tothill, Real-time and sensitive detection of Salmonella
Typhimurium using an automated quartz crystal microbalance (QCM) instrument with
nanoparticles amplification. Talanta 115 (2013) 761–767.
48. S. Elhadj, G. Singh, R. F. Saraf, Optical properties of an immobilized DNA monolayer from
255 to 700 nm. Langmuir 20 (2004) 5539–5543.

106
49. S. Fang, H. L. Lee, A. W. Wark, R.M. Corn, Attomole microarray detection of microRNAs by
nanoparticle-amplified SPR imaging measurements of surface polyadenylation reactions. J.
Am. Chem. Soc. 128 (2006) 14044–14046.
50. X. Yang, Q. Wang, K. Wang, W.Tan, H.Li, Enhanced surface plasmon resonance with the
modified catalytic growth of Au nanoparticles. Biosen. Bioelectron. 22 (2007) 1106–1110.
51. C. -C. Chang, S. -Y. Lin, S. -C. Wei, C. -Y. Chen, C.-W. Lin, An amplified surface plasmon
resonance “turn-on” sensor for mercury ion using gold nanoparticles. Biosen. Bioelectron. 30
(2011) 235–240.
52. A. J. Qavi, R. C. Bailey, Multiplexed detection and label‐free quantitation of microRNAs using
arrays of silicon photonic microring resonators. Angew. Chem. Int. Ed. 49 (2010) 4608–4611.
53. Y. Wang, D. Zheng, Q. Tan, M. X. Wang, L. Q. Gu, Nanopore-based detection of circulating
microRNAs in lung cancer patients. Nat.Nanotech. 6 (2011) 668–674.
54. G. K. Joshi, S. Deitz-McElyea, M. Johnson, S. Mali, M. Korc, Sardar, R. Highly specific
plasmonic biosensors for ultrasensitive microRNA detection in plasma from pancreatic cancer
patients. Nano letters 14 (2014) 6955–6963.
55. Z. Ge, M. Lin, P. Wang, H. Pei, J. Yan, J. Shi, Q. Huang, D. He, C. Fan, X. Zuo, Hybridization
chain reaction amplification of microRNA detection with a tetrahedral DNA nanostructure-
based electrochemical biosensor. Anal. Chem. 86 (2014) 2124–2130.
56. S. Roy, J.H. Soh, J. Y. Ying, A microarray platform for detecting disease-specific circulating
miRNA in human serum. Biosens. Bioelectron.75 (2016) 238–246.

107
CHAPTER 5
MULTIPLEXED SURFACE PLASMON ASSAY FOR SERUM PROTEINS AND MICRO-
RIBONUCLEIC ACIDS: SIGNAL AMPLIFICATION BY BIMETALLIC Fe3O4@Au
NANOPARTICLES
5.1 Introduction
To increase prediction rates by reducing false positive diagnoses based conventionally on a single
marker analysis, it is important to measure a panel of key biomarkers. Highly expressed circulating
protein and micro-ribonucleic acids (miRNA) markers have received increased attention in liquid
biopsy studies due to their promising predictability feature.1 Many analytical methods including
enzyme-linked immunosorbent assay (ELISA), spectroscopic and molecular biology techniques
(real-time polymerase chain reaction, northern blotting, microarray technology, and in situ
hybridization) have been employed in cancer biomarker detection.2,3
In view of developing molecular technologies that enable more precise and objective decision
making, surface plasmon resonance (SPR) spectroscopy with multiplexed imaging integrated with
the advances in microfluidics is an attractive strategy. SPR is a highly sensitive surface analysis
technique that can determine the binding events of various ligands to their respective receptors
through refractive index changes.4,5 Additionally, SPR can be used for high-throughput screening
and to obtain real-time binding insights of biomolecular interactions by elegantly tuning the surface
chemistries and metal-dielectric interfacial properties.6-8 Due to these features, SPR methods have
been widely employed for selective detection of various biomarkers.9-11

108
Incorporation of nanomaterials in bioassays offers the unique advantages of robustness due to
superior chemical and solvent stability compared to light-sensitive labels, versatility to be adopted
to various analytical techniques, and increased sensitivity and lowered detection limits. However,
the compromise on the linear dynamic range for high sensitivity needs to be overcome for
nanomaterial-based assays to measure various analyte concentrations in clinical samples.12,13
Among metal nanoparticles (NPs), the bimetallic NPs allow tuning of plasmonic and magnetic
properties, and the core (inner component)/shell (outer component) class is one of the important
types that combine the beneficial properties of the two different nanomaterials.14,15 Different
bimetallic combinations such as silver@gold, iron@platinum, platinum@cobalt, and
gold@platinum have been designed for biosensing, bio-imaging, and drug delivery applications.16
In particular, the magnetic properties of the iron-gold (Fe3O4@Au) bimetallic NPs offers the dual
benefit of (i) easy conjugation and magnetic separation of desired compounds for subsequent
detection in the assay;17 and (ii) the plasmonic gold shell properties are useful for amplifying the
surface plasmon detection signals.18 In addition, the coating of Fe3O4 NPs with a gold material
provides more dispersibility and room for various surface functionalization strategies (e.g., thiols,
polymers, small molecules, dendrimers) for immobilizing biomolecules.19,20 Brown et al.
demonstrated the synthesis of homogeneous and larger NPs via a seeding method involving the
reduction of gold salts by using either sodium citrate or hydroxylamine reagents.21 Pham et al.
magnetically separated IgG protein by gold-coated Fe3O4 NPs of 15-40 nm size.17
In this report, for the first time, we have devised a multiplexed SPR imager (SPRi) microarray
utilizing Fe3O4@Au NPs to simultaneously measure two protein and two miRNA markers present
in human serum. Greater plasmon enhancement signal in the imager by the synthesized Fe3O4@Au
NPs over either Fe3O4 or Au NPs of similar sizes is demonstrated. To demonstrate the applicability
of our SPRi bimetallic NP-based assay for health monitoring based on circulating biomarkers, we
chose two interleukins (IL-6 and IL-8) and miRNAs (miRNA-21 and miRNA-155) as

109
representative biomolecules. These markers were detected by spiking them in 10% normal human
serum.
IL-6 has been reported to be one of the major cytokines found in the tumor microenvironment and
in the circulatory system, and it is found to be over-expressed in all types of tumors depicting their
progression and severity.22 At the same time, the serum concentration of IL-8 has been found to
correlate with tumor burden, thus making it a useful pharmacodynamic-biomarker to detect
responses to cancer immunotherapy.23 Among the members of the miRNA family, miRNA-21 is
one of the consistently upregulated circulatory biomarkers in cancer patients.24 Similarly, the
miRNA-155 is a robust oncogenic circulating miRNA, and its overexpression can indicate the
promotion of tumorigenesis.25 The circulating concentrations of miRNA-21 and miRNA-155
markers have the potential utility for early diagnosis and monitoring of tumors as well as for
predicting chemoresistance.
Fe3O4@Au bimetallic NPs are employed as a signal amplification label on the SPRi platform to
increase sensitivity and mitigate the responses arising from the non-specific interaction of other
components in a serum sample. The designed sensor not only detects four biomarkers, but also
offers kinetic information, which is vital to understanding the degree of interaction of the chosen
receptors with the target analytes, and the analytical advantage of the designed assay strategy. Such
an SPRi array platform represents a useful bioassay that can be well adapted for analysis of
biomarkers present in clinical samples.
5.2 Experimental
5.2.1 Materials and chemicals
Thiol modified custom-designed DNA oligonucleotides and miRNAs (sequences presented in
Table 1), bovine serum albumin (BSA), dithiothreitol (DTT), 6-mercaptohexanol (MHOH), 3-
mercaptopropionic acid (MPA), ethyl-3-[3-dimethylaminopropyl]carbodiimide hydrochloride

110
(EDC), and N-hydroxysuccinimide (NHS), gold(III) chloride trihydrate (HAuCl4.3H2O), sodium
borohydride, sodium citrate, gold and iron standards for ICP analysis (1000 ppm) were obtained
from Sigma-Aldrich (St. Louis, MO). Recombinant IL-6 and IL-8 proteins, and purified anti-human
IL-6 and IL-8 sandwich antibodies (the surface-immobilized antibody is monoclonal and the
bimetallic NP-attached detection antibody is polyclonal) were purchased from BioLegend Inc.,
(San Diego, CA). The human serum samples were purchased from Fitzgerald Industries
International Inc., (North Acton, MA). Citrate-stabilized magnetic nanoparticles (Fe3O4 NPs, 50
nm hydrodynamic diameter) were purchased from Chemicell GmbH Inc., (Berlin, Germany).
Ultrapure deionized water (DI water) and NAP-10 columns were obtained from GE Healthcare
(Cranbury, NJ). SpotReady-16 gold spotted glass microarray chips (spot size 1 mm diameter, SPR-
1000-016) were obtained from GWC Technologies (Madison, WI).
Table 1. Sequences of the custom-designed DNA oligonucleotides employed in this study. (In the
hairpin capture DNA, the sequences in italics (underlined) are complementarity to the target
miRNA sequence, the sequences in bold are the hairpin forming sequence, and those highlighted
in gray are complementary to the sequence of the bimetallic NPs attached detection DNA. The
detection DNA partially hybridizes with the exposed region of the hairpin surface DNA when pre-
hybridized with the miRNA marker)
miRNA-21 5'UAGCUUAUCAGACUGAUGUUGA3'
Hairpin capture DNA
for miRNA-21
5'SH-(CH2)6-
ATTGAATCGAGTCAACATCAGTCTGATAAGCTATGCATAGCTTC
AAT-(CH2)3-NH23'
miRNA-155 5'UUAAUGCUAAUCGUGAUAGGGGU3'
Hairpin capture DNA of
miRNA-155
5'SH-(CH2)6-
ATTGAATCGAGACCCCTATCACGATTAGCATTAATGCATAGCTTC
AAT-(CH2)3-NH23'
Detection DNA
(Fe3O4@Au NP bound)
5'SH-(CH2)3–TTTTTTTTTTTTTGATTGAAGCAT3'

111
5.2.2 Instrumentation
The optical measurements were made using a SPRimagerII array instrument at room temperature
(Horizon SPR imager model) operating at a SPR source wavelength of 800 nm (GWC
Technologies, Madison, WI, USA). The experiments were conducted using our custom designed
four channel microfluidics set-up, each connected to a syringe pump (100 µL sample loop, New
Era Pump System, Inc., NY, USA). The SPRi pixel intensities for increased miRNA or IL
concentrations upon binding to their surface-immobilized selective receptors followed by signal
amplification from the binding of Fe3O4@Au NPs linked detection probes were measured. Digital
Optics V++ software package provided in the instrument was used to collect the SPRi difference
images (i.e., differences of the pixel intensities before and after the binding events), and the 3D-
images were represented using ImageJ 1.49v software (NIH, USA).
Quantification of oligonucleotides was done by a Nanodrop ND1000 spectrophotometer (Thermo
Scientific, Waltham, MA). The UV-vis spectral absorbance of antibodies and DNA
oligonucleotides was measured at 280 and 260 nm, respectively.26 The elemental analysis of the
Fe3O4@Au NPs was performed by an inductively coupled plasma optical emission
spectrophotometric analyzer (ICP-OES, SPECTRO Analytical Instruments Inc., NJ, USA). The
emission line selected for the Fe was 259.9 nm, and for Au, the line was 267.5 nm.27
Transmission electron microscopy (TEM, JEOL JEM-2100) images of the synthesized Fe3O4@Au
NPs were obtained by preparing drop-coated samples on carbon surface grids. Surface
characterization of the gold microarray before and after coating with the surface capture DNA, after
hybridizing with the miRNA marker, and subsequently, with the plasmon enhancing Fe3O4@Au
NPs linked detection probes was conducted by scanning electron microscopy (SEM, Model: FEI
Quanta 600FE). An accelerating voltage of 20 kV was applied. The images were acquired using
the FEIxT Microscope Control Software. The hydrodynamic diameter and surface charges of

112
Fe3O4@Au NPs covalently attached with the detection antibody or DNA were measured using a
ZetaPALS potential analyzer (Brookhaven Instruments Corporation, Holtsville, NY, USA).
5.2.3 Synthesis and characterization of Fe3O4@Au bimetallic nanoparticles
By adopting a seed growth technique derived from the process called Ostwald ripening, gold NPs
coated onto Fe3O4 NPs were synthesized (Figure 1).28 During this process, the continuous growth
of the gold layer will take place on the surface of Fe3O4 NPs. This will cause the bimetallic NPs to
significantly grow in size. A reaction flask containing HAuCl4.3H2O (10.3 mg/mL, 5 mL), sodium
citrate (59.3 mg/mL, 5 mL), Fe3O4 NPs (25 mg/mL, 0.5 mL) and 25 mL of H2O was refluxed at
100 oC for 10 min. A freshly prepared mixture of HAuCl4.3H2O (4.53 mg/mL, 10 mL), Fe3O4 NPs
(0.12 mg/mL, 10 mL), and sodium citrate (22.55 mg/mL, 10 mL) was then added to the reaction
flask as 1 mL aliquots for every 2 min at 90 oC. This secondary addition of the reaction mixture
controls the size of the outer Au shell formed around the Fe3O4 NPs.
Synthesized nanoparticles were characterized to determine their physical and chemical properties.
The Fe3O4@Au NPs were compared with similarly sized Au NPs or Fe3O4 NPs to estimate the
relative SPRi signal enhancement property.
Figure 1. Schematic illustration of the synthesis of Fe3O4@Au bimetallic NPs using the reaction
mixture consisting of 1. HAuCl4.3H2O, 2. Fe3O4 NPs, and 3. sodium citrate.

113
5.2.4 Preparation of the covalent conjugates of Fe3O4@Au NPs with detection antibodies
The surface lysine residues of IL-6 and IL-8 second antibodies were attached to the carboxylic acid
groups of citrate molecules adsorbed around Fe3O4@Au NPs using a protocol employed in our
previously reported studies.29-31 Briefly, the Fe3O4@Au NPs were suspended in freshly prepared
aqueous solution containing EDC (0.35 M) and NHS (0.1 M) and allowed to incubate for 20 min
to create the easily leaving N-succinimidyl ester units of the carboxyl groups. The NPs were
separated magnetically by using a magnet to remove the unreacted EDC/NHS solution. The
particles were then washed twice with phosphate buffered saline (PBS), magnetically separated
after each wash, and resuspended in PBS (pH 7.4). A freshly prepared antibody solution (200 μL
of 5 µg mL−1 in pH 7.4 phosphate buffer) was immediately added to the NP solution. The covalent
attachment of antibodies to NPs was carried out for 1 h at room temperature with a continuous
gentle mixing of the reaction tubes in an incubator (Labnet International Inc.,). Covalently attached
Antibody-Fe3O4@Au conjugates were separated from the free antibody solution by the magnet and
the conjugates were washed twice in PBS, resuspended in a 200 μL of a fresh PBS solution before
using for SPR studies.
5.2.5 Preparation of the conjugates of Fe3O4@Au with detection DNA molecules
Initially, to prepare the DNA oligonucleotide linked to Fe3O4@Au NPs, a protocol provided by the
manufacturer (Sigma-Aldrich) was followed to reduce the disulfide-modified oligonucleotide for
thiol-activation. For this, the dry oligonucleotide sample was treated with an aqueous solution of
DTT (100 mM) at 10:1 ratio (µL DTT to A260 units of oligonucleotides) and incubated for 1 h at
room temperature. A NAP-10 column, pre-equilibrated with approximately 15 mL of 50 mM
sodium phosphate buffer (pH 6.0), was used to remove DTT and any other irrelevant impurities.
The concentration of the purified detection oligonucleotide was determined by measuring
absorbance at 260 nm using a NanoDrop spectrophotometer (1 mm path length light source; CCD

114
array detector) and the molar extinction coefficient of the detection oligonucleotide sequence
(εdetection: 227.8 mM-1cm-1, Sigma-Aldrich).
DNA-Fe3O4@Au conjugates were prepared by chemisorbing the thiol-activated oligonucleotides
according to our previously described method with slight modifications.32 In short, 500 µL of 2 µM
detection DNA oligonucleotide solution prepared in sodium phosphate buffer (pH 6.0) was mixed
with 250 µL of Fe3O4@Au solution and incubated with gentle mixing for 4 h at 37 oC. Upon
completion of incubation, 250 µL of 1 M NaCl/0.1 M sodium phosphate buffer (pH 7.4) and 500
µL of distilled water were added and incubated for 24 h at 37 oC. The high salt 1 M NaCl/0.1 M
sodium phosphate buffer (pH 7.4) solution favors the thiolated DNA to adsorb well on to the gold
surface of Fe3O4@Au NPs.33 Following this, the DNA-Fe3O4@Au conjugates were magnetically
separated from the supernatant and were rinsed twice with 0.3 M NaCl/0.1 M sodium phosphate
buffer (pH 7.4) and brought to the original volume of 500 µL with PBS (pH 7.4), prior to use in the
assay. The low salt 0.3 M NaCl/0.1 M sodium phosphate buffer (pH 7.4) prevents the irreversible
growth of the Fe3O4@Au NPs after linking to DNA.33
5.2.6 Preparation of the four-channel microarray and multiplexed analysis
Eight spots on the SPRi gold array chip were incubated in 100 mM of MPA solution in ethanol for
12 h to form a self-assembled monolayer with free carboxyl surface groups. The chip was then
washed thoroughly with DI water and dried under nitrogen. Following the EDC/NHS activation,
the spots were rinsed with DI water and air-dried. The capture antibody of IL-6 or IL-8 (0.25 µL
of 1 µg mL-1 per spot) was placed on four spots of the gold array. Similarly, the thiol-activated
hairpin capture DNA of miRNA-21 or miRNA-155 (0.25 µL of 1 µM solution per spot) was placed
on four spots of the gold array.
The capture molecules were immobilized for a duration of 1 h in a moist, cold environment (4 oC,
Figure 2). The free surface of the oligonucleotide-coated spots was blocked using 5 mM MHOH

115
for 30 min and the chip was washed with PBS (pH 7.4) to minimize non-specific binding
interactions.
Figure 2. A. The experimental set-up for multiplexed SPRi analysis using a four-channel flow
injection system. B. The SPRi chip was modified with capture probes (CAb: capture antibodies or
CDNA: capture DNA) and the analytes were assayed as follows: Two lanes (4 spots each) of the
SPRi microarray were self-assembled with a monolayer of MPA. The remaining two lanes were
self-assembled with thiol-activated hairpin capture DNAs of miRNA-21 and miRNA-155 (4 spots
each) followed by blocking the free surface with MHOH. The IL-6 and IL-8 capture antibodies
were covalently attached to the -COOH activated MPA surface (4 spots each) followed by blocking
of the free surface with 1% BSA. Various concentrations of the protein and miRNA markers were
spiked in 10% human serum and allowed to bind their respective capture molecules on the chip
using the designated individual flow channels. The signal amplification step of the bioassay was
subsequently followed by introducing the respective detection molecules (DAb: detection antibodies
or DDNA: detection DNA) conjugated to Fe3O4@Au NPs yielding detection DNA-Fe3O4@Au or
detection antibody-Fe3O4@Au NPs.

116
The modified chip was immediately assembled on to the SPRi four-channel flow system with a
layer of index matching fluid between the free glass side of the chip that will be in contact with the
prism (Cargille Labs, NJ, USA). Each channel was connected to a sample injector unit and a syringe
pump. Real-time measurements were performed using the running buffer, PBS (pH 7.4).
Initially, the running buffer was pumped at a flow rate of 50 µL min-1, and a reference image of the
array was taken at first. The sample injector loops (100 μL volume) were then separately filled with
known concentrations of IL-6, IL-8, miRNA-21, or miRNA-155 solutions spiked in 10% normal
human serum in PBS (pH 7.4), and allowed to pass onto the capture molecule modified arrays for
45 min. Upon completion of the incubation, the chip surface was washed for 10 min with the
running buffer to remove all unbound molecules. Then 100 μL of Fe3O4@Au NPs conjugated to
detection molecules were introduced and incubated for 30 min, and washed with running buffer for
10 min before measuring the net pixel intensity changes. A control experiment was conducted by
treating the capture probe-modified microarray with only 10% serum to obtain the background
signals.
The final images of the microarray were acquired using a CCD camera. The difference images
taken before and after each assay step are represented in a 3D format using ImageJ software (1.49v,
NIH, USA). Multiplexing provided room for the analysis of four biomarkers in a single assay and
minimized multiple experiments due to the microarray platform.
5.3 Results and Discussion
5.3.1 Hydrodynamic size and zeta potential of Fe3O4@Au NPs and conjugates
The average hydrodynamic diameter of the synthesized Fe3O4@Au NPs and its conjugates with the
detection molecules (second antibody or oligonucleotide) were determined by the dynamic light
scattering (DLS) method (Table 2). A total of five measurements were made at a 90o angle (2 min
per measurement). The samples were diluted five times prior to measurements in PBS (pH 7.4).

117
The antibodies contain free surface lysine residues to covalently attach them to the surface carboxyl
groups on Fe3O4@Au NPs with random orientations, and no additional steps were implemented for
orienting the antibodies.34
The average size of the Fe3O4@Au NPs increased by about 25 nm after the antibody attachment.
This is consistent with the typical hydrodynamic size of the antibodies (10 to 15 nm).35 A similar
size increment was observed upon chemisorption of thiol-activated DNA to the Fe3O4@Au NPs.
The polydispersity index was ≤ 0.2 indicating good dispersion and narrow size distributions of the
conjugated NPs in the buffer medium, which is likely the result of surface charge repulsions.
Table 2. The hydrodynamic diameters and ζ-potentials of Fe3O4@Au NPs and their conjugates
with a detection antibody (shown here for IL-6 second antibody) or a detection DNA probe.
Parameter Fe3O4@Au NPs Antibody-Fe3O4@Au DNA-Fe3O4@Au
Hydrodynamic
diameter (nm)
105 ± 6 132 ± 11 124 ± 5
Polydispersity index 0.19 ± 0.03 0.18 ± 0.05 0.15 ± 0.01
ζ potential (mV) -38 ± 4 -12 ± 1 -51 ± 3
The ζ-potential was calculated by phase analysis of light scattering (PALS) that determined the
electrophoretic mobility of the particles by Smoluchowski's equation available with the instrument
software. Diluted samples were used to measure the ζ-potential of the NPs and conjugates for a
total of 10 measurements with each measurement lasting for 30 seconds (Table 2). The negative ζ-
potential measured for the unconjugated NPs is due to the citrate surface groups. The anti-IL
antibodies are members of an IgG class and they typically bear an isoelectric point (pI) of 8-9.536
and hence a net positive charge at pH 7.4. This is in agreement with the significant shift in the
positive ζ-potential for the detection antibody attached Fe3O4@Au NPs. The intrinsic negative
charge of nucleotides37 due to their phosphate groups shifted the ζ-potential of Fe3O4@Au NPs to
more negative values (Table 2).

118
5.3.2 Elemental composition of the Fe3O4@Au NPs
One mL of a solution of Fe3O4@Au NPs (3 mg/mL) was digested for 4 h in 9 mL of HNO3:HCl
(1:3) acid mixture in a hot-water bath.38 Upon completion of the digestion, the samples were diluted
to 25 mL volume with deionized water. The Fe and Au standard solutions (0.5 to 100 ppm) were
prepared by diluting the stock solutions (1000 ppm) in DI water. A calibration curve was developed
using the standard solutions prior to analyzing the digested Fe3O4@Au NPs nanoparticle samples
(N = 3). The percentage composition of Fe and Au was found to be 21.5 ± 0.4 ppm (91%) and 2.1
± 0.1 ppm (9%), respectively.
5.3.3 Estimation of SPRi signal amplification by Fe3O4@Au NPs over Fe3O4 or Au NPs of
similar sizes
To determine the SPRi signal amplification, the pixel intensities of Fe3O4 NPs (100 nm), Au NPs
(100 nm), and the synthesized Fe3O4@Au NPs (75 nm) or Fe3O4@Au NPs (105 nm) were
compared, similar to that reported previously.39 In brief, the SPRi microarray was coated with a
polycationic layer, polyethyleneimine (PEI, 0.1 mg mL-1 in DI water), by adsorbing for 30 min, and
washed with DI water. The negatively charged citrate-stabilized NPs were then adsorbed for 30
min on the polymer coated spots and rinsed with DI water to remove any unbound NPs. The
difference image obtained (before and after the coating with NPs) was processed by ImageJ
software to obtain 3D representations (Figure 3).
The pixel intensities for the synthesized Fe3O4@Au NPs (75 nm) were 9-times and 4-times higher
than Fe3O4 (100 nm) NPs and Au NPs (100 nm) alone, respectively. The increase in the Au shell
size in the case of 105 nm Fe3O4@Au NPs further increased the SPRi pixel intensity to ~ 11-times
and 6-times over the Fe3O4 (100 nm) and Au NPs (100 nm) alone, respectively. This could be
attributed to the spectral overlap of the surface plasmon resonance in the Au shell with an intrinsic

119
electronic transition with the Fe3O4 core.18 The results provide evidence for the Au shell containing
bimetallic NPs for enhancing the plasmon resonance.
Figure 3. The SPRi responses of A. 100 nm Fe3O4 NPs, B. 75 nm Fe3O4@Au NPs, C. 100 nm Au
NPs, and D. 105 nm Fe3O4@Au NPs adsorbed onto 0.1 mg mL-1 PEI coated gold surface. (a)
Schematic and experimental 3D images of SPR pixel intensity, (b) only the PEI adsorbed gold
surface. The corresponding line profiles and difference images (in grey) are shown on the right.
5.3.4 Microscopic characterization of the NPs and surface binding event of the conjugates
made with detection probes
Figure 4A represents the TEM image of synthesized Fe3O4@Au NPs. The particles assumed nearly
a spherical shape with an observable lighter Au layer around the darker Fe3O4 centers. The smaller
size observed compared to the hydrodynamic diameter is due to the dried samples under the high
vacuum conditions applied in the electron microscopic imaging.29 Figures 4B to 4D are the SEM
images obtained for the smooth gold surface of the microarray, the capture
antibody/antigen/detection antibody-Fe3O4@Au NP complex for IL-6 protein, and the hairpin
capture DNA /miRNA/detection DNA-Fe3O4@Au NP complex of miRNA-155, respectively.

120
Figure 4. TEM image of A. Fe3O4@Au NPs. SEM images of B. bare Au surface of the microarray,
C. IL-6 capture antibody/IL-6/Fe3O4@Au NP-IL-6 detection antibody assembly, and D. miRNA-
155 capture DNA/miRNA-155/Fe3O4@Au NP-miRNA-155 detection DNA assembly.
5.3.5 Quantitation of capture and detection molecules used in the designed SPRi microarray
for multiplexed detection of miRNAs and ILs
The fabricated microarray followed the sandwich type immunoassay strategy for IL detection and
a dual hybridization of the hairpin capture DNA for selectively capturing the target miRNA marker
from serum and detection with Fe3O4@Au NPs carrying the detection nucleotide. The
spectrophotometric quantification of the amount of capture DNA self-assembled on the microarray
surface and the number of detection probes attached to Fe3O4@Au NPs is presented in Table 3.
This quantitation confirmed the successful immobilization on the desired surfaces.

121
Table 3. The quantitation of capture molecules immobilized on the microarray and detection
molecules conjugated to the Fe3O4@Au NPs.
5.3.6 Real-time analysis of serum biomarkers
The real-time sensograms, difference images, 3-D representations, and line profiles corresponding
to the multiplexed detection of ILs and miRNAs spiked in 10% human serum are presented in
Figure 5. The detection probes conjugated to Fe3O4@Au NPs increased the SPRi responses by
about 2-fold for the ILs and 8-times for the miRNAs. This can be attributed to the additional
selective biological interaction and the NP-induced plasmon signal enhancements.
Figure 6 presents the linear response plots of SPRi signals subtracted for the signals resulted from
the control serum sample. An increase in the SPRi responses for increased concentration of
analytes spiked in to the serum confirms the specificity of the surface capture probes towards the
target analytes of interest. IL-6 and IL-8 demonstrated a linearity from 20 pM – 100 nM and 10 pM
Molecules used for
conjugation
Amount of
molecules added
(pmol)
Amount of
molecules
attached (pmol)
Average
immobilization
efficiency (%)
Surface
immobilized
biomarker
capture
molecules
IL-6 capture
antibody
0.013 ± 0.002 0.008 ± 0.001 61 ± 10
IL-8 capture
antibody
0.013 ± 0.002 0.008 ± 0.002 60 ± 11
miRNA-21
capture DNA
200 ± 38 155 ± 18 77 ± 17
miRNA-155
capture DNA
200 ± 30 158 ± 15 79 ± 14
Fe3O4@Au
NPs
IL-6 detection
antibody
16.6 ± 3.5 12.3 ± 1.8 74 ± 18
IL-8 detection
antibody
16.7 ± 2.3 11.8 ± 1.5 71 ± 13
miRNA-21/155
detection DNA
1000 ± 118 817 ± 52 82 ± 11

122
– 75 nM (~104 orders of magnitude), respectively. A wider dynamic range was observed for
miRNA-21 and miRNA-155 from 50 fM – 2 nM and 25 fM – 4 nM (~108 orders of magnitud),
respectively
Figure 5. SPRi responses for a multiplexed assay by the 4-channel flow injection analysis A. Real-
time pixel intensity changes for 10% serum spiked with a. IL-8 (10 nM), b. IL-6 (10 nM), c.
miRNA-21 (0.25 nM), and d. miRNA-155 (0.25 nM). I. Represents the introduction of the 10%
serum spiked with the markers to the capture probe coated microarray and II. represents the
introduction of the detection probes conjugated to Fe3O4@Au NPs. B. Final difference image of
the test spots after detection of protein and miRNA markers in a single microarray. C and D.
Corresponding 3-D representation and line profile, respectively.
The observed differences in the dynamic range may be due to variations in the functionalization of
the SPRi chip with capture probes and the sizes of the markers. The smaller self-assembled
monolayer of capture miRNAs can be immobilized at greater densities than the larger antibodies
of ILs. Thus, the sensitivities of miRNA detection were ~ 4-times greater than those for the ILs.
Additionally, the hairpin capture DNA probes consist of a stem-loop oligomer structure that is
structurally constrained, which thermodynamically increases the specificity of the target miRNA
compared to a linear DNA probe.40 The hairpin opens up only in the presence of the target to form
a duplex with the highly specific complementary nucleotide sequence present in the loop. The

123
hairpin DNA probes can recognize nucleotide targets even with a single-nucleotide
polymorphism.41
Figure 6. SPRi calibration plots for A. protein markers (IL-6 and IL-8) and B. miRNA markers
(miRNA-21 and miRNA-155) in 10% human serum. (N = 3 replicates).
The detection limits (DLs) for miRNAs and ILs were calculated by the following equation: DL =
3 x standard deviation of the control/slope of the regression line. The DLs for IL-6, IL-8, miRNA-
21, and miRNA-155 were 28 pM, 18 pM, 502 fM, and 483 fM, respectively. These DLs and
dynamic ranges were compared to those of other recent SPR assays that detected protein or miRNA
biomarkers in various matrices using different amplification strategies (Table 4). Our methodology
is unique in quantifying the serum protein and miRNA biomarkers through a multiplexed detection
format. The higher DLs resulted when measurements are carried out in serum medium over a simple
buffer solution can be understood from Table 4 data for miRNAs and proteins.
5.3.7 Analysis of binding strength of protein and miRNA markers
Determining binding kinetics is an important parameter to assess the strength of inteactions
between the markers and their receptors on the designed assay surface. Additionally, we can use
the binding constants as the quality control parameter to reproducibly make and use the bioassays
for reliable large-scale applications.

124
The Langmuir adsorption isotherm was followed to determine the equilibrium dissociation kinetics
based on a 1:1 bimolecular interaction model,42 where T is the target biomolecule and P is the
surface capture probe involving the following binding event forming the complex, TP (eq 1):
T + P 𝑘𝑎
⇌𝑘𝑑
TP (1)
If Γ is the surface concentration of the TP complex and Γ𝑚𝑎𝑥 is the total concentration of binding
sites available on the surface for the biomarkers, the adsorption (ka) and desorption (kd) kinetics can
be described by eq 2,
dθ
dt = 𝑘𝑎(1 − 𝜃)[𝑇] − 𝑘𝑑𝜃 (2)
At equilibrium, the relative surface coverage (θ = Γ/Γ𝑚𝑎𝑥) reaches a steady state (dθ/dt = 0), and θ
can be expressed by eq 3,
θ = KadsC
1+ KadsC (3)
Γ𝑚𝑎𝑥 can be related to the maximum signal upon saturating all the binding sites of the surface
capture probes. C is the concentration of biomarkers and Kads is the Langmuir adsorption coefficient
(Kads = ka/kd).
Figure 7 shows the plots of relative surface coverage (θ) plotted against the tested concentrations
of each biomarker. The data points were fit to a Langmuir isotherm (eq. 2) using OriginPro 2015
software (Originlab, Northampton, MA). The difference in the shapes of the Langmuir isotherms
for ILs and miRNAs can be due to the variations in their association rates.43 The Kads values obtained
for IL-6, IL-8, miRNA-21, and miRNA-55 were 2.50 (± 0.17) x 107 M-1, 6.10 (± 1.08) x 107 M-1,
7.00 (± 0.76) x 108 M-1 and 7.47 (± 1.10) x 108 M-1, respectively. At a bulk concentration equal to
1/Kads, the concentrations of capture probes at 50% surface coverage (Cθ0.5) were determined. We

125
found Cθ0.5 values of 40.1, 22.4, 1.4, and 1.2 nM for IL-6, IL-8, miRNA-21, and miRNA-155,
respectively.
Figure 7. Representative plots of the relative surface coverage (θ) as a function of the concertation
of A. IL-6, B. IL-8, C. miRNA-21, and D. miRNA-155. The solid line represents the Langmuir
isotherm fit to the data. All measurements were made in triplicates.

126
Table 4. Detection performance comparison of our method with other SPR methods.
Analyte Matrix used for
calibration
Surface
receptor
Amplification
method
Dynamic range Detection limit
Ref
IL-8 Cellular elements
removed saliva
Anti-IL-8
antibody
Monoclonal second
antibody
9.5 - 191 pM (in
buffer)
184 pM 44
Thrombin 20 mM HEPES
buffer (pH 7.4)
DNA-aptamer Different shapes of
Au NPs
Up to 200 nM
Cages:1 fM
Rods:10 aM
Quasi-spheres:1
aM
45
C-reactive
protein
(CRP)
1% human serum in
diluted in 10 mM
Tris, 15 mM NaCl
and 2 mM CaCl2
(pH 7.4)
biotinylated
aptamers
CRP-Specific
Aptamer reacted
with Quantum dots
5 – 5000 fg mL-1 5 fg mL-1 10
miRNA-21 10 mM PBS (pH
7.4)
Stem-loop DNA AuNPs and DNA
supersandwich*
- 8 fM 46

127
miRNA-15a 0.1 M PBS (pH 7.0) Hairpin capture
DNA
Orthogonal signal
amplification
5 fM - 0.5 nM 0.5 fM 47
miRNA-21 10 mM PBS (pH
7.4)
Stem-loop
DNA
Ag NPs adsorbed to
DNA
supersandwich* on
DNA-linked AuNPs
- 0.6 fM 48
miRNA-141 10 mM PBS (pH
7.4)
DNA
oligonucleotide
DNA-linked
AuNPs-MoS2
Nanocomposite
- 0.5 fM 49
Insulin
glucagon
somatostatin
PBS
Insulin
glucagon
somatostatin
antigens
Direct binding of
antibodies to their
respective antigens
Insulin: 34 - 633
ng mL-1
Glucagon: 85 -
1592 ng mL-1
Somatostatin:
719 - 4000 ng
mL-1
Insulin: 1 nM
Glucagon: 4 nM
Somatostatin: 246
nM
50
Fibronectin PBS (pH 7.4) anti-
fibronectin
antibody
Direct antigen
bound to antibodies
5 - 400 ng mL-1
1.5 ng mL-1 51

128
IL-1β
IL-6
IFN-γ
TNF-α
PBS with 0.075%
Tween 80 and 0.5%
BSA
Capture
antibodies for the
respective
antigens
Neutravidin and a
gold nanoparticle
cascade
7 logarithms (100
fg mL-1 - 1 μg
mL-1 test range)
IL-1β: 1.2 pg mL-1
IL-6: 50 fg mL-1
IFN-γ: 22 pg mL-1
TNF-α:15 pg mL-1
52
IL-6
IL-8
miRNA-21
miRNA-155
10% normal human
serum diluted in
PBS (pH 7.4)
Hairpin capture
DNA for
miRNAs and
capture
antibodies of ILs
Fe3O4@Au
bimetallic NPs
tagged detection
molecules
IL-6: 0.02 - 100
nM
IL-8: 0.01 - 75
nM
miRNA-21: 50
fM - 2 nM
miRNA-155: 25
fM - 4 nM
IL-6: 28 pM
IL-8: 18 pM
miRNA-21: 502
fM
miRNA-155: 483
fM
This
work

129
5.4 Conclusions
The designed surface plasmon microarray platform offers multiplexed assaying of ILs and miRNAs
directly from human serum samples. The combined magnetic and plasmon enhancing features of
Fe3O4@Au NPs were useful for separating the attached detection probes easily and amplifying the
SPRi signal output while minimizing the non-specific signals arising from the serum matrix. These
features improved the selectivity and sensitivity of the assay. The binding constants observed from
the µM to nM range provide evidence for strong affinities between the analyte biomarkers and their
receptor molecules on the designed sensor surface. Broader application of this approach to other
proteins and miRNA biomarkers is feasible.
130
5.5 References
1. Mehta, S.; Shelling, A.; Muthukaruppan, A.; Lasham, A.; Blenkiron, C.; Laking, G.; Print, C.
Ther. Adv. Med. Oncol. 2010, 2, 125-148.
2. de Planell-Saguer, M.; Rodicio, M. C. Anal. Chim. Acta, 2011, 699, 134-152.
3. Wu, L.; Qu, X. Chem. Soc. Rev. 2015, 44, 2963-2997.
4. Maley, A.M.; Lu, G.J.; Shapiro, M.G.; Corn, R.M. ACS Nano, 2017, 11, 7447-7456.
5. Manuel, G.; Luptak, A.; Corn, R.M. J. Phys. Chem. C. 2016, 120, 20984-20990.
6. Shen, M.; Joshi, A.A.; Vannam, R.; Dixit, C.K.; Hamilton, R.G.; Kumar, C.V.; Rusling, J.F.;
Peczuh, M.W. ChemBioChem, 2017, 19, 197-197.
7. Walgama, C.; Al Mubarak, Z. H.; Zhang, B.; Akinwale, M.; Pathiranage, A.; Deng, J.; Berlin,
K. D.; Benbrook, D. M.; Krishnan, S. Anal. Chem. 2016, 88, 3130–3135.
8. Singh, V.; Nerimetla, R.; Yang, M.; Krishnan, S., ACS Sensors, 2017, 2, 909-915.
9. Krishnan, S.; Mani, V.; Wasalathanthri, D.; Kumar, C. V.; Rusling, J. F. Angew. Chem. Int. Ed.
2011, 50, 1175 –1178.
10. Vance, S.A.; Sandros, M.G. Sci. Rep. 2014, 4, 5129.
11. He, L.; Pagneux, Q.; Larroulet, I.; Serrano, A.Y.; Pesquera, A.; Zurutuza, A.; Mandler, D.;
Boukherroub, R.; Szunerits, S. Biosens. Bioelectron. 2017, 89, 606-611.
12. Chinen, A.B.; Guan, C.M.; Ferrer, J.R.; Barnaby, S.N.; Merkel, T.J.; Mirkin, C.A. Chem. Rev.
2015, 115, 10530-10574.
13. Howes, P.D.; Chandrawati, R.; Stevens, M.M. Science, 2014, 346, 1247390.
14. Zaleska-Medynska, A.; Marchelek, M.; Diak, M.; Grabowska, E. Adv. Colloid. Interface. Sci.
2016, 229, 80-107.
15. Zhang, C.; Chen, B.Q.; Li, Z.Y.; Xia, Y.; Chen, Y.G. J. Phys. Chem. C. 2015, 119, 16836-
16845.

131
16. Srinoi, P.; Chen, Y.T.; Vittur, V.; Marquez, M.D.; Lee, T.R. Preprints, 2018
(doi:10.20944/preprints201804.0104.v1)
17. Pham, T.T.H.; Cao, C.; Sim, S.J. J. Magn. Magn. Mater, 2008, 320, 2049-2055.
18. Jain, P.K.; Xiao, Y.; Walsworth, R.; Cohen, A.E. Nano Lett. 2009, 9, 1644-1650.
19. Saha, K.; Agasti, S.S.; Kim, C.; Li, X.; Rotello, V.M. Chem. Rev. 2012, 112, 2739-2779.
20. Sperling, R.A.; Parak, W.J. Philos. Trans. Royal Soc. A: Math. Phys. Eng, 2010, 368, 1333-
1383.
21. Brown, K.R.; Walter, D.G.; Natan, M.J., Chem. Mater. 2000, 12, 306-313.
22. Kumari, N.; Dwarakanath, B.S.; Das, A.; Bhatt, A.N. Tumour Biol. 2016, 37, 11553-11572.
23. Alfaro, C.; Sanmamed, M.F.; Rodríguez-Ruiz, M.E.; Teijeira, Á.; Oñate, C.; González, Á.;
Ponz, M.; Schalper, K.A.; Pérez-Gracia, J.L.; Melero, I. Cancer Treat. Rev. 2017, 60, 24-31.
24. Komatsu, S.; Ichikawa, D.; Kawaguchi, T.; Miyamae, M.; Okajima, W.; Ohashi, T.; Imamura,
T.; Kiuchi, J.; Konishi, H.; Shiozaki, A.; Fujiwara, H. Am. J. Cancer Res. 2016, 6, 1511.
25. Jurkovicova, D.; Magyerkova, M.; Kulcsar, L.; Krivjanska, M.; Krivjansky, V.; Gibadulinova,
A.; Oveckova, I.; Chovanec, M. Neoplasma, 2014, 61, 241-251.
26. Desjardins, P.; Conklin, D. J. Vis. Exp. 2010, 45.
27. Winge, R. K.; Peterson, V. J.; Fassel, V. A. Appl. Spectrosc. 1979, 33, 206-219.
28. Gentry, S. T.; Kendra, S. F.; Bezpalko, M. W. J. Phys. Chem. C. 2011, 115, 12736.
29. Premaratne, G.; Nerimetla, R.; Matlock, R.; Sunday, L.; Hikkaduwa Koralege, R. S.; Ramsey,
J. D.; Krishnan, S. Catal. Sci. Technol. 2016, 6, 2361–2369.
30. Premaratne, G.; Farias, S.; Krishnan, S. Anal. Chim. Acta. 2017, 970, 23–29.
31. Petkova, G.A.; Zaruba, К.; Žvatora, P.; Kral, V. Nanoscale Res. Lett. 2012, 7, 287.
32. Premaratne, G.; Al Mubarak, Z.; Senavirathna, L.; Liu, L.; Krishnan, Sens. Actuator B Chem.
2017, 253, 368–375.
33. Mirkin, C.A.; Letsinger, R.L.; Mucic, R.C.; Storhoff, J.J. Nature, 1996, 382, 607.
34. Mustafaoglu, N.; Kiziltepe, T.; Bilgicer, B. Nanoscale, 2017, 9, 8684-8694.

132
35. Nobbmann, U.; Connah, M.; Fish, B.; Varley, P.; Gee, C.; Mulot, S.; Chen, J.; Zhou, L.; Lu,
Y.; Sheng, F.; Yi, J. Biotechnol. Genet. Eng. Rev. 2007, 24, 117-128.
36. Ducancel, F.; Muller, B.H. Molecular engineering of antibodies for therapeutic and diagnostic
purposes. In MAbs, Taylor & Francis, 2012, 4, 445-457.
37. Götting, N.; Fritz, H.; Maier, M.; Von Stamm, J.; Schoofs, T.; Bayer, E. Colloid Polym. Sci.
1999, 277, 145-152.
38. Hseu, Z.Y.; Chen, Z.S.; Tsai, C.C.; Tsui, C.C.; Cheng, S.F.; Liu, C.L.; Lin, H.T. Water Air Soil
Pollut. 2002, 141, 189-205.
39. Sugawa, K.; Tahara, H.; Yamashita, A.; Otsuki, J.; Sagara, T.; Harumoto, T.; Yanagida, S. ACS
Nano, 2015, 9, 1895-1904.
40. Bonnet, G.; Tyagi, S.; Libchaber, A.; Kramer, F.R. Proc. Natl. Acad. Sci. 1999, 96, 6171-6176
41. Tyagi, S.; Bratu, D.P.; Kramer, F.R. Nature Biotechnol. 1998, 16, 49-53.
42. Lee, H.J.; Wark, A.W.; Corn, R.M. Langmuir, 2006, 22, 5241-5250.
43. O'Shannessy, D.J.; Brigham-Burke, M.; Soneson, K.K.; Hensley, P.; Brooks, I. Methods.
Enzymol. 1994, 240, 323-349.
44. Yang, C.Y.; Brooks, E.; Li, Y.; Denny, P.; Ho, C.M.; Qi, F.; Shi, W.; Wolinsky, L.; Wu, B.;
Wong, D.T.; Montemagno, C.D. Lab Chip. 2005, 5, 1017-1023.
45. Kwon, M.J.; Lee, J.; Wark, A.W.; Lee, H.J. Anal. Chem. 2012, 84, 1702-1707.
46. Wang, Q.; Liu, R.; Yang, X.; Wang, K.; Zhu, J.; He, L.; Li, Q. Sens. Actuators B. Chem. 2016,
223, 613-620.
47. Hu, F.; Xu, J.; Chen, Y. Anal. Chem. 2017, 89, 10071-10077.
48. Liu, R.; Wang, Q.; Li, Q.; Yang, X.; Wang, K.; Nie, W. Biosens. Bioelectron. 2017, 87, 433-
438.
49. Nie, W.; Wang, Q.; Yang, X.; Zhang, H.; Li, Z.; Gao, L.; Zheng, Y.; Liu, X.; Wang, K. Anal.
Chim. Acta. 2017, 993, 55-62.
50. Castiello, F.R.; Tabrizian, M. Anal. Chem. 2018, 90, 3132-3139.

133
51. Sankiewicz, A.; Romanowicz, L.; Pyc, M.; Hermanowicz, A.; Gorodkiewicz, E. J. Pharm.
Biomed. Anal. 2018, 150, 1-8.
52. Hendriks, J.; Stojanovic, I.; Schasfoort, R.B.; Saris, D.B.; Karperien, M. Anal. Chem. 2018, 90,
6563-6571.

134
CHAPTER 6
SUMMARY
Development of robust and sensitive analytical approaches for the detection of biomarkers present
in clinical matrices pave an attractive direction towards future diagnostics. As a result, clinicians
could not only diagnose deadly diseases at a preliminary stage, but also plan suitable therapeutic
protocols and monitor their outcomes. This dissertation discussed different nano-inspired
electrochemical and optical analytical methodologies that were developed for small and large
molecule biomarker measurement in view of advancing the field of biosensors. A summary of the
objectives and associated key contributions under each chapter is presented below:
The first chapter of this dissertation attempted to summarize and recognize the recent scientific
contributions made on developing sensitive biosensor approaches for clinically relevant small and
large molecule biomarker measurements. A literature review was conducted on novel
electrochemical sensor methodologies, which combined the advancements in nanochemistry and
the biorecognition elements such as enzymes, aptamers, antigens and antibodies. Furthermore,
SPRi based approaches for multiplexed biomarker measurement were summarized. The
combination of elegant nanomaterials was useful for detection signal amplification, increasing
surface functional groups as well as highly oriented bioreceptor immobilization, and minimization
of the non-specific interactions of molecules other than the biomarker of interest present in the
sample matrices (e.g., serum, urine). The research field on electrochemical and SPRi biosensors is
exponentially growing and many more novel discoveries are anticipated in the near future.

135
The second chapter reported an amperometric nano-bioelectrode design that uniquely combined 1-
pyrenebutyric acid units pi-pi stacked with carboxylated multiwalled carbon nanotubes on the
surface of gold screen printed electrodes for covalent attachment of NAD+ dependent formaldehyde
dehydrogenase (FDH). The designed enzyme bioelectrode offered 6 ppb formaldehyde detection
in 10-times diluted urine with a wide dynamic range of 10 ppb to 10 ppm. Fourier transform
infrared, Raman, and electrochemical impedance spectroscopic characterizations confirmed the
successful design of the FDH bioelectrode. Flow injection analysis provided lower detection limit
and greater affinity for formaldehyde (apparent KM 9.6 ± 1.2 ppm) when compared with stirred
solution method (apparent KM 19.9 ± 4.6 ppm). Selectivity assays revealed that the bioelectrode
was selective toward formaldehyde with a moderate cross-reactivity for acetaldehyde (~ 25%) and
negligible cross-reactivity toward propanaldehyde, acetone, methanol, and ethanol. This
methodology can be broadly applied for measuring other small molecule biomarkers by tuning
marker specific enzymes.
The next study focused on correlating picomolar affinities between surface plasmon and
electrochemical immunoassays for the binding of serum glutamic acid decarboxylase-65
autoantibody (GADA), a biomarker of type 1 diabetes, to its antigen GAD-65. Carboxylated (~
5.0%) graphene modified immunoassembly on a gold surface plasmon chip or on an
electrochemical array provided significantly greater binding affinity, sensitivity, and lower
detection limits than a self-assembled monolayer surface of mercaptopropionic acid (MPA).
Estimation of the relative surface–COOH groups by covalent tagging of an electroactive
aminoferrocene showed that the graphenyl surface displayed greater number of –COOH groups
than the MPA surface. Additionally, the binding constant values obtained for the GADA-GAD65
binding through real-time SPRi studies can be useful as a quality control checkpoint for
reproducible and reliable production of large-scale biosensors for clinical bioassays.
The fourth chapter focused on comparing detection performances of a quartz crystal microbalance
(QCM), which is a mass sensor, with that of a surface plasmon resonance (SPR) microarray for an

136
oligonucleotide mimic of microRNA-21 biomarker. Surface immobilized capture oligonucleotide
probe was used to hybridize with the target oligonucleotide (i.e., the microRNA-21 mimic) to
facilitate selective detection. To obtain ultra-low femtomolar (fM) detection sensitivity, gold
nanoparticles (50 nm) were conjugated with the target oligonucleotide. Detection limits of 28 and
47 fM were achieved for the target oligonucleotide by the QCM and SPRi microarray, respectively.
Additionally, sample recovery study and matrix effect analysis was performed for the target
oligonucleotide. Although the QCM had a lower detection limit, the microarray approach offered
better throughput for analysis of up to 16 samples. We confirmed that the designed assay was
selective for the target oligonucleotide and did not show signals for the control oligonucleotide
with five mismatch sites relative to the target sequence. Combination of the QCM and microarray
methods that utilize the same assay chemistry on gold are useful for overcoming clinical sample
matrix effects and achieving ultra-low detection of small nucleotide biomarkers with quantitative
insights.
In the final chapter, a surface plasmon resonance imager (SPRi) microarray employing citrate-
stabilized Fe3O4@Au core/shell nanoparticles (NPs) as the plasmon signal amplification label was
presented. A 4-channel microfluidic system was designed to demonstrate the feasibility for
multiplexed assaying of two serum protein markers, interleukin-6 (IL-6) and interleukin-8 (IL-8)
by a sandwich immunoassay, and two serum microRNA markers (miRNA-21 and miRNA -155)
by a double hybridization assay. The Fe3O4@Au (105 nm) NPs exhibited 13-times higher plasmon
signal intensities than that of only Fe3O4 (100 nm) and 6-times greater signals than Au only NPs
(100 nm). The detection limits achieved for the markers were in the pM to sub-pM concentrations.
The dynamic range of detection for the proteins was from pM to nM concentration in 10% serum,
and for the miRNAs the dynamic range was from fM to nM in 10% serum. Additionally, the
strength of selective binding interaction between the analyte biomarkers and their surface
bioreceptors was assessed by the Langmuir-type binding kinetics. The binding constants estimated
for IL-6, IL-8, miRNA -21 and miRNA -155 were 2.50 (±0.17) x 107 M-1, 8.10 (±1.08) x 107 M-1,
137
7.00 (±0.76) x 108 M-1 and 7.47 (±1.10) x 108 M-1, respectively. The synergistic multiplexed
biosensing and kinetic assessment features associated with SPRi can be useful to measure potential
disease biomarkers and make decisions on the surface biorecognition elements on their suitability
for the assay.
In summary, the studies discussed in the dissertation suggest that highly sensitive, selective, and
wide dynamic range analytical methods are of paramount significance for assaying biomarkers,
which are typically present at very low levels in complex clinical matrices (e.g., whole blood,
serum, saliva, tissues, and urine). The presented electrochemical biosensor methodologies offered
highly sensitive electrochemical detection of biomarkers with minimum background effects as a
result of the functionalization strategies employed. Also, similar nanobio-modifications can be
adopted to expand the current electrode systems into multi-array formats for multiple biomarkers
measurement and validation studies. With the recently growing attention on SPRi in clinical
chemistry, this dissertation adds further significance for applications in biomarker identification
and validation assays offering both binding insights and ‘3D’ image based assay results.

138
VITA
Aluth Gedara Gayan Chandima Premaratne
Candidate for the Degree of
Doctor of Philosophy
Dissertation: ELECTROCHEMICAL AND OPTICAL BIOASSAY FOR CIRCULATING
BIOMARKERS
Major Field: Analytical Chemistry
Education:
Completed the requirements for the Doctor of Philosophy in Chemistry at Oklahoma State
University, Stillwater, Oklahoma in July 2018.
Completed the requirements for the Master of Science in Analytical Chemistry at University of
Colombo, Sri Lanka in June 2014
Completed the requirements for the Bachelor of Science in Microbiology, Botany and Chemistry
at St. Joseph’s College of Arts and Science (affiliated to University of Bangalore), India in May
2010.
Experience:
Graduate Assistant, Department of Chemistry, Oklahoma State University (2013 – 2018)
Research experience – Development of bioassays for disease-related biomarker
measurements in clinical matrices, voltage driven microsomal and bactosomal drug
metabolizing platforms, protein-nanoconjugates for biocatalytic applications.
Teaching experience - Taught chemistry laboratory courses in general chemistry I
(CHEM 1314), general chemistry II (CHEM 1515), quantitative analysis (CHEM 2122),
and modern methods of chemical analysis (CHEM 4020).
Fellowships, Scholarships and Awards:
Robberson Summer Dissertation Fellowship – OSU Graduate College (2017)
2nd place of Arts and Science Graduate 3MT competition – OSU Graduate College (2017)
Travel Awards – American Chemical Society and Electrochemical Society (2016 – 2017)
Skinner Fellowship and O. C. Dermer Award – Department of Chemistry (2013 – 2017)
Leadership and Service:
Chair – Oklahoma Chapter of the Electrochemical Society (2017 – 2018)
President – Phi Lambda Upsilon Chemical Society (2017 – 2018)
Vice President – International Student Organization (2015 – 2016)
Professional Memberships:
Electrochemical Society, American Chemical Society, Phi Kappa Phi Honor Society