Bhadra_okstate_0664M_11026.pdf - ShareOK
108
AN EXPERIMENTAL STUDY ON THE MICROSTRUCTURE–MECHANICAL PROPERTY RELATIONSHIP OF CRUMB RUBBER–POLYURETHANE FOAM COMPOSITES By ABHISEK BHADRA Bachelor of Engineering in Mechanical Engineering Jadavpur University Kolkata, India 2006 Submitted to the Faculty of the Graduate College of Oklahoma State University in partial fulfillment of the requirements for the Degree of MASTER OF SCIENCE July, 2010
-
Upload
khangminh22 -
Category
Documents
-
view
4 -
download
0
Transcript of Bhadra_okstate_0664M_11026.pdf - ShareOK

AN EXPERIMENTAL STUDY ON THE
MICROSTRUCTURE–MECHANICAL PROPERTY RELATIONSHIP
OF CRUMB RUBBER–POLYURETHANE FOAM COMPOSITES
By
ABHISEK BHADRA
Bachelor of Engineering in Mechanical EngineeringJadavpur University
Kolkata, India2006
Submitted to the Faculty of theGraduate College of
Oklahoma State Universityin partial fulfillment of
the requirements forthe Degree of
MASTER OF SCIENCEJuly, 2010

COPYRIGHT ©
By
ABHISEK BHADRA
July, 2010

AN EXPERIMENTAL STUDY ON THE
MICROSTRUCTURE–MECHANICAL PROPERTY RELATIONSHIP
OF CRUMB RUBBER–POLYURETHANE FOAM COMPOSITES
Thesis Approved:
Dr. Raman P. Singh
Thesis Advisor
Dr. Kaan A. Kalkan
Dr. Sandip P. Harimkar
Dr. Mark E. Payton
Dean of the Graduate College
iii
ACKNOWLEDGMENTS
It has been a fascinating experience for me to pursue my Master of Science degree at
Oklahoma State University. From a learning point of view, it has never been easy, but
nonetheless pleasant, as something great awaits for you after every disaster. There used
to be time when I believed that I would never be able to construct a good research thesis
because of numerous moments of failures I had undergone. But, eventually, the ray of hope
came, as there was someone who had more belief on me than I had on myself. He is my
advisor, Dr. Raman P. Singh. Probably, the only thing I never missed for a single day in the
United States is his kindness towards me. I am very grateful to him for everything.
I would like to thank Dr. Kaan Kalkan and Dr. Sandip Harimkar for serving on my
thesis committee. Dr. Kalkan has always been very helpful. I can still remember several
instances of knocking the door of his lab with my bunch of questions but never came back
without answer. I would also like to thank Dr. Harimkar from the bottom of my heart as I
always received his generous support, whenever needed.
I shall be failing in my duties if I do not acknowledge the support of Dr. Gajendra
Pandey. He has been such a wonderful and approachable mentor for me that after a point of
time I started calling him “Gajju” shipping the title of ‘Dr’ in front of his name. Whenever
I used to make samples in the laboratory with my vertical aluminum molds, I always re-
membered him, as this simplified design was by Dr. Pandey. It is not possible for me even
to remember the number of simple questions I have asked him, but he always answered
with a smile. Gajju, I will always be grateful to you from the bottom of my heart. God
bless you Sirjee.
I am thankful to Dr. Abhishek Singh and Dr. Pranav Nawani for acting as my mentors.
iv

Though I have not been fortunate enough to spend enough time with them, it has been a
fantastic learning experience.
I would also like to thank the cutest couple I have ever met in my life. It was not be
possible for me to know how good human beings can be until and unless I met Leila and
Masoud. I can never forget the help and kindness I have received from them throughout
my two years of life at Oklahoma State University. I would like to wish them best of luck
for their future. May God bless you both.
It has never been possible for me to consider MAML and Arif as two different entities.
A perfect Ph.D student, and a devoted Chelsea fan of course, Arif has been a fantastic
friend. Whenever, I faced any problem, I saw him coming with a determined and smiling
face ahead of me with a widespread helping hand. I wish Arif all the best for his upcoming
life.
Chirag and Dhivakar have been fantastic friends and lab mates throughout my two years
of study at OSU. I have always seen them being available for help, keeping tons of personal
work aside. I still remember my first day in the lab when I broke one mechanical stirrer
and became very disappointed. It would never have been possible for me to be confident
enough to break things again, until I got these two friends along with Arif beside me.
No one can forget his first pal in a different country. Mohammed and I joined MAML
on the same day and became friends. We took 30 credit hours together and had several
major fights regarding Manchester United and Liverpool. He has always been a brother to
me.
The difference between chemistry and mystery became much less from the day Ms. Se-
shumani Vorrey joined MAML. She has been a very helpful friend and research associate
throughout my last 6 months of study. I would like to give her a big thanks for all of her
support and help I have received.
I am also thankful to Dr. Dale Teeters at the University of Tulsa, for allowing me use
the FTIR and other facilities. I also acknowledge the support of R. T. Vanderbilt, Inc.,
v

(Norwalk, CT) and Lubrizol Inc., (Cleveland, OH) in donating surfactants for this research.
Heroes always come at the end of any commercial Indian movie and give a dazzling
performance. Hence, this is the time for my three heroes of MAML. I have been fortunate
enough to get three wonderful roommates whose presence made United States a home
away from home. One shares the name with me and is not much different from Leonardo
Di Caprio. He is Mr. Abhishek Jain, a cinema lover and an early to bed, early to rise
person. Mr. Clint Eastwood would be much more happy if he was compared with Kunal
Mishra as Mishra is the real Dirty Harry in our group. Last but not the least is Mr. Suman
Dasgupta, aka Don Cheadle (proclaimed by me, Jain, and Kunal) aka Hrithwik Roshan
(self-proclaimed). All of these are fantastic students and very good friends. I have always
taken valuable suggestions from them and it made my life much easier. We have shared
some good times together and those moments are really unforgettable. God bless them all.
I would like to express my gratitude towards my other friends and lab mates at MAML,
Chaitanya, Balaji, Vasu, Austin, Phil, Sadia, and my only cigarette partner, Hamim.
vi

TABLE OF CONTENTS
Chapter Page
1 INTRODUCTION 1
2 LITERATURE SURVEY 15
3 MATERIALS AND EXPERIMENTAL CHARACTERIZATION 27
4 RESULTS AND DISCUSSION 45
5 CONCLUSIONS AND FUTURE WORK 79
BIBLIOGRAPHY 83
vii

LIST OF TABLES
Table Page
1.1 Rubber waste situation in early 90s [1] . . . . . . . . . . . . . . . . . . . . 5
2.1 Properties of different organic compounds for rubber surface treatment [1] . 16
viii

LIST OF FIGURES
Figure Page
1.1 Piling yard of waste tires, adapted from [13] . . . . . . . . . . . . . . . . . 2
1.2 Different uses of scrap tires, adapted from [5] . . . . . . . . . . . . . . . . 3
1.3 Typical structure of surfactants and formation of a micelle, adapted from [14] 6
1.4 Typical crumb rubber particles recycled from waste tires, adapted from [15] 8
1.5 Chemical synthesis of polyurethane, adapted from [16] . . . . . . . . . . . 10
1.6 Chemistry behind polyurethane foam formation, adapted from [16] . . . . . 11
3.1 Sieve analysis data for crumb rubber having 40-99-mesh size, adapted from
[80]. . . . . . . . . . . . . . . . . . . . . . . . . . . . . . . . . . . . . . . 27
3.2 Optical micrograph showing crumb rubber particles inside foam . . . . . . 28
3.3 Basic concept of polyurethane foam formation by chemical blowing method,
as used in this investigation, adapted from [16] . . . . . . . . . . . . . . . 28
3.4 Chemical structure of PMDI (Part A), adapted from [82] . . . . . . . . . . 29
3.5 Chemical structure of HFC-245fa (Part B), adapted from [83] . . . . . . . . 30
3.6 Chemical structure of Darvan WAQ, adapted from [84] . . . . . . . . . . . 31
3.7 Monomer of Vycar 660 ×14, adapted from [87]. . . . . . . . . . . . . . . 31
3.8 Mold for preparing rubber-foam composites used in the present study . . . 33
3.9 Visible color change in rubber by the application of surfactant . . . . . . . 33
3.10 Rubber–polyurethane foam composites generated in this present study . . . 34
3.11 Microscope picture of rubber-polyurethane foam composite showing pores
inside structure . . . . . . . . . . . . . . . . . . . . . . . . . . . . . . . . 36
ix

3.12 Cylindrical samples along the height of rubber–foam composites for char-
acterization . . . . . . . . . . . . . . . . . . . . . . . . . . . . . . . . . . 37
3.13 Determination of physical properties by density determination set up . . . . 38
3.14 Vacuum infiltration chamber set up used in the present study . . . . . . . . 39
3.15 Helium ultrapycnometer 1000 used in the present study . . . . . . . . . . . 40
3.16 Foam–rubber specimens subjected to compression test following ASTM
C365/C365M . . . . . . . . . . . . . . . . . . . . . . . . . . . . . . . . . 41
3.17 Force versus displacement curve of a material with Hookean region, adapted
from ASTM standard C365 [90] . . . . . . . . . . . . . . . . . . . . . . . 42
3.18 The notations for specimen dimensions and 3-point bending test configu-
ration [92]. . . . . . . . . . . . . . . . . . . . . . . . . . . . . . . . . . . 43
3.19 Failure of composite specimens subjected to 3 point bending test . . . . . . 43
4.1 XRF analysis for the virgin crumb rubber samples . . . . . . . . . . . . . . 46
4.2 Effect of surfactants on the bulk density of polyurethane matrix system
without rubber . . . . . . . . . . . . . . . . . . . . . . . . . . . . . . . . . 46
4.3 Effect of surfactants on the open porosity of polyurethane matrix system
without rubber . . . . . . . . . . . . . . . . . . . . . . . . . . . . . . . . . 47
4.4 Effect of surfactants on the closed porosity of polyurethane matrix system
without rubber . . . . . . . . . . . . . . . . . . . . . . . . . . . . . . . . . 48
4.5 Effect of surfactants on the skeleton density of the polyurethane matrix
system without rubber . . . . . . . . . . . . . . . . . . . . . . . . . . . . . 49
4.6 Effect of crumb rubber particles on bulk density of polyurethane foam system 50
4.7 Effect of crumb rubber particles on skeleton density of polyurethane foam
system . . . . . . . . . . . . . . . . . . . . . . . . . . . . . . . . . . . . . 51
4.8 Effect of rubber particles on the closed porosity of polyurethane foam system 51
4.9 Effect of rubber particles on the open porosity of polyurethane foam system 52
x

4.10 Effect of Darvan on the bulk density of rubber and polyurethane foam com-
posites . . . . . . . . . . . . . . . . . . . . . . . . . . . . . . . . . . . . . 53
4.11 Effect of Darvan on the skeleton density of rubber and polyurethane foam
composites . . . . . . . . . . . . . . . . . . . . . . . . . . . . . . . . . . 54
4.12 Effect of Darvan on the closed porosity of rubber and polyurethane foam
composites . . . . . . . . . . . . . . . . . . . . . . . . . . . . . . . . . . 55
4.13 Effect of Darvan on the open porosity of rubber and polyurethane foam
composites . . . . . . . . . . . . . . . . . . . . . . . . . . . . . . . . . . 56
4.14 Effect of rubber on the physical properties of polyurethane foam composites 56
4.15 Agglomeration of rubber particles inside polyurethane foam . . . . . . . . 57
4.16 Effect of rubber on the physical properties of polyurethane foam composites 58
4.17 Effect of rubber particles on the porosity ratio of polyurethane foam system 59
4.18 Effect of rubber particles and surfactants on the porosity ratio of polyurethane
foam System . . . . . . . . . . . . . . . . . . . . . . . . . . . . . . . . . 60
4.19 Compressive stress-strain curve of rubber-polyurethane composites at dif-
ferent strain level . . . . . . . . . . . . . . . . . . . . . . . . . . . . . . . 61
4.20 Compressive modulus of rubber-foam composites . . . . . . . . . . . . . . 62
4.21 Compressive strength of rubber-foam composites . . . . . . . . . . . . . . 63
4.22 Load-deflection curve of rubber-foam composites . . . . . . . . . . . . . . 64
4.23 Flexural modulus of rubber-foam composites . . . . . . . . . . . . . . . . 65
4.24 Flexural strength of rubber-foam composites . . . . . . . . . . . . . . . . . 65
4.25 Specific compressive strength of rubber-foam composites as a function of
rubber content . . . . . . . . . . . . . . . . . . . . . . . . . . . . . . . . . 66
4.26 Specific compressive modulus of rubber-foam composites as a function of
rubber content . . . . . . . . . . . . . . . . . . . . . . . . . . . . . . . . . 67
4.27 Specific flexural strength of rubber-foam composites as a function of rubber
content . . . . . . . . . . . . . . . . . . . . . . . . . . . . . . . . . . . . . 69
xi

4.28 Specific flexural modulus of rubber-foam composites as a function of rub-
ber content . . . . . . . . . . . . . . . . . . . . . . . . . . . . . . . . . . 71
4.29 Cubic cell model of a closed cell foam [94] . . . . . . . . . . . . . . . . . 72
4.30 Comparison of experimental relative elastic modulus with different models 74
4.31 SEM images showing tearing of rubber particles in the tension side of test
specimens . . . . . . . . . . . . . . . . . . . . . . . . . . . . . . . . . . . 75
4.32 SEM images showing defects inside blend composites with highest rubber
content . . . . . . . . . . . . . . . . . . . . . . . . . . . . . . . . . . . . . 75
4.33 SEM images of fractured surfaces of composite samples with 30 weight %
of rubber . . . . . . . . . . . . . . . . . . . . . . . . . . . . . . . . . . . . 76
4.34 FTIR spectra of only Darvan and blend composites made with Darvan . . . 78
4.35 FTIR spectra of only Vycar and blend composites made with Vycar . . . . 78
xii

CHAPTER 1
INTRODUCTION
Problem Statement and Motivation
The disposal of waste materials is a serious concern for humankind. Certain polymeric
materials are specially problematic as they can be hard to decompose. One such example
is rubber. Probably, the most common use of rubber all over the world is as tires in au-
tomobiles and other transport vehicles. While the unique structure and property of both
vulcanized natural rubber and synthetic rubber provides stability for use in tires, it also
makes recycling challenging. As a result, very little raw chemical precursor material (less
than 1%) can be reclaimed for reuse from these waste tires. The chemistry of rubber in
these disposed tires also plays a major role in the associated environmental pollution. Due
to its cross-linked structure, rubber needs a long time for natural degradation. In addition,
the presence of stabilizers and additives in rubber further delays the process [1].
In United States of America, more than 270 million of tires are scrapped every year.
In addition, almost 300 million tires are stockpiled in different landfills [2]. This has a
detrimental effect on the environment as well as reducing the number of available disposal
sites. Tire piling yards, as shown in Fig. 1.1, become the inhabitation of animals and insects
resulting in further environmental damage [3]. It has been found that the two species of
mosquitoes, Aedes aegypti and Aedes albopictus, that are mainly responsible for yellow
fever and dengue, prefer scrap tires as their main habitat [4].
The most convenient way of decomposing waste tires is to burn them. Probably this is
the reason why the Scrap Tire Management Council reports almost 57% of recycled tires
are used as fuel [5]. But this is not a very sophisticated methodology and suspect from an
1
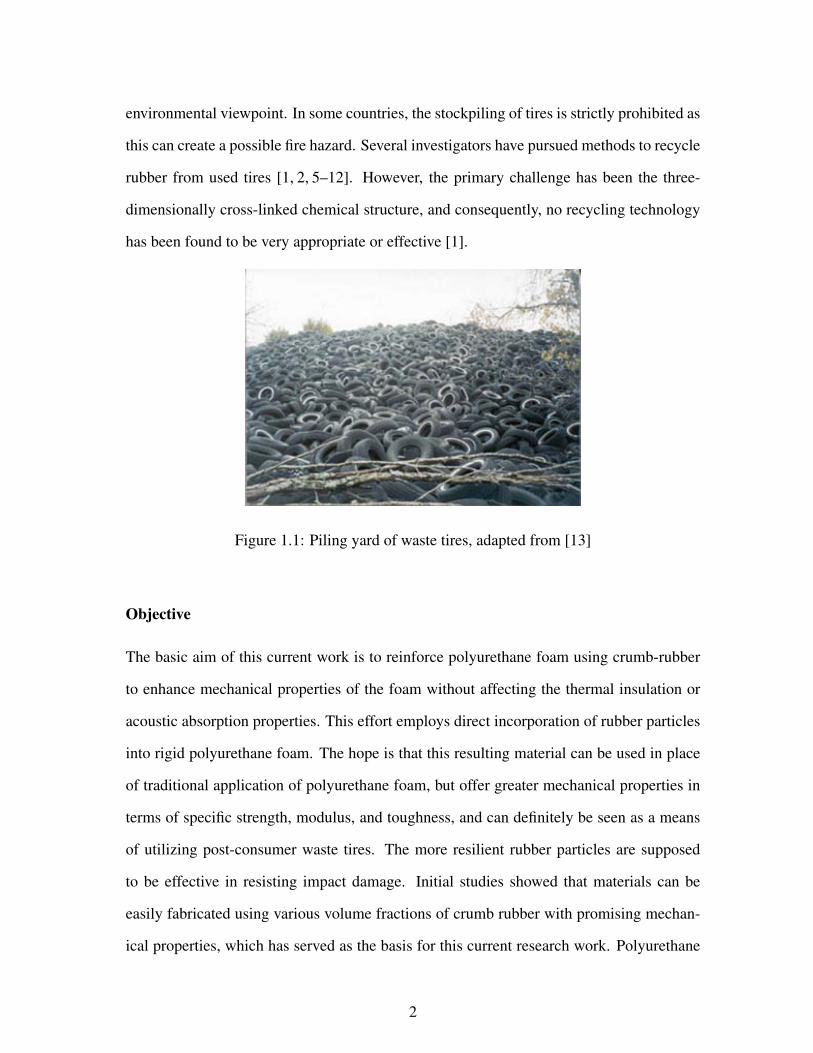
environmental viewpoint. In some countries, the stockpiling of tires is strictly prohibited as
this can create a possible fire hazard. Several investigators have pursued methods to recycle
rubber from used tires [1, 2, 5–12]. However, the primary challenge has been the three-
dimensionally cross-linked chemical structure, and consequently, no recycling technology
has been found to be very appropriate or effective [1].
Figure 1.1: Piling yard of waste tires, adapted from [13]
Objective
The basic aim of this current work is to reinforce polyurethane foam using crumb-rubber
to enhance mechanical properties of the foam without affecting the thermal insulation or
acoustic absorption properties. This effort employs direct incorporation of rubber particles
into rigid polyurethane foam. The hope is that this resulting material can be used in place
of traditional application of polyurethane foam, but offer greater mechanical properties in
terms of specific strength, modulus, and toughness, and can definitely be seen as a means
of utilizing post-consumer waste tires. The more resilient rubber particles are supposed
to be effective in resisting impact damage. Initial studies showed that materials can be
easily fabricated using various volume fractions of crumb rubber with promising mechan-
ical properties, which has served as the basis for this current research work. Polyurethane
2

foams are selected as they are widely used in the industry. We believe that if small rubber
particles can be successfully incorporated inside polyurethane foam matrix with enhanced
properties of the end products, this approach will yield a good avenue for recycling of
rubber from used tires.
Overview of Waste Tire Recycling
The recycling and reclaiming of rubber particle has been a subject of serious concern for
humankind, as with the decrease of available landfill sites that accept tires, the disposal
of waste rubber is becoming more difficult. The process of rubber compounding always
involves the mixing of various ingredients like stabilizers, plasticizers, flame-retardants,
and colorants. These chemicals leach from the bulk to the surface and ultimately to the
landfill. Consequently, they kill the advantageous bacteria of soil [1]. Fig. 1.2 shows
different uses of scrap tires.
Figure 1.2: Different uses of scrap tires, adapted from [5]
As we can see from the Fig. 1.2, the biggest market for the recycled rubber technology
3

is the tire derived fuel industry. This is simply the burning of tires in cement kilns, and a
method suspect from environmental considerations. Almost 4% of scrap tires are used in
the civil and infrastructural applications where novel products are made mixing recycled
rubber particles with concrete [5]. Another major reuse application is the production of
crumb rubber which is mostly related to the present work.
Recycling technologies have either focused on chemical reclamation, or shredding as
use as secondary material. Reclamation technologies have not been found to be highly
effective due to the three-dimensionally cross-linked structure of rubber. Recycling by
reuse of shredded tires has been limited by end-use application.
The most primitive method of polymeric material recovery is reclamation. Reclamation
is the chemical process where conversion of a three dimensionally interlinked and infusible
thermoset polymer takes place into a two dimensional, soft, plastic low modulus product.
In physical recycling, waste tires are processed into two main physical forms. The first type
is shredded or chipped rubber tire that is produced through a two-step shredding–cutting
process. After the first stage of shredding, rubber particles attain a length of 300–430 mm
with a width of 100–230 mm. In the second stage, the shredded particles are cut down to
dimensions of 100–150 mm. Continued shredding produces rubber particles having dimen-
sion of 13–76 mm. These shredded rubber particles are processed through subsequent steps
of magnetic separation to remove the metallic inclusions from tires, grinding and screen-
ing. Ultimately, the particles are processed with a typical size of 0.075–9.5 mm, and this
is called crumb rubber [6]. This study is focused on the use of crumb rubber, because the
interest is in the use of small particles as reinforcing aids that can be easily incorporated
inside a polyurethane foam matrix.
The rubber waste situation in early 90s is shown in Table. 1.1. It is very evident that in
the early 90s, the rubber waste situation in the United States was quite environment-friendly
in comparison to other countries as the percentage of landfill deposition was almost zero.
But, this condition became worse with time. According to the Rubber Manufacturers Asso-
4

ciation, recent waste situation witnessed an annual deposition of almost 300 million waste
tires to different landfills in United States [2] which is reducing the number of available
disposal sites.
Treatment France Germany Italy USA
Retreading% 20 17.5 22 None
Recycled% 16 11.5 12 28
Energy% 15 46.5 23 72
Landfill% 45 4 40 None
Export% 4 16 2 None
Table 1.1: Rubber waste situation in early 90s [1]
Recycling of rubber tires necessitates the removal of metal wires from the same. This
is a costly process. In addition, polymeric rubber compound requires some sort of surface
treatment for its own stability and compatibility to other materials. It has been expected and
seen that de-wiring and surface treatment of rubber would enhance its economic recycling
and applicability to produce new generation materials [5].
Surface Treatment of Rubber Particles
The basic aim of surface treatment of rubber particles is to treat ground rubber to make it
more reactive inside vulcanized material without breaking the bond. This is accomplished
in several ways. One approach is to coat the rubber particles with a bonding agent to make it
chemically reactive inside a new compound. The second approach is to activate the surface
of the rubber particles by using some caustic gas. In the early 90s, researchers exposed
ground rubber to oxidative gas mixtures containing small amount of fluorine and other
reactive gases like oxygen or sulfur dioxide [5]. The resulting reactions form hydroxyl
(OH−) or carboxylic (COOH−) reactive groups resulting in an enhancement of the surface
energy of the material. Subsequently, the treated rubber particles formed strong chemical
5

bonds with other materials [5]. Smith et al. [10] also discussed the surface treatment of
ground rubber particles by treating them with chlorine gas. This treatment improved the
compatibility of rubber with other polymeric compounds, but is a hazardous procedure.
Some researchers have used surfactants to activate the rubber particles with an intention
to enhance their bonding with different compounds. Our present work is based on the use
of surfactants to avoid the exposure and hazards associated with caustic gases.
Surfactants are short chain fatty acids. They have a unique structure where one part
has an affinity towards the polar media while the other part is attracted by the non polar
media. Surfactant molecules generally form oriented monomers at interfaces and show
surface reactivity. They do so by lowering the surface tension of the dissolving medium.
An example of a commonly used surfactant in daily life is detergent. These are special
kind of surfactants whose solutions provide cleaning properties. In other words, detergents
change the interfacial properties and remove a phase from the solid surfaces [14]. Fig. 1.3
shows the typical structure of a surfactant.
Figure 1.3: Typical structure of surfactants and formation of a micelle, adapted from [14]
The typical structure of a surfactant molecule is a combination of a hydrophilic head
6

group and hydrophobic chain group in the molecule. The polar or ionic group interacts
with the aqueous environment through dipole-dipole or ion-dipole interactions. In aqueous
solutions, surfactants work as an electrolyte. But they act differently at a higher concentra-
tion. They form organized aggregates of large number of molecules known as micelles. In
a micelle, the lipophilic parts of the surfactants move towards the interior of the aggregate
making hydrophilic parts to face the aqueous medium. The formation of a micelle can be
seen as a compromise in between the desire for the alkyl chains to avoid the contacts with
water and the tendency of the polar group to keep contact with water [14].
The physico-chemical properties of surfactants vary significantly above and below a
particular surfactant concentration. This is known as the critical micelle concentration
(CMC) of a surfactant. Below the CMC value, the properties of an ionic surfactant resem-
ble the same of as that of an electrolyte. On the other hand, above the CMC value, these
properties change markedly showing a cooperative process. At CMC, micelles are formed.
Since the thermal and electrostatic forces directly oppose micellization, a low CMC value
is always accompanied by increasing the lipophilic part of the molecule, lowering the tem-
perature, and addition of electrolyte. Micellar models always consider micelles as a sep-
arate phase. According to pseudo-phase model, the critical micelle concentration of any
monomer is defined as the concentration of maximum solubility of that monomer in that
particular solvent. This is significant, as in any process the concentration of surfactants
should be just near its CMC value or just a little bit higher. This is because the greatest ef-
fect of surfactant is always seen when it forms considerable micelle in the solution, whether
it is the process of interfacial tension lowering or foam stability. Another significance of the
CMC value is that it represents the solution concentration of surfactant where maximum
adsorption takes place. Plotting the physico-chemical property against the concentration
for a given surfactant-solvent system represents the importance of CMC value for each and
every surfactant. This plot is called the Prestons classic graph, and it shows a considerable
change in slope in a narrow concentration range of surfactant [14].
7

Crumb Rubber
Crumb rubber is usually defined as rubber having a particle size of 9.5 mm (3/8 inch) or
less. They can be classified into four groups: coarse, 9.5 to 6.3 mm; mid range, 2 to 1
mm; fine, 0.4 to 0.2 mm; and superfine, 0.15 to 0.075 mm. The size of crumb rubber is
designated by means of a mesh through which it is passed during its production. While only
a small number of tires have been converted to crumb rubber historically, there is increasing
interest in using this form of recycled tire rubber for creating reusable products [9, 12]
because of the ease of material fabrication along with the probability of enhanced toughness
in the end products. Based on available data, about 9 million tires were converted into
crumb rubber in the year of 2001, and this number has been growing at an annual rate of
10–15% [12]. Also, as a point of reference, each tire produces about 10–12 pounds of
crumb rubber [10].
Figure 1.4: Typical crumb rubber particles recycled from waste tires, adapted from [15]
Out of all reuse options, crumb rubber is the most complex but least studied subject in
terms of both production and market. In 1994, 2% of the total generated scrap tire was
utilized into the production of crumb rubber. This had increased up to 12% by the year
of 2001. The main advantage of crumb rubber market is the popularity and utilization of
8

all types of crumb rubber product. For example, different crumb rubber producers existing
in the same industry always need different mesh size of rubber particles for their unique
product. Consequently, it is not easy to generalize particle size requirement in crumb rubber
market and to forecast the market demand and production planning of the same [9].
Polyurethane
Polyurethanes are polymers that have a chain of organic units joined by urethane or car-
bamate links. Their formation takes place through step-growth polymerization where a
monomer having at least two isocyanate group forms bond with another monomer having
at least two alcohol groups. The first work on polyurethane (or commonly urethane) poly-
mers took place in Germany by Otto Bayers and his co-workers in the year of 1937 [16].
Polyurethanes are reaction polymers and they lie in the same group as epoxies, un-
saturated polyesters, and phenolics. As mentioned, a urethane linkage is produced by
the reaction of isocyanate group (-N=C=O) with hydroxyl (-OH) group. Similarly, the
polyurethane linkage follows the same path having the urethane linkage (-RNHCOOR) in
the resulting product, as shown in Fig. 1.5.
Commercially, polyurethanes are prepared by the reaction between liquid isocyanate
with liquid blend of polyols. These two components together are termed as a polyurethane
system [16]. But, sometimes, polyurethanes are produced by the reaction of diisocyanate
with a blowing agent directly. This investigation employs the latter approach.
Polyurethane can be easily fabricated as foam. Different blowing agents can be incor-
porated inside the diisocyanate–polyol combination as an auxiliary system or into the poly
side. Blowing agents react with isocyanate to produce carbon dioxide gas resulting in the
expanding of cells during the mixing process. For example, water molecules react with iso-
cyanate to produce carbamic acid, which is unstable and breaks down into carbon dioxide
and an amine group. The amine group thus produced, reacts with more isocyanate to pro-
duce a substituted area. Water produce significant amount of urea. This is not very soluble
9

Figure 1.5: Chemical synthesis of polyurethane, adapted from [16]
10

in the reaction mixture, and produces hard segments of polyurea. Halocarbons and hydro-
carbons are preferred over water as they have low boiling points (near room temperature).
As the polymerization reaction is exothermic, blowing agents volatilize into a gas during
the reaction. They expand the cellular polymer matrix and consequently foam is formed.
This mechanism of foaming is explained by the chemical reaction furnished in Fig. 1.6
Figure 1.6: Chemistry behind polyurethane foam formation, adapted from [16]
Surfactants help in polyurethane foam formation. They serve four distinct purposes:
stabilizing the dispersion of immiscible components; helping nucleation of bubbles during
foaming; stabilizing gas bubbles; and preventing the foam from collapsing by the reduction
of stress concentrations till the point when the foam gets sufficient mechanical strength as
a result of polymerization reaction [16–18].
While isocyanate and polyol are the two main chemical components for the formation
of polyurethane, the process can involve a number of ancillary chemicals. In addition to
surfactants, catalysts are used to accelerate the reaction. Polymer structure properties can
be modified by the usage of chain extenders and cross-linkers. Based on the application,
fillers, pigments, and fire retardants can also be added to the same. In addition to all of
these, there are blowing agents for the purpose of foaming. Reactive blowing agents form
carbon dioxide inside the mixture and help in foaming. On the contrary, non-reactive blow-
ing agents act by evaporating in the foaming mix.
Because of the fact that the physical, mechanical, and thermal properties of polyurethane
can be easily tailored by changing the isocyanate-polyol system, polyurethanes are consid-
11

ered highly versatile materials. The range of polyurethane type and the end products from
them is high. They are available starting from rigid or flexible lightweight foams up to
stiff and tough elastomers. This makes them widely used products in various industries.
For example, rigid polyurethane foams are used mostly in thermal insulation of building,
refrigerators, pipelines, and storage tanks, buoyancy and flotation device, packaging, fur-
niture, and equipment housing. On the other hand, flexible foams find their applications in
household furniture including bedding, automotive seating, textile laminates, and cushion-
ing. Semi rigid and low-density structural foams are used in making sports goods, such as,
skis and surfboards, steering wheels, and headrests. Elastomers have got wide applications
in making shoe soles, vehicle body panels, rollers and gear wheels, conveyors, and sealants
for automotive industry [19].
Effect of Particle Distribution on Foam Stability
Foams in liquid–liquid macro emulsions, where the droplet size varies between 1–100 mi-
crometers, are thermodynamically unstable since their decay results in a decrease of the
free energy of the system. Therefore, foams are considered as metastable for their appli-
cations because of their possible breakdown in the system. Primary processes of insta-
bility in foams are creaming, sedimentation, coalescence, and flocculation. The first two
are gravity-induced movements caused by the density difference between phases. Since,
gravity-induced movements are highly dependent on density, liquid drainage is significant
in foams. This drainage is the basic force behind the formation of polyhedral structures in
foam. Coalescence involves the binding of two bubbles where interfacial film drains and
ruptures leading to the formation of one single large bubble. Flocculation involves interac-
tion between emulsion droplets where, the interfacial film wall does not drain to rupture,
and droplets are fastened to each other like a cluster. Another major foam instability is dis-
proportionation. This is the process where air molecules diffuse between bubbles. As the
pressure is increased inside smaller bubbles, diffusion flux generally results in shrinkage
12

of smaller bubbles and growth of the larger resulting in further drainage and coalescence.
Therefore, a third component is required to stabilize the foams. This component can be
a foaming or emulsifying agent. Such agents should satisfy the conditions of foaming as
well as stabilizing it throughout required time periods. The most common emulsifiers are
surfactants. They adsorb to the interface and reduce the free energy by producing high
surface area interface resulting in a reduction in interfacial surface tension [20].
It is generally accepted that particles at an interface prefer to stay in any of the liquids,
mainly the disperse phase. It is also known that the adsorption of particles at bubble in-
terfaces is an important mechanism in the dynamic foaming processes. The association
of particles to create a steric barrier to coalescence is the main reason for foam stabiliza-
tion [20]. Smaller particle having high concentration form the most effective barrier. The
effect of particles on the inter film, for example retardation of drainage and enhancement of
maximum capillary pressure, is also important as the effect of drainage increases. Bridging
of particles in between bubbles can also put forward important contribution because of the
high force contact area in foam phases [20].
The wettability of particles also plays an important role. For example, particles do not
contribute much as stabilizers in aqueous foaming system. They destabilize the foam from
bridging drainage. Also, since, foams are deformable and delicate, they can be subjected
to foam destruction by means of particle piercing in case of larger particles [20].
Focus of the Present Work
In this work, an attempt has been made to reinforce rigid polyurethane foam to enhance its
specific strength, modulus, and toughness properties by incorporating particles of rubber
recycled from scrap tires. In addition, the relationships between rubber content, surfactant,
physical foam characteristics, and mechanical properties, are investigated in detail. These
materials can definitely be seen as a means of utilizing post-consumer waste tires. Since,
polyurethane is a widely used material in the industry, it is believed that the materials,
13

if developed successfully, will find wide applications and provide a high volume use of
recycled rubber.
14

CHAPTER 2
LITERATURE SURVEY
Prior Research in Rubber Recycling
Investigations on the recycling of used rubber fall in to three broad categories: economic
analysis; reclamation; and use of shredded or ground rubber. First, some studies discuss the
engineering economics and feasibility analysis of recycled rubber products [5,9,10]. Amari
et al. [5] analyzed how to maximize value recovery by calculating the life cycle energy bud-
get considering both the energy consumed for tire production and energy recovered from
their use as fuel. Their study put significant importance on the reuse of rubber products
and showed that used tires represent 23 petajoules of embedded energy from raw materi-
als annually, which is equivalent to four million barrels of oil. Sunthopagashit et al. [9]
examined the engineering economics of crumb rubber facilities with a financial model of
a nominal processing operation to aid the analysis of different market, crumb size, and
production scenarios. Their study analyzed the complex interactions between the demand
and production factors, and showed how pricing, quality, mesh size, and end-user markets
could be deciding factors in the crumb rubber business. Smith et al. [10] proposed testing
and evaluation of commercial applications of new surface treated rubber technology utiliz-
ing waste tires and proposed that recycled rubber particles without odor and low moisture
content could be the keys to its successful commercial applications.
The common methods of reclamation have been achieved using various organic (diphenyl
disulfide, dibenzyl disulfide, diamyl disulfide, alkoxy aryl disulfide, butyl mercaptan, thio-
phenols, xylene thiols and phenol sulfide etc), inorganic (toluene, naptha, benzene, cyclo-
hexane, iron oxide phenyl hydrazine based catalyst, copper chloride-tributyl amine catalyst,
15

diphenyl guinadine etc) and other chemical compounds (thiocarboxylic acid, thioacetic
acid, 1,3,5-trimethyl benzene, 2-mercaptobenzothiazole etc) [1]. Some significant organic
compounds used in the surface treatment of rubber during the process of reclaiming are
shown Table. 2.1.
Name of the Chemical Attacking Position of Cross-Link Bonds
Triphenylphosphine Polysulfide links into monosulfide and to lesser extent disulfide
Sodium di-n-butyl phosphite Di and polysulfide crosslinks
Propane-thiol/piperidine Polysulfide linkages
Hexane-1-thiol Both polysulfide and disulfide linkages
Dithriothreitol Disulfide bonds into two thiol groups
Lithium Aluminum Hydride Disulfide and polysulfide bonds
Phenol Lithium in Benzene Polysulfide and disulfide bonds
Methyl Iodide Monosulfide linkages
Table 2.1: Properties of different organic compounds for rubber surface treatment [1]
Several researchers have worked on the recycling and reclamation methodologies of
waste rubber products to make them reusable for engineering applications [1, 8, 21]. Ad-
hikari et al. [1] discussed the method to reduce the waste problem, recycling, reuse of used
waste rubber and reclaiming of raw rubber materials. Their study discussed about several
effective reclamation processes like cryo-mechanical, microwave, ultrasonic techniques,
and mechanical means. The microwave methodology was found to be the most effective,
as other methods cause undue degradation of rubber polymer chains. Romine et al. [21]
discussed activation of the surface of ground rubber by using thiophilic microorganisms by
selectively modifying sulfur cross-links to improve compounding properties. Final prod-
ucts showed increased reactivity of the particle surfaces and improved surface chemistry as
a function of biooxidation of sulfur species and concentration of sulfoxide functionalities.
Fukumori et al. [8] discussed devulcanization using high temperature and pressure.
16

The third class of studies have focussed on the use of shredded or ground rubber, with-
out devulcanization, in secondary products. Significant amount of work have been done
on the mixing of recycled rubber particles inside concrete, bitumen and asphalt to make
products appropriate for structural applications. The brittle nature of concrete and its low
loading toughness has initiated the use of rubber particles to remedy these drawbacks [7].
Several studies [2, 3, 6, 7, 11, 22–39] discussed the properties and performances of con-
crete mixed with high volume of crumb rubber from scrap tires. All of them demonstrated
promising mechanical properties and enhanced performance by the use of crumb rubber-
ized concrete. Another common trend investigated by all of the researchers was consid-
erable deformation undergone by concrete before failure and its capability to withstand
post-failure loads. All of these studies reveal a dependence of properties on the rubber
particle size along with an increase in failure temperature. The biggest common advantage
depicted by all of these studies had been the ease of fabricating crumb rubberized products
for structural applications.
In spite of all these advantages, some drawbacks were also seen. Fattuhi et al. [40] ana-
lyzed the properties of cement-based materials containing shredded scrap truck tire rubber
and got reduced compressive properties and densities of cement by the use of rubber. Fen-
ner et al. [41] discussed the environmental and structural implications for the reuse of tires
in fluvial and marine construction. They showed that leaching of different chemical com-
pounds like zinc, cadmium and carbon black results in the degradation of rubber tires and
limits their use for marine applications, especially in sea water and proposed one corrective
measure for the same. In addition, researchers found increased water permeability in the
concrete mixtures by the addition of rubber particles.
Rubber Particles in Polymeric Matrix
Rubber particles have been found to be usable in polymeric matrix as well. Elastic rubber
particles are expected to absorb large impact energy through plastic deformation of the
17

particles. Rubber particles would also promote crack pinning and crack bridging. These
mechanism should lead to higher toughness in rubber reinforced polymers [42].
Cawse et al. [43] proposed the use of rubber as a toughening agent in polyurethane net-
works and composite materials. They observed that the processing method, rubber particle
size, and size distribution are important parameters in affecting rubber–matrix adhesion and
material properties. Datta et al. [44] used waste rubber for filling cast urethane elastomers.
Manoj et al. [45] studied the miscibility and fracture toughness of polyurethane–rubber
composite blends and obtained enhanced values of fracture toughness by the incorporation
of rubber particles. Pastor-Blas et al. [46] analyzed the failure behavior of surface treated
unvulcanized rubber–polyurethane adhesive joints and found enhanced T-peel strength and
improved surface adhesion. On the other hand, Tan et al. [47] studied abrasion resistance of
thermoplastic polyurethane blended with rubber and found that the tensile strength, elonga-
tion at break, and abrasion resistance got increased with optimum rubber content. Danch et
al. [48] made dynamic mechanical thermal analysis (DMTA) study of the urethane network
in rubber waste–urethane composites and conducted thermal analysis of the end product.
The reaction between rubber (disulfide bonds) and isocyanate free groups was observed us-
ing FTIR. Dhamodharan et al. [49] studied blends of ethylene propylene diene rubber and
thermoplastic polyurethane and observed improved mechanical properties along with bet-
ter solvent resistance and enhanced low temperature flexibility whereas, the glass transition
temperature was found to increase. Ortiz-Morgan et al. [50] published their work on im-
proved adhesion of RF plasma treated rubbers by isocyanate incorporation to polyurethane
adhesive. They observed increase of rubber adhesion towards polyurethane adhesive. How-
ever, they mentioned the use of isocyanate as the cross-linker because of the presence of
anti-adherent compound like zinc stearate. Pachpinyo et al. [51] made a preliminary study
on the preparation of unsaturated polyester resin and rubber latex blends in the presence
of dispersion aids like toluene and liquid ammonia, and obtained increased impact resis-
tance. Sulkowski et al. [52] made thermogravimetric study of rubber waste-polyurethane
18
composites and concluded that no relationship can be drawn between material constitution
and thermal or mechanical properties.
Studies on reinforced polymer foams have also been conducted. Li et al. [42, 53]
synthesized and characterized rubberized syntactic foam. They concluded that the rub-
berized foam shows higher capability of absorbing impact energy at micro–length scales.
This foam is also capable of preventing the micro-length scale damage from propagating
into macro-length scale damage. El Lawindy et al. [54] studied the physical properties
of foam–rubber composites with carbon black as the second binding agent. They con-
cluded that a foaming agent promotes the dilution of carbon in the matrix. Mechanical
parameters were found to decrease with an increase of both temperature and foaming agent
content. Lin et al. [55] studied microstructure–mechanical property relationship of short
fiber–rubber–foam composites. They showed that short fibers disperse uniformly in the
composites irrespective of treatment, but treated fibers showed much better adhesion with
the rubber matrix than untreated ones. The experimental results indicated the enhancement
of most mechanical properties such as tensile modulus, hardness, and tear strength by the
incorporation of short fibers in the rubber foam matrix. De Mello et al. [56] studied the
effects of post-consumer PET (polyethylene terephthalate) on the performance of flexible
polyurethane foams. They observed much more enhanced mechanical properties in terms
of tensile resistance, strain at break, and tear resistance. The reinforced foam yielded better
wear and compression resistance than the standard foam without changing the number of
cells. Some more works on reinforced polymer foams have been discussed later in this
chapter.
Surfactants in Polyurethane Foam System
The use of surfactants has become very popular in heterogeneous blend systems. Numer-
ous surfactants have been tested in virgin polyurethane foams as well as crumb rubber-
polyurethane system with specific purposes. Surfactants are expected to coat the rubber
19

particles resulting in their effective bonding in polyurethane matrix system. On the other
hand, surfactants also help in stabilizing the foam matrix. Krupers et al. [17] studied the
formation of rigid polyurethane foam with a mixture of commercially available siloxane
L-6900 talc powder and several semi-fluorinated diblock copolymers as surfactants, and
observed a reduction in cell size. Fluorinated surfactants helped in the stability of the foam
system. Hawkins et al. [57] used the DC-193 surfactant in their study of the cell morphol-
ogy and mechanical properties of a rigid polyurethane foam. They concluded that there is a
relationship between the cell morphology and the compressive modulus and collapse stress
in the final product, and also that the size of mold significantly affects the method of foam-
ing. Morimoto et al. [58] used another silicon surfactant SH-193, having chemical formula
R(R2SO)y(CnH2nO)xR, in their work on rigid polyurethane foam. It was seen that the flex-
ural modulus and the flexural strength increased and their temperature dependence reduced
by the use of surfactant and longer fibers as reinforcing agent. Seo et al. [59, 60] used
polysiloxane ether as a surfactant for the formation of water blown free rising polyurethane
foam and saw that that the density and the compressive strength of the foam increased with
an increase in the OH value and the functionality of the polyols along with the use of sur-
factants. Saint-Michael et al. [61] used a PDMS/POE copolymeric silicone surfactant to
characterize the effect of filler particle size on high-density polyurethane foam. They found
that the reinforcement of foam might not be effective if the filler are bigger than the bubble
size. Thermal studies suggested that the fillers increase the crosslink density of the matrix.
Some other studies can be mentioned in this connection. Singh et al. [62] used polysilox-
ane ether as a surfactant in their work on the reactivity of raw materials and studied its
effects on the structure and properties of rigid polyurethane foam. They found increased
cream time and gel time of foaming with larger cell size distribution, though, the effects
of surfactants were found to be minimal. De Mello et al. [56] studied the effects of post-
consumer PET (polyethylene terephthalate) on the performance of flexible polyurethane
foams and used a silicone surfactant, polysiloxane-polyalkylene block copolymer. They
20

observed enhanced mechanical properties in terms of tensile resistance, strain at break, and
tear resistance. The reinforced foam yielded better wear and compression resistance than
the standard foam without changing the number of cells. Goods et al. [63] used silicone
glycol copolymer surfactant DC-193 with an average hydroxyl number of 75 in their study
on the mechanical properties of particle-strengthened polyurethane foam. They observed
that the surfactant helped in dispersing the aluminum particles uniformly inside the foam
resulting in higher values of modulus and collapse stresses. Lim et al. [64] studied the
effect of silicone surfactant B 8404 on rigid polyurethane foam. They found the reduc-
tion of average foam density associated with the generation of finer cells and increase in
closed cell porosity of the rigid foam and concluded that surfactants helped in the foaming
process. In addition, the surfactant took part in stabilizing the foam system.
Surfactants in Rubber–Polyurethane Blend System
There is a significant number of studies on the use of surfactants on rubber–polyurethane
blend systems. Datta et al. [44] used diazabicyclo[2.2.2]octane as a surfactant for charac-
terizing cast urethane elastomers containing waste rubber particles. Lin et al. [55] used a
new surfactant known as Accinox Tq (polymerized 1,2 dihydro 2,2,4-trimethyl quinoline)
for studying the microstructure and mechanical property relationship of short fiber–rubber
foam composites. The experimental results showed that the incorporation of short fibers
into rubber foams is responsible for the enhancement of mechanical properties such as
tensile modulus, hardness, and tear strength. The good interfacial adhesion of the short
fibers with the matrix enables further improvement in the mechanical properties. Pastor-
Blas et al. [46] analyzed the failure mode of unvulcanized rubber–polyurethane adhesive
joints by treating the rubber by trichloroisocyanuric acid (TCI) to reactivate the surface
and observed enhanced T-peel strength and improved surface adhesion. Danch et al. [48]
conducted dynamic mechanical thermal analysis (DMTA) study of the urethane network in
rubber waste-urethane composites by using Monothane A50 and Monothane A60 urethane
21

unary (one component) prepolymers as surfactant. FTIR analysis showed the reaction be-
tween rubber (disulfide bonds) and isocyanate free groups. Dhamodharan et al. [49] stud-
ied blends of ethylene propylene diene rubber and thermoplastic polyurethane and used
dicumyl peroxide as surfactant. They found improved mechanical properties along with
better solvent resistance and enhanced low temperature flexibility whereas, the glass tran-
sition temperature was found to increase. Ortiz-Morgan et al. [50] published on improved
adhesion of RF plasma treated rubbers by isocyanate incorporation to polyurethane adhe-
sive and enhanced the surface reactivity of rubber particles by the use of 4 weight % tris
(p-isocyanatophenil) thionophosphate surfactant. They observed increased rubber adhe-
sion towards the polyurethane adhesive. However, they mentioned the use of isocyanate as
cross-linker because of the presence of anti-adherent compound like zinc stearate. Pach-
pinyo et al. [51] studied the preparation of unsaturated polyester resin and rubber latex
blends in the presence of dispersion aids like toluene and liquid ammonia and received
enhanced impact properties by the use of dispersion aids. Sulkowski et al. [52] made
thermogravimetric study of rubber waste-polyurethane composites and used one compo-
nent polyurethane prepolymer surfactant Chemolan-M, Chemolan M-50 and Chemolan
B-3 having hardness similar to that of fine rubber. Yang et al. [65] used simple silicon
dioxide having a particle size of 30–50 micrometer as a surfactant. They concluded that the
integrated mechanical properties of hybrid reinforced rigid polyurethane composite foam
would achieve an optimal value by the incorporation of 7–8 % of rubber. Some other stud-
ies [66, 67] discussed the use of surfactants in polyurethane foam system. All of these
works presented significant changes in properties by the use of surfactants.
It is to be noted that the discussion on the working principle of surfactants is mainly
based on the application of surfactant in an aqueous medium. Most of the above mentioned
studies have used water as a blowing agent in the foam system. Hence, corresponding
surfactants were believed to work in the same principle. Though, our study does not directly
involve water in the crumb rubber–polyurethane foam blend system, the working principle
22

of surfactants will be governed by the same basic principles.
Literature survey on Non-Reinforced Polyurethane Foam
There have been several studies on the properties of polyurethane foams. Most of the ear-
lier investigations focussed on non-reinforced foams [57, 59, 60, 62, 68–74]. Mumford et
al. [68] studied the component analysis of rigid polyurethane foam, and addressed suit-
able means for the elemental analysis of foams, for example by chemical ionization mass
spectrometry and high pressure liquid chromatography. These methods were found to be
effective. Hawkins et al. [57] studied the cell morphology and mechanical properties of
rigid polyurethane foam. They concluded that cell morphology holds a relationship with
compressive modulus and collapse stress in the foam. It was further concluded that the
shape and orientation of the cells have significant effects on the mechanical properties if
not explained by means of some different failure mechanism. Izakson et al. [69] published
their work on the mechanical and thermo physical properties of polyurethane foam thermal
insulation coatings for controlling the instability of deep quarry banks, where they obtained
increased thermal and mechanical properties. Johlitz et al. [70] investigated experimental
and theoretical properties of non-linear viscoelastic polyurethane systems by considering
them as a material with zero plasticity and obtained proper agreement with the experimen-
tal results. Niyogi et al. [71] discussed the effect of blowing agent (water) on polyurethane
foam. They concluded that with an increase in blowing agent concentration, more bubbles
are formed and their average size decreases. In addition, the time of nucleation decreases,
resulting in a narrower bubble size distribution. Seo et al. [59,60] studied mechanical, mor-
phological, and thermal properties of water blown free rise rigid polyurethane foams. They
concluded that the kinetic rate of polyurethane foam forming increases with an increase
in water content by the reaction between water and foam component PMDI. They further
concluded that that the density and the compressive strength of the polyurethane foam in-
crease with an increase in the OH value and higher functionality group polyol. Singh et
23

al. [62] investigated reactivity of raw materials and their effects on structure and properties
of rigid polyurethane foam. They found increased cream time, and gel time of foaming
with larger cell size distribution. Sonneschein et al. [72] derived the relationship between
polyurethane foam microstructure, and foam aging, and observed that foam aging is pre-
dicted by means of hard segments inside foam network. Subramani et al. [73] developed
new polyurethane dispersion from blocked aromatic diisocyanate. These dispersions were
found to be stable for more than six months and observed the possibility of using these
anionically modified blocked-isocyanate adducts as potential crosslinkers. Tu et al. [74]
discussed plastic deformation modes in rigid polyurethane foams under static loading. The
mechanical properties of polyurethane foam were examined via compression in different
directions. Results showed that the response is anisotropic. Further conclusion was the
uniform distribution of foam by the effect of compression in the transverse direction.
Literature survey on reinforced polyurethane foam
Studies on reinforcements in polyurethane foam are more recent [42–47, 53–55, 58, 61,
75–79]. Haibach et al. [75] studied the mechanical properties of silica-particle reinforced
polyurethane foams via emulsion templating and obtained enhanced elastic properties along
with foam stability. Mahfuz et al. [76] studied the fabrication, synthesis, and mechani-
cal properties of nanoparticle infused polyurethane system. They concluded that an op-
timum amount of nanoparticle enhanced the thermal as well as mechanical properties of
polyurethane foams. Morimoto et al. [58] worked on the flexural properties of glass fiber
reinforced rigid polyurethane foam. It was seen that flexural modulus and the flexural
strength increased and their temperature dependences reduced by the use of surfactant and
longer fibers as reinforcing agent. Saint-Michael et al. [61] worked on the mechanical
properties of high-density polyurethane foam and the effect of filler size on their properties.
They found that the reinforcement of foam might not be effective if the filler are bigger than
the bubble size. Thermal studies suggested that the fillers increase the crosslink density of
24

the matrix. Rozman et al. [77] published on the mechanical and physical properties of
polyurethane component based on rice husk and polyethylene glycol. They concluded that
the introduction of rice husk as an OH groups provider in a polyurethane system enhances
the properties. It was further concluded that properties of the composites also depend on
the amount of homogeneous polyurethane matrix. Yosomiya et al. [78] reinforced rigid
polyurethane foam with glass fibers and characterized the compressive properties. They
concluded that out of different polymers, copolyimides show better resistance to swelling
in solvents than the elastomers, but, they show worse performance in alkalis. It was further
concluded that at low temperature, these copolyimides exhibit low stiffness, high deforma-
tion, and good elastic recovery. Cawse et al. [43] proposed the use of rubber as a toughening
agent in polyurethane network and composite materials and observed that the processing
method, rubber particle size, and size distribution are important parameters in affecting
rubber-matrix adhesion, and material properties.. Datta et al. [44] used rubber wastes for
filling the cast urethane elastomers. Li et al. [42, 53] synthesized and characterized novel
rubberized syntactic foam. They concluded that the rubberized syntactic foam shows a
higher capability of absorbing impact energy in micro–length scales. It is also capable of
preventing the micro-length scale damage from propagating into macro-length scale dam-
age. El Lawindy et al. [54] studied the physical properties of foam-rubber composites
along with carbon black as the second reinforcing agent. They concluded that foaming
agent promotes the dilution of carbon in the matrix. Mechanical parameters were found
to decrease with an increase of both temperature and foaming agent. Lin et al. [55] stud-
ied microstructure–mechanical property relationship of short fiber–rubber-foam compos-
ites and showed that short fibers disperse uniformly in the composites irrespective of treat-
ment, but treated fibers showed much better adhesion with the rubber matrix than untreated
ones. The experimental results indicated the enhancement of most mechanical properties
such as tensile modulus, hardness, and tear strength by the incorporation of short fibers in
rubber foam matrix. Manoj et al. [45] published on the miscibility and fracture toughness
25

of polyurethane–rubber composite blends and got enhanced values of fracture toughness
by the incorporation of rubber particles. These studies have helped in understanding the
mechanism of polyurethane foam formation and served as the basis of future work.
Motivation
As of yet, however, no studies are present that provide a detailed discussion of the effects
of the microstructure of rubber-polymer blend products on the mechanical properties. A
few studies discuss the microstructure-property relationship of glass fiber and carbon black
reinforced foam composites [55], no one has studied the same for crumb rubber particle
reinforced polyurethane foam products. This provides a motivation for the current investi-
gation.
26

CHAPTER 3
MATERIALS AND EXPERIMENTAL CHARACTERIZATION
This study investigates the fabrication and characterization of crumb rubber–polyurethane
foam composites. Crumb rubber particles, 40–99 mesh size, were purchased from Entech,
Inc. (White Pigeon, MI). Fig. 3.1 shows the particle size distribution of this particular size
of crumb rubber. An optical micrograph of the crumb rubber particles is shown in Fig. 3.2.
Figure 3.1: Sieve analysis data for crumb rubber having 40-99-mesh size, adapted from
[80].
The basic principle of polyurethane form formation is the reaction between an iso-
cyanate with a polyol in presence of a blowing agent. This method is termed as physical
27

Figure 3.2: Optical micrograph showing crumb rubber particles inside foam
blowing or foaming. There is another method where blowing agents are directly reacted
with the isocyanate and no polyol is involved. This is called chemical blowing or foaming
and was used in this study. The approach involves the reaction of isocyanate with active
hydrogen and the hydroxyl radicals of blowing agent to produce carbon dioxide gas for
foaming and urea linkages to form polyurea, as shown in Fig. 3.3 [16].
Figure 3.3: Basic concept of polyurethane foam formation by chemical blowing method,
as used in this investigation, adapted from [16]
We selected an expanding, rigid, closed cell, pourable urethane foam to fabricate the
composite, having a density of 0.03 g/cm3 from US Composites (Palm Beach, FL). This
foam has two parts (part A and part B), which are mixed in equal volume. Approximate
ideal temperature for the foaming process varies between 24–27 °C. When mixed, this
system starts foaming in 45 seconds and completes expansion in 5 minutes. The total
expanded volume is approximately 25 to 30 times the starting liquid volume.
28

Part A of this two-part foam system is polymethylene polyphenylisocyanate (polymeric
MDI or PMDI), which is the polymeric form of diphenylmethane diisocyanate (MDI).
This is a popular stable aromatic isocyanate and not considered to be carcinogenic. It is
a brown liquid with slight aromatic odor having a boiling and flashing point of 329 °C
and 199 °C respectively. It has a specific gravity of 1.24 and is insoluble in water. Above
204 °C, it can polymerize or decompose causing a pressure build-up in closed containers
resulting in effective rupture of the same. Hence, it should be kept far from the presence
of water, alcohols, glycols or other chemical materials having active hydrogens in their
chemical structure. PMDI is highly incompatible with amines and strong bases. It is highly
flammable in presence of carbon monoxide, carbon dioxide, benzene, toluene and traces of
hydrocyanic acid [81]. Fig. 3.4 shows chemical structure of PMDI.
Figure 3.4: Chemical structure of PMDI (Part A), adapted from [82]
Part B of our two-part foam system acts as the polymerization blowing agent, and
has the chemical name 1,1,1,3,3-pentafluoropropane. Commercially, this blowing agent
is called HFC 245fa. Though, it belongs to polyol resin system, it is not a conventional
polyol. Rather, it is a tertiary amine catalyst. This material is also stable and not carcino-
genic. It has a boiling point and flashing point of 15.5 °C and 93 °C respectively. It is
brown in color and 9% volatile by volume. HFC-245fa is slightly soluble in water with a
specific gravity of 1.155. It should be kept below 29 °C and far from chemicals like car-
bon dioxide, carbon monoxide, halogens, and carbonyl halides [81]. It is essential to know
29

that blowing agents like HFC 245fa does not take part to create the cells of foam. Foam
cells are created by the diffusion of blowing gases into bubbles that are nucleated during
the time of mixing. Microcellular foams can rather be created without the use of blowing
agents by the mechanism of frothing or nucleation [16]. Fig. 3.5 shows chemical structure
of 1,1,1,3,3-pentafluoropropane.
Figure 3.5: Chemical structure of HFC-245fa (Part B), adapted from [83]
As mentioned, because of the dissimilar chemical structure between the polyurethane
foam and rubber particles, it was expected that the dispersion of rubber particles in the
polyurethane matrix could be difficult. Surfactants or dispersion aids were therefore used
to coat the rubber particles, to promote the uniform dispersion and enhance rubber–foam
bonding [51]. This study employed two specific surfactants.
The first is soluble sodium lauryl sulfate (SLS) in water (Darvan WAQ, R. T. Van-
derbilt Company Inc. ,Norwalk, CT), an important anionic surfactant. The most common
use of SLS is as an emulsifier for emulsion polymerization of many polymers. It has
both hydrophobic and hydrophilic structures that are supposed to react with rubber and
polyurethane molecules. It is expected that hydrophobic sites would interact with rubber
molecules, while hydrophilic sites would interact with the polyurethane molecule [51].
SLS is synthesized by the reaction between lauryl alcohol and sulfuric acid to produce hy-
drogen lauryl sulfate, which, is further neutralized by adding sodium carbonate. Because
of this synthesis technique, SLS is not considered as a pure dodecyl sulfate, but a mixture
of alkyl sulfate with dodecyl sulfate as its main component. Like other surfactants, SLS
molecule has a tail consisting of twelve carbon atoms attached to a sulfate group. This
30

gives SLS molecules amphiphilic properties [84]. Fig. 3.6 shows the chemical structure of
a SLS molecule.
(a) Presence of head and tail in SLS
molecule
(b) Chemical structure of SLS
molecule
Figure 3.6: Chemical structure of Darvan WAQ, adapted from [84]
Darvan is a basic surfactant with a pH value of 7.5. It is a white colored liquid with
high solubility in cold water. The boiling and melting points of Darvan are 100 °C and 10
°C respectively. It is 73% volatile (w/w) and slightly denser than water, having a specific
gravity of 1.04. Darvan is not carcinogenic and a very stable chemical to work with. But, it
is not compatible with strong oxidizing agents like potassium permanganate and hydrogen
peroxide [85].
The second surfactant used in this study was a heat reactive, carboxylated vinylidene
chloride copolymer latex (Vycar 660 ×14 emulsion, Lubrizol Inc.,Cleveland, OH), a pop-
ular synthetic anionic surfactant. Unlike Darvan, it is acidic, having a pH factor of 5.7. It
has a surface tension of 30 Dynes/cm and denser than water with specific gravity 1.19. It
has a glass transition temperature of +7 °C and is not carcinogenic [86].
Figure 3.7: Monomer of Vycar 660 ×14, adapted from [87].
Vycar is an excellent flame-retardant. It is durable to washing and takes part in low
temperature heat curing without the aid of a catalyst. It is well known for its characteristics
31

of substrate adhesion, pigment binding, and colloidal stability with a high degree of re-
dispersibility. Vycar has the capability of generating good physical properties at very low
drying temperature. Generally the polymers of vinylidene chloride are prone to damage
to heat and light discoloration. Vycar does not have this drawback. It is compatible with
water-soluble flame retardant salts and has good toughness and abrasion resistance [86].
It is to be noted that the selection of a surfactant in polyurethane foam system needs
careful attention of the compatibility of the system and the purpose. Generally, popular
surfactants for rigid polyurethane foam systems are quite different than that of flexible
polyurethane foam system. This is because the rigid foam surfactants are used to produce
very fine cells and high closed cell contents. On the contrary, surfactants in flexible foams
are used to stabilize the reaction mass. At the same time, they enhance the open cell
content inside the structure so that it does not shrink. In this study, these two surfactants
were chosen on the basis of the qualitative elemental composition analysis of as received
rubber collected by XRF, as discussed later in the next chapter.
Sample Preparation
Different weights of crumb rubber particles were used to reinforce the polyurethane matrix
while the amount of polyurethane was kept constant. Four different quantity of rubber
particles were used as a reinforcing agent (25, 50, 75, and 100 g, which were 9, 18, 24
and 30 weight % of rubber particles, respectively). The effect of surfactants on the rubber-
polyurethane blend was tested using two different approaches. In one set of samples, the
amount of surfactant was kept constant for all the samples (at 10 g). The other set of
samples was prepared using a surfactant weight equal to 0.1% of rubber weight, i.e. the
weight ratio of surfactant to rubber was kept constant (0.025, 0.05, 0.075 and 0.1 g of
surfactant). Samples were prepared in 250 × 250 × 25 mm (10 × 10 × 1 inch) molds, as
shown in Fig. 3.8.
To prepare the composite samples, a measured weight of crumb rubber was placed in a
32

Figure 3.8: Mold for preparing rubber-foam composites used in the present study
mixing bowl, mixed properly with the surfactants using a mechanical stirrer at 2 to 4 rpm
for 10 minutes and then dried at room temperature for four hours. After mixing the surfac-
tant, a visible color change was observed throughout the entire mass of the rubber particles,
as illustrated in Fig. 3.9. This confirmed the interaction between anionic surfactants with
the ions present in the rubber. This visible change in color was seen for both the surfactants
Darvan WAQ and Vycar 660 ×14.
Figure 3.9: Visible color change in rubber by the application of surfactant
The surfactant treated rubber particles were then mixed with Part B of the polyurethane
foam using the help of a mechanical stirrer at 2 to 3 rpm for 5 minutes. Finally, Part A was
added and the mixture was hand stirred for a very short duration before being poured into
33

a pre-prepared mold. Due to rapid reaction and foam expansion the slurry was put inside
the mold within 45 seconds after mixing Part A. The entire mold was then placed inside a
fume hood for 24 hours with the two aluminum plates placed in a vertical orientation. This
process resulted in polyurethane foam plates with a nominal dimension of 250 × 250 × 25
mm with the incorporation of crumb rubber particles. Fig. 3.10 shows the picture of one
such plate.
Figure 3.10: Rubber–polyurethane foam composites generated in this present study
X-Ray Fluorescence Analyses and Selection of Surfactants
As already discussed, the non-uniform dispersion of rubber particles inside polyurethane
foam is a problem. Hence, proper dispersing aids were required in accordance with the
chemistry of the rubber particles. To select appropriate surfactants, XRF was performed on
the crumb rubber particles to determine elemental composition using the Tracer TurboSD
XRF analyzer (Bruker Inc. ,Madison, WI).
During processing, crumb rubber is treated with different chemicals. For example,
chlorine is used to remove the pungent odor (characteristic of the sulfur presence), and
specific solutions are used to increase fire retardancy. In addition, metal wires that were
34

incorporated during the manufacturing of tires may also be present in the crumb rubber
if not completely removed by magnetic separation. As a result, traces of these treatment
chemicals or residual metals are found in crumb rubber particles, and can affect the surface
treatment. A knowledge of the elemental composition aids the selection of surfactant as
one can plan for a possible bonding between the ions present in the specimen with the
polar or non-polar groups present in the respective surfactant.
FTIR Analysis
Fourier Transform Infrared Spectroscopy (FTIR) was used to examine the effect of sur-
factants on virgin rubber particles. This helped identify the nature of chemical interac-
tion between the two types of surfactants and crumb rubber. Spectra were collected using
AVATAR 60 (Waltham, MA) and the spectra without any manipulations or corrections were
processed using Omnic 5.1 and overlayed with the reference sample.
Determination of Physical Properties
The fabricated foam materials were characterized to determine the density, porosity, and
void volume fractions in accordance with European standard EN 993-1 [89]. Polyurethane
foam is a porous material, so porosity is a very important element defining the microstruc-
ture. The shape, density, orientation, quantity, type, size, and size distributions of pores
significantly affects the properties of foams. There are a significant number of terms affect-
ing the physical properties of rubber–polyurethane foam composites, namely bulk density,
skeleton density, solid density, apparent or total porosity (which is the void volume fraction
of air), open porosity and closed porosity [89]. In this study, the porosity of the com-
posites was quantified in terms of both open and closed porosity. Fig. 3.11 represents a
typical optical micrograph of rubber–polyurethane blend composites showing pores inside
the samples.
Measurements were carried out to quantify the spatial distribution of properties. For
35

Figure 3.11: Microscope picture of rubber-polyurethane foam composite showing pores
inside structure
density and porosity measurement, small cylindrical samples were cut along the height of
the composite samples, as shown in Fig. 3.12.
Open porosity is defined as the ratio of the volume of the open pores to the total volume
of the porous body. Similarly, closed porosity is the ratio of the volume of closed pores to
the total volume of the porous body. Apparent or total porosity is the ratio of the volume of
all pores to the total volume of the porous body. This is also the total void volume fraction
of the material and the sum of open and closed porosity. Bulk density is the quotient of
the mass and total volume of the body. This can be considered as an average of the density
of solid and gas present in the pores taking care of the presence of both open and closed
pores. The skeleton density is obtained dividing the mass of the samples by the skeleton
volume of the sample. In other words, skeleton density accounts the effects of only open
pores present in the sample. Solid density is determined dividing the mass of the sample
by its solid volume [89]. To determine the solid density, samples were crushed to make
powders so that there is no presence of voids inside it anymore and the solid volume was
36

Figure 3.12: Cylindrical samples along the height of rubber–foam composites for charac-
terization
obtained.
The principle of buoyancy was used for the measurement of densities and porosities
with the help of a density measurement kit (Sartorius Inc., Bohemia, NY). First, the dry
samples were weighed in air and this was recorded asm1. Then the samples were immersed
in water for twenty-four hours in a vacuum infiltration chamber. This process evacuates all
the air from open pores and fills them with the saturation liquid (water). The saturated
samples were then weighed while immersed to determine the apparent mass m2 using the
density measurement set up. Finally, saturated samples were wiped to remove surface
water and weighed in air to determine the saturation mass, m3. This was done quickly to
minimize any loss of mass due to evaporation of the saturation liquid (water). The density
of the saturation liquid, ρfl, was recorded at the particular temperature. Figures 3.13 and
3.14 show the density determination kit and the vacuum infiltration chamber used in this
present study. After all these measurements, the bulk density ρb, the skeleton density, ρsk,
37

(a) Determination of sample mass in water (b) Determination of wet sample mass
Figure 3.13: Determination of physical properties by density determination set up
and the open porosity, πa, were determined using the following equations, respectively [89],
ρb =m1
m3 −m2
× ρfl (3.1)
ρsk =m1
m1 −m2
× ρfl (3.2)
πa =m3 −m1
m3 −m2
× 100 (3.3)
where, ρb is the bulk density (g/cm3), ρsk is the skeleton density (g/cm3), ρfl is the density
of fluid (g/cm3), and πa is the open Porosity (in %).
The solid density and corresponding closed cell porosity of all the specimens were
determined using a helium pycnometer (Ultrapycnometer 1000, Quantachrome Inc, Boyn-
ton Beach, FL), shown in Fig. 3.15. Samples were crushed using liquid nitrogen inside a
grinder to make powders. This would ensure the removal of all pores from the samples.
38

Figure 3.14: Vacuum infiltration chamber set up used in the present study
The powders were then placed inside helium gas chamber of the pycnometer with an input
of dry weight of the samples. Five runs were taken for each individual samples using the
pulse mode of gas flow. The pycnometer provided the solid volume and solid density of
the samples as outputs. From the solid density, closed cell contents of the samples were
determined as,
πt =ρt − ρbρt
× 100 (3.4)
πf = πt − πa (3.5)
where, ρt is the solid density (g/cm3), πt is the apparent or total porosity (in %), and πf is
the closed porosity (in %).
Compressive Properties
Compressive properties of the foam-rubber composites were determined using cylindrical
samples as per ASTM C-365/C-365M [90]. Uniaxial compression tests were performed
using a 30 KN cell in a screw-driven test frame (Instron Model no. 5567, Norwood, MA)
at a cross-head displacement rate of 0.5 mm/min, as shown in Fig. 3.16. The ultimate
39

Figure 3.15: Helium ultrapycnometer 1000 used in the present study
flatwise compressive strength was determined using,
F fcuz = Pmax/A (3.6)
where, F fcuz is the ultimate flatwise compressive strength, Pmax is the ultimate force prior
to failure, and A is the cross sectional area [90].
Flatwise compressive chord modulus was also determined following the same ASTM
standard as,
Efcz =
P0.003 − P0.001
δ0.003 − δ0.001× t
A(3.7)
where, Efcz is the flatwise compressive modulus, P0.003 is the applied force corresponding
to δ0.003, P0.001 is the applied force corresponding to δ0.001, δ0.003 is the recorded deflection
value such that δ/t is closest to 0.003, and δ0.001 is the recorded deflection value such that
δ/t is closest to 0.001 [90]. This formula for determining the compressive modulus is set up
such that it accounts for the compliance correction part of the experiment. This is because
40

Figure 3.16: Foam–rubber specimens subjected to compression test following ASTM
C365/C365M
all typical force versus displacement curves consist of a toe region, which is not a property
of the material but is caused by a take-up of slack and alignment of seating of the specimen.
Hence, a proper positioning of zero point on the displacement axis is always difficult. To
get correct compressive modulus values, this artifact has to be compensated so that it gives
the corrected zero point on the displacement axis [90].
Fig. 3.17 shows typical force versus displacement curve of a material having Hookean
(linear) region (region CD), for example as for polyurethane foam. For actual measurement
of modulus values, this linear region should be extended through the zero-force axis. The
intersection point thus obtained (B), is the actual or corrected zero displacement point (δ =
0.000) from which the displacements should be measured. For a valid test, it is required
that point B fall below δ0.001 [90].
Flexural Properties
Flexural properties were determined according to ASTM D790 [91] with a load rate of 6
mm/min using three point bending. When composites are tested in flexure, as a simply
supported beam loaded in middle point, the maximum stress at the outer surface of the test
41

Figure 3.17: Force versus displacement curve of a material with Hookean region, adapted
from ASTM standard C365 [90]
specimen acts at the mid point. This stress is calculated for any point on the load deflection
curve using
σ =3PL
2wt2(3.8)
where, σ is the stress in the outer fibers at mid-point and considered as the flexural strength,
P is the load at a given point on the load-deflection curve, L is the Support span, w is the
width of specimen tested, and t is the depth of specimen tested [91, 92].
The tangent modulus of elasticity, or the modulus of elasticity, is the ratio of stress
to corresponding strain within elastic limit. It was measured by drawing a tangent to the
steepest initial straight-line portion of the load-deflection curve [91], and calculated as,
τ =L3m
4wt3(3.9)
where, m is the stiffness of the load deflection curve in the linear elastic region calcu-
lated by diving the maximum load achieved to the corresponding deflection. All rubber-
polyurethane foam composite specimens had a specimen length, l of 200 mm, width, w of
42

Figure 3.18: The notations for specimen dimensions and 3-point bending test configuration
[92].
62.5 mm, span length, L of 150 mm, and average sample thickness, t of 25 mm.
Figure 3.19: Failure of composite specimens subjected to 3 point bending test
Like the load-deflection curve, a typical stress–strain curve consists of a toe region,
which is not a property of the material. This was corrected as before [91].
Scanning electron microscopy (SEM)
Scanning electron microscopy studies were performed on selected samples to characterize
the cell size, failure of rubber particles, fractured surface topology, and interfacial char-
acteristics between rubber particles and polyurethane matrix. Fractured surfaces of the
43

bending specimens were managed using a Hitachi Scanning Electron microscope (Hitachi,
Model No: S-4800, Dallas, Texas). Before the observation, all the surfaces were gold
coated having a depth of 70 nanometer.
44

CHAPTER 4
RESULTS AND DISCUSSION
X-Ray Fluorescence Data
Fig. 4.1 shows the X-ray fluorescence data collected on crumb rubber. From the radiation
spectra, a rich content of Zn2+ and Br- ions was seen in the virgin crumb rubber sample, as
shown in Fig. 4.1. This was utilized in selecting the two surfactants. The presence of strong
electropositive sodium ions in Darvan has initiated the use of this particular surfactant as
sodium ions can form strong bonds with highly electronegative bromin ions present in the
as-received rubber particles. Similarly, the presence of highly electronegative chlorine ions
has initiated the use of surfactant Vycar as these ions are supposed to form strong bonds
with strong electropositive zinc ions present in the rubber particles.
Density and Porosity as Functions of Crumb Rubber and Surfactant Content
The first step was to determine the role of surfactant on the foaming process. Fig. 4.2
shows the variation of bulk density of polyurethane foam as a function of Darvan and Vycar
content. These samples were prepared without the incorporation of crumb rubber. The total
amount of polyurethane was kept constant at 200 ml (100 ml of Part A and 100 ml of Part
B). Four different amounts of both kinds of surfactants, namely 0.025 g, 0.05 g, 0.075 g
and 0.1 g (0.1% by weight of rubber particles utilized in other samples) were used. The
variation of bulk density was measured as a function of surfactant volume fraction, which
was obtained dividing the volume of these surfactants by the solid volume of polyurethane
and surfactant.
With an increase in surfactant content, a reduction in bulk density was observed for
45

Figure 4.1: XRF analysis for the virgin crumb rubber samples
Figure 4.2: Effect of surfactants on the bulk density of polyurethane matrix system without
rubber
46

both Darvan and Vycar, as expected. The addition of surfactant enhances foaming process
by reducing the surface tension between individual cells. Surfactants promote improved
blowing efficiency by helping the foam ability to create nuclei and also participate in stabi-
lizing the foam. Similar results have been published by Krupers et al. [17] who reported an
increase of average foam height by the addition of a fluorosurfactant. Lim et al. [64] also
reported similar results where foam density decreased asymptotically with the addition of
silicon surfactant B8404 in rigid polyurethane foam system.
Figure 4.3 shows the variation of open porosity of polyurethane foam as a function of
Darvan and Vycar content. With an increase in surfactant content, a reduction in open
porosity was observed for both the surfactants. The addition of surfactant reduced the sur-
face tension between individual cell, promoted enhanced foaming of the system, and helped
in stabilizing the foam matrix system to prevent possible collapsing and surface defects.
The increased stability resulted in a reduced amount of open pores in the polyurethane
foam system.
Figure 4.3: Effect of surfactants on the open porosity of polyurethane matrix system with-
out rubber
47

Figure 4.4 shows the variation of closed porosity of polyurethane foam as a function
of surfactant content. An increasing trend of closed porosity was seen with an increasing
content of surfactant. As discussed earlier, surfactants reduce the surface tension among the
particles and promote foaming process. In other words, they increase the blowing efficiency
of the foam. In addition, they increase foam stability. Both these factors contributed to
increased closed porosity.
Figure 4.4: Effect of surfactants on the closed porosity of polyurethane matrix system
without rubber
Figure 4.5 shows the effect of two surfactants, Darvan and Vycar, on the skeleton den-
sity of polyurethane foam. Skeleton density accounts for the presence of open pores, but
not the closed pores. With an increase in surfactant content, a reduction in skeleton density
values occurred for both kinds of surfactants. The decrease of open porosity along with
a simultaneous increase in closed porosity with an increasing surfactant content led to a
lower skeleton density.
The presence of particles is also known to affect the foaming process. Figure 4.6 shows
the effect of crumb rubber particles on the bulk density of polyurethane foam system with-
48

Figure 4.5: Effect of surfactants on the skeleton density of the polyurethane matrix system
without rubber
out the presence of surfactants. The most general observation was the increase in bulk
density with an increasing rubber content. This was due to the increase of the overall mass
of the composite samples along with high content of rubber. The bulk density was not
very uniform, as a function of normalized elevation, at the bottom portion of the samples.
Nonetheless a uniform trend of bulk density was seen for all the samples, irrespective of
the quantity of rubber, at a y/h value more than 0.5, i.e. the bulk density is much more
uniform at the top portion of the samples.
In general, for all specimens, the bulk density got increased with height. This means
that foam pushed the rubber particles up and there was not much gravitational effect present
due to the weight of rubber particles.
Figure 4.7 shows the effect of crumb rubber on the skeleton density of polyurethane
foam system without the presence of surfactants. In general, an increasing trend in skeleton
density was seen with higher content of rubber. Again, a more uniform and increasing trend
of skeleton density could be seen for all the samples, irrespective of the quantity of rubber,
49

Figure 4.6: Effect of crumb rubber particles on bulk density of polyurethane foam system
at a y/h value more than 0.5. This indicated the presence of significant and uniform amount
of open pores towards the foaming direction (i.e. towards the top of the sample). This is
understandable as open pores increases with decreasing depth [93]. The equation relating
the open porosity and depth was formulated by Athy in 1930 and given as, φ(z) = φoe−kz,
where, φo is the surface open porosity, k is the compaction coefficient and z is depth.
Figure 4.8 shows the variation of closed porosity inside the rubber-polyurethane foam
composite system, without the presence of surfactant, as a function of normalized elevation.
An increasing trend of closed porosity was observed for samples having rubber particles
starting from 9 weight % up to 24 weight %. But closed porosity got reduced for samples
having 100 g rubber. Probably, the addition of 30 weight % of rubber particles was exces-
sive for this particular polyurethane matrix blend system. Consequently, the polyurethane
could not wet the entire amount of rubber particles and some parts remained in agglomer-
ated form. Thus, these particles did not participate in reinforcing the system. Rather, they
promoted cell rupture, and decreased closed porosity.
Figure 4.9 shows the effect of rubber particles on the open porosity distribution of
50
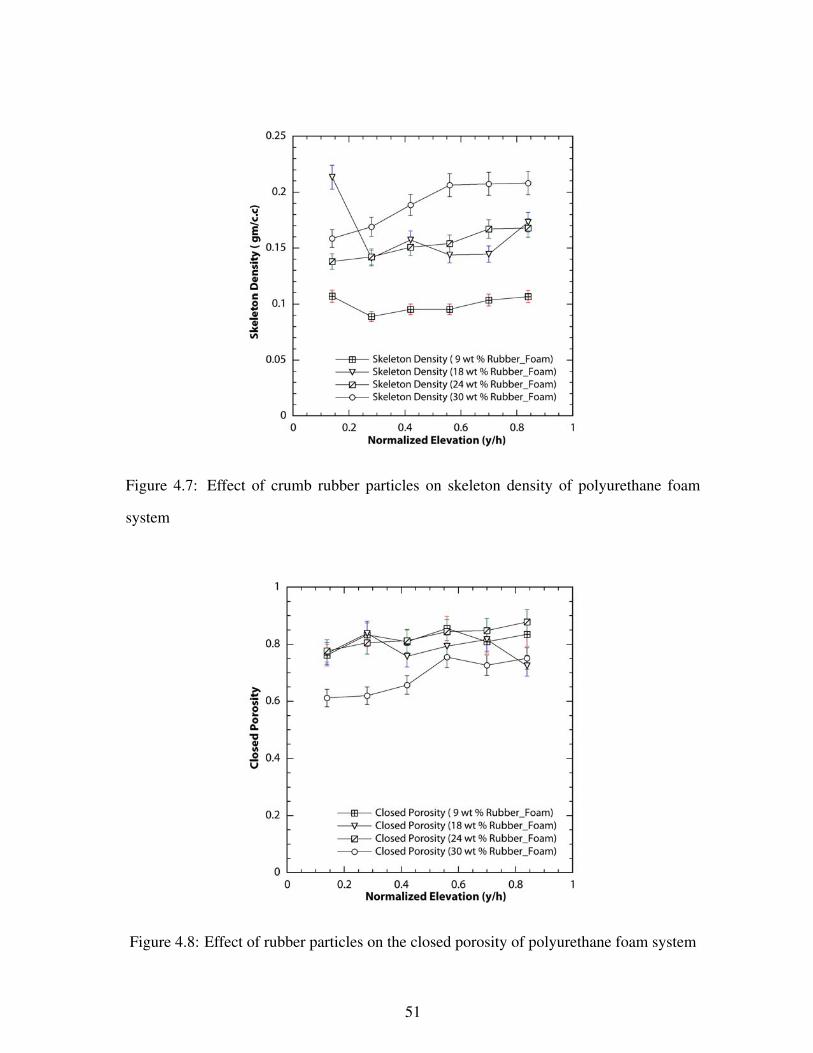
Figure 4.7: Effect of crumb rubber particles on skeleton density of polyurethane foam
system
Figure 4.8: Effect of rubber particles on the closed porosity of polyurethane foam system
51
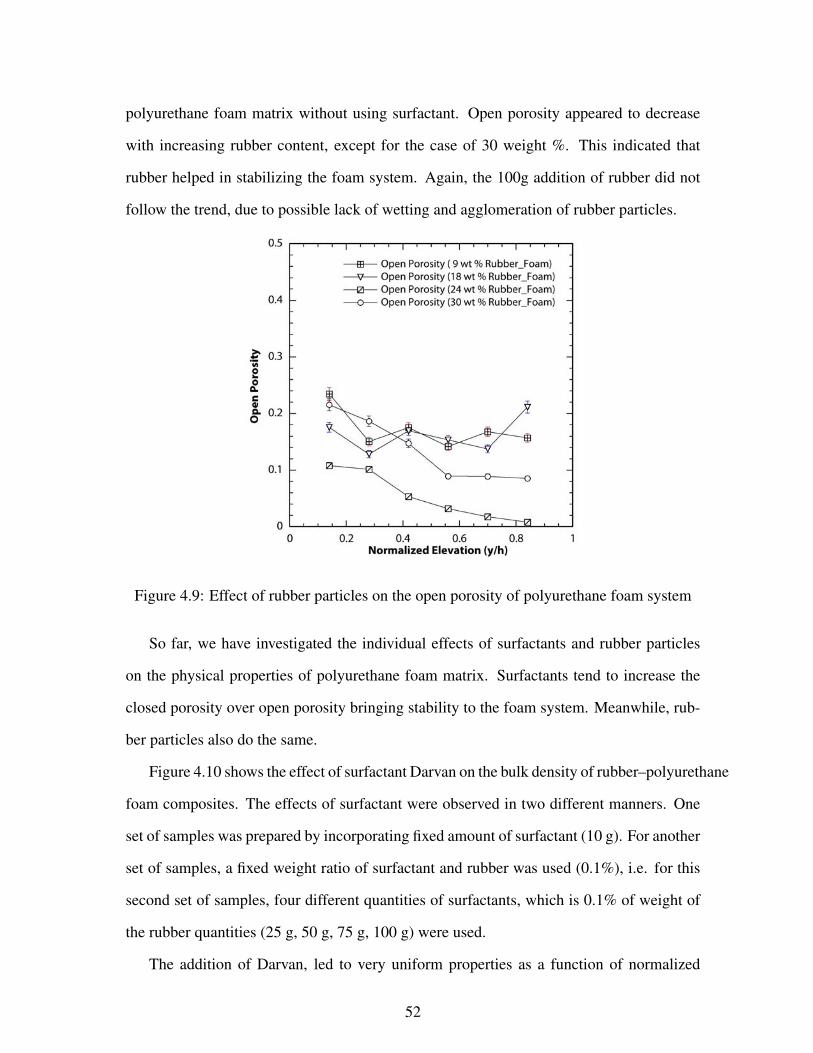
polyurethane foam matrix without using surfactant. Open porosity appeared to decrease
with increasing rubber content, except for the case of 30 weight %. This indicated that
rubber helped in stabilizing the foam system. Again, the 100g addition of rubber did not
follow the trend, due to possible lack of wetting and agglomeration of rubber particles.
Figure 4.9: Effect of rubber particles on the open porosity of polyurethane foam system
So far, we have investigated the individual effects of surfactants and rubber particles
on the physical properties of polyurethane foam matrix. Surfactants tend to increase the
closed porosity over open porosity bringing stability to the foam system. Meanwhile, rub-
ber particles also do the same.
Figure 4.10 shows the effect of surfactant Darvan on the bulk density of rubber–polyurethane
foam composites. The effects of surfactant were observed in two different manners. One
set of samples was prepared by incorporating fixed amount of surfactant (10 g). For another
set of samples, a fixed weight ratio of surfactant and rubber was used (0.1%), i.e. for this
second set of samples, four different quantities of surfactants, which is 0.1% of weight of
the rubber quantities (25 g, 50 g, 75 g, 100 g) were used.
The addition of Darvan, led to very uniform properties as a function of normalized
52

(a) Samples having fixed quantity (10 g) of
surfactant Darvan
(b) Samples having fixed weight ratio
(0.1%) of surfactant to rubber
Figure 4.10: Effect of Darvan on the bulk density of rubber and polyurethane foam com-
posites
height, y/h. This implies that the surfactant dispersed the rubber particles uniformly along
the foaming direction. Hence, a much more uniform distribution of bulk density was
achieved. Another observation was the reduction in overall bulk density by the incorpo-
ration of surfactant in comparison to samples prepared without any surfactant. This result
is very much expected, as the addition of surfactants helps in enhancing the blowing ef-
ficiency and increased overall foaming. Introduction of different quantities of surfactant
Darvan reduced the bulk density. The samples with fixed quantity of Darvan showed lesser
bulk density than that of samples with fixed weight ratio of surfactant to rubber. This is
also in accordance to the same observation. Samples with fixed quantity of Darvan have
more weight of surfactant (10 g) in comparison to the other set of samples (Darvan quantity
varies from 0.025 to 0.1 g). Hence, they showed lesser values of bulk density.
Rubber and surfactant contents have completely opposite effects on the bulk density of
polyurethane foam. Rubber particles tend to increase the bulk density, meanwhile, surfac-
tants try to reduce it. But, when they are working together in a system, surfactants had a
greater effect on reducing the bulk density of the foam matrix system in spite of the pres-
53

ence of rubber. Also, it can be concluded that Darvan served the basic purpose of surfactant
as it had uniformly dispersed the rubber particles inside polyurethane network. In addition,
it helped in overall foaming process of polyurethane system in spite of the presence of rub-
ber. So, the selection of Darvan was appropriate for our rubber-polyurethane foam blend
composite system.
Figure 4.11 shows the effect of Darvan on the skeleton density of rubber–polyurethane
foam composites. Again, the use of surfactant Darvan led uniform distribution of skeleton
density as a function of normalized height, y/h. Once we increase the quantity of Darvan,
the skeleton density values got reduced, which was in agreement with the results showing
that more surfactant leads to greater closed porosity.
(a) Samples having fixed quantity (10 g) of
surfactant Darvan
(b) Samples having fixed weight ratio
(0.1%) of surfactant to rubber
Figure 4.11: Effect of Darvan on the skeleton density of rubber and polyurethane foam
composites
Figure 4.12 shows the effect of Darvan on the closed porosity of rubber-foam compos-
ites. Both kinds of samples with fixed quantity of Darvan as well as fixed ratio of Rubber to
Darvan showed an increase in closed porosity values starting from samples having 9 weight
% rubber up to 24 weight % of rubber. However, a reduction in closed porosity was seen
in samples having 30 weight % of rubber particles, probably due to agglomeration issues.
54
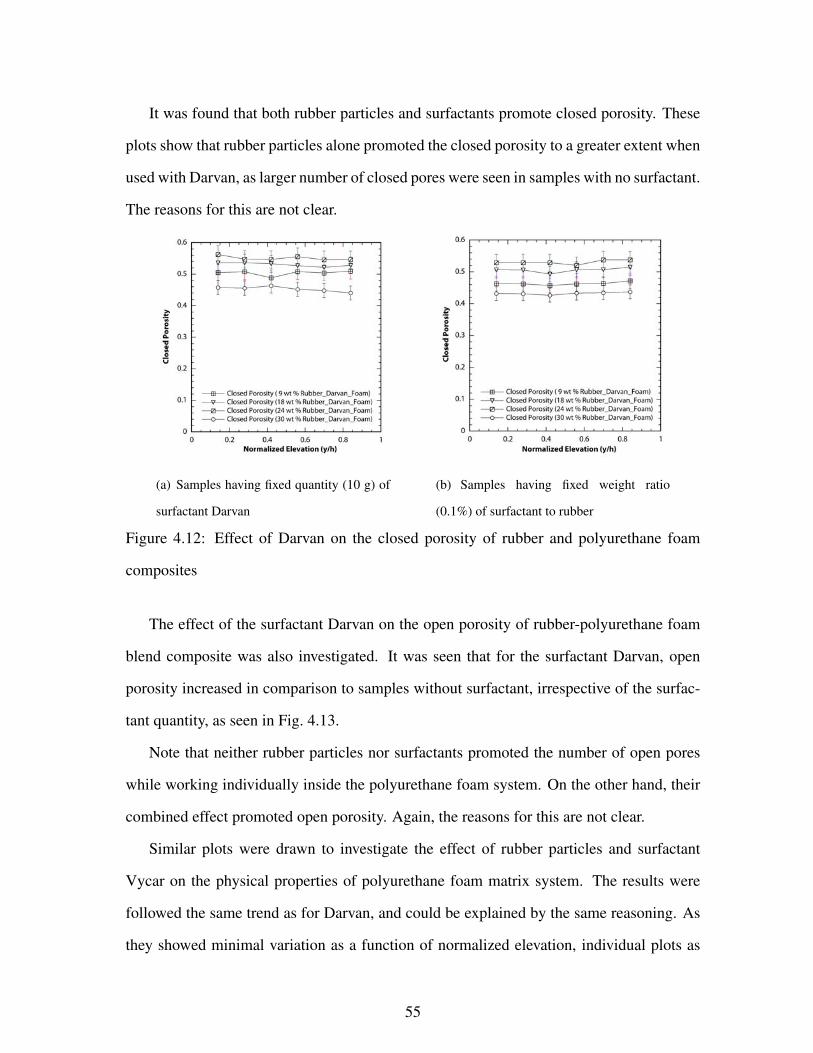
It was found that both rubber particles and surfactants promote closed porosity. These
plots show that rubber particles alone promoted the closed porosity to a greater extent when
used with Darvan, as larger number of closed pores were seen in samples with no surfactant.
The reasons for this are not clear.
(a) Samples having fixed quantity (10 g) of
surfactant Darvan
(b) Samples having fixed weight ratio
(0.1%) of surfactant to rubber
Figure 4.12: Effect of Darvan on the closed porosity of rubber and polyurethane foam
composites
The effect of the surfactant Darvan on the open porosity of rubber-polyurethane foam
blend composite was also investigated. It was seen that for the surfactant Darvan, open
porosity increased in comparison to samples without surfactant, irrespective of the surfac-
tant quantity, as seen in Fig. 4.13.
Note that neither rubber particles nor surfactants promoted the number of open pores
while working individually inside the polyurethane foam system. On the other hand, their
combined effect promoted open porosity. Again, the reasons for this are not clear.
Similar plots were drawn to investigate the effect of rubber particles and surfactant
Vycar on the physical properties of polyurethane foam matrix system. The results were
followed the same trend as for Darvan, and could be explained by the same reasoning. As
they showed minimal variation as a function of normalized elevation, individual plots as
55

(a) Samples having fixed quantity (10 g) of
surfactant Darvan
(b) Samples having fixed weight ratio
(0.1%) of surfactant to rubber
Figure 4.13: Effect of Darvan on the open porosity of rubber and polyurethane foam com-
posites
function of y/h are not shown here. Rather, the effects of rubber quantity on the physical
properties of polyurethane foam matrix are explained as follows.
(a) Samples having fixed quantity (10 g) of
surfactant Darvan
(b) Samples having fixed weight Ratio
(0.1%) of surfactant to rubber
Figure 4.14: Effect of rubber on the physical properties of polyurethane foam composites
Figure 4.14 shows the effect of different quantities of rubber particles on the various
physical properties of polyurethane foam matrix in the presence of surfactant Darvan. The
effects of rubber particles were observed on two different set of samples varied by surfac-
tant concentrations. It was seen that rubber particles affected the physical properties of
56
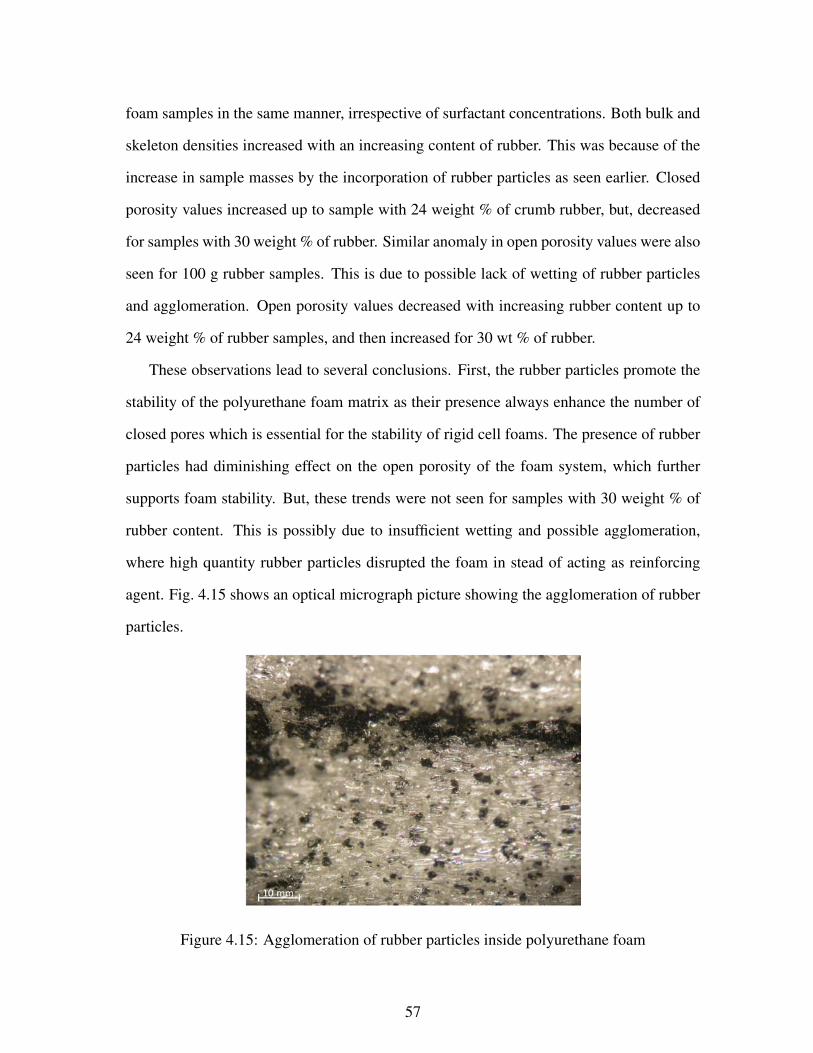
foam samples in the same manner, irrespective of surfactant concentrations. Both bulk and
skeleton densities increased with an increasing content of rubber. This was because of the
increase in sample masses by the incorporation of rubber particles as seen earlier. Closed
porosity values increased up to sample with 24 weight % of crumb rubber, but, decreased
for samples with 30 weight % of rubber. Similar anomaly in open porosity values were also
seen for 100 g rubber samples. This is due to possible lack of wetting of rubber particles
and agglomeration. Open porosity values decreased with increasing rubber content up to
24 weight % of rubber samples, and then increased for 30 wt % of rubber.
These observations lead to several conclusions. First, the rubber particles promote the
stability of the polyurethane foam matrix as their presence always enhance the number of
closed pores which is essential for the stability of rigid cell foams. The presence of rubber
particles had diminishing effect on the open porosity of the foam system, which further
supports foam stability. But, these trends were not seen for samples with 30 weight % of
rubber content. This is possibly due to insufficient wetting and possible agglomeration,
where high quantity rubber particles disrupted the foam in stead of acting as reinforcing
agent. Fig. 4.15 shows an optical micrograph picture showing the agglomeration of rubber
particles.
Figure 4.15: Agglomeration of rubber particles inside polyurethane foam
57

The effect of different rubber quantities on the physical properties of polyurethane foam
matrix were found to follow the same trend in the presence of surfactant Vycar. It was seen
that rubber particles helped in stabilizing the foam system and their behavior is independent
of the surfactant concentrations. The same anomaly was found in the porosity data for 30
weight % of rubber. Figure 4.16 shows the effect of rubber particles on polyurethane foam
system in the presence of the Vycar surfactant.
(a) Samples having fixed quantity (10 g) of
surfactant Vycar
(b) Samples having fixed weight ratio
(0.1%) of surfactant to rubber
Figure 4.16: Effect of rubber on the physical properties of polyurethane foam composites
The incorporation of both the surfactants Darvan and Vycar significantly affected the
microstructure of rubber-polyurethane foam composites, especially the porosity. Both
closed and open porosity were significantly changed by the introduction of surfactants into
the system. Fig. 4.17 shows the variation of the ratio of closed to open porosity as a func-
tion of normalized elevation for the rubber-foam composites made without the presence of
surfactant.
For samples having low rubber content (9 and 18 weight % of rubber), the variation
of open porosity was overall uniform. For samples having 30 weight % of rubber content,
both closed and porosity were varied in the same extent at the top portion of samples, i.e.
at an y/h value greater than 0.5. Out of all, samples having 24 weight % of rubber particles
showed an increasing trend of porosity ratio starting from the bottom up to the top. This
indicates that samples having 24 weight % rubber content have promoted the closed pores
58

Figure 4.17: Effect of rubber particles on the porosity ratio of polyurethane foam system
than open pores to a greater extent. It could be possible that 30 weight % of rubber would
have promoted this even further if agglomeration did not take place.
Figure 4.18 shows the effect of rubber particle content and surfactants on the porosity
ratio of crumb rubber-polyurethane foam composites. Here the porosity data is average
across the normalized height, y/h, because there was no variation along this direction.
Samples with fixed quantity of Darvan, i.e. higher quantity of surfactant, showed lower
porosity ratio than that with fixed ratio of surfactant. This also concluded that Darvan
promoted open porosity more than that of closed porosity. The relative variation of pores
had been most significant in samples with 24 weight % of rubber particles as reinforcing
agent. In other samples, the porosity ratio was affected by the rubber and surfactant content.
Recall that both of these tended to increase closed porosity while decreasing open porosity.
The porosity ratio increase all the way upto a rubber content of 24 weight %. It might have
increased further for 30 weight % rubber if not for agglomerated issues.
However, the effects of Vycar on the porosity ratio of crumb rubber-polyurethane foam
59
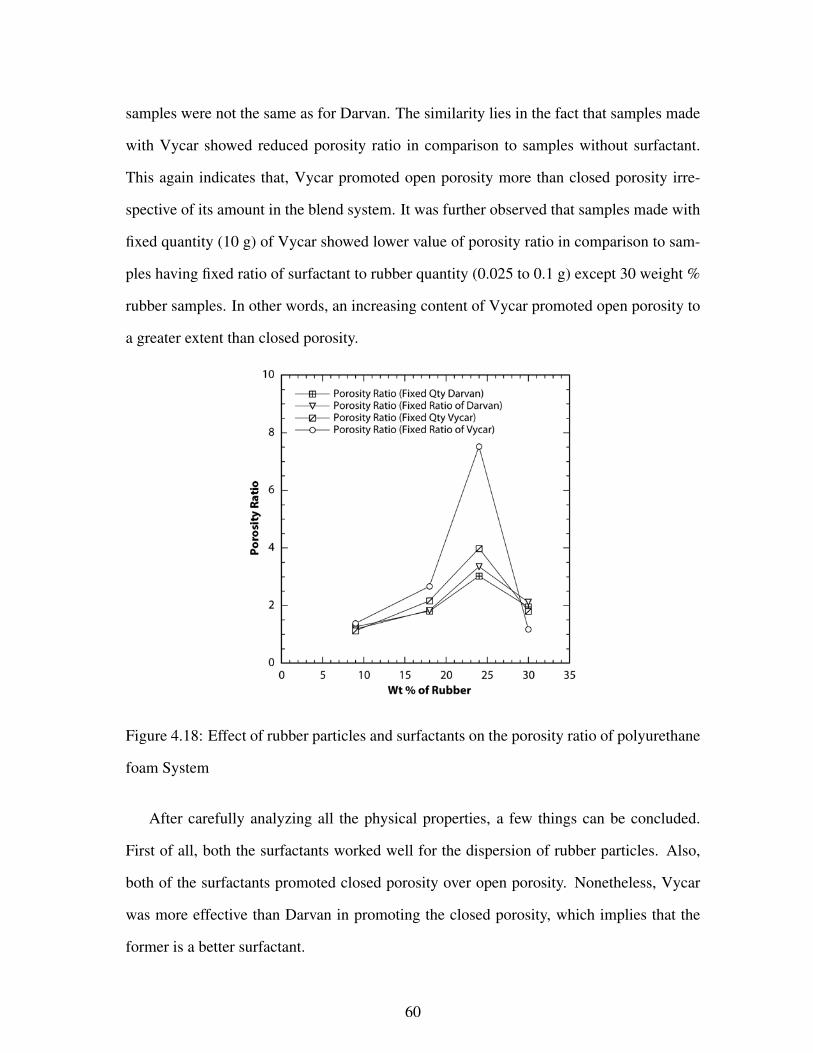
samples were not the same as for Darvan. The similarity lies in the fact that samples made
with Vycar showed reduced porosity ratio in comparison to samples without surfactant.
This again indicates that, Vycar promoted open porosity more than closed porosity irre-
spective of its amount in the blend system. It was further observed that samples made with
fixed quantity (10 g) of Vycar showed lower value of porosity ratio in comparison to sam-
ples having fixed ratio of surfactant to rubber quantity (0.025 to 0.1 g) except 30 weight %
rubber samples. In other words, an increasing content of Vycar promoted open porosity to
a greater extent than closed porosity.
Figure 4.18: Effect of rubber particles and surfactants on the porosity ratio of polyurethane
foam System
After carefully analyzing all the physical properties, a few things can be concluded.
First of all, both the surfactants worked well for the dispersion of rubber particles. Also,
both of the surfactants promoted closed porosity over open porosity. Nonetheless, Vycar
was more effective than Darvan in promoting the closed porosity, which implies that the
former is a better surfactant.
60
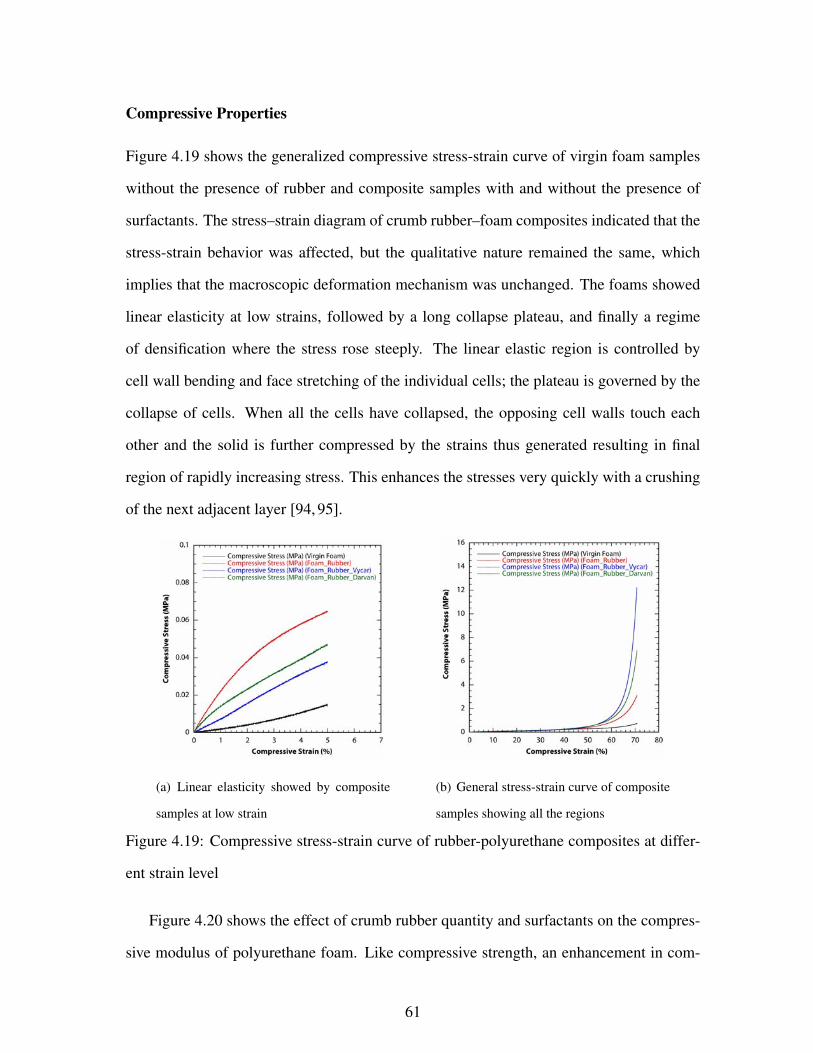
Compressive Properties
Figure 4.19 shows the generalized compressive stress-strain curve of virgin foam samples
without the presence of rubber and composite samples with and without the presence of
surfactants. The stress–strain diagram of crumb rubber–foam composites indicated that the
stress-strain behavior was affected, but the qualitative nature remained the same, which
implies that the macroscopic deformation mechanism was unchanged. The foams showed
linear elasticity at low strains, followed by a long collapse plateau, and finally a regime
of densification where the stress rose steeply. The linear elastic region is controlled by
cell wall bending and face stretching of the individual cells; the plateau is governed by the
collapse of cells. When all the cells have collapsed, the opposing cell walls touch each
other and the solid is further compressed by the strains thus generated resulting in final
region of rapidly increasing stress. This enhances the stresses very quickly with a crushing
of the next adjacent layer [94, 95].
(a) Linear elasticity showed by composite
samples at low strain
(b) General stress-strain curve of composite
samples showing all the regions
Figure 4.19: Compressive stress-strain curve of rubber-polyurethane composites at differ-
ent strain level
Figure 4.20 shows the effect of crumb rubber quantity and surfactants on the compres-
sive modulus of polyurethane foam. Like compressive strength, an enhancement in com-
61

pressive modulus was seen with increasing content of crumb rubber. This was expected
because of the introduction of the stiffer rubber content into much softer polyurethane ma-
trix. The presence of higher closed porosity was another reason behind the increase of
compressive modulus. Closed pores entrap gases in polyurethane foams. Samples with
more closed pores have greater quantity of entrapped gases, which produce higher resis-
tance towards cell wall buckling. This contributes to increased compressive modulus.
(a) Samples with fixed surfactant quantity
(10 g)
(b) Samples having fixed weight ratio
(0.1%) of surfactant to rubber
Figure 4.20: Compressive modulus of rubber-foam composites
In general compressive modulus was higher with the addition of only rubber without
surfactants. This cannot be explained in a simple manner, as it was shown earlier that sur-
factants stabilize the foam and should lead to greater compressive modulus. The highest
compressive modulus was found for a fixed surfactant quantity of Vycar. This fixed quan-
tity of surfactant is more close to its CMC values. On the other hand, for samples with
fixed surfactant ratio (0.1%), Darvan acted in a better way as 0.1% is the CMC value for
Darvan.
Figure 4.21 shows the variation of solid compressive strength of rubber-foam compos-
ites as a function of rubber and surfactant content.
The addition of rubber increased the compressive strength for all values except for
62

(a) Samples with fixed surfactant quantity
(10 g)
(b) Samples having fixed weight ratio
(0.1%) of surfactant to rubber
Figure 4.21: Compressive strength of rubber-foam composites
samples having 30 weight % of rubber. The latter had agglomeration and poor wetting of
rubber particles. The increase in strength, for 9–24 weight % case was probably due to an
increase in closed porosity and due to rubber acting as a reinforcing agent. In this case, both
surfactants, especially fixed quantity of Vycar lead to further increase in strength, perhaps
by promoting closed porosity over open porosity.
Flexure Properties
This section discusses the effects of rubber quantity and different concentrations of surfac-
tants on the flexural properties of polyurethane foam.
Figure 4.22 shows the load-deflection curve of rubber-foam specimens subjected to
three point bending. The stress-strain response was qualitatively same for all the cases.
Figure 4.23 shows the flexural modulus of different crumb rubber–polyurethane foam
blend composites, where an increasing trend in flexural modulus was seen with increasing
rubber content. For the samples made with fixed surfactant ratio with rubber, an increasing
trend was observed from samples up to 24 weight % of rubber and not for 30 weight %
of rubber. This is probably because of the variation of closed porosity. We observed an
63

Figure 4.22: Load-deflection curve of rubber-foam composites
increasing trend in closed porosity from 9 up to 24 weight % of rubber and then a reduction
for samples having 30 weight % of rubber because of agglomeration issues. Darvan acted
better in this case as it is working in its CMC. For samples having fixed surfactant quantity,
flexural modulus increased with increasing rubber content.
Figure 4.24 shows the effect of different quantity of rubber particles and surfactants
on the flexural strength of polyurethane foam matrix system. Neither the presence of rub-
ber nor the surfactants seemed to have played an important role in enhancing the flexural
strength of the foam-rubber composites samples as virgin foam samples showed pretty high
flexural strength in comparison to other samples having rubber crumb. Flexural strength
depends mostly on the proper bonding between reinforcing agent and the matrix in a het-
erogeneous composite system. It is very evident that, though surfactants helped in uniform
dispersion of rubber particles all over the polyurethane matrix, it did not promote the strong
bonding between rubber particles and polyurethane matrix. Or, strong bonding did occur
and the stiffer rubber particles acted as stress concentration points. Because, rubber parti-
cles are much stiffer than polyurethane.
64

(a) Samples with fixed surfactant quantity
(10 g)
(b) Samples having fixed weight ratio
(0.1%) of surfactant to rubber
Figure 4.23: Flexural modulus of rubber-foam composites
(a) Samples with fixed surfactant quantity
(10 g)
(b) Samples having fixed weight ratio
(0.1%) of surfactant to rubber
Figure 4.24: Flexural strength of rubber-foam composites
65

The failure modes of rubber particles inside polyurethane matrix is an important factor
in analyzing the bending strength and moduli of rubber-polyurethane composites. Failures
initiated on the tension side of all the specimens and rubber particles were found to be torn
out from the polyurethane network. This cohesion would lead to a decrease in flexural
strength (but not compressive strength). Scanning electron microscopy images will be
furnished to show the tearing of particles.
Specific Properties
Specific strength and modulus values were calculated in order to assess the net effect of
adding crumb rubber to polyurethane foam.
(a) Samples with fixed surfactant quantity
(10 g)
(b) Samples having fixed weight ratio
(0.1%) of surfactant to rubber
Figure 4.25: Specific compressive strength of rubber-foam composites as a function of
rubber content
Figure 4.25 and 4.26 shows the effect of rubber particles and surfactant concentrations
on the specific compressive strength and modulus of the blend composite system, respec-
tively. In the absence of surfactants, increasing rubber content led to decreased compressive
strength. However, by the use of fixed surfactant quantity, this was offset, except for the 30
weight % case resulting in a decrease in specific strength. The use of surfactants at fixed
66

weight ratio did not result similar.
In samples having maximum rubber content, the variation in bulk density has been
much more promoted than that of compressive strength, which makes sense as we have
investigated the reduction in strength along with highest bulk density for samples with 100
g rubber content as a reinforcing agent. It is quite obvious that, an increasing surfactant
quantity would promote the compressive strength much more than the bulk density so as
to get higher values of specific compressive strength. This also makes sense as we know
that with an increasing content of surfactant, two things occur simultaneously. Firstly, sur-
face tension between individual cells reduces significantly which promotes more foaming
and a reduction in bulk density. At the same time, surfactant promotes closed porosity in
the cell structure. As discussed earlier, materials having more closed pores contain larger
amount of entrapped air, which offers an opposite force towards cell wall buckling and
an enhancement of compressive strength, i.e. increasing surfactant increases the numera-
tor factor and makes the denominator factor lesser in the parameter specific compressive
strength. Consequently, specific compressive strength increases.
(a) Samples with fixed surfactant quantity
(10 g)
(b) Samples having fixed weight ratio
(0.1%) of surfactant to rubber
Figure 4.26: Specific compressive modulus of rubber-foam composites as a function of
rubber content
67

The specific compressive moduli values of blend composites were found to follow an in-
creasing trend. Again Vycar, when used in fixed quantity, improved modulus even further.
Darvan was effective in only specific cases, and only for fixed weight ratio of surfactants.
This results indicate that surfactant effectiveness was controlled by concentration being
closer to the CMC value. Both the surfactants performed better at a concentration closer to
their respective CMC. Sample with fixed surfactant quantity showed this increasing trend
up to 30 weight % of rubber content, while the other set of samples showed a rising trend up
to samples having 18 weight % of rubber, which might be due to improper wetting of rubber
in polyurethane as well as non uniform dispersion of rubber particles inside polyurethane
foam by the application of respective surfactants concentration for higher rubber contents.
Hence, we can conclude that though, surfactants have helped in overall dispersion of rub-
ber particles, it did not promote strong bonding in between rubber and polyurethane. It
could be seen that introduction of rubber particles had promoted the increase in moduli to a
greater extent than that of bulk density. Increasing the content of rubber signifies the intro-
duction of more and more stiffness inside the composite system and accordingly modulus
increases significantly. To say a few words about the effect of surfactants, we can conclude
that both the surfactants worked better in comparison to other at a concentration closer to
their respective critical micelle concentration as expected. A higher quantity of surfactants
always had promoted the increase in compressive moduli to a greater extent than the bulk
density as seen from the samples with fixed quantity of surfactants as, they showed an in-
creasing trend with an increasing content of rubber, irrespective of the type of surfactants.
Same inference could not be drawn for samples made with a fixed ratio of rubber to sur-
factant as they showed optimum performance for samples with 50 g rubber content. This
again signifies that an optimum performance can be achieved by the proper combination of
rubber quantity and surfactant concentration as both have different effects on physical and
mechanical property in a system where more that one parameter changes simultaneously.
For both surfactant concentrations, we can see that up to 50 g of rubber, surfactants worked
68

in a better way in comparison to samples with no surfactant, but the trend got changed for
higher quantity of rubber. This might be because of the fact that at low volume fraction of
rubber, the amount of surfactant used in the system had been able to orient the reinforcing
rubber particles in a plane vertical to stress direction so that rubbers could exert their re-
inforcing ability. This orientation introduced strong interfacial strength and consequently
samples with surfactants showed better results. The overall effect of surfactants had been
good on the compressive moduli of composite system as it dispersed the rubber particles
uniformly and increased the effective surface area in between reinforcing agent and matrix.
This would enable improved adhesion between the two components of this heterogeneous
system and increasing moduli values could be seen.
(a) Samples with fixed surfactant quantity
(10 g)
(b) Samples having fixed weight ratio
(0.1%) of surfactant to rubber
Figure 4.27: Specific flexural strength of rubber-foam composites as a function of rubber
content
Figure 4.27 and 4.28 shows the effect of rubber particles and surfactant concentrations
on the specific flexural strength and modulus of blend composites, respectively. Both spe-
cific modulus and strength values were found to follow a diminishing trend in comparison
to virgin foam samples. While, a moderate decrease in specific modulus occurred, signif-
icant decrease in specific strength was observed. This happened possibly due to rubber
69

particle decohesion. It is very evident that, though surfactants helped in uniform dispersion
of rubber particles all over the polyurethane matrix, they did not promote strong bonding
between rubber particles and polyurethane matrix. Or, strong bonding might have occurred
and the stiffer rubber particles acted as stress concentration points resulting in a reduction
of specific flexural properties.
Because, rubber particles are much stiffer than polyurethane. We could see much more
reduced values of flexural strength in comparison to virgin foam samples without the pres-
ence of rubber as well as surfactants. Any specimen in flexure is subjected to two directly
opposite kind of loading phenomenon simultaneously. One part of it is subjected to ten-
sion, while the other part is subjected to compression. Flexural strength depends mostly on
the proper bonding between reinforcing agent and the matrix in a heterogeneous compos-
ite system. From the figure, it could be concluded that, even though surfactants helped in
uniform dispersion of rubber particles all over the polyurethane matrix, it did not promote
the bonding between rubber particles and polyurethane matrix. At the same time, rubber
particles are much stiffer that polyurethane. Effectively, we got a system where higher
stiffness particles were loosely bonded in a softer matrix material, especially in that part of
the specimen subjected to tension. This had adverse effects on the micromechanics of the
blend composites as, rubber particles had acted as a mean of creating defective sites inside
the composite materials because of decohesion in between rubber and polyurethane system
in stead of acting as a reinforcing agent. This is the reason behind a decreasing trend in
specific flexural strength irrespective of the concentrations of surfactants as bulk density
had been promoted to a much greater extent that that of flexural strength. Both the sur-
factants worked better closer to their critical micelle concentration while comparing their
performances relative to each other. The similar trend was obtained for the specific flexural
moduli values, which can be explained in the same way like strength. One important obser-
vation was the relative difference in specific flexural moduli value for samples with rubber
and surfactants in comparison to virgin foam samples. In comparison to specific flexural
70

strength properties, the difference in flexural moduli had been much less for these different
set of samples. This is because of the fact the effects of decohesion and debonding are
much more prominent on flexural strength rather than that of flexural modulus. That is the
reason why the difference had not been so much for the case of moduli values.
(a) Samples with fixed surfactant quantity
(10 g)
(b) Samples having fixed weight ratio
(0.1%) of surfactant to rubber
Figure 4.28: Specific flexural modulus of rubber-foam composites as a function of rubber
content
Comparison of Experimental Results With Other Models
The experimental observation of mechanical properties were compared to current existing
models for foams. Figure 4.29 shows the cubic cell model of a closed cell foam. When
foams are constructed from a liquid, surface tension draws the material into the cell edges
keeping across the faces of the cell and ruptures easily. The dimensions of the unit cell and
the thickness of the cell walls have significance impacts on the mechanical properties of
polymeric foams [94]. Though, the foam cells are initially closed, stiffness is calculated
from that of edges and moduli are similar to those of open cell foams. In some of the
polymeric closed cell foams, a fraction of solid is always in the cell faces, which contributes
to the cell faces. Some cellulosic materials have closed cells with thick cell faces. In that
case, moduli depend on density in slightly different manner [94].
71

Figure 4.29: Cubic cell model of a closed cell foam [94]
Mechanical properties of closed cell foams (basically any type of polyurethane foams)
depend heavily on the density of the materials. Therefore, several researchers have modeled
the relative elastic (compressive) modulus of closed cell foams as a function of relative
density. Relative elastic modulus is the ratio of elastic modulus of final foam or foam-
particles composites to the elastic modulus of virgin foam. Similarly, relative density is
the ratio of the density of the final foam or foam–particles composites to the density of the
virgin foam material. This kind of study has been very helpful as it always helps in design
foam composites with controllable mechanical properties. One very popular model is the
Square Relationship Model, where the relative elastic modulus is considered as the square
of the relative density [55].
E∗
Es= (
ρ∗
ρs)2 (4.1)
Another popular model has been the Simple Bend Model. This model considers gas
cells as fillers of zero modulus and predicts that relative elastic modulus follows a linear
72
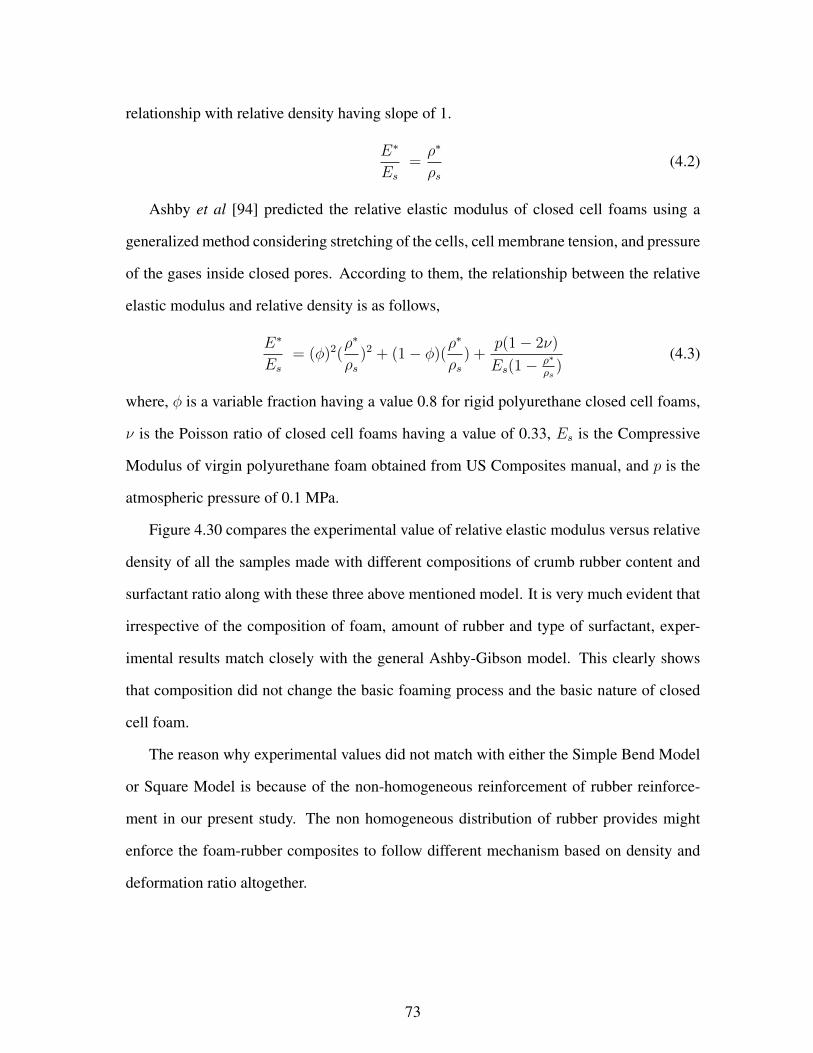
relationship with relative density having slope of 1.
E∗
Es=ρ∗
ρs(4.2)
Ashby et al [94] predicted the relative elastic modulus of closed cell foams using a
generalized method considering stretching of the cells, cell membrane tension, and pressure
of the gases inside closed pores. According to them, the relationship between the relative
elastic modulus and relative density is as follows,
E∗
Es= (φ)2(
ρ∗
ρs)2 + (1− φ)(
ρ∗
ρs) +
p(1− 2ν)
Es(1− ρ∗
ρs)
(4.3)
where, φ is a variable fraction having a value 0.8 for rigid polyurethane closed cell foams,
ν is the Poisson ratio of closed cell foams having a value of 0.33, Es is the Compressive
Modulus of virgin polyurethane foam obtained from US Composites manual, and p is the
atmospheric pressure of 0.1 MPa.
Figure 4.30 compares the experimental value of relative elastic modulus versus relative
density of all the samples made with different compositions of crumb rubber content and
surfactant ratio along with these three above mentioned model. It is very much evident that
irrespective of the composition of foam, amount of rubber and type of surfactant, exper-
imental results match closely with the general Ashby-Gibson model. This clearly shows
that composition did not change the basic foaming process and the basic nature of closed
cell foam.
The reason why experimental values did not match with either the Simple Bend Model
or Square Model is because of the non-homogeneous reinforcement of rubber reinforce-
ment in our present study. The non homogeneous distribution of rubber provides might
enforce the foam-rubber composites to follow different mechanism based on density and
deformation ratio altogether.
73

Figure 4.30: Comparison of experimental relative elastic modulus with different models
SEM Images
Possible tearing of rubber particles inside the rubber-polyurethane foam composite samples
could be a deciding factor in determining the flexural strength and moduli. Figures 4.31
and 4.32 show the SEM images of the fractured surfaces from flexural experiments. They
showed the presence of rubber particles tearing inside the samples.
Figure 4.33 shows the SEM images of fractured surfaces of composite samples used
for flexural testing. Though, high quantity of rubber particles had created a possibility of
the presence of great amount of rubber particles used in any fracture plane for the purpose
of crack bridging, as seen in the figure, materials were not free from defects as particle
decohesion was observed in microscopy images.
These defects might have come into the specimens because of two possible mechanisms
acting differently or simultaneously. Firstly, the presence of excess rubber particles inside
the foam samples might have allowed them to come closer to each other. The particles in-
74

(a) Teared rubber particles inside blend
composites
(b) Debonding of rubber particles by tearing
failure
Figure 4.31: SEM images showing tearing of rubber particles in the tension side of test
specimens
(a) Rubber particles creating defects inside
composite specimens
(b) Microcracks generated inside composite
samples by the poor bonding between rubber
and foam
Figure 4.32: SEM images showing defects inside blend composites with highest rubber
content
75

(a) Crack in surfaces made with Vycar (b) Other defects in samples made with Vy-
car
(c) Crack in surfaces made with Darvan
Figure 4.33: SEM images of fractured surfaces of composite samples with 30 weight % of
rubber
teracted and got ruptured introducing flaws inside the specimens. Another reasoning might
be the poor bonding between high stiffness rubber particles and soft polyurethane foam
matrix. The loosely bonded rubber particles, especially in the tensile side of the specimens
than compressive side had made the specimens defective in terms of crack propagation
rather than acting as a reinforcing agent because of decohesion in between two heteroge-
neous component system. The SEM pictures showing the teared rubber particles inside
polyurethane foam supported this fact further.
76

FTIR Spectra
Preliminary FTIR was conducted to investigate chemical reactions due to the introduction
of surfactants in the rubber-polyurethane foam system. Figure 4.34 shows the FTIR spec-
tra of the surfactant Darvan along with the blend composites made with Darvan. The large
peak at a wave number in between 3000 cm−1 and 4000 cm−1, for the surfactant is due
to the presence of hydroxyl groups in form of water in Darvan. Urethane linkages consist
of bonding of N-H or C=O groups. These groups are neither isolated nor free in the con-
densed state but stay in a large combination of polar and non polar groups. A rule of thumb
indicates the position of intermolecular chains of hydrogen bonds to be normal to the poly-
mer chains. At a shoulder near wave number of 1725 cm−1, some carbonyl stretching was
seen. This might be the result of strong hydrogen bond formation in between the carbonyl
group present in Part A of the polyurethane foam system along with the hydrogen atom of
surfactant Darvan. Similar peaks were identified by Coleman et al. [96] to be a result of
carbonyl group stretching due to hydrogen bond formation in between polyurethane and
ether interaction. This hydrogen bonding indicates that the surfactants had a good inter-
action with the polyurethane system. The formation of intermolecular hydrogen bonding
can make a material stronger. FTIR spectra of Vycar treated samples also showed similar
possibility.
77

Figure 4.34: FTIR spectra of only Darvan and blend composites made with Darvan
Figure 4.35: FTIR spectra of only Vycar and blend composites made with Vycar
78

CHAPTER 5
CONCLUSIONS AND FUTURE WORK
On the basis of experimental results obtained, a few conclusions can be drawn. It is very
clear that addition of rubber particles significantly affected the microstructure as well as the
mechanical properties of the blend composite system. The addition of rubber particles did
not affect the basic foaming process of polyurethane matrix system though, it led to greater
bulk density than that for virgin foam. Compressive properties were greatly enhanced by
the incorporation of rubber particles, as seen from the experimental results. At the same
time, reduction in flexural properties occured. This was due to lack of bonding between
high stiffness rubber particles and soft polyurethane matrix.
Application of surfactants was another major aspect of this present work. Consequently,
the effect of surfactants on the microstructure and mechanical properties of the blend com-
posites was also investigated. On the basis of experimental results, it can be concluded
that both the surfactants used in this study were effective. They helped in dispersing the
rubber particles uniformly inside the polyurethane matrix system in a much better way as
compared to samples made without surfactants. In addition, both the surfactants helped re-
ducing the total porosity of the system and promoted the generation of closed pores. Both
surfactants showed better performance at concentrations closer to their critical micelle con-
centration. In spite of all these advantages, the surfactant did not help much in the bonding
between rubber particles and polyurethane matrix. Though, the compressive properties
were not affected much, as they were dependent on some other parameters, the flexure
properties were significantly affected by this lack of bonding. Surface treated rubber–foam
79

samples showed better compressive strength in comparison to untreated rubber-foam sam-
ple. Surfactants seemed to have reacted well with polymeric rubber particles and strengthen
the cells, which, eventually delayed the collapse of the cells and raised the densification
strain resulting in an enhancement in the compressive strength. Last but not the list, was
the reduction of average cell size distribution by the application of surfactants which re-
sulted in the promotion of more open pores inside the system and not favorable for an ideal
closed cell foam. This made us believe that, though the blend composite system has been
benefited by the use of surfactants, both Darvan and Vycar can not be depicted as perfect
surfactant for our combination of crumb rubber and polyurethane foam, as they might tend
to change the nature of our foam matrix. This also concludes that knowledge of an optimum
combination of rubber and polyurethane foam quantity is very important for the maximum
performance of the particulate composite in this present study.
It has been clearly understood that microstructure of the present blend composite system
had a considerable impact on the mechanical properties. The basic nature of the particle
reinforced foam was carefully investigated in terms of mechanical properties and it was
seen to be the same as that for virgin closed cell foam irrespective of material composi-
tion. In general, both strength and modulus were seen to follow a linear relationship with
closed porosity content of composite samples except for very high percentage of rubber.
Materials having more closed pores possessed more gas pressure inside the pores, which
offered resistance to cell wall buckling, resulting an increase in both strength and modulus
values. Excess rubber particles inside the system introduced defects inside the composite
structure due to combined effect of stress concentration due to rigid rubber particles and
agglomeration.
There are a few things which can be addressed to further understand the micromechan-
ics of this rubber particle reinforced polyurethane foam system.
80

• The presence of both rubber particles and surfactant had a significant effect on the
properties of blend composite system, and there was a relationship between the
microstructure and property. While the incorporation of rubber particles directly
changed the physical as well as mechanical properties, the effects of surfactants were
more prominent on the interaction of particles in the heterogeneous material system
and change of morphology. Hence, the introduction of both rubber and surfactant
changed several parameters simultaneously inside the present material system and it
became complex to analyze any particular property as a function of single change in
parameter. For that, a detailed study is needed to understand the deformation mech-
anism of closed cell polyurethane foam. The multi scale nature of foam deformation
could be examined from individual struts to foam deformation to resolve this issue.
This needs a detailed understanding between the localization of individual struts and
deformation bands at the macro-scale. Digital Image Correlation (DIC) technique
can be very helpful in this connection, as it would provide continuous mapping of
strain fields along any cross section of foam sample.
• In this study, crumb rubber particles were of one particular size. The effect of dif-
ferent rubber particle sizes on the microstructure and mechanical properties of blend
composites could be a good study. It will also be interesting work to check the
effect of hydroxyl concentrations of polyol on the mechanical properties of rubber
polyurethane blend system.
• Since, this two part foam system consists of a blowing agent, it was not possible to
wash the surface of the rubber particles with a high volatile organic solvent in order
to coat the same to make an effective component. There were always the creation of
negative pressure gradient along the surfaces as carbon dioxide gas diffused through
the cell walls creating a much more brittle end product. A possible approach could
be to use some strong dispersing agent like xanthum gum.
81

• It would be good to focus on the thermal properties of composite system as well.
• FTIR is always an effective tool to characterize fiber-matrix surface chemistry to
study the changes. Although, significant changes were found in the FTIR spectra
between composite samples with surfactant and only surfactant, further analysis is
needed to understand the chemical interactions.
82

BIBLIOGRAPHY
[1] B. Adhikari, D. De, and S. Maiti, “Reclamation and recycling of waste rubber,”
Progress In Polymer Science, vol. 25, pp. 909–948, SEP 2000.
[2] R. Siddique and T. Naik, “Properties of concrete containing scrap-tire rubber - an
overview,” Waste Management, vol. 24, no. 6, pp. 563–569, 2004.
[3] P. Sukontasukkul and C. Chaikaew, “Properties of concrete pedestrian block mixed
with crumb rubber,” Construction and Building Materials, vol. 20, pp. 450–457, SEP
2006.
[4] S. G. C. From the Office of Mosquito Abatement Coordination, “Mosquitoes Disease
and Scrap Tires,” http://www.p2pays.org/ref/11/10504/html/biblio/htmls2/prh8.html.
[5] T. Amari, N. Themelis, and I. Wernick, “Resource recovery from used rubber tires,”
Resources Policy, vol. 25, pp. 179–188, SEP 1999.
[6] E. Ganjian, M. Khorami, and A. A. Maghsoudi, “Scrap-tyre-rubber replacement
for aggregate and filler in concrete,” Construction and Building Materials, vol. 23,
pp. 1828–1836, MAY 2009.
[7] A. R. Khaloo, M. Dehestani, and P. Rahmatabadi, “Mechanical properties of con-
crete containing a high volume of tire-rubber particles,” Waste Management, vol. 28,
pp. 2472–2482, DEC 2008.
[8] K. Fukumori, M. Matsushita, H. Okamoto, N. Sato, Y. Suzuki, and K. Takeuchi,
“Recycling technology of tire rubber,” JSAE Review, vol. 23, pp. 259–264, APR 2002.
83

[9] N. Sunthonpagasit and M. Duffey, “Scrap tires to crumb rubber: feasibility analysis
for processing facilities,” Resources Conservation and Recycling, vol. 40, pp. 281–
299, MAR 2004.
[10] F. Smith, E. Daniels, and A. Teotia, “Testing and Evaluating Commercial Applica-
tions of New Surface-Treated Rubber Technology Utilizing Waste Tires,” Resources
Conservation and Recycling, vol. 15, pp. 133–144, NOV 1995.
[11] A. Yilmaz and N. Degirmenci, “Possibility of using waste tire rubber and fly ash with
Portland cement as construction materials,” Waste Management, vol. 29, pp. 1541–
1546, MAY 2009.
[12] “The Many Uses of Crumb Rubber,” Waste Tire Recycling Program, Texas Natural
Resource Conservation Commission, 1999.
[13] “From the Official Website of Green Energy Industries,” http://gecorpusa.com.
[14] L. Schramm and D. Marangoni, “Surfactants: Fundamental and Application in PET
Industry,” Cambridge Unix Press, pp. 3–22, 2000.
[15] “From the Official Website of Vaibhav Rubbers Pvt Ltd,” http://product-
image.tradeindia.com.
[16] “From the Official Website of Google Inc,” http://en.wikipedia.org/wiki/polyurethane.
[17] M. Krupers, C. Bartelink, H. Grunhauer, and M. Moller, “Formation of rigid
polyurethane foams with semi-fluorinated diblock copolymeric surfactants,” Polymer,
vol. 39, pp. 2049–2053, MAY 1998.
[18] K. M. Zia, H. N. Bhatti, and I. A. Bhatti, “Methods for polyurethane and polyurethane
composites, recycling and recovery: A review,” Reactive & Functional Polymers,
vol. 67, pp. 675–692, AUG 2007.
84

[19] D. Allport, D. Gilbert, and S. Outterside, “MDI and TDI: Safety, Health and the
Environment: A Source Book and Practice Guide,” John Willey and Sons Ltd, 2003.
[20] T. N. Hunter, R. J. Pugh, G. V. Franks, and G. J. Jameson, “The role of particles in sta-
bilising foams and emulsions,” Advances in Colloid and Interface Science, vol. 137,
pp. 57–81, MAR 18 2008.
[21] R. Romine and M. Romine, “Rubbercycle: a bioprocess for surface modification of
waste tyre rubber,” Polymer Degradation and Stability, vol. 59, no. 1-3, Sp. Iss. SI,
pp. 353–358, 1998.
[22] M. K. Batayneh, I. Marie, and I. Asi, “Promoting the use of crumb rubber concrete in
developing countries,” Waste Management, vol. 28, pp. 2171–2176, NOV 2008.
[23] M. Bignozzi and F. Sandrolini, “Tyre rubber waste recycling in self-compacting con-
crete,” Cement and Concrete Research, vol. 36, pp. 735–739, APR 2006.
[24] H. Toutanji, “The use of rubber tire particles in concrete to replace mineral aggre-
gates,” Cement & Concrete Composites, vol. 18, no. 2, pp. 135–139, 1996.
[25] T.-C. Ling, H. M. Nor, and M. R. Hainin, “Properties of Crumb Rubber Concrete
Paving Blocks with SBR Latex,” Road Materials and Pavement Design, vol. 10,
pp. 213–222, JAN-MAR 2009.
[26] C. K. Akisetty, S.-J. Lee, and S. N. Amirkhanian, “High temperature properties of
rubberized binders containing warm asphalt additives,” Construction and Building
Materials, vol. 23, pp. 565–573, JAN 2009.
[27] S. H. Baek, H. H. Kim, Y. S. Doh, and K. W. Kim, “Estimation of high-temperature
properties of rubberized asphalt using chromatograph,” KSCE Journal Of Civil Engi-
neering, vol. 13, pp. 161–167, MAY 2009.
85

[28] J. E. Crespo, F. Parres, and A. Nadal, “Mechanical behavior analysis of sintered prod-
ucts of natural rubber crumb rubber (NRCR) using adhesives,” Material Wissenschaft
Und Werkstofftechnik, vol. 40, pp. 211–217, MAR 2009.
[29] S. G. Jahromi and A. Khodaii, “Empirical Model for Determining Rutting Parameter
in Rubber Modified Bitumen,” International Journal of Civil Engineering, vol. 6,
pp. 246–254, DEC 2008.
[30] S.-J. Lee, S. N. Amirkhanian, and B. J. Putman, “Characterization of Recycled Aged
RAP Binders Containing Crumb Rubber Modifier Using Gel Permeation Chromatog-
raphy,” Journal of Materials in Civil Engineering, vol. 21, pp. 382–391, AUG 2009.
[31] S.-J. Lee, S. N. Arnirkhanian, and S.-Z. Kwon, “The effects of compaction tempera-
ture on CRM mixtures made with the SGC and the Marshall compactor,” Construction
and Building Materials, vol. 22, pp. 1122–1128, JUN 2008.
[32] H. Li, H. Zhao, and K. Liao, “Study on the Technological Conditions of Crumb
Tire Rubber-Modified Bitumens,” Petroleum Science and Technology, vol. 27, no. 14,
pp. 1521–1533, 2009.
[33] S. Liu, W. Cao, J. Fang, and S. Shang, “Variance analysis and performance evalua-
tion of different crumb rubber modified (CRM) asphalt,” Construction and Building
Materials, vol. 23, pp. 2701–2708, JUL 2009.
[34] A. A. Mohamed, H. Omar, M. O. Hamzah, and H. Ismail, “Rheological Properties
of Crumb Rubber-Modified Bitumen Containing Antioxidant,” Arabian Journal for
Science and Engineering, vol. 34, pp. 3–12, APR 2009.
[35] K. M. Shatanawi, C. C. Thodesen, and S. N. Amirkhanjan, “Effects of crumb rubber
variability on failure temperature of Crumb Rubber Modified binders,” Road Materi-
als and Pavement Design, vol. 9, pp. 291–309, APR-JUN 2008.
86

[36] J. Shen, S. Amirkhanian, F. Xiao, and B. Tang, “Influence of surface area and size
of crumb rubber on high temperature properties of crumb rubber modified binders,”
Construction and Building Materials, vol. 23, pp. 304–310, JAN 2009.
[37] F. Xiao, S. N. Amirkhanian, J. Shen, and B. Putman, “Influences of crumb rubber size
and type on reclaimed asphalt pavement (RAP) mixtures,” Construction and Building
Materials, vol. 23, pp. 1028–1034, FEB 2009.
[38] Z. Tang, M. A. Butkus, and Y. F. Xie, “Enhanced performance of crumb rubber filtra-
tion for ballast water treatment,” Chemosphere, vol. 74, pp. 1396–1399, MAR 2009.
[39] J. Kim and S. Lee, “New Technology of Crumb Rubber Compounding for Recycling
of Waste Tires,” Journal of Applied Polymer Science, vol. 78, pp. 1573–1577, May 2
2000.
[40] N. Fattuhi and L. Clark, “Cement-based materials containing shredded scrap truck
tyre rubber,” Construction and Building Materials, vol. 10, pp. 229–236, JUN 1996.
[41] R. Fenner and K. Clarke, “Environmental and structural implications for the re-use of
tyres in fluvial and marine-construction projects,” Journal of the Chartered Institution
of Water and Environmental Management, vol. 17, pp. 99–105, MAY 2003.
[42] G. Li and M. John, “A crumb rubber modified syntactic foam,” Materials Science
and Engineering A-Structural Materials Properties Microstructure and Processing,
vol. 474, pp. 390–399, FEB 15 2008.
[43] J. Cawse and J. Stanford, “Rubber-Toughened Polyurethane Network and Composite-
Materials,” Polymer, vol. 28, pp. 356–367, MAR 1987.
[44] J. Datta and A. Iwanowska, “Use of rubber wastes for filling the cast urethane elas-
tomers,” Przemycl Chemiczny, vol. 86, pp. 872–874, SEP 2007.
87

[45] N. Manoj, P. Sivaraman, S. Praveen, R. Raut, L. Chandrasekhar, and B. Chakraborty,
“Miscibility and fracture toughness of thermoplastic polyurethane/poly(vinyl chlo-
ride)/nitrile rubber ternary blends with special reference to the blend composition,”
Journal of Applied Polymer Science, vol. 97, pp. 1763–1770, SEP 5 2005.
[46] M. PastorBlas, R. TorregrosaMacia, J. MartinMartinez, and J. Dillard, “Failure anal-
ysis of surface-treated unvulcanized SBS rubber/polyurethane adhesive joints,” Inter-
national Journal of Adhesion and Adhesives, vol. 17, no. 2, pp. 133–141, 1997.
[47] J. Tan, Y. M. Ding, X. T. He, Y. Liu, Y. An, and W. M. Yang, “Abrasion resis-
tance of thermoplastic polyurethane materials blended with ethylene-propylene-diene
monomer rubber,” Journal of Applied Polymer Science, vol. 110, pp. 1851–1857,
NOV 5 2008.
[48] A. Danch, S. Ilisch, W. Sulkowski, M. Moczynski, A. Radon, and H. Radusch,
“DMTA study of the urethane network in rubber waste-urethane composites,” Journal
of Thermal Analysis and Calorimetry, vol. 79, pp. 623–630, FEB 2005.
[49] R. Dhamodharan, P. Maiti, and G. Radhakrishnan, “Study on blends of ethylene
propylene diene rubber and thermoplastic polyurethanes,” Polymer-Plastics Technol-
ogy and Engineering, vol. 46, pp. 163–168, FEB 2007.
[50] A. B. Ortiz-Magan and M. M. Pastor-Blas, “Improved adhesion of RF plasma treated
rubbers by isocyanate incorporation to polyurethane adhesive,” Plasma Processes and
Polymers, vol. 5, pp. 681–694, SEP 15 2008.
[51] P. Pachpinyo, P. Lertprasertpong, S. Chuayjuljit, R. Sirisook, and V. Pimpan, “Prelim-
inary study on preparation of unsaturated polyester resin/natural rubber latex blends
in the presence of dispersion aids,” Journal of Applied Polymer Science, vol. 101,
pp. 4238–4241, SEP 15 2006.
88

[52] W. Sulkowski, A. Danch, M. Moczynski, A. Radon, A. Sulkowska, and J. Borek,
“Thermogravimetric study of rubber waste-polyurethane composites,” Journal of
Thermal Analysis and Calorimetry, vol. 78, no. 3, pp. 905–921, 2004.
[53] G. Li and N. Jones, “Development of rubberized syntactic foam,” Composites Part
A-Applied Science and Manufacturing, vol. 38, no. 6, pp. 1483–1492, 2007.
[54] A. El Lawindy, K. Abd El-Kade, W. Mahmoud, and H. Hassan, “Physical studies
of foamed reinforced rubber composites - Part 1. Mechanical properties of foamed
ethylene-propylene-diene terpolymer and nitrile-butadiene rubber composites,” Poly-
mer International, vol. 51, pp. 601–606, JUL 2002.
[55] G. Lin, X. Zhang, L. Liu, J. Zhang, Q. Chen, and L. Zhang, “Study on microstruc-
ture and mechanical properties relationship of short fibers/rubber foam composites,”
European Polymer Journal, vol. 40, pp. 1733–1742, AUG 2004.
[56] D. De Mello, S. H. Pezzin, and S. C. Amico, “The effect of post-consumer PET par-
ticles on the performance of flexible polyurethane foams,” Polymer Testing, vol. 28,
pp. 702–708, OCT 2009.
[57] M. Hawkins, B. O’Toole, and D. Jackovich, “Cell morphology and mechanical prop-
erties of rigid polyurethane foam,” Journal of Cellular Plastics, vol. 41, pp. 267–285,
MAY 2005.
[58] K. Morimoto, T. Suzuki, and R. Yosomlya, “Flexural Properties of Glass-Fiber Rein-
forced Rigid Polyurethane Foam,” Industrial & Engineering Chemistry Product Re-
search and Development, vol. 23, no. 1, pp. 81–85, 1984.
[59] W. Seo, J. Park, Y. Sung, D. Hwang, W. Kim, and H. Lee, “Properties of water-
blown rigid polyurethane foams with reactivity of raw materials,” Journal of Applied
Polymer Science, vol. 93, pp. 2334–2342, SEP 5 2004.
89

[60] W. Seo, H. Jung, J. Hyun, W. Kim, Y. Lee, K. Choe, and S. Kim, “Mechanical,
morphological, and thermal properties of rigid polyurethane foams blown by distilled
water,” Journal of Applied Polymer Science, vol. 90, pp. 12–21, OCT 3 2003.
[61] F. Saint-Michel, L. Chazeau, and J.-Y. Cavaille, “Mechanical properties of high den-
sity polyurethane foams: II Effect of the filler size,” Composites Science and Tech-
nology, vol. 66, pp. 2709–2718, DEC 2006.
[62] H. Singh, T. P. Sharma, and A. K. Jain, “Reactivity of the raw materials and their ef-
fects on the structure and properties of rigid polyurethane foams,” Journal of Applied
Polymer Science, vol. 106, pp. 1014–1023, OCT 15 2007.
[63] S. Goods, C. Neuschwanger, L. Whinnery, and W. Nix, “Mechanical properties of
a particle-strengthened polyurethane foam,” Journal of Applied Polymer Science,
vol. 74, pp. 2724–2736, DEC 9 1999.
[64] H. Lim, S. H. Kim, and B. K. Kim, “Effects of silicon surfactant in rigid polyurethane
foams,” Express Polymer Letters, vol. 2, pp. 194–200, MAR 2008.
[65] Z. Yang, B. Zhao, S. Qin, Z. Hu, Z. Jin, and J. Wang, “Study on the mechanical prop-
erties of hybrid reinforced rigid polyurethane composite foam,” Journal of Applied
Polymer Science, vol. 92, pp. 1493–1500, MAY 5 2004.
[66] J. Yuan and S. Q. Shi, “Effect of the Addition of Wood Flours on the Properties of
Rigid Polyurethane Foam,” Journal of Applied Polymer Science, vol. 113, pp. 2902–
2909, SEP 5 2009.
[67] W. Zatorski, Z. K. Brzozowski, and A. Kolbrecki, “New developments in chemical
modification of fire-safe rigid polyurethane foams,” Polymer Degradation and Stabil-
ity, vol. 93, pp. 2071–2076, NOV 2008.
90

[68] N. Mumford, D. Chatfield, and I. Einhorn, “Component Analysis of Rigid
Polyurethane Foams,” Fire Research, vol. 1, no. 2, pp. 107–117, 1977.
[69] V. Izakson, E. Aprosimova, and S. Shkulev, “Mechanical and thermophysical prop-
erties of polyurethane foam thermal insulation coatings intended for controlling the
stability of deep quarry banks,” Journal of Mining Science, vol. 34, pp. 317–319,
JUL-AUG 1998.
[70] M. Johlitz, H. Steeb, S. Diebels, A. Chatzouridou, J. Batal, and W. Possart, “Experi-
mental and theoretical investigation of nonlinear viscoelastic polyurethane systems,”
Journal of Materials Science, vol. 42, pp. 9894–9904, DEC 2007.
[71] D. Niyogi, R. Kumar, and K. Gandhi, “Water blown free rise polyurethane foams,”
Polymer Engineering and Science, vol. 39, pp. 199–209, JAN 1999.
[72] M. Sonnenschein, B. L. Wendt, A. K. Schrock, J.-M. Sonney, and A. J. Ryan, “The
relationship between polyurethane foam microstructure and foam aging,” Polymer,
vol. 49, pp. 934–942, FEB 18 2008.
[73] S. Subramani, Y. Park, Y. Lee, and J. Kim, “New development of polyurethane dis-
persion derived from blocked aromatic diisocyanate,” Progress in Organic Coatings,
vol. 48, pp. 71–79, NOV 2003.
[74] Z. Tu, V. Shim, and C. Lim, “Plastic deformation modes in rigid polyurethane
foam under static loading,” International Journal of Solids and Structures, vol. 38,
pp. 9267–9279, DEC 2001.
[75] K. Haibach, A. Menner, R. Powell, and A. Bismarck, “Tailoring mechanical prop-
erties of highly porous polymer foams: Silica particle reinforced polymer foams via
emulsion templating,” Polymer, vol. 47, pp. 4513–4519, JUN 14 2006.
91

[76] H. Mahfuz, V. Rangari, M. Islam, and S. Jeelani, “Fabrication, synthesis and mechan-
ical characterization of nanoparticles infused polyurethane foams,” Composites Part
A-Applied Science and Manufacturing, vol. 35, no. 4, pp. 453–460, 2004.
[77] H. Rozman, Y. Yeo, G. Tay, and A. Abubakar, “The mechanical and physical proper-
ties of polyurethane composites based on rice husk and polyethylene glycol,” Polymer
Testing, vol. 22, pp. 617–623, SEP 2003.
[78] R. Yosomiya and K. Morimoto, “Compressive Properties of Glass-Fiber Reinforced
Rigid Polyurethane Foam,” Industrial & Engineering Chemistry Product Research
and Development, vol. 23, no. 4, pp. 605–608, 1984.
[79] J. Kim, “Experimental and theoretical studies on crumb rubber polyurethane blend
system,” Korea Polymer Journal, vol. 5, pp. 241–247, DEC 31 1997.
[80] “Sieve Analysis Results for Crumb Rubber Particles (Batch ID ABR409909210901),”
Entech Inc, 2009.
[81] “From the Official Website of US Composites Inc,”
http://www.uscomposites.com/foam.html.
[82] “From the Official Website of Inchem Organization,”
http://www.inchem.org/documents/cicads/cicads/V27C102.gif.
[83] “From the Official Website of Chemyq,” http://www.chemyq.com/xz/img/img4/460-
73-1.gif.
[84] “From the Official Website of Google Inc,”
http://en.wikipedia.org/wiki/sodium lauryl sulfate.
[85] “Material Safety Data Sheet from the Official Website of R. T. Vanderbilt Company
Inc,” http://www.vanderbilt.com/documents/MSDS/US/13899.pdf.
92

[86] “Material Safety Data Sheet from the Official Website of Lubrizol Inc,”
http://www.lubrizol.com/coatings/Vycar/default.html.
[87] “From the Official Website of Lookchem Inc,”
http://www.lookchem.com/keyimages//2009-10/8bb9df5b-1887-4f89-94fe-
9e994fee94a3.jpg.
[88] B. Kaiser, “Fundamental XRF Technology Overview,” From the Official Website of
Bruker AXS.
[89] “Manual of Weighing Applications,” Sartorious Inc.
[90] “Standard test Method for Flat wise Compressive Properties of Sandwich Cores,”
ASTM International, 2005.
[91] “Standard test Method for Flexural Properties of Unreinforced and Reinforced Plas-
tics and Electrical Insulating Materials,” ASTM International, 2007.
[92] R. Maharsia, N. Gupta, and H. Jerro, “Investigation of flexural strength properties of
rubber and nanoclay reinforced hybrid syntactic foams,” Materials Science and Engi-
neering A-Structural Materials Properties Microstructure and Processing, vol. 417,
pp. 249–258, FEB 15 2006.
[93] “From the Official Website of Google Inc,” http://en.wikipedia.org/wiki/porosity.
[94] L. Gibson and M. Ashby, “Cellular Solids-Structure and Properties,” Cambridge Solid
State Science Series, 2001.
[95] V. Koissin and A. Shipsha, “Deformation of foam cores in uniaxial compression-
tension cycle,” Journal of Sandwich Structures & Materials, vol. 8, pp. 395–406,
SEP 2006.
93

[96] M. Coleman, D. Skrovanek, J. Hu, and P. Painter, “Hydrogen-Bonding in Polymer
Blends .1. FTIR Studies of Urethane Ether Blends,” Macromolecules, vol. 21, pp. 59–
65, JAN 1988.
94

VITA
Abhisek Bhadra
Candidate for the Degree of
Master of Science
Thesis: AN EXPERIMENTAL STUDY OF THE MICROSTRUCTURE–MECHANICALPROPERTY RELATIONSHIP OF CRUMB RUBBER–POLYURETHANEFOAM COMPOSITES
Major Field: Mechanical Engineering
Biographical:
Personal Data: Born in Kolkata, India on November 5th, 1983.
Education:Received the B.E. degree from Jadavpur University, Kolkata, India, 2006, inMechanical EngineeringCompleted the requirements for the degree of Master of Science with a majorin Mechanical Engineering Oklahoma State University in July, 2010.
Experience:Worked as a Graduate Research Assistant at the Mechanics of Advanced Mate-rials Laboratory headed by Dr. Raman P. Singh in the area of particle reinforcedcomposites

Name: Abhisek Bhadra Date of Degree: July, 2010
Institution: Oklahoma State University Location: Stillwater, Oklahoma
Title of Study: AN EXPERIMENTAL STUDY OF THE MICROSTRUCTURE–MECHANICAL PROPERTY RELATIONSHIP OF CRUMB RUBBER–POLYURETHANE FOAM COMPOSITES
Pages in Study: 94 Candidate for the Degree of Master of Science
Major Field: Mechanical Engineering
With the enormous growth of automobile industry initiating the needs of tire production allover the world, the disposal of scrap tires has become a significant environmental burden.Several research groups have investigated the development of novel products using wastetires. Nonetheless, the presence of non-degradable ingredients in tires makes the process ofdecomposition extremely difficult. Another issue is the need for proper surface treatmentof waste rubber to enhance its interaction with polymeric compounds. This current workis aimed to remedy the difficulties related to the recycling of polymeric rubber tires. Thisproject is developing technology to fabricate composite panels in which recycled rubberfrom tires is an inherent constituent. These resulting composite panels can also be used ascore materials inside Sandwich Composites and can definitely be seen as a means of utiliz-ing post-consumer waste tires. The inherent higher resilience of rubber particles is utilizedto make best core materials in resisting impact damage. Not only that, this study involvesan effective surface treatment methodology of as-received rubber particles using variousorganic functional groups. FTIR analysis will be utilized to understand the efficacy of vari-ous surface treatments. The compressive modulus and strength of crumb rubber reinforcedfoam are determined using ASTM standards as a function of crumb rubber content andsurface treatment. Initial studies show that materials can be easily fabricated using variousvolume fractions of crumb rubber. The modulus and compressive strength increase withgreater rubber contents.
ADVISOR’S APPROVAL: