Micrdfilms - ShareOK
228
INFORMATION TO USERS This reproduction was made from a copy of a document sent to us for microfilming. While the most advanced technology has been used to photograph and reproduce this document, the quality of the reproduction is heavily dependent upon the quality of the material submitted. The following explanation of techniques is provided to help clarify markings or notations which may appear on this reproduction. 1. The sign or “target” for pages apparently lacking from the document photographed is “Missing Page(s)”. If it was possible to obtain the missing page(s) or section, they are spliced into the film along with adjacent pages. This may have necessitated cutting througli an image and duplicating adjacent pages to assure complete continuity. 2. When an image on the film is obliterated with a round black mark, it is an indication of either blurred copy because of movement during exposure, duplicate copy, or copyrighted materials that should not have been filmed. For blurred pages, a good image of the page can be found in the adjacent frame. If copyrighted materials were deleted, a target note will appear listing the pages in the adjacent frame. 3. When a map, drawing or chart, etc., is part of the material being photographed, a definite method of “sectioning” the material has been followed. It is customary to begin filming at the upper left hand comer of a large sheet and to continue from left to right in equal sections with small overlaps. If necessary, sectioning is continued again-beginning below the first row and continuing on until complete. 4. For illustrations that cannot be satisfactorily reproduced by xerographic means, photographic prints can be purchased at additional cost and inserted into your xerographic copy. These prints are available upon request from the Dissertations Customer Services Department. 5. Some pages in any document may have indistinct print. In all cases the best available copy has been filmed. Universi^ Micrdfilms Internationcil 300 N. Zeeb Road Ann Arbor, Ml 48106
-
Upload
khangminh22 -
Category
Documents
-
view
0 -
download
0
Transcript of Micrdfilms - ShareOK

INFORM ATION TO USERS
This rep roduction was m ade from a copy o f a docum en t sent to us for microfilm ing. While the m ost advanced technology has been used to photograph and reproduce this docum en t, the quality o f the reproduction is heavily dependen t upon the quality o f the m aterial subm itted .
The following explanation o f techniques is provided to help clarify m arkings or no ta tions which may appear on this rep roduction .
1. The sign or “ ta rge t” for pages apparently lacking from the docum ent photographed is “ Missing Page(s)” . I f it was possible to ob tain the missing page(s) o r section, they are spliced in to the film along w ith adjacent pages. This may have necessitated cu tting througli an image and duplicating adjacent pages to assure com plete con tinu ity .
2. W hen an image on the film is ob literated w ith a round black m ark, it is an indication o f e ith e r b lurred copy because o f m ovem ent during exposure, duplicate copy , o r copyrigh ted m aterials th a t should n o t have been film ed. F or b lurred pages, a good image o f the page can be found in the adjacent fram e. If copyrighted m aterials were deleted , a target no te will appear listing the pages in the ad jacen t fram e.
3. W hen a m ap, draw ing o r chart, e tc ., is p a rt o f the m aterial being pho tographed , a defin ite m ethod o f “ sectioning” the m aterial has been follow ed. I t is custom ary to begin film ing at the upper le ft hand com er o f a large sheet and to con tinue from left to right in equal sections w ith small overlaps. I f necessary, sectioning is continued again -beg inn ing below the first row and continuing on until com plete.
4. F o r illustrations th a t canno t be satisfactorily reproduced by xerographic m eans, photographic p rin ts can be purchased at additional cost and inserted in to y o u r xerographic copy. These p rin ts are available upon request from the D issertations C ustom er Services D epartm en t.
5. Some pages in any docum en t m ay have ind istinct p rin t. In all cases the best available copy has been film ed.
U n iv e rs i^Micrdfilms
Internationcil300 N. Z eeb Road Ann Arbor, Ml 48106


8225505
Hubert, Jacqueline Shields
HEURISTIC STATISTICAL MODELS FOR CARBON M ONOXIDE IN EL PASO, TEXAS
The University o f Oklahoma PH.D. 1982
UniversityMicrofilms
I nternetional 300 N. zeeb Road. Ann Arbor, MI 48106
Copyright 1982
by
Hubert, Jacqueline Shields
All Rights Reserved


PLEASE NOTE:
In all c a se s this material has been filmed in the best possible way from the available copy. Problems encountered with this docum ent have been identified here with a check m ark V
1. Glossy photographs or pag es.
2. Colored illustrations, paper or print_____
3. Photographs with dark background_____
4. Illustrations a re poor co p y ______
5. P ages with black marks, not original copy.
6. Print shows through as there is text on both s id es of page.
7. Indistinct, broken or small print on several p ag es
8. Print exceeds margin requirem ents______
9. Tightly bound copy with print lost in spine______
10. Computer printout pages with indistinct print.
11. P age(s)____________ lacking when material received, and not available from school orauthor.
12. P age(s)____________ seem to be missing in numbering only a s text follows.
13. Two pages n um bered____________ . Text follows.
14. Curling and wrinkled p a g e s______
15. O ther ____________ ________________________________________________
UniversityMicrofilms
International


THE U N IV E R SIT Y OF OKLAHOMA
GRADUATE COLLEGE
H E U R IST IC ST A T IS T IC A L MODELS FOR CARBON MONOXIDE IN EL P A SO , TEXiVS
A D ISSE R T A T IO N
SUBMITTED TO THE GR.\DUATE FACULTY
in p a r t i a l f u l f i l l m e n t o f the requ irem en ts fo r the
d egree o f
DOCTOR OF PHILOSOPHY
BY
JACQUELINE S . HUBERT
Norman, Oklahoma
1982

H E U R IST IC ST A T IS T IC A L MODELS FOR CARBON MONOXIDE IN EL P A SO , TEXAS
APPROVED BY
D ISS E R T A T IO N COMMITTEE

T his d i s s e r t a t i o n i s d e d ic a te d to ray p aren ts
■Tack and J u a n i ta S h ie ld s
ill

ACKNOWLEDGEMENT
The author w ish es to e x p r e ss her s in c e r e a p p r e c ia t io n to the
committee chairman, Dr. L.W. Canter, and her committee members.
Dr. M.W. Baker, J r . , Dr. E.H. K lehr, Dr. G.W. Tauxe, and Dr. Jeyaraj
V a d iv e lo o . In a d d i t io n to c o n t r ib u t io n s in t h e i r in d iv id u a l a rea s o f
e x p e r t i s e to t h i s s tu d y , they were u n f a i l i n g in t h e i r requirem ents fo r
e x c e l l e n c e in performance and developm ent. No s tu d en t could have asked
fo r a b e t t e r com mittee.
Acknowledgements are extended to the p erson n el o f the
U n iv e r s i ty o f Oklahoma Computer S e r v i c e s , e s p e c i a l l y Jim W hite, Gary
P a re n t , and L e s l i e K eeley . To Ms. K eeley a p a r t i c u la r debt o f
g r a t i t u d e i s owed fo r her p a t i e n c e , many hours o f gu idance , and work
w ith the master tap es and g r a p h ic s .
The author a l s o w ish es to p e r so n n a l ly ex p re ss her a p p r e c ia t io n
to the p erson n el o f the Texas A ir C ontro l Board, Texas Department o f
T ra n sp o r ta t io n and Highways, El Paso C ity T r a f f i c Department, E l Paso
C ity-C ounty H ealth U n it , and the l a t e Dr. Andrew J o n e s , Chairman, C i v i l
E n g in eer in g Department, U n iv e r s i t y o f T exas , E l P aso . So many gave so
g e n e r o u s ly o f t h e i r time and p a r t i c u la r a re a s o f e x p e r t i s e in the data
c o l l e c t i o n phase o f t h i s stu d y .
Acknowledgement i s a l s o extended to the School o f C i v i l
E n g in eer in g and Environmental S c ie n c e , Univers:) Ty o f Oklahoma, fo r
funding provided for t h i s s tu d y , and to the o f f i c e p erso n n e l o f the
department for smoothing so many paper pathways.
iv

To Mrs. L e s l i e Rard and Mrs. V ic k i D a llen for Che e x c e l l e n t
ty p in g o f t h i s m anuscript and fo r t h e i r s p e c i a l i n t e r e s t in t h i s work
deep a p p r e c ia t io n i s g iv e n .
Acknowledgement i s a l s o extended to George Sammy fo r h i s rev iew
and comments o f t h i s work. S in c e r e a p p r e c ia t io n i s g iv e n to Duane J .
Rosa for h i s review and a s s i s t a n c e in the s t a t i s t i c a l and the computer
a r e a s . A s p e c i a l debt o f g r a t i t u d e i s owed to Carol Holloway who has
so g en er o u s ly g iven her fr ie n d s h ip and encouragement throughout th ese
l a s t two y e a r s .
F i n a l l y to Dr. Howard G. A p p le g a te , P r o f e s s o r , C i v i l
E n g in eer in g Department, U n iv e r s i t y o f Texas a t E l P aso , E l Paso , Texas,
d e e p e s t a p p r e c ia t io n , g r a t i t u d e , and r e s p e c t are g iv e n for h i s
encouragement, gu idance , and te a ch in g through th e s e many y e a r s .

ABSTRACT
The t i t l e o£ t h i s study i s " H e u r is t ic S t a t i s t i c a l Models for
Carbon Monoxide in E l P aso , Texas". The s t a t e d o b j e c t i v e s o f th e study
are 1 ) to produce such an h e u r i s t i c s t a t i s t i c a l m o d e l(s ) and 2 ) to
examine th e h i s t o r i c a l and cu rren t CO ambient a i r p r o f i l e in E l Paso,
T ex a s , u s in g the method o f d e s c r i p t i v e s t a t i s t i c a l a n a l y s i s . A
l i t e r a t u r e rev iew and b ib l io g r a p h y are g iv e n to p rov id e g r e a te r
u n d ersta n d in g o f the m u l t ip le f a c e t s o f CO b eh a v io r and atm ospheric
m od elin g . D e s c r ip t io n s o f the sam pling s i t e s , sam pling , a n a l y t i c a l
methods, and the d a ta b a ses used in t h i s s tudy are g iv e n . The methods
s e c t i o n d i s c u s s e s in d e t a i l d a ta c o l l e c t i o n and management p r a c t i c e s
and problem s, p a r t i c u l a r l y as r e la t e d to d a ta q u a n t i t y and d i v e r s i t y o f
i n i t i a l d a ta b a s e s . A lso in c lu d ed are diagrams and a d i s c u s s i o n for
th e s e q u e n t ia l developm ent, c a l i b r a t i o n , and v e r i f i c a t i o n o f two
h e u r i s t i c s t a t i s t i c a l m odels f o r CO c o n c e n t r a t io n p r e d i c t i o n s .
D e s c r ip t iv e s t a t i s t i c a l a n a ly s e s o f the d ata in d ic a te d s tr o n g ,
p e r s i s t e n t se a so n a l and d iu r n a l p a t te r n s fo r carbon m onoxide, t r a f f i c ,
wind speed , wind d i r e c t i o n , tem perature , m ix in g h e i g h t , and tra n sp o rt
w ind. T a b le s and f ig u r e s are p rov ided to d em onstrate the ty p es o f
c o n d i t io n in g used in the model developm ent and c a l i b r a t i o n p r o c e s s e s
which were performed u s in g 4 o f th e 6 y e a r s co n ta in ed in the d ata b a se .
Model v e r i f i c a t i o n r e s u l t s u s in g 2 o f the 6 y e a r s o f d ata in a 2 0 - term
q u a d ra t ic form model and a 5 -term g e n e r a l l i n e a r model show both models
to be e f f e c t i v e in p r e d ic t in g ambient a i r CO c o n c e n t r a t io n s .
vi

On th e b a s i s o f e x i s t i n g data i t was determ ined th at w h ile
t r a f f i c i s th e major sou rce o f CO in th e a r e a , m e te o r o lo g ic a l f a c t o r s
p rov id e the dominant in f lu e n c e in the e l e v a t i o n o f th e se c o n c e n tr a t io n s
to l e v e l s th a t exceed the N a t io n a l Ambient A ir Q u a l i ty S tan dards .
E x te n s iv e comments reg a rd in g th e r e s u l t s o f the s tudy and the
im p l ic a t io n s and a p p l i c a t io n o f th e s e r e s u l t s are a l s o in c lu d e d .
vii

TABLE OF CONTENTS
Page
ABSTRACT................................................................................................................................... v i
LIST OF TABLES.................................................................................................................... x
LIST OF FIGURES................................................................................................................ x i i
Chapter
I . INTRODUCTION........................................................................................................ 1
I I . BACKGROUND INFORMATION............................................................................... 4
Carbon Monoxide . 4
M odeling ................................................................................................................ 23-
L e g i s l a t i o n ...................................................................................................... 31
Study Area........................................................................................................... 36'
43I I I . MATERIALS AND METHODS ...............................................................................
D e s c r ip t io n o f Sampling S i t e s , Sampling D e v ic e s ,A n a ly t i c a l Methods and Data B ases . . . . . . . . . . . 43
Computer F a c i l i t i e s ............................................................................... • 52
M e t h o d s ................................................................................................................ 53
IV. PRESENTATION AND DISCUSSION OF RESULTS......................................... 63
D e s c r ip t iv e S t a t i s t i c s .............................................................................. 63
M odeling ................................................................................................................ 128
Model V e r i f i c a t i o n U sing L im ited Data ....................................... 143
E stim a te Rankings . . . . . . . . . . . . 148
P r e d ic t io n s ...................................................................................... 151
G eneral Comments............................................................................................ 152

Page
V. SUMMARY CONCLUSIONS ................................................................................... 153
Data Management ..................................................... . . . . . . . . . 153
Data P a tte r n s and A n a ly s i s . . . . . . . . ........................ . . 157
H e u r i s t i c S t a t i s t i c a l M odels.............................................. 159
Environmental Management.......................................................... 162-
General C o n c l u s i o n s ................................................................... 163
CITED REFERENCES............................................................................................................... 165-
APPENDIX A: SCHEMATICS OF CO PRODUCTION AND DESTRUCTION. . . . 178
APPENDIX B: EL PASO EMISSION INVENTORY AND GENERALEMISSION FACTORS................................................................................ 181
APPENDIX C: CO CASE STUDIES.................................................................................... 187
APPENDIX D: CO SAMPLING SITE DESCRIPTIONS.................................................. 196
APPENDIX E; SAMPLING DEVICES.................................................................................. 202
Ix

LIST OF TABLES
TABLE Page
1. Chemical and P h y s ic a l P r o p e r t i e s o f CO......................................... 5
2 . General E quations for CO R e a c t io n s .................................................. 7
3 . N atu ra l E m iss ion Sources and P ro d u ct io n Rates o f CO . . n
4 . CO E m ission In v en to ry for A nthropogen ic Sources . . . . 14
5 . A ir P o l l u t i o n L e g i s l a t i o n ...................................................................... 32
6 . N a t io n a l Ambient A ir Q u a lity S ta n d a r d s ......................................... 33
7 . Data Base D e s c r i p t i o n s ................................................................................ 47
8 . T r a f f i c Volume Surveys by the C ity o f E l PasoT r a f f i c and T r a n sp o r ta t io n Department ....................................... 50
9 . MOTHER D a t a ........................................................................................................ 56
10 . Computer Programs Used fo r Data A n a l y s i s . . ...................... 58
11-A. P ercen t M iss in g V alues fo r CO by S i t e , Monthand Year fo r 1 9 7 5 -7 8 .................................................................................... 81
11-B. P ercen t M iss in g V alues fo r CO by Month andYear fo r 1 9 7 5 -7 8 ............................................................................................. 82
12 . CO % F req u en c ies by Month fo r E l P a so , 1 9 7 5 -7 8 ...................... 84
13. Wind Speed F req u en c ie s by Month in E l Pasofo r 1975 —7 8 . . . . . . . . . . . . . . . . . . . . . . 86
14. Wind D ir e c t io n F req u en c ie s by Month in E l Pasofo r 1975-78 ....................................................................................................... 89
15. Temperature F req u en c ie s by Month for 1 9 7 5 -7 8 .......................... 92
16. T r a f f i c F req u en c ie s by Month in E l Paso for 1975-78 . . 9 4
17. Mixing H eight F req u en c ie s by Month fo r 1 9 7 5 -7 8 ..................... 96
18 . T ransport Wind F req u en c ie s by Month fo r E l Pasofo r 1975-78 ....................................................................................................... 99
1 9 . Monthly Means by Y e a r ................................................................................ 101
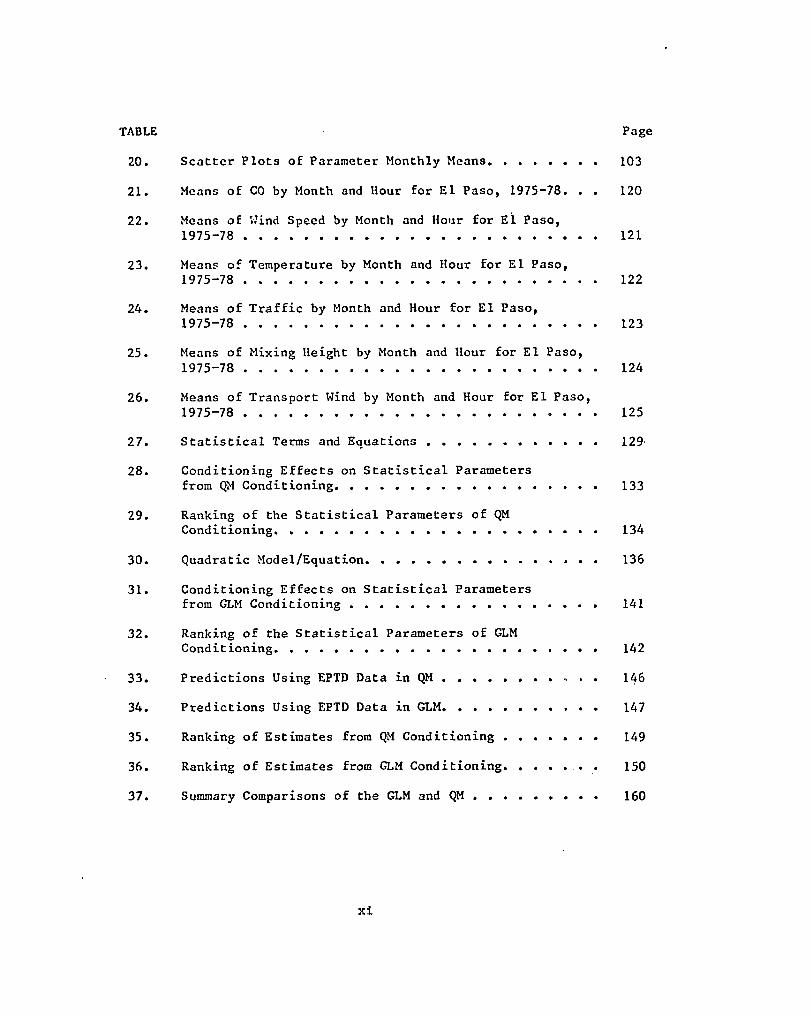
TABLE Page
20. S c a t t e r P l o t s o f Param eter Monthly Means.................................... 103
21. Means o f CO by Month and Hour fo r E l P aso , 1975-78 . . . 120
22. Means o f Wind Speed by Month and Hour for E l Paso ,1975-78 ................................................................................................................. 121
23. Means o f Temperature by Month and Hour fo r E l Paso ,1975-78 ................................................................................................................. 122
24 . Means o f T r a f f i c by Month and Hour fo r E l P aso ,1975-78 ................................................................................................................. 123
25. Means o f Mixing H eight by Month and Hour for E l P aso ,1975-78 ................................................................................................................. 124
2 6 . Means o f T ran sport Wind by Month and Hour for E l P aso ,1975-78 ................................................................................................................. 125
2 7 . S t a t i s t i c a l Terms and E q u a t i o n s .............................. 129
28. C o n d it io n in g E f f e c t s on S t a t i s t i c a l Param etersfrom QM C o n d it io n in g ......................................................................... 133
2 9 . Ranking o f the S t a t i s t i c a l P aram eters o f QMC o n d it io n in g ....................................................................................................... 134
30. Q uadratic M odel/E quation ........................................................................... 136
31. C o n d it io n in g E f f e c t s on S t a t i s t i c a l Param etersfrom GLM C o n d i t i o n i n g ............................................................................... 141
32. Ranking o f the S t a t i s t i c a l P aram eters o f GLMC o n d it io n in g ....................................................................................................... 142
33 . P r e d i c t i o n s U sing EPTD Data in QM................................................... 146
34. P r e d i c t i o n s U sing EPTD Data in GLM........................................ 147
35 . Ranking o f E s t im a te s from QM C o n d it io n in g . . . . . . . 149
36 . Ranking o f E s t im a te s from GLM C o n d it io n in g .................... . . 150
3 7 . Summary Comparisons o f the GLM and Q M . .................................... 160
xi
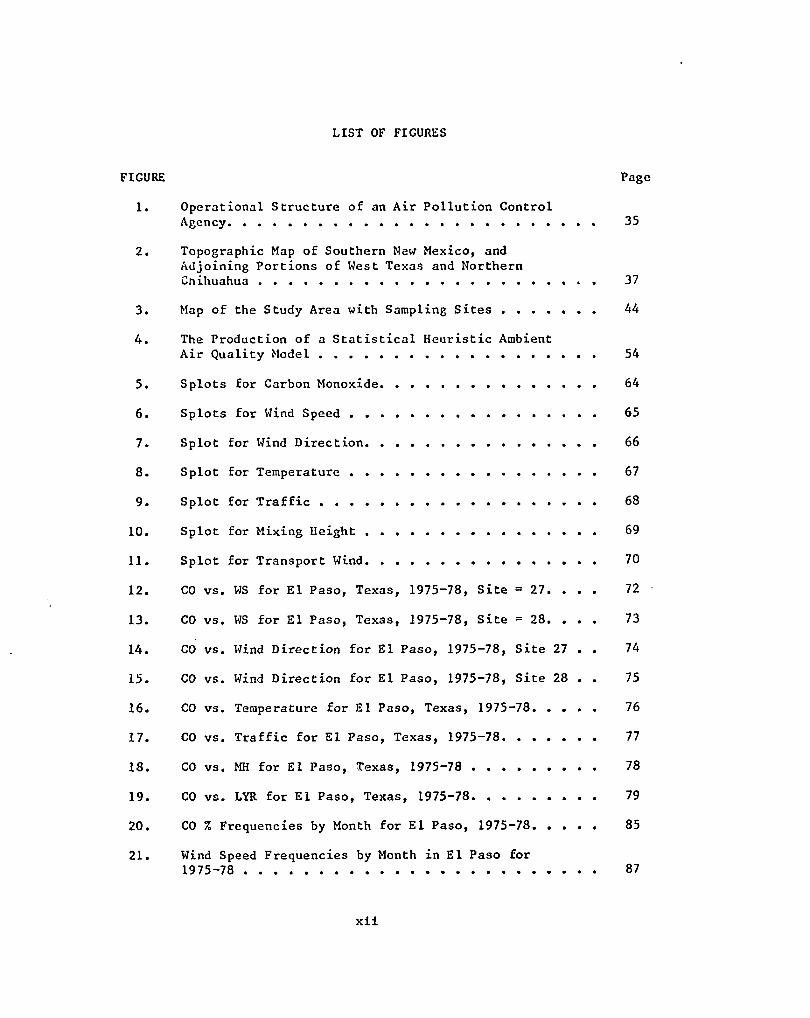
LIST OF FIGURES
FIGURE Page
1. O p era t io n a l S tr u c tu r e o f an A ir P o l l u t i o n C ontrolAgency..................................................................................................................... 35
2 . Topographic Map o f Southern New M exico, andA d jo in in g P o r t io n s o f West Texas and NorthernC n ih u a h u a ........................................................................................................... 37
3 . Map o f the Study Area w ith Sampling S i t e s ............................... 44
4 . The P ro d u ctio n o f a S t a t i s t i c a l H e u r i s t i c AmbientA ir Q u a l i ty M o d e l ........................................................................................ 54
5 . S p l o t s for Carbon Monoxide...................................................................... 64
6 . S p l o t s fo r Wind S p e e d ............................................................................... 65
7 . S p lo t for Wind D i r e c t i o n .......................................................................... 66
8 . S p lo t for T e m p e r a t u r e ............................................................................... 67
9 . S p lo t for T r a f f i c ......................................................................................... 6 8
10 . S p lo t for M ixing H e i g h t .......................................................................... 69
11 . S p l o t for T ran sport Wind.......................................................................... 70
12 . CO v s . WS fo r E l P a so , T exas, 1 9 7 5 -7 8 , S i t e = 2 7 . . . . 72
13. CO v s . WS fo r E l P a so , T exas, 1 9 7 5 -7 8 , S i t e = 28 . . . . 73
14 . CO v s . Wind D ir e c t io n fo r E l P a so , 197 5 -7 8 , S i t e 27 . . 74
15 . CO v s . Wind D ir e c t io n fo r El P a so , 1 975-78 , S i t e 28 . . 75
16 . CO v s . Temperature fo r E l P a so , T exas, 197 5 -7 8 . . . . . 76
17 . CO v s . T r a f f i c fo r E l P a so , T exas , 1 9 7 5 -7 8 ............................... 77
1 8 . CO v s . MH fo r E l P aso , T exas, 1975-78 ........................................ 78
19 . CO v s . LYR fo r E l P aso , T exas, 1 9 7 5 -7 8 ......................................... 79
2 0 . CO % F req u en c ie s by Month fo r E l P aso , 1 9 7 5 -7 8 ..................... 85
21 . Wind Speed F req u en c ie s by Month in E l Paso for1975-78 ................................................................................................................ 87
xii

FIGURE Page
22. Wind D ir e c t io n F requ en cies by Month in El Pasofo r 1975-78 ........................ 90
23. Temperature F requ en c ies by Month for 1 9 7 5 -7 8 .......................... 93
24 . T r a f f i c F req u en cies by Month for El Paso , 1975-78 . . . 95
25. Mixing H eight F req u en cies by Month for 1 9 7 5 -7 8 ..................... 97
26 . T ransport Wind F requ en cies by Month fo r El Pasofo r 1975-78 ...................................................................................................... 100
27 . The R e la t io n s h ip o f CO, WS, T, TR, MH, LYRand Time............................................................................................................... 104
28. CO Monthly Means v s . Wind Speed Monthly Means ..................... 105
29. CO Monthly Means v s . l/Wind Speed Monthly Means . . . . 106
30. CO Monthly Means v s . l /(W ind Speed Monthly Means)^. . . 107
31. CO Monthly Means v s . Temperature Monthly Means...... 108
32. CO Monthly Means v s . 1/Temperature Monthly Means. . . . 109
33. CO Monthly Means v s . T r a f f i c Monthly Means......................... ..... 110
34. CO Monthly Means v s . 1 / T r a f f i c Monthly Means........... I l l
35 . CO Monthly Means v s . Mixing H eight Monthly Means. . . . 112
36. CO Monthly Means v s . Transport Wind Monthly Means . . . 113
37. CO Monthly Means v s . 1 /T ransport Wind Monthly Means . . 114
38. Wind Speed Monthly Means v s . Temperature MonthlyM e a n s .................................................................................................................... 113
39. Wind Speed Monthly Means v s . Mixing H eightMonthly M e a n s .................................................................................................
4 0 . Wind Speed Monthly Means v s . Transport WindMonthly M e a n s . H 7
4 1 . Temperature Monthly Means v s . Mixing H eightMonthly Means ............................................ ....
4 2 . CO Means by S i t e , Month and Hour for197 5 -7 8 , S i t e = 27 . . . .................................................................... 126
xiii

FIGURE Page
4 3 . CO Means by S i t e , Month and Hour for1975-78 , S i t e = 2 8 ........................................................................................ 127
4 4 . P lo t o f QM P r e d i c t i o n s ............................................................................... 144
4 5 . P lo t o f GLM P r e d i c t i o n s ........................................................................... 145
4 6 . CO Ambient A ir L e v e l , T r a f f i c , and M e te o r o lo g ic a lP a t te r n s . 158
xlv

HEURISTIC STATISTICAL MODELS FOR CARBON MONOXIDE IN EL PASO, TEXAS
CHAPTER I
INTRODUCTION
The t i t l e o f t h i s s tudy im m ediate ly ev o k es the q u e s t io n — "why
should an ambient a i r model for a tm osp h eric CO c o n c e n tr a t io n s in E l
Paso be d eve lop ed ?" . The need e x i s t s b eca u se E l Paso has been d ec la re d
n o n -a tta in m en t fo r four o f s i x N a t io n a l Ambient A ir Q u a l i ty S tandards
(NAAQS), in c lu d in g carbon monoxide (CO). With each s u c c e s s i v e year
th e r e are in c r e a s e s in the number o f t im es the NAAQS fo r CO i s
ex ceed ed . To d a te th e major c a u s a t i v e f a c t o r ( s ) f o r the ob served CO
c o n c e n t r a t io n s have not been i d e n t i f i e d q u a n t i t a t i v e l y or q u a l i t a t i v e l y
(TAGS, 197 9 a ) . There i s no ambient a i r model fo r CO c o n c e n t r a t io n
p r e d ic t io n in E l P a so . The o n ly a p p l i c a b le models are p o in t and l i n e
sou rce m odels for s p e c i f i c e m is s io n s .
The next q u e s t io n to a r i s e i s — "how can such a model be
d ev e lo p ed ? " . S in ce no o th er model or model development program fo r a
comparable area or s i t u a t i o n was found in the l i t e r a t u r e , th r e e
r e se a r c h s t e p s were employed. The f i r s t s t e p was to s ec u r e the
e x i s t i n g d a ta b a s e s , the n ext s t e p was to s t a t i s t i c a l l y examine the
data fo r h i s t o r i c a l and e x i s t i n g p r o f i l e s , and f i n a l l y , the l a s t s t e p

was to in co rp o ra te th e s e f in d in g s in to two h e u r i s t i c s t a t i s t i c a l
ambient a i r model which can be used to p r e d ic t CO ambient a i r
c o n c e n t r a t io n s .
The th ird q u e s t io n i s — "how can the developed model be used
( i . e . , what i s i t s p u rp o se )? " . The four major model usage c a t e g o r i e s
are ; 1) to p r e d ic t ambient a i r CO c o n c e n tr a t io n g iv e n s p e c i f i c model
parameter input v a l u e s , 2 ) to d eterm in e th e major f a c t o r s in f lu e n c in g
ambient a i r CO c o n c e n t r a t io n s , 3) to p ro v id e a s y s te m a t ic s c i e n t i f i c
b a s i s fo r a i r p o l l u t i o n c o n t r o l management, 4 ) and to p rov id e a
s c i e n t i f i c b a s i s fo r a p p l i c a t io n s fo r exempt io n s /v a r ia n c e s for non
atta in m en t a reas when (o r i f ) c o n d i t io n s o f nature or CO t r a n s f e r from
o th e r areas o u t s id e E l Paso become th e major i n f l u e n c e ( s ) on ambient
a i r CO c o n c e n t r a t io n s .
The two major o b j e c t i v e s o f t h i s s tu d y , t h e r e f o r e , a re : (1 ) to
perform a d e s c r i p t i v e s t a t i s t i c a l a n a l y s i s o f the e x i s t i n g E l Paso
d a ta , and ( 2 ) to d ev e lo p an h e u r i s t i c s t a t i s t i c a l model to p r e d ic t
ambient a i r c o n c e n t r a t io n s o f CO in E l P aso , T exas . The scope o f the
study was as fo l lo w s :
1 . For the d e s c r i p t i v e s t a t i s t i c a l a n a ly s i s the b a s i c formso f the d ata were examined fo r :
a . n o rm a lity and skewness u s in g p l o t s and u n iv a r ia t e a n a l y s i s ,
b . l i n e a r r e l a t i o n s h i p s u s in g s c a t t e r p l o t s ,
c . m is s in g data — by s i t e , y ea r , month, and h our ,
d. frequency c a te g o r y d i s t r i b u t i o n s — by s i t e , y ea r ,month, and hour ,
e . a r i th m e t ic means — by s i t e , y ea r , month, and hour,and

f . e q u a l i t y o f means for sea so n a l and d iu rn a ld i f f e r e n c e s u s in g a p l o t t i n g o f mean v a lu e s v s , time and the K ru sk a l-W a ll is t e s t .
2 . For the h e u r i s t i c s t a t i s t i c a l m o d e l(s ) the fo l lo w in g a c t i v i t i e s wore done;
a. t e s t i n g v a r io u s types o f models with raw data and monthly mean d ata u s in g l i n e a r , q u a d r a t ic , e x p o n e n t ia l , in v e r s e , and mixed typ es o f m o d e ls /e q u a t io n s ,
b. s e l e c t i n g the b e s t m o d e l /eq u a tio n based p r im a r i ly on r 2 v a l u e s ,
c . c a l i b r a t i o n o f the model u s in g 12 typ es o f c o n d it io n in g , and
d. v e r i f i c a t i o n o f the model u s in g a c tu a l d a ta .
3. D eterm ination o f the parameters p ro v id in g the g r e a t e s t and most c o n s i s t e n t in f lu e n c e on CO ambient a i r c o n c e n t r a t io n s , t h i s in v o lv ed an exam ination o f the c a l i b r a t i o n and v e r i f i c a t i o n phases o f the model developm ent, and e x t e n s iv e use o f c o n d it io n in g to examine d i f f e r e n c e s in t h e o r e t i c a l v e r s u s a c tu a l s i t u a t i o n s .
The in fo rm a tio n a s s o c ia t e d w ith t h i s study i s presented in four
ch a p ter s in a d d i t io n to t h i s I n tr o d u c t io n ch a p ter . Chapter I I c o n ta in s
a rev iew o f the l i t e r a t u r e on carbon monoxide in the atmosphere. In
a d d i t io n , in fo rm a t io n on a i r q u a l i t y models i s in c lu d ed in Chapter I I .
Chapter I I I a d d resses the input d ata sou rces and methods used in t h i s
s tu d y . Chapter IV p r e s e n t s the r e s u l t s o f the d e s c r i p t i v e s t a t i s t i c a l
a n a l y s i s o f the d ata from the o n ly two E l Paso CO m on itor in g s t a t i o n s ,
and d e l i n e a t e s the development o f two h e u r i s t i c s t a t i s t i c a l m odels .
Chapter V c o n ta in s th e summary and c o n c lu s io n s o f t h i s s tu d y . F i n a l l y ,
c i t e d r e f e r e n c e s are in c lu d ed a long w ith s e v e r a l p e r t in e n t ap p en d ices .

CHAPTER II
BACKGROUND INFORMATION
Carbon Monoxide
T his ch a p ter p ro v id es a l i t e r a t u r e rev iew o f p r e v io u s ly
p ub lished m a te r ia l con cern in g carbon monoxide ch e m is tr y , s o u r c e s ,
s i n k s , d i s t r i b u t i o n , and b i o l o g i c a l e f f e c t s , as w e l l as a rev iew o f
l o c a l , s t a t e , f e d e r a l , and i n t e r n a t io n a l a i r p o l l u t i o n l e g i s l a t i o n
p a r t i c u l a r l y in th e E l Paso a re a . Background m a t e r ia l on the geography
and m eteoro logy o f E l Paso are in c lu d ed . A very b r i e f summary o f a
l i t e r a t u r e rev iew o f m odeling w ith emphasis on s t a t i s t i c a l models i s
a l s o p ro v id ed .
Chemistry
Carbon monoxide (CO), a c o l o r l e s s , o d o r le s s g a s , was f i r s t
i d e n t i f i e d as a compound c o n s i s t i n g o f carbon and oxygen by Cruikshank
in 1800 (L ew is , 1 9 7 1 ) . From 1800 u n t i l the m iddle o f the tw e n t ie th
cen tu ry s t u d ie s o f carbon monoxide were o r ie n te d toward i t s use in
i n d u s t r i a l p r o c e s s e s and in pure chemis try -p h y s i c s re sea rc h s t u d ie s .
In the mid 1 9 0 0 ' s , however, two e v e n t s occurred th a t were to open new
a r e a s o f stu d y in v o lv in g carbon monoxide ch em istry and chem ical
r e a c t i o n s . The f i r s t ev e n t was the d is c o v e r y in 1949 by M igeotte o f
th e CO band a t 4 . 7 p in the s o la r spectrum, thus i d e n t i f y i n g CO as a

component o f the atmosphere (W einstoch , 1 9 6 9 ) . The second event was
n ot a true e v e n t , but ra th er a c u l t u r a l / s o c i o - e c o n o m ic movement to
p r o t e c t , p r e s e r v e , and improve the en v iron m en t. . T his concern for
environm ental q u a l i t y by the g en er a l p u b l ic and s c i e n t i f i c community in
the 1 9 5 0 's and 1 9 6 0 's r a p id ly led to the development o f new methods and
in s tru m en ta t io n in th e f i e l d o f a n a l y t i c a l env iron m en ta l c h em is try , and
to the subsequent i n v e s t i g a t i o n o f the s t a t u s and fu n c t io n s o f chem ica l
s p e c i e s in the ambient a i r . A f t e r World War I I w ith the in c rea se d use
o f a u to m o b ile s , fr eew a y s , and d r iv in g in crowded urban a r e a s ,
com pla in ts o f h ea d a ch es , e x c e s s i v e f a t i g u e , d i z z i n e s s , and i r r i t a b i l i t y
became common among d r i v e r s o f motor v e h i c l e s . These co m p la in ts led to
p u b l ic demand to i d e n t i f y and d ev e lo p methods o f c o n t r o l l i n g th e
f a c t o r s r e s p o n s ib le fo r t h i s d isc o m fo r t and d e t e r i o r a t i o n o f the
environm ent.
While d e te rm in a t io n o f the d i s t r i b u t i o n , s o u r c e s , and s in k s o f
CO are im portant in the c o n tr o l and abatement o f CO c o n c e n tr a t io n s in
th e ambient a i r , th e most b a s ic and e s s e n t i a l p a r t o f t h i s p ro cess i s a
knowledge and u nd erstan d in g o f the ch em ica l and p h y s i c a l ch a r a c te r o f
CO. Table 1 p ro v id e s a summary o f th e s e chem ica l and p h y s ic a l
p r o p e r t ie s (CRC, 1 9 7 2 ) . The b a s ic a tm osp h eric r e a c t io n s o f CO are
g iv e n in T able 2 , w ith schem atic diagrams o f atm ospheric CO p roduction
and d e s t r u c t io n in c lu d ed in Appendix A. A lthough th e range, o f CO
chem ica l r e a c t io n s i s q u i t e e x t e n s iv e and can occur in the ambient a i r
( < 1 km), th e r e a c t io n s in eq u a t io n s 1 -8 in T ab le 2 occur p r im a r i ly in
the troposphere (up to = 20 km) w ith the r e a c t io n s o f eq u a t io n s 9-11
o cc u r r in g m ain ly in th e s t r a to s p h e r e (from = 20-50 km). High

Table 1. Chemical and Physical Properties of CO (CRC, 1972)
N a tu r a l ly o c c u r r in g s t a t e : gaseous
O dor less
C o lo r l e s s
M elt in g p o in t = -207°C
B o i l in g p o in t = - 1 9 1 . 5°C
Formula w e ig h t = 2 8 .0 1
-1 9 5 ° /4S p e c i f i c g r a v i t y = 0 .1 8 4 (Note a)
0°S o l u b i l i t y in w ater = 0 .0 0 4 (Note b)-6O v era l l mean CO p a r t i a l p r e s s u r e in marine atm osphere = 0 .1 1 7 x 10 atm
S o l u b i l i t y c o e f f i c i e n t ( s a l i n i t y = 35%; T = 25°C) = 23 x 10 mg cm atm ^
Flux v a lu e (CO)^q km ~ ^ 10^^ cm
Average m ix ing r a t i o = 0 .1 ppm
R atio o f m o lec u la r w e ig h t o f CO and A ir = 0 .9 7
Note a: S p e c i f i c g r a v i t y = 0 .1 8 4 a t -195°C w ith r e f e r e n c e to a i r = 4
Note b: S o l u b i l i t y in w ater = 0 .0 0 4 a t 0°C

Table 2. ('encrai I'qiiationn for CO KcacLions
CII + 0 C D ) CH +-0H ( E q u a t i o n 1)
CHy, + h V o- CHg
> Ciy +*H
Cll^ 4- Og > CH^O^ + M
-> CO +'0H
'2 "^2
CO + H O -> CO + ’\
(Fqn at i o n 2 a)
( E q u a t i o n 2b)
(Equal ion 3)
CH^O + CH^Og •> 2CH^0 + 0^ ( E q u a t i o n 4)
CH^O 4- Og ■>■ IlgCO 4- HÜ2* ( E q u a t io n 5)
H^CO 4- b V -)■ 4- CO ' (E q u a t i o n 6)
H^CO 4-* 0 H > H^O +»HCO ( E q u a t i o n 7)
HCO + O2 ^ bO ^' 4- CO ( E q u a t i o n 8a)
( E q u a t i o n 8 b )
CO + ' 0 H -> C0 „ +*H ( E q u a t i o n 9)
CO + « 0 H -> C O . + HO • ( E q u a t i o n 10)
(E quation 11)
Air
f u e l o x id a n t d i lu e n t com bustion products
79CHy + n0 2 + n 21 N2 -»• a COg + ( 1 - a ) CO + b HgO (Equation 12)
Z IZÊ. k 79+ 2 - b Hg + n - a - 2 - 2 Og + n 21
D i lu e n t s

8
a c C iv i t io n e n e r g ie s o f 20 k ca l /m o le for CO o x id a t io n by ozone, and
28 k ca l /m o le for o x id a t io n by NO2 , are major impediments to ambient a i r
CO r e a c t io n s . O x id at ion r e a c t io n s in v o lv in g CO as shown in Equations
9-11 in Table 2 do occur in the lower atm osphere, but the o x id a t io n
r a t e s are very slow and the r e a c t io n s do have s i g n i f i c a n t energy
b a r r ie r s ranging from = 51-56 k ca l /m o le ( J a f f e , 1 9 7 0 ) . R eaction r a t e s
range from 4 .1 x 10“ cm s e c “ fo r 0 + CHO to 2 .3 x 10® cm s e c “ for
CHO + O2 .
Many o f the chem ical • r e a c t io n s in the ambient a i r are
photochem ical in nature ( i . e . , are i n i t i a t e d by the a b so rp t io n o f a
photon by an atom, m o lec u le , or f r e e r a d i c a l ) . In the troposphere
chem ical r e a c t io n s are m ainly o f the type in v o lv in g a r e a c t io n w ith
m o lecu la r oxygen and are governed by the f a c t th a t s o la r r a d ia t io n o f
< 2900 R does not reach t h i s area . P h o t o d is s o c ia t i o n r e a c t io n s o f CO2
which y i e l d CO, th e r e f o r e , occur a t the h ig h e r l e v e l s o f th e
s tr a to s p h e r e where s o la r r a d ia t io n o f s u f f i c i e n t energy e x i s t s to
i n i t i a t e the r e a c t io n (Cadle and A l l e n , 1970; S im o n a it is and H e ic k le n ,
1972 — JCP; S im o n a it is and H e ick len , 1972 — IJCK; W einstock and N ik i ,
1972; D a v is , Payne, and S t i e f , 1973; W hitten , Sims, and Turco, 1 9 7 3 ) .
In the OH photochem ical r e a c t io n s th a t govern th e prod uction and l o s s
o f CO in th e troposp h ere and s t r a t o s p h e r e th e e q u i l ib r iu m o f
p r o d u c t io n / lo s s v a r i e s w ith h e ig h t (Junge, S e i l e r , and Warneck, 1 9 7 1 ) .
Green, e t a l . , (1973) in v e s t i g a t e d the p ro d u c t io n o f CO by charged
p a r t i c l e d e p o s i t io n to range from 0 . 1 ton s yr" l (o u te r r a d ia t io n b e l t )
to 50 ton s yr" l (a u ro ra ); however, they concluded th a t th ese amounts do
not c o n tr ib u te s i g n i f i c a n t l y to t o t a l CO p o l l u t i o n l e v e l s .

S tev en a , e t a l . , (1972) conducted s t u d ie s i n v e s t i g a t i n g the
v a r io u s i s o t o p ic s p e c i e s o f atm ospheric CO and determined the e x i s t e n c e
o f a t l e a s t 5 s p e c i e s , 2 o f which are o f the l ig h t -o x y g e n v a r ie t y
( i . e . , l e s s en r ich ed ) and 3 o f the h eavy-oxygen type ( i . e . , more
1^0 e n r ic h e d ) . They determined th e o r i g i n , p r in c ip a l sea so n a l and
m erid io n a l occu rren ce , and e s t im a ted p rod u ction r a te in the northern
hemisphere o f each s p e c i e s , thus p r o v id in g a to o l for o b ta in in g b a s ic
in form ation con cern in g n a tu ra l and an th rop ogen ic p rod uction o f CO.
Equation 12 in Table 2 i s the schem atic form o f the b a s ic
chem ica l eq u a tio n govern ing th e com bustion o f hydrocarbons ( f o s s i l
f u e l s ) and r e l e a s e o f CO to the ambient a i r (Edwards, 1 9 7 4 ) . The
number and com plex ity o f p o s s ib l e r e a c t io n s i s im m ediately apparent and
p ro v id es an e x c e l l e n t example o f the d i f f i c u l t i e s encountered in the
d ete rm in a t io n o f "exact" amounts o f p o l l u t a n t s produced by a l l typ es o f
v e h ic u la r (moving) em is s io n p r o c e s s e s as w e l l as s t a t io n a r y so u rces
u t i l i z i n g hydrocarbon f u e l s . For t h i s r e a so n , g e n e r a l v e h ic u la r and
s t a t io n a r y source em iss io n f a c t o r s ( in c lu d e d in Appendix B) are
u t i l i z e d in environm ental s t u d i e s .
Ambient a i r sampling and a n a ly s i s fo r CO i s c u r r e n t ly performed
u s in g autom ated-continuous sam pling m o n ito rs which employ e i t h e r
in fra re d (IR) or gas-chromatography (GC); they are p laced in m obile
u n i t s which can be moved from s i t e to s i t e . These instrum ents and
u n i t s are ex p en s iv e and req u ire the a t t e n t i o n o f tr a in ed t e c h n ic ia n s ,
c o n s e q u e n t ly , they are employed on a l im i t e d b a s i s by most a g e n c ie s
r e s p o n s ib le for ambient a i r m o n ito r in g . In the GC-type m onitor a
p r o v is io n i s made fo r th e s e p a r a t io n o f CO and CH/, b e fo r e the a n a ly s i s

10
i s performed, s in c e t h i s a n a l y t i c a l procedure c o n v e r ts CO to CH which
i s then a n a ly z ed . M onitoring in stru m en ts o f t e n u t i l i z e "ranges" or
" s c a le s " o f a n a ly s i s ; for exam ple, 0 - 1 ppm i s for use in r e l a t i v e l y
u n p o l lu te d a tm osp h eres , w ith 0 - 1 0 0 0 ppm ranges fo r h e a v i ly p o l lu te d
urban a r e a s . Sampling o f upper atm ospheres i s a ch iev ed by
in s tr u m e n ta t io n p la ced in a ir p la n e s or m e te o r o lo g ic a l o b s e r v a t io n
b a l l o o n s . Older a n a l y t i c a l methods fo r CO in v o lv in g wet ch em istry
tech n iq u e s are now seldom used in ambient a i r m on ito r in g . S e v e r a l
ambient a i r m on itor in g networks e x i s t for the c o l l e c t i o n o f CO d ata in
th e U n ited S t a t e s and on a g lo b a l b a s i s .
S ources
There are two major source c a t e g o r i e s fo r CO: n a tu r a l and
a n th ro p o g en ic . N atu ra l so u rces o f CO p ro d u c t io n in c lu d e the w o r ld 's
o c e a n s , v o l c a n ic g a s e s , n a tu r a l g a s e s , seed g erm in a t io n , marine l i f e
forms, p h o to o x id a t io n o f methane in the tr o p o sp h ere , e l e c t r i c a l s torm s,
f o r e s t f i r e s , p h o t o d i s s o c i a t i o n o f CO2 in th e upper atmosphere (above
70 km), te rp en e o x id a t io n from p la n t s o u r c e s , decay o f c h lo r o p h y l l in
p la n t s , and as a b y-product o f heme c a t a b o l i s m in man and a n im a ls .
T able 3 p ro v id es e s t im a t e s o f CO p ro d u c t io n from in d iv id u a l n a tu ra l
s o u r c e s . T o ta l w or ld -w id e annual e m is s io n q u a n t i t i e s o f CO from
n a tu r a l so u rce s have been e s t im a ted from 7 .2 x 10^ tons yr" l to 3 .4 x
109 tons yr" l ( J a f f e , 1 9 7 0 ) . A lthough the n a tu r a l p rod uction o f CO i s
e s t im a te d a t 3 -5 t im es th a t o f a n th ro p o g en ic so u rce s (W einstock and
N i k i , 1972; S te v e n s , e t a l . , 19 7 2 ), th e n a tu r a l d i s t r i b u t i o n p a t te r n
appears to be f a i r l y uniform; o n ly in a re a s o f h igh an th rop ogen ic

Table 3. Natural Emission Sources and Production Rates of CO
Author( s ) and Year N atural Source Em ission Rate
Robinson 6 Robbins, 1970
Junge, S e i l e r & Warneck,
1971
W einstock and N ik i , 1972
C h a n le t t , 1973
Green, e t a l . , 1973
J a f f e , 1973
Linnenbora, Swinnerton
and Lamontagne, 1973
ocean
oceans
oceans
t o t a l troposphere p roduction o f lA CO by cosm ic r a d ia t io n
troposphere
f o r e s t f i r e s
l i g h t n i n g
sea bubbles
v e g e ta t io n
o x id a t io n o f terp en es
oceans
degradation o f ch lo r o p h y l l
p la n t s - in c lu d in g b i l i nb io s y n t h e s i s from b lu e green a lg a e
Northern Hemisphere oceans
a l l oceans
_ , - 1 2 —1 9 X 10 gm yr
—A “ 2 —10 .5 X 10 g CO cm yr
2 14 -13 .5 X 10 gm CO yr
0 .8 4 ^^CO molecules cm ^ sec ^
. . . 1 5 - 15 X 10 gms yr
7 .2 X 10^ tons y r ^
1 0 0 tons yr ^-3 - 15 X 10 tons yr-2 -15 X 10 tons yr
-1- 54 X 10 m etr ic tons yr14 -1
2 . 2 X 1 0 gms yr
5 .4 X 10^ m etr ic tons yr ^
- 0 .9 X 10^ m etr ic tons yr ^
13 -19 X 10 gm yr14 - 1
2 . 2 X 1 0 gm yr

12
p rod uction arc problem areas or "pockets" o f e le v a te d l e v e l s o f CO
found. P r io r to 1970 when the oceans were f i r s t i d e n t i f i e d as a major
sou rce o f CO through the work o f Sw innerton , Linnenbora, and Lamontagne
(1 9 7 0 ) , em is s io n s from v e h i c l e s and o th er hydrocarbon combustion were
co n s id ered as the p r in c ip a l so u rces o f CO prod uction .
P roduction o f CO by the oceans occurs a t the a i r - s e a in t e r f a c e
as a r e s u l t o f p h y s ic a l - c h e m ic a l marine phenomena and by marine
organisms such as Siphonophores (a type o f j e l l y f i s h ) and b lu e -g ree n
a lg a e . E s t im a te s o f o c e a n ic CO production range from 0 .5 x 10"^ gm CO
cm“ 2 y r ' l (Junge, S e i l e r , and Warneck, 1971) to 9 x lO^Z gm yr"l
(Sw innerton , Linnenbora, and Lamontagne, 1 9 7 0 ) . The average
c o n c e n t r a t io n o f CO in ocean s u r fa c e w ater i s = 1 x 10“5 mg/1 (Robinson
and R obins, 1970), w ith a s o l u b i l i t y range o f 1 ,8 x 10"? to 3 .6 x 10"&
mg CO/1 depending on s a l i n i t y and temperature ( J a f f e , 1 9 7 0 ) . The
g lo b a l su r fa c e area o f the oceans i s = 5 .2 x 10^^ cm2, w ith a
s o l u b i l i t y c o e f f i c i e n t for CO o f 23 x 10“ mg cm” atm~^ a t a s a l i n i t y
o f 35%, temperature o f 25° C, and a t r a n s fe r c o e f f i c i e n t o f 41 x 10“
mg cm2 yr~ l atm“ l (Linnenbora, Sw innerton, and Lamontagne, 19 7 3 ). The
p rod u ction d i s t r i b u t i o n v a r i e s w ith many f a c t o r s , fo r example,
b i o l o g i c a l p r o d u c t i v i t y / a c t i v i t y a t th e ocean s u r fa c e , the chem ical
co m p o sit io n and p h y s ic a l c o n d i t io n o f the ocean s u r fa c e s ,
m e te o r o lo g ic a l c o n d i t io n s , s e a s o n , and d iu rn a l c y c le ; th e r e f o r e , on ly
e s t im a te s or averages are found in the l i t e r a t u r e fo r o ce a n ic
p rod u ction o f CO.
The second la r g e s t n a tu r a l source o f CO production occurs in
the troposp h ere from the o x id a t io n o f methane (Wofsy, McConnell, and

13
McEIroy, 1972; W einstock and N ik i , 1972; Kutranlcr and Baurer, 1973; and
Shiraazaki and C adle, 1 9 7 3 ) . Methane i s produced in areas such as r i c e
paddies and c o a s t a l m arshes, then tra n sp o rted upward in to the
troposphere where i t i s o x id iz e d to CO. D e ta i le d sch em atics /d iagram s
o f th i s p ro cess and r e a c t io n r a t e s are provided in Appendix A.
E stim a tes o f the tr o p o sp h e r ic p rod uction o f CO range from 21 x 10^^
m o lec u le s cm“ 2 s e c “ l (Wofsy, McConnell, and McElroy, 1972) to 0 .8 4 x
1 0 ^ 4 m o lec u le s cm~2 sec~^ (Junge, S e i l e r , and Warneck, 1 9 7 1 ) . Exact
p rod u ction f ig u r e s are d i f f i c u l t to o b ta in because g lo b a l em iss io n
in v e n t o r i e s and budgets and s t r a t o s p h e r ic and tr o p o sp h er ic exp er im en ta l
d a ta i s o f t e n la c k in g .
Anthropogenic so u rce s o f CO c o n s i s t o f f i v e major c a t e g o r i e s
w ith m u l t ip le s u b - c a t e g o r i e s . These f i v e major c a t e g o r i e s and CO
p rod u ction r a t e s are shown in T able 4 . G lobal an thropogen ic em iss io n
in v e n t o r i e s range from 250 x 10^ tons ( J a f f e , 1 9 7 0 ) , to 2 .8 x 10^ tons
a n n u a lly (Robinson and R obbins, 1 9 7 0 ) , to 359 x 10^ m e tr ic tons ( J a f f e ,
1 9 7 3 ) . Again, as w ith n a tu r a l so u rce s o f CO, a c t u a l f i g u r e s are
d i f f i c u l t to determ ine as a r e s u l t o f in co m p lete and/or in a c cu ra te
em iss io n i n v e n t o r i e s . Companies in " d e v e lo p e d - in d u s t r ia l" c o u n tr ie s
are r e lu c t a n t to s t a t e t h e i r f u l l p a r t i c i p a t i o n in CO production for
fe a r o f " p o l lu t io n p e n a l t i e s " ; in a d d i t io n , most government a g e n c ie s
e s t im a te the number o f v e h i c l e s in use and o th er an thropogen ic so u rce s ,
and then c a l c u l a t e CO em is s io n s from th o se e s t im a t e s . In th e
"develop ing" c o u n t r i e s , CO em iss io n in v e n t o r i e s range from n o n - e x i s t e n t
to g r e a t l y d e f la t e d to avoid p o l l u t i o n p e n a l t i e s th a t would re tard
badly needed economic growth. N e v e r th e le s s , even w ith a l l th e s e

Table 4. CO Emission Inventory for Anthropogenic Sources
Author and Year
L ocationand
Year
Anthropogenic Sources
S ta t io n a ry Mobile Combustion Combustion I n d u s tr ia l
S o lidWaste
D isp osa l M isce l la n eo u s T ota l
J a f f e , 1973 USA 1 .9 X 10^ 6 3 .8 X 10® 1 1 . 2 X 10® 7 .8 X 10® 9 .7 X 10® 9 4 .4 X 10®1972 to n s /y r to n s /y r to n s /y r to n s /y r to n s /y r to n s /y r
B u t le r , 1979 USA 4 .0 X 10® 55 .5 X 10^ 5 .7 X 10* 3 .6 X 10^ 9 .2 X 10^ 74 .5 X 10^1970 k g /y r k g /y r k g /y r k g /yr k g /yr k g /y r
CRC, 1972 USA 1.8 3 3 X 10® 63.79 X 10® 9 .7 0 X 10® 9 .2 5 X 10® 15 .4 7 X 10® = 1 0 0 X 10 ®1968 to n s /y r to n s /y r to n s /y r to n s /y r to n s /y r to n s /y r
C h a n le tt , 1973 USA 1 .9 X 10® 6 4 .5 X 10® 10 .7 X 10® 7 .6 X 10® 9 .7 X 10® 1 0 1 . 6 X 1 0 ®1966 t o n s /y r to n s /y r to n s /y r to n s /y r to n s /y r to n s /y r

15
fa c to r s in mind, Che e x i s t i n g CO a n th ro p o g en ic em iss io n in v e n t o r i e s do
b a la n ce r e l a t i v e l y w e l l w ith observed g lo b a l l e v e l s o f CO.
S in c e 95% o f the w o r ld 's g a s o l i n e consumption occurs in the
n orthern h em isphere , and m ob ile com bustion s o u r c e s , i . e . , v e h i c l e s ,
com prise the major source o f g lo b a l ly -p r o d u c e d CO, one would e x p e c t the
h ig h e s t ambient a i r l e v e l s o f CO to occur in the n orthern hem isphere,
and they do ( B u t l e r , 1979; Junge, S e i l e r , and Warneck, 1971; J a f f e ,
1 9 7 3 ) . S i x t y - t h r e e p ercen t o f the a n th ro p o g en ic CO e m is s io n s in the
U nited S t a t e s are a t t r ib u t e d to th e com bustion o f f o s s i l f u e l s in
v e h i c l e s ( J a f f e , 1 9 7 0 ) . E quation 12 in T able 2 p ro v id e s a b e t t e r
u n d ersta n d in g o f th e c o n t r ib u t io n o f i n t e r n a l com bustion en g ine
v e h i c l e s to th e CO em iss io n in v e n to r y .
Ambient a i r p o l l u t a n t s r e s u l t from the com bustion products
formed, and the d i l u e n t s undergo fu r th e r r e a c t io n s in the ambient a i r
to produce NOjj and 0 ^ s p e c i e s th a t are major components o f the urban
phenomena known as "smog". In E quation 12 CO and w ater a re the
p rod ucts o f p a r t i a l o x id a t io n o f th e hydrocarbons ( f u e l ) . S in ce the
p r o p o r t io n s o f CO2 , CO, H2 O, and H2 produced are dependent on the
" r ich n e ss" or " le a n e ss" o f the co m b u st ib le m ixture ( f u e l and a i r ) , the
tem perature and p ressu re c o n d i t io n s p r e s e n t a t the time o f com bustion ,
and the co m p o s it io n o f the f u e l , i t i s im p o ss ib le to w r i t e a s i n g l e
balanced chem ica l eq u a tio n f o r f o s s i l f u e l com bustion by th e i n t e r n a l
com bustion e n g in e . On a w or ld -w id e b a s i s , v e h i c l e s are the la r g e s t
s i n g l e sou rce o f an th rop ogen ic CO ( J a f f e , 1 9 7 3 ) .

16
Sinks
E a rly s t u d ie s o f ambient a i r r e a c t io n s and budgets o f CO led
i n v e s t i g a t o r s to a s s ig n atm ospheric r e s id e n c e tim es o f as high as 5
y e a r s to CO (R obbins, Borg, and R obinson, 1968); however, subsequent
r e s e a r c h e r s e s t a b l i s h e d an atm ospheric r e s id e n c e time o f 0 . 1 year
( J a f f e , 1970; Levy, 1 9 7 3 ) . I t was n o ted , however, th a t ambient a ir CO
l e v e l s are r e l a t i v e l y s t a b l e a lthough g lo b a l CO em is s io n s from v e h i c l e s
are in c r e a s in g . Work r a p id ly turned a t t h i s p o in t to sea r ch in g fo r CO
" s in k s" , i . e . , mechanisms or a rea s r e s p o n s ib le fo r the removal o f CO
from the atm osphere. Work by Inman, I n g e r s o l , and Levy (1971) showed
s o i l to be a major g lo b a l "sink" for CO through th e m eta b o lic
a c t i v i t i e s o f b a c t e r i a such as M e th a n o sa r ic in ia b a r k e r r i ,
Methanobacterium formicum. B a c i l lu s o l i g o c a r b o p h i l i u s , and Costridium
w e lc h i . C on sider ing th a t for the U n ited S t a t e s a lo n e the t o t a l s o i l
s u r fa c e i s 7 ,7 9 2 ,5 3 3 km^, th a t th e average c a p a c i ty o f the g lo b a l
amount o f s o i l to absorb CO i s 596 x 10^ m etr ic tons y r~ l (o r 6 .5 tim es
the U nited S t a t e s annual CO p rod uction r a t e ) , and th a t the average s o i l
a c t i v i t y i s 191.1 m e tr ic tons CO yr“ mi“2 (Inman, I n g e r s o l , and Levy,
1 9 7 1 ) , i t i s c l e a r l y e v id e n t th a t s o i l does indeed se r v e as a major
"sink" fo r CO. I t i s i n t e r e s t i n g to n ote the r e d u c t io n s in s o i l
s u r f a c e , i . e . , p o t e n t i a l "sink" s u r fa c e , in urban a rea s h av ing e le v a t e d
CO l e v e l s .
The o th er major "sink" was found to be the s tr a to s p h e r e where
the p r in c ip a l type o f r e a c t io n in v o lv e s OH o x id a t io n o f CO (Pressman
and Warneck, 1970; Levy, 1973; Kummler and Baurer, 1973; Shimazaki and
C ad le , 1973; Junge, S e i l e r , and Warneck, 1971; Wofsy, McConnell and

17
McElroy, 1972; W hitten , Sims, and Turco, 1 9 7 3 ) . D e ta i le d
schem atics /d iagram s o f t h i s p ro cess are found in Appendix A. Hydroxyl
(OH) r a d ic a l s are u s u a l ly found above 70 km ( i . e . , in the
s t r a t o s p h e r e ) . The exchange r a t e from the troposphere to the
s tr a to s p h e r e i s 6 x 10^7 m o le c u le s cm s e c " l , thus p ro v id in g for
tra n sp o rt o f CO gen erated in the troposphere to th e s t r a to s p h e r e where
the r e a c t io n between CO and OH p roceeds a t a r e a c t io n r a te c o e f f i c i e n t
o f 1 X 10"3 cm m o lecu le" ! s e c " ! (Pressman, and Warneck, 1970).
Pressman and Warneck (1970) e s t im a ted th a t the s tr a to s p h e r e consumes
11% o f the y ea r ly t o t a l CO in v e n to ry o f the tro p o sp h ere . Of c o u r s e , as
w ith c a l c u l a t i o n s for CO s o u r c e s , c a l c u l a t i o n s for CO "sinks" are
approxim ations due to the la ck o f ex p er im en ta l d a ta . I t i s i n t e r e s t i n g
to n o te , however, th a t the u se o f models and methods u t i l i z i n g g lo b a l
c o n c e n tr a t io n s g e n e r a l ly v e r i f y the p resen ce and c a p a c i t i e s o f th ese
s in k s and so u rce s .
D i s t r ib u t i o n
Because CO em iss io n in v e n t o r i e s a r e , a t b e s t , o n ly e s t im a t e s ,
ambient a i r c o n c e n tr a t io n s determ ined by a c t u a l measurements are the
data most commonly used fo r abatement and c o n tr o l p rocedu res . G lobal
CO l e v e l s vary g e o g r a p h ic a l ly and d em o g ra p h ica lly . The CO l e v e l s are
lo w es t in non-urban a r e a s , ranging from 0 .0 2 5 ppm in the northern
P a c i f i c Ocean ( J a f f e , 1973) to 0 .3 ppm in the t r o p i c a l A t l a n t i c Ocean
(Sw innerton , Linnenbom, and Lamontagne, 1 9 7 0 ) . C o n cen tra tion s in urban
atmospheres range from 1 to > 140 ppm ( J a f f e , 1 9 7 0 ) . T y p ica l 8 -hour
averages o f CO l e v e l s from v a r io u s c i t i e s in th e U nited S t a t e s in d ic a t e

18
c o n c e n t r a t io n s oE 115 ppm in heavy downtown t r a f f i c , 75 ppm on
exp ressw ays , 40 ppm in c e n t r a l commercial and i n d u s t r i a l a r e a s , and 23
ppm for r e s i d e n t i a l areas ( J a f f e , 1 9 7 3 ) . M u lt ip le s t u d ie s in urban
a rea s have in d ic a te d th a t CO l e v e l s arc c l o s e l y c o r r e la t e d to t r a f f i c
volumes and m e te o r o lo g ic a l c o n d i t i o n s . A ta b u la r summary o f 40 o f
th e s e s t u d ie s i s found in Appendix C. In g e n e r a l , as t r a f f i c volumes
in c r e a s e and m e te o r o lo g ic a l c o n d i t io n s become more s t a b l e , CO l e v e l s
i n c r e a s e .
G e o g ra p h ica l ly , background l e v e l s o f CO are h ig h er in the
northern hemisphere (0 .1 5 - 0 .2 0 ppm) (Kummler and Baurer, 1973) than
in the southern hemisphere (0 .0 6 - 0 .1 4 ppm) (W einstock, 1 9 6 9 ) . The
average g lo b a l background l e v e l o f CO i s a p p rox im ate ly 0 .1 ppm (Inman,
I n g e r s o l l , and Levy, 1971; W einstock , 1969; Robinson and Robbins, 1970;
Sw innerton , Linnenbom, and Lamontagne, 1970; J a f f e , 1 9 7 3 ) . Ambient a i r
c o n c e n tr a t io n s o f CO a t the North P o le have been measured a t 55 ppb,
and a t th e South P o le 43 ppb (N ew ell and Gauntner, 1 9 7 9 ) . R obbins,
Borg, and Robinson (1968) rep o rted CO l e v e l s o f 30-80 ppb in su b s id en ce
a ir m asses and 0 .3 ppm CO in s u r fa c e t r a j e c t o r y a i r m a sses , w ith l e v e l s
o f 0 .5 - 1 .0 ppm and g r e a te r in a i r masses o v er c o n t in e n t a l North
America. The southern hem isp here , a rea s over th e o c e a n s , and r u r a l
a rea s in the northern hemisphere c o n s i s t e n t l y have lower l e v e l s o f CO
in th e ambient a i r . By comparing th o se a re a s th a t have low or non
e x i s t e n t human p o p u la t io n s and/or low te ch n o lo g y b a ses w ith a rea s
h aving h igh p o p u la t io n d e n s i t i e s and accompanying te c h n o lo g y , i t i s

19
ea sy to observe the e f f e c t s o f humans and tech n o lo g y on the e l e v a t i o n
o f CO l e v e l s , p a r t i c u l a r l y on a r e g io n a l b a s i s .
C o n cen tra t io n s o f CO a l s o vary in d i s t r i b u t i o n w ith a l t i t u d e .
In a s tudy by Goldman, e t a l . , ( 1 9 7 3 ) , CO l e v e l s were observed to
d e c r e a s e from 0 .0 8 ppm to 0 .0 4 ppm between a l t i t u d e s o f 4 to 15 km.
R ates o f CO p ro d u ct io n a ls o change w ith a l t i t u d e as a r e s u l t o f
tr a n sp o r t from gro.und l e v e l e m is s io n s o u r c e s , and the c a p a c i t y o f the
trop osp h ere to se r v e as a so u rce and th e s t r a to s p h e r e to ser v e as a
s in k fo r CO.
G lobal ambient a i r CO l e v e l s are co n s id ered as hav ing remained
r e l a t i v e l y s t a b l e fo r the l a s t 2000 y e a r s (R obbins, Cavanagh, and
S a la s , 1973; Pressman and Warneck, 1970; McConnell, McEIroy, and Wofsy,
1971; Inman, I n g e r s o l l , and Levy, 1 9 7 1 ) . One o f the most i n t e r e s t i n g
s t u d i e s on the v a r i a t i o n s o f CO l e v e l s w ith time was conducted by
R obbins, Cavanagh, and S a la s (1 9 7 3 ) . Samples were taken from the i c e
caps o f Greenland and A n a r t ic a and a n a ly zed to r CO l e v e l s found in the
a i r b ub b les trapped in "blue i c e " . A lthough CO l e v e l s o f 0 .1 5 ppm CO
were found in samples dated a t 500 B .C . , and 0 .3 1 ppm fo r 1850 A.D.
sa m p les , the au thors d e c l in e d to a s s i g n an upward trend in CO l e v e l s in
th e ambient a i r s in c e the true " o x id a t io n -b r e a th in g " mechanisms in the
i c e were not c l e a r l y understood and th e d i f f e r e n c e was n o t c o n s id e red
s u f f i c i e n t l y s i g n i f i c a n t to d e c la r e as an in c r e a s in g tren d .
B i o l o g i c a l E f f e c t s
In any d i s c u s s i o n o f ambient a i r CO i t would be rem iss not to
in c lu d e a b r i e f d i s c u s s i o n o f b io c h e m is tr y and h e a l th e f f e c t s . Current

20
a i r p o l l u t i o n standards were based in p art on the e f f e c t s o f p o l lu t a n t s
on human h e a l t h . Carbon monoxide produces ad verse human h e a l th e f f e c t s
(and death ) by combining w ith haemoglobin in the b loodstream and
forming m e ta - s ta b le compounds (carboxy haem oglobin or COHb ex p re ssed as
percen t c o n c e n tr a t io n s in b lo o d ) which i n t e r f e r e w ith oxygen tra n sp o rt
in the body. The CO has an a f f i n i t y fo r haemoglobin 200 tim es s tr o n g e r
than oxygen (B u t le r , 19 7 9 ). At 10-20% COHb l e v e l s the f i r s t symptoms
o f carbon monoxide p o is o n in g occur — nausea , h ea d a ch es , and f a t ig u e ;
a t 30-40% — l o s s o f memory and muscular c o n tr o l ; a t 50-60% — death
w ith in hours; a t 80-90% — death w ith in an hour; and a t > 90% — death
w ith in m in utes . Death at 40% and g r e a te r can occur in the e l d e r l y ,
in f irm ed , or i n f a n t s . Death r e s u l t s from a s p h y x ia t io n s i n c e CO
r e p la c e s oxygen in the b lood stream , and permanent n eu ra l damage i s o f
the g en er a l type en cou n tered in oxygen d e p r iv a t io n c a s e s . Complaints
o f nausea , h ead ach es , f a t i g u e , and d i z z i n e s s are commonly exp ressed by
p ersons exposed to e l e v a t e d CO l e v e l s in heavy t r a f f i c d r iv in g
c o n d i t io n s such as th ose found on crowded freeways or in downtown
c e n t r a l b u s in e s s d i s t r i c t s .
Normal background COHb l e v e l s in non-smokers range from 1-2%,
but can in c r e a s e by as much as 3.4% a f t e r 2 hours o f exposure t o 100
ppm, or 5 hours to 50 ppm l e v e l s found in heavy t r a f f i c volume areas
(W right, R a n d ell , and Shephard, 1 9 7 3 ) . Godin, W right, and Shephard
(1972) c a l c u la t e d a 0.4% in c r e a s e o f COHb in a t y p i c a l non-smoker a f t e r
a 40 minute d r iv e exposuré to 20 ppm; 1.8% a f t e r a 1 hour d r iv in g
exposure to 60 ppm; or 0 . 1 - 0 . 8 % a f t e r a 10 m inute w alk in g exposure to
20-160 ppm. S tu d ie s have shown th a t CO l e v e l s are g e n e r a l ly h ig h e r

21
in s id e v e h i c l e s moving in heavy t r a f f i c . They a re , however, o n ly 30-
80% o f the amount found in "curbside" l e v e l s in moderate t r a f f i c (B r ic e
and R o e s s le r , 1966; P e te r se n and Sabersky, 1975;, C layton , Cook, and
F r e d r ick , 1960; C o lw i l l and Hickman, 1980; Godin, W right, and Shephard,
19 7 2 ).
Although the h a l f - t im e o f CO e l im in a t io n i s 4 -5 hours (P e ter so n
and S tew a r t , 1970; Godin, Wright, and Shephard, 1 9 7 2 ) , i t i s r e a d i ly
apparent that p eo p le having o c c u p a t io n a l exposures o f hours in heavy
t r a f f i c a rea s can e x p e r ie n c e cu m u la tive in c r e a s e s o f COHb l e v e l s . In
a d d i t io n to o cc u p a t io n a l e x p o su res , the re cen t trend toward outdoor
r e c r e a t io n such as jo g g in g has provided an a d d i t io n a l avenue o f
ex p o su re . Honigman, Cromer, and Kurt (1982) found accum ulation o f COHb
in jo g g e r s exposed to CO l e v e l s o f 7 ppm or g r e a te r . A standard r u le
o f 0.16% COHb per ppm CO i s used in e s t im a t io n s o f COHb l e v e l s
r e s u l t i n g from CO exp osu res (Ramsey, 19 7 0 ).
One o f the major q u e s t io n s a s s o c ia t e d with the d eterm in a tio n o f
COHb l e v e l s r e s u l t i n g from CO exp osu res concerns the e f f e c t o f th ese
l e v e l s on d r iv in g performance and o th er motor fu n c t io n s . Some o f the
human r e a c t io n s a s s o c ia t e d w ith d r iv in g and produced by CO exposures
are s low er r e a c t io n tim es to v i s u a l s t im u lu s , narrowing o f v i s i o n
f i e l d , impairment in c o n tr o l p r e c i s i o n , limb c o o r d in a t io n , and c a p a c i ty
to d is c r im in a te sh o r t time i n t e r v a l s , and d e t e r i o r a t i o n s in brake
r e a c t io n tim e, n ig h t v i s i o n , g la r e v i s i o n and recovery and depth
p e r c e p t io n (Beard and Wertheim, 1967; McFarland, 1973; W right, R a n d e l l ,
and Shephard, 1973; Hosko, 1970; Ramsey, 19 7 0 ). These e f f e c t s are
c o n t in g e n t upon many f a c to r s such as the s u b j e c t ' s age and p h y s ic a l

22
c o n d it io n ; d uration and q u a n t i ty o f exposure; and s y n e r g i s t i c e f f e c t s
w ith o th er ambient a i r p o l l u t a n t s . The d isagreem ent a r i s e s over what
p ercen tage o f COHb r e s u l t s in impairment or d e t e r i o r a t i o n s u f f i c i e n t to
produce u n sa fe d r iv in g p a t t e r n s . Most authors agree th a t g ro ss changes
are not apparent a t 6 - 1 1 % a lth o u g h s u b t le changes may occur a t l e v e l s
a s low as 3% COHb. S tu d ie s o f the r e la t i o n s h i p s o f s t r e e t l e v e l CO
c o n c e n tr a t io n s to t r a f f i c a c c id e n t s have f a i l e d to c o m p le te ly r e s o lv e
t h i s q u e s t io n (Ury, P er k in s , and G oldsm ith, 1972; C la y to n , Cook, and
F r e d r ic k , 1960).
A sid e from the e f f e c t s o f exp osu res to the segment o f the
g en er a l p o p u la t io n in v o lv ed in d r iv in g , the e f f e c t s o f CO exposures on
th a t segment o f the g en er a l p o p u la t io n s u f f e r i n g from c i r c u l a t o r y -
coronary problems have a l s o been s t u d ie d . S tu d ie s have re v ea led th a t
exp osu res to e l e v a t e d CO l e v e l s have ad verse h e a l t h e f f e c t s on
cardiopulmonary f u n c t io n s , and on th o se i n d iv id u a l s s u f f e r in g from
angina p e c t o r i s (due to coronary a r t e r y d i s e a s e ) , v a s c u la r d i s e a s e s
i n v o lv in g m yocardial i n f a r c t i o n s , and ch ro n ic o b s t r u c t i v e pulmonary
d i s e a s e (Aronow, F e r l in z , and G lau ser , 1977; Aronow, Stemmer, and
I s b e l l , 1974; Topping, 1977; M ostardi and Leonard, 1974; Anderson, e t
a l . , 1973; Cordasco and Van O rdstrand, 1977; M i t c h e l l , e t a l . , 1979;
Shy, H a sse lb la d , and Burton, 1 9 7 3 ) . These e f f e c t s , a g a in , are
dependent on numerous f a c t o r s such as freq uency , d u r a t io n , and l e v e l o f
exposure; age , in d iv id u a l m e ta b o l ic and p h y s ic a l c h a r a c t e r i s t i c s , and
d i s e a s e or d i s a b i l i t y c a se h i s t o r y ; and s y n e r g i s t i c a c t io n s o f o th er
environm ental p o l l u t a n t s .

23
Modeling
In tr o d u c t io n
To d e v i s e an e f f e c t i v e abatement and c o n tr o l s t r a t e g y for
ambient l e v e l s o f CO, e s p e c i a l l y during prolonged in v e r s io n p e r io d s ,
exam ination o f the h i s t o r i c a l p r o f i l e o f ambient a i r l e v e l s o f CO and
the m e te o r o lo g ic a l and t r a f f i c param eters known to in f lu e n c e th ose
l e v e l s ( s e e r e f e r e n c e s in c lu d ed in Appendix C summary c h a r t ) i s needed.
Data a n a ly s e s i s o f l i t t l e v a lu e u n le s s the r e s u l t s are in t e r p r e t e d and
employed in a c o h e s iv e e x p r e s s io n th a t dem onstrates c a u s e - e f f e c t
r e l a t i o n s h i p s . Such a v e h i c l e o f e x p r e s s io n i s termed a "model". I t
should be noted th a t w h ile th e primary g o a l o f any model i s to e x p r e s s
an observed or t h e o r e t i c a l phenomena on the b a s i s o f input d a ta , model
f a i l u r e may r e s u l t n o t from improper i n t e r p r e t a t i o n s o f d a ta , but
ra th e r from i n s u f f i c i e n t d ata q u a n t i ty or q u a l i t y . In en v ironm enta l
s t u d ie s i t i s o f p a r t i c u la r im portance to r e c o g n iz e t h i s f a c t s i n c e
many d e c i s i o n s in v o lv in g en v ironm enta l management are based on models
fo r which the input d ata b ases a r e in a d eq u a te .
I fh i le th e o p e r a t io n a l s t r u c t u r e o f governm ental a g e n c ie s
r e s p o n s ib l e fo r a i r q u a l i t y c o n t r o l i s d es ig n ed to produce a
co o rd in a ted group o f s p e c i a l i s t s in v a r io u s a reas o f a i r q u a l i t y
management; o f t e n , however, the r e s u l t i s the co m p a rtm en ta liz in g o f
a c t i v i t i e s among s e c t i o n s . T his i s shown in F igu re 1. A l l too o f t e n
d ata i s c o l l e c t e d by one s e c t i o n , s to r e d by a n oth er s e c t i o n , and
ignored by the rem aining s e c t i o n s o n ly to be r e s u r r e c te d in time to
produce some requ ired r e p o r t . Although th e m a jo r i ty o f work o f an a i r

24
c o n tr o l agency i s data c o l l e c t i o n , the a c t i v i t y r e c e iv in g the most
p u b l i c i t y i s en forcem en t. The enforcem ent s e c t i o n r e c e iv e s c i t i z e n s '
co m p la in ts and must contend w ith media p u b l i c i t y a tten d a n t to p o in t
source v i o l a t i o n s i t u a t i o n s . The t r a d i t i o n a l p erc ep t io n has been th a t
p o in t source e m is s io n s are the major ca u ses o f a i r q u a l i t y
d e t e r i o r a t i o n in an a re a . While t h i s may or may not be tr u e , i t has
caused the development o f d i f f u s i o n / d i s p e r s i o n p o in t source models.
C o n cu rren tly , d i f f u s i o n / d i s p e r s i o n l i n e sou rce m odels have been
d ev e lo p ed . Ambient a i r models in c o r p o r a te p o r t io n s o f p o in t and l i n e
sou rce models but th ey are e s s e n t i a l l y d i f f e r e n t in th a t they f i r s t
c o n s id e r the e x i s t i n g (o r h i s t o r i c a l p r o f i l e ) ambient a i r q u a l i t y and
then are h e u r i s t i c a l l y - d e r i v e d on th e b a s i s o f s t a t i s t i c a l exam inations
o f in f lu e n c in g f a c t o r s such as m eteo ro lo g y and e m is s io n s o u r c e s . E arly
s t a t i s t i c a l models were the fo r e -r u n n er o f t h i s type o f model, and
b eca u se h ig h -sp ee d computers were not commonly a v a i l a b l e , i t was most
d i f f i c u l t to produce f i n a l u n i f i e d m odels .
Three b a s ic types o f a i r p o l l u t i o n models have been i d e n t i f i e d
by L iu , Whitney, and Roth (1976) as 1) s t a t i s t i c a l , 2) f l u i d , and
3) n um erica l. In th e s t a t i s t i c a l model th e atmosphere i t s e l f i s used
to prov ide the req u ired in fo r m a t io n . F i r s t , a i r q u a l i t y data i s
c o l l e c t e d w ith accompanying m e te o r o lo g ic a l and e m is s io n d ata to form
the d ata b a s e . These d ata a re then ana lyzed fo r tren ds and
c o r r e l a t i o n a l r e l a t i o n s h i p s among the v a r io u s components forming the
data b a se . F lu id models employ la b o r a to r y d e v ic e s to s im u la te
atm ospheric b eh a v io r . T his type o f m odeling i s e x p en s iv e and r e q u ir e s
s t r in g e n t c o n tr o l o f la b o r a to ry t e s t i n g . F lu id models have been

25
employed in smog chamber and wind tunnel s t u d i e s . Numerical models use
a s e t o f eq u a t io n s to m a th em a tica l ly r e p r e se n t atm ospheric p r o c e s s e s .
Numerical models have the advantage o f b e in g l e s s ex p en s iv e than
s t a t i s t i c a l and f l u i d m odels , and l e s s tim e i s req u ired for data
c o l l e c t i o n . Numerical models used in a i r q u a l i t y control-management
b eg in w ith the assum ption th a t a p a r t i c u la r p o l lu t a n t or environm ental
f a c to r a d v e r s e ly im pacts a i r q u a l i t y in a d e f in e d a rea . "Impacting
fa c to r" i s a l s o a b a s ic con cept o f d i f f u s i o n / d i s p e r s i o n m odels.
D i f f u s i o n /D i s p e r s io n Models
The d i f f u s i o n model has been fr e q u e n t ly u sed , in f a c t , in a i r
q u a l i t y management the term " d i f f u s i o n m odeling" has become synonymous
w ith a i r p o l l u t i o n m od elin g . The terms " d i f fu s io n " and " d isp ers io n "
are both used in terc h a n g ea b ly in d e s c r ib in g the spread o f a p o l lu t a n t
or p o l lu t a n t s in th e ambient a i r . In a s t r i c t t e c h n i c a l d e f i n i t i o n ,
" d if fu s io n " d en o tes the movement or spread o f p o l l u t a n t s through an
ambient a i r mass, w h i le " d isp ers io n " i s used to d e s c r ib e the spread o f
a s p e c i f i c p o l lu t a n t in t o the ambient a i r from a s p e c i f i c source (p o in t
or l i n e ) .
D i f f u s io n m odeling has on ly been f u l l y d evelop ed in the l a s t 20
y e a r s . Some o f the f i r s t d i f f u s i o n m odels were deve lop ed by Holland in
1953, Lucas in 1958 (B en a r ie , 19 8 0 ), and B r e n k ie l in 1956 (Turner,
1 9 8 0 ) . The rapid developm ent and use o f d i f f u s i o n / d i s p e r s i o n models i s
b e s t demonstrated by a r e c e n t com puterized l i t e r a t u r e search which
l i s t e d over 5000 r e f e r e n c e s when the terms d i f f u s i o n - d i s p e r s i o n -
m a th e m a tica l-s im u la t io n -m o d e l-m o d e l in g were used . With t h i s number o f

26
r e fe r e n c e s a v a i l a b l e in the l i t e r a t u r e , i t was im p o ss ib le w ith in the
l i m i t s o f t h i s study to rev iew a l l o f them. E x c e l l e n t summaries o f the
major d i f f u s i o n / d i s p e r s i o n models c u r r e n t ly in use. are g iven by Turner
(1 9 8 0 ) , Benarie (1980) and the CRC Handbook o f Environm ental C on tro l ,
Volume I , A ir P o l l u t i o n (1 9 7 2 ) .
Modeling gained added s t a t u s and impetus by the passage o f the
Clean A ir Act Amendments o f 1977 which c a l l e d for a co n fe ren ce on a i r
p o l l u t i o n modeling w i th in 6 months and a t l e a s t every three years
t h e r e a f t e r . In P art C co n cern in g P re v en t io n o f S i g n i f i c a n t
D e t e r io r a t io n (PSD) r e g u l a t i o n s , i t was s ta t e d th a t the model or models
used under s p e c i f i e d c o n d i t io n s must be i d e n t i f i e d . Both the S ta te
Im plem entation Plan (SIP) and PSD r e g u la t io n s e c t i o n s req u ire s t a t e
a n a ly s i s o f source impacts on a i r q u a l i t y in a f f e c t e d a r e a s . These
requirem ents are b e s t met by the use o f a d i f f u s i o n or d is p e r s io n
model; th e r e f o r e , fo r the s tu d e n t , l o c a l agency o f f i c i a l , or any o th er
person confronted w ith the need to e v a lu a te or s o l v e an a i r p o l l u t i o n
problem in a s p e c i f i c a rea , one o f th e f i r s t p la c e s to look fo r
m odeling in form ation i s the s t a t e a i r c o n tr o l board or group.
The Texas A ir C ontrol Board (TACB) u s e s two typ es o f p o in t
source models: 1) the Texas E p is o d ic Model (TEM) which i s d es ig n ed to
p r e d ic t g r o u n d - le v e l sh o r t - t e r m c o n c e n t r a t io n s o f atm ospheric
p o l lu t a n t s ; and 2) the Texas C l im a t o lo g ic a l Model (TCM) which i s
d es ig n ed to p r e d ic t g r o u n d - le v e l , lo n g -term c o n c e n t r a t io n s . I t i s
c l e a r l y s ta te d in both models th a t they do not make an adjustm ent for
d i f f e r e n c e s in t e r r a in e l e v a t i o n between so u rces and/or r e c e p to r s
(TACB, 1980a; TACB, 1979b).

As p r e v io u s ly star.ed, d if fu .s io t i / c l i s p e r s io n m odeling i s based on
the assum ption th at a . s p e c i f ic p o in t or l i n e sou rce prov ides the major
impact on e x i s t i n g a i r q u a l i t y . B enarie (1 9 8 0 ) l i s t s the f o l lo w in g 6
c a t e g o r i e s o f d i f f u s i o n / d i s p e r s i o n models: I ) m u lt i - s o u r c e Gaussian
plume - sh o r t term, 2) lon g-term plume, 3) r o l l b a c k , 4 ) c o n s e r v a t iv e
volume e lem en t , 5) f o r e c a s t i n g , and 6 ) box-m odcls ( s i n g l e and m u l t i ) .
In a p p ly in g the in d iv id u a l e lem en ts o f any model most u s e r s tend to
assume s t e a d y - s t a t e and/or homogeneous c o n d i t io n s for the two most
c r i t i c a l e lem en ts - i n i t i a l c o n d i t io n s and background. The background
and p art o f the i n i t i a l c o n d i t io n e lem en ts c o n s i s t o f an h i s t o r i c a l and
cu rr en t p r o f i l e and a n a ly s i s o f ambient a i r c o n d i t io n s in th e a re a .
Without an h i s t o r i c a l and cu rren t p r o f i l e and a n a ly s i s o f th e ambient
a i r o f an area as provided by a s t a t i s t i c a l a n a l y s i s model, the f i r s t
assum ption o f d i f f u s i o n / d i s p e r s i o n m od elin g , i . e . , th e assum ption o f
th e i d e n t i t y o f th e parameter p ro v id in g th e major impact on a i r
q u a l i t y , can not be made w ith a s u f f i c i e n t d egree o f c e r t a i n t y . This
may be one o f th e major rea so n s fo r d i f f u s i o n / d i s p e r s i o n model f a i l u r e
an d/or i n s u f f i c i e n c y . The s e l e c t i o n and u se o f a d i f f u s i o n / d i s p e r s i o n
m odel, t h e r e f o r e , should not be i n i t i a t e d u n t i l a f t e r an e v a lu a t io n o f
p a s t and e x i s t i n g a i r p o l l u t i o n c o n c e n tr a t io n s in th e area has been
com pleted . The b a s i s o f t h i s e v a lu a t io n can be the usage or
development o f a s t a t i s t i c a l model.
S t a t i s t i c a l Models
S t a t i s t i c a l models for u se in a i r p o l l u t i o n s t u d ie s are o f
l im i t e d q u a n t i ty and have been co n fin ed to the fo l lo w in g main areas:

1 ) c a l c u l a t i o n o f moan c o n c e n tr a c io n s fo r p o l lu t a n t s for v a r io u s times
a nd/or g e o g r a p h ic a l a rea s (B erth ouex , 1931; Cether and S e ip , 1579;
J o n es , D a n ie l s j and R ich , 1576; Kushner, 1976; Ott and Mage, 1981;
P a s s i , 1976); and 2) c o r r e l a t i o n o f a i r p o l l u t i o n l e v e l s w ith o th er
f a c t o r s th a t may impact on , or be impacted by, th ese l e v e l s (McCormick
and X in ta r a s , 1962; Chang, Norbeck, and W einstock , 1930; C o l l i n s , Kasap
and H ollan d , 1971; G o ld s te in and D ulberg , 1981; Smith and Egan, 1 9 7 9 ) .
S t a t i s t i c a l models are o f the s t a t i s t i c a l eq u a tio n form and may
be c l a s s i f i e d as l i n e a r or n o n - l i n e a r . "Linear" means th a t a l in e a r
r e l a t i o n s h i p e x i s t s between th e dependent (Y) v a r ia b le and the
independent v a r i a b l e ( s ) (X or X„) in th e e q u a t io n . L i n e a r i t y i s a l s o
p r e se n t i f the v a r i a b l e s , a f t e r b e in g transform ed, are in h e r e n t ly
l i n e a r in th e m se lv e s . The problem o f l i n e a r i t y in a i r p o l l u t i o n
r e l a t i o n s h i p s i s o f t e n o v er lo o k ed or ig n o r ed , and data a n a ly s i s i s
o f t e n conducted under the au tom atic assum ption o f " l i n e a r i t y " . The
b a s ic typ es o f e q u a t io n s used in m odeling have the fo l lo w in g g en er a l
forms.
l i n e a r Y = + g^x^ + er r o r (E q u ation 13)
e x p o n e n t ia l Y = e^® ^ ^1^1 + • • « + er ro r (E q u ation 14)
r e c i p r o c a l Y = g - + g ^ ^ \ . - g x " " e r r o r (E q u a t io n 15) n n
m u l t i p l i c a t i v e Y = ax^^ ’ x^^ ' x^^ e r r o r (E q u a t io n 16)
q u a d r a t ic Y = gg + PiXi + 8 2 ^ 2 + 6 3 ^ 1 + 6 4 X2 ^
+ 8 5 X2x 2 4 e r r o r (E quation 17)

e x p o n e n t i a l c o m p l i c a t e d Y =1 + e G o + S l x i + S o x z + t T r o r ( K q u a t i o n 18)
Y = f'O + Bi e + er r o r (E quation 19)
Y = $0 4- B jx i + 8 2 ( 6 3 )^+ e r r o r (E q u a t io n 20)
The developm ent o f a s t a t i s t i c a l model depends h e a v i l y upon n
b a s ic d e s c r i p t i v e s t a t i s t i c a l a n a l y s i s / e v a l u a t i o n o f raw d a ta . T his
f i r s t phase o f the d e s c r i p t i v e s t a t i s t i c s e v a lu a t io n in c lu d e s the use
o f s c a t t e r p l o t s o f the raw d a ta , frequency c h a r t s and t a b l e s , ch a r ts o f
th e means, and t e s t s fo r n o r m a l i ty . Dependent on the r e s u l t s o f th e se
t e s t s a d d i t io n a l d e s c r i p t i v e s t a t i s t i c s such as s ta n d a r d iz in g o f the
means may be in d ic a t e d . Once th e s e t e s t s have been com pleted , the
a c t u a l model developm ent may b eg in ( A f i f i and Azen, 1972; Bard, 1974;
Box and T ia o , 1973; Conover, 1980; D an ie l and Wood, 1971; D a n ie l and
Wood, 1980; Draper and Smith, 1966; Ortega and R h e in b o ld t , 1970; Sokal
and R o h lf , 1969; W eisberg, 19 8 0 ) .
A summary rev iew o f a i r p o l l u t i o n s t u d ie s o f CO in v o lv in g the
u se o f s t a t i s t i c s and s t a t i s t i c a l models has been in c lu d ed in Appendix
C. Such s t u d ie s t r a d i t i o n a l l y have u t i l i z e d on ly segm ents o f the
e n t i r e problem in th e s t a t i s t i c a l a n a l y s i s . There i s , t h e r e f o r e , a
need fo r the development o f a com prehensive form o f a s t a t i s t i c a l model
to examine a l l f a c t o r s c o n tr ib u t in g to the ambient a i r p r o f i l e o f an
a rea . Such a s t a t i s t i c a l model should: 1) e v a lu a te ambient a i r
c o n c e n tr a t io n s fo r a s p e c i f i c p o l l u t a n t , em is s io n f a c t o r s , and
m eteoro logy in terrco o f a e n tr e n t and h i s t o r i c a l p r o f i l e s , tr e n d s , and

;o
s i g n i f i c a n t i n t e r - r e l a t i o n s h i p s ; 2) provide a b a s i s for assumption
an d/cr s e l e c t i o n o f major source c o n tr ib u to r s : and 3) provide an
a ccu ra te and r e a l i s t i c assessm ent o f a i r q u a l i t y in an area to form the
b a s is for d ec is io n -m a k in g in a i r q u a l i t y c o n tr o l and management.
S u f f i c i e n t data now e x i s t s in many areas to prov ide the la rg e data
b a ses needed for s t a t i s t i c a l model u sa g e . The use o f a s t a t i s t i c a l
model may a l s o determ ine d e f i c i e n c i e s or problem s, such as m is s in g
v a l u e s , a s s o c ia t e d w ith d ata c o l l e c t i o n and management programs.

Lü ç i s l a t Lon
F ed era l
With v i s i b l e d e t e r i o r a t i o n o f ambient a i r q u a l i t y r e s u l t i n g
from in c rea se d i n d u s t r i a l i z a t i o n and p o p u la t io n c o n c e n tr a t io n trends in
urban a reas a f t e r World War I I , p u b l ic p ressu re in c rea se d for
l e g i s l a t i o n to p r o te c t human h e a l th and property from the ad verse
e f f e c t s o f a i r p o l l u t i o n . The f i r s t f e d e r a l law, PL 84—159 — A ir
P o l l u t i o n C ontrol A ct , was enacted in 1955 and provided funding for a i r
p o l l u t i o n r e s e a r c h , t r a in i n g , and te c h n ic a l a s s i s t a n c e . Subsequent a ir
p o l l u t i o n a c t s , as shown in T able 5 , e s t a b l i s h e d standards and a s s ig n e d
r e s p o n s i b i l i t i e s fo r the c o n tr o l and abatement o f a i r p o l l u t i o n . Of
the. subsequent amendments to th e Clean A ir Act o f 1963, the two most
important were the Clean A ir Act Amendments o f 1970 (PL 9 1 -6 4 0 ) which
e s t a b l i s h e d standards fo r t o t a l suspended p a r t i c u l a t e s (TSF), SO2 , CO,
and NO2 , and the Clean A ir Act Amendments o f 1977 (PL 9 5 -9 5 ) which
a ss ig n e d the r e s p o n s i b i l i t y and development o f methods o f a tta in m ent to
the s t a t e s . The s t a t e s were a l s o req u ired to d ev e lo p s t a t e
im plem entation p lan s (S IP ) to a ch iev e standards and prevent s i g n i f i c a n t
d e t e r i o r a t i o n (PSD) o f ambient a i r q u a l i t y . The primary g o a l o f the
N a t io n a l Ambient A ir Q u a l i ty S tandards, as shown in T able 6 , was the
p r o t e c t io n o f human h e a l t h , hence the term "primary s tan d ard s" , w ith
secondary standards d es ig n ed to p r o t e c t p ro p erty .
S t a t e and L oca l
The Texas A ir Control Board (TACB) was e s t a b l i s h e d in 1965 and
has been d es ig n a ted as the prime agency ( i n Texas) r e s p o n s ib le for

32
T abic 5 . Air P o l l u t io n L e g i s l a t i o n
P u b l ic Law Law Date
84-159
86-363
86-493
87-761
88-206
89-272
89-675
90-148
91-604
92-157
93-15
93-319
95-95
95-190
A ir P o l l u t i o n C ontrol Act 6 /1 4 /5 5
A ir P o l l u t i o n C ontrol A c t , E x ten s io n 9 /2 2 /5 9
The Motor V e h ic le Exhaust Study 6 /8 /6 0Act o f 1960
A ir P o l l u t i o n C ontrol 1 0 /9 /6 2
The Clean A ir Act o f 1963 1 2 /1 7 /6 3
The Motor V e h ic le A ir P o l l u t i o n 1 0 /2 0 /6 5C on tro l Act
The Clean A ir Act Amendments 1 0 /1 5 /6 6o f 1966
The A ir Q u a l i ty Act o f 1967 • 1 1 /2 1 /6 7
The Clean A ir Act Amendments 1 2 /3 1 /7 0o f 1970
The Comprehensive H ea lth Manpower 1 1 /1 8 /7 1T ra in in g Act o f 1971 (T ec h n ica l Amendments to PL 9 1 -604)
Clean A ir A c t , E x ten s io n 4 / 9 / 7 3
Energy Supply and E nvironm ental 6 /2 4 /7 4C o o rd in a tio n Act o f 1974
The Clean A ir Act Amendments o f 8 /7 /7 71977
The S a fe D rinking Water Act o f 1 1 /1 6 /7 71977 (T ec h n ica l Amendments to PL 95 -9 5 )

33
Table 6. National Ambient Air Quality Standards—^(CRC, 1972)“ , , . /
POLLUTANTAVERAGING
TIMEPRIHARY-
ETANDARDSSECONDARY' 'STANDARDS
P a r t ic u la t em atter^'
Annual (Geometric mean)
24-hour
75 ug/m^
260 ug/m^
60 ug/ra^
150 ug/m^
S u lfu r d io x id e Annual (A r ith m et ic mean)
24-hour
3-hour
80 ug/m^( 0 .0 3 ppml 365 ug/m ( 0 .1 4 ppm)
1300 ug/m^ ( 0 . 5 ppm)
Carbon monoxide 8-hour
1-hour
• 10 mg/m^ (9 ppm)
40 mg/m (35 ppm)
Same as - primary •
Photochem ical o x id a n ts SJ 1-hour 160 ug/m^ 1)/
( 0 .0 8 ppm)Same as primary
Hydrucarbons U (nonmethane)
3-hour (6 to 9 a .m .)
160 ug/m^ ( 0 .2 4 ppm)
Same as primary .
N itrogen d io x id e SJ
Annual (A rith m et ic mean)
100 u g/m^ ( 0 .0 5 ppm)
Same as primary
— All s tandards are s p e c i f i e d as n ot to be exceeded more than once per y ea r .The measurement methods arc a l s o s p e c i f i e d a s F ederal Reference Methods.The a i r q u a l i t y standards and a d e s c r ip t io n o f the r e fe r e n c e methods were p ublish ed on A p r il 30, 1971 in 42 CFR 410, r e c o d i f i e d to 40 CFR on November 25, 1972.
^ / s e t fo r the p r o t e c t io n o f h e a lth .
£.^Sct fo r the p r o t e c t io n o f w e l f a r e , which, in. the words o f the Act " In c lu d es , but i s not l im it e d t o , e f f e c t s on s o i l s , w ater , crops , v e g e t a t i o n , man-made m a te r ia l s , an im als , w i l d l i f e , weather, v i s i b i l i t y , and c l im a te , damage to and d e t e r io r a t io n of p roperty , and hazards to t r a n s p o r ta t io n , as w e l l as e f f e c t s ■on economic v a lu e s and on personail comfort and w e l l b e in g ." S e c t io n 302 (b ) .
É / lh c secondary annual standard (60 ug/m^) i s a guide to be used in a s s e s s in g im plem entation-p lans to ach ieve the 24-hour secondary standard .
^./Expressed as ozone by the Federal Reference Method.
— Thls NAAQS i s for use as a guide in d e v i s in g im plem entation p lans to a ch ie v e oxidant s tandards.
No Federal Reference Method c u r r e n t ly in e f f e c t ,
if/Changed to 240 ug/m^ (0 .1 2 ppm) In 1979.

34
ambient a i r q u a l i t y in the s t a t e , T h e TACB has d es ig n a ted 12 a i r
q u a l i t y c o n t r o l r e g io n s fo r a i r q u a l i t y management (AQM) w ith in the
s t a t e . W ith in th e s e 12 a i r q u a l i t y re g io n s (AQR) l o c a l a i r p o l l u t i o n
c o n tr o l a g e n c ie s a l s o conduct a i r q u a l i t y c o n tr o l programs and are
encouraged to take the i n i t i a t i v e i n . con d ucting c o n tr o l and abatement
programs (TACB, 1 9 8 0 a ) . The El Paso C ity-C ounty H ealth U nit A ir
P o l l u t i o n C on tro l U n it (EPAPCU) i s the l o c a l agency th a t o p era tes
c o n c u r r e n t ly w ith th e TACB fo r AQM in E l P a so . Both the TACB and
EPAPCU o p era te under the framework g u id e l in e s (F igu re 1) s e t fo r th in
th e 1977 Clean A ir A ct Amendments (PL 9 5 - 9 5 ) , and they employ the same
standards as the NAAQS.
The TACB SIP fo r CO was enacted in 1979 and d e s ig n a t e s the C ity
o f E l Paso as the lea d p lan n ing o r g a n iz a t io n fo r the c o n tr o l and
abatement o f CO in E l P aso . In a l e t t e r o f January 31, 1978, Mayor Ray
S a la z a r and County Judge T. U d e l l More s t a t e d t h e i r i n t e n t io n o f
d e s ig n a t in g the C i ty o f E l Paso as the lead m e tr o p o l i ta n p lann ing
o r g a n iz a t io n fo r the developm ent, im p lem entat ion , and enforcem ent o f
th e agency r e s p o n s i b i l i t i e s requ ired by s e c t i o n 174(a ) o f the Clean A ir
Act o f 1970 (TACB, 197 9 a ) .
On March 3 , 1978, th e a d m in is tr a to r o f EPA d es ig n a ted an area
encom passing much o f the downtown area o f E l Paso as a nonattainm ent
a rea for CO. The area i s d e sc r ib e d as
"That p o r t io n o f the C ity o f E l Paso bounded on the north byHighway 10 from P o r f i r i o Diaz S t r e e t to R eynolds S t r e e t ,Reynolds S t r e e t from Highway 10 to the Southern P a c i f i c R a ilro a d l i n e s , th e Southern P a c i f i c R ailroad l i n e s from Reynolds S t r e e t to Highway 62 , Highway 62 from the Southern P a c i f i c R a ilro a d L ines to Highway 20, and Highway 20 fromHighway 62 to P o lo Inn Road; bounded on the e a s t by P o lo Inn

35
Agency A d m in is tra to r
P lan n in g (S IP , PSD)
C l e r i c a l L ega lDataBank
A d m in is t r a t iv e
Ambient
(m o n ito r in g )
co n tin u o u s random
E n f o r c e m e n t
( c o n t r o l and a b a t e m e n t )
s t a c k s o u r c e i n s p e c t i o n ss a m p l i n g s a m p l i n g
F ig u re 1: O p e r a t io n a l S t r u c t u r e o f an A ir P o l l u t i o n C o n tro l Agency

36
Road from Highway 20 to the Texas-M exico border; bounded on the couth by the Texas-M exico border from P o lo Inn Road to P o r f i r i o D iaz S t r e e t ; and bounded on the w est by P o r f i r i o D iaz S tr e e t from th e Texas-M exico border to Highway 10." (TACB, 1979a)
I n t e r n a t io n a l
The TACB a l s o acknowledged in the 1979 SIP the p o s s ib l e
in f lu e n c e o f a i r p o l l u t a n t s o r i g i n a t i n g in J u a rez , Chihuahua, M exico,
on the ambient a i r q u a l i t y in E l P aso . C u rr en t ly , ambient a i r data
from Ju arez docs not e x i s t ; th e r e fo r e , h o p e fu l ly a Memorandum o f
U nderstanding between th e U .S . Environm ental P r o t e c t io n Agency (USA)
and the S u b s e c r e t a r ia de Mejoramiento Ambiental (M exico) s ig n ed in
June, 1978, w i l l prov ide fo r th e development o f ap ambient a i r data
b ase for Ju arez and subsequent exchange o f in fo rm a t io n (TACB, 1979a).
There have been in form al d i s c u s s i o n s co n cern in g th e form ation o f an
in t e r n a t i o n a l boundary a i r commission s im i la r to the e x i s t i n g
I n t e r n a t io n a l Boundary Water Commission, however, th e s e d i s c u s s i o n s
have not reached s u b s t a n t iv e s t a g e s . I t i s not u nreason ab le to ex p ec t
th a t such a commission cou ld be formed in v iew o f i n t e r n a t i o n a l
agreements th a t have been promulgated in the p a st; an example i s the
t r e a t y o f 1944 which gave i n t e r n a t io n a l s t a t u s to th e I n t e r n a t io n a l
Boundary and Water Commission (A pplegate and Bath , 1 9 7 4 ) .
Study Area
Geography
E l P a so , T exas, ( s e e F igu re 2 ) , i s an urban area w ith a
p o p u la t io n in e x c e s s o f 5 0 0 ,0 0 0 . I t i s l o c a te d on the north ern s id e o f
th e R io Grande a t lo n g itu d e 106°30'W and l a t i t u d e 31°45 'N , and a t an

■
#W Ï I P â :A!o<nofier«c
cCumS ^ 1 iv Y % /^ - \
i|:) uOMii/Ai/ '
'((IP.,*C,«4< d J*srj I 7
; *A «if«
iCAit M M:L[*0 10 ro %' *0
^ o g r c r i : C e i t pf i 0 7 * « f f e m p 0 Xiity U S G S P r o f P ; o # r 2 , 3 ; ‘ i S C S io p p y io o ^ ic t n o p i ; & V G C d 3 ( I ^ G f O O i l . C S k ' v f f S r C f > o r t 0 l A t r e n j ^ r . c o l C ^ o r \
Figure 2. Topographie Map o f Southern New Mexico, and A djoin ing P o r t io n s o f West Texas and Northern Chihuahua (Adapted from Pray, 1975)
w

38
e l e v a t i o n o f about 1200 m eters (o r = 4000 f t . ) co v e r in g about 1 ,1 0 0 sq .
mi (Webb, 1971; Texas Almanac, 1 9 7 9 ) . The Rio Grande, o r "Rio Bravo",
and the "Pass o f th e North" or "El Paso d e l Norte" b i s e c t two ranges o f
th e B as in and Range P r o v in c e . The c i t y i s b u i l t l i k e a h o rsesh o e
around the F ra n k lin mountain ch a in , and i t spreads e a s t and w est down
in t o the v a l l e y f l o o r a long the r i v e r . The downtown p o r t io n o f E l Paso
near the r i v e r i s about 1110 m eters in e l e v a t io n ; s e c t i o n s o f the c i t y
reach over 1200 m eters on some p a r ts o f the m ountains. The F ra n k lin
Mountains th em se lv es r i s e to h e ig h t s o f about 2140 m e ter s . The r i v e r
v a l l e y i s a p p rox im ate ly 1600 to 4800 m eters w ide, w ith mesa land
between mountain ch a in s a t about 84 m eters above the v a l l e y f l o o r .
There are two p a s s e s through th e F ra n k lin M ountains, Hondo P ass and
Fusselman Canyon, and th e P ass o f the North lo c a te d between the
F ra n k lin Mountains and El C r is t o Rey. T h is com bination o f p a sse s
produces v e n t u r i e f f e c t s on wind cu rr en ts and " v a l l e y flow" s i t u a t i o n s
(T i l lm a n , 1959; Anonymous, 1979; Webb, 1971; and Hubert, 1 9 7 9 ) .
Juarez
E l Paso shares a common a i r shed w ith J u a rez , Chihuahua,
M exico, which i s lo c a te d on th e southern bank o f th e Rio Grande and i s
b u i l t around th e Chihuahuan mountain ch a in which i s the e a s t e r n
e x t e n s io n o f the ranges o f th e B as in and Range P rov in ce b i s e c t e d by the
R io Grande. J u arez has an e s t im a te d p o p u la t io n o f 7 0 0 ,0 0 0 . L i t t l e i f
any q u a l i t a t i v e or q u a n t i t a t iv e data con cern in g t r a f f i c , ambient a i r
q u a l i t y , m e te o r o lo g y , or em is s io n in v e n t o r i e s are a v a i l a b l e from
J u a rez . C u rr en t ly , the ambient a i r l e g i s l a t i o n in th e R epublic o f

39
Mexico concerns on ly TSF and smoke em iss io n s (A p p leg a te , 19 7 9 ). J t i s
l o g i c a l to assume th at by the very proxim ity o f Juarez and El Paso th a t
th ere should be b i l a t e r a l in f lu e n c e s on the commonly-held a i r shed;
however, la c k in g data from Juarez a t t h i s p o in t i t would be premature
to a s s ig n c a u s e - e f f e c t a c t i v i t i e s to e i t h e r c i t y .
M eteorology
S in ce m e te o r o lo g y /c l im a t o lo g y i s one s i g n i f i c a n t parameter to
be examined, a d e t a i l e d d i s c u s s i o n o f wind speed , wind d i r e c t i o n ,
p r e c i p i t a t i o n , and m ix ing h e ig h t fr e q u e n c ie s and means w i l l be g iv en in
the data a n a ly s i s s e c t i o n . One o f the most thorough d e s c r ip t i o n s o f
th e m e te o r o lo g y /c l im a to lo g y o f E l Paso i s p resen ted by Webb (1 9 7 1 ) .
Although the data p rese n ted are d escr ib ed from an e a r l i e r time period
than t h i s s tu d y , the fundamental a s p e c t s o f the m eteo ro lo g y o f the area
are assumed to be c o n s ta n t .
El Paso i s noted for i t s abundance o f su n sh in e days r e s u l t i n g
from reduced cloud c o v e r s . T his same f e a tu r e , combined w ith sp arse
v e g e t a t i o n , p rov ides l i t t l e s h i e l d i n g o f the e a r t h ' s s u r fa c e , thus
producing h o t su r fa c e tem peratures in the sp r in g and summer months.
Humidity v a lu e s are low s in c e m ois tu re - la d en ed P a c i f i c a ir l o s e s much
o f i t s m o is tu re in t r a v e r s in g h ig h er mountain ranges such as the
S ie r r a s b e fo r e i t rea ch es E l P aso . The average annual r a i n f a l l i s
about 20 cm. and o ccu rs m ain ly in the summer months. The p r e c i p i t a t i o n
ex p er ien ced r e s u l t s from an in f lo w o f m oist a i r from the G ulf o f Mexico
as in f lu e n c e d by the westward development o f the Bermuda h ig h -p r e s s u r e
r e g io n in the s o u th -c e n tr a l United S t a t e s . The northwestward push o f

40
G ulf a i r i s b locked by Che Sacramento mountain range, about 40, m i le s
e a s t o f E l P aso , a t which p o in t the a i r mass p a sses south o f the
mountain range and up the Rio Grande v a l l e y , thus producing the
thunderstorm s and ra in showers c h a r a c t e r i s t i c o f t h i s p e r io d .
C on seq uently , Che e a s t e r n s lo p e s o f the F ra n k lin Mountains g e n e r a l ly
e x p e r ie n c e more p r e c i p i t a t i o n than the w estern s i d e , p lu s b e ing
a f f e c t e d by eastward flow l e e wave co n d en sa t io n .
A lthough mountain l e e waves are c h a r a c t e r i s t i c a l l y produced
"downwind" on one s id e o f a mountain range, because the E l Paso area
r e c e i v e s w e s t e r ly winds in the w in ter and sp r in g and e a s t e r l y f low s in
th e Summer and f a l l , both s id e s o f the F r a n k l in Mountains e x p er ie n c e
str o n g mountain l e e waves. Mountain l e e waves are s p e c i a l s ta n d in g
forms o f g r a v i t y waves t i e d to some o b s tr u c t io n , in t h i s c a s e the
F ra n k lin M ountains, which i n t e r f e r e s w ith wind flow . Although the l e e
waves g e n e r a l ly occur on the e a s t e r n s lo p e s becau se o f the s tr o n g wind
f lo w s from the w e st , e a s t e r n f low s are a l s o o f s u f f i c i e n t s tr e n g th to
produce o b serv a b le l e e waves on the w estern s lo p e s . Lee waves o f
s u f f i c i e n t i n t e n s i t y and v a r i a t i o n to a f f e c t the e n t i r e atm ospheric
p r o f i l e were observed in the E l Paso area during l e e wave s t u d ie s
conducted a t the White Sands M i s s i l e Range during the l a t e 1 9 6 0 's
(Webb, 1 9 7 1 ) . These waves have a la r g e impact on atm ospheric p a t te r n s
in th e E l Paso area s i n c e they d e f l e c t th e g en er a l atm ospheric f low
p a t te r n s from the la m in ar-typ e w ith accompanying tu rb u lence o f the
l o c a l atm osphere, and l i f t i n g o f su r fa c e a i r m a sses . For l e e waves to
d ev e lo p , however, a s t a t e o f su r fa c e s t a b i l i t y must e x i s t , or the f low

41
ov er mountain b a r r i e r s w i l l im m ediately d ev e lo p in to tu rb u le n c e .
S u rfa ce s t a b i l i t y i s c o n t in g e n t on wind speed .
The s t r o n g e s t wind speeds in El Paso occur in the sp r in g and
e a r ly summer as a r e s u l t o f s tr o n g w e s t e r ly f low s a l o f t . A lthough wind
f lo w s from the w estern quadrant occur in the w in te r months, th e su r fa c e
wind speeds are d ecrea sed s i n c e the f low i t s e l f i s s h i f t e d to the
n o rth . These lower wind sp e e d s , combined w ith n o ctu rn a l s t a b l e su r fa c e
c o n d i t io n s and reduced v e r t i c a l eddy i n t e n s i t y , c o n t r ib u te to th e
form ation o f s u r fa c e in v e r s i o n s . Another major f a c to r in the form ation
o f th e s e in v e r s io n s i s th e s i g n i f i c a n t l o s s o f s u r fa c e h ea t a t n ig h t by
r a d i a t i v e c o o l in g which produces the n e c e s s a r y imbalance o f c o o le r
tem perature below and h ig h e r tem peratures a l o f t . Because o f the c l e a r
s k i e s , h igh a l t i t u d e , and s u r fa c e c h a r a c t e r i s t i c s ( s c a n t v e g e t a t i o n ) ,
u n s ta b le l a y e r s are g e n e r a l l y observed in the a f tern o o n and more s t a b l e
c o n d i t io n s a t n ig h t . As th e day b eg in s and the su r fa c e i s aga in warmed
by th e sun, and s u r fa c e c o n v e c t iv e and m echanica l d i f f u s i o n and m ixing
i n c r e a s e , the in v e r s io n s b eg in to d isap p ear ( i . e . , b reak -u p ); however,
i f s y n o p t ic c o n d i t i o n s , such as r e d u c t io n s in .daytime s o la r su r fa c e
h e a t in g or low su r fa c e wind sp eed s , e x i s t , then the in v e r s io n may l a s t
fo r more than one day (Webb, 1971; Barry and C horley , 1978; Husar, e t
a l . , 1977; Csanaday, 1972; Grossman and Beran, 1975; Auer, 1978;
S i s t e r s o n , Shannon, and H a le s , 1979; Yu, 1978; Ludwig and Dabberdt,
1976; R ieh l and H erkof, 1972; Lyons and C u tten , 1979; and Counihan,
1 9 7 5 ) . I t i s during t h e s e prolonged in v e r s io n p e r io d s th a t ambient a i r
p o l l u t i o n l e v e l s are h ig h e s t and the most v i o l a t i o n s o f the NAAQS for
CO in E l Paso have been recorded (TACB, 1980b).

42
A lthough the term "heat i s la n d e f f e c t " i s not a true
m e t e o r o lo g ic a l phenomena in th a t i t i s not produced by an ev e n t o f
n a tu r e , but r a t h e r , i s o f a n th rop ogen ic o r i g i n , i t w i l l be d escr ib ed
s i n c e i t i s so c l o s e l y a s s o c i a t e d w ith l o c a l i z e d urban m e t e o r o lo g ic a l
param eters. The h ea t i s la n d e f f e c t i s th a t 5-6°C r i s e in temperature
ob served ov er urban c e n t e r s o f h ig h p o p u la t io n and man-made s t r u c t u r e s .
In g e n e r a l , urban environm ents are warmer and have l e s s hum idity and
w in d s , and more c lo u d s and t o t a l suspended p a r t i c u l a t e (TSP) lo a d in g s
than surrounding r u r a l a r e a s . T his i s caused by r e d u c t io n s in n a tu r a l
s u r f a c e s and v e g e t a t i o n which r e g u la t e th e p r o c e s s e s o f
é v a p o tr a n s p ir a t io n , a lb ed o , and wind flow p a t t e r n s . Combinations o f
d is r u p t io n o f n a tu r a l s u r f a c e s and v e g e t a t i o n , the im p o s i t io n o f man-
made s t r u c t u r e s , and in c r e a se d buoyancy r e s u l t i n g from
a n th r o p o g e n ic a l ly -g e n e r a t e d h e a t produce a n e t con vergen ce p ro ce s s
c a l l e d the " s to v e p ip e e f f e c t " in which th ere i s c le a n a i r in f lo w to
th e s u r fa c e and d i r t y a i r o u t f lo w a l o f t . Tons o f ambient p o l l u t a n t s
can be moved a l o f t d a i ly by the h ea t i s la n d or s to v e p ipe e f f e c t .
Under low wind speed c o n d i t i o n s , e s p e c i a l l y during i n v e r s i o n s , th e h ea t
i s l a n d e f f e c t becomes even more pronounced. Wliile the h ea t is la n d
e f f e c t d oes produce profound changes in l o c a l i z e d m e te o r o lo g ic a l
c o n d i t io n s and p o l l u t i o n t r a n s p o r t , i t s e x t e n t and impact on the c i t y
o f E l Paso are unknown fo r th e s im ple reason th a t i t has n ever been
s tu d ie d fo r t h i s m etro p lex (E l P a so -J u a rez ) o f over 1 m i l l i o n p eop le
(Barry and C horley , 1978; A n g e l l and B e r n s te in , 1975; Haagenson, 1979;
R ie h l and H erkof, 1972; and Auer, 1978).

43
CHAPTER I I I
MATERIALS AND METHODS
The purpose o f t h i s ch ap ter i s to prov ide d e t a i l e d d e s c r ip t io n s
o f the sam pling s i t e s , sam pling d e v ic e s , a n a l y t i c a l methods, and data
base c o l l e c t i o n and management procedures used in t h i s s tu d y . F ig u res
and t a b l e s are used to summarize and c l a r i f y the d e s c r ip t i o n s o f the
model developm ent, c a l i b r a t i o n , and v e r i f i c a t i o n .
For c l a r i t y and e a s e o f u nderstanding the fo l lo w in g names and
terras are used throughout the s tudy: Texas A ir C ontro l Board (TACB),
Texas Department o f Highways and P u b l ic T ra n sp o r ta t io n (THD), E l Paso
C ity T r a f f i c and T r a n sp o r ta t io n Department (EPTD), N a t io n a l Oceanic and
A tm ospheric A d m in is tr a t io n (NCAA), and the E nvirom ental P r o t e c t io n
Agency (EPA).
D e s c r ip t io n o f Sampling S i t e s , Sampling D e v ic e s ,A n a ly t i c a l Methods and Data Bases
TACB Data
S i t e s . .The l o c a t i o n s o f the two sam pling s i t e s are shown in
F ig u re 3 . A d e t a i l e d g eo g r a p h ica l d e s c r ip t i o n o f the two TACB
co n tin u o u s a i r m o n ito r in g s i t e s (CAMS) l o c a t i o n s i s in c lu d ed in
Appendix D. CAMS 6 , which i s l i s t e d as s i t e #27 under th e SAROAD data
system code, i s lo c a te d a t 500 Campbell S t r e e t in the c e n t r a l b u s in e ss

^ FranklinvN'jU^VT^iinrnBîïirii. .'j.'!iie:J.MT%
iisJiitliaU N I T E D S T A T E
« T A T E 0 T M E W M E « I C C
« T A T E O T C H t M U A M
R E P U B L I C 0 F
MEXICO
1 = TACB - S i t e 272 = TACB - S i t e 283 = TDH4 = NOAA
\*
R E P U B L C « S i lMEXI CO
R E P U B L I C T ! 0 F
MEXICO
Figure 3. Map of the Study Area with Sampling Sites

45
d i s t r i c t as shown in F ig u re 3 . Although s i t e o p e r a t io n began in
O ctober, 1973, data in c lu d ed on th e TACB computer ta p es did not b eg in
u n t i l 1974. CAMS 12, SAROAD s i t e #2 8 , i s lo c a te d a t 6950 Alameda
Avenue in A sca r a te Park ap prox im ate ly 5 m i le s s o u th e a s t o f CAMS 6 .
CAMS 12 began co n tin o u s o p e r a t io n in J u ly , 1974, and was moved in 1981
from the A sca ra te Park s i t e to a s i t e a t th e U n iv e r s i t y o f Texas a t El
Paso . Both s i t e s are lo c a te d about 3 m i le s north o f the USA-Mexican
b ord er .
Sampling in s tr u m e n ts . D e ta i le d d e s c r ip t i o n s o f the CAMS and
flame i o n i z a t i o n d e te c t o r gas chromatography in s tr u m e n ta t io n (FID GO)
are inc luded in Appendix E. At t h i s p o in t , however, a comment i s in
order con cern in g the s u i t a b i l i t y o f th e CO m on ito r in g d e v i c e s . In th e
Texas SIP fo r CO (TACB, 1979a) the TACB s t a t e s th a t the FID GC
in s tru m en ta t io n used fo r CO a n a ly s i s was purchased in 1973-1974 w ith
EPA approval and funds. In 1975 EPA p u b lish e d th e l i s t o f approved
r e fe r e n c e and/or e q u iv a le n t methods ( in c lu d in g CO a n a l y s i s ) . The
TACB's m on itor in g method was not l i s t e d e i t h e r as a r e f e r e n c e or
e q u iv a le n t method; however, EPA d id grant a w aiver p e r m it t in g u se o f
th e method u n t i l 1980, a t which time the method was to be changed to a
r e fe r e n c e or e q u iv a le n t method. In the SIP (TACB, 1979a) the TACB goes
on to s t a t e t h e i r co n f id e n c e in the g en er a l q u a l i t y o f CO d ata
o b ta in e d , however, th ey do c a u t io n a g a in s t assuming com plete
r e l i a b i l i t y fo r s i n g l e measurements or sm all groups o f the d a ta . T his
cou ld be a c r u c ia l f a c to r in e v a lu a t in g th e El Paso a i r p o l l u t i o n
problem and w i l l be d is c u s s e d in more d e t a i l Chapter IV.

46
Data b a s e . A l l d ata c o l l e c t e d a t m on ito r in g s i t e s 27 and 28
from 1974 to 1981 were p rov ided on computer ta p es by the TACB lo c a te d
in A u s t in , T exas . A diagram o f the CAMS d ata a c q u i s i t i o n system i s
a l s o in c lu d ed in Appendix D (TACB, 1973; TACB, 1 9 7 5 ) . The TACB u s e s
th e SAROAD form o f d ata s to r a g e (EPA, 1971) on th e computer ta p e s . The
u t i l i z e d d ata base fo r CO c o n s i s t s o f 1973-1980 data fo r the fo l lo w in g
param eters: y ea r (YR), month (MO), day ( d a ) , hour (HR), CO, wind speed
(WS), wind d i r e c t i o n (WD), tem perature (T ) , r e s u l t a n t wind speed (RWS),
and r e s u l t a n t wind d i r e c t i o n (RWD). These param eters fo r a p a r t i c u la r
y e a r , month, day, and hour compose an o b s e r v a t io n or ca se in the m aster
data b ase c a l l e d "MOTHER" deve lop ed for t h i s s tu d y . A summary o f the
c o n te n t s o f a l l u t i l i z e d data b a ses i s g iv en in T able 7.
TDH Data
S i t e . The l o c a t i o n o f th e sam pling s i t e i s shown on F igu re 3 .
The sampling s i t e (S -1 6 2 ) used to p rov ide the m a jo r i ty o f the data for
t h i s study i s the permanent sam pling s i t e lo c a te d 0 . 6 m i le s west o f
US54 on IH-IO and o p erated by th e Texas Department o f Highways and
P u b l ic T ra n sp o r ta t io n in E l Paso and A u s t in , T exas.
Sampling d e v i c e . The t r a f f i c co u n ter a t S-162 i s a permanent
au tom atic m agnet ic loop form embedded in the roadbed o f the highway.
D i r e c t i o n a l co u n ts a re made fo r each lane o f t r a f f i c (Baerwald, 1 9 7 6 ) .
Data b a s e . The m aster data b a s e , "MOTHER", c o n ta in s t r a f f i c
count data from the p e r io d 1975-80 for s i t e S -1 6 2 , and was o b ta in ed in
computer tape form from the Texas Department o f Highways and P u b l ic
T r a n sp o r ta t io n in A u s t in , T exas . The d i r e c t i o n a l cou n ts for each lane

47
Table 7. Data Base Descriptions
Name A c q u i s i t io n O rig in D e sc r ip t io n
TACB J u ly 1981 o n - s i t e v i s i t to A u s t in , Texas
Texas A ir C on tro l Board
The 3 computer ta p es o f a l l data c o l l e c t e d a t th e 2 m on itor in g s i t e s in El Paso from 1974- 1981 co n ta in ed data fo r
T o ta l Suspendedp a r t i c u l a t e s (TSP)
S u lfu r D io x id e (SC^) Oxidants (0^)N itrogen d io x id e (NOg) Carbon monoxide (CO) Wind Speed (WS)Wind D ir e c t io n (WD) R e su lta n t Wind Speed
(RWS)R e su lta n t Wind D ir e c
t io n (RWD) Temperature (T)S i t e , Y ear, Month,
Day, Hour These data are h o u r ly averages o f rea d in g s taken a t 5 minute i n t e r v a l s fo r th e e n t i r e time p e r io d . Data was coded by th e SAROAD system .
THD January 1981 o n - s i t e v i s i t to El Paso and A u s t in
TexasDepartment o f Highways and P u b l ic T ra n sp o r ta t io n
The 3 computer ta p es co n ta in ed a l l th e t r a f f i c data c o l l e c t e d by perman en t t r a f f i c r eco rd ers (5 s i t e s ) fo r the y ea r s 19 7 5 -1980 . Only one s i t e , S -1 6 2 , was s u i t a b l e fo r u se in t h i s stu d y b eca u se o f l o c a t i o n and m is s in g d a ta . D i r e c t i o n a l h our ly t r a f f i c co u n ts were averaged to p ro v id e one count per hour. Weather c o n d i t io n s ( s u n sh in e , c lou d y , e t c . )

4 8
Table 7. Continued
Name A c q u is i t io n O r ig in D e s c r ip t io n
were a l s o in c lu d ed in th e d a ta . D e ta i le d d ata encoding i n s t r u c t i o n s and d e s c r ip t io n s were provided by th e agency.
EPTD January 1981 o n - s i t e v i s i t to El Paso
El Paso C ity T r a f f i c and T ra n sp o r ta t io n Department
Data fo r h o u r ly t r a f f i c counts by typ e and numb ers o f v e h i c l e s were a v a i l a b l e fo r 11 days in the tim e p er io d 1975- 1980, These cou n ts were o b ta in ed by co u n ter s and manual c o u n ts .
NOAA December1981te le p h o n ereq u est
N a t io n a l O ceanic and Atmospheric A d m in is tra t io n
The computer tape o f mixin g h e ig h t data con ta in ed data fo r 0200-0600 LST (2 a .m . - 6 a .m . Zulu time) fo r y e a r , month, day, m ixing h e ig h t (m e te r s ) , s u r fa c e wind speed (SFC in m e t e r s / s e c ) , t r a n s port w ind, and wind through th e m ixing depth (LYR in m e t e r s / s e c ) .Data encoding in fo rm a t io n was su p p l ied by th e agency.
Em issionInventory
October1981te le p h o n ere q u es t
Environmental P r o t e c t io n Agency (Region VI
■ D a l la s )
D e ta i le d em is s io n in v en to r y prov ided con ta in ed data from a l l so u rces o f CO e m is s io n s for 1979-1981 fo r th e c i t y and county o f El Paso, ( a l s o s e e Appendix B .)

49
o f t r a f f i c were added to form one com posite t r a f f i c count for each
y e a r , month, day, and hour during t h i s time p e r io d . Data e x t r a c t e d
from the TDH computer ta p es and incorp orated in to the m aster data base
were: y e a r , month, day, h our, w eather ( i . e . c lo u d y , p r e c i p i t a t i o n ,
e t c . ) and t r a f f i c c o u n ts . A summary o f the data base c o n te n t i s a l s o
g iv en in T able 7 .
EPTD Data
S i t e . A c tu a l t r a f f i c cou n ts a t or a d ja ce n t to the two CO
m o n ito r in g s i t e s were ob ta in ed from the C ity o f E l Paso T r a f f i c and
T ra n sp o r ta t io n Department. Table 8 c o n ta in s a l i s t i n g o f the l o c a t i o n s
a t which the co u n ts were taken .
Sampling d e v i c e . A m obile pneum atic-type t r a f f i c cou n ter was
used to o b ta in t r a f f i c counts (Baerwald, 1976) a long with manual cou n ts
a s in d ic a te d in Table 8 .
Data b a s e . T able 8 c o n ta in s a l i s t i n g o f the l o c a t i o n s , d a te ,
t im e , and t r a f f i c f lo w d i r e c t i o n o f the c o u n ts . These d ata were not
in c lu d ed in MOTHER, however, they were used in the model v e r i f i c a t i o n .
Although th e q u a n t i ty o f data i s l im i te d to an e x t e n t th a t p rec luded
i t s u se in th e d e s c r i p t i v e s t a t i s t i c s a n a l y s i s , i t i s , n e v e r t h e l e s s , o f
v i t a l importance when used d i r e c t l y in th e developed model.
NOAA Data
S i t e . The sampling s i t e shown on F igure 3 i s lo c a te d a t the E l
Paso I n t e r n a t io n a l A ir p o r t , and data i s c o l l e c t e d by th e N a t io n a l
Weather S e r v ic e .

Table 8. Traffic Volume Surveys by the City of El Paso Traffic and Transportation Department
Date Time T r a f f icD ir e c t io n
T r a f f ic Counter Location
1 - 6-76 1 1 : 0 0 a .m .- 1 2 : 0 0 a.m. Northbound North o f M issouri off-ramp on Campbell
1 - 7-76 1 2 : 0 0 a .m .- 1 1 : 0 0 a.m. Northbound North o f M issouri off-ramp on Campbell
1 - 7-76 1 : 0 0 p .m .- 1 2 : 0 0 a.m. Eastbound East a t Campbell on M issouri off-ramp
1 - 8-76 1 2 : 0 0 a .m .- 1 : 0 0 a.m. Eastbound East a t Campbell on M issouri off-ramp
4 -13-76 1 1 : 0 0 a .m .- 1 2 : 0 0 a.m. Eastbound East o f Campbell on Franklin
4 -14-76 1 2 : 0 0 a .m .- 1 1 : 0 0 a.m. Eastbound East o f Campbell on Franklin
1 1-28-78 1 2 : 0 0 p .m .- 1 2 : 0 0 a.m. Eastbound on D e lta Drive
11-28-78 1 2 : 0 0 p .m .- 1 2 : 0 0 a.m. Westbound on D e lta Drive
11-29-78 1 2 : 0 0 a .m .- 1 2 : 0 0 p.m. Eastbound on D e lta Drive
11-29-78 1 2 : 0 0 a .m .- 1 2 : 0 0 p.m. Westbound on D e lta Drive
11-28-78 1 2 : 0 0 p .m .- 1 2 : 0 0 a.m. Northbound on Juarez Avenue
11-29-78 1 2 : 0 0 a .m .- 1 2 : 0 0 p.m. Northbound on Juarez Avenue
11-25-80 1 : 0 0 a .m .- 1 2 : 0 0 a.m. Southbound South o f M issouri on Kansas
11-26-80 1 2 : 0 0 a .m .- 1 : 0 0 p.m. Southbound South o f M issouri on Kansas
7-16-30 6:00 a .m .- 9:00 p.m. _ * Campbell and Bataan Trwy.
7-15-80 6:00 a .m .- 9 :00 p.m. _ * Kansas and Bataan Trwy.
L/JO
*Manuai Counts

51
Snmpling d e v i c e . Sampling o£ the atmosphere a t 100 ,000 f e e t i s
performed u s in g neoprene b a l lo o n -b o r n e r a d io so n d e s . The ra d io so n d e i s
a s o l i d - s t a t e r a d io - t r a n s m it t in g d e v ic e w e igh ing approx im ate ly 600 gms.
equipped w ith p ressu re s e n s o r s ; i t i s re tu rn ed to the e a r t h ' s su r fa c e
v i a p arachute . Upon r e l e a s e the b a l lo o n ascends a t a r a t e o f
approx im ate ly 1000 f t . / m i n u t e . The ra d io so n d e b a l lo o n s a re r e le a s e d
tw ic e a day a t 11:00 and 23:00 Zulu tim e.
Data b a s e . Computer ta p es o f m ixing h e ig h t data for E l Paso
fo r the y e a r s 1975 to 1980 were o b ta in e d from the N a t io n a l O ceanic and
A tm ospheric A d m in is tra t io n lo c a te d in A s h e v i l l e , North C a ro lin a .
In c lu d ed on the ta p es are the f o l lo w in g : y e a r , month, day, h our , type
( o f w e a th e r ) , m ix ing h e ig h t in m e te r s , wind speed through the mixing
depth (LYR), and s u r fa c e wind sp eed . The data b ase used in t h i s study
i s composed o f 4 ,3 8 4 o b s e r v a t io n s . A summary o f the d ata b ase co n te n t
i s g iv en in T able 7 .
E m ission In v en to ry Data
S i t e . The em is s io n in v e n to r y data was provided fo r the c i t y
and county o f E l P aso .
Sampling d e v i c e . A l l d a ta was c o l l e c t e d a cc o rd in g to the
f e d e r a l r u l e s and r e g u la t io n s g o v ern in g e m is s io n s in v e n to ry d a ta .
Data b a se . The d ata b ase summary i s provided in Table 7 .

52
Computer F a c i l i t i e s
L o ca tio n
A l l computer work was performed u s in g an i n t e r a c t i v e computer
term inal a t RMTS ( t h e remote job en tr y term in a l s i t e lo c a te d in the
N uclear E n g in eer in g Lab) on the main campus a t the U n iv e r s i t y o f
Oklahoma, Norman, Oklahoma. The main computer, t o which the
i n t e r a c t i v e term in a l c o n n e c t s , i s lo c a te d in the Merrick Computer
Center in the Swearingen Research Park (North Campus).
Type
Hardware. The c e n t r a l p r o c e s s in g u n i t (CPU) i s an IBM System
1370, Model 158, th a t has 3 m i l l i o n b y te s o f main s t o r a g e . The
i n t e r a c t i v e computing te rm in a ls used were D ecw riter I I (1 1 0 , 300 BPS
ASC I I ) , ADM3 CRT (300 BPS ASC I I ) , IBM 3278 (9600 BAUD EBCDIC), IBM
3101 (1200 BAUD, ASC I I ) w ith 1200 and 300 BAUD modum B e l l dataphone.
Softw are (UCS, 1978; UCS, 1 9 8 0 ) . The p r i n c i p a l computer
package employed for the m a jo r i ty o f the work done in t h i s study was
SAS — S t a t i s t i c a l A n a ly s is System (SAS, 1978; SAS, 1979a, b; SAS,
1980; SAS, 1981a, b, c ) . For data management s i t u a t i o n s th a t were not
amenable to SAS u sa g e , so ftw a re s e l e c t i o n was made from the a v a i la b le
so ftw a re r e so u r ces l i s t e d in the UCS u ser manuals (UCS, 1978; UCS,
1 9 8 0 ) . I n d iv id u a l programs and f i l e s are not inc lu d ed s i n c e over 400
o f th ese were used in t h i s study and may e a s i l y be determ ined by use o f
v a r io u s SAS and o th er computer manuals (SAS, 1978 ; SAS, 1979 a , b;
SAS, 1980; SAS, 1981a, b , c; A f i f i and Azen, 1972; B o i l l o t , 1978;

1.3
Brown, 1977; D an ie l and Wood, 1971 ; D an ie l and Wood, 1980; Orce%a and
R h cin b o ld t , 1970; SAS, 1974; Spencer, 1980, UCS, 1978; UCS, 1 9 8 0 ) .
Comments on Data A c q u i s i t io n
Data a c q u i s i t i o n c o n s i s t e d o f o u - s i t e v i s i t s to the a p p ro p r ia te
agency fo r co n fe ren ce s con cern in g the ty p e , q u a n t i ty , and q u a l i t y o f
data a v a i l a b i l i t y . Telephone com munications p r io r to o n - s i t e v i s i t s
f a c i l i t a t e d the a c q u i s i t i o n o f d a ta computer tapes s in c e t h i s o f t e n
enab led the agency concerned to prepare the ta p es fo r t r a n s i t p r io r to
the schedu led v i s i t , and a l s o to prepare o th er m a t e r ia l s p e r t in e n t to
the s tu d y . O n - s i t e v i s i t s and p erso n a l communications with person n el
in v o lv e d in the d a y -to -d a y management o f a i r p o l l u t i o n in the study
a rea o f t e n p rov id e new and s p e c i a l i n s i g h t s to the problem.
U n fo r tu n a te ly , however, some o n - s i t e v i s i t s were prevented by time and
c irc u m sta n ces , - and in such c a s e s , e x t e n s iv e te le p h o n e usage was
p a r t i c u l a r l y h e lp f u l in r e s o lv in g q u e s t io n s con cern in g data a c q u i s i t i o n
and a v a i l a b i l i t y .
Methods
A schem atic diagram o f the methods and work p lan used in the
d e s c r i p t i v e s t a t i s t i c s work and p rod u ction o f the two h e u r i s t i c
s t a t i s t i c a l ambient a i r models i s shown in F ig u re 4 .
Data C o l l e c t i o n
The d ata c o l l e c t i o n phase o f the study was i n i t i a t e d by p la c in g
te lep h o n e c a l l s to the ap p ro p r ia te agency (T ab le 7) to determ ine:
a ) th e a v a i l a b i l i t y o f d a ta ,

TACB
MEANS
OTHERdataSETS
KRUSCAL - WALLIS
CLMRSREG
MISCELLANEOUS
DOTERl
GRAPHS
GRAPHSTRANSFORMS
k -SPLOTS
Figure 4. The Production o f a S t a t i s t i c a l H e u r i s t i c Ambient Air Q ua lity Model

53
b) the q u a n t i t y , q u a l i t y , and form o f data a v a i l a b l e ,
c ) a d d i t io n a l p e r t in e n t in fo rm a tio n co n cern in g the d ataa c q u i s i t i o n such as s p e c i f i c a t i o n s fo r computer tapep r e p a r a t io n s ,
d) and a s u i t a b l e time and method fo r s e c u r in g the data .
O n - s i t e v i s i t s were then made to th e a p p r o p r ia te a g e n c ie s
(T ab le 7 ) , a f t e r which a l l computer tapes were tra n sp o rted to the
Merrick Computer Center where c o p ie s o f the o r i g i n a l ta p es were made.
The o r i g i n a l ta p e s were then re turned to the agency .
Data Management
The data ta p es (F ig u re 4 - TACB, TDH, NOAA) were then decoded
and merged in to a m aster d ata ta p e , "MOTHER". The d ata s to red in
MOTHER (T ab le 9 ) was comprised o f 1 0 3 ,752 c a s e s . From MOTHER a second
d ata s e t , DOTERl (F ig u re 4) was produced c o n ta in in g o n ly th ose c a se s
th a t in c lu d ed th e NOAA d a ta . Other data s e t s were d er iv ed from MOTHER
(F ig u re 4 ) as needs arose in th e a n a l y s i s p ro ced u res . Data from 1975-
1978 were used in the d e s c r i p t i v e s t a t i s t i c s , model development and
model c a l i b r a t i o n p h a ses . Model v e r i f i c a t i o n was performed u s in g data
from 1979-1980 . The use o f one p o r t io n o f the d a ta base fo r model
developm ent and c a l i b r a t i o n and th e rem aining p o r t io n fo r model
v e r i f i c a t i o n i s a standard procedure in a i r p o l l u t i o n m odeling (T ia o ,
Box and Hamming, 1975; M c C o l l i s t e r and W ilson , 1975; Chock, T e r r e l l and
L e v i t t , 1 9 7 5 ) .
D e s c r ip t iv e S t a t i s t i c s
The d e s c r i p t i v e s t a t i s t i c s were performed (F ig u re 4 ) u s in g
programs from SAS to o b ta in raw d ata in fo rm a t io n ( i n MOTHER and DOTERl)

56
Table 9. MOTIIKR Data
S i t e , Yr, Mo, Da, HR, CO, WS, im , RWS, RIVD, T, TR, Wthr, MH, LYR, SPC, Prec
where ;
S i t e = 27 (Campbell S t . downtoim) or 28 (A sca ra tc Park)
Yr = year
Mo = month
Da = day
HR = hour
CO = carbon monoxide
WS = wind speed
RWS = r e s u l t a n t wind speed
RWD = r e s u l t a n t wind d i r e c t i o n
T = tem perature
TR = t r a f f i c
Wthr = w eather (coded 1 -9 fo r c l e a r - c lo u d y )
MH = m ixing h e ig h t
LYR = tr a n sp o r t wind
SPC = s u r fa c e wind speed
Prec = P r e c i p i t a t i o n ty p e

57
as d escr ib ed in T able 10. These procedures (T able 10) were a l s o
u t i l i z e d to o b ta in and a n a ly ze the monthly mean d a ta . T ransform ations
o f the d ata were a l s o examined u s in g procedures l i s t e d in the normal
d i s t r i b u t i o n and data i n t e r r e l a t i o n s h i p a n a ly s i s s e c t i o n s o f T able 10.
Model Development and C a l ib r a t io n
T e s t s on the raw data and monthly mean d ata were performed
u s in g th e GLM, RSREG, NLIH, and SYSINLIN procedures (T able 10) to
determ ine th e type o f s t a t i s t i c a l eq u a t io n or eq u a t io n s (E quations 13 -
20) th a t would b e s t ex p ress the d a ta . Monthly mean d ata were used fo r
development o f the model.
The s t a t i s t i c a l parameter used as the i n i t i a l c r i t e r i a fo r
model s u i t a b i l i t y was th a t o f R^. I n t e r p r e t a t io n o f R v a lu e s i s
addressed in Chapter IV.
D e t a i l s o f the model d e v e lo p m e n t - c o n d i t io n in g - c a l ib r a t io n
p ro cess are g iv en in Chapter IV to f a c i l i t a t e understanding o f the
p r o c e s s .
Model V e r i f i c a t i o n
A l l model v e r i f i c a t i o n was performed u s in g the d er ived 20-term
q u a d ra t ic eq u ation and 5-term g en er a l l i n e a r model e q u a t io n . Data from
1979-1980 were used for model v e r i f i c a t i o n . Although the model was
d ev e lo p ed , c a l ib r a t e d , and v e r i f i e d u s in g monthly means, an a d d i t io n a l
v e r i f i c a t i o n t e s t was performed on in d iv id u a l c a s e s ( s e l e c t e d c a s e s
hav in g s p e c i f i e d y ea r , m o n th ,■ day, and hour d a ta ) in t o which E l Paso
C ity T ra n sp o r ta t io n Department data was s u b s t i t u t e d .

Table 10. Computer Programs Used for Data Analysis
Type o f A n a ly s is Program(s) Summary D e sc r ip t io n R eference
Normal d i s t r i b u t i o n 'Proc S p lo t This SAS procedure p r e s e n ts a schem atic p lo t o f the raw data in which the lo c a t io n o f the data in r e l a t i o n to the normal d i s t r i b u t i o n curve i s p resen ted as w e l l as s c a l e , range, skew ness , k u r t o s i s , and o u t l i e r s . O u t l ie r s o f 1 / 2 0 samples are represen ted by an "0 " and 1 / 2 0 0 by a In th e body o f the r e c ta n g le a dashed l i n e r e p r e se n ts the median.
SAS, 1979b
U1CO
Data Proc GPlotin t e r r e l a t i o n s h i p s Proc P lo t
These procedures p lo t the data in s c a t t e r p l o t and a ls o th e form o f Y*X to rep resen t th e r e la t i o n s h i p s o f the v a r io u s param eters. The p lo t procedures are used to demonstrate th e r e s u l t s o f o th er t e s t s .
SAS, 1979a
SAS, 1981b
Frequencyd i s t r i b u t i o n
Proc Freq. Frequency c a t e g o r ie s were a ss ig n e d to each v a r ia b le as in d ic a te d in the Cables and th e procedure performed to determine the frequency d i s t r i b u t i o n o f the v a r ia b le by time and s i t e com bination.
SAS, 1979a

Table 10. Continued
Type o f A n a ly s is Program(s) Summary D e sc r ip t io n Reference
MeansM iss ing v a lu e s
Proc Means Proc U n iv a r ia te
Both procedures were used to determine the mean and accompanying b a s ic s t a t i s t i c s (sum o f w e ig h ts , sum, mean, s ta n dard d e v ia t io n , v a r ia n ce , u ncorrected sum o f sq u ares , co r rec ted sum o f sq u a res , standard error o f mean, coe f f i c i e n t o f v a r ia t io n , measure o f skew ness , mode, measure o f k u r t o s i s , s t u d e n t ' s t v a lu e fo r H : mean = 0 , s m a l le s t v a lu e , l a r g e s t v a lu e , lower and upper quar- t i l e and median range, d i f fe ren ce between la r g e s t and s m a l le s t v a lu e s , m iss in g v a lu e s , number o f occurr e n c e s , count as a % of t o t a l number o f o b s e r v a t io n s , count as a % o f t o t a l number o f m iss in g v a lu e s , number o f o b s e r v a t io n s , range, and norm ality u s in g the Kolo- mogorov-Smirnov t e s t ) for v a r io u s com binations o f s i t e , y ea r , month, day and hour.
SAS, 1979a
LnVO
A u to co r re la t io n Proc Autoreg This procedure was used to SAS, 1979adeterm ine the p resence orabsence o f a u to c o r r e la t io n SAS, 1980

Table 10. Continued
Type o f A n a ly s is Program(s) Summary D e sc r ip t io n R eference
E q u a lity o f means Proc NIPARWAY
Model development Proc GLM
as in d ic a t e d by the m atrix produced when u s in g the p ro ced u re .
T his procedure p ro v id es a c h i-sq u a r e approximate t e s t fo r th e K ru sk a l l -W a ll is ( in th e Wilcoxon p o rt io n o f th e procedure) fo r combinat io n s o f time and s i t e .
The p r i n c i p l e o f l e a s t squares i s used to f i t l in e a r models w ith u n iv a r ia t e and m u lt iv a r ia t e a n a l y s i s . This procedure a l s o a l lo w s the use o f cr o ss -p r o d u c t terms when th e model parameters a re cons id e r e d l i n e a r w i th in thems e l v e s .
SAS, 1979a
SAS, 1979aO'o
Model development and c a l i b r a t i o n
Model development and c a l i b r a t i o n
Proc RSREG
Proc KLIN Proc S y sn l in
This procedure models a quad- SAS, 1981cr a t i c respon se s u r fa c e , f i t t i n g the parameters and determ in ing th e c r i t i c a l v a lu e s fo r r e sponse o p t im iz a t io n .
These procedures u t i l i z e the SAS, 1979amethod o f l e a s t - s q u a r e s for e s t im a t io n o f the parameters SAS, 1980in a n o n - l in e a r model.

Table 10. Continued
Type o f A n a ly s is Program(s) Summary D e sc r ip t io n R eference
Model v e r i f i c a t i o n Proc P lo t Proc GPlot A ction Statem ents Working w ith SAS
Data S e ts
These procedures were used to c a l c u l a t e and produce graphs o f th e p red ic te d and a c t u a l v a lu e s and r e s id u a ls ob ta in ed by u s in g data from 1979 and 1980 w ith th e model developed u sin g th e data from 1975-1978.
SAS, 1979a
SAS, 1981a
Note: For th e accompanying job c o n tr o l language s e t (JCL)
fo r each program r e f e r to Broim, 1977; B o i l l o t , 1978;
SAS, 1978; SAS, 1979a; SAS, 1981a; SAS, 1981b; S a ss ,
1974; Spencer, 1980; UCS, 1980; and UCS, 1978. •

62
Commenta
Although the p r o to c o l shown in F igu re 4 in d i c a t e s a ra ther
c o n c i s e and o r d e r ly p ro g ress in the model p ro d u c t io n , one should
c o n s t a n t ly be aware o f the r e p e t i t i o n and re -ex a m in a tio n phases which
are in d ic a te d by the diamond-shaped f ig u r e s and arrows in the diagram.
The i n i t i a l use o f graphs to examine the d ata in each phase o f the
p ro ce ss g r e a t ly a id s in p ro ce ss e f f i c i e n c y . R e s u l t s o f s p e c i f i c t e s t
procedures may be c l a r i f i e d or a m p li f ie d by c o n ju n c t iv e usage o f the
v a r io u s graphing t e c h n iq u e s . M u lt ip le graphing tech n iq u e s (3
d im en s io n a l , bar graphs, p ie c h a r t s , e t c . ) are a v a i l a b l e in the
SAS/GRAPH package w hich , when combined w ith e l e c t r o s t a t i c p l o t t e r
o u tp u t , can provide in v a lu a b le d ia g n o s t i c t e c h n iq u e s . The exam ination
o f graph ic output may g r e a t l y s i m p l i f y the a n a l y t i c a l and d ia g n o s t i c
p r o c e s s e s . Graphic r e p r e s e n ta t io n s o f the data an d /or a n a ly t i c a l
procedures were used whenever p o s s i b l e . D i f f e r e n t g r a p h ic a l tech n iq u es
were examined to determ ine th e most e f f i c i e n t method fo r b es t
dem onstrating the t e s t r e s u l t s .
While the model d e v e lo p r a e n t - c o n d i t io n in g -c a l ib r a t io n p ro ce s s i s
n ot d i f f i c u l t , i t i s i n t r i c a t e . To c l a r i f y the procedure and the
r a t io n a l e used to d ev e lo p the p r o c e s s , p a r t i c u l a r l y by the use o f
s p e c i f i c examples from the c o n d i t io n in g p r o c e s s , the methods a re a l s o
in c lu d ed in Chapter IV.

63
CHAPTER IV
PRESENTATION AND DISCUSSION OF RESULTS
The d e s c r ip t i v e s t a t i s t i c s r e s u l t s in t h i s ch ap ter are g iv en
fo r normal d i s t r i b u t i o n curves (SPLOT); s c a t t e r p l o t s showing the
r e l a t i o n s h i p o f carbon monoxide (CO) to wind speed (WS), wind d i r e c t i o n
(WD), temperature (T ), t r a f f i c (TR), m ix in g h e ig h t (MH), and tr a n sp o r t
wind (LYR); m is s in g d ata ; fr e q u e n c ie s ; means; d iu r n a l and s e a s o n a l
p a t te r n s ; and e q u a l i t y o f means t e s t i n g . The two models — the
q u a d ra t ic model (QM) and the g e n e r a l l i n e a r model (GLM) — are
d e s c r ib e d in terras o f developm ent, c a l i b r a t i o n , v e r i f i c a t i o n , and
e v a lu a t io n .
D e s c r ip t iv e S t a t i s t i c s
The r e s u l t s o f the d e s c r i p t i v e s t a t i s t i c s w i l l be p rese n ted and
d is c u s s e d in terms o f s p l o t s , s c a t t e r p l o t s , m is s in g d a ta , f r e q u e n c ie s ,
and means.
S p lo t s
Examination o f the s p l o t s (F ig u r e s 5 -1 1 ) show the raw d ata
(w ith th e e x c e p t io n o f wind d i r e c t i o n and tem perature) to have a
p o s i t i v e skew. The u n i t s used in the s p l o t s were — CO (ppm), WS
( m i /h r ) , T (®F), TR ( v e h i c l e s / h r ) , and MH (m e te r s ) . The means and

2 3 . 0
SchCKA
IC
PLCTS
F0RVLP.1APL[
1 9 . 2
1 1 . 5
7 . 6 7
3 . 6 3
Note CO units=ppm
Figure 5. Splot for Carbon Monoxide

4 2 . 0
3 b . 0
2 8 . 0 '
SCHtyATIC
PL0TS
C 2 1 . c
VtP.IADL 1 * . 0 C
7 . C 0
N ote: Wind Speed u n i t s = n i l e s /h o u r
Figure 6. Splot for Wind Speed

26 1 .
3 J l .
2 4 1 .
If I.
1 2 1 ,
b r *2
(ft
N ote : Wind d i r e c t i o n u n i t s = d e g re e s
Figure 7. Splot for Wind Direction

111 .
scHtMATIC
PL0TS
F
§•VAF.IABLE
! 2 . 5
7 4 . 0
5 5 . 5
3 7 . 0
l e . 5
o
Note: Temperature u n i t s •=• degrees F arenheit
Figure 8. Splot for Temperature

• 105D* 05*
SC
cMATIC
PL0TS
F0R
VARIABL€
. 8 7 7 0 * 0 4 '
, 7 0 3 0 * 0 4 *
. 5 3 ü 0 * t ' 4 *
. 3 5 7 0 * 0 4 *
. 1 6 3 0 * 0 4 .
1 0 0 .
o3 )
Note: T r a f f i c u n i t s = v e h ic le s /h o u r
Figure 9. Splot for Traffic

.ESCC*C4
.*92C*(4
C . J 9 3 D * C 4
1 5 7 C * C 4
cr>o
Note: Mixing Height u n i t s = meters
Figure 10. Splot for Mixing Height

2 i.'û
SCHeXATIC
F10TS
F0.R
VAR ■ 1 A 0 L r
1 9 . 2
lb .3
1 1 . 5
T . t . 7 -
''jO
!?■R
3.-EÏ
Note; Transport Wind (LYR) u n i t s = m eters /secon d
Figure 11. S p lo t fo r Transport Wind

71
medians are in c l o s e agreement which was a l s o in d ic a te d in the
u n iv a r ia t e a n a l y s i s . The d ata show an abundance o f o u t l i e r s . Although
t h i s t e s t produces hidden v a lu e s ( i . e . d u p l i c a t e v a lu e s rep resen ted by
one or "o") the la rg e number o f o u t l i e r s i s a l s o dem onstrated in
th e exam ination o f the s c a t t e r p l o t s (F ig u r e s 1 2 -1 9 ) . T ransform ations
o f the d ata u s in g the lo g , In , l o g - l o g , e x p o n e n t ia l , square r o o t , and
th e subsequent in v e r s e forms f a i l e d to produce s u b s t a n t ia l improvement
in the d i s t r i b u t i o n o f CO. The s p l o t s show the data to be normally
d i s t r i b u t e d w ith the mean and median in c l o s e agreement. They a l s o
c l e a r l y show the s tron g p o s i t i v e skew in th e CO, wind speed , t r a f f i c ,
m ixing h e i g h t , and tra n sp o rt wind d a ta . The skewness o f the d ata may
p rov id e a p o t e n t i a l sou rce o f d i f f i c u l t y in e s t a b l i s h i n g l i n e a r
r e l a t i o n s h i p s in the modeling p r o c e s s .
S c a t t e r p l o t s
S c a t t e r p l o t s o f th e raw, untransform ed data are shown in
F ig u res 1 2 -1 9 . A p a r a b o lic curve i s shown in the s c a t t e r p l o t s (F ig u res
12 and 13) o f CO v e r s u s wind sp eed , thus in d ic a t in g a n o n - l in e a r
r e l a t i o n s h i p . In F ig u res 14 and 15 the r e la t i o n s h i p o f CO and wind
d i r e c t i o n by s i t e are shown. The data from both s i t e s show no apparent
l i n e a r r e l a t i o n s h i p s . The s c a t t e r p l o t o f the data from s i t e 27 (F igure
14) i n d i c a t e s c l u s t e r in g o f th e d ata p o in ts between ap proxim ate ly 5 0 -
175° and 2 1 0 -3 5 5 ° . S i t e 27 i s lo c a te d in the c e n t r a l b u s in e s s d i s t r i c t
o f E l Paso in the pass between th e F r a n k lin and Chihuahua Mountains.
T h is c l u s t e r i n g o f d a ta p o in t s i l l u s t r a t e s the wind p a s s a g e / f lo w
through t h i s p a ss .
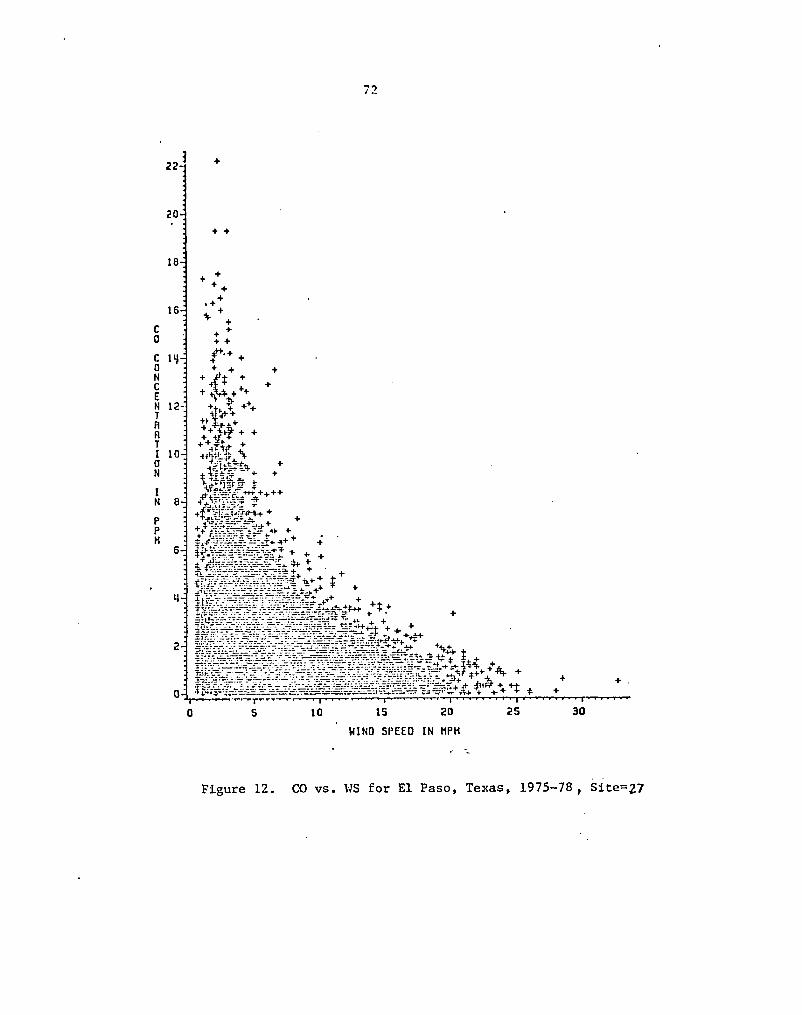
22-1
2 0 -
10 -:
16-
14-C 0 N C EN 12- T H fl T I 0 N
1 0 -
IN 8-P P M
0-
------
- T10 15 20
W I N G S P E E D IN H P H2 5 30
Figure 12. CO v s . WS fo r El P a so , T ex a s , 1 9 7 5 -7 8 , Sxte=27

73
20-
18
16
c IM0c0N 12cENTR 10ATI0N bINP 6-PH
y-
Iflt;
+
I.............I ' ' ' "- ■ ■ ■ I.' ............. I ■ ' ■.............. ■ I •0 s 10 15 20 ' 25 30 35 MO
H I N D S P E E D IN MP H
F ig u re 13. CO v s . WS f o r El P a so , T exas , 1 9 7 5 -7 8 , S it e = 2 8

74
22
2 0 -
18-
16-C0
C m0NCEN 12 TnRTI 10GNIN 8PPM
6-4
2-4
+ *
50 100 1 5 0 2 0 0D e g r e e s
2 5 0 3 5 0
Figure 14. CO vs. Wind Direction for El Paso, 1975-78, Site 27

75
20-J
10
16
C IW 0
C0N 12CENTn . 1 0H T I 0 N 8 -
6 -
W-
0 -
j - r r - ’.—. r c r ’
50 ICO 150 200Degrees
250 300 350
F igure 15. CO v s . Wind D ir e c t io n fo r El P aso , 19 7 5 -7 8 , S i t e 28

2 2 -
20 -
18-
76
+ f
+4-
C0
c.0NCENTRAT[0N
IN
PPH
16-
IW-
12 -
10 -
8 -
G-
q-:
2-
0 -
+ + + ++
+ +
* î -
+ +
+
yo 50 60 70
TEMPERATURE IN DEGREES F
100 110
Figure 16. CO vs. Temperature for El Paso, Texas, 1975-78

2 2 -
20 -
18:++
77
C0
C0NrENTflflTI
. 0NINPPM
l e :
m :
12:
10:
4-
2 -
q:
++++ +++
' ■ ■ m '
++
:V -: +
^ t t s r t ** +++ '+ 4 ^ 1 ' # ^-*4 + 4-
+ 4 + +
. t >+ 4-,
JlliÉiliiiiîllMiiiiiiiliii/iiéiiiijiiiÉiili®
2000 1 0 0 0 ' 6000 V E H I C L E S P E U H O U R
100 0 10000
Figure 17. CO vs. Traffic for El Paso, Texas, 1975-78

78
134
12
11 -
10
C 9 0
C0NCENTRATI0N
IN
PPM
8 -
7-
5 -
y-
2 -
1 -
t
& + +
++
++
4+ ++
+
+ 4- + +.+ + ++ + + ++ +
+ + ++ + +
+ + +
4-.4+-M-44PfH- +;rif:»-++ ..4+ 4f. # t ■*■++. .
c+ J _ + +
,,,+*- + . -ff
r - # +_ _ L "t+Jd"
ifc^SKèÎÉiiife-i1000 2000 3000 4000
MIXING HEIGHT IN METERS
5000 6000
Figure 18. CO vs. MH for El Paso, Texas, 1975-78

79
1 3 4
12
1 1
1 0 -
C 9 0
0.NCENTRATt
'ÔNINPPM
8 -
7-
6 -
4-1
+
++
-r
++
0-1 i- rry r-
10f-rrp-m
T T x p r
IS1--^+^ + + 4^ ■*■. y o , I I t i-T -p T i - , , , - r , , p ," ' r
128 8 10 12 14 IS 18W I N D S P E E D n C C R O S S M I X I N G D E P T H IN M / S
20 22
F igu re 19 . CO v s . LYR fo r El P aso , T exas , 1975-78

80
S c a t t e r p l o t s o f temperature (F igu re 1 6 ) , t r a f f i c (F igu re 17),
m ixing h e ig h t (F ig u re 1 8 ) , and tr a n sp o r t wind (F ig u re 19) a l l show
apparent lack o f l in e a r r e l a t i o n s h i p s w ith CO. Care should be
e x e r c i s e d in the i n t e r p r e t a t i o n o f th ese graphs s in c e o u t l i e r s were not
om itted from the d a ta , nor was c o n d i t io n in g done on th e p lo t t e d data .
E x c lu s io n o f o u t l i e r s and/or c o n d i t io n in g o f the data was not used in
the s c a t t e r p l o t t i n g p ro ce ss s in c e t h i s r e s u l t e d in 1 ) r e d u c t io n o f the
data to q u a n t i t i e s th a t d id not a d eq u a te ly r e p r e s e n t the e n t i r e
p o p u la t io n , 2) e x c lu s io n o f important d ata segm ents , or 3) production
o f s im i la r s c a t t e r p l o t forms.
S c a t t e r p l o t s o f the raw d ata show th at l i n e a r r e la t i o n s h i p s
among CO and the o th e r parameters are not c l e a r l y d e f in e d . T his may be
th e r e s u l t o f 1 ) the abundance o f raw d a ta , 2 ) th e p o s s i b l e p resen ce o f
la rg e numbers o f o u t l i e r s , or 3) the absence o f a l i n e a r r e la t i o n s h i p .
Because o f t h e ' lack o f c l e a r l y d e f in ed l i n e a r r e la t i o n s h i p s as shown in
th e s c a t t e r p l o t s , n o n - l in e a r model form i n v e s t i g a t i o n was in d ic a t e d fo r
th e model development phase.
M iss in g Data
T a b u la t io n s o f m is s in g data fo r CO i s shown in T ables l lA and
1 IB. Examination o f the CO d ata by s i t e , month, and year in T able 11-A
r e v e a l s four months (November-Deeember o f 1975 and January-February o f
1976) o f m is s in g data for s i t e 27 and four months (M arch-July , 1978)
fo r s i t e 28. P er cen ta g e s o f m is s in g d ata e x c e e d in g 25% are
c o n s i s t e n t l y found throughout the d a ta from 1975-1978 . Although
grouping the d ata fo r both s i t e s by month and year (T ab le 11-B)

Tabic l lA . I’o rccn t Ml.sslnp, V alues for CO by S i t e , Month and Year fo r 1975-78
18 M3 MCr fCTH|337Î 1 l?0 744 17.473
i f 75 2 79 0?: 11.756? . f 75 3 120 74 4 16.1292 f 75 M 2?! 72: 39.0282 f 75 . S 394 74, 52.957i f 75 b 671 67. 99.6512 75 7 418 y : : 58.0562 f 75 t 105 744 25.COO2 f 75 9 450 72'» C3.<?^92 f 75 to 67 7h , 11.6942» 75 11 720 720 100.0002 75. 12 744 74s ICO.000d 75 1 744 744 100.0003 f 76 2 695 695 100.0002 f 76 3 735 74 . 99 .7902 f 75 4 33 72: 4.SU32 75 5 293 744 40.1802» 76 6 130 720 19.1672' 76 7 199 744 23. 7472 * 76 0 46 744 6.1632» 76 9 59 723 8.194a 75 10 57 744 7.6612 76 1 I 215 720 29.0612' 76 12 58 744 7.7962» 77 I 89 744 11.9622» 77 2 68 6UQ 10.4942* 77 3 116 744 15.5912 ’ 77 U 104 720 14.4442^ 77 5 95 744 12,7692 77 6 120 720 17.7782 f 77 7 267 744 35.0072 77 8 34 744 4.5702» 77 9 423 720 58.7502» 77 10 342 74 4 45.9582» 77 I 1 34 720 4.7222 77 (2 238 744 31.9892 76 J 153 744 20.5552 * 78 2 521 624 83.4942 78 3 60 74-, 10,7532» 78 4 63 720 8.7502> 78 5 106 744 14.2472» 78 6 188 720 27.5002» 78 7 IS 744 2.01627 78 8 204 5C4 40.4762 ’ 70 9 174 720 24.1672 ’ 78 10 58 744 7.7962 ; 78 11 43 720 5.97227 76 12 37 744 4.97328 75 1 312 523 59.09126 75 2 597 672 06.83926 75 3 45 744 6.04820 75 4 106 720 14.72226 75 5 144 744 19.35523 75 6 102 720 14.1:726 75 7 351 744 47.17728 75 8 230 744 30.91428 75 9 305 720 42.50028 75 10 103 744 13.04423 75 11 192 643 29.63028 75 12 275 744 37.50028 76 1 139 744 16.68328 , 76 2 24 696 3.44623 75 3 109 744 14.65128 1 76 4 357 672 53.12s28 75 5 371 720 51.52828 76 6 142 720 19.72228 76 7 381 744 51.21028 76 8 266 . 744 35.75328 76 9 34 720 4.72228 76 10 63 744 8.46828. 76 11 117 720 16.25023 76 12 44 744 5.91428 77 1 41 744 5.51128 77 2 33 672 4.91128 77 3 161 744 21.64028 77 4 33 720 13.61128 77 5 204 744 27.41923 77 6 123 720 17.08328 77 7 306 744 41.12928 77 e 103 744 13.84428 77 9 526 720 73.05628 77 10 66 744 11.55928 77 11 SO 720 6.94428 77 12 43 744 5.7602J 73 I 661 744 8 8 .8 4 428 78 2 602 872 89.56323 70 3 744 744 100.00028 78 4 720 720 100.00028 70 5 74 4 744 100.00028 78 6 720 720 100.00028 73 7 744 •744 100.00028 70 0 555 744 74.59?28 78 9 136 698 19.54020 78 10 42 744 S.64528 78 11 106 720 15.00028 76 12 86 744 11.559

82
Table I I B , P ercen t M iss in g V alues fo r CO by Month and Year fo r 1975-78
TF. r.s NF!I5 NOB PCTKISS75 I 442 1272 34.74 8475 2 676 1344 50,297675 3 165 1488 11.088775 W 337 1440 26.675075 5 538 1466 35.155975 6 773 1392 55.531675 7 769 1464 52.527375 8 416 14 88 27.957075 9 766 1440 53.194475. 10 190 1488 12.766875 11 912 1358 65.565775 12 1023 1498 66.750076 1 883 1488 59.341476 2 720 1392 51.724175 3 644 1488 56.720476 390 1392 28.017276 5 670 1464 45.755075 6 280 1440 19.444476 7 580 1488 36.378576 8 312 1488 20.967775 9 33 1440 6.458376 10 120 1488 8.054576 11 332 1440 23.055676 12 102 1488 6.854877 1 130 1488 8.736677 2 101 1320 7.651577 3 277 1488 18.615677 202 1440 14.027877 5 299 1488 20.094177 6 251 1440 17.430677 7 573 1408 38.508177 8 137 1488 9.207077 3 949 1440 65.902877 10 428 1408 28.763477 11 84 1440 5.833377 12 281 1488 18.864478 1 814 1488 54.704378 2 1123 1296 86.651278 3 824 1488 55.376378 783 1440 54.375076 5 850 1488 57.123778 6 918 1440 63.750078 7 759 1488 51.008178 8 759 1248 60.817378 9 310 1416 21.832778 10 100 1488 6.720470 11 151 1440 10.486178 12 123 1488 8.266)

83
e l im in a te d the p er io d s h av in g 1 0 0 % m is s in g d ata b lo c k s , n e v e r t h e l e s s ,
p ercen ta g es in e x c e s s o f 50% were found in 18 o f the 48 time p e r io d s .
T h is e x t e n s iv e m is s in g data produced the problems o f 1) unequal sample
s i z e s and 2 ) l o s s o f n o rm a lity which g r e a t ly in t e r f e r e d w ith a n a ly s i s
a t the s i te -y e a r -m o n th -h o u r l e v e l . M iss in g d ata a l s o l im ite d th e u se
o f d ata fo r the o th e r p aram eters .
F req u en c ie s
Frequency d ata w i l l be p resen ted and d is c u s s e d fo r CO, wind
sp eed , wind d i r e c t i o n , tem p eratu re , monthly t r a f f i c , m ixing h e i g h t , and
tr a n sp o r t w inds. On th e b a s i s o f a p re l im in a ry cu rsory scan o f the
d a ta , and o b s e r v a t io n s o f th e s p l o t s and s c a t t e r p l o t s frequency
c a t e g o r i e s were i n t u i t i v e l y and a r b i t r a r i l y a s s ig n e d fo r u s e w ith CO,
wind sp eed , wind d i r e c t i o n , tem p eratu re , t r a f f i c , m ix ing h e i g h t , and
tr a n sp o r t wind.-
CO. T able 12 and F ig u re 20 p r e se n t CO frequency by month fo r
1975-1978 fo r th e fo l lo w in g four c a t e g o r i e s o f ambient a i r CO
c o n c e n t r a t io n s : 1) < 1 ppm, 2) 1-5 ppm, 3) 5-9 ppm, and 4 ) > 9 ppm. As
shown by T able 12 the h ig h e s t p ercen ta g e o f CO v a lu e s >5 ppm occu r in
October through January. At v a lu e s = 5 ppm the frequency d i s t r i b u t i o n
does not e x h i b i t a c l e a r monthly p a t t e r n . I n d iv id u a l p a t te r n s o f the
d a ta shown by s i t e should be e v a lu a ted w ith c a u t io n and from the
c o n s e r v a t iv e v iew p o in t termed i n c o n c lu s iv e because o f m is s in g d a ta .
Wind sp eed . Wind speed fr e q u e n c ie s are d is p la y e d i n T ab le 13
and F igu re 21 by year and month fo r a l l s i t e s combined. The l a r g e s t
p erc en ta g es o f low wind speeds (= 5 mph) are c o n s i s t e n t l y found in the

MO
Table 12. CO % Frequencies by Month for El Paso, 1975-78
TABLE OF F BT MO
PERCENT 1 1 1 2 1 3 1 1 1 5 1 6 - I ’ I 8 1 9 110 111 1 12 1 TOTAL« I 1 3.51 1 3.20 1 5.11 1 5.08 1 1.75 1 1.92 1 1.56 1 5.52 1 .1.79 1 5.80 1 1.88 1 1.78 1 56.911-5 1 3.59 1 2.18 1 3.02 1 3.37 1 2.90 1 2.63 1 2.51 1 3.36 ! 2.91 1 1.59 1 3.60 1 1.12 1 39.03
5-9 1 0.39 1 0.21 1 0.23 1 0. 15 1 0. 11 1 0.08 1 0.02 1 0.05 1 0. 19 1 0.61 1 0.51 1 0.52 1 3.30>9 1 0.03 1 0.05 1 0.02 1 0.01 1 0.01 1 0.00 1 0.00 1 0.00 1 0.02 1 0.15 1 0.18 1 0.18 1 0.7:TOTAL 316? 7.SB 27325.97 38128.10 39508.53 3571 31S0 3217 7.81 7.53 7.10
SZTE'2710888,91 36187.91 511111.13 12093.20 11239.67 15751100.00
■ TABLE OF F BT MOF MOPERCENT 1 1 1 2 1 3 : 1 1 1 5 1 6 1 7 1 8 1 9 1 10 111 1 12 1 TOTAL< I 1 2.32 1 1.50 1 3.26 1 1.37 1 3.92 1 2.93 1 1.30 1 3.85 1 2.87 i 3.22 1 2.90 1 1.99 1 37.191-5 1 1.93 1 3.52 1 1.57 I 5.58 1 1.71 1 1.20 1 1.30 1 5.70 1 1.32 1 6. 17 1 1.32 1 5.02 1 57.37
5-9 1 0.52 1 0.35 1 0.32 1 0.21 1 0.19 1 0.08 1 0.01 1 0.08 1 0.29 1 0.78 1 0.57 1 0.61 1 1.23»9 1 0.11 1 0.05 1 0.03 1 0.01 1 0.01 1 0.00 1 0.00 1 0.00 1 0.02 1 0.17 1 0.16 1 0.25 1 0.86TOTAL 1860 7.91 1276 S.12 1925 8. 18 239910.20 2082 1697 8.85 7.21
SITE TABLE OF
20538.73"28 F BT HO
22669.63 17617.50 213210.31 18637,91 18998.07 23521100.00
F HOPERCENT 1 I 1 2 1 3 1 1 1 5 1 6 1 7 1 8 1 9 110 111 1 12 1 TOTAL< 1 1 1.77 1 5.00 1 7.12 1 5.81 1 5.61 1 7.03 1 1.75 1 7.28 1 6.82 1 8.52 1 6.98 1 7.69 1 77.11l-S i 2.1: 1 1.37 1 1.37 1 1.01 1 0.95 1 0.96 1 0.62 1 0.89 1 1.12 1 2.52 1 2.81 1 3.17 1 19.73
5-9 1 0.25 1 0.13 1 0. 13 1 0.08 1 0.09 1 0.07 1 0.00 1 0.03 1 0.08 1 0.19 1 0.51 1 0.11 1 2.28>9 1 0.03 1 0.01 1 0.01 1 0.01 1 0.01 1 0.00 1 0.00 1 0.00 1 0.01 1 0.13 1 0.20 1 0.09 1 0.55
total 16077.23 11586.55 19178.82 15516.98 1189 1793 6.70 8.07 1:915.37 18228.20 18518.31 268212.06 231:10.53 252111.35 22230100.00
CO

HO
a 0 . 1 6 1
S.5ÎX
cy0 . 0 2 %
ny0.08%2.63%
nj0 . 0 1 %2.90%
CJ0.16%
cy0 . 0 2 %0.23%
cy0 .0 5 %
CD0.09%0.39%
f
F igure 20 . CO % F requ en c ies by Month fo r El P aso , 1975-78
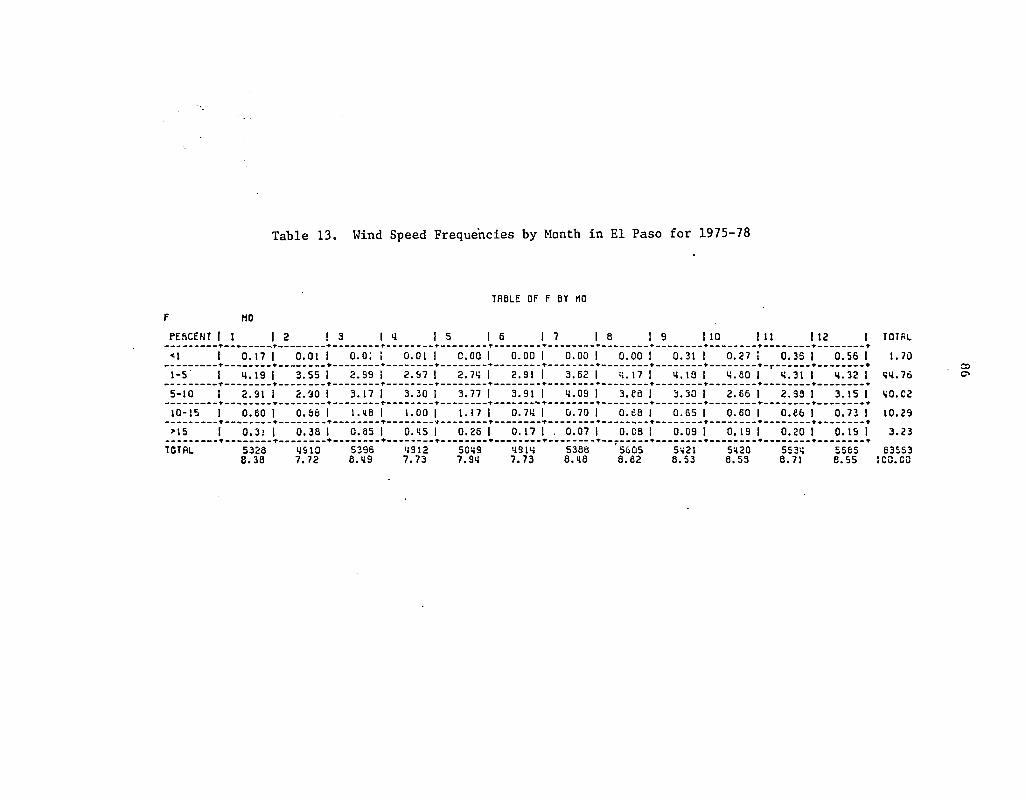
Table 13. Wind Speed Frequencies by Month in El Paso for 1975-78
HOTABLE OF F BT MO
PERCENT 1 1 1 2 1 3 1 4 1 5 1 6 1 7 1 8 1 9 10 11 1 12 1 total<1 1 0.17 1 0.01 1 0.0: 1 0.01 1 C.OO 0.00 1 0.00 1 0.00 1 0.31 0.27 0.35 1 0.55 1 1.701-5 1 M.19 1 3.55 1 2.99 1 2.97 1 2.74 2.91 1 3.62 1 4.17 1 4.18 4.60 4.31 1 4.32 1 14.765-10 1 2.91 i 2.30 1 3.17 1 3.30 1 3.77 3.91 1 4.09 1 3.86 1 3.30 2.66 2.93 1 3. 15 1 10.0210-15 1 0.80 1 0.66 1 1.18 1 1.00 1 1.17 0.74 1 0.70 1 0.68 1 0.55 0.60 0.66 1 0.73 1 10.29>15 I 0.31 0.38 1 0.85 0.15 1 0.26 0. 17 1 . 0.07 0.08 ! 0.09 0. 19 0.20 I 0.19 1 3.23TOTAL 5328 1910 5396 4912 5049 4914 5388 5605 5121 5120 5534 5565 835538.38 7.72 8.19 7.73 7.94 7.73 6.18 8.62 8.53 8.53 8.71 8.55 100.00

rtftCENrecc block ckam
»ii C3O■0.I7Z
CD0 . 0 0 %
CD0.07% o.ino.e$%
ccC.SE%0.69%0.90%
3.17%« I X
l*S3.62%2.97%
C 3o.in
iD0 . 0 0 %
CD0 . 0 0 %
CD0 . 01%
CD0 . 01%
CDo.oox
MO
Figure 21 . Wind Speed Frequencies by Month in El Paso fo r 1975-78

88
months o f October through January. At wind speeds in e x c e s s o f 5 mph
the monthly wind speed p a t te r n s become i n d i s t i n c t . The la r g e s t
p ercen tage o f wind speeds in e x c e s s o f 10 mph occur in the month o f
March. These p erc en ta g es must be c a r e f u l l y e v a lu a te d , however, in view
o f 1 ) the e x t e n t o f m is s in g d ata and 2 ) th e low p ercen ta g es r e s u l t i n g
from e v a lu a t io n o f the in d iv id u a l d ata b lo c k s as a p o r t io n o f the t o t a l
d ata s e t .
Wind d i r e c t i o n . Wind d ir e c t i o n fr e q u e n c ie s by month for the
combined d ata shown in T able . 14 and F ig u re 22 may g e n e r a l ly be
summarized as fo l lo w s :
a . p erc en ta g es o f wind d i r e c t i o n s 0 -4 0 ° (and 2 0 0 -2 4 0 °) appear to be ev e n ly d i s t r i b u t e d a c r o s s the months o f the y ea r ,
b . th e h ig h e s t p erc en ta g es o f wind d ir e c t i o n s 4 0 -1 6 0 ° occur in J u ly through O ctober ,
c . th e h ig h e s t p erc en ta g es o f wind d i r e c t i o n s 120-160° occur i n May through O ctober ,
d. p erc en ta g es o f wind d i r e c t i o n s 1 6 0-200° a l s o appear to be e v e n ly d i s t r i b u t e d a c r o ss the months o f th e year w ith a s l i g h t peak o cc u r r in g in J u ly ,
e . in Maroh-April the h ig h e s t p erc en ta g es o f wind d ir e c t i o n o f 2 0 0 -2 4 0 ° occur w ith lo w est v a lu e s observed in A ugust- September.
f . wind d i r e c t i o n , 2 4 0 -2 8 0 ° p e r c e n ta g e s are e le v a te d throughout the year w ith lo w er in g s in J u ly and August,
g . wind d ir e c t i o n , 2 8 0 -3 2 0 ° p e r c e n ta g e s have a s l i g h t l y lower e l e v a t i o n (than 2 4 0 -2 8 0 °) throughout the year w ith in c rea se d lower p erc en ta g es shown in J u ly , August, and September,
h . June i s the o n ly month throughout the year e x h ib i t in g a s l i g h t in c r e a s e in 3 2 0 -3 6 0 ° wind d i r e c t i o n .
F ig u re 22 in d i c a t e s the predominant wind d ir e c t i o n c a t e g o r ie s
to be 1) 4 0 -1 8 0 ° which have th e h ig h e s t p ercen ta g e o f o ccu rren ces in

Table 14. Wind Direction Frequencies by Month in El Paso for 1975-78
TABLE OF F BT KOHO
PERCENT 1 1 1 2 1 3 1 1 1 5 1 6 1 7 1 8 1 8 I1 10 111 1 12 1 TOTAL<W0 1 0.M6 1 0.10 1 0.37 1 0.30 1 0.36 1 0.17 1 0.19 1 0.17 1 0.38 1 .0.51 1 0.19 1 0.13 1 5.12>*'i0-'80 1 0.78 1 0.72 1 0.82 1 0.77 1 0.61 1 0.73 1 1. 15 1 1.27 1 1.37 i1 1.21 1 0.85 1 O.SI 1 10.92>=80-<!20 ! 1.11 1 0.99 1 0.89 1 1.02 1 1.02 1 1.11 1 2.08 1 1.33 1 1.82 11 1.50 1 1.37 1 1.11 1 15.53>=120-<160 1 0.83 1 0.61 1 0.51 1 • 0.72 1 0.91 1 1.23 1 1.83 1 1.31 1 1.13 11 0.99 1 0. 71 1 0.79 I 11.79>=150-<200 1 0.11 1 0.38 1 0.11 1 0.17 1 0.59 1 0.61 1 0.92 1 0.77 1 0.52 1 0.55 1 0.13 1 0.18 I 6.55>=200-<2.40 1 0.55 1 0.53 1 0.75 1 0.69 1 0.65 1 0.55 1 0.18 I 0.13 1 0.15 1 0.52 1 0.55' 1 0.52 1 6.95>=2'iC-<260 1 1.85 1 1.92 1 2.50 I 2.11 1 2.09 1 1.22 1 0.53 I 0.81 1 1.28 1 1.51 1 1.73 1 1.93 1 19.61>c2B0-<320 1 1.78 1 l.CO 1 1.76 1 1.5S 1 1.60 1 1.28 1 0.58 1 0.68 1 0.89 1 1.01 1 1.17 1 2.03 I 16.19>*320-<=360 1 0.55 1 0.17 I 0.16 1 0.38 1 0.58 1 0.72 1 0.39 1 0.12 1 0.39 1 0.15 1 0.52 1 0.60 1 5.33
total 56338.3252537.71 S8S78.59 55358.25 57958.18 56208.23 58168.51 56108.21 56258.21
59058.65 5596 8. 19 53338.52 68303100.90

rcKiiir&u uccx cmmt
•V
o.iu I.su1 . 4 5 1
9 55% 0. U 20 .75%0 .63%
0 .17% 0 .5 5% 0 . 4 1 1 e .« i io.set
0 71%
O . I I Xl.ltl
0 . ? n I . S 7 Z l . 2 ) Z 0 .15%0 .77%
«UO.tll# 4 6 %
oo
Figure 22. Wind D ir e c t io n Frequencies by Month in El Paso fo r 1975-78

91
the summer and Call months (Ju n e -O cto b er ) , and 2) 2 4 0 -320° which are
predominant in a l l but the l a t e summer months (August and Septem ber).
Temporature. Temperature frequency p e rc en ta g es (T ab le 15 and
F ig u re 23) e x h ib i t e d the ex p ec ted p a t t e r n s , i . e . , r e d u c t io n s o f
tem perature in the f a l l and w in ter months and e l e v a t i o n s in the sp r in g
and summer.
Monthly t r a f f i c . Monthly t r a f f i c frequency d i s t r i b u t i o n s
(T ab le 16 and F ig u re 24) show t r a f f i c volum es in the 1000-5000 v e h i c l e s
c a te g o r y p red om in ating . A l l frequency c a t e g o r i e s show no s i g n i f i c a n t
v a r i a t i o n by month or s e a so n .
Mixing h e i g h t . Mixing h e ig h t frequency p ercen ta g e by month
(T ab le 17 and F ig u r e 25) r e v e a l more d i s t i n c t i v e and c o n t r a s t in g
p a t te r n s than th e 5 p rev io u s p aram eters. The predominant frequency
p ercen ta g e c a t e g o r y i s the > 500 m eter c a t e g o r y which i s g r e a t l y
e l e v a t e d in March through May, w ith s l i g h t lo w er in g in J u ly and A ugust.
The 300-500 meter ca te g o r y tends to remain s t a b l e throughout th e y ea r .
S l i g h t in c r e a s e s in May, June, September, November, and January are
shown fo r the 100-300 meter c a t e g o r y . Only J u ly and August e x h i b i t any
lo w er in g o f the frequency p erc en ta g e o ccu rren ce o f the < 1 0 0 meter
c a te g o r y . W hile J u ly and August appear to be th e o n ly two months o f
the year having c o n s i s t e n t l y h ig h e r m ix ing h e ig h t s d ep th s , March-May
have th e h ig h e s t frequency p ercen ta g e o f o c c u r r e n c e s fo r m ixing h e ig h t s
in e x c e s s o f 500 m e te r s . H igher frequency p erc en ta g es o f <100 m eters
are shown fo r th e months February-May i n d i c a t in g th e p o t e n t i a l fo r th e
occu rrren ce o f low er l e v e l in v e r s io n e p i s o d e s d ur in g th e s e months.

MO
Table 15. Temperature Frequencies by Month for 1975-78
TABLE OF F BT KO
PERCENT 1 1 1 2 1 3 1 4 1 S 1 6 1 7 1 8 1 9 110 III 1.12 1 TOTAL0-30 1 0.12 1 0.09 0.02 0.00 1 0.04 1 0.00 1 0.00 1 0.00 1 0.00 1 0.00 1 0.33 1 0.41 1.3030-60 1 6.83 1 5.35 5.03 2.78 1 0.98 1 0.01 1 0.00 1 0.00 1 0.52 1 3.23 r 5.60 1 7.39 37.7660-00 1 0.62 1 1.73 3.47 4.35 1 4.93 1 3.24 1 3.63 1 3.65 1 5.17 1 4.65 I 2.35 1 0.93 38.75>80 1 0.00 1 0.00 0.18 1.22 1 2.54 1 5.08 1 4.83 1 4.67 1 2.55 1 0.87 1 0.03 1 0.00 22.18TOTAL 5309 4831 5302 5538 5795 5619 5701 5512 5627 5904 5607 5890 674307.87 ■ 7.17 8.75 8,35 8.59 8.33 8.45 . 8.32 8.34 8.75 8.31 8.73 100.00
O

MmCtWTRCg OlOCK CHART
*B0 CJ0 . 0 )1
CJ0 . 1 8 1
C J0 . 00% 0 . 6 7 1 I
s . 17%
CJ0 . 0 1 % S 60%0. &;%5.03%
a cy0.04%
MO
W
Figure 23 . Temperature Frequencies by Month fo r 1975-78

Table 16. Traffic Frequencies by Month in El Paso for 1975-78
TABLE OF F BT MOHO
PERCENT 1 1 1 2 1 3 1 0 1 5 1 6 1 7 1 8 1 9 1 10 111 112 1 TOTAL<.0-<500 1 1.02 1 0.90 1 1.00 1 0.90 1 0.90 1 0.70 1 0.75 0.70 1 0.92 1 0.98 1 0.90 1 0.70 I 10.55500-1000 1 0.93 1 0.80 1 0.93 1 0.92 1 0.97 1 1.01 1 1.03 l.OG 1 0.90 1 0.93 1 l.CO 1 1.11 1 11.531000-5000 1 N.32 1 3.75 I 0.22 1 0. 17 1 0.59 1 0. IS 1 0.53 . 0.20 1 0. 11 1 0. IS 1 3.73 1 3.91 1 09.305000-10000 1 2.00 1 2.12 1 2.39 1 2.21 1 2.09 1 2.30 1 2.23 2.25 1 2.30 1 2.50 1 2.52 1 2.82 1 27.77>10000 1 0.00 1 0.00 1 0.00 1 0.00 1 0.00 1 0.00 1 0.00 0.00 1 O.CO 1 0.01 1 0.02 1 0.01 1 0.03TOTAL 573S 5300 5952 5712 5928 5712 5928 5712 5736 5952 5888 5952 69312
8.28 7.85 8.59 8.20 8.55 8.20 8.55 8.20 8.28 8.59 8.21 8.59 ICO.03

f c n c c N T R s e b l o c k c h a a t
'~CD / CD ^ O o .c ix ^ 7 o . c i t e . s i i
7 felT 7M )
CDO . C O l
3 .7 3 1
1.0:% i.iul . C U0.80%
0. 70%0.76%1 . 02 %
K 9
Figure 24- T r a f f i c Frequencies by Month fo r El Paso, 1975-78

Table 17. Mixing Height Frequencies by Month for 1975-78
TfiSLE OF F 01 MOMO
PERCENT 1 1 1 2 1 3 1 S 1 5 1 G 1 7 i e 1 S 1 10 111 12 1 TOT?.<=c-<ioa 1 Î.Zt 1 1.55 1 l.SS 1 1.74 ( 1.34 1 1.21 1 0.24 i 1. 1C 1 1.23 ; 2.39 1 1.53 2.23 : 19.12J00-3C0 l.iiS 1 0.G7 1 O.GS 1 0.86 1 0.51 1 1.02 1 C.SO 1 1.10 1.10 1 1.07 1 1.21 1.2: ; 12.04300-500 0.23 1 0.13 1 0.13 1 0.21 0.24 1 0.55 1 0.64 1 0.78 0.27 1 0.62 1 •' 0.35 0.54 i 4.83>500 A .'50 1 3.'-iO i S.es 1 5.92 5.50 1 4.31 1 5.52 E. 13 5.34 1 £.57 i 5.71 5.53 : £5.04
TOTAL 278 215 320 326 298 233 255 342 233 357 34, 357 37337.«5 S.75 6.55 6.74 7.95 7.72 7.21 3.17 7.94 10.64 9.57 1:5.6:
•O

nacesTME ôlock chrt
■I
a / 0.62%
aa0.21%
0.67% Q.9U t . 07%
KO
O•sj
Figure 25. Mixing Height Frequencies by Month for 1975-78

98
This o b s e r v a t io n i s based s o l e l y on examinat ion o f mixing h e i g h t
frequency p e r c e n ta g e s .
Transport wind. Transport wind frequency p ercen ta ges by month
are g iv e n in Table 18 and F ig u re 26. The predominant frequency
perc enta ge c a t e g o r i e s are ^ 1 m e t e r s / s e c . and 1-5 m e t e r s / s e c . which are
h i g h e s t in March, A p r i l , and May and a g a in i n October through December,
Means
Monthly means (by year ) f o r CO, wind speed (MWS), temperature
(MT), t r a f f i c (MTR), mixing h e i g h t (MMH), and tr a n sp o r t wind (MLYR) are
g i v e n in Table 19 and shown in Figure 27 . Seasona l v a r i a t i o n s o f the
parameters r e v e a l e l e v a t e d l e v e l s o f CO in the f a l l and w i n t e r months
a lo ng wi th e l e v a t e d tr a nsp o rt wind speed . During th es e months the
monthly mean mixing h e i g h t d e c r e a s e s t o g e t h e r with temperature. For
the sp r ing and - summer months the parameters re v e r s e th emselves with CO
reduced, t r a f f i c reduced, mixing h e i g h t i n c r e a s e d , temperature
i n c r e a s e d , and tr a n s p o r t wind d ecr ea s ed . S urfa ce wind speeds are
h i g h e s t in the sp ri ng and g r a d u a l l y d e c r e a s e to minimum v a l u e s in th e
f a l l and w i n t e r . This s u g g e s t s th a t CO i s i n v e r s e l y r e l a t e d to mixing
h e i g h t and temperature and d i r e c t l y r e l a t e d to t r a n s p o r t wind speed.
The r e s u l t s o f s c a t t e r p l o t s o f the monthly means o f the parameter
i n t e r r e l a t i o n s h i p s are shown in F ig u r e s 28 through 41 and summarized in
Table 20. They do not p resent d i s t i n c t p a t t e r n s ; however, wi th the
e x c e p t i o n s o f CO v e r s u s t r a n s p o r t wind ( F i g u r e s 36 and 3 7 ) , and wind
speed v e r s u s mixing h e i g h t (F igure 3 9 ) , the o t h er parameter
r e l a t i o n s h i p s may be regarded as ap pr ox im ate ly l i n e a r hav ing wide band

Table 18. Transport Wind Frequencies by Month for El Paso for 1975-78
MOTfiSLE OF V 3T HO
PERCENT 1 1 1 2 1 3 1 9 1 5 1 8 1 7 1 8 1 9 i10 1 1 12 1 TOT<=1 3.55 1 2.59 1 9.25 1 9.39 1 9.05 1 9.03 ! 3.35 1 9.39 1 3.93 1 5.29 1 9.70 50.1-5 2.23 1 1.73 ! 1.35 i 1.50 1 1.73 1 2.S3 I 2.95 i 3.92 1 2.77 i 3.55 1 3. 12 2.55 i 50.5-lG 0.89 1 0.92 1 1.90 1 1.S9 l.SS :.23 1 0. 73 i 1.22 ! 1.15 1.50 i 1.12 1.13 ! 1 ,.13-15 0.32 0.29 0.77 ! 0.79 0.62 0.13 1 0.00 0.00 0.09 0.20 1 0.55 C.3, ; — •
>15 0.03 0.03 0.93 0.21 0.09 3.01 1 0.03 O.C-3 3.30 O.CO 1 0.11 0.33 : :.
TOTAL 5:27.16 9285.96 60S8.50 6236.75 ■ 560 8.11 5728.00 5227.30 3899.26 SES7.91 75010.9C6725.55 652 S.11 :co.

P E R C E N T A G E S L Î C K C H P R T
>15 CJ CJCJ CJC . C I Ï
1D>15
0.322
5-10
M i0 . 8 '
1-5
<•1
<4.25-
HO
F ig u re 26 . T ra n s p o r t Wind F re q u e n c ie s by Month f o r E l P aso f o r 1975-78

101
Table 19. Monthly Means by Year
YR MO NCO MIJS MT MTR m u in.YR
75 1 1.85 6 . 8 44.2 2839 742 5 .475 2 1.83 6 . 6 50.1 2993 1213 5 .975 3 1 .03 8 . 6 56.4 2942 1577 8 . 175 3 0.97 7.9 61.9 3015 1643 7.775 5 1.06 6 . 8 70.6 2978 2092 6 . 275 6 0.63 6 . 8 8:3.2 3023 2329 5.275 7 0.74 6 . 2 30.0 2997 1894 3.975 3 1 . 0 1 5.5 81.3 2999 1931 3.575 9 1.15 5.7 73.4 3056 1710 4.Ô75 10 1 .79 5.4 6 6 . 2 3172 1328 4.475 11 1.33 5.8 54.1 3071 1097 5 .875 12 1 . 2 0 5.4 46.0 3209 711 4.076 1 1 .26 4.9 44.4 3072 742 4.176 2 0.97 5.6 55.3 3245 1162 5 .876 3 0 . 6 6 3.0 58.3 3269 1810 7 . 776 4 1 .42 6 . 6 6 6 . 0 3296 2213 6 .376 5 . 1 .04 7.5 71.8 3153 2064 5.976 6 0.94 6.5 82.7 3319 2265 5 . 276 7 0.94 5.6 80.2 3236 1800 3 .776 8 0 .9 5 5 .5 82.2 3233 1943 3 . 376 9 1 . 0 1 5.6 73.1 3303 1393 3 . 576 10 1.53 .6 . 1 59.8 3296 1284 4.676 11 1 .43 6 . 2 46.6 3131 733 3 .576 12 2.40 5.3 42.7 3364 779 3.177 1 1 .59 6 . 1 45.2 3260 1019 5 .277 2 1 .44 7.2 51.3 3450 1148 4.777 3 1 .29 8 . 1 54.9 3525 1346 7 . 077 4 1 .05. 6.9 6 6 . 2 3527 2047 5 . 677 5 1.17. 6 .7 74.6 3394 2146 6 . 677 6 1 .05 5.9 84.7 3549 2479 3 . 377 7 1 . 0 0 5.8 83.9 3435 2081 3 .677 8 0.96 6.3 ■ 85.3 3527 1896 3 .777 9 1 .50 4.5 80.9 3537 1722 4.377 10 1.59 3.9 6 6 . 1 3543 1338 3 .977 11 2 .06 5.1 56.2 3593 962 5.177 12 1.64 5.2 51.6 3689 755 4 .678 1 2 . 1 0 5.0 46.8 3505 860 4 .278 2 1 .67 5.4 50.0 3752 1207 5 .078 3 1 .64 6 . 0 60.1 3770 1566 6 .378 4 0 .9 5 6.9 6 8 . 2 3652 1951 6 . 878 5 1.05 7.4 74.5 3644 2262 6 .778 6 1 .31 6.9 8 6 . 0 3693 2580 4 . 478 7 1.04 7.0 87.1 3524 2101 4 .078 8 1 . 1 2 6.3 81.9 3765 1921 4.278 9 1.08 6 . 2 72.9 3754 1433 4 . 478 10 1.62 5.2 65.1 3836 1191 3 .778 11 1.57 5.4 55.5 3928 942 4 . 678 12 1.59 6 . 1 44.5 3913 839 5 .8

102
Table 19. Continued
YR MO MCO m s MT KÜR M>fl1 MLYR
79 1 "l .83 6.4 42.7 3848 803 5 .979 2 1.64 6 .7 50.4 4064 958 5 .679 3 1 . 2 2 7.3 56.4 3039 1350 6 . 679 4 1.09 7.3 67.1 3908 2146 7 .279 5 0.35 7.3 71.5 3841 2064 6 . 179 6 0.95 6.7 79.7 3815 22 1 0 4.979 7 0.82 6 . 0 85.5 3715 2383 3.979 8 1.19 5.1 78.9 3925 1898 3.979 9 1.29 5.3 75.4 3302 1818 3 .879 10 2.04 5.5 6 8 . 6 4000 1366 5.379 11 1 .75 .. 6 . 2 50.9 3740 9 2 6 5.179 12 1 .81 4.8 46.3 3392 709 3 .880 1 2.37 ■ 6.3 49.3 3831 812 5.180 2 1 .47 6 . 6 •52.3 3929 1119 5.780 3 1.40 8 . 1 ,55.4 3363 1655 8.380 4 1 .29 7.2 63.1 3970 2075 6 . 280 5 t .16 7.0 73.4 4034 2228 6.480 6 1 .78 5.9 88.7 3822 2503 4.480 7 1 .25 6.5 88.7 3892 2339 3 .780 8 1 .36 6 . 8 81 .4 3901 2054 4.180 9 1 .26 5.7 74.9 3946 2437 3 .580 10 .1 .83 6 . 2 62.2 4113 1229, . 4 . 080 11 1 .95 6.3 50.2 3938 816 3 . 6go 12 2.90 5.6 48.9 4073 682 3 .0

Table 20. Scatterplots of Parameter Monthly Means
S c a t t e r p l o t FigureNo.
Observed Type o f R e la t io n sh ip Slope
MCO * Ml S 28 Approximately l i n e a r - wide band -
MCO * 1/MHS 29 Approximately l i n e a r - wide band +
MCO * 1/(MWS)^ 30 Approximately l i n e a r - wide band +
MCO * MT 31 Approximately l i n e a r - wide band -
MCO * 1/MT 32 Approximately l i n e a r - wide band +
MCO * MTR 33 Approximately l i n e a r - wide band +
MCO * 1/MTR 34 Approximately l i n e a r - wide band +
MCO * MMH 35 Approximately l i n e a r - wide band -
MCO * MLYR 36 Approximate b e l l - s h a p e d cu rve-s addle p o in t
MCO * 1/MLYR 37 Approximate b e l l - s h a p e d cu rve -s addle po in t
MlfS * MT 38 d i f f u s e , obscure
MWS * MMH 39 2 c l u s t e r s - sa ddle po in t
m s * MLYR 40 ■ l i n e a r +
MT * MMH 41 l i n e a r +
ow

10/,
2 5 . 0
2 2 . 5
20 .0
17.5
12.5
10 .0
5 . 0
■Bta— b b o -d o2.5-
0 . 0 -
0 C T 7 1 HflT75 H 0 V 7 5 J'JN7G D E C 7 6 J U L 7 7 J A N 7 0 flUG78 « 0 0 7 9DOTE
N o t e ‘.MCO units=ppin symbol“oMWS u n i t s = m i l e s / h o u r synibol=«MT u n i t s = ° F s y m b o l = tr ia n g l eMTR u n i t s = v e h i c l e s / h r symbol=square MMH u n i t s = m e t e r s syi:ibbl=diamond
MLYR u n i t s = m e t e r s / s e c syinboI=X
where: MT = MT/10MTR = MTR/1000 MMH = MMH/100
M = a r i t h m e t i c monthly mean v a l u e s
Figure 27 . The R e l a t i o n s h i p o f CO, WS, T, TR, MH, LYR and Time

«CO \ u o u m i A ■ t 0 1 3 , I • 3 o i t , n e . a
2 . 7 3
2 . 3 0
2 . 2 3
2 .0 0
1 . 3 0
AA A
AA A
A AA - A A
1 . 7 3 ♦ A
A A A AA I O
A
A A AA A
A AA A A A
1 . 2 3 » A A AA A A
A A AA A A
A A A A A A1 . 0 0 * A A A
A B A A A A A
AA
1 . 7 3 « A
1 .3 0
«US
Figure 28. CO Monthly Means vs. Wind Speed Monthly Means

ICOENSi A ■ I OSS, 8 ■ 2 0 1 3 , ETC.
SCO \ A
2 . 7 S
2 . 3 0
3 . 2 3
2 .0 0
I . SO
AA
AA A
A AA A A
I . 7 S « A
A A A OI A A = 'A A
A A AA A
A AA A A A
1.33 » A A AA A A
A A AA A A
A AA A A A A1 . 0 0 « A A A
A A A A A B A
AA
1 . 7 5 ♦ A
0 .3 0
Figure 29. CO Monthly Means, vs. 1/Wind Speed Monthly Means

L I S E « S > A > 1 o n , B • 2 CBS , ETC.
MCO \ A
].7S
2 . 5 0
2.35
3 . 0 0
I . SO
O . M
AA A
AA A
A AA
1 . 7 5 * A
A A A A A
A AA A A A
1 . 3 5 « A A AA A A
A A AA A A
A AA AAA A1.00 * A A A
A A A A A B A
A0 . 7 5 » A
1 /MWs2 2Figure 30. CO Monthly Means vs. l/(Wind Speed Monthly Means)

L t c n s i A ■ I C I S , B • 2 0 1 3 , ETC .
BCD \ A
3 . 7 3
2 . S 0
2 . 2 S
3 . 0 »
I . S O
AA A
A AA A
I . 7 S * A
AA A AA A A A
A A
A A AA A
A AA A A A
I . 2 S • A A AA A A
B AA A A
A A A A A A A1 . 0 0 * A A A
A A A A A AA A
AA
0 . 7 J ♦ A
0 5»
AT
Figure 31. CO Monthly Means vs. Temperature Monthly Means
oCO

lE C EID : A > t O IS , B « 2 0 3 : , ETC.
MCO
} . 7 S
2 . S 0
].23
2.00
I . 7 J
1 . 3 0
1 . 2 3
1 .0 0
1 . 7 3
* 30
AA A
A AA A
AA A AA
A A A AA A
A AA A
A AA A A A
A A AA . A A
A BA A A
A A A A A A AA A A
A l l . A A A
AA
0 . 0 1 0 0 0 . 0 1 1 3 0 . 0 1 3 0 0 . 0 1 4 3 O.OIAO 0 . 0 1 7 3 O . O I I O 0 . 0 2 0 3 0 . 0 2 2 0 0 . 0 2 3 3 0 . 0 2 3 0
1/MT
Figure 32. CO Monthly Means vs. 1/Temperature Monthly Means

lEGFNIi] A > I 0 » S , » > 2 M S , ETC.
MCO
2 . 4
2.2
2 .0
l.t
1 . 4
1 . 4
1 . 2
1.0
0.0
0 .4
AA
AA A
A A A A
A A
A
A
A
AA
A
A A A A A A AA A A
A A A A AA A
A
A
AA
2 1 0 0 2 0 0 0 3 0 0 0 3 1 0 0 3 2 0 0 3 3 0 0 3 4 0 0 3 5 0 0 3 6 0 0 3 2 0 0 3 8 0 0 39 C 0 4 0 0 0
AT*
Figure 33. CO Monthly Means v s . T r a f f i c Monthly Means

LEGEND; A > 1 OBS, B « 2 OBS, ETC.
SCO
2 .4
2 . 2
2 .0
1.3
1.6
1 .4
1.2
1 .0
0 .8
0 .6
AA
AA A
A A A AA
A A
A
AA
A
A
A
A A AA A A AA A A
A A A A AA A
A
A
0 . 0 0 0 2 5 0 . 0 0 0 2 6 0 . 0 0 0 2 7 0 . 0 0 0 2 8 0 . 0 0 0 2 9 0 . 0 0 0 3 0 0 . 0 0 0 3 1 0 . 0 0 0 3 2 0 . 0 0 0 3 3 0 . 0 0 0 3 4 0 . 0 0 0 3 5
l/MTR
Figure 34. Co Monthly Means v s . 1 / T r a f f i c Monthly Means

KCO
2.73
2.30
2.23
2.0»
1.2*
1.30
1.23
t . O »
1.7*
«.*»
l E C t H S i A > 1 DBS, B • 2 0 1 3 , E T C .
A
AA
àA A
t* A
B
A A AA A A A
A A
A AAA
A AA A
A A A AA A A
A A AA A A
A A AA AA B A A
A A AA A A A AA A A
AA
A
A A
*0» 20» to» 1100 1*00 1300 1700 1*00 2100 2:00 2300 ' 2700 2*00
MMH
Figure 35. CO Monthly Means vs. Mixing Height Monthly Means

L ia tN S i A ■ I e u , A m * o u , c t : .
HCO \ A
2.7S
I . S O
2. 3S
3. 00
' A
A
A
A A
A AA A
A II . 7S « A
A A A AA A A A
II . SO » A
A A AA
A AA A A A
I . 3S » A A AA A A
A A AA A A
A A A A A A A1. 00 « I A
A I A A A A A
AA
0.7S * A
0 SO
1 .0 1 .1 l.A 1 .0 4.3 4 .5 4 .1 5.1 5.4 5 .7 4.0 4 .1 4 .4 4 .0 7 .2 7 .5 7 .8 8.1
ALYR
Figure 36. CO Monthly Means vs. Transport Wind Monthly Means

lECENSl A > I O IS , B • 2 O IS , ETC.
HCO
. 2 . 7 5
2 . 5 0
2 . 2 5
2 .0 0
1 . 7 5
I . S O
1 . 2 5
1 .0 0
1 . 7 5
I . S O
A
A A
AA A
A
A A AA A A A
BA
A AA
A AA A A A
A A AA A AA A A
A A AA A A A A A A
A IA A A A A
A
I . I O 0 . 1 2 O . M O. I A 0 . 1 » 0 . 2 0 0 . 2 2 0 . 2 4 0 . 2 A 0 . 2 3 1 . 3 0 0 . 1 2 1 . 1 4
1/MLYR
Figure 37. CO Monthly Means vs. 1/Transport Wind Monthly Means

LECENII t « I » t , I • 2 Olt, ETC.
US \
\
4
A AA
A
A4
4 4 A4 A
A 4A A 4
A 4 A 44 A A
A 4 A4
4 4 4 A4 4 4 4 4
4 4 4
4 AA
A A4 4
A 4 4 44 4 4
4 4 4 A4
4 A
44
4
A
A
4 0 4 2 4 4 4 4 4 8 SO 0 2 5 4 . 5 4 5 8 4 0 4 2 4 4 4 4 4 8 2 8 7 2 7 4 7 4 7 8 8 0 1 2 - 8 1 1 4 8 1
« I
Figure 38. Wind Speed Monthly Means vs. Temperature Monthly Means

U C E a S l A ■ I O IS , S ■ 2 OBS, ETC.
\
\
44
4
4A 4 A
4 4
.A A4 A
4 4 A A4 4 A
4 4 AA 4
. AI AA
4 4 4 A AA A A
4 AAA
4 AA A
4 ' 4 4 A4 4
A 4 A 44 A
A A4 A
44
4
A
3 9 « 7 4 » t o o . 1 1 0 0 1 1 0 0 ISOO 1 7 0 0 I tOO 2 1 0 0 3 1 0 0 2 3 0 0 3 7 0 1 2 9 0 0
KXH
Figure 39. Wind Speed Monthly Means vs. Mixing Height Monthly Means

U iE N I I t ■ I OBS, B ■ 2 O IS , ETC.
U3
\
A AA A
AA A A
A AA A A
A A A AA A A
A A AA A
AA A A A
A A A A AA A A
A AA A
A AA A
A A A AA A A
A A A AA A
A JkA A
AA
A
A
l . e 1 . 1 l . A 1 . 9 « . 2 4 . 1 4 . B 1 . 1 1 . 4 1 . 7 4 . 0 4 . 1 4 . 4 4 . 9 7 . 2 7 . 1 7 . 1 8 . 1
MLIB
Figure 40. Wind Speed Monthly Means vs. Transport Wind Monthly Means

H I
U C £ « D l A ■ t O i l , I > 3 H t , ETC.
t A
8:
8 1 A A A
A AA
A AAA
A A
7A
A A
A A
A
7 1
AS
A»
AAA
A A
CO
5 5AA
A A
S I
43
A AA A
A A AAA A
A AAA
A A
AA
4 0
S H 7 0 3 1 0 3 1 1 3 3 1 3 0 3 1 5 0 3 1 7 0 0 1 0 0 0 2 1 0 0 2 3 3 0 2 5 0 0 2 7 1 0 2 1 0 0
MAH
Figure 41. Temperature Monthly Means vs. Mixing Height Monthly Means

119
p a t t e r n s . The CO and wind d i r e c t i o n (F igure 14 and 15) e x h i b i t data
c l u s t e r i n g or sa d d le p o i n t - t y p e p a t t e r n . Transforms o f the data f a i l e d
to improve the p a t t e r n s for l i n e a r i t y . These parameter
i n t e r r e l a t i o n s h i p s c a t t e r p l o t p a t t e r n s i n d i c a t e the p o s s i b i l i t y o f a
l i n e a r or a q u a d r a t ic type eq u a t io n to be t e s t e d in the model
development phase . D e s p i t e the absence o f o b s e r v a b l e s tr ong l i n e a r
r e l a t i o n s h i p s , a l l the data parameters do e x h i b i t s t r o n g , p e r s i s t e n t
s e a s o n a l p a t t e r n s as demonstrated in T ab le s 12 through 19 and F ig u res
20 through 27.
K ru s k a l -W a l l i s t e s t . The r e s u l t s o f the K ru s k a l l -W a l l i s t e s t
f o r e q u a l i t y o f means r e j e c t Hq: P = P2 ~ • • • 1 2 > fu r t h e r
co n f irm in g s e a s o n a l v a r i a t i o n p a t t e r n s . I t i s a l s o o f i n t e r e s t to note
t h a t fo r CO, Hg: 1J75 = uyg = P 7 7 = P 7 g was r e j e c t e d u s in g the Krunskal-
W a l l i s t e s t . Examinat ion o f t h e s e y e a r l y means o f a l l monthly and
h o ur ly CO data combined r e v e a le d an i n c r e a s e in the y e a r ly mean for
each o f the four y e a r s .
D iurna l p a t t e r n . The d iu r n a l p a t t e r n o f the parameters are
shown i n T a b le s 21 through 26. The d iu r n a l p a t t e r n o f CO a t S i t e 27
for a l l months i s shown in F ig u res 42 and 4 3 . The CO hour ly l e v e l s are
e l e v a t e d from about 7 to 10 a . m . , d e c r e a s e in the e a r l y a f t ern o o n , and
r i s e between 5 and 7 p.m. (LST). Higher h o u r ly v a l u e s are observed in
th e months o f October through March. Wind speed h o u r ly means are
h i g h e s t from about 9 a.m. to 6 p .m . , and are reduced during the
e v e n in g , n i g h t , and e a r l y morning hou rs . Temperature hour ly means
f o l l o w the same p a t t e r n o f low v a l u e s in the ev e n in g , n i g h t , and
morning, w i th h i g h e s t v a l u e s observed from noon to about 5 p.m.

Table 21. Means of CO by Month and Hour for El Paso, 197 5- 78
SI'E 27: HR Ml M2 M3 M4 H5 MS M7 M3 H9 MIO Mil MI2
I 1.63 1.79 1.13 1.01 0.95 0.69 0.5? 0.65 0.91 1.63 1.71 2.162 1.40 1.35 0.83 ; 0.82 0.70 0.53 0.47 0.50 0.73 1.27 1.45 1.613 1,17 1.15 0.3S 0.57 0.55 0.50 0.31 0.43 0.53 0.95 1.10 1.33
0.94 0.33 0.66 . 0.46. 0.44 . 0.36 0.2Ô 0.35 0.43 0.74 0.83 I.CO5 0.B4 0.69 0.59 0.42 0.46 0.43 0.31 0.40 0.48 0.75 0.59 0.816 0.66 0.74 0.70 0.67, 1.Q7 1.05 0.86 1.03 1.05 1.40 0.53 0.877 1.28 1.49 1.57 1.'52' . 2.42 2.29 1.85 2.35 2.93 3.45 1.19 1.438 2.70 3.43 2.90 2.36 2.32 2.35 ■ 1.84 2.34 3.21 4. 19 2.81 3.229 3.71 4. 12 2.S4 2.07 1.41 1.71 1.12 1.67 1.85 2. 71 3.25 3.9510 2.23 2.85 1.71 1.44 1.35 1.60 1.33 1.52 1.58 2.00 2.OS 3. 1311 2.25 2.16 1.35 1.30 1.32 1.61 1.44 1.54 1.50 1.70 1.79 2.5312 2. 10 1.91 1.32 1.47 1.30 1.53 1.48 1.59 1.55 1.65 1.54 2.4513 2. 10 1.72 1.45 1.45 1.24 1.29 1.37 1.23 1.34 1.39 1.55 2.2214 1.89 1.43 1.34 1.29 1.22 1.54 1.41 1.43 1.33 1.46 1.40 1.5515 1.62 1.65 .1.34 • 1.30 1.32 1.58 • 1.54 1.56 1.50 1.58 1.49 2.1916 2.03 1.78 1.60 1.59 1.65 1.93 1.8S 1.99 2.07 ■ 2. 18 1.75 2.3517 2.53 2.57 2.23 2.24 2.34 2.64 2.59 2.79 2.69 3.25 2.32 3.2513 4.53 3.49 2.54 2.27 1.22 1.35 1.31 1.36 1.57 2.50 3.82 5.5319 3.35 2.94 1.83 1.52 ■ 1.05 1.17 0.97 1.19 1.73 2.95 3.75 4.8420 2.97 3.00 2. iS 1.88 . 1.58 1.51 . 1.28 .1.65 2. 13 3.25 3.09 4.1521 2,52 2.56 2.35 1.89 2.11 2. 15 1.43 1.9! 2. 15 3.35 2.83 3.6322 2.79 2.69 2.47 1.81 2.10 2.06 1.35 1.59 2.03 2.94 2.85 3.3423 2.87 • 2.71 2. 18 1.55 1.76 1.51 1.07 1.32 1.92 2.56 2.65 2.1124 2.20 2.14 1.64 1.26 1.28 1.02 0.79 0.92 1.35 1.99 2.24 2.61
-
HR Ml M2 M3 M4 MS MS N7 M3 M9 MIO Mil M121 1.46 1.33 0.71 0.84 ■ 0.85 0.68 0.49 • 0.50 0.76 1.60 2.10 • 1.432 1.21 0.95 0.46 0.64 0.58 0.53 0.38 0.40 0.53 1.18 1.77 1.213 0.90 0.57 0.39 0.53 0.53 0.35 0.33 0.31 0.41 0.95 1.38 0.954 0.62 0.52 0.32 0.33 0.42 0.29 0.25 0.23 0.31 0.72 1.06 . 0.775 0.54 0.40 0.29 0.31 0.40 0.28 0.23 0.23 0.31 ■ 0.53 0.64 0.5C6 0.50 0. 37 0.37 0.43 0.56 0.41 0.41 0. 37 0.46 0.67 o.es 0.457 0.65 0.57 0.77 0.88 0.98 0.83 0.67 0.82 1. 10 1.35 0.85 0.558 1.44 1.25 1.24 0.97 0.63 0.6Û 0.46 0.65 1.26 1.61 1.45 • 1.489 1.84 1.14 0. 88 0.49 0.46 0.43 0.29 0.29 0.67 0.91 1.35 1.9110 0.89 0.56 0.49 0.27 0.28 0.30 0.20 0.30 0. 38 0.57 0.61 1.C511 0.56 0. 32 0.32 0.19 0.21 0.21 0. 1C 0.22 0.23 0.33 0.50 0.5712 0.36 0.23 0.22 0. 15 0. 17 0. IS 0.15 0. 17 0. 19 0.24 0.35 C.4713 0.29 0. 15 0. 15 0.13 C. 17 0. 16 0.17 0. 19 0. 17 0.21 0.25 0.3314 0.28 . 0. 12 0. 16 0.13 C. 17 0. 15 0.19 0.22 0. 14 0.13 0.23 0.3115 0.22 0. 10 0. IS 0. 18 0. 15 . 0. 18 0.21 0. 19 0. 12 0. 18 0.21 0.2516 0.23 0. 10 0.29 0. 15 0.20 0. 15 0.24 0.25 0. 14 0.19 0.25 0.2917 0.28 0.11 0.21 0.16 0.20 0.18 0.32 0.22 0.20 0.27 O.ÏS 0.4318 0.63 0.24 ; 0.28 0.24 0.22 0.25 0.38 0.31 0.28 0.62 0.94 •0.9519 1.38 0.93 0.61 0.49 0.43 0.47 0.60 0.52 0.61 I.7I 2. 18 1.8320 2.07 1.57 1.23 1.19 1.26 0.95 I.OS 0.92 1.20 2.36 2.74 2.3821 2.48 2.03 1.43 1.58 - 1.63 1.43. 1.21 1.15 1.59 3.02 3.05 2.5322 2.45 2.46 1.72 1.58 1.S8 1.51 1.09 1.01 1.58 • 2.62 3.07 2.s223 2.47 1.90 1.38 1.33 1.73 1.17 0.77 0.91 1.46 2.56 2.39 2.2524 1.91 1.53 1.06 1.17 1.22 0.91 0.65 0.64 1.12 2.IS 2.60 1.85
roO

Table 22. Means of Wind Speed by Month and Hour for El Paso,1975-78SITE.27 -
HR Ml M2 M3 M4 MS M6 M7 MS M9 MIO Mil Ml 21 4.96 5. 16 6.55 5.90 6. 40 5.30 5.98 5.85 - 5.03 4.63 5.44 5.C-42 4.94 5. 14 6.56 5.92 . 5.39 S. 18 5.85 6.20 4.93 4.78 5.35 4.533 4.99 5.35 3.48 6.00 6.42 0.20 5.95 6. 10 4.61 4.81 5. IS - 4.774.SB 5.33 . 6.24 5.91 6.28 . 6.01 5.53 s . e s 4.95 4.82 5.27 4.71S 5. 15 5. 18 6.23 5.74 5.04 5.04 9.5-3 5.62 4.39 4.83 5.23 4.776 5.33 5.21 5.83 5.79 6.02 5.07 5.55 5.50 4.59 4.58 5.17 4.747 5.34 5.08 5.59 5.95 6.28 6.73 6. 13 . 5.88 4.93 4.74 5.18 4.878 5.40 5.23 ■ 6.23 6.51 7.01 7.24 6.91 6.61 5.45 5.64 5.55 4.SSS 5.80 5.90 7.43 7.11 7.63 7.27 6.93 6.77 5.09 5.42 6.05 5.7510 6.47 6.89 6.31 7.67 7.68 7. 12 5.47 6.58 3. 15 6.58 6.45 6.11
11 6.91 6.97 8.79 7.95 7.40 7.06 6.50 6.42 . 5.35 7. 10 5.83 5.7012 7. 12 7.24 8.54 . 7.87 7.67 6.93 6.25 6.05 6.48 6.90 7.11 7.1713 7.34 7.35 ■ 8.78 8.03 8.05 6.07 6.43 6.38 5.51 6.83 7.37 7.57m 7.33 7.47 3.85 8.22 8.04 6.38 6.86 6.50 6.50 6.74 7.21 7.6115 7.15 7.84 S.24 8.50 7.92 7.11 7.24 6.70 6.52 6.43 7.25 7.2516 6.S6 7.66 9.01 8. 13 6.30 7.28 7.43 6.95 5.54 6.32 6.96 6.6317 6.55 7.34 8.81 8. 19 8.17 7.65 7.61 7.23 5.51 5.87 6.38 5.3416 6. 15 6.73 6.29 8.03 • 7.62 7.49 7.68 7.47 6. 10 4.83 S.55 5.72IS 5.75 5.63 . 7. 12 7.04 7.78 7.07 7.35 7.02 5.47 4.44 5.42 5.432 0 5.38 5.37 5.53 6. 19 6.48 6.43 6.47 6.36 4.97 4.28 5.34 5.5721 5. 19 5.44 6.51 6.34 6.27 5.88 6. 19 £.93 5.04 4.33 5.55 5.6!22 5.00 5.22 6.38 6.25 6.11 5.35 6.28 5.90 5.03 4.54 5.32 5.3523 4.94 5.11 6.62 6.46 5.06 6.53 6. 10 5.90 4.94- 4.85 5.26 5.402 1 4.81 5.15 6.55 8. 12 6. 14 6.45 6.07 6.06 4.90: 4.65 5.36 5.36
Silt 20HR Ml M2 M3 M4 MS M5 M7 MS M9 MIO Mil K12I 4.05 4.66 6.26 5.65 ■ 5.56' ' 5. 13 4.75 4.50 4.42 3.71 3.70 3.84 •2 4.01 4. 31 6. 18 5.21 5.45' . 4.75- 4.35 4.62 4.03 3.72 3.79 3.803 3.55 4. 33 S. 10 5.09 5.40 4.75: 4.38 4.46 3.83 3.65 3.75 3.494 3.65 4.34 5.79 4.88 4.96- 4.33 4.03 4.34- 4.12 : 3.65 3.62 3.31S 3.73 4.33 5.91 4.52 4.77- 4.23 3.99 4.07 3.91 3.59 3,75 3.656 4.04 . 4.56 5.38 4.61 4.69 3.93 4.20 3.03 3.84 3.73 - 4.11 3.487 4.03 4.57 5.50 4.96 4.52 4.63 4.55 4.33 4.17 4.02 4.47 3. 246 5.20 5.24 6.51 5.68 5.89 5. 35 5.32 5.27 4.69 4.81 5.31 4.459 5.74 5.70 7.62 6.90 7.04 6.26 5.68 5.75 5.64 5.55 5.53 5.02
10 6.09 6.66 9.03 7.90 7.67 5.55 5.61 5.87 6.00 5.96 6.32 5.3311 6.58 7.55 10.34 8.70 8. 13 6.69 5.58 5.64 5.35 6.53 .- 6.78 5.4412 6.90 8.51 10.79 9.00 8.56 6.99 5.60 5.58 6. 77 6.99 7.23 7.3313 7.97 8.95 ■ 10.83 9.56 9. 13 6.75 5.88 5.75 7.03 7.22 7.86 8.01m 8.22 9.53 11.12 10.30 9.25 6.94 5.62 5.96 7.25 7.25 8.06 8.4215 8.12 9.58 11.96. 10.93 9.63 7.48 S.94 6.46 7. 39 7. 16 8.20 8.3716 7.63 3.99 11.60 10.74 10.43 7.80 6.85 6.79 7.55 7.04 7.90 . 7.9217 7.67 9.32 11.42 10.25 10. 10 8.34 7.22 6.92 7.32 6.45 6.85 6.6318 6.45 8.06 10.26- 9.80 S.42 8. 14 7.50 6. S3 5.65 5.02 4.94 4.SOIS 5.30 5.67 8.62. 8.42 8.25 7.69 7.13 6.45 5.63 4.23 4.70 4.54 12 0 4.63 5.32 7.471 7.25 6.55 7.15 5.02 6.07 5.20 4.19 4.35 4.2321 4.42 5.24 7.08- 6.92 6.05 6.43 . 6.05 5.71 5. 15 . 3.97 4.35 4.272 2 4.21 4.89 6.35: 6.52 6.07 6.21 6.03 • 5.45 4.75 3.82 4.33 3 . 8 32 3 4.12 4.90 6.59. • 6.01 5.70’ • 6.31- 5.39 . 5.21 4.51 3.72 4.20 4.232<i 4.04 4 . 7 6 6.89 5.91 S.64- - 5.35 5.16 4.88 4.21 3 . 6 3 4.01 4.10

Table 23. Means of Temperature by Month and Hour for El Paso^ 1975-78- 5ITE=27 -
HR HI M2 M3 M4 MS MS M7 M8 H9 MIO HU M12I 41.21 45.65 52.54 59.57 60.37 ,76.90 76.22 75.78 69.59 58.37 46.13 41.942 40.42 45.52 51.20 58.08 55.02 75.40 75.15 75.67 68.52 57.33 45.84 40.673 33.55 44.95 49.09 56.69 63.34 74.08 74.22 74.30 £7.52 56.29 45.89 33.54U 36.80 43.74 48. 57 56,55 62.41 72.72 73.28 73.73 66.71 55.35 44.94 33.635 37.SI 42.80 47. 34 54.24 ■ 61.29 71.5! 72.57 72.b? 55.85 54.71 44.32 37.736 37.29 41.94 45.35 53.29 ■ 61.17 71.57 72.44 71.95 65.09 53.34 43.55 37.CO7 36.55 41.20 46.05 54.67 63.90 74.37 74.58 73.85 68.18 54.38 43.24 35.438 37.25 43.03 49.04 58.30 S7.57 77.51 77.31 75.85 63.23 53.07 45.60 37.343 40.63 47.06 53. 34 52.93 71 .45 ■ 81.02 80.84 60.50 72.55 62.20 49.24 41.0310 44. 16 51.15 57. 55 57.06 75.43 80.38 84.92 84.25 75.25 65.37 52.34 45.2311 47.72 55.07 61.61 70.87 78.65 63.92 88.17 67.65 73.48 65.74 55.64 43.9712 SC.74 58. 16 64.25 73.37 61.11 92.74 90.82 90.57 81.59 72.08 59. 12 51.6413 52.53 59.97 66.89 76.23 63.56 95.58 93.37 £3.40 84. 11 74.42 61.SI 53.s:m 54.91 62.45 63.72 77.90 .85.47 97.35 94.16 S4.79 85.43 75.84 63.82 55.03IS 56.03 63.67 69. 79 76.59 66.07 97.93 94.11 95.03 85.33 75.49 64.65 £7.2516 55.20 64. 15 69.83 78.84 85.66 97.79 93.74 94.37 85.00 76.22 64.58 57.1317 54.86 63.34 68.92 78.25 84.92 95.82 92.65 53.35 84.72 74.36 52.44 55.2716 . 51.41 50.04 65.43 76. 10 63. 30 94. 73 90.88 SO. 85 82. 13 70.05 58.75 52. IS13 43.21 55.65 62.90 71.81 79.33 91.38 87.83 66.83 73.74 67.40 56.40 43.9920 47.55 54.66 66. ?6 66.81 75.94 86.92 84.65 84.35 73.20 65.24 54.52 48.3521 46.22 52.53 58.38 66.41 73.48 84.07 82.45 82.42 74.33 63.38 52.64 47.2222 44.80 51.51 56.70 64.49 71.51 82.00 80.66 80.83 72.89 52.05 51.15 45.9125 43.45 49.95 55.47 62.68 69.67 80.28 73. 11 79.43 71.54 60.80 49.72 44.6524 42.23 48.28 54.09 61.26 88.05 78.77 77.74 77.96 70.32 59.44 48.57 43.24
HR Ml M2 M3 M4 M5 M6 M7 M8 M9 MIO Mil M121 33.72 45.03' 51.02 57.42' 64.29 74.92 . 75.05 75. 10 66.44 57.05 46.56 40.512 38.82 43.80 49.59 55.68 62.94 73.33 74.23 74. 15 67.55 55.57 45.75 33.353 37.82 42.70 . 43. 13 54. 35 61.54 72.01 73.34 73.30 65.72 55.03 44.87 33.334 37. 17 41.71 45.65 53.07 60.26 70.88 72.47 72. 16 65.05 54.27 44.22 37.5,5 33.49 40,6! . 46.00 51.68 59. 14 69.63 71.74 71.29 65.18 53.40 43.52 35.876 35.78 40.05 45.00 50.53 53.24 69.91 71.52 70.53 64.56 52. 78 42.83 35.237 35.13 33. 12 44.69 53.09 63.36 74.53 74.07 73.50 65.78 53.27 42.43 35.778 35.09 • 41.85 43.98 58.64 66.09 79.27 78.55 77.75 70.15 57.99 45.05 37.169 40.43 47.21 53.73 ■ 63.72 72.36 83.79 82.39 81. 80 74.10 63. 18 51.43 42.1710 45.21 52. 18 53.25 • 67.80 76.29 68.33 80.32 85.60 78.03 67.95 55.33 47.4311 49.24 56.42 52.41 71.46 79. 15 Si.55 05.81 83.95 81.52 71.91 60.01 51.7412 52.58 59.53 . 65.49 74.41 31.02 94.19 52.43 91.89 84.32 74.78 62.97 . 54.5513 54.63 61.68 67.84 76.43 82.43 95.90 93.59 94. 12 86.13 75.52 64.91 53.7214 55.04 63.38 68.84 77.55 83.52 96,32 S3.15 . 95.03 85.54 77.34 65.C3 55.1015 55.83 64.27 70.01 78.23 84.27 97.10 53.29 95.12 86.89 77.73 65.45 55.69. IS 56.58 64.37 69.72 76.03 63.00 96.47 52.79 £4.34 06.20 . 77.02 65.80 £8.1517 55.08 63.21 56.67 77.02 82.65 95.20 91.65 92.68 84.70 74.97 63.35 55.9118 51.02 60.37 65.95 74.67 81. 10 93.34 39.57 89.87 81.84 70.59 58.27 51.73IS 46. 17 56. 19 62.07 70.84 77.98 90,17 87. 12 65.52 77.71 66.47 55.42 49.3120 46.29 53.89 59.41 67 50 74.03 65.50 83.95 82.69 75.21 64.05 53.39 47.5321 44.58 51.74 57.36 65.07 71.62 82.60 81.71 80. 79 73.37 62.11 51.61 46.6322 43.22 49.60 55.47 62.89 ■ 69.64 80.44 79.94 79.38 71.81 60.59 49.93 44.7223 41.74 46.40 54,05 60.98 67.69. 76.57 73.33 77.77 70.34 58.93 48.42 43.4324 40.52 46.98 52.71 55.28 66.09' 73.37- 78.55 75.29 63.05 57.73 47.30 42.17
w

Table 24. Means of Traffic by Month and Hour for El Paso, 1975-78
Hfl12345678 3
10U1213U1516 17 161920 21 22 23 2U
HI
9 5 2 . 9 3 7 0 5 . 1 5 5 5 2 . 2 5 4 0 2 . 5 9 3 8 6 . 6 9 6Ù4.Ô1
2 0 9 2 . 0 1 5 5 3 1 . 1 34 9 1 4 . 9 4 4 0 2 9 . 1 2 4 1 1 5 . 0 5 4 5 5 2 . 2 5 4 6 2 9 .4 1 4 6 1 2 . 3 05 0 3 4 . 9 4 5 4 5 5 . 7 7 6 2 2 5 . 4 0 6 1 5 3 . 6 6 4 1 5 9 . 8 73 0 4 5 . 6 2 2 3 5 5 . 3 6 2 1 4 9 . 7 11 8 5 7 . 6 2 1 4 7 4 . 3 9
M2
9 2 7 . 4 7 6 51 . 81 5 2 4 . 6 2 376. 15 3 7 2 . 8 5 6 0 7 . 0 6
2239 . 91 6 2 5 8 . 6 9 5 2 3 7 . 4 7 4 3 5 5 . 9 34 3 3 4 .2 1 4 7 7 1 . 3 6 5 1 1 2 . 1 3 5 0 0 7 . 3 8 5 2 7 1 . 4 0 5 7 1 0 . 3 2 6 4 5 0 . 8 66 3 6 2 . 8 5 4 5 2 4 . 8 93 3 5 2 . 8 5 2 5 2 1 .5 42 3 5 6 . 9 22 0 3 2 . 2 2 1 52 1 .7 2
M3
9 62 . 18 6 8 2 . 6 5 5 4 1 . 5 3 3 9 0 . 0 6 3 8 7 . 7 4 6 3 6 . 1 3
2 3 3 4 . 6 8 6 1 9 5 . 3 2 5 1 5 4 . 2 7 4 3 5 0 . 0 0 4 3 8 3 . 3 14 8 0 4 . 5 2 5 0 8 4 . 1 9 4 9 9 5 . 6 55 2 1 4 . 5 2 5 5 6 1 . 8 56 4 55 . 81 6 3 2 9 . 3 4 4 4 56 . 21 3 3 8 8 . 8 72 6 2 2 . 8 2 2 3 4 2 . 7 4 2 0 2 2 . 1 8 1 5 7 6 . 9 5
«4
1 0 1 7 . 5 6 7 1 5 . 4 6 5 5 8 . 3 5 4 0 3 . 9 1 3 9 4 . 3 3 5 6 2 . 2 7
2 4 6 3 . 9 9 6 1 3 2 . 9 4 5 0 8 0 . 0 0 4 3 6 1 . 8 9 4 3 7 0 . 8 4 4 7 6 5 . 1 35 0 5 8 . 9 9 4 9 5 0 . 5 0 5 1 7 0 . 4 2 5 5 0 9 . 4 5 6 3 1 8 . 11 6 1 7 7 . 18 4 4 2 8 . 5 3 3 4 3 3 . 3 2 2 7 3 1 . 8 12 3 9 3 . 6 1 2 0 6 3 . 8 71 6 2 2 .6 1
M5
1 1 0 7 . 0 0 7 7 0 . 8 9 6 0 2 . 5 5 4 0 9 .3 1 3 8 3 . 9 7 6 2 3 . 0 8
2 3 9 7 . 8 95 5 6 5 . 8 04 8 4 8 . 3 84 1 5 5 . 3 5 4 2 2 8 . 5 8 4 6 5 4 . 2 94 3 1 8 . 5 4 4 7 9 2 . 8 3 4999 . 315 4 8 2 . 3 5 6228 . 918 08 1 .0 1 4 19 2 .7 13 3 3 5 . 5 5 2 7 9 0 . 0 8 2 50 4 . 9 42 2 2 5 . 3 8 1 71 5 .2 6
MB
1 1 6 2 . 9 8 8 0 5 . 6 8 5 1 3 . 6 0 4 3 4 . 0 3 4 2 5 . 1 3 7 1 2 . 5 2
2 8 6 0 . 4 6 5 6 2 2 . 3 9 5 1 9 9 . 4 1 4 3 9 3 . 0 7 4 4 3 1 . 0 5 5 0 2 2 . 4 8 5 0 1 1 . 6 4 5 0 7 6 . 1 35 1 2 0 . 2 5 5 412 . 146 1 7 6 . 4 7 6 2 1 2 . 3 1 4 1 2 5 . 7 1 3 3 5 3 . 3 0 2 6 4 8 . 4 52 6 2 6 . 2 6 2 2 8 1 . 8 1 1 6 0 7 . 9 0
M7
1 1 8 5 . 2 6 8 29 . 1 1 5 4 5 . 4 7 4 3 9 . 7 2 4 3 0 . 4 9 7 0 4 . 7 4
2 6 3 9 . 4 75 2 1 4 . 6 64 7 2 5 . 2 6 4 2 2 4 . 2 94 3 5 2 .3 14 8 8 8 . 3 4 4 947 . 17 4 9 7 3 . 3 6 5 0 6 5 . 1 4 5 3 1 0 . 7 3 5 9 3 6 . 2 85 9 5 9 . 3 5 4 0 9 2 . 6 3 3 3 4 8 . 5 62 8 7 0 . 3 2 2 5 3 8 . 9 9 2 3 0 1 . 9 4 1 8 4 3 . 2 4
MR1145.21
8 1 3 . 4 06 3 3 . 5 74 4 3 . 8 74 3 3 . 7 47 1 4 . 7 5
2 5 5 2 . 1 4 5 5 1 5 . 5 9 4 8 4 9 . 5 4 4 2 5 5 . 0 94 4 1 1 . 9 7 4 9 2 0 . 5 8 5 0 0 0 . 6 35 0 1 8 . 4 0 5 2 1 6 . 0 55 5 7 3 . 3 26 2 2 3 . 1 55 2 2 1 . 9 7 4 1 6 4 . 2 93 4 4 6 . 4 0 2 8 8 2 . 3 92 5 5 8 . 3 2 2 2 2 1 . 4 7 1 7 72 . 65
M91015 . 93
7 1 5 . 3 5 5 7 6 . 5 9 4 0 4 . 1 03 9 3 . 3 5 6 5 0 . 7 5
2 3 2 5 . 6 55 3 8 0 . 5 9 5 2 2 5 . 5 3 4 2 7 5 . 1 94 2 9 3 . 6 2 4 7 6 8 . 4 55 0 9 4 . 9 44 9 5 4 . 5 2 5 2 4 9 . 1 25 7 5 5 . 5 9 6 3 7 3 . 3 7 6 3 7 1 . 7 24 4 7 6 . 5 33 4 8 9 . 6 2 2 7 9 2 . 4 72 3 3 1 . 6 32 1 9 5 . 6 5 1 6 3 0 . 5 0
MIO
1 0 1 9 .1 9 7 3 1 . 5 3 5 7 6 . 2 9 4 0 3 . 4 7 3 5 2 . 2 5 6 4 4 . 0 3
2 3 7 5 . 2 46 4 5 3 . 5 3 5 2 9 2 . 2 64 3 5 3 . 5 3 4 4 5 0 . 1 64 9 1 7 . 6 2 5 2 3 1 . 1 3 5 0 7 3 . 7 9 5 3 2 5 . 7 35 8 03 . 3 16 5 6 5 . 6 3 5 5 0 2 . 9 34 5 55 . 3 1 3 4 5 5 . 4 0 2 6 4 9 . 6 8 2 3 5 5 . 8 3 2 1 6 3 . 9 5 ’ 6 2 4 . 8 4
Ml 19 5 4 . 6 4 7 0 2 . 9 5 5 5 0 . 6 3 4 0 5 . 0 5 39 3 .7 1 5 6 3 . 3 3
2 4 4 2 . 1 5 6 1 4 7 . 9 3 5 1 3 5 . 5 54 4 2 7 . 4 3 4 50 5 . 4 14 0 3 5 . 1 0 5 2 3 1 . 1 3 5 1 3 0 . 0 85 4 0 3 . 4 4 5 6 4 7 . 7 5 £ 5 2 5 . 6 5 5 5 0 3 . 2 9 4 5 7 4 .0 1 3 2 5 9 . 0 32 4 7 6 . 1 0 2 3 0 4 . 3 5 2 1 4 7 . 7 2 1 5 3 8 .3 1
Ml?
1125 . 61 8 2 5 . 0 5 6 5 3 . 8 7 4 5 5 . 4 3 4 4 0 . 8 3 6 - 3 . 7 1
2 2 7 1 . 0 5 5 5 7 5 . 4 3 4933 . 31 4 = 2 3 . 3 ? 4 7 5 8 . 3 9 5 : 1 4 . 5 2 5 - , , 2 . 2 5 5 4 2 5 . 5 9 5 7 2 8 . 7 9
6 ^ 1 4 . 6 4 5- . 35 . 4S 4 5 5 7 . 7 4 2 5 1 6 . 1 5 2 6 4 1 . 2 7 2 5 3 7 . 9 0 2 2 6 1 . 9 4 1 7 8 3 . 5 5
row

Table 25. Means of Mixing Height by Month and Hour for El Paso, 1975-78
hft Ml M2 H3 K4 M5 K5 M7 K8 MS MIO M il M12
7 1*76 kS2 625 529 614 441 592 455 452 s e c 372 35117 12S4 1922 2'195 3297 3517 4374 3346 3375 2562. 2189 1 6 0 : 1151
SITE 28
h a a i M2 M3 K«i MS MS M? K8 MS m; o M il K :2
7 liSS 625 517 .612 4 5 1 . 555 482 461 360 3 :3 35117 1227 l e s ? 2495 3294 3621 4356 3345 3327 2557 2169 IS lC 1191

Table 26. Means of Transport Wind by Month and Hour for El Paso, 1975-78
5IT E -27
hft Ml M2 M3 K4 MS M37 U.O 5.9 U.8 U.8 3.817 5.7 6.^ 6.5 8.3 7.8 • 5.4
m • Ml M2 M3 MS MS MG7 3.7 t i . 2 5.9 *i.7 y.8 3.8I? 5.3 5.*i 8.6 8.U 7.8 5.>i.
H73.JS59011.33153
3 . 21 . 3
M8 •3.2U.O
M33.3-1.7
MIO3.31.9
Mil3.75.6
M:2
3.25.5
roU1
M3 MS MIO k :; M12
3.2 3.3 3.3 3.7 3.21.0 1.7 1.3 5.6 5.5

Month
/ Ü / U ' / Ü / L y
/ / / , ^ é/n W 7 W Æ
^Tü^liTMryüVülyniTBvsy^ /J_jj| K --- Â ---Â --- Â --- rfa--- /L---Â:---Z,--- Z---- tR--- Z --- Z ---Z>---Z --- ------ T\r---
0 / w10/ ü /L / / c
\ r 7 W 7 W J W 7 W J \ ï 7 W J W 7 ^ / u / O / u / d8 Æ / î i i /U i / G
8 / g / g / g / g / g / 0 /[[il / ü i / [ | l / ii / i i / W / t i ' /& ' /G '
T e T ir / t i ) / e / s /n i / [ T T ^ z r T F /s / s / G / ô i / g / e / B / i l ^ J d y y W / G / h i y ü / G /
S / 0 / s / « / s / 0 / ü Z:|il7 II / P /Ë) / ï f / § s /Lji / S / ü / n
^ Y u r /H r Y L j - y n0 /ü ) / 0 / g
ÿ ^ / W / Dy u / L i / D / 0 / & / S
i / p y i i y a / p / t ? / g / Ë r y
1 ■? 3 0 b 7 8 9 10 11 12 13 i T 15 Tr^'i'5'^'iÛ" 21 22 23" 24
Hour
Note: In d iv id u a l v a lu e s found in Table 21.
F igure 42. CO Means by S i t e , Month and Hour fo r 1975-78 , S ite=27

«?■
1 2 1 s I B f i j ï ï j s / S / I
= J -7 lr7 f|-7 !r7 Î7 r7 f^i / i /J 7 ^ /s 7 B 7 h Ü T l jT
H
8 / g - / g / g / ^ e / ê y g / ^ ! : y : ' / g
7 / s / s / g / s y kï / b" y s y6 y / ® / &' /' s y g y & / ÿ' y% y 0' y s
' - '-' ' - - ------------5 y ^ y 5 y g / s y s y ^ y^^ y a ; y g y a y a / s y ^ y ^ / a y i Æ y r / s y s / ¥ y B j t p r j r / s j F y r ~
/è v s / s /a / s / s /S~7i~2^ / B / si— rA:— A — A — A — A — /-,— Ar — /—y/È y g y g y @ y k ^ ^ ' ê / a
" - ^ - ^ r y ^ y g : y g - y g r y g r ^ y % y ^ . y ^ y ^ y ;
JT . /
/F - y ^ T ^ / ^ - y a - ÿ a y r y & - ; T / L y ü / T 7 T/ / / * t ' / ___ • ■ •-■» _, t y __ fy a y a y a y a y s y» y & / b y b / u y o / y y
I T / 2 / s y i y ï ï ' y b ' T I l T O ' T l
g y b / b / ü / b y ü y
r / i î / a / a / a / Ë / B ,
, Hour
rc' - J
Note; In d iv id u a l v a lu e s found in Table 21.
F igu re 43. CO Means by S i t e , Month and Hour fo r 1975-78, S ite=28

i:>8
T r a f f i c h o u r ly means by month show d i s t i n c t in c r e a s e s from 7 to 8 a.m.
and 4 to 5 p.m. Mixing h e ig h t h o u r ly means by month are c o n s i s t e n t l y
lower in the morning ( 6 a .m . ) , by an approximate fa c to r o f 6 , than the
a ftern o o n m ixing h e ig h t means. The 6 a.m. (LST) tr a n sp o r t wind means
are c o n s i s t e n t l y s l i g h t l y low er than the 4 p.m. (LST) mean v a lu e s . The
K r u s k a l l -W a l l i s t e s t r e j e c t e d the n u l l h y p o th e s is fo r CO th a t Ho; y HI “
UHZ “ • • • “ hH24> fu r th e r con firm in g the e x i s t e n c e o f th ese s tron g
d iu rn a l p a t t e r n s . T e s t in g fo r the e q u a l i t y o f means a t the year-m onth-
hour l e v e l was rendered u n r e l i a b l e because o f m is s in g d ata which
produced extreme sample s i z e ranges a t t h i s l e v e l o f t e s t i n g .
Modeling
T r a d i t i o n a l l y the model developm ent, model c o n d i t io n in g , and
model c a l i b r a t i o n phases are c o n s id e red as s e p a r a t e ; however, because
o f the q u a n t i ty and co m p lex ity o f the data and d ata b a s e s , th e s e w i l l
be d is c u s s e d as a s i n g l e u n i t p r o c e s s .
While a thorough exam ination o f the d e s c r ip t i v e s t a t i s t i c a l
a n a l y s i s i n t u i t i v e l y in d ic a t e d th a t a l i n e a r type m o d e l /eq u a tio n u s in g
monthly means would be the b e s t ; n e v e r t h e l e s s , i t was co n s id ered
e s s e n t i a l to t e s t fo r b e s t - f i t type eq u a tio n u s in g both the raw data and
monthly means in the s t a t i s t i c a l m o d e l /eq u a tio n s shown in E quations 13
through 20 . The v a lu e (E quation 21 , T able 27) was the i n i t i a l
s t a t i s t i c a l parameter used to s e l e c t the b e s t m o d el/eq u a tio n from t h i s
s c r e e n in g p r o c e s s . U t i l i z a t i o n o f computer program packages g r e a t ly
f a c i l i t a t e d t h i s phase s in c e i t o n ly in v o lv e d i n s e r t i n g the data in to

Table 27. Statistical Terms and Equations
Term EquationNo.
Equation form D e sc r ip t io n and Function
21 R = SS due to r e g r e s s io n SB about mean
measures th e accuracy o f the est im ated r e g r e s s io n
R esid u a l Sum o f Squares
Error Sum o f Squares
Mean Square Error (MSE)
22
23
24
SS^ = Z(Y^ - Y)'
SSj = £(Y^ -
MSE = SS..
n -k
where: k = no. o f parameters n = sample s i z e
the sum o f squares due to r e g r e s s io n measures the d ev ia t io n o f the p red ic ted v a lu e (Y .) from the mean v a lu e (Y)(y = dependent v a r ia b le X = independent v a r ia b le )
the sum o f squares about r e g r e s s io n measures the d i f f e r e n c e between the a c t u a l v a lu e o f the ob servat ion ^ (Y .) and the p red ic ted v a lu e (Y^)
2i s an e s t im a te o f a , the v a r ia n ce o f th e tru e r e s id u a ls
roo
C o e f f i c i e n t o f V a r ia t io n (CV)
25 CV = s X 100 i s a comparison o f th e amount o f v a r ia t io n in p o p u la t io n s having d i f f e r e n t means
25a standard deviation

Table 27. Continued
Term EquationNo.
Equation form D e sc r ip t io n and Function
R esid u al Mean Square (MS^) 26 MS = - X)^ e s t im a te s th e va r ia n ce (a^) o f the r e s id u a ls
e s t im a te
r e s id u a l( e i )
27 ' l • * • ‘"20p a r t i a l r e g r e s s io n c o e f f i c i e n t s
observed v a lu e - v a lu e as pred ic te d by th e f i t t e d r e g r e s s io n equation
F r a t io 29 F = MS /MSE measures th e independence o f the v a r ia b le s in th e r e g r e s s io n

131
the v a r io u s package procedures th a t t e s t tor the d i f f e r e n t model ty p e s ,
and then e v a lu a t in g program ou tp u t fo r b e s t - f i t r e s u l t s .
QM
From t h i s i n i t i a l model s u i t a b i l i t y t e s t i n g i t was determined
th a t a tw enty-term q u a d ra t ic m o d e l /eq u a t io n o f the fo l lo w in g b a s ic form
would seem to prov ide a b e s t - f i t for the d ata in the monthly mean form.
CO = 6 q + BjWS + B^T + B^TR + B^MH + B^LYR + B^(WS * WS) + B ^ ( T * T ) +
B g ( T R A T R ) + Bg(M H * MH) + 3 ^q (L Y R * L Y R ) + B^j^CWS * T ) +
B gCWS * T R ) + B^gCWS * MH) + B^^CWS & LYR) + B ^ ^ f T * T R ) +
B ^ g ( T * MH) + B ^ yC T * LYR) + B ^ gC T R * MH) + B%g(TR * LY R ) +
BggCMH * LYR)
The SAS package program RSREG was the program (T able 10) which
was used to produce the 2 0 -terra q u a d ra t ic eq u a tio n by u s in g a l l f i r s t
order and second order com bin ations on th e 5 i n i t i a l input p aram eters.
The 2 0 -term model c a l i b r a t i o n procedure was then done u s in g the
c o n d i t io n in g p ro ce s s fo r model b e s t - f i t under s p e c i f i e d c o n d i t io n s .
The c o n d it io n in g p ro ce s s was performed by s p e c i f y i n g the c o n d i t io n s
under which th e model was to be t e s t e d . An example o f the c o n d i t io n in g
p r o c e s s would be to s e t t e s t i n g c o n d i t io n s as having on ly th o se
o b s e r v a t io n s fo r which the wind d i r e c t i o n was 0 - 9 0 ° and s i t e = 27; and

132
ex c lu d in g a l l o th er o b s e r v a t io n s ; and then t e s t i n g the model on the
s p e c i f i e d o b s e r v a t io n s . The r e s u l t s o f the QM c o n d i t i o n i n g - c a l i b r a t i o n
p r o c e s s e s arc g iv en in T able 28.
A f t e r the c o n d i t io n in g p ro ce s s for the 20 -term QM was completed
a comparison ranking (T ab le 29) was made for the fo l lo w in g s t a t i s t i c a l
t e s t param eters.
( 1 ) the r 2 v a lu e , which t e l l s how much o f the t o t a l v a r i a t i o ni s due to v a r i a t i o n about th e r e g r e s s io n i t s e l f ascompared to how much o f the v a r i a t i o n may be a t t r ib u t e d to the v a r i a t i o n o f the Y's (WS, T, TR, MH, LYR) about t h e i rin d iv id u a l means (E<iuation 21, T able 2 7 ) ,
(2 ) the mean square e r ro r (MSE) which i s an e s t im a te o f thev a r ia n c e o f the true r e s id u a l s (E q uation 24 , T able 2 7 ) ,
(3 ) the c o e f f i c i e n t o f v a r i a t i o n which i n d i c a t e s the amount o f v a r i a t i o n p r e s e n t in the i n i t i a l in p u t parameters (WS, T, TR, MH, LYR) independent o f the magnitude o f t h e i r means (E q uation 25 , T able 2 7 ) ,
( 4 ) the r e s id u a l sum o f squares which m easures the v a r i a t i o no f th e CO v a lu e s p r e d ic te d by th e QM from the a c t u a l orob served v a lu e s (E quation 22, T able 2 7 ) ,
( 5 ) th e r e s id u a l mean square which e s t im a t e s the v a r i a t i o n o fthe r e s i d u a l s o f the r e g r e s s io n (E q uation 26, T able 2 7 ) ,
( 6 ) the a c t u a l ( r e s p o n s e ) v a lu e o f CO (Y) v e r s u s the p r e d ic te d v a lu e o f CO (Y ).
The comparison ran k in gs o f th ese s t a t i s t i c a l t e s t parameters
were made by a s s i g n i n g a v a lu e o f "13” to the b e s t v a lu e ob ta ined for a
s p e c i f i c t e s t param eter for a l l 13 c o n d i t io n in g p r o c e s s e s (T ab le 2 9 ) .
A v a lu e o f "1" was a s s ig n e d to the l e a s t d e s i r a b l e (w o rs t) v a lu e . The
rank ings o f each in d iv id u a l c o n d i t io n in g p r o c e s s were then summed, and
th e c o n d i t io n in g p r o c e s s w ith the h ig h e s t t o t a l o f ranking p o in t s was
s e l e c t e d as the b e s t - f i t reduced model form.

Table 28. Conditioning Effects on Statistical Parameters from QM Conditioning
C ondit ion ingID
C ondition ing it o f Obs,
r 2 MSE Coef. o f V a r ia t io n
ResidualSS
R esidualMean
Square
Response P red ic ted Mean Mean
GLMREG Mother-Raw Data 103752 0.1945 1 .3831 0 .8996 11430.6 1.9131 1 .5 4 -0 .9 1
RS-2 Doter I -Raw Data 3730 0 .1854 1 .3928 0.9324 7194 1.9398 1 .4 9 -0 .7 8
R-IA Monthly means by y ea r— Mother
48 0 .6940 0.2836 0 .2186 2.1722 0 .0805 1 .3 0 1 .5 3
R-1 Monthly means by y ear— D oter l
48 0 .5129 0.4847 0 .3285 6 .3439 . 0 .2350 1 .4 8 0 .59
C-2 Monthly means WD— 0 -9 0 °
48 0 .6822 0.3544 0 .2887 3.3906 0 .1256 1 .2 3 1 . 1 1
C-4 Monthly means WD— 90-180°
48 0 .8 1 5 3 0.3462 0 .2283 3.2352 0 .1198 1 .5 2 1 . 6 6
C-1 Monthly means WD— 180-270°
48 0 .6246 0.3539 0 .2855 3.3826 0 .1253 1 .2 4 1.44
C-3 Monthly means WD— 270-360°
48 0 .6453 0.3041 0 .2302 2.4965 0.0925 1 .3 2 0 .06
C-5 Monthly means S i t e = 27
48 0.4707 0 .7822 0 .4198 14.0705 0 .6118 1 . 8 6 1.43
C—6 Monthly means S i t e = 28
48 0 .8427 0.2006 0 .2384 0.8859 0 .0403 0 .8 4 0 .5 7
C-7 Monthly means with HR=17 S ite=27 WD 270°
48 0 .7999 0.5404 0 . 2 0 1 1 6.1334 0.2921 2 .69 3.29
C- 8 Monthly means WD 270° S ite=27
48 0 .4273 0 .6453 0.3562 9.5786 0 .4165 1 .8 1 2.09
C-9 Monthly Means S at. & Sun. D eleted
48 0 .6724 0 .3033 0 .2344 2.4833 0.09197 1 .29 1 . 2 1

134
Table 29. Unnkiiif; of Che Statistical Parameters of QM Conditioning
Parameter
C o n d it io n in g 9 R esid u a l R esid u a li n i r MSE CV SS MS Y-Y T ota l
GLMREG 2 2 2 1 2 1 10
RS-2 1 1 1 2 1 2 8
R-IA 10 13 ■ 12 12 12 9 6 8
R-1 5 6 5 5 6 4 31
C-2 9 7 6 7 7 12 48
C-4 12 9 11 9 9 11 61
C-1 6 8 7 8 8 10 47
C-3 7 10 10 1 0 1 0 3 50
C-5 4 3 3 3 3 6 22
C- 6 13 12 8 13 13 8 67
C-7 11 5 13 6 5 5 45
C- 8 3 4 4 4 4 7 26
C-9 8 1 1 9 1 1 1 1 13 62
13 = b e s t v a lu e
1 = w orst v a lu e

135
On the b a s i s o f h ig h e s t sum for each c o n d i t io n in g (T ab le 29)
o b ta in ed from the ranking o f th e s t a t i s t i c a l t e s t r e s u l t s ( a s s ig n in g
eq u al importance v a lu e to each t e s t ) the c o n d i t io n in g p ro ce ss in v o lv in g
monthly a r i th m e t ic means d e r iv e d from MOTHER was chosen fo r the
s e l e c t i o n o f the p a r t i a l r e g r e s s io n c o e f f i c i e n t s used in the f i n a l form
20-term QM g iv e n in Equation 4 0 , T able 3 0 ) .
Although the in d iv id u a l s t a t i s t i c a l t e s t s d id not always
r e c e i v e the b e s t ranking v a l u e , n e v e r t h e l e s s the sum o f the rankings o f
s t a t i s t i c a l t e s t parameters fo r t h i s c o n d i t io n in g d id have the b e s t sum
o f rank ings (T ab le 2 8 ) . For exam ple, th e v a lu e fo r t h i s
c o n d i t io n in g was n ot the h ig h e s t R v a lu e o b ta in e d , however, th e MSE
v a lu e was the b e s t o b ta in e d in a l l the t h i r t e e n c o n d i t io n in g p r o c e s s e s
w ith the C .V ., R e s id u a l SS, and R e s id u a l MS v a lu e s rank ing second b e s t .
The m o d e l /e q u a t io n e v a lu a t io n w ith c o n d i t io n in g on monthly means
d er iv ed from MOTHER and s i t e = 28 was q u i t e comparable to the s e l e c t e d
m odel. I t was d e c id e d , however, to use the m o d e l /eq u a t io n d er iv ed from
th e monthly a r i th m e t ic means (MOTHER) s in c e a m o d e l /eq u a t io n th a t was
n o t c o n d it io n e d to be s i t e s p e c i f i c would f in d more g e n e r a l
a p p l i c a t i o n . A ls o , i t d id perform w e ll when a p p lied to c o n d it io n in g
u s in g o n ly d a ta from s i t e 27 (T a b le 2 8 ) .
GLM
The 20-term q u a d r a t ic m o d e l /eq u a t io n (E quation 4 0 ) , w h i le
p ro v id in g a more com plete e x p r e s s io n o f the fu n c t io n s and i n t e r a c t i o n s
o f the 5 i n i t i a l input param eters , was n e v e r t h e le s s regarded as b e in g
form idab le in i t s appearance and thus not as r e a d i l y a c c e p ta b le as a

136
'I'able 30. (Ju.ulraCLe Nodol/KquaC Ion
MCO = g g + Bj^WS + B g T + B ^ T R + B^MII + B ^ L Y R + 6 ^’ ( V S * WS) + B ^ ( T * T ) +
P (TR * TR) + Bg(MH * MH) + B^q (LYR * LYR) + Bj^(WS * T) +
* TR) + ^^^(WS * MH) + 6 ^^(WS & LYR) + B^g(T * TR) +
B^^(T * >01) + 6 ^^(T * LYR) + B^g(TR * MH ) + B^g(TR * LYR) +
B^g(MH * LYR) (Equation 30)
which s i m p l i f i e s to : MCO = + LQC (Equation 31)
where LQC = L + Q + C (Equation 32)
Note:
MCO = a r i t h m e t i c monthly mean o f CO
MWS = a r i t h m e t i c monthly mean o f wind speed
MT = a r i t h m e t i c monthly mean o f tem perature
MTR = a r i t h m e t i c monthly mean o f t r a f f i c
MMH = a r i th m e t ic monthly mean o f m ix ing h e ig h t
MLYR = a r i t h m e t i c monthly mean o f t r a n s p o r t wind
in which L = l i n e a r term components
or L = * MWS + B2 * MT + Bg * IMH + 6 * MLYR (Equation 33)
s u b s t i t u t i n g e s t im a t e s fo r B ~ 3 ^
r e s u l t i n g in :
.L = 0 .0 0 0 7 5 4 * MTR) + (0 .0 0 7 3 9 * MMH) + ( - 1 .8 6 4 4 * 1-1LYR)+ (1 .5 2 8 4 * m s ) + ( -0 .3 5 7 4 * MT) (Equation 34)
and Q = q u a d r a t ic term components
or q = B, * (MWS) + By * (MT)^ + Bg * (MTR) + 6g (MMH)^
+ Bj q (MLYR) (Equation 35)

H 7
Tabic 30. Continued
subsc ituC inR e s t im a t e s fo r 3^ - 3j q r e s u l t i n g in ;
Q = ( -0 .0 0 8 8 5 * IWSQ) + (0 .0 0 2 7 1 * MTQ) + (9 .4375E - 8 * MTRQ)+ (0 .0 0 0 0 0 1 3 7 * MMllQ) + (0 .0 2 1 9 9 * MLYRQ) . (Equation 36)
where:
m s Q = f-ws * m sMMHQ = MMH * MMH
MTQ = MT * MT MLYRQ = MLYR * MLYR
MiRQ = Ml'R * MTR
and C = cro ssp r o d u c t term components
or ^ “ ^ 1 1 * * MT + 3 ^ 2 * MlfS * Ml’R + 3 ^ ^ * MWS * MMH
+ 3 ^ ^ * MWS * MLYR + 3 ^ ^ * MT * MTR + 3^ ^ MT * MMH
+ 3j^y * MT * MLYR + 3j^g * MTR * MMH + 3 ^ g * MTR * MLYR
+ 320 * MMH * MLYR (Equation 37)
s u b s t i t u t i n g e s t im a t e s fo r 3 - ^2q y i e l d s :
C = ( -0 .0 0 3 2 9 * CMWSl) + ( -0 .0 0 0 4 4 8 * CMWS2) + (0 .00000863 * CMTl) + (0 .0 0 0 0 7 9 8 * CMWS3) + ( -0 .0 0 0 8 6 5 * CMMHl)+ ( -0 .0 0 0 1 2 9 * CMT2) + (1 .9874E - 7 * CMTRl) + (0 .0 2 0 8+ CMWS4) + (0 .0 3 5 7 * CMT3) + (0 .0 0 0 1 5 2 * CMTR2)
(Equation 38)
i:
CMWSl = IMS * MT CMWS2 = MWS * MTR CIMS3 = MWS * MMH
CM17S4 = MWS * MLYR CMTl = MT * MTR CMT2 = MT * MMH
CMT3 = MT * MLYR CMTRl = MTR * MMH CMTR2 = MTR * MLYR
CMMHl = MMH * MLYR
w ith 3 = 6 .2 6 1 2o(Equation 39)

138
Table 30. Continued
Iiaving the f i n a l form:
MCO = 6 .2 6 1 2 + (1 .5 2 8 4 * MWS) - (0 .3 5 7 4 * MT) + (0 .000754 * MTR)
+ (0 .0 0 7 4 * MMH) - (1 .8 6 4 4 * MLYR) - (0 .0 0 8 9 * MWS )
+ (0 .0 0 2 7 * MT ) + (9 .4375E - 8 * MTR ) + (0 .00000137
* MÎ-ÎH ) + (0 .0 2 1 9 9 * MLYR ) - {0 .0 0 3 3 * (MWS * MT)}
- (0 .0 0 0 4 4 8 A (MWS * MTR)} + {0 .0000798 * (MWS * MMH)}
+ {0 .02784 * (MWS * MLYR)} + {0 .00000865 * (MT * MTR)}
- {0 .000129 * (MT * MMH)} + {0 .0357 * (MT * MLYR)}
+ {1 .987E - 07 A (MTR * MMH)} + {0 .000152 * (MTR * M LYR)}
- {0 .000865 * (MMH * MLYR)} (Equation 40)

139
more a b b rev ia ted form o f model. The development o f an ab brev ia ted form
o f t h i s m o d e l /eq u a t io n th a t would have a comparable p r e d ic t iv e c a p a c i ty
was f e l t to be more s e r v ic a b le for g en er a l u sa g e . To determ ine a
s a t i s f a c t o r y a b b r e v ia te d model form the c o n d i t i o n i n g - c a l i b r a t i o n
r e s u l t s (T ab le 28) o f the 20-term model were used for the
m o d el/eq u a tio n e v a l u a t i o n / s e l e c t i o n p r o c e s s .
The model eq u a tio n e v a l u a t i o n / s e l e c t i o n p r o c e s s fo r the form o f
the reduced term model in v o lv e d u s in g th e e v a lu a t io n s o f th e
com parisons o f the parameters ob ta ined fo r the 20 terra QM model
c o n d i t i o n i n g - c a l i b r a t i o n , to g e th e r w ith a r e - e v a lu a t io n o f the
d e s c r i p t i v e s t a t i s t i c a l a n a l y s i s , and fu r t h e r e v a lu a t io n o f
cro ssp r o d u c t and l i n e a r terra com bination models (F ig u re 4 ) .
Examination o f raw data and c o n d i t io n in g s o f the data used in
Equation 30 , th e F - r a t i o and a s s o c ia t e d p r o b a b i l i t y in d ic a te d the
l i n e a r p o r t io n o f the eq u a tio n to be th e most s i g n i f i c a n t p o r t io n ( a t
0 . 0 0 0 1 l e v e l o f s i g n i f i c a n c e ) , fo l lo w ed by the cr o ssp r o d u c t term s, then
the q u a d ra t ic terms which e x h ib i t e d a low l e v e l o f s i g n i f i c a n c e in
t h e i r c o n tr ib u t io n to th e eq u a t io n . T h e r e fo r e , s i n c e the q uad ratic and
cro ssp r o d u c t terms o f th e eq u a tio n did not c o n tr ib u te s i g n i f i c a n t l y to
the r 2 t e s t o f the e q u a t io n , i t was d ec id ed to use o n ly th e l i n e a r
p o r t io n (which in c lu d ed on ly the 5 i n i t i a l input param eters) o f the 20
term QM. The r e s u l t s o f v a r io u s l i n e a r p lu s cro ssp ro d u ct terra
eq u a t io n s d id not improve the v a lu e . As a r e s u l t o f t h i s e v a lu a t io n
i t was then d ec id ed to use the reduced form f i v e terra g en era l l i n e a r
model (GLM) h av in g the form:

lAO
MCO = Co + 0 1 (MWS) + (Î2 (MT) + 8 3 (MTR) + 8 4 (MMH) + 8 5 (MLYR)
(Equation 4 1 )
C o n d it io n in g and c a l i b r a t i o n procedures were then performed on
the GLM (T ab le 31) in the same manner as th ose used on the QM.
r2 r e s u l t s o f GLM u t i l i z i n g raw d ata were c o n s i s t e n t l y low
ex cep t when e x t e n s iv e c o n d it io n in g was employed. Although e x t e n s iv e
c o n d it io n in g o f the raw d ata and subsequent u se o f the c o n d i t i o n a l l y
produced monthly means d id improve the R^, SS and mean squares o f the
model and e r ro r terra to v a lu e s o f < 0 .5 and d id reduce the MS, t h i s
s t i l l d id not produce a b e t t e r model f i t than the one obta ined u s in g
a r i th m e t ic monthly mean (by y ea r ) a v e r a g e s . As shown by a ranking o f
the s t a t i s t i c a l t e s t parameters (T ab le 32) as performed fo r the QM the
b e s t model f i t was o b ta in e d u s in g a r i th m e t ic monthly means (MOTHER).
Monthly means ob ta in ed from the raw d ata in DOTERl d id improve the R%
v a lu e , but n ot as much as d id th o se (m onthly means) from MOTHER. The
f i n a l form o f the m o d e l /eq u a tio n a f t e r param eter e s t im a te s had been
s u b s t i t u t e d f o r v a lu e s i s shown as f o l l o w s :
MCO = 2 .6 1 7 3 + { (-0.1147)MWS }+ { ( - 0 . 0 2 3 4 )MT }
+ {(0 .00028)M TR } + {(0.00016)MMH} + {(-0.0533)MLYR>
(Equation 4 2 )
where "M" d e n o te s a r i th m e t ic monthly mean o f the parameter
Model V e r i f i c a t i o n
The d ata u sed in the v e r i f i c a t i o n o f both models were
a r i t h m e t ic monthly means for 1979-1980 .

Table 31. Conditioning Effects on Statistical Parameters from GLM Conditioning
C ondition ingID
C ondition ing it o f Obs.
r 2 Coef. o f V a r ia t io n
ModelSS
MeanSquare
F Value PR F
GLMREG Mother - Raw Data 103752 0.1945 0.8996 2167.7 433.5 216 .0 0 . 0 0 0 1
R-2 Doterl-Raw Data 3730 0.1473 95 .20 1301.2 260.2 128.7 0 . 0 0 0 1
RIA Monthly means by y ea r— Mother
48 0 .5913 20 .26 4 .2 0 .8396 12.15 0 . 0 0 0 1
R-1 Monthly means by year— D oterl
48 0.2701 32.24 3 .5 0 .7036 3.11 0 .0178
C-2 Monthly means WD— 0-90^
48 0.4699 29.89 5 .0 1.0026 7 .45 0 . 0 0 0 1
C-4 Monthly means WD— 90-180°
48 0.5959 27 .07 10 .4 2.0872 12.39 0 . 0 0 0 1
C-1 Monthly means im— 180-270°
48 0 .4547 27.59 4 .1 0 .8195 7.01 0 . 0 0 0 1
C-3 Monthly means WD— 270-360°
48 0 .4310 23 .3 7 3 .0 0 .6066 6 .3 6 0 . 0 0 0 2
C-5 Monthly means S ite=27
44 0 .2641 38.51 7 .0 1.4039 2 .7 3 0 .0335
C- 6 Monthly means S ite=28
43 0 .6230 28 .46 3 .5 0 .7019 12.23 0 . 0 0 0 1
C-7 Monthly means w ith HR=17 S ite=27 WD 270°
42 0.4674 25 .05 14.3 2.8650 6 .32 0 .0003
C- 8 Monthly means TO 270 S ite=27
44 0.2275 32.19 3 .8 0.7609 2 .24 0 .0703
C-9 Monthly Means S a t . & Sun. D ele ted
48 0 .5812 21 .25 4 .4 0 .8813 1 1 . 6 6 0 . 0 0 0 1

142
Table '32. Kanking üf the Statistical Parameters of CI.M Conditioning
C o n d it io n in gID
Parameter
T o ta lr 2 CVModel
SSMean
Square F -v a lu e PR>F
GLMREG 2 13 1 2 13 4 .5 35.5
RS-2 1 1 2 1 12 4 .5 21 .5
R-IA 1 1 12 8 9 9 4 .5 53 .5
R-1 5 3 11 .5 12 3 3 37.5
C-2 9 5 6 6 6 4 .5 36 .5
C-4 12 8 4 4 11 4 .5 43 .5
C-1 7 7 9 10 7 4 .5 44 .5
C-3 6 10 13 13 4 5 51
C-5 4 2 5 5 2 2 20
C- 6 13 6 1 1 .5 8 10 4 .5 53
C-7 8 9 3 3 5 4 32
C- 8 3 4 10 1 1 1 1 30
C-9 10 11 7 7 8 4 .5 47 .5
13 = b e s t v a lu e
1 = w orst v a lu e
143
QM v e r i f i c a t i o n . V e r i f i c a t i o n o f the QM was performed u sin g
Equation 4 0 . F igu re 44 dem onstrates the r e s u l t s o f t h i s v e r i f i c a t i o n
procedure. The QM eq u a tio n produces h ig h e r lower CO v a lu e s than a c t u a l
v a lu e s found a t the corresp on d in g agreem ent. The agreement between
a c tu a l and p r e d i c t i v e v a lu e s when u s in g the QM eq u a tio n i s q u i te good
fo r a tw e lve month p e r io d , but the range between a c tu a l and p r ed ic te d
v a lu e s becomes p r o g r e s s iv e ly w ider w ith time.
GLM v e r i f i c a t i o n . V e r i f i c a t i o n o f the GLM m o d e l/eq u a tio n was
performed by s u b s t i t u t i o n o f the e s t im a te s (o b ta in ed u s in g the
a r i th m e t ic monthly means c o n d i t io n in g ) i n t o Equation 42 producing the
r e s u l t s as shown in F igure 4 5 . The GLM model produces p r e d ic t io n
v a lu e s h ig h e r than the a c t u a l monthly mean CO v a l u e s . The p r e d ic t iv e
c a p a c i ty o f the model appears to be b e s t for both o f f i r s t year o f
s e l e c t e d t e s t d a ta . The agreement between a c t u a l and p r e d i c t i v e v a lu e s
when u s in g the GLM eq u a tio n (F igu re 4 5 ) i s comparable to th a t obta ined
u s in g the QM eq u a tio n (F ig u re 4 4 ) .
Model V e r i f i c a t i o n U sing L im ited Data
S in c e in d iv id u a l s i t e t r a f f i c cou n ts were a v a i l a b l e (EPTD,
Table 7) i t was d ec id ed to s u b s t i t u t e th e s e data fo r the monthly mean
t r a f f i c d a ta used to d ev e lo p and c a l i b r a t e th e m od els . T his would
provide in fo rm a tio n co n cern in g the models performance with data for
l im ite d time c o n s tr a in e d c o n d i t io n in g . The r e s u l t s o f th e se t e s t s are
shown in T ab les 33 and 34. As shown (T ab les 33 and 34) n e i t h e r model
performs w e l l w ith l i m i t e d , s p e c i f i c c ircu m sta n ce , raw d a ta . These

144
MCO
2 . 5 -
2 . 0 -
0 . 5 -
0 .0-
- 0 . 5 -
- 1 . 0 -
•TN0V78 MflR79 JUN79 SEP79 DEC79 flPRSO JUL80 0CT60
DflTEl
nCTUOL = SOUnRE PHEOICT = DIflHOND RESID = .X
Figure 44. Plot of OM Predictions

lA'j
MCO
2 . 5 0 -
2 . 2 5 -
2 . 0 0 -
1 . 7 5 -
1 . 5 0 -
1 . 2 5 -
1 . 0 0 -
0 . 7 5 -
0 . 5 0 -
0 . 2 5 -
0 . 0 0 -
- 0 . 2 5 -
- 0 . 5 0 -
JUL80 OCTOOJUN79 SEP79 0EC79N0V78 MAR79
DflTElflCTUAL-SOUflRE PflEOICT=01HHOND RESID=X
Figure 45. Plot of GLM Predictions

Table 33. Predictions Using EPTD Data in QM
SITE YR MO DA HR MCO Ml-IS WD T TR MH LYR PMCO RESID
27 76 4 13 17 3 .3 6 . 8 ' 284 84.2 1534 4453 11 .7 7.569 10.869
27 76 4 14 7 1 .9 3 .7 77 61 .9 59 289 4 .7 0.611 1.288
27 76 4 14 17 3 .0 1 2 .7 293 70.7 1534 3496 1 2 . 1 -0 .9 4 7 3.947
27 80 7 15 17 4 .8 5 .0 244 104.0 984 4257 1 . 6 2.788 2 . 0 1 2
27 80 7 16 17 3 .3 1 2 . 0 1 00 8 8 . 0 1998 4795 4 .0 12.083 -8 .7 8 3
27 80 11 25 17 2 .5 8 . 0 1 1 1 37 .0 1127 938 4 .6 4 .970 -2 .4 7 0
28 78 11 28 17 0 . 2 8 . 0 249 51 .0 1179 2033 6 . 1 3.720 -3 .5 2 0
28 78 1 1 29 7 0 .5 6 . 0 172 36.0 89 142 4 .4 3.322 -2 ,8 2 2
c\

Table 34. Predictions Using EPTD Data in GLM
SITE YR MO DA HR MCO MWS WD T TR MH LYR PMCO RESID
27 76 4 13 17 3 .3 6 . 8 284 . 84 .2 1534 4453 11 .7 0 .39 2 .92
27 76 4 14 7 1 .9 3.7 77 61 .9 59 289 4 .7 0 .55 1 .35
27 76 4 14 17 3 .0 12 .7 293 70.7 1534 . 3496 ■ 1 2 . 1 - 0 .1 6 3 .16
27 80 7 15 17 4 .8 5 .0 244 104.0 984 4257 1 . 6 0.49 4 .32
27 80 7 16 17 3 .3 1 2 . 0 1 00 8 8 . 0 1998 4795 4 .0 0 .2 9 3.01
27 80 11 25 17 2 .5 8 . 0 1 11 37.0 1127 938 4 .6 1 .04 1 .45
28 78 11 28 17 0 . 2 8 . 0 249 51 .0 1179 2033 6 . 1 0 .8 3 - 0 .6 3
28 78 1 1 29 7 0 .5 6 . 0 172 36.0 89 142 4 .4 0 .8 9 - 0 .4 0

148
r e s u l t s were exp ected s in c e the models wore developed u s in g "smoothed"
or monthly mean d a ta .
E stim ate Rankings
F i n a l l y , rank ings o f the e s t im a t e s (T a b le s 35 and 36) were then
performed by a s s ig n in g a v a lu e o f "2 0 " to the parameter h av in g the
l a r g e s t e s t im a te v a lu e which in d ic a t e d the l a r g e s t c o n tr ib u t io n o f
in f lu e n c e in the m o d e l /eq u a t io n and a v a lu e o f "1 " to the lo w est
e s t im a te v a lu e ( s m a l l e s t c o n t r ib u t i o n ) . A f t e r the e s t im a te s fo r each
in d iv id u a l c o n d i t io n in g were done the rank ings for each term were then
added. E v a lu a t io n o f the parameter h av ing c o n s i s t e n t l y the g r e a t e s t
c o n tr ib u t io n to the m o d e l /eq u a t io n was then made by s e l e c t i n g the
parameter w ith the h ig h e s t sum. C o n tr ib u t io n importance o f the o th e r
19 m o d e l /eq u a t io n terms was su b se q u en t ly determ ined by l i s t i n g the
terms in order o f d escen d in g v a lu e s w ith the s m a l l e s t sum d en o t in g
l e a s t c o n tr ib u t io n to th e m o d e l /eq u a t io n .
Ranking o f th e parameter e s t im a te s produced in th e QM
c o n d i t io n in g s l i s t e d in T able 35 show the f i v e i n i t i a l input param eters
to be ranked by l a r g e s t e s t im a te v a lu e as LYR>WS>T>MH>TR i n d i c a t in g
t h e i r importance as impact f a c t o r s , and WS>LYR>T>TR>MH u s in g GLM
e s t im a te ran k in gs . A lthough TR i s l i s t e d as h a v in g a h ig h er e s t im a te
( t o t a l sum) ranking than MH a c l o s e exam in ation o f T able 36 shows th e
TR ( t o t a l sum) e s t im a te ranking to be o n ly one p o in t h ig h er than th a t
o f MH. S in c e the scope o f parameter e v a lu a t io n i s la r g e r fo r QM i t i s
more rea so n a b le to u se th e s e v a lu e s fo r e v a lu a t in g the r e l a t i v e

Table 35. Ranking of Estimates from QM Conditioning
Parameter
C ondit ion ing ID
T ota lCl C2 C3 C4 C5 C6 C7 C8 C9 GR RIA R1 R2
WS 18 19 20 19 19. 19 20 19 16 20 19 19 20 247T 19 13 17 18 18 18 18 18 19 18 18 14 18 226TR 13 11 12 9 13 9 11 11 13 11 9 7 12 141
MH 12 12 10 7 12 12 13 12 14 13 13 12 13 155LYR 2 0 20 19 20 2 0 20 19 2 0 20 19 20 2 0 19 256WS 15 16 18 14 17 15 15 15 18 15 14 18 15 205T^ 10 9 13 11 9 11 1 0 10 11 9 11 11 11 117TR 3 1 1 3 2 2 1 1 2 2 1 2 1 22
MH ' 1 2 3 1 1 1 3 2 3 3 3 1 3 27LYR 16 17 1 1 16 15 17 16 14 15 16 16 17 16 202
WS*T 14 14 14 17 16 14 14 16 10 12 12 15 10 177WS*TR 8 6 6 10 7 7 7 6 8 8 8 9 8 98WS*MH 9 8 4 . 12 10 8 9 9 6 6 5 10 6 102
WS&LYR 17 18 16 13 11 16 17 17 12 17 15 16 17 2 02
T*TR 4 4 5 5 5 6 4 4 4 5 4 5 5 60T&MH 5 5 7 4 4 4 5 5 7 4 6 4 4 64T*LYR 1 1 15 15 15 14 14 1 2 13 17 14 17 14 14 184TR*MH 2 3 2 2 3 3 2 3 1 1 2 3 2 29TR*LYR 7 7 8 6 6 5 6 8 5 7 7 6 7 85MH*LYR 6 10 9 8 8 10 8 7 9 10 10 8 9 11 2
20 = h ig h e s t 1 = low est

150
T able 36. Rankin# o f b sc im atos from OLM C o n d it io n in #
Parameter
C o n d it io n in g ID
T ota lCl C2 C3 C4 C5 C6 C7 C8 C9 GR RIA RI R2
WS 5 5 5 5 5 5 5 5 5 5 5 4 5 64
T 3 4 3 3 • 3 3 2 3 3 3 3 2 2 37
TR 2 2 2 1 1 1 3 2 2 1 2 3 3 25
MH 1 1 1 2 2 2 1 1 1 2 1 5 4 24
LYR 4 3 4 4 4 4- 4 4 4 4 4 1 1 45
5 = l a r g e s t 1 = s m a l l e s t

151
importance o f the e f f e c t s o f i n i t i a l input parameters on the CO
c o n c e n t r a t io n s .
P r e d ic t io n s
One o f the four major model usage c a t e g o r ie s l i s t e d was the
a b i l i t y o f the models to p r e d ic t ambient a i r CO c o n c e n t r a t io n s g iv e n
s p e c i f i c parameter input v a lu e s . There are two methods by which
p r e d ic t io n s may be made. They a r e ; 1) u s in g input parameter v a lu e s
taken from days for which data was p r e v io u s ly c o l l e c t e d and i n s e r t i n g
th e s e v a lu e s in t o th e models and then comparing " a c tu a l" w ith
"p red ic ted " v a lu e s as was done in the model v e r i f i c a t i o n p ro ce ss ; or 2 )
u s in g the " scen a r io " p r e d i c t i v e p r o c e s s .
The s c e n a r io p r e d i c t i v e p ro ce s s may be fu r th e r d iv id ed in to two
ty p e s : a) the random ty p e , or b ) th e most probable com bination o f
e v e n t s typ e . In the random type input parameter v a lu e s are randomly
s e l e c t e d , p laced in the model, and a p r e d i c t i v e CO c o n c e n tr a t io n v a lu e
c a l c u l a t e d . One must then w a it fo r th ese e v e n ts to occur in
c o n ju n c t io n as s ta t e d or sea rch e x i s t i n g records fo r such e v e n t
com binations and check observed CO c o n c e n t r a t io n s a g a in s t p r e d ic te d
v a l u e s . The most probable com bination o f ev e n ts type o f the s c e n a r io
p r e d ic t io n p ro cess in v o lv e s exam ining the d e s c r ip t i v e s t a t i s t i c a l
a n a l y s i s r e s u l t s , s e l e c t i n g inp u t v a lu e s th a t r o u t in e ly occ r a t
c e r t a i n tim es and p la c e s , i n s e r t i n g th e s e s e l e c t e d v a lu e s in the model,
and f i n a l l y comparing p r ed ic te d v a lu e s w ith the CO c o n c e n tr a t io n v a lu e s
th a t have r o u t in e ly been e x h ib i t e d in the p ast and w i l l th e r e fo r e most
probably be e x h ib i t e d during a s p e c i f i e d fu tu re p er io d .

152
From Che scrong and p e r s i s t e n t p a t te r n s o f the model input
v a r i a b l e s as shown in the d e s c r i p t i v e s t a t i s t i c a l a n a ly s i s and
summarized in F igure 46 one may r e a d i ly e n v isa g e the p r e d i c t i v e ty p es o f
s c e n a r io s in which e i t h e r model may be employed. The r e s u l t s ob ta in ed
in the v e r i f i c a t i o n procedure in d ic a t e th a t u se o f t h e s e typ es o f
s c e n a r io s would y i e l d e x c e l l e n t r e s u l t s . S cen a r io p r e d ic t io n s o f t h i s
type are most e f f e c t i v e when used by a g e n c ie s in m i t i g a t i n g the adverse
im pacts o f an th rop ogen ic f a c t o r s such as t r a f f i c during p er io d s o f
n a t u r a l ly o ccu rr in g adverse impact e v e n ts such as in v e r s io n s .
An example o f the p r e d i c t i v e use and c a p a c i ty o f the models i s
g iv e n in the fo l lo w in g s c e n a r io d er iv ed from F ig u re 4 6 .
In January in E l Paso wind speeds and temperature are low. The
a g e n c ie s r e s p o n s ib le fo r l o c a l AQM are n o t i f i e d by m e t e o r o lo g i s t s th a t
an in v e r s io n period ( i n v o lv in g v a lu e s fo r mixing h e ig h t and tr a n sp o r t
wind) o f g r e a te r than one d a y 's d u r a t io n i s em inent. Using the two
models they may r a p id ly p r e d ic t th a t h ig h e r average CO l e v e l s th a t w i l l
occur during th i s period i f average t r a f f i c volumes remain r e l a t i v e l y
the same or how much the average CO c o n c e n tr a t io n s during t h i s p er io d
can be reduced or rea so n a b ly h e ld w i th in th e NAAQS l i m i t s by
c o n t r o l l i n g average volumes o f t r a f f i c .
This s c e n a r io not o n ly dem onstrates the p r e d i c t i v e c a p a c i t i e s
o f the m odels , but the r o l e s o f th e s e models in e f f e c t i v e AQM.
General Comments
Comparison o f the v a lu e s o b ta in ed in th e v a r io u s QM
c o n d i t io n in g p r o c e s s e s prov ide a d d i t io n a l i n s i g h t s to the p r o c e s s e s

153
im pacting CO l e v e l s . The r2 v a lu e s o b ta in ed u s in g raw data were the
lo w e s t , as e x p e c te d , s i n c e the p resen ce o f o u t l i e r s would i n t e r f e r e
w ith and d i s t o r t the a n a l y s i s . v a lu e s ob ta ined fo r the 9 0 -1 8 0 ° and
2 7 0 -3 6 0 ° wind d i r e c t i o n s were s l i g h t l y h ig h er than th o se o b ta in ed fo r
th e 0 -9 0 ° and 180 -2 7 0 ° a rea s which are the s e c t o r s h av in g the g r e a t e s t
p o p u la t io n and t r a f f i c m a sses . The 1 8 0 -2 7 0 ° s e c t o r i s a l s o a d ja c e n t to
J u a rez . T his r e d u c t io n in the r2 v a lu e s i n d i c a t e s the p resen ce in
th e s e s e c t o r s o f o th e r p o s s ib l e f a c t o r s which may impact CO l e v e l s
p a r t i c u l a r l y in v iew o f the f a c t th a t the c o e f f i c i e n t o f v a r i a t i o n i s
reduced fo r both o f th e s e s e c t o r s i n d i c a t i n g a r e d u c t io n in the
v a r i a t i o n encountered in the param eters in c lu d ed in the model. T h is
same p a t te r n i s re p e a ted in the com parison o f th e R^, CV, and MSE
v a lu e s o b ta in ed by s i t e c o n d i t io n in g . The lower v a lu e s o b ta in ed a t
s i t e 28 which was lo c a te d in A sc a r a te Park, an a rea o f low t r a f f i c
volume, and l e s s exposed to the " s t o v e p ip e" , "heat i s la n d " , and
v e n tu r i wind e f f e c t s encountered a t s i t e 27 fu r th e r em phasize th e
i n c r e a s e in accuracy o f CO p r e d i c t i o n in low en v ironm enta l impact
a r e a s . S in c e th e e s t im a te (T a b le s 28 and 31) v a lu e s change in each
c o n d i t io n in g p r o c e s s i t i s a l s o p o s s i b l e to examine by the ranking
p ro ce ss th e s e v a lu e s to o b ta in i n s i g h t s to the f a c t o r s hav in g th e most
i n f lu e n c e on CO l e v e l s in a p a r t i c u l a r s e t o f c ir c u m s ta n c e s . The
s t a t i s t i c a l p a t te r n em erging from the c o n d i t io n in g p r o c e s s e s i s q u i t e
s t a b l e and c o n s i s t e n t l y shows an improved r2, lower CV, lower MSE, and
low er RMS in a re a s h av in g reduced or lowered en v ironm enta l impact
f a c t o r s o f a n th rop ogen ic and n a tu r a l o r i g i n .

154
CHAPTER V
SUMMARY CONCLUSIONS
Although t h i s stu d y i s e n t i t l e d " H e u r is t ic S t a t i s t i c a l Models
fo r Carbon Monoxide in E l Paso , Texas" , i t has encompassed a wide range
o£ t o p ic s n e c e s s a r y fo r th e d e te r m in a t io n , u n d ersta n d in g , and
i n t e r p r e t a t i o n o f model components and model adequacy. The c o n c lu s io n s
d er iv ed from t h i s s tu d y may be d iv id e d in t o the fo l lo w in g four major
c a t e g o r i e s ; data management; d a ta p a t t e r n s ; model s e l e c t i o n , fu n c t io n ,
and l i m i t a t i o n s ; and en v iron m en ta l management u t i l i z i n g the model.
Data Management
C o n s i s t e n t l y throughout the s tu d y one o f th e major problems was
th a t o f d a ta management. A lthough d ata c o l l e c t i o n was g r e a t l y
f a c i l i t a t e d by the c o o p e r a t io n and i n t e r e s t o f the p erson n el in the
a g e n c ie s r e s p o n s ib le for c o l l e c t i o n and maintenance o f the data b a s e s ,
a c t u a l c o l l e c t i o n o f the data b a ses in v o lv e d in the s tudy was a t im e -
consuming p r o c e s s and o f t e n f r u s t r a t i n g . The major problems
encountered were:
1. P h y s ic a l d i s p e r s io n o f the data b a ses — There i s no c e n t r a l r e p o s i t o r y fo r the env iron m en ta l data o f the a re a . Each agency c o l l e c t i n g the v a r io u s typ es o f data must be c o n ta c te d to o b ta in th e d a ta . Not o n ly i s t h i s uneconom ical from a tim e s ta n d p o in t , i t i s a l s o i n e f f i c i e n t and unecomonic from the da ta adequacy s ta n d p o in t . Tvo main examples from t h i s study in v o lv e d

15:
t r a f f i c and mixing h e i g h t data . While the q u a l i t y o f the data was very high i t d id not provide in form atio n 1 ) d i r e c t l y r e l a t e d to ev e n t s at the sampling s i t e as with the t r a f f i c da ta or b) for time per iods corresponding to the sampling p er io d s as with the mixing h e i g h t data . In both c a s e s assumptions had to be made co ncerning data a p p l i c a b i l i t y . These were: 1) that the t r a f f i c dataob ta ined a t a s i t e not ad ja ce nt to e i t h e r sampling s i t e a d e q u a t e ly re p r e s e n t e d a c t u a l t r a f f i c p a t t e r n s a t each s i t e ; and 2 ) th a t the mixing h e i g h t data s u f f i c i e n t l y ex p re s s ed the study area i n v e r s i o n p a t te rn s and o c c u r r e n c e s . These two assumptions proved (by model v e r i f i c a t i o n ) to be v a l i d when a g g r e g a t io n s (a r i t h m e t i c monthly means) o f the da ta wore used; however, as shown in the model v e r i f i c a t i o n u s in g t r a f f i c data from in d iv id u a l sampling days , s u f f i c i e n t d i f f e r e n c e s e x i s t e d to preclude c o n s i s t e n t adequate model p r e d i c t i v e r e s u l t s .
2 . A c c e n tu a t io n o f m is s i n g v a lue e f f e c t s — In a l l three component da ta b a ses (TACB, THD, and NOAA) b locks o fm i s s i n g da ta occ urred . Often th ese b lo c k s o f data were for unsyncronized time p er io d s which n e c e s s i t a t e d v o id in g even more data and fu r t h e r reducing the master data base .The lack o f c o o r d i n a t i o n o f data b a s e s a l s o makes i td i f f i c u l t to determine the a c t u a l ca u s e s o f data q uan ti ty inadequacy ( m is s i n g v a l u e s ) .
3. L i m i t a t i o n s o f data parameters — Of the 16 parametersp r e s e n t in the th ree s e p a r a t e data b a ses c o l l e c t e d , on ly 5 o f t h e s e parameters were adequate for use in the s tudy. This i s not to say t h a t th e s e were the o n l y 5 parameters needed to a d eq uat e ly d eve lop an h e u r i s t i c s t a t i s t i c a l p r e d i c t i v e model o f CO ambient a i r l e v e l s in El Paso, i t s imply says th a t ap proximate ly only o n e - t h i r d o f the data parameters c o l l e c t e d can be u t i l i z e d in such a s tudy .C o l l e c t i o n and merging o f e x i s t i n g data b a s e s by a c e n t r a lagency or group would c e r t a i n l y 1 ) prov ide a more e f f i c i e n t p r o c e s s for data q u a n t i t y , q u a l i t y , adequacy, and r e l e v a n c e , 2 ) reduce redundancy and c o s t o f dataparameter c o l l e c t i o n procedures , and 3) prov ide a r e a d i l y a c c e s s i b l e , r e s p o n s i v e , and adequate data base to be used by a g e n c i e s r e s p o n s i b l e for o n - s i t e management o f env iron men ta l problems o f shor t and long- te rm nature .
4 . The sheer volume o f d a ta encountered — The very l a r g edata volumes encountered provided d i f f i c u l t i e s in dete rm in in g the s m a l l e s t l e v e l o f data a g g reg a t io n that cou ld be e f f e c t i v e l y used to e v a l u a t e CO b eh a v io ra l p a t t e r n s and model adequacy. A large p o r t i o n o f the time i n v o lv e d in the s tudy was devoted to f i n d i n g ways o f e f f e c t i v e l y managing t h e s e q u a n t i t i e s o f d a ta . This was

156
time th a t cou ld have been spent more p r o f i t a b l y in the data a n a l y s i s and i n t e r p r e t a t i o n o f t h i s or any other environmen ta l s tu dy o f a s i m i l a r nature .
From the da ta management s i t u a t i o n s encountered in t h i s s tudy
i t i s concluded th at:
1) P re s en t a i r p o l l u t i o n data base management p r a c t i c e s are u ncoord in ate d , i n e f f i c i e n t , and redundant.
2) The da ta base q u a n t i t i e s o f t e n obscure the data parameteradequacy from a q u a l i t a t i v e and q u a n t i t a t i v e s ta n d p o in t . Judgment concern in g the re le v a n c e o f the a v a i l a b l e c o l l e c t e d d a ta i s d i f f i c u l t in the face o f suchoverwhelming q u a n t i t i e s o f numbers. P h y s i c a l l y , such numbers p la c e the realm o f e f f e c t i v e data a n a l y s i se v a l u a t i o n and usage beyond the c a p a c i t y o f l o c a l a g e n c ie s th a t do not have or have a c c e s s to high speed computers.
3) I t i s no lo n g e r re a so n a b le in th e face o f suchoverwhelming numbers and com plex i ty o f data to exp ec t data management and a n a l y s i s to be conducted u s in g the " f i l i n g c a b i n e t and h a n d - c a l c u l a t o r or s l i d e r u l e " systems o f the p a s t .
4 ) I t i s not f e a s i b l e nor reasonab le to co n t i n ue to i n v e s t e x p e n d i t u r e s and time in data c o l l e c t i o n i f the r e s u l t i n g d a ta bases cannot be e f f e c t i v e l y managed for a n a l y s i s and subsequent usage i n the e v a l u a t i o n and s o l v i n g o f environmen ta l problems.
5 ) The da ta b a s e s fo r t h i s s tu dy , w h i l e c o n t a i n i n g la r g e volumes o f d a ta , n e v e r t h e l e s s , co n ta in ed data o f the q u a l i t y th at was s u i t a b l e on ly for an e x p l o r a t o r y study o f the p as t and e x i s t i n g CO ambient a i r l e v e l p r o f i l e s in El Paso . The p r e d i c t i v e c a p a c i t y o f the 20 term quadra t ic model as c o n t r a s t e d with r e s u l t s o f th e 5 terra model c l e a r l y i n d i c a t e s the com plex i ty o f i n t e r a c t i o n s , numbers o f parameters th a t c o n t r o l the environmental behavior o f CO, and p o s s i b l e e x i s t e n c e o f o th e r r e l e v a n t input parameters .
6 ) The la ck o f s t a n d a r d i z a t i o n in da ta c o l l e c t i o n , maintenance, a c c e s s , and r e t r i e v a l sys tem s reduced the e f f i c i e n c y o f the i n i t i a l phases o f the s tudy and n e c e s s i t a t e d a d d i t i o n a l communicat ions to conf irm data inp ut p r a c t i c e s .

157
Data Patterns nad Analysis
Based on Che r e s u l t s oE the d e s c r i p t i v e s t a t i s t i c s e lement o f
t h i s s tudy , the f o l l o w i n g comments and c o n c l u s i o n s can be drawn:
1) P r i o r to t h i s s tudy CO data p a t t e r n s were g e n e r a l l y assumed, however, no s y s t e m a t i c d e s c r i p t i v e s t a t i s t i c a l a n a l y s i s o f the e x i s t i n g CO data had been conducted. This study conf irms the d i s t i n c t e x i s t e n c e and p e r s i s t e n c e o f t h e s e p a t t e r n s over a period o f s i x y e a r s .
2) S tro n g , p e r s i s t e n t s e a s o n a l and d iu r n a l p a t t e r n s o fambient a i r CO l e v e l s e x i s t in E l Pa so . These CO p a t t e r n s are a l s o accompanied by s t r o n g t r a f f i c and m e t e o r o l o g i c a lparameter p a t t e r n s .
3) While t r a f f i c c o n t r i b u t e s appr ox im ately 8 6 % o f thee m is s i o n in v e n to r y input o f CO in El Paso, t h i s does not say th at t r a f f i c a l one i s r e s p o n s i b l e for the CO problemin El Paso . The i n t e r r e l a t e d parameter p a t t e r n se s t a b l i s h e d in the d e s c r i p t i v e s t a t i s t i c a l s e c t i o n and summarized i n F ig u re 46 c l e a r l y show the problem to be a r e s u l t o f both n a tu r a l and anth ropogen ic f a c t o r s .
4 ) CO l e v e l s are a t t h e i r h i g h e s t l e v e l s when botha n th rop ogen ic ( t r a f f i c ) parameters and na tu ra l phenomena (wind speed , te mperature , mixing h e i g h t , and t r a n s p o r t wind) are a t t h e i r optimum c o n d i t i o n s for adverse e f f e c t s on CO ambient a i r l e v e l s , i . e . , in c r e a s e d t r a f f i c volumes, low s u r f a c e and t r a n s p o r t wind sp eed s , low mixing h e i g h t s , and low te mperatu re s .
5) The la rg e numbers o f the p o s s i b l e com binat ions o f t h e s ef a c t o r s , i . e . , data o f the y e a r , month, day, and h o u r - ty p e , p r e s e n t a s u f f i c i e n t range o f v a r i a t i o n to make da ta a n a l y s i s a t t h i s l e v e l d i f f i c u l t , and o f t e n produces m i s l e a d i n g r e s u l t s , p a r t i c u l a r l y in the presenc e o f la rg e numbers o f m i s s i n g d a ta . These problems may be overcome to a l arge degree by the use o f a r i t h m e t i c monthly mean aver ages on a y e a r l y or h o u r ly b a s i s which "smooths" the d a t a , as seen in the re d u c t io n o f the sum o f squares s i z e , and a l l o w s the da ta p a t t e r n s to emerge more c l e a r l y .
6 ) Further s t r e n g t h i s added to the c a s e for u s in g a r i t h m e t i c monthly mean averages (by year or hour ) when one c o n s i d e r s the warning a g a i n s t the use o f i n d i v i d u a l data p o i n t s as i s s u e d in the Texas A ir Contro l Board SIP for CO (TACB, 1 979a) .

Month A B Ao f th e _!----------------------1-----------------------------------------------------------------------------------------1--------------------------------------j
Year , 2 3 4 5 6 7 8 9 10 11 12
1 2 3 4 5 6 7 8 9 10 11 12 13 14 15 16 17 18 19 20 21 22 23 24
Midnight Noon Midnight
CO WS T TR MH LYRA + 4 4 4 4 4
B 4 4 4 4 4 4
C 4 4 4 4 4 4
D + 4 4 4 tY 4
E 4 4 4 4 t 4
F ig u re 46 . CO Am bient A ir L e v e l , T r a f f i c , and M e te o ro lo g ic a l P a t t e r n s
cc

159
7) M iss ing da ta problems may a l s o be minimized by u s in g CO a r i t h m e t i c monthly mean a v e r a g e s , thus a l low ing longer t ime p er io d s to be used in the data a n a l y s i s .
8 ) U h i l e c e r t a i n parameters o f the data base , such as wind d i r e c t i o n , t ime , and g e o g r a p h ic a l l o c a t i o n , are not s c a l a r and thus are prec luded for use in a c t u a l model c a l c u l a t i o n s , they may s t i l l be incorp ora te d i n t o model usage by the c o n d i t i o n i n g p r o c e s s . The c o n d i t i o n i n g p r o c e s s used in da ta management p ro v ides a f l e x i b l e and r e s p o n s i v e t o o l for data a n a l y s i s and i n t e r p r e t a t i o n . C o n d i t io n in g o f the da ta a l s o i s the on ly method whereby s c a l a r and n o n - s c a l a r types o f parameters can be ev a lu a ted s i m u l t a n e o u s l y .
H e u r i s t i c S t a t i s t i c a l Models
Two h e u r i s t i c s t a t i s t i c a l CO p r e d i c t i v e models were developed
in t h i s s tudy . The f i r s t model deve loped was a 20 -t erm q uad rat ic model
c o n s i s t i n g o f l i n e a r , q u a d r a t i c , and c r o s s - p r o d u c t terms e x p r e s s in g the
l e v e l o f a c t i v i t y and i n t e r a c t i o n s o f the f i v e inp ut parameters used in
the GLM. Table 37 g i v e s a summary o f the d e s c r i p t i o n , u sa g e ,
ad v a nta g es , and l i m i t a t i o n s o f t h i s model . The second model was a
g e n e r a l l i n e a r type model (GLM) for use in a g r o s s p r e d i c t i v e c a p a c i t y .
This model i s a 5 - t erm g e n e r a l l i n e a r model u t i l i z i n g the a r i t h m e t i c
monthly mean parameters o f wind speed, temperature , t r a f f i c , mixing
h e i g h t , and t r a n s p o r t wind to p r e d i c t the a r i t h m e t i c monthly means o f
CO ambient a i r c o n c e n t r a t i o n s under c i rc u m s ta n ces s p e c i f i e d in the
c o n d i t i o n i n g p r o c e s s . The p r e d i c t i v e accuracy o f t h i s model i s q u i t e
comparable to th a t o f the f i r s t model . The GLM equati on usage ,
advanta ges and l i m i t a t i o n s are summarized in Table 37. This model
should always be used e i t h e r p r i o r to or in c o n j u n c t i o n wi th the more
complex model to: 1 ) prov ide an i n i t i a l s c r e e n in g and f i l t e r i n g
p r o c e s s for data a n a l y s i s and management; 2 ) pro vide a rapid method o f

Table 37. Summary Comparisons of the GLM and QM
Parameter G/M
5-term general l i n e a r
QM
2 0 - term quadrat ic
P r e d i c t i v e 1 . Good 1 . B e t t e rca p a c i ty 2. Rapidly shows trends in 2 . P r e d i c t s w e l l f o r p er io d s
the data over time per iods o f approximately 12 monthso f approximately 12 months
3. P r e d i c t s s l i g h t l y h ig h er than 3. P r e d i c t s s l i g h t l y lower tha:a c t u a l a c t u a l
Appearance D e c e p t iv e ly s imple I n t im ida t in g
Manual E a s i l y accomplished Cumbersome but notc a l c u l a t i o n s im p oss ib le
R e su l ts 1 . Requires exper ienced per 1 . Requires experienced h ig h l yi n t e r p r e t a t i o n sonne l w i th b a s i c knowledge s k i l l e d personnel wi th an
o f s t a t i s t i c s advanced knowledge o f s t a t i s t i c s
2 . Uncomplicated 2 . More complex3. Accomplished ra t he r q u ick ly 3, Requires longer time period
Performance Moderate S l i g h t l y above moderateco s t
Condit ioning S e n s i t i v e Increased s e n s i t i v i t yresponse
c\o

1 6 1
s h o r t and long- term ambient a i r CO c o n c e n t r a t i o n behavior ; and
3) prov ide a s i m i l a r , rapid method o f c a l i b r a t i o n for the more
e l a b o r a t e model. The f o l l o w i n g g e n e r a l comments and c o n c l u s i o n s
con cern in g the models can be drawn:
1) N e i t h e r model i n c l u d e s the complete component o fparameters th a t compose the t o t a l input o f f a c t o r sa f f e c t i n g CO ambient a i r l e v e l s in El Pa so , nor should they be co n s ide red the d e f i n i t i v e word in CO ambient a i r c o n c e n t r a t i o n model ing in El Paso. They ar e , however, the two b e s t models th a t could be developed on the b a s i s o f a v a i l a b l e input data .
2) D e s p i t e the l i m i t a t i o n s o f each model, both models do tend to p r e d i c t w e l l for p e r io d s o f one year the CO ambient a i r c o n c e n t r a t i o n s .
3) Given the volume o f input data n e i t h e r model cou ld have been developed or c a l i b r a t e d w i th ou t the use o f a h ig h speed computer.
4 ) Once the models were c a l i b r a t e d and parameter r e g r e s s i o n c o e f f i c i e n t s were o b ta i n e d , c a l c u l a t i o n s were e i t h e r model could be done u s in g manual methods in the absence o f a h ig h - s p e e d computer t o a ch iev e re asonab ly a cc u r a te p r e d i c t i o n s for CO ambient l e v e l s to be encountered i n the n ext y e a r . The usage o f both models i s t h e r e f o r e c o s t e f f e c t i v e , i n e x p e n s i v e , ra p id , and does not r e q u i r e the use o f h i g h l y s k i l l e d or t e c h n i c a l l y s o p h i s t i c a t e d p ers o n n e l in the prod uc t i on or i n t e r p r e t a t i o n o f c e r t a i n f a c e t s o f r e s u l t i n g o u t p u t s once the i n i t i a l p a r t i a l r e g r e s s i o n c o e f f i c i e n t s have been determined.
5) Both g e n e r a l model forms may be adapted for use in o th er g e o g r a p h ica l l o c a t i o n s . On the b a s i s o f input raw d ata , u s in g the 5 b a s i c a i r p o l l u t i o n inp u t parameters new parameter r e g r e s s i o n c o e f f i c i e n t s may be o b ta in e d for s u b s t i t u t i o n i n t o the g en er a l eq u a t io n form o f e i t h e r model thus p ro v id in g the same b a s i c model s t r u c t u r e for the new area. This c o n c l u s i o n i s drawn on the b a s i s o f c o n d i t i o n i n g done fo r both s i t e s . While the models performed b e t t e r a t one s i t e ( s i t e 28) Chan a t Che o t h e r , n e v e r t h e l e s s , both models — the GLM and QM — were found to be adequate for e i t h e r s i t e . Of c o u r s e , model p r e d i c t i v e c a p a c i t y can be improved by s u b s t i t u t i o n o f parameter r e g r e s s i o n c o e f f i c i e n t s found to be s i t e - s p e c i f i c r a th e r than th o se obta ined u s i n g raw input data for a l l s i t e s and c o n d i t i o n s combined.

162
6 ) E v a l u a t i n g the e s t i m a t e s (parameter r e g r e s s i o n c o e f f i c i e n t s ) found for each model , i t was determined that parameters d e r iv e d from n a t u r a l f o r c e s , i . e . mixing h e i g h t , wind speed , e t c . , ra t h e r than parameters o f anth ropogen ic o r i g i n , i . e . t r a f f i c , provided the g r e a t e r v a l u e s thus i n d i c a t i n g th a t th ese parameters c o n t r i b u t e more to the models than t r a f f i c .
7) E i t h e r model p ro v id e s an e f f e c t i v e and r e d u c e d - c o s t method o f s t u d y in g parameter r e l a t i o n s h i p s and i n t e r a c t i o n s a s s o c i a t e d wi th CO ambient a i r c o n c e n t r a t i o n s in El Paso. This model f e a t u r e i s c o n s t r a i n e d , however, by the fa c t t h a t h i g h l y t r a i n e d , e x p e r ie n c e d , and s p e c i a l i z e dp erso n n e l are needed for r e s u l t i n t e r p r e t a t i o n s .
8 ) The parameter r e g r e s s i o n c o e f f i c i e n t s for both modelsshould be r e - e v a l u a t e d a t l e a s t once ev ery year on raw inp ut data to c o r r e c t for p o s s i b l e data trend adverse i n f l u e n c e s on the models ' p r e d i c t i v e c a p a c i t i e s .
9 ) N e i t h e r model f u n c t i o n s w e l l g i v e n i n d i v i d u a l c a s e ( i . e . y ea r , day, month, hour) d a ta s i n c e the models were d eve loped on the b a s i s o f smoothed data; they do not handle w e l l data t h a t e x h i b i t s wide d e v i a t i o n s from parameter mean v a l u e s .
10) Given th e inp ut o f >1 m i l l i o n p i e c e s o f raw data asen countered in the combined data b a s e s used in t h i s s tu d y , i t would be u n r e a l i s t i c to t r y to d eve lop e i t h e r model( p a r t i c u l a r l y w i th r e s p e c t to the parameter r e g r e s s i o n c o e f f i c i e n t s ) w i t h o u t the use o f a h ig h - s p e e d computer.
11) A v a r i e t y o f types o f gra ph ic p r e s e n t a t i o n s o f the d e s c r i p t i v e s t a t i s t i c s are needed t o a id i n model development and m oni to r ing o f the raodel(s) p r e d i c t i v e c a p a c i t y .
Environmental Management
Based on the r e s u l t s o f t h i s s tu d y , the f o l l o w i n g comments and
c o n c l u s i o n s r e l a t i v e to environmen ta l management can be drawn:
1) E f f e c t i v e management o f CO ambient a i r l e v e l s in E l Pasow i l l depend on: 1 ) i d e n t i f i c a t i o n o f the environmentalparameters h av in g major impacts on t h e s e l e v e l s ; 2 ) e v a l u a t i o n o f CO ambient a i r l e v e l p a t t e r n s e x h i b i t e d under s p e c i f i e d c o n d i t i o n s con cern in g geography, t ime , em is s i o n in v e n t o ry i np u t , and m e t e o r o l o g i c a l c o n d i t i o n s ;3) a cc u r a te p r e d i c t i o n o f CO ambient a i r l e v e l s th a t w i l l

163
occur under s p e c i f i e d environmental c o n d i t i o n s ; and 4 ) the development o f a r e a l i s t i c s i t u a t i o n management program t l iat i s a c c e p t a b le to the p o pu la t io n o f the a f f e c t e d area (E l Paso) and s c i e n t i f i c a l l y d e f e n s i b l e . E i t h e r o f the two models deve loped w i l l acc omplish or lead to the accomplishment o f t h e s e four g o a l s s i n c e both models have i d e n t i f i c a t i o n - d i a g n o s t i c , p r e d i c t i v e , and guidance c a p a c i t i e s . These c a p a c i t i e s are f u r t h e r f o r t i f i e d and a m p l i f i e d when accompanied by the d e s c r i p t i v e s t a t i s t i c s n e c e s s a r y fo r the development o f the m ode ls .
2) To answer a q u e s t i o n as s e n s i t i v e and important as the oneco n cern in g the c o n t r i b u t i o n or lack o f c o n t r i b u t i o n o f J u a rez , Chihuahua, Mexico to the CO ambient a i r l e v e l s in El Paso, Tex as , USA, the f o l l o w i n g are needed: a) a c t u a l ,adequate data from Juarez ; b) more c o n d i t i o n i n g r e s u l t s u s in g e i t h e r o f the two models dev elop ed in t h i s s tudy combined with an i n - d e p t h i n t e r p r e t a t i o n o f th o se r e s u l t s ; o r , f a i l i n g in the a t ta in m ent o f # 2 - a , the p r e d i c t i v e r e s u l t s ob ta ined u s in g the models develop ed for El Paso c o u ld be u t i l i z e d to s i m u la t e a CO ambient a i r c o n c e n t r a t i o n p r o f i l e fo r that c i t y and s i m u l t a n e o u s l y co n f irm model a p p l i c a t i o n e f f e c t i v e n e s s by concu rr en t CO t e s t i n g .
3 ) By the use o f th e two deve loped m od el s , e i t h e r s i m u l t a n e o u s l y or s e p a r a t e l y , in environmen ta l s c e n a r io p r o d u c t io n , p u b l i c l y a c c e p t a b l e , e f f i c i e n t and e f f e c t i v e methods o f CO ambient a i r c o n c e n t r a t i o n c o n t r o l can be d e v i s e d and implemented.
General Co nclu sions
The g e n e r a l c o n c l u s i o n s from t h i s s tu dy a re :
1. The two major g o a l s o f t h i s s tudy have been a t t a i n e d . Those were: a) the examinat ion and s ta te m en t o f the h i s t o r i c a l and p res e n t CO ambient a i r c o n c e n t r a t i o n p r o f i l e s and p a t t e r n s by the u se o f d e s c r i p t i v e s t a t i s t i c s ; and b) development o f an h e u r i s t i c s t a t i s t i c a l model to p r e d i c t ambient a i r l e v e l s o f carbon monoxide in E l Paso, Texas , and i d e n t i f y the env iron men ta l parameters p r o v i d i n g the major i m p a c t ( s ) on t h es e l e v e l s .
2 . There i s a need for an improved method o f raw d ata a c c e s s t o f a c i l i t a t e and encourage maximum u t i l i z a t i o n o f the d a ta a f t e r c o l l e c t i o n .

16.'.
3. While the data used in t h i s s tudy was adequate to produce two h e u r i s t i c s t a t i s t i c a l models to p r e d i c t CO ambient a i r c o n c e n t r a t i o n s in El Paso, the need for a d d i t i o n a l types o f da ta i s i n d i c a t e d . These types o f data inc lud e sampling s i t e t r a f f i c counts corresponding to the sampling regime employed at the s i t e , and more d e t a i l e d , d i v e r s e m e t e o r o l o g i c a l data .
4 . The data bases used in the s tudy were s u f f i c i e n t to e s t a b l i s h the presence and p e r s i s t e n c e o f s t rong s e a s o n a l and d iu r n a l p a t t e r n s for carbon monoxide ambient a i r l e v e l s in El Paso.
5 . Although both models can adequate ly p r e d i c t a r i t h m e t i c monthly mean ambient a i r c o n c e n t r a t i o n s o f CO, the l a r g e r model a t t a i n s b e t t e r p r e d i c t i v e c a p a c i t y u s in g r e s u l t s as p r e d i c t i v e c a p a c i t y c r i t e r i a . Using the two yea rs o f data used for v e r i f i c a t i o n o f the model and c a l c u l a t i n g r2, an r2 o f 0 .6 8 1 2 was obta ined for the QM and 0 .5 9 1 9 for the GLM.
6 . The use o f the d e s c r i p t i v e s t a t i s t i c a l a n a l y s i s r e s u l t s and the p r e d i c t i v e c a p a c i t y o f the models produced in t h i s s tudy pro v ide a s y s t e m a t i c , e f f i c i e n t , and e f f e c t i v e method for ambient a i r q u a l i t y management with r e s p e c t to CO c o n c e n t r a t i o n s .
7 . While t r a f f i c prov ide s 8 6 % o f the anthropogen ic source e m is s i o n s in the s tudy area , the major f a c t o r s i n f l u e n c i n g CO ambient a i r l e v e l s are m e t e o r o l o g i c a l ( i . e . n a tu r a l f a c t o r s ) .
8 . A d d i t i o n a l d e t a i l e d s t u d i e s are i n d i c a t e d f o r thef o l l o w i n g major a rea s : a) CO ambient a i r c o n c e n t r a t i o np a t t e r n s , b) e l a b o r a t i o n o f both models , c ) a p p l i c a t i o n o f the t e c h n iq u e s used in t h i s s tudy to i n v e s t i g a t e o th er a i r p o l l u t a n t s found i n E l Paso and t h e i r p o s s i b l e i n t e r a c t i o n s .

165
CITED REFERENCES
A f i f i , A.A. and Azen, S . P . , S C a C i s t i c a l A n a l y s i s - A Computer O rien ted Approach, Academic P r e s s , New York, Now York, 1972.
Anderson, E.W., e t a l . , " E f f e c t o f Low-Level Carbon Monoxide Exposure on Onset and Durat ion o f Angina P e c t o r i s " , Annal o f I n t e r n a l M e d ic in e , V ol . 79, No. 1, 1973, pp. 4 6 - 5 0 .
A n g e l l , J .K. and B e r n s t e i n , A . B . , "Flow Across an Urban Area Determined from D o u b le -T h e o d o l i t e P i l o t B a l lo o n O bserv at ions", Journal o f Appl ied Me t e o r o l o g y , Vol . 14, S ep t . 1975, pp. 1072-1079.
A pple gate , H.G., Environmental Problems o f the B o rd er la n d s , Texas Western P r e s s , El Pa so , Texas , 1979.
A pple gate , H.G. and Bath, C . R . , A ir P o l l u t i o n Along the United S t a t e s - Mexico Border — Contaminacion d e l Aire a l o Largo de la Frontera Mexico-Estado u n i d e n s e , Texas Western P r e s s , El Paso, Texas , 1974.
Aron, R.H. and Aron, I . , " S t a t i s t i c a l F o r e c a s t i n g Models; 1. Carbon Monoxide C o n ce ntra t io n s in th e Los Angel es Bas in" , Journal o f the A ir P o l l u t i o n Control A s s o c i a t i o n , V o l . 25 , 1978, pp. 68 1-6 84 .
Aronow, W.S. , F e r l i n z , J . and Glauser , F . , " E f f ec t o f Carbon Monoxide on E x e r c i s e Performance in Chronic O b s t r u c t i v e Pulmonary D i s e a s e " , American Journal o f M e d ic in e , V o l . 6 3 , Dec. 1977, pp. 90 4-9 08 .
Aronow, W.S. , Stemmer, E.A. and I s b e l l , M.W., " E f f e c t o f Carbon Monoxide on I n t e r m i t t e n t C l a u d i c a t i o n " , C i r c u l a t i o n , V ol . XLIX, Mar. 1974, pp. 4 1 5 -4 1 7 .
Anonymous, Texas Almanac, A.H. Be lo Cor porat ion, D a l l a s , Texas , 1979.
Auer, A.H. , J r . , "C o rre la t io n o f Land Use and Cover w i th M e t e o r o lo g i c a l Anomalies", Journal o f Appl ied M e teo r o lo g y , V ol . 17, May 1978, pp. 6 36- 643.
Baerwald, J . E . , ( e d i t o r ) . T r a n s p o r t a t io n and T r a f f i c E n g in ee r in g Handbook, P r e n t i c e - H a l l , I n c . , Engelwood C l i f f s , New J e r s e y , 1976.
Bard, Y . , NonTinear Parameter E s t i m a t i o n , Academic P r e s s , New York, New York, 1974.
Barry, R.G. and Chor ley, R . J . , Atmosphere, Weather, and C l i m a t e , Third E d i t i o n , Methuen and Company, L t d . , London, England, 1978,
Beard, R.R. and Wertheim, G.A. , "Behavioural Impairment A s s o c i a t e d w i th Small Doses o f Carbon Monoxide", American Journa l o f P u b l i c H e a l t h , V o l . 57 , 1967, pp. 201 2-20 22 .
164

166
Bcn ario , M.M., Urban A ir P o l u t i o n Model ing , The MIT P r e s s , Cambridge, M a ssa c hu se t t s , 1980.
B cn ca la , K.E. and S e i n f e l d , J . H . , "On Frequency D i s t r i b u t i o n s o f Air P o l l u t i o n C o n ce ntr a t io n s" , Atmospheric Environment , V ol . 10, 1976, pp.941 -950 .
Berthouex, P.M. and Hunter, W.C., "Simple S t a t i s t i c s for I n t e r p r e t i n g Environmental Data", Journ al o f Water P o l l u t i o n Contro l F e d e r a t i o n , Vol . 53 , No. 2 , Feb. 1981, pp. 167-175.
B o i l l o t , M. , Understanding F o r t r a n , West P u b l i s h i n g Company, S t . Pau l , Minnesota , 1978.
Box, G.E.P. and T iao , G .C . , Bayesian I n f e r e n c e in S t a t i s t i c a l A n a l y s i s , Addison-Wesley P u b l i s h i n g Company, Reading M a s s a c h u s e t t s , 1973.
B r i c e , R.M. and R o e s s l e r , J . F . , "The Exposure to Carbon Monoxide o fOccupants o f V e h i c l e s Moving in Heavy T r a f f i c " , Jo urn al o f the Air P o l l u t i o n Control A s s o c i a t i o n , V ol . 16, 1966, pp. 597 -6 00 .
Brown, G.DeW., System 370 Job Contro l Language, John Wiley & Sons, I n c . , New York, New York, 1977.
Browne, N .E . , "A S im u la t io n Model for A ir P o l l u t i o n Over C o n n ect icu t" , Journal o f A ir P o l l u t i o n Con trol A s s o c i a t i o n , V o l . 19, No. 8 , Aug. 1969, pp. 5 7 0-5 74 .
B u l l i n , J . A . , Green, N.J . and P o l a s e k , J . C . , "Determinat ion o f V e h i c l e Emiss ion Rates from Roadways by Mass Balance Techniques" , Environmental S c ie n c e and Tec hno logy , Vol . 14 , No. 6 , June 1980, pp. 700- 70 5.
B u t l e r , J . D . , A ir P o l l u t i o n Ch em is try , Academic P r e s s , New York, New York, 1979.
Clean Air Act Amendments o f 1970, PL 9 1 -6 4 0 .
Clean A ir Act Amendments o f 1977, PL 9 5 - 9 5 , 91 S t a t . 685, 42 USC 7401.
Cadle , R.D. and A l l e n , E . R . , "Atmospheric Photoch em is try", S c i e n c e , V o l . 167, No. 3916, Jan. 16, 1970, pp. 24 3-2 49 .
Carpenter , A . B . , True, D.K. and S tanek , E . J . , "Leaf Burning as a S i g n i f i c a n t Source o f Urban A ir P o l l u t i o n " , Journal o f the A ir P o l l u t i o n Control A s s o c i a t i o n , V ol . 27 , No. 6 , June 1977, pp. 57 4-5 76 .
Chang, T .Y . , Norbeck, J.M. and Weinstock, B . , "Ambient Temperature E f f e c t on Urban CO Air Q u a l i ty " , Atmospheric Environment , V ol . 14, 1980a, pp. 6 0 3 -6 08 .
167
Chniig, T . Y . , Norbeck, J.M. and Weinstock, lî. , "Urban-Center CO Air Q u a l i ty P r o j e c t i o n s " , Jo urn al o f the A ir P o l l u t i o n Control A s s o c i a t i o n , V ol . 30, No. 9 , S ep t . 1980b, pp. 1022-1025 .
Chang, T.Y. and Weinstock, B . , "Urban CO C o n centra t io n s and V e h i c l e Emiss ion", Journal o f A ir P o l l u t i o n Co ntro l A s s o c i a t i o n , V ol . 23, No.8 , Aug. 1973, pp. 6 9 1 -6 9 6 .
Chang, T.Y. and Weinsto ck , B . , "Genera l i zed Rol lback Model ing f o r Urban A ir P o l l u t i o n C ontro l" , Journ al o f the A ir P o l l u t i o n Control A s s o c i a t i o n , V ol . 25 , No. 10, Oct . 1975, pp. 1033-103 7.
C h a n le t t , E . T . , Environmental P r o t e c t i o n , McGraw H i l l Book Company, New York, New York, 1973.
Chock, O . P . , e t a l . , " E f f e c t o f NO, Emiss ion Rates on Smog Formation in the C a l i f o r n i a South Coast A ir Bas in" , Environmental S c i e n c e and T ech n o lo g y , V ol . 15, No. 8 , Aug. 1981, pp. 9 3 3 -9 3 9 .
Chock, D . P . , T e r r e l l , T.R. and L e v i t t , S . B . , "Tim e-S er ies A n a l y s i s o f R i v e r s i d e , C a l i f o r n i a A ir Q u a l i t y Data", Atmospheric Environment , Vol .9 , 1975, pp. 97 8-9 89 .
C l a g g e t t , M. , Shrock, J . and N o l l , K .E . , "Carbon Monoxide Near an Urban I n t e r s e c t i o n " , Atmospheric Environment , Vol . 15, No. 9 , 1981, pp. 1633- 1642.
Clayto n , G .D . , Cook, W.A. and F r e d r i c k , W.G., "A Study o f the R e l a t i o n s h i p o f S t r e e t L e v e l Carbon Monoxide C on centr a t i on s to T r a f f i c A c c i d e n t s " , American I n d u s t r i a l Hygiene J o u r n a l , V ol . 21 , 1960, pp. 4 6 - 54.
C o l l i n s , J . J . , Kasap, H.S. and H ol la nd , W.W., "Environmental F a c t o r s in Child M o r t a l i t y in England and Wales", American Journ al o f E p id em io lo g y , Vol . 93 , No. 1 , 1971, pp. 10-22.
C o l w i l l , D.M. and Hickman, A . J . , "Exposure o f D r iv e rs to Carbon Monoxide", Journa l o f Air P o l l u t i o n Con tro l A s s o c i a t i o n , V ol . 30 , No. 12, Dec. 1980, pp. 13 16 -1 319 .
Conover, W .J . , P r a c t i c a l Nonparametric S t a t i s t i c s - S e c o n d E d i t i o n , John Wiley & Sons , New York, New York, 1980.
Cordasco, E.M. and Van Ordstrand, H . S . , "Air P o l l u t i o n and COPD", Post graduate M e d ic in e , V o l . 62 , No. 1 , J u ly 1977, pp. 124-127 .
Counihan, J . , "A diabat i c Atmospheric Boundary Layers : A, Review andA n a l y s i s o f Data from the P er io d 188 0-197 2" , Atmospheric Environment , V o l . 9 , 1975, pp. 8 7 1 -9 0 5 .

1 6 8
CRC Handbook oC Environmental Co ntrol : Volume I - A ir P o l l u t i o n , CRCP r e s s , I n c . , Boca Raton, F l o r i d a , 1972.
Csanady, G .T . , "Crosswind Shear E f f e c t s on Atmospheric D i f f u s i o n " , Atmospheric Environment , Vo l . 6 , 1972, pp. 2 21-2 32 .
Dabberdt, W.F. , Ludwig, F.L, and Johnson, W.B. , J r . , " V a l i d a t i o n and A p p l i c a t i o n s o f an Urban D i f f u s i o n Model f o r V e h icu la r P o l l u t a n t s " , Atmospheric Env ironment , V o l . 7 , 1973, pp. 60 3 -6 1 8 .
D a n i e l , C. and Wood, F . S . , F i t t i n g Equations to D a ta , John Wiley &Sons , I n c . , New York, New York, 1971.
D a n i e l , C. and Wood, F . S . , F i t t i n g Equations to Data - Second E d i t i o n , John Wiley and Sons, New York, New York, 1980.
D a v is , D .D . , Payne, W.A, and S t i e f , L . J . , "The Uydroperoxyl Rad ica l in Atmospheric Chemical Dynamics; R e a c t io n with Carbon Monoxide", S c i e n c e , Vo l . 179, Jan. 19, 1973, pp. 2 80-2 82 .
Derwent, R.G. and Hou, 0 . , "Computer Model ing S t u d i e s o f the Impact o fV e h i c l e Exhaust Emiss ion C o n tro l s on Ph otochemica l A ir P o l l u t i o n Formaton in the U nited Kingdom", Environmental S c i e n ce and T ech n o lo g y , V o l . 14 , No. 11, 1980, pp. 136 0-136 6.
Draper, N.R. and Smith, H . , Appl ied R e g r e s s i o n A n a l y s i s , John Wiley &Sons, I n c . , New York, New York, 1966.
Edwards, J . B . , Combustion - Formation and Emiss ion o f Trace S p e c i e s , Ann Arbor S c i e n c e , Ann Arbor, Michigan, 1974.
Gether, J . and S e i p , H.M., "A na ly s i s o f A i r P o l l u t i o n Data by the Combined Use o f I n t e r a c t i v e Graphic P r e s e n t a t i o n and a C l u s t e r i n g Technique", Atmospheric Environment , Vo l . 13 , 1979, pp. 8 7 -9 6 .
Godin, G . , Wright , G. and Shephard, R . J . , "Urban Exposure to Carbon Monoxide", A r ch iv es o f Environmental H e a l t h , Vol . 25 , 1972, pp. 305-313.
Goldman, A . , e t a l . , " V e r t i c a l D i s t r i b u t i o n o f CO in the Atmosphere", Jou rn al o f Geophys ica l R ese arch , Vo l . 78 , No. 24, Aug. 20, 1973, pp. 5 273-5 2 8 3 .
G o l d s t e i n , I . F . and Dulberg , E .M ., "Air P o l l u t i o n and Asthma: Searchfo r a R e l a t i o n s h i p " , Journ a l o f A i r P o l l u t i o n Contro l A s s o c i a t i o n , Vol . 31, No. 4 , Apr. 1981, pp. 37 0-3 75 .
Green, N . J . , B u l l i n , J .A . and P o l a s e k , J . C . , " D is p ers io n o f Carbon Monoxide from Roadways a t Low Wind Speeds", Journa l o f the Air P o l l u t i o n C ontrol A s s o c i a t i o n , V o l . 29 , No. 10, Oct. 1979, pp. 1057- 1061.

169
CRC Handbook o f Environmo.ntnl Control; Volume I - A ir P o l l u t i o n , CRC P r e s s , I n c . , Boca Raton, F l o r i d a , 1972.
Csanady, G . T . , "Crosswind Shear E f f e c t s on Atmospheric D i f f u s i o n " , Atmospheric Environment , V ol . 6 , 1972, pp. 221 -2 32 .
Dabberdt, W.F., Ludwig, F.L. and Johnson, W.B., J r . , " V a l id a t io n and A p p l i c a t i o n s o f an Urban D i f f u s i o n Model for V e h icu la r P o l l u t a n t s " ,Atmospheric Environment , Vol . 7 , 1973, pp. 6 0 3 -6 18 .
D a n i e l , C. and Wood, F . S . , F i t t i n g Equations to D ata , John Wiley &Sons, I n c . , New York, New York, 1971.
D a n i e l , C. and Wood, F . S . , F i t t i n g Equations to Data - Second E d i t i o n , John Wiley and Sons, New York, New York, 1980.
D a v i s , D .D . , Payne, W.A. and S t i e f , L . J . , "The Uydroperoxyl Rad ical in Atmospheric Chemical Dynamics: React ion wi th Carbon Monoxide",S c i e n c e , V ol . 179, Jan. 19, 1973', pp. 280-282.
Derwent, R.G. and Hou, 0 . , "Computer Model ing S tu d ie s o f the Impact o fV e l i i c l e Exhaust Emiss ion C ontr o l s on Photochemical A ir P o l l u t i o n Formaton in the United Kingdom", Environmental S c ien ce and Techno logy , Vol . 14, No. 11, 1980, pp. 1360-1366.
Draper, N.R. and Smith, H, ,, Appl ied R e gress ion A n a l y s i s , John Wiley & Sons , I n c . , New York, New York, 1966.
Edwards, J . B . , , Combustion - Formation and Emiss ion o f Trace S p e c i e s , Ann Arbor S c i e n c e , Ann Arbor, Michigan, 1974.
Gether, J . and S e i p , H.M. , "A na lys is o f A ir P o l l u t i o n Data by the Combined Use o f I n t e r a c t i v e Graphic P r e s e n t a t i o n and a C l u s t e r i n g Technique", Atmospheric Environment, Vol . 13, 1979, pp. 8 7 - 9 6 .
Godin, G . , Wright, G. and Shephard, R . J . , "Urban Exposure to Carbon Monoxide", Arch ives o f Environmental H e a l t h , V ol . 25 , 1972, pp. 305- 313.
Goldman, A . , e t a l . , " V e r t i c a l D i s t r i b u t i o n o f CO in the Atmosphere", Journal o f Geophys ical R e se a rc h , Vol . 78 , No. 24, Aug. 20, 1973, pp. 527 3-528 3.
G o l d s t e i n , I . F . and Dulberg, E.M., "Air P o l l u t i o n and Asthma: Searchfo r a R e la t io n s h ip " , Journal o f A ir P o l l u t i o n Control A s s o c i a t i o n , V ol . 31, No. 4 , Apr. 1981, pp. 370-37 5 .
Green, N . J . , B u l l i n , J .A . and P o l a s e k , J . C . , " D is p ers io n o f Carbon Monoxide from Roadways a t Low Wind Speeds", Journal o f the Air

170
Green, A . E . S . , e t a l . , "Product ion oC Carbon Monoxide by Charged P a r t i c l e D e p o s i t i o n " , Journal o f Geophys ical R e se a rch , V ol . 78 , No. 24, Aug. 20, 1973, pp. 5284-52
Grossman, R.L. and Ecran, D.W., "An I n v e s t i g a t i o n o f Extreme Low-Level Wind Shear a t S e l e c t e d S t a t i o n s in the Conterminous United S t a t e s " , Journal o f Appl ied Met e o r o l o g y , Vol . 14, June 1975, pp. 506-512.
l laagenson, P . L . , " M ete o ro lo g ica l and C l i i n a t o lo g i c a l F a c t o rs A f f e c t i n g Denver Air Q ual i ty " , Atmospheric Environment , V ol . 13, 1979, pp. 79 -8 5 .
H i r t z e l , C.S. and Quon, J . E . , "Time S e r i e s C h a r a c t e r i z a t i o n o f Continuous Carbon Monoxide Measurements", 7 1 s t Annual Air Po l l u t i o n Control A s s o c i a t i o n M e et in g , A ir P o l l u t i o n Control A s s o c i a t i o n , P i t t s b u r g h , P e n n sy lv a n ia , June 1978.
Honigman, B . , Cromer, R. and Kurt, T . L . , "Carbon Monoxide L e v e l s in A t h l e t e s During E x e r c i s e in an Urban Environment", Journal o f the Air P o l l u t i o n Control A s s o c i a t i o n , V ol . 32 , No. 1, Jan. 1982, pp. 77 -7 9 .
l losko, M .J . , "The E f f e c t o f Carbon Monoxide on th e V i s u a l Evoked Response in Man", A rch iv es o f Environmental H e a l t h , V o l . 21, 1970, pp. 174-180.
Hubert, J . S . , "Ambient A ir L e v e l s o f T o t a l Suspended P a r t i c u l a t e s , Lead, Z inc , Cadmium, and A rsen ic in E l Pa so , Texas", M a s t er ' s T h e s i s , U n i v e r s i t y o f Texas a t E l Paso, El Pa so , Texas , Aug. 1979.
Husar, R .B . , e t a l . , "Three-Dimensional D i s t r i b u t i o n o f A ir P o l l u t a n t s in the Los Angeles Bas in " , Journa l o f Appl i ed M e teo ro lo g y , V ol . 16, Oct. 1 9 / 7 , pp. 1089-1096.
Inman, R . E . , I n g e r s o l l , R.B. and Levy, E .A . , " S o i l : A Natural S ink for Carbon Monoxide", S c i e n c e , V ol . 172, June 18, 1971, pp. 1229-1231.
J a f f e , L . S . , "Sources , C h a r a c t e r i s t i c s , and Fa te o f Atmospheric Carbon Monoxide", Annals o f New York Academy o f S c i e n c e s , V ol . 174, 1970, pp. 76-8 8 .
J a f f e , L . S . , "Carbon Monoxide in the B iosp here : S our ces , D i s t r i b u t i o n ,and C on centr a t i on s" , Journal o f Geophys ica l R e se a rch , V ol . 78, No. 24, Aug. 20, 1973, pp. 5293-530 5.
Johnson, K .L . , "Dworetzky, L.H. and H e l l e r , A . N . , "Carbon Monoxide and A ir P o l l u t i o n from Automobi le Em is s ions i n New York C i ty " , S c i e n c e , V ol . 160, Apr. 5 , 1968, pp. 6 7 - 6 8 .
Johnson, W.B., e t a l . , "An Urban D i f f u s i o n S im u la t io n Model for Carbon Monoxide", Journa l o f A ir P o l l u t i o n Contro l A s s o c i a t i o n , Vol . -23, No. 6 , June 1973, pp. 4 9 0 -4 9 8 .

171
J o n cs , R . l l . , D a n i e l s , A. and Rich, W. , " F i t t i n g a C i r c u l a r D i s t r i b u t i o n to a Histogram", Jou rn al ot! Appl i ed M e t e o r o lo g y , Vo l . 15, Jan. 1976, pp. 9 4 -9 8 .
Junge, C . , S e i l e r , W. and Warneck, P . , "The Atmospheric l^CO and Budget", Jou rn al oC Geophysi c a l R e se a r c h , V o l . 76 , No. 12, Apr. 20, 1971, pp. 28 66 -2 879 .
Knox, J . B . and Lange, R . , "Surface A ir P o l l u t a n t C on ce ntrat ion Frequency D i s t r i b u t i o n s : I m p l i c a t i o n s f o r Urban Model ing", Journal o fthe A ir P o l l u t i o n Control A s s o c i a t i o n , Vo l . 24 , No. 1, Jan. 1974, pp. 4 8 - 5 3 .
Kutmnler, R.H. and Baurer, T . , "A Temporal Model o f T r o s o s p h c r i c Carbon- Hydrogen Chemistry", Jo urn a l o f Geophys ic a l R e se a r c h , Vo l . 78 , No. 24, Aug. 20, 1973, pp. 5306-5 3 1 6 .
Kushner, E . J . , "On D eterm in ing the S t a t i s t i c a l Parameters for P o l l u t i o n C on centr a t i on from a Truncated Data S e t" , Atmospheric Environment , V o l . 10, 1976, pp. 9 7 5 -9 7 9 .
Larsen, R . I . , "A New Mathematical Model o f A ir P o l l u t i o n Con ce ntr a t i on o f A ir P o l l u t a n t C o n ce ntr a t io n Ave ra ging Time and Frequency", Journal o f the Air P o l l u t i o n C on tro l A s s o c i a t i o n , Vo l . 19, No. 1, Jan. 1969, pp. 2 4 - 3 0 .
L e d o l t e r , J . , "A S t a t i s t i c a l A n a l y s i s o f New J e r s e y Carbon Monoxide Data", A ir P o l l u t i o n Control A s s o c i a t i o n Conference on Q u a l i ty Assurance in Air P o l l u t i o n Measurement, A ir P o l l u t i o n Contro l A s s o c i a t i o n , P i t t s b u r g h , P e n n s y lv a n ia , Mar. 1979.
Levy, H. , I I , "T ropospheric Budgets for Methane, Carbon Monoxide, and R ela t ed S p e c i e s " , Jo urn a l o f Geophys ica l R e s e a r c h , Vo l . 78 , No. 24, Aug. 20, 1973, pp. 5325-5 3 3 2 .
Lewis , J . R . , C o l l e g e Chemistry, 9th E d i t i o n , A Barnes and Noble Ou t l i n e , Harper and Row, New York, New York, 1971, pp. 227 -2 28 .
L i n c o l n , D.R. and Rubin, E . S . , "C o nt r ibu t io n o f Mobi le Sources to Ambient P a r t i c u l a t e C o n c e n tr a t io n s in a Downtown Urban Area", Jo urn al o f the Air P o l l u t i o n Contro l A s s o c i a t i o n , V o l . 30 , No. 7 , J u ly 1980, pp. 77 7 -7 8 1 .
Linnenbom, V . J . , Swinnerton , J.W. and Lamontagne, R . A . , "The Ocean as a Source fo r Atmospheric Carbon Monoxide", Journal o f Geophys ical R e se a rc h , Vo l . 78 , No. 24, Aug. 20 , 1973, pp. 5333-5 3 4 0 .
Liu, C.Y. and Goodin, W.R., "A Two-Dimensional Model for the Transport o f P o l l u t a n t s in an Urban Bas in" , Atmospheric Environment , Vol . 10, 1976, pp. 5 1 3 - 5 2 6 .

172
L iu , Mei-Kno, Whitney, D.C. and Roth, P.M. , " E f f e c t s o f Atmospheric Parameters on the C o n centra t io n o f Photochemica l Air P o l l u t a n t s " , Journal o f Appl ied M eteo ro lo g y , V o l . 15, Aug. 1976, pp. 8 2 9 -8 33 .
Ludwig, F.L. and Dabberdt, W.F. , "Comparison o f Two P r a c t i c a l Atmospheric S t a b i l i t y C l a s s i f i c a t i o n Schemes in an Urban A p p l i c a t i o n " , Journ al o f A ppl ied M e teo r o lo g y , V o l . 15, Nov. 1976, pp. 1172-1176.
Lyons, T .J . and Cutten, D .R . , "Atmospheric P o l l u t a n t and Temperature T r a v er s e s in an Urban Area", Atmospheric Environment , V o l . 9 , 1975, pp. 7 3 1 -7 3 7 .
M c C o l l i s t e r , G.M. and Wilson, K .R . , "Linear S t o c h a s t i c Models for F o r e c a s t i n g D a i l y Maxima and Hourly C o n ce ntr a t io n s o f A ir P o l l u t a n t s " , Atmospheric Environment , Vol . 9 , 1975, pp. 4 1 7 -4 2 3 .
McConnell , J . C . , McElroy, M.B. and Wofsy, S . C . , "Natural Sources o f Atmospheric CO", N a tu re , Vol . 233, S ep t . 17, 1971, pp. 187-1 88 .
McCormick, R.A. and X i n t a r a s , C . , " V a r ia t io n o f Carbon Monoxide C o n c e n tr a t io n s as R e la ted to Sampling I n t e r v a l , T r a f f i c and M e t e o r o l o g i c a l F a c t o r s " , Journal o f Appl ied M e teo r o lo g y , V ol . 1 , June 1962, pp. 2 3 7 -2 4 2 .
McFarland, R . A . , "Low L ev e l Exposure to Carbon Monoxide and D r iv in g Performance", A rch iv es o f Environmental H e a l t h , V o l . 27 , 1973, pp. 355 - 359.
M i t c h e l l , R . S . f e t a l . , "Health E f f e c t s o f Urban A i r P o l l u t i o n - S p e c i a l C o n s id e r a t io n o f Areas a t 1 , 500 ra and Above", Journal o f the American Medical A s s o c i a t i o n , V ol . 242, No. 11, S ep t . 14, 1979, pp. 116 3-116 8.
Mo stard i , R.A. and Leonard, D . , "Air P o l l u t i o n and Cardiopulmonary F unct i on" , A r ch iv e s o f Environmental H e a l t h , Vol . 29 , Dec. 1974, pp. 3 2 5 -3 28 .
N e w e l l , R.E. and Gauntner, D . J . , "Experimental Evidence o f I n t e r h e m i s p h e r i c Transport from Airborne Carbon Monoxide Measurements", Journ al o f A ppl ied M e teo r o lo g y , V o l . 18, May 1979, pp. 6 9 6 -6 9 9 .
N i c h o l s o n , S . E . , "A P o l l u t i o n Model for S t r e e t - l e v e l A ir" , Atmospheric Environment , V o l . 9 , 1975, pp. 19 -3 1 .
Norbeck, J . M . , Chang, T.Y. and Weinstock , B . , " E f f e c t o f New York C i ty Taxi S t r i k e on CO C o n centra t io n s ,in Mid town Manhattan", Journa l o f A ir P o l l u t i o n Con trol A s s o c i a t i o n , V o l . 29 , No. 8 , Aug. 1979, pp. 8 4 5 -8 4 7 .
Ortega , J.M. and Rheinbo ld tj W.C. , I t e r a t i v e S o l u t i o n o f N on l in ea r Equ at ions in S e v e r a l V a r i a b l e s ,■■ Academic P r e s s , New York, New York, 1970.

173
Ote, W.R. and Mage, D . T . , "Measuring A ir Q u a l i ty L e v e l s I n e x p e n s iv e ly a t M u l t ip le L o c a t io n s by Random Sampling", Journal o f A ir P o l l u t i o n Control A s s o c i a t i o n , V o l . 31, No. 4 , Apr. 1981, pp. 36 5-369.
P a s s i , R.M., "A Weig ht in g Scheme fo r A u t o r e g r e s s i v e Time Averages", Journal o f Appl ied M e t e o r o lo g y , V ol . 15, No. 2, Feb. 1976, pp. 117-119.
P e t e r s e n , G.A. and S abersky , R .H . , "Measurements o f P o l l u t a n t s I n s id e an Automobi le", Jo urn al o f the Air P o l l u t i o n Co ntro l A s s o c i a t i o n , Vol. 25, 1975, pp. 1028-1032.
P e t e r s o n , J . E . and S t e w a r t , R . D . , "Absorpt ion and E l im in a t i o n o f Carbon Monoxide by I n a c t i v e Young Men", A rch ives o f Environmental H e a l t h , Vol . 21, 1970, pp. 165-171.
Pray, L . C . , ( E d i t o r ) , A Guidebook to the M i s s i s s i p p i a n S he l f -E dg e and Basin F a c i e s Carbonates , Sacramento Mountains and Southern New Mexico R e g io n , Annual Meet ing o f the American A s s o c i a t i o n o f Petroleum G e o l o g i s t s and the S o c i e t y o f Economic P a l e n t o l o g i s t s andM i n e r a l o g i s t s , D a l l a s G e o l o g i c a l S o c i e t y , D a l l a s , Texas , Apr. 1975 , p. 2 .
Pressman, J . and Warneck, P . , "The S tr a t o s p h e r e as a Chemical Sink for Carbon Monoxide", J o u rn a l o f the Atmospheric S c i e n c e s , V ol . 27 , Jan. 1970, pp. 155-163.
Ramsey, J . M , , "Oxygen Redu ct ion and R e a c t io n Time in Hypoxic and Normal D r iv e r s " , A rch iv es o f Environmental H e a l t h , V o l . 20 , 1970, pp. 597-60 .
Remsberg, E . E . , B u g l i a , J . J . and Woodbury, G . E . , "The NocturnalI n v e r s i o n and I t s E f f e c t on the D i s p e r s i o n o f Carbon Monoxide a t Ground L e v e l in Hampton, V i r g i n i a " , Atmospheric Environment , Vol . 13 , 1979,pp. 4 4 3 -4 4 .
Reyno lds , S . D . , e t a l . , "Mathematical Model ing o f Photochemica l Air P o l l u t i o n - I I I . E v a l u a t i o n o f the Model", Atmospheric Environment , V ol . 8 , 1974, pp. 5 6 3 - 5 9 6 .
R i e h l , H. and Herkof , D . , "Some A sp ec t s o f Denver Air P o l l u t i o n Meteoro logy" , Journa l o f A ppl ied M eteo ro lo g y , V o l . I I , 1972, pp. 1040-1046.
Robbins , R .C . , Borg, K.M. and Robinson, E . , "Carbon Monoxide in the Atmosphere", Journ al o f the A i r P o l l u t i o n Co ntro l A s s o c i a t i o n , V ol . 18 , No. 2, Feb. 1968, pp. 106- 11 0.
Robbins , R .C . , Cavanagh, L.A. and S a l a s , L . J . , "Ana lys i s o f Ancient Atmospheres", V ol . 7 8 , No. 24, Aug. 20, 1973, pp. 5 341-5 344 .

174
Robinson, E. and Robbins , R . C . , "Atmospheric Background C on centr a t i on s o f Carbon Monoxide", Annals o f New York Academy o f S c i e n c e s , V o l . 174, 1970, pp. 8 9 - 9 5 .
SAS, SAS I n tro d u c to r y Guide, SAS I n s t i t u t e , Cary, North C a r o l in a , 1978.
SAS, SAS U s e r ' s Guide ~ 1979 E d i t i o n , SAS I n s t i t u t e , Cary, North C a r o l in a , 1979a.
SAS, SAS Supplemental Library U s e r ' s Guide - 1979 E d i t i o n , SASI n s t i t u t e , Cary, North C a ro l in a , 1979b.
SAS, SAS/ETS U s e r ' s Guide - Econometric and Time S e r i e s L ibra ry , 1980 E d i t i o n , SAS I n s t i t u t e , Cary, North C a ro l in a , 1980.
SAS, SAS/Graph U s e r ' s Guide - 1981 E d i t i o n , SAS I n s t i t u t e , Cary, North C a r o l in a , 1981a.
SAS, SAS Programmer's Guide - 1981 E d i t i o n , SAS I n s t i t u t e , Cary, North C a r o l in a , 1981b.
SAS, SAS I n s t i t u t e T ec h n ica l Report - SAS 7 9 .5 Changes and Enhancements , SAS T ech n ica l Report P -115 , SAS I n s t i t u t e , Cary, North C a r o l in a , 1981c.
S a s s , C . J . , Fo rtran IV Programming and A p p l i c a t i o n s , Holden-Day, I n c . , San F r a n c i s c o , C a l i f o r n i a , 1974.
Shimazaki , T. ' and Cadle , R . D . , " T h e o r e t i c a l Model o f V e r t i c a l D i s t r i b u t i o n s o f CO and CH4 in th e Mesosphere and Upper S tr a t o sp h e r e " , Journ al o f G eophys ic a l Research , V ol . 78 , No. 24, Aug. 20, 1973, pp. 5352-5 361 .
Shy, G.M., H a s s e l b l a d , V. and Burton, R.M., "Air P o l l u t i o n E f f e c t s on V e n t i l a t o r y Fu nct i on o f U.S. S c h o o lc h i l d r e n " , Ar ch iv es o f Environmental He a l t h , Vol . 27 , S ept . 1973, pp. 124-128.
S i m o n a i t i s , R. and H e ick len , J . , " K in e t i c s and Mechanism o f the R e a c t i o n o f 0 (3 p) w i th Carbon Monoxide", The Journal o f Chemical P h y s i c s , Vol . 5 6 , No. 5 , Mar. 1, 1972, pp. 2004-201 1.
S i m o n a i t i s , R. and H e ic k len , J . , "The R e a c t io n o f OH wi th NO2 and the D e a c t i v a t i o n o f 0(^D) by CO", I n t e r n a t i o n a l Journal o f Chemical K i n e t i c s , Vol . IV, 1972, pp. 5 2 9 -5 40 .
S i s t e r s o n , D . L . , Shannon, J .D, and H a l e s , J . M . , "An Examinat ion o f R egio n a l P o l l u t i o n S tr u c t u r e in the Lower Troposphere - Some R e s u l t s o f thé D i a g n o s t i c Atmospheric C r o s s - S e c t i o n Experiment (DACSE-1)", Journal o f Appl ied M ete oro lo gy , V o l . 18, Nov. 1979, pp. 1421-1428.

175
Smith, D.G. and Egan, B .A . , "Design o f Monitor Networks to Meet M u l t i p l e C r i t e r i a " , Journal o f A ir P o l l u t i o n Con trol A s s o c i a t i o n , Vol . 29 , No. 7 , 1979, pp. 710-714.
So k a l , R.R. and R o h l f , F . J . , B iom etr y , W.H. Freeman and Company, San F r a n c i s c o , C a l i f o r n i a , 1969.
Spencer, D .D . , The I l l u s t r a t e d Computer D i c t i o n a r y , Char les E. M e r r i l l P u b l i s h i n g Company, Columbus, Ohio, 1980.
S t e v e n s , G.M., e t a l . , "The I s o t o p i c Composit ion o f Atmospheric Carbon Monoxide", Earth and P l a n e ta r y S c i e n c e L e t t e r s , V ol . 16 , 1972, pp. 147- 165.
Swinnerton , J .W . , Linnenbom, V .J . and Lamontagne, R . A . , " D i s t r i b u t i o n o f Carbon Monoxide Between the Atmosphere and the Ocean", Annals o f New York Academy o f S c i e n c e s , Vol . 147, 1970, pp. 9 6 -1 0 1 .
Texas Air Contro l Board, Texas Ambient A ir Q u a l i t y Continuous Monitoring Network, Texas Air Contro l Board, A u s t i n , Texas , 1973.
Texas A ir Control Board, CONNIE - Continuous Atmospheric MonitoringS t a t i o n , Texas Air Contro l Board, A u s t i n , Texas , 1975.
Texas A ir Contro l Board, B i e n n i a l Report - September 1 , 1976-August 31 , 1 9 7 8 , Texas A ir Co ntrol Board, A u s t i n , Texas , 1978.
Texas Air Control Board, R e v i s i o n s Texas S t a t e Implementat ion P l a n ,Texas A ir Co ntro l Board, A u s t in , Texas , 1979a.
Texas A ir Co ntrol Board, B i e n n i a l Report - September 1 , 1978-August 31, 1 9 8 0 , Texas A ir Contro l Board, A u s t i n , Texas , 1980b.
Texas A ir Control Board, U s e r ' s Cuide - Texas C l i m a t o l o g i c a l Model ,Texas A ir Co ntro l Board, A u s t in , Texas , Aug. 1980a.
Texas A ir Co ntro l Board, U s er ' s Cuide - Texas E p i s o d i c Model , Texas AirControl Board, A u s t in , Texas , Oct. 1979b.
Tauber, S . , "P att ern R e c o g n i t io n Methods i n Air P o l l u t i o n C ontro l" ,Atmospheric Environment, Vol . 12, 1978, pp. 237 7-238 2.
T ia o , G .C . , Box, C.E.P. and Hamming, W.J . , "A S t a t i s t i c a l A n a l y s i s o f th e Los A nge les Ambient Carbon Monoxide Data 1955-1972" , Journal o f the A ir P o l l u t i o n Contro l A s s o c i a t i o n , V o l . 25, No. 11, Nov. 1975, pp.1129-113 6.
T i l lm a n , J . H . , Air P o l l u t i o n in the E l Paso , Texas Area , E l Paso C i t y - County Hea l th U n i t , El Paso, Texas , 1959.

176
Topping, D . L . , "Metabo l i c E f f e c t s o f Carbon Monoxide in R e l a t i o n to A t h e r o g e n e s i s " , A th er o s e l e ros i s , Vol . 26 , 1977, pp. 129-1 37 .
Turner, D . B . , "Atmospheric D i s p e r s i o n Model ing a C r i t i c a l Review", Atmospheric D i s p e r s i o n Model ing: APCA Repr in t S e r i e s , A ir P o l l u t i o nContro l A s s o c i a t i o n , P i t t s b u r g h , P e n n s y lv a n ia , 1980, pp. 2 - 1 9 .
U .S . Environmental P r o t e c t i o n Agency, Users Manual, SAROAD, Environmental P r o t e c t i o n Agency, Research T r i a n g l e Park, North C a r o l i n a , 1971.
UCS, I n t r o d u c t i o n to Computing F a c i l i t i e s , U n i v e r s i t y Computing S e r v i c e s , U n i v e r s i t y o f Oklahoma, Norman, Oklahoma, 1980.
UCS, B a s i c P l o t t i n g G uide, U n i v e r s i t y Computing S e r v i c e s , U n i v e r s i t y o f Oklahoma, Norman, Oklahoma, 1978.
Ury, H .K . , P e r k i n s , N.M. and Goldsmith, J . R . , "Motor V e h i c l e A c c i d e n t s and V e h i c u l a r P o l l u t i o n i n Los A n g e les" , A r ch iv e s o f Environmental H e a l t h . V o l . 25, 1972, pp. 31 4 -3 2 2 .
Webb, W.L. , Mesometeorology at E l P a s o , Texas Western P r e s s , U n i v e r s i t y o f Texas a t E l Pas o , E l Paso, Texas , 1971, 121 pp.
Weinsto ck , B . , "Carbon Monoxide: R es id en ce Time in the Atmosphere",S c i e n c e , Vo l . 165, Oct . 10 , 1969, pp. 2 2 4 - 2 2 5 .
W eins to ck , B. and N i k i , H . , "Carbon Monoxide Balanc e in Nature", S c i e n c e , V o l . 176, Apr. 21, 1972, pp. 2 9 0 -2 9 2 .
Weisberg, S . , Ap pl i ed L inear R e g r e s s i o n , John Wiley & Sons, New York, New York, 1980.
W hitten , R .C . , S ims, J . S . and Turco, R . P . , "A Model o f Carbon Compounds in the S t r a t o s p h e r e and Mesosphere", J ou rn a l o f Geophys ica l R e se a r c h , V o l . 78 , No. 24, Aug. 20, 1973, pp. 5362-5 374 .
Witz , S. and Moore, A . B . , J r . , " E f f e c t o f Meteoro logy on the Atmosphereic C o n c e n t r a t io n s o f T r a f f i c - R e l a t e d P o l l u t a n t s a t a Los A n g e le s S i t e " , J o u rn a l o f the A ir P o l l u t i o n Contr o l A s s o c i a t i o n , Vol . 31 , No. 10, Oct. 1981, pp. 1098-1100.
Wofsy, S . C . , McConnell , J . C . and McElroy, M.B., "Atmospheric CH/,, CO, and CO2 ", Journ a l o f Geophys ic al R e se a r c h , V o l . 7 7 , No. 24, Aug. 20, 1972, pp. 4 4 7 7 -4 4 9 3 .
Wright, G . , R a n d e l l , P. and • Shephard, R . J . , "Carbon Monoxide and D r iv in g S k i l l s " , A r c h iv e s o f Environmental H e a l t h , Vo l . 2 7 , 1973, pp. 349-3 54 .

177
Yu, Tsann-Wang, " D o t e m i n i n g Height o f the Nocturnal Boundary Layer", Journ al o f Appl i ed M e teo r o lo g y , Vo l . 17, Jan. 1978, pp. 2 8 -3 3 .

APPENDIX A
SCHEMATICS OF CO PRODUCTION AND DESTRUCTION
178

179
IACIC80UN9AN0INimCONMgSlOl f f f l C f tS C X JtC C S
I I OIOC IC AI SINKSM A l U I A l t o u t c i s
SORPMOMOM SOlios
pHorooissociAnoN
WAÏIR AssoarnoN
O AT
OAT
lO v M t - A I M O S P K I l CC O C O '< lN t« A ( IC N S
U P f r H A l M O S P H f R I CCOCONCtNIRAtlOSS
fORMATIONOf 0 ; ANOCASSCHTDRAUS
INriRACriCN WITH IIAM ANO OÎHCR OXIO£S
UPPER AÎVOSPHÎRIC CO, CCNCENTRAnCNS
IO vMR-AIaiO S P mERIC C mM lC A l CONVERSION
lOWlR AIMOSPMERIC CO, CCNCtNIRAtlCNS
BASIC CARtONAft fCRA\ATIOHON PCPOSEO COPPER ANO &RONZE
Figure A-1 . Atmospheric CO/CO^ B alanc e (Kummler and Baurer, 1973)
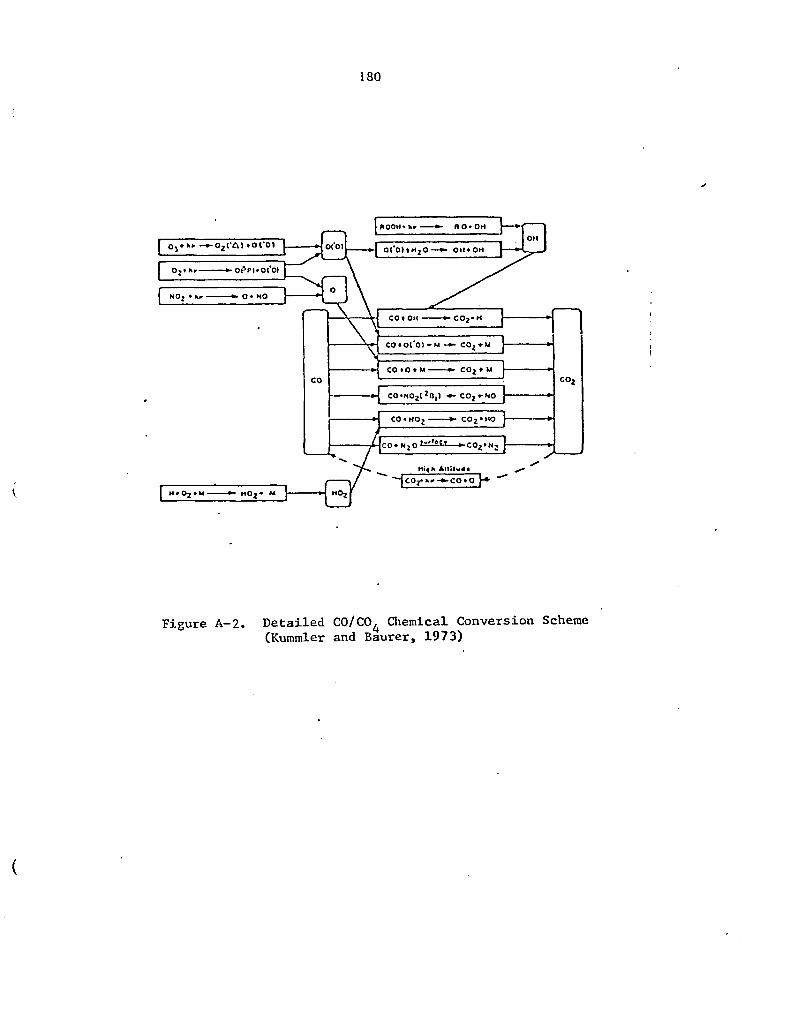
180
CM*0(01
O • NOHO;c ot OH
C 0 * O ( ' 0 ) «-M
CO « 0 t MCO.CO
C O ^ N O j l ^ O , ! -#» C O j f - N O
C O * HO
CO* N j O
HOjMO;
Figu re A - 2. D e t a i l e d CO/CO^ Chemical Conversion Scheme (Kummler and Baurer, 19 7 3 )

APPENDIX B
EL PASO EMISSION INVENTORY AND GENERAL EMISSION FACTORS
181

1 8 2
Table B-1 . El Paso Emiss ion Inventory as Snminarizcd from the Environmental P r o t e c t i o n Agency Emission Inventory
E m is s io n S o u r ce Tons/YearEmitted
Motor v e h i c l e s
G a s o l in e powered v e h i c l e s
- h i g h w a y - v e h i c l e s 2 2 8 ,9 2 5- o f f - h i g h w a y v e h i c l e s 7 ,3 4 1
D i e s e l powered v e h i c l e s
- highway v e h i c l e s 2 ,7 5 4- o f f —highway v e h i c l e s 265- r a i l w a y l o c o m o t i v e s _____646
S ub - t o ta l 2 3 9 ,931
A i r c r a f t
M i l i t a r y 3 3 ,6 0 0 l a n d i n g - t a k e o f f c y c l e s 820
C i v i l 1 0 6 , 4 6 0 l a n d i n g - t a k e o f f c y c l e s 1 , 0 0 1
Commercial 2 0 , 8 9 0 _____________________________________________ _____533
S ub - t o ta l 2 ,3 5 4
General Types
R e s i d e n t i a l 133
Commercial and I n s t i t u t i o n a l 79
I n d u s t r i a l 1 , 6 1 3
S u b - t o ta l 1 , 8 2 5
S o l i d Waste D i s p o s a l 2 ,4 9 9
M i s c e l l a n e o u s - 1 , 4 3 7 s t r u c t u r e f i r e s 418
Area P o i n t Source E m i s s io n s 31,120TOTAL 278 ,146

183
Table B-2. Carbon Monoxide Emissions by Source Categoryin the United S t a t e s in1 1968 ( J a f f e . 1973)
CO em is s io n Percent o foourcc (tonsb t o n s / y r ) T o ta l
T e c h n o l o g ic a l so u rce sFuel combustion i n mobi le
s o u r c e s 6 3 . 8 6 7 . 6Motor v e h i c l e s 5 9 .2 62 .7
G a so l in e 5 9 .0 6 2 . 5D i e s e l 0 .2 0 .2
A i r c r a f t 2 . 4 2 . 5V e s s e l s 0 . 3 0 . 3R ai lroad s 0 .1 0 .1Non-highway use o f motor •
f u e l s 1 .8 1.9Fuel combust ion i n
s t a t i o n a r y so u r c e s 1.9 2 .0Coal 0 .8 0 .8Fuel o i l 0 .1 0 .1N atu ra l gas * *Wood 1 .0 1 .0
I n d u s t r i a l p r o c e s s e s 11 .2 11.9 1 .0S o l i d w as te combust ion 7 . 8 8 . 3
M is c e l la n e o u s :man-made f i r e s 9 . 7 10.3c o a l r e f u s e b ur n in g , e t c .C i g a r e t t e smoke 0 .0 1
T e c h n o l o g ic a l s o u r c e s( s u b t o t a l ) 9 4 . 4 100
Na tu ra l so u rc e s. F o r e s t f i r e s 7 .2
T o ta l from a l l s o u r c e s : 101 .6
* = n e g l i g i b l e

Table B-3. Estimated Global Anthropogenic CO Sources for 1974 (Jaffe, 1973)
World Worldources Fuel Consumption, CO E m iss io n ,%
10 m etr ic to n s /y r 10^ , e t r o c to n s /y r
MobileMotor v e h i c l e s 439 ' 199
G aso line 197D ie s e l 2
A ir c r a f t ( a v ia t io n g a s o l in e , j e t f u e l ) 84 5W atercraft 18R ailroads 2Other (nonhighway) motor v e h i c l e s
(c o n s tr u c t io n equipment, farm t r a c t o r s ,u t i l i t y e n g in e s , e t c . ) 26
S ta t io n a ryCoal and l i g n i t e 2983 . 4R esidual f u e l o i l 682 <1Kerosene 69 <1D i s t i l l a t e f u e l o i l 411 <1L iq u ef ie d petroleum gas 34 <1
I n d u s tr ia l p r o c e s s e s (petroleum r e f i n e r i e s , 41s t e e l m i l l s , e t c . )
S o l id w aste d is p o s a l (urban and i n d u s t r i a l ) 1130 23M isce llan eou s (a g r ic u l t u r a l burning, c o a l 41
bank r e f u s e , s t r u c t u r a l f i r e s )T ota l an thropogenic CO 359
C Os>

Table B -4 . f a c t o r s fo r C a lcu la t io n o f CO Emissions ( J a f f e , 1973)
Source Factor
G asoline e n g in e s , motor v e h i c l e sU.S.A. 261 .2 kgRest o f world 423 .4 kg
D ie s e l e n g in e s , motor v e h i c l e s 2 7 .0 kgGasoline-powered u t i l i t y en g in es 411 .0 kgD ie s e l u t i l i t y en g ines 39 .0 kgA ir c r a f t
Turbofan, jumbo j e t 12 .7 kgTurbofan, long range 11.8 kgTurbofan, medium range 7 .3 kgTurbojet 10.9 kgTurboprop 0 .9 kgTurboshaft 2 .7 kgP is to n , transport 137.0 kgP is t o n , l i g h t 5 .5 kg
R ailroadsD ie s e l d i s t i l l a t e and r e s id u a l f u e l o i l 8 .4 kgCoal (h a n d -f ired u n i t s ) 10 .8 kg
W atercraftG asoline 4 1 1 .0 kgR esid u a l f u e l o i l 1 .8 kg
Coal, s ta t io n a r y sourcesE l e c t r i c u t i l i t y 0 .5 kg
1 (2180 lb CO/1000 g a l)
1 (3430 lb CO/1000 g a l) 1 (325 lb CO/1000 g a l )
co/engine.
LTO c y c le LTO c y c le LTO c y c le LTO c y c le LTO c y c le LTO c y c le LTO c y c le LTO c y c le
(1230 1 /en g in e ) (682 1 /en g in e ) (644 1 /en g in e ) (833 1 /en g in e ) (265 1 /en g in e ) (95 1 /en g in e ) (270 1 /en g in e ) (8 .3 1 /en g in e )
S t e e l and r o l l i n g m i l lR e s id e n t ia l , commercial, l i g h t i n d u s t r i a l , i n s t i t u t i o n a l
R esidual o i l and d i s t i l l a t e o i l E l e c t r i c u t i l i t i e s ManufacturingR e s id e n t ia l , commercial, and l i g h t in d u s t r i a l
0 .7 5 kg CO/metric ton25 .0 kg CO/metric ton (average)
0 .0 0 5 kg CO/IO^ 1 0 .005 kg C0/I03 1 0 .6 kg CO/103 1
OC

Table B-4. Continued
Source Factor
N atural gas combustionE l e c t r i c power p la n t and i n d u s t r i a l p ro cess b o i l e r s
' Domestic and commercial h e a t in g u n i t s Kerosene
I n d u s tr ia l Domestic h e a t in g
L iq u ef ied petroleum gas I n d u s t r ia l p rocess Domestic and commercial
Wood (combustion in b o i l e r s )Iron foundries Petroleum r e f i n e r i e s
F lu id c a t a l y t i c crack ing u n i t s Moving bed c a t a l y t i c crack ing u n i t s
Carbon b lack Gas furnace O il furnace Channel
S t e e l manufacturing S in te r in gB a s ic oxygen furnace
Kraft pulp and paper S u l fa t e pulp ing S o l id w aste d is p o s a l (r e fu se )
M unicipal in c in e r a t io n C onical burners
Municipal, r e fu s e Wood
Open burning ( r e fu s e )A g r ic u l tu r a l f i e l d burningF o res t f i r e s , p re sc r ib e d burning (open burning)
6 .4 kg C0/10& m3320 kg CO/10^ m3
0 .0 2 5 kg C0/1q3 1 0 .6 kg C0/I03 1
0 .0 0 1 kg C0/I03 1/propane-butane 0 .2 5 kg CO/103 1/propane-butane 1 .0 kg CO/metric ton72 .5 kg CO/metric ton
39 .2 kg CO/103 110 .3 kg CO/103 1
2650 kg CO/metric ton 2250 kg CO/metric ton 16750 kg CO/metric ton
22 kg CO/metric ton6 7 .5 kg CO/metric ton 35 kg CO/metric ton 30 kg CO/metric ton
17.5 kg CO/metric ton (average)
30 kg CO/metric ton 65 kg CO/metric ton4 2 .5 kg CO/metric ton 50 kg CO/metric ton 25 kg CO/metric ton
c=O'

APPENDIX C
CO CASE STUDIES
187

Sunnnary o f CO U rban Amblenc A ir L e v e l S tu d ie s
A u tho rC s) and D a te o f P u b l i c a t i o n S tu d y A rea S tu d y P e r io d T ype o f S tudy
D ata B ases and P a ra m e te r s Used
In th e S tudy R e s u l t s C o m e n ts
A p p le g a te , U .C ., 1981
A ro n , R .H ., an d A ro n , I . H . , 1978
B e o c a la , K .E ., end S e in f e ld , J . H . , 1976
E l P a s o -J u a r e za i r s h e d
L os A n g e le s b a a in
1977
1974 -75
E m p ir ic a l - S t a t i s t i c a l '
S t a t i s t i c a l m ode ls - l i n e a r c o d e ia and l e a s t s q u a re s
8 c i t i e s Los A n g e le s P h i la d e lp h i a D enverSan F ra n c is c o C in c in n a t i S c . L o u is W ash ing ton C h icago
1962 -68 S t a t i s t i c a l( f r e q u e n c y )
E m iss io n in v e n to r y
R e s u l t a n t w ind sp eed
R e s u l t a n t w ind d i r e c t i o n
S ou th C o a s t A ir Q u a l i ty Managem ent D i s t r i c t
P o l l u t a n t d a ta b a se
T e m p era tu re E m iss io n In v en
to r yI n v e r s io n h e ig h t P r e s s u r e g r a d i e n t s T r a f f i c c o u n ts M ix ing h e i g h t
Wind sp e e d M ix ing h e ig h t Mean c o n c e n tr a
t i o n s In s ta n ta n e o u s
c o n c e n t r a t io n s
1) CO t r a n s p o r t e d by v in d f lo w from J u a r e z c o n t r i b u t e s t o CO l e v e l s i n E l P aso
1) D i f f e r e n t CO l e v e l s w ere found a t d i f f e r e n t s i t e s h a v in g I d e n t i c a l m e teo ro l o g i c a l c o n d i t i o n s .
2 ) P re v io u s d a y 's m ax icua CO v a l u e . I n v e r s io n b a s e h e ig h t and te m p e r a tu r e w ere m ost im p o r ta n t .
1 ) G e n e ra l iz e d a s s i c p t lo n # a r e made on v e h i c l e ty p e , n u m b e rs , and u s a g e .
2 ) M ix ing n e l g h t d a t a w as n o t u s e d .
3 ) So s p e c i f i c m odel was u se d o r d e v e lo p e d .
1) W hile h i s t o r i c a l p r o f i l e was ex a m in ed , em p h asis w as on p r e d i c t i v e c a p a c i ty
X) A v e rag in g tim e a f f e c t s f r e quency d i s t r i b u t i o n s .
2 ) CO c o n c e n t r a t io n s and w ind sp e e d a r c l o g - n o r n a l ly d i s t r i b u t e d .
3) Wind sp eed and n ix in g h e ig h t a r c m a jo r f a c t o r s a f f e c t i n g a i r p o l l u t i o n fre q u e n c y d i s t r i b u t i o n s .
4 ) I f w ind s p e e d s a r e =» lo g - n o rm a lly d i s t r i b u t e d th e n a l s o a r e r e s u l t i n g CO con c e n t r a t i o n s .
1 ) The s t a t i s t i c a l b e h a v io r o f th e d a t a I s th e m a jo r t o p i c o f th e p a p e r .
2 ) The lo g -n o rm a l d a t a l a a p p l ie d to th e Box, G a u s s ia n P lum e, and Eddy d i f f u s i o n m ode ls I n g en e r a l te r m s , b u t n o t f o r CO a m b ie n t l e v e l p r e d i c t i o n s .
CO00
Brow ne, M .E ., 1969
S t a t e o f C o n n e c t ic u t
1 m onth ( J a n u a ry )
G a u s s ia n ty p e d i f f u s i o n model u s in g a c o n t in uous p o in t s o u rc e e q u a t io n .
Wind f i e l d ( s p e e d and d i r e c t i o n )
A rea g r id T ra v e l tim e F o is u Io n In v e n
to r y
1) P o l lu t i o n from a p o in t o r a r e a nay be t r a c e d a lo n g a t r a j e c t o r y f o l lo w in g th e mean w ind and s p r e a d s by eddy d i f f u s i o n .
2) C hanges i n w ind sp e e d and d i f f u s i o n m o tio n s I n f lu e n c e t r a j e c t o r y b e h a v io r b u t cay be com puted e a s i l y .
1 ) M ix ing h e i g h t b e h a v io r la 8 ss i= ed .
2) S o u rc e s a r e h a n d le d by low o r s t r o n g c a t e g o r i e s .
3 ) P r e d i c t i o n s o f a i r q u a l i t y c a d e from t h i s model w ere n o t a d e q u a te ly v e r i f i e d .

A u th o r ( s ) andD a te o f P u b l i c a t i o n S tu d y A rea S tu d y P e r io d ly p e o f S tu d y
D ata E a se s andP a r a n e t c r s Used
In th e S tudy R e s u l t s C o æ n t s
B u l l l n , J . A . , G re e n , N . J . , and P o la s e k , J . C . , 1980
T exas (D a lla s H ouston San A n to n io E l P aso )
0 ,5 h r .sa m p lin gp e r io d s
H ass b a la n c e te c h n iq u e u s in g AP-A2 and M ob ile 1 m odels
V e h ic le I n v e n to ry 1 ) AP-62 d o es n o t a d e q u a te lyV e h ic le s p eed s Wind sp eed and
w ind d i r e c t i o n a t v a ry in g h e i g h ts
r e p r e s e n t c u r r e n t e m is s io n f a c t o r s .
2 ) M ob ile 1 n g re c s w ith some ch e c k s o f v e h i c l e e m is s io n s and m ass b a la n c e c a s e s
1 ) So s in k o r d is a p p e a r a n c e o f c a t e r i a l I s a s s i s e d .
2 ) The a u th o r s c o n c lu d e t h a t c o r e d a t a , m ore p r e c i s e m e a su re m e n ts , and c o re I n s t r u m e n ta t io n a r e need ed to v e r i f y th e m o d e ls .
C a r p e n te r , A .B ., T ru e , D .K ,, and S ta n e k , E . J . , 1977
D eM oines,Iowa
J u l y -A ugust1975
E m p ir ic a lS t a t i s t i c a l
A e r ia l p h o to g ra p h s 1) On d ay s o f c o s t I n te n s e F i r e d e n s i t y l e a f b u rn in g h ig h l e v e l s o f
r e a d in g s CO and TSP w ere o b s e rv e d .IS P d a t a 2 ) O nly CO & TSP d i s t r i b u t i o n
c h a r t s w ere g iv e n .
1 ) Ho s p e c i f i c m e te o r o lo g ic a l d a t a was u s e d .
2 ) Ko c o r r e l a t i o n s w ere p e r fo rm ed .
C hang, T .Y ., K o rb cck , J .M . , and V e ln s to c k , E . , 1980a .
C hang, T .Y . , N o rb eck , J .M . , an d V e ln s to c k , B . , 1980b
C hang, T .Y . , and W eln sco ck , S . , 1975
C hang, T .Y ., and V e ln s to c k , B . , 1973
New Y ork , New Y ork (M an h a ttan ) andLus A n g e le s ; C a l i f o r n i a
13 c i t i e s - USAF a irb a n k sP h o en ixB r id g e p o r t , (TTV a s h ln g to n , D .C ,A t la n taC hicagoL o u i s v i l l eNew Y ork C ityD aytonP o r t l a n d , OR P i t t s b u r g Spokane A lb u q u erq u e
P h o e n ix -T ucscn
1975-1977
1 ^70-1975
1976
S t a t i s t i c a l
C hicago W ash ing ton D enverP h i la d e lp h ia C in c in n a t i San F ra n c i s c o L os A n g e le s
1970
1956-80D.C.
C om parison o f EPARM an d CRM m odels
R o llb a c kModel
C om parison o f s t u d i e s In s e v e r a l u rb an a r e a s w ith em p h as is on v e h i c l e em iss io n and volum e d a ta
T e m p era tu re V e h ic le e m is s io n
f a c t o r s VMT d i s t r i b u t i o n V ind sp e e d T r a f f i c c o u n ts M ix ing h e ig h t
d a t a f o r Los A nge le s
V e h ic le volum e V e h ic le e m is s io n s
V e h ic le e m is s io n In v e n to ry
1 ) An in v e r s e r e l a t i o n s h i p b e tw een CO and te m p e ra tu re was fo u n d .
2) S e a s o n a l I n c r e a s e s i n CO c o u ld n o t b e a t t r i b u t e d to th e te m p e ra tu r e dependence o f CO v e h i c l e e m is s io n s .
1 ) v e ry s i m i l a r p r e d i c t i o n s w e re o b ta in e d u s in g EPARM and CRM m o d e ls .
1 ) B a r ic s t a t i s t i c a l a n a ly s i s o f d a t a i s needed p r i o r to u s e o f th e m ode l.
V e h ic le e m is s io n 1 ) C om parisons o f R o llb a c k ,in v e n to r y
CAMP N etw ork d a ta T r a f f i c volum e
1 ) D a ta and f in d in g s from th e 1972 s tu d y by K o lr - v o r th w ere d is c u s s e d and s l m l l a r i c l e s w ere u sed f o r e s t a b l i s h i n g b a s ic a s s u m p tio n s .
1 ) M e te o r o lo g ic a l d a t a b a s e u s e w as n o t s p e c i f i c a l l y d i s c u s s e d .
1 ) The u s e o f d a t a b a s e s o t h e r th a n CO a r e n o t s p e c i f i e d
1) T h is i s n o t an a c t u a lC a u s ia n , and Box model r e s u l t s a s a p p l ie d to u rb an a r e a s t u d i e s a r e g iv e n and I t i s s u g g e s te d t h a t th e p r e s e n t d r iv i n g c y c le u sed to e v a lu a te v e h i c l e e m is s io n s b e reex am in ed g iv in g a a r e em phasis t o d r iv i n g mode.
s tu d y o f a s p e c i f i c u rb a n a r e a , b u t r a t h e r o f a " l i n e p o in t " ty p e o o d e l .
COO

A u th o rC s) andD a te oc P u b l i c a t i o n S tu d y A rea S tu d y P e r io d Type o f S tu d y
D ata B ases andP a ra m e te rs Used
in th e S tudy R e s u l t s Corcents
C hock , D .P . , e t a l . 1981
C a l i f o r n i a S o u th C o as t A ir B a s in
1973
C hock, D .P . , T e r r e l l , T .R . , an d L e v i t t , S .B . , 1975
R iv e r s id e ,C a l i f o r n i a
A ugust 1964 - J u n e 1972
C la g g c t t , M ., S h ro c k , J . , and h o l l , R .E .* 1931
K e lro s eP a rk ,I l l i n o i s(C h icagos u b u rb )
3 O c t . - 16 Novemb e r , 1978
T l n e - s e r l e s a n a ly s i s
( U n iv a r i a te a n a l y s i s o f w eek ly a v e ra g e s )
B o x -J c n k ln s M odel
D if f u s io nm odelp r e d i c t i o n s
E n v iro n m e n ta l L a g ra n n ia n S im u la to r o f T ra n s n o r t and A tm o sp h eric R e a c tio n s (ELSTAR)
E m issio n In v e n to ry LAIU'P ir .e a su re o en ta T o ta l liy d ro ca rb o n NO, NO,, CO. and
SO, e m is s io n d a ta
T e m p era tu re M ixing h e ig h ts V ind sp eed S t a b i l i t y c a te g o ry
W eekly a v e ra g e s o f 1) th e d a i l y maxima o f 0 . , CO, N O,, and t o t a l h y d ro - 2) c a rb o n s
R a d ia t io n i n t e n s i t y
Wind sp eed T e m p era tu re (d ry
and v e t b u lb )Dew p o in t V i s i b i l i t y Wind v e c to r
1 ) "The m odel p r e d i c t i o n s I n d i c a t e t h a t w ith n o n - v e h lc u la r e m is s io n s h e ld f ix e d ( a t th e 1973 l e v e l ) f u tu r e m otor v e h i c l e e m is s io n s w i l l r e s u l t in re d u c e d a tm o s p h e r ic co n c e n t r a t i o n s o f CO, NO, N 3-,0 , PAN, and UNO I f tic l e v e l s a r e h e ld c o n s t a n t , liow ever, th e n SO^ w i l l d e c r e a s e , b u t 0_ and PAN w i l l I n c r e a s e .
3)
CO in c r e a s e d by 7 .4 % /y r , in R iv e r s id e (b u t d e c re a s in g In Los A n g e le s a s o f 1 9 6 9 ). The R iv e r s id e CO d a t a i s non-horaogeneous and h a s 2 d a i l y p e a k s .H ig h e s t d a l l y maxima o c c u r In th e f a l l and w in te r .
A u to m a tic bag s a m p le rs f o r CO l e v e l s a t th e q u eu e ,
A c c e l e r a t i o n / d e c e l e r a t i o n and m id -b lo c k c r u i s e zones
Wind sp eed Wind D ir e c t io n T e m p era tu re A ttn osoho rlc
s t a b i l i t y T r a f f i c volum e
c o u n ts V e h ic le sp eed HIVAY Model MOBlLE-1 model
1) F req u en cy d i s t r i b u t i o n s w ere g iv e n .
2) H ig h e s t CO c o n c e n tr a t io n s o c c u rr e d d u r in g p ea k t r a f f i c v o lu m es , a t th e quene z o n e , and when w ind s p eed s w ere l i g h t to m o d e ra te
3) CO l e v e l s a r e h ig h e r a t s i g n a l i z e d i n t e r s e c t i o n s th a n a t fre e w a y s h av in g 2 -3 tim e s th e t r a f f i c volum e
4 ) The s u c c e s s o f HIWAY p r e d i c t i o n s was d ep e n d e n t oo th e e m is s io n r a t e s u s e d .
1 ) Model " s h o u ld b e co n f in e d to A d a y t im e , r .o n - s ta g n a n t c o n v e c t i v e p e r io d o v e r r e l a t i v e l y sm ooth t e r r a i n , "
2 ) E m iss io n d a t a was c s lm a ie d i n t e r p o l a t e d f o r m is s in g d a t a .
3) T h is i s a com plex m odel u s in g a o D v in g -g r ld : t r a j e c t o r y - i n p u t ty p e o f a n a l y s i s .
1 ) M is s in g d a t a i n th e p o l l u t a n t d a t a b a s e n e c e s s i t a t e d th e u se o f w eek ly a v e r a g e s .
2 ) U n iv a r i a te a n a l y s i s I s s a t i s f a c t o r y when a l l c o n t r o l l i n g v a r i a b l e s do n o t d e v i a t e from t h e i r p r o j e c t e d c o u r s e ; o th e r w is e m u l t i v a r i a t e a n a l y s i s i s m ore d e s i r a b l e
I ) T h is s tu d y was c o n c e rn e d p r im a r i l y w i th th e in f l u e n c e o f t r a f f i c on CO l e v e l s w ith o th e r p a ra m e te r s r e c e iv in g l e s s w e ig h t i n th e m o d e lin g p r o c e s s .

A u th o rC s) andD ate oi P u b l lc tc l o i ; S tudy A rea S tu d y P e r io d Type o f S tu d y
D ata B ases andP a ra m e te rs Used
In th e S tudy R e s u l t s Coaenta
D a b b e r t , W .F ., Ludw ig , F .L . , and Johnson» W .B ., J r . , 1973
San J o s e ,C a l i f o r n i a ,andS c . L o u is , M is s o u r i
Aug, - Oct. 1971
D erw en t, R .G ., an d Kou, 1980
LondonU.K.
J u n e 1 6 , 1973
1974 -75
G reen , K . J . , B u l l i n , J . A . , an d P o la s e k , J . C . , 1979
£1 P aso S an A n to n io
1977(< 1 y r . )
K aag en so n , P .L . 1979
D enver 1968 -75
U rban Canyon ( i . e . l o c a l i z e d phenom ena)
U rban d i f f u s i o n m odel
N u m erica l s im u l a t i o n te c h n iq u e s a p p l ie d to a b o x m odel
CALINE-2AlRPOL-4TRAPSHIVAY( l i n e s o u r c e )
S t a t i s t i c a la n a l y s i s
APRi\C-lA ( m u l t i p u rp o se d i f fu s io n m odel)
V e h ic le e m is s io n In v e n to ry
M ix ing h e ig h ts a tm o s p h e r ic s t a b i l i t y ty p e
T r a n s p o r t w ind sp eed
Wind d i r e c t i o n No d i r e c t o b s e r
v a t io n s o f in p u t d a t a I s r e q u i r e d .
180 Model s p e c i e s ( p o l l u t a n t s )
M ix ing h e ig h t E m iss io n I n v e n to ry
d a ta D e p o s i t io n F lu x D e p o s i t io n V elo c
i t y T e m p era tu re R e la t i v e h u m id ity R a te c o n s ta n ts Wind d i r e c t i o n Wind sp eed V e h ic le e m is s io n
and In v e n to ry d a ta
H o r iz o n ta l w ind sp eed
5 , 35 , 4 7 , 6 102 f t . CO d a ta and m e te o ro lo g y d a ta (w ind a n g le , w ind d i r e c t i o n , w ind sp e e d )
V e h ic le e m is s io n in v e n to ry and c o u n ts
M ix ing h e ig h t Wind sp eed V e n t i l a t i o n D egree o f S ta
b i l i t y Wind d i r e c t i o n
1) O b se rv ed and c a l c u l a t e d v a lu e s f o r CO f o r S e p t . 1 3 - 19 and 20- 2 6 , 1971 a r e show n.
2) The model g e n e r a l ly p e rfo rm s w e l l , b u t te n d s t o o v e r e s t im a te h ig h CO c o n c e n tr a t i o n s and u n d e r p r e d i c tlow c o n c e n t r a t i o n s .
1) C om puter s im u la t io n te c h n iq u e s may b e u sed to e v a l u a t e th e e f f e c t s o f v e h i c le e x h a u s t e m is s io n c o n t r o l s t r a t e g i e s on p h o to c h c m i- c a l l y g e n e ra te d se c o n d a ry p o l l u t a n t s .
2 ) >HC e m is s io n s p rom o te th e fo rm a tio n o f p h o to c h e m ic a l p o l l u t a n t s and >N0 e a l s - s lo n s i n h i b i t t h e i r f o r m a tio n ( i n t h e London r e g io n )
1 ) D ata was u sed I n th e 4 m odels to p r e d i c t th e t r a j e c t o r y o f th e l i n e s o u rc e plum e and d a ta was u sed to v e r i f y p r e d i c t i o n s
2) D i f f i c u l t y i n s i t e l o c a t i o n was one p ro b lem In th e s tu d y
1) P o l lu t i o n e p is o d e s r e s u l t from a d v e rs e m e te o ro lo g ic a l c o n d i t io n s ( I . e . in v e r s io n s ) and I s enhanced by to p o g ra phy c h a r a c t e r i s t i c s .
1) t h i s s tu d y I s c o n c e rn e d p r i n c i p a l l y v i-H m o d e lin g CO l e v e l s In u rb a n c a n y o n s in r e s t r i c t e d g eo g r a p h ic a l a r e a s .
2 ) T h is m odel d o es h ave f l e x i b i l i t y f o r in p u t p a r a m e te r s .
1 ) The o r i e n t a t i o n o f t h i s model i s s tu d y o fth e c h e m ic a l r e a c t io n s a n d i n t e r a c t i o n s o c c u r r i n g in th e a m b ien t a i r
2) CO r e c e iv e s l i m i t e d a t t e n t i o n in t h i s s tu d y .
3) No d a t a a r e g iv e n f o r h i s t o r i c a l p o l l u t a n t p r o f i l e s o f th e s tu d y a r e a
1 ) Wind s h e a r e f f e c t s o b s e rv e d in E l P aso a r e some o f th e f i r s t o f t h i s ty p e o f phenom ena d i r e c t l y r e l a t e d to COd a t a r e p o r t e d i n th e l i t e r a t u r e .
2 ) T h is i s n o t a t r u e am b ien t a i r s tu d y , b u t r a t h e r a l o c a l i z e d phenom ena s tu d y .
1 ) F req u en cy d i s t r i b u t i o n s , s c a t t e r p l o t s , and d a t a p l o t s w ere th e m a jo r m ethods u se d to exam ine th e d a t a .

A uchor(s> andDace o f P u b l ic a t i o n S tu d y A rea
H lr tz e X i C .S .» and C h icago Q uon, l . E . t 1978
S tu d y P e r io d Type o r S tu d y
D ata B ases andP a ra m e te rs Used
In th e S tudy R e s u l t s C osaecca
J a n . 1973 - J u n e 1976
Tlme-aerlea 1 h o u r r e a d in g s from CAMP s t a t i o n in C h icago
H o u rly a v e ra g e s M onthly CO means Auto c o r r e l a t i o n
a n a ly s i s R a t io o f v a r i a n c e
l i s t to d e t e r m ine in d e p e n d en ce
F req u en cy d i s t r i b u t io n s
1} The d a t a show r e l a t i v e l y few in d e p e n d e n t o b s e rv a t i o n s i n a c o n tin u o u s r e c o rd o f CO ra e a su re n e n ts .
2 ) The p a t t e r n o f a u to c o r r e l a t i o n fu n c t io n was found to be p e r s i s t e n t .
3 ) D iu rn a l an d s e a s o n a l p a t t e r n s w ere c o n f irm e d .
1) T h is s tu d y shows th e b e h a v io r a l p a t t e r n s o f CO w i th t l c e , b u t d o es n o t I n v e s t i g a t e c a u s a t io n / Im p a c tin g v a r i a b l e s
J o h n so n , K .L ., D v o re tc k y , L .H ., and H e l l e r , A .M ., 1968
J o h n so n , V .B ., e c m l . , 1973
K nox, J . B . , 1974
L a r s e n , R . I . , 1969
L in c o ln , D .R ., a n d R ub in , E .S . , 1980
Hew Y o rk , New Y ork
San J o s e , C a l i f o r n i a
6 J a n . - 17 May, 1967 and30 J u ly - 14 S e p t . , 1967
N o v .-D e e , 1970
San F ra n c is c o J u ly 1968
C h icago C in c in n a t i Los A n g e le s F h l l a d e l p h l l a San F ra n c is c o W a sh in g to n , D .C .
P i t t s b u r g
3 y e a r s 1961-64
1975
S t a t i s t i c a lA n a ly s is
D if f u s io nS im u la t io nM odel
D if f u s io nm odel
(L a g ra n g ia nandE u l e r l a n -L a g ra n g ia n )
S t a t i s t l c a l -m a th e t l c a lm odel
S t a t i s t i c a la n a l y s i s
T r a f f i c volum e CO d a t a
T r a f f i c In v e n to ry T r a f f i c volum es G e o g ra p h ic a l a r e a T r a n s p o r t w ind
d i r e c t i o n and sp eed
M ix ing d e p th A tm o sp h e ric
s t a b i l i t y c a te g o ry
C loud p a th and h e ig h t
Wind sp eed
CO d a t a
A lle g h e n y C ounty B ureau o f A ir P o l lu t i o n Cont r o l(BAPC) D ata f o r CO, TSP, COM
1 ) CO c o n c e n t r a t io n lo g s t r a f f i c vo lum e.
1 ) R e a so n a b le p r e d i c te d and o b s e rv e d v a lu e s w ere o b ta in e d u s in g th e m o d e l.
2 ) A l i m i t e d a r e a was s tu d ie d to p ro v id e c o m p o s ite d a ta f o r a l a r g e u rb a n m ode l.
1 ) R ea so n a b le ag ree m en t was o b ta in e d betw een p r e d i c te d and o b s e rv e d v a l u e s .
1) The m odel p r e d i c t s p o l l u t a n t c o n c e n t r a t io n a s a f u n c t io n o f a v e ra g in g t i n e and f r e q u e n c y .
2 ) A l l c o n c e n t r a t io n s a r e~ lo g -n o rm a lly d i s t r i b u t e d .
1 ) C om parisons o f w eekday and w eekend p o l l u t a n t c o n c e n tr a t i o n s w ere made.
2 ) C o r r e l a t i o n s among p o l l u t a n t s was p e r fo rm e d .
1 ) T h is i s a v e ry l i m i t e d s tu d y t h a t u t i l i z e s o n ly t r a f f i c and CO r e l a t i o n s h i p s . No m e te o r o lo g ic a l d a t a v a s I n c lu d e d .
1 ) The m odel was d e v e lo p e d and c a l i b r a t e d onSan J o s e d a ta and v e r i f i e d on d a t a f r o a 5 o th e r c i t i e s .
2 ) T h is s tu d y c o n c e n tr a te d on c i d - b lo c k s t r e e t canyon e f f e c t s .
1 ) T h is model c o n s id e r s o n ly t r a n s p o r t and d e p o s i t io n phenom ena.
2 ) The model do es n o t p ro v id e a t o t a l a n a ly s i s o fSan F r a n c is c o a m b ien t a i r .
1 ) No c a u s e - e f f e e t was c o n s id e r e d by th e m odel - o n ly c o n c e n t r a t io n p a t t e r n s .
1 ) No d i r e c t t r a f f i c c o u n t d a ta w as o b ta in e d .
2 ) No m e te o r o lo g ic a l p a r a m e te r s w ere in c lu d e d .

A u th o r(8 ) andD a te o f P u b llc a C lo o S tu d y A rea S tu d y P e r io d Type o f S tu d y
D ata B ases andP a ra m e te rs Used
i n th e S tudy R e s u lt s C o rs e n ts
t e d o l c e r , . J . and T la o , C .C . , 1979
Kew J e r s e y a t 1971 t o 1977 C azd en , A n co ra ,E l i z a b e th ,J e r s e y C i ty , and S o z e r t l l l e
I n t e r v e n t io n t i n e s e r i e s (ARIMA) and r e g r e s s io n a n a l y s i s w ere u sed to deter** z i n c th e io p a c t o f th e New J e r s e y c a r i n s p e c t io n p ro g ram on CO l e v e l s .
H ourly CO r e a d in g s 1) from C andcn,A n co ra , E l iz a b e th , J e r s e y C i t y , and S o r .e r v l l l e , New 2) J e r s e y
NO.\A duca from 3)P h i l a d e lp h i a , N cw ard, and New 4) York
M onthly means T ra n sfo rm e d raw 5 )
d a t a , CO Wind sp eed Wind d i r e c t i o n R e la t i v e h u m id ity M ixing h e ig h t T e m p era tu re P r e c i p i t a t i o n S ea l e v e l p r e s s u r e
The d a t a w ere c o n d i t io n e d f o r tim e and w ind d i r e c t i o n f o r r e g r e s s io n o o d e l a p p l i c a t i o n .CO i s I n v e r s e ly r e l a t e d to w ind sp eedCO h a s a s t r o n g n e g a t iv e l i n e a r r e l a t i o n s h i p w ith n ix in g h e ig h t M ix ing h e ig h t h a s a s t r o n g c o r r e l a t i o n w ith r e l a t i v e h u a l - d l t yU sing tim e s e r i e s a n a ly s i s i t was found t h a t a ) th e b e s t p r e d i c to r f o r m orn ing CO v a lu e s I s a l i n e a r c o m b in a tio n o f m o rn in g , noo n , and ev e n in g v a lu e s from th e p re v io u s day b ) f o r noon - th e c o rn in g v a lu e s and c ) f o r e v e n in g - th e c o m in g and noon v a lu e s o f CO
1) TTils I s one o f th e c o s t c o m p le te s t a t i s t i c a l s t u d i e s o f CO fo u n d lo th e l i t e r a t u r e . L l n e a r l l y p ro b le m s In th e d a t a r e l a t i o n s h i p s w ere o v e rc c c e by u s in g a v e ra g in g t e c h n iq u e s .
L iu , C .Y ., and G ood in , W .R ., 1976
L os A n g e le s . 29 A u g ., 1967
2 -d lm e n s lo n s lt r a n s p o r tm odel
I n v e r s io n b a s e h e ig h t
Wind f i e l d T u rb u le n t
d i f f u s i v i t v S o u rce In v e n
to r y T r a f f i c c o u n ts
1 ) The m odel v e r i f i e s th e a s s u m p tio n o f a w e l l - c ix c d m a rin e l a y e r .
2 ) D if f u s io n e f f e c t s a r e s m a ll com pared to a d v c c t io n f o r p r e d i c t i o n p u rp o s e s .
3 ) Boundary u n c e r t a in t y f o r I n v e r s io n l a y e r and g round l e v e l I s a v o id e d in th e m ode l.
1 ) A lth o u g h th e m odel g iv e s good p r e d i c t i o n th e s tu d y doe* n o t p ro v id e a h i s t o r i c a l p r o f i l e o f th e s tu d y a r e a .
L iu , K .K ., W l.ltney , D .C ., and R o th , P .M ., 1976
L os A n g e le s 29 S e p t . 1969
N u m erica l M odel ( a i r s h e d ty p e m odel)
Wind sp eed V e r t i c a l d i f f u s i -
v l t y M ix ing d e p th R a d ia t io n I n t e n s i t y E m iss io n r a t e
1 ) Good g e n e ra l p r e d i c t i o n s w ere 1 ) A lth o u g h o o d e l v e r l f l -o b ta ln e d f o r q u a l i t a t i v e e s t l e a t l o n s on I c p a c t s o f e n v iro n m e n ta l c h a n g e s .
c a t i o n r e s u l t * w ere good no h i s t o r i c a l p ro f i l e o f th e a r e a o r i c p a c t l n g f a c t o r s was g iv e n .
M c C o l l l s te r , G .H ., a n d W ilso n , K .R ., 1975
M cCormick, R .A ., a n d X in ta r a s , C . , 1962
Los A n g e le s B a s in
N ashville ,T e n n e sse eandC in c in n a t i ,O hio
1972
26 A p r i l - 5 May, 1969
Kay 1 0 -2 6 , 1960
T i o e - s e r i c sm odel
S t a t i s t i c a lA n a ly s is
L os A n g e le s C ounty 1 ) A s im p le o n e - d l z e n s lo n a l A ir P o l lu t i o n t l m e - s e r l e s o o d e l ca n beC o n tro l D i s t r i c t u sed to p r e d i c t p o l l u t a n t(LAAPCD) d a t a
CO d a taT r a f f i c c o u n ts Wind sp e e d Wind d i r e c t i o n
c o n c e n t r a t i o n s .
1 ) CO l e v e l s an d t r a f f i c d e n s i t y h ad a m o d e ra te d e g re e o f c o r r e l a t i o n .
1 ) Ko c e t e o r o l o g i c a l p a r a - c e t e r s w ere I n c lu d e d .
2 ) C uases o f d a t a b e h a v io r w ere n o t exam ined - o n ly th e b e h a v io r o f p o l l u t a n t l e v e l* w ith t im e .
1 ) C o r r e l a t i o n s w ere made s e p a r a t e ly on CO and th e o th e r p a ra m e te r* .
2 ) No m odel was d e v e lo p e d f o r p o l l u t a n t b e h a v io r .

A u th o rC s) andD a te o f P u b l i c a t i o n S tu d y A rea S tu d y P e r io d Type o f S tudy
D ata B ases andP a r a a e t e r s Used
in th e S tudy R e s u l t s C osaeoea
N ic h o ls o n , S .E . , 1975
N o rb eck , J .M ., C hang, T .Y . , an d W e ln s to ck , B . , 1979
M ad ison ,W isc o n s in ;C h ic ag o ,I l l i n o i s ;F r a n k f u r t ,C em any
M an h a ttan (New Y ork)
1968-1970
1970
S c a la r b u d g e t - b ox d i f f u s i o n model
S t a t i s t i c a l A n a ly s is and
2 com ponent
CO d a taT r a f f i c C ounts C e o s tro p lc w ind
Speed
T r a f f i c c o u n ts T r a f f i c in v e n to r y CO d a t a Wind s p e e d s
1) V o rte x c i r c u l a t i o n d ev e lo p e d In s t r e e t c anyons o u s t be c o n s id e r e d in a Q O d c l .
2) The m odel p r e d i c t i o n s w ere a c c u r a te f o r a l l 3 c i t i e s .
1 ) CO l e v e l s and t r a f f i c c o u n t r e l a t i o n s h i p s a r e s t r o n g ly in f lu e n c e d by m e te o r o lo g ic a l phenom ena.
1) The m odel I s a p p l ie d t o i n d i v id u a l s t r e e t s and n o t th e e n t i r e c i t y .
2 ) A lth o u g h p r e d i c t i o n v a lu e s w ere g o o d , no h i s t o r i c a l p r o f i l e s o r t r e n d s w ere ex am in ed .
1 ) T h is I s one o f th e few s t u d i e s CO a d d re s s c a u s e - o b s e rv e d e f f e c t s , h o w ev er, i t i s f o r a s p e c i f i c and l i m i t e d s i t u a t i o n .
O t t , V .R ., and M age, D .T ., 1981
lîe a s b e rg , E .E . , B u z l ia , J . J . . and W oodbury, G .E ., 1979
64 USA c i t i e s
San J o s e , C a l i f o r n i a d a t a w as u sed e x t e n s iv e l y
Ham pton,V i r g in i a
1971
O c t. and N ov. 1976 (2 -4 8 h r . p e r io d s )
RANDOMAIR s t a t i s t i c a l a n a ly s i s u s in g random
B o x -d if f u s io n model
CO d a ta
CO d a ta M ix ing h e ig h t T e m p era tu re Wind sp eed Wind d i r e c t i o n
1 ) A r e l a t i v e l y p r e c i s e e s t i m ate (95% c . i . ) o f a n n u a l a v e ra g e s can b e made u s in g random sa m p lin g o f CO.
1) L a rg e s c a l e s u b s ld a n c c in v e r s io n s a id in d e v e lo p in g h ig h n o c tu r n a l l e v e l s o f CO, ev e n th o u g h t r a f f i c i s s i g n i f i c a n t l y r e d u c e d .
1 ) T h is i s a p r e d i c t i v e m odel and d o es r o t show h i s t o r i c a l p r o f i l e s o r c a u s e - e f f e c t r e l a t l c n s h l p s .
1 ) T h is i s a v e ry good examp le o f a c a u s e - e f f e c t s tu d y ; h o w ev er, lo n g - te rm t r e n d s and b e h a v io r a r e n o t e x p lo r e d .
R e y n o ld s , S .D ., e t a l . , 1974
Los A n g e le s a i r s h e d
1969( f a l l - 6 d a y s )
T a u b e r , S . . 1978
T la o , C .C . , Box, G .E .P . , an d Hamming, W . J . , 1975
P o r t l a n d ,O regon
L os A n g e le s
1972-1973
1955-1972
M ath e m a tic a lmodel(u rb a n a i r sh ed m odel)
S t a t i s t i c a lA n a ly s is
S c a c l s c i c a lA n a ly s is
EPA p o l l u t a n t d a ta b a s e f o r CO and KOjç ayatetr.8
T r a f f i c c o u n ts Wind sp eed Wind d i r e c t i o n M ix ing h e ig h t
CO d a ta Wind s p e e d Wind d i r e c t i o n T e m p era tu re P r e c i p i t a t i o n
LA/»PCD-CO d a t a I n v e r s io n b a s e
h e ig h t M ix in g h e i g h t Wind sp eed Wind d i r e c t i o n T r a f f i c p a t t e r n s
1 ) Good a g r c c c e n t b e tw e en p r e d i c t e d and o b s e rv e d v a lu e s w as o b ta in e d .
2) A m ore c o m p le te s e n s i t i v i t y a n a l y s i s was r e c o n -c n d e d .
3) T r a f f i c and CO r e l a t i o n s h i p s and e f f e c t s by m e te o r o lo g ic a l p a ra m e te r s a r e w e ll c o r r e l a t e d .
1 ) CO l e v e l s can b e p r e d i c te d from p a t t e r n r e c o g n i t i o n e s p e c i a l l y when m e te o ro lo g ic a l p a ra m e te r s a r e u s e d .
1 ) W hile p r e d i c t i o n c a p a c i ty i s good f u r t h e r w ork w ould e x p l a in th e s e n s i t i v i t y o f CO l e v e l r e s p o n s e to v a r io u s e n v iro n m e n ta l f a c -
1 ) A lth o u g h CO I s p ro d u ced by t r a f f i c , i t s c o n c e n t r a t io n s a r c v e ry s e n s i t i v e to m e te o ro l o g i c a l c h a n g e s .
2 ) S e a s o n a l and d iu r n a l t r e n d s a r e shown a t d i f f e r e n t lo c a t i o n s .
1) A lth o u g h th e s tu d y p e r io d i s l i m i t e d i t show p ro m ise f o r l a r a e r t i s e - s c a l e a p p l i c a t i o n s .
1 ) T h is i s o n e o f th e c l a s s i c a i r - p o l l u t l o n c a s e h i s t o r y s t u d i e s .

A u th o r( • ) andD ate o f P u b l i c a t i o n S tu d y A rea S tu d y P e r io d Type o f S tu d y
D ata B ases andP a ra m e te r s Used
In th e S tudy R e s u lt s Cos& enta
V ang, V , , and Shawn, J . H . , 1970.
C h icago 1969D enverC in c in n a t iP h i la d e lp h i aS c . L o u isV a s h ln g to n , D .C .
U i t z , S . , an d Los A n g e le s 1979M oore, A .B ., J r . ,198 1 .
S ta C lB C lc a lA n a ly s is
S t a t i s t i c a lA n a ly s is( r e g r e s s io na n a l y s i s )
CO d a ta b a s e from 1 ) CO l e v e l s sh o v ed d iu r n a l an d 1 ) T h is l a a v e ry b r i e f a r t l -EPA
Wind sp eed Wind d i r e c t i o n
seasonal variations corresponding CO changes in traffic and ectcorologlcal factors.
c l e an d g iv e s l i t t l e d e t a i l e d d a ta a n a l y s i s .
2 ) C o r r e l a t i o n s h i s t o r i c a l t r e n d s and p r o f i l e s a r e n o t d is c u s s e d .
LAAPCD p o l l u t a n t 1 ) Good a g r e e n c n t was o b ta in e d 1 ) L i t t l e d e t a i l w as g iv e nd a ta
Wind sp eed I n v e r s io n b a s e
h e i g h ts Wind d i r e c t i o n T e m p e ra tu re T r a f f i c c o u n ts
b e tw e en o b s e rv e d and p r e d i c t e d v a l u e s .
2) CO v a lu e s a r e a f u n c t io n o f t r a f f i c volum e and h e a v i ly in f lu e n c e d by c e t e o r o l o g l c a l c o n d i t i o n s .
f o r a n a l y s i s c e tb o d s a l th o u g h th e r e was l i b e r a l u sa g e o f g r a p h s .
Oun

APPENDIX D
CO SAMPLING SITE DESCRIPTIONS
196

197
CONNIE 6 - EL PASO - TAQCR II (TACB, 1975)
" P ro jec t Connie s t a t i o n 6 i s lo c a te d a t 500 Campbell S t r e e t , El
P aso , E l Paso County, Texas. The s i t e is w i th in a t r ia n g l e formed by
I n t e r s t a t e 10 running NE to SW, Campbell S t r e e t th a t runs NW and SE,
and the IH 10 a c c e s s road from Campbell S t r e e t where Campbell S t r e e t
i n t e r s e c t s M is so u r i S t r e e t . T his l o c a t i o n i s l a t i t u d e 3 1 ° 45 ' 45" and
lo n g i t u d e 106° 29' 10". The e l e v a t i o n i s 3 ,9 1 8 f e e t above mean sea
l e v e l . Connie 6 was dep loyed to Texas A ir Q u a l i ty C ontrol Region 11 in
l a t e O ctober , 1973, and con tin uou s sampling o f ambient a i r began a few
days l a t e r . The s t a t i o n has op erted c o n t in u o u s ly on th a t s i t e s in c e
deployment to E l P aso .
The area im m ediately surrounding s t a t i o n 6 i s p r im a r i ly a
r e s i d e n t i a l and commercial b u s in e s s a r e a . There are no heavy
i n d u s t r i a l com plexes w i th in about 0 .7 5 m i le o f the s t a t i o n . A r a i lr o a d
p a sse s b eneath Campbell S t r e e t about 200 f e e t s o u th e a s t o f Connie 6 .
A lthough t h i s r a i l r o a d i s m od erate ly h e a v i l y u sed , no s i g n i f i c a n t
e f f e c t on the m o n ito r in g instrum ent re a d in g s has been observed to d a te .
From about 0 .7 5 m i le to th ree m i le s from the s i t e th ere are fe rro u s and
n o n - fe r r o u s m eta l fo u n d r ie s , f a b r ic a t o r s and s m e l t e r s . These l i e from
ENE to WNW from th e s i t e and c o n tr ib u te p a r t i c u l a t e s , heavy m e ta ls and
s u l f u r d io x id e to th e monitored ambient a i r .
Much o f m e tr o p o l i ta n Ciudad J u a rez , M exico, l i e s w i th in one to
th ree m i l e s south to s o u th e a s t o f th e Connie 6 s i t e . While s p e c i f i c
. in fo rm a t io n co n cern in g p o l l u t i o n c o n t r ib u t io n s i s not a v a i l a b l e , there
a re some i n d i c a t io n s th at hydrocarbons and p a r t i c u l a t e s from Juarez are

1 0 8
c a r r ie d to the s i t e by the sou th to s o u t h e a s t e r ly winds th a t are
p r e v a le n t about 20% o f the y ea r .
Between th ree and s ix m i l e s from th e s t a t i o n are p e tr o c h e m ic a l -
r e la t e d companies and r e f i n e r i e s , m eta l sa lv a g e y a r d s , and
c o n s t r u c t i o n - r e l a t e d companies such as rock q u a r r ie s , sand ■p i t s and
paving m anufacturing o p e r a t io n s . There i s a l s o a cement p la n t , an a c id
p la n t , a c o t to n m i l l and a power p la n t . The p e tr o le u m -r e la t e d
in d u s t r i e s in g e n e r a l l i e ENE from the s t a t i o n . The o th e r s l i e from
ENE to IVNW from the s i t e . T hese i n d u s t r i e s and m anufacturers
c o n t r ib u t e p a r t i c u l a t e m a tter , s u l f u r d io x id e , hydrogen s u l f i d e , heavy
m e t a l s , hydrocarbons and n i t r o g e n d io x i d e . Due to th e v a r y in g
p r e v a i l i n g w in d s , on o c c a s io n a l l o f th e s e p o l l u t a n t s are c a r r ie d to
the m o n ito r in g s t a t i o n . S e v e r a l m eta l p r o c e s s in g and f a b r i c a t io n
in d u s t r i e s l i e about 18 m i le s NNE and NW o f the s i t e . ï fh i le they
c o n t r ib u t e heavy m e ta ls and p a r t i c u l a t e s to the R egion 11 p o l l u t i o n
l e v e l , the e f f e c t o f th e t e r r a in on th e p r e v a i l i n g winds o f the area
makes t h e i r c o n t r ib u t io n to the m onitored p o l l u t i o n l e v e l s d i f f i c u l t to
e v a lu a t e .
The E l Paso area i s unique and t h i s makes the d e f i n i t i o n o f
ambient a i r c o n d i t io n s in the c i t y q u i t e d i f f i c u l t . The a d ja ce n t rows
o f m ounta ins , and t h e i r e f f e c t on wind d ir e c t i o n s as w e l l as t h e i r
e f f e c t on tem perature in v e r s i o n s , cau se w id e ly d iv e r g e n t .ambient a i r
c o n d i t io n s w i th in the c i t h o f E l P aso .
Campbell S t r e e t , a d ja ce n t to Connie 6 , i s a ra th e r h e a v i l y
t r a v e le d s t r e e t and i s a c o n n e c t iv e a c c e s s s t r e e t t o IH 10. The l a t e
March, 1974, t r a f f i c f lo w , e x tr a p o la t e d from a sh o r t terra 1973 t r a f f i c

199
co u n t , in d ic a te d th a t the average d a i l y t r a f f i c fo r th at time o f year
i s 13,651 v e h i c l e s per day p a s t the i n t e r s e c t i o n o f F ra n k lin and
Campbell. I n t e r s t a t e 10 p a sse s beneath Campbell S t r e e t about 250 f e e t
n orthw est o f the s t a t i o n . The l a t e March, 1974 average d a i l y t r a f f i c
f low , a s c e r ta in e d for Campbell S t r e e t , was 19 ,704 v e h i c l e s per day.
The average d a i l y t r a f f i c f low fo r the same period on Campbell S t r e e t
northw est o f the IH 10 a c c e s s road was 9 ,3 8 0 v e h i c l e s per day.
Connie 6 i s s i t u a t e d in a v ery e x c e l l e n t p o s i t i o n to en a b le
m on itor in g for p o l l u t a n t s from n e a r ly a l l o f the heavy in d u s tr y
em iss io n so u rces in the c i t y . The t e r r a i n a s s i s t s the n o r th e r ly winds
in c a r ry in g the em is s io n s from the s m e l t e r s , power p la n t s and cement
f a c t o r i e s to the s i t e . The same mountainous t e r r a in a s s i s t s the e a s t
to n o r t h e a s t e r ly winds in c a r ry in g the e m is s io n s from the p etro leum
r e la t e d i n d u s t r i e s , a c id p la n t , fo u n d r ie s and c o n s t r u c t i o n - r e l a t e d
i n d u s t r i e s to the m o n ito r in g s t a t i o n . The annual p r e v a le n t winds a t E l
Paso are in d ic a te d by the wind r o se on the E l Paso area map. They are
from the w est to north 20%, north to e a s t 27%, e a s t to south 25.5%, and
south to w est 27.5% o f the t im e ."

2UÜ
CONNIE 12 - EL PASO - TAQCR 11 (TACB, 1975)
"P ro jec t Connie s t a t i o n 12 i s lo c a te d in A scarate Park a t 6950
Alameda Avenue, E l P aso , El Paso County, T exas , l a t i t u d e 31° 4 5 ' 13"
and lo n g itu d e 106° 24' 15". The e l e v a t i o n i s 3 ,6 9 5 f e e t above mean sea
l e v e l . Connie 12 was deployed in l a t e J u ly , 1974, and began continuous
o p e r a t io n J u ly 31, 1974. , Tnis s t a t i o n l i e s w i th in the j u r i s d i c t i o n o f ,
and i s operated by, Texas Air Q u a l i ty C on tro l Region 11. I t was the
second s t a t i o n s i t e d in E l Paso , w ith Connie 6 being the f i r s t .
The s t a t i o n i s near the. c e n t e r o f the park on the west s id e o f
A sca ra te Lake, a 44 acre man-made la k e used fo r f i s h i n g , swimming, and
p le a s u r e b o a t in g . The 4 2 0 -a c re county park h a s , in a d d it io n to the
la k e , a g o l f c o u r se , an amusement park, and a f i r e s t a t i o n w ith a
f ir e m e n 's t r a in in g c e n t e r . South o f the Connie s i t e about 2 /3 m ile i s
th e Rio Grande R iver which borders M exico. On the Mexican s i d e i s
m o s t ly open land w ith the c i t y o f Ju arez approxim ately 3 m i le s
so u th w est . Surrounding the park e a s t , w e s t , and northw est are
r e s i d e n t i a l a r e a s . From about 1 to 2 m i le s north and n o r th ea s t o f the
Connie are v a r io u s la r g e in d u s t r i e s in c lu d in g an a c id p la n t , a copper
r e f i n e r y , and s e v e r a l p e tr o le u m -r e la te d r e f i n e r i e s . These emit
pred om in ate ly hydrogen s u l f i d e , s u l f u r d io x id e , hydrocarbons, and
p a r t i c u l a t e . Winds from between NNE and ENE which blow 19% o f the time
ca rry th e s e p o l l u t a n t s toward th e s i t e . The E l Paso I n te r n a t io n a l
A ir p o r t i s 3 m i le s n o r th ea s t o f the Connie, and the c i t y ' s b u s in e s s
d i s t r i c t i s 4 - 1 / 2 m i le s WNW. Approxim ately 7 m i le s northw est o f Connie

201
12 are s e v e r a l c o n s t r u c t i o n - r e l a t e d i n d u s t r i e s and a la rg e metal
sm e lter and r e f i n e r y .
The on ly major roadways in the v i c i n i t y o f Connie 12 are to the
north and run g e n e r a l l y p a r a l l e l s o u th e a s t to w e s t . Highway 20, 0 .6
m ile north o f the s i t e , c a r r i e s an average d a i l y volume o f 30 ,000
v e h i c l e s . Highway 76, 1 m ile north o f the Connie, has an average d a i l y
t r a f f i c f low o f 1 3 ,0 6 0 . Two m ile s north o f the s t a t i o n i s I n t e r s t a t e
10 w ith an average d a i l y t r a f f i c count o f 5 6 ,3 6 0 ."

APPENDIX E
SAMPLING DEVICES
202

2W3
S t a t i o n D esign (TACK, 1975)
"The Texas co n t in u o u s m on itor in g s t a t i o n s have been d e s ig n e d ,
purchased , c o n s tr u c te d and f i e ld e d by Texas A ir C ontrol Board
p e r so n n e l . T his e f f o r t has r e s u l t e d in an in e x p e n s iv e y e t h igh q u a l i t y
m o n ito r in g s h e l t e r or p la t fo rm . A number o f in n o v a t iv e d e s ig n f e a tu r e s
have been employed. These make the s t a t i o n s p a r t i c u l a r l y w e l l s u i t e d
fo r measuring ambient a i r p o l lu t a n t c o n c e n tr a t io n s a t the p a r ts per
m i l l i o n and p a r ts per b i l l i o n l e v e l .
To a ssu re long term use and r e l i a b i l i t y , as w e l l as p r o v id in g
fo r c l o s e c o n tr o l and s t a b i l i t y o f th e i n t e r n a l ambient tem perature ,
the TACB found i t n e c e s s a r y to d e s ig n a new -type instrum ent s h e l t e r or
s t a t i o n h o u s in g . S p e c ia l d e s ig n f e a t u r e s in c lu d e w in dow less
c o n s t r u c t io n , a s p e c i a l s a f e t y v e n t i l a t i o n system , heated sam pling
m a n ifo ld , and a s p e c i a l w a l l c o n s tr u c t io n u s in g a 3" p ressu re-bon d ed
lam in ate o f f i b e r g l a s s , plywood, and 1%" san dw ich-type s tyrofoam
i n s u l a t i o n . T h is c o n s t r u c t io n i s s i m i l a r to th e type p ro v id in g
s a t i s f a c t o r y s e r v ic e for many companies on s i t e l o c a t i o n s throughout
v a r i a t i o n s o f weather c o n d i t io n s th a t meet or exceed th o se found in th e
S t a t e o f T exas . The c o n tr o l and s t a b i l i t y o f the s t a t i o n s in t e r n a l
tem perature i s req u ired to a ssu re c o r r e c t in stru m en t o p e r a t io n .
The s h e l t e r was d es igned w ith 10 f o o t by 10 fo o t by 24 fo o t
d im ensions to in su re a generous amount o f space in the instrum ent room
(10 f e e t by 20 f e e t ) and in the u t i l i t y room (10 f e e t by 4 f e e t ) . T his
e x tr a w idth fe a tu r e has saved a tremendous number o f man-hours d ur in g
instrum ent i n s t a l l a t i o n and m aintenance. I t has more than compensated

204
for Che minor problems a s s o c ia t e d w ith moving a 1 0 - fo o t wide t r a i l e r on
p u b l ic h igh w ays." The layout o f a t y p i c a l s t a t i o n i s shown in F ig u re
E -1 .

20'-)
©
®rT-%:
ATMOSPHERIC MONITORING STATION
TEXAS AIR CONTROL BOARD
D Z : . " z a ©
©
3 ®
- ©
F ig u re E -1 . Continuous M on itor in g S t a t io n Systems Layout (TACB, 1975)

20f)
i G R c n d
Item Number I d e n t i t y
1 Wind D ir e c t io n sen so r
2 Wind Speed sen so r
3 Ambient Temperature se n s o r
4 THG/CIl^/CO Environmental Chromatograph
5 Spare Monitor s t a t i o n , Main bench
6 TS/HgS/SOg Environmental Chromatograph
7 Perm eation Tube System
8 N i t r i c Oxide span c y l in d e r
9 ND/NO^/NO^ chem ilurainescent m onitor
10 Chemiluminescent Ozone m onitor
11 Ozone g en era to r
12 C o e f f i c i e n t o f Haze m onitor
13 Spare m onitor s t a t i o n . Wall Bench
14 S t r ip ch a r t r e c o r d e r , s i n g l e pen
15 S t r ip ch a r t reco rd er s i g n a l s w i tc h in g u n i t
16 M aster c o n t r o l p ane l
17 ' D a ta lo g g e r , 20 channel
18 M e te o r o lo g ic a l s e n s o r s s i g n a l t r a n s l a t o r
19 T e s t tem perature probe 1
20 T es t tem perature probe 2
21 B a t te r y power backup fo r d a ta lo g g e r c lo c k
22 T e le ty p e and paper punch
23 Main Room
24 Main Bench
25 W all Bench
26 Desk area
27 S in k /w a ter r e s e r v o i r
28 M agnehelic p r e s s u r e gauge
29 Ambient sample i n l e t m a n ifo ld in h ea ted raceway
30 Ambient sample i n l e t b low er
Figure E-1. Continued

XÜ7
LcRcnd
Item Number I d e n t i t y
31 U t i l i t y Room
32 U t i l i t y Room Vent
33 Hydrogen Generator
34 Hydrogen G enerator w ater su pp ly r e s e r v o i r
35 Exhaust Gas M a n ifo ld , Scrubber System
36 E th y lene c y l i n d e r
37 CH /CO span g a s c y l in d e r
38 N itro g en c y l i n d e r
39 Spare gas c y l i n d e r s
40 A ir p u r i f i c a t i o n system
41 Air p u r i f i c a t i o n system e l e c t r o n i c c o n t r o l s
42 Power e n tr a n c e , c i r c u i t b reak er box
43 Ladder w i th l o c k a b l e , rem ovable shroud
44 C en tra l a i r c o n d i t i o n e r / h e a t e r
45 Ambient sample in t a k e fu n n e l
46 High volume p a r t i c u l a t e s a m p le r ( s ) on r o o f
47 E x ter n a l s i g n
48 Supporting fr a m e /sk id
49 T o w / l i f t i n g p o in t s
Figure E-1, Continued

2 0 8
D a t a C o l l e c t io n (TACB, 1 9 7 5 )
The average p r o je c t Connie s t a t i o n c o n t a in s tw elve a i r q u a l i t y
m o n ito r in g and re c o r d in g in s tru m en ts . M onitor in g instru m en ts are
a u to m a t ic a l ly scanned by the data lo g g er once each f iv e -m in u te p er io d .
I n s ta n ta n e o u s v o l t a g e measurements for each parameter b e in g monitored
are fed to the data lo g g e r where they are co n v er ted to d i g i t a l form and
are then s e r i a l l y logged on a punch paper tape machine. P o l l u t a n t s and
o th e r param eters th a t a re measured a re : n i t r o g e n o x id e (NO), n i t r o g e n
d io x id e (NO2 ) , o x id e s o f n i t r o g e n (N0%), t o t a l s u l f u r (T S), hydrogen
s u l f i d e (H2 S ) , s u l f u r d io x id e (SO2 ) , ozone (O3 ) , t o t a l hydrocarbons
(THC), methane (CH4 ) , carbon monoxide (CO), c o e f f i c i e n t o f haze (COH),
tem perature (T ) , wind speed (WS), and wind d i r e c t i o n (WD). The two
a d d i t i o n a l f i e l d s are used fo r m o n ito r in g the equipment.
The in fo rm a t io n ga th ered by th e in s tru m en ts mentioned above i s
supplemented by p e r io d ic o p e r a t io n o f a h i-v o lu m e a i r sampler and an
atm ospheric gas b ub b ler a t each Connie s t a t i o n . These prov ide a
p e r io d ic c r o s s - c h e c k on the instrum ent d a ta mentioned above. T his
c r o s s - c h e c k may a l lo w th e Texas A ir C on tro l Board to c h a r a c t e r iz e , by
e x t r a p o la t io n , th e ambient a i r q u a l i t y over a wide a rea .
A pproxim ately 2000 f e e t o f punch ta p e are gen erated each week.
The tape and supp lem ental lo g s are s en t to the Texas A ir C on tro l Board
(TACB) w eekly where the tape i s fed in t o the Texas S t a t e H ealth
Department computer from a remote t e r m in a l . When the req u ired averages
and o th e r p r o c e s s in g i s co m le ted , d ata a re tr a n sm it te d back to the TACB
fo r n e c e s s a r y rev iew , v a l i d a t i o n , and e d i t i n g .