Cook_okstate_0664M_12115.pdf - ShareOK
105
STRATIGRAPHY, DEPOSITIONAL ENVIRONMENTS AND RESERVOIR DESCRIPTION OF THE TUSSY (DESMOINESIAN) SANDSTONES, SOUTHEAST JOINER CITY FIELD, LOVE AND CARTER COUNTIES, OKLAHOMA By JEFFREY M. COOK Bachelor of Science in Geology University of Oklahoma Norman, Oklahoma 2010 Submitted to the Faculty of the Graduate College of the Oklahoma State University in partial fulfillment of the requirements for the Degree of MASTER OF SCIENCE May, 2012
-
Upload
khangminh22 -
Category
Documents
-
view
2 -
download
0
Transcript of Cook_okstate_0664M_12115.pdf - ShareOK

STRATIGRAPHY, DEPOSITIONAL ENVIRONMENTS
AND RESERVOIR DESCRIPTION OF THE
TUSSY (DESMOINESIAN) SANDSTONES,
SOUTHEAST JOINER CITY FIELD,
LOVE AND CARTER COUNTIES,
OKLAHOMA
By
JEFFREY M. COOK
Bachelor of Science in Geology
University of Oklahoma
Norman, Oklahoma
2010
Submitted to the Faculty of the
Graduate College of the
Oklahoma State University
in partial fulfillment of
the requirements for
the Degree of
MASTER OF SCIENCE
May, 2012

iii
STRATIGRAPHY, DEPOSITIONAL ENVIRONMENTS
AND RESERVOIR DESCRIPTION OF THE
TUSSY (DESMOINESIAN) SANDSTONES,
SOUTHEAST JOINER CITY FIELD,
LOVE AND CARTER COUNTIES,
OKLAHOMA
Thesis Approved:
Dr. James Puckette
Thesis Adviser
Dr. Darwin Boardman
Dr. Gary Stewart
Dr. Sheryl A. Tucker
Dean of the Graduate College

iv
TABLE OF CONTENTS
Chapter Page
I. INTRODUCTION ......................................................................................................1
Purpose of the Research ...........................................................................................1
General Methods ......................................................................................................3
Study Area ...............................................................................................................5
Previous Work .........................................................................................................5
II. GEOLOGIC SETTING .............................................................................................9
Stratigraphy ..............................................................................................................9
Regional Structural Setting ....................................................................................12
Local Structural Geologic Setting and Hydrocarbon Entrapment .........................14
Paleogeography and Paleoclimate .........................................................................17
III. STRATIGRAPHIC FRAMEWORK .....................................................................18
IV. PETROGRAPHY, FACIES ANALYSIS AND RESERVOIR QUALITY ..........22
General Description of Cores.................................................................................22
Facies Analysis ......................................................................................................24
(F1) Clay-Clast Conglomeratic Sandstone ......................................................24
(F2) Horizontal Planar-laminated Sandstone ...................................................26
(F3) Cross-laminated Sandstone ......................................................................27
(F4) Trough-cross-laminated Sandstone ..........................................................29
(F5) Deformed Sandstone ................................................................................30
(F6) Current-rippled Sandstone .......................................................................32
(E) Current-rippled siltstone ............................................................................34
(P) Paleosol ......................................................................................................36
(FP) Variegated Mudstone ...............................................................................37
(M1) Silty Mudstone ........................................................................................38
(M2) Mudstone ................................................................................................39
Summary of Facies Analysis .................................................................................45
Facies Associations ................................................................................................46
Floodplain .......................................................................................................46
Estuarine .........................................................................................................46
Fluvial Channel ...............................................................................................46
Marine .............................................................................................................47
Electrofacies .................................................................................................................48

v
Controls on Reservoir Quality .....................................................................................50
Summary ......................................................................................................................53
V. BOREHOLE-IMAGE ANALYSIS ........................................................................54
Introduction ............................................................................................................54
Borehole-image Facies Analysis, Illustration of Method ......................................57
(F1) Clay-clast Conglomeratic Sandstone .......................................................61
(F3) Cross-laminated Sandstone ......................................................................62
(F4) Trough Cross-laminated Sandstone .........................................................63
(F5) Deformed Sandstone ................................................................................64
(F6) Current-rippled Sandstone .......................................................................65
(P-E) Paleosol-Estuarine ..................................................................................66
Reservoir Quality Inferred From Chromatic Variation .........................................67
Borehole-image Facies Associations .....................................................................67
Dipmeter Pattern Analysis and Fluvial Typing .....................................................69
Summary ................................................................................................................71
VI. SPATIAL CHARACTERISTICS OF THE RESERVOIRS .................................72
Subsurface Maps ..........................................................................................................72
Net-porous-sandstone Maps.............................................................................72
Storage Capacity Maps ....................................................................................72
Depositional Model and Meander-belt Analogues ......................................................77
Dimensions of Fluvial Channels ..................................................................................80
Channel Connectivity...................................................................................................80
Summary ......................................................................................................................84
VII. CONCLUSIONS ..................................................................................................85
REFERENCES ............................................................................................................87
APPENDICES .............................................................................................................90

vi
LIST OF TABLES
Table Page
1.) Summary of depositional facies designations and characteristics ......................40
2.) Summary of borehole-image facies designations and characteristics .................58

vii
LIST OF FIGURES
Figure Page
1.) Southern Oklahoma tectonic features and location of study area ...................................... 2
2.) Map of location of study area ............................................................................................ 4
3.) Map showing Southeast Joiner City field and surrounding oil fields .............................. 7
4.) Map showing distribution of wells in Southeast Joiner City and surrounding fields ....... 8
5.) Stratigraphic nomenclature common to the Marietta and Ardmore Basins ................... 10
6.) Stratigraphic column of the Tussy interval, Southeast Joiner City field ........................ 11
7.) Regional tectonic index map of the Southern Oklahoma aulacogen. ................... 13
8.) Structural contour map on top of the Tussy Limestone ................................................. 14
9.) Paleogeologic map of pre-Pennsylvanian strata in the study area ........................ 15
10.) Rose plots, drilling-induced fractures ........................................................................... 16
11.) Paleogeographic map of Midcontinent during early Desmoinesian time ..................... 17
12.) Location of the north-to-south cross-section through the study area .................. 19
13.) North-to-south stratigraphic cross-section .................................................................... 20
14.) Rose plots, cross-bedding dips ...................................................................................... 21
15.) Rose plots, sedimentary and planar lamination dips ..................................................... 23
16.) Map showing locations of available cores .................................................................... 23
17.) Core photograph, conglomeratic sandstone (F1) .......................................................... 24
18.) Photomicrograph, conglomeratic sandstone (F1) .......................................................... 25
19.) Core photograph, horizontal laminated sandstone (F2) ................................................ 26
20.) Core photograph, cross-laminated sandstone (F3) ........................................................ 27
21.) Photomicrograph, cross-laminated sandstone (F3) ....................................................... 28
22.) Core photograph, trough-cross-laminated sandstone (F4) ............................................ 29

viii
23.) Core photograph, deformed sandstone (F5) .................................................................. 30
24.) Photomicrograph, deformed sandstone (F5) ................................................................. 31
25.) Core photograph, current-rippled sandstone (F6) ......................................................... 32
26.) Photomicrograph, current-rippled sandstone (F6) ........................................................ 33
27.) Core photograph, current-rippled siltstone (E) ............................................................. 34
28.) Photomicrograph, current-rippled siltstone (E) ............................................................. 35
29.) Core photograph, Paleosol facies (P) ............................................................................ 36
30.) Core photograph, variegated mudstone (FP) ................................................................. 37
31.) Core photograph, silty mudstone (M1) ......................................................................... 38
32.) Core photograph, mudstone (M2) ................................................................................. 39
33.) Photograph of cored Tussy B sandstone from the Hembree 3-17 ................................. 41
34.) Photograph of cored Tussy A sandstone from the Hembree 3-17 ................................ 42
35.) Photograph of cored Tussy A sandstone from the Gilley 20-2 ..................................... 43
36.) Photograph of portions of cored Tussy A and B sandstone from the Gilley 20-2 ........ 44
37.) QFR ternary diagram for the Tussy sandstones ............................................................ 45
38.) Tussy A and B electrofacies and grain-size scale ......................................................... 49
39.) Cross-plot of permeability versus porosity for the Hembree 3-17 ................................ 51
40.) Cross-plot of permeability versus porosity for the Gilley 20-2 ..................................... 52
41.) Photograph of Halliburton’s XRMI ......................................................................... 56
42.) Core photograph and static and dynamic XRMI of Tussy B in the Hembree 3-17 ...... 59
43.) Core photograph and static and dynamic XRMI of Tussy A in the Hembree 3-17 ...... 60
44.) Facies F1 borehole-image characteristics ..................................................................... 61
45.) Facies F3 borehole-image characteristics ..................................................................... 62
46.) Facies F4 borehole-image characteristics ..................................................................... 63
47.) Facies F5 borehole-image characteristics ..................................................................... 64

ix
48.) Facies F6 borehole-image characteristics ..................................................................... 65
49.) Facies P-E borehole-image characteristics .................................................................... 66
50.) Tussy B static XRMI and porosity and permeability in the Hembree 3-17 .................. 68
51.) Gamma-ray, static XRMI and dipmeter plots from the Hembree 3-17 ......................... 70
52.) Thickness map of Tussy A sandstone (>12% phi, <40% vsh) ...................................... 73
53.) Thickness map of Tussy A storage capacity ................................................................. 74
54.) Thickness map of Tussy B sandstone (>12% phi, <40% vsh) ...................................... 75
55.) Thickness map of Tussy B storage capacity ................................................................. 76
56.) Satellite photograph of the Mississippi River near Memphis, Tennessee, USA ........... 78
57.) Computer simulation meander belt prominent features ................................................ 79
58.) Isopach maps displaying two channel belt connectivity scenarios ............................... 81
59.) Outcrop photograph of point bars from the Miocene Huesca Fan in Ebro, Spain ........ 81
60.) Cross-section between Tom 1-2 and Tom 3-2 showing reservoir discontinuity ........... 83

1
CHAPTER I
INTRODUCTION
Purpose of the Research
Pennsylvanian sandstones are important reservoirs that produce large volumes of oil and
gas within the Ardmore and Marietta basins of southern Oklahoma. The purpose of this
study was to acquire and interpret a data set of subsurface geology, and thereby develop a
better understanding of reservoir characteristics of the Pennsylvanian Tussy sandstones in the
Southeast Joiner City field of Love and Carter Counties, Oklahoma. The endeavor was
initiated at the suggestion of Mid-Con Energy Operating, to aid in developmental drilling and
production-enhancement operations. The purpose was to interpret the stratigraphic
framework and depositional environments, relate depositional facies to reservoir quality, and
deduce spatial distribution and connectivity of reservoir rocks. Describing and mapping the
stratigraphic variation of these reservoirs was expected to produce these benefits: enhanced
reservoir-management strategies, improved prediction of reservoir properties, increased
production, and prolonged life of the field. This study will serve as an analogue for
exploration and development of similar Pennsylvanian sandstone reservoirs.

2
Figure 1: Map of southern Oklahoma and north Texas showing the location of the study area (red
star) relative to prominent tectonic features. Marietta Basin – orange, Criner Uplift – blue,
Ardmore Basin – green, Wichita Uplift – Purple, Waurika-Muenster Arch – red (modified from
Al-Shaieb and others, 1980).

3
General Methods
To achieve the research objectives, these methods were employed:
1) Analysis of conventional wireline logs, borehole image logs, and cores, to provide
information necessary interpret the stratigraphic framework and depositional
environments of the Tussy sandstones in the Southeast Joiner City field,
2) Interpretation of core-derived depositional facies, relative to reservoir quality,
3) Determination of controls on reservoir quality and identification of the dominant rock
constituents and porosity types, through petrographic analysis,
4) Calibration of cored lithofacies to chromatic patterns on borehole-image logs,
5) Inference of depositional facies and, thereby, influence of reservoir facies in wells
where the Tussy sandstones were not cored, but were depicted on borehole-image
logs,
6) Characterization of reservoir geometry, connectivity, and overall reservoir quality
through stratigraphic analysis and subsurface mapping.

4
Figure 2: Map of Oklahoma showing the locations of Love and Carter Counties and of the
Southeast Joiner City field.

5
Study Area
The Southeast Joiner City field (Figure 2) is a mature oil field in Love and Carter
counties, in T. 5-6 S., R. 1-2 W., in far south-central Oklahoma, approximately 10 miles
southwest of the city of Ardmore. The northernmost portion of the study area lies within the
North Simon field (Figures 3 and 4). Tussy sandstones have produced approximately 5 million
stock-tank barrels of oil within the study area. These sandstones under study are in the central
portion of the Marietta Basin (Figure 1) and were deposited in Desmoinesian time. Within the
Southeast Joiner City field the Tussy sandstones are unitized and are currently under secondary
recovery production enhancement by Mid-Con Energy Operating.
The fields were chosen for this study due to the abundance of subsurface data, which
consists of two cores, more than 100 wireline logs and 11 borehole-image logs. Fifteen thin-
sections from one of the cores were analyzed to determine the influence of diagenesis on
reservoir quality. Core-derived petrophysical properties were used to relate reservoir quality to
lithofacies. Wireline logs were the principal source of information used to depict the stratigraphic
framework and configuration of the local basin. These logs were rich in information for
inferences about lithofacies and reservoir quality: Extended Range Micro Image (XRMISM
)
(Halliburton), Electrical Micro Imager (EMITM
) (Halliburton), Fullbore Formation MicroImage
(FMI) (Schlumberger ®) or Compact™ MicroImage (CMI) (Weatherford).
Previous Work
Deese sandstones have produced large volumes of oil and gas in the Ardmore and
Marietta Basins. Published studies regarding Desmoinesian depositional environments and
reservoir-scale analyses are mostly restricted to strata of the Ardmore Basin. In terms of
Desmoinesian sedimentary rocks, the Marietta Basin is the subject of regional stratigraphic
studies regarding correlations and mapping, reservoir geometries, oil and gas production, and

6
types of traps. As the result of southern Oklahoma’s complex structural setting, detailed
structural geologic studies have been concentrated on specific oil and gas producing fields. No
information has been published on reservoir characterization of the Tussy sandstones. Previous
works allow for a broad regional overview of the Lower Pennsylvanian sedimentary rocks of the
Marietta Basin or else they focus on petroleum geology of specific fields.
Hoard (1954) detailed the stratigraphy and lithology of the Tussy Sandstone sequence
within the “Tussy Sector” of the Tatums Field in Carter and Garvin Counties. Mullen (1954)
provided a stratigraphic, lithological and structural analysis of the Hewitt Field in Carter County,
approximately 10 miles north of the Southeast Joiner City study area. Neustadt (1954) analyzed
the geologic history and subsurface structure of the West Hewitt Field which is also
approximately 4 miles north of the study area. Reeves and Mount (1960) provided a detailed
study of possible oil accumulations along the northern flank of the Marietta Basin, and proposed
that Pennsylvanian sandstones as prime candidates for stratigraphic traps. Reeves and Mount
(1960) proposed that the Deese sands originated as the result of erosion of the Simpson sands on
the Criner Hills. Stark (1961) defined the evolution of the Marietta Basin and correlated
Pennsylvanian time-stratigraphic relationships between the Fort Worth Basin, Marietta, and
Criner-Hill-Ardmore Basins, to construct regional isochore and facies maps. Tomlinson and
McBee (1959) observed that the abrupt differences in lithology, and the lenticular geometries of
the Pennsylvanian sandstones make stratigraphic correlations difficult in the Ardmore Basin.
Westheimer (1965) noted that the Lower Deese sandstones are relatively lenticular and have
limited areal extents. Billingsley and others (1996) interpreted a tidal influence on lower Deese
sandstones exposed in the Ardmore Basin as made evident by bi-directional flow indicators such
as herringbone cross-stratification and flaser to lenticular bedding.

7
Figure 3: Map of Oklahoma showing the location of the Southeast Joiner City field and study area
relative to surrounding oil fields in northern Love and southern Carter counties. Field names are
shown on left side of the figure (modified from Boyd, 2002).
8
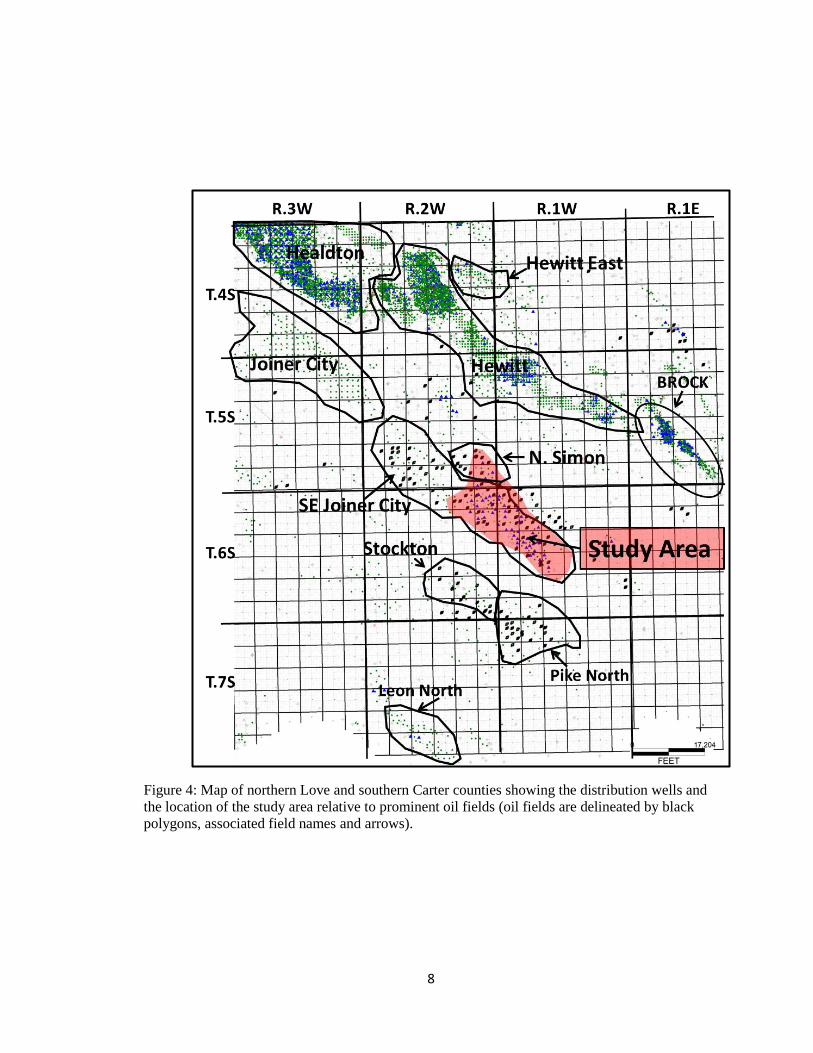
Figure 4: Map of northern Love and southern Carter counties showing the distribution wells and
the location of the study area relative to prominent oil fields (oil fields are delineated by black
polygons, associated field names and arrows).

9
CHAPTER II
GEOLOGIC SETTING
Stratigraphy
Stratigraphic nomenclature used in this study was modified from that used by the
operator who discovered the field. Figure 5 displays common subsurface names used in the
Marietta and Ardmore Basins and Figure 6 is a type log for the study area. The Tussy interval is
defined as the set of strata between the Tussy Limestone at the top and the Atokan Upper Dornick
Hills Group at the base. “This limestone is the key bed used in subsurface work of the Lower
Deese formation in southern Oklahoma” (Hoard, 1954). The Tussy interval is divided informally
in descending order: Tussy A, B and C (Figure 6). The top of the Tussy interval, marked by the
Tussy Limestone, is easily identifiable in the subsurface on wireline logs by its distinct gamma-
ray and bulk density signature. The Tussy A sandstone is fine-grained, and its gamma-ray
signature is bell-shaped (Figure 6). Tussy B consists of two sandstones; the lower typically is
very fine-grained sandstone that commonly is shown by a funnel-shaped gamma-ray signature,
whereas the upper Tussy B sandstone has a bell-shaped gamma-ray character (Figure 6). Tussy C
consists of a sandy limestone conglomerate that is almost certainly ubiquitous within the study
area (Figure 6). Mudstones are between the Tussy A, B and C sandstones. The base of the Tussy
interval unconformably overlies the Desmoinesian upper Dornick Hills.

10
Figure 5: Surface nomenclature commonly used in the Ardmore Basin (From Waddell, 1966), and
subsurface nomenclature commonly used in the Marietta Basin (From Price, 2012, verbal
communication). Subsurface stratigraphic nomenclature for the Marietta Basin lacks a unified
naming system; it consists of locally derived names created by local operators (verbal
communication with Charles Price). Future research correlating Ardmore Basin surface
stratigraphy to the Marietta Basin subsurface would be of great value. NK: not known
Group
Skia
took
O
chel
ata
Missourian
Syst
em
Pen
nsy
lvan
ian
Series
Marietta Basin
Subsurface Names
(Price, 2012)
Dee
se
Desmoinesian
Mar
mat
on
C
her
okee
Atokan
Upper
Dorn
ick H
ills
Pumpkin Creek
tussy
l. fusulinid
u. fusulinid
Hoxbar
Devils Kitchen
Ardmore Basin
Surface Names
(Waddell, 1966)
?
Zuckerman Limestone
Daube Limestone
Anadarche Limestone
Crinerville Limestone
Confederate Limestone
Natsy Limestone
williams Limestone
Frensley
Lester
Bostwick
Arnold
rocky point
Camp Ground
chubbee
Lone grove
norris
Bayou limestone
“G” loco limestone
“E” palacine loco
“C”
NK

11
Figure 6: Type log including the Tussy interval, N.E Oswalt Field, Marietta Basin (RDT
Properties, Hembree 3-17, Sec. 17, T. 6S., R.1W.). Gamma-ray (GR) values increase from
yellow to orange and density porosity (DPHI) is shown in blue on the right track.
?

12
Regional Structural Setting
The Marietta Basin is a small, northwest-trending structural basin in southern Oklahoma
(Figure 1). The study area is in the central portion of the basin, in northern Love and southern
Carter counties. The Marietta Basin is bounded by two northwest-trending positive structural
features, the Criner Arch and the Muenster Arch. Two major structural features are progressively
north of the Criner Arch: the Ardmore Basin and the Arbuckle Mountains, respectively (Figure
1). The Marietta Basin becomes progressively deeper southeast of the study area; this portion of
the basin is known as the Gordonville Trough, it is sub-parallel to the Red River in Love County
and adjacent to Cooke and Grayson Counties, Texas (Bradfield, 1968).
The Ardmore and Marietta basins are within the southeast portion of the southern
Oklahoma aulacogen. The southern Oklahoma aulacogen (Figure 7) extends from the Ouachita
fold belt in southeastern Oklahoma 700 km W-NW into southwestern Oklahoma and northern
Texas (Feinstein, 1981). Ham et al. (1964) believe that the southern Oklahoma aulacogen formed
in three phases: rifting, subsidence and deformation. “The last stage of deformation resulted in
fragmentation of the original long basin and formation of the new tectonic provinces” (Feinstein,
1981). Ham et al. (1964) theorized that the Marietta and Ardmore Basins were connected and
possibly formed the southeastern portion of the much larger Anadarko Basin, prior to the final
deformation stage. Feinstein (1981) noted similarities in the subsidence curves of the Marietta
and Ardmore basins, which support the theory that the basins are two fragments of an original
larger basin (Ham et al., 1964). Uplifts were created in Late Mississippian through
Pennsylvanian time during the final deformation stage of the aulacogen are believed to have been
sources of the large volume of sediment in the Ardmore and Marietta basins. Ham and others
(1964) estimated downwarp of the Marietta basin relative to the Muenster Arch was
approximately 15,000 ft. The Criner Hills were gained approximately 20,000 ft of relief above
the surrounding basins during Desmoinesian time, (Tomlinson and McBee, 1962).

13
Figure 7: Regional tectonic index map of the Southern Oklahoma aulacogen. EGR: eastern
granite-rhyolite province; SGR: southern granite-rhyolite province; CB: Cheyenne belt; MCR:
Midcontinent rift system; PMIC: Pecos mafic intrusive complex; AGM: Abilene Gravity
Minimum; LF: Llano Front; FM: Franklin Mountains; TU: Tusas uplift; WM: Wet Mountains;
UU: Unconpahgre uplift; CU: Cimarron uplift; SGU: Sierra Grande uplift; VH: Van Horn area,
and LU: Llano Uplift (Keller and Stephenson, 2007). Ouachita thrust front: orange dashed line,
Paleozoic continental margin: green dashed line (Keller and Stephenson, 2007).

14
Local Structural Geologic Setting and Hydrocarbon Entrapment
Dip within the study area is southwestward, at 600 to 900 ft per mile. Figure 8 shows
configuration of the Tussy Limestone, which marks the top of the Tussy interval (Figure 6). The
Tussy section unconformably overlies the Desmoinesian Upper Dornick Hills Group. The Tussy
interval is pinched out from south to north against the unconformity. Where the sandstones
develop good porosity, they form reservoirs which stratigraphically trap hydrocarbons by up-dip
pinchout against the upper Dornick Hills unconformity surface.
Figure 8: Southeast Joiner City Field. Structural contour map of the top of the Tussy interval
within the study area, showing southerly dip associated with the S.E. Joiner City anticline.
Depths relative to sea level are shown in color scale bar, upper right side of figure. On the color
bar, depths range from -6400 ft (red) to -8100 ft (purple).

15
The pre-Pennsylvanian structure within the study area is that of a breached anticline,
bounded on the northeastern and southwestern sides by normal faults, essentially an anticlinal
horst that trends northwestward. Seismic reflection data would be required to determine the
configurations and exact locations of these bounding faults accurately. The NW-SE anticlinal
trend parallels many of the prominent regional structures previously discussed. With current well-
control and without access to seismic reflection data, there is no evidence that these large scale
faults offset Desmoinesian strata within the study area. Figure 9 is a Pre-Pennsylvanian subcrop
map showing the breached anticlinal structure.
Figure 9: Paleogeologic map of pre-Pennsylvanian strata, showing evidence of a breached
anticline within the study area (Abbott, 2006).
Caney Sycamore Woodford
Hunton Sylvan Viola

16
Figure 10 is composed of two rose plots of drilling-induced fracture-strike directions
from the Hembree 3-17 and PD Sullivan 3-6 borehole image (BHI) logs. The wells are in the
southern and northern parts of the study area, respectively. Drilling induced fractures typically
form parallel or subparallel to the maximum horizontal stress direction (Shmax). Analysis of BHI
logs revealed a dominant northeastward strike of drilling-induced fractures. Thus, the dominant
Shmax direction within the study area varies between N20E and N60E within various parts of the
field. The understanding of Shmax is important to developmental drilling and to enhanced-
recovery operations, because dominant natural fracture sets typically form parallel to subparallel
to Shmax. Analysis of BHI logs has revealed a correlation between Shmax and the orientation of
natural fractures. One of the crucial components to well placement within the study area is
orienting injector-producer well pairs at least 10 degrees off of the Shmax within the localized area
of the field. Doing so decreases the likelihood of early injection water breakthrough from injector
to producer wells. Based on analysis of image logs in comparison to other highly fractured
reservoirs, these reservoirs are not considered to be intensely fractured but, it is believed that
fractures do have an effect on waterflood sweep efficiency and overall reservoir performance.
A B
Figure10: Rose plots of drilling induced fracture and maximum horizontal stress strike directions
from the Hembree 3-17 (A) and PD Sullivan 3-6 (B) XRMI borehole image logs. Both sets of
data were acquired by Halliburton and interpreted by R. Montalvo (Hembree 3-17) and J.
Mitchell (PD Sullivan 3-6) (Halliburton borehole-image interpreters).

17
Paleogeography and Paleoclimate
During Middle Pennsylvanian (Desmoinesian) time, the Marietta Basin was positioned
south of the Arbuckle uplift, east of the Wichita uplift, west of the Ouachita uplift and north of
the Muenster Arch. Farther north on the Cherokee platform, in present-day north-central
Oklahoma, Desmoinesian deltaic systems (Bartlesville, Red Fork, Skinner, Prue) were dispersing
sediment from a northerly source onto the shelf. Figure 11 illustrates a model of early
Desmoinesian Midcontinent paleogeography with the plotted location of the study area.
Pennsylvanian paleoclimate was warm and humid as the equator was just north of present-day
(Jorgenson, 1989).
Figure 11: Paleogeography of the Mid-Continent during early Desmoinesian time, showing
thickness of early Desmoinesian rocks (modified from Rascoe, B. Jr., and Adler, F.J., 1983).
18
CHAPTER III
STRATIGRAPHIC FRAMEWORK
Stratigraphic cross-sections were used to reconstruct the configuration of the local basin
and of the stratigraphic framework. A comprehensive sequence-stratigraphic or basin-analysis
study was not the intention of this research. Limitations of the data set support the reservoir-scale
focus. In any reservoir characterization study, to understand the stratigraphic framework and
basin configuration is important. Figure 9 is a north-to-south stratigraphic cross-section through
the study area. The Tussy interval is bounded by the Tussy limestone above and unconformably
by the Upper Dornick Hills below. Figure 12 shows location of cross-section. Figure 13 depicts
southerly thickening of the Tussy interval, toward the Marietta Basin. Thus, the depocenter was
south of the study area and represented the location of accommodation space during Tussy
deposition. Rose plots of cross-bedding from two field-wide representative borehole image
(BHI) logs (Figure 14) infer a dominate north-to-south sediment transport direction. Figure 15
depicts the southerly sedimentary and planar lamination dips for the Tussy A and B sandstones in
the Mid-Con Operating Hembree 3-17. If this evidence is representative of Tussy sandstones in
general, siliclastic sedimentary rocks within the Tussy interval in this portion of the basin
probably had a northerly source. As interpreted here, Tussy stratal architecture shows evidence
of three cycles of shale-sandstone-shale (Tussy A, B and C intervals).

19
Figure 12: Map of the study area depicting the location of the north-to-south cross-section
through the study area.

20
Figure 13: North-to-south gamma-ray log cross-section through the study area. The Tussy
interval is bounded above by the Tussy Limestone and below by the Upper Dornick Hills
Limestone. Datum is the top of the Tussy interval, marked by the Tussy Limestone. Northward
from the Mid-Con Sullivan 11-1, exact stratigraphic relationships within the Tussy interval are
not known. Information necessary for description of these relationships is not available.

21
Figure 14: Rose plots of cross-bedding dips within the Tussy interval from (A) Elaine 3-18 FMI
and (B) Banks 11-18 FMI. These plots show predominant north-to-south orientation of cross-
beds. Both sets of data were acquired by Schlumberger and interpreted by Y. Chen
(Schlumberger Borehole Geologist). (C) Location of logged wells.
A B
C

22
Chapter IV
Petrography, Facies Analysis and Reservoir Quality
General Description of Cores
Cores of the Tussy interval are available for two wells within the study area, the Hembree
3-17 and Gilley 20-2. The Hembree 3-17 core is a sample from the Tussy A and B intervals,
whereas the Gilley 20-2 core includes rocks of the Tussy A and the uppermost part of the Tussy B
interval. Cores of the Tussy limestone and of the Tussy C interval were not located; therefore,
these two intervals were not examined. Eleven depositional facies were described by inspection
of the Tussy A and B intervals. Depositional features recognized in the cores are similar;
altogether, they indicate deposition in a low-energy fluvial environment.
The Tussy A and B intervals are composed of amalgamated fining-upward sets of beds;
the sets are capped by current-rippled laminae (Figures 33, 34, 35, 36). The Tussy B sandstone
overlies grey silty mudstone unconformably; it consists of fine-to-medium-grained, horizontal-
planar-laminated, cross-laminated, and current-rippled sandstones. The uppermost part of the
Tussy B interval contains calcium carbonate, and an oxidized zone. This evidence is indicative of
a surface of exposure. The Tussy A overlies variegated mudstones unconformably. It consists of
fine-to-medium-grained horizontal-planar-laminated, cross-laminated, and current-rippled
sandstones. The interval above the Tussy A sandstone was not cored.

23
Figure 15: Rose plots from the Hembree 3-17 XRMI showing orientations of sedimentary dips
(blue) and planar lamination dips (green) of the (A) Tussy A and (B) Tussy B intervals. Dips of
low-energy mudstones are represented by planar laminations (green), and sedimentary structures
deposited by high-energy are represented by sedimentary dips (blue). Both sets of data were
acquired by Halliburton and interpreted by R. Montalvo (Halliburton borehole-image interpreter).
Figure 16: Map of study area showing locations of the Hembree 3-17 and Gilley 20-2 wells
(black arrows), in which the Tussy and Tussy B intervals were cored.
24
Facies Analysis
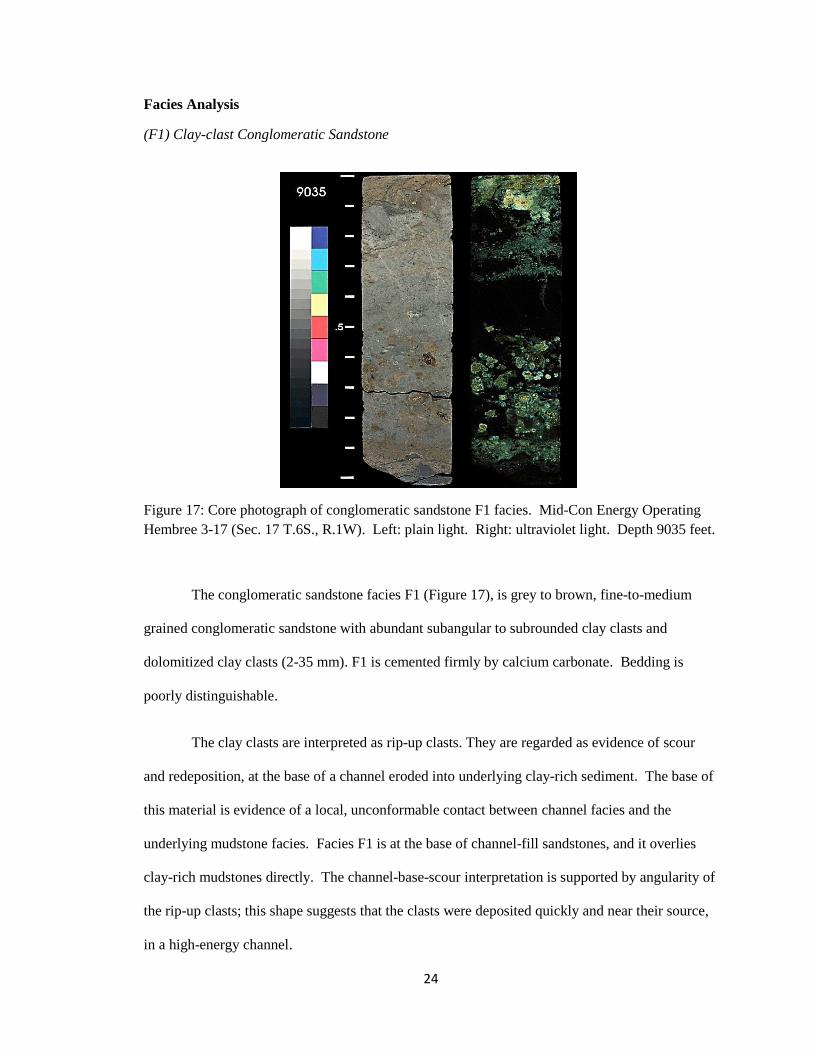
(F1) Clay-clast Conglomeratic Sandstone
Figure 17: Core photograph of conglomeratic sandstone F1 facies. Mid-Con Energy Operating
Hembree 3-17 (Sec. 17 T.6S., R.1W). Left: plain light. Right: ultraviolet light. Depth 9035 feet.
The conglomeratic sandstone facies F1 (Figure 17), is grey to brown, fine-to-medium
grained conglomeratic sandstone with abundant subangular to subrounded clay clasts and
dolomitized clay clasts (2-35 mm). F1 is cemented firmly by calcium carbonate. Bedding is
poorly distinguishable.
The clay clasts are interpreted as rip-up clasts. They are regarded as evidence of scour
and redeposition, at the base of a channel eroded into underlying clay-rich sediment. The base of
this material is evidence of a local, unconformable contact between channel facies and the
underlying mudstone facies. Facies F1 is at the base of channel-fill sandstones, and it overlies
clay-rich mudstones directly. The channel-base-scour interpretation is supported by angularity of
the rip-up clasts; this shape suggests that the clasts were deposited quickly and near their source,
in a high-energy channel.

25
Figure 18: Photomicrographs of samples from the F1 conglomeratic facies. Dominant framework
grains are quartz and dolomite. Metamorphic-rock fragments, feldspars and chert are present in
lesser quantities. Calcite cement – yellow arrow. Dolomite clast – red arrow. Mid-Con Energy
Hembree 3-17. Depth 9035.75 feet.
The dominant F1 facies framework grains of the F1 facies are quartz and dolomite,
whereas metamorphic-rock fragments, chert and feldspars are in minor quantities (Figure 18).
Quartz grains appear to be angular; this angularity is primarily the result of quartz overgrowths.
Primary porosity was occluded by calcium carbonate cement and pseudomatrix; however, few
secondary pores are present, and such pores that were detected originated by dissolution of
feldspar and detrital clay matrix. Core-derived porosity and permeability data are not available
for rocks of facies F1. However, reservoir quality is inferred to be poor, due to abundant
porosity occluding calcium carbonate cement and pseudomatrix.
0.1 mm 0.1 mm

26
(F2) Horizontal Planar-laminated Sandstone
Figure 19: F2 facies from the Santa Fe Minerals Inc. Gilley 20-2 (Sec. 20 T.6S., R.1W). Planar
laminations in the sandstone are conspicuous. Depth 9047 feet.
Stratigraphic unit F2 (Figure 19) is brown fine-to-medium-grained laminated sandstone
with distinct thin (1-3 mm) dark brown planar laminae. The dark brown laminae are the coarser,
being composed of medium-sized grains; whereas the light-brown laminae (3-10 mm thick) are
fine-grained.
This planar-laminated sandstone is interpreted as the product of high-energy, sheet-like
traction-flow deposition within a channel. F2 facies is interpreted as the record of fluvial
deposition, unaffected by marine processes. Plane-laminated sandstones are deposited in many
environments; therefore, the interpretation of them is reliant on associated facies. Facies F1
supports the interpretation. F2 facies is not present in the Hembree 3-17 cored interval. Facies
F2 average core-derived permeability and porosity are 96 md and 15.5 %, respectively.
Higher permeability Coarser grained

27
(F3) Cross-laminated Sandstone
Figure 20: Facies F3 from the Mid-Con Energy Operating, Inc. Hembree 3-17 (Sec. 17 T.6S.,
R.1W). Cross-laminations in the sandstone are conspicuous. Depth 8984 feet.
F3 facies (Figure 20) is brown fine-to-medium-grained sandstone with dark, (1-3 mm)
dipping laminae. The dark brown laminations are similar to the horizontal planar laminations in
one attribute: they are of fine to medium grain-size, whereas light-brown laminations are fine-
grained.
F3 facies is interpreted as the record of low-energy deposition within a sand-dominated
channel; the sediment probably formed by migration of dunes. Facies F3 typically overlies F2
facies; it underlies Facies F4 at some localities, and facies F5 at others. Where facies F2 is not
present, F3 directly overlies facies F1. There is no evidence of a marine influence for facies F3,
as normal marine invertebrates and trace fossils were not observed. Facies F3 is interpreted as
the product of deposition by fluvial processes.

28
Figure 21: Photomicrographs of facies F3, showing moderately sorted sandstone. Detrital grains
include: quartz (Q), chert (CH), metamorphic rock fragments (MRF) and feldspar (F). Primary
porosity is identified by planar pore boundary (yellow arrows). Secondary porosity is evident by
irregular pore boundary (green arrows). Quartz overgrowths are shown by red arrows. Left-hand
panel: plane-polarized light. Right-hand panel: cross-polarized light. Blue epoxy shows filled
pore space. Bottom images are enlarged by area in box. Mid-Con Energy Operating Hembree
#3-17. Depth 8984.7 ft.
Quartz is the dominant framework grain, whereas metamorphic rock fragments, chert and
feldspars compose the minor fraction (Figure 21). Quartz overgrowths and pore-lining illite are
the authigenic constituents. Where present, grain-coating illite prohibits quartz overgrowths,
thereby the original shape of the grain is preserved. Measured core plug (depth: 8984.7 ft.)
porosity is 15.8% and permeability to air is 131 md. Primary porosity is common. Secondary
porosity is also abundant. It consists of moldic and oversized pores. Secondary porosity is the
result of the dissolution of metastable grains, detrital matrix, pseudomatrix and authigenic clays.
Q
MRF
CH
MRF
Q
CH
Q Q
0.2 mm 0.2 mm

29
(F4) Trough Cross-laminated Sandstone
Figure 22: F4 facies from the Mid-Con Energy Operating Hembree 3-17 (Sec. 17 T.6S., R.1W).
Depth 9027 feet.
Facies F4 (Figure 22) is brown very-fine- to fine-grained sandstone with foreset laminae.
The laminae are curved to planar. The overall aspect of the sedimentary structures is reminiscent
of trough cross bedding.
Trough cross-bedding are interpreted as evidence of deposition within a channel, under
conditions of moderate energy, where sediments accumulate as migratory dunes. Trough cross-
bedding also is commonly associated with point bars. At depth 9027.35 in the Hembree 3-17, F4
facies has net confining stress (NCS = 6500 psi) porosity of 13.2% and permeability to air of
0.783 md. Observations of fine-to-very-fine grain-size from facies F4 is consistent with the low
permeability (<1 md) measurements for core-plug analysis.
.

30
(F5) Deformed Sandstone
Figure 23: F5 facies from the Mid-Con Energy Operating Hembree 3-17 (Sec. 17 T.6S., R.1W).
Deformed laminae in the sandstone are conspicuous. Depth 8980 feet.
Facies F5 (Figure 23) is brown, fine-grained sandstone with deformed bedding and
abundant carbonaceous debris. The deformed bedding is irregular to convoluted and contains
sparse fluid escape structures.
The convolute bedding of F5 is interpreted to as the result of slumping from the
instability of channel walls. Slump structures, distorted bedding, clay infills and fairly persistent
layers of organic debris are commonly observed near the bases of infilled channels (Coleman and
Prior, 1981). This facies could also be interpreted as the result of hydroplastic flowage caused by
a flood; the plastic deformation is evident by the convoluted bedding. F5 typically is underlain
by well-organized cross-bedded F3 facies and overlain by very-fine-grained current-rippled F6
facies.

31
Figure 24: Photomicrographs of moderately sorted F5 facies. Red arrow shows secondary pore
from dissolution of clay matrix (red arrow). Green arrow shows pseudomatrix. Primary porosity
is indicated by purple arrow. Plane-polarized light (left). Cross-polarized light (right). Mid-Con
Energy Hembree 3-17. Depth 8980.65 ft.
Porosity is a combination of primary intergranular porosity and secondary porosity
developed by the dissolution of feldspar, rock fragments, detrital clay matrix and authigenic clays
(Figure 24). Pseudomatrix formed by clay is common. Secondary pores are of intragranular,
moldic and oversized. At depth of 8980.65 ft in the Hembree 3-17, F5 facies has a measured
NCS (6500 psi) core-plug porosity of 14.2% and permeability to air of 2.28 millidarcies. Core-
plug permeability of facies F5 (depth 8980.65 ft) (2.28 md) compared with facies F3 (depth 8984)
(131 md) probably is a function of the homogenized deformed bedding in F5, because grain sizes
and amounts of cement of both facies are similar.
0.2 mm 0.2 mm

32
(F6) Current-rippled Sandstone
Figure 25: Facies F6 from the Mid-Con Energy Operating Hembree 3-17(Sec. 17 T.6S., R.1W).
F6 (Figure 25) is very-fine grained, brown-to-light-brown ripple-laminated sandstone.
All observed ripples are asymmetrical (unidirectional), are penetrated by rare vertical burrows,
and show evidence of few mud drapes. Rippled foresets are common visible (0.5 – 1cm).
F6 facies is interpreted as evidence of low-energy (lower flow regime), unidirectional
current-dominated deposition within a fluvial channel system. Deposition of facies F6 is
hypothesized to have been the result of decreased fluvial energy because channel abandonment,
probably from a rise in base level. This low-energy fluvial process results in lower-flow-regime,
unidirectional ripple bedding and decreased grain size. Evidence such as properties indicative of
unidirectional flow and the lack of heterolithic rhythmic alterations of sand and mud suggest that
deposition was within a fluvial channel, not directly affected by tidal processes.
Well organized stacked asymmetrical current-ripples
Poorly organized stacked asymmetrical current-ripples

33
Figure 26: Photomicrographs of F6 facies, which is composed of poorly sorted, clay-rich, very-
fine-grained sandstone. Secondary porosity as a result of dissolution of clay matrix is shown by
red arrow. Pseudomatrix is shown by green arrow. Plane polarized light (left) and cross-
polarized light (right).
Dominant framework grains of facies F6 are quartz; the minor fraction of grains is made
up of feldspar, chert, metamorphic-rock fragments and sedimentary-rock fragments (Figure 26).
Authigenic constituents include quartz overgrowths and grain-coating illite. Pore space was
reduced by abundant pore-clogging pseudomatrix and clays. The sandstone is very fine-grained
and silty. Secondary and primary porosity are evident (Figure 22). Secondary porosity is
dominantly a product of dissolution of metastable grains, including feldspars and rock fragments,
and dissolution of pseudomatrix. Core-plug porosity and permeability data are not available for
facies E.
0.2 mm 0.2 mm

34
(E) Current-rippled siltstone
Figure 27: Facies E from the Mid-Con Energy Operating Hembree 3-17 (Sec. 17 T.6S., R.1W).
Red arrows point to “vertical” burrows.
Wavy-laminated to current-rippled siltstone of facies E (Figure 27) is grey to light grey;
it contains wavy laminations and current-ripples within a silt-dominated matrix. “Vertical”
burrows and carbonaceous clay debris are abundant.
Facies E is interpreted as having been deposited during periods of channel flooding,
initiated by rise in base level. This facies contains abundant “vertical” burrows (red arrow)
(Figure 27), and carbonaceous debris (green arrow) that probably was deposited after
abandonment of the channel. Abundant “vertical” burrows, very-fine-grained sand and silt grain-
size and carbonaceous in debris altogether support the interpretation of rise in base level and shut
down of the fluvial system by submergence. Facies E could be evidence of estuarine conditions.
Facies E typically is near the top of the sandstone “package”; typically it overlies facies F6 and
underlies paleosol facies P (to be described).

35
Figure 28: Photomicrographs of facies E. Poorly sorted clay-rich siltstone; the pore space of
which is clogged by abundant clay matrix (red arrows). Plane-polarized light (left) and cross-
polarized light (right). Mid-Con Energy Operating Hembree 3-17. Depth 9009.75 ft.
Framework grains in facies E are dominantly quartz, with smaller quantities of feldspar,
chert, sedimentary-rock fragments and metamorphic-rock fragments (Figure 28). Detrital clay
matrix occludes porosity. Reservoir quality is poor; the siltstone is clogged by detrital clay.
Core-plug porosity and permeability data are not available for facies E.
0.2 mm 0.2 mm

36
(P) Paleosol
Figure 29: Core photograph of facies P from the Mid-Con Energy Operating Hembree 3-17(Sec.
17 T.6S., R.1W).
Facies P (Figure 29) is grey-to-dark-grey siltstone-to-very-fine-grained sandstone. Facies
P has a red-to-orange crumbly oxidized character in localized nodules and vertically aligned
irregular fractures – a pedogenic aspect, overall.
Facies P is crumbly, a trait that may be evidence of incipient pedogenesis associated with
subaerial exposure (Figure 29). Facies P is interpreted to have formed during a decline in base
level, which resulted in subaerial exposure of an underlying estuarine facies. Thus, paleosol
facies is likely the subaerially exposed upper-portion of facies E. Facies P is considered to be
non-reservoir, due to its clay- and silt-rich composition. Core plug data is not available for this
facies, but reservoir-quality is inferred to be poor.

37
(FP) Variegated Mudstone
Figure 30: Facies FP from the Santa Fe Minerals, Inc. Gilley 20-2 (Sec. 20 T.6S., R.1W). FP is
variegated red-green-grey and has weak structure.
Variegated mudstone facies FP (Figure 30) is crumbly, variegated grey-green-red
mudstone. This facies contains sparse thin, dark grey, competent layers of shale.
Facies FP is interpreted to as the product of deposition on a floodplain, that was exposed
by drop in base level. This inferred fall in base level probably was associated with activation of
the Tussy A fluvial system, in which floodplain muds were deposited. Floodplain facies (FP) is
overlain unconformably by the Tussy A fluvial channels. This sharp and erosional contact is
evident in the Hembree 3-17 and Gilley 20-2 cored intervals; where fluvial sandstones appear to
have scoured into underlying mudstone facies. Borehole-image (BHI) logs throughout the study
also portray this contact to be abrupt, by these attributes: rip-up-clasts near the channel bases, and
apparent sharp-contacts between channel sandstone facies and underlying mudstone facies.

38
(M1) Silty Mudstone
Figure 31: Oxidized zones in the M1 facies from the Mid-Con Energy Operating Hembree 3-17
(Sec. 17 T.6S., R.1W).
Facies M1 (Figure 31) is grey silty mudstone with siderite concretions. The concretions
are interbedded with thin, wispy to inclined, lenticular-bedded to rippled very-fine-grained
sandstone. Figure 31 illustrates the silty mudstone portion of facies M1 but does not include the
thin, interbedded very-fine-grained sandstone.
Facies M1 is interpreted as having been deposited as delta-front, its gamma-ray signature
diminishes upward, which implies upward increase in grain-size. The interbedded sandstones are
interpreted as the record of pulses of sediment discharge from the delta mouth. The Tussy B
interval in the Hembree 3-17 BHI contains M1 facies that is overlain unconformably by F1
channel facies.

39
(M2) Mudstone
Figure 32: M2 facies from the Mid-Con Energy Operating Hembree 3-17 (Sec. 17 T.6S., R.1W)
with carbonized plant debris (green arrows).
Facies M2 (Figure 32) is dark grey, poorly indurated crumbly mudstone with few siderite
concretions (3.5-5cm in thickness) and abundant carbonaceous plant debris. The siderite is sub-
parallel to bedding. Facies M2 was observed only in the Tussy B cored interval in the Hembree
3-17. The Tussy A intervals in the Hembree 3-17 and Gilley 20-2 do not contain this facies.
Facies M2 probably was deposited in the distal subaqueous delta plain. Perhaps this rock
is evidence of the most seaward extent of the lower delta plain, for typically sediments of the
finest-grain size are transported to the most seaward position in the subaqueous lower delta plain
(Boggs, 2006). Depositional facies are summarized in Table 1. Photographs of the facies are in
Figures 33, 34, 35 and 36.

40
Facies
Code
Facies Name
Grain Size
Dominant Features
Depositional
Processes
Fluvial (F)
F1
Carbonaceous clay-
clast conglomeratic
sandstone
Matrix-supported
paraconglomeratic
1 – 5 cm diameter mud
clasts, poorly sorted
Scour and fill
F2
Horizontal planar
laminated
sandstone
Fine to upper fine
Horizontal laminations
Unidirectional
traction flow
F3
Cross-laminated
sandstone
Fine to upper fine
Low-angle laminations
Alternating
between bedload
and suspension
F4
Trough-cross
stratified sandstone
Very fine to fine
Trough-cross-laminae
“Unidirectional”
to traction flow
F5
Deformed
sandstone
Very fine to upper
fine
Deformed/convoluted
beds, flow structures
Channel fill
slumping
F6
Current-rippled
sandstone
Very fine
Asymmetrical climbing-
ripple laminations, few
burrows
Current-
dominated,
traction flow
Estuarine (E)
E
Current-rippled to
wavy laminated
siltstone
Fine
Current-rippled to wavy
laminae, heavily
burrowed
Mixed fluvial-
marine
Estuarine
processes
Paleosol (P)
P
Paleosol
Very fine
Crumbly, oxidized
material
Subaerially
exposed estuarine
facies
Floodplain (FP)
FP Variegated
Mudstone
Mudstone
Variegated material
(red-green-grey)
Exposed
floodplain
Marine (M)
M1
Interbedded silty
mudstone and
sandstone
Silty mudstone
Silty mudstone
interbedded with wavy to
discontinuous thin beds
(1-3 cm) of siltstone to
very-fine sandstone
Marginal-marine,
delta-front
M2
Mudstone
Mudstone
Dark grey mudstone with
carbonaceous plant debris
Marine,
Pro-delta
Table 1: Summary of depositional facies designations, characteristic features and interpreted
depositional processes of eleven facies described from cores, Hembree 3-17 and Gilley 20-2
wells.
41
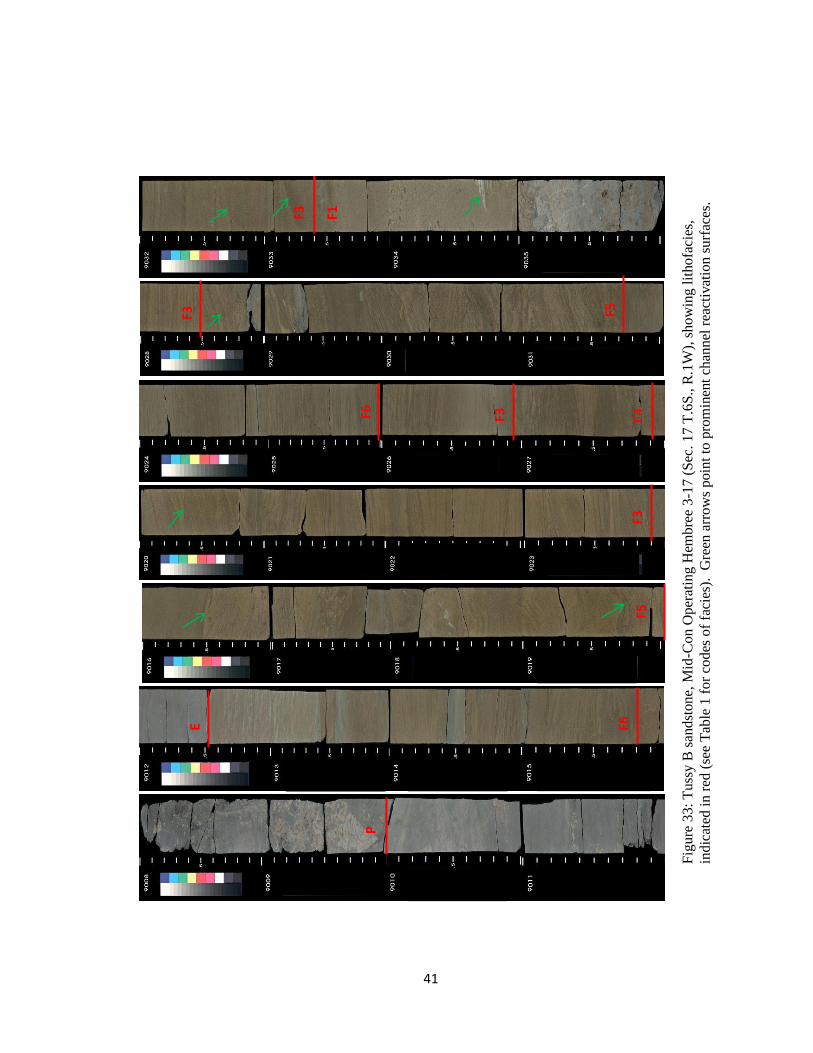
F1
P
F3
F3
F5
F3
E
F6
F6
F5
F3
Fig
ure
33:
Tu
ssy
B s
and
stone,
Mid
-Con O
per
atin
g H
embre
e 3-1
7 (
Sec
. 17 T
.6S
., R
.1W
), s
ho
win
g l
itho
faci
es,
ind
icat
ed i
n r
ed (
see
Tab
le 1
for
codes
of
faci
es).
G
reen
arr
ow
s poin
t to
pro
min
ent
chan
nel
rea
ctiv
atio
n s
urf
aces
.
F4

42
Figure 34: Tussy A sandstone, Mid-Con Operating Hembree 3-17 (Sec. 17 T.6S., R.1W),
showing lithofacies, indicated in red. Green arrows point to prominent channel reactivation
surfaces. See Table 1 for codes of facies.
F5

43
Figure 35: Tussy A sandstone, Gilley 20-2 (Sec. 20 T.6S., R.1W), showing lithofacies, coded in
red. See Table 1 for codes of facies.
F3
F2
F2

44
Figure 36: Basal part of Tussy A sandstone, mudstone below Tussy A sandstone and uppermost
portion of Tussy B sandstone from the Gilley 20-2 (Sec. 20 T.6S., R.1W). Lithofacies indicated
in red. See Table 1 for codes of facies.
F6
Tussy B
Sandstone
Tussy A
Sandstone
FP
F4
F3

45
Summary of Facies Analysis
Eleven depositional facies within the Tussy A and B stratigraphic intervals were
described from the Hembree 3-17 and Gilley 20-2 cores; these are summarized in Table 1. The
Hembree 3-17 core is composed of fluvial facies (F1, F3, F4, F5 and F6), paleosol facies (P) and
marine facies (M1 and M2). Of the Hembree 3-17 core, facies boundaries of the Tussy B and A
intervals are shown in Figures 33 and 34. For the Hembree 3-17, core-plug porosity and
permeabilities correlated to cored-facies and static BHI are in Appendix A. The Gilley 20-2 core
(Figures 35 and 36) comprises fluvial facies (F2, F3, F4, F5 and F6) and floodplain facies (FP).
Facies boundaries of Tussy A and B intervals are labeled in Figures 33, 34, 35 and 36.
Sandstones of the Tussy A and B intervals are litharenite (Figure 37).
Figure 37: QFR classification scheme of the Tussy A and B sandstone reservoir facies, from
point counts of thin-sections. Depicted above are the normalized percentages (adjusted to
exclude percentage of pore-space) of quartz (Q), feldspar (F) and rock fragments (R).
Q

46
Facies Associations
Floodplain
The floodplain association consists of variegated grey-green-red mudstone. Floodplain
facies was observed in the Hembree 3-17 and Gilley 20-2 cored intervals above the Tussy B
sandstone (Figures 30 and 36). This facies seems to have been exposed subaerially on a
floodplain; it is interpreted to be the result of a lowered base level, which rejuvenated the Tussy A
fluvial system. The floodplain facies overlies estuarine facies, and is overlain unconformably by
Tussy A fluvial sandstones.
Estuarine
The estuarine facies association consists of facies E (Figure 27), a heavily burrowed,
current-to-wavy-rippled dark grey, very fine grained sandstone and siltstone that overlies fluvial
facies F6 (Figure 25). Estuarine facies are records of drowning of the channel belt from rise in
base-level, the elevation which resulted in an estuarine environment of the estuarine facies, the
chief evidence of which is burrowed rock. The uppermost portion of the estuarine facies is an
exposure surface of oxidized material, associated with pedogenic processes. This surface of
exposure probably is evidence of lowered base level, and consequent exposure of the estuarine
facies. This association is evident in the Hembree 3-17 core (Figures 29 and 33).
Fluvial Channel
The fluvial channel facies association comprises reservoir units in the Tussy interval. It
is an overall fining-upward succession of facies, including all fluvial (F) facies. Strata of
channel-fill origin are multistoried (each increment 5-30 ft thick) successions of amalgamated
fining-upward sequences. Fining-upward sequences have basal erosional surfaces. The internal
amalgamated cross-laminated sandstones and scour surfaces are regarded as the record of stacked

47
lateral-accretionary point-bar deposits. They justify the inference of movement of a meandering
channel within a channel belt. Bases of fluvial channels show abrupt contacts with underlying
mudstone (erosional unconformities) characterized in the lower part by carbonaceous clay-clast
conglomeratic sandstone (Figure 17). The sandstones fill channels scoured into mudstones.
Reservoir facies are horizontal planar laminated, low-angle to wavy laminated and distorted-
bedded sandstones; they are within the lower to middle portions of fluvial channels. Distorted
beds that contain clay clasts are abundant within the channel body. Fluvial channel-fill deposits
are capped by wavy-laminated to unidirectional-rippled siltstone. This wavy-to-unidirectional-
rippled burrowed facies contains vertical burrows; the burrows indicate the onset of base level
rise and the beginning of estuarine depositional processes. There is evidence, such as
depositional facies and their associated stacking patterns, which support the interpretation that the
Tussy A and B sandstones were deposited within fluvial channels which were inundated.
Marine
The marine facies association is dark grey mudstone with siderite concretions and
carbonaceous plant debris (Figure 32), overlain by grey to dark grey silty mudstone (Figure 31).
The mudstone grades upward into thin, interbedded, wispy parallel-to-inclined siltstone and
rippled, very fine grained sandstone with few vertical burrows and siderite concretions. In typical
modern settings, the delta front is just seaward of the lower delta plain; it forms the uppermost
portion of the subaqueous delta plain. Seaward from the delta front is pro delta submarine terrane
(Boggs, 2006). The delta front association was observed only directly below the Tussy B channel
facies in the Hembree 3-17 core. Features in this facies association could form in many
environments such as a flood plain or tidal flat – but data compiled from cores seems to indicate
that a subaqueous delta-front or prodelta is plausible.

48
Electrofacies
The previously described facies associations are evident in distinct wireline-log
signatures, particularly those observed from gamma-ray curves. Gamma-ray logs detect the
combined natural radioactivity, sourced by uranium, potassium and thorium (Asquith and
Krygowski, 2004). These data are normalized to API (American Petroleum Institute) units. The
Tussy A and B fluvial facies are the main focus of this discussion.
Figure 38 illustrates the interpreted gamma-ray electrofacies from the Hembree 3-17. As
interpreted, the channel facies in core is depicted on gamma-ray logs as sharp-based, fining
upward, bell-shaped gamma-ray curves, which generally are less than 45 API units in the lower
and middle portions of the sandstone body; in the fining-upward sequence gamma-ray deflection
is in the range of 75-90 API, near the top. Channel facies gamma-ray signatures are aggregates of
stacked internal fining-upward gamma-ray sequences; these successions of fining-upward
gamma-ray signatures represent the stacked fining-upward sequences observed in core. The
uppermost portion of the sandstone body is channel abandonment/estuarine facies and typically
has low density porosity (4-6%) and relatively high GR values (75-90 API).
Marine facies lie below the Tussy B channel facies, coarsen upward, and are funnel-
shaped (Figure 38). Gamma-ray deflection decreases from 105 API units near the base of the
mudstone/siltstone sequence to 45 API near the top. Floodplain facies overlie the Tussy B
channel-fill facies and underlie Tussy A channel-fill facies. The floodplain facies has gamma-ray
deflection of 95-110 API units.

49
Figure 38: Field-wide representative gamma-ray (green) electrofacies signatures and generalized
grain-size scale of the Tussy A and B cored intervals: Marine facies, channel facies, estuarine
facies and floodplain-paleosol facies. Mid-Con Energy Operating Hembree 3-17(Sec. 17 T.6S.,
R.1W) .
Core
d I
nte
rval
Mid-Con Energy Operating - Hembree 3-17
Gamma-ray Deflection
Tussy A
Tussy B
Marginal Marine Facies
API
0 150 75
Abandoned channel/Estuarine Facies
Channel Facies
Floodplain Facies
Channel Facies
Sand Clay
Grain Size
Silt
(0.0

50
Controls on Reservoir Quality
As discussed above, rocks of relatively high porosity and permeability are in the channel
facies. Characteristics of these lithotypes from analyses of core, thin-sections and core-derived
porosity and permeability data reveal that grain size, degree of cementation and clay content are
the major controls on reservoir quality. The best reservoir facies are of coarse grain-size, are
poorly cemented, and have small amounts of pore-clogging clays. Cross-plots of core-derived
permeability and porosity (Figures 39 and 40) showed that depositional facies are another
dominant control on reservoir quality. The hypothesis is that rocks of the highest permeability
are the laminated sandstone facies F2 and F3. The highest recorded core-derived permeability
and porosity, 148 md permeability and 17.7 % porosity, was from the cross-laminated facies F3
in the Gilley 20-2. As described in the previous facies-analysis section, dark laminae in facies F2
and F3 are slightly coarser-grained sandstone, which results in relatively high permeability
values. Facies F2 and F3 have the highest measured porosity and permeability values; they are
the best reservoir rock observed in the Tussy interval.

51
Figure 39: Cross-plot of core derived permeability (to air) versus porosity (6500 psi, net
confining stress: NCS) from the Hembree 3-17 core. Data points are color coded to identify
lithofacies. Color coded lithofacies designations in the upper left hand corner include F1-F6. F1:
conglomeratic sandstone, F3: cross-laminated sandstone, F4: trough-cross laminated sandstone,
F5: deformed sandstone, F6: current-rippled sandstone.
y = 0.0002e0.7021x
R² = 0.6134
0.001
0.01
0.1
1
10
100
1000
0 4 8 12 16 20
Per
mea
bil
ity t
o A
ir,
mil
lidar
cies
Porosity at Net Confining Stress (NCS), %
F1 F3 F4 F5 F6
MID-CON ENERGY OPERATING
HEMBREE 3-17
PERMEABILITY VS. POROSITY

52
Figure 40: Cross-plot of core derived permeability (to air) versus porosity from the Gilley 20-2
core. Data points are color coded by lithofacies to represent their relative reservoir qualities.
Color coded lithofacies designations in the upper left hand corner include F2-3 and F6. F2-3:
cross-laminated and horizontal-laminated sandstone, F6: current-rippled sandstone.
y = 0.0098e51.971x
R² = 0.8223
0.01
0.1
1
10
100
1000
0 0.02 0.04 0.06 0.08 0.1 0.12 0.14 0.16 0.18 0.2
Per
mea
bil
ity t
o A
ir,
Mil
lidar
cies
Core Porosity
SANTA FE MINERALS
GILLEY 20-2
PERMEABILITY VS. POROSITY
F2-3 F6

53
Summary
The Tussy A and B cored intervals are rocks that were deposited in marine, fluvial,
floodplain and estuarine environments; they show evidence of sea-level cyclicity. Eleven core-
derived facies were interpreted, each with distinct sedimentary structures and reservoir quality.
Tussy A and B sandstones are interpreted to have been deposited in fluvial-channels; these
fluvial-channels consist of successions of amalgamated fining upward sequences.
Tussy B fluvial processes seem to have thrived during a relative base level lowstand.
This lowstand is evidenced by the unconformable contact between the Tussy B channel base and
underlying marine sediments. As base-level rose, channel abandonment occurred due to
decreased fluvial energy. As base-level continued to rise, the fluvial system shut-down to form
an estuary with increased biotic activity, evidenced by heavily burrowed siltstone facies. When
base-level began to fall, previously deposited estuarine facies were subaeirally exposed. This
base-level fall is evidenced by a paleosol above Tussy B sandstone. As base-level continued to
drop, Tussy A fluvial systems were activated, which unconformably overlie flood plain facies.
Another rise in sea-level probably shut down the Tussy A fluvial system.
High-quality reservoir rocks are restricted to channel facies. Facies F2, F3 and F5 have
the best reservoir quality, while F4 and F6 have fair reservoir quality. Facies F1 has poor
reservoir quality due to abundant cementation by calcite. Facies E, FP, P and M are considered
non-reservoir but, form great seals. Primary porosity is abundant, and suggests these rocks were
not buried at great depths. Secondary porosity is dominantly from dissolution of feldspars and
rock fragments. Pores are intergranular, intragranular, moldic and oversized. Reservoir quality is
controlled by grain size, depositional facies and degree of cementation. The best quality reservoir
facies are fine to medium grained laminated sandstones with minimal cementation.

54
CHAPTER V
BOREHOLE-IMAGE ANALYSIS
Introduction
Borehole-image (BHI) logs from three service companies (Schlumberger, Weatherford
and Halliburton) were available from eleven wellbores within the study area. All eleven BHI logs
were examined in detail to extract stratigraphic and structural information. One of the eleven
BHI logs is used as an example: Mid-Con Energy Operating Hembree 3-17 Extended Range
Micro Imager (XRMI). Schlumberger, Weatherford and Halliburton designed their tools based
on similar principles. Halliburton’s EMI is discussed in detail. Wireline-based dipmeter and BHI
tools are configured with various arms; four, six, or eight and each arm has a pad. Within each
pad are a certain number of sensors, ranging from 4 to 92, depending on the design specifications
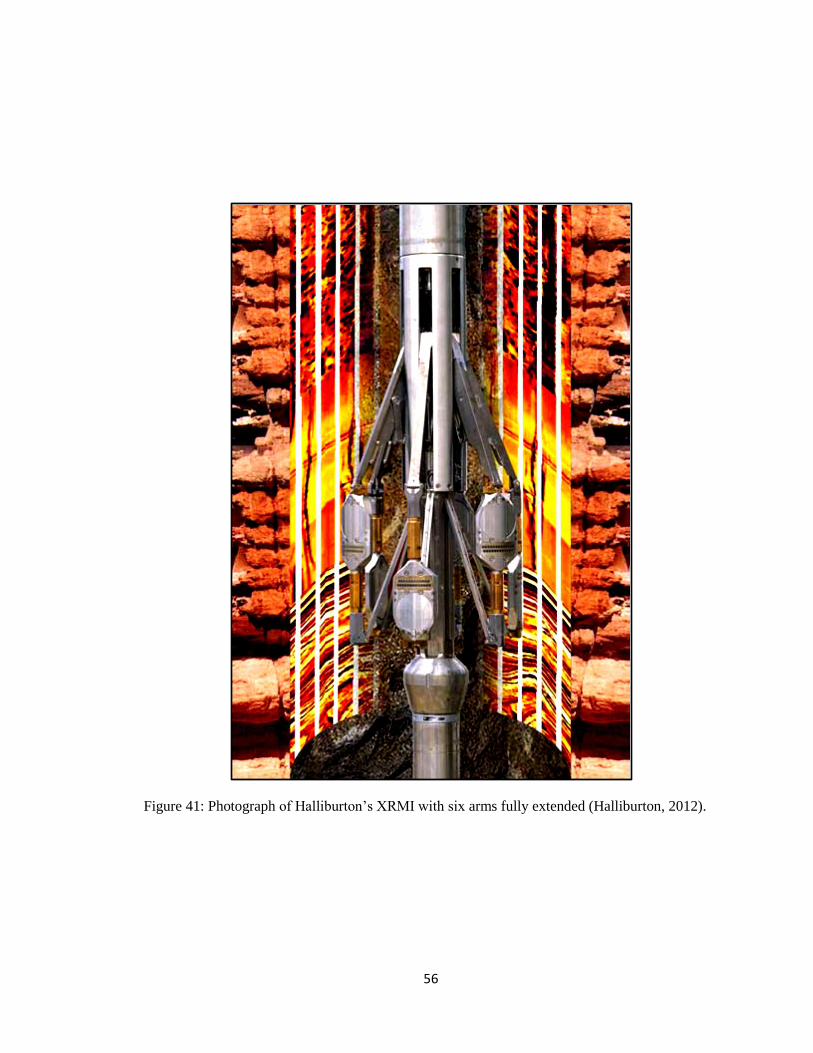
of the tool (Lagraba et al., 2010). The Halliburton EMI (Figure 41) has six independent arms
each with 25 buttons - therefore a total of 150 sensors (Halliburton, 2012). While the sensors are
pressed against walls of a borehole they record an alternating electrical current that is induced by
an electrode (Lagraba et al., 2010). The tool produces an electrical image by measuring and
mapping formation micro resistivity (Halliburton, 2012). The concept behind the BHI tool is to
measure resistivity of the flushed zone (Rxo), the zone adjacent to the borehole and saturated with
mud filtrate. Mud filtrate displaces formation fluid. Investigation at such short distances from

55
the borehole and measurement of rock saturated with mud filtrate minimizes the effect of
formation fluids on resistivity (Deyhim, 2000).
DeVries (2005) showed that facies can be described by chromatic variation observed
from BHI logs. These variations are shown by the range from darker to brighter colors. The
brighter colors (white – yellow) are characteristic of resistive rock, whereas the darker colors
(orange to black) are indicative conductive rock. Schlumberger, Weatherford and Halliburton use
similar presentations for illustrating micro resistivity, all displaying a static image and a dynamic
image, side-by-side. The Halliburton Extended Range Micro Imager (Figure 41) uses an
additional image display called the Horiz7 Filter, which provides much detail in imagery of
sedimentary structures, by use of a high-resolution (3-ft.) sliding window. Static normalization
applied throughout the interval of the BHI color-codes a given resistivity value consistently
throughout the data set. Alternatively, the dynamic image is normalized dynamically; local
normalization of the data is conducted within a sliding window. For high resolution data, size of
the sliding window typically is between 2 and 10 ft. The dynamic image provides abundant local
detail within a given window. However, relative colors of two equal values of resistivity located
in different windows will be eluded (Lagraba et al., 2010). Dynamic images provide excellent
local detail, but the static image is the preferred display for use in comparison of resistivity
signatures throughout a data set. High-quality BHI data permits accurate interpretation:
orientations of strata, composition, texture, degrees of cementation, reservoir quality, faults,
fractures, and borehole breakouts.
56
Figure 41: Photograph of Halliburton’s XRMI with six arms fully extended (Halliburton, 2012).
57
Borehole-image Facies Analysis, Illustration of Method
Facies described from core of the Hembree 3-17 were calibrated to borehole-image logs.
The working hypothesis was that correlation of a core-calibrated micro image log to other wells
with BHI logs but with no cores would allow identification of reservoir facies. Analysis of dip
meter data would help define the types of fluvial processes that deposited the Tussy sands. Core-
calibrated BHI logs have been effective for interpretation of upper Morrowan sandstone
depositional facies and inferring reservoir quality within the Mustang East field in Morton
County, Kansas (DeVries, 2005). Pattern recognition of chromatic variation and dip meter
orientations of individual core-derived lithofacies in BHI logs were used in combination to
interpret depositional facies and reservoir quality and to correlate mappable micro-image log
derived facies (DeVries, 2005). Donselaar and Schmidt (2010) showed how BHI logs allow
direct interpretation of lithofacies, by comparison with behind-outcrop BHI logs and one behind-
outcrop core. Fluvial facies and borehole image facies were interpreted from vertical color
successions and dip meter patterns (Donselaar and Schmidt, 2010). Similar methods were
employed in this study. Table 2 is an outline of characteristics used to relate micro resistivity
signatures to core-derived depositional facies. Figure 42 shows the Tussy B sandstone and Figure
43 shows the Tussy A sandstone from the Hembree 3-17 core. These images are positioned
between Halliburton’s Static XRMI and Horiz7 dynamic XRMI.

58
FACIES Borehole Image Characteristics
Terminology Descriptions
F1 Highly resistive (yellow to orange) interbedded, with resistive (dark
orange to brown) clay rip-up clasts. Recognizable on the dynamic or
Horiz7 images. Dip meter typically shows “random” tadpoles.
F3 Highly resistive (white to orange) with sinusoidal pattern from low-angle
planar laminae. Recognizable on the dynamic or Horiz7 image. Dip-
meter tadpoles show a unidirectional pattern.
F4 Highly resistive (white to orange to dark orange). Difficult to identify on
static and dynamic images due to inconsistency of patterns. (Dipmeter
did not record orientations over this interval in the Hembree 3-17.)
F5 Highly resistive (yellow to orange) with slightly less resistive drapes
(orange dark orange). Recognizable on dynamic or Horiz7 images;
poorly visible on static image. Dip-meter typically shows unidirectional
dip pattern.
F6 Highly resistive (yellow to orange) with well-defined stacked, rippled
laminae sets. Recognizable on dynamic or Horiz7 images; poorly visible
on static image. Dip meter typically shows unidirectional dip pattern.
P-E Moderately to highly conductive (orange to dark orange). Typically
forms the uppermost parts of fining-upward sequences.
M-FP Highly conductive (dark orange to dark brown).
Table #2: Characteristics of BHI log facies from the Hembree 3-17.
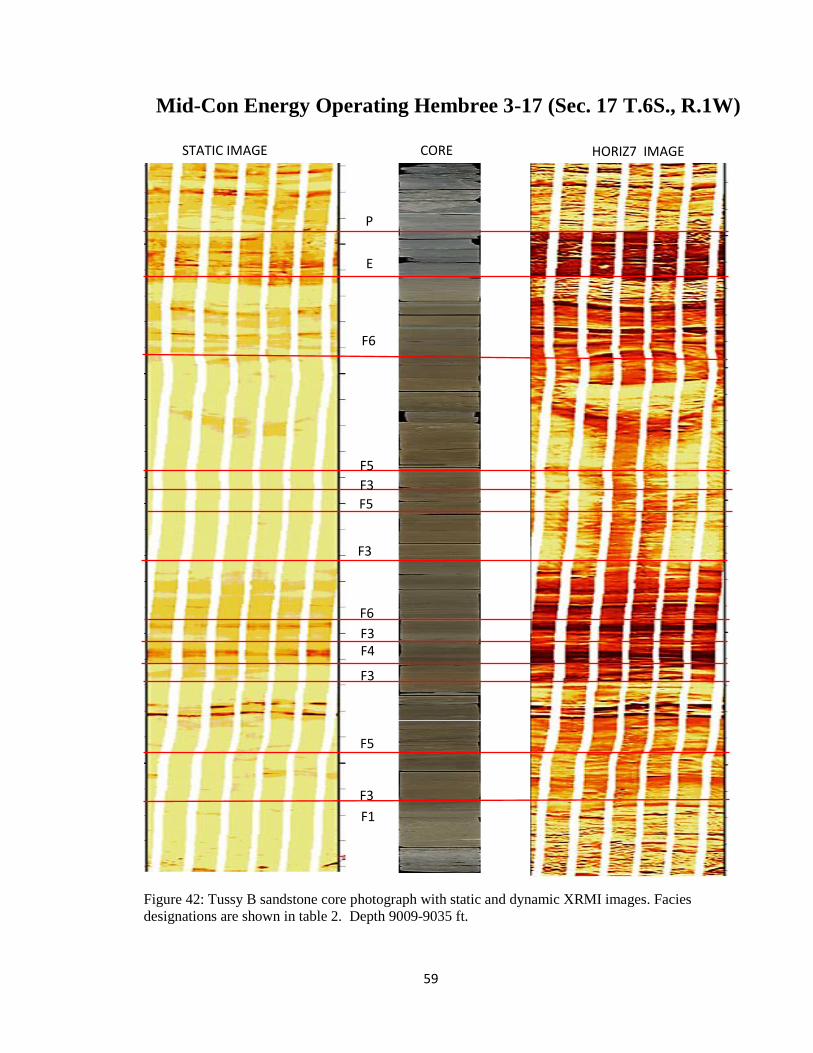
59
Figure 42: Tussy B sandstone core photograph with static and dynamic XRMI images. Facies
designations are shown in table 2. Depth 9009-9035 ft.
F1
P
E
F6
STATIC IMAGE CORE HORIZ7 IMAGE
F5
F3
F5
F4
F3
F3
F3
F6
F5
F3
Mid-Con Energy Operating Hembree 3-17 (Sec. 17 T.6S., R.1W)

60
Figure 43: Tussy A sandstone core photograph with static and dynamic XRMI images. Facies
designations are shown in table 2. Depth 8980-8990 ft.
STATIC IMAGE CORE HORIZ7 IMAGE
Mid-Con Energy Operating Hembree 3-17 (Sec. 17 T.6S., R.1W)
F3
F5
F3
F5
F6
F5
F5
F3

61
(F1) Clay-clast Conglomeratic Sandstone
Figure 44: Facies F1. BHI characteristics showing channel-lag clay rip-up clasts and associated
“randomly” oriented dipmeter readings.
Facies F1 (Figure 44) is highly resistive (yellow to orange) with resistive (dark orange to
brown) rip-up clasts. F1 is easily recognized by use of the dynamic or Horiz7 images. The static
image does not highlight clay rip-up clasts. The dynamically normalized image is useful in
depicting clay clasts in the conglomeratic sandstone facies, because the sliding window can
discriminate among resistivities of the fine-grained sandstone and the less-resistive clay clasts.
Dipmeter tadpole orientations are “randomly” oriented within the F1 facies (Figure 41). Thus,
analyzing the “random” orientations of dipmeter tadpoles, in combination with inspection of
images of resistive clay clasts - as seen in the Dynamic or Horiz7 images - allows reliable
interpretation of facies F1.
3 ft.
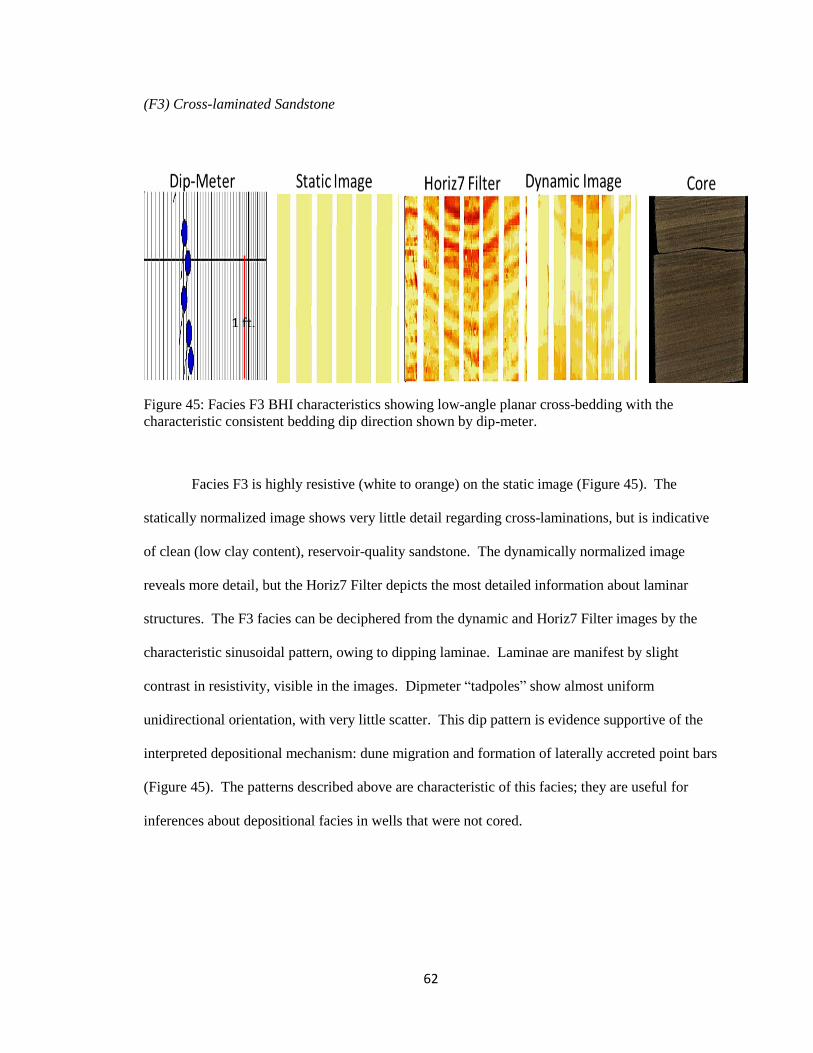
62
(F3) Cross-laminated Sandstone
Figure 45: Facies F3 BHI characteristics showing low-angle planar cross-bedding with the
characteristic consistent bedding dip direction shown by dip-meter.
Facies F3 is highly resistive (white to orange) on the static image (Figure 45). The
statically normalized image shows very little detail regarding cross-laminations, but is indicative
of clean (low clay content), reservoir-quality sandstone. The dynamically normalized image
reveals more detail, but the Horiz7 Filter depicts the most detailed information about laminar
structures. The F3 facies can be deciphered from the dynamic and Horiz7 Filter images by the
characteristic sinusoidal pattern, owing to dipping laminae. Laminae are manifest by slight
contrast in resistivity, visible in the images. Dipmeter “tadpoles” show almost uniform
unidirectional orientation, with very little scatter. This dip pattern is evidence supportive of the
interpreted depositional mechanism: dune migration and formation of laterally accreted point bars
(Figure 45). The patterns described above are characteristic of this facies; they are useful for
inferences about depositional facies in wells that were not cored.
1 ft.

63
(F4) Trough Cross-laminated Sandstone
Figure 46: Facies F4. Borehole-images showing suspected trough cross-stratification. Dip-meter
shows no tadpoles.
Facies F4 is highly resistive (yellow to orange) on the static image log (Figure 46). The
dark yellow to orange hue on the static image is probably indicative of very fine grain size, which
reduces the quality of the F4 reservoir facies. (Compare this pattern with solid yellow hue in the
F3 facies.) Facies F4 is clearly identifiable on the Horiz7 filter or dynamic image, but overall, its
BHI characteristics are not as diagnostic as those of the other facies considered in this paper. In
general, the BHI textural characteristics are those of a mottled pattern. (Dipmeter data were not
recorded over this stratigraphic interval.)
1 ft.
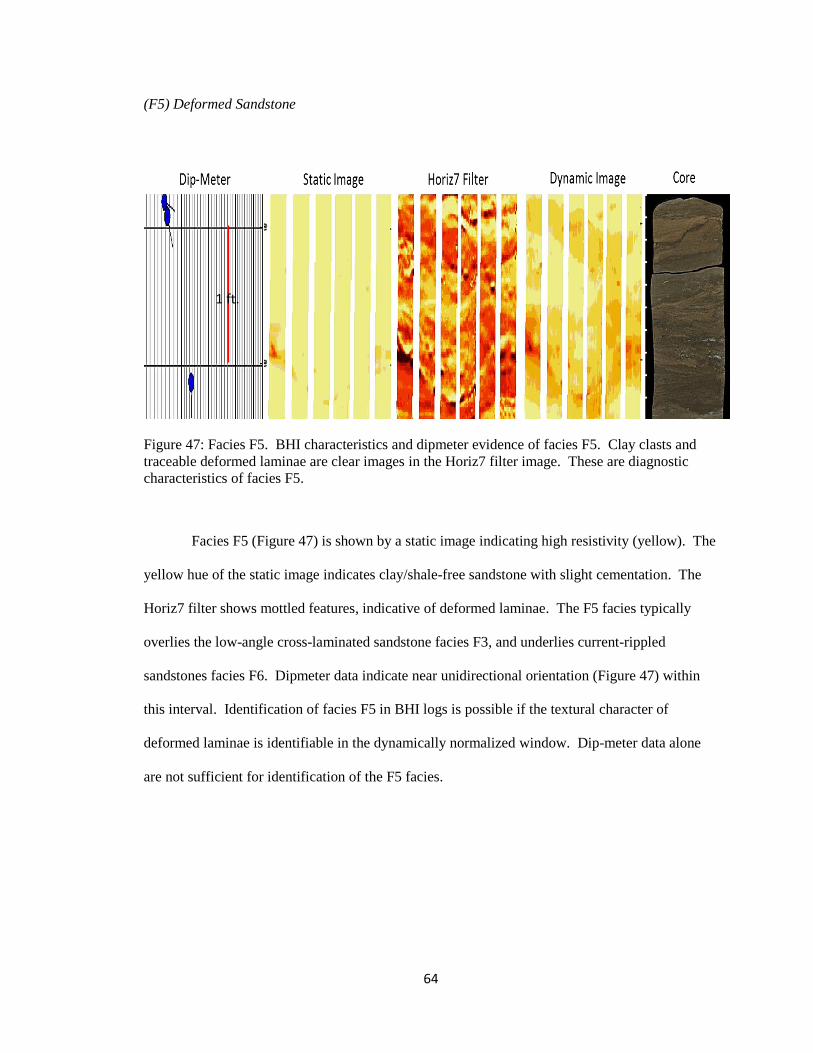
64
(F5) Deformed Sandstone
Figure 47: Facies F5. BHI characteristics and dipmeter evidence of facies F5. Clay clasts and
traceable deformed laminae are clear images in the Horiz7 filter image. These are diagnostic
characteristics of facies F5.
Facies F5 (Figure 47) is shown by a static image indicating high resistivity (yellow). The
yellow hue of the static image indicates clay/shale-free sandstone with slight cementation. The
Horiz7 filter shows mottled features, indicative of deformed laminae. The F5 facies typically
overlies the low-angle cross-laminated sandstone facies F3, and underlies current-rippled
sandstones facies F6. Dipmeter data indicate near unidirectional orientation (Figure 47) within
this interval. Identification of facies F5 in BHI logs is possible if the textural character of
deformed laminae is identifiable in the dynamically normalized window. Dip-meter data alone
are not sufficient for identification of the F5 facies.
1 ft.

65
(F6) Current-rippled Sandstone
Figure 48: Facies F6. BHI characteristics of stacked asymmetrical ripple cross-laminations with
consistent dip directions.
Facies F6 is highly resistive (yellow to orange) on the statically and dynamically
normalized images (Figure 48). The Horiz7 Filter in Figure 48 elucidates the asymmetric,
current-ripple cross bedding that contains fine-grained sandstone drapes and slightly coarser-
grained sandstone. Dipmeter tadpoles show a unidirectional dip direction with minimal scatter.
The “uniform” orientation of dipmeter tadpoles (Figure 48) is consistent with the interpreted
depositional mechanism of this facies – namely, deposition by unidirectional lower-flow-regime
stream flow. This facies can be identified easily in wells without cores, by micro-image logs and
conventional wireline logs. The stacked-ripple cross-bed geometries are detectable by orientation
of dipmeter tadpoles; moreover, the gamma-ray log signature indicates that grain size tends to
fine upwards. This facies is typically positioned near the top of the fining-upward sequence. It is
associated with relatively high gamma-ray signatures and low neutron-density porosity, in
comparison with coarse-grained sandstone of better reservoir quality.
1 ft.

66
(P-E) Paleosol-Estuarine
Figure 49: Facies P-E. Characteristic oxidized, conductive material; the product of subaerial
exposure and weathering as a result of subaerial exposure and weathering.
BHI facies P-E has a moderately resistive (yellow to dark orange) hue on the static image
(Figure 49). The dark yellow to dark orange hue of the static image is indicative of this facies,
which is very-fine-grained sandstone to siltstone; the reservoir quality is poor. The P-E facies can
be interpreted from borehole imagery by the variegated resistivity pattern. The pattern of colors
is derived from resistivity contrasts between the highly oxidized zones (the more resistive) and
the moderately oxidized zones. Dipmeter tadpoles show a consistent orientation pattern (Figure
49). The dip pattern may reflect unidirectional low-energy flow of channel abandonment, or of
estuarine sediments filling an abandoned-channel belt.
1 ft.

67
Reservoir Quality Inferred From Chromatic Variation
Reservoir quality can be inferred in borehole image logs by analysis of chromatic
variation (Devries, 2005). In the present instance, the rock analyzed was the cored Tussy B
interval, in the Mid-Con Energy Operating Hembree 3-17 (Figure 50). Light-yellow-to-white hue
indicates clean sandstone that is highly cemented (porosity is occluded); reservoir-quality is poor
(less than 10% porosity). Yellow-to-light-orange hue on the static image indicates good reservoir
quality and porous-sandstone facies (more than 10% porosity). Light-orange-to-orange hue
typically is associated with very-fine-grained silty to shaly sandstone, of fair to poor reservoir
quality (less than 8% porosity). Dark-orange-to-brown hue is associated with silt to mudstone;
this rock is considered to be of non-reservoir quality. Appendix A shows core-derived porosity
and permeability values correlated with core photographs and static BHI logs of the Tussy A and
B sandstones in the Hembree 3-17 well.
Borehole-image Facies Associations
The purpose of this section is to group previously defined Tussy lithofacies into
borehole-image associations, according to lithology and reservoir quality, and to relate the
defined facies associations to wells with borehole-image logs, but no cores. Four borehole-image
facies can be correlated on a field-wide scale: (1) fluvial facies, (2) channel abandonment-
estuarine facies, (3) floodplain facies and (4) marine facies. The cored Tussy B interval of the
Hembree 3-17 is useful for illustration of these four BHI facies associations (Figure 50). The
sandstone (reservoir) is underlain by marine mudstones and overlain by abandoned-channel facies
and estuarine facies. In Appendix A is a borehole-image cross section. It shows correlations of
borehole-image facies at field-wide scale.

68
Figure 50: Static image, Tussy B reservoir facies, Mid-Con Energy Operating Hembree 3-17
showing borehole-imagery facies associations, porosity and permeability.
Fa
ir t
o P
oo
r
Res
erv
oir
No
n-
rese
rvo
ir
No
n-
rese
rvo
ir
7.6
16.9
15.0
15.3
12.3
15.2
13.2
12.5
11.6
12.5
15.1 16.9
15.9
17.6
16.3
16.6
11.6 10.3
13.4
11.0
12.5
0.025
9.29
7.28
15.4
0.176
25.8
0.783
0.153
0.109
0.557
6.80 36.6
17.5
36.0
43.8
16.5
0.206
15.9
0.921
0.028
0.155
Porosity (%) Permeability (md)
Good
Res
erv
oir
Floodplain Association
Abandoned Channel-
Estuarine Association
Fluvial
Association
Marine
Association

69
Dipmeter Pattern Analysis and Fluvial Typing
Interpretation of dipmeter data in conjunction with facies analysis is useful in
determining the type of fluvial system under investigation: meandering, braided or distributary.
Meandering rivers typically are of low gradient; in them are deposited elongated “shoe-string”
sand bodies, bordered by floodplain. These shoestring sands are sub-parallel to the sloping
depositional profile (Cant, 1982). In comparison to braided streams, meandering rivers are low-
energy systems. Meandering systems typically contain sediments with smaller grain size (Slatt,
2006). A typical vertical profile consists of channel-lag conglomerate that fines upward to sand,
to mud. Channel-lag deposits grade upward into point-bar deposits, which consist of cross-
bedded, plane-bedded, and trough-cross-bedded sands capped by climbing ripples and mud
drapes (Cant, 1982). Point bars enlarge by lateral migration of megaripples from the channel
floor onto point bars (Allen, 1970; Bridge, 1977; Donselaar and Schmidt, 2010). The deposits of
small meandering fluvial systems are manifest in cores as successive fining-upward sequences
(Cant, 1982). Similar features were observed from core of the Tussy sandstones.
Figure 51 includes a gamma-ray curve, a statically normalized borehole-image and dip-
meter tadpoles of the Tussy A and B intervals in the Mid-Con Energy Operating Hembree 3-17.
Dipmeter tadpoles were organized into groups (2-6 ft) of “unidirectional” dip. Each group
depicts gradually upward-different dips, which are interpreted as being the record of lateral
accretion surfaces of point-bars, an arrangement similar to findings by Donselaar and Schmidt
(2010); “The gradual vertical variation in dip angle is the expression of the sigmoidal shape of
the accretion surfaces, and the slight upward rotation of the dip direction indicates the
(downstream) migration in time of the point bar”. (Donselaar and Schmidt, 2010). Small grain
size and fluvial-linked sedimentary structures (Figures 33, 34, 35 and 36) support the meandering
fluvial environment, in conjunction with dipmeter data described above.

70
Figure 51: Gamma-ray (left), static image (middle) and sedimentary dip-meter plots (right) from
the Mid-Con Energy Operating Hembree 3-17 XRMI. Dip-meter tadpoles are grouped into
packages of common “unidirectional” dip orientations, interpreted as lateral accretion of stacked
fluvial point bars, within a meandering fluvial system. The carbonate present in the middle-to-
upper portions of the channel facies (black ovals) are probably a result of groundwater circulation
and/or subaerial exposure, while the carbonate near the base (red ovals) are probably the result of
erosion into underlying carbonate-rich mudstone.

71
Summary
Core-derived lithofacies display distinct textural characteristics on borehole image logs;
they allow accurate core-to-borehole-image calibration. The Horiz7 and the dynamic image are
most effective for interpretation of sedimentary structures and depositional facies. The static
image (Figure 50) is most effective for inferences about diagenetic effects (cementation) and
differences in grain-size. Borehole-image facies were grouped into four associations: marine,
fluvial, floodplain and abandoned-channel -estuarine (Figure 50). These associations were
correlated to records of wells with borehole-image logs, but no cores. Vertical stacking patterns
of borehole-image logs provided evidence of this sequence of depositional environments within
the Southeast Joiner City oilfield: marine, fluvial channel, channel abandonment, estuarine,
floodplain, fluvial channel (from bottom-to-top). This stacking is believed to be evidence of
base-level cyclicity that controlled deposition of the Tussy A and B intervals. Sharp contacts
between sandstones and underlying mudstones-siltstones, observed on borehole-imagery logs,
help solidify the interpretation.
Chromatic variation is effective evidence for inferences about reservoir quality (Figure
50). A yellow hue typically correlates to the best reservoir quality in the Tussy sandstones.
Dipmeter data (Figure 51) were available in description of the Tussy fluvial system as a
meandering-channel belt, composed of laterally and vertically amalgamated, side-attached point-
bars.
72
CHAPTER VI
SPATIAL CHARACTERISTICS OF THE RESERVOIRS
Net-porous-sandstone Maps
Net-porous-sandstone isopach maps of the Tussy A (Figure 52) and Tussy B (Figure 54)
reservoirs were hand contoured and then digitized into Petra Geological software. The maps
illustrate distribution of the reservoirs. The net-porous-sandstone cutoffs used to define the Tussy
A and B reservoirs are:
(1) Volume of shale less than 40%, and (2) density-porosity is more than 12% (as calculated
on the basis of matrix density = 2.71 grams/cm^3)
Storage Capacity (phi*h) Maps
Storage capacity of the Tussy A and B sandstones is shown in Figures 53 and 55,
respectively. Storage capacity is the product of average porosity and net pay thickness; it was
calculated for the majority of wells in the study area. These maps were constructed using Petra
Geological Software. Average porosity (PHIA) was calculated for each well by cross-plotting
density porosity (Dphi) and neutron porosity (Nphi), using the following equation:
PHIA = (Dphi + Nphi) / 2.
Storage capacity was calculated for each well by the following equation:
Storage Capacity = Average porosity * Net pay height

73
Figure 52: Thickness of net porous Tussy A sandstone (density-neutron porosity > 12%; volume
of shale < 40%). Contour interval: 3 ft. Thicknesses shown in color bar, upper left corner of the
figure. Actual Range: zero (magenta) to 27 ft (red). Red arrow indicates oil-water contact within
an interpreted disconnected sandbody with a down-dip water leg. These abandoned sand bodies
were the only observed oil-water contacts in the Tussy A sandstone within the Southeast Joiner
City field.
Interpreted isolated point-bar with down-dip water leg

74
Figure 53: Storage-capacity thickness, Tussy A sandstone. Storage capacity = average porosity *
net-pay height. Contour interval and color bar are on left. Red arrow indicates a water leg in an
isolated sandstone deposit.
Interpreted isolated point-bar with down-dip water leg

75
Figure 54: Thickness of net porous Tussy B sandstone (density-neutron porosity > 12%; volume
of shale < 40%). Contour interval: 3 ft. Thicknesses shown in color bar, upper left corner of the
figure. Actual Range: zero (magenta) to 27 ft (red). Red arrow indicates oil-water contact within
an interpreted disconnected sandbody with a down-dip water leg. These abandoned sand bodies
were the only observed oil-water contacts in the Tussy B sandstone within the Southeast Joiner
City field.
Interpreted isolated point-bar with down-dip water leg

76
Figure 55: Storage-capacity thickness, Tussy B sandstone. Storage capacity = average porosity *
net pay height. Contour interval and color bar are on left. Black line indicates a water leg in an
isolated sandstone deposit.
Interpreted isolated point-bar with down-dip water leg
77
Depositional Model and Meander-belt Analogues
Sedimentary structures and gamma-ray log geometries support the inference of a fluvial
origin of the Tussy A and B sandstones. Borehole-imagery and dipmeter data provided patterns
consistent with those of point-bar deposits. Sandstone-distribution maps (Figures 52, 53, 54 and
55) depicted patterns indicative of active channel fill. Distribution and geometry of the Tussy
sandstones (Figures 52, 53, 54 and 55) resemble analogues of meander-channel belts.
Figure 56 illustrates meander-belt geometry and distribution of sediment in the
Mississippi River near Memphis, Tennessee. Figure 57 is a computer simulation of the spatial
distributions and geometries of salient features within a meander belt. These two figures were
used as conceptual analogues. They were of value in visualizing prominent depositional features
and their spatial relationships. Distribution and geometry of the Tussy A and B sandstone, as
illustrated by the reservoir isopach maps (Figures 52, 53, 54 and 55) resemble the distribution and
geometry of the two meander-belt analogues in Figures 56 and 57. The sandstone bodies form
elongated shoestring-like bodies that are oriented generally perpendicular to the depositional
profile, which is consistent with meandering fluvial channel geometries described by Cant, 1982.
In the meander belt computer simulation in Figure 57, numerous abandoned point-bars are at the
sides of the main meander belt; this pattern resembles “pods” of sandstone shown in the Tussy A
and Tussy B isopach maps (Figures 52, 53, 54 and 55). The Mississippi River anastomoses and
has multiple abandoned channels; numerous meanders are off to the sides of the active channel
belt (Figure 56). A similar pattern is interpreted in the Tussy A and B sandstone distribution
maps (Figures 52, 53, 54 and 55).

78
Figure 56: Satellite photograph of Mississippi River meander belt near Memphis, Tennessee,
USA (www.eros.usgs.gov).

79
Figure 57: Computer simulation and model of a meander belt, showing prominent point bars and
spatial relationships (Sun et al., 1996).

80
Dimensions of Fluvial Channels
Widths of the Tussy A and Tussy B channels range from approximately 2,000 ft. to 4,500
ft. (Figures 52, 53, 54 and 55). As interpreted from currently available well logs and derived
data, the Tussy A and B reservoirs are about 4 to 6 miles long (Figures 52, 53, 54, 55). The
reservoirs almost certainly are longer. Analysis of Tussy sandstone production history for the
majority of wells in the Southeast Joiner City field has revealed that the more prolific wells (more
than 50,000 barrels of oil) are greater than 8 ft. in thickness. Channel thickness ranges from 1 ft.
at the edges to 30 ft. near the center.
Channel Connectivity
Figure 58 illustrates two isopach-map scenarios of meandering-point-bar deposits from
the Miocene Huesca Fan at Ebro, Spain (Donselaar and Overeem, 2008). The outcrop shown in
Figure 59 is interpreted as a sequence of multistoried laterally amalgamated point-bar sandstones
– the record of a meander river system. The Miocene Huesca fluvial fan is an outcrop analog of
lateral relationships of point-bar deposits. Donselaar and Overeem (2008) described fluvial
point-bar connectivity within the Huesca Fan; they showed how point bars can be connected by
channel-floor sandstone bodies. This research is important for oil-and-gas operators who develop
fields comprised of side-attached (meandering) point-bars, because these types of deposits are
well known as being discontinuous – an attribute that is especially problematic waterflooding and
other enhanced recovery procedures. When present, reserves of petroleum are larger and
productivity is better in meandering-stream deposits that are connected by channel floor
sandstones (Donselaar and Overeem, 2008). Point-bar connectivity of similar kind is suspected
to be operative in Tussy reservoirs. During enhanced-recovery operations, injection of water has
stimulated producing wells that are more than 1 mile from the injection-well. Injector –producer
communication is more apparent where both wells are near to the center of the channel belt.

81
Figure 58: Isopach maps from Miocene Huesca fluvial fan in Ebro, Spain showing two
interpretation meander-sandstone distribution and connectivity. (A) Fluvial channel is filled with
mud after channel abandonment; point-bars are compartments. (B) Channel floor consists of
clean trough-cross-bedded sand. The sand body is connected throughout the trend (Donselaar and
Overeem, 2008).
Figure 59: Outcrop photograph and interpretation of multistoried laterally amalgamated point
bars in a meandering-river sandstone of the Miocene Huesca fluvial fan. (Donselaar and
Overeem, 2008).

82
Point bars seem to be connected over long distances in most of the study area,
particularly where they are in the central part of the channel belt. However, in a few areas
injector and producer wells within the same stratigraphic interval are not connected, a fact that is
apparent from analysis of injection data and production data. For example, Figure 60 is a well-
log cross-section that shows evidence of flow barriers between two wells completed in the Tussy
A Sandstone. The large volume of water injected (more than 550,000 bbl) into Tussy sandstone
in the Sabre Operating Tom 1-2 has caused no apparent increase in oil or water production in the
RDT Tom 3-2, located only 900 feet to the southeast. In November 2011a well test of the Tom 3-
2 was 1 barrel of oil and 0 barrels of water (Figure 60). During the month of December 2011, the
Sabre Operating Tom 1-2 injection well averaged 355 barrels of water injected per day (Figure
60). Recent injection profiles for the Tom 1-2 show that the injected water enters perforations in
the Tussy A sandstones. Thus, the Tom 1-2 is an active injector of water into Tussy sandstones
but the nearby Tom 3-2 producer shows no response. The unavoidable conclusion is that at this
point, sandstones of the point-bar system are isolated.

83
Fig
ure
60:
Lo
g c
ross
-sec
tion i
llust
rati
ng f
low
bar
rier
s bet
wee
n w
ells
com
ple
ted
in t
he
Tuss
y
San
dst
on
es. T
he
larg
e volu
me
of
wat
er i
nje
cted
into
the
Sab
re O
per
atin
g T
om
1-2
has
cau
sed
no
app
aren
t in
crea
se i
n o
il o
r w
ater
pro
duct
ion f
rom
the
RD
T T
om
3-2
, lo
cate
d o
nly
ab
ou
t 9
00
fee
t to
the
sou
thea
stw
ard
. T
his
flo
w b
affl
e is
consi
sten
t w
ith i
nte
rbar
dis
conti
nuit
y i
n p
oin
t-bar
syst
ems.
Inje
ctio
n H
isto
ry
Av
g.
for
Dec
. 20
11
= 3
55
BW
IPD
To
tal
cum
in
ject
ion
= 5
54,
25
2 B
BL
84
Summary
Based on the distribution patterns, sandstone geometry, sedimentary structures, and
dipmeter measurements and patterns, the Tussy A and B sandstones of the Southeast Joiner City
field are interpreted as having been deposited in fluvial-channel belts. The Tussy reservoirs
almost certainly originated as stacked laterally amalgamated point bars, which compose a
meander belt. Individual point bars show evidence of a high degree of connection, particularly
near the middle of the channel belt. Lateral connection probably is the result of channel-floor
sand bodies that extend among individual point-bars within the channel belt. In the study area,
some point-bar sandstones contain water, but are up-dip from similar sandstones that contain oil.
These point-bars are interpreted to have been abandoned from the main channel, and to be
isolated by mudstones. Mapping of the sandstones along with injection and production data
showed the locations of connected point bars and abandoned point bars. Mapping the distribution
of net porous sandstone with more than 12% porosity delineates reservoir facies. Allowing the
depositional model to guide subsurface mapping improves the interpretation of reservoir
distribution and connectivity.

85
CHAPTER VII
CONCLUSIONS
Data collected from two cores, from conventional wireline logs and from borehole-image
logs were integrated and interpreted, Conclusions regarding the Lower Desmoinesian Tussy
sandstone reservoirs in the Southeast Joiner City field in Love and Carter County, Oklahoma are
as follows:
1. Thickness of the stratigraphic interval (175-300 ft) and rose diagrams based on plots
of sedimentary bedding-plane dips indicate a dominant north-to-south sediment-
transport direction, toward the depocenter, south of the Southeast Joiner City oil
field.
2. Lithofacies of the Tussy stratigraphic interval are of marine, estuarine, fluvial and
floodplain environments. Vertical stacking patterns reveal cyclic deposition that is
suggestive of deposition controlled by variation of base level.
3. The Tussy A and B sandstones are interpreted as amalgamated and laterally
connected, side-attached point-bar deposits within a channel belt. This conclusion is
based on sedimentary structures, sand-body geometry and sand-body distribution.

86
4. Apparent variation in base level influenced deposition styles. As interpreted from the
stratigraphic sequence the stages were as follows: lowstand, with paraconglomeratic
erosive channel base, fluvial sandstones succeeded by estuarine and mixed fluvial-
marine deposition during transgression, and subaerial exposure during the subsequent
fall in base-level and development of paleosols.
5. Tussy point-bar fluvial facies have the highest porosity (12% - 18%) and
permeability (1md - 148 md). These rocks are the best reservoir.
6. Primary porosity is abundant, but secondary porosity is prevalent; it resulted from
dissolution of feldspar, rock fragments and detrital clay matrix.
7. Horizontal planar-laminated facies and cross-laminated facies are the best reservoir
facies. The deformed sandstone facies also is of good quality, but porosity is high
and permeability tends to be low.
8. Core-calibrated borehole-image logs accurately display discrete textural
characteristics of core-derived lithofacies. They are the basis for the inferences about
depositional facies, grain size and reservoir quality in wells with borehole-image
logs, but no cores.
9. Dip-meter data from borehole-image logs provide evidence about migration of dunes.
They are useful for interpretation of vertically amalgamated, laterally accreted point-
bar deposits.
10. The rather plentiful evidence of fluid transmitted from one point-bar to another could
be associated with channel-floor sandstones that connect adjacent point-bars.

87
REFERENCES
Abbott, B.N., 2006, Pre-Pennsylvanian subcrop map, Love County, Oklahoma, unpublished map
Allen, J.R.L., 1970, Studies in fluviatile sedimentation: A comparison of fining upward
cyclothems with special reference to coarse-member composition and interpretation: Journal of
Sedimentary Petrology, v. 40, p. 298-323.
Al-Shaieb, Z.F., Thomas, R.G., and Stewart, G.F., 1980, National uranium resource evaluation,
Lawton quadrangle, Oklahoma and Texas: U.S. Department of Energy, Open file report.
Asquith, G., Krygowski, 2004, Gamma Ray, in G. Asquith and D. Krygowski, Basic Well log
analysis: AAPG Methods in Exploration 16, p. 31-35.
Billingsley, P., Banerjee, S., Elmore, R.D., and Sutherland, P.K., 1996, Fluvial-deltaic facies
patterns in the lower Deese group (Middle Pennsylvanian), Ardmore Basin, in Johnson, K.S.
(ed.), Deltaic reservoirs in the southern Midcontinent, 1993 symposium: Oklahoma: Oklahoma
Geological Survey Circular 98, p. 240-248.
Boggs, S. Jr., 2006, Principles of sedimentology and stratigraphy 4th ed.
Boyd, D.T., 2002, Map of Oklahoma oil and gas fields, Oklahoma Geological Survey Map GM-
37
Bradfield, H.H., 1968, Stratigraphy and structure of the deeper Marietta basin of Oklahoma and
Texas: in W.J Stewart, ed., Basins of the southwest, v. 1, p. 54-70: North Texas Geological
Society.
Bridge, J.S., 1977, Flow, bed topography and sedimentary structures in open channel bends: A
three-dimensional model: Earth surface processes, v. 2, p. 401-416.
Cant, D.J., 1982, Fluvial facies models and their applications, in P.A. Scholle and D. Spearing
(eds.), Sandstone depositional environments: AAPG Memoir 31, p. 115-138.
Coleman, J.M., Prior, D.B., 1982, Deltaic environments of deposition, in Scholle, P.A., Darwin,
S., eds., Sandstone depositional environments: AAPG Memoir 31, p. 139-178.
Deyhim, P., 2000, Compartmentalization and overpressuring of the oligocene Vicksburg
Sandstone, TCB Field, Kleberg County, Texas: unpublished M.S. thesis, Oklahoma State
University, Stillwater, Oklahoma.
DeVries, A. A., 2005, Sequence stratigraphy and micro-image analysis of the Upper Morrow
sandstone in the Mustang East Field, Morton County Kansas: unpublished M.S. thesis, Oklahoma
State University, Stillwater, Oklahoma.
88
Donselaar, M.E., and J.M. Schmidt, 2010, The application of borehole image logs to fluvial facies
interpretation, in M. Poppelreiter, C. Garcia-Carballido, and M. Kraaijveld, eds., Dipmeter and
borehole image log technology: AAPG Memoir 92, p. 145-166.
Donselaar, M. E., Overeem, I., 2008, Connectivity of fluvial point-bar deposits: An example from
the Miocene Huesca Fluvial Fan, Ebro Basin, Spain, AAPG, Bulletin V. 92, no. 9 p. 1109-1129.
Feinstein, S., 1981, Subsidence and thermal history of southern Oklahoma Aulacogen:
Implications for petroleum exploration: AAPG, Bulletin V. 65, no. 12, p. 2521-2533.
Halliburton website, 2012,
http://www.halliburton.com/public/lp/contents/Brochures/web/H06462.pdf
Ham, W.E., Denison, R.E., and C.A. Merritt, 1964, Basement rocks and structural evolution of
southern Oklahoma: Oklahoma Geological Survey Bulletin 95, 302 p.
Hoard, J.L., 1954, Tussy Sector of the Tatums Field, Carter, and Garvin Counties, Oklahoma:
AAPG, Petroleum Geology of Southern Oklahoma: A symposium: Sponsored by the Ardmore
Geological Society, V. 1, p. 186-206.
Jorgensen, D.G., 1989, Paleohydrology of the Anadarko Basin, Central United States, Oklahoma
Geological Survey Circular 90. p. 176-193.
Keller, G. R. and R. A. Stephenson, 2007, The Southern Oklahoma and Dniepr-Donets
aulacogens: a comparative analysis, in Hatcher, R. D., Jr., Carlson, M. P., McBride, J. H., and
Martínez Catalán, J. R. (eds.), The 4D Framework of Continental Crust: Geological Society of
America, Memoir 200, p. 127-143.
Lagraba, P., J. O., S. M. Hansen, M. Spalburg, and M. Helmy, 2010, Borehole image tool design,
value of information, and tool selection, in M. Poppelereiter, C. Garcia-Carballido, and M.
Kraaijveld, eds., Dipmeter and borehole image log technology: AAPG Memoir 92, p. 15-38.
Mullen, L.M., 1954, The Hewitt Oil Field of Carter County, Oklahoma: AAPG, Petroleum
Geology of Southern Oklahoma: A symposium: Sponsored by the Ardmore Geological Society,
V. 1, p. 154-161.
Neustadt, W. Jr., 1954, West Hewitt Field, Carter County, Oklahoma: AAPG, Petroleum Geology
of Southern Oklahoma: A symposium: sponsored by the Ardmore Geological Society, V. 1, p.
162-173.
Price, C., 2012, Verbal communication.
Rascoe, B. Jr., Adler, F.J., 1983, Permo-Carboniferous hydrocarbon accumulations, Mid-
Continent, U.S.A: AAPG Bulletin v. 62, no. 6, p. 979-1001.
Reeves, C.C. Jr., Mount, J.R., 1960, Possibility of hydrocarbon accumulations along northern
flank of Marietta Syncline, Love County, Oklahoma, AAPG Bulletin v. 44, no, 1, p. 72-82.
Slatt, R.M., 2006, Stratigraphic reservoirs characterization for petroleum geologists,
geophysicists and engineers: Handbook of Petroleum Exploration and Production, v. 12.
Stark, P.H., 1961, Subsurface stratigraphic study of the Pennsylvanian System in the Marietta
Basin of south central Oklahoma and north central Texas: unpublished M.S. thesis, University of
Wisconsin, Madison, Wisconsin.

89
Sun, T., P. Meakin, T. Jossang, and K. Schwarz, 1996, A simulation model of meandering rivers:
Water Resources Research, v. 32, pt. 9, p. 2937-2954.
Tomlinson, C.W., and McBee W. Jr., 1959, Pennsylvanian sediments and orogenies of Ardmore
District, Oklahoma, in Petroleum Geology of Southern Oklahoma, AAPG, v. 2: p. 3-52,
Tomlinson, C.W., and McBee W. Jr., 1962, Pennsylvanian sediments and orogenies of Ardmore
District, Oklahoma, in C.C. Branson, ed., Pennsylvanian System in the United States – a
symposium: AAPG, p. 461-500. (reprinted with revisions from “Petroleum Geology of southern
Oklahoma, v. 2”)
United States Geological Survey website, 2012, www.eros.usgs.gov
Waddell, D., E., 1966, Pennsylvanian fusulinids in the Ardmore Basin, Love and Carter Counties,
Oklahoma: Oklahoma Geological Survey Bulletin 113.
Westheimer, J M., 1965, Geology and petroleum of Love County, Oklahoma: Part II-Petroleum
geology of Love County, OGS Circular 63.

90
APPPENDIX A
Petrologs, Borehole-images, Core Photos, Thin-section Locations, Core-plug Porosity,
Permeabilities, and Borehole-image cross-section

91
9
05
0
Pennsylvanian / Desmoinesian (TUSSY)
90
10
90
40
89
80
90
30
90
20
89
90
90
00
MID
-CO
N E
NER
GY
OP
ERA
TIN
G H
EMB
REE
3-1
7
CO
RE
T
HIN
SE
CT
ION
Po
rosi
ty %
Fluvial Channel Marginal
Marine Floodplain Fluvial Channel
Car
bo
nac
eou
s P
lan
t D
ebri
s
Ch
ann
el L
ag
Stac
ked
Fin
ing
Up
war
d S
equ
ence
s
Exp
osu
re S
urf
ace
Thin
Wis
py
San
dst
on
es
90
50

92
Core Plug
Mid-Con Operating Hembree 3-17
Tussy A Sandstone
Thin Section Porosity
(NCS, 6500 psi)
psi)
Permeability (To Air)
14.2
12.0
3.5
14.4
15.8
16.0
16.0
12.5
16.0
12.5
9.5
2.28
0.157
0.0056
2.67
131.0
136.0
15.1
3.25
58.4
38.6
4.59

93
Core Plug Thin Section Core Porosity
(NCS, 6500 psi)
Core Permeability
(To Air)
Mid-Con Operating Hembree 3-17
Tussy B Sandstone
7.6
16.9
15.0
15.3
12.3
15.2
13.2
12.5
11.6
12.5
15.1
16.9
15.9
17.6
16.3
16.6
11.6
10.3
13.4
11.0
12.5
0.025
9.29
7.28 15.4
0.176
25.8
0.783
0.153
0.109
0.557
6.80
36.6
17.5
36.0
43.8
16.5
0.206
15.9
0.921
0.028
0.0155

94
San
ta F
e M
ine
rals
Gill
ey 2
0-2

95
Estuarine/Channel
Floodplain
Floodplain
Tussy A
Tussy B
Good quality reservoir
Good quality reservoir
Good quality reservoir
Good quality reservoir
Good quality reservoir
Vertical baffle
Good quality reservoir
Poor quality reservoir
Non-reservoir
Non-reservoir
Non-reservoir
Non-reservoir
Non-reservoir Non-reservoir
Non-reservoir
Non-reservoir
Good quality reservoir
Poor quality
reservoir
Tussy L.S. Datum Datum

VITA
Jeffrey Manning Cook
Candidate for the Degree of
Master of Science
Thesis: STRATIGRAPHY, DEPOSITIONAL ENVIRONMENTS AND RESERVOIR
DESCRIPTION OF THE TUSSY (DESMOINESIAN) SANDSTONES, SOUTHEAST
JOINER CITY FIELD, LOVE AND CARTER COUNTIES, OKLAHOMA
Major Field: Geology
Biographical:
Personal Data: Born in Oklahoma City, Oklahoma, on October 27, 1985, the son of Greg and
Janie Cook.
Education: Graduated from Edmond North High School, Edmond, Oklahoma in May
2004; received Bachelor of Science degree in Geology from University of
Oklahoma, Norman, Oklahoma in May 2010. Completed requirements for the
Master of Science degree with a major in Geology in May 2012.
Experience: Employed by Mid-Con energy as an intern geologist from May 2010 to
August 2010. Employed by Mid-Con Energy as a full-time staff geologist
from September 2010 to May 2012. Employed by Texland Petroleum as a
geologist from May 2012 to present.
Professional Memberships: American Association of Petroleum Geologists, Oklahoma
City Geological Society, Tulsa Geological Society

ADVISER’S APPROVAL: Dr. James Puckette
Name: Jeffrey M. Cook Date of Degree: May, 2012
Institution: Oklahoma State University Location: Stillwater, Oklahoma
Title of Study: STRATIGRAPHY, DEPOSITIONAL ENVIRONMENTS AND RESERVOIR
DESCRIPTION OF THE TUSSY (DESMOINESIAN) SANDSTONES, SOUTHEAST
JOINER CITY FIELD, LOVE AND CARTER COUNTIES, OKLAHOMA
Pages in Study: 95 Candidate for the Degree of Master of Science
Major Field: Geology
Scope and Method of Study: The Pennsylvanian (Desmoinesian) Tussy sandstones were studied
in the Southeast Joiner City field of Love and Carter Counties, Oklahoma. Data collected
from two cores, conventional wireline logs and borehole-image logs were analyzed and
interpreted. This set of data permitted interpretations of the stratigraphic framework,
depositional environments, and reservoir quality, geometry and distribution for the Tussy
sandstones within the Southeast Joiner City Field.
Findings and Conclusions: The Tussy interval is defined as the set of strata between the Tussy
Limestone at the top and the Upper Dornick Hills Group at the base. Analysis of cross-
sections revealed a southerly thickening of the Tussy interval, and rose plots of bedding
dips show a dominant north-to-south sediment transport direction. Thus, the basin
depocenter was south of the Southeast Joiner City field during Tussy deposition.
The Tussy A and B cored intervals are rocks that were deposited in marine,
fluvial, floodplain and estuarine environments; they show evidence of sea-level cyclicity.
Eleven core-derived facies were interpreted, each with distinct sedimentary structures and
reservoir quality. Characteristics of the lithotypes from analyses of core, thin-sections
and core-derived porosity and permeability data reveal that grain-size, degree of
cementation and clay content are the major controls on reservoir quality. The best
reservoir facies are of coarse grain-size, are poorly cemented, and have small amounts of
pore-clogging clays.
The Tussy A and B sandstones were interpreted as meandering stream deposits,
composed of amalgamated and laterally connected, side-attached point-bar deposits
within a channel belt. This conclusion is based on sedimentary structures, sand-body
geometry and sand-body distribution patterns which resemble modern analogues of
meander belts.