University Microfilms International - ShareOK
265
INFORMATION TO USERS This material was produced from a microfilm copy of the original document. While the most advanced technological means to photograph and reproduce this document have been used, the quality is heavily dependent upon the quality of the original submitted. The following explanation of techniques is provided to help you understand markings or patterns which may appear on this reproduction. 1. The sign or "target" for pages apparently lacking from the document photographed is "Missing Page(s)". If it was possible to obtain the missing page(s) or section, they are spliced into the film along with adjacent pages. This may have necessitated cutting thru an image and duplicating adjacent pages to insure you complete continuity. 2. When an image on the film is obliterated with a large round black mark, it is an indication that the photographer suspected that the copy may have moved during exposure and thus cause a blurred image. You will find a good image of the page in the adjacent frame. 3. When a map, drawing or chart, etc., was part of the material being photographed the photographer followed a definite method in "sectioning" the material. It is customary to begin photoing at the upper left hand corner of a large sheet and to continue photoing from left to right in equal sections with a small overlap. If necessary, sectioning is continued again — beginning below the first row and continuing on until complete. 4. The majority of users indicate that the textual content is of greatest value, however, a somewhat higher quality reproduction could be made from "photographs" if essential to the understanding of the dissertation. Silver prints of "photographs" may be ordered at additional charge by writing the Order Department, giving the catalog number, title, author and specific pages you wish reproduced. 5. PLEASE NOTE: Some pages may have indistinct print. Filmed as received. University Microfilms International 300 North Zeeb Road Ann Arbor. Michigan 48106 USA St John’s Road. Tyler’s Green High Wycombe, Bucks. England HPIO 8HR
-
Upload
khangminh22 -
Category
Documents
-
view
0 -
download
0
Transcript of University Microfilms International - ShareOK

INFORMATION TO USERS
This material was produced from a microfilm copy of the original document. While the most advanced technological means to photograph and reproduce this document have been used, the quality is heavily dependent upon the quality of the original submitted.
The following explanation of techniques is provided to help you understand markings or patterns which may appear on this reproduction.
1. The sign or "target" for pages apparently lacking from the document photographed is "Missing Page(s)". If it was possible to obtain the missing page(s) or section, they are spliced into the film along with adjacent pages. This may have necessitated cutting thru an image and duplicating adjacent pages to insure you complete continuity.
2. When an image on the film is obliterated with a large round black mark, it is an indication that the photographer suspected that the copy may have moved during exposure and thus cause a blurred image. You will find a good image of the page in the adjacent frame.
3. When a map, drawing or chart, etc., was part of the material being photographed the photographer followed a definite method in "sectioning" the material. I t is customary to begin photoing at the upper left hand corner of a large sheet and to continue photoing from left to right in equal sections with a small overlap. If necessary, sectioning is continued again — beginning below the first row and continuing on until complete.
4. The majority of users indicate that the textual content is of greatest value, however, a somewhat higher quality reproduction could be made from "photographs" if essential to the understanding of the dissertation. Silver prints of "photographs" may be ordered at additional charge by writing the Order Department, giving the catalog number, title, author and specific pages you wish reproduced.
5. PLEASE NOTE: Some pages may have indistinct print. Filmed as received.
University Microfilms International300 North Zeeb RoadAnn Arbor. Michigan 48106 USASt John’s Road. Tyler’s GreenHigh Wycombe, Bucks. England HPIO 8HR

77-21,391OBOT, Johnson Udo, 1939- MOVEMENT AND THE REMOVAL OF NUTRITIONAL DEFICIENCIES: THE CASE OF BEEF IN NIGERIA.
The University of Oklahoma, Ph.D., 1977 Social GeographyI
Xerox University Microfilms, Ann Arbor, Michigan4sio6

THE UNIVERSITY OF OKLAHOMA GRADUATE COLLEGE
MOVEMENT AND THE REMOVAL OF NUTRITIONAL DEFICIENCIES: THE CASE OF BEEF IN NIGERIA
A DISSERTATION SUBMITTED TO THE GRADUATE FACULTY
in partial fulfillment of the requirements for the degree of
DOCTOR OF PHILOSOPHY
BYJOHNSON UDO OBOT Norman, Oklahoma
1977

MOVEMENT AND THE REMOVAL OF NUTRITIONAL DEFICIENCIES: THE CASE OF BEEF IN NIGERIA
APPROVED BY
DISSERTATION COMMITTEE

MOVEMENT AND THE REMOVAL OF NUTRITIONAL DEFICIENCIES:THE : CASE OF BEEF IN NIGERIA
BY: JOHNSON UDO OBOT
MAJOR PROFESSOR: GARY L. THOMPSON, Ph.D.
The purpose of this study was to evaluate the problem of food deficit and its consequential protein malnutrition in less- developed countries. Protein-caloric malnutrition in children causes raarasmas and kwashiorkor. The malnourished children have stunted growth, protruding belly, pale color of the skin, abnormal reddening of the hair, swollen legs and feet, and accumulation of excessive fluid depending upon the severity of the deficiency. The high mortality rates in the one to four year-age old group suggest that protein malnutrition affects about fifty percent of the children. In adults it causes lethargy and poor motivation and can trigger off psychiatric illnesses.
Inadequate protein intake in these countries does not mean that protein foods are not produced in them. The problem is that their production is restricted because of adverse climatic conditions, poor technology and insect infestation. Solution lies in shipping high protein foodstuffs from production region to deficit areas.This requires capital, entrepreneurs, and experts for research, planning and development. The less-developed countries lack all these.
In order to analyze carefully the protein syndrome, Nigeria, was chosen as a particular example for investigation. In Nigeria the prevalence of Glossina, vectors of trypanosomiases, precludes successful animal husbandry in the southern provinces, it is only through costly and controlled schemes that animal husbandry can be practiced. The trypanosome-resistant dwarf Muturu and Ndama varieties raised in the south provide little meat and milk.
Supply of beef in the south must come from the northern Sahel zone that is tsetse free. Inefficient physical distribution management has made it impossible to transport and distribute beef cattle in the south. Consumers in this area prefer fresh beef to either refrigerated or canned meat. Live cattle must be shipped from north to south. The journey takes five weeks by foot, four days by truck and three days by train. The long journey coupled with poor feeding makes the cattle susceptible to diseases, such as, trypanosomiases.

The results are shrinkages, weight and death losses; and the meat that Is obtained Is masculature.
Increased protein Intake In southern Nigeria can be encouraged if transportation and physical distribution managements are planned and developed In the country. Initially, the government should subsidize and supervise transportation of cattle from the north and distribution In the south* Later on the government should hand over the enterprise It started to the private sector so that profit motives may lead to efficient development and expansion. Overstocking of livestock by the Fulanl should be discouraged by taxing hoarded herds. Food science education should be encouraged In all public places. Refrigerated meat should be Included In all school and restaurant menu.

ACKNOWLEDGEMENTS
I would like to express my thanks and appreciation to the members of my dissertation committee; Dr. James R. Bohland, Dr.
Robert Q. Hanham, Dr. Alexander J. Kondonassis, and Dr. Thomas.
J. Wilbanks for their suggestions and constructive criticism during
the course of writing the dissertation. A deserving thanks is due
Dr. Gary L. Thompson, my committee chairman and dissertation director, for his guidance and encouragement throughout the writing
of the dissertation.
I wish to extend my thanks and appreciation to Dr. William
Watson for reading a draft of the dissertation and offering useful comments. I am very much indebted to Messrs. Emmanuel U. Ekpoudom,
Ise U. Ekpoudom, Udom U. Ekpoudom, Etim Umana Etuk, Marcus Opara,
Solomon C. Udoh, Anthony J. Urom, and Rev. Fr. Bernard C. Nwoedu
for their help in collecting the data used for the dissertation.
I am also grateful to the different Federal and State Ministries
in Nigeria, especially the Nigerian Livestock and Meat Authority, for sending me their public documents.
A special thanks is due Mrs. Diana DePorter-Onyenwoke for her cartographic work and for typing the final draft of the manuscript. A special and affectionate thanks to my wife, Veronica,
for her sacrifice and encouragement during difficult times. To my children, at home and abroad - this work is dedicated.
iii

TABLE OF CONTENTSPage
ACKNOWLEDGEMENTS....................................... iii
LIST OF TABLES......................................... ixLIST OF ILLUSTRATIONS ............. xi
Chapter
I. INTRODUCTION.............. ................. 1
Movement and Food Deficits........... 1
Effects of Food Deficit ............ . . . . . 2
Suggested Action ............................ 5
The Problem of Food Deficits and Distribution in Nigeria ...................................... 9Transportation in Developing Economies ......... 13
Bases of the Problem............................ 17Assumptions of the Study........... 20Objectives...................................... 23
Modern Distribution Management ................ 25
Importance of the S t u d y ........................ 30
Su mm a r y ........................................ 33
II. PROTEIN PRODUCTION AND CONSUMPTION — NIGERIAAS A CASE S T U D Y ................................ 35
Protein Malnutrition in Nigeria.................. 35
iv

TABLE OF CONTENTS (Continued)Chapter Page
Beef Consumption in Southern Nigeria . 43
The Southern Taboos .............. 54
Urbanization and Demonstration Effect ............ 57
Beef Cattle Production in Nigeria ................. 60
Seasonal Movement of Cattle ...................... 62
Factors Affecting Regional Specialization . . . . . 65
Resource and Physical Bases ...................... 66
Fulani Entrepreneurial and Labor Skills .......... 68
Capital, Inertia, and Economic R e n t ............. 71The Dualistic Nature of the Nigerian Economy . . . 73
Economic D u a l i s m ....................... 75
Effects of a Dualistic Society .................. 76
III. INTERREGIONAL MOVEMENT..................... 80
Removing Deficit by Improvements in the Interregional Transportation System .................. 81Evaluation of the Present Transportation Modes . • 91
Transportation M o d e s ........... 93
On-The-Hoof..................................... 93Truck Transportation........................... 98
Rail Transport.................................102
Present Regional Interaction Patterns ............ 105Linear Programming .............................. 113
V

TABLE OF CONTENTS (Continued)Chapter Page
Demand . . . . . . . . . . . . . . . . 115
Dependent Variables......... 116
Price............................................. 117
I n c o m e ........................................... 117
Population................................... 117
Distance......................................... 117
Optimal Flows......................... 120The Dual of the Transportation Problem . . . . . . 124
Flows and Inventory Replenishment................. 126
Ways to Improve the Effectivenss of the System • . 130Credit Arrangements............................... 130
Cooperatives............................. 132
IV. INTRAREGIONAL MOVEMENT....................... lÿj-
Removing Deficits by Improvements in the Intra- regional Distribution Systems . ................. I3 6
Gravity Model..................................... 143Incentives to Rural Trade and Marketing........... 149
Slaughtering Cattle near Final Consumption Areas . 151-
Refrigerated Meat Transport....................... 153
New Food Products............. I5 6
Freeze-dried M e a t ............. I5 7
Canning........................................... I5 7
Sausages......................................... I5 8
Vi

TABLE OF CONTENTS (Continued)Chapter Page
Fortification..................................± Q
Meat A n a l o g s ....................................160Alternative Meat S ou r c e s................ 161
Fishing..........................................161Mutton, Pork, and Goat M e a t ....................
V. GOVERNMENT POLICY, PRODUCTION, AND DEMAND . . 165
Subsidies............................... 1 6 7
Taxation.................. ...................1 6 7
Putting More Cattle Into the System............... 172^Food Science Education ........................ 1^6
CONCLUSIONS AND SUGGESTIONS FOR NIGERIA........... 1 7 9
Insights for Interaction Theory in Geography . . 181
Perishability Factor .......................... 188Implications for Removing Food Deficit in Less- Developed Countries.............................. I90
BIBLIOGRAPHY.................................... 192).
2iPPENDIXES
A. FREIGHT COSTS OF SHIPPING CATTLE BY HOOF PERM I L E ........................................ 2 1 2
... B. FREIGHT COSTS OF SHIPPING CATTLE BY TRUCK PERM I L E ........................................ 21?
C. FREIGHT COSTS OF SHIPPING CATTLE BY RAIL PERMILE ...................................... 2 2 3
vii

TABLE OF CONTENTS (Continued)Chapter Page
D. OPTIMOM MOVEMENT OF CATTLE BY HOOF............. 228
E. OPTIMOM MOVEMENT OF CATTLE BY TRUCK........... 2 3b
F. OPTIMAL CATTLE FLOW BY TRAIN . . . . . . . . . 3 3 9
G. RELATIONSHIP BETWEEN TRADE AND FLOWS.244
viii

LIST OF TABLESTable Page
1. Computed Mean Daily Protein and Amino Acid Intakeof Adults at Bero-Okuta in Southern Nigeria . . . 37
2. Computed Mean Daily Protein and Amino Acid Intakeof Adults at Jarawaji in Northern Nigeria . . . . 41
3. Percentages of Income Spent on Different FoodI t e m s ........................................... 49
4. Local Production of Trade Cattle 1966-1971 . . . . 85
•5. Composition of Nigerian Meat Supply 1963/64 &1979/80 86
6 . Regional Annual Growth Rates of Population, CattleProduction, and Beef Consumption, 1973 & 1974 . . 89
7 7. Cattle Shipment by Hoof, 1973 & 1974 ............ 95
8 - Actual Cattle Shipment by Hoof, 1974 ............ 96
9. Cattle Transport by Truck, 1973 and 1974 . . . . . 99
10. Actual Cattle Shipment by Truck, 1974 10011. Cattle Shipment by Rail, 1973 and 1974 ...........103
12. Actual Cattle Shipment by Train, 1974 10413. Multiple Correlation Summary.................... 118
14. Estimated Annual Beef Cattle Demands for SouthernNigeria . .................................... 119
15. Periodic Cattle Allocation to Villages in CalabarDivision......... I4 5
Ix

LIST OF TABLES (Continued)
Table Page
16. Quarterly Trade Cattle Production in NorthernNigeria, 1974 . . ...............................168

LIST OF ILLUSTRATIONS Figure Page
1. Heights and Weights of Boys in Some Far EastCountries Compared with Reference Growth Standards ................... 4
2. Structure of Distribution Channels ............... 293- Weight/Height Changes in Nigerian Children . . . . 45
4. Cattle Slaughtered Per Capita in Selected Towns,1973 (By Month)................................... 47
5. Average Monthly Beef Consumption, 1973 .......... 51
6 . Per Capita Beef Consumption in Nigeria, 1973 . . . 52
7. Infestation Patterns of Tsetse Borne CattleDiseases in Nigeria, 1976 61
8 . Actual Cattle Movement by Hoof, 1974 .......... 97
9. Actual Cattle Movement by Truck, 1974 101
10. Actual Cattle Movement by Train, 1974 106
11. Highway and Railroad Networks ...................10812. Cattlemen, Movement and their Modes, 1973 . . . .110
13. Optimal Cattle Movement by H o o f .................121
14. Optimal Cattle Movement by T r u c k s ...............12215. Optimal Cattle Movement by Train.................12416. Production-Distribution System Response to a
Sudden Ten Per Cent Increase in Retail Sales . • .128
xi

LIST OF ILLUSTRATIONS. (Continued)Figure Page
17. Marketing Beef to Southern Nigeria Consumers . . « 1 3 8
18. Intraregional Demand Allocation C h a r t ........... 142
19. Intraregional Beef Cattle Flow ................. m-620. Means of Transportation and Trade A r e a........... 148
21. Subsidization by Taxation ..................... *173
xii

MOVEMENT AND THE REMOVAL OF NUTRITIONAL DEFICIENCIES:
THE CASE OF BEEF IN NIGERIA
CHAPTER I
INTRODUCTION
Movement and Food DeficitsSince the end of the Second World War the problem of
food deficit and consequent malnutrition in the less-developed countries has commanded the attention of many social and nutri
tional scientists. Their focus, however, has largely been on
increased production through mechanization, hybridization, irri
gation^ fertilization.and other scientific means without consideration of the movement and distribution of the already known
and available food products from areas of production surplus to
deficit areas. In 1946, the Food and Agricultural Organization
(F.A.O.) in its Preparatory Commission Report on World Food Proposals stated that:
. . . if nutritional standards are to be raised in accordance with the Copenhagen objectives, the development and modernization of agriculture in the malnourished countries is essential. We recommend to such countries the early formulation of development programs, the establishment of any needed administrative machinery, and the seeking out of advantageous contacts in other countries; We recommend to the Food and Agricultural Organization of the United Nations the initiation of certain agricultural surveys, of clearinghouse activities for international interchange of personnel, scientific material and infor-

matlon, and of work on extension programs (advisory services), and a rural welfare (F.A.O., 1947, p. v).
One author, recognizing the crisis proportions reached
by protein malnutrition in these countries, calls for increased
food supplies and emphasizes that: "All means for increasingprotein supply require better application of existing technologies
or development of new ones" (Altschul, 1974, p. 23).
Effects of Food DeficitProtein deprivation concomitant with food deficit results
in lowered energy output, fatigue and inability to perform hard
work. The afflicted individual is apathetic, depressed, and
lethargic.
Food deficit and its consequential protein-caloric mal
nutrition in children causes marasmas, a disease caused by cal
oric deficiency, or lack of food; and kwashiorkor, a disease
that is caused by lack of protein in meals (Dema, 1965, p. 18).The visible signs of protein deficiency are stunted growth, pro
truding belly, pale color of the skin (the skin may begin to flake and eventually open sores may develop), abnormal reddering of the hair (the hair becomes pale and may fall out), swollen
legs and feet, and, or accumulation of excessive fluid depending
upon the severity of the deficiency (Brock and Autret, 1952, p.15). The extremely high morbidity and mortality rates in the one to four year—age group in the less-developed countries suggest
that moderate protein malnutrition affects, at least, fifty per cent of these children (President’s Science Advisory Committee,

31967, p. 17). In studies conducted in South Africa and Chile it was found out that children who were severely deficient in
protein displayed significantly smaller head sizes and that
there was a significant correlation between cranial size and (IQ) intelligent quotient (Read, 1969, pp. 12-14; Monckberg,
1973, p. 114).
The relationship of food deficit and its inevitable malnutrition to physical growth and development is illustrated in Figure 1. The growth of boys in five Far Eastern countries
(Bangladesh, Burma, Malaysia, Thailand, and Vietnam) is compared
with the growth of the lowest quartile of boys in Iowa as a re
ference growth standard. At the age of five, it can be seen
that the heights and weights of the Far Eastern boys are below
those of the Iowa boys of the same age. Deficiency in food which
brings with it protein deprivation (though there may be other causes) is the main reason for the difference.
Oomen (Rajalakshmi, 1973, p. 20) has added a new dimension to the problem of protein malnutrition. He reported the presence of nitrogenfixing bacteria in human intestine under con
ditions of marginal protein supplies and their disappearance with adequate protein Intake.

HEIGHTS AMD ’EIGHTS OF BOYS IN SOME FAR EAST COUNTRIES COMPARED WITH REFERENCE
GROWTH STANDARDS
454 0
35 WEIGHT
O 25:oa.20
lO
40
35»U l
g3 0
25
20
Malaysia Burma Thailand.
_Q__ Bangladesh Vietnam Reference
Growth Standard,*I _L_
Source: World Food Problem, Vol.II, 1 9 6 7 , P.1 5 .
3 4AGE (years)
Figure 1

Suggested Action
While the situation is very precarious in many less-
developed countries, Paarlberg finds a combination of factors which can be overcome with help from the advanced countries.He says that from the next decade or so the probability is good
that total (world) food production will keep a half step ahead of population growth, but that there will be times and places of
critical shortage (Paarlberg, 1974, p. 1). The United Nations
World Food Conference in trying to find a solution to the food
deficit problem in the less-developed countries concluded that :
It [the World Food Conference] should combine a sense of immediate urgency with a long-run optimism that the developing countries, with assistance from developed countries, can achieve the necessary increases in food output while meeting more adequately the goals of rural development and social justice (United Nations, 1974, p. 5).
In India the common diets provide only eight to ten per cent of the required daily protein intake (Rajalakshmi, 1973, p.20). A study at Maku (Southern Nigeria) showed that the people
had a protein deficiency of about 12g/head/day (Dema, 1965, p.
87). In the Philippines the animal protein intake is approximately thirty per cent of the required minimum amount (Woolley,Jr., et al., 1972, p. 67).
Secretary General of the United Nations, U. Thant, in
his 1971 annual address viewed the protein malnutrition problem
as one of the great tragedies that besets less-developed countries. He suggested that:
In the world today, there is a considerable body of
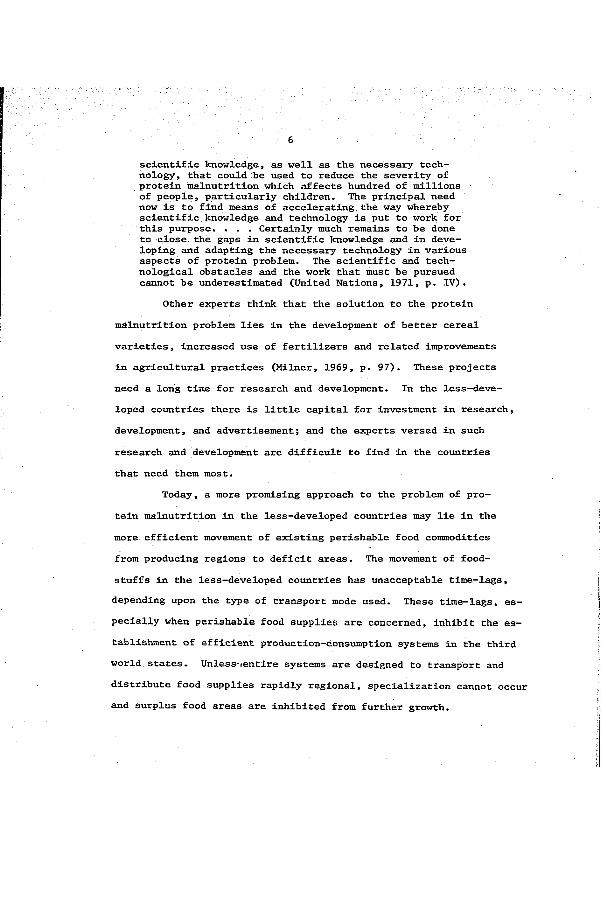
scientific knowledge, as well as the necessary technology, that could be used to reduce the severity of protein malnutrition which affects hundred of millions of people, particularly children. The principal need now is to find means of accelerating the way whereby scientific knowledge and technology is put to work for this purpose. . . . Certainly much remains to be done to close the gaps in scientific knowledge and in developing and adapting the necessary technology in various aspects of protein problem. The scientific and technological obstacles and the work that must be pursued cannot be underestimated (United Nations, 1971, p. IV).
Other experts think that the solution to the protein
malnutrition problem lies in the development of better cereal
varieties, increased use of fertilizers and related improvements in agricultural practices (Milner, 1969, p. 97). These projects need a long time for research and development. In the less-developed countries there is little capital for investment in research, development, and advertisement; and the experts versed in such
research and development are difficult to find in the countries
that need them most.Today, a more promising approach to the problem of pro
tein malnutrition in the less-developed countries may lie in the
more efficient movement of existing perishable food commodities
from producing regions to deficit areas. The movement of food
stuffs in the less-developed countries has unacceptable time-lags, depending upon the type of transport mode used. These time-lags, es
pecially when perishable food supplies are concerned, inhibit the establishment of efficient production—consumption systems in the third world states. Unless-»entire systems are designed to transport and
distribute food supplies rapidly regional, specialization cannot occur and surplus food areas are inhibited from further growth.

7There has been a notable lack of research in the deve
lopment of modern distribution systems in the less-developed
countries. Movement is obviously fundamental to the removal of food deficits in many such countries. Food deficit represents
a spatial imbalance in the afflicted economies. This spatial im
balance is empirically well illustrated by the statement that :
The African situation is a dramatic illustration of wide variation among subregions and nations. The Savannah regions of West Africa have protein consumption levels of close to 70 grams per person per day. In comparison, in the Southeast Zone of West Africa, the protein intake approximates 43 grams, a level just slightly higher than the levels in the Congo and the Dominican Republic, the two countries included in the F.A.O. Indicative World Plan for Agricultural Development (IWP) study with the lowest per capital protein consumption (Schertz, 1971, p. 6 ).
Movement is the only means of correcting this kind of spatial im
balance. With increased accessibility offered by efficient trans
portation systems, movement can be speeded up and large areas of
their perishable products can be tapped. The perishable product,
in turn, can be marketed over great distances.
Without improved transportation, areas of high population
are limited to the goods they can produce, and unproductive areas
are left with a deficiency in their needs. Most areas in the less- developed countries suffer from food deficiency problem and its accompanying protein malnutrition because of poor and underdeve
loped means of transportation. In order to supply food deficit areas in the less-developed countries with the deficient food
stuffs the development of an overall distribution system for the transportation of the needed foods from the production regions,

8and the distribution of the products to the vulnerable groups
should be given priority over other development projects.
There are many examples in the less-developed countries
where lack of efficient transportation-distribution system has
frustrated well-intentioned efforts to supply the people with
badly needed foodstuffs. In many parts of the less-developed
countries intensification of agricultural production has oftenbeen thwarted by poor quality and high cost of rural mobility.The situation has been summarily stated that:
In Thailand, partially used jungle land was transformed into highly productive, prosperous farms a- long the hundred-mile course of the Friendship Highway. Travel time was reduced from eleven hours on the road to three on the new. . . . In Bolivia, the highway from Cochabamba to Santa Cruz reduced travel time in the rainy season from several weeks to fifteen hours and provided a link between the country’s food supplies and its consumers. Until then the price of Bolivian rice was 50 percent higher than imported rice simply because the cost of domestic transport was high. . . . In Costa Rica, before the Inter-American Highway was constructed, driving beef from grazing lands to San Jose customarily resulted in a 40 percent loss of weight, and imports were necessary to satisfy domestic market demand for beef. With an all-weather highway, it became possible to deliver cattle by truck- trailer units overnight and Costa Rica has become self- sufficient in meat (President’s Science Advisory Committee, 1967, p. 573).
In Nigeria the demands for general traffic in the early 1950’s have resulted in a backlog of peanut (groundnut) tonnage each
year and a quota system restricting the tonnage of peanut in transit from the Niger Republic. The difficulty was due to inability of the transportation system to move the goods (IBRD.,
1955, p. 467; Niven, 1971, p. 60).
9The Problem of Food Deficits and
Distribution In Nigeria
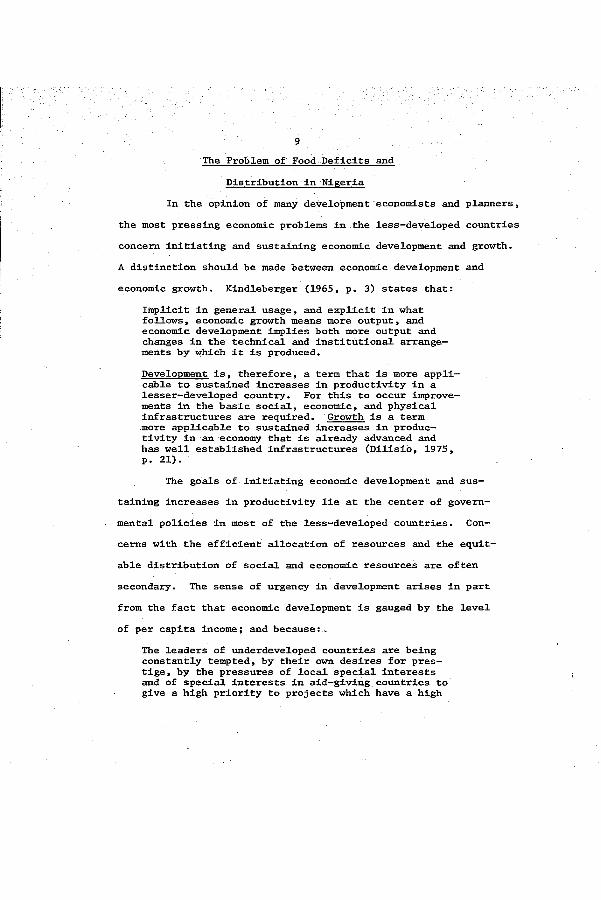
In the opinion of many development economists and planners,the most pressing economic problems In the less-developed countriesconcern Initiating and sustaining economic development and growth.
A distinction should be made between economic development andeconomic growth. Klndleberger (1965, p. 3) states that:
Implicit In general usage, and explicit in what follows, economic growth means more output, and economic development Implies both more output and changes In the technical and Institutional arrangements by which It Is produced.
Development Is, therefore, a term that Is more applicable to sustained Increases In productivity In a lesser—developed country. For this to occur Improvements In the basic social, economic, and physical infrastructures are required. Growth is a term more applicable to sustained increases in productivity in an economy that is already advanced and has well established Infrastructures (Dlllsio, 1975,p. 2 1).
The goals of Initiating economic development and sustaining Increases In productivity lie at the center of governmental policies in most of the less-developed countries. Concerns with the efficient allocation of resources and the equitable distribution of social and economic resources are often
secondary. The sense of urgency In development arises in part
from the fact that economic development Is gauged by the level
of per capita Income; and because:_
The leaders of underdeveloped countries are being constantly tempted, by their own desires for prestige, by the pressures of local special Interests and of special Interests In ald-glving countries to give a high priority to projects which have a high

10prestige value but a low real economic yield (Reid,1965, p. 26).
This same view is expressed by another author, Alpert thusly:The drive [for economic development] was motivated, first of all, by the desire to break free from traditional subsistence way of life that suddenly become intolerable. But apart from this longing for the good things of life, which only the populations of the industrialized countries could afford to enjoy, a powerful incentive in the drive for development was the desire to achieve equality of status with the rich and powerful nations of the industrialized world.This desire was especially deeply felt by the youth, the most dynamic element of the nations awakening from their protracted lethargy (Alpert, 1963, p. 4).
To Goulet one of the general goals of development in the less-
developed countries is self-esteem. This conviction is echoed
in the statement that:
Just as nineteenth-century Japan embarked on the path of industrialization to avoid humiliation by technologically and militarily superior 'barbarian" powers, so nowadays the Third World seeks development in order to gain the esteem which is denied to societies living in a state of disgraceful "underdevelopment." Therefore, the conviction is gaining strength throughout the world that mass proverty cuts societies off from due recognition or esteem. Once deprivation reaches an intolerable point, people are quite ready to begin desiring material "development" (Goulet, 1971, p. 90),
These views are not held by all Western social scientists.
Kindleberger himself (1965, p. 3) points this out when he says :
"By analogy with human being, to stress growth involves focussing on height or weight, while to emphasize development draws atten
tion to the change in functional capacity - in physical coordina
tion, for example, or learning capacity." Souza and Porter hold a related view of development. They argue persuasively that:
11. . . genuine development will come through animal husbandry, hand plows, and donkey carts, not by tangible monumets to progress such as huge hydro-electric projects, glittering airports, impressive buildings of state, and air-conditioned offices. . . . Indigenous agricultural systems can contribute to relief of poverty and provide the basis for authentic development in the underdeveloped world, but only if governments are prepared never to turn their backs on the interest of small farmers (Souza and Porter, 1974, p. 6).
A sense of urgency should properly arise .from a concern
directed towards raising the living standards of the people.
Higgins calls this "the human ascent." He urges that:
Deficiencies in standards of food, clothing, and shelther must be eliminated: for this, both agricultural improvement and industrialization are necessary, as well as general education, better technical training, increase savings and investment. And all this will require planning (Higgins,1968, p. 369).
Any attempt to raise the living standards of the people in the
less-developed countries should have the social and economic well-being of the people as a priority all over other objectives.
This will then result in increased productive capacity of the
people and the national economy. In stressing the need for nutri
tion and health in less-developed countries, Alan Berg (1973, p.
17) says that investment in human capital is probably the major
explanation for increases in the national output of the Western
countries.
The problem of food deficit in the less-developed coun
tries has existed for a long period of time. But in recent years it has been noted that the population of the less-developed coun
tries has been subject to overall food shortages and, or to

- 12 ,
Specific nutritional deficiencies (especially proteins). This
is due to the population increases which accelerated in the 1960*s.Commenting on this one geographer says :
On the basis of the 1960 growth rate, the earth’s population will reach 135.8 billion by the year 2220, or about one person per square meter of land surface - certainly a catastrophic situation for humanity. The present growth rate of about 20 per 1 0 0 0 , an all-time high, portends a doubling of the earth’s population within about 35 years, or an eightful increase in a century (Trewartha, 1969, p. 31).
Host of the recent increases in population take place in the less-developed countries, where incomes are lowest and
malnutrition very frequent. In the industrialized western nations
population grows at an annual rate of 1 . 0 per cent, while growth
in the less-developed countries is about 3.0 per cent, and by about the year 2 ,0 0 0 the less-developed countries will be gaining
population at the rate of 98 million in a year, seven eights of
the projected annual increase in the world as a whole (U.N., 1975a, p. 3). Unfortunately, food production is not keeping pace with
the rising population.
During the last decade, there has been increasing awareness of the extent and implications of the protein-caloric deprivation among the vulnerable groups. The Food and Agricultural
Organization of the United Nations estimates that 20 percent of the population in the less-developed countries are undernourished
(have too little to eat) and 60 percent are malnourished (eat
the wrong types of food) (U.N., 1975a, p. 56). The United Nations
Committee on the Application of Science and Technology to Deve

13lopment summarily stated that:
While the quantity of food (calories) is already causing considerable concern in many areas throughout the developing world, the quality (notably protein) of the food consumption pattern is even more critical. For over one third of the present population in the developing countries the protein-cal- orie balance of the diet is inadequate (United Nations, 1968, p. 4)-
The increase of protein (perishable) food intake in
the less-developed countries can be viewed as an explicit expression of the case of transportation development. A study by
the Food and Agricultural Organization of the United Nations
(F.A.)., 1966, p. 215) emphasized this when it said: "The low
average intakes are more probably the consequences of the lack
of availability or because the animal-protein foods are too high
ly priced for certain groups." The present method of transport
ing perishable protein foods in the less-developed countries is very inefficient and inadequate.
Transportation in Developing EconomiesThere is, however, no consensus on the role of trans
portation investment in developing economies. In any case, transportation should not be conceptualized as an end in itself; rather
it should be a means to facilitate achieving other objectives.In pursuance of this point three possible causal relationships
have been noted:
(1 ) a positive effect on development process —the expansion in directly productive activities being a direct result of providing improved transportation facilities;

14(2 ) a permissive effect on development process,
because transportation does not independently produce directly productive activities or subsequent increases in the level of economic growth;
(3) a negative effect occurring when an overinvestment in transportation reduces potential growthin directly productive activity and, consequently, leads to an absolute decline in the level of income per capita (Gauthier, 1970, p. 613).
The state and national governments in the less-developed countries
must carefully consider the design and development of total dis
tribution systems. A high level of productivity in a modern economy
cannot be achieved without heavy investment in such physical dis
tribution systems, which may be composed of any feasible combina
tion of transportation methods that provides an adequate and continuous flow of goods between producers and consumers (President’s
Science Advisory Committee, 1967, pp. 573-574). Physical distri
bution systems have been defined as:
. . . the operation which creates time, place, andform utility through the movement of goods and personsfrom one location to another. The system encompasses all movement from the shipment of raw material to the final resting point of the finished product. Thus defined, it includes the physical facilities for intercity movement, physical arrangements for storage, and the terminal properties necessary to equalize demand and supply with respect to the size of the shipment (Mossman and Morton, 1965, p. 3).
Some people feel that transportation network planning
must precede economic development - some say it follows, and
some say that it is concomitant. Hunter (1965, pp. 71—73) says
that transportation development was a precursor to the industrial revolution (especially in the early stages) in Western
Europe. Hurst (1974, pp. 382—383) observes that conventional

15Western attitude tends to view ample transport capacity as play
ing the role of a prerequisite for economic development. Owen
(1964, p. 1) believes that it plays a key role in marketing of agricultural commodities. Lloyd and Dicken (1972, pp. 89-90)
observe that transportation development increases areal special
ization and emphasize that:
Decline in the relative importance of transportation costs implies that other factors increase in significance. In particular, specialization of production on the basis of comparative advantage rather than market accessibility emerges, with a concomitant increase in areal specialization. In agriculture, for example, particularly favorable physical conditions can be exploited, whereas their location relative to the market precluded their optimum use under less favorable transport conditions.
To some extent there can be reliance on the market mech
anism for transportation development; but, since the organiza
tion of transportation is a decision that rests on investment, it must involve public policy. The difficulty envisaged in such
a reliance has been succinctly stated :
Since private initative in this field is sure to prove woefully inadequate, government must bear theprime educational responsibility. It must also carrythe burden of the new infrastructure investment (especially basic transport facilities), since the private sector is generally incapable of doing so except under politically untenable or economically undesirable conditions (Fromm, 1965, p. 3).
In the less-developed countries, the immediate task is to iden
tify all of the urgent needs and then establish the order of prior
ities in which the improvements should be undertaken to achieve
the much needed results. The development of efficient transportation-distribution systems is one aspect of the infrastruc—

16ture in urgent need of attention.
Since the decisions to invest in transportation are not
easily reversed nor as readily corrected as in those sectors with
facilities that wear out easily, or can be built in small in
crements , care should be taken before any investment is under
taken (Gauthier, 1970, p. 614). The decision to invest in a trans
portation enterprise involves a great deal of risk-taking so that the investor must exercise a great deal of study and care before
plunging into this type of business. Too much investment in transportation may lead to a frittering away of resources that
can be used elsewhere, and too little investment in transportation may hinder the rest of the economy.
During the past three decades physical distribution man
agement has emerged in the Western countries as a major concern
of business operations for the delivery of goods, in correct quantities, to consumers at different places, and in good condi
tion at the lowest possible total cost. Perishable protein foods
cannot be delivered to vulnerable consumers in less-developed
countries unless physical distribution management is well planned
and developed. The importance of this has been briefly stated:
Production can build a high-quality product at the lowest possible unit cost. It remains for physical distribution to ensure that the right product is at the right place at the right time (Bowersox, 1974, p. 35).
The importance of physical distribution systems in developing economies is vividly described at the last section of this chapter.

17Bases of the Problem
Millions of people In the less-developed countries never
get enough to eat, and much larger number, although not actually
hungry, do not get the right kind of diet necessary for good
health (F.A.O., 1947, 1968; U.N. World Food Conference, 1974; U.
S. Dept, of Agriculture, 1974). The situation has been Illustratively stated:
Tied In with the shortage of food for these people and others like them Is the shortage of the right type of food, the kind that provides the proper amount of nutrition so necessary to a person's diet.For just as the lack of food can weaken, malm and destroy, so too, can a shortage of protein, vitamins and other nutrients (Glvaudan Flavor1st, 1973, p. 1).
The technological revolution, which has brought about
rapid and self-generating economic growth and development In the
advanced countries, has had one critically Important effect In
the less-developed countries— the reduction In the death rates
In the population. Soon after the Second World War, the Intro
duction of Western medicine for the prevention and cure of mal
aria and the use of vaccines to eradicate epidemic diseases, such
as, smallpox and measles, led to Increases In the longevity and
life expectancy of the people In the less-developed countries.To Illustrate this, one author stresses that:
This startling phenomenon, "the population explosion," as It Is called, arises primarily from medicines' advanced techniques of "death control." Medical discoveries of the past decades have made possible sensational reduction In the death rate. The systematic, large-scale use of antibiotics, sulfa drugs,DDT, and other Insecticides has led to control ofInfectious diseases to an extent and with a speed previously Incessible. In some less developed

18countries death rates have fallen at a tremendous rate — three to five times as fast as they did in 19th Century Europe (Wilcox, 1960, p. 860).
In most of the less-developed countries, the decrease
in the mortality rates has not been accompanied by a decline in the birth rates. Consequently, it has created an unprecedented
occurrences of high rates of population growth. The less-deve
loped countries of the world now contain about two-thirds of the
world’s population (President’s Science Advisory Committee, 1967, p. 5). Food production in these countries seems to be barely
keeping pace or falling behind these burgeoning populations.
Though they may plant more acres or grow more food, there are
more and more people to feed. Rural populations are extremely
vulnerable due to a complex of factors including low incomes and formidable transportation-distribution problems.
The increasing food deficit problem in the less-developed
countries arises from the uneven distribution of food supply
among countries, within countries, and among families with different levels of income. The spatial variations in protein in
take are inevitably reflected in variations in personal incomes
received by the population. Birch (1968, p. 594) in a provocative paper questions why malnutrition is a curse for certain
groups in societies with an abundant and often enriched food supplies. Lack of money and education (information) are his only answers. The position that poverty, low education, and
culture are associated with protein malnutrition and its con
sequent deterioration of physical and social conditions have

been substantiated by Delgado, et al. (1961), Jeans, et al.
(1952), and Mayer (1965). Here, this author adds that ineffic
ient transportation-distribution system causes the greatest dif
ficulties in the delivery of quality perishable foods to both
the urban and rural areas in the less-developed countries.
Of the low per capita incomes in less-developed countries,
half or more may be spent for food. Income—food expenditure relationships reflect a hierarchy of cultural preferences ranging from the most highly desired foods to the least popular. Income—
food expenditure relationships are often measured by income elas
ticities which express the ratio of the percentage increases in
consumption of a given food to a percentage change in income.In the third world, income elasticities are lowest for roots and
tubers. They are a little higher for coarse grains and progress
ively higher for other cereals, pulses, fruits, vegetables, and
animal products. The diets of many people in Southern Nigeria
are biased towards starchy foods with little or no intake of animal proteins.
Basing judgment on the work of Mottram and Graham (1941, p. 76), who have concluded that no food should be counted as a
protein food unless it contains at least ten per cent protein, the protein deficiency in the less-developed countries is not
only acute but chronic. Their criterion excludes all of the leaf, root, seed vegetables, and fruits that make up the bulk
of the daily diets of the people in these countries. Support
for the above statements can be assessed through a nutritional

20value analysis of the different sources of protein:
The life—sustaining characteristics of the various sources of protein may provide a partial explanation.Animal proteins have a high biological value in the sense that by themselves they can sustain life and promote normal growth in the human being. Proteins from other sources have a low biological value; by themselves they cannot sustain life, let alone promote growth (Belli, 1971, p. 19).
Assumptions of the Study
In order to supply the food deficit areas in the less-
developed countries with the badly needed protein-rich foods,
an interregional trade in perishable food supplies has developed between the production regions and the deficit areas. The re
liance on this trade to supply the protein-rich perishable food
stuffs depends on how fast the perishable products can be shipped
fresh to the deficit areas. The development of this trade is
well illustrated by the Heckscher-Ohlin Theorem. The Swedish
economist, Elis Heckscher, and his student Bertil Ohlin, hypo
thesized the factor endowment proportion and trade predominance, which was developed as an alternative to the then prevailing
classical comparative—cost theory. The theorem quoted succinctly reads :
International (in this case interregional) trade results from (a) different production factor endowments from north to south, and (b) the different factor intensities of production processes for - different goods. Exports from any one particular region comprise those goods in whose production a predominant quantity of relatively abundant factor is employed, and its imports include such commodities that predominant amounts of factors scarce in that area are used (Ohlin, 1933, p. 29).

21In Nigeria there is regional specialization in both ex
port and domestic agricultural production due to natural factor endowments» and cultural differences. For example, in the West the Yorubas raise cocoa, the Edos in the Midwest produce rubber, and the Annangs in the Southeast concentrate on palm oil produc
tion. In the Northern Region the Hausas, the Kanuris, and the
Nupe cultivate cotton and peanuts (groundnuts), while the Tiv
of Middlebelt produce sesame. The Cow Fulanis, who occupy the Sahel region, produce the only source of beef in the country.
Most regions, because of either poor soil, harsh climate, or
disease infestation, cannot produce badly needed protein food
stuffs. This is typified in the case of beef cattle that hardly
survive in the Southern Provinces because of the prevalence of
tsetse fly that causes trypanosomiasis in the animals. A new
dimension was added with the discovery of endemic infection of
the southern soil with claustridia group of anaerobic organisms that Infest and kill livestock at Obudu Ranch,^
Needleman has written of the inability of a region in a nation to supply most of its own needs. He postulated that trade between regions is due to insufficiency of certain commod
ities :
Regions are less self-sufficient than nations, so that trade is even more important for regions than
^The information here was obtained by letter communicated dated 3rd March, 1975 from the Assistant Manager of Obudu Cattle Ranch, Obudu, Ogoja, Nigeria.

22nations. But though the Importance of Interregional trade was recognized early and Indeed was emphasized In the title of a seminal work on trade theory,Bertlle Ohlin's Interregional and International trade,1933, most of the theoretical work and almost all of the empirical studies on trade have explicitly concentrated on trade between nations rather than between regions. Part of the explanation Is that the policy problems associated with Interregional trade were much less obvious and apparently less urgent than those arising from International trade (Needleman, 1968, p..235).
It Is further hypothesized that the duallstlc nature of
the economies of many less-developed countries Is real, exist
ing In the form of a subsistence-export economy. This dualism
also reveals a spatial aspect called "Regional Inequality" by
Myrdal (1957, pp. 23-28). The nature and degree of geographical-
economic dualism depends not only on the stage of the local econ
omic development, but also upon the spatial processes of the diffusion of ln^ortant Innovations, such as. Western education, religion, technology, and communication-transport facilities.
In the less-developed countries cultural characteristics depend on a variety of factors: (1) urban or rural setting; (2) the
Impact of formal education;(3) social organization and religion;
(4) resource base and the stage of technological development; and (5) remoteness and resistance to cultural change. Hence,
less-developed countries of the world are characterized by
varied cultural patterns; some regions have traditional ways of
life while others adapt more readily to new technologies and
new forms of social organization.

23Objectives
The increase in the demand In Nigeria for high protein
foods due to increasing population, urbanization, rising incomes,
and heightened nutritional awareness caused by what Nurkse (1970,
pp. 63-67) calls "demonstration effect, has not stimulated in
creases in the efficiency of transportation and distribution of
perishable protein foods from production to demand regions.^
Meat is therefore scarce and highly priced in such deficit areas
as southern Nigeria. The question of concern here is: How can
the inadequate supply of perishable (protein) foods, such as,
beef, be increased in southern Nigeria so that protein malnutri
tion may be eliminated among the vulnerable consumers" Increased
protein food supply is only possible through increased efficiency in transportation and physical distribution management. Efficient
transportation and physical distribution management will result in increased capacity, and this will help to reduce costs of
supply. Lowering cost of supply will lead to increased consun^-
tion of the badly needed protein foods.
^Demonstration effect here can be seen as the dependence of every individual’s consumption behavior on that of every other individual. The situation is well illustrated when it is argued that: In given circumstances, the individuals in question comeinto contact with goods superior to the ones they use with a certain frequency. Each such contact is a demonstration of the superiority of these goods and is a threat to the existence of the current consumption pattern. It is a threat because it makes active the latent preference for the goods (Duesenberry, 1949, p. 26),
^Railroad extension has been atten^ted in the country and the use of trucks for hauling is on the increase but protein deficiency still persists. The difficulty here is that of inefficient physical distribution management.

24There is no evidence of a world-wide shortage of quality
(protein) foods in Nigeria. There is a large production of live
stock and livestock products, especially meat; and Nigeria can
be self-sufficient in meat production (U.S. Dept, of Agriculture,
1972, p. 45). The problem of food deficit and its accompanying
severe protein deprivation can be seen as an expression of lack
of efficient transportation and physical distribution management in the country (Anthonio, 1966, p. 81).
In the past perishable (protein) foods were available
during traditional festivities (Ferguson, 1967, p. 7; Ilori,1972, p. 57). For example, in Benin, many cows were trekked
into villages during the time of the ceremony marking the burial of a chief or a wealthy citizen (Ryder, 1969, pp. 313-314).
Cows were also slaughtered during the celebration that accompanied
the fattening of a girl for betrothal. This practice was very
common among Xbibios in Southeastern Nigeria and until the late 1960's the people of Ika were still pratising virgin girl fatten
ing ceremonies before marriage. Today, these traditional fes
tivities are no longer held and local consumers with poor pur
chasing power have less perishable protein foods available to
them. This situation will continue for long unless adequate physical distribution systems are planned and adopted. The
delivery of perishable protein foods to southern Nigeria! consumers (i.e., at least, or lesser cost solution) is very im=-. portant and urgent.
It is, therefore, the purpose of this research to:

25(1) evaluate the present cost characteristics of the different
modes of transporting and distributing perishable protein foods
from the production region to the deficit areas in Nigeria, (2)
develop a possible solution to provide a more economical means
of transporting perishable protein foods to the most vulnerable
consumers (i.e., allocate protein food shipments from origin
(in the north) to the deficit areas (in the south) so that trans
portation costs and delivery times may be minimized."
Investment in alternate means of preservation, such as, freezing, freeze-drying, smoking, and canning are ruled out when
Nurkse (1970,.p. 7) stresses that: "The inducement to invest is
limited because of the size of the market." Freezing, freeze- drying, smoking, and canning would produce new meat that would
require an additional educational process in order to orient the
consumers to the new foods. Moreover, there would be value added
to the processed products, and the added transportation costs
would further limit the ability of the low-income consumers to
buy the products. For the poor and least able to afford costly
protein—rich foods the best solution lies in the movement of the
already available beef cattle from northern to southern Nigeria.
For this to be successful well planned physical distribution systems are added.
Modem Distribution Management
In recent years there has developed a considerable interest in new business management techniques that address the hither

26to neglected area of physical distribution. In the past, when
other areas of business operations (production, purchasing, ware
housing) have been subjected to the most careful scrutiny and'
appraisal, physical distribution has been either neglected; view
ed as a cost center, or an inevitable source of profit erosion
(Christopher, 1971, p. 1), Today, physical distribution systems constitute a major functional factor in the economies of industrialized nations.
Integrated physical distributions systems have allowed the modernization of western economies as opposed to the tradi
tional systems in less-developed countries. Physical distribution systems are largely the result of planning within the frame
work of western corporate management systems. Central economic
planning requires similar systems planning to move goods from
surplus regions to points of consumption. In Third World "prob
lems of physical distribution are often brushed aside as matters
of little importance" (Bowersox, 1974, p. 2), One major defic
iency of traditional physical distribution has also been blamed
on its lack of integrated treatment (Bowersox, et al., 1968, p. 102). In Nigeria physical distribution systems are so fragmented that both planning and development of the total system are prohibited.
A properly designed physical distribution system can
help in the generation of sales by; (a) minimizing out-of-stock occurrences, (b) reducing customer, inventory requirements, (c) solidifying supplier-customer relationships, (d) increasing de-

27livery discount to customers, (e) enabling expanded market cover
age, and (f) allowing greater concentration on demand creation
(Bowersox, et al., 1969, p. 62). In order that all these can be
fulfilled the logistical system should be designed to minimize
transportation cost in relation to the total system cost (Bowersox,
1974, p. 20). That physical distribution systems play a major role in business management as well as contribute to a very high level of consumption in the Western countries has been stated:
In a practical sense, physical distribution is concerned with directing the desired assortment of products to the right place, in marketable conditions, in a manner timely to sales or processing requirements. Physical distribution then engages the management of product flow. In the livestock and meat industry such physical distribution flow originates with the initial transport of livestock and ends when a particular cut or assortment of meat is sold for consumption (Bowersox, et al., 1969, p. 69).
Physical distribution is founded on the basically simple
discovery that the costs of storage and of movement are closely
interrelated; and that it is only by dealing with them together
as a single unified activity can the potential of each of them contribute to the overall objectives of movement and distribution (Wentworth, 1970, p. 35).
In the past, once a manufacturer sold a product to a wholesaler, the wholesaler pushed the product forward to the retailer, who in turn pushed the product to the market (ultimate
consumer). This "push*' philosophy has changed to a marked degree as a result of the various manufacturers being attuned to
customers needs and wants. In the Western countries, today, major producers have adopted a "pull" philosophy, which, primarily

28involves manufacturers preselling the product to the ultimate
consumer who in turn searches retail outlets for the product
(Davis and Brown, 1974, p. 229). This is impossible in less- developed countries because of poor communication media.
Moving and sorting goods on their way from production points through various subassemblies and assemblies to their
ultimate consumers cost a lot of money. Presently, the cost of
moving and sorting goods is the third highest in all business operations ; it is surpassed only by costs of materials and labor. The high cost has cut into profit margins, and a new attack is
launched on physical distribution for purposes of achieving some savings.
Since physical distribution is fundamentally concerned
with the spatial aspects of business operations, it is under
standable that the primary emphasis is placed upon geographical
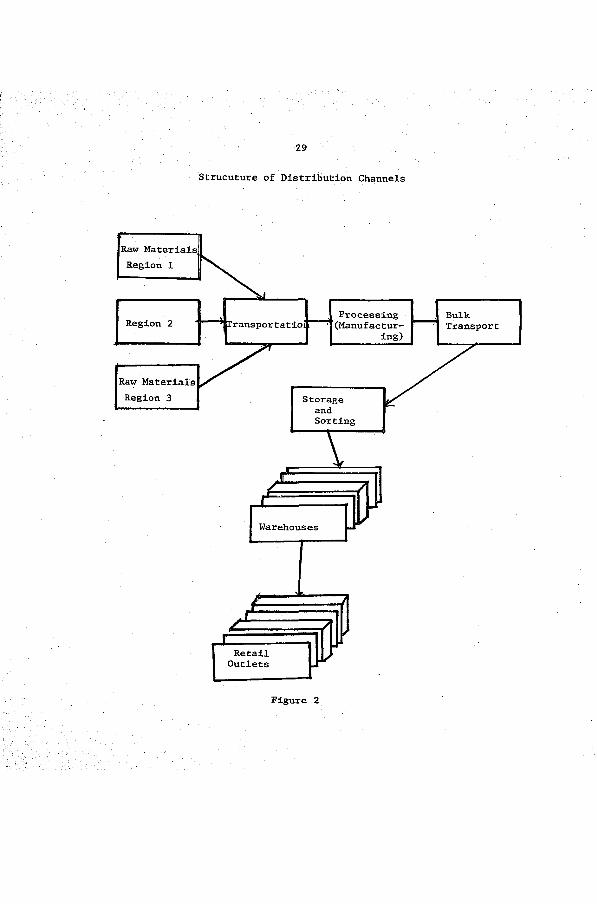
arrangements of exchange facilitites (Bowersox, et al., 1968, p. 56). Figure 2 (Structure of distribution channels) shows the
channel structure of a typical distribution system. It can be
noted from the figure that raw materials from production locations 1-3 are transported to the processing or manufacturing
center. After processing the goods are shipped in bulk to storage where they are stored or sorted before being shipped to the
warehouse. The warehouse operation is essentially a break—bulk and, or regrouping procedure. Describing this operation it is said:
. . . individual carloads of separate commodities may
29
Strucuture of Distribution Channels
Raw Materials. Region 1
Region 2
Raw Materials Region 3
Processing (Manufactur
ing)BulkTransport
Figure 2

30come in from many separate origins and be placed in the terminal for temporary storage; they are then reassembled in smaller quantities» still as individual commodities, but each outbound shipment will constitute a volume move (Mossman and Morton, 1965, p 236).
The warehouse (break-bulk and reassambly terminal) is often loc
ated near the market (center of demand-cost for a distribution
region) and away from processing points (Attwood, 1971, p. 27). Goods shipped from the warehouse go to wholesale or retail agents
from whom customers buy their needs. This does not mean that the
answer to efficient physical distribution lies in the location
of more warehouses. Increasing the number of warehouses in a
system Increases the operating costs (Attwood, 1971, p. 27). It
may, on the contrary, mean fewer warehouses. It can mean the
use of whole truckload instead of the more costly less—than-truck- load (LTL) shipments. Or it may mean the use of truck, boxcar,
or van trailers as a rolling warehouse if the transportation company can be relied upon for dependable deliveries.
Importance of the Study
There are many interrelated determinants of human well
being. Good nutrition is one of them, and can be a precondition
to the development of other factors of production. It can be a propellant to higher economic achievement levels. Malnutrition
may be viewed as a consequence of less-development (Aylward and
Jul, 1975, p. 16). It is also a drag on the potentials from
which national development can be directed. A well-nourished
population is a significantly important factor in the economic

31development of any nation.
In Nigeria problems of balanced diet exist. The danger
inherent in such a qualitative (or animal protein^) food defic
iency has been succinctly put by a United Nations panel of experts. They say:
Protein malnutrition is an important cause of infant and young children mortality, stunted physical growth, low work output, premature aging and reduced life span in the developing world. Recent research has also revealed a link between malnutrition in infancy and early childhood and impaired learning and behavior in later life. . . . The direct and Indirect costs of malnutrition to the economy are often more than would be required for prevention (United Nations, 1971, p. 18).
In 1962 the F.A.O. Committee established the level of safe prac
tical allowance of protein intake at between 0.66 and 0.84 g/kg/day (grams per kilogram of body weight per day). It depends upon the diet regime of the country whether or not the minimal requirement of 0.33 g/kg/day can be met.
The F.A.O. study in many less-developed countries in 1965
proved that countries, such as, India has a daily protein intake
of 50 grams, Nigeria has 51 grams, and Surinam has 45 grams as compared to 90 grams in Australia, 91 in the United States and 92
in Denmark. Protein malnutrition in Nigeria seems deceptively
straightforward and the temptation to simplify and overlook it
^Animal protein is high quality protein because it supplies all the essential amino acids (leucine, isoleucine, valine, lysine, histidine, tryptophan, methionine, threonine, and phenylalaning)In near optimal proportions. The term 'high quality’ is used here because proteins from animal sources are usually complete, not because proteins with full complements of amino acids are exclusively derived from animal sources (See the World Food Problem, Vol. II, p. 302).

32Is almost Irrâsistable. The United Nations has summarized the
dangers involved because of the wide gap existing in proteinconsumption in less-developed countries. It states that:
The gap between nutritional requirements and the actual consumption of protein by greater part of the populations of the developing countries is widening rapidly. Protein deficiency already has serious consequences for the health and working efficiency of the population of the developing countries. If the situation worsens, the physical, economic, social and political development of the populations involved may be completely arrested. Protein-calorie malnutrition not only increases susceptibility to acute and chronic infections, but also causes a compensatory reduction in the capacity for physical activity and promotes apathy. The direct effects on adult populations impede the economic productivity and development of countries which are desperately in need of improving the status and potential of their people, quite apart from human suffering involved (United Nations, 1968, p. 4).
The average animal protein consumption in Nigeria shown
by the United Nations survey above is misleading because consumption varies with real income or purchasing power, and the
seasonal fluctuation of perishable protein food supply in southern Nigeria. It can now be asked: How can perishable protein
food items be moved from the production region in Northern
Nigeria for distribution in the deficit areas in the Southern
Provinces at a reasonable speed so that the cost is at a minimum and perishability eliminated? The adoption of efficient
transportation-distribution systems will not only improve in
terregional trade on perishable food supplies in the Southern Provinces, but will also reduce shrinkages (parasitic attacks,
weight and death losses). These measures will result in what
Janelle (1968, pp. 5-10) has called time-and-cost-space con-

vergence. The decline In the relative importance of transportation costs will lead to increases in the significance of other
factors of production. This is particularly due to areal specialization of production which is based on the principle of compar
ative advantage (Lloyd and Dicken, 1972, p. 89). Eventually
this will bring about time- x —cost—and—space convergence, and
will result in increased animal protein intake in the Southern
Provinces of Nigeria.With modernization, people in Nigeria abandoned the rela
tive security of hunting and gathering foods from the forest and
relied on the uncertainty of the cultivated farms. This makes
the adequacy of food supplies an appropriate concern of the Nigerian government, and any action taken by the national govern
ment to assure regular flow of high protein foods from the nor
thern production region to the deficit areas of the south at reasonable prices should be accepted as proper.
SummaryIn this chapter a survey of the problem of food deficit
and the consequent protein malnutrition in the less-developed countries has been undertaken. It is now well known that pro
tein malnutrition has reached crisis proportions in these countries and that the human sufferings from it needs immediate atten
tion. The existence of protein malnutrition in the less-developed countries does not mean that protein foods are not produced
in most of these countries. The problem is that the production
of perishable foods in less-developed countries is restricted

34to limited areas because of Insect Infestations (e.g. tsetse
fly). The Immediate solution to Increasing perishable protein
food supply In the deficit areas In the less-developed countries
Is the movement of these foodstuffs from the production region to the deficit areas.
In order to view carefully the position of protein de
ficiencies In the less-developed countries one country, Nigeria
Is chosen as a particular case for investigation, Nigeria pro
vides an excellent laboratory for analyzing the present perishable
protein food distribution system In the less-developed countries.
In order to use Nigeria as a case study It is wise to look at
the present pattern of perishable food production and consumption In the country. In Nigeria the prevalence of tsetse fly
which causes trypanosomiasis In cattle precludes any good animal
husbandry In southern Nigeria. Cattle raising Is practiced In the northern Sahel Zone that Is tsetse free. Supply of beef In the south must come from this area. Inefficient physical distri
bution management has made It difficult to transport and distribute beef cattle to consumers in the Southern Provinces. In
the following chapter this problem is examined in depth.

CHAPTER II
PROTEIN PRODUCTION AND CONSUMPTION--
NIGERIA AS A CASE STUDY
Protein Malnutrition in Nigeria The presence and persistence of serious malnutrition
in many parts of Nigeria have long been recognized (Dema, 1965, p. 30; Nicol, 1959, p. 307). The prevalence of such chronic
malnutrition is caused by shortages of foodstuffs in many parts
of the country. In particular, there is marked deficiency of an
imal protein in the Southern Provinces (Floyd, 1969, p. 239;
Oyenuga, 1967, p. 12). Two foreign experts who have investigated the malnutrition problem in Nigeria emphasized that :
The consensus of medical opinion, as well as such few records as were available [for] investigation into nutritional standards, suggest that the large majority of Nigerians suffer to a greater or lesser degree from undernutrition and ill-balanced diet. Although the nature of the dietary déficiences varies greatly as between the Northertj Eastern and Western Territories, and almost from Province to Province and month by month within the Provinces according to the nature of the agriculture and the general income level, there is common to all a serious shortage of protein (Shaw and Colvile, 1950, p. 69).
The dietary patterns vary considerably within and amongbroad geographical areas. In his study of agriculture inNigeria Oyenuga (1967, p. 12) observed this spatial pattern whenhe concluded that : "It is very well known that a serious short-
35

36age of animal protein exists in Nigeria, and that the shortage
Is more acute In the south than in the north." In a study of
the "Protein Requirements in Nigerian Peasants" In different
communities, the spatial patterns of protein déficiences were
noted. The observer stated that:
The mean Intake of men and women over 12 years of age In the grain-eating areas (Jarawaj1, Tangaza,Bunga, Tunga Maldubu and Langal) was 85 g. protein which scored 77, whereas in yam-eating areas (Bero- Okuta and Mbanege) the respective figures were 51 g. and 50. The graln-eatlng groups consumedbetween 1 and 2 times the safe practical allowance. The diets of the yam-eating communities provided a little more protein than the minimumrequirement, but In no Instance did they supplythe safe practical allowance (Nicol, 1959, p. 311).
From Table 1 it can be seen that there is an absolute
shortage of animal protein in Southern Nigeria. At Bero-Okuta
(Southern Nigeria) the computed total daily intake Is 51.99 g.
as compared to 112.33 g. at Jarawaji in Northern Nigeria (Nicol,
1959b, pp. 309-310). The daily food intake in the Southern
Provinces is unbalanced, being heavily biased towards starchy food such as cassava (Hanihot esculenta) cocoyam (Colocasia).
rice (Oryza sativa), and yam (Dioscorea); and lacking in animal protein. Cassava provides 0.30 g. of protein intake dally and
yam provides 34.01 g. The quality of this protein Is of poorquality as compared with 22.12 g. from fish and 3.47 g. from beef in the Northern Provinces. Meat (antelope) provides only 0.08 g. at Bero-Okuta. Most of the food eaten in the Southern
Provinces are deficient in some amino acids. For example, cassava the commonest food, provides 13 mg. of lysine and 2 mg* of

TABLE 1
COMPUTED MEAN DAILY PROTEIN AND AMINO ACID INTAKE OF ADULTS AT BERO-OKUTA IN SOUTHERN NIGERIA
Foodstuffs Amount Protein
Nitrogen Iso Leu Lys Met Sul
phur Phe Thr Try Val(g) (g) (g) (mg) (mg) ([mg) (mg) (mg) (mg) (mg) (mg) (mg)
1. Cassava (Manihot esculenta) 20 0.30 0.05 9 13 13 2 6 9 9 4 10
2. Cheese (sour) 2 0.70 0.11 41 75 59 19 25 38 33 7 40 w
3. Green leaves 19 0.48 0.08 23 29 20 4 7 14 8 5 194. Groundnuts 3 0.77 0.14 35 77 29 7 21 41 '25 10 415. Kola nut (Cola
Acuminata Schott) 11 0.99 0.19 59 83 47 16 .39 60 42 15 56.6, Locust bean (Parkia
clappertoniana 4 1.63 0.26 84 161 120 12 22 80 35 14 80
7. Maize (Zea Mays) 24 2.28 0.36 104 292 65 42 71 102 90 14 1158. Mango (Manfifera
indica) 18 0.13 0.02 4 6 16 1 2 4 4 2 4
9. Meat (antelope) 4 0.80 0.13 43 67 71 20 30 33 36 9 4510. Okra (Hibiscus
esculentus) 19 0.61 0.10 24 34 26 8 14 22 22 6 30

TABLE 1 (Continued)
Foodstuffs Amount, Pro- ' teinNitrogen Iso Leu Lys Met Sul
phur Phe Thr Try Val(g) (g) (g) (mg) 1(mg) 1(mg) (mg) (mg) (mg) (mg) (mg) (mg)
11. Peppers (Piper Nigrum) 3 0.04 0.01 2 2 3 1 1 3 3 2
12. Pumpkin (Cucurbitamaxima) 1 0.27 0.05. 15 21 12 5 10 15 8 5 14
13. Sorghum (Sorghum Vulgare) 81 8.18 1.31 445 1315 223 141 277 407 293 92 468
14. Tomato (Lycoper- sicon esculentum) 3 0.03 0.01 2 3 3 - - 2 2 1 2
15. Yam (Dioscorea) 1417 34.01 5.44 1632 2872 1676 500 620 1496 1153 588 1540
, TOTAL 51.99 8.40 2522 5050 2383 778 1145 2326 1763 772 2466
Source) Adapted from Nicol, 1959b, p. ]10.Iso = Isoleucine Leu = Leucine Lys = LysineMet = Methionine Phe = Phenylalanine Thr = ThreonineTry = Tryptophan Val = Valine - = Negligible
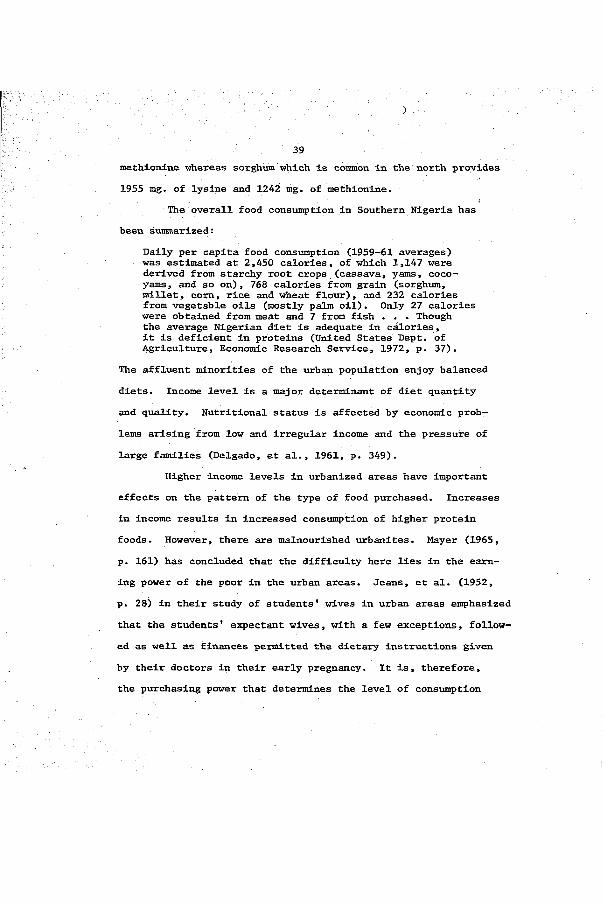
39methionine whereas sorghum which is common in the north provides
1955 mg, of lysine and 1242 mg. of methionine.The overall food consumption in Southern Nigeria has
been summarized:
Daily per capita food consumption (1959-61 averages) was estimated at 2,450 calories, of which 1,147 were derived from starchy root crops (cassava, yams, cocoyams, and so on), 768 calories from grain (sorghum, millet, com, rice and wheat flour), and 232 calories from vegetable oils (mostly palm oil) • Only 27 calories were obtained from meat and 7 from fish . . . Though the average Nigerian diet is adequate in calories, it is deficient in proteins (United States Dept, of Agriculture, Economic Research Service, 1972, p. 37).
The affluent minorities of the urban population enjoy balanced
diets. Income level is a major determinant of diet quantity
and quality. Nutritional status is affected by economic prob
lems arising from low and irregular income and the pressure of
large families (Delgado, et al., 1961, p. 349).Higher income levels in urbanized areas have important
effects on the pattern of the type of food purchased. Increases in income results in increased consumption of higher protein foods. However, there are malnourished urbanites. Mayer (1965,
p. 161) has concluded that the difficulty here lies in the earning power of the poor in the urban areas. Jeans, et al. (1952,
p. 28) in their study of students* wives in urban areas emphasized
that the students* expectant wives, with a few exceptions, follow
ed as well as finances permitted the dietary instructions given
by their doctors in their early pregnancy. It is, therefore, the purchasing power that determines the level of consumption

40even In urban areas. "As might be expected, the nutritional
status of poor people is generally poorer than that of the
wealthy" (U.S. Senate Select Committee, 1974, p. 840).
In the north, the supply of foodstuffs includes Guinea c o m (Sorghum vulgare), lima beans (Phaseolus lunatus), millet
(Fenninsetum typhoideum) , meat and milk. Table 2 shows that
the mean daily beef consumption in the North provides 3.47 g.
while whole milk gives another 3.32 g. (Nicol, 1959b, p. 309).It has been observed that these diets provide the people with
about two and a half times the minimum daily protein require
ments (Nicol, 1959b, p. 311).
Mottram and Graham (1941, p. 76) in their analysis con
cluded that foods with less than ten per cent protein should not be considered high quality (protein) foods. This underscores
the chronic protein shortages in Southern Nigeria because it ex
cludes all of the leaf, roots, vegetables, and fruits that make up the bulk of the daily diets of most Southern Nigierians. Sup
port for the above statement can be assessed through a nutritional analysis that finds similarities between the composition of
the human body and those of animal proteins. The analysis con
cluded that:
Because there is a great similarity between the chemical composition of the human body and that of animals, the eating of animal proteins is a very efficient method of acquiring all the essential amino acids. Animal proteins include meat, fish, poultry, eggs, milk, and cheese. Such foods contain the essential amino acids in the amounts and proportions required by the human body. They are sometimes called complete protein foods. . . . It is necessary, therefore, to consume a variety of these

TABLE .2
COMPUTED MEAN DAILY PROTEIN AND AMINO ACID INTAKE OF ADULTS AT JARAWAJI IN NORTHERN NIGERIA
Foodstuffs Amount(g)
Protein(g)
Nitro-©
Iso(mg)
Leu(mg)
Lys(mg)
Met(mg)
Sulphur(mg)
Phe(mg)
Thr(mg)
Try(mg)
Val(mg)
Beef (fresh & dried) 15 3.47 0.56 I83 287 306 87 131 144 155 41 194Cassava (Manihot esculenta) 11 0.16 0.03 5 8 8 1 3 5 5 2 6Cow pea (vigna senensis) 13 3^* 0.49 148 229 199 47 87 160 121 29 173Desert Date pulp (Balanites aegyptica) .3 0.02 - - - - - - - - - -
Egg plant (Solanum melongena) 1 0.04Fish(fresh & dried) 58 22.12 3.54 1122 1671 1940 644 941 821 959 219 1179Groundnuts (Arachis hypogea) 11 2.82 0.52 134 198 116 29 78 164 87 36 162Kola nuts (Cola acuminata Schott) 6 0.54 0.10 31 44 25 9 21 32 22 8 30Leaves (dried) 2 0.48 0.08 23 29 20 4 7 14 8 5 19

TABLE 2 (Continued)
Foodstuffs ll°r Nitrogen Iso Leu' Lys Met Sul
phur Phe Thr Try Val
(g) (g) (g) (mg) (mg) (mg) (mg) (mg) (mg) (mg) (mg) (mg)
Milk (fresh & sour) 95 ,32 0.52 212 326 258 81 111 161 153 47 228Okra (Hibiscus esculentus) 25 3.22 0.52 125 183 138 41 71 118 119 33 164Onion (Allium cepa) 2.5 0.04 0.01 1 1 2 - - 1 1 1 1Peppers (Capsicum) 3 0.45 0.07 17 17 19 6 10 20 18 3 12Poultry 3-5 0.70 0.11 36 50 60 18 27 27 29 8 34Sorghum (Sorghum vulgare) 712 71.91 11.50 3910 11546 1955 1242 2438 3577 2576 805 4106
TOTAL 112.33 18.05 5947 14589 5046 2209 3925 5244 4253 1237 6308
Source : Adapted from Nicol, 195L, p, 309-
Iso = Isoleucine Leu = Leucine Lys = LysineMet = Methionine Phe = Phenylalanine Thr = ThreonineTry = Tryptophan Val = Valine - = Negligible
■fSN3

43foods in relatively large amounts in order to acquire the essential amino acids • • • .Any reasonable diet containing meat and/or beans and milk will provide all the amino acids necessary for good health. Unfortunately, amino acids, unlike carbohydrates and fats, cannot be stored in the body for future use. Proteins that the body cannot use at any given time are excreted. Protein intake then, must be continuous (Laplace, 1972, p. 366).
Beef Consumption in Southern Nigeria
Almost all the beef marketed or eaten in Southern Nigeria comes from the North because the widespread presence and persis
tence of various species of Glossina restrict animal husbandry
in the Southern Provinces. There are, however, some trypanosome-
tolerant dwarf N*Dama and Muturu varieties in the south. These
animals scavenge for themselves, and as a result they produce very little meat and milk. These trypanosome-resistant breeds
are not considered useful or productive, rather they are a sym
bolic mode of investment. The trypanosome-resistant breed is only butchered on ceremonial occasions; hence scarcity of meat
in the area. As property par excellence of the chiefs and the
wealthy (Dupire, 1968, p. 336), their social value sets their
economic value.As a result of the ubiquitous tsetse fly that restricts .
animal husbandry in the south and the inefficient means of trans
porting and distributing northern cattle, there is an acute short
age of meat in the Southern Provinces. Southern Nigerian diets suffer from shortages of animal proteins. These shortages greatly
affect the physical (and perhaps, the mental) development of most

44southern Nigerians. Figure 3 compares the physical development
(weight and height changes) of Nigerian children in rural commun
ities with those of the highest social (elite) class In Ibadan
as optimum group, and Fankshln children in Northern Ibadan as a standard.
Children in villages in Southern Nigeria have the lowest
body weight—height changes as a result of protein deficiencies
in their diets. In a survey conducted by Dema (1965), and Collls and Janes (1967), it was found out that children who live in
rural areas in Eastern Nigeria have body welght-height changes
similar to those In the West. The result of the survey showed that children In Southern Nigeria have the slowest growth rate and weight changes In the country. Children in Adlaslm, South
eastern Nigeria show the slowest body weight-helght changes.
Children In Ilesha In the West followed, while children from
M^u, Idembla, and Urualla, East Central State follow in the
descending order. The study led to the conclusion that:. . . a diet that meets the requirements of the Food and Agricultural Organization (FAG) will by itself Improve growth rates of Individual children and also groups of children, whether or not Infection has been prevented, as will be demonstrated (Collls and Janes,1967, p. 56).
The children of the Fankshln group In Northern Nigeria contrast
markedly with those of the rural communities in the Southern
Frovlnces. From ages two to six children In Ilesha, Maku, Urualla, and Adlaslm are well below the well nourished children
of the Ibadan optimum group In body build. Thereafter, Fankshin

45
W E IG H T /H E IG H T C H A N G ES
IN N IG E R IA N CHILDREN
20I S A D A S O p t i m u m
M A K U
O gE 15o. ™
14
Age In Years
SourceDema, I965, p.65

46children follow the line of physical development of the child
ren of the Ibadan group. Protein deficiency in foods accounts for these differences In the groups. The estimation of physique
by the ratio of body weight to height has been defended as a
means to estimate the amount of soft tissues In relation to the
size of the skeleton. Physique, therefore. Is derived simply
as the weight/height Index and Its measurements are useful in
comparing the body build of different groups of people (Dema, 1965,
p. 73).
The number of cattle slaughtered in a given town Is a good Indicator of the availability of meat In that area. Figure 4 plots the number of cattle slaughtered In selected towns In
Southern Nigeria as compared with monthly slaughterings at Kano
for 1973. Port Harcourt had the smallest monthly slaughterings.
Distance from the source of cattle accounts for the small number.
However, fish may serve as a partial protein source near the
coast (Collls and Janes, 1967, p. 60). Slaughterings In smaller
towns may even be less because of long distances from supply
centers or Inefficient distribution systems. Slaughtering figures for rural areas In Southern Nigeria are not available, hence
it Is Impossible to compare rural slaughterings in the north with
those in the south. Slaughterings for Lagos and Ibadan are high, though not as high as those for Kano In the north. Lagos is a capital city and Ibadan Is the seat of a university. People who live here are in the upper Income brackets in the country.
Income is an.important factor in determining the types

47CATTLE SLAUGHTERED PER CAPITA IN SELECTED TOWNS. 1973 fSY MONTH)
1 0 0
,090
080
070
0 6 0 Kano
a,o
Lagoi
020', rbadam
010 _ Benin " fenuguSarcoiirt
Jan. Feb. Mar. Apr. May Jun. Jul. Aug. Sept. Nov. Dec
Source 1 Nigerian Livestock and Meat Authority.Figure 4

48of food purchased. In a survey conducted by the Nigerian Federal
Departr^nt of Statistics, it was shown that low—income families
spend the greatest percentage of their income on carbohydrates
with correspondingly less percentage on meat and other food items
which provide better nourishment than staples. This is necessar
ily so, because staples are cheap. High-income families buy more nutritious (protein) foods than poor people. Table 3 shows a summary of the survey taken by the Federal Department of Statis
tics, Lagos at Akure/Ondo/Owo, Lagos, Onitasha, and Oshogbo/Ife/ Ilesha. This confirms that low-income families buy very few
protein foods Including meat because of price and scarcity in
their local markets. The means of transporting and distributing meat are very inefficient, and rural communities are deficient
in protein food supplies. Table 3 which follows shows the per
centage of income spent on different food items by three differ
ent income groups in selected towns in Southern Nigeria.From the table it can be noted that the lower income
group have no money to spend on protein rich food. After spend
ing a very high percentage of their income on staples very little
is left for protein foods. For example, at Okure» Ondo, and Owo the lower income groups (wage earner) spent 45.0 per cent of their income on staple and 28.7 per cent on meat; the self-em
ployed spent 49.0 per cent on staple and 32.7 on meat. At Lagos they spent 55.6 per cent (wage earner) and 59.0 (self-employed)
on staples while meat has only 26.3 per cent and 27.4 per cent respectively. At Oshogbo, Ife, and Ilesha the lower-income

49
TABLE 3PERCENTAGES OF INCOME SPENT ON
DIFFERENT FOOD ITEMS
Towns 1Income Group Staple Meat Oil&Fat Veg.Fruit Others
Akure/Ondo/Owo Lower Income
(Wage Earner) 45.0 28.7 5.8 8.9 11.6Lower Income (Seof-Employed) 49.0 32.7 5.0 8.8 4.4Middle Income 40,0 29.9 7.4 8.2 14.0
Lagos Lower Income (Wage Earner) 55.6 26.3 4.9 6.4 6.8Lower Income (Self-Employed) 59.0 27.4 4.5 6.2 2.9Middle Income 38.7 32.6 7.4 9.3 12.0
Onitsha Lower Income (Wage Earner) 43.6 34.4 4.3 9.9 7.8Lower Income (Self-Employed) 47.7 31.7 4.2 7.9 6.5Middle Income 39.6 34.2 5.2 10.6 10.4
Oshogto/Ife/Ilesha
Lower Income (Eage Earner) 48. 9 28.8 5.0 8.3 9.0Lower Income (Self-Employed) 57.4 27.3 3.8 7.1 4.4Middle Income 37.4 32.9 7.2 7.9 14.6
Source» Compiled from Federal Department of Statistics, Lagos, 1966.
^Staple here includes such starchy foodstuffs as cassava (maniac), cocoyam, maize, rice, and yam.

50(wage earner) spent 28.8 per cent, and (self-employed) 27.3 per cent on meat while staple had 48.9 (wage earner) and (self-
employed) 57.4 per cent respectively. With very low income and
a very small percentage spent on meat the poor can hardly have
enough protein intake.
Figure 5 compares the average quantity of beef eaten (in pounds) per person per month in two Southern Nigerian towns
(Calabar and Ibadan) with the consumption at Kano, Northern Nigeria for 1973. Calabarians had less consumption than Ibadan
or Kano. From July to September each person in Calabar town ate
about 5 lbs. of beef per month. People at Ibadan had between 6
and 8 lbs. of meat each from July and December. At Kano, the
inhabitants had between 20 and 30 lbs. per person per month at
the same time in that year. Beef consun^tion in the southern
towns is very low because they are too far away from the sources
of supply. Rich urban dwellers in Lagos can afford to buy beef
at a high price, but supply in the city is poor. Means of trans
portation and distribution of beef cattle in the country is very .
inadequate^ Calabar is too far away from the center of supply and lacks good communication routes to the interior.
The average daily amount of beef eaten by each Nigerian in each state in 1973 has been mapped. From the Figure 6 it
can be seen that only Lagos in the Southern states had a daily beef consumption favorably compared to the Northwestern state. Kano and North Central States came second, while the Northeast was the third. Kwara and Benue-Plateau states had the smallest

51
AVERAGE MONTHLY BEEF CONSUMPTION, 1973
LbsOklahoma
\___/20. Kano
15-
1 0,Ibadan
Calabar
Nov Dec
Calabar-IbadanKano.Oklahoma (State)
Sources: Nigerian Livestock and Meat Authority, 1973 USDA., 1973.
Figure 5

52
PER CAPITA BEEF CONSUMPTION IN NIGERIA (BY STATE), 1973
:Nortli-Westerri
IS ta to :N o rth -E a s te rn S ta te
N o rth -
\> C e n tr a l -
-P
Western State
IMid-West
E ast-C e n tra l
G r/Person/Day
[rrrm 1.23 -Snuth|
East,
IHHHHHJ 10.02 - 18.78
E E E 3 18.79 - 27.5Ü
I > 1 ?7.56 - 3C.33
. JO.31 - 4!,. HI
SOURCE : N iq c r ia n l iv o ': lo c kami Meat A u th u r i Ly , 19 /3 ,

53amount of intake In the Northern area. These latter states are
partly in the Guinea forest zone and partly in the northern sav
annah zone, but the former occupies a greater geographic area.
Tsetse infestation begins to attack cattle in the southern half
of these states. In the Southern Provinces, East Central State had 1.23 grams per person per day in 1973. People in Rivers State had 2.0 grams. Southeastern State had 2.45 and the Western
State had 5.22 grams.^ These states are too far away from the
northern savannah zone where cattle husbandry is practiced.
As a result of scarcity and prices of beef in the southern markets, poor families are deficient in animal protein in
take. Children in these families may be of stunted growth and
emasciated. Insufficient supplies of protien in the body result
in the use of the little protein available for energy instead of
for body building (Collls and Janes, 1967, p. 55). The mortality
rates of Nigerian children under the age of five are in the order
of 50 per cent in several parts of Southern Nigeria. Studies con
ducted at Ilesha village in 1959 showed that 12 per cent of the
^The amount of meat eaten (in grams) per person per day in each state for 1973 was based on: (1) Recorded slaughteringsas reported by the Nigerian Livestock and Meat Authority. It has been reported that there are unrecorded slaughterings which amount to an additional 10 per cent of recorded slaughterings in each state (See Western Nigeria Development Project No. 3, p. 3). (2) Each slaughtered cattle was estimated to give 340pounds of meat and edible offals (See Ferguson, 1967, p. 52 for a brief discussion on the topic). (3) All calculations were based on the population of each state as recorded in the Annual Abstract of Statistics, 1972.

54child mortality in the village was caused by protein malnutrition (Dema, 1965, p. 36), Protein malnutrition has been observed as
a precursor to some psychiatric illnesses in some Nigerians. ;
Protein malnutrition causes lethargy and retardation which ultimately triggers off behavior problems. In this connection it
is stated that;A glance at the total physical findings of the two groups (psychiatric cases and controls) emphasizes the differences. It was in the state of nutrition that the divergence was most marked. This calls the effect of starvation associated with famine edema on subsequent organic brain diseas e as described by Eitinger in survivors from concentation camps (Collls and Janes, 1967, pp. 68-69).
The malnourished adult Nigerian is poorly motivated for increased
productivity and hope for a better world:This was clearly seen in the Ekiti farming community of Oke—lie . . . where the people do not have food enough to eat, and are therefore not willing to work for more than three or four days in the week on farms which they fatalistically believe cannot be substantially improved (Dema, 1965, p. 37).
In order to increase the Intake of beef and consequently protein in the Southern Provinces efficient transportation and distri
bution systems must be planned and developed.
The Southern TaboosThere are neither widespread religious nor cultural taboos
against the eating of beef in Nigeria. The eating of pork is
scorned by Moslems, but very few observe this Islamic law in the Southern Provinces. However, there are some local prejudices
against the consumption of meat by certain children on specified
market days. The reason for this is the belief by ignorant

55parents that children who are encouraged early in life to eat
meat will steal it if they cannot afford to buy it in later
life. Another reason is the fear that children may become sick if they eat beef on certain sacred market days when cooking is prohibited.
Today, the above cultural observations are no longer observed. The only consideration governing meat consumption is
its freshness. Only fresh meat is eaten by a majority of South
ern Nigerians, This means that only meat butchered on that very day is eaten by Southern consumers. Meat which has stayed over
night is not palatable to the local consumers. The reasons for
this are not difficult to understand. In Nigeria, refrigeration
is uncommon. Refrigeration is vary important for the storage of
perishable food products. Adequate cold storage facilities are nonexistent in most Nigerian markets. Even if refrigeration were
provided in all markets, difficulties would still arise over the
purchase of cold or refrigerated meat. Apart from palatability,
many consumers suspect refrigerated meat to be spoiled, or to come from contaminated animals. The difficulty makes butchers limit their slaughterings to the numbers that they are able to
sell In a day. If the slaughtered meat is sold out in the early
afternoon, the butcher will not take the risk of offering more cattle for slaughtering for fear that he will not be able to sell the meat on that day. Due to these practices, demand for
meat may not be met in the Southern Provinces •The widespread and presistent occurrence of protein mal-

, 56nutrition in the south can then be viewed as caused by lack of
availability of protein-rich foods. This has resulted in pro
tein-rich foods too highly priced for the low-income families
to be able to afford. In addition to the development of adequate
transportation and distribution systems for the transportation
of beef cattle from the north and distribution in the south, there is need for the education of Nigerians on new food habits
so that refrigerated meat may be accepted by the masses. Food science education should be viewed as a long-term project be
cause food habits are difficult to change. Efforts should be made to make the already known source of protein foods avail
able to the southern consumers by efficient development of trans
portation and distribution systems in the country.
The cultural taboo against the consumption of either
cold or refrigerated meat in Nigeria has a great effect on the
distribution systems in the country. It has held to the driving
of live cattle from the Northern to the Southern Provinces. The
cattle thus trekked are emaciated, sick and weak; and may not live for more than a few weeks on arrival in the south. This cultural taboo against refrigerated meat has also hindered the development of well organized meat markets in the protein-deficit Southern Provinces. The effects of this cultural taboo has been em
phasized:It is a fact that the absence of organized marketing has considerably accentuated protein deficiencies in the country, since considerable weight loss occurs in slaughtered animals as a result of trekking long distances from the producing to the consuming centers

57under unhealthy conditions. A better organized marketing system will enable live animals to be transported In more humane manner, and the considerable amount of weight usually lost during trekking would be minimized. The use of modern .abattoirs and _ slaughtering techniques would be encouraged by a good marketing organization which could also, more effectively consider the economics, finance and logistics of Inter-state trade In chilled meat. A good marketing organization would tackle the problems at present associated with the improper utilization of valuable animal by-products such as bones, hoofs, horns and blood (Fe. Min. of Inf., 1970, p. 122).
Urbanization and Demonstration Effect
Until the post World War II period, there existed very
little urbanization in Southern Nigeria. Towns were not un
known in the pre-Western period, especially among the Yorubas, who were traditionally town dwellers. A mid-nineteenth century
European traveler once said that there were nine pre-industrial
Yoruba towns with populations between 20,000 and 70,000 (Bascon,
1955, pp. 446-456). These ancient towns were mere population conurbations In walled cities or market centers and river cross
ings. The people were ethnically concentrated in such centers
for purposes of defense and protection against tribal Incursions. Today’s towns are developed for commercial and administrative purposes.
The development of modern urban centers in Nigeria is
the result of the Introduction of western Influences, such as,
government, trade, commerce, and industry into the country. Foreign religious centers also led to the opening of modern urban centers (Johnson, 1967, pp. 168-202). Today urbanization Is

58growing at a very fast rate in Nigeria. The annual rate of urbanization has been eistimated at 5.8 per cent (Coleman, 1960). Pre
sently, the rate of urbanization in the Southern Provinces has
been estimated as 7.Ô per cent, which is faster than the rate of population growth.
The opening up of modern towns in Nigeria for purposes of government, industry, commerce, education, and religious acti
vities has led to the employment of Nigerians in the highly paid
jobs in the urban centers. Urbanization and the rise in income levels create some appeal of new and superior goods to the con
sumers. In his theory of individual consumption function, Duesen-
berry calls this "demonstration effect" (Duesenberrg, 1949, p.
27). The demonstration effect in Nigeria results from the meet
ing of employed Nigerians with their western colleagues. It is also noted that Nigerian students trained overseas are introduced
to superior goods and the western styles of life. Their consumption patterns are also affected.
Individual consumption functions are very much inter
related. They are dependent upon the patterns of close associates (social groups), such as, neighbors, friends, and colleagues.
This is well Illustrated when it is stated that:
Of necessity then, in view of our social goals, every individual makes comparisons between his own living standard and those of his associates in higher and lower status positions. Every unfavorable comparison of this sort leads to an impulse to buy goods which will raise the living standards, and eliminate the unfavorable comparison (Duesenberrg, 1949, p. 31).
The meeting of Nigerians with western administrators, teachers.
59'bankers» and Industrialists has aroused the desire for social emulation by means of conspicuous consumption. The contact has
resulted in the consumption of superior goods (in this case, pro
tein foods) and the adoption of more advanced ways of living by many urban Nigerians.
The role of cities as the main force and chief locus for
the introduction of new ideas and ways of doing things as well
as new demands, for example, new technology, new consumption and
production patterns, and even new social institutions had for long been very well attested (Hoselitz, 1953, pp. 195-208). This
role in Nigeria is in no way quite different. Urbanization, com
mercialization, and demonstration effect combined with a normally
high population density in the southern towns accelerate the growth of internal agricultural trade between the Northern and Southern Provinces. Here what Bertil Ohlin calls factor proportions
comes in clearly. The north being savannah region is a substan
tial net exporter of livestock, cereals, and nuts to the sorthem
urban centers. Conversely, the north imports palm oil, bananas, oranges, and kola from the south. These developments have led
to a considerable degree of both geographic and ethnic special
ization in the Nigerian internal trade. One such ethnic special
ization is represented by the Cattle Fulani who own nearly 96 per cent of the cattle in Nigeria. The difficulty in the deve
lopment of the interregional trade is the inefficient development
of the transportation and distribution systems which hamper fast
delivery and distribution of the perishable food products from

60the north to the new urban focussed population of the south.
Beef Cattle Production In Nigeria Cattle husbandry in Nigeria is restricted to the north
ern savannah zone. This northern zone is tsetse free because it is too arid to provide breeding places for tsetse flies. The
tsetse thrives well in areas that are humid and have thick fol
iages. Such favorable places are unavailable in the dry north.
Figure 7 shows the cattle raising areas in Nigeria and the dis
tribution of each tsetse species. From Figure 7 it can be noted that the only tsetse free zone in Nigeria is the northern Sahel
region. The Jos Plateau in the central part of the country, the Adamawa highlands and the Oban Hill in the eastern part of the
country are also tsetse free, but there is no intensive animal
husbandry practiced in these areas. More recently a ranch was
opened at Obudu (on the Oban Hill Plateau) by the Eastern Nigeria
Development Corporation. It has by now been noted that there is
an endemic infection of the soil with claustridia group of an
aerobic organisms. The infection killed nearly all the animals
in the Obudu Ranch in 1965.%
In Southern Nigeria, the prevalence of Glossina, which
are vectors of. trypanosomiases, severely limit the practice of
efficient animal husbandry. It is only through very costly
^This information was supplied by letter communication with the assistant manager of the Obudu Cattle Ranch dated March 3, 1975.
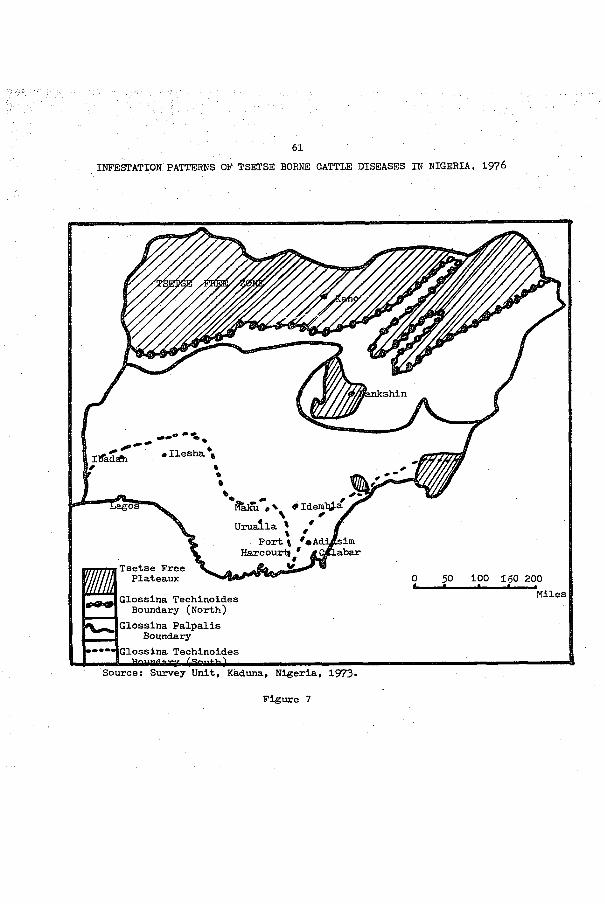
61INFESTATION PATTERNS OF TSETSE BORNE CATTLE DISEASES IN NIGERIA, 1976
nkshin
«llesha I
9àlîû • * IdenrtiJ-aUrualla ' *
\ *Port % 'oAd^sim Harcour-tj * ^ oÆabar
Tsetse Free Plateaux 50 1 0 0 1 5 0 2 0 0
Glossina Teohlnoides Boundary (North)
Glossina Palpalis Boundary
Glossina Teohlnoides(iSniith)uiiiinrar
Source: Survey Unit, Kaduna, Nigeria, 1973-
Figure 7

62and specially controlled schemes such as the Obudu Ranch, Ogoja
in the Southeast, and the Ogun River Scheme in the West, that
animal husbandry has been successful in the south. Neither of
these has yet reached commercial production levels, but the former provides about two slaughter animals per day. According to
projections, in ten years Upper Ogun will be producing about
1,600 slaughter animals per year (Western Nigeria Development
Project, 1964, p. 13).
In the dry northern zone, the open savannah provides
good herbage for cattle grazing. The scanty rainfall in the
area makes the grazing abundant only in the wet season (November
through April). However, the government has recently drilled wells to supplement water supplies during the dry season. The irrigation facilities provided by these wells cannot provide
adequate forage during the long dry periods. The cattlemen have
to rely on the seasonal rhythms for the supply of forage to feed
their cattle. During the dry season, the herdsmen are forced to
migrate southward with their herds in search of water and better
pasture (Federal Ministry of Information, 1970, p. 121).
Seasonal Movement of CattleThe transhumance nature of animal husbandry has been
practiced by the Fulani herdsmen for centuries. The practices
can be viewed as a spatial movement resulting from different
vegetation and annual precipitation cycles. By long experience in nomadic pastoralism the Fulani had learned how to avoid trypanosoma infections of their cattle. The southward movement to

63the dry season grazings is made slowly with many short stops
depending upon the rhythm of the rain. In years of prolongeddrought, the Fulani cattlemen may take the risk of putting
their herds into known tsetse-infested areas which they would
normally avoid (De St. Croix, 1944, p. 31).
The problems associated with this tradtional way of
cattle raising have been summarily stated:
The animals emaciate during the long treks and many which are forced into tsetse infested areas die of tryp6 iosomiasis and other diseases, the most serious of which are rinderpest and contagious bovine pleuropneumonia (Federal Ministry of Information, 1970, p. 121).
There is no regular or fixed sequence of the southward migrationof the herdsmen and their cattle because of the unpredictability
of the weather conditions in the country. In the south, thecattle are grazed on the generally more watered areas, especially
near large rivers or lakes; or in areas with numerous streams
(De St. Croix, 1944, p. 31).
There are, however, real economic costs involved in this
type of traditional animal husbandry. The transhumance nature
of animal grazing encourages soil depletion and erosion which in
turn creates problems for other types of farming. It is hereemphasized that:
The "Cow" Fulani, the present nomads, are people of considerable grace and beauty, but to the Territory they have in effect and in habit, the characteristics of the gipsy. Learned in the lore of cattle raising, they not only make no contribution to the country* agriculture, but their mode of life is quite inimical to it (Shaw and Colvile, 1950, p. 36).
Presently, the government is providing pilot irrigation schemes

64that will encourage sedentarization of the nomadic pastoralists
(Annual Report of Animal Husbandry, 1974, p. 6). In Kano, the
state government has increased official grazing acreage for the
Fulani herdsmen from 2,000 in 1968 to 15,000 in 1970, and plans
are on the way to add another 128,000 areas with irrigation schemes
(Ministry of Agr. and Nat. Resources, 1974, p. 24),
The seasonal movement of herds for wet season grazing in Nigeria takes the animals away from potential markets (F.A.O.,
1966, p. 217). Production is not a decisive factor in the marketing of cattle by the nomadic herdsmen. The Fulanis are sub
sistence pastoralists with minimal interest in selling their
cattle. The owners value cattle far beyond either utilitarian
or pecuniary worth of the animals. Without any scientific knowledge of controlling disease and drought the accumulation of stock
is a recognizable insurance against death and human hunger.
The Fulani herdsmen believe that they hold cattle in trust
for future generations and, therefore must increase their wealth
in cattle (Hope, 1948, p. 26). Their viewpoint does not appear
to experienced veterinarians entierly bereft of good sense because
it is through the large number of cattle that the herd can be re
constituted after the periodic losses brought about by diseases,
drought, and underfeeding (Duplre, 1968, p. 335). Quite apart from economic value, ownership of cattle gives membership in Fulani society and their loss may result in expulsion (Hopen,
1958, p. 27). The social prestige and importance of the cattle owner is gauged by the number of head owned and not by the in—

65dividual quality of the animal (Ferguson, 1967, p. 11). There
is, as yet, little incentive to encourage standard improvements
or trading on livestock. The types of cattle raised are numerous
and the breeds are considerably mixed, but most of them are poor and multi-purpose in nature. Being a visible sign of wealth,
the Fulani refuse to sell their cattle except during timus of emergencies. Such emergencies include payment of cattle tax (jangali), buying of salt for the cattle, paying fees for use of
public grazing grounds or pasture, paying veterinary expenses
for immunization, and occassionally, buying food and clothing
for the family (Ferguson, 1967, p. 11). However, there is no time that the supply of trade cattle is lacking in the northern
cattle markets. The reasons^are: (1) at one time or another
some cattlemen must need cash in order to buy their needs, (2)
the Fulanis sell cattle that are old and unproductive, and (3) a Fulani cattleman due to his old age and without heirs to his
cattle can choose to sell some of his cattle leaving only the
number that he is able to raise properly.
Factors Affecting Regional SpecializationThe prevalence of Glassina, vectors of trypanosomiases,
has severely restricted the practice of cattle ranching in Nigeria. This is why almost all the cattle marketed in Southern Nigeria
come from the tsetse free zone in the Northern Provinces. The restrictions on cattle farming are related to factor endowments. This can be analyzed in the context of the Heckscher-Ohlin frame
66work which states that :
Specifically, the comparative-cost doctrine holds that a country (region) possesses a comparative advantage in producing those commodities in whose production its "real" labor costs (in the sense of the inverse of average productivity of labor) are relatively lower than those of other countries. On the other hand, the Heckscher-Ohlin theory of comparative advantage depends on (a) different productive factor endowments among countries and (b) different factor intensities of production processes for different goods (Moroney and Walker, 1966, p. 573).
In Nigeria, interregional trade is based on the fact that pro
ductive factors for cattle exist only in the north. The immobility of cattle production factors gives rise to the concen
tration of cattle raising in the northern savannah zone*
Resource and Physical Bases
In his identification of the essential questions concern
ing the production of any commodity, Chisholm (1966, p. 29) em
phasized that: "Three interrelated questions underlie a study
of the spatial pattern of production of any commodity: What is(will be or has been) produced, how much of it, and where?" Why is the Nigerian cattle production located in the north? In the
Western industrialized nations, a basic assumption is that an
entrepreneur will choose a location where his production derives maximum profits as the most favorable location for his firm.
This approach is necessarily so because in a competitive economy, no one production firm can easily achieve minimum costs. The
measure of optimum location then becomes relative and is based
upon some financial returns (profits) that are relative to a competitor's.

67The traditional cattle industry in Nigeria is quite
different from the profit oriented western firm discussed above. The role of regional resources in the initial stages of economic development need not be over-emphasized here. In the early history of the United States, the regional endowment that contributed
to the development of the Midwest was arable land, while metal
ore mining was the major factor in the economic development of
the,mountain region (Perloff and Wingo, Jr., 1972, pp. 215-218). However, it has been shown that abundant resources are not a
sufficient cause to fully explain economic development, as
Argentina and Burma perhaps prove; but they afford the opportun
ity for development and support the ongoing process (Kindleberger,
1965, p. 67).
In Nigeria, there is a definite correlation between re
lative factor endowments and the location of the cattle industry.
Natural resources, capital, and labor endowments (among other things) are very important determinants of the comparative advantage of any region. In any case, beef cattle cannot be pro
duced in an area that lacks the necessary natural resources for their production, for example, modem feed lots. The Nigerian
cattle industry is greatly influenced by the availability of
natural resources rather than by the abundance of either capital or labor. Mittendorf and Wilson (1960, p. 3) have stated that
cattle production in Africa is limited by the availability of
adequate pasture, water, and the degree of freedom from diseases.The northern savannah zone, --here the Nigerian cattle

68husbandry is carried on, is tsetse free. The area is too dry
to support the growth of herbaceous plants which encourages tsetse fly breeding by providing shade for the flies. In South
ern Nigeria, trypanosomiasis inhibits the production of quality cattle. The disease, which is transmitted by various tsetse
fly species interferes with animal productivity. The debilitating
effect of the disease causes live weight losses, reduced rates
of growth and fertility, and high mortality rates in the herd.
Apart from infections with pathogenic trypanosome vivax
which are not encountered in the northern zone, the nature of the
herbage species and the quantities of fodder found in the area
are very important to successful husbandry. Since the herds live on natural pastures, the availability of digestable and nutritious forage is very important for cattle production. The northern
zone, though seasonally stricken by drought, provides natural
pasturage for the cattle. With the installation of irrigation
pumps, this area provides considerable security for animal hus
bandry for the Fulani herdsmen.
Fulani Entrepreneurial and Labor Skills
The fact that labor skills are not evenly distributed ?
spatially makes the availability of skilled labor, especially in a less-developed country such as Nigeria, very signficant in the location of any production system. Though the relative
importance of labor factors in the production system varies
greatly from one economic activity to another, yet the locational
69pull of labor possessing certain skills Is very necessary In
tradtional forms of production. This Is put more vividly when
it Is concluded that :
. . . it Is often the need for particular scarce and spatially localized type of labor possessing certain skills that makes many Industries especially labor sensitive in the modem world. The total value added by the contribution of such workers may not always be quantitlatively large nor may their total impact on costs, but the existence of the enterprise in any form may depend heavily upon their sheer availability (Lloyd and Dicken, 1972, p. 95).
The Fulani herdsmen are the greatest single cattle-owning ethnic group in West Africa. They are found In a number
of scattered clusters from Senegal (their original home) across
the Savannah belt to the Sudan (Hopen, 1958, p. V; U.S.D.A.., 1972, p. 33). Cattle husbandry has always been the dominant
interest of the Fulani people. They are learned in the lore
of cattle raising (Shaw and Colvile, 1950, p. 36). One author
in describing these herdsmen said :
Although the [the Fulani] are sentimentally attached to their livestock, they live off them physically, socially, and morally and if their attitude towards them were not realistic they would long since have disappeared from the map of Afrlcla (Duplre, 1968, p. 337).
As regards skill in cattle raising, the Fulani acquire their lore from their parents. Before children can walk they are brought into contact with calves. At about the age of five,
children are given the task of keeping calves away from domestic supply of grain, and when they are about six years old they tie
up cattle in the evenings so that they may not feed from their dams (Hopen, 1958, p. 24). Knowledge of cattle raising among
70the nomadic Fulani is gained through observation and imitation.
They have learned from long experience how to select succulent grasses for their cattle.
The Fulani herdsmen have a strong contempt for farming or any other kind of occupation. In describing them one author stated that:
They [Fulani] know neither how to tan hides» how to work bone and horn, nor to dig wells. The women make butter but not cheese from the milk of their [cattle].All their technical knowledge directly concerns tending their herds of zebus. This extreme specialization makes them dependent on the craftsmanship of their neighbors - Hausas, Bellah, Tuareg - and European imports (Dupire, 1968, p. 335).
The Fulanis are very confident about their ability in cattle
husbandry (Hopen, 1958, pp. 29-30). Without any scientific re
search the Fulani know when the dry season is approaching and
when to start the southward trek so that arrival may be in good time. One author says:
Prior to moving cattle to another area, one or more members of the family will be sent off in advance over the route to be traversed, to make full enquiries as to whether there are any outbreaks of disease along the proposed route, or in the area into which they wish to move (De St. Croix, 1944, p. 32).
Their knowledge of local breeding from long experience hastaught them many things. The best herds which calve regularly
and produce off-springs with high milking qualities are keptfor building up good strains in the herd. Though bulls aremarketed more than cows, promising bulls are kept for breedingpurposes.
Today the Fulani managerial skills do not appear to be
71the attractive factor in the location of a modern cattle industry
in the northern savannah region. The single all-embracing factor is the absence of Glossina, vectors of typanosomiasis, the prevalence of tsetse fly in Southern Nigeria, that restricts the
development of the cattle industry in the region. However, phy
sical (ecological), as well as social and economic factors have
all played their part in transforming the northern savannah region into the Nigerian cattle producing region. Over the long
term, modern research, a wise use of insecticides, and tsetse fly
clearings may prove that the tsetse species can be eliminated in
the south and animal husbandry practiced in that area.
Capital. Inertia, and Economic Rent
Some form of capital is necessary in the successful oper
ation of any economic activity. Capital then can be defined as:. . . all man-made aids to production, that is, all tools, machinery, equipment, and factory, storage, transportation, and distribution facilities used in producing goods and services and getting them to the ultimate consumer. Capital goods ("tools") differ from consumer goods in that the latter satisfy wants directly, whereas the former do so indirectly by facilitating the production of consumable goods (McConnell,1969, p..22).
There exists a wide variation in capital inputs from one industry to the other. Some industries are labor-intensive, while others (are capital intensive) require large capital investments. In
Nigeria, the pastoral Fulani have little or no capital investment for their cattle husbandry. This is the reason why seasonal mobility is practiced and in many instances a camp may be moved
at about an hour's notice (Hopen, 1958, p. 33). The only capital

72required in the practice of the nomadic husbandry is the livestock set aside by inheritance:
First of all, it is set aside for direct heirs, the sons, who from the time of their birth, gradually receive in pre-inheritance their share of the paternal herd. . . . The master of the herd cares for livestock over which the members of the polygamous family have certain rights of usage or of unalienable ownership during their minority. In view of these multiple obligations one can understand how the portion actually belonging to the master of the herd diminishes as he grows old and his sons set up for themselves (Dupire,1968, p. 337).
Capital involves the application of labor to the pro
cessing of resources. This varies according to the level of technology and organizational practice of the society. The
Fulani herdsmen have wells for watering their herds. Land that
provides pasture is also another asset. These are some of the sources of phenomena that provide geographical inertia. Still,
the single most important factor that accounts for the location
al inertia is the absence of Glossina, vectors of trypanosomiases.
Historically, this environmental factor has been a critical fac
tor explaining the inertia for the Fulani cattle industry.In the Western countries business decision-makers seek
locations where risks are low and net profits high. More recent
ly, the location of the market has been recognized as vitally
important in making decisions for not only the location of in
dustrial and commercial firms but also for public service fac
ilities. This is necessarily so because both the suppliers and customers are at the same place, which is the urban area. In
the industrialized nations land resource is not as crucial as

73skill and organizational management in the location of production. In Nigeria, the location of the Fulani cattle industry can
be seen as a result of the extensive tsetse free land-use patterns
in the north. The location of the market (in this case the con
sumers in the south) plays no role in the location of the north
ern cattle production.
The Dualistlc Nature of the Nigerian Economy Regional dualism is one of the distinguishing character-
sitics of less-developed countries. In Nigeria, regional dualism
is clearly present. A dualistic economy is characterized by
different marginal efficiencies of identical factors in different segments of the economy (kindleberger, 1965, p. 258). There
are diffemt kinds of dualism— religious, social and economic
(Fumivall, 1944, pp. 447-465). Kelly, et al., agree that the
existence of dualism can be argued on the basis of differences in social system (Boeke, 1953), caste or ethnic background
(Fumivall, 1944), production conditions (Eckaus, 1955), demo
graphic behaviors (Higgins, 1956), consumer expenditure and savings behavior (Boeke, 1953), and domestic and foreign sec
tors (Baldwin, 1966). However, in the literature of geography, dualism is most often referred to as regionalism. Summarizing this a geographer said:
Many geographers have used the terminology of classification theory in discussing regional systems and some have recognized that many of the principles of classification are applicable to regions or areal classes (Grigg, 1965, p. 472).
Dualism can be defined as :

74. . . the existence of a sector or sectors in which the actual distribution of capital stock and of complementary factors does not permit the market to be cleared and optimal resource to be effected. Under such conditions of inequality between the proportions in which factors are available and in which they are used, general equilibirum theory becomes invalid and a distribution theory based on an institutional hypothesis must be applied (kanis, 1966, p. 15).
Social scientists have recognized the existence of stub
born persistence of regionalism at all levels of national deve
lopment (Williamson, 1965, p. 3). This pheonomenon of spatial imbalance (spatial economic differential) has been referred to as the "North-South" problem (Higgins, 1968, p. 763). The North-South problem, for example, the Brazilian Northeast, Italian
South (Mezzogiomo) , and the Mexican South, and within many coun
tries is by now well attested (Keeble, 1967, p. 257). This type
of spatial imbalance becomes even more difficult to explain because the variation is not only persistent but increasing in the
less-developed countries (Williamson, 1965, pp. 16, 17). In
Nigeria the situation is well Illustrated when it is stated that:
Before the Federal government split Nigeria into 12 states in 1967, Nigeria consisted of five regions; i.e., the North, the East, the West, the Mid-West, and the federal territory of Lagos. The North is by far the largest and most populated region, though it is also the least developed. The East is the most densely populated region, while the West is the most urbanized and developed one, mainly due to its cocoa exports. The Southern regions are relatively more developed than the North, especially in education, degree of industrialization and available infrastructure facilities. The recent discovery of oil in the East and Mid-West has given these regions a relatively strong economic position, even compared to the Western region (Kahnert, et al-, 1969, pp. 81—82).
Socio-economic dualism can result from the sudden errup—

75tion of twentieth century technology into primitive societieswhich adapt only gradually (Hirschman, 1958, pp. 126-132).
This mingling of advanced and primitive cultures results in a
clash of two cultures which brings about social dualism. In
emphasizing this one author states that;
Social dualism is the clashing of an imported social system with an indigenous social system of another style. Most frequently the imported social system is high capitalism. But it may be socialism or communism just as well, or a blending of them. Nevertheless even in that case it remains advisable to keep the term social dualism because this emphasizes the fact that the essence of social dualism is the clash between an imported and an indigenous social system of divergent character (Boeke, 1953, p. 4).
Economic Dualism
In Nigeria, dualism appears in two sectors: One devotedto peasant agriculture and the other confined to industrialized
operations and included even large-scale agriculture. Dualism is, therefore, more readily explained in its economic and tech
nological terms (Higgins, 1968, p. 232).
Socio-economic dualism has both spatial and temporal di
mensions. The injection of western techniques into Nigeria reveals itself in the dual economy of the country. This dualism
is expressed in a geographical distribution pattern which re
sults in the growth of some localities and regions at the expense of relative stagnation or regression of others. This is in Myrdal*s (1957) term "regional inequality." There are in less- developed countries, for example, in Nigeria, characterized cultural patterns and sectional division of labor based on ethnic

■ 76groups be it nationality, caste, tribe, or even clan (Fumivall,
1944, pp. 446-459). Ethnic diversity definitely affects the
geography and economy of Nigeria. How this operates in Nigeriais well illustrated in the statement that :
The developments [regional dualisms] have led to a considerable degree of geographic and ethnic specialization in export crops and to a much lesser extent in domestic staples. Thus, the Yorubas raise cocoa in the southewest, the Edo and other groups produce rubber in the southern midwest, and the Ibo in the southeast represent the major concentration of oil palm production. In the north, the Hausa and other large groups, such as the Nupe and Kanuri, produce most of the peanuts and cotton. Another important export crop, sesame seed, is grown almost exclusively by the Tiv, who live just north of the former eastern region border. The nomadic Fulani of the north are the primary source of beef (Huth, 1970, p. 161).
In the urban areas, many are engaged in industrial or admin
istrative jobs. Industrial employment is a typical example
of the intrusion of western economic organization into a trad- itional\society. About eighty per cent of the population, accord
ing to the 1963 census, are still engaged in agriculture, the trad
itional sector. Occupations in the various regions are as varied as the ethnic compositions of the country. Akwete is noted
for its weaving industry: the Ijaws of the Niger Delta are renowned fishermen; Ekulu pottery is well known;Ikot Ekpene raffia weaving is very famous; and Ife sculpture is known world-wide.
Effects of a Dualistlc SocietyIt is a well known fact of the economic and geographic
landscape that economic development does not occur evenly over
a nation. Regional growth differentials exist because of differ-

77ences in regional natural resource endowment* levels of educa
tion, health, capital formation, level of technology, and or
ganizational ability. Complete elimination of regional inequalities may be impossible, but their intensities can be reduced
through regional planning and investment. The elimination of
regional inequalities is in many cases at cross-purposes with
overall growth of the (GNP) Gross National Product.
In a dualistic society such as Nigeria, it is common to recognize two divergent sectors— agricultural and industrial.
Though production in both sectors is subject to constant returns
to scale and diminishing marginal rates of substitution, produc
tion in the secondary sector is more capital intensive than in
agriculture (Kelley, et al., 1972, p. 24). .The capital inten
sive sector is the leading sector while the agricultural sector
lags behind. The Fulani cattle industry is a good example of the
lagging sector of the traditional sector. One characteristic of dualism is that the traditional or indigenous (agricultural) sector and the technical, modern or enclave (industrial) sector may correspond to a rural-urban dichotomy.
The peculiar "lag" characteristic of the Nigerian agri
cultural sector is due to its redundant labor (disguised unem
ployment) in the agricultural sector (Lewis, 1954, p.. 141).The contribution of lagricultural labor is zero or very negli
gible to the country's economy. A typical example of this in
Nigeria is the traditional employment in the Fulani cattle in
dustry. The Fulani cattle industry is so labor intensive that

78the marginal productivity of labor, is negligible.
The more dynamic industrial sector comes about largely as a result of foreign investment in capital intensive enterprises. In Nigeria, this is due to the exploration of mineral
resources, as there is no foreign-owned plantation agriculture.
The exploitation of tin on the Jos Plateau during the World War
XI created a relatively prosperous economic island surrounded by
poor or depressed areas. The exploitation of petroleum at Port
Harcourt has created an affluent society for an employed popula
tion amidst a very poor peasantry.
In a dualistic society, the two—factor markets^ can para
lyze rather than stimulate economic development. The high wages in the industrialized sector (e.g., in the petroleum Industry)
attract nearly all skilled and semi-skilled workers while employ
ment in the agricultural sector is discouraged. There is a lack
of innovation in the agricultural (lagging) sector. This has
resulted in inelasticities of supplies of agricultural products (mostly foods). When monetary expansion occurs because of employment in the industrial sector, or because of salary revisions,
the result is an inflation of prices. Savings become impossible
^The two-factor markets here mean that one section of the market is modem or industrialized and makes substantial increases in the per capita incomes in that sector. The traditional sector is lagged behind without making any dent in the problem of poverty in this sector. A greater percentage of the population in the traditional sector are engaged in agriculture. The industralized sector comprises a small part of the population that may be made up of foreigners or the elites.

79because the people have no "common social demand"^ (Fumivall,
1944, p. 447). This is detrimental to the formation of capital
for any entrepreneurial adventure. Easy chance of getting a job
in the industrial sector discourages innovation in the lagging
sector. Savings in a dualistlc society do not accrue because of limited entrepreneurial spirit in the dominant sector. This
results in the dilution of incentives to save, invest, work, and
restrict family size in an undivided family system (Higgins, 1956,
p. 111).
^Here common social demand includes education, hospitals, transportation networks, welfare, and development of other public infrastructure facilities.

CHAPTER III
INTERREGIONAL MOVEMENT
The concentration of population in Southern Nigeria urban centers has led to the development of a demand for perishable
foodstuffs not produced in local urban hinterlands, including
beef from the north. The southern urban centers have developed
a dependence on such distant areas of food production.
In order to provide the necessary food in the south, interregional trade in perishable food developed. The development
of the interregional trade results not only from regional dif
ferences in factor endowments and dualism, but also from the
growth of urban centers with concurrent demand for food. Population growth, and urbanization in the south and the inability of the urban hinterlands to produce and distribute foods have
resulted in protein deficit diets in the South.
In this chapter the emphasis will be on the flows of
beef cattle from the north (production region) to the south
(consumption region). The actual flows of cattle by hoof, truck and rail from the north to the south will be identified. Ways
to remove deficits by changing patterns of transportation and distribution will be considered. The optimal flows obtained by linear programming techniques will be compared with actual flow. Finally, regional
Investments as a sufficient solution to total distribution planning will be suggested.
80

81Removing Deficits Through Improvements In
the Interregional Distribution System
The movement of goods from production points to consumption points helps to maximize the value of the delivered
goods. Due to transportation costs, perishable goods, are
shipped to nearby markets. One difficulty of trying to sell
such foodstuffs in the locality of production is that severe
losses may be incurred by the local producers because of low
Income of the local consumers. In the industrialized nations,
manufacturers market their goods at considerable distances from
the points of production. This is made possible under situations of a highly developed transportation-distribution infrastructure and a workable relationship between supply and demand. Shortages promote sales by competitors or reduce demand by elasticity.
Oversupply leads to price reductions, and higher consumption
which can bring about a slumping of production.
Due to spatial variations in the factor endowments, pro
duction costs vary spatially, even if there is a homogeneous trans
portation network. These differences in production costs and
labor productivity favor low cost regions, leading to a process of regional specialization.
The movement of beef cattle between Northern and Southern
Nigeria can be evaluated in terms of complementary supply and
demand, intervening opportunities, transferability of the goods, and distribution costs. Cattle are transported from Northern
82Nigeria to the Southern Provinces because surplus production is possible only in the north, while most of the demand is in
the south. Traditionally, trade cattle have been delivered to
the southern consumers by driving live animals along historical trails.
Spatial interaction caused by regional complementarities can be prevented or inhibited by trade restrictions or transpor
tation costs. There are no internal trade barriers between the
northern and southern provinces of Nigeria. The major difficulty
has been the lack of efficient low-cost distribution systems.
Pointing this out one author said:
Governments of the old regime were either ignorant of, or indifferent to, the question of distribution.In almost all of the recent plans and programmes, the emphasis has been on increasing production and productivity without any thought being given to the improvement of the distribution of the anticipated increases. And until very recently, no government past or present, bothered about marketing (Anthonio,1966, p. 80).
In the 1970-74 Development Plan, 21.3 per cent of the national expenditure was earmarked for the transportation sector (Federal
Ministry of Information, 1970, p. 179). Surfacing of roads and
extension of railways have been attempted, but these improvements
have had little effect on the patterns of cattle movement from
the production areas because total physical distribution planning
has been neglected in the belief that infrastructural investment in transportation would improve the distribution of beef.
The distribution system in the southern Provinces is also to be blamed for the deficient protein food supplies in the area.

83Concerning the importance of physical distribution in marketingDrucker emphasizes that:
Physically, distribution contributes little, it can only mar, soil, tear, scratch, or otherwise damage or downgrade the product. Economically, however, distribution is the process in which physical properties of matter are converted into economic value ; it brings the customer to the product (Drucker, 1962, p. 103).
Efficient flow from production of concentration points is very
important in the distribution of goods, especially perishable
goods, to local consumers. Physical distribution, though it contributes little if any to the physical characteristics of a pro
duct, creates the attributes of time and place (Drucker, 1962, p. 103). Meeting transaction time requirements and taking ad
vantage of spatial organizations that allow efficient flows of
goods through the distribution network is the ideal arrangement.
Organizing distribution channels in an optimal manner is the concern of modem business planners :
Because physical distribution is fundamentally concerned with the spatial aspects of business operations, it is understandable that primary emphasis is placed upon geographical arrangements of exchange facilities. This preoccupation with georeference is intensified by the array of different markets a typical firm exchange channel must loglstlcally support. However, distance alone is not adequate in planning an exchange channel (Bowersox, et al., 1968, p. 56).
Chronic protein deficiencies in rural Southern Nigeria may be alleviated if the distribution of beef from urban centers were better organized. The concentration effect of the present beef cattle trade is such that the animals are transported from
the north to the southern urban centers without any effort to

84redistribute them to rural consumers* Protein deficiencies in
Nigeria are not caused by a dearth of meat producing animals in
the country. Except for large-scale meat producing countries
such as Australia, New Zealand, Argentina, the United States, and Canada, Nigeria compares favorably in the number of livestock
per capita. Nigeria has 28 cattle per 100 persons as compared to 27 in Western Europe, and 504 in North America (Oyenuga, 1963,
p. 19). Table 4 shows the growth of local production of cattle
in Nigeria. The number of local production shows a rising kill-
out percentage, an estimate of the number of cattle available
for consumption throughout the country. Cattle sales in the
north are increasing. In 1966-67 local sales amounted to 430,109
while in 1970-71 they increased to 595,729, an increase of 38.51
per cent.^ Recorded exports—hy rail and on-the-hoof show declines
because of the civil war in the country from 1967-1970. Trans
portation to the then Eastern Region of Nigeria was impossible
during the war. Rail transport has declined because dealers think that it is cheaper, though not faster, to move either by
truck (lorry) or on-the-hoof. The present trade cattle production in the north is sufficient to provide more adequate beef
supplies to the coastal zone, where cattle production is not feasible, in addition to increasing domestic consumption in the
north (De Young, 1968, p. 49). This statement has been confirmed
^Slaughter figures showed a decline because all stations did not send in their returns as reported by the Nigerian Livestock and Meat Authority.

Table 4Local Production of Trade Cattle 1966-1971
1966/67 1967/68 1968/69 1969/70 1970/71
Recorded Cattle Sales Local 430,109 464,181 588,274 629,680 595.729(North) Imported 253.216 220,684 279,641 279.912 267, ()03*
Slaughtered 546,281 574.263 654,763 622,873 532,516*Recorded Export to the South
Hoof 199.366 193.195 217,115 169.358 188,543
Rail 175.623 94,845 68,400 82,392 106,450Lorry 8,409 17.952 48,771 44,820 49.335
TOTAL 1 ,613,004 1565,120 1356,964 1329.035 1740,176
Source I Nigerian Livestock and Meat Authority, Annual Report. 1970-71. p. 3-♦These were imported from Cameroun, Chad, Dahomey, and Niger.♦♦Returns were incomplete according to The Nigerian Livestock and Meat Authority's accounts.
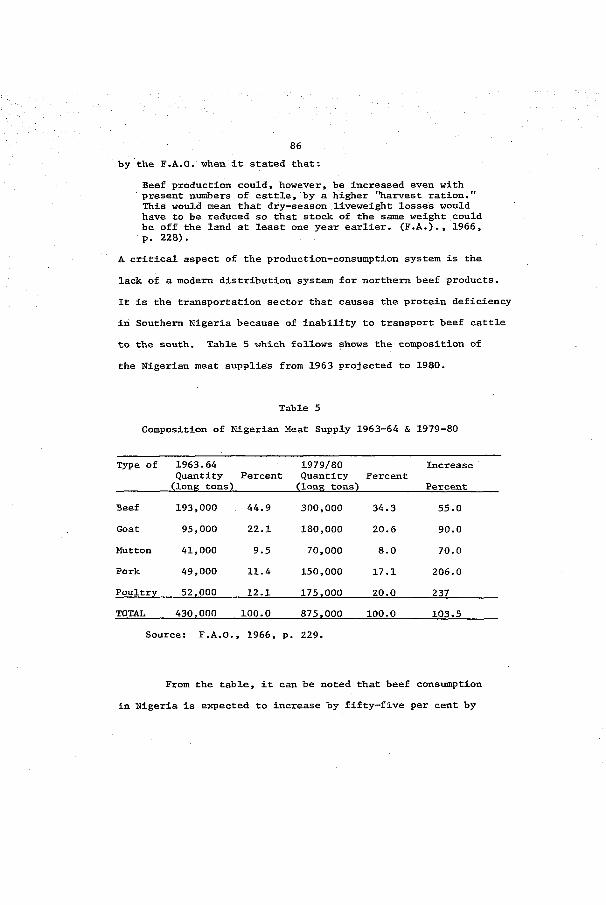
86by the F.A.0. when it stated that;
Beef production could, however, be increased even with present numbers of cattle, by a higher "harvest ration,"This would mean that dry—season liveweight losses would have to be reduced so that stock of the same weight could be off the land at least one year earlier. (F.A.)., 1966, p. 228).
A critical aspect of the production—consumption system is the
lack of a modern distribution system for northern beef products.
It is the transportation sector that causes the protein deficiency in Southern Nigeria because of inability to transport beef cattle
to the south. Table 5 which follows shows the composition of
the Nigerian meat supplies from 1963 projected to 1980.
Table 5
Composition of Nigerian Meat Supply 1963—64 & 1979—80
Type of 1963.64 Quantity (long tons)
Percent1979/80 Quantity (long tons)
PercentIncrease
PercentBeef 193,000 44.9 300,000 34.3 55.0Goat 95,000 22.1 180,000 20.6 90.0Mutton 41,000 9.5 70,000 8.0 70.0Pork 49,000 11.4 150,000 17.1 206.0Poultry 52.000 12.1 175,000 20.0 237TOTAL 430.000 100.0 875,000 100.0 103.5
Source: F.A.O., 1966, p. 229.
From the table, it can be noted that beef consumption in Nigeria is expected to increase by fifty-five per cent by

871979-80. The increase in beef consumption will need the trans
portation of more cattle from the north to the south. Other types of meat were estimated for an increase in production due
to increasing population, urbanization, and rise of Incomes in the Southern Provinces.
The supply of mutton, poultry, pork and goat meat that
comes from the Southern Provinces is very small because of the
attack of tsetse flies and other epizootic diseases, such as
rinderpest and contagious bovine pleuro-pneumonia. The difficulty with stock (goat, pig, sheep and poultry) raising in the
Southern Provinces has been well illustrated with a report from
Obudu Cattle Ranch in Ogoja Province in which it is reported that:For instance the severe harmattan ushers in acute wilting which renders the grazing scanty and inadequate unless supplemented with some silage.. . . the effect of solar radiation on animals with unpigmented skins especially after intake of leguminous feed leads to hypersensitivity disorders and skin cancers which leaves openings for fungi and other skin infections to get established and deal the death blows in the wet months ahead.Invariably, the exotic breeds form the category most affected by this condition. The wet months which are characterized by high humidity precip- tate a syndrome of physiological disturbances which the lush innutritions grazing due to seasonality leaching of such nutritients predisposes to rapid fermentation causing bloat and metabolic disorders. This was acutally the condition noticed in the herds which explains why the Ranch can never progress with the present technological quackery which has no solutions to its problems. . . .Another note was sounded against sheep and goat breeding on the Ranch due to endemic infection of the soil with claustridia group of anaerobic organisms introduced into the Ranch when un— vaccinated. North Chevoit sheep were imported at the commencement of the Ranch, and were all

88wiped out by the end of 1 9 6 5 .2
Livestock raising in the Southern Provinces to meet increased demand for meat can now be ruled out because of the unsurmount—
able difficulties outlined above. The immediate solution to the
protein déficiences in the Southern Provinces is the importation
of beef cattle from the Northern Provinces.
Beef cattle production in the north can meet the increased
demand for meat in the south. Presently, the government is taking serious steps aimed at improving as well as increasing cattle
production in the Northern Provinces. For example, there have
been reorganizations and expansions of the supplementary feeding schemes to ensure that all cattle owners have access to the highly subsidized (85%) concentrate feeds for their cattle, and these
schemes have already increased cattle production in the north
(Ministry of Agric. & Nat. Resources, 1974, p. 24). This pro
duction increase has been markedly noticed in Kano where the
local trade cattle production of 111,192 in 1973 has increased to 160,163 in 1974 (Veterinary Division, 1974, p. 6). This was an
increase of 44.04 per cent over the previous year’s production.
Other plans have also been made to increase cattle production in the north.
More water supply will be provided by drilling artesian wells and constructing dams in semi-arid areas and grazing reserves will be established where the nomads will be en-
^The information was contained in a letter communication OCR/5/2/103 dated 3rd March, 1975, with A. 0. Ntia, the assistant manager of Obudu Cattle Ranch in Ogoja.

89couraged to settle and practice better animal husbandry and mixed farming. Extension work will be directed towards pasture improvements, fodder conservation and feeding of protein rich concentrates such as cotton seed and groundnut—cake. Improved animals from Government Livestock Breeding and Inç>rovement Centers will be distributed to stock-owners (Fed. Min. of Information, 1970,p. 121).
Table 6
Regional Annual Growth Rates of Population, Cattle Production, and Beef Consumption, 1973 & 1974
RegionsPercentage of Population Growth Rate
Percentage of Cattle Production Growth Rate
Percentage of Beef Consumption Growth Rate
Eastern 6.1 1.0 15.09Federal Territory 5.5 -- 9.01Midwest 4.7 1.0 11.81
Northern 2.7 19.27 5.12
Western 7.0 1.0 16.19TOTAL 26.0 22.27 56.22
Sources: (1) Caldwell and Okonjo, 1968.(2) Nigerian Livestock and Meat Authority, 1974.(3) Food and Agricultural Organization, 1966.(4) Ministry of Ec. Development and Reconstruction,
Benin City, 1970.
It can be noted from the table above that the annual rate of
cattle production in the Southern Provinces is very small (about one
per cent for-each.region) , while 'the consumption rates are very'high. In the Northern Region, production rate is high and consumption
rate grows at 5.12;,per cent; This-means that there are enough heefcattle to take care of the increased consumption demands in the

90Southern Provinces. The problem is to modernize transportation
and distribution channels. Though the kill ratio or extraction
rate^ of the Northern cattle is small, there is always surpluscattle for export to the south.
There is, therefore, a surplus of 52,000 cattle a year available for sale from each 1,000,000 of the cattle population; or a rate, of output of from the total herd of 5.2% annually (Shaw and Colvile, 1950, p. 63).
The Food and Agricultural Organization (1966, p. 223) has estimated an extraction rate of 10.7 per cent for the northern herds. On the other hand, it (F.A.O.) concluded that if the government estimated cattle population is correct, the off-take
would be 18.3 per cent. The author in this study has calculated
an off-take rate of 19.27 per cent. Only seven per cent of the extraction rate is marketed in the Southern Provinces (Mittendorf
and Wilson, 1961, p. 101). A higher percentage of this can be
exported to the Southern Provinces if efforts are made by both
private and government sectors to improve cattle transportation to the south. Mere transportation is not enough- The beef cattle must be redistributed
from the concentration points in the Southern urban centers to rural consumers. The importance of distribution of products has been
stressed in these words :Perhaps the single most important lesson the generation-old G. M. approach still has to teach us is that distribution policy and distribution
^Extraction rate is the percentage of cattle population marketed annually. In Nigeria, the extraction rate is about 9.2 per cent as compared with twenty eight per cent in the United Kingdom and forty per cent in the United States (Oyenuga, 1963, p. 21).
91system must take into account the entire flow of the product regardless of lines of ownership and legal responsibility (Drecker, 1962, p. 265).
The possible high extraction rate of the Nigerian cattle
has no meaning unless a reasonable off-take number is transported
and distributed in the markets in the Southern Provinces. It has
been concluded that the function of transfer constitutes the mechanics of collection and dispersement and that goods must be
physically transported in order to achieve temporal and physical
value (Bowersox, 1969, p. 99).
Evaluation of the Present Transportation ModesThe movement of cattle from Northern Nigeria to the south
by the Fulani had been going on before the arrival of Europeans
in West Africa in the early seventeenth century. However, the
cattlemen never penetrated into the coastal south until the arrival of the British colonial government and the maintenance
of settled conditions that Michael Gleaves calls the "Pax Britannica"
(Cleaves, 1965, p. 131). During the pre-colonial days, the transhumance movements were mostly connected with seasonal grazing
in the better watered portions of the southern savannah around Tiv and Xlorin. Today, cattle movements into the southernmost parts of the country are mostly connected with trade; but there
are some cattle led into the south for pasturing during the dry
season.The Fulani cattlemen have never understood the'demands
of urban cattle markets. Often, they graze their cattle too
far away from market centers (F.A.O., 1966, p. 217). For this

92
reason. Itinerant cattle traders act in a liason role between
the cattlemen and the traders known as "middlemen•" The activities
of these itinerants have been condemned when it is concluded that:
The entire notion of loosely aligned middlemen seems to condemn distribution channels as being inherently endowed with duplication, waste, and inefficinecy. The social justification for intermediaries has always appeared in doubt leading to the general belief that one road to increasing marketing efficiency depended on elimination of middlemen. Despite this condemnation, specialized middlemen have survived and increased in importance CBowersox, 1969, p. 95).
The itinerants move from one cattleman to another in order to
buy cattle from herdsmen who want to sell their cattle for
cash which is needed^to pay for pressing items such as jangali
(cattle tax), salt for the cattle, and clothes for the family.
The number of cattle sold by the herdsman depends upon the price
and the need for immediate cash that forces him to offer hiscattle for sale. In other words, the Fulani sell their cattle
only when cash is needed and not in an orderly sequence of anykind.
The cattle brought by the itinerant traders are taken to
local periodic markets in the north where they are in turn bought by middlemen. The middlemen in turn sell their cattle to Hausa
dealers at such central markets as Bauchi, Gombe, Jos, Kano,
Katsina, Sokoto, and Zaria, etc. These dealers hire the cattle trailed to the Southern Provinces to be sold to local agents or
butchers. A neglible number of Yoruba and Ibo dealers also buy cattle directly from the middlemen and have them herded to the
south.
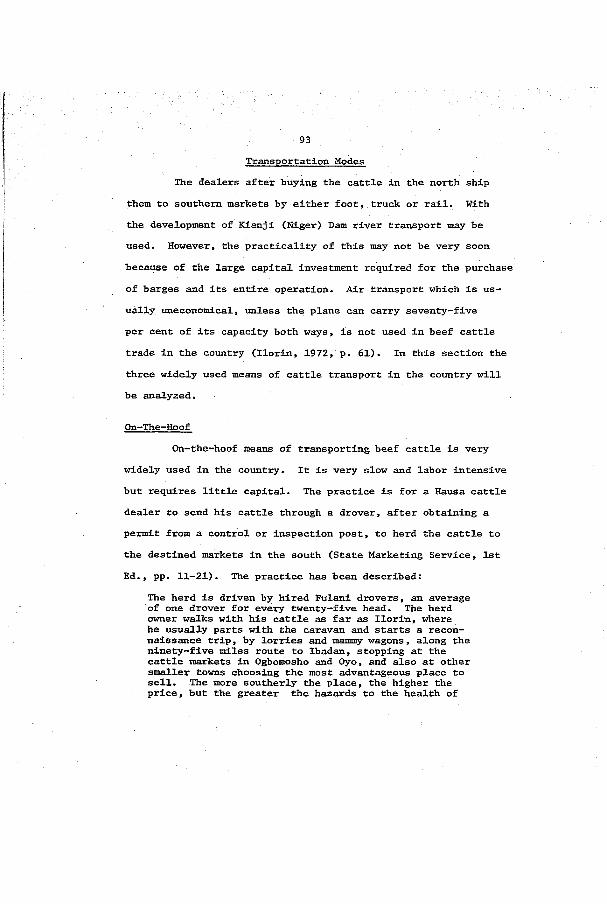
93Transportation Modes
The dealers after buying the cattle in the north ship
them to southern markets by either foot, truck or rail. With
the development of Kianj i (Niger) Dam river transport may be used. However, the practicality of this may not be very soon
because of the large capital investment required for the purchase
of barges and its entire operation. Air transport which is us
ually uneconomical, unless the plane can carry seventy-five
per cent of its capacity both ways, is not used in beef cattle
trade in the country (Ilorin, 1972, p. 61). In this section the
three widely used means of cattle transport in the country will
be analyzed.
On-The-Hoof
On-the-hoof means of transporting beef cattle is very
widely used in the country. It is very slow and labor intensivebut requires little capital. The practice is for a Hausa cattle
dealer to send his cattle through a drover, after obtaining apermit from a control or inspection post, to herd the cattle to
the destined markets in the south (State Marketing Service, 1st
Ed., pp. 11—21). The practice has been described:
The herd is driven by hired Fulani drovers, an average of one drover for every twenty-five head. The herd owner walks with his cattle as far as Ilorin, where he usually parts with the caravan and starts a reconnaissance trip, by lorries and mammy wagons, along the ninety-five miles route to Ibadan, stopping at the cattle markets in Ogbomosho and Oyo, and also at other smaller towns choosing the most advantageous place to sell. The more southerly the place, the higher the price, but the greater the hazards to the health of

94
the cattle and the longer the period in which the capital is engaged (Cohen, 1965, p. 9).
Table 7 shows the number of cattle moved by hoof in 1973 and 1974 from the north. It can be noted from the table that movement by
hoof accounted for about sixty per cent of all recorded cattle
transported from the north to the south in 1973 and 53.82 per
cent in 1974. The decrease in 1974 might have been due to in
crease use of the truck. Table 8 shows the origins and destinations of the shipments. The greatest receiver was Lagos whose
supplies originated at Kano. Benin City was next with supplies
from Adamawa Province. Abeokuta had its supplied from Ilorin.
One disadvantage of the trek is the complete loss of fat in the cattle. The nutritional quality of the beef is very much deteriorated before the cattle arrive in the southern markets.
The trek is only possible with cattle that are 7-9 years old.^
This helps to limit thé harvest ratio of the Fulani cattle avail
able for shipment to the south. However, it can be seen from Figure 15 (the actual flow of cattle by hoof) that movement by
hoof is the only means that delivers cattle to rural consumers.
All other means concentrate on cattle movement to urban centers.
^Only cattle that are 7-9 years old are able to undertake the long and tedious journey from North to South (sometimes nearly 1,000 miles).
^During overnight stops or stops to allow the cattle to drink or graze a little the cattle that are sick or unable to continue the journey are sold to local butchers. In this way villages along the cattle trek route obtain irregular and meager supply of beef from drovers. On-the-hoof also herds cattle towards urban centers except for emergency sales en route.

95TABLE 7
Cattle shipment by Hoof 1973 and 1974. 1973 1974
Loading PointsNo.
ShippedPercentage* of shipment
No. Shipped
Percentage* of shipment
1. Adamawa 20,891 100 26,522 99.552. Bauchi 2,917 27.40 2,287 16.22
3. Benue 19,776 99.76 22,553 99.41
4. Bo m u 60,744 59.61 8,137 9.45
5. Ilorin 37,389 97.63 48,760 99.83
6. Kabba 3,322 100.0 5,724 100.0
7. Kano 128,017 59.97 96,077 51.01
8. KaCslna 23,956 50.06 21,224 43.37
9. Niger 3,121 29.58 19,109 65.12
10. Plateau 10,457 99.11 20,622 94.47
11. Sardauna 35,251 100.0 22,093 97.58
12. Sokoto 26,396 92.53 100,527 90.15
13. Zarla 4.549 39.00 3,531 31.75
376,786 59.57 397,166 53.82
Source; Nigerian Livestock and Meat Authority, Marketing Information Service; Quarterly Livestock Market Survey, 1973 and 1974.
*The percentages are based on the total number of beef cattle shipped at the station by hoof, truck, and rail for the year.

96TABLE 8
Shipped from Shipped to
1. Adamawa 26,522 1. Benin City 23,0282. Calabar 823. Ogoja 9944. Owerri 2,418
2. Bauchi 2 , 2 87 1. Oyo 2,2873. Benue 22,553 1. Abakabikl 10,055
2. Enugu 9,4414. Bomu 8,137 1. S. Oyo 2,225
2. Port Harcourt 5,9115. Ilorin 48,760 1. Abeokuta 20,030
2. Ibadan 18,6293. Ondo 10,101
6. Kabba 5,760 1. Abeokuta 4,6022. N. Oyo 1,122
7. Kano 96,077 1. Lagos 96,0778. Katsina 96,077 1. Ibadan 14,366
2. Umuahia 4,8583. Delta 2,000
9. Niger 19,109 1. S. Oyo 5,7742. Umuahia 13,335
10. Plateau 20,622 1. Calabar 6,2542. Enugu 8,2153. Owerri 6,153
11. Sardauna 22,093 1. Calabar 2,0932. Onltsha 20,000
12. Sokoto 100,527 1. Ibadan 34,2072. Lagos 66,320
13. Zarla 3,531 1. Benin 2,1642. Enugu 1,367
Sources: (1) Nigerian Livestock and Meat Authority(2) State Ministries of Economic Development
and Reconstruction.

ACTUAL CATTLE M O V E M E N T BY HOOF, 1974SOKOTO
SINA >
MAIOUOUR)
S/""
NIOEH I KONTAOOHA GOMBE
iLon#]
ADANAWA
I NIGERIA.•■'I
I i/y-'j .
LASOS X \ C ITYS ---S
SARDAUNA ,
LEGEHS 1,000 - 10,000
11,000 - 20,000
21.000 - 30,00031.000 - 40,00060.000 - 80,000
'"'Vi■j OGOJA y ylAOAKALKI
BOUNDARIES: International .. DELTA
WARRII I SOURCES I (1) Nigerian
livestock and Meat Authority (2) StateNaîiraf RLource^ " “ “-«“O
Floure^
S i — — : \ProvlncW ....... V u
04 ’.DEGEMA

98Rail transport cannot deliver cattle to many provinces in the
Midwest and Southeastern States because no railroads connect towns in these states.
Truck Transportation
Transportation by lorry (truck) is a modem way of shipp
ing the cattle. It takes three to four days to ship cattle by truck from Kano to Lagos, a distance of about 712 miles. The difficulty with truck shipment is that both roads and trucks are
badly maintained and there are no maintenance facilities on the way. Many hours are lost by drivers who must repair their own vehicles. Some of the roads are unimproved and many roads are
closed to traffic for several hours after rain begins to fall
(U.S.D.A.1972, p. 7). There are accidents on the road due to
either lack of sleep or rest by drivers.
From Table 9 it can be observed that shipment of cattle
by truck is increasing. It increased from 24.47 per cent in 1973 to about 31 per cent in 1974. Figure 9 shows the actual
flows of cattle from the trading points in the north to the south
in 1974. It can be seen from the flows that the trucking industry delivers cattle only to the urban areas, while the rural consumers are left without any regular delivers. This reveals one
major cause of protein deficits in the rural areas. Table 10 shows the origins and destinations of truck shipments in 1974.Lagos and Ibadan received the greatest shipment from Kano. BeninCity had the next largest shipment from Bomu (see the table for details) .

. 99TABLE .9
Cattle Shipment by Truck, 1973 and 1974
Loading Points
1973No.
Shipped, 1974-
Percentage* No. of Shipment ' Shipped
Percentage*Shipped
1. Adamawa -- -- 121 0.452. Bauchi 2,268 21.30 5,675 40.26
3. Benue 47 0.24 134 0.594. Bornu 41,160 40.39 78,010 ■ 90.555. Ilorin 908 2.37 81 0.176. Kano 75,969 35.59 89,204 47.36
7. Katsina 23,895 49.94 27,709 56.638. Niger 7,431 70.42 10,234 34.889. Plateau 94 0.89 1,208 5.53
10. Sardauna -- -- 547 2.4211. Sokoto 2,132 7.47 10,966 9.8512. Zaria 880 7.57 4.654 41.86
154,737 24.47% 228,543 30.96%Sources : Nigerian Livestock and Meat Authority, Marketing
Information Service: Quarterly Livestock MarketSurvey. 1973 and 1974.
*The percentage are based on the total number of beef cattle shipped from the station by the three different modes (hoof, truck and rail).
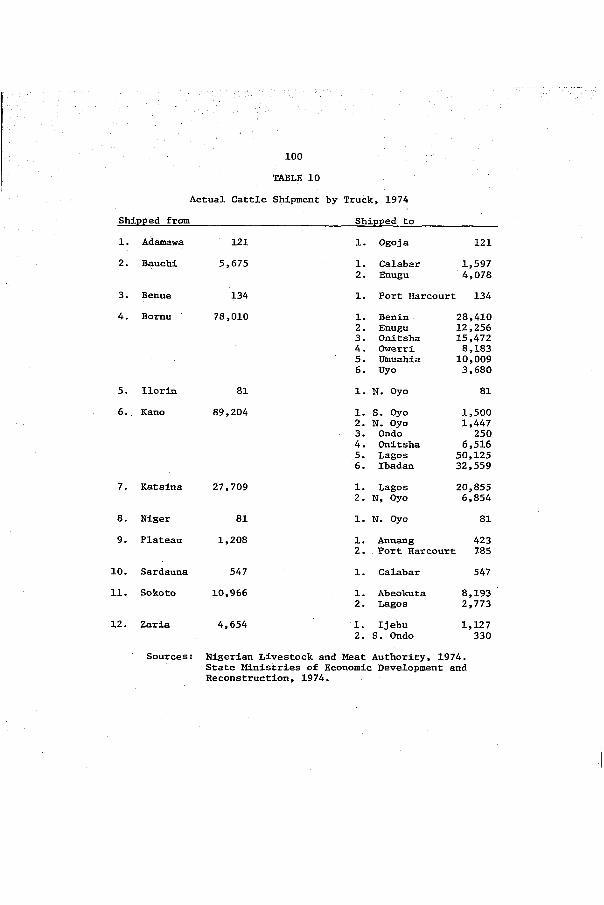
100TABLE 10
Actual Cattle Shipment by Truck, 1974Shipped from Shipped to
1. Adamawa 121 1. Ogoja 1212. Bauchi 5,675 1. Calabar
2. Enugu1,5974,078
3. Benue 134 1. Port Harcourt 1344. Bomu 78,010 1. Benin
2. Enugu3. Onitsha4. Owerri5. Umuahia6. Uyo
28,41012,25615,4728,18310,0093,680
5. Ilorin 81 1. N. Oyo 816. Kano 89,204 1. S. Oyo
2. N. Oyo3. Ondo4. Onitsha5. Lagos6. Ibadan
1,5001,447
2506,516
50,12532,559
7. Katsina 27,709 1. Lagos2. N, Oyo
20,8556,854
8. Niger 81 1. N. Oyo 819. Plateau 1,208 1. Annang 423
2. Port Harcourt 78510. Sardauna 547 1. Calabar 54711. Sokoto 10,966 1. Abeokuta
2. Lagos8,1932,773
12. Zaria 4,654 1. Ij ebu2. S. Ondo
1,127330
Sources : Nigerian Livestock and Meat Authority, 1974.State Ministries of Economic Development and Reconstruction, 1974.

A C T U A L CATTLE M O V E M E N T BY TRUCK, Ï 9 7 4
SOKOTO
BOKNU MAIDUGURI
QZARIA
ZARIA BAUCHIOOMBE
""'r N I G E R I ArI kOANkWAPLATEAU
I "4 " l# 0 0 0 * “ S » 0 0 0
[ / -A--- 6,000-10,000
....
KABBA11,0 0 0 - 20,000
Bl,000-30,000AIÇ0KUTA
\ ‘. r
BENINIKEJA
LAGOS
'" * - v ^ /-aP ^ ttsha y, / a o a k a £ ik i / SOURCES: (1) Nigerian Livestock and Heat Authority
(2) Field Data(3) State Ministries of
Economic DevelopmentBOUmARlES Inlcrnationol —— R cgionol P rovincia l
0 90 100Mil r.s v c ~ ~ .% i.? 'j!n n 3
A , 1)1 U.MA
; M g u ro 9

— 102 During the time of the cattle travel from the production
points in the north to the south, the cattle are given neither enough food nor water. They stand on their feet throughout the
journey. The rough trip causes severe bruises to animals enroute (Ilori, 1972, p. 59).
Rail Transport
This mode is employed in the cattle trade, but its use
in Nigeria has definite shortcomings. The locomotives are de
signed for a maximum speed of 60 m.p.h. (Nigerail, 1973, p. 1).
The speed is quite slow and it takes about three days to travel from the north to the south. One authority attributes the dif
ficulty facing the railroad in Nigeria to inability of obtaining
additional stock, the old age of the equipment, and a very rapid
program of Nigerianization (Hance, 1964, p. 190). Table 11 gives the number of cattle moved by rail from northern rail points to
the south in 1973 and 1974. . In 1973, train carried about 16 per
cent of the cattle shipped (by hoof, truck, and train) to the
south, but in 1974 it carried only 15.22 per cent. Table 12
illustrates this, _
The rise in the number of automobiles and buses made
possible by consumer credit has deprived the Nigerian Railway of most of its short passenger hauls. In any case, it is un
economical for a railroad to be engaged in short distance freight. The Nigerian Railway, which is a statutory public corporation, can hardly compete with the private truck owner in the country
whose aim is to make as much profit as possible from the daily
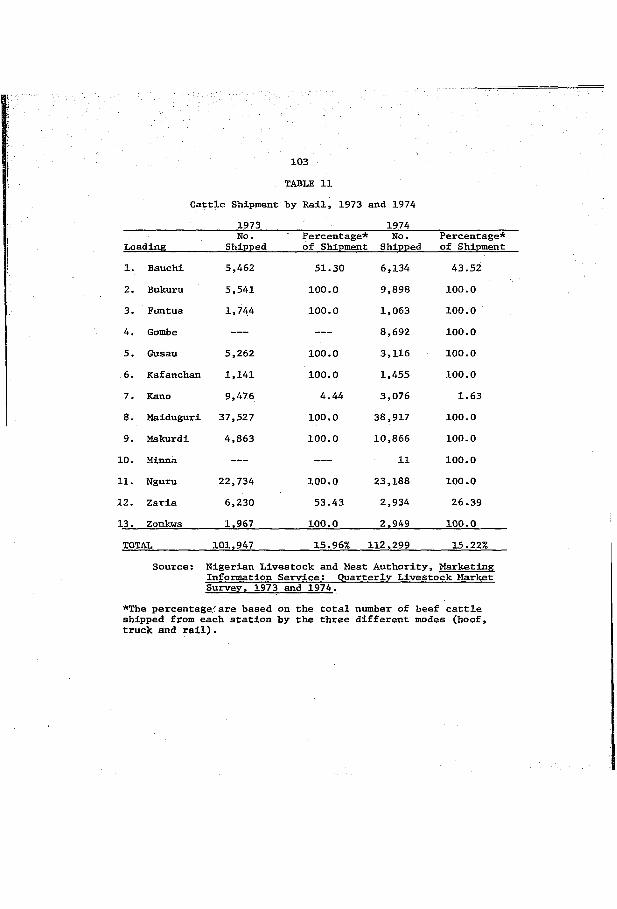
103TABLE 11
Cattle Shipment by Rail, 1973 and 1974 ________ 1973 1974
LoadingNo.
ShippedPercentage* of Shipment
No. Shipped
Percentage* of Shipment
1. Bauchi
2. Bukuru3. Funtua
4. Gombe
5. Gusau
6. Kafanchan
7. Kano
8. Maiduguri9. Makurdi
10. Minna
11. Nguru
12. Zaria13. Zonkwa
5,462
5,541
1,744
5,262
1,141
9.476
37,527
4,863
22,734
6,230
1.967
51.30
100.0100.0
100.0100.04.44
100.0100.0
100.053.43
100.0
6,134
9,898
1,0638,692
3,116
1,4553,076
38,917
10,86611
23,188
2,934
2.949
43.52
100.0100.0100.0100.0100.0
1.63100.0100.0100.0100.026.39100.0
TOTAL 101.947 15.96% 112.299 15.22%
Source; Nigerian Livestock and Meat Authority, Marketing Information Service: Quarterly Livestock MarketSurvey. 1973 and 1974.
*The percentage.;'are based on the total number of beef cattle shipped from each station by the three different modes (hoof, truck and rail).

104
TABLE 12Actual Cattle Shipment by Train, 1974
Shipped from1. Bauchi 6,134
2. Bukuru 9,898
3. Funtua 1,063
4. Gombe 8,6925. Gusau 3,1166. Kafanchan 1,4557. Kano 3,076
Shipped to
8. Maiduguri
9. Makurdi
10. Minna11. Nguru
IbadanLagos
2,934
13. Zonkwa 2,949
1. Abeokuta 5,4722. Enugu 4263. Umuahia 2361. Ibadan 9,898
1. Oshogbo 752. Port Harcourt 988
1. Enugu 8,692
1. Lagos 3,116
1. Port Harcourt 1,4551. Aba 1,0412. Ibadan 2,035
6,67432,173
Vba 1,377ùnugu 4,020ort Harcourt 5,469
112,075
21.1131. Port Harcourt 2,934
1. Oshogbo 2,949Nigerian Livestock and Meat AuthorityState Ministries of Economic Development andReconstruction.

105operation of his truck (Barbour, 1967, p. 27). The govemseat
statutory corporation has no need to strive for profits. A
glance over the Nigerian railroad schedule shows that passenger
trains do not leave any station daily. For exacple, a train departs from Kano on Mondays, Wednesdays, and Fridays, and at
Bukuru, a train is available once a week (Nigerian Railway Cor
poration Time Table, 1971). Figure 10 shows the act; al flew cf
trade cattle by rail from the north to the south. It can be noted from the figure that many provinces such as, Ahakallka, Annang, Benin, Calabar, Degema, Delta, Ijebu, Ogoja, Ondo, Onitsha.
Uyo, and Yenogoa are not connected by railroad. These areas rely
on either foot or truck for their sporadic supply of beef cattle.
Table 12 shows the delivery of cattle to southern markets. The largest importer was Lagos. It received 32,173 from Maldngnrl
and 3,116 from Gusau. Ibadan came second with 9,89S from Suknm
and 6,674 from Maiduguri.
Present Regional Interaction Patterns The present shipment of beef cattle froa northern Slgcrla
to the southern provinces by hoof, truck, and train has sosae
spatial patterns. Certain areas depend on certain nodes. For example, figure 8 shows that movement by hoof originates mostly from the northwest and the north central parts of the country.
Shipments from these areas go to the western provinces the Federal capital of Lagos. A limited amount of shipment goes to the eastern provinces. The spatial pattern of the cattle
movement by foot can be accounted for historically. Cattle


104
TABLE 12Actual Cattle Shipment by Train, 1974
Shipped from Shipped to
1. Bauchi
2. Bukuru
6,134
9,898
3. Funtua 1,063
4. Gombe 8,692
5. Gusau 3,116
6. Kafanchan 1,455
7. Kano 3,076
8. Maiduguri 38,917
9. Makurdi 10,866
10. Minna 11
11. Nguru 23,188
12. Zaria 2,934
13. Zonkwa 2,949
1. Abeokuta 5,4722. Enugu 4263. Umuahia 236
1. Ibadan 9,898
1. Oshogbo 752. Port Harcourt 988
1. Enugu 8,692
1. Lagos 3,116
1. Port Harcourt 1,455
1. Aba 1,0412. Ibadan 2,035
1. Ibadan 6,6742. Lagos 32,173
1. Aba 1,3772. Enugu 4,0203. Port Harcourt 5,469
1. Oshogbo 11
1. Ibadan 2,0752. Umuahia 21,113
1. Port Harcourt 2,934
1. Oshogbo 2,949
Sources: Nigerian Livestock and Meat AuthorityState Ministries■o£ Economic Development and Reconstruction.

105operation of his truck (Barbour, 1967, p. 27), The government
statutory corporation has no need to strive for profits. A
glance over the Nigerian railroad schedule shows that passenger
trains do not leave any station daily. For example, a train departs from Kano on Mondays, Wednesdays, and Fridays, and at
Bukuru, a train is available once a week (Nigerian Railway Cor
poration Time Table, 1971). Figure 10 shows the actual flow of trade cattle by rail from the north to the south. It can be
noted from the figure that many provinces such as, Abakalika, Annang, Benin, Calabar, Degema, Delta, Ijebu, Ogoja, Ondo, Onitsha,
Uyo, and Yenogoa are not connected by railroad. These areas rely on either foot or truck for their sporadic supply of beef cattle.
Table 12 shows the delivery of cattle to southern markets. The
largest importer was Lagos. It received 32,173 from Maiduguri and 3,116 from Gusau. Ibadan came second with 9,898 from Bukuru
and 6,674 from Maiduguri.
Present Regional Interaction Patterns The present shipment of beef cattle from northern Nigeria
to the southern provinces by hoof, truck, and train has some
spatial patterns. Certain areas depend on certain modes. For example, figure 8 shows that movement by hoof originates mostly
from the northwest and the north central parts of the country. Shipments from these areas go to the western provinces and the Federal capital of Lagos. A limited amount of shipment goes
to the eastern provinces. The spatial pattern of the cattle
movement by foot can be accounted for historically. Cattle

ACTUAL CATTLE M O V E M E N T BY TRAIN, 1974SOKOTO
■ KATSINAMAIDUSUKI
FUNTUA'
t ILORIN / ZONKWA
osHooaoBENUE
makurdi
IJEDU BENIN
OGOJAlAp'AKALIK^J ‘
Xr'9' UYO ;'^naco;i'',degema'' '
ADANAWA- \ )T " / N I G E R I A
LAGOS
BOUNDARIES:
; LEGEND
/ 1,000 - 5,0006,000 - 10,009
11,000A 20,000
« — 21,000- 30,000
inllet°K “
SOURCES) (i) Nigeria Livestock and Meat Authority (2) State Ministries of Natural Resources
FIGURE 10
o0\

107trails have for long been cleared and demarcated in those dir
ections (Kwara State, 1972, p. 1).
Cattle movement by truck originates from the northeast
and north central parts of the country. Shipments from these
areas (Kano, Katsina and Zaria provinces) go to the west while
shipments from Bauchi and Bomu provinces go to the eastern and midwestem provinces. There are some shipments from Niger province to the east and midwest as well. The pattern created by
truck shipment in 1974 is illustrated in figure 9. The flow patterns created by truck may be attributed to the orientation
of the Nigerian highway system. Figure 11 which follows shows the road and railroad network systmes in the country. It can be seen from this figure that the roads have a north-south orien
tation because they were designed during the colonial government
to serve in carrying goods to the sea ports. The orientation
of the highway networks also determine the spatial pattern of all truck shipments. The present domicile of truck owners creates
the spatial patterns of truck movements. Drivers shipping goods
from the north deliver the goods to markets that are near truck owners^residence. This informs the private truck owners of the
arrival and departure of their trucks.It can be noted from figure 10 that cattle shipment by
train originates mostly from the northeast. There are small
shipments from the north central provinces (Bauchi, Kano, Katsina,
Niger, and Plateau) and Sokoto in the northwest. The delivery of these shipments produce two market regions in the south.
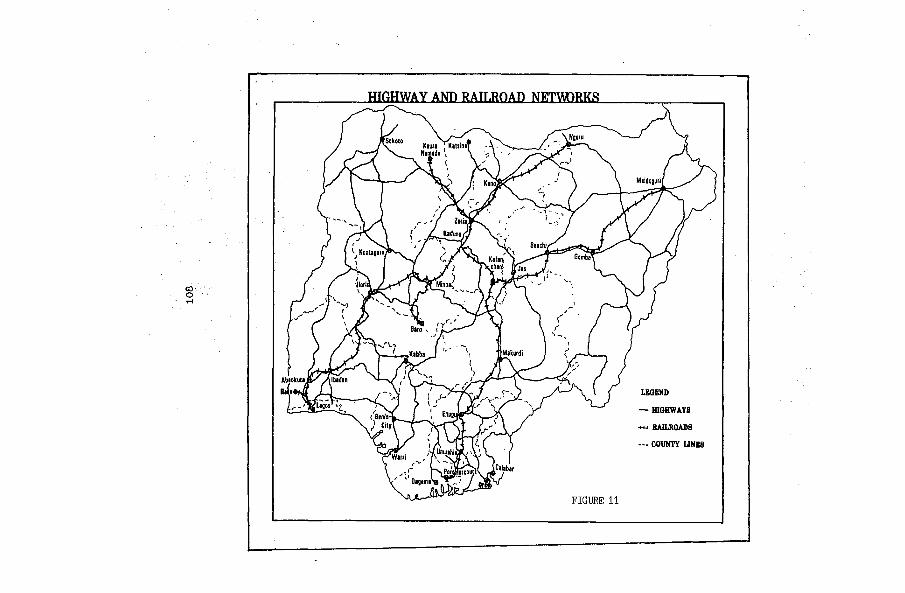
COo
HIGHWAY AND RAILROAD NETWORKS
NflUfU[SokotoKitira I Kaliina]
Nimoda \
Miidugurij
Bauchi/Gomb?Kafanjylnnl Ifjo,
Biro
[Mikurdi.Kibba
Abiokuta
Ba(a»f>Z[Ibadan
LEGEND
[la g o i'mOHWAYS
-4-w RAILROADS
- - COUNTY UNB8MlÀnuihijWarn
Dagama'
FIGURE 11

109This market region in the east is made up of Enugu, Owerri,
Port Harcourt and Umuahia provinces. In the west it includes
Abebkuta, Ibadan, Federal Capital of Lagos, and Oyo. The re
strictive two market regions is caused by lack of railroad
connections in the other provinces. This restrictive nature of
the train delivery market region suggests that the government should build new railroads to give access as well as quicken
beef cattle delivery from the north.
Figure 12 shows graphically the percentages of beef cattle exported from each area in the north for the 1973 market year. One hundred per cent of the cattle exported from Adamawa,
Kabba, and Sardauna Provinces went by hoof. Very high percent
ages were also moved at Benue (99.76%), Ilorin (97.63%), Plateau
(99.11%), and Sokoto (92.53%) Provinces. Rail loading points are remote in these areas. Here the cattle dealers hire Fulani
drovers to herd their cattle to the south. Where there are more cattle at the railroad station than the train can ship in a short time the cattle dealers hire drovers to herd their cattle to the
south. Such a situation is common at Zaria where the train (in 1973) carried 53.43 per cent, on-the-hoof thirty nine per cent
and truck 7.57 per cent. Train movement was important at Bukuru,
Funtua, Gusau, Kafanchan, Maiduguri, Makurdi, Nguru and Zonkwa, where it carried one hundred per cent of all the cattle exported
from each of the areas. However, the number of cattle carried by train is small compared to those moved by foot and truck. In 1973 drovers carried 59.57 per cent of all the cattle shipped
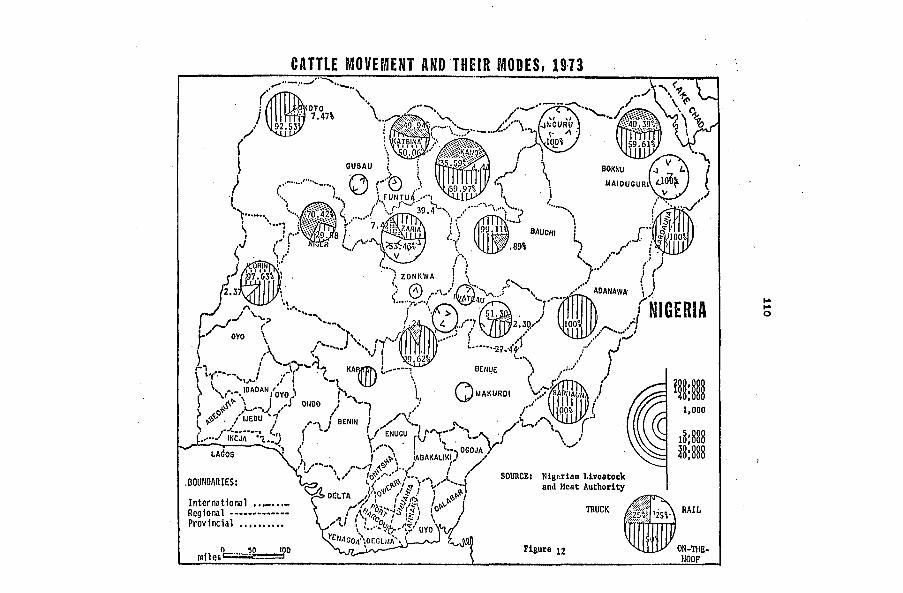
CATTLE M O V E M E N T AND THEIR MODES, 1973
D2.53
0U8AU
/ 4 * ’0 r © >iFUNTut---,
37.634 Z O N K W A
; V I '“ I VJ. \,-.-J3A0AN,/„ „ .JL,,J CMDO /
MAKURD
/ IJEBU 7 J B EN IN /
f ENUGUL x - y IKCJA
I --S VWVJH/ADAKALIKiJ ./LAGOS
DELTA y l ,Inter national Regional Provincial
Or.GCMA
rnliefiC
.BOUNDARIES:
BOKNU
m a id u g u r i
99.11 f 1/100w,m
aoanawa r NIGERIA
V/? f OAUN1,000
iS;888
TRUCK
ON-THB-IIOOF
SOURCE) Nlgbrlan Llveatock and Meat Authority
Figure 12

Illto the south; the truck moved 24.47 per cent, while 15.96 per
cent was carried by train.
It takes about five weeks for a drover and the cattle
from the north to arrive in a Southern Nigeria market, such as Ibadan, a distance of about four hundred miles (Cohen, 1965,
p. 9). The routes on which the trade cattle trek are cleared
and well demarcated and there are some drovers' shelters built
on the route (Veterinary Division, 1972, p. 1). Throughout the journey from north to south, the cattle are very meagerly
fed, if at all. Poor feeding coupled with long trek makes the
cattle weak and susceptible to diseases, especially trypanosomiases,
The trypanosome attacks begin to take place at the Ilorin
cattle-holding grounds where the tsetse species of Glossina M.
submorsitans and Glossina technoides with a few Glossina palpalis
are aburidant (Jordan, 1965, p. 275). The cattle that have been
herded to the south have a life expectancy of only two weeks after arrival, whereas cattle that travel by train can live for about two and one half months (Cohen, 1965, p. 9). Apart from mortality losses, the weight and quality of the meat from the trade cattle
decline after arrival. Godfrey, et al., (1965, p. 266) report a
loss of 9 kgm, on the experimental cattle trekked from Jiblja
to Ilorin (a distance of 415 miles). ZJnsworth and Birket (1952) calculated an average loss of 13 kgm. on the trekked cattle body
weight. A loss of 12.5 per cent was reckoned for on-the-hoof
cattle from Kano to Ibadan, a distance of about 630 miles (Werhahn,
et al., 1966). The loss of 220 lbs. on a 400-pound cattle

112walked from Kano to Umuahia in Eastern Nigeria has been recorded
(Jones, 1946, pp. 36-37). Jones-Davis (1967, p. 330) has recorded an average body-weight loss of 13 per cent on cattle trekked
from Jibija to Ilorin.
Rail transport accounted for about 16 per cent in 1973
and 15.22 per cent in 1974. Trucking is on the increase. In 1973, it carried 24.47 per cent and in 1974 it transported about
31 per cent. Beef trade cattle transportation by train seems to
be declining. For the 1973 market year, trains carried nearly
sixteen per cent of the cattle shipped to the south; while in
1974 it carried only 15.22 per cent. The declining importance
of the Nigerian railroad has been noted in the transportation of
other goods. In passenger as well as goods transportation, this
state-owned railroad competes with the private truck-owners whose interest is to make as much profit as possible; and in order
to maintain a high profit the truck-owners keep their vehicles
on the road as many of the twenty-four hours each day as they
possibly can (Barbour, 1967, p. 26). The layout of the Nigerian
railroad is often blamed for its inefficient use because it has
a very limited access to most areas. For example, very many regional centers (states and provinces) have no railroads that
connect them with other areas. However, it should be noted that
the initial motives that the British colonial government had in
the construction of the Nigerian railroad were more political
than economic (Taaffe, et al., 1963, p. 510). Moreover, during the early nineteenth century, emphasis was on long hauls of heavy

113exports from the far interior to the coast as economically as
possible without trucks (Niven, 1970, p. 68). Though beef cattle
movement by train is declining it is cheaper than either truck or
on-the-hoof. A comparison of freight costs per cattle per mile
by foot, truck and train on appendixes A, B, and C reveals that shipment by train is the least expensive.
Linear Programming
Important considerations in the decisions of the live
stock (or meat) industry in Nigeria should be the optimal flow
of live animals (and in the near future dressed meat). These op
timal flows can be obtained by using a special form of linear
programming, the transportation model. In linear programming
the standard transportation problem involves the selection of
shipping routes for transferring known quantities of a single commodity from a number of specified destinations so that the
total transportation cost may be minimized (Kriebel, 1961, p.67; Dano, 1965, p. 61).
Though optimal shipment patterns might not have been
achieved under the existing institutional structures and physical distribution management, they do portray the potentials
that exist in the trade. The organization of the interregional cattle trade in the past may serve as a guide to physical dis
tribution management decisions and probably trading patterns to achieve adequate flow of cattle to southern Nigeria. In this
study interregional optimal flows for hoof, truck, and rail are
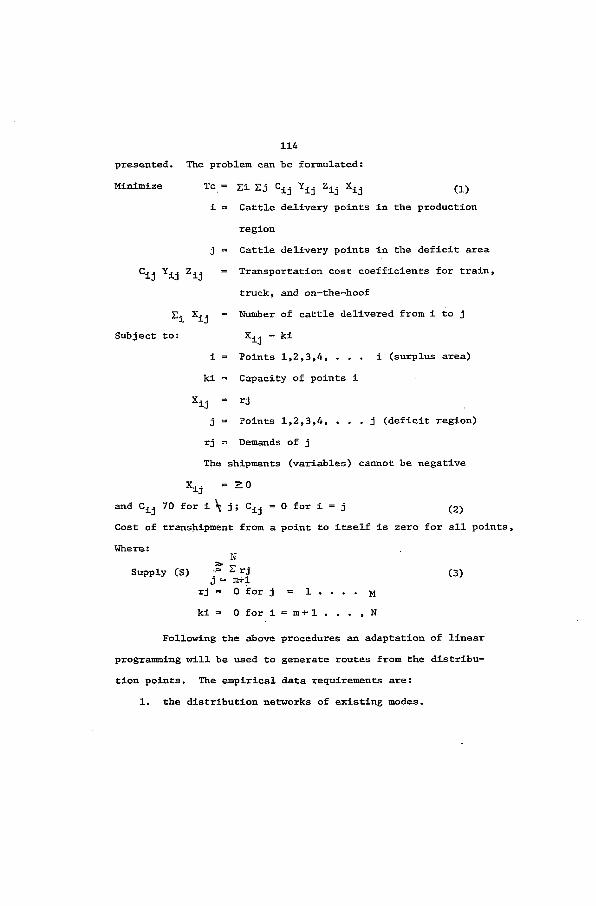
114presented* The problem can be formulated:
Minimize Tc = Si gj Z y (i)i = Cattle delivery points in the production
regionj = Cattle delivery points in the deficit area
Y y Zj j = Transportation cost coefficients for train,
truck, and on-the-hoof = Number of cattle delivered from i to j
Subject to: X^j - ki
i = Points 1,2,3,4, . . . i (surplus area)
ki = Capacity of points i
%ij =j = Points 1,2,3,4, * . . j (deficit region)
rj = Demands of jThe shipments (variables) cannot be negative
% j = z oand 70 for i \ j ; C ^ = 0 for i = j (g)Cost of transhipment from a point to itself is zero for all points,
Where: HSupply (S) 3 (3)
J = m f lrj- 0 for j = 1 . . . . M
ki = 0 for i = m + l . . . , N
Following the above procedures an adaptation of linear
programming will be used to generate routes from the distribution points. The empirical data requirements are:
1. the distribution networks of existing modes.
1152. the distances in miles among the shipping and distri
bution points.3. costs of hauls by the different networks.
4. size of shipments (number of cattle) by each line haul.
5. the delivery time required by each mode.6. demands in each of the deficit areas.
Economists have suggested the important determinants of
the level of demand as :
1. increase in the consumer's money income.
2. changes in the prices of other goods (substitutes).3. tastes and preferences of the individual consumer.
4. a growth in population which can increase the total market
demand for a product (Samuelson, 1961, pp. 434-435).
5. transaction costs, (ICP) Information-contractual-policing cost (Rogers III, 1971, p. 1921).
In Nigeria the above determinants are spatially differentiated,
thus giving rise to a wide variety of demand conditions and demand
intensity for perishable protein foods in the Southern Provinces.
Since demand must spring from the consumers, the mechanism for
the production-distribution of fresh perishable protein foods
in Nigeria is not responsive to demand as it is generated because
of low purchasing power.The United Nations Statistics Yearbook reports that
Nigeria had a per capital income of $211 in 1973 (U.N., 1974, p. 644). This is too low to provide a good purchasing power for
the daily staple plus high priced perishable protein foods.

116Many Nigerians earn far less than the per capital Income cal
culated by the United Nations Statistical Division.
In order to determine the best possible distribution
routing solution to the transportation problem In Southern
Nigeria, there Is need to know the demand of each point In the
system. A linear regression analysis was used In predicting thedemand. Using the linear regression model, a sample of about
forty communities in the Southern Provinces was used to develop
the predicitve equation model.The model requires a linear regression analysis formu
lated as below:
Y = a ' b^ + 3 ^3+ b^ in pounds per communityY = Demand (number of beef cattle)
a - interceptb = slope
“ Population
= Per capita income of the community
Xg » Distance in miles between the communities
x^ = Price per pound of beef (in Naira)The results of the predictive model are given here below:
Y - 179.20 +(10.94809)x^ + (0.09125)x2 + (-13.43174)x3-f(22.66252)x^
The estimated demand function here assumes that the quantity of beef variable is dependent or adjusting variable to price. This
study also suggests that demand varies with population density.
Dependent Variables

117The expected per capital consumption of beef per community
for 1974 was used as the dependent variable. This was the mean calculated from the F.A.O. (1964) minimum and maximum require
ments to achieve the necessary protein intake.
PriceSince the quantity of beef demanded depends upon the
price of beef per pound weight, the cost of beef in Southern
Nigeria as published by the Nigerian Livestock and Meat Authority
was obtained for the different communities.
IncomeThe disposable incomes of the Nigerian consumers were
calculated from the Urban Consumer Survey published by the Federal
Department of Statistics.
PopulationSince the size of the community affects demand it was
necessary to include the population of each of the communities
as a variable. The population of each community was as published
by the Digest of Statistics, Federal Office of Statistics, Lagos,
January, 1974.
DistanceThe distance (in miles) separating the various communities
from their regional center was chosen as a variable because con
sumption of protein foods in a traditional society varies with
distance from:the source of beef due to perishability.
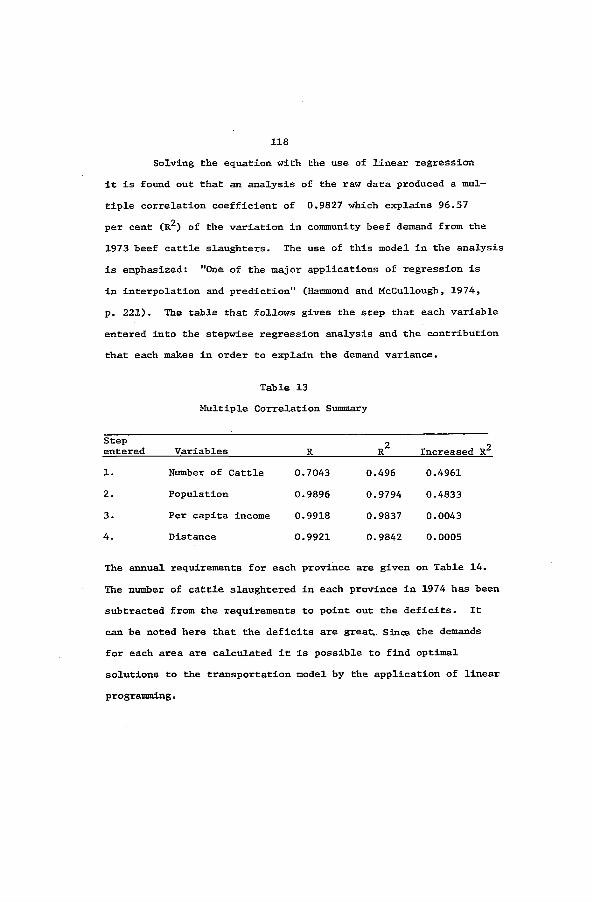
118Solving the equation with the use of linear regression
it is found out that an analysis of the raw data produced a mul
tiple correlation coefficient of 0.9827 which explains 96.57
per cent (R^) of the variation in community beef demand from the
1973 beef cattle slaughters. The use of this model in the analysis is emphasized: "One of the major applications of regression is
in interpolation and prediction" (Hammond and McCullough, 1974,
p. 221). The table that follows gives the step that each variable
entered into the stepwise regression analysis and the contribution
that each makes in order to explain the demand variance.
Table 13 Multiple Correlation Summary
Stepentered Variables R pZ Increased R^1. Number of Cattle 0.7043 0.496 0.49612. Population 0.9896 0.9794 0.48333. Per capita income 0.9918 0.9837 0.00434. Distance 0.9921 0.9842 0.0005
The annual requirements for each province are given on Table 14.
The number of cattle slaughtered in each province in 1974 has been
subtracted from the requirements to point out the deficits. It
can be noted here that the deficits are great,. Since the demands for each area are calculated it is possible to find optimal
solutions to the transportation model by the application of linear
programming.

119TABLE 14
Estimated Annual Beef Cattle Demands for Southern Nigeria
Provinces Estimated* No. Slaughtered Deficits_____________ Requirements_________in 1974**______________________
1. Abakaliki 116,282 15,194 101,088
2. Abeokuta 87,831 8,193 79,638
3. Annang 73,179 2,436 70,7434. Benin 124,900 42,644 82,256
5. Calabar 22,724 8,022 14,702
6. Degema 85,729 85,7297. Delta 106,365 7,541 98,8248. Enugu 136,073 13,138 122,935
9. FederalTerritory 142,500 141,150 1,350
10. Ibadan 250,486 80,876 170,410
11. Ijebu 52,601 20,237 32,364
12. Ogoja 36,134 3,057 33,077
13. Ondo 213,913 25,904 188,009
14. Onitsha 143,779 4,132 139,64715. Owerri 196,577 3,571 193,006
16. Oyo 137,893 23,409 114,484
17. Port Harcourt 70,309 10,843 59,466
18. Umuahia 114,372 21,113 93,25919. Uyo 213,733 2,286 211,44720. Yenogpa 30,175 30,175
**Source: Nigerian Livestock and Meat Authority, 1974.* The annual requirements have taken into consideration the F.A.O. protein requirements of 0.33 g/kg/day (minimum) and 0.88 g/kg/day (maximum). One cattle weighs yOO lbs in the north providing meat and edible offals of 361 lbs.

120Optimal Flows
Linear programming techniques were employed to obtain op
timal distribution patterns of cattle from the north to the south.
Optimal flows data by hoof were obtained from a 34 x 34 regional
matrix. The cost of shipment per cattle per mile is shown on Appendix A. The results obtained from the optimal flow are shown on Appendix D and mapped in Figure 12. Compared with Figure 8 (actual movement by hoof) it can be seen that optimal
flows can serve not only the large urban centers but the isolated
areas, such as Degema and Yenogoa, that received nothing as recorded in
the past. There is no direct shipment of cattle from the north
to Abak, Ikot Ekpene, Oron, and Uyo in the Southeastern Provinces.
Cattle slaughtered In these places are transhipped by foot from from the train. Often cattle are bought at Enugu, after they
arrive from the north, and moved to Ikot Ekpene, a distance of
131 miles. The long trek by cattle after they arrive by train exposes the animals to tsetse attacks. The animals become sick,
emaciated and die a week later.The same linear programming techniques were used in a
33 X 33 regional matrix to obtain optimal flow data by truck.
The costs of shipment per cattle per mile by truck are shown on Appendix B. The results of the optimal flows are shown on Appendix E and mapped on Figure 13. Compared with actual flow
patterns on Figure 9 it can be noted that actual flow patterns coverge on the urban centers such as Abakaliki, Benin City,Ibadan, Lagos, Onitsha and so on. The reasons for this are:

OPTIMAL CATTLE M O V E M E N T BY HOOFSOKOTO
MAIDUGURI \BOKNU
bauchi
ADANAWA ! NIGERIA
SARDAUNA / (
1,000 - 5,000 5,999 - 10,000 10,999- 20,00021.000- 30,00031.000- 40,000
LAGOS
BOUNDARIES: SOURCES! (1) NigerianLivestock and Heater— 41,000- 50,000 Authority(2) State MiniBtrio8*^60,000 and over of Natural Resources
WARRIDELTAInternational Regional
ProvincialOEOEMA t'l’iNL
FIGURE i2

O P T I M A L CATTLE M O V E M E N T BY T R U C KSOKOTO
31NA >
BOKNU MAIDUGURI
k o n t a g o r a
ADANAWAy NIGERIA7
sardauna
^ ■ . 1 ^ -IJEOU
'BENINLAGOS ^OITYl LEGEHD
1,000 - 10,000
11,000 - 20,000
21.000 - 30,00031.000 - «0,000
BOUNDARIES:DELTAInterratiotBl .. Regional
Provincial SOURCES: (1) NigerianLivestock and Meat Authority (2) State Minis t ^ n
of Economic Development *R$” ^«1,000 - 50,000OA lOLOLMA /xxJ
Eiguro T)miles
is
123(1) truck drivers deliver their cattle to the agents who live
in the urban areas; (2) there are consumers with buying power in the urban areas; (3) cattle dealers prefer marketing their cattle in the urban areas where they make the highest possible profit.
This causes the neglect of the rural areas; and (4) the truck
owners who live in the cities like shipments between the north
and the market near their homes.
The optimal flow data by train were obtained from a 31
X 31 matrix of the linear programming techniques. The results
of these flows are given on Appendix C and mapped on Figure 14.
Differences between actual and optimal flows by train were and
are small. The only outstanding flows differences between the
two are flows from Nguru in the northeast to Ibadan in the west and Umuahia in the east. The little difference is necessarily
so because most of the culled cattle, which are always sent by
rail, are used for making dried beef which is shipped by train to the Western Provinces. Nguru is a greater center for the preparation of dried meat. In practice little or no live cattle
are shipped from Nguru. Secondly, the train is a modern mode of transportation in the country, and its use should be efficient
but for lack of adequate physical distribution management in the country. The optimal flow figures for train are shown on Appendix F.
The Dual of the Transportation Problem
The dual of the transportation problem is to maximize the value added to the product by transfer between (i)

OPTIMAL CATTLE M O V E M E N T BY TRAINSOKOTO
, KATSINAQUSAU
BOKNUmaidugurir LFUNTUAl
BAUCHI
NIGER GOMBE
ILORN
ADANAWA
oshogboA
U '
\ 7"') OYO J1 “ I ONOO
DENUE
MAKURDI
ADDA
1.000 - 5,0006.000 - 10,000
11,000- 20,000
21,000- 35,000
sardauna
JEDU j BENIN I
1 ODOJAAKALIKiJLAGOS
BOUNDARIES: SOURCES: Nigerian Livestock & Meat AuthorityState Ministries oC Natural ResourcesState Ministries of Economic Development
DELTA v fInternational Regional Provincial
DEGEMA
FIGURE lA
g

123(1) truck drivers deliver their cattle to the agents who live
in the urban areas; (2) there are consumers with buying power in the urban areas; (3) cattle dealers prefer marketing their cattle in the urban areas where they make the highest possible profit.
This causes the neglect of the rural areas; and (4) the truck
owners who live in the cities like shipments between the north and the market near their homes.
The optimal flow data by train were obtained from a 31
X 31 matrix of the linear programming techniques. The results
of these flows are given on Appendix C and mapped on Figure 14.
Differences between actual and optimal flows by train were and
are small. The only outstanding flows differences between the two are flows from Nguru in the northeast to Ibadan in the west
and Umuahia in the east. The little difference is necessarily so because most of the culled cattle, which are always sent by
rail, are used for making dried beef which is shipped by train
to the Western Provinces. Nguru is a greater center for the preparation of dried meat. In practice little or no live cattle
are shipped from Nguru. Secondly, the train is a modern mode of transportation in the country, and its use should be efficient
but for lack of adequate physical distribution management in the country. The optimal flow figures for train are shown on Appendix F.
The Dual of the Transportation Problem
The dual of the transportation problem is to maximize the value added to the product by transfer between (i)
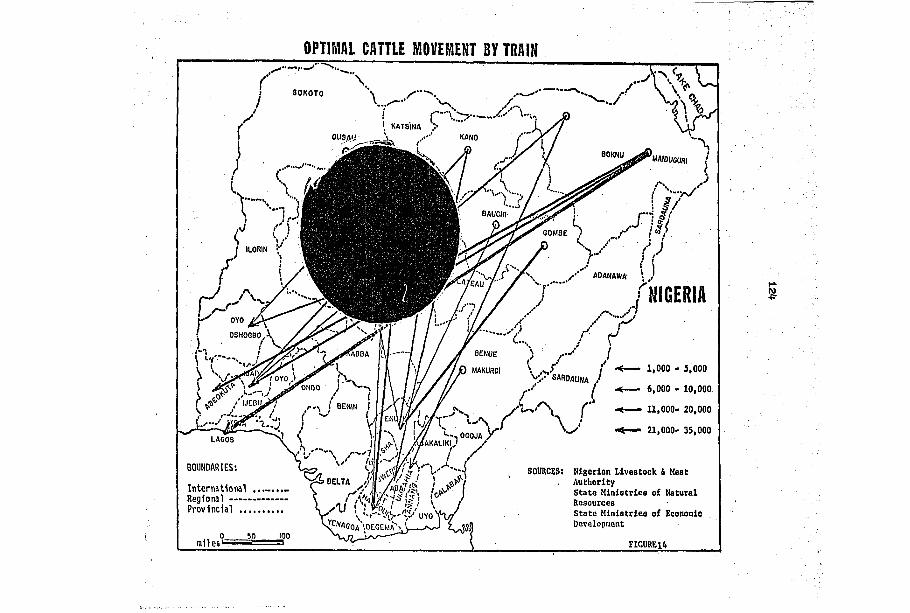
OPTIMAL CATTLE M O V E M E N T BY TRAINSOKOTO
k atsin a
OUSAUBOKNU
MAIDUGURI
bauchi
COMBE
ILORIN
ADANAWA
05HOCB0^\
BENUE
MAKURDI®WDAUNA /
1.000 - 3,0006.000 * 10,000
11,000- 20,000
21,000- 35,000
ONDO
r " ' , \ BENIN 1
OGOJA AKALIKiJ /LAGOS
BOUNDARIES: SOURCES: Nigerian Livestock & Heat AuthorityState Ministries of Natural ResourcesState Ministries of EconomicDevelopment
DELTAInternational Regional Provincial
is I
OEGEMA0m1les‘ FIGURElA

125source and (j) destination (Taaffe and Gauthier, Jr., 1973, p.
169). Barr (1968, p. 174) defines the dual of the transporta
tion problem as a technique for estimating relative differences
in factory price and marketed price among different producers
and consumers•
However, the economic implication of the dual is to
maximize for all (i) sources and (j) destinations the (S) value added to the product at j minus the production cost at i.
In 1974 the recorded cattle shipment by all the three
modes totaled 738,008 and the truck was the most expensive.
Train was the least costly of all. If the train shipped all the cattle from north to south there would have been a saving
of about 48 per cent in the total transportation cost. The delivered values for the three different modes are given on Appendixes D, E, and F. However, further Investigations of
the spatial price system of the Nigerian beef cattle trade is
beyond the scope of the present study and must be left for future analysis.
Flows and Inventory Replenishment
In recent years the industrialized nations have paid in
creasing attention to all forms of flows, order-processing-trans-
mlttal, and logistical operations. Businessmen who operate on a profit know that delay in inventory replenishment increases the probability of an out—of—stock condition at the retail store. Elapsed time and delay in inventory flow is extremely critical

126to total logistical performance (Bowersox, 1974, p. 283).
The first classical study of the importance of flows,
time and delay of inventory on industrial performance was under
taken by Jay W. Forrester in 1958. In his investigation the im
portance of time lags in amplifying inventory and distribution
requirements within an over-all distribution channel has been illustrated (Bowersox, 1974, p. 284). The kinds of relationships that are needed in the production—distribution functions can be
illustrated in equation form:
UOR.K = UOR.J + DT (RER.JK - SSR.JK)® (1)i.e., the levels of unfilled orders at time K are equal to unfilled
orders at time J plus the new orders received during the interval
JK, minus shipments sent during the interval JK
SSR.KL = UOR.K/DFR.K (2)Similarly, shipments sent from retail are the ratio of unfilledorder to the delay in filling orders at retail,
K/CFAR.K/RSR.K) (3)
The delay in filling orders at retail depends on the size of the
inventory relative to the ordering rate. As inventory gets
A complete computer write up of this program is presented in Appendix G. The program follows Alexander L. Pugh III very closely. The program is Dynamo II (Dynamics Models). The program can deal with flow of goods into Inventory, men into labor force and current into a capacitor. It shows the process that relates a quantity to the time rate of change of that quantity. The symbols are standard Industrial dynamic symbols for levels, rates, sources, and sinks.

127
smaller, the delivery delay gets larger, the smaller Inventories being less able to fill an order from stock. The argument here
follows Pugh III (1973) very closely.
Figure 15 shows the interrelationships among the different components of sales, inventory stocks at various distribution
channels, and production output. From the figure it can be seen that a sales increase of ten per cent occurs in January.It reaches a peak of sixteen per cent in March because new orders
received have been added to the retail level to increase inven
tories as well as raise the level of orders and goods in transit to correspond to the ten per cent in sales rate. The factory
output peaks at plus 40 per cent in June. In April the distri
butors order reaches a peak of 28 per cent, not only because of
the 16 per cent increase for orders and goods in transit between
distribution and factory. The reverse is also possible. Retail
ers who satisfy their inventory requirements decrease their order rate. Factory output must, therefore, be decreased as in this case — 13 per cent below the current retail sales.
These fluctuations in sales and distribution are possible in the advanced economies of the world. In the less-developed countries the peasants do not operate on profit margins and this accounts for the reason why this kind of relationship among sales,
inventory stocks at various levels in the distribution channel, and production output cannot be supplied in the case of the
Nigerian beef cattle trade between the Northern and Southern Provinces.

128
p r o d u c t i o n-d i s t r i b u t i o n 'SYSTEM RESPONSE TO A SUDDEN TEN PER CENT INCREASE IN RETAIL SALES
Retailors' Orders From Customers I
pistributors' Orders from RetailersFactory Warehouse Orders from Distributors
Factory Production Output -+25$
ventory- at Factoiy Warehouse
Factory Warehouse
I Weeks I 4 ' 4 12 16 20 24 28 32 38 42 48
' I52
Figure 15

129
Ways to Improve the Effectiveness of the System
The protein shortages in Southern Nigerian diets are not
caused by low cattle production in the country. It results from inefficient transportation development and the inability of the
markets in the south to redistribute the beef received from the
north. However, the kill—out-percentage (ECOP) of the Nigerian cattle is low. It is about 9.2 per cent as compared with 28 per
cent in the United Kingdom and 40 per cent in the United States
(Oyenuga, 1963, p. 21), This low extraction rate is caused by
the unwillingness of the Fulani herdsmen to sell their cattle
unless forced to do so by certain emergencies. The maturity period for the Fulani cattle is four or more years as compared •
to one or one and a half years in the United States. These fac
tors, plus poor physical distribution management if solved could result in alteration of the protein shortages in Southern Nigeria.
Cattle production in Nigeria is high enough to provide the needed nutrition to the people. Protein shortages occur
"because means of communication with and transportation (of trade cattle) to consuming centers are still completely lacking"
(Mittendorf and Wilson, 1961, p. 17). There is a discrepancy, such as the 'mai gida* credit arrangement, in the Nigerian cattle
trade that helps to prepetuate low intake of animal production in
Southern Nigeria.
Credit Arrangements Most of the cattle that are transported to Southern

130Nigeria have difficulty In reaching the vulnerable consumers
because many butchers are unable to obtain credit for the purchase of cattle before butchering. Though a butcher does not
need much capital to stay In business, the entry of a new person Into the trade Is difficult. Since cattle do not live for
long periods after arrival In the south, dealers always sell
their cattle Immediately on arrival. They can do this only
through the granting of credit to local butchers.
The mal glda credit system, which grants cattle to a
butcher on credit, requires guarantee from the glda (cattle
broker) before the dealer can give out the cattle on credit to the butcher. The glda will only act as a guarantor to a butcher
who does not owe money to any other cattle dealers. The butcher
must also be a regular'customer, since the local law requires that each butcher slaughters, at least, one head of cattle per week In order to stay In business In the area.
The agreement of glda (or sarkl) Is necessary before any
cattle can be sold on credit to a local agent or butcher. The cattle dealer does not always come to collect the loan. It Is
the duty of glda (risk insurer) to see to It that the local
agent or butcher pays the cost of the animal bought to the dealer
during the next visit. Should the agent fall to pay his debt,
the glda who guaranteed the credit takes It upon himself to
collect the money. If the glda falls to collect the money, he pays the money to the cattle dealer so that he may be able to
maintain his position as a cattle broker In the local cattle market.

131The mai glda credit system is very unreliable. It leads
to losses on the part of the dealer in the case of the butcher's
death as it becomes impossible to collect the money from either
the deceased relatives or the risk insurer (gida)• A local
butcher who owes a dealer, no matter how reliable he had been
in the past, cannot obtain any new credit in the cattle market.
Any debt no matter how small may put a local butcher out of
butcherybusiness.The dangers inherent in this kind of credit system can
be eliminated if a modern system of financial institutions is
established to handle or take over the present primitive credit system. However, the absence of such a credit institution has
been recognized by the Nigerian Federal Government. In 1973, the government under the auspices of the International Bank for
Reconstruction and Development (IBRD) opened the Nigerian Agri
cultural Bank (NAB). One of the objectives of the bank is to
grant loans for agricultural production (for example, animal
husbandry, fisheries, forestry and timber production) and for
purposes of storage, distribution and marketing connected with
such production (NAB., Ltd., 1973, p. 3). Presently, many states
have taken advantage of the new developmental project. In the past two years, the bank (N.A.B.) has granted loans to prospective farmers in almost all the states (N.A.B., Ltd., 1973, p. 5).

132Cooperatives
As an agricultural marketing innovation, the Danish co
operative movement is often cited as a European example. This
cooperative movement, which came into existence in the 1880's took
place in a Danish rural environment. Is such cooperative mar
keting possible in Nigeria so that the peasants can pull their resources together for the promotion of reliable interregional
and intraregional trade on beef cattle in the country? The work of the farmers Cooperatives in the United States can be pointed to as another example. The Farmers Cooperatives helps to trans
port, store, as well as promote the products of its members.
The cooperatives efforts to minimize costs of marketing have
served to build up cost-consciousness among its members, and this in turn has helped to hold down costs to consumers (USDA, 1972,
pp. 28-29).
In some African countries, consumers/producers coopera
tives have brought about active and conscious participation of the local communities in government’s developmental plans. The
reason for this has been summarized :
This is partly because the method of organization and administration of a producer’s cooperative are in accordance with the traditional African concept of a group working together for mutai benefit, while at the same time having a trustee or trustees appointed to manage the communal property in the interest of the groups as a whole. There is a clear parallel here between the managing committee of a co-operative society and the tribal elder or group of elders who take charge of the allocation of the use of the land (F.A.O., 1966, p. 361).
The establishment of cooperatives would lead to the establishment
133of Improvement measures such as regulations to suppress specific
abuses, maintenance of fair sales practices, provision of market
ing information and facilities, grading systems, and the forma
tion o£ new bodies to engage in marketing in competition with
existing marketing channels (Mittendorf and Wilson, 1961, p. 85).
Though the development of transportation infrastructure is a public concern, cooperative organizations can help to re
direct the beef cattle trade toward the vulnerable members.
Cooperative marketing has a distinctive economic advantage of
by-passing a number of middlemen so as to increase the rewards to
each member (F.A.O., 1966, p. 361). Since Southern Nigerians
have no means of preserving meat, and beef must be used as soon
as possible, it will be the place of the cooperative marketing
system to deliver live cattle as close to the final comsumption
areas as possible. This will hold down the price added by chill
ing and freeze-drying that helps to put the price above the ability
of low-income consumers. Furthermore, canning, chilling, and freeze-drying methods produce new food items that definitely
encounter strong consumer resistance in many parts of southern Nigeria.

CHAPTER IV
INTRAREGIONAL MOVEMENT
Transportation network development in less-developed countries has often been blamed for the continuing economic orientation towards overseas markets (EAC/EAO., 1972, p. 42). The
most important phase in the transportation development in such countries was the emergence of major lines which penetrate from
the seaports to the interior. Three principal reasons for build
ing these lines of penetration from the coast to the interior have
been established: (1) the desire to connect an administrativecenter on the seacoast with an interior area for both political
and military control, (2) the desire to reach areas of mineral
exploitation, and (3) the desire to reach areas of potential
agricultural export production (Taaffe, et al., 1953, p. 506).
In the past the political and administrative motives were the most important. In West Africa these motives led to the construction of railroads from Apapato Kano in Nigeria, and from Cape Coast to Kumasi in Ghana. Today, it is the desire for the exploitation of mineral and agricultural raw products that dominates
railroad expansion in Nigeria.
In this chapter the shipment of beef from southern urban
centers to village markets will be examined. A simulation model will de designed to represent the situation as well as allocate
134-

- 135
beef from regional centers to village markets following the per
iodic cycle of the rural markets. The incentives necessary for
rural marketing of beef will be considered. Finally, the difficulties associated with the introduction of refrigerated meat
and protein substitutes will be analyzed.
In Nigeria, today, the beef cattle trade has not departed
much from the traditional external market orientation. Beef
cattle leave the port of Lagos quite regularly for Accra, Ghana
(Ferguson, 1967, p. 30). Within the country, beef cattle trade is oriented towards the urban centers.
The increase in the consumption of beef in the urban
centers has aroused the interest of some governmental bodies in
the country. For example, the Western Nigerian government
studied the possibility of establishing a central abattoir at Ibadan (Arthur Little, Inc., 1964). The Federal Government has
taken surveys of consumption in urban centers.^ The rural consumers seem very much forgotten.
The reasons for urban consumption interest are not dif
ficult to understand. Urban consumers can afford to pay higher
prices for beef. Average incomes in the urban centers are much
higher than those in the rural areas. The presence of foreigners
also stimulates the beef cattle trade in the urban centers. Most wealthy Nigerians also live in the urban areas. Businessmen are
^The reports of the surveys are published in booklets titled Urban Consumers Surveys. They are published by the Federal Department of Statistics, Lagos, Nigeria.

interested in sales where they make the greatest profit. In rural areas consumers are too poor to support the business of an
ambitious entrepreneur. Beef cattle are rarely transported to
rural markets, and as a result the rural populations are resigned
to an existence of the very scantiest amounts of animal protein
in their diets. What is needed at the present time is a program
that will deliver beef cattle not only to the Southern Nigeria urban centers but to rural areas as well.
Removing Deficits by Improvements in the
Intraregional Distribution Systems
A factor influencing perishable food supplies in Nigeria is the effectiveness with which the traditional marketing systems
distribute the available products to rural consumers. The absence
of an efficient marketing and distribution system is a great
barrier to improved nutrition, in rural areas of Southern Provinces. Though most Nigerians are subsistence farmers and produce sufficient
staples for the needs of their families, southern producers who cannot raise livestock are deficient in animal proteins in their
diets. The important consideration here is that in cases where the farmers do not raise cattle they should have the income neces
sary for the purchase of meat. A great percentage of the population cannot afford to buy the food needed to meet their basic
nutritional requirements. Since consumer prices in the country
are maintained at levels based on ability to buy, most rural consumers cannot purchase the needed protein foods.
.,137
In order to encourage food consumption in the rural
areas, marketing systems must be organized to provide fast and
effective distribution not only in the urban areas but In the rural areas as well. The government has the primary respon
sibility of developing good transportation and marketing systems.
The view has been stressed when it Is stated that:
These government responsibilities Imply viewing good marketing as an essential and productive part of the economic system that "adds value" In the same sense as the production of food products on farms. Government should do everything possible through research, education, service, and regulation to promote the most efficient marketing system at lowest possible cost (President's Science Advisory Committee, 1967,
. p. 542).Beef marketing In Nigeria, schematically described In
Figure 16, has been broken down into three sections, namely, pro
duction, processing, and dlstrlbtulon and sales, with a number of subsections In each service area. The first two services are
performed In the north while the last one Is performed In the
south. The work of the primary and secondary activities, as
well as that of the mal glda (sarkl) was described previously.The concern Is the marketing of beef (cattle) In the Southern
Provinces and why there is widespread protein deficiency despite
the cattle slaughtered in the urban areas In the south. One problem can be Isolated— Inefficient transport and marketing systems.
When the butcher Is able to obtain credit (I.e., after the Glda had guaranteed his credit before the cattle dealer) the butcher slaughters his cattle on a slab In or near an urban

^ 3 8 'MARKETING BEEF TO SOUTHERN NIGERIA CONSUMERS
PUIANI OATTIEMENPRODUCTION
itinerant cattie traders
movement HAUSA MIDDLEMEN
HAUSA DEAIERS ■4>tA3. SHANÙ:)
' /CORNEDBEEFBUTCHER
DISTRIBUTION
AND SAIES TRADER TRADER
INTERMEDIARY.'-URBAN
AGENTSTOREKEEPER
PROCESSING i SADES
MARKETTRADER
MARKETTRADER
URBANBUTCHER
VILLAGEbutcher
HAWKER
(URBAN AND RURAL)
FIGURE 1 6
The dried meat industry, an ingenous way of marketing meat from culled cattle, has its supply of cattle from all sources of the heef market Industry. Dried meat is mostly sold in Western Nigeria.
These people act as landlords and guarantee credit for the cattle dealers. In short, they act as middlemen between the dealers and the agents or butchers. They can be-called "cattle brokers".

;±39.market. The meat is not separated Into steaks, roasts, etc.,
as it is done in the United States; rather it is deboned andcut into cubes (USDA., 1972, p. 33). There is little or no
difference in price among the cuts. This greatly affects thelow income consumers who can least afford to buy meat. The
situation has been described;
In North America and Europe prices of the various cuts of a carcass differ considerably, especially as between the fore and hindquarters, in reflection of consumer preference. In Africa, such differentials have hardly developed because of the generally low consumption of meat, and because of the cooking methods employed. Most of the meat is deboned, cut up and cooked in small pieces. The quality of muscle is then more important than the quality and cut.Meat rarely is grilled; only the higher income groups are shifting to such cooking methods. The low meat consumption also favours the consumption of offals which Africans like to eat and of which the sale generally presents no difficulty (Mittendorf and Wilson, 1961, p. 28).
The deficiencies of animal protein in Southern Nigerian
diets should not suggest the absence of slaughtering operations
in that region. Slaughtering is carried on regularly in the
urban centers. A study conducted for the Western Nigeriangovernment testifies that:
There are at present seven slabs being operated by the Ibadan City within the city limits and an additional fourteen slabs operating in the outlying districts. Approximately 110 cattle are slaughtered daily, seven days a week on the seven city slabs and sixty—five to seventy—five at the peripheral slabs (Arthur Little, Inc., 1964, p. 2).
The sale of beef is carried out by the wholesale butcher whosplits up the carcasses among retail butchers. Local consumersbuy their supply of beef from retail butchers. In the urban

140
areas, beef markets open early in the morning. If by the after
noon all the meat in possession of a retail butcher is not sold, the prices of the meat in the stalls will be drastically reduced
to stimulate sales. The meat that is still for sale after the
early morning rush is of lower quality. High income housewives, who have the money for the purchase of meat, usually buy the good
parts of the beef during the early hours of the morning (Arthur Little, Inc., 1964, p. 27). Low-income families normally buy
their meat supplies in the evening markets.Some retail butchers may leave the urban markets for
village markets during the afternoon time. They do this because they have to sell all the meat in their possession by the evening
on the day of slaughter. Any meat left overnight cannot be sold because of stiff competition from retailers offering fresh meat
in the urban centers. There is also a difficulty of lack of re
frigeration to keep the meat fresh for the following day (Mittendorf
and Wilson, 1961, p. 28). One of the greatest drawbacks to selling
cold beef is that the local consumers prefer their meat fresh*
This is necessarily so because Southern Nigerians desire fresh
flavor more than tenderness. The slaughter of cattle in the south is, therefore, geared closely to daily demand (Western Nigeria,N.D., p. 5). The local butchers try not to butcher more cattle than they can sell on the day of slaughter. This practice has helped to keep the price of beef high in the south. If there are more daily customers than usual looking for beef to buy, the re
tail butchers raise the price of beef instead of slaughtering more

:
cattle. The system of beef cattle distribution in Nigeria is
such that only the large towns in the Southern Provinces are
supplied with beef. The smaller towns (or villages) near the cattle trails can get beef supplied occasional^ when animals
that are unable to stand the strain of a long trek are sold en
route; occassionally, some cattle are slaughtered en route in order to pay local tolls (Western Nigeria, n.d., p. 4), Villages which are not near cattle trails have no beef delivered to them. Protein deficiency in such villages is chronic. A dramatic
revision of the intraregional distribution of beef cattle in the Southern Provinces is the only means for solving the non—beef
cattle delivery in the remote areas of the south.
In order to illustrate the intraregional movement of beef
from the southern urban centers to village markets, a simulation
model of the regional has been developed. The flow chart (Figure
18) gives a schematic description of the model. The model uses
19 towns as regional market centers and 114 villages as the dis
tribution points. Using the demand model in Chapter II the pro
gram distributes beef cattle from the regional centers to their surrounding villages and specifies the number of cattle that
should be delivered per trip in order to achieve the required number of cattle that the consumers need for each month of the year.A typical example of this is shown in Calabar Division in Southeastern Nigeria- In 1973 the number of cattle slaughtered in
the division for a population of about 267,015 was 5,543 (Southeastern State, 1973, p. 72). Some beef shipped from the central

.142
Intraregional Demand Allocation Flow Chart
CREATE ARRAY: FOR VILLAGE MOMTHLY TOTAL
WRITE OUT DEMAND OP EACH VILLAGE FOR EACH MONTHREAD NUMBER
OF CITIESitelTE OUT KMT.iro BE supplie:BBY THE CITY BFOR THAT MONT:READ NUMBER
OF VILLAGES
>^HERE MOB MONTHS TO SIMULATE?
SET VILLAGE iCCUMULATORS:qual to zero
SET MONTHLY TOTAL ACCUMULATOR EQUAL !ERO.MONTOT=o I
NO
^ ARE THERE MORE V CITIES?
YES£ Tt
CALCULATE DEMAND (DMN)
E NO
ADD DEMAND TO MON .’TOT
ADD DEMAND TO VIL (L) YES
ARE THERE MORETillages _
WRITE DEMAND FIGURES FOR TILLAGES FIGURE 18
NO

14-3
city (Calabar) served the surrounding villages. Six of these
villages have been selected for the present survey. Based on
population, distance from the central market (Calabar), cost of
cattle per head, and per capita income, the number of cattle that
each village would need per trip, per month and in a year was
determined. Each village market is visited about five times each month based on either eight-day week or five-day cycle of the periodic local market. Table 15 gives a list of villages,
the number of trips, the number of cattle delivered to each village per trip, and total requirements for the month.
Gravity Model
In transportation researches the gravity model has usually employed two masses, one at the origin and the other at the des
tination. This model can be written:PiPj
Where: Interaction between i and j for
commodity 'a* p^pj= Measure of size i and j (No. of cattle
per trip) d^j= Distance separating i from j
Perishability factor This formulation is based on the postul&te that the potential in
teraction existing between a beef consumer and the butcher's stalls
in Southern Nigeria varies with the distance separating the con—

, 1 ^
TABLE 15
Periodic Cattle Allocation to Villages
in Calabar Division
No. of Trips No. of Cattle Requirements Month Villages Per Month Per Trip Per Month
January 1. Aningeye 5 1 2 59.8
2 . Atimbo 5 5 23.6
3. Ikang 4 1 4.3
4. IkatNakanda 5 5 23.0
5. Mbarakom 5 4 20.9
6 . Oban 5 3 15.5
147.1
The central market (Calabar) needs 130 head of cattle per month for its urban population. The deliveries shown above are made for each of the twelve months of the year. Other regional centers and villages were treated in the same way but their requirements are not listed here because of lack of space.

sumers from the butchers’ stalls. Solving this for Atimbo
village market which is five miles from Calabar central market
with a high perishability factor because the trade is by foot it is:
130 X 23.65 X 10 = 61.36
This kind of regional market centers interaction with their sur
rounding villages has been illustrated with four central markets
in the east in Figure 19.There are, however, some common limitations associated
with the gravity model. It has been argued that the gravity con
cept is an empirical notion with very little, if any, theoretical
substance (Olsson, 1 64, P* 48; Hammond and McCullagh, 1974, p.
265). Huff (1961, p. 20) thinks that the gravity model tells
nothing about why observed regularities occur as they do under
various conditions and, as a consequence, leaves one at a loss
when unexplained discrepancies occur. Hammond and McCullage (1974, p. 266) have encouraged the use of this technique in geo
graphic studies because it helps in the prediction of future effects of the location of a new town on the retail trade and
services of the neighboring towns; and it also helps to provide information that can be mapped to describe a spatial distribution pattern.
Since fresh meat can only stay fresh for about four hours
without refrigeration it has a very high perishability (e.g., 1 0
above) and the interaction is very low. Trade beef by foot is only
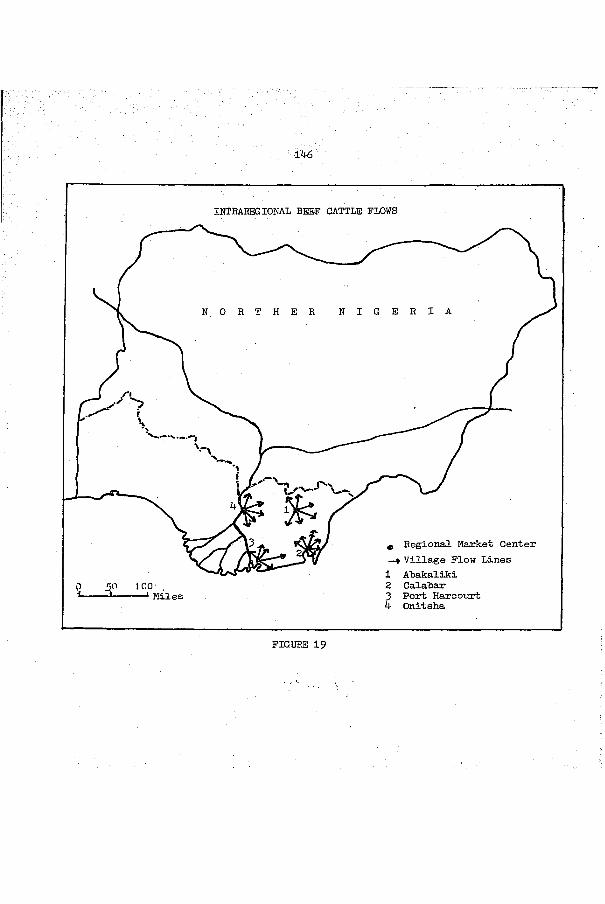
146
IjNTHAEEGIONAL BEEF CATTLE FLOWS
0 Regional Market Center —* Village Plow Lines1 Atakaliki2 Calabar3 Port Haroourt4 Onitsha
100 ,— ' Miles
FIGURE 19

. 147possible If the distance to be covered Is about five miles. By bicycle beef can be traded as far as fifteen miles, and by truck
it Is possible to go as far as 50-60 miles. This is so because
Nigerian consumers think that fresh beef remains fresh for three
or four hours after it is butchered. After this time deteriora
tion sets in. The area that can be covered in beef trade by
foot, bicycle and truck without refrigeration is shown on Figure 19 • Trade by foot can only sell a limited amount of beef between
and B^. By bicycle the area increases to and but witha little large amount of beef. The truck can carry much larger
amounts of beef and can also cover a longer distance, but it
still needs about four hours to sell its unrefrigerated meat before it deteriorates.
The solution presented by the model is that fresh beef
shipment from regional centers in the south to rural markets would make it possible to maintain reasonable slaughtering as
well as distribution costs through the introduction of efficient
transportation and marketing systems. The reduced distribution
costs will increase the per capita consumption of beef in Southern
Provinces greatly needed to supplement the low protein intake especially of the low-income consumers (Arthur Little, Inc., 1964, p. 4). It would be possible to implement efficient meat in
spection and sanitation controls because closer coordination can be established between live and dressed carcass inspections before the meat is shipped to the local markets. It would be possible to arrange regular beef delivery to surrounding rural markets
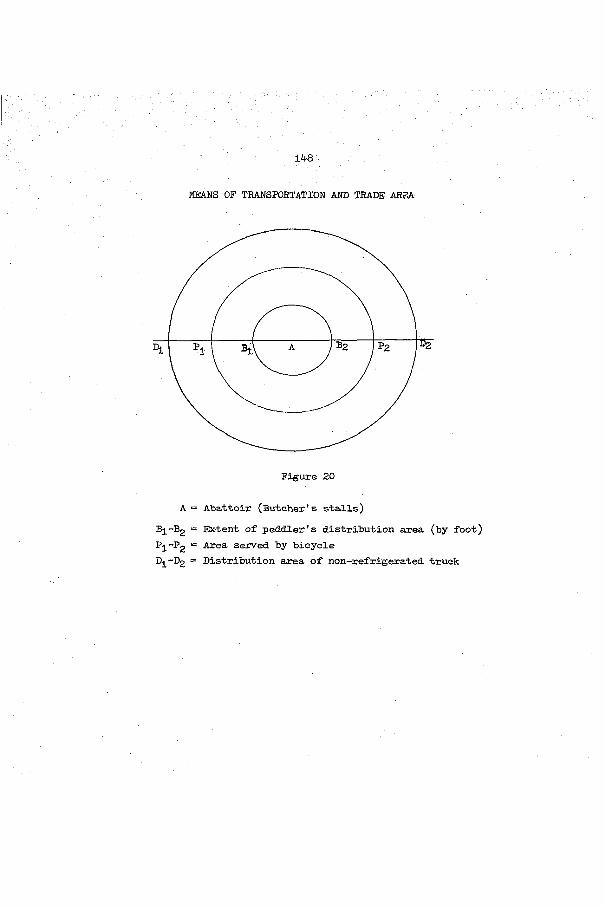
148
MEANS OF TRANSPORTATION AND TRADE AREA
Figure 20
A = Abattoir (Butcher's stalls)B1 -B2 = Extent of peddler's distribution area (by foot) P^-Pg = Area served by bicycleD^-Dg = Distribution area of non-refrlgerated truck

' 149from an organized central location. Retail butchers who would
try to deviate from rural to urban markets can easily be checked
or tracked down. Consumption of animal protein foods can be
increased in Southern Nigeria urban as well as rural areas if transportation is planned and developed.
Incentives to Rural Trade and MarketingThe role of the government in economic planning in a
free enterprise economy involves the provision of the necessary
infrastructure for the economic well-being of the country.
Government provides certain indispensable public services without
which community life would be hampered or rendered impossible.
By their very nature these functions cannot be left to private
enterprise. The traditional role of government in the provision
of these services has been listed as:
. . . first, the provision of "public goods," such as police and fire protection, national defense, flood control, public health measures, roads, bridges, parks, and so on, where use by one consumer, up to very high limits, leaves unchanged the amount of the good available for others; second, the construction of schools, hospitals, and possibly housing, where there are external economies in consumption and the consumer is compelled (as in elementary education) or encouraged to adopt appropriate standards; third, the prevention of external diseconomies by private concerns, in erosion, pollution or depletion of natural resources, the proliferation of standards, with consequent lack of interchangeability; fourth, the prevention of wasteful competition, such as duplicate railroads between two cities, or duplicate electric, gas, or telephone companies (Kindleberger, 1968, p. 125).
There are, however, some services that the government cannot provide by itself. A typical example is the monopoly franchise
' lÜP .
granted to a public utility. In granting the utility company a
complet monopoly, the government steps in to protect the consumers
by setting maximum rates. "In setting such prices, it has long
been customary to pick prices that will try to give the companya fair return on its capital" (Samuelson, 1961, p. 558). Vlner
in supporting this commented that:Whether government should intervene, says Bentham, should depend on the extent of the power, intelligence, and inclination, and therefore the spontaneous initiative, possessed by the public, and this will vary as between countries. "In Russia, under Peter the Great, the list of sponte acta being blank, that ofagenda was proportionally abundant." Governmenthas special responsibilities for providing security against food shortages as well as military security.He approves of government aid in the construction of roads, canals, iron railways, of public hospitals for the sick, hurt and helpless, of public establishments for the "occasional maintenance and employment of able-bodied poor," and, as we have seen, of public health activities on a scale still unknown (Viner,1949, p. 371).
The argument for government behavior here should be that of in
determinate benefits. Government can spread the risk over the economy as a whole rather than concentrate on the hands of a
few entrepreneours. Since government has better access to information than private enterprise, it may be advantageous for it to .take the risk in innovation and decision making, and it has the added advantages regards ability to recruit highly
talented men into its services. Government can easily attract intelligence, training, and energy in many countries in ways
which private enterprise cannot (Kindleberger, 1968, p. 127).In all these, it is assumed that the government will avoid over-

151
centralized decision-making, maximization of the wrong variables, and monumental projects.
In Nigeria, cooperative marketing societies might be formed as a solution to dispersing government subsidies to encourage
cattle delivery to the rural consumers. This would lead to the
fulfillment of the Nigerian philosophy of planning which succinctly stated reads:
The ultimate goals of economic development is the welfare of the individual. The focus of our policy objective should, therefore, be on how the ordinary citizen is to be affected by the resulting set of action programmes and projects. The prospect of the citizen in the process of economic development and social change should not be determined by the mere accident of the circumstances of his birth. He should be able to have equal access to all the facilities and the opportunities which could help him realize his potential and develop his full personality. A sense of self-reliance and a sense of national pride are worthy objectives which the Government believes the average Nigerian wishes to cultivate.But he can only do so in an atmosphere of expanding opportunities for full employment, for education and for self-fulfillment. The nation will, therefore, remain fully committed to the achievement of these objectives at all times(Fed. Min. of Information, 1970, p. 33).
The livestock and Meat Authority under the auspices of the Federal government can regulate cattle slaughter in the urban areas. Presently, there is no regulated cattle slaughtering in the rural
Slaughtering Cattle Near Final Consumption Areas
One of the requirements of beef consumption in Nigeria is that the meat be fresh. This is due to lack of refrigeration and
the suspicion that people in less-developed countries attach to

,, .152new technologies. In Nigeria, many people think that refrigerated
beef comes from "culled” cattle, especially those that are too
sick to travel to the Southern markets (Ferguson, 1967, p. 35).Fresh beef is preferred in the Southern Provinces because of itsflavor. Fresh meat preference in Nigeria may be due to the way
in which it is traditionally cooked: most of the meat is deboned,
cut up into small pieces and cooked for use in stews with roots
and grains (USDA., 1972, p. 33), In this case, the freshness of
the meat is more important than the cut. This has been stated
in these words:
Fresh meat is often preferred to chilled or frozen meat. It is not clear, however, how far this is due to mishandling during chilling and freezing, and the ignorance or misunderstanding of these ways of preserving meat. The lack of a refrigerated market channel from the abattoir to the consumer is the main obstacle to the introduction of frozen meat.There is also the question of how far the natural process whereby the meat matures after slaughtering has been interrupted by chilling. It may be that when chilled meat was offerred on the market it was not so tender as fresh meat (Mittendorf and Wilson, 1961,p. 28).
Since there is reluctance on the part of consumers to buy cold or refrigerated meat, the marketing system should be
made to deliver live animals as close to the consumption areas
as possible. This suggests that it is necessary to slaughter cattle near the point of final consumption. This can become
possible only if the government subsidizes transportation to the
rural markets because unsubsidized transportation would make
beef too costly for the most vulnerable consumers. The question
raised here is whether subsidized markets for meat can be per

,153fectly competitive or not. The answer to this can be found in
the statement that subsidization can be used as a means to neutralize or reduce resource misallocation under certain conditions
(Cumberland and Beek, 1967, p. 255). An action taken by the
government, in the short-run, to develop human capital may not
necessarily be consistent with a perfectly competitive allocation of resources. In the long-run, the market should become subsidy-
free and competitive. However, the government can choose to make
promotional subsidies without government ownership. The govern
ment can also create incentives so that the private sector will
eventually take over management of the distribution systems on
a profit basis. In Nigeria, government subsidy is very necessary
if cattle traders are to be encouraged to deliver cattle not to
only urban centers, but to the rural markets. Stressing the need
for links between separted markets Fromm said:
Transportation is the link between geographically separated markets, whose growth can maintain a balance only if transportation is provided in efficient amounts and at efficient rates.Efficient pricing of regionally separated activities requires that the difference between the prices of homogeneous goods at different locations should not exceed the marginal cost of transporting these goods.In other words, if the difference equals the marginal cost of transportation, an interregional commodity flow will take place (Fromm, 1965, p. 120).
Refrigerated Meat Transport The beef cattle marketing system has been criticized for
being wasteful and costly to consumers in Southern Nigeria. Its wastefulness Is caused by weight and quality losses due to in-

; .15^efficient means of transportation from north to the Southern Provinces. The transportation of meat from the urban to rural markets can be made more efficient by the use of refrigerated
trucks and rail cars, trailers, and van containers. Such methods,
might be a better distribution alternative to the present means
of moving live cattle on—the-hoof, truck, and train. A large-
scale operation of refrigerated meat trade would cut down the
unnecessarily large number of middlemen that help to raise the
price of the beef to the local consumers. "In some cases, meat
is sold directly from the first level retailer to the consumer;
in other cases, meat may pass through as many as three retailers
before reaching the consumer" (Arthur Little, Inc., 1964, p. 25).
Shrinkages and weight losses Incurred during live cattle movement are almost eliminated.
Refrigerated meat transport saves feeding and labor costs
because only the marketable carcasses and offals are transported
to the consuming region. In an experiment in South Africa, weight losses on refrigerated carcass amounted to only 1.5 per cent (Mittendorf and Wilson, 1961, p. 59). In Nigeria, live weight
losses of 10 per cent, 12.5 and 13 per cent on cattle trekked
from Kano to Ibadan, Kano to Ilorin, and from Jibiya to Ilorin had been reported (Jones-Davles, 1967, p. 330 and Werhahn, et al.,
1966, pi 23.). Apart from weight losses, live cattle transport by rail and truck causey severe bruises to animals en route (Ilori, 1972, p. 59).

M 5
Presently, there is & small scale trade on cold meat
from the central abattoir at kano to the southern urban areaswhere foreigners and some urban Nigerians patronize the trade.
The abattoir handles only 400 cattle daily, and has a cold stor
age capacity of about 25 per cent of daily slaughter (Ministry
of Agriculture and Nat. Resources, 1974, p. 21). There are a
number of obstacles to the expansion of this trade, which is
limited to the urban areas because cold storage is available only
in such towns as Lagos, Ibadan, Enugu, and Port Harcourt. There
are many foreigners and some educated Nigerians who buy the re
frigerated meat. In rural markets, cold storage facilities are not available (F.A.O., 1966, p. 223), Most southern Nigerians
are very skeptical about the technology of beef refrigeration.
They complain about the taste of refrigerated beef.^
The use of refrigerated trucks, rail cars, trailers,
and van containers in the transportation of beef from Northern
Nigeria and distribution in the Southern Provinces may make the
cost of beef much more expensive than it is at the present time.
^In rural areas in Nigeria, ice is mystical and refrigeration is uncommon. Rural consumers in Nigeria are, therefore, afraid of eating refrigerated meat. The consensuses of local opinion are that:
(1) refrigerated beef comes from sick cattle that are unable to travel to the south:
(2) fresh beef is associated with fresh blood and the fact that refrigerated meat has no fresh blood means that it is not fresh before local Nigerian consumers:
(3) refrigerated meat is not as tender as fresh hot beef, and the test of refrigerated meat is not very appealing to local consumers.

: 156In order to operate interregional and intraregional refrigerated
truck service cheaply, there must be some return load from the
consuming area. Such a backhaul would include avacado (Persea
americana), banana (Musa sp.), cocoyam (Colocasia spp.), pawpaw
(Carica papaya), pineapple (Ananas sativus), pumpkins (Cucurbita
maxima), and yam (Dioscorea). Another difficulty with this trade
is the technology. Nigeria does not produce refrigerated trucks,
rail cars, trailers, or van containers. Though the trucks, trailers
and vans can be purchased from abroad, mechanically refrigerated
trucks are very expensive and the effects of possible breakdowns without mechanics to repair them must be taken into consideration.
However, the greatest obstacle to the use of mechanically refrigerated trucks, trailers, and van containers is the attitude
of the southern consumers who prefer hot fresh beef to cold, re
frigerated, or chilled meat. An entrepreneur who ventures into large-scale refrigerated beef trade in the country now is likely to fail. For an enterprise to succeed there must be a demand
for its product. Most of the protein-deficit groups in Southern
Nigeria would not eat cold beef. To change this attitude needs some time for a new food consumption education, through extensive
government advertisement programs. Some alternative meat sources
have been suggested as a means of increasing protein intake in the area.
New Food ProductsThe need to make sure that any food consumed in any

: -157significant quantities has the necessary nutrltonal value has
led to the consideration of new products. The production of
new foods such as freeze-dried meat, canning, sausages, fortification,
meat analog, as well as improved plant hybridization techniques, purchase from abroad and fishing have even been mentioned. Each
has its merits and demerits, costs and benefits.
Freeze-dried Meat
Following indigenous methods,^ meat could be freeze—dried in the cities before being shipped to markets in the rural areas.
Freeze-dried meat can be produced without reliance on weather and
scale economies can be practices. (1) The difficulty is that electricity for processing freeze—dried meat is very expensive in Nigeria, (2) Also, freeze-dried meat can easily be subjected
to spoilage because of high humidity. (3) Dried meat is consumed only in the Western Provinces, and there may be insufficient
demand for a large-scale enterprise to operate profitably.
Canning
Meat can also be canned and then transported in tins or
cans to the consumers. Presently, there is a limited number of
^There are local and indigenous dry meat centers at Maiduguri and Nguru, which use cattle that would die in transit if walked, trucked, or railed to the south. The local meat drying takes place during the dry season from October to April. The procedure is very ancient and small-scaled. The meat is first flayed, cut into cubes, boiled, dried in the sun, and then smoked over a wood fire. The bulk of the dried meat is shipped to the Western Provinces.

158
beef canning plants in the country. In 1973, one of the plants,
the Nigeria Canning Company at Kano, shipped 56,755 cartons of
corned beef and 5,250 cartons of "jollof" rice-beef to the southern markets. The factory used approximately 6,740 head of
cattle that year for its production.^
Canned beef has a limited market in Southern Nigeria be
cause of the value added by manufacturing. Low income makes it
impossible for rural consumers to buy corned beef.
SausagesThe production of sausages has been suggested as a means
of supplying the local people with preserved beef. A new food
product can only be accepted by the people if it calls for a minimum change in eating habits. Sausage is quite a new food
product to rural consumers. This should be considered as a long
term project that cannot solve the immediate protein malnutrition
problem in the country.
Fortification
Fortification of starch foods (cassava (manioc), corn,
rice, yam, etc.) has been suggested as the most promising im
mediate possibility for improving protein nutrition (Jansen,1974, p. 41). The nutrtional value of cassava, a very important
^Thls information was obtain by letter communication with Mr. James Frederick Trew, the general manager of the Nigeria Canning Company at Kano. A carton of corned beef contains approximately 15 pounds of beef and a carton of jollof rice contains about 6 pounds of beef.

,,,159
Staple food in Southern Nigeria, can be improved by the addition
of protein concentrates. For example, the introduction of enriched rice in Japan has made beriberi a minor factor in mortality
rates (Mitsuda, 1969, p. 215). Commenting on cassava foritifica- tion Jansen said:
Concentrates are also of value in serving as a supplemental source of protein in cassava-based diets where little protein is normally present. In such situations almost all the protein will be supplied by the concentrate thus justifying concern about the amino acid pattern of the concentrate per se (Jansen, 1974, p. 67).
Fortification of protein vegetable foods would remove the propensity of meat products to shrink and spoil, if kept for a
long time. The removal of these risks means that the foods can
compete favorably with other foodstuffs in the market. Fortified (package) protein foods are easy to store for a long time and this
means that seasonality of protein food supply is eliminated.
Fortified food products have some difficulties. Protein supplements, generally speaking, have adverse effects on accept
ability of the final products (Jansen, 1974, p. 107). It may be difficult to make rural consumers to buy fortified foods, because
changing the eating habits of man is always an unrewarding ex
perience. Many Nigerians like the taste of beef. The fact that it contains protein which is an essential ingredient in body
building is secondary to the people. In Nigeria consumers emphasize palatability rather than nutrition, and for any nutritional program to be effective Goldblith has concluded that:
. . . in order to be effective for a maximum group of
160,.-
people, a method of providing protein must do so with a minimum of change in the food and dietary patterns, in cultural practices, or in food habits. Any remedy in malnutrition which involves a change in food habits is likely to be ineffective in the short run. In the long run (i.e., certainly a generation's time hence or more) the increasing trend towards urbanization while creating an increasing number of problems related to urban living can also make it easier for more effective communications and education and advertising and thus can be helpful in beginning to change dietary customs (Goldblith, 1970, p. 26).
There is an added transport cost which must be passed unto thelocal consumers who are the least able to pay.
Meat Analogs
Meat analogs resemble meat in some functional character
istics, such as flavor, texture, color, and appearance. Meat
analogs can be both palatable and acceptable. However, the new
textured protein foods will demand a higher price in the market
place than the raw commodities from which they are made (Altschul,
1974, p. 410). The high cost of this product would eliminate the most vulnerable consumers who need high quality protein the
most. Other difficulties associated with meat analog have been summarized when it is stated that:
An essential point to be borne in mind in any case is that the addition of synthetic amino acids will only improve the quality of the protein without increasing the concentration of the protein in the food or the diet, whereas the need to increase the latter is often the most important problem in many developing areas (Altschul, 1974, p. 41).
The quality of amino acids added to meat analogs may deteriorateduring the course of enrichment, drying, and cooking.
In view of the problems involved in attempting to find

161
protein-rich mixtures to supplement deficient diets, the best
option, presumably, lies in using the protein-containing
materials (beef) direct as food rather than turning them into
protein concentrates or meat analog (Aylward and Jul, 1975, p.
64)• Owing to limited resources and the urgent need for est
ablishing priorities, there should be less involvement on the
development of new food products. Emphasis should be led on
finding ways to reach the people with the already known and
available protein sources. "Development is for the people and the current wants of the people should not be ignored for the
sake of raising per capita output in the future" (Higgins,1968, p. 367).
Alternative Meat Sources
More recently consumers in the Southern Provinces have
been encouraged to eat fish, mutton, pork, and goat meat in
order to increase their protein intake. The difficulties that
each source suffers precludes further development. Though out
side the scope of this paper, each source is considered briefly
below without any close examination.
Fishing
In Southern Nigeria fishing operations are very traditional.
They are conducted from tree-trunk dugout canoes which are propelled by poling. In some areas fishing is conducted from floating isl-:
:162lands.^ The fishing equipments in the country comprise simple
home-made basket traps, small throw nets, spears, and hooks of
bent wood and bone (Floyd, 1969, p. 241). The catch is very
small per person per boat. It has been estimated that the aver
age catch in Nigeria per fisherman per annum is about one ton by
weight (Hance, 1964, p. 194).
Since the catrh in the Southern Provinces is very small, trade in banda (smoke-dried fish) from Lake Chad area, has deve
loped but the journey from that area to the Southern markets takes about seven to ten days (Nzekwu, 1963, p. 248).
In an effort to keep the fish in good condition until they arrive in the southern markets traditional curing is prac
tised. The technique is so crude that when the fish arrive in the southern markets they are infested with insects, particularly
beetles, and the protein losses amount to about forty per cent.
The situation has been clearly depicted when it is stated that:
Fish is cleaned and cut up into small pieces. Grass, sometimes not perfectly dry, is collected and the pieces of fish are spread on it. The grass is then set on fire and while it burns, the pieces of fish are partly smoked, partly cooked, and partly burnt but they are still far from dry. They are then spread out in the sun until they are completely dry. It is during this process of drying in the sun that the insects which are not wanting in banda apd which reduce into a pulp
®The roots of papyrus plants which grow on the shores of Lake Chad bind the top soil together. During a storm some suckers with roots break off the main body and float on the lake. Often the Budumas chop off portions of the paprus bush in order to obtain a floating Island from which they can fish. A floating island can be as large as fifty feet in diameter (See Nzekwu, 1963, p. 250).

or powder the flesh of the fish find their way into the pieces. The insects increase and multiply during the long wait for tansport to take the fish from the lakeside villages to Maiduguri (Nzekwu, 1963, pp. 249-250).
Presently only twelve pounds (66,000 metric tons) of
fish is consumed per head per year in the Southern Provinces
(Floyd, 1969, pp. 239-240). It is only by using improved fishing techniques that the Nigerian fishermen can make substantial con
tributions to ward off protein malnutrition in the country. This can only be possible through the development of pond-fish culture, the construction and stocking of artificial ponds with young fish
and fingerlings. The development of marketing facilities which
include transportation-distribution infrastructures are very im
portant for any improvement in fish protein intake in the country in any forseeable future.
Mutton. Pork, and Goat Meat
Mutton, pork, and goat meat— all contain proteins in vary
ing amounts. Can they substitute for beef in the south? In the
Southern Provinces the ubiquitous tsetse flies, through the para
sites they transmit, restrict all livestock raising. The breeds
of sheep, pig, and goats, are small and the rate of mortality
is very high (F.A.O., 1966, p. 216). At maturity these animals
yield carcasses that are rather lean and masculature. Some of the runimants are tethered, but most of them roam about the villages, over fellow lands, and even amongst the oil palms and coconut trees
of the large plantations. The indigenous pigs are mostly scaven
gers and the ardent Moslems in the west do not look on pork as

164
clean meat. The F.A.O. (1966, p. 224) Report concludes that con
sumption of these meats is hindered by the extent to which these
local animals suffer from intestinal parasites. Perhaps, because
of insect infestation that makes cattle raising unproductive, people in the Southern Provinces are not stock-minded and they
depend on cash and plantation agriculture. Beef cattle from
Northern Nigeria presents a more immediate solution to the protein shortages in the south.

CHAPTER V
GOVERNMENT POLICY, PRODUCTION, AND DEMAND
The problem of wide disparities in levels of income and
economic development among nations and regions has increasingly become a concern of economists and policy makers in the post World War II period (Cumberland and Seek, 1967, p. 253). The
problem of protein nutritional disparities, has not been seriously viewed by Nigerian development planners. However, income levels
have strong effects on the type of food consumed. In this chapter
the strategies of policy implication in the promotion of beef con
sumption will be developed. The development of human resources
as a distinctive and important feature of the economies of the high
income industrialized western nations has led to some focus on pro
tein consumption not only by food scientists but also by social scientists. It is echoed that:
Much of what we call consumption constitutes investment in human capital. Direct expenditures on education, health, and internal migration to take advantage of better job opportunities are clear examples. . . .In these and similar ways, the quality of human effort can be greatly improved and its productivity enhanced. I shall contend that such investment in human capital accounts for most of the impressive rise in the real earnings per week (Schultz, 1961, p. 1).
Decision to improve the diets of all Nigerians (urban and rural)
should be viewed as an integral part of economic development,
165
166and can only be achieved through the development of transportation-
distribution-marketing systems properly designed to emphasize
the interrelationships between north and south, producers and con
sumers. This has been emphasized when it is said, "Physical distribution may be viewed in a passive way as the backup capability
to support the marketing objectives of the firm" (Bowersox, et al., 1968, p p . 24-25). The goals of Nigerian society, expressed through the Federal government on the Second National Development Plan
1970-74 are the acceleration of the rate of economic development
and improvements in the standard of living through the maximum use of national, financial, and human resources for the expansion
of the economy (Fed. Min. of Information, 1970, p. 33).
Once a rise in per capita income is established, the prob
lem of initiating and intensifying protein food consumption in
spatial terms is concerned with funneling fresh protein foods
from production regions to consumers in the more remote parts of
the country. Time-cost constraints which stem from poor, inefficient, and unreliable transportation-distribution links between
separated regional markets severely hamper perishable protein food consumption in Southern Nigeria thus accentuating protein malnutrition not only in the periphery but also in the urban centers. Presently, per capita incomes in Nigeria are so low that
the malnutrition problem can only be solved by government inter
vention through the provision of transportation subsidies to provide an adequate distribution system.

SubsidiesSince the disposable Incomes in Nigeria are so low that
people cannot afford .to pay for high cost protein foods, it isthe place of the government to alleviate the protein malnutritiondilemma. This can be done by subsidization of cattle movement
from north to the southern markets. "Livestock is availablefrom the north to increase slaughterings as fast as the demand
for meat Increases" (Arthur Little, Inc., 1964, p. 5). Table 16
gives the quarterly total production for 1974 (i.e., the numberof cattle that was available for sale from Northern Nigeria).
Local production was lowest during the third quarter because
during the rainy season, cattlemen do not sell their cattle.
There is grazing for the herd. Above all, during this time,
cattle drovers, the greatest carriers of cattle, are unable to
trek with cattle to the south. In 1974, local cattle production
was highest during the second quarter (Apr11-June) the heart ofthe dry season when grazing is scanty and the herdsmen have tomove with their cattle to the more watered savannah areas in thesouth. Compared with 1971 local trade cattle production it can
be seen that production is increasing. In 1971 there were 595,729trade cattle as compared to 675,682 in 1974. Commenting on theIncreased production it is stated that:
. . . it can be seen that 185,646 head of locally produced trade cattle were recorded during the second quarter of 1974. This shows an Increase of about 26.0% more than the figures of the second quarter of 1973 (Nigerian Livestock and Meat Authority, 1974, p. 2).

TABLE 16
QUARTERLY TRADE CATTLE PRODUCTION IN NORTHERN NIGERIA, 19?4
Provinces 1st Quarter 2nd Quarter 3rd Quarter 4th Quarter Annual Total
1 . AâamaiNa 2,377 4,348 8,793 6,520 22,038
2 . Bauchi 3,586 8,039 7 ,194 - 18,8193. Benue 5,^76 6,751 7,792 6,004 26 ,023
4. Borno 57,848 61,675 47,124 63,728 230,375
5. Ilorin 14,865 24,835 3,590 1 ,161 44,451
6 . Kabba 1,454 1,630 1,919 707 5,710
7. Kano 35,693 34,877 19,984 38,470 129,0248. Katsina 7,544 3,825 5,243 7,011 23,623
9. Niger 1,953 7,443 13,930 3,764 27,090
10. Plateau 6,741 6,787 10,426 6,84? 30,801
11. Sardauna 3,596 5,507 7,061 6,838 23,002
12. Sokoto 22,188 17,129 22,608 20,563 82,48813. Zaria 1,610 2,800 4,102 2,373 10,885
TOTAL . 165,931 185,646 159,766 164,339 675,682
H-'S
Sources Nigerian Livestock and Meat Authority, 197 .

The practice of attracting a special development project to a cer
tain locality by means of Inducements or subsidies Is very old
(Cumberland and Beek, 1967, p. 254), The devices of tax exemption,
leasing of sites or plants at a low rental and subsidization of transport costs, all mean that the enterprise is not required to
pay the full value of the transfer costs (Moes, 1962, p. 3).
The Nigerian government can eliminate protein deficiencies In the Southern Provinces by subsidizing beef cattle transport to
the most vulnerable areas. This can be done by either direct fin
ancial assistance to cattle dealers who deliver their beef cattle
to rural areas, or It can subsidize transport costs which will In
turn bring down the cost of beef per pound In the rural areas.The government can build slaughtering slabs and cattle Inspection
units In the rural areas so that cattle dealers do not have to travel far for these services before slaughtering the cattle.
Some economists have rejected subsidization as unwarranted- government Intervention with the efficacy of resource allocation (Cumberland and Beek, 1967, p. 254). Various governments have
granted subsidies for purposes of generating high returns on the
subsidies to the local community (Moes, 1962). The major factor
Is the desire of the government to Insure that adequate and
efficient transportation Is available to serve the public needs.
In the early nineteenth century, the United States government
granted vast acreages for the development of railroads and canals (Luna, 1971, p. 92). Typical examples of such subsidized enter
prises are the Interstate Highway programs In the United States

: 170and the government owned rail system of western Europe and Nigeria.
Since the early part of the twentieth century, almost all countries have extended subsidies to the air transport industry (Luna, 1971, p. 109; Pergrum, 1973, p. 468).
The question often asked is whether the industries receiving
subsidies are likely to be competitive. Subsidization does not necessarily encourage perfectly competitive allocation of resources,
but correction of the misallocation of resources requires inter
vention by government (Cumberland and Beek, 1967, p. 262). In Nigeria, regional dualism prevents pure competition for equal dis
tribution of resources. Subsidization is, therefore, very necessary as an incentive because capital and entrepreneurial skills are
scarce. Commenting on this Helleiner (1966, p. 145) said. "The bottleneck to development in the modern sector is not labor, but
capital, skills, and entrepreneurship." In Nigeria, the develop
ment of distribution facilities for public use should be started
by government initiative within the framework of government control.
Japanese experience in this respect is invaluable. Theearly industrial development of Japan was planned and carried out
by the state. When the Initial difficulties were overcome, the
state handed over the projects it had started to the private
sector. Summarizing this, Spengler concluded that:The government, moreover, offset the lack of an adequate enterpreneurial class by performing many of the functions of this class and facilitating the accomplishment of others through the use of appropriate monetary, fiscal, and related policies. By 1930 the relative number of workers engaged in agriculture and fishing had fallen

171
to about 50 per cent from an estimated 85 as of 1873 (Spengler, 1951, p. 44).
In Nigeria, the government can subsidize and supervise the transportation and distribution of beef cattle from the north to the
south. The private sector which Invests In the projects should
be allowed to make some profits on their Investments so that
there may be room for expansion and improvements. Complete
government control under the auspices of statutory government co
operation may be counter productive. Most of the agricultural projects In the country that have failed can be traced to total
government control under the auspices of Government Provincial Farms, Farm Settlements and Regional Development Corporation.
The establishment of independent privately owned companies for transporation, distribution and marketing of beef from the north
should be encouraged and, this author believes that private business
with profit motive Is the only reasonable solution to proper
handling of the beef cattle trade.
TaxationSince the beef cattle trade from north to south converges
on the southern urban centers, the Nigerian government, apart
from the provision of Infrastructure, granting of subsidies, and supervision of the trade, can also regulate beef cattle slaughtering in the urban areas. It can set a limit on the maximum number of cattle that should be slaughtered In each town per day. Any additional cattle slaughtered above the maximum

172number set for the town should be taxed; the tax progressively
higher as the number of cattle above the maximum increases. The
tax thus collected should be used in the subsidization of cattle transport to the rural markets. The tax income can also be used in paying supervisors (sanitarians), who look after the proper
handling and slaughtering of the beef cattle.
This kind of tax policy has been commented upon by anumber of experts:
In some countries inducement policies are combined with a policy of discouraging further expansion of highly developed, fast growing, metropolitan regions, through a system of building controls as in England and France (Cumberland and Beek, 1967, p. 253).
The situation has been diagramatically illustrated in Figure 21.OP is. the population that would have enough protein if OQ is supplied.
Either because of scarcity or high costs of DC, consumption is reduced to CM. At DM only the affluent population is well fed
while MP is. deficient in protein supply. Local subsidy of OB permits consumption MN (i.e., ON). If extra consumption by OM is taxed, a subsidy of AC is generated. This is the difference
between maximum 00 and the marginal consumption OA by the population OP. What is available now can be given to NP which means all are fed, or OP has adequate protein intake.
The taxation of cattle slaughtered above the authorized maximum number in the urban areas would be a means well devised
to release some cattle directed to urban centers for slaughtering at the rural markets. Butchers who would choose to slaughter their cattle or retail slaughtered carcasses in the rural markets

173
Subsidization by Taxation
Quantity of Meat
Number of People Receiving Meat Figure 21 ,
OP = People Receiving Protein Foods (Meat)OQ = Quantity that would give adequate nutrition High cost at 00 reduces consumption to OM (Affluent population)OB = Local Subsidy permits consumption by MN (i.e., up to ON)AC = Subsidy provided by taxing above maximum consumption by OM. This provides extra for consumption by NP.The entire population (both rich and poor) are now supplied with sufficient protein foods.
/// = Area moved by government subsidization policy.

should be exempted from the tax, and this would be an. Incentive
for retail butchers to sell their meat at the rural markets.
The difficulty in this policy is that it would lead to corruption in the beef cattle market. Butchers would try to suppress the number of cattle that they are allowed to slaughter in
the urban centers by offering bribes to the tax collectors so that
they may be allowed to butcher more cattle than the maximum number set up for each day in an urban area. The number of cattle
allowed for each urban center would be based on its population; but the regulated cattle slaughter and sale would make no pro
vision for people with poor purchasing power in each urban cen
ter. Perhaps the taxation policy would lead to the setting up of an elaborate department for its collection. This would need
some time for training and development. However, all the cattle
inspected and slaughtered in all registered slabs in the country are charged some fees for the services and there seems to be notrouble with the operation of the system. At Ibadan, the chargefor the use of the facilities and services is (Nl) one Naira
(US $1.60) per cattle (Arthur Little, Inc., 1964, p. 2). Shouldthe policy be implemented upon there will be protein foods avail
able to the people no matter whether they are urban or not. This
would mean elimination of protein deficiency even among the most vulnerable groups in both rural and urban areas.
Putting More Cattle Into the SystemThe taxation of cattle slaughtered above the authorized

175
maximum number in the urban areas will release some cattle that
arrive In the urban centers to rural markets. In order toavoid the taxes butchers will choose to slaughter their cattle In
the rural markets. Presently, the Fulanl cattlemen pay sometaxes (jangali) per head of their cattle (Ministry of Economic
Planning, 1970, p. 107). In Southern Nigeria cattle are not taxed.
The cattle tax works against cattle raising In the north, and asa result the Fulanls try to evade taxation by not allowing their
cattle to be counted or by hiding them (Min. of Ec. Planning, 1973,
p. 107). The retrogressive effects of the cattle tax has beenrecognized by the former head of state when he said:
Government has agreed in principle to abolish throughout the country, the age old cattle tax, otherwise known as Jangali. This will bring some relief to the Fulani cattle owner on his capital and encourage him to keep his cattle within the country (Gowon, 1975, p. 6).
The government should not tax breeding stock. Cattle that are kept above the breeding age should be taxed. This kind of tax
may be to persuade people to avoid hoarding (Higgins, 1968, p.
524). To do this, the average breeding age should be established. The number of cattle to be grazed on available acreage depending
upon season should also be established. Defaulters should be taxed accordingly. The cattlemen who refuse to pay the tax should
have the option of giving a certain percentage of their cattle to
the government that will eventually release them for sale. The
cattlemen can, if they like, sell their cattle to the government at a cost that will meet the tax expenses. In this way, the government does not force any cattlemen to do anything, but give him a

'i-76number of alternatives*
There should be programs to settle the Fulanls. Settle
ment will lead to urbanization and the Introduction of luxury living. The longing for luxury living due to demonstration effects
in urbanized areas will force the cattlemen to sell their cattle.
The children In the families should be made to go to school by
means of compulsory primary education. The need for higher education will force the parents to sell their cattle in order to pay
the children’s fees, buy books, and pay for their room and board.
The educated children will come to appreciate higher living standards and this will encourage selling some cattle to meet high costs of living.
Food Science Education
Though the real cause of protein malnutrition in Southern Nigeria is Inadequate transportation-distribution-marketing channel
of the existing beef cattle, the problem of ignorance on the part
of the local consumers needs Immediate attention. Protein intake
in the Southern Provinces can be improved if food science educa
tion goes hand in hand with all other attempts aimed at correcting the protein malnutrition problem. Nutrition education will
be effective if it is extended to all members of the community.
If the present protein sources in the country were properly distributed and fully utilized, no protein malnutrition would exist (U.N., 1971, p. 24). It is the effort to promote not only proper transportation and distribution, but also effi—

1? ? .
dent utilization of the available protein sources that the need for educational and promotional programs are necessary.
In order to educate local consumers on the need for
adequate protein intake, nutrition should be included in the
overall planning for economic development. This means that
national nutrition policies should be developed. There should
be pilot project centers set up to help in the improvement of national nutrition policies.
Since protein malnutrition is more prevalent among theyoung, nutrition education should be planned also for mothersand housewives in maternity, child care and mother-craft centers
(President's Science Advisory Committee, 1967, p. 84). Thoughlack of purchasing power is a constraint to good nutrition, it
may also be due to an information gap (Berg, 1973, p. 74). Inthe mother-craft centers information can be easily spread and the
introduction of refrigerated beef into meals can be encouraged.Old food habits may be changed in that way, though they are mostdifficult to change-
old habits may be difficult to change, but it must be recognized that nearly all of the major and popular food items used today were introduced into Nigeria mostly from other countries. As per capita incomes and the general level of edcuation rise in Nigeria, and as nutritionists convince people of the need for improved diets, a fairly rapid adjustment in food preferences may develop (Johnson, et al., 1969, p. 38).
School lunch programs may be valuable in furnishing the
children with the needed protein meals and in teaching them the essentials of adequate diets. Lessons in schools about nutrition
■ - 4^®will help the children to practice balanced diets at home,
especially after school life. Community feeding centers should
be opened for demonstrating and disseminating Information on the use and preparation of protein foods. The local community should
be encouraged to take active part In the centers* programs.
Protein foods should be encouraged In all restaurants. Advertisement programs should be promoted by radio, television, and newspapers. For more effective nutrition programs, extension
officers should be trained In universities and other Institutions of higher learning so that they may go out Into the local com
munities to demonstrate as well as supervise the established
community protein nutrition centers.

CONCLUSIONS AND SUGGESTIONS FOR NIGERIA
Most of the less-developed countries (of which Nigeria is one) are engaged in strenuous, even frantic struggle for econ
omic development. In concluding this treatise it is wise to examine some of the wider implications of development for Nigeria. In order to sustain economic growth in the country the
amount of protein intakes, in the Southern Provinces must be increased. Why is it necessary to increase protein intake in the
country in order to promote economic development? Increase pro
tein intake in Nigeria will avert the malnutrition problem that
causes infant and young child mortality, stunted growth, pre
mature aging, reduced life span, reduced work capacity, and im
paired learning and behavior in later life.The overall effect of malnutrition is that it retards econ
omic as well as social development. The advantage of increased
protein intake is that by augmenting the supply of the essentials
of life it enables many people to choose life rather than death; i.e., it enables more children to live out their lives and it ex
tends man’s life span. The reduction of protein malnutrition in Nigeria can be seen as a prerequisite for the development of human resources. Adequate nutrition is a fundamental as well as a basis for all economic and social development (U.N., 1971, p.12). In Nigeria the development of human capital is necessary
179

, ; :180
for the economic development of the country.
In the past, the Nigerian government has tended to treat protein malnutrition as a problem of the individual family. Today
the complexity of the protein malnutrition problems coupled with
their interrelationships with all other aspects of social and
economic development have demanded that the country should (a) plan and develop efficient transportation-distribution systems of beef cattle from the Northern to the Southern Provinces; (b)
develop a national protein nutrition policy to serve as a guide to the country's national administration; (c) develop protein nutri
tion projects in the field of food and nutrition including consumer
nutrition education; (d) set up institutions for the training of sufficient professional personnel in science and technology related
to food nutrition; (e) subsidize movement of beef cattle from the
production region to the rural areas in the deficient areas where the most vulnerable consumers are least able to buy beef because
of poor purchasing power; (f) build new railroads to link all the
provinces in the south with those in the north. The links should also make it possible to move from east to west by rail; and (g)
improve as well as build highways that will make it possible to move perishable foods in the country without undue delays.
In the Western countries the development of improved distribution systems or distribution methods has a generally beneficial effects on the entire distribution channel. Most large companies that embark upon a comprehensive distribution program
have also a physical distriBution service division with the pri-

181mary mission of coordinating customer systems with supplier
systems (Bowersox, et al., 1968, p. 27). Improvements In beef
distribution in Nigeria can be considered in terms of improvements
in the physical distribution management. An efficient physical distribution management will lead to élimination -of .pn-thè-hpôf movement of cattle, modernization of truck movement, and the effective use of the railroad. Adequate provision of rail cars are necessary in order to avoid unnecessary delays for the shipment of cattle at the railroad stations.
An efficient distribution management will also help in
the redistribution of beef cattle when they arrive at the south
ern regional centers to the rural markets. The vulnerable groups In Southern Nigeria cannot Improve their protein food intake
unless the foodstuffs are delivered to them at a price that they can afford to pay.
Insights for Interaction Theory in GeographyTraditionally, geographers have assumed that Interregional
trade takes place because of areal differentiation In the resource base and economic specialization. Today it is clear that differ
entiation and specialization alone do not necessarily result in interaction between places. Close examination indicates that,
particularly in the less-developed countries, there are many different production and consumption regions that have little or no Interaction with each other, even though situated In close proximity.

182It is true that improvements in transportation increases
interactions between places, but improvements alone cannot be
held as truly accountable (responsible) for the interactions. Interaction between places occurs (and increases) as the rela-
tive advantage increases. There is a mntual interdependence in all forms of interaction.
Geographers like to think of river valleys as natural
routeways and the reason why highways, railraods, and even footpaths pass through them. In a study of the Great Australian
Divide as a barrier to railway communication, Appleton (1963, p.
114) observed that a natural routeway provides an opportunity for communication, but does not, necessarily, provide demands.
Taaffe, Morrill, and Gould (1963, p. 516) in their study of the
development of transportation in less-developed countries pointed
out that variations in the physical landscape are relatively unim
portant in determining transportation development. Before th
arrival of the Europeans in West Africa there was trade across the Sahara between the Arabs and West Africans. The great expanse of desert did not prevent the movement of goods from the
Guinea Coastal lands to the Arabian territories. The movement of commodities can, therefore, be seen as a response to a set of stimuli rather than as alternatives or substitutes.
Areal differentiation is a great generator of spatial movements. The above example can help to illustrate that for movements to occur between any two places there must be, at

; 18^
least, demand (pull forces) in one place and supplies (push forces) in another. Then the movement may be generated through
areal differentiation based on natural or cultural causes, or on economies of scale. In the less-developed countries natural endowments are the major forces promoting movements. In the indus
trialized nations cultural (or technological) forces and economies of scale are the main forces behind all movements. It can here
be emphasized that heavy investments in infrastructures promote interregional trade while technological advancement allows for
global movements (or international trade).
This is typified in the case of chemical fertilizers and
other manufactured goods that are moved enormous distances from the United States to markets in West Africa, Asia, and other parts
of the world. Manioc is not moved from South America to the Guinea Coastal markets because there is no demand for manioc
there. West African farmers produce enough manioc and it is cheaper to buy it locally. An important aspect of movement is what Ullman (1957, p. 21) called "complementarity." The importance of complementarity is so great that petroleum moves great
distances to the United States and Japan. The movement of petro
leum from the Middle East and West Africa (origins) to the United States and Japan (destinations) is not difficult because there is no intervening opportunity (alternative destination). The industrialized nations not only have the demand for petroleum, but they can also afford to pay the high costs of petroleum ex—

:n184ports. The mutual Interdependence of this movement is very clearly pictured here.
There are other factors that govern the structure, direction, and consistency of commodity flows apart from demand and
supply. The contemporary ideology of development planners in
deciding from where needed goods should be imported may affect
the direction, structure, or the consistency of commodity movements. This may be in the way of prohibitive tariffs that make
it impossible for traders to make profits because nobody wants
to buy such expensive goods. Governments can ban the sale of
goods from particular countries because of incompatibility in
political ideologies. In most Anglophone countries in Africa, marxlst goods (especially books) are banned. In the twentieth
century Japanese goods were regarded as cheap goods hence Japan lacked trading interaction with other countries because no coun
try wanted to trade with it in its cheap goods. Cultural beliefs
or tradition may exclude trade in certain commodities with other areas or countries. India which belives that cattle are sacred
animals does not trade in beef with other countries. It therefore lacks interaction with other countries in this trade even
though there is a demand and it has the supply.If transfer costs are too great, movements (potential
and actual) between any two places will not occur even though there is complementarity and no intervening opportunity. If the cost of overcoming distance is too high, poor local sub-
sis tutes will be found, or people will choose to go without the

185
In demand. If demand cannot be met the people will choose to do without the goods. This may mean living the live that
their forefathers lived without any change. À typical example
of this is the unsatisfied need for beef in Southern Nigeria.
The cost of overcoming cattle movement from the North to the
South is very high and has resulted in meat costs higher than
most of the poor consumers can afford to pay. As a result of this situation, the poor people choose to do without beef or
meat in their meals. Protein deficiency and malnutrition are
the end results.
Movements between any two places (origin and destination) will increase or decrease according transportation costs separating them, the number of other possible origins, and the alterna
tive destinations possible. Movements between places may be
related to the law of Newtonian physics which states that two
objects attract each other with gravitational force that varies directly with the product of the masses of the object and inversely proportional to the square of the distance separating
them. The larger the center, the more attractive the force it
exerts on other places. This is the reason why most travels in less-developed countries converge on primate (capital) cities.
Rural areas have no or little attractive forces for meat mar
keting. However, densely settled rural areas would consume beef had they the purchasing power and the presence of infrastructures as well as marketing organizations.

186
How the primate cities (which have the purchasing power in less-developed countries) attract movements into their areas
can be mathematically illustrated by the use of gravity model thus: ■
Ija = d.. (1)
Where:
~ Interaction between 1 and j for commodity
= Measure of sizes i and j. d^j = Distances separating 1 from j.
Under normal circumstance (as exemplified by the gravity model) a greater amount of movement takes place between two very
large urban centers than two very small villages. This is not always, necessarily so because the great distances which always
separate urban centers (primate cities) in less-developed coun
tries have modifying effects on the amount of interaction between such paired centers. This principle of distance decay was em
pirically tested by Zipf (1946, 1949) when he gathered data on
airway, highway, railroad traffics, and telephone calls between cities in the United States. Comparing the data with what would
be expected if the traffic between the cities were related to the sizes of the cities and inversely proportional to the distance separating them; it was discovered that the volume of movement decreases as the distance between the cities increases.

187
A celebrated variation of the gravity.model was put forward by William Reilly in his attempt to delimit trade areas
around centers. In his laws of retail gravitation, Reilly (1929) states that the trade boundary between towns (A and B) is equal to the relative retail pull power of the competing towns on an
intervening area. He then developed his 'breaking point' center
between competing towns. His equation reads :
= . (2)1 + P..__
Where: Dj^ - Distance from j to breaking point.
D^j = Distance between i and j.
= Sizes of towns i and j . k = Breaking point between i and j .
Huff (1963) tried to allow for probabilistic situations
in his formulation. He allows for choice between competing cen
ters. But he recognizes the constraint of a maximum distance that
a consumer is able or willing to travel for the purchase of his needs. A derivation of his formulation is put forward here:
T (3)
P(i,j,a,) = Probability that consumer at i will travel to j for commodity *a*

..,4 8 8
Sj - Size of urban center j,
Tj j = Time distance separating i and j .
Perishability Factor
A perishability factor can be introduced into the gravity
model. In this case the higher the factor the more perishable
the product (i.e., the lesser the interaction the higher the perishability of the product).This can be mathematically written thus:
(4)
^ = denotes perishability factor.Let us assume that P^ (100) and P^ (110) and the distance
(d^j) between i and j (25 miles) and the perishability factor (4) gives an Interaction of 110. This is lesser interaction than
a perishability factor of 2 which gives an interaction of 200.
The problem can be reformulated differently, for example:
I - k (5)d±j
Where ^ is a measure of imperishability; period of time with-
out deterioration. For example, there is trade in beef between
Katsina in Northern Nigeria and Benin City in the south. In this case P^ (Katsina) is 109.4 and P^ (Benin City) is 121.7 and the imperishability factor ( ) is 1 while the distance sep
arating them is 736 miles. The Interaction is 18.09, Or the problem can formulated differently, for example:

189
I = k IlZi_ (6)dyji)Where 0 Is a measure of the cost of preservation without deter
ioration. This can be illustrated with the trade in beef between
Maiduguri, Northern Nigeria and Enugu, Southern Nigeria. In this
case, (Maiduguri) is 140.0 P^ (Enugu) is 138.5, the distance
between them (dj j) is 747 miles and the cost of preservation with
out deterioration (0) is 2. The Interaction here is 12.9 The perishability can be expressed otherwise thus:
^ - weight, e.g., technological development:
(1) Modern transportment development(2) Refrigeration
(3) Canning
(4) Freez e-drying
Using the figures for 7 above the interaction between Maiduguri
and Enugu can be calculated with a technological weight (gC of
+.50 and perishability factor of +1,0. An interaction index of
51.91 is obtained.Owing to inadequate technology and demand based on the
cultural milieu, most foodstuffs in the less-developed countries
are highly perishable. The foodstuffs here include fresh meats, fruits and vegetables. The perishability of a product determines

190the areal extent of the market for a very short period of time.
If they are held off the market for a long time, losses caused by spoilage and deterioration in quality and mark-down in prices
will be incurred. A good example of this is the trade in beef between Northern Nigeria and the Southern Provinces. In order
to supply the southern consumers with fresh beef the cattle are
walked down from the north- The animals suffer from loss of fat
and some fresh during the long walk and the result is a markdown in prices. If the butchered meat is not sold on the very
day of slaughter the meat deteriorates in quality and the per
ishability is irrecoverable.
Implicit in the technique discussed above (which includes
the central place model) is the assumption that the consumer (all
things being equal) purchases his goods from the nearest source
or market. In Christaller’s model (central place theory) the
high order center is the nearest one, provided the consumer’s
savings in purchasing the needed items, from the higher order center, exceed the additional transportation costs incurred. In
any case, the purchase of low and high goods from a high order
center makes up for this, if the high order center is more dis
tant than the low order one. It may here be pointed out that consumers are rational satisficers and not economic men who try to optimize by minimizing travel effort.
Implication for Removing Food
Deficit in Less-Developed Countries

191
The protein malnutrition problem which results from in
efficient transportation-distribution systems of available food— supplies should not be considered in isolation but in conjunction
with the task of total economic and social development of the less-
developed countries. It is now well known that it is not sufficient
for the regions threatened by the protein malnutrition problems to work only towards economic development relying on the fact that given a greater economic growth, the problem of food deficit
and malnutrition will be automatically solved. It should, however,
be noted that one of the important goals of development should be
to guarantee the transportation, distribution, and marketing to of foods sufficiently high in quality proteins to the people.
Food deficit results in undemutrition and malnutrition;
and the impact of malnutrition on economic and social development
are all pervasive. In the less-developed countries 25 to 30 per
cent of the children die before their fifth birthday due to malnutrition (U.N., 1971, p. 7), In Columbia 82 out of every 1,000
children die of malnutrition before they reach 12 months (Givaudan Flavorist, 1973, p. 4). Mortality rates of Nigerian children
under the age of five years are alarmingly high, and these may
be in the order of 50 per cent in several parts of the country.In Ilesha village about 12 per cent of the children's deaths are caused by malnutrition, including undernutrition,, and most of
the adults are so grossly underfed that they are poorly motivated
for Increased productivity and hope for a better world (Dema,
1965, pp. 36-37). The United Nations has recorded 149 deaths

192
out of every 1,000 one—year old children in the Federal Terri
tory of Lagos alone (U.N., 1973, p. 256). It has been concluded that maldistribution of the available food within social and
economic population groups and among family members is another
explanation for the observed protein malnutrition in the less- developed countries (U.N., 1975b, p. 601).
The existence of a hungry or malnourished citizen is
an affront to a country that begets him. Perhaps, there is
no single factor as important as hunger in primitive social
strife (May, 1969, p. IX), Food deficit in less-developed
countries can cause national unrest which can endanger terri
torial security and international stability. Summarizing such difficulties one author states that:
The political potency of a food problem depends on the perceived need. . . . And those food problems which cannot be defined clearly or for which clear support from the nutrition is not forthcoming will attract varying degrees of attention depending on who reaches the ears of decision-makers. . . . For practical purposes we deal primarily with grains - an intolerable increase in the price of wheat, rice, or c om can cause a government to be overthrown. . . . (A recent example is the contribution of high meat prices to political Instability in Poland that forced a change in the government leadership a few years ago) (Altschul, 1974, pp. 5-9).
Anthonio (1966, p. 81) has noted that in recent years tense
political situations in Nigeria have been aggravated by foodshortages and soaring prices. He attributed the alarming rates
of food price increase to past and present neglects and inefficienciesin transportation, distribution and marketing channels development
by both government and private sector.

193
In less-developed countries high food prices (causes
by shortages and scarcity) lead to panic situations. This Is
necessarily so because a greater part of the Income and nearly all financial transactions (due to low purchasing power) center
around expenditures on food. Anthonio (1966, p. 81) calls this
hlgh-food drain economy. In such an economic region unrest, riots,
mass murder, destruction of property, burglary, and Insecurity
of life are frequent.

BIBLIOGRAPHY
Books
Abler, Ronald, John S. Adams, and Peter Gould, SnatialOrgan!zation! The Geographer's Viev) of the World. Englewood Cliffs, New Jersey: Prentice-Hall, Inc.,1971.
Alpert, Paul. Economic Develonment: Objectives and Methods.New York : The Free Press of Glenco, I9 6 3.
Altschul, Aaron M . , ed. New Protein Foods : Volume lA.Technology. New York : Academic Pressi 1974.
Attwood, Peter R. Planning A Distribution System. Gower Press.Ltd.. 1971.
Aylward, Francis and Mogens Jul. Protein and Nutrition Policy in Low-Income Countries. New York : John Wiley and Sons, 1975•
Berg, Alan, Nevin S. Scrimshaw, and David L. Call. Nutrition. National Develcornent and Planning. Cambridge: Massachusetts Institute of Technology Press, 1973.
Boeke, J. H. Economics and Economic Policy of DualisticSocieties 1 As Exemplified by Indonesia. Haarlem:H. D. Tjeenk Willink and Zoon, N. V., 1953.
Bowersox, Donald J. Logistical Management: A SystemsIntegration of Physical Distribution Management. Material Management, and Logistical Coordination.New York: Macmillan Publishing Co., Inc., 1974.
Edward W. Smykay, and Bernard J. La Londe. PhysicalDistribution Management : Logistics Problems of the Firm. New York: McMillan Company, I9 6 8.
Brock, J. P., and M. Autret. Kwashiorkor in Africa. Geneva : World Health Organization. 1953-
194

195
Buchanan, K. M. and J. C. Pugh. Land and People in Nigeria;The Human Geography of Nigeria and Lts Environmental Background. London: University of London Press, 1955•
Caldwell, John C., and Chukuka Okonjo. The Population of Tropical Africa. New York : Columbia UniversityPress, 1 9 6 8.
Chisholm, Michael, Geography and Economics. New York: Frederick A. Praeger, Publishers, I9 6 6.
Christopher, Martin, Total Distribution: A Frame For Costingand Control. Essex: Gower Press, Ltd., 1971.
Collis, W. R. P. , and Margaret Janes. "Maltifactorial Causation of Malnutrition and Retarded Growth and Development," in Nevin S. Scrimshaw and J. E. Gordon, eds. Malnutrition. Learning, and Behavior. Massachusetts: Massachusetts Instituteof Technology, I9 6 8.
Daniel, Norman E. and J. Richard Jones, Business Logistics:Concepts and Viewpoints. Boston: Allyn and Bacon, Inc.,1969.
Dano, Sven. Linear Programming in Industry:: Theory andApplication: An Introduction. New York: Springer-Verlag/Wien, 19^5.
Davis, Grant M. and Stephen W. Brown, Logistics Management.Lexington, Mass.: D. C. Heath and Co., 1974.
Dema, I. S. Nutrition in Relation to Agricultural Production. Rome: Pood and Agricultural Organization of theUnited Nations, I9 6 5.
Dorfman, Robert, Paul A. Sarauelson, and Robert M. Solow.Linear Programming and Economic Analysis. New York : McGraw-Hill Book Company, 195b.
Duesenberry, James S. Income, Saving and the Theory of Consumer Behavior. Cambridge, Massachusetts: Harvard University Press, 194-9.

196
Dupire, Marguerite. "Trade pnd Markets in the Economy ofNomadic Fulani of Niger (Bororo)," in Paul Bohannan and George Dalton. Markets in Africa. Evanston,111.: Northwestern/University Press, I 9 6 8.
Ferguson, Donald S. The Nigerian Beef Industrv. New York: •Cornell International Agricultural Development Bulletin, No. 9, 196?.
Ferguson, Robert 0., and Laurenn F, Sargent. Linear Programming: : Fundamentals and Annlications. New York:New York : McGraw-Hill Book Company, 1958.
Floyd, Barry. Eastern Nigeria: A Geographical Review.New York : Praeger, I9 6 9.
Food and Agricultural Organization. Agricultural Development in Nigeria I96 5-I98O. Rome: Food and AgriculturalOrganization, 1966.
Friedruch, C. J., ed. Alfred Weber's Theory of Location ofIndustries. Chicago: Chicago University Press, 1929.
Fromm, Gary, ed. Transport Investment and Economic Development . Washington, D.C.: The Brookings Institute,1 ^ .
Furnival, J. S. Netherlands India: A Study in PluralEconomy. Cambridge: Cambridge University Press,
Gauthier, Howard L. "Least Cost Flow in a CapacitatedNetwork: A Brazilian Example." in Frank Horton,ed. Geographic Studies of Urban Transportation and Network Analysis. Evanston, Illinois:Northwestern University Studies in Geography, No.1 6 , 1 9 6 8 .
Gellman, Aaron J. "The Most Influential Factor in Distribution Economics," Readings in Physical Distribution Management: The Logistics of Marketing.London:Collier-MacMillan, Ltd., 1969.
Gifft, Helen H. , Marjorie B. Washborn, and Gail G. Harrison.Nutrition. Behavior, and Change. Englewood Cliffs,New Jersey: Prentice-Hall, Inc., 1972.
Goldblith, S. A. "Food Habits and Taboos and the Potentials of Twentieth-Century Food Science and Technology." in A. E. Bender, B. Lofqvist, R. Kihlberg, and L.Munck. Evaluation of Novel Protein Products. Proceedings of the International Biological Programme (IBP) and Wenner-Green Center Symposium Held in Stockholm. September, 1 9 6 8 . New York: PergamonPress, 1 9 7 0 .
197
Goulet, Denis. The Cruel Choice : A New Concent in the Theoryof Development. New York: Atheneum, 1971.
Hagen, Everett E.. The Economics of Development. Homewood, Illinois: Richard D. Irwin, Inc., 1968.
Halm, George N. Economic Svstems; A Comparative Analysis.New York: Rinehart and Winston, Inc., 1958.
Hammond, Robert and Patrick McCullagh. QuantitativeTechni cues in Geography: An Introduction. Oxford:Clarendon Press, 1974.
Hance, William A. The Geography of Modern Africa. New York : Columbia University Press, 1967.
Hay, Alan M. and Robert H. T . Smith. Interregional Tradeand Money Flows in Nigeria. 1964. Ibadan, Nigeria : Oxford University Press, 1970.
Heer, David M . , ed. Readings on Ponulation. Englewood Cliffs, New Jersey: Prentice-Hall Press, Inc., 1968.
Helleiner, Gerald K. Peasant Agriculture. Government and Economic Growth in Nigeria. Homewood, Illinois :Richard D. Irwin, Inc., 1966.
Henderson, J. M. The Efficiency of the Coal Industrv: AnAnnlication of Linear Programming. Cambridge, Massachusetts: Harvard University Press, 1958.
Higgins, Benjamin. Economic Development : Principles. Problems,and Policies. New York: W. W. Norton and Company,Inc., 1 9 6 8.
Hirschman, Albert 0 . The Strategy of Economic Develonment.New Haven: Yale University Press, 1 9 5 8, Ch. 10.Hopen, Edward C. The Pastoral Fulbe Family in Gwandu.
London: Oxford University Press, I9 5 8.Hurst, Michael Eliot E. A Geography of Economic Behavior:
An Introduction. Belmont, California: WadsworthPublishing Company, Inc., 1972._________ , Transportation Geogranhv: Comments and Readings.New York:McGraw-Hill Book Company, I9 7 4.International Bank for Reconstruction and Development, The
Economic Development of Nigeria. Baltimore : JohnHopkins Press, 1955*

1-98
Johnson, Glenn L., Onlin J . Scoville, George K. Dike, andCari K. Eicher. Consortium for the Study of Nigeria Rural PeveloTJment. East Lansing: Michigan StateUniversity, I 9 6 9.
Kahnert, E. , P. Richards, E. Stoutjesidijk, and P. Thompoulos. Economic Integration Among Developing Countries.Paris : Development Centre of the Organization forEconomic Co-operation and Development, I9 6 9.
Keeble, D. E. "Models of Economic Development," in Richard J. Chorley and Peter Haggett, eds. Models in Geogranhv. Methuen and Co., Ltd., 196?.
Kelley, Allen, Jeffrey G. William, and Russell J. Cheetham, Dualistic Economic Development : Theorv and History.Chicago : University of Chicago Press, 1972.
Kindleberger, Charles P. Economic Development. New York: McGraw-Hill Book Company, 1968.
King, Leslie J. Statistical Analysis in Geography. Englewood Cliffs, New Jersey: Prentice-Hall, Inc., 1969»Laplace, John. Health. New York : Appleton-Century-Crofts,
1 9 7 2 .Lloyd, Peter E . , and Peter Dickens. Location in Snace: A
Theoretical Annroach to Economic Geogranhv. New York : Harper and Row Publishers, 1972.
Luna, Charles. The United Transportation Union Handbook of Transportation in America. New York: UnitedTransportation Union, 1971-
May, Jacques M. The Ecology of Malnutrition in West Africa and Madagascar. New York : Hafnar Publishing Co.,1 9 6 9 .
McLester, James S. Nutrition and Diet in Health and Disease. Philadelphia! Wl El Saunders Company, 1949.Meier, Gerald M. Leading Issues in Economic Development;
Studies in International Poverty. London: OxfordUniversity Press, 1970 -
Mittendorf, H. J., and S. G. Wilson. Livestock and MeatMarketing in Africa. Rome : Food and AgriculturalOrganization, I96I.

1.99.,.
Mitsuda, Hisateru. "New Approaches to Amino Acid andVitamin Enrichment in Japan," in Protein-Enriched Cereal Foods for the World Needs, hy Max Milner, ed. St., Paul, Minnesota: American Association ofCereal Chemists, 1969.
Moes, John E. Local Subsidies for Industrv. Chapel Hill:North Carolina: University of North Carolina Press,1962.
Mossman, Frank H . , and Newton Morton. Logistics of Distribution Svstems. Boston: Allyn and Bacon, Inc., 1965.
Myrdal, Gunnar. Rich Lands and Poor. New York: Harperand Row, 1957.
Needleman, L., ed. Regional Analvsis. Baltimore : PenguinBooks, Inc., 1 9 6 8.
Niven, Rex. The War of Nigerian Unity. 1967-1970. Totowa,New Jersey: Rowman and Littlefield, 1970.
Nurkse, Ragnar. Problems of Capital Formation in Underdeveloped Countries and Patterns of Trade and Develoment. New York: Oxford University Press,1970.
Ohlin, Bertil Gothard. Interregional and International Trade. Cambridge : Harvard University Press, 1967.
Olsson, Gunnar. Distance and Human Interaction: A Reviewand Bibliogranhv. Sweden: University of Uppsala,1964.
Owen, Wilfred. Strategy for Mobility. Washington, D.C.:The Brookings Institute, 1964.
Pergrum, Dudley F. Transportation Economics and Public Policy. Homewood, Illinois : Richard D. Irwin, Inc., 1973.
Pugh, III, Alexander L. Dynamo II User's Manual. Cambridge, Massachusetts: The Massachusetts Institute of Technology Press, 1973.
Reid, Esoott. The Future of the World Bank: An Essay.Washington, D.C.: International Bank for Reconstruction and Development, 1965.
Robinson, Hamlin, Stanton R. Smith, and Kenneth G. Clare.The Economic Cordination of Transport Development in Nigeria" Menlo Park, California: Stanford ResearchInstitute, I96I.

200
Rogers III, Augustus James. Choice : An Introduction toEconomics. Englewood Cliffs, New Jersey: Prentice- Hall, 1 9 7 1.
Samuelson, Paul Anthony. Economics. New York : McGraw-Hill, 1 9 6 7.
Schultz, Theodore W. Transforming Traditional Agriculture.New Haven: Yale University Press, 19^4.
Scott, Allen J. An Introduction to Spatial Allocation Analvsis. Commission on College Geography, Resource Paper, No. 9 . Washington, D.C.: Associationof American Geographers, 1971-
Shannon, Robert E. Svstems Simulation: The Art and Science.Englewood Cliffs, New Jersey: Prentice-Hall, Inc.,1975.
Smith, David M. Industrial Location: An Economic Geogranhi-cal Analvsis. New York : John Wiley and Sons, Inc.,1 9 7 1 .
Souza, Anthony R. de and Philip W. Porter. The Underdevelon- ment and Modernization of the Third World.Commission on College Geography, Resource Paper No.2 8 . Washington, D.C.: Association of AmericanGeographers, 1974.
Spielglas, Stephen and Charles J. Welsh, ed. Economic Development : Challenge and Promise. EnglewoodCliffs, New Jersey: Prentice-Hall Inc., 1970.
Stenning, D. Savannah Nomads. London: Oxford UniversityPress, 1959-
Stockton, R. Stansbury. Introduction to Linear Programming. Boston: Allen and BacorTi IncT, IS'b3 .Trewartha, Glenn T. A Geography of Population: World Patterns.
New York: John Wiley and Sons, Inc., 1969-Ullman, Edward L. American Commodity Flow. Seattle: University
of Washington Press, 1957.United Nations. Demographic Yearbook, 1973. New York: United
Nations, 1973.

201
United Nations. The Population Debate : Dimensions andPersnectives. Papers of the World Population Conference. Bucharest, 1 9 7 ^ New York: UnitedNations, 1975a--
_. Statistical YearUook. New York : United Nations,1975c.
_. Strategy Statement on Action to Avert ProteinCrisis in the Developing Countries. Report of the Panel of Experts on Protein Prohlem Confronting Developing Countries. New York: United Nations,1971.
Viner, J. International Trade and Economic Develpment.London: Oxford University Press, 1953.
Wentworth, Felix R. L . , ed. Physical Distribution Management. London: Gower Press, Limited, 1970.
Werhahn, Hans, Werner Frioke, Frierich Hunger, FriedrichWeltz, Udo-Hermann Gottschalk, and Hermann Saager.The Cattle and Meat Industrv in Northern Nigeria. Frankfurt/Main, 1964.
Wohl, Michael G . , and Robert S. Goodhart. Nutrition in Health and Disease. Philadelphia: Lea andFebuger, i 9 6 0 .
Articles
Anthonio, Q. B. 0. "Marketing of Food-Stuffs in Nigeria." Nigerian Opinion. 2:80-81 (July, 1966).Barbour, K. M. "A Survey of the B o m u Railway Extension inNigeria - A Geographical Audit." Nigerian Geographi
cal Journal. 10:11-28 (June, I 9 6 7).Bascom, William. "Urbanization Among the Yoruba." American
Journal of Sociology. 60:446-456 (March, 1955).Belli, Pedro. "The Economic Implications of Malnutrition:
The Dismall Science Revisited." Economic Development and Cultural Change. 20:1-23 (October, 1971).
Chang, Jen-Hu. "The Agricultural Potential of Humid Tropics.' Geographical Review. 58:333-361 (July, 1 9 6 8 ).

202
Church, B. M. "Some Methods for Livestock Survey Work inAfrica." Agricultural Economic Bulletin for Africa. No. 2 (January, I9 6 3 ).
Cohen, Abner. "The Social Organization of Credit in a West African Cattle Market." Africa. 351 8 -2 0 (1 9 6 5).
Connell, John. "The Geography of Development or theDevelopment of Geography." Antipode. 5 127-39 (May,1 9 7 3 ).
Cravioto, Joacquin, Elsa R. Delicardie, and Herbert G. Birch."Nutrition, Growth and Neurointegrative Development :An Experimental and Ecologie Study." Pediatrics.38 13 19-3 7 2 ,(1 9 6 6 ).
Culbertson, W. S. "Raw Materials and Foodstuffs in Commercial Policies of Nations." Annals. American Academy of Political and Social ScTence. 112:11-26 (March, 1^24).
Cumberland, John H . , and Frits Van Beek. "Regional Economic Objectives and Subsidization of Local Industry."Land Economics. 4-31253-264 (August, 1 9 6 7 ).
Dantzig, George B. "Linear Programming Under Uncertainty." Management Science. 1:197-206 (April-July, 1955).
Dart, Francis E. "The Rub of Culture." Foreign Affairs.41:3 6 0 - 3 7 1 (January, I9 6 3).De St. Croix, P. W. "Some Aspects of the Cattle Husbandry of the Nomadic Fulani." Farm and Forest. 1:29-13 (1944). -----------------De Young, Maurice. "Some Notes on the Economics of Beef
Industry in the West African Sub-Region."Agricultural Economics Bulletin for Africa. 10:49-60 (July, 1968). ---------
Delgado, Graoicla, C . L. Brumback, and Mary Brice Seaver, "Eating Patterns Among Migrant Families." Public Health Report. 76:3^9-554 (April, I96I). ~

203
Drucker, Peter F. "The Economy's Dark Continent." Fortune.6 5 11 0 3, 2 6 5 - 2 7 0 (April, 1 9 6 2 ).
Ferguson, Allen and George B. Dantzig. "The Allocation ofAircraft to Routes— An Example of Linear Programming Under Uncertain Demdnds." Management Science.13:45-73 (October, 1956).
_________. "The Problem of Routing Aircraft." AeronauticalEngineering. 14: 51-55 (April, 1955).Forrester, Jay W. "Industrial Dynamics a Major Break
through for Decision Makers." Harvard Business Review. 3 6 :3 7 - 6 6 (July-August, 1958).
Garrison, William L. "Spatial Structure of the Economy: II."Annals of Association of American Geographers. 49:471-482 (December, 1959).
Gauthier, Howard L. "Geography, Transportation, and Regional Development." Economic Geogranhv. 46 : 612-619 (October, 1970).
Givaudan Corporation. "Imitation Meats and Meat Flavorings: Food for the Future." The Givaudan Flavorist, 2:1-5 (1 9 7 3).
Godfrey, D. G., R. Killick-Kendrick, and W. Ferguson."Bovine Trypanosomiasis in Nigeria: IV-Observâtionson Cattle Trekked Along a Trade-Cattle Route Through Areas Infested with Tsetse Fly." Annals of Tropical Medicine and Parasitology. 59:255-269 (September,1 9 6 5 ).
Gould, Peter R., and Robert H. T. Smith. "Methods inCommodity Flow Studies." Australian Geographer. 8:70-77 (1 9 6 2).
Graham, G., A. Cordano, J. M. Baertl, and E. Morles. "Programs for Combatting Malnutrition in the Preschool Child in Peru." in Pre-School Child Nutrition. Pub. No. 1282, National Academy of Science, Nat. Res. Council, Washington, D.C.: I6 3-I67 (1 9 6 6 ).

Grigg, David. "The Logic of Regional Systems." Annals of the Association of American Geographers. 55:^65- 491 (September, 1965 i.
Hegsted, D. M . , and Fredrick J. State. "Agriculture Versus Chemistry in the Nutrition of Man." Scientific Monthly. 79:177-179 (September, 1954).
Henderson, J. M. "A Short-Run Model of the Coal Industry." Review of Economics and Statistics. 37:336-346(1 9 5 5 ).
_________. "Efficiency and Pricing in the Coal Industry."Review of Economics Statistics. 37:50-60 (I9 5 6 ).Higgins, Benjamin. "The'Dualistic Theory* of Underdeveloped Areas." Economic Develoment and Cultural Change.
4:9 9 - 1 1 5 (January, 1956).Hitchcock, P. L. "The Distribution of A Product from Several
Sources to Numerous Locations." Journal of Mathematics and Phvsics. 20:224-230 (194l).Horvath, Ronald J. "Von Thunen's Isolated State and the
Area Around Addis Ababa, Ethiopia." Annals of the Association of American Geographers. 59:3O8 : 323 (June, 1969).
Huff, David L. "Ecological Characteristics of Consumer Behavior." Paners and Proceedings of Regional Science Association. 7:19-28 (I96I).
Hunter, Holland. "Transport in Soviet and Chinese Development Economic Development and Cultural Change. 14:71-84 October, 1965).
Igbozurike, Matthias U. "Ecological Balance in Tropical Agriculture." Geographical Review. 61:519-529 (October, 1971).
Ilori, Christopher 0. "Economics of Livestock Transport and Inter-State Trade in Nigeria." Nigerian Agricultural Journal. 9 :5 6 - 6 3 (April, 1972).
Isard, Walter. "Interregional Linear Programming: AnElementary Presentation and a General Model."Journal of Regional Science. 1:1-59 (Summer, 1958).

205
Jeans, P. C ., Mary B. Smith, and Genevieve Stearns. "Dietary Habits of Pregnant Women of Low Income in a Rural State." Journal of the American Dietetics Association. 28:27-34 (January, 1952}.
Johnson, Hildegard Binder. "The Location of ChristianMissions in Africa." Geographical Review. 57 :168- 202 (April, 196?).
Jones, G. I. "The Beef-Cattle Trade in Nigeria." Africa, 1 6 1 2 9 - 3 8 (1946).
Jordan, A. M. "Bovine Trypanosomiasis in Nigeria: TheTsetse-Fly Challenge to a Herd of Cattle Trekked Along A Trade Route." Annals of Tropical Medicine andf.Parasitologv. 59:270-274 (1965
Jumper, Sidney R. "Wholesale Marketing of Fresh Vegetable." Annals of the Association of American Geographers. 64:387-396 (September, 1974).
Kriebel, Charles H. "Warehousing With Transhipment Under Seasonal Demand." Journal of Regional Science.3 :6 7 - 6 9 (1 9 6 1 ).
Mayer, Jean. "The Nutrition Status of American Negroes." Nutrition Review. 2 3 :161-164 (June, I9 6 5 ).
Moroney, John R., and James M. Walker. "A Regional Test ofthe Heckscher-Ohlin Hypothesis." Journal of Political Economv. 74:573-584 (December, I 9 6 6 ).
Nicol, B. M. "The Calorie Requirements of Nigerian Peasant Farmers." British Journal of Nutrition. 13:293-306 (1959a)._________. "The Protein Requirements of Nigerian Peasant
Farmers." British Journal of Nutrition. 1 3 :30 7- 319 (1959b).
Nordbeck. Stig, "Computing Distances in Road Nets." Papers of the Regional Science Association. European Congress. Lundi 12:207-220 (1964).
Nzekwu. Onuora, "Banda. The Secret of Ibo Concentrationin Maiduguri." Nigeria Magazine. 79:248-253 (I963).

206
Oyenuga, V. A. "The Contribution of Animal Products to the Diets of Nigerians." Presidential Address to Annual Conference of the Agricultural Society of Nigeria (July, 1 9 6 3 ;.
Poole, Nichael A., and Patrick N, O' Farrell. "The Assumptions of the Linear Regression Model." Institute of British Geographers; Transactions. 52: 1^5- I5 B (March, 1971).
Rajalakshmi, R. "Some Nutritional Problems and Anomalies in India." Agricultural Science Review. 11:18-23 (Second Quarter, 1973)•
Read, Merrill S. "Malnutrition and Learning." American Education. 5:11-14 (November, I9 6 9 ).
Reed, L. "Notes on Some Fulani Tribes and Customs." Africa. 5 ,4 ( 1932 ) .
Reilly, William J. "Methods for the Study of RetailRelationships." University of Texas Bulletin. No. 2 9 4 4 (November, 1929), in David L. Huff, "A Pro- babilistic Analysis of Shopping Center Trade Areas." Land Economics. 39:81-90 (February, I9 6 3).
Schultz, Theodore W. "Investment in Human Capital." The American Economic Review. 51:1-17 (March, I96I H
_________, and Alan M. Hay. "Theory of Spatial Structure ofInternal Trade in Underdeveloped Countries." Geographical Analysis. 1:124-136 (April, I9 6 9 ).
Spengler, Joseph J. "Economic Factor in the Development of Densely Populated Areas." Proceedings of the American Philosophical Society. 95 :20-53 (1951).
Stenning, D. J. "Transhumance, Migratory Drift, Migration: Patterns of Pastoral Fulani Nomadism." Journal of the Royal Anthropological Institute. 8 7 :57-73 (1957).
Stevens, Benjamin H, "An Interregional Linear Programming Model." Journal of Regional Science. 1:60-98 (Summer, 1958).
2Q7
Stoch, M. B., and P. M. Smythe. "Does Undernutnit;ion DuringInfancy Inhibit Brain Growth and Subsequent Intellectual Development?" Archives of Diseases in Childhood. 3 8 :5 4 6 - 5 5 2 (December, I9 6 3),
Taaffe, Edward J., Richard L. Morrill, and Peter R. Gould."Transportation Expansion in Underdeveloped Countries." Geographical Review. 53i503-529 (October, I9 6 3 ).
Taylor, Carl E. "Health and Population." Foreign Affairs:An American Quarterly Review. 43:475-486 (April,1 9 6 5 ) .
Udo, Reuben K. "Food-Deficit Areas of Nigeria."Geographical Review. 61: 415-430 (July, 1971).
Viner, Jacob. "Bentham and J. S. Mill: The UtilitarianBackground." American Economic Review. 39:36O- 382 (March, 19WT.
Wilcox, Francis 0. "World Population and Economic Development." Department of State Bulletin. 42:860-867 (May 3 0 , 1 9 6 0).
Williamson, A. J. "Regional Inequality and the Process ofNational Development: A Description of the Patterns."Economic Development and Cultural Change. 13:3-45 (1965).
Yeates, Maurice. "Hinterland Delimitation: A DistanceMinimizing Approach." The Professional Geographer. 15:7-10 (1 9 6 3 ).
Young, H. B. "Effects of Nutrition on Growth and Performance." Agricultural Science Review. 8:1-8 (Third Quarter,1 9 7 0 ).
Young, Maurice de. "Some Notes on the Economics of the Beef Industry in the West African Sud-Region." ■ Agricultural Economics Bulletin for Africa, 10 :49-60 (July, 1 9 6 8 ).

208
Government Publications
Arthur Little, Inc. Ibadan Meat Slaughter and Market Requirements and geasihilitv of a Central Abattoir. Ibadan, Nigeria: Economic Department of the Premier'sOffice, 1964.
Federal Ministry of Economic Development and Reconstruction, Second National Development Plan 1970-74; First and Second Progress Reports. Lagos, Nigeria:Federal Ministry of Economic Development and Reconstruction, 1974.
Federal Ministry of Information. Second National Development Plan 1970-74: Programme of Post-War Reconstructionand Development. Lagos, Nigeria: Federal GovernmentPrinter, 1970.
Federal Office of Statistics, Annual Abstract of Statistics.1972. Lagos, Nigeria: Federal Office of Statisticsi1972.
_________. Digest of Statistics. Vol. 22. Lagos, Nigeria:Federal Office of Statistics, 1973.
_________. Urban Consumer Surveys in Nigeria: Akure/Ondo/Owo, Ibadan, Lagos, Onitsha, Oshogbo/Ife/Ilesha.Lagos, Nigeria: Federal Office of Statistics, 1 9 6 5 .
Gordon, Marvin F. Agriculture and Population: World Perspectives and Problems. Washington, D.C.: U. S.Department of Agriculture, 1975•
Gowon, Yakubu. 197 8/76 Budget Speech by the Head of State. Lagos : Federal Military Government, 31st March,1 9 7 5 .
Huth, William. "Nigeria: Peasant and Export Agriculture," inEconomic Progress of Agriculture in Developing Nations 1980-681 Foreign Agriculture Bulletin, No. 59, Washington, D.C.: U. S. Dept of Agriculture,(April, 1 9 7 0 ).
Kallen, David J. Nutrition, Development and Social Behavior.Washington, D.C.: U, S. Dept, of Health, Education,and Welfare, 1973-

1209 : '
Kano State. Achievements of the Ministry of Agriculture andNatural Resources of Kano State Under the SevenYears of Military Regime May. 1967-MaVi 197?I Kano, Nigeria1 Ministry of Agriculture and Natural Resources, 1974.
• Annual Report. 1973-74. Kano, Nigeria: Ministryof Agriculture and Natural Resources, Veterinary Division, 1974.
Kwara State. Statistical Digest. 1970-72. Ilorin, Nigeria: Ministry of Economic Development, Statistics Division, 1973.
Midwestern State. Midwestern Statistical Notebook. Volume2. Benin City, Nigeria: Ministry of EconomicDevelopment and Reconstruction, 1972.
Nigerian Agricultural Bank, Limited. Guide to Annlicants. Kaduna, Nigeria: Nigerian Agricultural Bank,Limited, 1973.
Nigerian Livestock and Meat Authority. Decree No. 42. 1971.Lagos, Nigeria: Federal Military Government, 28thAugust, 1 9 7 1.
_________. Quarterly Livestock Survey. Kaduna, Nigeria:Federal Ministry of Animal and Forestry Resources,1 9 7 3 .
_________ . State Marketing Service. Kano, Nigeria: VeterinaryDivision, 1973.Nigerian Railway Corporation. Tariff No. 7 : Railway Passengers
and Goods Services. Ehute Metta: Nigerian RailwayCorporation, 1970.
North-Central State. Statistical Yearbook. 1973. Kaduna, Nigeria: Ministry of Economic Planning and NaturalResources, 1973■
Northwestern State. Second Annual Report, April. 1969- March 31. 1 9 7 0 . Sokoto, Nigeria: Ministry ofNatural Resources and Cooperatives, 1970.

21Q^:
Perloff, Harvey S., and Lowdon Wingo, Jr. "Natural Resource Endowment and Regional Economic Growth." in Joseph J. Dpengler, ed. Natural- Resources and Economic Growth. Washington, D.C.: Resource for the Future,Inc., 1 9 61 (pp. 1 9 1-2 1 2 ).
President's Science Advisory Committee. The World Food Problem. Vol. 2. Washington, B.C.! The White House, 1 9 6 7.
Schertz, Lyle P. Economics of Protein Improvement Programs in the Low Income Countries. Washington, B.C.:U. S. Bept. of Agriculture Foreign Economic Bevelopment Report 11, July, 1971•
Shaw, Thomas and Gilbert Calville. Report of Nigerian Livestock Mission. London: Her Majesty's StationeryOffice, 1 9 5 0 .
Southeastein State. Statistical Bigest. 1970. Calabar, Nigeria: Ministry of Economic Bevelopment andReconstruction, 1973.
U. S. Bept. of Agriculture. The Agricultural Economv of Nigeria. Washington, B.C.: Economic ResearchService, 1972.
_________ . The World Food Situation and Prospects to 1984.Washington, B.C.: Foreign Agricultural EconomicReport, No. 9 8, 1974.
U. S. Environmental Protection Agency. A Guide to Modelsin Governmental Planning and Operations. Washington, B.C.: Office of Research and Bevelopment, Environmental Protection Agency, 1974.
Ü. S. Senate, Hearings Before the Select Committee on Nutrition and Human Needs of the United States. Ninety-Third Congress, Second Session, Part 3 -
. Nutrition and Special Groups. Washington, B.C.:June 1 9 , 1 9 7 4 . Government Printing Office, 1974.
Western Nigeria Development Project. Project Analysis No.3, Beef. Ibadan, Nigeria: Economic Bepartmentof the Premier's Office, n.d.
________ Bigest of Agricultural Statistics, 1970. Ibadan,Nigeria : Ministry of Economic Planning and Reconstruction, 1 9 7 0 .

211...
Woolley, P. 0., Jr., C. S., Perry, L. J. Gangloff, D. L, Larson. Svncrisisi The Dynamics of Health: AnAnalytic Series on the Interactions of Health Socio-Economic Develonment. XV. The Philinnines. Washington, B.C.: U. S. Dept, of Health, Educationand Welfare, July, 1972.
Unpublished Materials
Annegers, John Fred. Geographic Patterns of Diet and Nutritional Status in West Africa With Special Reference to Calorie and Protein Deficiencies.Ph.D. Dissertation, Michigan State .University,1972.
Barr, Brenton M. The Role of Transfer Costs in the Location and Flow Patterns of the Soviet Wood-Processing Industry. Unpublished Ph.D. Dissertation, University of Toronto, 1968.
Dilisio, James E. Standards-of-Living and Spatial-Temporal Trends in Regional Inequalities in Oklahoma. Unpublished Ph.D. Dissertation, University of Oklahoma, 1974.
Paarlberg, Don. Statement bv Director of AgriculturalEcenemies. U.S. Department of Agriculture, at the 43rd Annual Convention of the Northeastern Poultry Producers Council, Philadelphia, Pennsylvania,October 22, 1974.
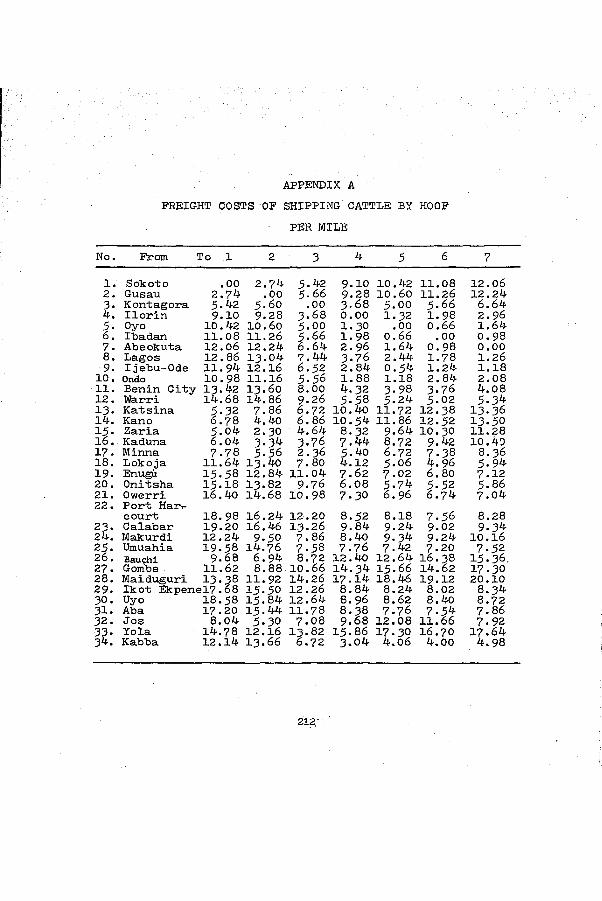
APPENDIX A FREIGHT COSTS OF SHIPPING CATTLE BY HOOF
PER MILE
No. From To 1 2 3 4 5 6 7
1. Sokoto .00 2 . 7 4 5.42 9 . 1 0 10.42 1 1 . 0 8 1 2 . 0 62. Gusau 2 . 7 4 .0 0 5 - 66 9 . 2 8 1 0 . 6 0 1 1 . 2 6 12.243 . Kontagora 5.42 5 . 6 0 .0 0 3 . 6 8 5 . 0 0 5 . 6 6 6.644. Ilorin 9 . 1 0 9 . 2 8 3 . 6 8 0 . 0 0 1 . 3 2 1.98 2 . 9 65. Oyo 10.42 1 0 . 6 0 5 . 0 0 1 . 3 0 .0 0 0 .66 1.646 . Ibadan 1 1 . 0 8 1 1 . 2 6 5 .66 1 . 9 8 0.66 .00 0 . 9 87. Abeokuta 1 2 . 0 6 12.24 6.64 2 . 9 6 1.64 0 . 9 8 0.008. Lagos 12.86 1 3 . 0 4 7 . 4 4 3 . 7 6 2.44 1 . 7 8 1 . 2 69. Ijebu-Ode 1 1 . 9 4 12.16 6 . 5 2 2.84 0 . 5 4 1.24 1.18
10• Ondo 10.98 1 1 . 1 6 5 . 5 8 1.88 1.18 2. 84 2.0811. Benin City 1 3 . 4 2 1 3 . 6 0 8.00 4 . 3 2 3 . 9 8 3 . 7 6 4.0812. Warri 14.68 14.86 9 . 2 6 5 . 5 8 5.24 5 . 0 2 5 . 3 41 3 . Katsina 5 . 3 2 7 . 8 6 6 . 7 2 10.40 1 1 . 7 2 1 2 . 3 8 1 3 . 3 614. Kano 6 . 7 8 4.40 6.86 1 0 . 5 4 11.86 1 2 . 5 2 1 3 . 5 01 5 . Zaria 5.04 2 . 3 0 4.64 8 . 3 2 9.64 1 0 . 3 0 11.281 6 . Kaduna 6.04 3 . 3 4 3 . 7 6 7 . 4 4 8 . 7 2 9.42 10.401 7 . Minna 7 . 7 8 5 . 5 6 2 . 3 6 5.40 6 . 7 2 7 . 3 8 8 . 3 618. Lokoja 11.64 1 3 . 4 0 7 . 80 4.12 5 . 0 6 4.96 5 . 9 41 9 . Enugii 1 5 . 5 8 12.84 11.04 7 . 6 2 7 . 0 2 6 .80 7 . 1 220. Onitsha 1 5 . 1 8 1 3 . 8 2 9 . 7 6 6.08 5 . 7 4 5 . 5 2 5 . 8 621. Owerri 16.40 14.68 1 0 . 9 8 7 . 3 0 6. 96 6 . 7 4 7.0422. Port Har.-
oourt 18.98 16.24 12.20 8 . 5 2 8.18 7 . 5 6 8.282 3 . Calabar 1 9 . 2 0 1 6 .46 1 3 . 2 6 9.84 9.24 9 .0 2 9 . 3 424. Makurdi 12.24 9 . 5 0 7 . 8 6 8.40 9 . 3 4 9.24 1 0 . 1 62 5 . Umuahia 1 9 . 5 8 1 4 . 7 6 7 . 5 8 7 . 7 6 7.42 7 . 2 0 7 . 5 22 6 . Bauchl 9 . 6 8 6 . 9 4 8 . 7 2 12.40 12.64 1 6 . 3 8 1 5 .3 6 ,2 7 . Gombe 1 1 . 6 2 8.88 10.66 1 4 . 3 4 1 5 . 6 6 1 4 . 6 2 1 7 . 3 02 8 . Maiduguri 1 3 . 3 8 1 1 . 9 2 1 4 . 2 6 1 7 . 1 4 18.46 1 9 . 1 2 20.102 9 . Ikot Ekpenel7.o8 1 5 . 5 0 1 2 . 2 6 8.84 8.24 8.02 8 . 3 43 0 . Uyo 18 .5 8 15.84 12.64 6 . 9 6 8.62 8.40 8 . 7 23 1 . Aba 1 7 . 2 0 1 5 . 4 4 1 1 . 7 8 8 . 3 8 7 . 7 6 7 . 5 4 7 . 8 63 2 . Jos 8.04 5 . 3 0 7 . 0 8 9 . 6 8 12.08 11.66 7 . 9 23 3 . Yola 14.78 12.16 1 3 . 8 2 1 5 . 8 6 1 7 . 3 0 1 6 . 7 0 17.643 4 . Kabba 12.14 1 3 . 6 6 6 . 7 2 3 . 0 4 4 . 0 6 4.00 4 . 9 8
212;

213
APPENDIX A (Continued)
No. From To 8 9 10 11 12 13 14
1. Sokoto 12.86 1 1 . 9 4 1 0 . 9 8 1 3 . 4 2 14.68 5 . 3 2 6 . 7 82. Gusau 13.04 12.12 1 1 . 1 6 1 3 . 6 0 14.86 7 . 8 6 4.043. Kontagora 7.44 6 . 5 2 5 . 5 6 8.00 9 . 2 6 6 . 7 2 6.86k. Ilorin 3 . 7 6 2.84 1.88 4 . 3 2 5 . 5 8 10.40 1 0 . 5 45. Oyo 2.44 0 . 5 4 1.18 3 . 9 8 5 . 2 4 1 1 . 7 2 11.866. It) a dan 1 . 7 8 1.24 2.84 3 . 7 6 5 . 0 2 1 3 . 3 8 1 2 . 5 27. Abeokuta 1 . 2 6 1.18 2.08 4.08 5 . 3 4 1 3 . 3 6 1 3 . 5 08, Lagos 0.00 1.24 2.86 4.14 5 . 4 0 14.16 14.249. Ijebu-Ode 1.24 0.00 1 . 9 6 2 . 9 0 7 . 5 4 1 3 . 2 4 1 3 . 3 810. Ondo 2.86 1 . 9 6 .00 2. 80 4 . 0 6 12.28 12.42
11. Benin City 4.14 2 . 9 0 2.80 0.00 1 . 2 6 1 4 . 7 2 14. 8012. Warri 5.40 7 . 5 4 4 . 0 6 1 . 2 6 0.00 1 5 . 9 8 1 6 . 0 613. Kastina 14.16 1 3 . 2 4 1 2 . 2 8 14.72 1 5 . 9 8 0.00 2.1614. Kano 14.24 1 3 . 3 8 12.42 14.80 1 6 . 0 6 2 . 1 6 .0015. Zaria 12.08 1 1 . 1 6 1 0 . 36 12.46 14.02 3 . 4 2 2.2216. Kaduna 11.18 10.28 9 .3 2 1 1 . 7 6 1 3 . 0 2 4.46 3 . 2 017. Minna 9 . 1 6 8.24 7 . 2 8 7.46 8.72 6.68 5 . 8 218. Lokoja 6.84 5 . 8 6 3 . 88 3 . 6 0 5 . 8 0 1 4 . 5 2 14.6019. Enugu 7.18 5 . 9 4 5.84 3 . 0 4 3 . 7 8 1 3 . 9 6 1 2 . 7 620. Onitsha 5 . 9 0 4.66 4 . 5 6 1 . 7 6 2 . 5 0 14.98 1 3 . 7 421. Owerri 7 . 1 2 5 . 8 8 5 . 7 8 2.98 3 . 7 8 1 5 . 8 0 14.6022. Port Harcourt 8 . 3 4 7 . 1 0 7 . 0 0 4.20 4 . 4 9 1 7 . 3 6 1 6 . 3 823. Calabar 9.40 9 .1 6 8.04 5 . 3 0 6.00 1 7 . 5 8 1 6 . 3 824. Makurdi 10.22 9 . 9 8 8 . 1 6 6.08 6.82 1 0 . 6 2 9.4225. Umuahia 7 .5 8 5 . 3 4 6.24 3 . 4 4 4.18 1 5 . 8 8 14.682 6 . Banchi 1 6 . 1 6 14.82 1 3 . 2 0 1 1 . 9 2 12.66 5 . 9 2 3 . 7 627. Gombe 18.10 1 6 . 7 6 14.22 1 3 . 8 6 14.60 7 . 8 6 5 . 7 02 8 . Maiduguri 20.88 1 9 . 9 8 1 9 . 0 2 1 7 . 6 8 18.42 9 . 5 6 6 .6 029. Ikot Ekpene 8.40 7 . 1 6 6.98 4 . 2 6 5 . 0 0 16.58 1 5 . 3 830. Uoy 8 . 7 8 7 . 5 4 7 . 4 4 4.64 5 . 3 8 1 6 . 9 6 1 5 . 7 631. Aba 7 . 9 2 6.68 6 . 5 8 2.80 ■ 4 . 5 2 1 6 . 5 6 1 5 . 3 632. Jos 1 3 . 4 4 1 2 . 5 2 1 1 . 5 6 10.28 11.02 6 .42 5 . 2 233. Yola 1 7 . 7 0 1 6 .46 1 5 . 6 2 1 3 . 5 4 1 4 . 3 0 11.14 8.9834. Kabba 5 . 7 6 4.86 2.88 2 . 7 6 4.14 1 5 . 7 4 1 3 . 5 8

APPENDIX A (Continued)
No. From To 15 16 17 18 19 20 21
5 .04 6. 04 7 .78 11. 64 1 5 .58 1 5 .18 1 6 .402. 30 3 .34 5 .56 1 3 .40 12. 84 1 3 .82 14. 684. 64 4. 76 2. 36 7 .80 11. 04 9 .76 10. 988. 32 7 .44 5 .40 4. 12 7 .62 6. 08 7 .309 .,64 8. 72 6. 72 5 .06 7 .,02 5 .7 4 6 .96
10. 30 9 .42 7. 38 4. 96 6. 80 5 .52 6 .7 411. 28 10. 40 8. 36 5 .94 7 .12 5 .86 7 .0612. 08 11. 18 9 .16 6. 84 7 .18 5 .90 7 .1211. 16 10. 28 8. 24 5 .86 5 .94 4. 66 5 .8810. 36 9. 32 7 .28 3 .88 5 .84 4. 56 5 .7812. 46 11. 76 7 .46 3 .60 3 .04 1. 76 2. 9814. 02 1 3 .02 8. 72 5 .80 3 .78 2. 50 3 .783- 42 4. 46 6 .68 14. 52 1 3 .96 1 3 .7 4 14. 602. 22 3 .20 5 .82 14. 60 12. 72 1 3 .7 4 14. 600. 00 1. 04 4. 60 11. 48 10. 5 4 11. 52 12. 381. 04 0 .00 3 .72 11. 56 9. 58 10. 56 11. 424. 60 3 .72 0. 00 3 .86 8. 84 8. 16 10. 98
11. 48 11. 56 3 .86 0. 00 3 .54 4. 30 5 .5210. 54 9 .58 8. 84 3 .5 4 0. 00 1. 28 2. 2011. 52 1 0 .56 8. 16 4. 30 1. 28 0. 00 1. 2212. 38 11. 42 10. 98 5 .52 2. 20 1. 22 0. 001 3 .94 12. 98 12. 24 6. 7 4 3 .40 2. 44 1. 2214. 08 1 3 .20 12. 46 7 .16 3 .62 3 .50 2. 28
7 .20 6 .24 5 .50 4. 28 3 .34 4. 32 5 .1812. 46 11. 50 10. 76 5 .46 1. 92 1. 68 0. 724. 46 5 .12 7 .3 4 10. 12 7. 56 10. 16 11. 026 .58 4. 64 5 .12 7 .34 10. 12 7 .56 10. 169 .62 10. 88 1 3 .10 1 5 .88 14. 94 1 5 .92 1 6 .78
1 3 .16 12. 20 11. 46 6 .16 2. 62 2. 50 1. 281 3 .5 4 1 5 .76 11. 04 6 .5 4 3 .00 2. 88 1. 661 3 .16 12. 18 11. 44 6. 14 2. 60 2. 02 0. 80
3 .00 3 .48 5 .70 8. 48 7 .14 8. 52 9 .389 .14 10. 22 12. 44 11. 7 4 10. 80 10. 80 12. 80
11. 36 10. 48 4. 94 3 .86 5 .40 4. 12 5 .34
1. Sokoto2. Gusau3. Kontagora4. Ilorin 5* Oyo6. Ibadan7. Abeokuta8. Lagos9. Ijebu-Ode
10. Ondo11. Benin City12. Warri1 3 . Katsina14. Kano1 5 . Zaria1 6 . Kaduna1 7 . Minna18. Lokoja 19 • Enugu20. Onitsha21. Owerri22. Port HareOUI2 3 . Calabar24. Makurdi 2 5 ■ Umuahia2 6 . Bauchl2 7 . Gombe28. Maiduguri2 9 . Ikot Ekpene3 0 . Uyo3 1 . Aba3 2 . Jos3 3 . Yola3 4 . Kabba

APPENDIX A (Continued)
No. Prom To 22 23 24 25 26 27 28
18. 98 1 9 . 20 12. 24 1 9 .58 9. 68 11. 62 1 3 .381 6 .24 1 6 .46 9. 50 14. 76 6 .94 8 .88 1 1 .921 2 .20 1 3 .26 7 .86 7 .58 8 .72 1 0 .66 14. 26
8 .52 9 . 84 5 .40 7. 76 1 2 .40 14. 34 1 7 .148 .18 9 . 24 9. 3 4 7 .42 1 2 .64 1 5 .66 18. 467 .96 9 .02 9. 24 7 .20 14. 38 14. 62 1 9 .128 .28 9 .3 4 1 0 .16 7. 52 1 5 .36 1 7 .30 2 0 .108 .3 4 9 .40 1 0 .22 7 .58 16. 16 18. 10 2 0 .887 .10 9 .16 9. 98 5. 34 14. 82 1 6 .76 1 9 .987 .00 8 .06 8 .16 6 .24 1 3 .20 14. 22 1 9 .024. 20 5 .30 6 .08 3 .44 1 1 .92 1 3 .86 1 7 .684. 94 6 .00 6 . 82 4. 18 1 2 .66 14. 60 18. 02
1 7 .36 1 7 .58 1 0 .62 1 5 .88 5 .92 7 .86 9 .561 6 .16 1 6 .38 9 .42 14. 68 3 .76 5 .70 6 .601 3 .94 14. 08 7 .20 1 2 .46 4. 64 6 .58 9. 621 2 .98 1 3 . 20 6 .7 4 1 1 .50 5 .12 7 .06 1 0 .881 2 .24 1 2 .46 5 .50 1 0 .76 7 .34 9. 38 1 3 .10
6 .74 7 .16 4. 28 5 .46 1 0 .12 1 2 .06 1 5 .883- 40 3- 62 3 .34 1 .92 7. 56 1 1 .14 14. 962 .44 3 .50 4. 32 1 .68 1 0 .16 1 2 .10 1 5 .921 .22 2 .28 5 .18 0 .72 1 1 .02 1 2 .96 1 6 .780 .00 2 .28 6 .74 1 .48 1 2 .58 14. 52 18. 342 .28 0 .00 6 . 96 1 .70 1 2 .80 14. 7 4 18. 566 .74 6 . 96 0 .00 5 .34 5 .84 7 .78 1 1 .601 .48 1 .70 5 .34 0 .00 1 1 .10 1 3 .04 1 6 .86
1 2 .58 1 2 .80 5 .7 4 1 1 .10 0 .00 1 .94 5 .841 1 .02 1 2 .55 1 2 .80 1 3 .04 1 .94 0 .00 4. 9818. 34 18. 56 1 1 .60 1 6 .86 5 .84 4. 98 0 .00
1 .28 1 .00 5 .96 0 .70 1 1 .80 1 3 .74 1 7 .561 .66 0 .62 6 . 34 1 .08 1 2 .18 14. 12 1 7 .940 .80 1 .48 5 .94 0 .68 1 1 .78 1 3 .72 1 7 .5 4
1 0 .94 1 1 .16 4. 20 9. 46 1 .64 3 .58 7. 4014. 20 14. 42 8 .40 1 2 .72 5 .16 3 .28 5 .466 .56 7 .62 5 .36 5 .80 1 1 .20 1 3 .14 16. 96
1. Sokoto2. Gusau-3. Kontagora4. Ilorin5. Oyo6. Ibadan7. Abeokuta8. Lagos9. Ijebu-Ode10. Ondo
11. Benin City12. Warri
Katsina Kano1 5 • Zaria1 6 . Kaduna1 7 . Minna18. Lokoja1 9 . Enugu20. Onitsha21. Owerri22. Port Harcourt2 3 . Calabar24. Makurdi2 5 . Umuahia2 6 . Bauchl2 7 . Gombe2 8 . Maiduguri2 9 . Ikot Ekpene3 0 . Uyo3 1 . Aba3 2 . Jos3 3 . Yola3 4 . Kabba

21.6
APPENDIX A (Continued)
No. From To 29 30 31 32 33 341. Sokoto2. Gusau3. Kontagora4. Ilorin5. Oyo6. Ibadan7. Abeokuta8. Lagos9. Ijebu-Ode
10. Ondo11. Benin City12. Warri 13' Katsina14. Kano15. Zaria16. Kaduna17. Minna18. Lokoja19. Enugu20. Onitsha21. Owerri22. Port Harcourt 23' Calabar 24' Makurdi 25' Umuahia2 6 . Bauchl 27 ' Gombe2 8 . Maiduguri 29' Ikot Ekpene 3 0 ' Uyo 3 1 ' Aba3 2 . Jos 33' Yola3 4 . Kabba
All costs are in Naira (ftl.OO = US $1.60) _Source I Computed from field data by author. For the field data from which transportation costs by truck and on-the-hoof were computed the author is indebted to Anthony J. Urom, Emmanuel EkpoUdom, Ise EkpoUdom, Marcus Opara, Rev. Fr. Bernard Nwoedu, Solomon Charlie, and Udom EkpoUdom for their efforts in collecting the data for this study. In Nigeria there are no recorded charges for shipment of cattle from north to south byon-the-hoof, and without their help it would have been impossible to collect the data.
17'.68 18. 58 1 7 ,,20 8,,04 14. 78 12,,141 5 .,50 15' 84 1 5 ,,44 5 ,,30 1 2 ,,16 1 3 .,661 2 ,,26 1 2 .64 1 1 ,,18 7 ,,08 1 3 .,82 6 .,72
8 ,.84 8 .96 8 ,'38 9 ,,68 1 5 .,86 3 .,048 ,.24 8 .62 7 ,,76 1 2 ,,08 17.,30 4,,068 ,,0 2 8 .40 7,, 5 4 1 1 ,, 66 1 6 ,,70 4,,008 ,, 3 4 8 .72 7 ,,86 7 ,,92 1 7 .,64 4,,988 ,,40 8 .78 7 ,,92 1 3 ,, 44 1 7 .,70 5,,767.,16 7' 5 4 6 ,,68 1 2 ,,52 16. 46 4. 866 .,98 7. 44 6 ,,58 1 1 ,,56 1 5 .,62 2 .884,,62 4. 64 2 ,,80 1 0 ,,28 1 3 .'54 2 .765 .,00 5' 38 4,,52 1 1 ,,02 14,,30 4. 14
1 6 .58 1 6 .96 1 6 ,,56 6 ,,42 1 1 .,14 15, 7 41 5 .,38 15' 76 1 5 .,36 5 ,,22 8 ,,98 1 3 .,581 3 .,16 1 3 .5 4 1 3 .,14 3 .,00 9 .,14 1 1 ,361 2 ,,20 15' 76 1 2 ,,18 3 ,,48 1 0 ,,22 1 0 ,,481 1 ,, 46 1 1 .04 1 1 ,,44 5 ,,70 1 2 ,, 44 4,, 9 4
6 ,,16 6 .5 4 6 ,,14 8 ,,48 1 1 ,,7 4 3 .,862 ,,62 3 .00 2 ,.60 7,,14 1 0 ,,80 5 .,402 ,,50 2 .88 2 ,,02 8 ,,52 1 1 ,,80 4,,121 ,,28 1 .66 0 ,,80 9.,38 1 2 ., 80 5 ., 3 41 ,,28 1 .66 0 ,,80 1 0 ,, 9 4 14,,20 6 ,,561 ,,00 0 .62 1 ,,48 1 1 ,,16 14,,42 7 ,,625 .,96 6 .34 5 .,9 4 4,,20 8 ,,40 5 .,360 ,.70 1 .08 0 ,,68 9 ,,46 1 2 ,,72 5 .,80
1 1 ,,80 1 2 .18 1 1 ,,78 1 ,,64 5 .,16 1 1 ,,201 3 .'74 14. 12 1 3 .,72 3 .,58 3 .,28 1 3 ,,141 1 ,'56 17. 94 17',5 4 7 ,,40 5 .,46 1 6 ,,96
0 ,,00 0 .38 0 ,,48 1 0 ,,16 1 3 ., 16 6 ,,620 ,,38 0 .00 0 ,,86 1 0 ,,57 1 3 ,,80 7 ,,000 ,,48 0 .86 0 ,,00 1 0 ,,14 1 3 ,,40 0 ,,86
1 0 ,,16 1 0 .57 1 0 ,,14 0 ,,00 6 ,,7 4 9,,561 3 .,42 13' 80 1 3 .,40 6,,74 0,,00 12,,526,,62 7' 00 0 ,,86 9 .,56 12,,82 0,,00

APPENDIX BFRIGHT COSTS OP SHIPPING CATTDE BY TRUCK,
PER MILE
No. From To 1
1. Abakallki2. Abeokuta3. Adamawa4. Annang"5. Bauchl6. Benin7. Benue8. Bornu9. Calabar
1 0 . Degema11. Delta12. Enugu1 3 . Fed. Territory14. Ibadan1 5 . Ijebu1 6 . Ilorin1 7 . Kabba18. Kano1 9 . Katsina20. Niger21. Ogoja22. Ondo2 3 . Onitsha24. Owerri2 5 . Oyo2 6 . Plateau2 7 . Port Harcourt28. Sardauna2 9 . Sokoto3 0 . Umuahia3 1 . Uyo3 2 . Yenogoa3 3 . Zaria
0. 00 20. 29 3 3 ,, 5 4 8,.9 4 28,.58 12,,3020. 29 0. 00 5 3 .,22 2 5 .,02 46,,08 12,, 243 3 .5 4 5 2 .92 0.,00 40,,2 6 1 5 ..48 40,, 628. 94 2 5;02 40,,26 0,,00 3 5 .,40 1 7 .,88
2 8 . 68 46. 08 1 5 .,48 35 .04 0,,00 35'.7 612. 30 12. 24 40,,62 35 '.40 3 5 ..7 6 0,, 0011. 16 3 0 .48 2 5 .,20 1 7 .,88 1 7 .,52 18,,244 5 .96 6 0 .30 1 6 ,.3 8 5 2 ,,68 1 7 .,28 5 3 .,0411. 94 28 . 02 4 3 .,26 3 .,00 38.,40 1 5 .'902 7 .60 2 6 .40 4 3 .,20 9..72 3 9 ..48 1 5 ..3014. 3 4 1 6 .02 42.,90 1 5 .,00 3 7 .98 3 .'783- 00 21. 36 3 2 ., 40 7 .,86 22.,68 8.,12
24. 5 4 3 .78 5 3 ..10 2 5 .,20 48.,48 12., 422 3 .40 2. 94 5 1 .,30 24,,06 4 3 ,,14 11,.2 820. 84 3 .5 4 4 9 .,38 21,,48 44,,46 8,.702 5 .44 8. 88 4 7 .■ 58 2 6 ,.52 3 7 .,20 12.,961 6 .98 14. 94 3 8 .,46 19..86 3 3 ..60 8.,283 9 .42 40. 50 2 6 ., 94 46,,13 11,,28 44,.404 3 .02 40. 08 3 3 .,42 4 9 .,7 4 1 7 ..7 6 44,.163 6 .12 1 9 .92 41.,46 5 2 ,,68 2 6 ,,16 40., 62
3 .60 2 7 .96 3 7 .,14 12,,5 4 38..92 14., 4018. 24 8. 46 4 5 .,78 18,.90 6,.12 2 3 .. 406.9 4 1 7 .92 3 5 ., 40 7 ..50 3 0 ,.48 5 ..28
7 .08 21. 18 3 8 ,,40 3 ..84 3 3 .. 06 8,. 9 424. 06 4. 92 5 1 .,90 2,.52 37..92 11., 9 424. 76 3 7 .92 20,,22 3 0 ,.12 4,.92 3 0 ..8411. 28 24. 84 42., 60 3 .,84 37 ..7 4 12., 603 3 .5 4 2 4 7 .20 7.,20 5 2 .,86 1 9 .,08 4 9 .,624 7 .88 3 6 .18 44,,3 4 5 3 .,04 40,,26 3 6 .,726.94 22. 56 3 7 .,56 2.,10 3 3 .,30 10.,3210. 08 2 6 .16 41,,40 1,,14 3 6 .,5 4 1 3 .,921 3 .08 2 7 .60 4 3 .,14 9.,72 39.,48 1 5 .,303 2 .76 3 3 .84 28,,92 39.,48 1 3 .,92 37.'38
217
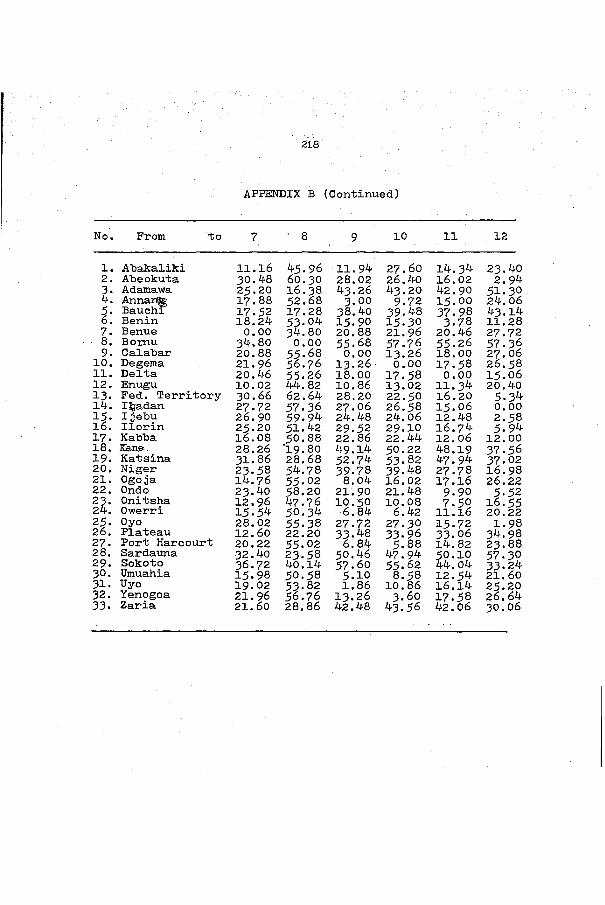
218
APPENDIX B (Continued)
No. From to 7 8 9 10 11 12
1. Abakallki 11.16 4 5 . 9 6 11.94 27.60 14.34 23.402. Abeokuta 30.48 6 0 . 3 0 28.02 26.40 16.02 2.943 . Adamawa 25.20 16 . 3 8 4 3 . 2 6 43.20 42.90 51 . 304. Annansg I7 . 8 8 5 2 . 6 8 3 .00 9 . 7 2 1 5 .OO 24.065 . Bauchl 1 7 . 5 2 1 7 . 2 8 3 8 . 4 0 39.48 37.98 43.146. Benin 18.24 53.04 I5 . 9 0 I5 . 3 0 3 . 7 8 11.287. Benue 0.00 3 4 .80 20.88 21.96 20.46 27.728. B o m u 34.80 0.00 5 5 . 6 8 5 7 . 7 6 5 5 . 2 6 5 7 . 3 69 . Calabar 20.88 5 5 . 6 8 0.00 1 3 . 2 6 18.00 27.06
10. Degema 21.96 5 6 . 7 6 I3 . 2 6 0.00 17.58 2 6 . 5 811. Delta 20.46 5 5 . 2 6 18.00 17.58 0.00 1 5 . 0 612. Enugu 10.02 44.82 10.86 I3 .O2 11.34 20.401 3 . Fed. Territory 3 0 . 6 6 62.64 28.20 22.50 16.20 5.3414. Ibadan 27.72 5 7 . 3 6 27.06 2 6 . 5 8 1 5 , 0 6 0.001 5 . Ijebu 2 6 . 9 0 5 9 . 9 4 24.48 24.06 12.48 2 . 5 81 6 . Ilorin 2 5 . 2 0 51.42 29.52 29.10 16.74 5 .941 7 . Kabba 16.08 5O . 8 8 22.86 22.44 12.06 12.0018. Kans.. 28.26 '19.80 49.14 5 0 . 2 2 48.19 37.561 9 . Katsina 3I . 8 6 28.68 52.74 5 3 . 8 2 47.94 37.0220. Niger 23.58 5^.78 39.78 39.48 2 7 . 7 8 16 . 9 821. Ogoja 1 4 . 7 6 5 5 . 0 2 8.04 1 6 . 0 2 1 7 . 1 6 2 6 . 2 222. Ondo 2 3 . 4 0 58.20 21.90 21.48 9 .9O 5 . 5 223. Onitsha 12.96 47.76 10 . 5 0 10.08 7.50 16.5524. Owerri I5 . 5 4 50 . 3 4 6.84 6.42 11 . 1 6 20.222 5 . Oyo 28.02 55.38 27.72 27.30 15.72 1.982 6 . Plateau 12.60 22.20 33.48 3 3 . 9 6 3 3 . 0 6 3 4 . 9 82 7 . Port Harcourt 20.22 55.02 6.84 5 . 8 8 14.82 2 3 . 8 828. Sardauna 32.40 2 3 . 5 8 50.46 4 7 .94 5 0 .IO 5 7 . 302 9 . Sokoto 3 6 . 7 2 40.14 5 7 . 6 0 5 5 . 6 2 44.04 33.243 0 . Umuahia 15.98 50 . 5 8 5 .10 8 . 5 8 12.54 21.603 1 . Uyo 1 9 . 0 2 5 3 . 8 2 1.86 10.86 16.l4 25.203 2 . Yenogoa 21.96 56.76 1 3 . 2 6 3 . 6 0 1 7 . 5 8 26.643 3 . Zaria 21.60 28.86 42.48 4 3 . 5 6 42.06 3 0 . 06

219 '■
APPENDIX B (Continued)
No. Prom to I3 14 15 16 I7 18
1. ABakaliki 3 .00 24.54 20.82 25.44 16.98 39.422. Abeokuta 21 . 3 6 3 . 7 8 3.54 8.88 14.94 40.503 . Adamawa 32.40 5 3 . 1 0 4 9 . 3 8 4 7 . 5 8 3 8 . 4 6 26.844. Annang 7 . 8 6 25.20 21.48 2 6 . 5 2 19.86 46.135 . Bauchl 22.68 48.48 44.46 3 7 .20 3 3 . 6 0 11.286. Benin 9.12 12.42 8 .70 12 . 9 6 8.28 44.407 . Benue 14.02 3O . 6 6 26.94 25.20 16.08 28.268. B o m u 44.82 62.64 59.94 51.42 5 0 . 8 8 19.809 . Calabar 10.86 28.20 24.48 29.52 22.86 49.14
10. Degema I3 .O2 22.50 24.06 29.10 22.44 50.2211. Delta 1 1 . 3 4 1 6 . 2 0 12.48 16.74 12.06 48.1912. Enugu 0.00 2 1 . 5 4 1 7 . 8 2 22.86 16.20 3 8 . 2 81 3 . Fed. Territory 21.54 0.00 3 . 7 2 11.28 17.28 42.7214. Ibadan 20.40 5 . 3 4 2.58 5 .94 12.00 3 7 . 5 61 5 . Ijebu 17.82 3 . 7 2 0.00 8 . 5 2 14.58 40.141 6 . Ilorin 22.86 11.28 8 . 5 2 0.00 9.12 31.621 7 . Kabba 16.20 17.28 14.58 9.12 0.00 40.7418. kaao 3 8 . 2 8 4 2 . 7 2 40.14 3 1 . 6 2 4 0 . 7 4 0.001 9 . Katsina 41.88 42.48 3 9 . 7 2 3 1 .2 0 47.22 6.4820. Niger 32.12 22.32 19-56 11.04 20.16 20.5821. Ogoja 6 . 6 0 28.14 24.42 29.04 18.18 43.0222. Ondo 1 5 . 2 4 9 . 5 4 5 . 8 2 7 . 9 2 7 . 5 0 3 9 . 5 42 3 . Onitsha 3 .84 17-70 1 3 . 9 8 18.24 12 . 3 5 41.2224. Owerri 6.60 21 . 3 6 17.64 21.90 16.02 43.802 5 . Oyo 2 1 . 0 6 7 . 3 2 4 . 6 2 3 - 9 6 12.18 35-582 6 . Plateau 21-42 40.42 37-56 29-04 28.68 1 5 . 6 62 7 . Port Harcourt 10.20 25.02 21 . 30 2 5 . 5 6 19-68 48.4828. Sardauna 3 9 - 6 0 6 0 . 3 0 56.40 5 4 . 7 8 38.46 34.142 9 . Sokoto 46.74 3 8 . 5 8 35.82 27-30 36.42 20 . 3 43 0 . Umuahia 5 . 7 6 22.74 19-02 23-28 17.40 44.0431- Uyo 9-00 2 6 . 3 4 2 2 . 6 2 2 6 . 8 8 21.00 4 7 - 2 83 2 - Yenogoa I3 . 0 2 22-50 24.06 29-10 22.44 50.223 3 . Zaria 31-52 36.24 33.48 24.95 34.08 6.66
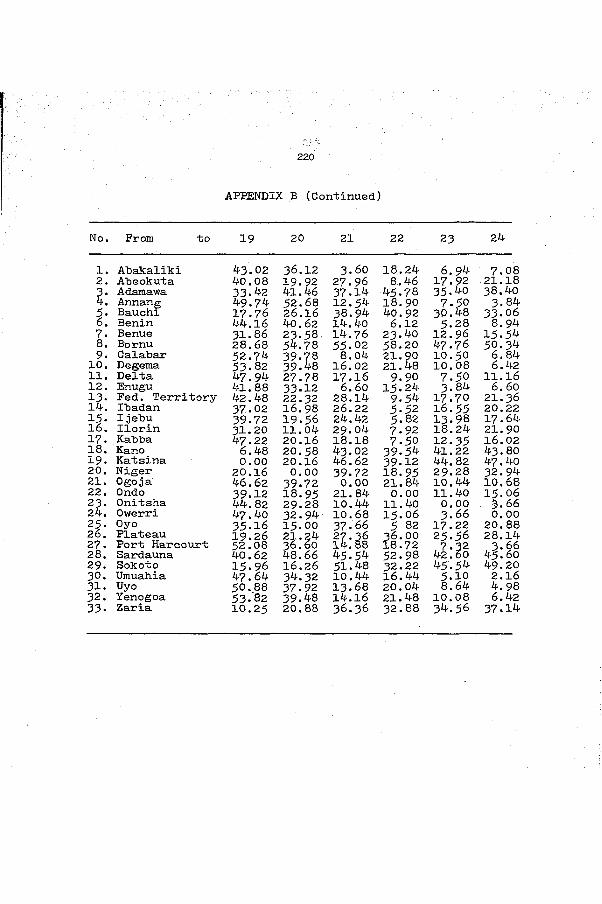
220
APEENDIX B (Continued)
No. From to 19 20 21 22 23 24
1. Abakaliki 43.02 36.12 3.602. Abeokuta 40.08 19.92 27.963. Adamawa 33.42 41.46 37.144. Annang 49.74 52.68 12.545. Bauchl 1 7 . 7 6 2 6 . 1 6 3 8 . 9 46 . Benin 44.16 40 . 6 2 14.407 . Benue 31.86 2 3 .5 8 . 14.768. Bornu 2 8 . 6 8 54.78 55.029 . Calabar 52.74 39.76 8.0410. Degema 53.82 39.48 16.02
11. Delta 4 7 . 9 4 2 7 . 7 8 1 7 . 1 612. Enugu 41.88 33.12 6.60
Fed. Territory 42.48 22.32 28.14Ibadan 37.02 1 6 . 9 8 26.22
1 5 . Ijebu 3 9 . 7 2 1 9 . 5 6 24.421 6 . Ilorin 3 1 . 2 0 11.04 29.041 7 . Kabba 47.22 20.16 18.1818. Kano 6.48 20 . 5 8 43.021 9 . Katsina 0.00 20.16 46.6220. Niger 20.16 0.00 39.7221. Ogoja 46.62 39.72 0.0022. Ondo 3 9 . 1 2 18.95 21.842 3 . Onitsha 44.82 29.28 10.4424. Owerri 47.40 32.94 10.682 5 . Oyo 3 5 . 1 6 1 5 . 0 0 3 7 . 6 62 6 . Plateau 1 9 . 2 6 21.24 2 7 . 3 62 7 . Port Harcourt 52.08 3 6 . 6 0 l4.882 8 . Sardauna 40.62 48.66 45.542 9 . Sokoto 1 5 . 9 6 1 6 . 2 6 51.483 0 . Umuahia 47.64 3 4 . 3 2 10.443 1 . Uyo 5 0 . 8 8 3 7 . 9 2 1 3 . 6 83 2 . Yenogoa 53.82 39.48 14 . 163 3 . Zaria 10.25 20.88 3 6 . 3 6
18,,24 6. 94 7. 088. 46 1 7 .92 21. 184 5 .. 78 3 5 .40 3 8 .4018.,90 7 .50 3 .8440.. 92 3 0 .48 33. 066. 12 5 .28 8. 94
2 3 ..40 12. 96 1 5 .5458.,20 4 7 .76 5 0 .3421..90 10. 50 6. 8421.,48 10. 08 6. 42
9 ..90 7. 50 11. 161 5 .,24 3 .84 6. 60
9 .,5 4 1 7 .70 21. 365 .,52 1 6 .55 20. 225 ..82 1 3 .98 1 7 .647 .. 92 18. 24 21. 907 .,50 12. 35 1 6 .02
39 ..5 4 41. 22 4 3 .803 9 .,12 44. 82 4 7 .4018.,95 2 9 .28 3 2 .9421.,84 10. 44 10. 680..00 11. 40 1 5 .06
11..40 0. 00 3 .661 5 ., 06 3 .66 0. 005 82 1 7 .22 20. 88
3 6 .,00 2 5 .56 28. 1418., 72 7 .32 3 .665 2 .,98 42. 60 4 5 .603 2 .,22 4 5 .5 4 4 9 .201 6 ., 44 5 .10 2. 1620.,04 8. 64 4. 9821.,48 10. 08 6. 423 2 .,88 3 4 .56 37 . 14

221- '
APPENDIX B (Continued)
No. Prom to 25 26 27 28 29 30
1. Abakaliki 24.06 2 3 . 7 6 11.28 33.54 47.88 6.942. Abeokuta 4.92 37.92 24.84 247.20 3 6 . 1 8 2 2 . 5 63 . Adamawa 51.90 20.22 42.60 7.20 44.34 3 7 . 5 64. Annang 2.52 3 0 .I2 3.84 52.86 53.04 2.105 . Bauchl 3 7 . 9 2 4 . 9 2 3 7 . 7 4 1 9 . 0 8 29.04 3 3 . 306. Benin 11.94 30.84 12.60 49 . 6 2 40.26 10 . 3 27 . Benue 28.42 12.60 20.22 32.40 3 6 . 7 2 15.788. B-omu 5 5 . 3 8 22.20 55.02 2 3 . 5 8 40.14 5 0 . 5 89 . Calabar 27.72 33.48 6.84 50.46 5 7 . 6 0 5 . 1 0
10. Degema 27.30 3 3 . 9 6 5 . 8 8 47.94 55-62 8 . 5 811. Delta 1 5 . 7 2 3 3 . 0 6 14.82 5O.IO 44.04 12.5412. Enugu 2 1 . 0 6 21.42 10.20 3 9 . 6 6 46.74 5 . 7 61 3 . Fed. Territory 7 . 3 2 40 . 3 2 25.02 6 0 . 30 3 8 . 5 8 22.7414. Ibadan 1 . 9 8 3 4 . 9 8 2 3 . 8 8 57.30 33.24 21.601 5 . Ijebu 4 . 6 2 3 7 . 5 6 2 1 . 3 0 5 6 . 4 0 3 5 . 8 2 1 9 . 0 216. Ilorin 3 . 9 6 29-04 2 5 . 5 6 54.78 27-30 23-281 7 . Kabba 12.18 28.68 19-68 38.46 3 6 . 4 2 17.4018. Kano 35-58 15-66 48.48 34.14 20.24 44.041 9 . Katsina 3 5 - 1 6 1 9 . 2 6 5 2 .08 40.62 I5 . 96 47-6420. Niger 1 5 . 0 0 21.24 3 6 . 60 48.66 16 . 2 6 34-3221. Ogoja 2 7 . 6 6 2 7 . 3 6 14.88 4 5 . 5 4 51.48 10.4422. Ondo 5 .82 3 6 .00 18-72 52.98 32.22 16.442 3 . Onitsha 17-22 25-56 7-32 42.60 4 5 . 5 4 5 .1024. Owerri 20.88 28.14 3 . 6 6 45.60 49.20 2 . 1 62 5 . Oyo 0.00 3 6 . 2 4 2 4 . 5 4 5 9 . 1 0 3 1 . 2 6 2 2 . 2 62 6 . Plateau 36.24 0.00 3 2 . 8 2 27.42 24.12 2 8 . 3 82 7 . Port Harcourt 24-54 3 2 . 8 0 0.00 49.80 5 6 . 9 4 4.4428. Sardauna 59-10 27-42 49-80 0.00 5 1 . 5 4 4 5 . 3 62 9 . Sokoto 3 1 . 2 6 24.12 5 6 . 9 4 5 1 . 5 4 0.00 5 2 . 7 43 0 . Umuahia 2 2 . 2 6 2 8 . 3 8 4.44 4 5 . 3 6 52-74 0.003 1 . Uyo 28.86 3 1 . 6 2 4 . 9 8 48.60 5 5 . 7 4 3-243 2 . Yenogoa 30.90 34-56 5 . 8 8 47.10 55.62 8 . 5 83 3 . Zaria 28-92 9.00 41.82 36.42 15.12 37-38

222
APPENDIX B (Cbntinued)
No. From to 31 32 33
1. Abakaliki 10.08 1 3 . 8 0 3 2 .7 62. Abeokuta 2 6 . 1 6 2 7 . 6 0 33.843. Adamawa 41.40 4 3 . 1 4 2 8 . 9 24. Annang 1.14 9 . 7 2 39.485. Bauchi • 3 6 . 5 4 39.48 1 3 . 9 26. Benin 1 3 . 9 2 1 5 . 3 0 3 7 . 3 87. Benue 1 9 . 0 2 2 1 . 9 6 2 1 . 6 08. Bprnu 5 3 . 8 2 5 6 . 7 6 28.869. Calabar 1.86 1 3 . 2 6 42.4810. Degema 10.86 3 . 6 0 4 3 . 5 611. Delta 16.14 1 7 . 5 8 42.06
12. Enugu 9.00 1 3 . 0 2 3 1 .5 213. Fed. Territory 2 6 . 34 2 2 . 5 0 3 6 . 2 414. Ibadan 2 5 . 2 0 26.64 3 0 . 0 615. Ijebu 2 2 . 6 2 24.06 33.48l6. Ilorin 2 6 . 8 8 2 9 . 1 0 24.9517. Kabba 21.00 22.44 3 4 . 0 8 .18. Ka®o 4 7 . 2 8 5 0 . 2 2 6.6619. Katsina 5 0 . 8 8 53.82 1 0 . 2 520. Niger 3 7 . 9 2 39.48 20.8821. Ogoja 1 3 . 6 8 14.16 3 6 . 3 622. Ondo 20.04 21.48 3 2 . 8 82 3 . Onitsha 8.64 10.08 3 4 . 5 624. Owerri 4 . 9 8 6.42 37.142 5 . Oyo 2 5 . 8 6 3 9 . 9 0 28.922 6 . Plateau 3 1 . 6 2 3 4 . 5 6 9 . 0 027. Port Harcourt 4.98 5 . 8 8 41.822 8 . Sardauna 48.60 4 7 . 1 6 3 6 . 4 22 9 . Sokoto 5 5 . 7 4 5 5 . 6 2 1 5 . 1 23 0 . Umuahia 3.24 8.58 3 7 . 3 83 1 . Uyo 0.00 10.86 4 0 . 6 23 2 . Yenogoa 10.86 0.00 4 3 . 5 63 3 . Zaria 40, 62 4 3 . 5 6 0.00
All costs are in Naira (M 1.00 = $1.6o)Source I Computed from field data. For the field data, the
author is indebted to Anthony J. Urom, Emmanuel Ekpoudom, Ise Ekpoudom, Marcus Opara, Rev. Fr. BernardNwoedu, Solomon Charlie, and Udom Ekpoudom for theirefforts in collecting the data for this analysis.Since there are no recorded changes for cattle shipment by truck the collection of field data was necessary for this study.

APPENDIX C FREIGHT COSTS OF SHIPPING CATTLE BY
RAIL PER MILE
No. From To 1 2 3 4 5 6
1. Kaura Namoda 0 . 0 0 0 . 2 0 0.80 1 . 3 0 1 . 8 0 2 . 7 02. Gusau 0 . 2 0 0 . 0 0 0 . 6 0 0 . 9 0 1 . 5 0 2.403. Funtua 0 . 8 0 0 . 6 0 0 . 0 0 0 . 3 0 0 . 8 0 1.804. Zaria 1 . 3 0 0 . 8 0 0 . 3 0 0 . 0 0.40 1.405. Kaduna 1 . 8 0 1 . 5 0 0 . 80 0.40 0 .0 0 0 . 9 06 . Minna 2 . 7 0 2.40 1.80 1.40 0 . 9 0 0 . 0 07. Baro 3.80 3 . 5 0 2 . 8 0 2 . 5 0 2 . 0 0 1 . 1 08 . Zungeru 3 . 2 0 2.80 2 . 1 0 1.80 1 . 3 0 2 . 2 09. Jebba 4.20 4.00 3 . 4 0 2 . 90 2.40 1 . 5 010, Ilorin 4.80 4 . 5 0 3 . 9 0 3 . 5 0 2.40 2 . 1 0
11. Oshogbo 5 . 0 0 5.40 4 . 5 0 4.10 3 .6 0 2 . 6 012. Ibadan 6 . 0 0 5 . 8 0 5 . 1 0 4 . 7 0 4.20 3 . 2 01 3 . Abeokuta 6 . 6 0 6 . 3 0 5 . 7 0 5 . 3 0 4 . 7 0 3 . 8 014. Lagos 7 . 2 0 6. 90 6 . 3 0 5 . 9 0 5.40 4.101 5 . Idogo 7 . 2 0 6 . 9 0 6. 30 5 . 9 0 5.40 4.101 6 . Nguru 3 . 5 0 3 .2 0 3 . 5 0 2.20 2 . 6 0 3 . 6 01 7 . Kano 2.10 1. 80 1.20 0 . 9 0 1 . 3 0 2.2018. Maiduguri 7 . 1 0 6 .8 0 6.20 5 . 8 0 5 . 3 0 6.201 9 . Gombe 3 . 5 0 1 . 5 0 4 . 3 0 3 . 9 0 3 . 5 0 4.4020. Bauchi 4 .3 0 4.00 2.40 2 . 9 0 2.40 3 .4 021. Jos 3 . 5 0 3 . 2 0 2 . 5 0 2.10 1 . 6 0 2 . 6 022. Bukuru 3 . 4 0 3 .1 0 2.40 2.00 1 . 6 0 2 . 5 02 3 . Zonkwa 2 . 5 0 2.40 1. 80 1.40 0. 80 1.8024. Kafanchan 2.80 2 . 5 0 1 . 9 0 1 . 5 0 1.10 2.002 5 . Lafia 3 . 9 0 3 .6 0 2 . 9 0 2 . 5 0 2.00 3 .1 026. Makurdi 4 . 5 0 4.20 3 . 6 0 3 . 2 0 2 . 6 0 3 . 6 02 7 . Oturkpo 4 . 9 0 4 . 7 0 4.10 3 . 7 0 3 .2 0 4.102 8. Enugu 5.80 5 . 5 0 4.80 4 . 5 0 4.00 4. 9029- Umuahia 6 . 6 0 6. 30 5 . 7 0 5 . 3 0 4 . 7 0 5 . 7 03 0 . Aba 6.80 6 . 6 0 6.00 5 . 6 0 0 . 5 0 6.003 1 . Port Harcourt 7 . 3 0 6. 90 6 . 3 0 5 . 9 0 5 . 5 0 6.40
223

224
APPENDIX C (Continued)
No. From To 7 8 9 10 11 12
1. Kauna Namoda 3 . 80 3 . 1 0 4.20 4 . 8 0 5 . 5 0 6.002. Gusau 3 . 5 0 2.80 4.00 4 . 5 0 5 . 0 0 5 . 803. Funtua 2.80 2.10 3 . 4 0 2 . 9 0 4.40 5 . 1 0h. Zaria 2 . 5 0 1.80 2. 90 3 . 5 0 4.00 4 . 7 05• Kaduna 2.00 1.40 2.40 3 . 1 0 3 . 6 0 4.206. Minna 1.10 0 . 3 0 1 . 5 0 2.10 2 . 5 0 3 .3 07. Baro 0.00 2.80 1 . 5 0 2.10 3 . 8 0 4 . 3 08, Zungeru 1.40 0.00 1.20 1 . 7 0 4.80 2 . 9 09. Jebba 2 . 5 0 3.40 0.00 0 . 5 0 0 . 9 0 1 . 7 010. Ilorin 3.20 2.40 0 . 5 0 0.00 0.40 1.20
11. Oshogbo 3 .7 0 2 . 3 0 1.20 0 . 5 0 0.00 0 . 5 012. Ibadan 5 . 1 0 3.60 1 . 7 0 1.20 1.20 0.001 3 . Abeokuta 4 . 9 0 4.20 2 . 3 0 1 . 7 0 1.20 0 . 5 014. Lagos 5 . 5 0 4.40 2.80 2 . 3 0 2.00 1.201 5 . Idogo 5 . 5 0 4.40 2.80 2 . 3 0 2.00 1.201 6 . Nguru 4 . 7 0 4.10 5 . 1 0 5.80 6.20 6 . 9 01 7 . Kano 3 . 3 0 2 . 6 0 3 . 8 0 4 . 3 0 4.40 5 . 6 018. Maiduguri 7 . 3 0 6 . 5 0 7.80 8 . 3 0 8.80 9 .5 01 9 . Gombe 5 . 5 0 4 . 7 0 5 . 9 0 6 . 5 0 7 . 1 0 7 . 7 020. Bauchi 4.40 3 .7 0 4 . 9 0 5 . 5 0 6.00 6 . 7 021. Jos 3 . 80 2 . 9 0 4.10 4 . 7 0 5 . 1 0 5 . 9 022. Bukuru 3 . 6 0 2.80 4.00 4 . 6 0 5 . 1 0 5.802 3 . Zonkwa 2.80 2110 2 . 7 0 3.40 3 . 9 0 4 . 5 024. Kafanchan 3 . 1 0 2 . 3 0 3-50 4.10 4.60 5 . 3 02 5 . Lafia 4.10 3 . 4 0 4 . 5 0 5 . 1 0 5 . 6 0 6 . 3 02 6 . Makurdi 4 . 7 0 4.10 5 . 1 0 5 . 7 0 6.20 6 . 9 02 7 . Oturkpo 5 . 3 0 4 . 5 0 5 . 7 0 6 . 3 0 6 . 5 0 7.4028. Enugu 6.00 5 . 0 0 6.40 7 . 1 0 0 . 7 0 8.202 9 . Umuahia 6 . 7 0 6.10 7 . 3 0 7 . 8 0 8 . 3 0 9 .0 03 0 . Aba 1.10 6.40 7 . 6 0 8.10 8 . 6 0 9 .3 03 1 . Port Harcourt 7 . 5 0 6 . 7 0 7 . 9 0 8 . 5 0 9 .0 0 9 .7 0
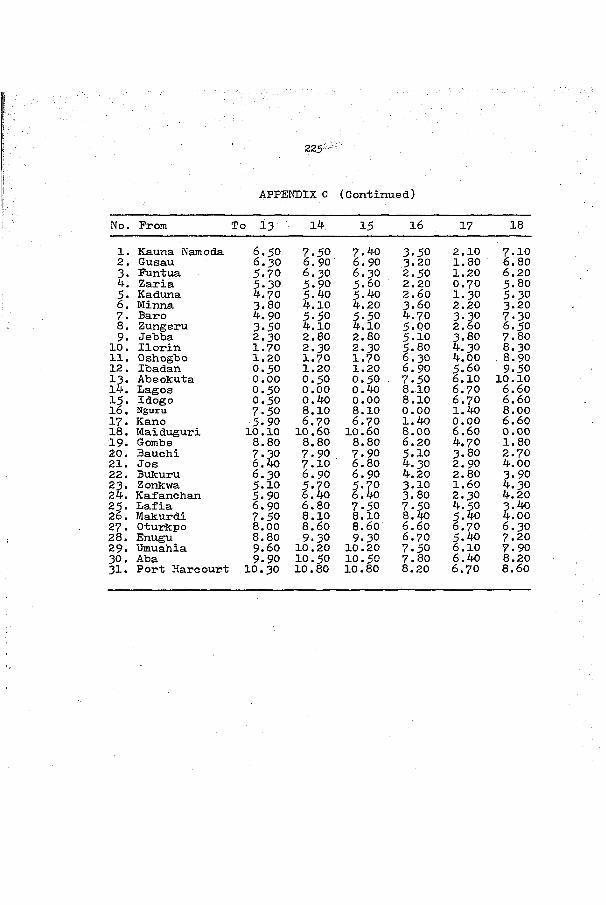
225-
APPENDIX G (Continued)
No. Prom To 13 14 15 16 17 18
1. Kauna Namoda 6 . 5 0 7 . 5 0 7.40 3 . 5 0 2 . 1 0 7 . 1 02. Gusau 6 . 3 0 6 . 9 0 6 . 9 0 3 . 2 0 1.80 6 . 803. Funtua 5 . 7 0 6 . 3 0 6 . 3 0 2 . 5 0 1 . 2 0 6 . 2 04. Zaria 5 . 3 0 5 . 9 0 5 . 6 0 2 . 2 0 0 . 7 0 5 . 8 05. Kaduna 4 . 7 0 5.40 5 . 4 0 2 . 6 0 1 . 3 0 5 . 3 0D . Minna 3 .8 0 4.10 4.20 3 . 6 0 2 . 2 0 3 . 2 07. Baro 4 . 9 0 5 . 5 0 5 . 5 0 4 . 7 0 3 .3 0 7 . 3 08 . Zungeru 3 .5 0 4.10 4.10 5 . 0 0 2 . 6 0 6 . 5 09 . Jebba 2 . 3 0 2.80 2 . 80 5 . 1 0 3.80 7.80
10. Ilorin 1 . 7 0 2 . 3 0 2 . 3 0 5 . 8 0 4. 30 8 . 3 011. Oshogbo 1 . 2 0 1 . 7 0 1 . 7 0 6 . 30 4.00 8 .9 012. Ibadan 0 . 5 0 1 . 2 0 1 . 2 0 6 . 9 0 5.60 9 .5 013. Abeokuta 0 . 0 0 0 . 5 0 0 . 5 0 . 7 . 5 0 6 . 1 0 1 0 . 1 014. Lagos 0 . 5 0 0 . 0 0 0.40 8 . 1 0 6 . 7 0 6 . 6 01 5 . Idogo 0 . 5 0 0.40 0 . 0 0 8 . 1 0 6 . 7 0 6 . 6 01 6 . Nguru 7 . 5 0 8 . 1 0 8 . 1 0 0 . 0 0 1.40 8 .0 01 7 . Kano 5 . 9 0 6 . 7 0 6 . 7 0 1.40 0 . 0 0 6 . 6 018. Maiduguri 1 0 . 1 0 1 0 . 6 0 1 0 .6 0 8 . 0 0 6 . 6 0 0 . 0 01 9 . Gombe 8 . 8 0 8.80 8 .8 0 6 . 2 0 4 . 7 0 1.8020. Bauchi 7 . 3 0 7 . 9 0 7 . 9 0 5 . 1 0 3.80 2 . 7 021. Jos 6.40 7 . 1 0 6.80 4 . 3 0 2. 90 4.0022. Bukuru 6 . 3 0 6. 90 6 . 9 0 4.20 2.80 3 . 9 023. Zonkwa 5 . 1 0 5 . 7 0 5-70 3 .1 0 1 . 6 0 4 . 3 024. Kafanchan 5 . 9 0 6.40 6.40 3 . 80 2 . 3 0 4.202 5 . Lafia 6 . 9 0 6.80 7 . 5 0 7 . 5 0 4 . 5 0 3 . 4 02 6 . Makurdi 7 . 5 0 8.10 8.10 8.40 5 . 4 0 4.002 7 . Oturkpo 8.00 8 . 6 0 8 . 6 0 6 . 6 0 6 . 7 0 6 . 3 028. Enugu 8.80 9 . 3 0 9 .3 0 6 . 7 0 5 . 4 0 7 . 2 02 9 . Umuahia 9 .6 0 10.20 10.20 7 . 5 0 6.10 7 . 9 03 0 . Aba 9 .9 0 1 0 . 5 0 1 0 . 5 0 7.80 6.40 8.203 1 . Port Harcourt 1 0 . 3 0 10.80 10.80 8.20 6 . 7 0 8 . 6 0

226 ,
APPENDIX C (Continued)
No. From To 19 20 21 22 23 24
1. Kauna Namoda 5 . 3 0 4 . 3 0 3 . 5 0 3 .4 0 2 . 6 0 .3 . 2 02. Gusau 4 . 9 0 4.00 3.20 3 .1 0 2.40 2 . 5 03» Funtua 4 . 3 0 3 .4 0 2 . 5 0 2.40 1.80 1 . 9 04. Zaria 3 .9 0 2 . 9 0 2.10 2.00 1.40 1 . 5 05■ Kaduna 3 .5 0 2.40 1 . 6 0 1 . 6 0 0.80 1.106. Minna 4.40 3.40 2 . 6 0 2 . 5 0 1.80 2.007. Baro 5 . 5 0 4.40 3 . 7 0 3 . 6 0 2. 80 3 . 1 08. Zungeru 4 . 7 0 3 .8 0 2 . 9 0 2.80 1 . 9 0 2 . 3 09. Jebba 5 . 9 0 4 .9 0 4.10 4.00 3.40 3 . 5 010. Ilorin 6 . 5 0 5 . 5 0 4 . 7 0 4 . 6 0 3 .4 0 4.10
11. Oshogbo 7.40 6.10 5 . 3 0 5 . 1 0 4 . 5 0 4 . 7 012. Ibadan 7 . 7 0 6 . 7 0 5 . 9 0 5.80 5 . 0 0 5 . 3 01 3 . Abeokuta 8 . 3 0 7 . 3 0 6.40 6 . 3 0 5 . 7 0 5 . 9 0l4. Lagos 8.80 7 . 9 0 7 . 1 0 6 . 9 0 6.20 6.401 5 . Idogo 8.80 7 . 9 0 7.10 6. 90 6.20 6.401 6 . Nguru 7 . 5 0 5 . 1 0 4 . 3 0 4.20 3 . 6 0 3 .7 01 7 . Kano 4 . 7 0 3 .8 0 2 . 90 2.80 2.20 2 . 3 018. Maiduguri 1.80 2 . 7 0 4.00 3 . 9 0 4. 30 4.201 9 . Gombe 0.00 0 . 9 0 2.20 2.10 4 . 3 0 2,4020. Bauchi 0 . 9 0 0.00 1.20 1.10 6.20 1.4021. Jos 2.20 1.20 0.00 0.10 0 . 7 0 0 . 5 022. Bukuru 2.10 1.10 0.10 0.00 0 . 6 0 0.4023' Zonkwa 2 . 5 0 1 . 6 0 0 . 7 0 0 . 6 0 0.00 0.1024. Kafanchan 2.40 1.40 0 . 5 0 0.40 0.10 0.002 5 . Lafia 5 . 3 0 3 . 4 0 4.10 1 . 6 0 1 . 5 0 1.202 6 . Makurdi 5.80 4.00 3 .1 0 2.20 2.10 1 . 9 02 7 . Oturkpo 6 . 7 0 6 . 7 0 5 . 7 0 2 . 6 0 2 . 6 0 2 . 3 028. Enugu 5 . 4 0 4 . 3 0 3 . 5 0 3 .5 0 0 . 7 0 2 . 9 02 9 . Umuahia 6.10 5 . 1 0 4 . 3 0 4.20 3 . 9 0 3 . 7 03 0 . Aba 6.40 5.40 4.60 4 . 5 0 4.20 4.003 1 . Port Harcourt 6 . 7 0 5 . 8 0 4 .9 0 4.80 4 . 5 0 4 . 3 0

227
APPENDIX C (Continued)
No. Prom To 25 26 27 28 29 30 31
1. Kaura Namoda 3 .9 0 4 . 5 0 4. 90 5 . 8 0 6 . 6 0 6.80 7 . 2 02. Gusau 3 .6 0 4.20 4 . 7 0 5 . 5 0 6 . 3 0 6 . 6 0 6 . 9 03. Funtua 2 . 9 0 3 . 6 0 4.00 4.80 5 . 7 0 6 . 0 0 6 . 3 04, Zaria 2 . 5 0 3 . 2 0 3 .7 0 4 . 5 0 5 . 3 0 5 . 6 0 5 . 9 05. Kaduna 2 .0 0 2 . 6 0 3 .2 0 4.00 4 . 7 0 5 . 0 0 5 . 5 06 . Minna 3 .1 0 3 . 6 0 4.10 4 . 9 0 5 . 7 0 6 . 0 0 6.407. Baro 4.10 4 . 7 0 5 . 1 0 6.00 6 . 7 0 7 . 1 0 7 . 5 08. Zungeru 3 .5 0 4.00 4.40 5 . 3 0 6.10 6 . 3 0 6 . 7 09. Jebba 4 . 5 0 5 . 1 0 5 . 6 0 6.40 7 . 3 0 7 . 6 0 7 . 9 0
10. Ilorin 5 . 1 0 5 . 7 0 6.20 7 . 1 0 7.80 8.10 8 . 5 011. Oshogbo 5 . 7 0 6. 30 6.80 7 . 7 0 8.40 8 . 7 0 9 .1 012. Ibadan 6. 30 6 . 9 0 7.40 8.20 9 . 0 0 9 .3 0 9 .7 01 3 . Abeokuta 6.80 7 . 5 0 8.00 8.80 9 .6 0 9 .9 0 1 0 . 3 014. Lagos 7 . 5 0 8.10 8 . 6 0 9 .3 0 10.20 1 0 .5 0 10.801 5 . Idogo 7 . 5 0 8.14 8 . 6 0 9 .3 0 10.20 1 0 .5 0 10.801 6 . Nguru . 4 . 7 0 5.40 5 . 9 0 6 . 7 0 7 . 5 0 7.80 8.201 7 . Kano 3 .4 0 4.00 4 . 5 0 5 . 4 0 6.10 6.40 6 . 7 01 8 . Maiduguri 5 . 3 0 5.80 6 . 3 0 7 . 3 0 7 . 9 0 8.20 8 . 6 01 9 . Gombe 3 .4 0 4.00 4 . 5 0 5 . 3 0 6.10 6.40 6 . 7 020. Bauchi 2.40 3 .1 0 3 .3 0 4 . 3 0 5 . 1 0 5.40 5 . 8 021. Jos 1 . 6 0 2 . 6 0 2 . 6 0 3 . 5 0 4. 30 4 . 6 0 4 . 9 022. Bukuru 1 . 5 0 2.10 2 . 6 0 3 . 5 0 4.20 4 . 5 0 4.802 3 . Zonkwa 1.20 1.80 2.20 3 . 2 0 3 . 4 0 3 . 9 0 4.0024. Kafanchan 0 . 9 0 1 . 6 0 2.10 2 . 9 0 3 . 7 0 4.00 4 . 3 02 5 . Lafia 0.00 0 . 5 0 1.10 1 . 9 0 2 . 6 0 2 . 9 0 3 .4 02 6 . Makurdi 1 . 6 0 0.00 0.40 1 . 3 0 2.00 2 .3 0 2 . 7 02 7 . Oturkpo 2.10 1.10 0.00 0 . 7 0 1 . 6 0 1 . 9 0 2.202 8 . Enugu 1 . 9 0 1 . 3 0 0 . 7 0 0.00 0 . 7 0 1.11 1.402 9 . Umuahia 2 . 6 0 2.00 1 . 5 0 0 . 7 0 0.00 0.20 0 . 6 03 0 . Aba 2 . 9 0 2 . 3 0 1.80 1.10 0.20 0.00 0 . 3 03 1 . Port Harcourt 3.40 2 . 7 0 2.20 1.40 0 . 6 0 0 . 3 0 0.00
Source I Nigerian Railway Corporation, Tariff No. 7 .. 1971.All costs are in Naira (N)., 1974.

APPENDIX ® Optimum Movement of Cattle By Hoof
No. From To 1 2 3 4 5 6
1 . Sokoto 80 ,0302. Gusau3. KontagoraU. Ilorin5. Oyo6, Ibadan7. Abeokuta8. Lagos9. Ijebu-Ode
10. Ondo11. Benin City12. Warri13. Katsina14. Kano13. Zaria16. Kaduna17. Minna18. Loko ja19. Enugu .20. Onitsha21. Owerri22. Port Harcourt2 3 . Calabar24. Makurdi2 5 . Umuahia2 6 . Bauchi2 7 . Gombe 36 ,90 228. Maiduguri2 9 . Ikot Ekpene3 0 . Uyo3 1 . Aba3 2 . Jos 62,613Yola
Kabba
Total 62,613 36 ,902 80 ,030Delivered. Value N 32.10 33.40 1 2 .50
228

229
APPENDIX D (Continued)
No. From To 7 8 9 10 11 12
1. Sokoto2. Gusau3. Kontagora 108,849 52,8414. Ilorin5. Oyo6. Ibadan7. Abeoketa8. Lagos9. I.jebu-Ode
10. Ondo11. Benin City12. Warri13. Katsina 21.24214. Kano15. Zaria16. Kaduna17. Minna .18. Lokoja19. Enugu20. Onitsha21. Owerri22. Port Harcourt23. Calabar24. Makurdi25. Umuahia26. Bauchl27. Gombe 30,45728. Maiduguri29. Ikot Ekpene30. Uyo31. Aba32. Jos33. Yola 4,43234. Kabba
Total 30 ,45 7 .21,242 108,849 57.273

230
APPENDIX D (Continued)
No. From To 13 14 15 16 17 181. Sokoto2. Gusau3- Kontagora4. Ilorin5. Oyo6. Ibadan7. Abeokuta8. Lagos9. Ijebu-Ode
10. Ondo11. Benin City12. Warri13. Katsina14. Kano15. Zaria16. kaduna17. Minna18. Lokoja19. Enugu20. Onitsha21. Owerri22. Port Harcourt23. Calabar24. Makurdi25. Umuahia2 6 . Bauchl27. Gombe28. Maiduguri29. Ikot Ekpene30. Uyo31. Aba32. Jos33. Yola34. Kabba
TOTAL - - - - - - -DeliveredValue N

231APPENDIX D (Continued)
N o . Prom To 19 20 21 22 23 - 24
1 . Sokoto2 . Gusau3. Kontagora4. Ilorin 15,591 33,1695. Oyo6 . Ibadan7. Abeokuta8 . Lagos9. Ijebu-Ode
1 0 . Ondo1 1 . Benin City1 2 . Warri13. Katsina 20,14214. Kano . 18,754 23,80515. Zaria 3,5311 6 . Kaduna17. Minna18. .Loko ja19. Enugu2 0 . Onitsha2 1 . Owerri2 2 . Port Harcourt23. Calabar24. Makurdi 3,553 19,00025. Umuahia2 6 . Bauchl 5827. Gombe 12,235 4,8582 8 . Maiduguri29. Ikot Ekpene30. Uyo31. Aba32. Jos33. Yola34. Kabba 1,292
TOTAL 34,472 30,072 19,000 23,805 15.766 25,000

232
APPENDIX D (Continued)
No . From To
1. Sokoto■2 Gusau3. Kontagorah. Ilorin5. Oyo6. Ibadan7. Abeokuta8. Lagos9. I;jebu-Ode
10. Ondo11. Benin City12. Warri13. Katsina14. Kano15. Zaria16. Kaduna17. Minna18. Loko.ia19. Enugu20. Onitasha21. Owerri22. Port Harcourt23. Calabar24. Makurdi25. Umuahia26. Bauchl27. Gombe28. Maiduguri29. Ikot Ekpene30. Uyo31. Aba32. Jos33. Yola34. Kabba
25 26 27 28 29 30
21,08251.921
11,626
13,374
51,921 21,082 25,000

233
APPENDIX P (Continued)
No. From To 31: 32 33 34
1 . Sokoto 13.8942. Gusau3. Kontagora4. Ilorin5. Oyo6 . Ibadan7. Abeokuta8. Dagos9. Ijebu-Ode10. Ondo
11. Benin City12. Warri13. Katsina14. Kano 9.59715. Zaria16. Kaduna17. Minna18. Dokoja19. -Enugu20. Onitsha21. Owerri22. Port Harcourt23. Calabar24. Makurdi25. Umuahia2 6 . Bauchl27. Gombe28. Maiduguri29. Ikot Ekpene30. Uyo31. Aba32. Jos33. Yola34. Kabba 8,364
TOT AD 31.855

APPENDIX E Optimum Shipment of Cattle by Truck
From To 1 2 3 4 5 6 7
1. Abakallkl2. Abeokuta3. Adamawa4. Annang5, Bauchl,.6. Benin7. Benue8. Bornu9. Calabar
10. Degema11. Delta12. Enugu13. Federal Territory14. Ibadan15. Ijebu16. Ilorin17. Kabba18. Kano19. Katsina20. Niger21. Ogoja22. Ondo23. Onitsha24. Owerri25. Oyo26. Plateau27. Port Harcourt28. Sardauna29. Sokoto30. Umuahia31. Uyo32. Yenogoa33. Zaria
4,931
18,708
TOTAL 18,708 ' 66,197----
■ ,234

235
Appendix E (Continued)8______9 10 11 12 13 14
1. Abakallkl2. Abeokuta3. Adamawa4. Annang5. Bauchl6. Benin7. Benue8. Bornu9. Calabar
10. Degema11. Delta12. Enugu13. Federal Territory14. Ibadan15. Ijebu16. Ilorin17. Kabba18. Kano19. Katsina20. Niger21. Ogoja22. Ondo23. Onitsha24. Owerri25. Oyo26. Plateau27. Port Harcourt28. Sardauna29. Sokoto30. Umuahia31. Uyo32. Yenogoa33. Zaria
33,678
4,613 6,75620,892
43,991
12,179 6,147 18,525
34,272TOTAL 4,613--- 40,419 45,857 18,525
234

236
Appendix E (continued)15 16 17 18 19 20 21
1. Abakallkl2. Abeokuta3. Adamawa4. Annang5. Bauchl6, Benin7. Benue 28. Bornu9. Calabar
10. Degema11. Delta12. Enugu13. Federal Territory14. Ibadan15. Ijebu16. Ilorin17. Kabba18. Kano19. Katsina20. Niger21. Ogoja22. Ondo23. Onitsha24. Owerri25. Oyo26. Plateau27. Port Harcourt28. Sardauna 5,29. Sokoto30. Umuahia31. Uyo32. Yenogoa33. Zaria
2,114
5,776
_____________________________________ 3.939TOTAL 7j890 —— — ——— -- ——— 3*939

237
Appénijix E (continued)22 23 24 25 26 27
1. Abakallkl2. Abeokuta3. Adamawa4. Annang5. Bauchl6. Benin7. Benue8. Bornu9. Calabar10. Degema11. Delta12. Enugu13. Federal Territory14. Ibadan15. Ijebu16. Ilorin17. Kabba 3318. Kano19. Katsina20. Niger21. Ogoja22. Ondo23. Onitsha24. Owerri25. Oyo26. Plateau27. Port Harcourt28. Sardauna29. Sokoto30. Umuahia31. Uyo32. Yenogoa33. Zaria
13,642
14,930
112,835
23,456
22,5863,650
TOTAL 33,157 23,456 112,835 51,158 3,656

238
Appendix E (continued)28 29 30 31 32 33
1. Abakallkl2. Abeokuta3. Adamawa4. Annang5. Bauchl6. Benin7. Benue 1,6358. Bornu 90,6759. Calabar10. Degema11. Delta12. Enugu13. Federal Territory14. Ibadan15. Ijebu16. Ilorin17. Kabba18. Kano19. Katsina20. Niger21. Ogoja22. Ondo23. Onitsha24. Owerri25. Oyo26. Plateau27. Port Harcourt28. Sardauna 21,06729. Sokoto30. Umuahia31. Uyo32. Yenogoa33. Zaria
TOTAL 23,103 100,412 --

APPENDIX FOptimal Cattle Plow by Train
No. From To
1. Kaura Namoda2. Gusau3. Funtua4. Zaria5. Kaduna6. Minna 7• Baro8. Zungeru9. Jebba
10. Ilorin11. Oshogbo12. Igadan1 3 . Abeokuta14. Lagos1 5 . Idogo1 6 . Ngurn1 7 . Kano18. Maiduguri1 9 . Gombe20. Bauchi21. Jos22. Bukuru2 3 . Zonkwa24. Kafanchan2 5 . Lafia2 6 . Makurdi2 7 . Oturkpo2 8 . Enugu29. Umuahia3 0 . Aba3 1 . Port Harcourt

240
APPENDIX P (Continued)
No. From To 8 9 10 11 12 13 141. Kaura Namoda2. Gusau3. Funtua 754. Zaria5. Kaduna6 . Minna 117. Baro8 . Zungeru9. Jebba
10. Ilorin11. Oshogbo12. Ibadan1 3 . Abeokuta14. Lagos1 5 . Idogo1 6 . N g u m 2 , 0 7 51 7 . Kano 2 , 0 3 518. Maiduguri 6 , 6 7 4 32,1731 9 . Bombe20. Bauchi 5,47221. Jos22. Bukuru 9.8982 3 . Zonkwa 2,94924. Kafanchan2 5 . Lafia2 6 . Makurdi2 7 . Oturkpo28. Enugu2 9 . Umuahia3 0. Aba3 1. Port Harcourt
TOTAL 3 , 0 3 5 20,682 5,472 32,1738 . 3 0 9 . 5 0 1 0 . 6 0

241 tg?"APPENDIX F (Continued)
No. From To 15 16 1? 18 19 20 211. Kaura Namoda2. Gusau3. Funtua4. Zaria5. Kaduna6 . Minna7. Baro8 . Zungeru9. Jebba
10. Ilorin11. Oshogbo12. Ibadan1 3 . Abeokuta14. Lagos1 5 . Idogo1 6 . N g u m 17 . Kano18. Maiduguri1 9 . Gombe20. Bauchi21. Jos22. Bukuru2 3 . Zonkwa24. Kafanchan2 5 . Lafia2 6 . Makurdi2 7 . Oturkpo2 8 . Enugu2 9 . Umuahia3 0 . Aba31. Port Harcourt

2*2:APPENDIX P (Continued)
No. From To 22 23 24 25 26 27 28
1. Kaura Namoda2. Gusau3. Funtua4. Zaria 5• Kaduna6. Minna7. Baro8. Zungeru9. Jebba
10. Ilorin11. Oshogbo12. Ibadan1 3 . Abeokuta14. Lagos1 5 . Idogo1 6 . N g u m1 7 . Kano18. Maiduguri1 9 . Gombe20. Bauchi21. Jos22. Bukuru2 3 . Zonkwa24. Kafanchan2 5 . Lafia2 6 . Makurdi2 7 . Oturkpo28. Enugu2 9 . UmUahia3 0 . Aba3 1 . Port Harcourt
3,116
2368 , 6 9 2
426
4,020
TOTALDelivered Value N 3.3528.10 13.138
9 . 3 0
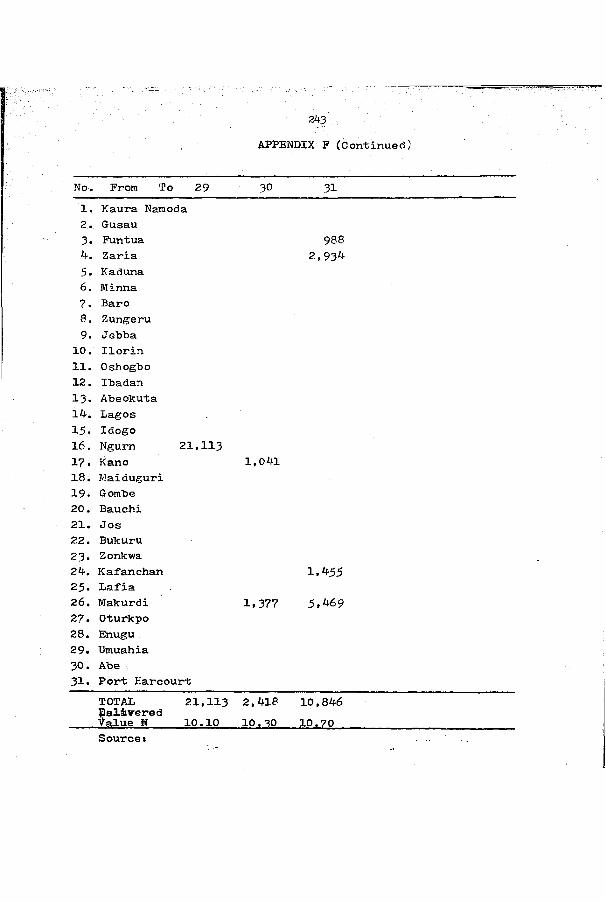
243APPENDIX F (Continued)
No. From To 29 30 311. Kaura Namoda2. Gusau3. Funtua 9884. Zaria 2,9345. Kaduna6. Minna7. Baro8. Zungeru9. Jebba
10. Ilorin11. Oshogbo12. Ibadan13. Abeokuta14. Lagos15. Idogo16. N g u m 21,11317. Kano 1,04118. Maiduguri19. Gombe20. Bauchi21. Jos22. Bukuru23. Zonkwa24. Kafanchan 1.45525. Lafia2 6 . Makurdi 1.377 5.46927. Oturkpo28. Enugu29. Umuahia30. Abe31. Port Harcourt
TOTAL Palivered Value N
21.11310.10
2,418 10. BO
10,846 10.70
Sourcei
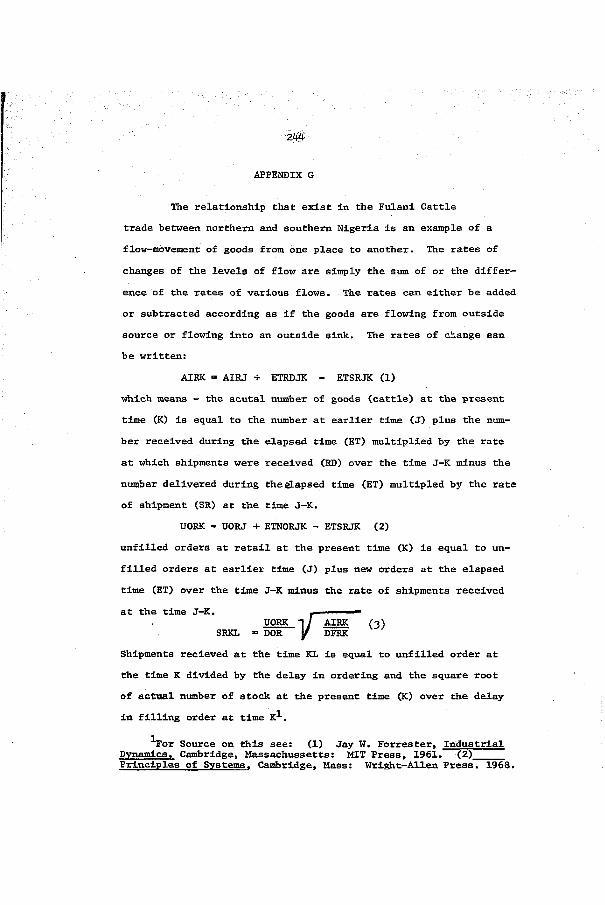
2 #
APPENDIX G
The relationship that exist in the Fulani Cattle trade between northern and southern Nigeria is an example of a
flow-movement of goods from one place to another. The rates of
changes of the levels of flow are simply the sum of or the differ
ence of the rates of various flows. The rates can either be added
or subtracted according as if the goods are flowing from outside source or flowing into an outside sink. The rates of change ean be written:
AIRK = AIRJ + ETRDJK - ETSEJK (1)
which means — the acutal number of goods (cattle) at the present
time (K) is equal to the number at earlier time (J) plus the num
ber received during the elapsed time (ET) multiplied by the rate
at which shipments were received (ED) over the time J-K minus the
number delivered during the elapsed time (ET) multipled by the rate of shipment (SR) at the time J-K.
UOEK » UORJ + ETNORJK - ETSEJK (2)
unfilled orders at retail at the present time (K) is equal to un
filled orders at earlier time (J) plus new orders at the elapsed
time (ET) over the time J-K minus the rate of shipments received
at the time J-K.
■fUOEK 1 / AIEK (3)SEKL = DOR y DFEK
Shipments recieved at the time KL is equal to unfilled order at the time K divided by the delay in ordering and the square root of actual number of stock at the present time (K) over the delay in filling order at time K^.
^For Source on this see: (1) Jay W, Forrester, IndustrialDynamics. Cambridge, Massachussetts: MIT Press, 1961.__(2)____Principles of Systems. Cambridge, Mass: Wright-Allen Press. 1968.