UniversiV Micrdnlms International - ShareOK
256
INFORMATION TO USERS This reproduction was made from a copy of a document sent to us for microfilming. While the most advanced technology has been used to photograph and reproduce this document, the quality of the reproduction is heavily dependent upon the quality of the material submitted. The following explanation of techniques is provided to help clarify markings or notations which may appear on this reproduction. 1.The sign or “target” for pages apparently lacking from the document photographed is “Missing Page(s)”. If it was possible to obtain the missing page(s) or section, they are spliced into the film along with adjacent pages. This may have necessitated cutting through an image and duplicating adjacent pages to assure complete continuity. 2. When an image on the film is obliterated with a round black mark, it is an indication of either blurred copy because of movement during exposure, duplicate copy, or copyrighted materials that should not have been filmed. For blurred pages, a good image of the page can be found in the adjacent frame. If copyrighted materials were deleted, a target note will appear listing the pages in the adjacent frame. 3. When a map, drawing or chart, etc., is part of the material being photographed, a definite method of “sectioning” the material has been followed. It is customary to begin filming at the upper left hand comer of a large sheet and to continue from left to right in equal sections with small overlaps. If necessary, sectioning is continued again-beginning below the first row and continuing on until complete. 4. For illustrations that cannot be satisfactorily reproduced by xerographic means, photographic prints can be purchased at additional cost and inserted into your xerographic copy. These prints are available upon request from the Dissertations Customer Services Department. 5. Some pages in any document may have indistinct print. In all cases the best available copy has been filmed. UniversiV Micrdnlms International 300 N. Zeeb Road Ann Arbor, Ml 48106
-
Upload
khangminh22 -
Category
Documents
-
view
0 -
download
0
Transcript of UniversiV Micrdnlms International - ShareOK

INFORMATION TO USERS
This reproduction was made from a copy o f a document sent to us for microfilming. While the most advanced technology has been used to photograph and reproduce this docum ent, the quality o f the reproduction is heavily dependent upon the quality o f the material submitted.
The following explanation of techniques is provided to help clarify markings or notations which may appear on this reproduction.
1.The sign or “ target” for pages apparently lacking from the document photographed is “Missing Page(s)” . If it was possible to obtain the missing page(s) or section, they are spliced into the film along with adjacent pages. This may have necessitated cutting through an image and duplicating adjacent pages to assure complete continuity.
2. When an image on the film is obliterated with a round black mark, it is an indication of either blurred copy because o f movement during exposure, duplicate copy, or copyrighted materials that should not have been filmed. For blurred pages, a good image o f the page can be found in the adjacent frame. If copyrighted materials were deleted, a target note will appear listing the pages in the adjacent frame.
3. When a map, drawing o r chart, etc., is part o f the material being photographed, a definite method of “sectioning” the material has been followed. It is customary to begin filming at the upper left hand com er o f a large sheet and to continue from left to right in equal sections with small overlaps. If necessary, sectioning is continued again-beginning below the first row and continuing on until complete.
4. For illustrations that cannot be satisfactorily reproduced by xerographic means, photographic prints can be purchased at additional cost and inserted into your xerographic copy. These prints are available upon request from the Dissertations Customer Services Department.
5. Some pages in any document may have indistinct print. In all cases the best available copy has been filmed.
UniversiVMicrdnlms
International300 N. Zeeb Road Ann Arbor, Ml 48106


8324886
Elm arghani, Mohamed Abdusalam
CONTINUOUS REDUCTION OF NICKEL AND COBALT FROM AMMONIACAL SULFATE SOLUTIONS BY HYDROGEN IN A TUBULAR REACTOR
The U niversity of Oklahoma Ph.D. 1983
UniversityMicrofilms
I n te r n âti 0 n 3.1 300 N. zeeb Road, Ann Arbor, Ml 48106


PLEASE NOTE:
In all ca se s this material has been filmed in the best possible way from the available copy. Problems encountered with this docum ent have been identified here with a check m ark V
1. Glossy photographs or p ag e s .
2. Colored illustrations, paper or print_____
3. Photographs with dark background_____
4. Illustrations a re poor copy______
5. P ages with black marks, not original copy.
6. Print shows through as there is text on both s id es of page.
7. Indistinct, broken or small print on several p ag es
8. Print exceeds margin requirem ents______
9. Tightly bound copy with print lost in spine______
10. Computer printout pages with indistinct print.
11. P ag e(s)____________ lacking when material received, and not available from school orauthor.
12. P age(s)____________ seem to be missing in numbering only a s text follows.
13. Two pages num bered____________ . Text follows.
14. Curling and wrinkled p a g e s______
15. O t h e r ____________ _______________ ____ ________________________
UniversityMicrofilms
international


THE UNIVERSITY OF OKLAHOMA GRADUATE COLLEGE
CONTINUOUS REDUCTION OF NICKEL AND COBALT FROM AMMONIACAL SULFATE SOLUTIONS BY
HYDROGEN IN A TUBULAR REACTOR
A DISSERTATION SUBMITTED TO THE GRADUATE FACULTY
in partial fulfillment of the requirements for the
degree of DOCTOR OF PHILOSOPHY
ByMOHAMED ABDUSALAM ELMARGHANI
Norman, Oklahoma 1983

CONTINUOUS REDUCTION OF NICKEL AND COBALT
FROM AMMONIACAL SULFATE SOLUTIONS BY
HYDROGEN IN A TUBULAR REACTOR
APPROVED BY
-rr- Z T 7-----^
iKSHBZDISSERTATION COMMITTEE
"In the Name of God Most Compassionate and Most Merciful"
To my (Late) Father-in-Law Mohamed Ali Abuzed
Who Appreciated the Value of Education

ABSTRACT
Continuous hydrogen reduction of metal values from their salt solutions can compete favorably with the conventional process of electrolysis (electrowinning) particularly if the cost of energy is a limiting factor. With the abundance of low grade ores, a continuous hydrogen reduction process provides a better alternative to electrowinning
since high throughputs can be processed at minimum operating costs. Hydrogen reduction for recovering pure metals from leach solutions is currently practiced in batch or semi- continuous, stirred reactors.
The objective of this study was to explore the reaction kinetics for an ammoniacal nickel sulfate-hydrogen system in a continuous, tubular reactor. An aqueous nickel
sulfate solution treated with ferrous sulfate (a nucleating agent) and preheated to an isothermal reactor temperature
was introduced at the top of the reactor while hydrogen was sparged at the bottom of the reactor for countercurrent operation. Ammonium hydroxide solution was injected separately at the reactor inlet for pH adjustment of the feed solution. Individual high pressure separators were used for
separation of the bottom products (liquid-solid) and overflowiv
(gas-liquid) products. Similarly, several experiments were also made to find a suitable nucleating agent for cobalt precipitation from its ammoniacal sulfate solution by hydrogen.
The results of the study indicate that nickel depletion from solution, which is defined herein as conversion,
depends on concentration of ferrous ions in the feed, total reactor pressure, molar ratio of ammonia to nickel at reactor inlet, temperature and concentration of ammonium sulfate in feed solution. In the range of study of resi
dence times, 1.25-5 minutes, no appreciable change in conversions due to either excess amount of hydrogen feed over the stoichiometric rate or to a change in residence time was
observed. The latter observation indicates that the rate of conversion is very fast. However, since the ultimate
objective of this study was to determine the effect of these
variables on the formation of metallic nickel, which is defined herein as the yield, it was necessary to estimate the metallic nickel content of the solid product using x-ray
diffraction techniques. The data indicate that the yeild to metallic nickel approaches the conversion only when reactor pressure exceeds about 4000 Kpa (580 psia) at 120°C
(250°F) and with 5 minutes of residence time. Since hydrogen solubilities decrease with a decrease in total pressure, corresponding decreases in yield values were observed. How
ever, soluble hydrogen accounts for all metal produced only atV

higher pressures (6200 Kpa-900 psia) while both gaseous and soluble hydrogen are responsible for nickel formation at lower pressures. In the range of study of reactor temperature, 75-193°C (175-380°f ), the rate of reduction to metallic
nickel increases with temperature up to a point and then levels
off at 193°C with a yield value of about 88 percent when the feed solution contains no ammonium sulfate. Over the temperature range of the study, it appears that the molar ratio of ammonia consumed to metallic nickel produced is about two,
indicating that the most easily reduced nickel complex is the
diammine. The data also indicate that soluble hydrogen is responsible for about 50 percent of the metal produced when only 25 percent excess hydrogen is used. The nickel conversion and yield data were correlated with a second order rate
equation; the apparent activation energies were found to be 12.45 and 10.66 Real per mole, respectively. In agreement with previous investigators, buffering feed solution with ammonium sulfate retards both nickel conversion and yield when the reactor temperature is less than or equal to 163°C
(325°F). At 193°C (380°F), the addition of ammonium sulfate seems to improve slightly the yield to metallic nickel (90 percent), but only at the expense of severe reactor plugging and plating of nickel on reactor walls.
The results of the exploratory runs on cobalt reduc
tion indicate that residence times longer than 5 minutes are required for metallic cobalt precipitation with a sodium sul-
fide-sodium cyanide nucleating agent.vi
ACKNOWLEDGMENT
The author is indebted to his Committee Chairman, Professor Cedomir M. Sliepcevich, for his interest and continual encouragement and guidance, to Dr. R. D. Daniels,Dr. F. M. Townsend, Dr. R. J. Block and Dr. G. Dryhurst for consenting to serve on the author's dissertation committee.
I am extremely grateful to El-Fatah University and University Technologists, Inc. for providing the financial support during this research work.
My sincere appreciation is extended to Dr. K. M. Sista, Dr. V. V. Hathi and my colleague Mrs. L. T. Jenq for their help during the experimental work.
The efforts of Mrs. B. A. Brown who typed the manuscript are appreciated.
Finally, I wish to acknowledge the contributions of my wife, Zohra, my children: Asma, Aymen and Nayrouz, by wayof many sacrifices and understanding without which this task would have been impossible and my parents for their incentive and prayers during my education.
Mohamed Abudsalam Elmarghani
vii

TABLE OF CONTENTS
PageLIST OF TABLES.............................................. xLIST OF ILLUSTRATIONS..................................... xiiChapter
I. INTRODUCTION....................................... 1
II. REVIEW OF LITERATURE.............................. 4III. THEORETICAL BACKGROUND........................... 16IV. EXPERIMENTAL EQUIPMENT............................ 43V. EXPERIMENTAL PROCEDURE........................... 53
VI. EXPERIMENTAL RESULTS.............................. 64VII. METHOD OF DATA A N A L Y S I S ......................... 142
VIII. RESULTS AND DISCUSSION............................ 151IX. CONCLUSIONS....................................... 189
NOMENCLATURE................................................. 196BIBLIOGRAPHY................................................. 200Appendix
A. EXPERIMENTAL OBSERVATIONS ON REDUCTION OFCOBALTOUS SULFATE SOLUTION WITH HYDROGENIN A CONTINUOUS TUBULAR REACTOR............... 204
B. PRERUN CALCULATIONS FOR RUN # 3 3 .................. 213
C. CALIBRATIONS....................................... 216
viii

Appendix PageD. PREVIOUS WORK ON NICKEL REDUCTION BY
HYDROGEN IN TUBULAR REACTOR................... 219E. ENERGY CONSIDERATIONS FOR THE PRODUCTION
OF COPPER BY THE CONTINUOUS HYDROGENREDUCTION PROCESS.............................. 223
IX

LIST OF TABLES
Table PageIII-l. Equilibrium pH Values at Different
Hydrogen Pressures and with a Molar Concentration of Metal Ions of 10“^ ............ 22
III-2. Standard Reduction Potentials forNickel Ammines ................................... 26
III-3. Equilibrium Constants and Heats ofReaction for the Hydrogen Reductionof NifNHg)^* at Different Temperatures . . . . 29
III-4. Equilibrium Constants at DifferentTemperatures for the Reduction ofCo(NH3)^+ Complex by Hydrogen................... 29
VI-1. Run #3. Solid Product Analysis.................. 70VI-2. Run #13. Solid Product A n a l y s i s ................. 86VI-3. Run #18. Solid Product A n a l y s i s ................. 94VI-4. Run #21. Solid Product A n a l y s i s ................. 97VI-5. Run #26. Solid Product Analysis . ................ 104
VI-6. Run #31. Solid Product A n a l y s i s .................... 114VI-7. Run #33. Solid Product A n a l y s i s .................... 119VI-8. Run #35. Solid Product A n a l y s i s .................... 122
VI-9. Run #39. Solid Product A n a l y s i s .................... 126VI-10. Runs #40 and 41. Solid Product Analysis . . . . 129
VI-11 Run #44. Solid Product A n a l y s i s .................... 134VI-12. Runs #45 through 50. Solid Product
A n a l y s i s ..................................... 135

Table PageVIII-1. Summary of Experimental Results ................. 154E-1. Energy Requirements for Copper Electro
winning Processes (46) and Calculated Potential Energy Savings by Using the Continuous Hydrogen Reduction Process as a Substitute for Electrowinning of C o p p e r ............................................. 232
XI
LIST OF ILLUSTRATIONS
Figure Page
III-l. Variation of Reduction Potentialwith Metal Ions Concentration inSolutions of Metal Sulfates andwith pH at 250c .............................. 23
III-2. Variation of Reduction Potentialwith Molal Ratio of Ammonia to Nickel Ions at 25°C Accordingto Bjerrum (3) .............................. 28
IV-1. Schematic Diagram for ContinuousHydrogen Reduction Process ................ 44
VI-1. Conversion of Ni++ Ions with pH of SpentSolution Versus Run Lapse Time (Run #5). Sampling is throughPort #5........................................ 73
VI-2. Conversion of Ni++ Ions and pH of SpentSolution Versus Run Lapse Time (Run #5). Sampling is throughPort #6........................................ 74
VI-3. Conversion of Ni++ Ions and pH of SpentSolution Versus Run Lapse Time (Run #5). Sampling is throughPort #7........................................ 75
VI-4. Reactor Temperature Profile for Run #6. . . . 77VI-5. Conversion Versus Run Lapse Time
(Run # 6 ) ..................................... 79VI-6. Conversion Versus Run Lapse Time
for Runs #7, 8 and 9 ....................... 82
VI-7. Conversion of Ni++ Ions and pH of SpentSolution Versus Run Lapse Time forRuns #10 and 12.............................. 84
xii

VI-8 . Conversion of N1++ Ions and pH Spent Solution Versus Run Lapse Time for Runs #11 and
of 13 .
VI-9. Conversion of Ni++ Ions and pH Spent Solution Versus Run Lapse Time for Run #16 . . .
of. . . 88
VI-10. Conversion of Ni++ Ions and pH Spent Solution Versus Run Lapse Time for Run #17 . . .
of. . . 91
VI-11. Conversion of Ni++ Ions and pH Spent Solution Versus Run Lapse Time for Run #18 . . .
of. . . 93
VI-12. Conversion of Ni++ Ions and pH Spent Solution Versus Run Lapse Time for Run #19 . . .
of. . 98
VI-13. Conversion of Ni++ Ions and pH Spent Solution Versus Run Lapse Time for Run #20 . . ,
of. . . 99
VI-14. Conversion of Ni++ Ions and pH Spent Solution Versus Run Lapse Time for Run #21 . . ,
of. . . 100
VI-15. Conversion of Ni++ Ions and pH Spent Solution Versus Run Lapse Time for Run #27 . . ,
of. . . 106
VI-16. Conversion of Ni++ Ions and pH Spent Solution Versus Run Lapse Time for Run #28 . . ,
of
VI-17. Conversion of Ni++ Ions and pH Spent Solution Versus Run Lapse Time for Run #29 . . ,
of. . . 109
VI-18. Conversion of Ni++ Ions and pH Spent Solution Versus Run Lapse Time for Run #30 . .
of. . . Ill
VI-19. Conversion of Ni++ Ions and pH Spent Solution Versus Run Lapse Time for Run #31 . .
xiii
of. . . . 112

Figure PageVI-20. Conversion of Ni++ Ions and pH of
Spent Solution Versus RunLapse Time for Run #32 . ................
VI-21. Conversion of Ni++ Ions and pH of Spent Solution Versus RunLapse Time for Run # 3 3 .....................
VI-22. Conversion of Ni++ Ions and pH of Spent Solution Versus RunLapse Time for Run # 3 4 .................... 120
VI-23. Conversion of Ni++ Ions VersusRun Lapse Time for Runs #35 and 36 . . . . 123
VI-24. Conversion of Ni++ Ions VersusRun Lapse Time for Runs #37 and 38 . . . . 125
VI-25. Conversion of Ni++ ions and pH of Spent Solution Versus RunLapse Time for Run # 3 9 .................... 127
VI-26. Conversion of Ni++ ions VersusRun Lapse Time for Runs #40 and 41 . . . . 130
VI-27. Conversion of Ni++ Ions and pH of Spent Solution Versus RunLapse Time for Run # 4 4 .....................
VI-28. Conversion of Kii++ Ions Versus Run Lapse Time for Runs #45,46, 47 and 48................................ 136
VI-29. Conversion of Ni++ Ions VersusRun Lapse Time for Runs #49 and 50 . . . • 140
VII-1. Notation for Plug Flow Reactor........ 144
VIII-1. Effect of Ferrous Ions Concentrationin Feed on Conversion of Ni++ Ions . . . . 157
VIII-2. Effect of Reactor Pressure onConversion and Y i e l d ....................... 160
VIII-3. Hydrogen Solubility in Water asReported by Conner ( 9 ) ..................... 162
VIII-4. Effect of inlet Molar Ratio of NH3to Ni++ on Conversion of Ni++ Ions . . . . 165
xiv

FigureVIII-5.
VIII-6.
VIII-7.
VIII-8.
VIII-9.
VIII-10.
VIII-11.
VIII-12.
VIII-13.
VIII-14.
VIII-15.
C— 1 •
PageEffect of Hydrogen Input on
Conversion and Y i e l d ....................... 157Nickel Conversion and Yield Versus
Temperature. Feed SolutionContains No Ammonium Sulfate .............. 169
Arrhenius Plot Based on Conversion of Ni++ Ions to Products (Salts Plus Metal)................................... 171
Arrhenius Plot Based on Yield.Feed Solution Contains NoAmmonium Sulfate ............................ 172
Effect of Ammonia Consumed on Nickel Yield over the Temperature Range 79 to 1930c ................................... 174
Effect of Hydrogen Consumed and Soluble Hydrogen on Yield to Metallic Nickel over Temperature Range of 79 to 19 30c .......................
Conversion of Ni++ Ions Versus Residence Time as a Function of Temperature when Feed Contains . No Ammonium Sulfate...................................
Yield to Metallic Nickel Versus Residence Time as a Function of Temperature when Feed Contains No Ammonium Sulfate ..................
175
178
179Conversion of Ni++ Ions Versus Residence
Time as a Function of Temperature when Feed Solution ContainsAmmonium Sulfate ............................ 181
Effect of Ammonium Sulfate Addition on Yield as a Function ofResidence Time at 1630C..................... 133
Effect of Ammonium Sulfate Addition on Yield as a Function ofResidence Time at 19 3°C..................... 134
DP-Cell Calibration Curve ..................... 217
XV

Figure PageC-2. Reactor Temperature Calibration;
Flow Rate = 100 c c / m i n .................... 218D-1. Nickel Conversion Versus Ferrous
Sulfate Concentration Accordingto Plumb (32)................................. 220
D-2. Nickel Conversion Versus Molar Ratio of Ammonia to Nickel Ions atReactor Inlet According to Plumb (32). . . 221
D-3. Nickel Conversion Versus Temperature According to Brunsell (6) andPlumb ( 3 2 ) ................................... 222
XVI

CONTINUOUS REDUCTION OF NICKEL AND COBALT
FROM AMMONIACAL SULFATE SOLUTIONS BY HYDROGEN IN A TUBULAR REACTOR
CHAPTER I
INTRODUCTION
The precipitation of pure metals from their leach solutions is a critical step in the economics of all hydro- metallurgical processes for the recovery of metal values from
natural ores or from scrap. Among the currently practiced techniques of precipitation, by far, hydrogen reduction is
the most attractive from the standpoint of lower energy requirements and lesser environmental effects.
Among the metals, nickel and cobalt have attracted
the attention of the extractive metallurgical industry for many decades due to their wide use. Nickel and cobalt are generally extracted from their sulfide ores by leaching with either sulfuric acid or ammonium hydroxide in an oxygen
atmosphere. The resultant leach liquors contain either the sulfate or the ammonium sulfate of the metals. According to thermodynamics the nickel and cobalt values of such liquors can be reduced by hydrogen from alkaline solutions. Therefore, when these alkaline solutions are contacted with
1

2
hydrogen gas under temperature and pressure and in the presence of a nucleating agent (catalyst), essentially pure nickel and cobalt can be precipitated.
Hydrogen reduction has been practiced in batch or
semi-continuous operations. There are disadvantages associated with such production of pure metals, however, which include both economic (high capital and operating costs) and technical
(poor control on the product quality) factors. These shortcomings can, essentially, be minimized by a continuous hydrogen
reduction process since it offers the prospect of significantly lower capital and operating costs and better product quality. The alternative to the continuous hydrogen reduction process is electrowinning. Though electrowinning can be
operated on a semi-continuous basis, it is more energy intensive since expensive electric power is needed whereas the continuous hydrogen process requires hydrogen which can be pro
duced more efficiently by reforming natural gas. In fact, and as it is shown in Appendix E of this dissertation, continu
ous hydrogen reduction can produce two to three times more copper over electrowinning for the same unit of fuel consumed.
Even though hydrogen reduction of nickel and cobalt solutions has been practiced for more than thirty years by batch or semi-continuous processes, very little information on the kinetics of the reduction is available in the literature. Even if proprietary know-how for these reductions were released, it would be inadequate for translation to continuous

3
commercial operation because the operating requirements are quite different in these kinds of systems. In this study experiments were conducted, using a tubular reactor, to in
vestigate the effect of the kinetic parameters on the rate of nickel reduction. Several experiments were also made to find a suitable nucleating agent required to nucleate cobalt
metal reduction. The results obtained were then compared with available information.

CHAPTER II
REVIEW OF LITERATURE
Precipitation of metals and metal oxides by hydrogen
reduction of metals salt solutions has been known for more than one hundred years. Yet, in hydrometallurgy, it is still a new art when compared to its counterpart cementation in which a metal is precipitated by displacement in solution by another metal. The hydrogen reduction of many metals from salt solutions is covered in the literature, but this chapter is limited to the review of only the literature most pertinent to the reduction of ammoniacal solutions of nickelous and cobaltous sulfate solutions by hydrogen.
The reaction in which a metal is dissolved by an acid to produce gaseous hydrogen and a salt solution was discovered
early in the history of chemistry. In 1859 Baketov (2) found
experimentally that this reaction could be reversed; i.e, a salt solution could be reduced by hydrogen to produce metal
and an acid. Beketov was successful in displacing silver and mercury from their dilute salt solutions under 1000 Kpa (147 psia) hydrogen pressure and ambient temperature. In 1892 Tammann and Nernst (42) were not successful in reducing copper
from its sulfate solution with hydrogen under 4050 Kpa (5884

5psia) hydrogen pressure and room temperature since their
experiments were continually plagued with explosions. Tamman and Nernst were the last investigators to contribute to the science of hydrogen reduction during the 19th century.
During the first decade of the 20th century, interest
in hydrogen reduction to recover metals from their aqueous solution was renewed by Ipatieff (18). Ipatieff's work was an outgrowth of his successful experimentation in the hydrogenation of organic compounds under pressure. Consequently,
Ipatieff possessed the technical background in high pressure applications that previously hindered the progress of earlier investigators.
Ipatieff prepared several metals and metal oxides
such as copper, nickel, cobalt, tin, platinum, iridium and arsenic at extreme conditions of temperature and pressure:
up to 50640 Kpa (7350 psia) and 373°C, for as long as several
days. According to Ipatieff, each metal has a critical condi
tion of temperature and pressure at which displacement from solution occurs. This critical temperature, as thought by Ipatieff, is the temperature at which metal is precipitated
from solution rapidly and completely at a minimum hydrogen pressure.
The pioneer work of Ipatieff soon was continued in the U. S. and abroad in light of the growing demands of pure metals. In 1928 Muller, et al (28) obtained a patent in the
United States on a process of selective metal reduction from
6ammoniacal solution. Their method allegedly permits separation of silver, copper, nickel, cobalt and zinc by treatment of the ammoniacal salt solution with reducing gases under progressively higher temperature and pressure. Unfortunately, the authors were neither able to precipitate metallic zinc in the manner claimed nor to obtain a clear-cut separation between
nickel and cobalt from ammoniacal solutions. The latter
finding was confirmed by Tronev, et al (44, 45). These devel
opments triggered the interest of the hydrometallurgical industry for batch processing of such metals (36, 38). Thus, by
19 50 the majority of publications were either related to the industrial application of hydrogen reduction or contributions made by university research groups.
Commercialization of the hydrogen reduction process was first considered in the early 1950's when Chemical Construction Corporation and Sherritt Gordon Mines, Ltd. began their extensive research work. In 1955, Schaufelberger (35) of the former firm presented a paper discussing the chemistry
and the thermodynamics of precipitation of copper, nickel, cobalt and cadmium from their salt solutions by hydrogen. Mechanisms of metal precipitation, nucléation, growth and
agglomeration were reviewed as well as some solubility phenomena of gases and solids at elevated temperatures. Later, Schaufelberger and Roy (37) presented their work on simultaneous copper-nickel-cobalt separation and metal recovery effected by selective metal precipitation in acid solutions.

7
Copper was first reduced from the acid solution and then the solution was heavily buffered with ammonia and ammonium sul
fate, while reduction of nickel and cobalt were carried out homogenously, i.e., no catalyst was required. The selective precipitation of nickel and cobalt from an acid medium requires a careful control of solution pH and is largely dependent on the initial ratio of nickel to cobalt in the charge. However, commercial practice soon after adopted heterogenous precipitation of nickel and cobalt from ammoniacal solutions because equilibrium conditions are more favorable and corrosion is much less severe (14).
In 1957, Mackiw, Lin and Kunda (2^) of Sherritt Gordon Mines, Ltd. studied extensively the reduction of nickel by
hydrogen from ammoniacal solutions using a 4 liter stainless
steel autoclave. They were the first to examine the effect of ferrous sulfate added to the reaction mixture of nickel sulfate, ammonia and ammonium sulfate. It was found that although ferrous ions could initiate the nickel reduction, its
nucleating effectiveness decreased with increasing concentrations of ammonium sulfate in the charge. It was noticed that beyond a molar ratio of (NH^)2S0^ to Ni"*"*’ ions of two in the charge, the reduction rate was infinitely slow, and all metal reduced was plated on the wall of the vessel. These observa
tions suggested that at low (NH4) concentrations., Fe(OH) 2 which probably was responsible for the catalysis, was formed. The metallic nickel nuclei formed initially then could reduce
8
the Ni++ ions autocatalytically. The concentration of ammonium sulfate increased as the reaction proceeded and,
when it was too high for the Fe(0H)2 to be stable, the latter dissolved and the acceleration stopped. All of the iron
added was finally found in the solution in the Fe++ state.
Moreover, when the molar ratio of NH^ (including NH^ from
(NH4) 2SO4) to Ni++ ions was 2.0 along with a concentration of 1.2 gr Fe'^’ /liter, the reduction reaction was essentially
complete at about 177°C (350°F) and a hydrogen pressure of 23 atmospheres (350 psia).
Courtney and Schaufelberger (12) examined the nucléation and growth kinetics of nickel reduction both from acidic and ammoniacal solutions. It was found that homogenous nucléation of nickel was possible provided that the pH of the solution would not drop below 3. On the other hand, homonucleation of nickel from ammoniacal solution was not possible, and this difficulty was bypassed either by using chemical reducting agents which homonucleate nickel metal particles or by using
hydrogenation catalysts which heteronucleate the Ni(II)-H2
reaction. It was observed that ferrous ion gave nucléation (after about 15 minutes) when an aqueous solution of ferrous ammonium sulfate was rapidly injected into the ammoniacal solu
tion of nickel, whereupon the solution was then heated to about 175°C (350°F) and hydrogen was added. On the other hand,
injection of ferrous solution into hot N i (II) solution at 175°C, followed by hydrogen addition, usually gave nucléation at much

9longer times (45 minutes). The addition of Fe(0H)2 to cold
N i (II) solutions, followed by heating to the reaction temperature of 175°C, never nucleated the Ni(II)-H2 reduction. These results suggested that a mixed Fe(II)-N i (II) hydroxide or
basic sulfate was involved in nucleating N i (II)-H^ reaction even though the nickel solution without a catalyst (Fe’’"*' ion)
did not precipitate a salt when heavily buffered with (NH^) 2 0 . Of further interest was that chemical and x-ray anlaysis after injection of Fe(II) solution but before hydrogen addition indicated the formation of magnetite, Fe^O^, and nickel metal. From these observations, the authors concluded that the exact nucléation mechanism would be difficult to determine.
In 1962, Kunda, Warner and Mackiw (25) published their
results on the selective batch reduction of nickel and cobalt, now used by the Sherritt Gordon Mines, Ltd. The process com
prises the following principal steps:(a) Addition of ammonia to convert nickelous and co
baltous sulfates to the respective ammines and oxidation of the cobaltous ammine to cobaltic ammine with air
(b) Precipitation of nickel ammonium sulfate from the oxidized solution by addition of sulfuric
acid in a two stage operation.(c) Reduction of cobaltic ammine to cobaltous ammine
in the nickel-free solution by addition of cobalt
powder

10(d) Reduction of cobaltous ammine by hydrogen under
pressure to produce cobalt metal and ammonium sulfate.
The oxidation step (a) was found to give best results when the
solution had the following composition: molar ratio of NH^/Ni+ Co was greater than 5, the molar ratio of (NH^ÏgSO^/Co was about 5 while the temperature and oxygen pressure were 80°C (180°F) and 709 Kpa (103 psia) , respectively. It was also found that the optimum conditions for cobalt reduction, step
(d), were: 175°C (350°F) , 4134 Kpa (600 psia) and NH^/Co molarratio of about 2.5 when using freshly formed cobalt metal as a catalyst (30 gr/liter) . It was not revealed, however, the
extent of plating of both nickel and cobalt on the walls of the autoclaves.
A limited, but significant, research on hydrogen reduction of both nickel and cobalt has been performed at vari
ous academic institutions. In 1956, Kaneko and Wadsworth at the University of Utah (20) studied the batch reduction of cobalt from its ammoniacal solution by hydrogen using colloi
dal graphite and hydroquinone as catalysts. They found that
the latter is a better nucleating agent for the reduction. In an effort to explain their reduction data, Kaneko and Wadsworth postulated a mechanism which led to a rate expression depending exponentially on hydrogen pressure and directly pro
portional to the concentration of the diammine complex of cobalt. Later, Wimber and Wadsworth (47) investigated the

11
kinetics of reduction of cobalt sulfate-ammonium acetate solutions catalyzed by platinum in a pyrex-glass lined autoclave. The role of chloroplatinic acid added to initiate the reduc
tion was not understood^ however. It was also demonstrated by the authors that when using the chloroplatinic acid as a catalyst the rate of cobalt reduction from ammoniacal cobalt solution was faster than that of the acetate buffered solution.
It is worth noting that the authors found that stainless steel and Carpenter 20 were also catalysts for the hydrogen reduction
of these two systems.At the University of British Columbia, Sircar and Wiles
(39) have studied the batch hydrogen reduction of nickel from
buffered acetate solutions using a nickel catalyst. At temperatures between 130 and 160°C (270 to 320°F), the rate of
reduction was found to be proportional to the catalyst surface area, the nickel ions concentration and hydrogen pressure.The effect of hydrogen ions (pH) was found to reduce the observed rate of reduction, likely by causing the reverse reaction (dissolution) to proceed.
In 1971, Klocke and Hixon (22) at the University of Pennsylvania measured the solubility of ferrous ions in aqueous solutions containing various amounts of ammonia and either chloride, sulfate or carbon dioxide at ambient conditions. Although there was no detectable iron solubility in these solu
tions at low concentrations, it was found that iron became soluble in increasingly large amounts at concentrations of 300, 400 and 500 gr/liter of these anions. More recently ,
12Boateng, et al (4) of Laurentian University, have investigated the batch reduction of nickel by hydrogen from nickel-loaded organic acid solutions. Although most carboxylic acids are themselves reduced by hydrogen under the conditions necessary
to reduce their salts of copper, nickel and cobalt, organic acids which are highly branched in the a-position are not. Boeteng et al have tested several organic acids and found that the system di(2-ethylexyl) phosphoric acid in a diluent (Shellsol 715) to be the most suitable to prepare the nickel- loaded organic solution for hydrogen reduction. With nickel powder as a catalyst, it was found that up to 97 percent of the nickel content of 0.044 mole/liter nickel-organic solution could be recovered after only 100 minutes. A temperature of about 140°C (2850F) was found to be suitable for the heterogeneous batch reduction reaction. The rate of reduction, how
ever, was sensitive to the procedure for loading the nickel into the organic phase, and limited by mass transfer due to the high viscosity of the nickel-organic solution. Stubina and Distin (41) of McGill University have studied the batch recovery of cobalt from loaded Kelex-100 solutions by reaction
with hydrogen. This procedure can be used as an alternative to the acid stripping of cobalt (Co+++) which is a difficult step in conventional solvent extraction in hydrometallurgy.The data showed that Kelex 100 dissolved in kerosene with decanol as modifier was very stable and could be regenerated for recycle. The reaction kinetics of precipitation were

13strongly temperature sensitive and were relatively insensitive to hydrogen pressure. The authors also claimed that seed addition (activated colloidal carbon or cobalt metal powder) prevented the plating of cobalt on the internal parts of the autoclave.
Work initiated by University Engineers, Inc. in Norman, Oklahoma, on hydrogen reduction in 1964 resulted in development of continuous tubular reactor (30). The work of Brown (5) was mainly concerned with crystal growth; however, he could repro
duce the work of previous investigators in copper reduction
from the salt solutions by hydrogen in a batch autoclave. In 1968 Conner (9) made a thermodynamic analysis on the aspects of copper reduction from cupric sulfate solutions buffered with ammonium sulfate by hydrogen in a batch autoclave.Kothari (23), in 19 71, conducted experimental work using a
batch autoclave on the nickel sulfate system in an attempt to determine its "critical" precipitation temperature. He found
that this temperature depended on the efficiency of nucléation, but for a ferrous sulfate catalyzed reaction, the reduction reached completion at about 150°C (300°F).
In 1973, Kieswetter (21) studied the reduction of both
copper and nickel sulfate solutions in specially designed
batch reactor tubes mounted on a rocking mechanism and heated externally in an oil bath. His work provided valuable information on reduction since the reaction time for complete conversion was found to be in order of minutes (5 to 10 minutes).
This study helped Neskora (29) bridge the gap between batch

14and continuous modes of reduction. Neskora's work on copper and nickel reduction demonstrated for the first time the feasibility of reducing metal salts by hydrogen continuously in tubular reactors. A different problem encountered in this
process, generally not anticipated in batch processing, was the precipitation of basic salts at elevated temperatures which virtually eliminated the possibility of preheating the feed before entering the reactor. Although Neskora made only
a few runs on nickel reduction system, his results indicated that about 80 percent conversion to metallic nickel could be obtained under the conditions of: 150°C (300°F), 3445 Kpa
(500 psia) and a liquid residence time of 2.0 minutes. The
conversion to metallic nickel was, however, very sensitive to temperature and an activation energy of about 10 Kcal/mole was estimated.
The preliminary work of Neskora was extended further
by Sista (40) whose objective was to investigate the effects of the various kinetic parameters on the conversion of copper. Sista's work not only demonstrated the advantages of using a tubular reactor in hydrogen reduction, but also furnished valu
able reduction data on copper precipitation. Plumb (32) devoted his study to the operational parameters affecting the
continuous reduction of nickel. The principal operational
problem in the process, which had been experienced by both Neskora and Sista, was the plugging of the feed preheater and the accumulation of product in the reactor. In his study.
15
Plumb found that a proper control of (NH4)2SO^ addition to
the feed would minimize the preheater plugging problems and a molar ratio of (NH^lgSO^ to Ni’*”*’ in the feed of two was recommended. However, the accumulation of nickel inside the
reactor could only be eliminated when the feed was free of any ammonium sulfate. The findings of Plumb encouraged Brunsell
(6) to run the reactor isothermally. Brunsell found that a residence time of about five minutes was sufficient for complete depletion of nickel from an ammoniacal feed solution when the reactor temperature was about 200°C (400°F). His data also showed that the nickel reduction reaction was a second order
with respect to nickel concentration and the rate of reduction was very temperature sensitive with an activation energy of
about 13 Kcal per mole over the temperature range of 120 to 175°C (250-350OF).

CHAPTER III
THEORETICAL BACKGROUND
Three main kinds of processes are used at present for the production of metals by reduction of solutions of their salts: (1) electrowinning, (2) gaseous reduction and (3)cementation. Each process involves electron exchange between
the reducing agent and the reduced species. In electrowinning the electrons are supplied by the applied voltage; while in gaseous reduction and cementation the electrons are supplied by a reducing gas and a lower affinity metal, respectively.
As a result gaseous reduction can be treated thermodynamically from an electrochemical viewpoint.
Thermodynamic Considerations By definition "reduction" means the gain of electrons
by chemical species while "oxidation" is the loss of electrons
by such species. According to the recommendation of the lUPAC* a reduction reaction should be written as:
oxidant + ne = reductant, E° (volts) (III-l)
where ne is the required number of electrons to complete the
*International Union of Pure and Applied Chemistry meeting held in Stockholm in 1953.
16

17reduction reaction and E° is the standard potential of re- ductant-oxidant electrode measured in volts.
The hydrogen reduction of a divalent metal ion can be represented by an overall reaction as
M''"*’ + Hg = M + 2H" (III-2)which in accordance to equation (III-l) can be written as the algebraic sum of two half-cell reactions; namely
M+'*' + 2e = M, (III-3)
2H'"' + 2e = Hg, Eg (III-4)
In equations (III-3) and (Xll-4) the metal and hydrogen ions are being reduced to metal and hydrogen gas, respectively.In electrochemical technology each of equations (III-l),(III-3) and (III-4) is referred to as a redox couple or a halfcell reaction. The reactivity of a redox couple is determined
by its tendency to gain or lose electrons. A measure of thistendency is called the "potential" and is measured in volts.
In equations (III-3) and (III-4) E^ and Ejj are called reduc
tion potentials. The potential for the overall reduction reaction given by equation (III-2) can be obtained by combining
the reduction potentials of the individual redox couples, equations (III-3) and (III-4), as
^overall = ""'S)
If Ejj exceeds E^ the overall reaction given by equation (III-2) will liberate hydrogen which passes into solution. On
the other hand, if E^ exceeds Eg^r the reduction reaction will proceed to precipitate metal out of solution.

18The extent to which the overall reduction reaction
will proceed is governed by the thermodynamic equilibrium constant (K^) which is related to the free energy change, AG of the reaction system by
[m ] [H*]^AG = AG° + RT £n ----------- (III-6)
[M++] [Hzl
where AG° is the standard free energy change (at unit activity
of reactants and products), R and T are the universal gas constant and the absolute temperature in appropriate units. For a reaction at equilibrium, AG = 0 and AG° = -RT 2n Kg where Kg is defined by
- W e W 1 Î
' W ' J e [»2]e
where the square brackets denote the activities of the respective species and the subscript e denotes equilibrium. The reaction given in equation (III-2) may be visualized as a perfectly reversible electrochemical cell in which case the work obtainable from this cell would be nEF, where n is the number
of Faraday's passing through the cell to complete the reaction, E is the potential of the cell in volts and F is the Faraday equivalent (96,487 Columbs). This reversible work must equal
the free energy change of the reactionAG = -nEF (III-8)
When all species involved in the reaction, equation (III-2), are at unit activity (standard state) then equation (III-8)
becomes

19AG° = -nE°F (III-9)
where E° is the standard potential of the cell. Combining equations (III-6) , (III-8) and (III-9) yields
E . E° - (iii-lO)[m -^I [h ]
Equation (III-IO) is usually referred to as Nernst Equation after the famous physical chemist Nernst who first used it to express the relationship between the potential of a metal electrode and the concentration of a metal ion in solution. At equilibrium E = 0 since AG = 0 and equation (III-IO) reduces to
RT [M]g _ RT
where the subscript e is used, as before, to denote the equilibrium activities of the respective species.
For the overall reaction, given by equation (III-2), to take place spontaneously its free energy must be negative.As a result it is necessary that the potential, E, must be
positive as seen from equation (III-8) . Therefore, and as
seen from equation (III-5), E^ ^ % 2 * ^ general rule forany divalent metal reduction this criterion should be always satisfied, i.e.,
> Eg^ (III-12)
Using equations (III-3), (III-4), (III-5) and (III-12) it is
possible to write separate Nernst Equations for each of the

20half-cell reactions in terms of their respective reduction potentials as
” If [^] 2F (III-13)
^ ®H2 " ^ P P 2] (III-14)
where E° and E°^ are the standard state potentials for the metal-metal ion and the hydrogen-hydrogen ion electrodes, respectively. By definition E°^ is zero while E° may be cal
culated from the free energy of formation of the metal ion in aqueous solution, referred to the metal as standard state of unit activity. Moreover, since by definition the pH of the
solution is equal to -Log^g [h "*"], it can be seen that the overall reduction potential (E^ - E^^) for any divalent metal in solution by gaseous hydrogen is controlled by the activities of the metal ions, hydrogen gas and the pH of the solution.The pH at which reduction is carried out determines the minimum activity (or concentration) of the metal ions which can
be obtained since at equalibrium E^ must equal E^g-Assuming that the hydrogen activity, or fugacity, is
taken to be identical with the partial pressure of hydrogen and that the activity of metal ion can be approximated by its molar concentration, then equations (III-13) and (III-14) can
be written as
EM = + §F (2.302) Log^g (m "") (III-15)

21RT RT^ (2.302) pH - g (2.302) Log^^ (III-16)
Upon substitution of the numerical values of R(1.987 cal*deg~^ • mole“^), T(298 • deg.) and F(23050.4 cal.) and setting
~ ^H2' then the equilibrium pH can be calculated by
M 1 ,pH 0.05916 2 ^°®10 'e
Equilibrium (III-17)
where (M^^)^ and are the equilibrium metal ion concentration and partial pressure of hydrogen, respectively. Table III-l shows the calculated pH values for several divalent metal ions at 1 and 100 atmospheres hydrogen partial pressure
when the equilibrium metal ion concentration is taken as 10“
mole M'*"^/liter and equation (III-17) is used. From Table III-l, it can be seen that precautions must be taken to pre
vent the pH of the solution from decreasing below the equilibrium values shown in the table due to the accumulation of H"*"
ions produced by the reduction reaction. It can also be deduced from this table that metals with positive reduction
potential (E°) values can be reduced without such precautions
but metals with negative E° values will require the addition*Vi n c i r r a * i -crû
of neutralizing agents to maintain the pH values above the
equilibrium values. This requirement becomes more severe asthe reduction potential becomes more negative. From the
practical point of view, solutions of uncomplexed Zn^^ or Fe^* ions in solution of pH greater than 6-7 are not possible andthe solution of equation (III-17) does not correspond to

22TABLE III-l
EQUILIBRIUM pH VALUES AT DIFFERENT HYDROGEN PRESSURES AND WITH A MOLAR CONCENTRATION OF
METAL IONS OF 10“ ^
Metal Ion Ejj, volts Hydrogen Partial Pressure, atm, 1.0 100
Zn++ -0.762 13.9 12.9Fe++ -0.440 8.4 7.4Cd++ -0.403 7.8 6.8Co'*"*' -0.267 5.5 4.5Ni++ -0.241 5.1 4.1CU++ +0.337 -4.7 -5.7Ag'*"*' +0.80 -12.5 -13.5
chemical reality. Figure III-l is a diagram of the reduction
potential versus pH for hydrogen pressure of 1 and 10 0 atmospheres at 25°C according to equation (III-16). Similarly metal ion concentrations from 1.0 to 0.0001 mole/liter of Cu^^,
Ni^^, Co^^ and Zn*^ ions are also plotted against the reduction potential, equation (III-15), on the same figure. As shown in Figure III-l it is thermodynamically possible to reduce a metal from solution if its E^ line lies above the Eg^ line.Thus it is possible to reduce Cu^^ at all normal pH values while, again, it is practically impossible to reduce Zn^^ under
the conditions given in the figure. It is also clear from Figure III-l that the reduction potential (E^ - Eg^) increases
for the reduction of Ni"*" and Co'*"*’ ions as the pH of the solution increases; on this basis the conditions for reduction are

23Molar Concentration of Metal Ions
0.001 0.01 0.1 1.0+0.4
,++
+0.2 -
CM
i+ +.++
^ -0.4a .
“ - 0 . 6
++- 0.8
0 2 4 6 8 10 12 14
Figure III-l.pH
Variation of Reduction Potential with Metal Ions Concentration in Solutions of Metal Sulfates and with pH at 250C.

24
more favorable as the solution becomes more alkaline. However, above pH of 7 the rate of hydrolysis of nickelous and cobaltous ions becomes appreciable (particularly at high
temperatures) and in order to retain homogenous solutions
it is necessary to complex these ions. The simplest method for both raising the pH and complexing the metal ions isthe addition of ammonia which causes the formation of the metal ammines MCNH^)^^. This effect is best exemplified bythe case of nickel.
The addition of ammonia to the solution of a nickelsalt results in the sequential formation of ammines as follows;
Ni++ + NHg = Ni(NH3)++ (III-18)
Ni (NH3 + N H 3 = Ni(NH3)2* (III-19)
Ni(NHg) 2" + N H 3 = Ni(NH3) 3"*" (III-20)
Ni(NH3)3+ + NH3 = Ni(NH3)4+ (III-21)
Ni(NH3)++ + N H 3 = Ni(NH3)s+ (III-22)
Ni(NH3)s'*' + N H 3 = Ni(NH3)g' (III-23)
For each of these step-equilibria there is a corresponding
equilibrium constant given by;
"n = Ni(NH3)+:i NH.
where the square brackets denote the activities of the respective species and n is an integer from 1 to 6 (maximum coordination number of Ni"*" ) . When a complex is reduced to

25nickel, the reaction can be represented by
NiCNH^)^'*' + 2e = Ni + n NH^ (III-25)
and its standard reduction potential, can be calculatedfrom the free energy change of the reaction,equation (III-25), Thus at 25°C the si ammonia complex isThus at 25°C the standard reduction potential for a nickel-
n o -AG°E . = ---------- (III-26)^ 2 X 23.06
where AG° (K ,g -|_/mole) is the free energy change of reaction, equation (III-25), which can be calculated from the free energies of formations of ammonia and the complex, ( A G ° ) a s
AG° = n AG°H -(AG°)^ (HI-27)
Note that when n = 0, equation (III-26) gives which is
the standard reduction potential of simple hydrated nickel ion.
Earner, et al, (1) have compiled thermodynamic data for compounds and aqueous species' from which it was possible to calculate the standard reduction potentials for the nickel complexes as shown in Table III-2. From Table HI - 2 , it can be
seen that the complex ions are more difficult to reduce to metal because they have larger free energies of formation than the simple hydrated nickel ion. Ni’*”*’.
For any given ammoniacal nickel solution, in which all nickel ammine species are necessarily in equilibrium, there will be only one nickel ammine potential but the absolute value will depend upon both the absolute nickel concentration and the ratio of ammonia to nickel present in solution. The

26TABLE III-2
STANDARD REDUCTION POTENTIALS FOR NICKEL AMMINES
= -6.4 Kcal/mole NH^(aq)
n Species (ûG°)n (Kcal/mole) ^^Ni(volts)
0 Ni++ -10.9 -0.2361 Ni(NH2)++ -21.1 -0.3182 Ni(NH3)2' -30.6 -0.3863 Ni(NH3)^+ -39.3 -0.4364 Ni(NH3)++ -47.4 -0.4735 Ni(NH3)++ -54.8 -0.494
6 Ni(NH3)' t -61.2 -0.494
reduction potential of a solution of any ammine (complex), such as Ni is given by
^ 5 [Ni(NH3);;+] (111-28)
Recall also that the reduction potential of hydrogen, as it is
shown in equation (III-16), depends upon both the hydrogen pressure and the pH of the solution. Thus, the driving force
for reduction any ammoniacal nickel solutionwith hydrogen depends on the variation of the activity (or concentration) of each ammine with the overall ratio of
ammonia to nickel in solution, hydrogen pressure and temperature. Bjerrum (3) has determined the variation of the driving force with the molal ratio of ammonia to nickel as

27
ammonia is added to 1 molal nickel solution at 25°C.
Bjerrum's results are presented in Figure III-2. From this figure it is clear that the greatest driving force for reduc
tion occurs at about an ammonia to nickel molal ratio of 2.0 to 3.0. This result may indicate that the second complex of nickel is the most easily reduced by hydrogen as
NitNHg)** + Hg = Ni + 2NH+ (III-29)
Note also that the addition of ammonium salts tends to shiftthe reaction, equation (III-29) , toward the left while an increase in hydrogen pressure will shift the reaction toward the right. Using the thermodynamic data reported by Earner et al (1), the equilibrium constants and the heats of the reaction at different temperatures are presented in Table III-3. Similarly
the equilibrium constants for the reduction of the second complex of cobalt by hydrogen at different temperatures are tabu
lated in Table III-4. The reduction reaction of the secondcomplex of cobalt is
CofNHg)^^ + = Co + 2NH+ (III-30)
From Tables III-3 and III-4, it is obvious that the hydrogen reduction of the second complexes of nickel and cobalt should proceed to completion at 25°C under a hydrogen pressure of one atmosphere.
From the foregoing thermodynamic considerations it
is feasible to reduce both the cobaltous and nickelous ions
with hydrogen at room temperature and one atmosphere pressure.

28
0.20
o>CM0.16
I
zLUCI I
0.12
ta
ac 0.08 o4->U3- a
0.04
4.82.4 3.6NHg to Ni++ Ions (molal ratio)
Figure III-2. Variation of Reduction Potential with Molal Ratio of Ammonia to Nickel Ions at 25°C According to Bjerrum (3).

29
TABLE III-3EQUILIBRIUM CONSTANTS AND HEATS OF REACTION
FOR THE HYDROGEN REDUCTION OF Ni(NHg)±+AT DIFFERENT TEMPERATURES
Temperature, °C AHj , Kcal/mole &n Ka
25 -3.5 19.4650 -4.0 19.0475 -4.0 18.53
100 -3.8 18.23
150 -3.9 17.5200 -3.2 17.12250 -3.1 17.2
TABLE III-4
EQUILIBRIUM FOR THE
CONSTANTS AT DIFFERENT REDUCTION OF CotNH?)^^
BY HYDROGEN
TEMPERATURESCOMPLEX
Temperature, °C &n Ka
25 19.4650 19.04
75 18.53
100 18.23
30However, since thermodynamics can not predict how fast the reduction reactions will proceed to precipitate the metallic products, the kinetic factors controlling the rate of reduction must be investigated experimentally.
Kinetic Considerations The kinetic factors controlling the rate at which a
reaction proceeds are intimately related to its mechanism.
In homogenous reactions the respective reactants are available
freely to combine in a common media to form products. Reac
tion may proceed in a sequence of steps, forming intermediate species before obtaining a final product. Each step in the
sequence proceeds at a different rate and the slowest step controls the overall rate of reduction. Kinetic factors such
as temperature, pressure, degree of mixing of reactants, addition of diluents or inerts to the reaction media may enhance
the rate of formation of intermediate species and the overall rate at which the reaction proceeds. In heterogenous reactions, the reaction occurs at solid-liquid, gas-solid or gas-liquid
interfaces. Most heterogenous reactions taking place at such interfaces are controlled by either mass transfer rate or by
chemical reaction at the interface depending on which is slowest. Both homogenous and heterogenous reactions are categorized as: (1) catalytic in which a catalyst is required
to enhance the rate, (2) non-catalytic in which the reactants react at a fast enough rate without the presence of an exter
nal catalyst. Reduction of nickel from its ammoniacal solutions

31
by hydrogen, for example, requires a catalyst. While the reduction of copper from its aqueous sulfate solution does not, both reactions are heterogenous. Although both the reduction
of nickel and copper takes place in the liquid phase and the resistance to mass transfer can be eliminated, by increasing the
partial pressure of hydrogen and by sufficient agitation, the mechanism of reduction is poorly understood because little is known about the nucléation and growth of the metal particles in
solution. Consequently an understanding of the effects of the kinetic factors of the mechanism of hydrogen reduction is essential for an efficient utilization of the hydrogen reduction process.
Reduction of Ammoniacal Nickel SolutionsThe reaction between hydrogen and nickel ammoniacal
solutions in presence of a catalyst is heterogenous. The cata
lyst can be either a chemical nucleating agent (a homogenous catalyst) or a metallic seed dispersed in solution. Homogen
ous catalysts such as the aqueous solutions of ferrous sulfate,
chromium sulfate or a mixture of sodium cyanide and sodium sulfide have been found to be effective nucleating agents for precipitating metallic nickel by hydrogen reduction (12) under moderate temperatures (175°C) and hydrogen pressure (4000 Kpa—
580 psia). Once these agents homonucleate metallic nickel particles, these particles then act as "seed" for further reduction. Nickel particles can also be heteronucleated by hydrogenation catalysts such as nickel powder dispersed in an ammoniacal

32nickel solution. Although the subsequent reduction will take place with either type of nucléation, the rate of reduction depends upon the number of nickel metal particles initially formed. Thus the gross reduction rate of nickel will depend
upon the surface area of the freshly formed metallic nickel particles (nucléation kinetics) and also the growth kinetics, which involves diffusion of a nickel complex and hydrogen mole
cule to the surface of a growing metal particle and chemical reaction on that surface. Thus the over-riding difficulty in studying the kinetics of hydrogen reduction lies in the diffi
culty of differentiating between reduction to form new metal nuclei and reduction of metal ions upon the existing nuclei.
The overall reaction for the reduction of nickel from its ammoniacal solution by hydrogen can be expressed by
Ki(NH3)^S04 + ^ (kh,) +
(n - 2)NHg
n = 1, . . . , 6 (III-31)
where the "catalyst" can be either metallic nickel seed or a homogenous nucleating agent. Much of the data available (25, 7) have been concerned with determining the optimum reaction conditions for commercial batch production of metallic nickel. From equation (III-31) it can be seen that temperature and hydrogen pressure should affect the reduction step in the mechanism of reduction while ammonia and ammonium sulfate con
centrations determine the equilibrium concentration of nickel

33
remaining in solution. Moreover, since the reduction reaction is heterogenous and is taking place at a liquid-solid interface, there should be a direct proportionality between the concentration of the catalyst added and the reaction rate except at high enough concentrations of the catalyst where the rate of the reaction might be limited by the rate of mass transfer.
In the presence of nickel powder suspended in the ammoniacal nickel solution, it appears that the reduction re
action is strictly heterogenous; the reduced metal is deposited
upon the surface of the pre-existing nickel feed. It has been found (27) that the rate of nickel reduction is independent of nickel concentration, at least down to 85% reduction, and first
order with respect to both the hydrogen pressure (P^g) and nickel seed surface area (A^). The rate equation therefore takes the form
I":-:::)
The variation in the rate constant (k) with temperature gives an apparent activation energy of 10.2 Kcal/mole over the tem
perature range of 120 to 1B0°C (250 to 356°F).To account for these observations Mackiw et al (26)
suggest that the nickel seed particles are covered with a
strongly adsorbed layer of NKNH^)^"*" ions, and the surface concentrations of these ions begin to fall only when 85% of the ions have been reduced from solution. Thus the rate of reduction can be controlled by the rate at which hydrogen molecules can reach and adsorb onto the surface of a metal

34particle. This rate is proportional to the hydrogen partial pressure and the catalyst surface area. But, since the activation energy for diffusion of hydrogen in water is about 2 to 3 Kcal/mole, then the adsorption and the reaction on the surface steps could have a total activation energy of about 8 Kcal/
mole which indicates that the reduction is chemically controlled.
The nickel reduction reaction given by equation (III-31)
produces metallic nickel on the nickel seed. It is understandable, then, that the reaction should become autocatalytic; that is, the reaction should accelerate and its order with respect
to nickel ammine concentration should become negative. One factor which causes a change of the reaction order with respect to nickel ammine concentration toward the negative side,i.e., acceleration of the reaction, is the initial gradual
establishment of equilibrium between hydrogen gas, dissolved hydrogen, and adsorbed hydrogen on the growing metallic nickel
particles. These growing particles, however, tend to settle to the bottom of the reactor (autoclave) and, hence, the effective catalytic surface area is decreased causing a change in
the reaction order toward the positive side. This apparent change of reaction order was observed by Courtney and Schau- felberger (12) who investigated the kinetic factors controlling
the rate of reduction of nickel on nickel powder (50 gr/liter).
Their results were correlated in terms of hydrogen partial
pressure (PH2) and the concentrations of ammonia and

35
ammonium sulfate. The initial rate of reduction (Ro) is given by
kFCNHg)Ro = ----------- — (III-33)
where k is a temperature-dependent constant, FCnH^) an unknown function of ammonia concentration and [(NH^)2SO4J0 is the initial concentration of ammonium sulfate.
When ferrous sulfate is used as the nucleating agent (homogenous catalyst) and hydrogen reduction of ammoniacal nickel solutions is carried out in a batch reactor, it is found that the reduction curves, i.e., concentration of Ni’*"*’ ions
reacted versus time, are parabolic in shape. Mackiw et al (26) explained these results on the hypothesis that during the
reaction the rate of formation of nuclei was constant, and the overall rate of reduction was proportional to the number of nuclei present. Thus, if N represents the number of nuclei present in solution then
the rate of formation of nuclei = ^ = kj (III-34)
and - — L = k,N (XII-35)dt ^
where k]_ and kg are constants. Integration of equations (III-34) and (III-35), and substitution of (Ni**)^, the initial con
centration of the feed at t = 0 , gives
(Ni' '*') = ( N i + + ) ---— t^ (III-36)° 2
and a plot of (Ni"*"*') versus t will therefore be parabolic.

36
However, the rate of formation of nuclei is drastically affected by both the degree of agitation and the concentration of ferrous sulfate. For example, when the concentration of ferrous
sulfate was about 0.5 gr Fe++/liter and the solution in the autoclave was agitated with a stirrer rotating at 730 revolu
tions per minute an induction period (with no reaction) of
about 80 minutes was observed (26) . With the same level of agitation, a concentration of 4.5 gr Fe'"^^/liter resulted in
complete nickel conversion in about 20 minutes. Therefore, equation (III-36) may only represent the reduction kinetics
between these two extremes of ferrous ion concentrations.The addition of ferrous sulfate to ammoniacal nickel
solutions results in the formation of insoluble, finely-
divided particles which may be responsible for initiation of the reduction by hydrogen. These fine particles are be
lieved to be either ferrous hydroxide, Fe(0H)2, or magnetite,
Fe^O^ (17, 12) . The latter may be formed by the disproportionation of ferrous hydroxide by nickel sulfate salts to form
^^3^4' hydrogen and water (13) by the reactionNiSOA
3Fe(OH)2 ________^®3°4 + + ^2 (HI-37)
The liberated hydrogen shown in equation (III-37) could conceivably have reduced part of the nickel ions in solution in the presence of magnetite. A gross discripency to this proposed
mechanism was found (12) when ferrous hydroxide alone failed to nucleate nickel. Moreover, and as shown in Chapter VI,Run #18, the addition of ferric sulfate solutions to the nickel
37feed resulted in the precipitation of metallic nickel. It would appear that since a mixed salt of Fe^^ - Ni^^ is involved in nucleating the reduction reaction of nickel when ferrous sulfate is used as a nucleating agent for the reduction,
the exact nucléation mechanism will be difficult to determine.
Reduction of Ammoniacal Cobalt SolutionsThe kinetics of the reduction of ammoniacl cobalt solu
tions by hydrogen are somewhat superficially reported in the literature (8, 15, 25) in that considerable similarity to the kinetics of nickel reduction is often assumed. Reduction of
cobalt can occur with either a homogenous catalyst or on a solid surface. Similar to the reduction of nickel, the overall cobalt reduction reaction may be written as
CofNHgi^SO^ + Hg Co + (NH^lgSO^ +
(n - 1) NH^ . . . , n = 1, 2 , . . . 6 .
(III-38)The most widely used homogenous catalyst is a mixture
of sodium cyanide and sodium sulphide, though several otherorganic and inorganic catalysts have been tested (24). The
cyanide catalyst tends to nucleate cobalt metal on which further cobalt may be deposited. It appears that the addition of sodium cyanide-sodium sulphide mixture to an ammoniacal solution of cobalt results in the formation of very finely
divided cobaltous sulphide on which sodium cyanide ions are strongly adsorbed; they bring about a direct reduction of
cobaltous ions to metal probably by the reaction (3)

38
2Co(CN)g“ + .5=^ 2Co(CN)g"+ Co (lH-39)
There is , however, evidence contrary to this reaction since cobalt sulphide slurries as well as sodium sulphide (24) are both capable of reducing ammoniacal cobalt solutions under
moderate conditions of temperature and pressure. The role of cyanide ions in nucleating cobalt metal is not understood al
though an unidentified organic compound, possibly CH^NHg, has been found present in cyanide nucléation experiments with hydrogen reduction of ammoniacal cobalt solutions (12).
Wimber and Wadsworth (47) have investigated the kinetics
of hydrogen reduction of cobalt solutions buffered with either ammonium acetate or ammonium hydroxide using chloroplatinic acid as a nucleating agent in a pyrex-glass lined autoclave in the temperature range of 170°C (340°F) to 232°C (450°F) and hydrogen partial pressure range of 790 to 5720 Kpa (115 to 830 psia). The results suggest that the rate of reduction is proportional to the hydrogen partial pressure and the surface area of pyrex glass but independent of the quantity of chloro
platinic acid added initially. Wimber and Wadsworth proposed a mechanism which postulates that a hydrogen molecule and a cobalt complex are adsorbed onto a surface site, consists of metallic platinum on the surface of the pyrex glass, before
they react forming an intermediate complex which dissociates fast enough to deposit cobalt metal. The adsorption step in the mechanism was assumed controlling in the overall rate of
reduction. The overall rate is given by

39
deRate = ---- = k P„ C (III-40)dt “ 2
where C represents the concentration of cobalt complex adsorbed (reacted) on the pyrex glass surface; P is the partial pressure of hydrogen and k is a lumped parameter
which is a function of: temperature, Henry's law solubilitycoefficient and the surface area of pyrex glass. It is not clear, however, from the proposed mechanism, what the role of
chloroplatinic acid is since pyrex glass nucleated the reaction alone and whether the cobalt concentration, (C), accounts
for the possible basic salts coprecipitated with the .metallic cobalt. It must also be noted that the reduction rate of co
balt from ammoniacal solution was found to be about 20 percent faster than from its acetate solution under the same conditions
of temperature, hydrogen pressure and concentration of chloroplatinic acid added initially.
The reduction of cobalt from its ammoniacal sulfate
solutions with an organic homogenous catalyst have been investigated by Kaneko and Wadsworth (20) who used catechol (0-dihydraybenzene) and hydroquinone (P-dihydroxybenzene). The latter was found to be a more effective homogenous catalyst for reduction. More recently, Kunda and Hitesman (24) have tested several organic catalysts and found that thioactamide
catalyst could catalyze the reduction of cobalt from its ammoniacal solutions containing large amounts (up to 500 gr/
liter) of ammonium sulfate.

40
Metallic cobalt, like nickel, can be precipitated by reduction from its ammoniacal solution using hydrogenation catalysts. The mechanism of reduction is not known and is presumed to involve the adsorption of hydrogen on the catalyst
surface and subsequent reaction of adsorbed hydrogen with a cobaltous complex. Cobalt powder, dispersed in solution at a concentration of as little as 25 gr/liter, has been used to initiate the reduction. The nature of the powder used is not known with certainty and it appears that a cobalt powder,
obtained by nucleating a fresh feed with a homogenous catalyst which is stored wet, is the most effective catalyst (24). Colloidal graphite suspended in water ("Aquadaq") has also been used to precipitate cobalt (20, 41) .
Sakano et al (34) investigated the effects of ammonia
and ammonium sulfate on the reduction rate of cobalt using metallic cobalt powder in an autoclave in the temperature
range of 150°C (300°F) to 225°C (440°F) and hydrogen pressure
range of 980 Kpa (142 psia) to 6860 Kpa (995 psia). The results were correlated by a proposed mechanism which involves the
adsorption of hydrogen on cobalt metal and a reaction between a diammine complex of cobalt with the adsorbed hydrogen. The rate of reduction was found to be directly proportional to the solubility of hydrogen and the effective surface area of cobaltpowder. An expression for the reduction rate is given by
rate = - — L = k aS P„ exp -7,540 (III-41)

41where S is the effective surface area of cobalt powder, a
the hydrogen solubility coefficient, P„ the partial pressure2
of hydrogen and is an Arrhenius pre-exponential factor. It is of interest to note the values of the activation energies for the reduction of nickel (=8Kcal), deduced from equation (III-32), and for cobalt shown in equation (lIX-41) .
The use of colloidal graphite as a heterogenous hydrogenation catalyst was investigated by Kaneko and Wadsworth (20). Their study was carried out in a batch reactor from which liquid samples were withdrawn at periodic intervals. The
feed was made from reagent grade chemicals of cobaltous sulfate and ammonium hydroxide. The temperature and the hydrogen pressure ranged from 150°C (300°F) to 245°C (473°F) and 1030
Kpa (150 psia) to 5500 Kpa (800 psia), respectively. The rate of reduction was found to vary linearly with the concen
tration of graphite between 40 to 240 mg/liter. With a concentration of graphite of only 20 mg/liter, the rate of reduction was found to be maximum when the molar ratio of NH3 to
Co^^ was 2.0. This result indicated that the most easily reduced cobalt complex was the diammine, which is consistent with a proposed mechanism involving adsorption of hydrogen and co
balt ammine complex on the catalyst surface. However, the rate was exponentially dependent on hydrogen pressure as shown inthe following rate expression:
(K,)Crate = --- P exp (8P„ /RT) (III-42)
1 + (K2)C 2 2

42
where K 2 ' 3 are temperature-dependent constants,the hydrogen partial pressure and C is the concentration
of the adsorbed neutral complex given by the product of the
concentration of the diammine complex of cobalt and the concentration of sulfate ions present in the reactor. The exponential pressure term in equation (III-42) was assumed to be due to the structural variations associated with the quinonoid character of colloidal graphite. Courtney (11), however, questioned the results of Kaneko and Wadsworth since he did not have success in catalyzing the reaction with up to eight times the graphite concentration used by the latter under the same reaction conditions. The reduction data, Co'*" concentra
tion versus time, reported by Courtney indicate that although the reduction reaction is seeded with metallic cobalt, blue basic cobalt salts are present for at least the first twenty
minutes. It appears that beyond the first twenty minutes the reduction rate should be independent of cobalt ammine concentration (i.e. the rate is zero order with respect to Co^^) and
inversely proportional to the initial concentration of ammonium sulfate.

CHAPTER IV
EXPERIMENTAL EQUIPMENT
The experimental setup was a modification of the system originally built by Neskora (29) in 1973. It was used by Sista (40) in the reduction of copper from acidic copper
sulfate solutions in 1978. Brunsell (6) and Plumb (32) also used the setup in subsequent studies on the reduction of nickel
from its ammoniacal nickel sulfate-ammonium sulfate solutions catalyzed with ferrous sulfate. In this study the reactor was modified further by incorporating side outlets and valves to sample the reactor fluid along its axis. The experimental setup consisted of a vertical, tubular reactor with associated feed, preheater and product separation systems. The complete system with its accessories is shown schematically in Figure IV-1.
Feed System
The ammonium hydroxide feed solution was contained in a 2-liter polypropylene reservoir mounted on a platform approximately 3 meters (10 feet) above ground level. The bottom fill-level of the reservoir was connected to the top of a 100 cc graduated cylinder through a plastic hose equipped
43

PumpPressureGuage0
FeedTankDrain
g HighPressurePump
Circulating Pump (P-l)
IFCylinder ?* P-3
DrainHighPressurePump
WrappedPreheater
P-2 CoiledPreheater
Reactor
0i(sG-i;
3% Gas/Liquidiï ® Separator ^
(#1)
(#2)
1W"^W
O OPres =ure Con tr aller(PIC)
C//3)
(#4)[JTJ Side Valve ^ (Port #5)
“ Cooling Water «*pP=nft3 t (Port #6)
I II II_ _ _ _ I
i, (PCV-l)
To Vent
B Cooling yg,.-Water est
Meter
CompressedAir
-1 x 3 - 1Spent Liquid (PortD . P N ^ ^Meter V Liquid/Solid • (F—1) T Separator
N2 Hg
Figure IV-1. Schematic Diagram for Continuous Hydrogen Reduction Process

45with a stopcock to regulate the flow (by gravity) into the cylinder. The graduated cylinder was connected to the suction
of a 5 horse power, Andrea Hofer, diaphram high pressure pump (P-3) through 3.2 mm (1/8 inch), 304 stainless steel tubing.
The discharge of the high pressure pump (P-3) was connected to the reactor inlet through 3.2 mm (1/8 inch), 304 stainless steel tubing and without any external heating. The flow rate
of the ammonium hydroxide solution was monitored by the drop in the solution level in the graduated cylinder (when the stopcock was closed) over a given interval of time.
The feed solution to be processed was contained in a 57 liter (15 gallons) propylene tank connected to the suction of a 1/4 horse power Teel centrifugal pump (P-1) through 19 mm (3/4 inch) diameter flexible PVC tubing. The discharge of the circulating pump was divided into three branches; (1)
feed to the suction of the high pressure pump (P-2), (2) a recirculation line through a Jamesbury ball valve back to the feed tank and (3) a drain line, provided with a Jamesbury ball valve for removing the feed after the run or for emergency
dumps. The high pressure pump, a 1/2 horse power Milton Roy reciprocating diaphram pump, received the feed from the circulation pump through a 13 mm (1/2 inch) diameter flexible PVC tubing. The wetted surfaces of the Milton Roy pump were constructed from Carpenter stainless 20 material. The discharge
from the high pressure pump fed directly to the top of the reactor after passing through a feed preheater section. An
Ashcroft dial pressure indicator and an Anderson Greenwood

46316 stainless steel safety relief valve were provided on the discharge line of the high pressure pump.
Hydrogen was stored in a regular "k" type bottle equipped with a Victor pressure regulator; it was introduced into the reactor through 6.35 mm (1/4 inch), 304 stainless
steel, high pressure tubing. The flow of hydrogen to the re
actor was measured by a DP (differential pressure) cell (F-1) and was controlled by a manually-operated 6.35 mm (1/4 inch)Nupro needle valve. Hydrogen was introduced to the reactor
through a ceramic sparger located inside the reactor below the
jacketed cooler. A three-way Republic valve was incorporated in the hydrogen line downstream from the DP cell. Nitrogen which was used to purge or pressurize the reactor was introduced through the same line as hydrogen at the three-way valve.
Feed PreheaterThe feed solution discharged from the high pressure
pump (P-2) was preheated to the reactor temperature prior to entering the reactor. The preheater consisted of a 12 meters (40 feet) section of 6.35 mm (1/4 inch) coiled, 304 stainless
steel high pressure tubing placed in a 203 mm (8 inches) in diam
eter tubular electrical resistance heater. The capacity of this heater was 4.8 kw-hr and was controlled by a 220-volt single phase powerstat variac. The preheated feed solution
then passed through a 3.65 meter (12 foot) section of 6.35 mm (1/4 inch), 304 stainless steel high pressure tubing, along
which five J-type thermocouples were placed at equidistances

47and were connected to a 24 point Honeywell-Brown Electronik
temperature recorder. The feed line was insulated first by wrapping asbestos tape, 25 mm (one inch) wide and 3.2 mm (1/8 inch) thick and then was covered by 19 mm (3/4 inch) thick fiberglass pipe insulation.
Reactor System
The vertical countercurrent flow reactor was constructed from 304 stainless steel pipe, 1.83 meters (6 feet) in length, 19 mm (3/4 inch) in inside diameter and 3.9 mm
(0.153 inch) in wall thickness. The top end of the reactor (76 mm or 3 inches) long was machined to fit a 25.4 mm (1.0
inch), 304 stainless steel Swagelok nut connecting the sight glass (SG-1) to the reactor. At the lower end of the reactor a section, 280 mm (11 inches) long, was also machined to 25.4
mm (1.0 inch) in outside diameter to fit a 254 mm (10 inches) long slip-on cooling jacket and a 25.4 mm (1.0 inch) Swage- lok nut connecting the reactor to the top of the liquid-solid separator. The net length of the reactor was 1.524 meters (5 feet) since the ammonium hydroxide feed line dipped about 51.8 mm (2 inches) inside the top end of the reactor and the lower end of the reactor was covered by the cooling jacket.
Five 6.35 mm (1/4 inch) Hoke needle valves, made from 304 stainless steel, were provided along the reactor seam for sampling the reactor fluid. Each valve was equipped with an
on-line filtering element covering a range of 2 to 9 microns.

48
The locations of these valves were 368.3 iran (14 1/2 inches),657.2 iran (25 7/8 inches), 946.1 mm (37 1/4 inches), 1235.0 mm (48 5/8 inches), and 1524 mm (60 inches) as measured from the top end of the reactor. Each valve was connected through a 6.35 mm (1/4 inch) in diameter 304 stainless steel, tee which
was connected via a section 100 mm (4 inches) long of 6.35 mm {h inch) in diameter, high pressure stainless steel tubing welded to the reactor wall. The size of the port opening was3.2 mm (1/8 inch) it was freed of burrs before the tubing section was welded to the reactor wall. At each "T" connection
a thermowell, made of 304 stainless steel tubing, 50 mm (2 inches) long and 6.35 mm (1/4 inch) in diameter, was fitted with a welded cap and was filled with heating oil in which a J-type thermocouple was immersed to monitor the reactor fluid temperature. The reactor was heated externally with two sec
tions, 3 meters (30 feet) long each, of 22 gauge nickel-
chromium electrical resistance wire wound evenly on the
reactor wall. Each heating section was sandwiched between
two layers (5.0 mm thick, each) of heat resistance Sauereisen No. 6 cement, and controlled by a 220-volt single phase powerstat variac. Six J-type thermocouples, one about 50 mm (2
inches) below the reactor inlet and the other five at about the locations of the side valves, were provided to monitor the reactor wall temperature. The thermocouple output was recorded with a 24 point, Honeywell-Brown Electronik, temperature

49recorder. The reactor was insulated first by wrapping asbestos tape 25 mm (1 inch) wide and 3.2 mm (1/8 inch) thick over the cement. A 50 mm (2 inches) thickness of fiberglass pipe insu
lation was then installed over the asbestos tape. The side valves were also insulated with asbestos tape and fiberglass
pipe insulation. The feed line from the preheater and the
outlet for gaseous products from the reactor to the gas- liquid separator were connected just above the Strahman SVT-6 , Thru-Vision sight glass (SG-1) via a "T" connection.
Product Separation System The product separation system consisted of two com
ponents: (1) a liquid-solid separator directly below thereactor, and (2) gas-liquid separator connected to the top vent line of the reactor.
Liquid-Solid SeparatorIt consisted of a two-liter pressure vessel con
structed from 190 mm (7 1/2 inches), schedule 40, 100 mm (4
inches) nominal diameter, 304 stainless steel pipe. A 100 mm
(4 inches) stainless steel, slip-on flange was welded to the top end of the pipe. The flange was positioned in such a way that the concave weld joint would serve as a seat for a filter basket. The bottom end of the pipe was cap welded and a 19 mm (3/4 inch) tap was provided at the bottom of the separator
with an appropriate Jamesbury stainless steel ball valve for draining the separator and the reactor after completion of a run or during an emergency. The lid for the separator.

50consisting of a cap welded to a second 100 mm (4 inches) flange, was connected to the lower end of the reactor with appropriate Swagelok fittings. Two 6.35 mm (1/4 inch) taps were provided in the lid for hydrogen (or nitrogen) input and
collection of reactor fluid when desired (port #6). The filter basket inside the separator was fabricated from 1.6 mm (1/16 inch) thick stainless steel perforated sheet. The basket was provided with a ring at its top end to fit securely
into the concave seat of the separator body. The perforated basket was placed between two 10-micron, nylon filter bags;
one on each side for recovery of solid products. The product
filtrate was continuously withdrawn through a 75 mm (3 inches) long, 6.35 mm (1/4 inch) diameter, 304 stainless steel tubing
welded to the separator body at a distance of 50 mm (2 inches) from the flange center and was provided with a 6.35 mm (1/4 inch) on-line filter and Nupro needle valve (port #7). Gas-Liquid Separator
The gas-liquid separator was constructed from a 380 mm(15 inches) section of 100 mm (4 inches) schedule 80, 316stainless steel pipe. The top end of the separator was fitted
with two weld neck stainless steel flanges while its bottom was cap welded. The separator section below the flanges was fitted with appropriate connections for gas-liquid product inlet, a liquid level guage and a liquid removal system. Cooling water was circulated through 10 meters (30 feet) of
copper tubing wrapped around the lower separator section to

51cool the product gas and the entrained liquid. The separator section above the flanges was packed with alluminum shavings to remove entrained liquid from the gas product prior to dépressurisa t ion. The accumulated separator liquid was removed (usually at the end of run) through two cycling, 316 stainless steel, ball valves installed in a vertical position and located
on the bottom of the separator. The ball valves were pneumatically activated and were alternately opened and closed with a variable speed cam actuator. The actuator was designed
to ensure that only one of the two valves could be opened at a time. The two valves were connected by a short teflon-lined section of stainless steel pipe which was purged automatically with nitrogen when the lower valve was opened. The purging was done by the use of a Grove pressure regulator and a check
valve arrangement.The product gases removed from the top of the separa
tor were depressurized through a Research Control, pressure control valve (PCV-l) as shown in Figure IV-1. The pressure
control valve also maintained the desired system pressure
through a control sequence employing a Honeywell-Brown pressure indicator controller (PIC). The pressure indicating controller sensed the gas-liquid separator pressure and pneumatically controlled the pressure control valve to maintain the desired system pressure. A Grove, small-volume, pressure regulator was provided parallel to the pressure control valve to gain better control on the reactor pressure. System

52pressure was monitored with a Heise pressure indicator calibrated in two pound per square inch divisions. Depressurized exhaust gas passed through a precision scientific
wet test meter before being vented to the atmosphere through a 12.7 mm (1/2 inch) pipe.
Auxiliary System
Special precautions were taken to handle both the flammable hydrogen and the high pressure system in this inves
tigation. All electrical motors used were explosion proof and wiring was sealed in conduits. A Dayton exhaust fan 6100 mm (24 inches) in diameter, having a capacity of 150 cubic meter (5000 cubic feet) per minute, was used to remove air continuously from the laboratory to preclude any accumulation of hydrogen.
The utilities required during the operation included
40-volt, single phase and 220-volt, three phase electrical circuits, domestic cooling water and compressed air at 720
Kpa (120 psia) for the instruments. All the utilities and
the required hardware for noraml functioning and cleaning of the system were available in the existing facilities.

CHAPTER V
EXPERIMENTAL PROCEDURE
Process Description
Most of the work in this study was devoted to the precipitation of nickel powder by contacting an aqueous solu
tion containing nickel sulfate, ferrous sulfate, ammonium hydroxide and ammonium sulfate with hydrogen in a counter- current, vertical, tubular reactor by flowing the solution from the top and hydrogen from the bottom of the reactor. In
the remainder of the study, the feasibility of precipitation of cobalt from its ammoniacal cobaltous sulfate solution containing a nucleating catalyst by hydrogen was investigated in
a counter-current, vertical, tubular reactor. The experi
mental procedure described herein for the reduction of nickel solution would apply equally to the reduction of cobalt solution with merely a change of the feed solution as described in Appendix A.
The feed solution containing nickel sulfate, ferrous
sulfate and in some runs ammonium sulfate, preheated to the reactor temperature, was introduced to the top of the reactor while a cold ammonium hydroxide solution was fed to the top
53

54
of the reactor at a separate inlet. Hydrogen gas was introduced at the bottom, below the water jacket, through an Aqua- Fresh, stone sparger to provide maximum liquid-gas contact.The reaction products containing liquid and solids were separated in the liquid-solid separator located immediately below the reactor; the liquid product was continuously removed to maintain the desired liquid level in the reactor. The excess and unreacted hydrogen along with entrained liquid, exited from the top of the reactor into a gas-liquid separator. The gas, after passing through a wet test meter, was vented to the outdoors.
Experimental Procedure
It consisted of the following steps for a total run:1. Prerun calculation of hydrogen flow rate2. Prerun checkup of equipment3. Feed preparation
4. Experimental run
5. Shut-down and post-run procedure6 . Product analysis
Prerun Calculation
Prior to any run, it was necessary to determine the setting on the differential pressure cell (DP) for the hydro
gen flow rate based on a given aqueous feed composition and its flow rate. The procedure is given in Appendix B for run #33.

55
Prerun CheckupBecause of operation at elevated pressures, each time
the reactor was opened (which was the case for every run) and was reassembled, the complete system had to be pressure-
checked for leaks. The reactor and the liquid-solid separator were filled with distilled water and pressurized with nitrogen
to about the run pressure (usually 3445 Kpa— 500 psia). All gas lines were checked for leaks by a soap bubble test. Liq
uid lines were visually inspected for any leaks particularly those leading to and from the reactor. If the pressure
started to drop, the lines were closely inspected until all leaks were found and corrected after the reactor had been depressurized. If no leaks were found, the pressure was retained for at least one hour. If the pressure remained constant, the system was depressurized and the reactor was
drained. Having established the readiness of the equipment, hydrogen and nitrogen bottles were checked to make sure they were adequate for the run. Other utilities such as water, air supply and sufficient recorder chart paper were also checked.
Feed Preparation
Feed solutions were prepared just prior to each ex
perimental run. Technical grade nickelous sulfate (NiSO^'ôHgO), ammonium sulfate (NH4)2SO^, and ferrous sulfate (FeSO^'VHgO) obtained from Fisher Scientific Company were

56used to prepare the bulk feed solution. Predetermined weights
of nickelous sulfate and if needed ammonium sulfate were dissolved in distilled (obtained from the University of Oklahoma Physical Plant) and transferred into a 19-liter (5 gallon) polypropylene carboy graduated in one-liter division. A
weighed amount of the catalyst, ferrous sulfate, was also dissolved in distilled water and transferred into the carboy. The carboy was then filled to the required mark by adding more distilled water, if needed, and its contents were mixed thoroughly. When the feed was more than 19 liters (5 gallons), the contents were transferred into another carboy and the procedure was repeated as described. The ammonium hydroxide feed was prepared using a reagent grade, 58 weight percent ammonium hydroxide, obtained from the J.T. Baker Chemical Co. and distilled water. The approximate ammonia assay ranged
from 27 to 30 weight percent. Samples of nickel and ammonium hydroxide solutions were taken for analysis.
Experimental Run
The nickel feed solution was transferred to the feed
tank and the ammonium hydroxide solution was placed in the 2- liter reservoir. The graduated cylinder was filled with ammonium hydroxide solution and then the ammonia pump (P-3) was primed after checking its oil reservoir. The laboratory
heater, or air conditioner, was shut off to eliminate any
possible ignition sources, and the exhaust fan was activated.
57
Cooling water, compressed air and electrical sources were
activated. Then the circulation pump and the high pressure pump were started and nitrogen was allowed to flow into the reactor. The nitrogen was discontinued when the system pressure was about 80% of the run pressure, whereupon the preheater was turned on. Once the reactor was filled to the liquid level at the preset mark on the sight glass, the outlet valve on the liquid-solid separator was opened and was adjusted to maintain the level in the reactor. (At this
point the system pressure would be a little higher than the
desired pressure and could be lowered by adjusting the pressure regulator.) Then the reactor heaters were activated and
the temperatures were recorded. The nickel solution flow rate was measured, when the liquid level in the sight glass was stable enough, by collecting the solution in a graduated cylinder over a given time period (usually one minute). The flow rate measurement was repeated several times before an
adjustment on the high pressure pump was finally made due to instability in the reactor liquid level, particularly when
operating with a high throughput. When the reactor reached isothermal conditions, the hydrogen was allowed to flow at the desired rate through the differential pressure cell by
adjusting the needle valve on the hydrogen line. The hydrogen was usually allowed to flow for about five minutes prior to
activating the ammonium hydroxide pump, which marked the start of the run. The ammonium hydroxide feed rate was determined periodically by monitoring the drop in the level over a given

58
time in the graduated cylinder. The hydrogen exhaust was routed through the wet test meter by monitoring the valves. Samples of the product solution coming out of the reactor and/ or the liquid-solid separator were collected in 25 cc sample
bottles during the run. The runs varied in duration from
50 to 180 minutes, with an average being about 80 minutes
(established by experience) for a steady state conversion to be obtained.Shut-Down and Post-Run Procedures
Once it was decided to terminate the run, the hydrogen flow and the ammonium hydroxide feed to the reactor were cutoff. The preheater and the reactor heaters were also shut off. Any remaining solution in the feed tank was drained and the tank was filled with distilled water. The flow of distilled water was maintained until all thermcouples read below 65°C (150°F). Then the reactor was slowly depressurized. The reactor and the gas-liquid separator were drained and the
system was purged with nitrogen. Finally, cooling water and compressed air were disconnected, and the electrical supply circuit was disengaged.
After the reactor cooled down to room temperature, the
sight glass and the liquid-solid separator were disconnected. The accumulated product in the filter basket was removed and washed several times with distilled water before transferring
it to the drying oven. The reactor was then washed with tap
water— using a PVC hose fitted with a nozzle connection—
several times until all loose product on the walls was
59disengaged. This loose product was filtered and washed with distilled water and was transferred to the drying oven. The reactor was allowed to drip until dry before a visual in
spection— by placing a light source underneath it and looking
downward inside the reactor from the top end— was made. In case there was some buildup of product on the walls, the reactor was brushed with nylon bristle brush— and in some runs by a steel brush 19 mm (3/4 inch) in diameter— several times
until the walls were thoroughly clean. The reactor was then reassembled for a pre-run checkup.
Product Analysis
The product filtrate samples collected during a run were volumetrically analyzed for unreacted nickel (or cobalt) present in solution. The difference between the initial (feed) concentration of nickel (or cobalt) in the feed at the reactor inlet and the product solution was taken as the
conversion of nickel (or cobalt) ions to total product (incl. salts) For quantitative analysis of solid product, several
powder samples were analyzed for metallic nickel by x-ray
diffraction (XRD). An approximate elemental analysis was made by x-ray energy-dispersive spectrometry (EDX), noting that EDX analysis gives total nickel, including nickel salts, and iron contents in the samples irrespective of the nature of their salts. X-ray fluorescence (XRF) and x-ray diffractions (XRD) were then used to identify the iron and nickel
salts in some samples. Hematite (Fe20g) was mixed with metallic nickel samples and calibration curves were made for
60
FSgOg concentration versus the count rate for Fe-K-alpha line.
The nickel salts were identified by XRD as nickel hydroxide,N i (OH)2 * The concentration of nickel hydroxide in solid samples was approximated by adding a known weight of metallic nickel to the sample. The sample was then analyzed by XRD and the observed decrease in the intensity of nickel hydroxide
peak and the corresponding increase in nickel peak were taken
to be proportional to the ratio of concentrations of nickel hydroxide to nickel in the sample.
pH measurement; pH of the feed and product samples
were measured by an Orion Research, Model 401, specific ion meter. The following procedure was employed:
1. Sample was allowed to equilibrate to room temperature.
2. pH meter and electrode were calibrated using buffer solutions of 4, 7, and 11 pH.
3. Sample pH was measured and recorded.
Specific gravity of feed: Specific gravity of thefeed was measured as follows:
1. Sample was allowed to equilibrate to room temperature .
2. A clean and dry 50 ml flask was accurately
weighed to three decimal places using a type 10, Ainsworth electronic balance and the weight was recorded.
3. An accurate 10 ml portion of sample was pipetted

61
into the flask.4. The flask and its content were weighed to three
decimal places and the weight was recorded.5. The difference in the weight of the flask obtained
in steps 4 and 2 was divided by the volume of
the sample (step 3) and was taken as the sample specific gravity.
Ammonia analysis; The ammonia concentration in the ammonium hydroxide feed and in the product solution, in some runs, was determined as follows:
1. Aliquot 5 ml pipette sample was transferred into 125 ml flask.
2. Three drops of methyl orange indicator were added to the flask.
3. The solution was titrated with either 1.0 or 0.1
molar sulfuric acid solution. The volume of the acid required to change solution color from yellow to red-orange was recorded.
4. The product of the standardized acid strength and the recorded acid volume was multiplied by
two and was then divided by the volume of the sample pipetted into the flask in step 1 to ob
tain the molar concentrations of ammonia. Note that in a product sample this would give the total molar concentration of complexed and free ammonia in solution.

62
EDTA titration of nickel feed and product solutions
and solid samples: EDTA (ethylendiaminetetracetic acid) analyses were used for determining the nickel content of feed and product solutions, and, in few runs, the total nickel content of the solid product. The following procedure was used by previous workers (32, 29, 6) in this laboratory and have
been described in some detail by Pierce, et al. (31) and Guenther (16):
1. A 5 ml sample of liquid solution was accurately obtained using a pipet.
2. When solids were analyzed, a weighed sample of the dry solid was first dissolved in 6 molar nitric acid and warmed on a hot plate until all of the solid was dissolved.
3. The solution from either step 1 or 2 was adjusted to a pH of about 9 using an ammonium hydroxide solution.
4. A few crystals of murexide indicator were added
to the buffered solution. The solution color changed from light blue to yellow.
5. The solution was then titrated with standardized EDTA solution (0.02 milar) to the murexide violet end point.
6 . The concentration of nickel in the sample was calculated from the volume of standard EDTA used in step 5. When analyzing solid samples, the

63total nickel content in grams would be the pro
duct of the standard EDTA volume (mlX0.02 mole/ liter) and (M/1000); where M is the molecular weight of nickel.
EDTA titration of cobalt feed and product solutions ; The following procedure was used for determining cobalt concentration in feed and product solutions as described by Young (48):
1. A 5 ml sample of liquid solution was accurately
obtained using a pipette and was then transferred into an 125 ml flask.
2. An accurate excess of standardized EDTA solution (0.02 milar) was added to the flask from a
burrette.3. The solution was then adjusted to a pH of 9 by a
dropwise addition of an ammonium hydroxide solu
tion.4. Three drops of 0.2% aqueous solution of Erio-
chrome Black T were added to the solution. The solution color was light blue.
5. The excess EDTA was back titrated with either Zn(II) or Pb(II), 0.02 molar, solution to the pink-violet end point.
6 . The concentration of cobalt was determined by
calculating the difference in the original (excess) EDTA added and that titrated in step 5.

CHAPTER VI
EXPERIMENTAL RESULTS
In this chapter the reactor conditions and variables are first explained and defined. Then the results of experimental runs on the reduction of nickel from its ammoniacal solutions in the presence of ferrous sulfate catalyst with hydrogen are presented. The observations made on the reduction of cobalt from its ammoniacal sulfate solution with different catalysts by hydrogen are presented
separately, for the sake of clarity, in Appendix A.
Reactor Conditions and VariablesTemperature
The reactor temperature reported in the results
section is actually the outside skin temperature; it represents a mean temperature which was averaged over the duration of each run. The reactor outside skin temperature was measured with six thermocouples spaced evenly along the reactor. The fluid-side temperature of the reactor was mea
sured by inserting a thermowell inside the reactor; it was
fitted to a T-connection of the sight glass by appropriate Swagelok fittings. The thermowell was made of 3.2 mm (1/8
64

65inch) 304 stainless steel tubing and sealed at one end. It was filled with heating oil. The thermocouple was long enough (1200 mm, 47.2 inches) to reach about half-way down the re
actor. Distilled water was pumped through the reactor and
preheated to the desired temperature. Reactor heaters were activated and the steady state temperatures of the fluid as
well as outside skin of the reactor were monitored. By repeating this procedure it was possible to calibrate the outside skin temperature with that of the water as shown in Appendix C, Figure C-2. From this figure it can be seen that the fluid temperature varied only a few degrees from the reactor outside skin temperature over a temperature range of 40 to 200°C (100 to 400°F).Pressure
The total reactor operating pressure was measured with a Heise pressure indicator calibrated in two pounds per square inch divisions. Pressure readings were taken
every ten minutes during a run; they varied very slightly, less than 5 psi in all runs from the preset value.Hydrogen Flow Rate
The hydrogen input flow rate was measured by a DPcell in inches of water which could then be converted to a volumetric flow rate using the calibration curve shown in
Appendix C, Figure C-1. The excess of hydrogen input reported in the experimental runs was calculated as
9a - 9tExcess Hydrogen, % = -------- x 100 (Vl-1)9t

66
where and are the actual hydrogen feed rate and the stoichiometric hydrogen feed rate, respectively (SCPM) required for reducting all of the nickel in solution. Most of the runs were made with 25% excess hydrogen input.Solution Feed Rates
The nickel solution feed rate was determined by measuring the volume of liquid exiting the reactor in a specified length of time. The feed pump was adjusted until the
desired flow rate (within + 5 cc) was achieved. The ammonium
hydroxide solution flow rate was determined by observing the drop in the solution level in a graduated cylinder placed in the suction side of the ammonia feed pump (P-3). The flow
rate of ammonium hydroxide solution was limited to about 10 percent of the total volumetric flow rate through the reactor
to avoid excessive dilution of the nickel feed concentration and excessive cooling at the reactor inlet.Feed Solution Concentrations
The nickel concentration of the feed solution was taken as that of the feed tank solution and was measured
according to the procedure outlined in Chapter V. The iron catalyst concentration in the feed tank was based on a
weighed amount of FeSO^'VHgO added to the feed tank. The cunmonium sulfate concentration was also based on a weighed
amount of (NH^)2S0^ added to the feed tank to give the desired molar ratio of ammonium sulfate to nickel ions.

67
Ammonium Hydroxide to Nickel Molar RatioThis ratio refers to the molar ratio of the flow rates
(mole/min) of ammonium hydroxide and nickel solutions at the reactor inlet. This ratio was calculated by measuring the
concentrations of ammonia and nickel ions at their respective feed tanks and by assuming additive volumes of the two solutions at the reactor entrance.Residence Time
A residence time of a given volume of reactor fluid (gas-liquid and solid) was taken as that of the liquid phase only. It was calculated by dividing the reactor volume (400 cc) by the total volumetric flow rate to the reactor. The latter was the sum of the flow rate of nickel solution and
the flow rate of ammonium hydroxide solution as measured in
cubic centimeters per minute.Conversion of Ni'*"*' ions
The conversion of nickel ions to product (nickel salts and metallic nickel) was based on the nickel ion concentration of nickel at the reactor inlet. The latter, however, was based on the feed tank concentration of nickel which was diluted by the addition of ammonium hydroxide feed at the reactor inlet. Therefore, the fractional conversion of nickel ions at the reactor exit can be formulated as
%Ni++ =(Ni++).
1 ^ (1 + ^ )- (Mi )o FN1++
(VI-2)

68
where (Ni"*"*") and (Ni^^) are the feed tank and the reactor spent solution nickel concentrations, respectively; while
Fjjjj and are the volumetric flow rates of ammoniumhydroxide and nickel feed solutions, respectively.
Experimental Observations on Continuous Nickel Reduction by Hydrogen
Run #1
The objective of this run was to determine whether the stainless steel reactor walls (in mill condition) would
nucleate the reduction reaction. The nickel feed solution (11.7 gr Ni''”*’/liter) containing no ferrous sulfate was pumped
to reactor pressure (3479 Kpa— 505 psia) at a rate of 70 cc/ m i n . An ammonium hydroxide solution was pumped at a rate of
10 cc/min to give a molar ratio of NH^ to Ni '*’ ions of about2.5 at the reactor entrance. The hydrogen flow rate was 75% in excess of the stoichiometric rate to minimize any mass transfer resistances in the liquid phase. The reactor average
temperature was 175°C (350°F) and the run duration was one
hour at which time the reactor spent solution was clear in color.
After the run, the reactor was visually inspected and
found to be coated with a greenish film of solids removable with a bristle brush. The solid product collected in the
liquid-solid separator was also light green in color and nonmagnetic; presumable all nickel salts. Therefore, under the

69above operating conditions stainless steel could not nucleate the reduction reaction to any measurable extent.Runs #2 and 3
Run #2 was made to check the feasibility of sampling the reactor fluid through the side ports. The run conditions were similar to run #1 except ferrous sulfate was added to
the feed tank to give a concentration of 1.0 gr Fe^^/liter.The run was terminated after only 50 minutes of operation due to a complete plugging of side ports with fine nickel particles. The first valve (port #1) was plugged in 25 min
utes while the others were plugged after about 4 0 minutes of operation. The conversion of nickel ions at run termination time was about 85 percent.
Run #3 was made to duplicate run #2 but with a shorter liquid residence time— 1.25 minutes. The feed solu
tion contained 9.4 gr Ni^^/liter and 1.0 gr Fe^^/liter. It
was pumped to the reactor at a rate of 280 cc/min. The feed rate of ammonium hydroxide solution was about 40 cc/min; all
other operating conditions were the same as for run #2. Again, port #1 was plugged within 20 minutes in the run, and all other side ports were completely plugged in 55 minutes at
which time the conversion level was about 85 percent as measured through port #5. The reactor did not reach a steady state level of conversion however. The product collected in this run was analyzed by x-ray diffraction spectrometry (XRD)
and atomic absorption spectrometry (AA). On a weight basis.

70the product was found to contain 91.2% nickel, 6.45% iron and less than 1% nickel hydroxide. The anlaysis of the product is shown in Table VI-1. Upon visual inspection of
the reactor interior, no platting of nickel metal on the
reactor walls was observed under the conditions of the run.
TABLE VI-1 RUN #3. SOLID PRODUCT ANALYSIS*
Elemental or Molecular Species
Weight Percent (wt%)
Nickel (Ni) 91.22
Nickel Hydroxide [Ni (OH).,] <1.00Iron (Fe) 6.45Copper (Cu) 0.59Calcium (Ca) 0.48Sodium (Na) 0.23Potassium (K) 0.073Cobalt (Co) <0.01Chromium (Cr) <0.003Zinc (Zn) <0.001Manganese (Mn) <0.002Lead (pb) <0.01
*Solid sample was examined with x-ray fluorescence spectrometry (XRF), x-ray diffraction spectrometry (XRD), and atomic absorption spectrometry (AA). The analysis was made by EMTEC Corporation of Norman, Oklahoma.

71Runs #4 and 5
These runs were made to compare the conversion levels of ions at steady state by smapling the reactor throughports #5, 6 and 7. In particular, it was of importance to see the effect of the double-bag filtering arrangement in the liquid-solid separator on the final conversion, as measured
through port #7, by comparing it with the steady state values
of conversion obtained from the other sampling ports. Also,
the duration of the run for the reactor to reach a steady state was important for the remainder of the experimental program.
Both runs were made with an average reactor temperature of 174°C (345°F) and a total pressure of 3479.5 Kpa (505 psia). The liquid residence time for each run was about2.0 minutes. The feed solution (nickel and iron) concentra
tions were 9.5 gr Ni^^/liter and 1.0 gr Fe^^/liter, respectively. The hydrogen input to the reactor was about 40% in excess of the stoichiometric rate. The feed solution was 175 cc/min., and the ammonium hydroxide rate was 25 cc/min.
The molar ratio of NH^ to Ni ions at the reactor entrance was 3.0.
Run #4 was terminated after only 60 minutes following
hydrogen introduction due to the discharge of fine particles through port #5. Since the reactor did not reach a steady state, the run was repeated as run #5 after washing the re
actor thoroughly with distilled water. The filter element of
72
port #5 was found encased with a cake of granular black nickel particles. The element was cleansed with dilute nitric acid and air-flushed before it was put back on line.
Run #5 lasted about 75 minutes before termination due to frequent level fluctuation indicating a near plugging condition due to accumulation of products inside the reactor. Again, there was some discharge of nickel particles through ports #5 and 6 after only 40 minutes in the run. None of these
ports were plugged, however, until the end of the run. The results plotted as percentage of conversion of Ni''”’’ ions and pH of spent solution versus run lapse time are shown in Figures VI-1, VI-2 and VI-3. The results indicated that at
steady state there was about 5 percent difference in conversion between the inlet (port #6) and the exit (port #7) of the liquid-solid separator, perhaps due to the filtering action of
the double-bag arrangement in the separator.The erratic behavior of nickel conversion and pH at
the beginning of the run was due to the introduction of ammonium hydroxide solution and the subsequent liquid level fluctuations inside the reactor. As shown in Figures Vl-1, Vl-2 and VI-3 once the liquid level was stabilized; both conversion
and pH leveled off at their respective steady state values.
The results also indicated that a minimum of 60 minutes duration was required to secure a steady state operation of the
reactor.

73
100
80
t/lco++
60
coO>Cs
20
Feed Tank Concentrations (gr/liter): N1+* = 10.2 Fe** = 1.0
No (NHa)2S04 added NHg:Ni^+ = 3.0 (molar ratio) Excess Hydrogen = 40% Pressure = 3479 Kpa Temperature = 174°C Residence Time = 2.0 minutes- # — # -- # conversion-©— e— ©■ pH
10
OoLT>CO
Co
o(/IOJQ.co
Figure VI-1.
■Jô ’ 1 ' 1 * i-’—mL—Run Lapse Time, minutes
Conversion of Ni++ Ions and pH of Spent Solution Versus Run Lapse Time (Run #5). Sampling is through Port #5.

74
100
80
V)Cot 60
ocoi/iLQ)>COo
40
20
Feed Tank Concentrations (gr/liter): Ni = 10.2 = 1.0No (NH4)2S04 added NH3:N1++ = 3.0 (molar ratio)Excess Hydrogen = 40%Pressure = 3479 Kpa Temperature = 1740C Residence Time = 2.0 minutes
— # — # - - - # - conversion—®— 0 G PH
20 80 100
10
OotnCVJ-MfC
Co
o00cQ)CLC/)
Figure VI-2.
40 60Run Lapse Time, minutesConversion of Ni++ Ions and pH of Spent Solution Versus Run Lapse Time (Run #5). Sampling is through Port #6.

75
Feed Tank Concentrations (gr/liter): Ni++ = 10.2 Fe** = 1.0No (NHA)nS04 added NH3:Ni^+ = 3.0 (molar ratio) Excess Hydrogen = 40% Pressure = 3479 Kpa Temperature = 1740C Residence Time = 2 minutes # __ * # conversion
100
co++zH-Oco
100Run Lapse Time, minutes
10
ooI f )C\j4->to3CO.co
7caQ.(/)
Figure VI-3. Conversion of Ni++ Ions and pH of Spent Solution Versus Run Lapse Time (Run #5). Sampling is through Port #7.

76
Run #6
The objective of this run was to duplicate one of Brunsell's runs (run #2) under the same condition of feed composition and total reactor pressure, but with a non- isothermal reactor. It was reported by Brunsell (6) and
Plumb (32) that a conversion level of 99.5 percent could be obtained with an isothermal reactor temperature of about 204°C (400°F) and a total reactor pressure of 3548 Kpa (515 psia). However their work was aggravated by two problems.
The first was the excessive accumulation of solid product inside the reactor, i.e. none of the nickel product was found in the liquid-solid separator. The second problem was the excessive plating of metallic nickel on the reactor walls
(in both the titanium and stainless steel reactors). It was intended in the present run that by limiting the preheater temperature to about 93°C (200°F) and thus operating the re
actor under non-isothermal conditions, the above problems
could be either minimized or eliminated.The feed tank concentrations of nickel and iron were
9.5 and 1.0 gr/liter, respectively. The molar ratio of
ammonium sulfate to nickel ions in the feed-tank was about 2.0. The feed solution (1.0 sp. gravity) was pumped to the
reactor at a rate of 70 cc/min. The ammonium hydroxide solution feed rate was 10 cc/min; making the molar ratio of NH^
to Ni^^ ions at the reactor entrance about 3.0. The hydrogen input to the reactor was four times the stoichiometric rate.
The reactor temperature profile is shown in Figure VI-4.

77
240
200
5 160
5 120“O
ÜC
58 87 116Distance from Reactor Inlet, cmFigure VI-4. Reactor Temperature Profile for Run #6.

78The run was terminated after 80 minutes at which time
a considerable level fluctuation in the reactor sight glass was observed. The preheater did not show any plugging during this period as the fluid entering the reactor was free of
any suspended solids. There was some metallic nickel plating on the sight glass despite its low temperature (90°C). After the end of the run, about half of the solid product was found
in the liquid-solid separator while the other half was found in the upper half of the reactor in the form of granular black nickel mud. This mud was removed by nylon bristle brush and the reactor was washed thoroughly with water. The reactor was further inspected (visually) for any nickel plating on the walls; it was found that some plating had taken place only in the bottom-half section where the temperature reached 228°C (442°F). This plating was adhered tightly to the reactor wall and was removable only with a steel brush.The plating took the form of thin foil, rusty-silver in color. Figure VI-5 shows a comparison of conversion between the results of this run and those obtained by Brunsell.
From Figure VI-5, it can be seen that essentially
the same level of nickel conversion can be obtained with a non- isothermal reactor. The problems of excessive product accumu
lation and nickel plating on reactor walls were minimized with
a non-isothermal reactor. The solid product collected in this run was not analyzed for metallic nickel by x-ray diffraction spectrometry. Hence the quality of the product produced in

20
79
TFeed Tank Concentrations (gr/liter):
N1++ = 9.5 Fe++ = 1.0(NH4),S04:Ni++ = 2.0 ) , .NH3TNi++ = 3.0 ) (molar ratios)Excess Hydrogen = 300%Pressure = 3465 Kpa Residence Time = 4.7 minutes
this work Brunsell (6)
100
80
I/)Co++
coV)S.§:coo
60
40
I20 40 60 80 100Run Lapse Time, minutes
Figure VI-5, Conversion Versus Run Lapse Time (Run #6).

80
this run could not be compared with that reported by Brunsell,i.e. better than 90 wt% nickel.Runs #7, 8 and 9
The objective of these runs was to investigate theeffect of the catalyst (ferrous sulfate) concentration on
the final conversion of Ni** ions. The preliminary work ofNeskora (29) suggested that a final conversion of nickel of98 percent could be obtained with a catalyst concentration ofabout 0.5 gr Fe**/liter when the average reactor temperaturewas about 100°C (212°F). It was decided, therefore, to pursue
this finding further by varying the catalyst concentration
between 0.25 (run #7) and 1.0 gr Fe**/liter (run #9) whilethe catalyst concentration for run #8 was 0.5 gr Fe**/liter.
The feed tank concentrations of nickel ions were
10.8, 9.1 and 10.4 gr Ni**/liter for the three runs, #7, 8and 9, respectively. A predetermined weight of FeS0^-7H20was added to the feed tank a few minutes prior to the startof the run to avoid any oxidation of the iron (Fe**) due tothe occasional agitation of the solution in the feed tank.The catalyst-treated feed solution was pumped to a reactorpressure of 3479 Kpa (505 psia) at a rate of 70 cc/min. Theammonium hydroxide solution was fed to the top of the reactorseparately at a rate of 10 cc/min. The molar ratio of NH^
*4*+to Ni ions at the reactor inlet was between 2.2 and 2.5.
The reactor average temperature was between 115°C (240°F) to
120°c (250°F). All runs were made with a liquid residence

81time of about 5 minutes. The hydrogen feed was three times the stoichiometric rate. The duration of each run was 100 minutes. The reactor was inspected for plating after the end of each run and was found to be free of any metallic plating on walls.
The steady state conversion of Ni"*"'’ ions for the
three runs (#7, 8 and 9) were 72, 8 8 and 95 percent, respec
tively. The results are shown in Figure VI-6. The drop in conversion (less than 10 percent) observed between run #9 and 8 was within the accuracy of the analytical technique used to determine the nickel concentrations; therefore limiting the catalyst concentration to about 0.5 gr Fe^^/liter in the feed tank is probably justifiable.Runs #10, 11, 12, 13, 14 and 15
These runs were made to determine whether the
ferrous sulfate catalyst had to be supplied continuously with the nickel solution in order for the reduction reaction
to proceed or whether it was simply needed to initiate the reaction. These runs were made in the following manner; A
portion of the feed solution (3.0 gr Ni^’*’/liter) , treated with ferrous sulfate catalyst to give a concentration of 0.5 gr Fe^^/liter in the feed tank, was pumped to the reactor for the first 40 minutes, followed thereafter by uncatalyized feed (3.0 gr Ni"'"*’/liter) . Both hydrogen and ammonium hydroxide solution were continuously fed to the reactor during both portions of the run to minimize any disturbances in the liquid

82
100
80
tn§++ 60
gî 40 0)>co(_)
20
0 20
TFeed Tank Concentrations (gr/liter)
Ni++ = 9.1-10.8 Fe++ = 0.25-1.0No (NHgJgSOa added NH3:Ni++ = 2.2-2.5 (molar ratio) Excess Hydrogen = 160-200% Pressure = 3342-3479 Kpa Temperature = 115-12000 Residence Time = 5.0 minutes
- © --- © - - - - O — Run #8Run #9
1.0 Fe++
0.50 Fe
++0.25 Fe
40 60 80 100Run Lapse Time, minutes
Figure VI-6. Conversion Versus Run Lapse Time for Runs #7, 8 and 9.

83
level. The pH and the nickel concentration of the spent solution samples collected during the course of the run were measured to follow the progress of the reaction(s).
Each run was made with a different molar ratio of
NHg to Ni"*”* ions at the reactor inlet to examine the dependency of the final conversion of Ni^* ions on this ratio. The corresponding molar ratio of NH^ to Ni'*”'’ ions at the reactor entrance were 1, 2, 3, 4, 6 and 8. Each run was made at a total liquid residence time of 5 minutes. The reactor average
temperature and pressure were 116°C (240°F) and 3583 Kpa
(520 psia), respectively. The hydrogen gas flow rate was about nine times the stoichiometric rate in order to eliminate any mass transfer resistance in the liquid phase. In each run the catalyzed feed was supplied to the reactor for only the first 40 to 50 minutes followed then by uncatalyzed feed for the remainder of the run, about 80 minutes, making
the run duration 120 minutes. The results of runs #10 and 12are shown in Figure VI-7 while the results of runs #11 and 13are shown in Figure VI-8.
From Figures VI-6 and VI-7, it can be seen that there
was a slight drop (less then 10 percent) in nickel conversion due to the absence of ferrous ions in feed solution in the second segment of each run. On the other hand, the absence
of ferrous ions in the feed solution resulted in an increase in pH when the molar ratio of ammonia to nickel ions was less than or equal to two. The accumulated product from each run

84
100
80w(/>co
60
iA&.O>Coo
40
20
20
Figure VI-7.
I
T
40
Feed Tank Concentrations (gr/liter):Ni++ = 3.0 Fe** = 0.5 (for the first55 minutes only)No (NHa)pS04 added NH3:Ni^+'= 1.0 (Run #10) and
3.0 (Run #12) (molar ratio) Excess Hydrogen = 800%Pressure = 3583 Kpa Temperature = 116-127°C Residence Time = 5 minutesRun #1012
Conversion £H
1 I
10
ooLDCSJ4->to
co4-)3OLOCO)Q .t/)
100 12060 80 Run Lapse Time, minutes
Conversion o f Ni++ Ions and pH o f Spent S o lu t i on VersusRun Lapse Time fo r Runs #10 and 12.

85
100
80
t/)Coî
co(/)OJ>coCJ>
60
40
20
Feed Tank Concentrations (gr/liter):Ni++ = 3.0 Fe*^ = 0.5 (for the first40 minutes only)No (NHA)2S04 added NH3:Ni^+ = 2.0 (Run #11) and
4.0 (Run #13l (molar ratio) Excess Hydrogen = 800%Pressure = 3583 Kpa Temperature = 116-123°C Residence Time = 5 minutes
Conversion
o © o 0-
10.5
9.5
8.5
7.5
OoinOJ■P3:C LCo
o(/)cO)C Loo
6.5
Figure VI-8 .
60 80 Run Lapse Time, minutes
Conversion o f Ni++ Ions and pH o f Spent So lut io n VersusRun Lapse Time f o r Runs #11 and 13.
5 .5

86
was found heavily contaminated with a layer of green salts; about 50 percent of the total weight of the product. An x-ray examination of the product from run #13 (Table Vl-2)
showed about 48 wt% metallic nickel content. Since the accumulated products— from both portions of the run— could not be collected and analyzed separately it could not be determined whether the ferrous ions had to be supplied continuously with the feed solution in order for a reduction to metallic nickel to take place.
TABLE VI-2
RUN #13. SOLID PRODUCT ANALYSIS*
Element Weight Percent (wt%)
Metallic nickel 48.0 (XRD)
Total nickel (incl. salts) 93.01 (EDX)Iron 6.64 (EDX)
Sulfur 0.15 (EDX)
Aluminum 0.20 (EDX)
*Solid sample was examined by x-ray diffraction spectrometry (XRD) and x-ray energy dispersive spectrometry (EDX). Analysis was made by Target Reservoir Analysis, Inc. of Oklahoma City, OK.
Run #16This run was made in an effort to study the possi
bility of using the oven-dried nickel product collected in run #3 (91% metallic nickel content, see Table VI-1) as a

87
reducing catalyst for the reduction reaction. The run was made in the following manner; A fresh feed solution of nickel
(3.0 gr Ni"*"*’/liter) and without any ferrous catalyst was pumped to the reactor for one hour, followed by a nickel solution containing some suspended nickel powder; as the catalyst.
During the course of the run, hydrogen at nine times the
stoichiometric rate and a solution of ammonium hydroxide were continuously and separately fed to the reactor. The reason for operating the reactor in the above fashion was to compare the nickel conversion before and after the addition of the nickel powder (catalyst) to the feed tank.
The reactor average temperature and pressure were 120°C (250°F) and 3583 Kpa (520 psia) respectively. The nickel solution feed rate was 70 cc/min, while the ammonium hydroxide solution was 10 cc/min. The molar ratio of NH^
to Ni'*"*' ions at the reactor inlet was about 4.0. The nickel powder added to the feed tank was 100 mesh (Taylor equivalent)
in size and its concentration in the feed tank was about 0.3 gr/liter. The results of the run are shown in Figure VI-9.
The product collected in the liquid-solid separator
was mainly greenish except for a few black crystals which presumably was the nickel powder added. The reactor walls
were scaled with a thin layer of greenish cake. Note that in Figure VI-9 there was no change in either the conversion or the pH level, regardless of the nickel powder added, indicating that the dried nickel powder could not catalyze the reduc
tion reaction to any measurable extent.

88
100
80
co++
60
I 40Q>>Coo
20
Ni ^ = 3.0 (gr/liter) in feed tank No FeSOa added to feed tank No (NH4L S O 4 added to feed tank Nickel Powder (0.3 gr/liter) added to
feed tank after 60 minutes of operation
NH3:Ni++ = 4 (molar ratio)Excess Hydrogen = 800%Pressure = 3583 Kpa Temperature * 121°C Residence time = 5 minutes-a.
conversionpH
12
11
10
— o — © — 0-e- -0- -O 0---©--- €h
ooIDCNJ(0
co3'oC/Ï4-*C0)o.00
1 120
Figure VI-9 .
40 10060 80 Run Lapse Time, minutes
Conversion o f Ni++ Ions and pH o f Spent S o lu t io nRun Lapse Time f o r Run #16.
120
Versus

89
Run #17
The objective of this run was to investigate the possibility of precipitation of nickel values from spent solution without any further treatment with either ferrous
sulfate or ammonia. It was suspected that the spent solution
from the reactor during the course of a normal run would still have in it enough active nuclei capable of self-
catalyzing the reduction reaction. Since the life time of
these nuclei might be short, it was decided to divide the run into two segments. In the first segment a fresh feed of
nickel solution (3.0 gr Ni^^/liter) was prepared and treated
with ferrous sulfate to give a concentration of 0.5 gr Fe**/ liter in the feed tank. The feed was pumped to the reactor at a rate of 70 cc/min. while the ammonium hydroxide solution was at a rate of 10 cc/min; making the molar ratio of NH^ to Ni** ions at the reactor entrance of about 7. The hydrogen
input was about nine times the stoichiometric rate. The reactor average temperature and pressure were 120°C (250°F) and 3583 Kpa (520 psia). This segment was made for 120 minutes before hydrogen gas was cutoff. The spent solution
during this period was continuously collected and stored in glass bottles (3.4 liters).
At the end of the first segment, the reactor was washed with distilled water (200 cc/min) for about one hour to remove nickel particles that were adhered to the walls. The reactor temperature and pressure were then
90
adjusted to the conditions of the first segment of the run before the second segment was commenced.
In the second segment of the run the collected spent solution was mixed with 5.5 liters of fresh nickel solution (3.0 gr Ni^^/liter and no iron) to give a concentration of 1.0
gr Ni"*”*’/liter and a pH of 8.6 in the feed tank. Note that no ammonia was added to the reactor and that the amount of hydrogen used in this segment was 2400 percent in excess of the stoichiometric rate. This segment of the run was made for only 60 minutes before shut-down due to a complete plating of
the sides of the sight glass with metallic nickel. Figure VI-10 shows the results of the two segments of the run. Although the conversion levels of both segments were practically
the same, the second segment was not conclusive in determining that precipitation of metallic nickel had taken place
since the products of the two segments of the run were mixed and could not be analyzed separately. On the other hand, the slight drop in pH (from 9.6 to 8.1) as well as the plating of metal that took place on the sight glass during the second segment might indicate that some reduction had occurred.
Run #18This run was made specifically to determine whether
ferric sulfate could act as a nucleating agent for precipi
tating metallic nickel from its sulfate solution by hydrogen.
(No mention was found in the literature for the use of ferric sulfate to reduce nickel by hydrogen.) It was also important

91
100
80
60
cot/fs-co(_)
40
20
T TFeed Tank Concentrations (gr/liter):
Ni++ = 1-3 Fe*^ = 0.0 (2nd segment) & 0.5 (1st segment)NH3:Ni++ = 3-7 (molar ratio)Excess Hydrogen = 800-2400%Pressure = 3583 Kpa Temperature = 121-130°C Residence Time = 5 minutesRun Segment Conversion
FirstSecond AE ü©A
12
11OoinOJ
10
o4->Oc(UQ.
CO
"^20 40 60 80 100 120 'Run Lapse Time, minutesFigure VI-10. Conversion o f Ni*^ Ions and pH o f Spent So lu t i on Versus
Run Lapse Time f o r Run #17.

92for the forthcoming experiments to find out the effects of agitation of the feed solution in the feed tank where ferrous ions, noramily used as a catalyst, might be oxidized with oxygen from room air to the ferric state.
The run was made with 16 liters of fresh nickel sulfate solution to give a concentration of 6.3 gr Ni^^/liter;
70 grams of ferric sulfate (FSgtSO^lg'XHgO), made by Baker & Adamson & Co., were added to the feed tank. The granular ferric sulfate had a maximum limit of ferrous ions (Fe’*"*’) of 0.02 wt%. The feed solution was continuously mixed to ensure a uniform feed input composition to the reactor. The molar
ratio of NH^ to Ni^^ ions at the reactor entrance was 4.2.The feed rates of nickel-iron solution and ammonium hydroxide solution to the reactor were 70 to 10 cc/min respectively.The excess hydrogen fed was about 60 percent. The reactor
average temperature and total pressure were 120°C (250°F) and
3445 Kpa (500 psia) respectively.During the run the feed solution entering the reactor
was brown in color with very fine particles, presumably ferric hydroxide due to the hydrolysis of ferric ions in the preheater section. The run was made for a total of 100 minutes without any signs of plugging or severe liquid level fluctuations. The results of the run are shown in Figure VI-11. The solid product collected from the run was greenish-gray in color and was heavily contaminated with a brown layer of ferric salts. The product was thoroughly washed with distilled water
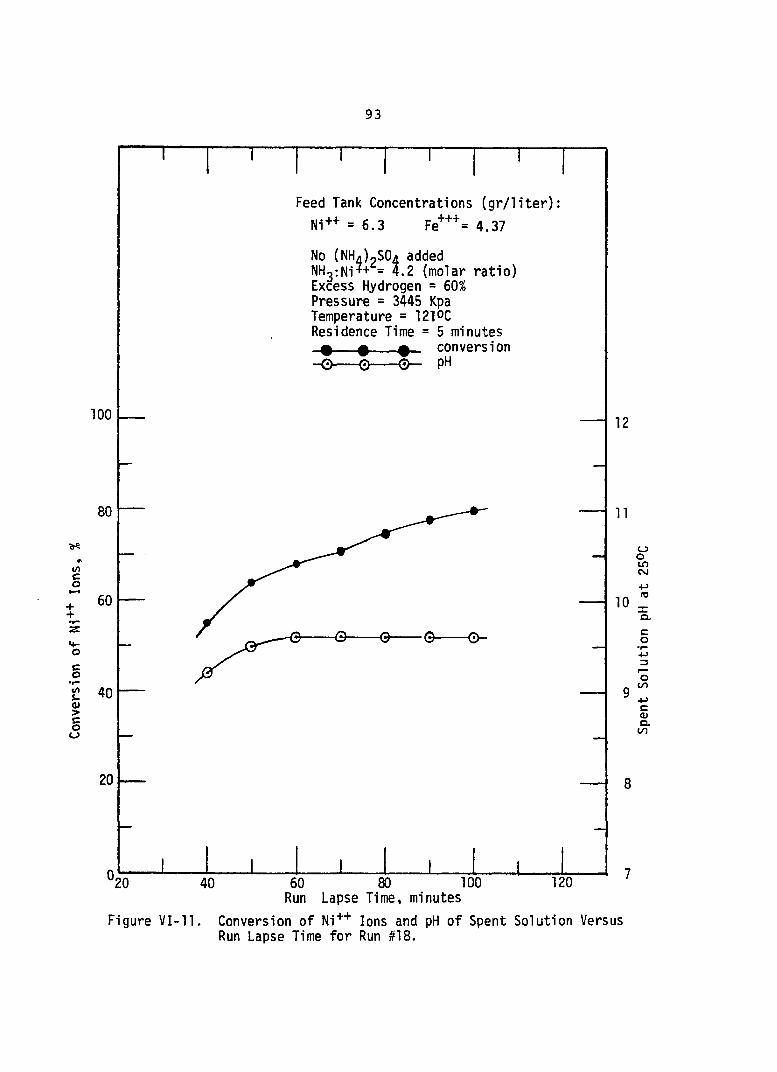
93
i/ïcoî
gCOuQ)>
I
Feed Tank Concentrations (gr/liter): Ni++ = 6.3 Fe' ' ’ = 4.37MO iMMajpSUa aoceo NH2:Ni?+ = 4.2 (molar ratio) Excess Hydrogen = 60% Pressure = 3445 Kpa Temperature = 121^0 Residence Time = 5 minutes 0 ^ 0 conversion
- O 0 - - - © — pH
100
80
60
O -
40
20
0 100 12060Run Lapse Time, minutes8020 40
12
11
OOLf)CSJ
10cO
o{/)•MCOJQ.
Figure V I -1 1 . Conversion o f Ni++ Ions and pH o f Spent S o lu t io n VersusRun Lapse Time f o r Run #18.

94and left to dry in an oven at 107°C for 24 hours. The total weight of the dry product was 46.6 grains. An x-ray analysis of this product was made and shown in Table VI-3.As seen from this table the product contains about 60 percent by weight metallic nickel.
TABLE VI-3 RUN #18. SOLID PRODUCT ANALYSIS*
Element Weight Percent(wt%)
Metallic nickel 60.0 (XRD)Total nickel (incl. salts) 90.74 (EDX)Iron 7.40 (EDX)Sulfur 1.63 (EDX)
Aluminum 0.23 (EDX)
*Solid sample was examined by x-ray diffraction spectrometry (XRD) and x-ray energy dispersive spectrometry (EDX). Analysis was made by Target Reservoir Analysis, Inc. of Oklahoma City, OK.
The presence of metallic nickel in solid product indi
cated that ferric sulfate was capable of catalyzing the nickel reduction reaction. However, it was not clear whether a hydrated ferric hydroxide alone or a mixed salt of nickel and ferric iron was responsible for initiating the reduction.Runs #19, 20, 21, 22, and 23
These runs were made to determine the effect of total reactor pressure (and hence the hydrogen partial pressure) on

95the final conversion of Ni"*" ions and product quality. The
range of total reactor pressure studied was from 6201 Kpa (900 psia) for run #19 to as low as 455 Kpa (66 psia) for run #22. All runs were made with a reactor temperature of 115-120°C (240-250°F) and a residence time of 5 minutes. The catalyst concentration in the feed tank was 0.5 gr Fe^*/
liter while the feed nickel concentration was about 10 gr
Ni^^/liter. The molar ratio of NH^ to Ni"*"*" at the reactor inlet was 2.4. The feed rates of nickel and ammonium hydroxide solutions were 70 and 10 cc/min respectively.
The total reactor pressure for run #19 was 6201 Kpa (900 psia) and the hydrogen flow rate was 100 percent in
excess of the stoichiometric rate. The reactor reached a steady state and the values of conversion and spent solution
pH were 95 percent and 9.1 respectively. The run lasted 85 minutes at the end of which the reactor liquid level started to fluctuate. After the end of the run the reactor contained very hard scaling uniformly around the wall which was removed with a steel brush.
Run #20 had a total reactor pressure of 2136 Kpa (310 psia) and 170 percent excess hydrogen gas input. All other operating conditions were the same as for run #19. The
steady state values of conversion and pH were about 85 percent and 8.2 respectively. The reactor walls were found plated with a foil sheet of solid product. This foil was
removed with a steel bursh and found to contain 98 wt% nickel
by a wet method of analysis.
96The reactor pressure for run #21 was decreased to 550
Kpa (80 psia) which was just enough to prevent the solution in the reactor from boiling. The hydrogen flow rate was about 70 percent in excess of the stoichiometric rate. The steady state
conversion of Ni^^ and pH of the spent solution were 70 percent and 8.6 respectively. Upon inspection of the reactor, it was
found that some loose product adhered to the walls but there was no sign of hard scaling or metallic plating. The
product collected in the liquid-solid separator resembled
that of the high pressure run (#19) in color and magnetic susceptibility. The product was analyzed by x-ray diffraction and found to contain a mixture of nickel and nickel hydroxide. The analysis is shown in Table VI-4. The results of runs #19, 20 and 21 are shown in Figure VI-12, VI-13 and VI-14, respectively.
The interesting result of co-precipitating metallic nickel and its hydroxide were pursued further and run #21 was
repeated in runs #22 and 23 to confirm its findings. The steady state conversion of Ni^+ ions were 68 percent and 70 percent for runs #22 and 23 respectively. Again, the products of these two runs were magnetic and presumed to contain some nickel hydroxide as well.
Runs #19 through 23 indicated that the operating pressure affected slightly the nickel conversion, i.e. about 25
percent drop in conversion as a result of decreasing the pressure from 6201 to 550 Kpa. At low operating pressures (=550 Kpa) the co-precipitation of nickel hydroxide with metallic nickel could be due to either a partial hydrolysis of nickel

97
TABLE VI-4 RUN #21. SOLID PRODUCT ANALYSIS*
Element or Molecular Species
Weight Percent (wt%)
Nickel (Ni) 54.37Nickel Hydroxide [Ni(OH)g] 37.00Iron (Fe) 7.26Copper (Cu) 0.59Calcium (Ca) 0.41Sodium (Na) 0.26Potassium (K) 0.077Cobalt (Co) <0.01Chromium (Cr) <0.003
Zinc (zh) <0.001Manganese (Mn) <0.002Lead (pb) <0.01
*Solid product was analyized with x-ray flourescence spectrometry (XRF), X-ray diffraction spectrometry (XRD) and atomic absorption spectrometry (AA). The analysis was made by EMTEC Corporation of Norman, Oklahoma.
ions or a low solubility of hydrogen, i.e. not enough hydrogen in solution was available to complete the reduction of nickel ions.
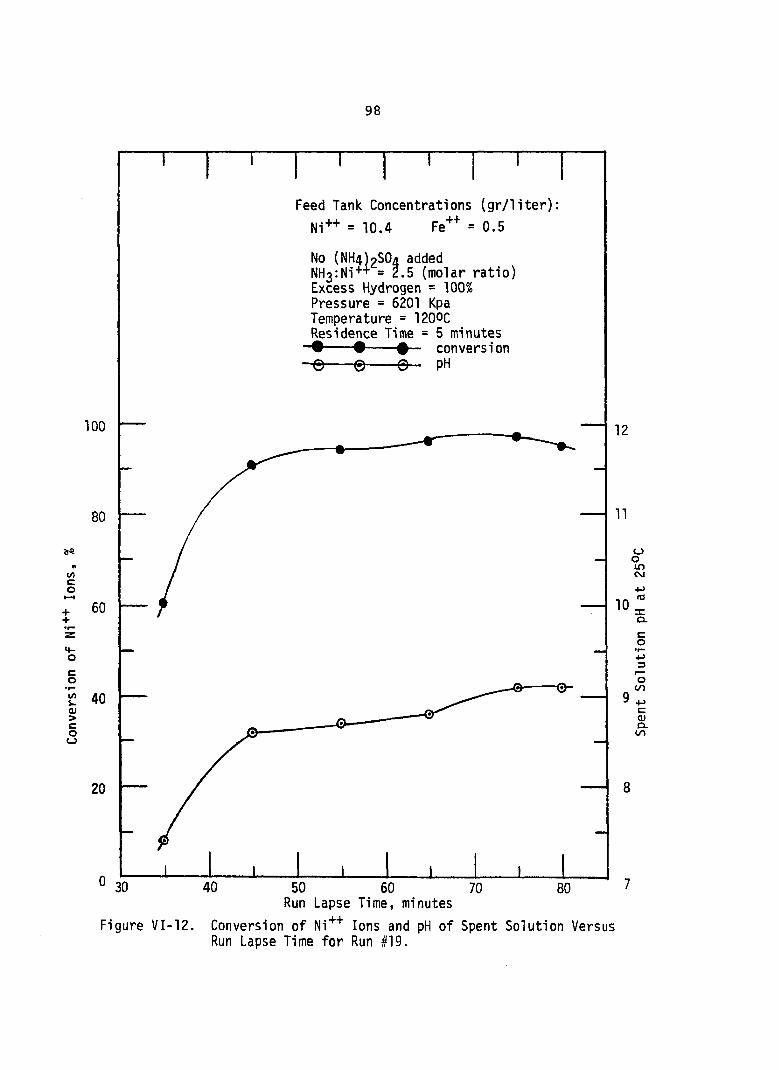
98
100
80
I/)COî 60
t/)u.ugu
40
20
TFeed Tank Concentrations (gr/liter);
Ni++ = 10.4No (NH4)2S04 added NHgiNi"""^ = 2.5 (molar ratio) Excess Hydrogen = 100% Pressure = 6201 Kpa Temperature = 1200C Residence Time = 5 minutes- # - - - #-- - - # — conversion- © - - - © --- © — pH
12
11
oomCM
10 icQ.co
ocQ)Q.CO
50 60Run Lapse Time, minutes
Figure VI-12. Conversion o f Ni* '*’ Ions and pH o f Spent So lu t io n VersusRun Lapse Time f o r Run #19.
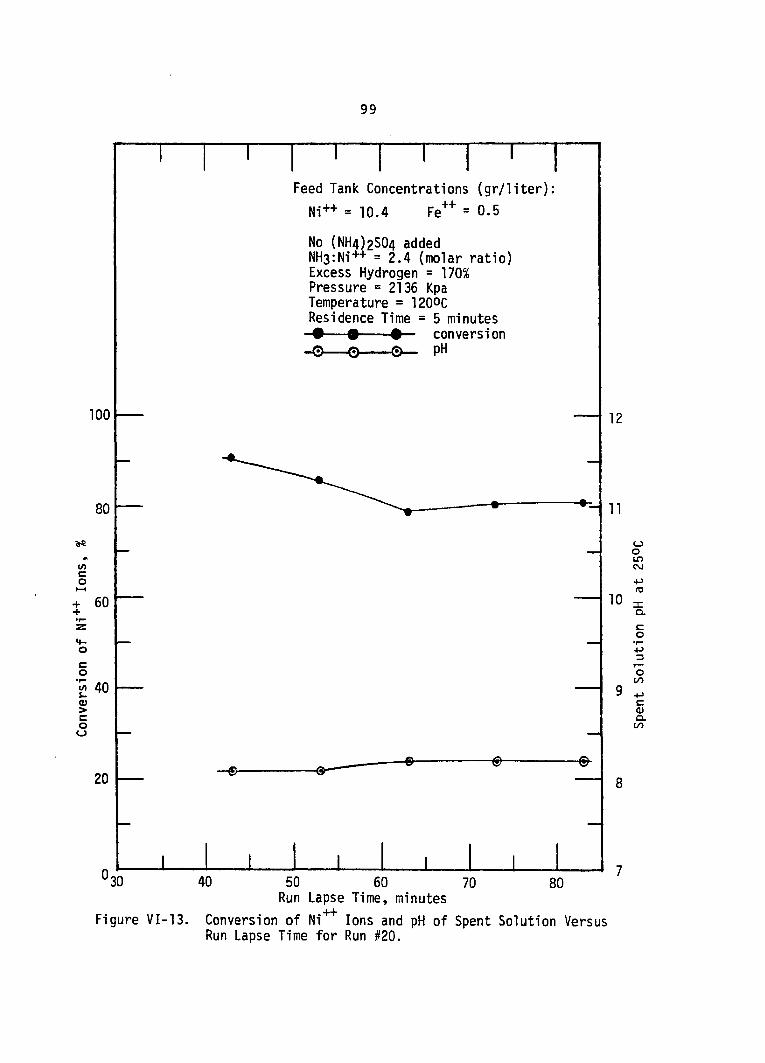
99
100
80
I/)co++ 60
w 40>coo
20
0
T TFeed Tank Concentrations (gr/liter);
Ni++ = 10.4 Fe' '*' = 0.5No (NH4)2S04 added NH3:Ni++ = 2.4 (molar ratio)Excess Hydrogen = 170%Pressure = 2136 Kpa Temperature = 1200C Residence Time = 5 minutes
conversionpH
-e- -0-
1 1
12
11
10
OoI f )CSJ4->fO
co4->3OincOJC Lin
30
Figure VI-13.
40 70 8050 60Run Lapse Time, minutes
Conversion o f Ni^^ Ions and pH o f Spent So lut ion VersusRun Lapse Time fo r Run #20.

1 0 0
Feed Tank Concentrations (gr/liter): Ni"*" = 10.9 Fe" " = 0.5
added.1 (molar ratio)NHnzNi
Excess Hydrogen = 70% Pressure = 550 Kpa Temperature = 118°C Residence Time = 5 minutes
conversion -ey- pH-o-
100
(/)co
col/><u>cou
‘12
11
10
o0L DCJ-p«33:CL
1 x>3'Sc/)-t->C01o.(/)
Figure VI-14.
Run Lapse Time, minutesConversion o f Ni++ Ions and pH o f Spent S o lu t i on VersusRun Lapse Time f o r Run #21.

10 1
Runs #24 and 25
The objective of these runs was to investigate the effect of the molar ratio of NH3 to Ni"*" ions at the reactor
entrance on the final conversion of Ni"*" ions to metallic nickel and nickel hydroxide with low pressure operation. It was suspected that co-precipitation of nickel hydroxide with
the metallic nickel was a result of either the low solubility of hydrogen gas in solution or due to the hydrolysis of nickel ions under the operating conditions. The latter could be
deduced by varying the molar ratio of NH^ to Ni"*"*" ions and by examining both the conversion and the final quality of the product. The molar ratio was 1 and 4 for runs #24 and 25
respectively. Both runs were made with a liquid residence time of 5 minutes and a catalyst concentration (ferrous sulfate) of 0.5 gr Fe^^/liter.
The total reactor pressure of run #24 was 613 Kpa (89 psia) and its average temperature was 113°C (236°F). The
feed tank nickel concentration was 11.3 gr Ni^^/liter; it was fed to the reactor at a rate of 70 cc/min. The ammonium
hydroxide solution was pumped into the reactor inlet at a rate
of 10 cc/min. The feed rate of hydrogen was about 70 percent in excess of the stoichiometric rate. The duration of the
run was 100 minutes.The steady state conversion of Ni^^ and spent solution
pH were 52 percent and 7.7 respectively. After the end of the run, the reactor was inspected and found to contain a layer

1 0 2
of green scale adhered loosely to the walls. The product collected in the liquid-solid separator was green, gelatinous mud. The product was oven dried and found to be soluble in both ammonia and nitric acid. Its total nickel content—
as determined by the wet method of anlaysis— was 63 wt%. In addition, this greenish product was non-magnetic and presumed to be all nickel hydroxide. The product was not analyzed,
however, with x-ray diffraction spectrometry to determine its metallic nickel content, if any.
In run #25 the feed tank nickel concentration was
7.2 gr Ni^^/liter. The hydrogen feed rate was about 300 percent in excess of the stoichiometric rate. The average reactor temperature and total pressure were 117°C (247°F) and
675 Kpa (98 psia) respectively. The flow rates of feed solutions were the same as for the previous run while the molar
ratio of NH^ to Ni ions at the reactor entrance was about4.0. The duration of the run was also 100 minutes.
The steady state conversion of Ni** ions and the pH
of the spent solution were 75 percent and 9.5 respectively. Again, the reactor was free of any hard scaling while the product in liquid-solid separator was gray-to-black in color similar to the product of run #21. Material balances, on both the ammonia and nickel ions, on run #21 (molar ratio of
NH^ to Ni** ions = 2.4) and on run #25, revealed that 1.85 and 2.2 moles of ammonia per mole of Ni** ions were consumed by the reaction(s) in these two runs, respectively. This

103result might indicate that the second nickel complex. Ni
^^^3)2^^' was responsible for the observed co-precipitation of nickel and its hydroxide.Run #26
This run was made in an effort to minimize the formation of nickel hydroxide by reducing the input nickel concentration to the reactor. The feed tank concentrations of
nickel and iron were limited in this run to 3.1 gr Ni"*”*" ions
and 0.5 gr Fe’*"'*' ions per liter. The molar ratio of NH^ to Ni ions at the reactor inlet was about 4.0. The hydrogen input was six times the stoichiometric rate. The reactor average temperature and pressure were 114°C (237°F) and 634 Kpa (92 psia) respectively. The nickel solution was fed at a rate of 70 cc/min while the ammonium hydroxide solution was
pumped to the reactor entrance at a rate of 10 cc/min, making the total liquid residence time about 5 minutes. The duration of the run was two hours.
The steady state conversion of Ni'*”*' ions and the pH
of the spent solution were 95 percent and 9.3 respectively.The solid product collected was again gray-to-black in color
and magnetic, very similar to that of runs #21 and 25. An x-ray analysis of the product of this run was made and shown in Table VI-5. From Table VI-5, x-ray diffraction (XRD) examination of the solid product revealed that its metallic nickel content was about 22 w t % , while its total nickel content (metal and nickel in salts) was about 87 wt% as

104
TABLE VI-5 RUN #26. SOLID PRODUCT ANALYSIS*
Element Weight Percent(wt%)
Metallic nickel (Ni) 22. (XRD)Total nickel (incl. salts) 87.72 (EDX)Iron (Fe) 9.97 (EDX)
Sulfur (S) 1.47 (EDX)Aluminum (Al) 0.65 (EDX)
*Solid sample was examined with x-ray diffraction spectrometry (XRD) and x-ray energy dispersive spectrometry (EDX). Analysis was made by Target Reservoir Analysis, Inc, of Oklahoma City, Oklahoma.
determined by x-ray energy dispersive spectrometry (EDX).
The EDX analysis did not reveal the nature (oxide, sulfate,
etc.) of the precipitated salts. It could only be inferred based on the analysis of run #21 (Table VI-4) that nickel hydroxide was also part of the solid product of this run (#26) Overall material balances on both ammonia and nickel were made and the molar ratio of ammonia to nickel consumed by the reaction(s) was about 2.5 despite the drop in the inlet concentration to as low as 3.1 gr Ni^^/liter. This result confirmed the earlier finding that beyond an initial molar
ratio of ammonia to nickel at the reactor entrance of two, the number of moles of ammonia per mole of nickel consumed in
the reactor was between 2 to 2.5.

105Since the formation of nickel hydroxide was only
observed when the reactor was operated with low total pressure, and despite the unsuccessful efforts made in the above runs to control its formation, it was decided to carry out
the remainder of the work under a nominal pressure of 3480 Kpa (505 psia) under which condition the precipitation of nickel hydroxide had not been observed.Runs #27, 28 and 29
These runs were made to obtain conversion values when
the molar ratio of NH^ to Ni^^ ions at the reactor inlet was less than about 2.5— the value used in run #9. The values of this ratio studied in these three runs were 0.6, 1.2 and 1.5, respectively. All three runs were made with fresh feed
solution with nickel and iron (catalyst) concentrations of9.8 and 1.0 gr/liter respectively in the feed tank. The liquid residence time in the reactor was 5 minutes in each run. The average reactor temperature and total pressure
were about 113°C (235°F) and 3479 Kpa (505 psia). The hydro
gen feed rate was three times the stoichiometric rate.Run #27 was made for a total of 100 minutes before
termination due to liquid level fluctuation. The steady state conversion and pH of the spent solution are shown in Figure VI-15. The reactor was inspected and found to be free
of any scale formation. The product obtained was heavily contaminated with green salts which were mixed with gray-to-
black nickel mud.
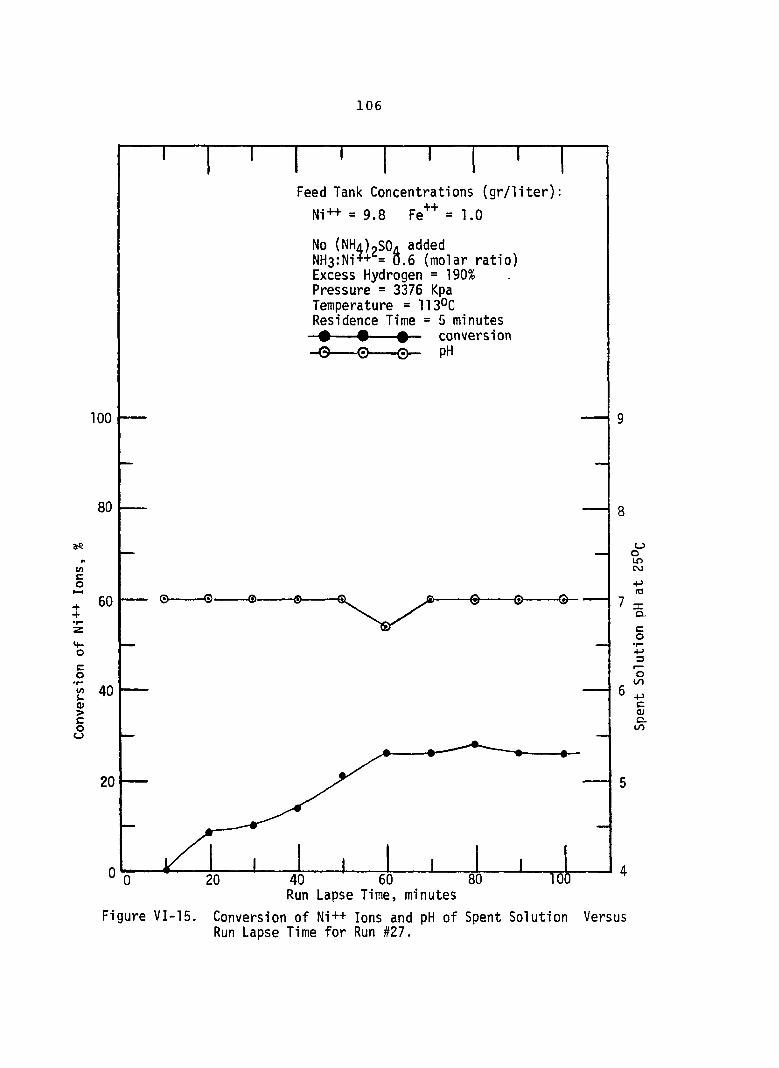
106
1/)co
M-O0U01 > c o o
Feed Tank Concentrations (gr/liter):
No (NHaiySO,NH3:Ni?+ = 0.Excess Hydrogen = 190% Pressure = 3376 Kpa Temperature = 113°C Residence Time = 5 minutes - # -- # - - - # — conversion
added6 (molar ratio)
100
80
60
40
20
0 100Run Lapse Time, minutes
OcI f )CM4-)fOQ.Co4->3OCOcQJC-co
Figure VI-15. Conversion o f Ni++ Ions and pH o f Spent S o lu t io nRun Lapse Time f o r Run #27.
Versus

107Run #28 was terminated after 100 minutes due to shor
tage of feed. The results, conversion and pH, are presented in Figure VI-16. Again, the reactor walls were free of any hard scaling and the solid product collected was a mixture of green and gray mud.
Run #29 was terminated after only 85 minutes because it was believed that a steady state had been reached, judging
from the clear color of the spent solution. The steady state conversion was about 75 percent while the pH of the spent solution was 5, a little lower than that of run #28 (6.4). The
results of this run are shown in Figure VI-17. The solid product obtained was slightly green in color, presumably due to the post-run washing of the reactor.Runs #30, 31 and 32
The runs were made to investigate further the effect
of increasing the molar ratio of NH^ to Ni*^ ions at the re
actor inlet on the final conversion of Ni^^ ions to products. The corresponding molar ratio of NH^ to Ni** ions for these runs were 2.9, 3.75 and 6. In order to examine the effect of increasing the ammonia to Ni** ion molar ratio on the product, the catalyst (ferrous sulfate) concentration was limited to 0.4 gr Fe**/liter in each run. The average reactor tempera
ture and total pressure were about 120°C (250°F) and 3548 Kpa (515 psia) respectively. The feed tank nickel concentration was 8.2 gr Ni**/liter; it was pumped to the reactor at a rate of 70 cc/min. The ammonium hydroxide solution, on the other hand, was adjusted to the appropriate concentration to give
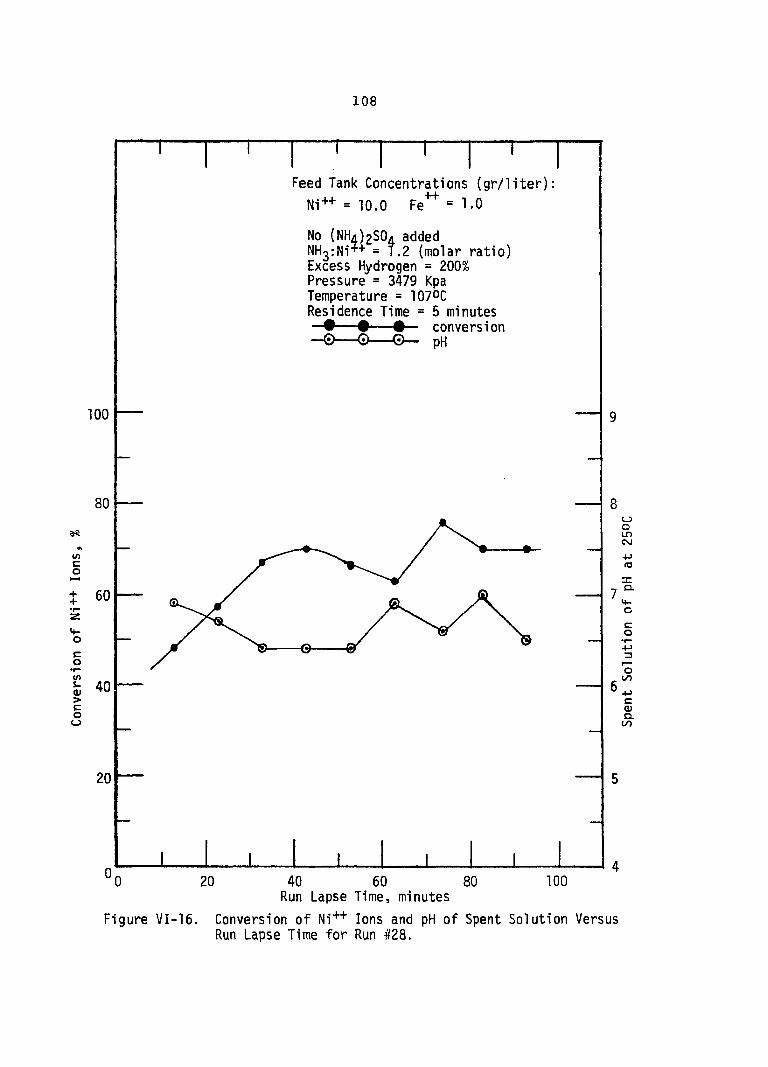
108
TOO
80
</>co++4-O
«/)i-01>cou
60
40
20
T TFeed Tank Concentrations (gr/liter)
Ni++ = 10.0 Fe*^^ = 1.0No (NHa)2S0A added NHg:Ni^+ = 7.2 (molar ratio) Excess Hydrogen = 200%Pressure = 3479 Kpa Temperature = 107°C Residence Time = 5 minutes
conversion pH
1 1 1
OOir>CV4
lEO.
Co3O00■*->cQ)Q-00
20 80 100
Figure VI-16.
40 60Run Lapse Time, minutesConversion o f Ni++ Ions and pH o f Spent S o lu t io n VersusRun Lapse Time f o r Run #28.

1 0 9
100
80as(/)co
60
co0 40OJ>Coo
20
Feed Tank Concentrations (gr/liter):Ni++ = 9.7 Fe++ 1.0
No (NH4)pS04 added NH3:Ni++ = 1 . 5 (molar ratio) Excess Hydrogen = 200% Pressure = 3479 Kpa Temperature = 1200C Residence Tiem = 5 minutes
conversion pH
1 1
OOIDCMrO
CO
o00+JcQ)C L00
20 80 100
Figure VI-17.
40 60Run Lapse Time, minutes
Conversion o f Ni++ Ions and pH o f Spent So lut ion VersusRun Lapse Time for Run #29.

1 1 0
the desired molar ratio at the reactor inlet; it was pumped
to the reactor at a rate of 10 cc/min. The hydrogen flow rate was about two and one half times the stoichiometric rate.
Run #30 was terminated after only 80 minutes at which time the hydrogen gas bubbles (as seen in the sight glass) were getting bigger; indicating a plugging condition in the
reactor. The reactor did reach a steady state however and the conversion of nickel ions was about 98.7 percent. By a
material balance on the ammonia and Ni^* ions, it was found that the molar ratio of ammonia to nickel consumed in the reactor was about 1.9 (final pH of spent solution was 9.1).The data from this run are shown in Figure VI-18. The re
actor was inspected and found to contain a slight buildup of black-nickel metal loosely adhering to the walls. The solid product collected in the liquid-solid separator was slightly contaminated with a green layer of nickel salts.
Run #31 was terminated after only 60 minutes due toa complete plating of nickel on the glsss windows of the
sight glass. This plating action had started about 40 minutes into the run. The plating progressed upward toward the
feed inlet-end of the sight glass; presumably due to thecarry over of fresh metallic nickel by hydrogen gas. The plating was shiny and silver in color. The final conversion of nickel and the spent solution pH were 99 percent and 9.8
respectively as shown in Figure VI-19. Upon inspection of

Ill
(/>coÎ
co(/)u0)3>coo
Feed Tank Concentrations (gr/liter): Ni++ = 8.2 Fe++ = 0.4No (NHa)2S04 added NH3*,Ni^+ = 2.9 (molar ratio Excess Hydrogen = 250% Pressure = 3562 Kpa Temperature = 1230c Residence Time = 5 minutes — # — # — # — conversion
100
80
60
40
20
01008060400 20
12
11
10
OoI f )CM• p«3D.Co-p3'o(/)-Pc(UCL(/I
Run Lapse Time, minutesFigure VI-18. Conversion o f N1++ Ions and pH o f Spent S o lu t io n Versus
Run Lapse Time f o r Run #30.
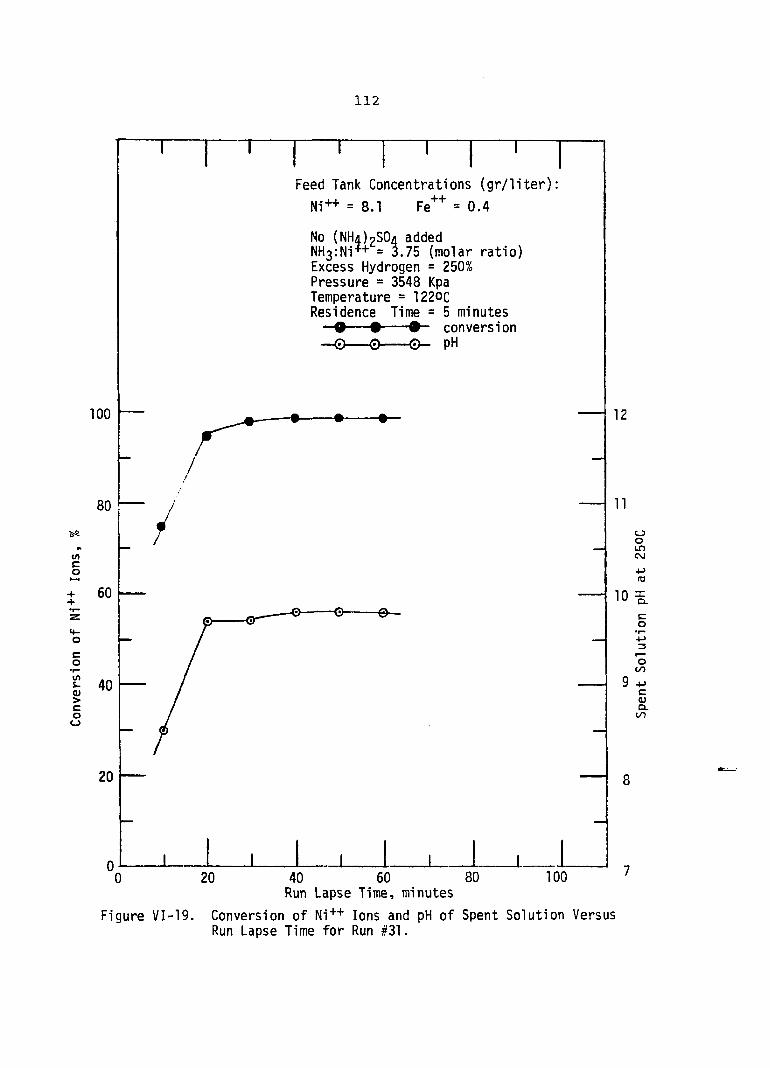
112
Co++4-ocot/>s.Q)>Coo
Feed Tank Concentrations (gr/liter): Ni++ = 8.1 Fe** = 0.4
added75 (molar ratio) Excess Hydrogen = 250% Pressure = 3548 Kpa Temperature = 122oc Residence Time = 5 minutes—Q- - - # -- # - conversion— © - - - 0 -- 0 - pH
100
80
60
40
20
0 80 10020 40 600
12
11
OoLf)C\J-Pro
10co
o00ceuCL00
Figure VI-19.
Run Lapse Time, minutesConversion o f Ni++ Ions and pH o f Spent S o lu t i on VersusRun Lapse Time for Run #31.

113the reactor walls, it was found that very little buildup of product adhered to walls, but there was no metallic plating at all. The solid product collected during the
run was gray-to-black in color with few flakes of nickel salts. Its weight— after drying at 107°C for 24 hours—
was 33.6 grams. An x-ray analysis of the product revealed that it contains about 88 wt% metallic nickel as determined by XRD while its total nickel content (metal and nickel salts) is about 92 wt% as determined by EDX. Table VI-6 shows the results of the analysis. It is interesting to note here that by an overall material balance, it was found that about 1.85
moles of NH^ per mole nickel ions were consumed in the reactor.
Run #32 was terminated, again, due to the plating
action of the sight glass that had taken place about 35 minutes into the run. The hydrogen was cutoff at the end of 80
minutes of operation. The conversion and the pH as a function of run lapse time are shown in Figure VI-20.
Upon inspection of the reactor it was found that a hard film of black metallic nickel had formed on the inside
walls of the reactor. This film was removable only with a steel brush. The product accumulated in the liquid-solid separator was paractically free of any nickel salts and very similar to the product obtained in run #31. Also, it was
found that about 2.3 moles of ammonia per mole of nickel ions were consumed in the reactor by an overall material
balance.

114
TABLE VI-6 RUN #31. SOLID PRODUCT ANALYSIS*
Element or Molecular Species
Weight Percent (wt%)
Method Used For
Determination
JalMetallic nickel (Ni) 88.4 XRD
Nickel Hydroxide [Ni (OH) 2]
3.0 XRD
Hematite (Fe^Og) 8.6
(b)
XRF
Total nickel (incl •salts) 92.46 EDX
Iron (Fe) 5.61 EDX
Sulfur (S) 1.07 EDX
Aluminum (Al) 0.75 EDXSilicon (Si) 0.11 EDX
Analysis made by;(a) Spectrochem Laboratories, Oklahoma City, Oklahoma.(b) Target Reservoir Analysis, Inc., Oklahoma City,
Oklahoma.
*Solid sample was analyzed with x-r.ay diffraction spectrometry (XRD) , x-fay fluorscence spectrometry (XRF), and x-ray energy dispersive spectrometry (EDX).
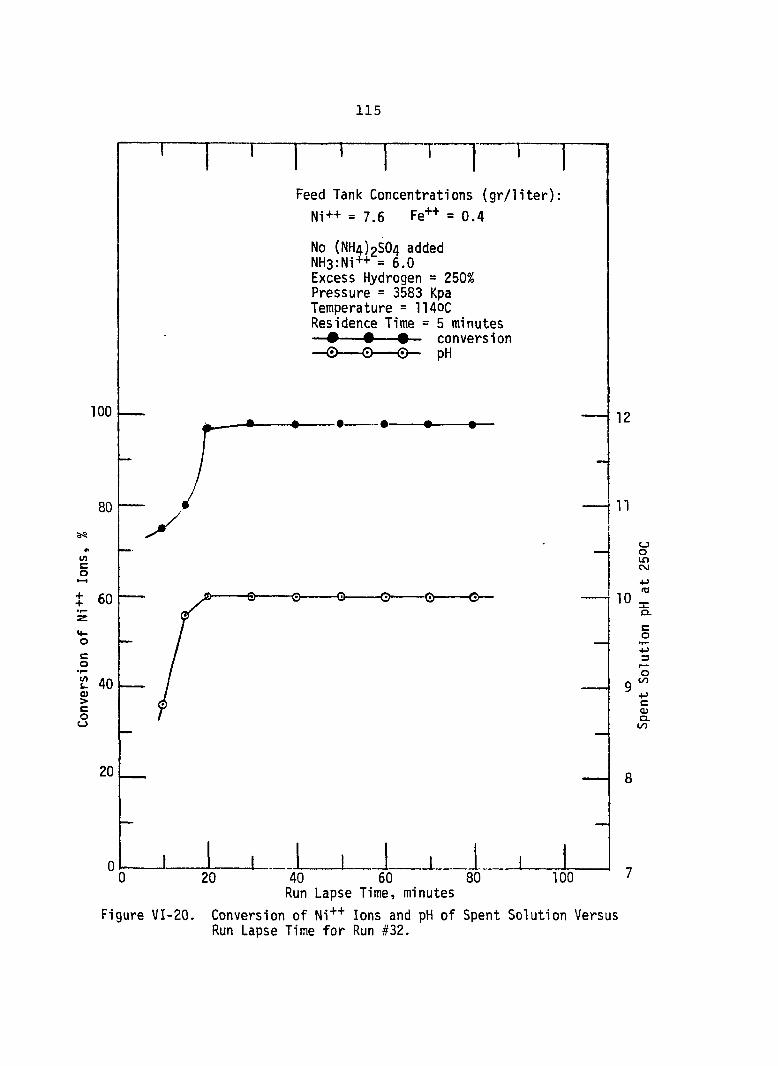
115
100
80
toco++ 60
t 40 §: c o o
20
T T TFeed Tank Concentrations (gr/liter):
Ni++ = 7.6 Fe++ = 0.4No (NH4)2SÛ4 added NH3:Ni++ = 6.0 Excess Hydrogen = 250%Pressure = 3583 Kpa Temperature = 1140C Residence Time = 5 minutes conversion
pH
12
11
10
OOmCM<tjJZCL
co
o•pca;CL
20 1. i ,80 1100
Figure VI-20.
40 60Run Lapse Time, minutesConversion o f Ni++ Ions and pH o f Spent S o lu t io n VersusRun Lapse Time f o r Run #32.

116It was evident from runs #27 through 32 that nickel
conversion increased with increasing the molar ratio of ammonia to nickel until about 3, beyond which value the conversion leveled off at about 99 percent. Thus for complete
nickel conversion a molar ratio of ammonia to nickel greater
than or equal to 3 was needed. Even with a nickel conversion of 99 percent (run #31) the solid product did contain about
3.0 wt% nickel hydroxide which suggested that higher operating temperature than 120°C (250°!^ was needed for better product yield. Higher temperatures would increase the reduction rate, but the rate of nickel hydrolysis would also increase. Therefore in order to suppress the formation of nickel hydroxide a buffering agent such as ammonium sulfate might be required.Runs #33 and 34
The objective of these runs was to examine the effect
of excess hydrogen input on the final conversion of nickel ions to product. The hydrogen input in these runs was limited to about 25 percent excess over the stoichiometric rate. It
was also intended, in these runs, to minimize the plating of
the sight glass observed in runs #31 and 32 by decreasing the hydrogen feed rate.
Both runs were made with a liquid residence time of
5 minutes. The feed tank concentrations of nickel and ferrous ions were 8.3 and 0.5 gr/liter respectively. The reactor
average temperature was 112°C (234°F) while its total pressure
was about 3583 Kpa (520 psia).

117
The molar ratio of ammonia to nickel ions at the
reactor inlet was 3.75 for run #33. Its duration was 80 minutes during which no sign of plating on the sight glass was observed. The steady state conversion and pH of spent solution were 91.5 percent and 9.8 respectively as shown in Figure VI-21.
By an overall material balance, it was found that 2.2 moles of NHj per mole of Ni"*"*" ion had reacted.
Upon inspection of the reactor, there was no sign of
scaling or plating of nickel on the walls. All of the solid product was found in the liquid-solid separator and it was
heavily contaminated with nickel salts. An x-ray analysis of the oven-dried product revealed a metallic content of about
60 percent by weight as shown in Table VI-7.In run #34 the initial molar ratio of ammonia to nickel
ions was decreased to about 2.4. The run was made for 150 min
utes before termination due to shortage of feed. The final
nickel conversion and spent solution pH were 86.5 percent and9.3 respectively. The reactor was again free of any plating
or scaling and the solid product was heavily contaminated with
nickel salts. The results of the run are shown in Figure VI-22. From Figures VI-19 and VI-21 it can be seen that there was
about 10 percent drop in conversion as a result of limiting
the excess input of hydrogen to about 25 percent. It was
decided, based on this comparison, that the remainder of the
program would be carried out with only 25 percent excess hydrogen input.

118
100
80
10co60
{«0co(_>
20
T
Feed Tank Concentrations (gr/liter) Ni++ = 8.5 Fe++ = 0.5No (NH4)2S04 added NH3:Ni++ = 3.75 (molar ratio) Excess Hydrogen = 25%Pressure = 3548 Kpa Temperature = 118°C Residence Time = 5 minutes — • — # — # — conversion — €)— © -- © — pH
201
80
12
11OOLOCSJ
10 3:Q .
CO
O(/)4-)CQ)Q.
100
Figure VI-21.
40 60Run Lapse Time, minutes
Conversion o f Ni++ Ions and pH o f Spent Solu t i on VersusRun Lapse Time fo r Run #33.

119
TABLE VI -7 RUN #33. SOLID PRODUCT ANALYSIS*
Element or Molecular Species
Weight Percent (wt%)
Method Used For
Determination
(a)Nickel (Ni) 60.0 XRDNickel Hydroxide
(Ni (OH) 2 ]31.9 XRD
Hematite (FOgOg) 8.1
(b)
XRF
Total Nickel (incl. salts) 93.05 EDXIron (Fe) 5.69 EDX
Sulfur (S) 1.11 EDX
Aluminum (Al) 0.34 EDX
Analysis was made by ;
(a) Spectrochem Laboratories, Oklahoma City,Oklahoma.(b) Target Reservoir Analysis, Inc., Oklahoma City,
Oklahoma.
*Solid product was analyzed with x-ray fluorscence spectrometry (XRF) , x-ray diffraction spectrometry (XRD) and x-ray energy dispersive spectrometry (EDX).

1 2 0
Feed Tank Concentrations (gr/liter):N i + + = G Q = n K
No (NH4)2S04 added NH3:Ni*+ = 2.4 (molar ratio) Excess Hydrogen = 25% Pressure = 3583 Kpa Temperature = 1120[Residence Time = 5 minutes — # — -# ■# conversion
100
15090 110Run Lapse Time, minutes
130
12
11
10
OI f )CSJ
4-)ns3:Q.Co
oooco.t/5
Figure VI-22. Conversion o f Ni++ Ions and pH o f Spent S o lu t i on VersusRun Lapse Time f o r Run #34.
1 2 1
Runs #35, 36, 37, 38 and 39These runs were made to study the effect of tempera
ture on the final conversion and the quality of the product
precipitated. The range of temperature studied was between 79.5°C (175°F) to 163°C (325°F). Each run was made with a
liquid residence time in the reactor of 5 minutes. The molar
ratio of NH^ to Ni"*" ions at the reactor entrance was about
4.0. The concentrations of nickel and ferrous ions in the feed solution were 8.5 and 0.5 gr/liter, respectively. The hydrogen input was about 25 percent in excess of the stoichiometric rate and the total reactor pressure was 3583 Kpa (520 psia).
The average reactor temperature in run #35 was about 79.5°C (175°F). The run was terminated after 120 minutes of
operation and the steady state conversion of Ni^^ ions was55.8 percent. After the end of the run the reactor was found
to be free of any scaling and the product collected in the
liquid-solid separator was heavily contaminated with green
nickel salts. The product was washed with distilled water and was dried for 24 hours at 107°C. An x-ray analysis of
this product was made and the results are shown in Table VI-8.
The total weight of the dry product was 45.5 grams. From
Table VI-8, it can be seen that the metallic nickel content of the product was about 23 wt% as determined by x-ray
diffraction (XRD) while its total nickel content (metal and nickel in salts) was about 92 wt% as determined by x-ray
energy dispersive spectrometry (EDX).

122 TABLE V I - 8
RUN #35. SOLID PRODUCT ANALYSIS*
Element Weight Percent (wt%)
Metallic nickelTotal nickel (incl.IronSulfurAluminum
salts)23.0 (XRD) 9 2.15 (EDX) 6.70 (EDX) 0.79 (EDX) 0.36 (EDX)
*Solid product was analyzed with x-ray diffraction (XRD) and x-ray energy dispersive spectrometry (EDX) Analysis was made by Target Reservoir Analysis, Inc. of Oklahoma City, Oklahoma.
In run #36 the average reactor temperature was about 99°C (210°F). The run was made for about 150 minutes before
termination due to fluctuation in the reactor liquid level
and the formation of large gas bubbles. The steady state conversion of Ni^^ ions was about 77.2 percent. Figure VI-23
summarizes the results of run #35 and 36. The reactor was inspected and found to be free of any hard scaling on the walls.
The product was not analyzed for its metallic nickel content.In run #37, the reactor temperature was raised to
an average of 149°C (300°F). Its duration was 120 minutes at
which time the level started to fluctuate and the hydrogen gas was cutoff. The steady state conversion was 88 percent
which represents about a 4 percent decrease from that of
run #33 (118°C). It was decided to repeat run #37 and double

123
Feed Tank Concentrations (gr/liter):.++ - n K= 8.3-8.6
No (NHa)2S04 added NH3:Ni*+ = 4.0 (molar ratio) Excess Hydrogen = 25% Pressure = 3583 Kpa Residence time = 5 minutesRun # Temperature, QÇ Conversion
79.5
100
80
i/i
60o —
40
20
0 40 60 10080 120 140Run Lapse Time, minutes
Figure VI-23. Conversion o f Ni++ Ions Versus Run Lapse Time f o rRuns #35 and 35.
124
check this dip in conversion in run #38 where the average reactor temperature was 151.7°C (305°F). All other operating conditions were the same as for run #37.
Run #38 was made for 125 minutes and was terminated without any serious level fluctuation; the final conversion was 95.7 percent. The results of both runs (#37 and 38) are presented in Figure VI-24. Note that run #38 was made with
a thoroughly cleansed reactor and no scaling was observed
at the end of the run. The weight of the dry product collected in the run was 89.5 grams. No analysis for its metallic contents was made however.
*The average reactor temperature for run #39 was 163°C
(325°F). The run was made for a total of 120 minutes with no
sign of any reactor plugging. The steady state conversion of Ni^^ ions was 97.5 percent. The reactor walls were in
spected and found to be free of any hard scaling or metallic plating. The solid product collected in the liquid-solid
separator was slightly mixed with greenish salts. The product was washed with distilled water and oven dried for 24 hours at 107°C. The weight of the dry product was 81 grams and its
x-ray analysis (see Table VI-9) showed about 75 percent by
weight metallic nickel content. The results of this run are shown in Figure VI-25.
The results of runs #35 through 39 indicated that
there was no appreciable change in nickel conversion with temperature beyond 120°C (200°F). However the metallic

125
Feed Tank Concentrations (gr/liter):NÎ++ ++
No (NH4)2S0, added NH3:Ni++ = ^ :Excess Hydrogen = 25% Pressure = 3548-3583 Kpa Temperature = 1490Q Residence Time = 5 minutesRun # Conversion
I* auueu4.0 (molar ratio)
100
o —
Co
M-Oco(/)s.a>>cou
12080 100 Run Lapse Time, minutesFigure VI-24. Conversion o f Ni++ Ions Versus Run Lapse Time fo r
Runs #37 and 38.

126
TABLE VI-9 RUN #39. SOLID PRODUCT ANALYSIS*
Molecular Species Weight Percent(wt%)
Nickel (Ni) 75Nickel Hydroxide [Ni(OH)-] 15.8Hematite (FegO^) 9.2
*Solid product was analyzed with x-ray fluorescence spectrometry (XRF) and x-ray diffraction spectrometry (XRD). Analysis was made by Spectrochem Laboratories of Oklahoma City, Oklahoma.
nickel content of the product increased from about 23 wt% at 79°C (run #35) to 75 wt% at 163°C (run #39) indicating that
the rate of reduction to metallic nickel increased with increasing temperature.Runs #40 and 41
The objective of these runs was to obtain conversion of Ni^^ ions at different liquid residence times when the average reactor temperature and total pressure were 120°C (250°F) and 3548 Kpa (515 psia) respectively. Since the con
version with a residence time of 5.0 minutes was known (91.5 percent— run #33), it was decided to obtain conversion data at two other residence times; namely 2.5 (run #40) and 1.25 minutes (nm #41). In both runs the hydrogen input was about 25 percent in excess of the stoichiometric rate and the catalyst concentration in the feed tank was 0.5 gr Fe^^/liter.

127
Feed Tank Concentrations (gr/liter):M-Î++ = 8.57NO iNMajojUa aoaeo NHg:Nif+ = 4 . 2 (molar ratio) Excess Hydrogen = 25% Pressure = 3548 Kpa Temperature = 1630C Residence Time = 5 minutes - # -- # -- conversion
100
(/)coÎ <D—z«f-oco
120100Run Lapse Time, minutes
12
11
10
OoL f )C S J
«3
co
oC O
Q)Q.VI
Figure VI-25. Conversion o f Ni++ Ions and pH o f Spent S o lu t i on VersusRun Lapse Time f o r Run #39.
128
Furthermore the molar ratio of NH^ to Ni’*"*’ ions at the reactor inlet was about 3.5 and the feed rate of ammonium hydroxide solution was 20 cc/min in each run.
In run #40 the average reactor temperature was 114°C (236.5°F) at a total reactor pressure of 3479 Kpa (505 psia). The nickel solution (8.6 gr Ni^^/liter) feed rate was 140 cc/ min. The run was made for only 70 minutes due to shortage
of feed. The steady state conversion of Ni^^ ions was 91.8 percent as shown in Figure VI-26. It was also found that
about 2.3 moles of ammonia per mole of nickel were consumed in the reactor. After the end of the run the reactor was
found to be free of any hard scaling; the precipitated product was contaminated with nickel salts.
Run #41 was made under about the same conditions of temperature and pressure as run #40: the average reactor
temperature was 119°C (247°F) and its total pressure was
3410 Kpa (495 psia). The nickel feed solution (7.6 gr Ni^^/
liter) was pumped to reactor pressure at a rate of 300 cc/min. The run was terminated after only 75 minutes of operation due
to the discharge of fine nickel particles from the sampling valve (port #7). Recall that the same observation was also
made in run #3. It seemed that these fine nickel particles did not have enough residence time to grow, thus escaping the inner filter bags of the liquid-solid separator as well
as the micro-filtering elements of the sampling valve.

129
The steady state conversion in run #41 was about 83 percent as shown in Figure VI-26 which represented a drop of less that 10 percent from the value reported in run #33 (residence time of 5 minutes). The most striking observation
made in this run (#41) was that the reactor walls were plated
uniformly with silvery-metallic nickel, a condition which was
not noticed in run #3 despite its higher temperature of 174°C (345°F). The solid product collected in run #41 was washed and oven dried for 24 hours. Its total dry weight was 87
grams. Table VI-10 shows the result of x-ray diffraction (XRD) and x-ray fluorescence analysis (XRF) for the products
of run #40 and 41. The results shown in Table VI-10 indicated
a drop of about 15 wt% in metallic nickel content due to a change of liquid residence time from 5 to 1.25 minutes.
TABLE VI-10 RUNS #40 and #41. SOLID PRODUCT ANALYSIS*
Run # Nickel(Ni)
Nickel Hydroxide [Ni(OH)2]
Hematite(F6203)
40 67.7 22.0 10.341 52.2 33.0 14.8
♦Solid(XRD)
samples were anlayzed with x-ray diffraction and x-ray fluorescence (XRF). Analysis was made
by Spectrochem Laboratories of Oklahoma City, Oklahoma. Values are in weight percent (wt%).

130
Feed Tank Concentrations (gr/liter): Ni++ = 7.6-8.6 ++
No (NH4)2S04 added NH3:Ni++ = 3.5 (molar ratio)Excess Hydrogen = 25%Pressure = 3410=3479 Kpa Temperature = 114-119.500Run # Residence Time Conversion
1.25 min.
100
-o
incoÎ
coinUQ)>Coo
100Run Lapse Time, minutes
Figure VI-25. Conversion o f Ni++ Ions Versus Run Lapse Time forRuns #40 and 41.
131Run #42
The purpose of this run was to repeat run #41 but with a lower nickel feed concentration and to examine the
extent of reactor plating, if any. Prior to the run the
reactor was brushed with a steel brush and thoroughly cleansed
with dilute solution of nitric acid to dissolve any metallic nickel on the walls. The reactor was very clean.
The run was made with a 3.0 gr Ni /liter solution
and all other operating conditions were kept the same as in run #41. The duration of the run was again limited to about
70 minutes of operation before the sampling valve was plugged with very fine nickel particles. The final conversion of Ni^^
ions was about 96 percent.Upon inspection of the reactor after the end of the
run, it was found that only a few spots in the lower half section of the reactor were plated. The plating was in the
form of a foil sheet of metallic nickel removable only with
a steel brush.
Runs #43 and 44These runs were made to obtain the conversion of Ni"*"*"
ions at two different residence times, 2.5 and 1.25 minutes, at low reactor temperature 79.5°C (175°F). Both runs were
made with 25 percent excess hydrogen input and a catalyst concentration of 0.5 gr Fe^^/liter. The molar ratio of NH^
to Ni^^ ions at the reactor entrance was about 4.Run #43 was made with a nickel solution (6.7 gr Ni’’*’/
liter) pumped to a reactor pressure of 3548 Kpa (515 psia) at

132
a rate of 140 cc/min. The ammonium hydroxide solution was pumped at a rate of 20 cc/min. The run was made for only 50 minutes of operation due to the plugging of the sampling valve by very fine nickel particles. The final conversion
was 51 percent compared to 55.8 percent (run #35) when the
liquid residence time was about 5 minutes. The solid product
was a mixture of green salts and black nickel mud very similar
in color to that of run #35. The dry weight of the product was 31.5 grams. The reactor was free of any plating.
In run #44 the nickel feed solution (7.5 gr Ni^^/ liter) was pumped at a rate of 300 cc/min while the ammonium
hydroxide solution at 20 cc/min. The reactor total pressure was3617 Kpa (525 psia). The run was made for only 70 minutes
due to the high consumption rate of feed solution. The
sampling valve was not plugged and there was not any sign
of discharge of solids through it during this period. As shown in Figure VI-27 the steady state conversion of Ni^^ ions was about 44 percent. The solid product was again mixed
heavily with green nickel salts and its dry weight was 98.1
grams. This product was x-ray analyzed and found to contain about 9 percent by weight metallic nickel as determined by
x-ray diffraction (XRD) while its total nickel content (metal
and nickel in salts) was about 87 wt% as detected by x-ray
energy dispersive spectrometry (EDX). The results of this analysis are shown in Table VI-11. It was also interesting to find that about 2.4 moles of NH^ per mole of Ni'*’ ions were
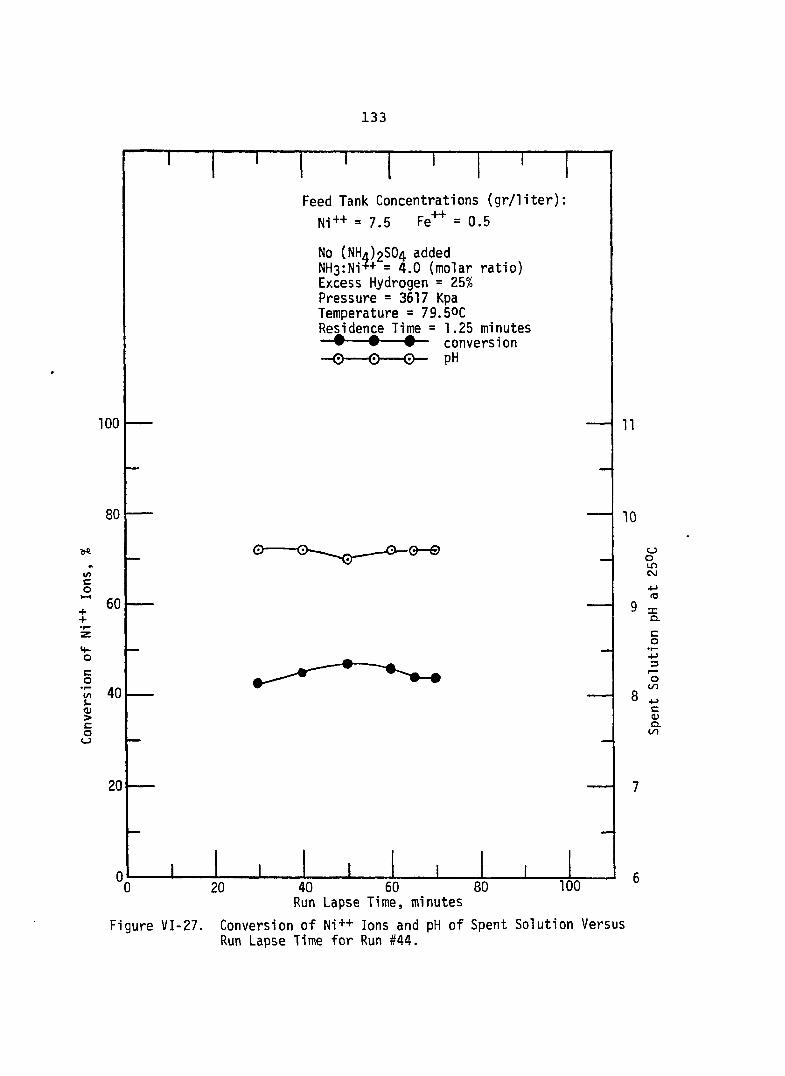
133
Feed Tank Concentrations (gr/liter): Ni++ = 7.5 Fe++ = 0.5No (NHa)2S04 added NH3:Ni?+ = 4.0 (molar ratio) Excess Hydrogen = 25%Pressure = 3617 Kpa Temperature = 79.50C Residence Time = 1.25 minutes — • -- • -- # — conversion
100
++
Coi/iS.coo
100Run Lapse Time, minutes
11
10
OOmC\j
co■M3'oLn4->CcuQ.in
Figure VI-27. Conversion o f Ni++ Ions and pH o f Spent S o lu t io n VersusRun Lapse Time f o r Run #44.

134
consumed in the reactor despite its low temperature, (79.5°c) Moreover, after the run, the reactor was inspected and found to be free of scaling or metallic plating.
TABLE VI-11 RUN #44. SOLID PRODUCT ANALYSIS*
Element Weight Percent(wt%)
Metallic nickel 9.0 (XRD)Total nickel (incl. salts) 87.06 (EDX)Iron 11.02 (EDX)Sulfur 1.34 (EDX)Alumium 0.58 (EDX)
*Solid sample was analyzed with x-ray diffraction (XRD) and x-ray energy dispersive spectrometry (EDX). Analysis was made by Target Reservoir Analysis, Inc. of Oklahoma City.
Runs #45 and 46
These runs were made to obtain conversion data at
two different residence times: 5.0 and 1.7 minutes at reactortemperature of 190°C (380°F). Both runs were made with fresh
feed solutions and the concentrations of Ni^^ and Fe*^ ions
were 8.0 and 0.4 gr/liter, respectively. The molar ratio of +4*NHg to Ni at the reactor inlet was about 4.0, and the
hydrogen feed was about 50 percent in excess of the stoichio
metric rate. The reactor total pressure was 3583 (520 psia). Both runs had to be terminated after only 65 minutes of operation due to reactor plugging with product.
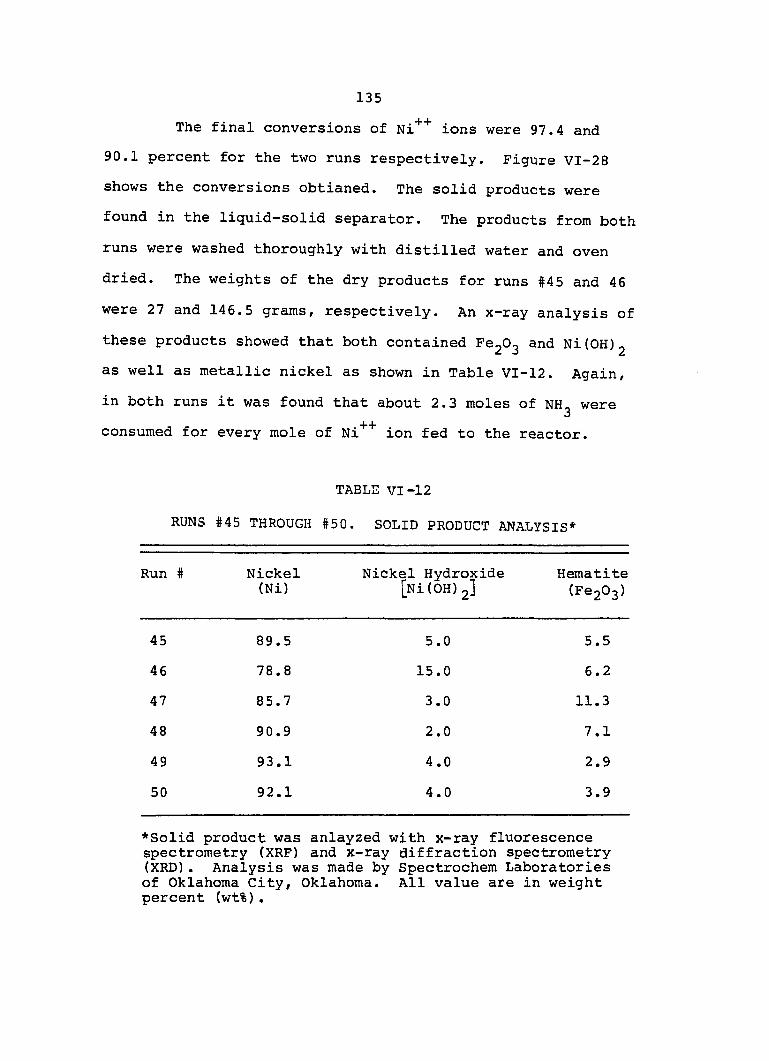
135. + + .The final conversions of Ni ions were 97.4 and
90.1 percent for the two runs respectively. Figure VI-28 shows the conversions obtianed. The solid products were found in the liquid-solid separator. The products from both
runs were washed thoroughly with distilled water and oven dried. The weights of the dry products for runs #45 and 46
were 27 and 146.5 grams, respectively. An x-ray analysis of
these products showed that both contained FegO^ and N i (OH)g as well as metallic nickel as shown in Table VI-12. Again,
in both runs it was found that about 2.3 moles of NH^ were consumed for every mole of Ni^* ion fed to the reactor.
TABLE VI-12
RUNS #45 THROUGH #50. SOLID PRODUCT ANALYSIS*
Run # Nickel(Ni)
Nickel Hydroxide [Ni (OH) 2]
Hematite(FegOg)
45 89.5 5.0 5.5
46 78.8 15.0 6.247 85.7 3.0 11.348 90.9 2.0 7.1
49 93.1 4.0 2.950 92.1 4.0 3.9
*Solid product was anlayzed with x-ray fluorescence spectrometry (XRF) and x-ray diffraction spectrometry (XRD). Analysis was made by Spectrochem Laboratories of Oklahoma City, Oklahoma. All value are in weight percent (wt%).

136
100
80
l/lco
î 60
I 40â!coo
20
45464748
TFeed Tank Concentrations (gr/liter):
Ni ++ - 7.5-11.0 Fe++ 0.4-0.8(NH4)2S04:Ni++ = 2.4 (molar ratio)
(Runs #47 and 48 only) NH3:Ni++ = 4.0 (molar ratio)Excess Hydrogen = 50%Pressure = 3459-3583 Kpa
Run # Residence Time5 min. 1.7 min. 5.0 min. 2.5 min.
Temperature190OC190OC1630C1630C
Conversion- O o -
.A-
120 80 100
Figure VI-28.
40 60Run Lapse Time, minutes
Conversion o f Ni++ Ions Versus Run Lapse Time forRuns #45, 46, 47 and 48.

137
Run #47 and 48
The objective of these two runs was to examine the effect of addition of ammonium sulfate to the feed on the
final conversion of Ni"*" ions and the purity level of the
product. Brunsell (6) reported conversions of 66 and 55
percent at residence times of 5.0 and 2.5 minutes, respectively. Therefore, it was intended in runs #47 and 48 to reproduce Brunsell's results and examine further the effect
of (NH^jgSO^ addition.In run #47, the average reactor temperature and total
operating pressure were 163°C (325°F) and 3459 Kpa (502 psia),
respectively. The concentrations of Ni "*" and Fe"*"* ions in the feed tank were 7.5 and 0.8 gr/liter. The molar ratio
of (NH^ÏgSO^ to Ni^* ion in the feed take was about 2.4,
while the molar ratio of NH^ to Ni"*"*" ions at the reactor inlet was about 4.0. The liquid residence time in the reactor
was 5 minutes. The hydrogen feed was about 50 percent in excess of the stoichiometric rate. The total duration of the
run was 90 minutes. It was terminated due to reactor plugging
with solid product accumulated in the reactor. However, there was no plugging in the feed preheater. The conversion of Ni "*” ions was 70.5 percent as shown in Figure VI-28.
Upon inspection of the reactor, it was found that all nickel product remained in the reactor. The walls of the reactor were also coated uniformly with a layer of the product. A steel brush was used to remove this layer. After
being washed with water and allowed to dry overnight, the
138
reactor walls were further brushed, and the walls seemed to be free of any plating. The product collected during the
brushing and washing procedure was further washed over a filter paper (in a cone arrangement) with distilled water and then
oven dried. The total weight of the dry product was 19 grams. An x-ray analysis of this product showed that about 85 percent
of nickel was in the form of metallic nickel. The results
of this analysis are shown in Table VI-12.
The operating conditions of run #48 were about the same as in run #47 except the feed tank concentration of Ni^^ and Fe^^ ions were 11.0 and 0.5 gr/liter and the liquid
residence time in the reactor was 2.5 minutes. Again the run duration was 90 minutes before the reactor liquid level
started to fluctuate considerably. The steady state conversion of Ni"*”* ions was 59 percent as shown in Figure VI-28.
As was the case of run #47, the product remained in the
reactor and loosely adhered to the walls. The collected
product was washed thoroughly and oven dried. Its total dry
weight was 60 grams. An x-ray analysis of the product re
vealed that about 91 percent was in metallic form, about 2
percent N i (OH)g and 7.1 percent FegOg as shown in Table VI-12. Runs #49 and 50
These runs were made to examine further the effect
fo (NH^)2S0^ addition on conversion and product quality. It was reported by Brunsell (6) and Plumb (32) that essentially
complete conversion can be obtained when the reactor tempera
ture was about 204°C (400°F) and the liquid residence time

139
was 5 minutes. Run #49 was made to reproduce the results of
Brunsell and Plumb while run #50 was made with a residence time of 1.7 minutes to examine further the effect of residence time on conversion. Since runs #45 and 46 were made at 190°C
(380°F), it was felt that a comparison on the effect of
(NH^jgSO^ addition could be made if the present runs were also made at 190°C.
In run #49 the average reactor temperature and total pressure were 19 0°C (380°F) and 3583 Kpa (520 psia), respec
tively. The concentrations of Ni"*"*" and Fe’*”*’ ions in the feed tank were 7.5 and 0.4 gr/liter, respectively. The molar ratio of (NH^igSO^ to Ni'* ’*’ ions in the feed tank was about 2.7 while
the molar ratio of NH^ to Ni'*”*’ at the reactor inlet was 4.0.
The hydrogen feed was about 50 percent in excess of the
stoichiometric rate. The run duration was 90 minutes before termination due to excessive buildup of product inside the reactor. The steady state conversion was 97.5 percent as
shown in Figure VI-29.All of the nickel product was, again, found adhering
to the reactor walls. The reactor was brushed and washed
several times and the collected product was further washed
and oven dried. Upon further inspection of the reactor walls,
it was observed that a few spots were heavily plated with metallic nickel which could not be removed with a steel brush. No attempt was made to dissolve these spots with acid. The dry product (25 grams) was analyzed by an x-ray and found
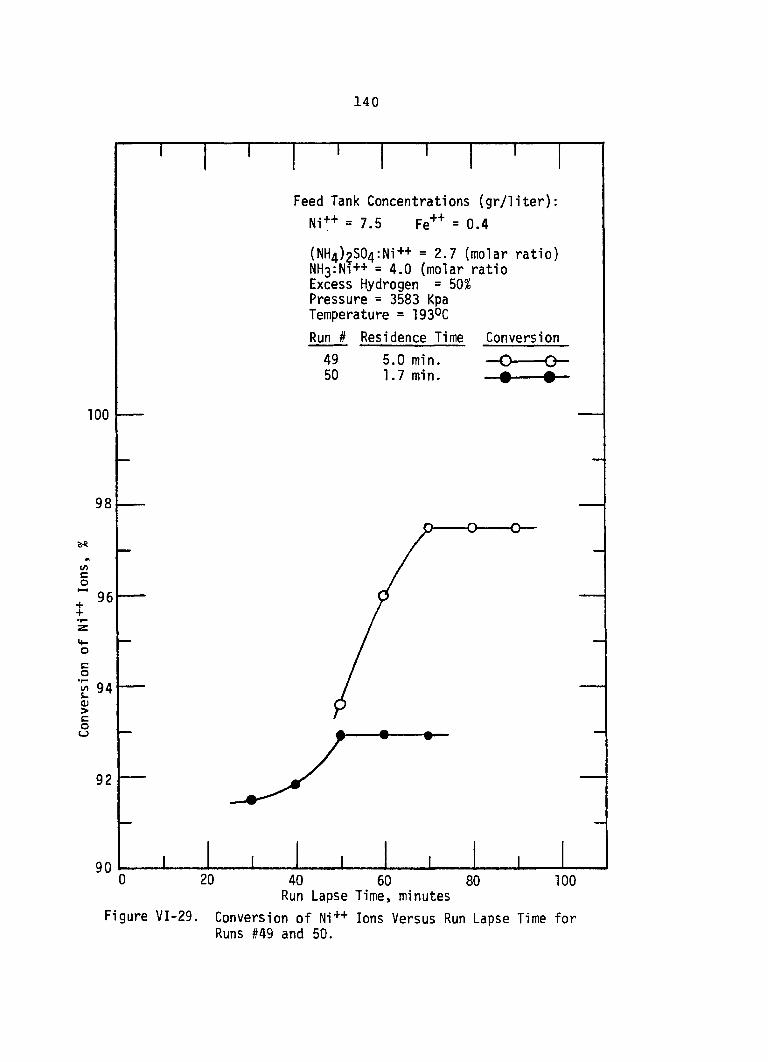
140
100
98
1/1coî
96
I 94OJ>cou
92
90
Feed Tank Concentrations (gr/liter): Ni++ = 7.5 Fe++ = 0.4(NH4)?S04;Ni++ = 2.7 (molar ratio) NH3:Ni++ = 4.0 (molar ratio Excess Hydrogen = 50%Pressure = 3583 Kpa Temperature = 193°C
Residence Time ConversionRun #4950
5.0 min. 1.7 min.
O —
1 10 20 80 10040 60
Run Lapse Time, minutesFigure VI-29. Conversion o f Ni++ Ions Versus Run Lapse Time f o r
Runs #49 and 50.
141to contain about 93 percent metallic nickel and about 4
percent N i (OH)g and 2.9 percent FegO^. The results of thisanalysis are shown in Table VI-12.
Run #50 was made under the same operating conditionsas run #49 except the residence time was 1.7 minutes. Therun was terminated after 70 minutes of operation due to
shortage of feed. The final conversion of Ni^^ ions was 93percent as shown in Figure VI-29. It was found in both of
these runs that about 2.3 moles of NH^ were consumed per +4*mole of Ni in the feed, which was also the case in runs
#45 and 46 when the feed was free of any (NH^igSO^.Most of the product of this run was also found in
the reactor adhering loosely to the walls; only a few spots of hard plating were observed. The collected product from the reactor was washed further with distilled water and
dried. The dry weight was 82 grams; it seemed to be much
finer than that of run #49. An x-ray analysis was made on
the product of run #50; it was found th be about the same
as for run #49 as shown in Table VI-12.

CHAPTER VII
METHOD OF DATA ANALYSIS
In this study the experimental results on the reduc
tion kinetics of ammoniacal nickel solutions by hydrogen in
a counter-current tubular reactor were correlated by an integral method of analysis. Since an explicit rate equation for the reduction reaction could not be deduced due to uncertainties regarding the reaction mechanism, a nth-order rate
equation was tested and it was found that a second order rate
equation gave the best fit for the limited data. The reactor was considered to be a plug flow by making the following simplifying assumptions;
1. The upward flow of hydrogen produced only minor backmixing in the downward flow of nickel solu
tion. All mixing effects produced by the hydrogen bubbles were assumed to be in the radial direction.
2. The presence of solid product in the liquid phase produced a limited backmixing due to
eddies of flow around the small crystals of the solid product. Thus, the longitudinal velocity
142
143
of a solid particle was assumed to be of the same magnitude as that of the liquid phase; i.e. no relative lifting action by the upward flow of hydrogen.
3. The mixing of nickel feed solution and the pretreatment solution of ammonium hydroxide was considered almost instantaneous in the radial direc
tion. Thus, no significant pH variations would be present in the radial direction beyond the
reactor entrance.With the above assumptions the general criteria for a plug flow reactor are met; i.e., there is no mixing of reactants in the direction of flow but complete mixing in the radial direction.
Consider a tubular plug flow reactor shown in Figure VII-1 where the composition of the fluid varies from point to point along its length; consequently, the material balance for a reaction component. A, must be made for a differential ele
ment of volume dV. Thus, if (moles/time) is the input of Component A and 4- dQ^ is the output of Component A to and
from the differential element dV, then at steady state the rate of disappearance of Component A must be equal to the difference between the input and the output of mass in the differential element dV. Hence,
(-r^) dV = - dQ^ (VII-1)

Distance through Reactor, ZFigure VII-1. Notation for Plug Flow Reactor.

145
where is the rate of reaction, 'of Component A. Moreover, if the fluid volume (V) is equal to the reactor volume (V^), then the equation (VII-1) can be separated as
dQadV„ = - 7— ^ = Adz (VII-2)R
Equation (VII-2) can be integrated if a known rate equation is at hand; otherwise the compositional change of component A along the length of the reactor should be differentiated first and tested against a hypothesized reaction mechanism. In case
of either limited data and/or uncertainties regardling the de
tails of the reaction mechanism, it is often assumed that alumped parameter rate expression which can only be a functionof temperature and composition would satisfactorily fit the observed data. Such a rate expression might take the form of an nth-order equation as
(-r^) = kC^ (VII-3)
where k is an Arrhenius temperature coefficient usually known
as the "rate constant," (time)"^ (mole/volume)^”^, and is the concentration of Component A (mole/volume) consumed in dV^. The rate constant k is defined by the well-known Arrhenius equation as
k = k^ exp (-E^/RT) (VII-4)
in which k^ is a frequency factor which is usually (but not always) a function of temperature (T) only, E^ is known as the activation energy in Kcal/mole, and R is the universal
146
gas constant in the appropriate units. When equation (VIl-3) is substituted in equation (VII-2) and the resulting equation is integrated for an assumed value of n and solved for k, the
value of n which gives the least variation in k along the reactor at a given temperature would then be taken as the "apparent" order of the reaction. Once the order of the reaction is secured, equation (VII-4) can then be used to ex
amine the possibility of change of order of the reaction with temperature as detected from the change of the value of the activation energy over the range of the experimental data.
Efforts were made in this study to collect nickel
conversion data along the direction of flow, but they were hampered by premature plugging of the sampling valves. Alternatively, it was decided to measure the nickel concentration in the effluent stream exiting the liquid-solid separa
tor fitted to the bottom section of the reactor. By means of varying the inlet volumetric flow rate, it was possible
to construct conversion versus residence time at two isothermal reactor temperatures. However, examination of the
data showed that the conversion of nickel to products was independent of the liquid residence time in the reactor.
This observation indicated that the reaction of nickel ions in the presence of hydrogen to products (metallic nickel plus nickel salts) was instantaneous as measured by the depletion of nickel ions from solution. Moreover, it was also observed
that there was a dependence of nickel conversion on the
147residence time whenever the feed was buffered with ammonium sulfate. Therefore, in order to correlate the reduction data of nickel on a common basis, it was necessary to evaluate the yield of metallic nickel in the product at different temperatures and residence times by means of an x-ray diffraction technique for determining the metallic nickel content in the solid product.
The overall reduction of nickel solution by hydrogen
in the presence of a catalyst, FeSO^, may be written as
NiSO^ + n NH4OH + Ni + (NH^igSO^ + { n - 2 ) m ^ (VII-5)
nickel-iron salts (VII-6)The simultaneous precipitation of metallic nickel, shown by
equation (VII-5), and the deposition of nickel salts, shown by reaction 6 , can be followed in terms of the conversion of nickel ions defined as
X. = ^ (VII-7)AO ‘ Ao
where and are the nickel concentrations at the inlet and outlet of the reactor. Similarly, the yield to metallic nickel, y^, can be defined in terms of metallic nickel concentration (C.,) based on the inlet concentration of nickel as:
y, = ^ (vii-8)^ ^Ao
But, since the concentration of metallic nickel cannot be

148measured directly, the purity of the product estimated by an x-ray diffraction spectrometer, is defined as
% - ^ (VII-9)
Combining equations (VII-7), (VII-8), and (VII-9)
In reference to Figure VII-1, equation (VII-2) is rewritten in terms of the yield, y^, and rate of reduction of
nickel ions (component A) to metallic nickel (-r^) as
dV = (VII-11)
Noting that
=Ao <1 - ÏA> ] = - ^AO <=A0 ' A where is the volumetric flow rate (liter/min). Moreoever,equation (VII-11) can be rearranged in terms of the liquid residence time, x (minutes), as
C&0 dydx = (VII-13)
'"a/where the liquid residence time x (minutes) is defined as
t = V a / P a o (vii-14)
Note also that the residence time given in equation (VII-14) can be varied by either changing the volume of the reactor for a fixed volumetric flow rate or, as in this study, by changing the flow rate for a given reactor volume. Equation (VII-14) can then be integrated

149
_ = =AO .O O
where denotes the steady state yield to metallic nickel at a given liquid residence time, t , and for a given reaction
temperature.Evaluation of the reduction data showed that a
second-order rate equation in the form given by equation (VII-3) best fits the data. Hence, equation (VII-15) when integrated, after insertion of the rate equation,
(-r&) = k (1 - (VII-16)
leads to
Equivalently, equation (VII-17) can be written in terms of
the overall nickel conversion, by substituting equation(VII-10) into equation (VII-17)
1
Equation (VII-18) was used to calculate the rate constant, k, which then was correlated versus temperature according to equation (VII-4) by plotting ink versus (1/T). The activation energy. Eg, was calculated from the slope of the Arrhenius curve where
Eg = - R (slope of Arrhenius curve) (VII-19) Since k was known at several temperatures from the Arrhenius

150curve, it was also possible to predict the yield of metallic nickel at several residence times by using equation (VII-17)
after rearrangement as
^ ^Ao ^^Af = 1 + k C, T (VII-20)Aoparticularly when the feed solution was free of any ammonium
sulfate. Thus by using this calculational procedure, it was possible to examine the effect of ammonium sulfate addition on yield at a given reduction temperature over several residence times.
CHAPTER VIII
RESULTS AND DISCUSSION
In Chapter VI (and in Appendix A) experimental obser
vations were presented which give an insight to some of the problems and advantages of the continuous hydrogen reduction of nickel and cobalt from their ammoniacal sulfate solutions. In this chapter the results of nickel reduction are presented and discussed.
Several problems and limitations were encountered in this study which impeded the interpretation of the data collected. These difficulties were:
1. Estimation of the steady state product quality. Since both metallic nickel and nickel salts were continuously collected in the liquid-solid sepa
rator, it was impossible with the existing setup*
*A design modification required in the existing setup is to include a high pressure liquid-solid removal system.There are two basic arrangements for such a system either (1) by using two cycling ball valves with variable speed actuators to handle the desired flow rate as previously employed in Neskora's study, or (2) by adding another liquid-solid separator whereby the transient products and post-run washings are to be directed to flow into the existing liquid-solid separator while only the steady state products are to be accumulated in the new separator.
151
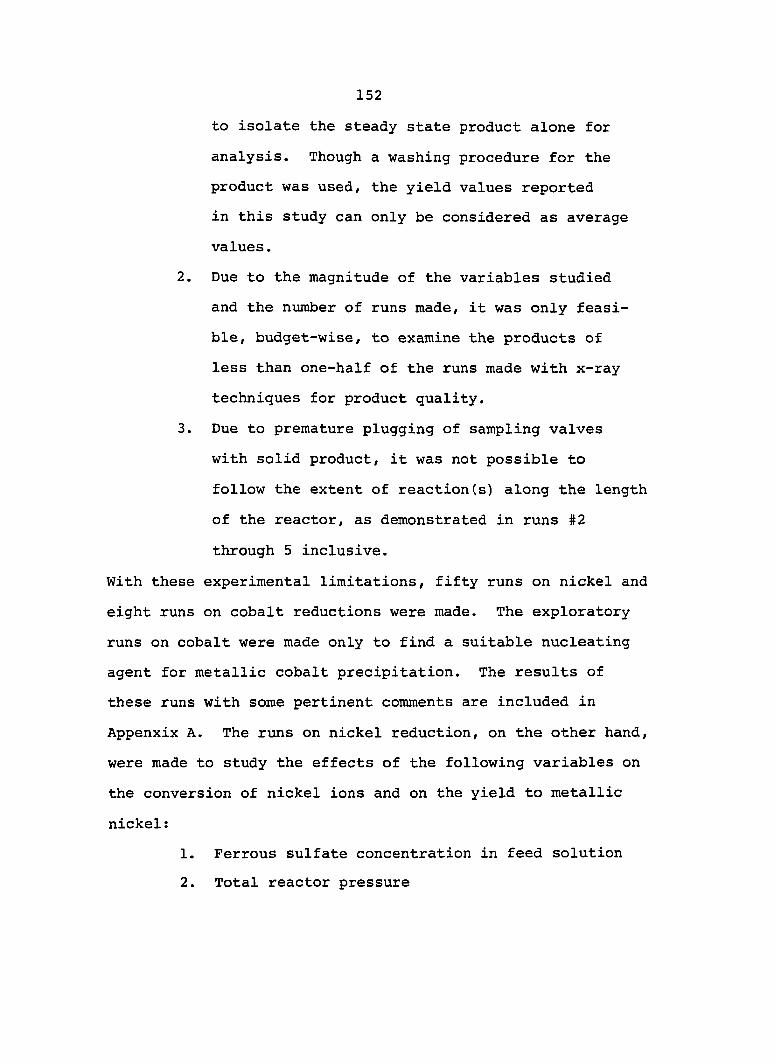
152
to isolate the steady state product alone for analysis. Though a washing procedure for the product was used, the yield values reported in this study can only be considered as average values.
2. Due to the magnitude of the variables studied and the number of runs made, it was only feasible, budget-wise, to examine the products of less than one-half of the runs made with x-ray techniques for product quality.
3. Due to premature plugging of sampling valves with solid product, it was not possible to follow the extent of reaction(s) along the length of the reactor, as demonstrated in runs #2
through 5 inclusive.
With these experimental limitations, fifty runs on nickel and eight runs on cobalt reductions were made. The exploratory runs on cobalt were made only to find a suitable nucleating agent for metallic cobalt precipitation. The results of these runs with some pertinent comments are included in
Appenxix A. The runs on nickel reduction, on the other hand, were made to study the effects of the following variables on
the conversion of nickel ions and on the yield to metallic
nickel;1. Ferrous sulfate concentration in feed solution2. Total reactor pressure
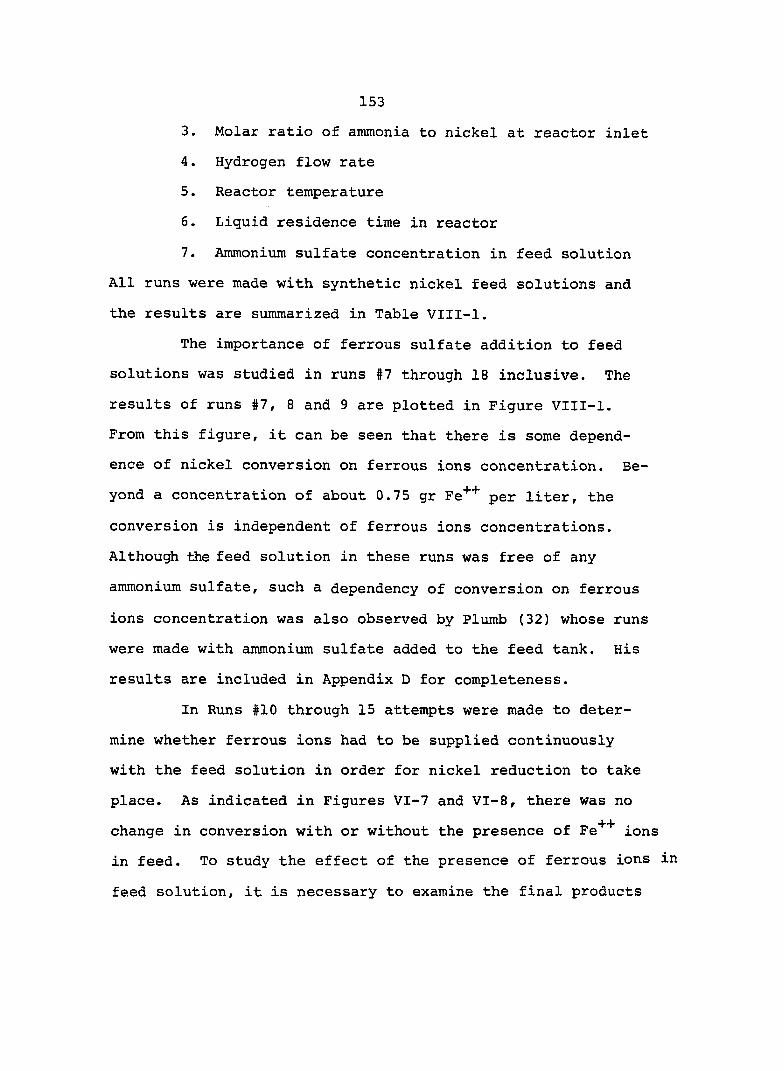
1533. Molar ratio of ammonia to nickel at reactor inlet4. Hydrogen flow rate5. Reactor temperature
6. Liquid residence time in reactor
7. Ammonium sulfate concentration in feed solution All runs were made with synthetic nickel feed solutions and the results are summarized in Table VIII-1.
The importance of ferrous sulfate addition to feed solutions was studied in runs #7 through 18 inclusive. The results of runs #7, 8 and 9 are plotted in Figure VIII-1.From this figure, it can be seen that there is some dependence of nickel conversion on ferrous ions concentration. Beyond a concentration of about 0.75 gr Fe^^ per liter, the
conversion is independent of ferrous ions concentrations. Although the feed solution in these runs was free of any
ammonium sulfate, such a dependency of conversion on ferrous
ions concentration was also observed by Plumb (32) whose runs were made with ammonium sulfate added to the feed tank. His results are included in Appendix D for completeness.
In Runs #10 through 15 attempts were made to determine whether ferrous ions had to be supplied continuously with the feed solution in order for nickel reduction to take
place. As indicated in Figures VI-7 and VI-8, there was no change in conversion with or without the presence of Fe ions in feed. To study the effect of the presence of ferrous ions in
feed solution, it is necessary to examine the final products
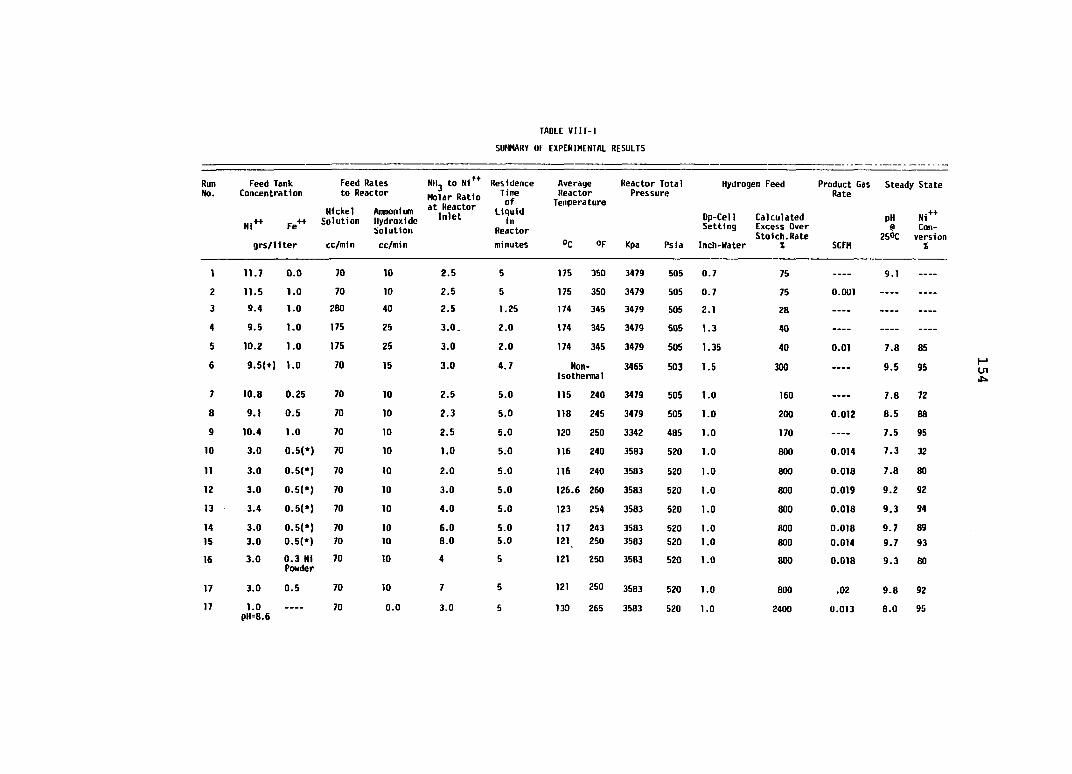
TADLE VIII-I SUEWARÏ OF EXPERIMENTAL RESULTS
RunNo.
Feed Tank Concentration
Hi Fe
Feed Rates to Reactor
Nickel Amnonium Solution Hydroxide
Solution
NHj to NiMolar Ratio at Reactor Inlet
ResidenceTimeof
Liquidin
Reactor
AverageReactorTemperature
Reactor Total Pressure
Hydrogen Feed Product Gas Steady State Rate
Op-CellSetting
Calculated Excess Over Stoich.Rate
pH@250CNi++Conversion
grs/liter cc/min cc/min minutes "C op Kpa Psia Inch-Hater X SCFH X
1 11.7 0 .0 70 10 2.5 5 175 350 3479 505 0.7 75 --- 9.1 --2 11.5 1.0 70 10 2.5 5 175 350 3479 505 0.7 75 0.001 ---3 9.4 1.0 280 40 2.5 1.25 174 345 3479 505 2.1 28 --- --- — —4 9.5 1.0 175 25 3.0. 2 .0 174 345 3479 505 1.3 40 --- --- ---S 10.2 1.0 175 25 3.0 2.0 174 345 3479 505 1.35 40 0.01 7.8 856 9.5(f) 1.0 70 15 3.0 4.7 Non- 3465 503 1.5 300 9.5 95
Isothermal7 10.8 0.25 70 10 2.5 5.0 115 240 3479 505 1.0 160 --- 7.8 728 9.1 0.5 70 10 2.3 5.0 118 245 3479 505 1.0 200 0.012 8.5 88
9 10.4 1.0 70 10 2.5 5.0 120 250 3342 485 1.0 170 7.5 9510 3.0 0.50 70 10 1.0 5.0 116 240 3583 520 1.0 800 0.014 7.3 3211 3.0 0.50 70 10 2.0 5.0 116 240 3583 520 1.0 800 0.018 7.8 8012 3.0 0.5(f) 70 10 3.0 5.0 126.6 260 3583 520 1.0 800 0.019 9.2 9213 3.4 0.50 70 10 4.0 5.0 123 254 3583 520 1.0 800 0.018 9.3 9414 3.0 0.50 70 10 6 .0 5.0 117 243 3583 520 1.0 800 0.018 9.7 8915 3.0 0.50 70 10 8 .0 5.0 121 250 3583 520 1.0 800 0.014 9.7 9316 3.0 0.3 Ni
Powder70 10 4 5 121 250 3583 520 1.0 800 0.018 9.3 80
17 3.0 0.5 70 10 7 5 121 250 3583 520 1.0 800 .02 9.8 9217 1.0
pH-8.6--- 70 0.0 3.0 5 130 265 3583 520 1.0 2400 0.013 8 .0 95
Ul

TABLE VIII-1— Continued
RunNo.
Feed Tank Concentration
N1++ Fe++ grs/llter
Feed Rates to Reactor
Nickel Amnonlun Solution Hydroxide
Solutioncc/min cc/min
NH3 to N1*+Molar Ratio at Reactor Inlet
ResidenceTimeof
LiquidIn
Reactorminutes
AverageReactor
Temperature
oc OF
Reactor Total Pressure
Kpa Psia
Hydrogen Feed
Dp-Cell Calculated Setting Excess Over
Stoich.Rate Inch-water ' %
Product Gas Rate
SCFH
Steady State
pH N1++8 Con-
25°C version X
18 6.3 4.37FerrieSulfate
70 10 4.2 5 121 250 3445 500 0.3 60 0.002 9.6 80
19 10.4 0.5 75 10 2.5 4.7 120 250 6201 900 1.0(x) 100 0.006 9.1 9620 10.4 0.5 70 10 2.4 5.0 120 250 2136 310 1.05 170 0.005 8.2 8521 10.9 0.5 75 10 2.1 4.7 118 245 550 80 0.4(0) 70 0.002 8.6 70.522 10.6 0.5 70 10 2 .0 5.0 114 237 455 66 0.3(A) 77 8.2 68.423 7.75 0.5 70 10 2.0 5 115 240 503 73 0.4(A) 260 --- 8.3 70.524 11.3 0.5 70 10 1.0 5 113.4 236 613 89 0.4(A) 70 0.003 7.7 5225 7.16 0.5 70 10 4.0 5 116.7 242 675 98 0.5(A) 300 0.004 9.5 7526 3.1 0.5 70 10 4.0 5 114 237 634 92 0.35(A) 500 0.003 9.3 9327 9.8 1.0 70 10 0 .6 5 113 235 3376 490 1.05 190 0.018 7.0 26.528 10 1 .0 65 10 1.2 5.3 107 225 3479 505 1.0 200 0.010 6.4 6429 9.7 1 .0 65 12 1.5 5.2 120 250 3479 505 1.05 200 0.007 --- 7530 8 .2 0.4 70 10 2.9 5.0 123 254 3462 517 1.0 250 0.015 9.1 98.731 8 .1 0.4 70 10 3.75 5.0 122 252 3548 515 1 .0 250 0.009 9.8 9932 7.63 0.4 70 10 6 .0 5.0 114 238 3583 520 1.0 250 0.015 10 98.633 8.5 0.5 70 10 3.75 5.0 118 245 3548 515 0.3 25 0.006 9.8 91.534 8.3 0.5 70 10 2.4 5.0 112 234 3583 520 0.3 25 0.004 9.3 86.535 8.6 0.5 70 10 4.0 5.0 79.5 175 3583 520 0.3 25 0.002 10 55.836 8.3 0.5 70 10 4.0 5.0 99 210 3583 520 0.3 25 0.004 10 77
HLnLn
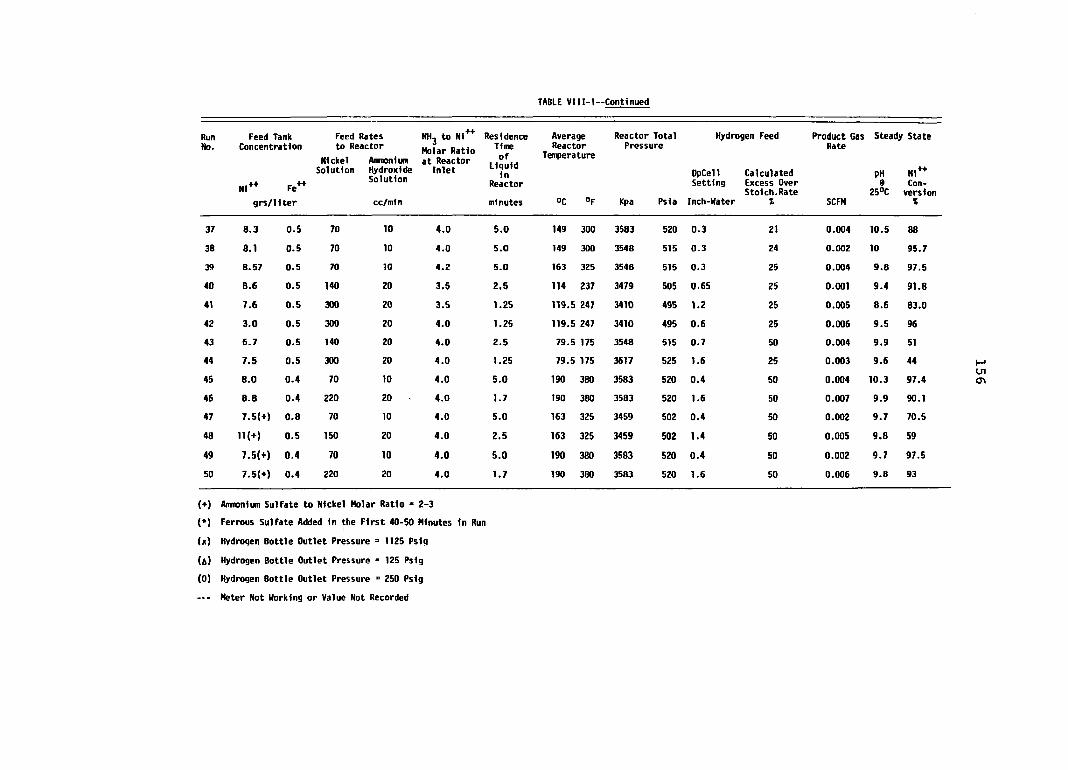
TABLE VIII-1—Continued
RunNo.
Feed Tank Concentration
Hi" Fe grs/liter
NickelSolution
Feed Rates to Reactor
Aimonium Hydroxide Solution
cc/min
NHj to NiMolar Ratio at Reactor Inlet
ResidenceTimeof
Liquidin
Reactorminutes
AverageReactor
Temperature
»C
Reactor Total Pressure
Hydrogen Feed
Kpa
DpCellSetting
Psia Inch-Hater
Calculated Excess Over Stoich.Rate %
Product Gas Steady State Rate
pH Hi"@ Con-
25“C version SCFH X
37 8.3 0.5 70 10 4.0 5.0 149 300 3583 520 0.3 21 0.004 10.5 8838 8.1 0.5 70 10 4.0 5.0 149 300 3548 515 0.3 24 0.002 10 95.739 8.57 0.5 70 10 4.2 5.0 163 325 3548 515 0.3 25 0.004 9.8 97.540 8.6 0.5 140 20 3,5 2.5 114 237 3479 505 0.65 25 0.001 9.4 91.841 7.6 0.5 300 20 3.5 1.25 119.5 247 3410 495 1.2 25 0.005 8.6 83.042 3.0 0.5 300 20 4.0 1.25 119.5 247 3410 495 0.6 25 0.006 9.5 9643 6.7 0.5 140 20 4.0 2.5 79.5 175 3548 515 0.7 50 0.004 9.9 5144 7.5 0.5 300 20 4.0 1.25 79.5 175 3617 525 1.6 25 0.003 9.6 4445 8.0 0.4 70 10 4.0 5.0 190 380 3583 520 0.4 SO 0.004 10.3 97.446 8.8 0.4 220 20 4.0 1.7 190 380 3583 520 1.6 50 0.007 9.9 90.147 7.5(+) 0.8 70 10 4.0 5.0 163 325 3459 502 0.4 50 0.002 9.7 70.548 11(f) 0.5 150 20 4.0 2.5 163 325 3459 502 1.4 50 0.005 9.8 5949 7.5(f) 0.4 70 10 4.0 5.0 190 380 3583 520 0.4 50 0.002 9.7 97.550 7.5(+) 0.4 220 20 4.0 1.7 190 380 3583 520 1.6 50 0.006 9.8 93
inCi
(+) Anmonium Sulfate to Nickel Molar Ratio = 2-3(*) Ferrous Sulfate Added in the First 40-50 Minutes in Run(x) Hydrogen Bottle Outlet Pressure = 1125 Psiq(a) Hydrogen Bottle Outlet Pressure = 125 Psig(0) Hydrogen Bottle Outlet Pressure = 250 Psig— Meter Not Working or Value Not Recorded
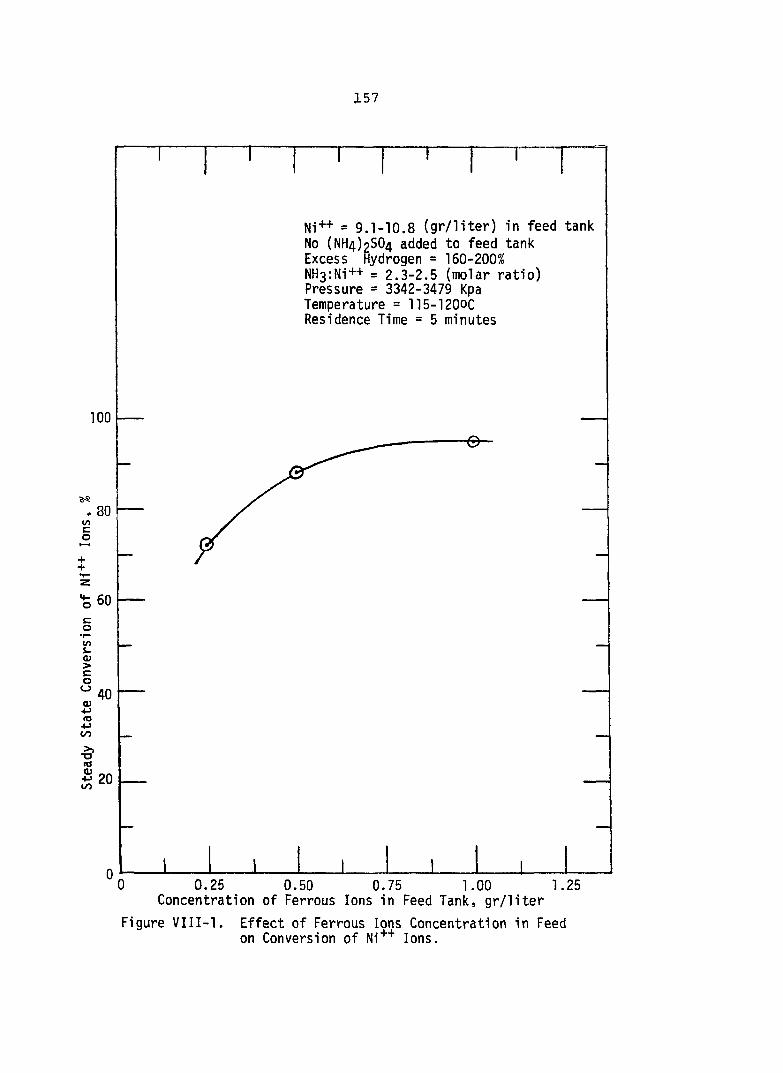
157
TOO
l/îCo
60
inOJ>cooO)«34-)(/3«00)
40
20
Ni++ = 9.1-10.8 (gr/liter) in feed tank No (NH4)2S04 added to feed tank Excess Hydrogen = 160-200%NH3:Ni++ = 2.3-2.5 (molar ratio) Pressure = 3342-3479 Kpa Temperature = 115-120OC Residence Time = 5 minutes
1 10 0.25 0.50 0.75 1.00 1.25
Concentration of Ferrous Ions in Feed Tank, gr/literFigure VIII-1. Effect of Ferrous Ions Concentration in Feed
on Conversion of Ni*+ Ions.

158of such runs. However, this effect could not be determined since the product of the run segment with feed solution containing ferrous ions was mixed with the product of the run segment containing no ferrous ions. In run #16 an effort
was made to use a solid nickel product as a reducing catalyst. The results of this run indicated that there was no reduction to metallic nickel since the final product was in the form of nickel salts.
Despite all of these efforts, the role of ferrous ions in nucleating nickel metal is not understood. It can
only be postulated that in the presence of ammonium hydro
xide ferrous hydroxide is precipitated thus providing nucléation sites for the nickel-hydrogen reaction. X-ray analysis of solid products collected in this study revealed that
iron was present as hematite, FegO^. Hematite formation can be either due to air oxidation of ferrous hydroxide during the drying time of the solid product or due to possible oxidation (10) of ferrous hydroxide inside the reactor accord
ing to the following reactions;
FeSO^ + 2NH4OH = Fe(0H )2 + (NH^jgSO^ (VIII-1)
2Fe(OH)2 + J2O2 = FegO^'ZHgO (VIII-2)Fe(0H)2 + 0H“ = %Fe203*3H20 + e, (E° = +0.56 volts) (VIII-3)Reaction (VIII-3) is possible, however, since in run #18 when ferric sulfate was added to feed solution, instead of ferrous sulfate, a reduction to metallic nickel was observed as indicated in Table VI-2. Furthermore, Courtney, et al (12)

159observed that the addition of FefOHjg alone never nucleated nickel reduction. Therefore reaction (VIII-3) supports that
hydrous ferric oxide is involved in nucléation of metallic nickel. Note also that the addition of ammonium sulfate along with ferrous sulfate to the feed solution should de
crease the concentration of ferrous hydroxide available according to reaction (VIII-1) and might explain the retardation effect on conversion whenever ammonium sulfate is added to feed solutions, as will be shown in the latter part of this chapter.
The effect of reactor pressure on nickel conversion and yield was investigated in runs #19 through 23 inclusive.The range of pressure studied was from about 450 Kpa (65 psia) to 6200 Kpa (900 psia) with a reactor temperature of
about 120°C (250°F). The liquid residence time in the reactor was five minutes and the hydrogen flow rate was 70 to
260 percent in excess of the stoichiometric rate. The results
plotted as reactor pressure against the steady state values of conversion (solid line) and yield (dotted line) are pre
sented in Figure VIII-2. From this figure it can be seen that the yield to metallic nickel approaches the conversion only when the reactor pressure exceeds about 4000 Kpa (580
psia). As the pressure decreases the yield drops sharply due to formation of nickel salts. At a pressure of about 550 Kpa (80 psia) the yield is less than half of the conversion as
shown by the solid product anlaysis of run #21 indicated in

100
inc►2++
cotAUQ)>COoQ)fOLOlU(U
80
60 Feed Tank Concentrations (gr/liter) Ni++ = 7.75-10.9 Fe*+ = 0.4-0.5
100
/40 /
No (NHA)2S04 added NH3:Ni^+ = 2.5-3.75 (molar ratio) Excess Hydrogen = 70-260% Temperature = 115-120QC Residence Time = 5 minutes
(U80 o
034-><U60
40
-oOJ>-(U+->tato
(OO)4->to
O
20 20
1000 2000
Figure VIII-2.
160003000 4000 5000
Reactor Pressure, KpaEffect of Reactor Pressure on Conversion and Yield.
7000 8000

161Table VI-4. The nickel salts coprecipitated with the nickel metal were identified as nickel hydroxides by x-ray analysis. Since nickel hydroxide is known to be soluble in excessive amounts of ammonium hydroxide or ammonium salts, runs #24 and
25 were made with NH^ to Ni" "*" ions molar ratios of 1.0 and 4.0, respectively, as discussed in Chapter VI. The results
of run #24 indicated that nickel was hydrolyzed in the reactor since the solid product had the properties of nickel hydroxide. The results of run #25, however, indicated that a molar ratio
of NHg to Ni'*”*’ of more than 4 was needed to minimize the hydroxide formation though it was not tried.
The effect of pressure on yield may, in part, be
rationalized in terms of hydrogen solubility. However, hydrogen solubility data in ammoniacal solutions is not available
and the following rationale is based on the solubility of hydrogen in water. The data reported by Conner (9) which is
reproduced in Figure VIII-3 seem to agree with that reported
originally by Pray et al (33). From Figure VIII-3 it can be
seen that the solubility of hydrogen in water increases by increasing temperature and pressure.
For runs #21, 31 and 19 which were made with a tempera
ture of 120°C (250°F) and reactor pressures of about 100,500 and 900*
*For this pressure the following correlation reported by Conner was used:
LogiQ(S) = -0.48218 + (6.326 x 10"^)p _(1.1718 X 10"5)p2 + (8.1712 x 10"^)P^
where S is in mJl - Hj per 10 gram-water at STP to be multiplied by 0.004458 for conversion into the units of gr-mole-Hg per liter at STP and P is in psia.
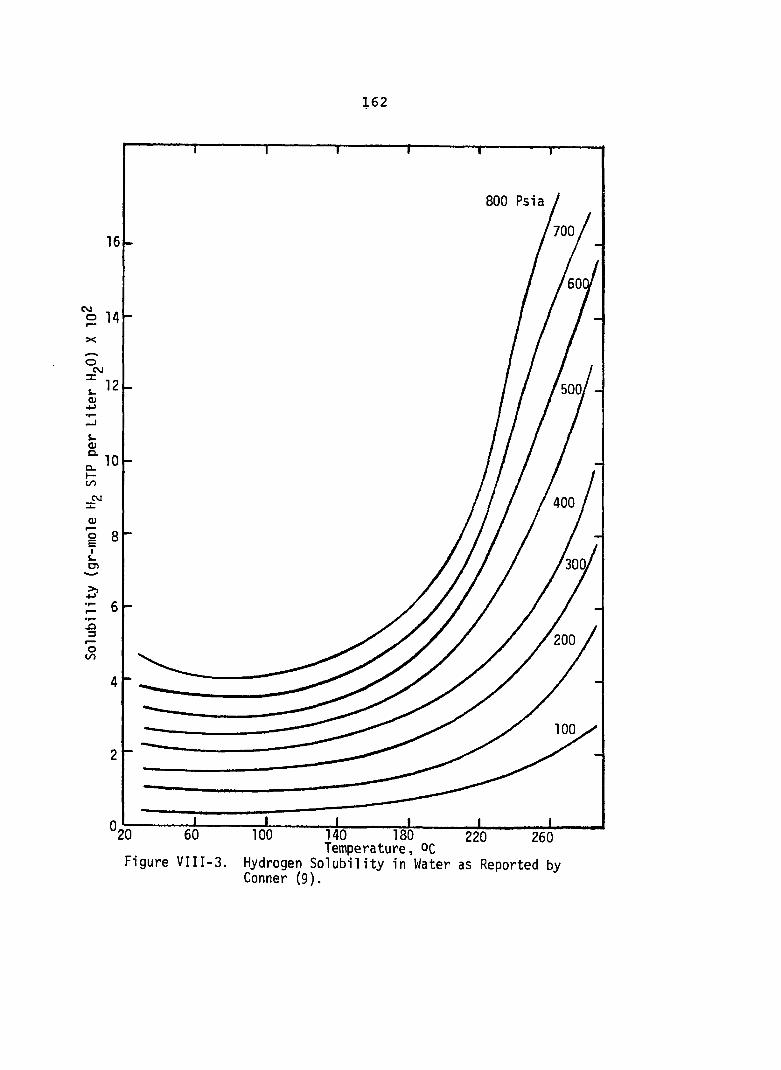
162
800 Psia700
o 14X
CVJ500,
Q.
400
300,
200t /5
100
180 220 260 Figure VIII-3. Hydrogen Solubility in Water as Reported by
100 140Temperature, ocHydrogen Sol Waterty1 1n asConner (9) .

163
psia, respectively, the corresponding hydrogen solubilities are; 0.0049, 0.0264 and 0.2184 gr-itiole per liter. Noting that the solution feed rate used in these runs was 80 cc per minute, the above values of hydrogen solubility, in gr- mole per minute, are: 0.000392, 0.002112 and 0.01767. From
Table VIII-1 and Figure VIII-2, the amounts of metallic nickel produced in these runs (#21, 31 and 19), in gr-mole
per minute, are: 0.00498, 0.00845 and 0.0117, respectively.
Thus the molar ratios of soluble hydrogen to metallic nickel produced in these runs are: 0.078, 0.25 and 1.15. Therefore
based on the stoichiometry of nickel reduction reaction which
requires one mole of hydrogen for every mole of metallic
nickel reduced, soluble hydrogen accounts for all metallic nickel produced in run #19 (6200 Kpa, 120°C) only. Further
more, from Table VIII-1, the molar ratios of hydrogen consumed
(including soluble hydrogen) to metallic nickel produced in runs #21, 31 and 19 are: 4.4, 2.4 and 1.3, respectively. By
comparing the molar ratios of soluble hydrogen per mole of nickel with the corresponding molar ratios of hydrogen consumed
(including soluble hydrogen) per mole of nickel produced, it can be seen that soluble hydrogen accounts for 88.5, 10.5 and 1.7 percent of the hydrogen consumed in runs #19 (900 psia),
31 (500 psia) and 21 (100 psia), respectively.The addition of ammonia to nickel feed was studied
in terms of the effect of the molar ratio of ammonia to nickel at the reactor inlet on nickel conversion. Runs #27 through
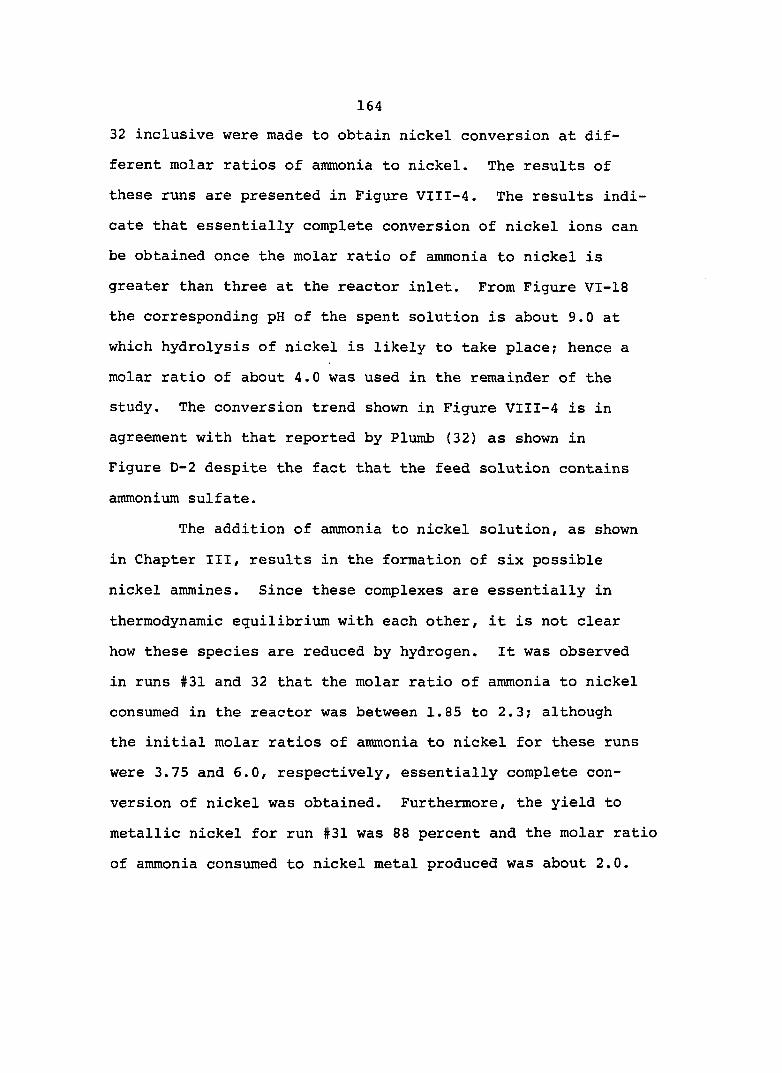
16432 inclusive were made to obtain nickel conversion at different molar ratios of ammonia to nickel. The results of these runs are presented in Figure VIII-4. The results indicate that essentially complete conversion of nickel ions can be obtained once the molar ratio of ammonia to nickel is greater than three at the reactor inlet. From Figure VI-18 the corresponding pH of the spent solution is about 9.0 at which hydrolysis of nickel is likely to take place; hence a molar ratio of about 4.0 was used in the remainder of the study. The conversion trend shown in Figure VIII-4 is in agreement with that reported by Plumb (32) as shown in Figure D-2 despite the fact that the feed solution contains ammonium sulfate.
The addition of ammonia to nickel solution, as shown
in Chapter III, results in the formation of six possible nickel ammines. Since these complexes are essentially in
thermodynamic equilibrium with each other, it is not clear how these species are reduced by hydrogen. It was observed in runs #31 and 32 that the molar ratio of ammonia to nickel consumed in the reactor was between 1.85 to 2.3; although the initial molar ratios of ammonia to nickel for these runs were 3.75 and 6.0, respectively, essentially complete conversion of nickel was obtained. Furthermore, the yield to metallic nickel for run #31 was 88 percent and the molar ratio of ammonia consumed to nickel metal produced was about 2.0.

165
Feed Tank Concentrations (gr/liter):
No (NH4)2S0« added Excess Hydrogen = 200-250% Pressure = 3376-3583 Kpa Temperature = 107-12200 Residence Time = 5 minutes
100
80
o 60
40
0 6.01.2 2.4 3.6 4.8Molar Ratio of NH3 to Ni++ at Reactor Inlet0
Figure VI I I - 4 . Effect of Inlet Molar Ratio of NH3 to Ni++ on Conversion of Ni++ Ions.

166
This result may indicate that the most easily reduced nickel complex is the diammine, NiCNH^)^"*".
The effect of hydrogen flow rate on conversion and yield was specifically examined in runs #31 and 33. The corresponding excesses of hydrogen fed to the reactor over the theoretical stoichiometric rate were 250 and 25 percent. The steady state values of conversion and yield are plotted versus the hydrogen flow rate in Figure VIII-5. From this
figure it can be seen that the excess hydrogen has a pro
nounced effect on yield and practically no effect on conversion. An increase in the excess hydrogen input from 25 to 250 percent results in an increase in yield to metallic nickel from 55 to 88 percent. Note that if a stoichiometric hydro
gen flow rate is used, a yield of 47 percent can be expected,i.e. only about half of the nickel ions will be reduced to metallic nickel under the conditions of: 120°C, 3548 Kpa and5 minutes of residence time. With the excess hydrogen input of 250 percent over the stoichiometric rate, however, the
reactor was behaving as a fluidized bed; with some metallic nickel being lifted by the gas stream. Therefore, based on
this observation, it was decided to limit the hydrogen flow
rate to about 25 percent over the stoichiometric rate which greatly stablized the flow regime inside the reactor.
The effect of temperature on conversion and yield was studied in runs #35 through 39 and in run #45. In these runs the nickel feed solution was free of ammonium sulfate.
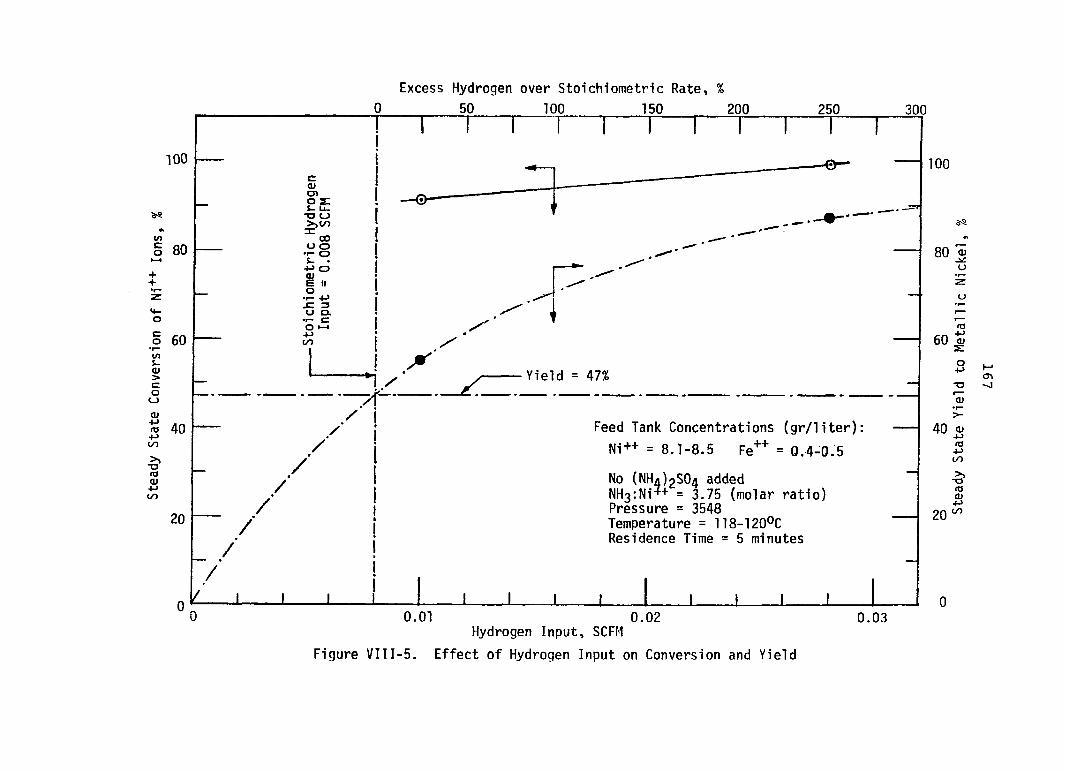
Excess Hydrogen over Stoichiometric Rate, %50_ _ _ _ _ _ _ 100_ _ _ _ _ 150 ___ 200
Yield = 47%
fOaCO
//
20 //
//
Feed Tank Concentrations (gr/liter): Ni++ = 8.1-8.5 Fe** = 0.4-0.5No (NHa)2S04 added NH3:Ni3+ = 3.75 (molar ratio) Pressure = 3548 Temperature = 118-120°C Residence Time = 5 minutes
Figure VIII-5.
0.01 0.02 Hydrogen Input, SCFMEffect of Hydrogen Input on Conversion and Yield
0.03

168and the residence time was 5 minutes. The temperature range studied was from 80°C (175°F) to 193°C (380°F) and the results are presented in Figure VIII-6. From this figure, it can be seen that no change in conversion was observed once the reactor temperature was higher than 120°C (250°F). On
the other hand, it appears that the yield increases by increasing temperature: with a value of about 88 percent at193°C as compared to a conversion value of about 98 percent at this temperature.
The effect of temperature on nickel conversion when the feed solution was buffered with ammonium sulfate was studied by Brunsell (6) and Plumb (32) from 120°C (250°F) to
204°C (400°F). Their results are included in Appendix D. It
appears that the conversion increases gradually by increasing
temperature and a complete conversion can be obtained at
about 200°C. When the results of Brunsell and Plumb are compared with the results presented in Figure VIII-6, it seems that the addition of ammonium sulfate to the feed retards
nickel conversion greatly at low temperature. For instance at 120°C the conversion with and without ammonium sulfate in
the feed are 20 and 91 percent, respectively. At about 200°C, however, the conversion reaches 100 percent whether
the feed solution contains ammonium sulfate or not. Since ammonium sulfate tends to suppress nickel hydroxide formation,
it is desirable to buffer the feed with it particularly at higher temperatures.

169
100
01co
î
80
60y- oc0u>S-15 40Q)4->tO4->CO<0güO 20
Feed Tank Concentrations (gr/liter); Ni++ = 8-8.5 Fe++ = .4-.5NH3:Ni++ = 4.0 (molar ratio)Excess Hydrogen = 25-50%Pressure = 3548-3583 Kpa Residence Time = 5 minutes
100
40 >-
tn
120 180150Figure VIII-5.
Temperature, 0[Nickel Conversion and Yield Versus Temperature. Feed Solution Contains No Ammonium Sulfate.

170The conversion values obtained in this study and
those reported by Brunsell (6) are correlated with a second order rate expression. The rate constants are plotted versus the inverse of the absolute temperature in Figure VIIl-7.
The variation of the rate constant with temperature gives activation energies of 13.9 and 12.44 Kcal per mole Ni'*"*'
when the feed is with and without ammonium sulfate, respectively. The slight increase in activation energy may be due
to the effect of ammonium sulfate addition discussed above.The activation energy of 13.9 is in a close agreement with
that reported by Mackiw, et al (26), i.e. 13.7 Kcal per mole over the temperature range of 149 to 163°C. Unfortunately
Burnsell did not evaluate the yield to metallic nickel in his study. The yield values obtained in this study are correlated by a second order rate expression, as discussed in
Chapter VII, and the variation of the rate constant with temperature gives an activation energy of about 10.66 Kcal per
mole metallic nickel as shown in Figure VIII-8. This value is in a good agreement with the value of 10.2 Kcal per
mole originally reported by Weddings, et al (27) , though their rate equation was with a zero order with respect to nickel
concentration and with a first order with respect to hydrogen
concentration when metallic nickel seed was used to initiate
the reduction.The effect of temperature on yeild can also be
examined in terms of the amounts of ammonia and hydrogen

171
Feed Tank Concentrations (gr/liter):
NH3:Ni++ = 3.75-4.2 (molar ratio) Excess Hydrogen = 25-50%Pressure = 3548-3583 Kpa Residence Time = 5 minutes G This Work A Brunsell (6)
[Feed ContainsA ffl
3.03C
Activation Energy = 12.44 Kcal per mole Ni++i
5
+1.0
0.0
Activation Energy =13.9 Kcal per mole Ni<++
- 2.02.0 2.2 2.4 2.6 2.8 3.01/TO K X 103Figure VIII-7. Arrhenius Plot Based on Conversion of Ni++ Ions to
Products (Salts Plus Metal).

172
Feed Tank Concentrations (gr/liter): Ni++ = 8-8.6 Fe^^ = .4-.5NH3:N i = 3,75-4.2 (molar ratio) Excess Hydrogen = 25-50%Pressure = 3548-3583 Kpa Residence Time = 5 minutes Activation Energy = 10.66 Kcal per
mole metallic nickel
3 . 0 --
- 2.0
-3.0
Figure VIII -8 . Arrhenius Plot Based on Yield. Feed Solution Contains No Ammonium Sulfate.

173consumed per mole of metal produced. By a material balance the amount of ammonia consumed in the reactor, expressed as
gr-mole of NH^ per gr-mole of metal and per gr-mole of nickel salts precipitated, are plotted versus the yield over the temperature range of 79 to 193°C in Figure VIII-9. Recall that the initial molar ratio of ammonia to nickel is between 3.75 and 4.2 for runs #33 through 39 and for run #45 over this temperature range. From Figure VIII-9, it can be seen that the ratios of ammonia to nickel salts and ammonia to nickel metal approach the limit of 2.0 at 0.0 and 100 percent yield, respectively. This limit suggests clearly that over the temperature range of 79 to 193°C, the most easily reduced
complex of nickel is the diammine. This finding also supports
the earlier remark made about the molar ratio of ammonia to metallic nickel of 2.0 observed in run #31.
In Figure VIII-10, the nickel yield is plotted
against the ratio of gr-mole hydrogen consumed per gr-mole metal produced and gr-mole soluble hydrogen per gr-mole metal
produced. The latter ratio is based on the solubility of hydrogen in water over the temperature range of 80 to 190°C
at 3445 Kpa (500 psia). Note also that the hydrogen input was 25 percent in excess of the stoichiometric flow rate. From Figure VllI-10, it can be seen that the soluble hydrogen accounts for about 50 percent of the metal produced when the
yield reaches 100 percent. Also from this figure it can be seen that the amount of hydrogen consumed approaches the
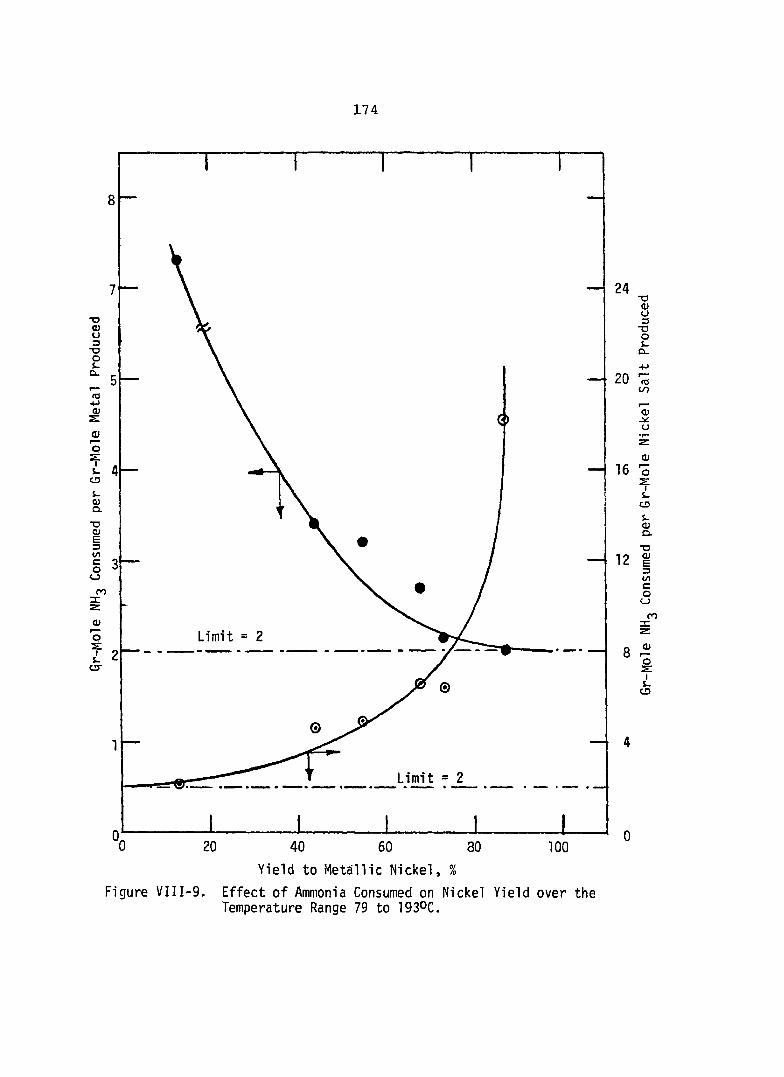
174
oC L
O00
Limitcr
Limit
100
24" Os3“OOLo_
20 i;<0oo<DU
( D16 "3
12
lS .
C DS .OJQ .T5i3tncoo
8 ^IuÜ3
Figure VIII-9.Yield to Metallic Nickel, %
Effect of Ammonia Consumed on Nickel Yield over the Temperature Range 79 to 1930C.
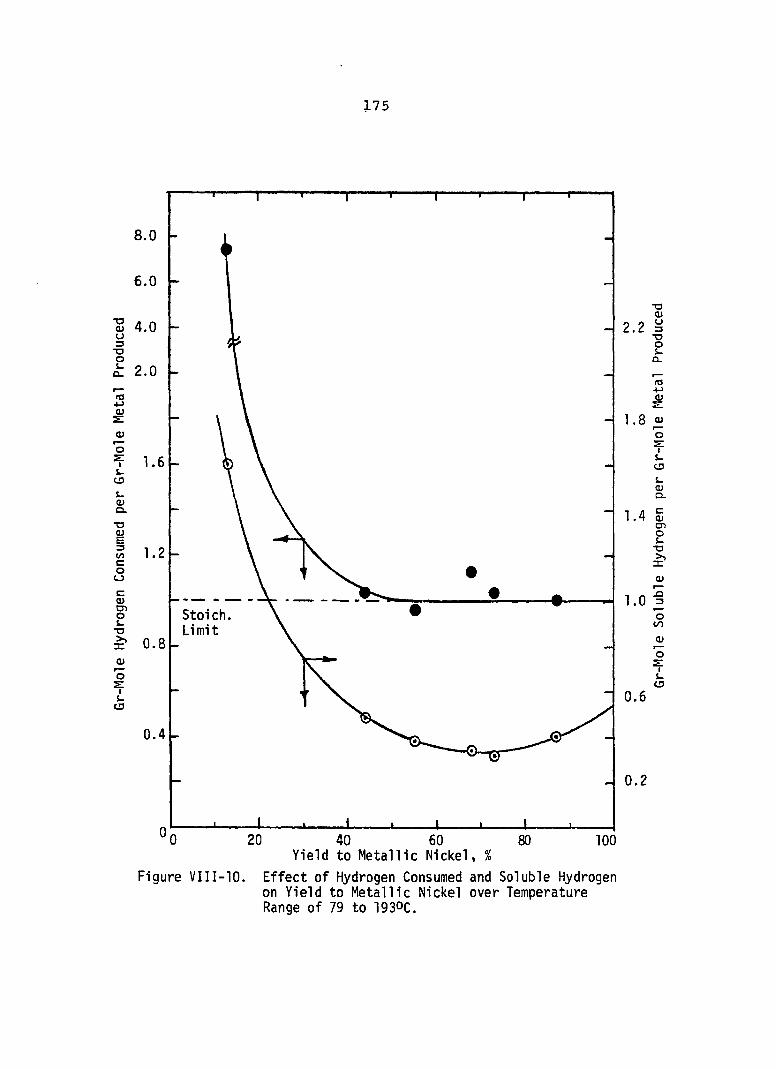
175
8.0
6.0
130>U3"OO& _
Q .
0)"Ô?COL.O)C L•OË3U)coo
Stoich.Limit
(Uo
100Yield to Metallic Nickel, %
TJO)2.2 3"O
2Û.roë
1.8 O?LC Os-Q .
1.4 Sen2"O
Q)1.0 I
*0c/)0)"ôo
0.6
0.2
Figure VIII-10. Effect of Hydrogen Consumed and Soluble Hydrogen on Yield to Metallic Nickel over Temperature Range of 79 to 193°C.

176stoichiometric limit only when the yield is greater than 50 percent.
Based on the results of Figures VIII-9 and VIII-10 the following inferences can be made;
1. Soluble hydrogen either reduces half of the amount of nickel diammine complex while the other half is reduced by gaseous hydrogen over
the freshly formed nickel, or the soluble hydrogen forms another unknown complex with the diammine complex of nickel which requires only
half of the stoichiometric hydrogen for complete nickel recovery.
2. Soluble hydrogen may be responsible for the
reduction of higher nickel complexes in the presence of ferrous iron to the diammine and gaseous hydrogen may then reduce the diammine
complex to metallic nickel.
Neither one of these two inferences is fully substantiated in this study due to experimental limitations, however.
The effect of liquid residence time in the reactor on nickel conversion and yield was investigated in runs #35, 43 and 44 at a temperature of 79°C, in runs #33, 40 and 41 at 120°C and in runs #45 and 46 at 193°C. The residence time range studied was between 1.25 to 5 minutes. The results
plotted as the steady state values of conversion and yield versus residence time are shown in Figures VIII-11 and
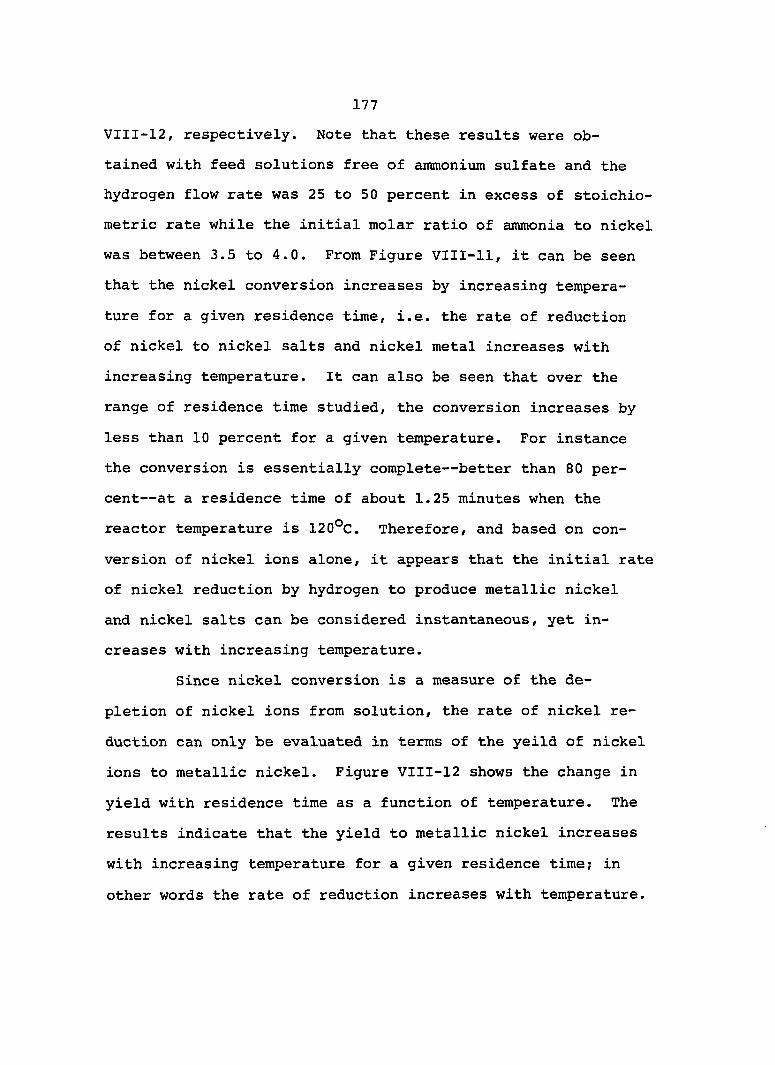
177VIII-12, respectively. Note that these results were obtained with feed solutions free of ammonium sulfate and the hydrogen flow rate was 25 to 50 percent in excess of stoichiometric rate while the initial molar ratio of ammonia to nickel was between 3.5 to 4.0. From Figure VIII-11, it can be seen that the nickel conversion increases by increasing tempera
ture for a given residence time, i.e. the rate of reduction of nickel to nickel salts and nickel metal increases with increasing temperature. It can also be seen that over the
range of residence time studied, the conversion increases by
less than 10 percent for a given temperature. For instance the conversion is essentially complete— better than 80 percent— at a residence time of about 1.25 minutes when the
reactor temperature is 120°C. Therefore, and based on con
version of nickel ions alone, it appears that the initial rate of nickel reduction by hydrogen to produce metallic nickel and nickel salts can be considered instantaneous, yet increases with increasing temperature.
Since nickel conversion is a measure of the de
pletion of nickel ions from solution, the rate of nickel re
duction can only be evaluated in terms of the yeild of nickel ions to metallic nickel. Figure VIII-12 shows the change in
yield with residence time as a function of temperature. The results indicate that the yield to metallic nickel increases
with increasing temperature for a given residence time; in
other words the rate of reduction increases with temperature.

1 78
Feed Tank Concentrations (gr/liter):
No (NHa)2S04 added NH3:Ni++ = 3.5-4.0 (molai Excess Hydrogen = 25-50% Pressure = 3410-3617 KpaTemperature ( o Q
0 193 © 120
100
o 60
" 40 ---
00
00
Residence Time, minutesFigure VI I I -11 . Conversion of Ni++ Ions Versus Residence Time as a
Function of Temperature when Feed Contains No Ammonium Sulfate.

179
<Uu
ta4-)
o• p
Feed Tank Concentrations (gr/liter):
No (NHa)2S04 added NH3:N1" + = 3.5-4.0 (molar ratio) Excess Hydrogen = 25-50% Pressure = 3410-3617 KpaTemperature (OC)
100
80
60
40
20
04 51 20 3
50
40
u30
<aCD
20 XJ0)
>-
10
Figure VIII -12 .
Residence Time, minutesYield to Metallic Nickel Versus Residence Time as a Function of Temperature when Feed Contains No Ammonium Sulfate.
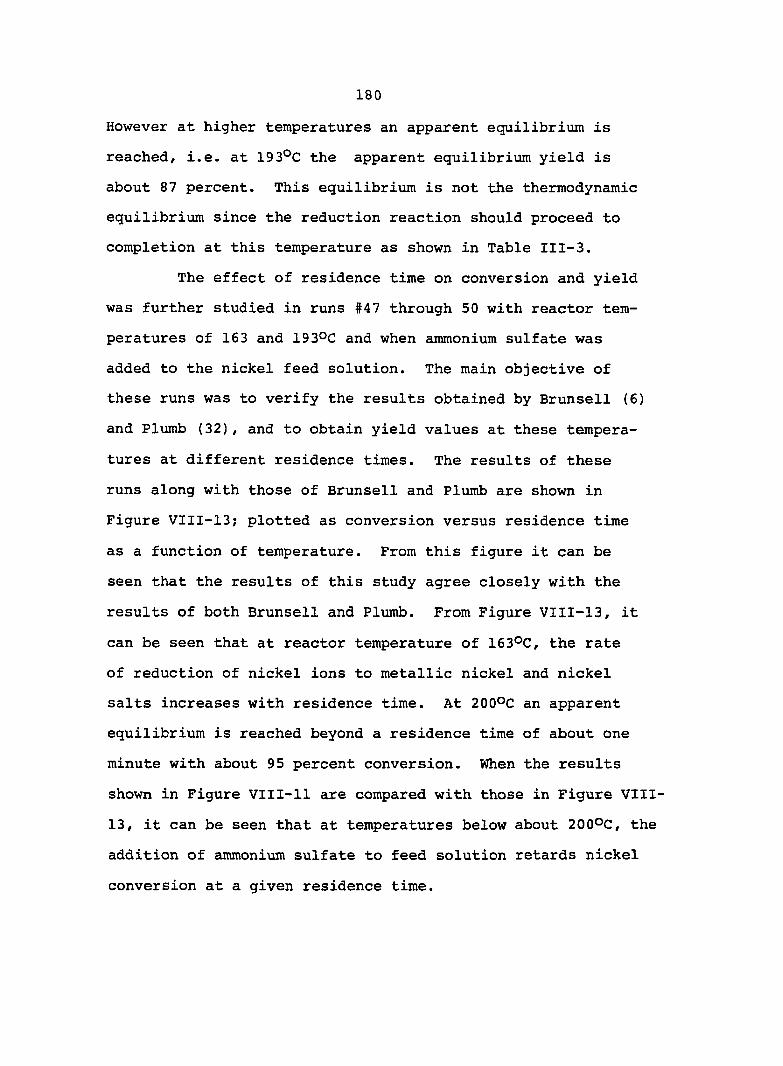
180
However at higher temperatures an apparent equilibrium is reached, i.e. at 193°C the apparent equilibrium yield is about 87 percent. This equilibrium is not the thermodynamic equilibrium since the reduction reaction should proceed to completion at this temperature as shown in Table III-3.
The effect of residence time on conversion and yield was further studied in runs #47 through 50 with reactor temperatures of 163 and 193°C and when ammonium sulfate was added to the nickel feed solution. The main objective of these runs was to verify the results obtained by Brunsell (6) and Plumb (32), and to obtain yield values at these tempera
tures at different residence times. The results of these runs along with those of Brunsell and Plumb are shown in Figure VIII-13; plotted as conversion versus residence time
as a function of temperature. From this figure it can be seen that the results of this study agree closely with the
results of both Brunsell and Plumb. From Figure VIII-13, it
can be seen that at reactor temperature of 163°C, the rate of reduction of nickel ions to metallic nickel and nickel salts increases with residence time. At 200°C an apparent equilibrium is reached beyond a residence time of about one
minute with about 95 percent conversion. When the results shown in Figure VllI-11 are compared with those in Figure VIII-
13, it can be seen that at temperatures below about 200°C, the addition of ammonium sulfate to feed solution retards nickel
conversion at a given residence time.

181
100
I 80
60§tc50>5 40-S'(00>to
20
T T TFeed Tank Concentrations (gr/liter):
Ni++ = 7.5-11 Fe++ = 0.28-.80(11114)2504:N i = 2-3 (molar ratio) NH3:Ni++ = 4.0 (molar ratio)Excess Hydrogen = 25-50%Pressure = 3583 KpaReactor Temperature (OC)D 204, Plumb (32)0 193, This Work g 176, Plumb (32)0 176, Brunsell (e)# 163, This Work
_ _
1
Figure VIII -13.
1 2 3 4 5Residence Time, minutes
Conversion of Ni++ Ions Versus Residence Time as a Function of Temperature when Feed Solution Contains Ammonium Sulfate.

182
The effect of ammonium sulfate addition to feed solutions on yield to metallic nickel was evaluated at reactor temperatures of 163 and 193°C as shown in Figures VIII-14 and VIll-15, respectively. The results shown in these figures
are in effect a comparison between the yield values obtained
in runs #47 through 50, when the feed solution was buffered with ammonium sulfate, with similar runs (#39, 45 and 46) when the feed contained no ammonium sulfate. Note also that the dotted lines drawn through the experimental data points de
noted by the clear circles are based on equation VII-20 with révélant rate constants obtained from Figure VIII-8 and by assuming a nickel concentration at the reactor inlet of 0.128 mole per liter. At a reactor temperature of 1630C, as shown in Figure VIII-14, the addition of ammonium sulfate to
feed solution resulted in a lower yield than when the feed solution is free of ammonium sulfate. However, as the tem
perature was increased to 193°C a better yield was obtained by adding ammonium sulfate to the feed tank as shown in
Figure VIII-15. From these two comparisons, and those regarding the conversion values discussed above in conjunction
with Figures VIII-11 and VIII-13, it is clear that the addi
tion of ammonium sulfate to feed solutions retards nickel conversion and yield when the temperature is less than about 200°C. At about 200°C, however, slightly better nickel con
version and yield can be obtained by adding ammonium sulfate to feed solutions. Though the addition of ammonium sulfate
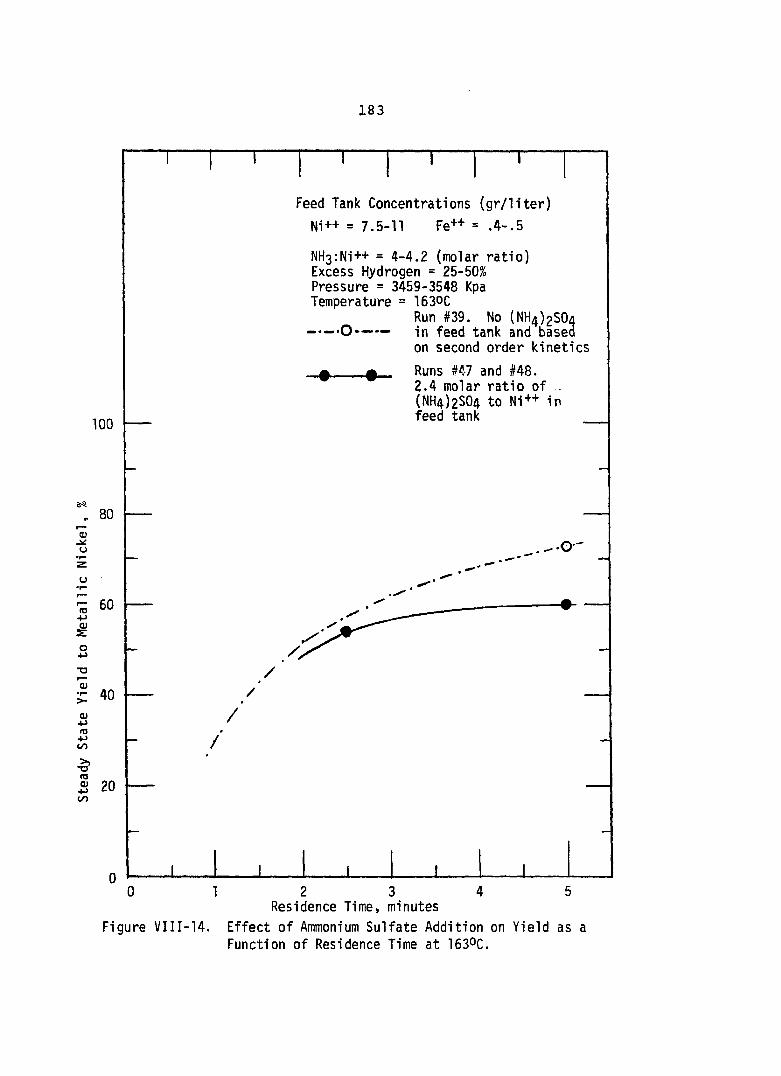
183
100
u
80
0) 40OJ*Ü•p(/)-o’(O“J 20 (/)
T TFeed Tank Concentrations (gr/liter)
Ni++ = 7.5-11 Fe++ = .4-.5NH3:Ni++ = 4-4.2 (molar ratio)Excess Hydrogen = 25-50%Pressure = 3459-3548 Kpa Temperature = 1630C
Run #39. No (NH4)2S0A — — 0 — — in feed tank and basea on second order kineticsRuns #47 and #48.2.4 molar ratio of . (NH4)2S04 to Ni++ in feed tank
• O '
//
//
_L I X
Figure VIII-14.
2 3 4 5Residence Time, minutes
Effect of Ammonium Sulfate Addition on Yield as a Function of Residence Time at 163°C.

184
100
0)u
80
60OJs;
•uQ)>-Q}Z 40m4-)COroQ) 20
Feed Tank Concentrations (gr/liter): Ni++ = 7.5-8.8 Fe++ = 0.4NH3:Ni++ = 4.0 (molar ratio)Excess Hudrogen = 50%Pressure = 3585 Kpa Temperature = 1930C - # — # — Runs #49 and #502.7 molar ratio of (NH4)2S04 to Ni++ in feed tank— 0---0- »Runs #45 and #46 No (NH4)2S04 in feed tank and based on second order kinetics
_____ _
.O'
X X
Figure V III -15 .
2 3 4 5Residence Time, minutesEffect of Ammonium Sulfate Addition on Yield as a Function of Residence Time at 1930C.
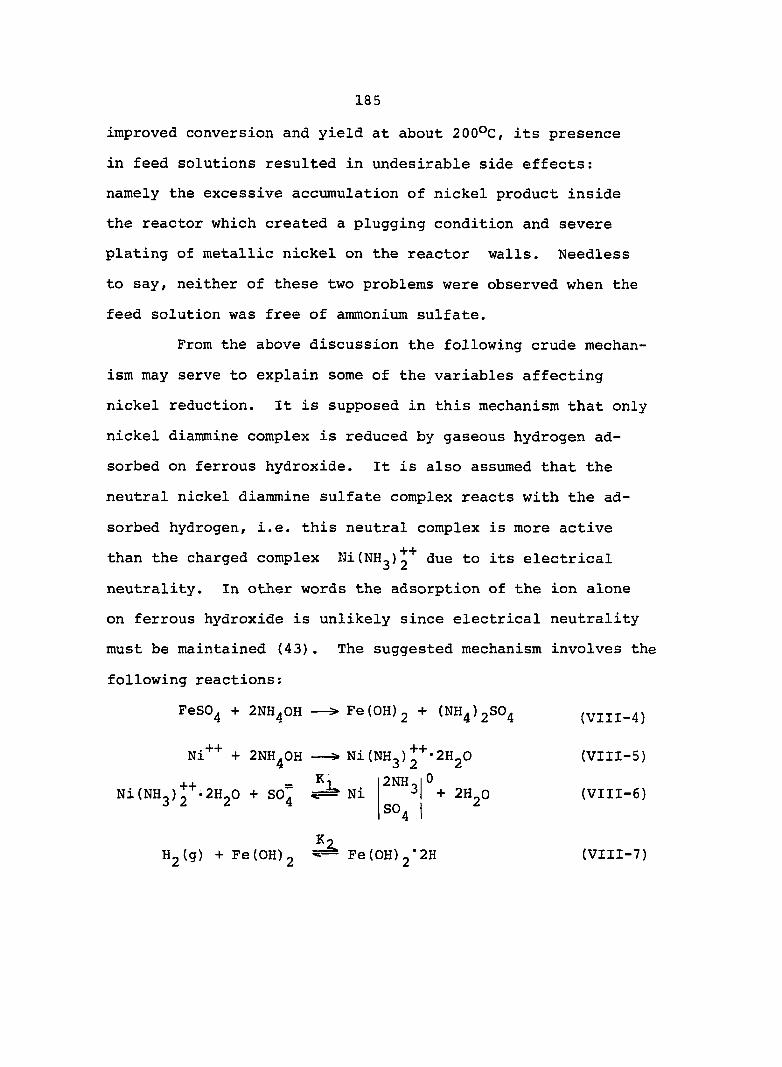
18 5
improved conversion and yield at about 200°C, its presence in feed solutions resulted in undesirable side effects: namely the excessive accumulation of nickel product inside the reactor which created a plugging condition and severe plating of metallic nickel on the reactor walls. Needless
to say, neither of these two problems were observed when the feed solution was free of ammonium sulfate.
From the above discussion the following crude mechan
ism may serve to explain some of the variables affecting
nickel reduction. It is supposed in this mechanism that only nickel diammine complex is reduced by gaseous hydrogen adsorbed on ferrous hydroxide. It is also assumed that the neutral nickel diammine sulfate complex reacts with the ad
sorbed hydrogen, i.e. this neutral complex is more active
than the charged complex NKNH^)^^ due to its electrical neutrality. In other words the adsorption of the ion alone on ferrous hydroxide is unlikely since electrical neutrality must be maintained (43). The suggested mechanism involves the
following reactions;
FeSO^ + 2NH4OH — > Fe(0H)2 + (NH^iaSO* (VIII-4)
Ni++ + 2NH^0H -- 5 . NitNHgjg^'ZHgO (VIII-5)K
Ni(NH2)2^-2H20 + SO' Ni2NH,| 0
1 + 2H_0 (VIII-6)S04 I
Hgtg) + Fe(0H)2 Fe(OH)2‘2H (VIII-7)
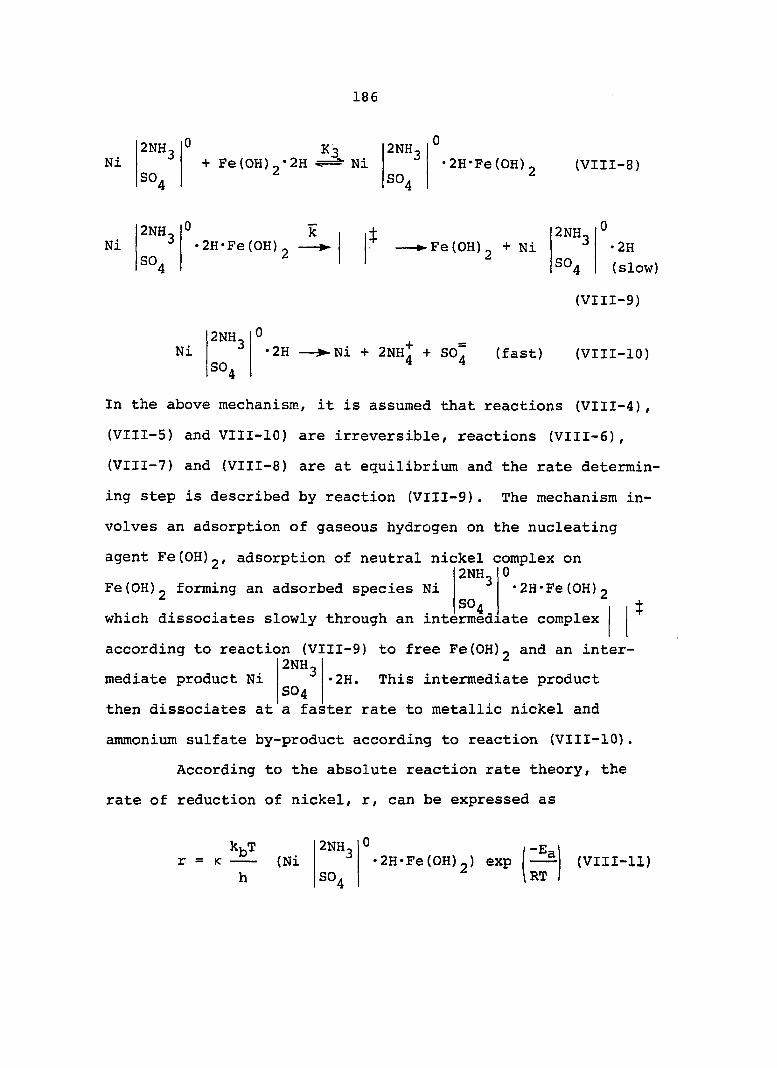
186
2NH3 0 2NH3Ni + Fe(OH) „-2H Ni
SO4 SO4
2NH, 0 k $Ni •2H*Fe(OH)2 -- ►SO4
'2H*Fe(0H) (VIII-8)
Fe(0H)2 + Ni2NH-SO,
0•2H(slow)
Ni2NH.SO,
•2H Ni + 2NH: + SO.4 4 (fast)
(VIII-9)
(VIII-10)
In the above mechanism, it is assumed that reactions (VIII-4), (VIII-5) and VIII-10) are irreversible, reactions (VIII-6 ),
(VIII-7) and (VIII-8) are at equilibrium and the rate determin
ing step is described by reaction (VIII-9). The mechanism involves an adsorption of gaseous hydrogen on the nucleating
agent Fe(0H)2 , adsorption of neutral nickel complex onFe(0H )2 forming an adsorbed species Ni
2NH,SO,
0•2H*Fe(OH)2
which dissociates slowly through an intermediate complex
according to react mediate product Niaccording to reaction (VIll-9) to free Fe(OH)_ and an inter-
2NH^2H. This intermediate productSO4
then dissociates at a faster rate to metallic nickel and ammonium sulfate by-product according to reaction (VIII-10).
According to the absolute reaction rate theory, the rate of reduction of nickel, r, can be expressed as
r = <kbT
(Ni2NH-
80,'2H'Fe(OH)2) exp
-E;RT
(VIII-11)

187
where k . is the transmission coefficient (usually considered
to be unity) , and kj and h are the Boltzman and Planck constants, respectively, T is the absolute temperature, R is the universal gas constant, is the activation energy and the term enclosed by the parenthesis represents the concentration of the reactants. The concentration of the reactants
shown above in equation (VIII-11) can be expressed in terms
of the concentrations of Ni(NH2) g"""'ZH^o, SO^, Fe(0H )2 and the partial pressure of hydrogen Pjj as follows;
Ni
^1 =
2NH.
SO,
[Ni(NH2)++'2H20] (SO")(VIII-12)
[Fe(OH)2*2H]2 P jj [Fe(0H)2] (VIII-13)
[Ni2NH.
SO,•2H*Fe(0H) 2]
[Ni2NH.
SO,] [Fe(OH) 2'2H]
(VIII-14)
By combining equations (VIII-12), (VIII-13) and (VIII-14) and solving for the concentration of the adsorbed species
2NH,Ni
SO,2H'Fe(0H) 2 as

188
[Ni2NH-
SO,■2H*Fe(OH)2] = [FefOHig] [Ni(NH3)2 •2H2O] (SO )
RT
Hence, the rate of nickel reduction becomes:
k,T K,K_K, _ l - E \r = -B [Fe(OH)_] P„ [Ni (NH,), • 2H„o] [SO:] exp —
h RT 2 J ^ ^
By setting k equal to
g . W i e x ph R
The rate equation becomes
-E.RT'
(VIII-16)
(VIII-17)
r = k [Fe(0H)2] [Ni(NH3)2 • 2H2O] (SO ) (VIII-18)
Note that when the feed solution is free of ammonium sulfate, then the rate expression reduces to a second order with respect to nickel ions as long as the formation of the diammine complex is irreversible and fast, i.e.
f = k P [Fe(OH)_] (Ni++)2 2
(VIII-19)
Furthermore for a constant temperature, pressure and ferrous ions concentration, the above rate expression reduces to
r = k(Ni++)2 (VIII-20)
which is used in Chapter VII.
CHAPTER IX
CONCLUSIONS
The results of this study show that metallic nickel
can be produced continuously by hydrogen reduction from its
ammoniacal solution in the presence of ferrous sulfate in tubular reactor. As demonstrated in this study nickel conversion (to salts and metal) and thus ultimately the yield to metallic nickel, depend on the following kinetic para
meters: ferrous sulfate concentration in feed solution,
pressure, molar ratio of ammonia to nickel at reactor inlet, hydrogen flow rate, temperature and residence time. Since nickel conversion is a measure of the depletion of nickel ions from solution, the yield to metallic nickel is a proper
measure of the extent of nickel reduction. However, owing to experimental limitations, the yield was only evaluated for the most "critical" variables affecting nickel reduction; namely reactor pressure, hydrogen flow rate, temperature and residence time.
The addition of ferrous sulfate affects nickel conversion. Beyond a ferrous sulfate concentration of about0.75 grams per liter, it appears that the conversion is
189
190independent of ferrous sulfate concentrations under the following reactor conditions: 120°C, 3480 Kpa, 2.5 NH^ to Ni'*"'"molar ratio, 200% excess hydrogen input and a residence time of 5 minutes. The role of ferrous ions in nucleating metal
lic nickel is not understood. Ferric sulfate tends to initiate nickel reduction, while stainless steel and dried metallic nickel do not under the above-operating conditions. Therefore, it is not clear whether ferrous ions are hydrolyzed first to ferrous hydroxide and then oxidized in the reactor to
a hydrous ferric oxide which is responsible for nickel precipitation or whether a mixture of ferrous hydroxide and nickel salt acts as a nucleating agent for metallic nickel
formation. Due to experimental limitations, spent solution from the reactor could not be recycled for further processing. Hence, it could not be determined whether or not ferrous sulfate had to be supplied continuously with the nickel feed solution in order for nickel reduction to take place. There
fore, it cannot be stated that freshly-formed nickel auto- catalytically reduces part of the nickel feed.
The yield to metallic nickel approaches the conversion only when the reactor pressure exceeds about 4000 Kpa (580 psia). As the pressure is decreased, the yield drops
sharply due to the formation of nickel hydroxides. Based on
the solubility of hydrogen in water, it appears that only at about 6200 Kpa (900 psia) the soluble amount of hydrogen is responsible for all metallic nickel precipitated. On the

191
other hand, as the pressure is decreased, there seems to be a reaction between gaseous hydrogen and nickel salts to pro
duce metallic nickel, as determined by a mass balance on hydrogen and metallic nickel produced.
The results of this study show that complete nickel
conversion can be obtained with a molar ratio of ammonia to nickel of about 4.0 at a temperature of 120°C, a residence time of 5 minutes for feed solution free of ammonium sulfate.If the feed is buffered with ammonium sulfate, a complete conversion of nickel ions can be obtained with this molar ratio
but at a higher temperature— 193°C. Although the effect ofthe molar ratio of NH^ to Ni "*" ions at reactor inlet on yield was not determined, mass balances on ammonia and nickel
ions consumed in reactor revealed that the molar ratio, of NH^
to Ni"*"*" was about two; indicating that the most easily reduced nickel complex was the diammine, Ni(NH3)^+. The results of this
study also indicate that excess hydrogen input over stoichiometric rate has a pronounced effect on yield but not on nickel conversion. An excess hydrogen of 250% results in a yield value of about 88% under the conditions of: 120°C, 3548 Kpa and a
residence time of 5 minutes. Under these conditions, the stoichiometric hydrogen flow rate can only reduce about half of the nickel values, i.e., 47% yield. Excessive hydrogen
can be used to improve the yield values, but only at the expense of operating the reactor as a fluidized bed since an

192appreciable amount of metallic nickel carry-over was ob
served. For a stable countercurrent flow pattern, a 25 percent excess hydrogen input is recommended.
Nickel conversion and yield to metallic nickel are
both sensitive to temperature. In the absence of ammonium
sulfate in nickel feed solutions, however, the conversion does not change with temperature once the reactor temperature is about 120°C. The yield, on the other hand, increases al
most linearly with temperature under the following reactorconditions: 3583 Kpa, 25% excess hydrogen input, molar ratio
++of NHg to Ni ions of 4.0 and a residence time of 5 minutes.
Under these conditions ammonium sulfate addition to feed solu
tions appears to retard both nickel conversion and yield to metallic nickel when the temperature is equal to or less than 163°C. At a temperature of about 200°C, the addition of
ammonium sulfate seems to improve only slightly the yield to metallic nickel. Though the yield may be improved further at
higher temperatures by buffering the feed solution with ammonium sulfate, severe reactor plugging and metallic nickel
plating on reactor walls can jeopardize the feasibility of continuous reduction operation. Neither of these problems arise, however, when the feed solution is free of ammonium
sulfate. Therefore, nickel sulfide ores leached with sulfuric acid under oxygen atmosphere should make better nickel sulfate feed stock solution for continuous hydrogen reduction than that leached with ammonium hydroxide, i.e., nickel

193ammonium sulfate leach feed solution because of the tendency
for plugging.The results of this study indicate that a rate equa
tion second order with respect to concentration of nickel ions
can be used to correlate nickel conversion and yield to metallic nickel with temperature. Variation of the rate constant with temperature gives an activation energy of 12.45 Kcal. per mole nickel ions consumed and 10.66 Kcal. per mole of metallic nickel produced over the temperature range of 80 to 163°C when the feed is free of ammonium sulfate. Over this temperature range, it appears that the molar ratio of ammonia consumed to nickel salts produced and the molar ratio of ammonia consumed to metallic nickel produced are about two at the limits
of zero and 100 percent yield, respectively. Thus, the most easily reduced nickel complex is the diammine. Also, over
this temperature range, the results indicate that based on the solubility of hydrogen in water, soluble hydrogen accounts for about half of the metal produced when the yield is 100
percent. Therefore, there is a clear indication that gaseous hydrogen is responsible for the reduction of at least half of nickel ions fed to the reactor.
The results of this study show that the rate of nickel reduction increases with temperature. In the absence of ammonium sulfate, and based on nickel conversion alone,
the initial rate of reduction is practically instantaneous.

194For proper determination of the rate of reduction, yield to
metallic nickel must be evaluated which requires proper means of collecting the steady state solid product and esti
mating its nickel content by a combination of analytic and spectrometrie techniques. Under the limitations of the present experimental setup only average values of the steady- state yield were evaluated. Based on these averaged values, the results indicate that there is an apparent equilibrium with a yield value of 88 percent at about 200°C under theconditions of: 3600 Kpa, 25% excess hydrogen input, 0.4 gram
+ + *f +per liter Fe ions in feed tank, molar ratio of NH^ to Niions of 4 at the reactor inlet for a feed free of ammonia
sulfate. Under the same conditions, but when the feed solution is buffered with ammonium sulfate at a molar ratio of2.7 to Ni"*"*’ ions in the feed tank, the yield is about 90 percent.
The results of the exploratory runs on cobalt reduction indicate that a residence time longer than 5 minutes (in order of 30 minutes), a pressure of 5753 Kpa (835 psia) and
a reactor temperature of 220°C (430°F) are required for metallic cobalt precipitation. Under reactor conditions of: 5753 Kpa (835 psia), 220°C (430°F), a residence time of 5 minutes, a 2.5 molar ratio of NH^ to Co^* at reactor inlet and 25% excess hydrogen input, colloidal graphite dissolved in cobalt feed solution at a concentration of 0.5 gr/liter resulted in some metallic cobalt precipitation. Similarly,
the mixture of NagS (0.25 gr/liter) and KCN (0.65 gr/liter)

195added to cobalt feed solution resulted in some metallic cobalt precipitation under the following conditions: pres
sure 3580 Kpa (520 psia), temperature 212°C (415°F), 2 to 1 molar ratio of NHg to Co^* in feed tank, 25% excess hydrogen
input and 5 minutes of residence time. Under similar conditions, however, the mixture of sodium sulfide-sodium cyanide did not initiate cobalt reduction.
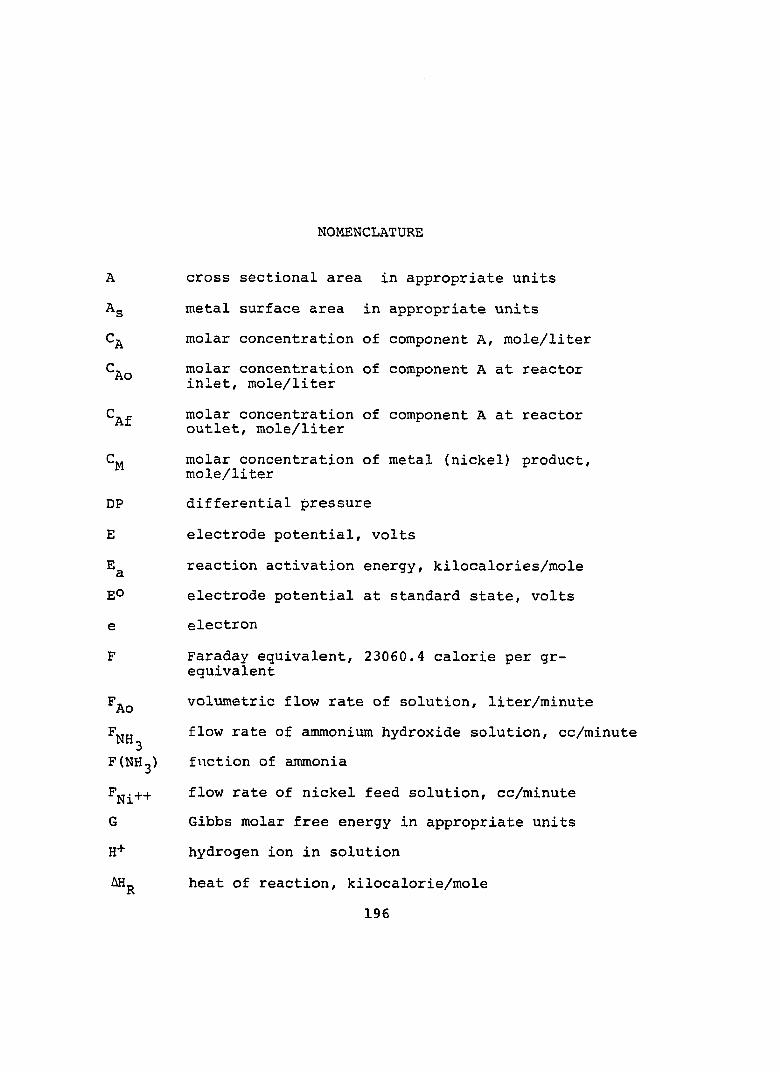
NOMENCLATURE
A cross sectional area in appropriate units
Ag metal surface area in appropriate units
molar concentration of component A, mole/literC. molar concentration of component A at reactor
inlet, mole/liter
C „ - molar concentration of component A at reactoroutlet, mole/liter
C» molar concentration of metal (nickel) product,mole/liter
DP differential pressure
E electrode potential, volts
reaction activation energy, kilocalories/moleE° electrode potential at standard state, voltse electron
F Faraday equivalent, 23060.4 calorie per gr-equivalent
F^^ volumetric flow rate of solution, liter/minute
F^g flow rate of ammonium hydroxide solution, cc/minuteFfNHg) fuction of ammonia
F^^++ flow rate of nickel feed solution, cc/minuteG Gibbs molar free energy in appropriate unitsH'*' hydrogen ion in solution
heat of reaction, kilocalorie/mole196
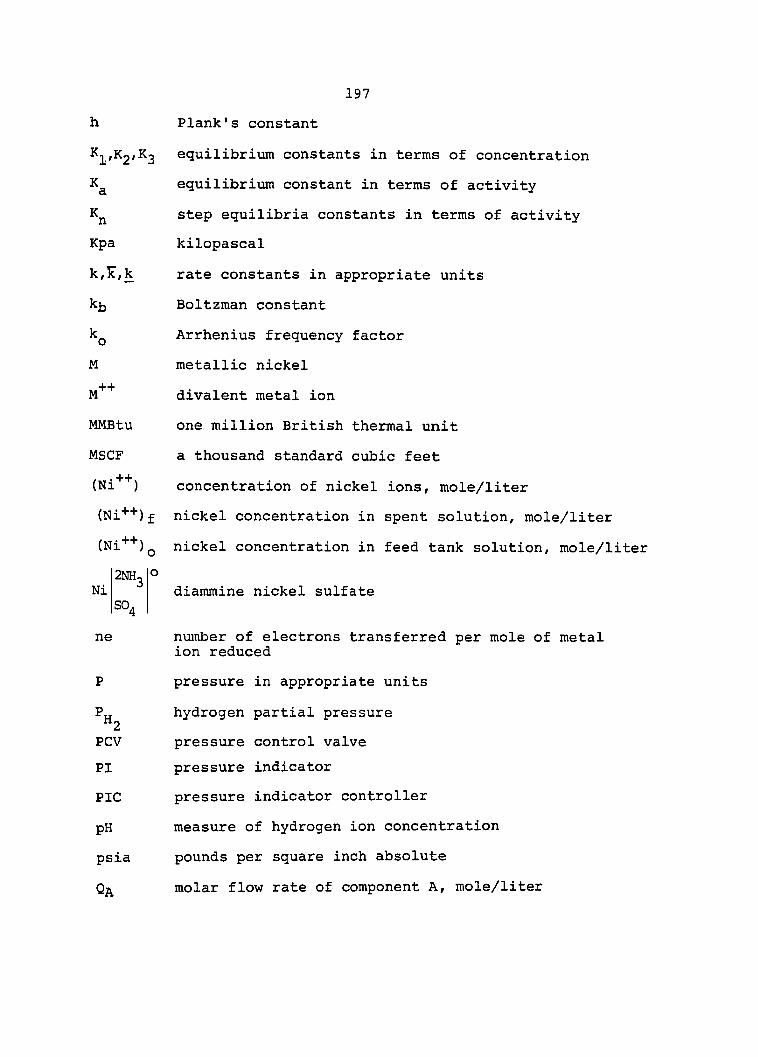
197h
Ka%nKpak,k,k
kb
M
MMBtu MSCF (NÎ++) (Ni++)f
(Ni++)_2NH.
NiSO.
ne
P
'’‘=2PCVPIPIC
pHpsia
Qa
Plank's constant
equilibrium constants in terms of concentration equilibrium constant in terms of activity step equilibria constants in terms of activity kilopascal
rate constants in appropriate unitsBoltzman constantArrhenius frequency factormetallic nickel
divalent metal ionone million British thermal unita thousand standard cubic feet
concentration of nickel ions, mole/liternickel concentration in spent solution, mole/liter
nickel concentration in feed tank solution, mole/liter
diammine nickel sulfate
number of electrons transferred per mole of metal ion reducedpressure in appropriate units
hydrogen partial pressurepressure control valvepressure indicatorpressure indicator controllermeasure of hydrogen ion concentrationpounds per square inch absolute
molar flow rate of component A, mole/liter

198actual hydrogen input, SCFM
theoretical hydrogen input, SCFM R universal gas constant in appropriate units
Rq initial reaction rate in appropriate unitsr reaction rate in appropriate units
(-r^) rate of disappearance of component A, mole/time-literS effective surface area of cobalt in appropriate unitsSCFM standard cubic feet per minuteSTP standard temperature and pressureT absolute temperature, °Kt general timeV fluid volume, liter
VifV2 volumetric hydrogen flow rates at same DP settingbut at different bottle outlet pressures, SCFMreactor volume, liter
W reverisble work in appropriate units
fractional conversion of component A at reactor exitX ^ steady state fractional conversion of component A at
reactor exit
X^^++ fractional conversion of nickel ions at reactor exity^ fractional yield to metal at reactor exity. , steady state fractional yield to metal at reactor
exit
Z distance along reactor in appropriate units
Greek Letters a hydrogen solubility coefficient
B temperature-dependent constant

199
Yj metallic nickel content of solid product< transmission coefficientn efficiency of water electrolysisT residence time, minutes

BIBLIOGRAPHY
1. Barner, H. E., and Scheuerman, R. V. Handbook of Thermo-chemical Data for Compounds and Aqueous Species.New York; John Wiley & Sons, 1978.
2. Beketov, N. N. (1859), Compt. rend.. Vol. 48, p. 442.3. Bjerrum, J. Metal Aminine Formation in Aqueous Solutions.
Copenhagen: P. Haase and Son, 1957.4. Boateng, D. A . ; Ng, T. C. ; Phillips, C. R.; and
Tombalaklan, A. S. "Production of Nickel by Hydrogen Reduction of Nickel-Loaded Organic Acid Solutions,"I.&E.C. Proc. Des. Dev, ^ (1981), 229-232.
5. Brown, R. L. "Steady State Crystallization from Solutions of Metal Salts under Hydrogen Atmospheres at Elevated Temperatures and Pressures." M. S. Thesis, University of Oklahoma, Norman, OK, 1965.
6 . Brunsell, D. A. "A Kinetic Study of the Hydrogen Reduction of Nickel in a Continuous Flow Reactor." M. S. Thesis, University of Oklahoma, Norman, OK, 1980.
7. Burkin, A. R. "Production of Metal Powders and Coatingsby Precipitation Techniques and their Fabrication," Metallurgical Reviews, 12 (1967), 1-14.
8 . Burkin, A. R. and Richardson, F. D. "The Production ofMetal Powders from Aqueous Solutions," Powder Metallurgy, ^ , 1 9 (1967), 33-57.
9. Conner, H. S. "Equilibrium Thermodynamics of CopperDisplacement from Copper Salt Solutions under Hydrogen Atmosphere at Elevated Temperatures and Pressures."M. S. Thesis, University of Oklahoma, Norman, OK, 1968.
10. Cotton, F. A. and Wilkinson, G. Advanced InorganicChemistry. 3rd ed. New York: Interscience Publishers,1972, 860.
200

20111. Courtney, W. G. "The Catalytic Reduction of Cobalt
with Hydrogen from Ammoniacal Cobalt Sulfate Solutions." Journal of Physical Chemistry. 61 (1957), 693-694: ~
12. Courtney, W. G. and Schaufelberger, F. A. "Observationson the Kinetics of the Reduction of NiSO^ in Aqueous Solutions." Phys. Chem. Process Metallurgy. Met.Soc. Conferences, 8 (1961) 1277-1290.
13. Evans, U. R. and Wanklyn, J. N. "Evolution of Hydrogenfrom Ferrous Hydroxide." Nature, 162 (1948): 27.
14. Forward, F. A. "Ammonia Pressure Leach Process forRecovering Nickel, Copper and Cobalt from Sherritt Gordon Nickel Sulphide Concentrate." CIM Trans., 56 (1953): 363-370.
15. Forward, F. A. and Halpern, J. "HydrometallurgicalProcesses at High Pressures." Inst. Min. Metal.Trans. 66 (May 1956). London, 191-218.
16. Guenther, W. B. Quantitative Chemistry. Reading, MA:Addison-Wesley, 1968, 341.
17. Habashi, F. Private Communication, Université' Laval,Department of Mining and Metallurgy, Quebec, Canada,May 3, 1982.
18. Ipatieff, V. N. "Early Work on the Displacement ofMetals and Metal Oxides." Journal of Chemical Education. (Mar.1953), 110-115.
19. James. G. R. "Which Process Best for Producing Hydrogen?"Chemical Engineering. (Dec. 1961), 161-166.
20• Kaneko, T. M. and Wadsworth, M. E. "The CatalyticReduction of Cobalt from Ammoniacal Cobalt Sulfate Solutions." J. Physical Chemistry. 60 (1956), 457-462
21. Kieswetter, 0., Jr. "Reduction of Cupric and NickelousIons from Aqueous Copper and Nickel Sulfate Solutions by Hydrogen." Ph.D. Thesis. University of Oklahoma, Norman, OK, 1973.
22. Klocke, D. J. and Hixon, A. N. "Solubility of FerrousIron in Aqueous Ammoniacal Solutions." I.&E.C. Proc. Des. Dev, n, 1 (1972), 141-146.
23. Kothari, R. H. "Precipitation of Metals from Their SaltSolutions by Hydrogen." M. S. Thesis, University ofOklahoma, Norman, OK, 1971.

202
24. Kunda, W., and Hitesman, R. "The Reduction of Cobaltfrom Its Aqueous Ammine Ammonium Sulfate System Using Hydrogen under Pressure." Hydrometallurgy. 4 (1979), 347-375. -
25. Kunda, W . ; Warner, J. P.; and Mackiw, V. N. "The Hydro-metallurgical Production of Cobalt." CIM Trans. 65 (1962), 21-25.
26. Mackiw, V. N.; Lin, W. C.; and Kunda, W. "Reduction ofNickel by Hydrogen from Ammoniacal Nickel Sulfate Solutions." Journal of Metals. 9, 6 (1957), 786-793.
27. Meddings, B.; Kunda, W . ; and Mackiw, V. N. "The Preparation of Nickel Coated Powders." Powder Metallurgy.New York: Interscience Publishers, 1961, 775.
28. Muller, Schlecht, Schubart: U. S. Patent 1,686,391 (1928)
29. Neskora, D. R. "Copper and Nickel Production by Continuous Steady-State Hydrogen Reduction from Aqueous Ionic Salt Solutions." Ph.D. Thesis. University of Oklahoma, Norman, OK, 1973.
30. Neskora, D. R.; Brown, R. L . ; and Sliepcevich, C. M.U. S. Patents 3,833,351 and 3,877,931.
31. Pierce, W. C.; Haenisch, E. L.; and Sawyer, D. T.Quantitative Analysis. 4th ed. New York; John Wiley, 1958.
32. Plumb, P. D. "Continuous Hydrogen Reduction of Nickelfrom Sulfate Solution: Operational Feasibility."M. S. Thesis. University of Oklahoma, Norman, OK,1980.
33. Pray, H. A.; Schweickert, C. E . ; and Minnich, B. H."Solubility of Hydrogen, Oxygen, Nitrogen, and Helium in Water at Elevated Temperatures." Industrial and Engineering Chemistry. 44, 5 (1952), 1147-1151.
34. Sakano, T.; Nagano, T.; and Terada, F. "Metal Precipitation from Solution by Hydrogen Reduction-Rate of Reducation of Cobalt by Hydrogen from Ammoniacal Cobalt Sulfate Solution." Journal Mining Institute (Japan) 75, 853 (July 1959), 469-473.
35. Schaufelberger, F. A. "Precipitation of Metal from SaltSolution by Reduction with Hydrogen." Journal of Metals. 8 (1956), 695-704.
2 0 3
36. Schaufelberger, F. A. U. S. Patent 2,734,821.37. Schaufelberger, F. A. and Roy, T. K. "Separation of
Copper, Nickel and Cobalt by Selective Reduction from Aqueous Solution." Trans. Inst, of Mining and Metallurgy. 64 London (1955), 375-398.
38. Schaufelberger, F . A. and Roy, T. K. U. S. Patent2,694,005.
39. Sircar, S. C. and Wiles, D. R. "Hydrogen Precipitationof Nickel from Buffered Acid Solutions." Trans, of Meta. Soc. AIME. 218 (1960), 891-893.
40. Sista, K. M. "Continuous Hydrogen Reduction of Copperfrom Its Sulfate Solution; Kinetic Study in a Plug Flow Reactor." Ph.D. Thesis. University of Oklahoma, Norman, OK, 1978.
41. Stubina, N. M. and Distin, P. A. "Direct Cobalt Recovery from Loaded Kelex 100 by Reaction with Hydrogen." The 21st Annual Conference of Metallurgy." Reprint No. 15.2, Canadian Institute of Mining Metallurgy. (Toronto, Aug. 29-Sept. 1, 1982).
42. Tammann, G. and Nernst, W. (1892). Z. Physik, Chem.,9, 1.
43. Thorne, P. C. L. and Roberts, E. R. Inorganic Chemistry.New York: Interscience Publishers, 1948, 299.
44. Tronev, Bondin, Demenu, Buinov, et al. ChemicalAbstracts. 44 (1950), 901-902 and 45 (1951), 55, 927.
45. Tronev, Bondin and Khrenova. Chemical Abstracts. 4 5(1951), 2359
46. u. S., Department of Energy Report, DOE/CS/40132,2 1980.An Assessment of Energy Requirements in Proven and New Copper Processes, by University of Utah, Dept, of Metallurgy and Metallurgical Engineering.
47. Wimber, R. T. and Wadsworth, M. E. "Kinetics of thePlatinum-Catalyzed Hydrogen Reduction of Aqueous Cobalt Sulfate-Ammonium Acetate Solutions." Trans.AIME. 221 (1961), 1141-1148.
48. Young, R. S. Chemical Analysis in Extractive Metallurgy.London: Charles Griffin & Company, Limited, 1971,119.

APPENDIX A
EXPERIMENTAL OBSERVATIONS ON REDUCTION OF COBALTOUS SULFATE SOLUTION WITH HYDROGEN IN A
CONTINUOUS TUBULAR REACTOR
The following exploratory runs were made using the same experimental setup previously described in Chapter IV
for the nickel reduction runs. Due to the nature of these runs, no attempt was made to correlate the results since the main objective was to explore the feasibility of continuously
reducing Co ions by hydrogen in a tubular reactor. All chemicals used in these runs were reagent grade.Run #1
The objective of the run was to examine the possi
bility of using hydrated sodium sulfide (NagS-SHgO) as a nucleating agent under normal conditions as reported in the literature (24). The concentrations of the feed solution were 5 gr Co^^/liter and 0.1 gr NagS/liter. The feed solution was pumped to the reactor at a rate of 70 cc/min. The
ammonium hydroxide solution was injected separately into the reactor at a rate of 10 cc/min; thus making the molar ratio of NH^ to Co*^ of about 2.5 at the reactor inlet. A 25%
204

2 0 5
excess hydrogen input was used. The reactor was isothermal with an average temperature of 177°C (350°F). The reactor total pressure was 3580 Kpa (520 psia) and the liquid residence time was 5 minutes.
The run was terminated after only 35 minutes of
operation due to reactor plugging with product. Most of the product was found in the liquid-solid separator, however.The product collected was deep blue in color and gelatinous in nature. The product was washed and dried, and its dry weight was 21 grams. The dry product was not magnetic and was very similar in color to the salt obtained by mixing Co '*’ and NH^OH solutions. It was concluded from this run that
under the above operating conditions, sodium sulfide did not nucleate the cobalt reduction reaction. This finding was in contrast to that reported by Kunda et al. (24) who reported
that under the conditions of 300 to 800 psig and 300 to 400°F, and with up to 0.78 gr NagS/liter a complete conversion of
cobalt could be otained within 25 minutes in a batch reactor. Run #2
This run was made under the same operating conditions as in run #1 except that molar ratio of NH^ to Co'*"'’ at the reactor inlet was decreased to about 1.0. The objective of
this run was to check whether the reduction would proceed under a lower pH value.
The run lasted 100 minutes and the spent solution was analyzed for both cobalt and pH. The pH remained

206
essentially constant throughout the run at about 7.9 while+ +the steady state conversion of Co was 75 percent. The pro
duct collected in the liquid-solid separator was, however,
very similar to that of run #1. Therefore, it was concluded that sodium sulfide alone did not nucleate the reduction reaction under the above operating conditions.Runs #3 and 4
The objective of these two runs was to see if hydro-
quinone would nucleate the reduction reaction of cobalt. It was reported by Kaneko et al. (20) that hydroquinone was a better nucleating agent for cobalt reduction than colloidal graphite in a batch reactor under the conditions of 450°F and 800 psig total pressure. Both runs were made with freshly prepared cobaltous solution feed of 5.0 gr Co^^/liter con
centration. The molar ratio of NH^ to Co^^ at the reactor
inlet was about 2 to 1, and a 25 percent excess hydrogen input to the reactor was used. A predetermined weight of hydroquinone to give a concentration of 0.5 gr/liter was added and
mixed thoroughly in the feed tank a few minutes before the start of each run. In both runs the liquid residence time was 5 minutes.
In run #3, the feed solution was preheated to the reactor temperature of 177°C (350°F). The total reactor
pressure was 3580 Kpa (520 psia). The reactor was plugged after only 35 minutes of operation and hydrogen was cutoff. The product collected during this period was dark blue and

207
gelatinous salts of cobalt. Upon inspection of the reactor interior, it was packed with cobalt salts in the form of a cake adhered to the walls. There was no visual sign of any
reduction to metallic cobalt in this run.In run #4, the feed solution was not preheated and
the reactor was non-isothermal with a maximum temperature of about 220°C (430°F), about mid-way down the reactor. Other
operating conditions were similar to run #3. The duration
of the run was 100 minutes during which time no sign of anyplugging in the reactor was observed. The spend solution pH was 8.2 and the percentage of cobalt conversion was 92 percent at steady state. The product accumulated in the liquid-
solid separator was again blue in color and non-magnetic.
Therefore, under the above operating conditions, hydroquinone did not nucleate the cobalt reduction reaction.Runs #5 and 6
The objective of these two runs was to see if "Aquadag" (colloidal graphite) could nucleate the cobalt
reduction. Both runs were made with freshly prepared cobaltous solution of 5.0 gr/liter and 2.5 molar ratio of NH^ to Co '*’ at reactor inlet. A 25 percent excess hydrogen input
was used and the liquid residence time was 5 minutes. The
average reactor temperature in both runs was 220°C (430°F). Colloidal graphite was prepared by dissolving a weighed amount of concentrated "Aquadag" (Acheson Colloids Co.) in the feed tank.

208Run #5 was made with a concentration of 0.5 gr/liter
of colloidal graphite. The total reactor pressure was 5753 Kpa (835 psia). The reactor fluid level started to fluctuate after 75 minutes of operation and the run was terminated due
to reactor plugging. The spent solution color was clear in
dicating better than 95 percent conversion of cobalt. However, the product collected was a mixture of dark blue salts and silvery metallic cobalt. The reactor walls were also covered with metallic cobalt and blue salts. The product was washed with distilled water and dried in an oven at 107°C for
24 hours. It was observed that the blue salts turned rosey- red in color perhaps due to oxidation. This rosey salt was found to be soluble in a 2-molar ammonium sulfate solution as well as nitric acid, indicating that the basic salts were
cobalt hydroxides, Co(OH)2 * The silvery metallic cobalt was also soluble in both sulfuric and nitric acids and very magnetic. This silvery-gray powder was further separated from the rosey salts by a teflon covered magnet and analyzed by x-ray energy dispersive spectometry (EDX). It was found that
its total cobalt content (salts plus metal) was about 90 percent by weight.
In run #6 , the concentration of graphite was decreased to about 0.25 gr/liter, while the total operating
pressure was increased to 7582 Kpa (1115 psia). Other operating variables remained constant as in the previous run. The residence time was 5 minutes. The run was terminated due to

209
level fluctuation after 90 minutes of operation. The steady
state conversion of cobalt was 85 percent. The accumulated product in the liquid-solid separator was again heavily con
taminated with basic cobalt salts. The reactor walls were washed and inspected for plating. It was observed that some
metallic plating had taken place which could not be removed with a steel brush. The collected product was washed and dried and again the blue salts turned rosey in color due to possible oxidation. The silver-gray cobalt separated from the product weighed 7.8 gr dry and its cobalt content (salts plus metal) was about 85 percent by weight as determined by EDX analysis. It was concluded from these two runs that colloidal graphite was responsible for initiating the reduction
of cobalt and that an increase in the residence time of the order of 10 to 15 minutes could give better yield to cobalt metal.Run #7
The objective of this run was to examine the possibility of using a mixture of sodium sulfide (NagS) - potas
sium cyanide (KCN) as a nucleating agent for cobalt reduction.
There was no mention in the literature of using such a mixture although the mixture of NagS-NaCN is widely used in industry.
The run was made with a feed solution made of cobalt sulfate (5 gr Co^^/liter), ammonium hydroxide (2:1
molar ratio of NH^ to Co^^), 0.25 gr/liter of NagS and 0.65 gr/

210liter KCN. The feed solution was kept mixed thoroughly in
the feed tank during the run. Note here that the ammonium hydroxide was mixed with the cobalt solution in the feed
tank, which forced the run to be made with a non-isothermal reactor; i.e., the feed solution could not be preheated since
basic cobalt-ammonia salts could precipitate and cause a plugging condition in the feed line upon heating. A 25 percent excess of hydrogen was used; the feed solution rate was
80 cc/min, which equates to 5 minutes of residence time. The maximum reactor temperature was 212°C (415°F) and the total pressure was 3580 Kpa (520 psia). The run was terminated after only 45 minutes due to reactor plugging with product. The spent solution was clear in color.
Most of the product was found in the liquid-solid separator and all was in the form of blue basic salts of
cobalt. Upon brushing the reactor with a steel brush, some more product was collected; it was a mixture of cobalt salts and silvery-gray cobalt metal. This product was further washed with water and then digested in a 2-molar (NH^)
solution. The metallic powder was then collected by means of a magnet and dried. The collected metal resembled that collected in runs #5 and 6 but was not analyzed for cobalt content by x-ray diffraction. The observations made in this run indicated that the cyanide ion was responsible for cobalt nucléation since sodium sulfide alone, as seen in runs #1 and
2 , could not initiate the reduction to metallic cobalt.

211
Run #8The objective of this run was to examine the possi
bility of using a mixture of sodium sulfide (Na^S) and sodium cyanide (NaCN) as a nucleating agent for cobalt reduction.
This mixture has been widely used in industry (15,24) as a
nucleating catalyst for cobalt hydrogen reduction. It was reported by Kunda et al. (24) that in a batch reactor operated under the condition of: (1) temperature, 150 to 200°C(300 to 390°F), (2) total pressure, 1930 to 3858 Kpa (280
to 560 psia), (3) ammonium sulfate concentration in the feed, none to 200 gr/liter, (4) to Co"*" molar ratio of 2 to 3 and(5) a nucleating agent concentration of 0.001 to 0.01 mole NagS/liter and 0.01 to 0.05 mole NaCN/liter, a nearly com
plete conversion of Co"*" to metallic cobalt was obtained within 40 minutes of reduction time.
This run was made with a freshly prepared feed solution consisting of: 5.0 gr Co^*/liter, 0.001 mole NagS/literand 0.01 mole NaCN/liter. This feed solution was pumped to a reactor pressure of 4272 Kpa (620 psia) at a rate of 70 cc/
min. The ammonium hydroxide solution was fed separately to the reactor at a rate of 10 cc/min. making the NH^ to Co"*"*" molar ratio of about 2.5 at the reactor entrance. A 50 percent excess hydrogen input was used. The reactor average temperature was 204°C (400°F). The liquid residence time in the reactor was 5 minutes. The cobalt feed solution was pre
heated to the reactor temperature. The run was made for 90

212
minutes without any level fluctuation. At the end of the run
the spent solution was clear indicating a nearly complete conversion of cobalt.
The solid product collected in the liquid-solid
separator was all in the form of dark-blue basic salts. There was no metallic cobalt whatsoever found in either the liquid- solid separator or in the reactor. It appeared that a resi
dence time of 5 minutes was not enough to reduce the cobalt solution under the above conditions.

APPENDIX B
PRERUN CALCULATIONS FOR
RUN #33
Fresh feed solution volume = 14 liters
Nickel feed solution flow rate = 70 cc/min.
NH^OH feed solution flow rate = 10 cc/min.Molecular weight of NiSO^'GHgO (tech. grade) = 263.2 gram/mole Molecular weight of FeSO^'THgO (reagent grade) = 278 gram/mole Molecular weight of nickel = 58.69 gram/moleMolecular weight of iron = 55.85 gram/mole
Molarity of 30 wt% NH^ solution = 15.71 mole/literFeed tank nickel concentration = 8.5 gram/literAmount of nickel sulfate needed to make 14 liters of 8.5gram/liter nickel solution is:
263.28.5 — g -gg X 14 = 533.67 grams NiSO^’GH^O
For a concentration of 0.5 gram Fe+t/liter in feed tank, the
amount of ferrous sulfate needed is:278
0.5 gg gg X 14 = 34.84 grams Fe^So^'7H 2O
213
214Assuming additive volumes at reactor inlet, then the concentration of nickel becomes
70 ++8.5 = 7.4 37 grams Ni /liter
= 0.127 mole Ni"*"^/liter
For a molar ratio of NH^ to Ni^^ of 3.75, the concentration of ammonia at the reactor inlet is
0.127 (3.75) = 0.476 mole NH^/liter.The concentration of ammonia in ammonium hydroxide feed tank is
800.476 — = 3.808 mole NH^/liter.
Using a 30 wt% ammonia solution the amount needed to make a 3.808 molar solution is
^‘ = 0.242 liter of 30 wt% NH, solution.15.71 3Since the concentration of nickel at reactor inlet is 7.4gram/liter and the total volumetric flow rate through thereactor is 80 cc/min, then the molar flow rate of nickel is
^'2^ = 2.238 X 10“5 lb mole per min.58.69 X 454
Assuming that one mole of hydrogen reduces one mole of nickel
then the stoichiometric flow rate of hydrogen is2.238 X 10"5 X 379 = 8.5 X 10“3 SCFM - H^.
At 25% excess the hydrogen flow rate becomes
8.5 X 10-3 X 1.25 = 0.0106 SCFM - H2

215which correspondends to about 0.3 inch-water on DP cell as obtained from the calibration curve C-1.

APPENDIX C
CALIBRATIONS
For the DP CellThe calibration is graphically presented in Figure
C-1 and was taken from Sista's thesis (solid line). The
dotted line in Figure C-1 is based on bottle outlet pressure of 125 Psig and is calculated from the following equation:
V 2 = (Pi/P2)^, SCFMwhere is the volumetric flow rate when the bottle outlet
pressure (P^) is equal to 754.7 Psia, P2 is equal to 139.7Psia and V2 is the volumetric flow rate at P2 and at thesame DP setting as V^.For Outside Reactor Wall Temperature with Fluid Temperature
The calibration procedure is explained in Chapter VI,
The calibration curve is presented in Figure C-2.
216

— • -- • — Hydrogen Bottle Outlet Pressure = 750 Psig— O - - - - - - Hydrogen Bottle Outlet Pressure = 125 Psig0 .20 -
0.18
0.16 6Ts:U.
" 0.14
0.12
0 .10 -
0.06
0.04
0.02
0 1 2 3 4 5Inches of Water on DP-cell 6 7 8
N)
Figure C-1. DP-Cell Calibration Curve.

218
400 ,400
350 350
p 300 300
I—250 250
o 200 200
150 150
100 100100 150 200 250Fluid Temperature, op
Figure C-2. Reactor Temperature Calibration; Flow Rate = 100 cc/min.300 350 400
roS.OJQ.£o
<u" D
in4-)3os.ou(ÜdJ

APPENDIX D
PREVIOUS WORK ON NICKEL REDUCTION BY
HYDROGEN IN TUBULAR REACTOR
Results reported by Brunsell (32) and Plumb (6) on the continuous hydrogen reduction of nickel from its ammoniacal solution buffered with ammonium sulfate are presented in Figures D-1, D-2 and D-3.
219

220
NiSO, Cone. = .16-.17 M (NH4T2SO4 Cone. = 0.4 M NH40H:Ni*+ = 4 (molar ratio) Residence Time = 5 min. Exeess Hydrogen = 50% Reaetor Pressure = 500 Psig
100
Temperature = 400opT 80
Temperature = SOOOp
0.004 0.008PeS04 Concentration, mole per liter
0.012 0.016ter
0.02mol 1e per 1Figure D-1. Nickel Conversion Versus Perrous Sulfate
Concentration According to Plumb (32).

221
Temperature = 400° F NiS04 Cone. = .17-.18 M (NH4)2S04 Cone. = 0.2 M FeSOg Cone. = 0.002 M Residenee Time = 5 min. Exeess Hydrogen = 50% Reaetor Pressure = 500 Psig
100
co(/)0»>cooQ)o
Si<o4->00toSi(/)
NHo to N i Molar RatioFigure 0-2. Niekel Conversion Versus Molar Ratio of Ammonia to Niekel Ions at Reaetor Inlet Aceording to Plumb (32)

222
T TNiSO^ Cone. = .16-.17 M ( N H J p S O a Cone. = 0.005 M NH3:Ni+T = 4 (molar ratio) FeS04 Cone. = 0.005 M Residenee Time = 5 min. Exeess Hydrogen = 50% Reaetor Pressure = 500 Psig © Brunsell's Work Q Plumb's Work
100
80
60
Co
LQ)>CooQ)u
rdin 40
Sito
20
_L°200
Figure D-3.
250 400300 350Reaetor Temperature, opNiekel Conversion Versus Temperature According to Brunsell (5) and Plumb (32).
450
APPENDIX E
ENERGY CONSIDERATIONS FOR THE PRODUCTION OF COPPER BY THE CONTINUOUS HYDROGEN REDUCTION PROCESS
The objective of this appendix is to compare the energy consumptions for the production of copper by electrowinning and by continuous hydrogen reduction. In the absence
of energy values for electrowinning of nickel, it was felt that such a comparison could give some insight to the possible energy savings by utilizing continuous hydrogen reduction. Should data on electrowinning of nickel become available in the future, similar calculations can be made along the lines presented in this appendix.
The energy requirements for the production of 100,000 tons of copper per year using the Continuous Hydrogen Reduc
tion process (CHR) are compared with literature values for three well-known processes employing at present the electrowinning step for the production of cathode copper. Since the CHR process requires hydrogen as a feed, two schemes of hydrogen production are examined. The comparison between the CHR and electrowinning is made in energy units per ton of copper produced since specific cost figures are not available.
223

224
Sista (40) reported that an 80 percent yield tometallic copper could be achieved using the CHR processoperating under the following conditions:
Reactor residence time = 10 minutes
Total reactor pressure = 3548 Kpa (515 psia)Reactor average temperature = 204°C (400°F)Inlet feed concentration = 20 gr Cu^^/literExcess hydrogen input = 25%
Based on an operating schedule of 360 days per year, thefeed rate of copper leach solution can be calculated as
105 ton Cu 2000 lb----------- X--------yr ton 455.5 lb mole Cu
0.8 lb Cu ^ 360 day ^ 63.54 lb Cu** ^ 24 hr hrlb Cu^* yr lb mole day
For the reduction reaction
Cu++ + ^ Cu + 2H" (E-1)
and using 25 percent excess hydrogen over the stoichiometric rate, the hourly hydrogen feed rate is
455.4 lb mole Cu*+ 379 SCF-H- x 1.25 2151.7 MSCF-------------------- X------------------- = -----------
hr lb mole hrwhere (MSCF) denotes 1000 standard cubic feet at 60°F and 14.7 psia total pressure. Therefore, the hydrogen requirement to produce one ton of copper in the CHR process would be
215.7 MSCF-HgX 360 X 24 mSCF-H,hr “2
100,000 ton Cu yr
2 2 5
To supply the necessary amount of hydrogen for reducing copper in the CHR process, two alternatives will be evaluated; namely, catalytic reforming of natural gas and water electrolysis.
Steam reforming of natural gas is a widely used process for the production of hydrogen whenever natural gas
or paraffins are abundant. It involves an endothermie re
action between methane (CH^) and steam over a nickel-containing catalyst as represented by
CH.(g) + H_0(g) — ■ ^ CO(q) + 3H-(g) (E-2)"catalyst ^
The feed must be sulfur-free to prevent poisoning of the catalyst. The synthesis gas (CO + H^) is passed through a converter packed with a promoted-rion catalyst where the carbon monoxide is reacted exothermally with steam to produce
hydrogen and carbon dioxide according to the following reaction:
FeCO(g) + H_0(g) ---------- COu(g) + H. (g) (E-3)
'catalyst ^ ^Hence the overall reaction for hydrogen production with
steam reforming of natural gas can be written as
CH^ + 2 H2 O ^ COg + 4Hg (E-4)
It can be seen from equation (E-4) that complege conversion of methane would produce four moles of hydrogen for every mole of methane fed. Typical operating conditions of methane reforming are 800°F and 110 psig. Under such conditions the

226
conversion of methane to hydrogen is about 70 percent.Typical requirements for such a process are (19):
Natural gas per 1.0 MSCF-Hg produced = 450 SCFPower (for compression) per 1.0 MSCF-Hg = 2.5 kw-hr
Therefore, the amount of natural gas required to produce18.6 MSCF of hydrogen which in turn will produce one ton of
copper in the CHR process is
18.6 MSCF-H- 450 SCF-CH, 8.4 MSCF-CH. -------------2 ^ ----------- 4 ^ -------------4
ton Cu MSCF-Hg ton Cu
and the electrical energy needed for compression in the gas
reforming process would be
18.6 MSCF-Hg 2.5 kw-hr 46.5 kw-hr---------------------------------- X ---------------------------- = ------------------------------
ton Cu MSCF-Hg ton Cu
Hence, and based on a 32.5 percent electric power generationefficiency, the total energy requirement to produce one toncopper in the CHR process which utilitizes natural gas asthe source of hydrogen is
8.4 MSCF-CH. 10® Btu 0.000293 kw-hr—------------------------------- X -- -------------------- X ------------------------------------------ X 0.325 +
ton Cu MSCF-CH^ Btu
^ = 846 kw-hr per ton Cu ton Cu
= 850 kw-hr per ton Cu Note that an energy value of methane of 1000 Btu per stand
ard cubic foot has been used in the above calculation. An

227
energy equivalent of 0.0105 million Btu per kw-hr (0.0105MM Btu/kw-hr) can be obtained from burning 10.5 SCF of
methane in a power plant operating with an efficiency of32.5 percent to generate one kw-hr, i.e..
Power generagion _ energy output efficiency energy input
_ ____ 1 kw-hr X 3413 Btu/kw-hr10.5 SCF-CH^ X 1000 Btu/SCF-CH^
= 0.325An alternative process for hydrogen production is
water electrolysis. It's overall chemical reaction is;
HgOfA) ^ Hgfg) + 1/2 Ogfg) (E-5)
In conventional operation, a direct-current (dc) potential
is applied across electrodes bounding a cell containing an alkaline electrolyte solution. Current flows through the cell, and the electrochemical dissociation of water leads to hydrogen gas evolved at the cathode and oxygen gas evolved at the anode according to the reactions
2H2O + 2e 20H~ + 2H (cathode) (E-6)
2H ^ HgOg) (E-7)
20H" 20H + 2e (anode) (E-8)
20H H 2OOI) + 1/2 0 2 (g) (E-9)
Among the attractive advantages of electrolysis are: it is operable at room temperature, it produces pure hydrogen
and oxygen, both gases are generally separable, and the

228
equipment is relatively compact. The principal disadvantage is that the electrical energy input is large since only the free energy of the reaction (equation E-5) can be interchanged with electrical energy.
Consider a reversible cell in which the overall re
action for water electrolysis is taking place under the standard state conditions of 25°C, 1 atm and all chemical species are at unit activity. Then the minimum value of electrical
energy input in this cell must equal the change in Gibbs free energy of the reaction, i.e.
“^(reversible work) “ (E-10)But the change in Gibbs free energy is also proportional tothe voltage applied across the cell in accordance with Faradaylaw given by
AGO = _nFE° (E-11)
where n is the number of Faradays (gram equivalents) passing
through the cell to complete the reaction, F is Faraday's constant 23.06 Kcal per volt per gram equivalent (26.8
Ampere-hr per gram equivalent) and EO is the cell standard potential in volts. At these standard conditions AGO for
the dissociation of water is 56.7 Kcal per mole of hydrogen, and from equations (E-10) and (E-11) the minimum electrical energy input and the cell voltage can be calculated as

2 2 9
56.7 Kcal 454 gr mole 1 lb mole 1.17 x 10 kw-hrgr mole-Hg lb mole 379 SCF-Hg Kcal
= 0.0795 kw-hr per SCF-Hg
W = -79.5 kw-hr per MSCF-Hg56.7 Kcal
IP = -________________________________________________________. . . . . . 23.06 Kcalgr mole (2 equivalents per mole) êiTiv^ënt:volt
= -1.23 volts
This is the theoretical dissociation potential for water.
In practice higher potentials, around 2 volts, are required in order to overcome irreversible resistance (overvoltage) on the elctrodes. With a cell voltage of 2.0, the amount of electrical energy needed for 1000 SCF of hydrogen would be
W = -4 X 23.06(III)1.17 = -129.3 kw-hr/MSCF-Hg
Define an electrolysis cell efficiency asHeating value of H2 output
n = ------------------------------ (E-12)Electrical energy input
Thus, by taking a 32.5 percent conversion of heat into electrical energy (0.0105 MM Btu per kw-hr) and 325 Btu per SCF-Hg as the heating value of hydrogen, the efficiency for a 2-volts cell producing 1000 SCF-Hg would be
1.0 MSCF-Hg X 0.325 MM Btu per MSCF-H^n =
129.3 kw-hr per MSCF-H^ x ^kw-hr
= 0.24

2 3 0
as compared to the 70 percent efficiency for gas reforming.This large difference in efficiencies results from the need
to supply "high availability" electrical energy. Therefore to supply the CHR process with hydrogen produced by water
electrolysis18.6 MSCF-Hg 130 kw-hr------------- X ---------- = 2430 kw-hr per ton Cu
ton Cu MSCF-Hg
of electrical energy would be needed as compared to about 850
kw-hr per ton copper needed when hydrogen gas is produced in a gas reformer.
In a recent publication (46) several hydrometallur- gical processes employing electrowinning to produce cathode
copper have been evaluated. The evaluation involves an assessment of the material and energy requirements as compared to the equivalent pyrometallurgical processes with a capacity of
100,000 tons of copper per year. The energy requirements for each process were assessed in two respects: (1) an operationalrequirement such as electrical energy and steam generation,
and (2) the energy requirement associated with various chemicals consumed or produced in the processing steps. The most energy intensive step, however, has been found to be the elec
trowinning. It consumes between 30 to 70 percent of the total
energy requirement as shown in Table ET-1.In order to make some comparisons between the con
ventional hydrometallurgical processes utilizing at present
the electrowinning step for the production of copper with

231
the continuous hydrogen reduction process one needs to consider two basic approaches:
(1) Comparison between the energy consumed in the electrowinning step and the energy requirement for the CHR process with a water electrolyzer as the source for hydrogen. This can be the case where electrical energy is cheaper than gas reforming.
(2) Comparison between the energy consumed in the electrowinning step and the energy requirement for the CHR process with a gas reformer to supply hydrogen.
When making these comparisons, however, it is assumed that the energy consumed in all front-end operations of mining,
grinding, concentrating, leaching and separating would be the same in the CHR process as well as the counterpart processes listed in Table E-1. Furthermore, the potential energy savings by using the CHR process supplied with re
quired hydrogen gas produced by either water electrolysis
or natural gas reforming over each of these processes is expressed as
amount of electrical energy required to produce one ton of cathode copper
amount of electrical energy required to produce one ton of copper by the CHR process
as shown in the last column of Table E-1.

TABLE E-1
ENERGY REQUIREMENTS FOR COPPER ELECTROWINNING PROCESSES (45) AND CALCULATED POTENTIAL ENERGY SAVINGS BY USING THE CONTINUOUS HYDROGEN REDUCTION PROCESS AS A SUBSTITUTE FOR ELECTROWINNING OF COPPER
ProcessName Total Energy Requirement
kw-hr ton Cathode Cu
Energy Consumed in Electrowinning
kw-hr ton Cu
% of Total Energy Consumed inElectrowinning of Copper
Potential Energy Savings (ton Cu Produced by CHR Process per ton Cathode Copper)Hydrogen by Hydrogen by Water Natural Gas Reforming Electrolysis
Ni tri c- Sulfurie Acid Leach
7090 2300 32.4 2300 = 0.95 2430« 7 _ 2300 kw-hr L . J - --------------Xton Cathode Cu
ton Cu by CHR 850 kw-hr
Roast- Leach Electro- wi nni ng
2900 2134 73.58 0.87 2.5
FerricSulfate-AcidLeach
4710 2445 51.9 1.0 2.87
NJU)ro
23 3
Using the first approach, and since the CHR process requires 2430 kw-hr for every ton of copper produced when a water electrolyzer is incorporated with it as a hydrogen
supplier, the potential energy savings range from 0.8 to1.0 ton of copper produced by CHR process per ton of copper produced by electrowinning. This finding is expected, however, since in both water electrolysis and electrowinning,electrical energy is the source of work required to increase the free energy of the reactions, i.e. the electrical energy would supply two Faraday equivalents needed for either the dissociation of water or the precipitation of copper from its
sulfate solution. In electrowinning of copper, the overall chemical reaction is
Cu^^ + H^O ==a Cu + 2H" + 1/2 Ogfg) (E-13)
Noting that the reactions at the anode and the cathode of the cell can be written as
HgO 2H^ + 1/2 Og + 2e (anode) (E-14)Cu++ + 2e Cu (cathode) (E-15)
The Gibbs free energy for reaction (E-13) is 41.2 Kcal per mole of copper. Thus the theoretical electrical energy requirement to produce one ton of cathode copper can be calculated from equation (E-10) as
41.2 Kcal 454 gr mole 2000 , , ,«-3 kw-hr _- --------------------------- X X X 1.17 X 10--- ----- =mole Cu lb mole 63.5 Kcal
_ 689 kw-hr ton Cu

234
Therefore, the efficiencies of the three processes listed in Table E-1 are 30, 32 and 28 percent, respectively. These efficiencies are only 4 to 8 percent higher than that of the conventional electrolysis of water calculated previously using equation (E-12). From these calculations it appears that there is no potential in energy savings by using the CHR process with water electrolyzers as the source of hydrogen over the existing electrowinning step unless better efficiencies are obtained through improvements in cell design for water electrolysis.
Based on the second approach, and since the amount of energy required to produce one ton of copper in the CHR
process is 850 kw-hr when reformed natural gas is the source of hydrogen, the potential energy savings are; 2.7, 2.5 and 2.87 ton of copper produced by CHR per ton of cathode copper
as shown in Table E-1. These potential energy savings represent at least a twofold increase in the production capacity by using the CHR process. In short, it seems that the continuous hydrogen reduction process can utilize available energy from natural gas more efficiently simply because there
is no need for the intermediate energy conversion step of natural gas to electricity to metal since natural gas can be reformed to hydrogen which can then be used directly in
copper production.