Universl^ - ShareOK
482
INFORMATION TO USERS This reproduction was made from a copy of a document sent to us for microfilming. While the most advanced technology has been Used to photograph and reproduce this document, the quality of the reproduction is heavily dependent upon the quality of the material submitted. The following explanation of techniques is provided to help clarify markings or notations which may appear on this reproduction. 1. The sign or “target” for pages apparently lacking from the document photographed is “Missing Page(s)”. If it was possible to obtain the missing page(s) or section, they are spliced into the film along with adjacent pages. This may have necessitated cutting through an image and duplicating adjacent pages to assure complete continuity. 2. When an image on the film is obliterated with a round black mark, it is an indication of either blurred copy because of movement during exposure, duplicate copy, or copyrighted materials that should not have been filmed. For blurred pages, a good image of the page can be found in the adjacent frame. If copyrighted materials were deleted, a target note will appear listing the pages in the adjacent frame. 3. When a map, drawing or chart, etc., is part of the material being photographed, a definite method of “sectioning” the material has been followed. It is customary to begin filming at the upper left hand comer of a large sheet and to continue from left to right in equal sections with small overlaps. If necessary, sectioning is continued again-beginning below the first row and continuing on until complete. 4. For illustrations that cannot be satisfactorily reproduced by xerographic means, photographic prints can be purchased at additional cost and inserted into your xerographic copy. These prints are available upon request from the Dissertations Customer Services Department. 5. Some pages in any document may have indistinct print. In all cases the best available copy has been filmed. Universl^ MicrdriSms International 300 N. Zeeb Road Ann Arbor, Ml 48106
-
Upload
khangminh22 -
Category
Documents
-
view
0 -
download
0
Transcript of Universl^ - ShareOK

INFORMATION TO USERS
This reproduction was made from a copy of a document sent to us for microfilming. While the most advanced technology has been Used to photograph and reproduce this document, the quality of the reproduction is heavily dependent upon the quality of the material submitted.
The following explanation of techniques is provided to help clarify markings or notations which may appear on this reproduction.
1. The sign or “target” for pages apparently lacking from the document photographed is “Missing Page(s)” . If it was possible to obtain the missing page(s) or section, they are spliced into the film along with adjacent pages. This may have necessitated cutting through an image and duplicating adjacent pages to assure complete continuity.
2. When an image on the film is obliterated with a round black mark, it is an indication of either blurred copy because of movement during exposure, duplicate copy, or copyrighted materials that should not have been filmed. For blurred pages, a good image of the page can be found in the adjacent frame. If copyrighted materials were deleted, a target note will appear listing the pages in the adjacent frame.
3. When a map, drawing or chart, etc., is part of the material being photographed, a definite method of “sectioning” the material has been followed. It is customary to begin filming at the upper left hand comer of a large sheet and to continue from left to right in equal sections with small overlaps. If necessary, sectioning is continued again-beginning below the first row and continuing on until complete.
4. For illustrations that cannot be satisfactorily reproduced by xerographic means, photographic prints can be purchased at additional cost and inserted into your xerographic copy. These prints are available upon request from the Dissertations Customer Services Department.
5. Some pages in any document may have indistinct print. In all cases the best available copy has been filmed.
Universl^MicrdriSms
International300 N. Zeeb Road Ann Arbor, Ml 48106


8425547
S erp k en c i, Ray Resit
AN INVESTIGATION INTO THE DETERMINANTS OF RETAIL STORE PERFORMANCE
The University of Oklahoma Ph.D. 1984
UniversityMicrofilms
I nternstionsi soon , zeeb Road, Ann Arbor, Ml 48106
Copyright 1984
by
Serpkenci, Ray Resit
All Rights Reserved


PLEASE NOTE:
In all c a se s this material has been filmed in the best possible way from the available copy. Problems encountered with this docum ent have been identified here with a check m ark ^
1. Glossy photographs or p a g e s .
2. Colored illustrations, paper or print_____
3. Photographs with dark background______
4. Illustrations are poor copy______
5. P ages with black marks, not original copy.
6. Print shows through as there is text on both sid es of page .
7. Indistinct, broken or small print on several p ag e s i /
8. Print exceeds margin requirem ents______
9. Tightly bound copy with print lost in spine____
10. Computer printout pages with indistinct print.
11. P age(s)____________ lacking when material received, and not available from school orauthor.
12. P age(s)____________ seem to be missing in numbering only a s text follows.
13. Two pages num bered____________ . Text follows.
14. Curling and wrinkled p a g e s______
15. O t h e r __________________ ■_________________
UniversityMicrofilms
International

THE UNIVERSITY OF OKLAHOMA
GRADUATE COLLEGE
AN INVESTIGATION INTO THE DETERMINANTS OF
RETAIL STORE PERFORMANCE
A DISSERTATION
SUBMITTED TO THE GRADUATE FACULTY
in partial fulfil Invent of the requirements for the
degree of DOCTOR OF PHILOSOPHY
ByRAY RESIT SERPKENCI
Norman, Oklahoma
August,1984

AN INVESTIGATION INTO THE DETERMINANTS OF RETAIL STORE PERFORMANCE
A DISSERTATION APPROVED FOR THE DIVISION OF MARKETING
/nû/(d/ ..Æ-y /p r -
lA Ji4jLlL

© 1984
RAY RESIT SERPKENCI
ALL RIGHTS RESERVED

ABSTRACT
With the growing importance of the service economy
and the much publicized state of lagging productivity gains
in this sector, the area of retailing performance has been
one of special interest to a number of marketing scholars.
However, despite the vast amount of research generated, our
knowledge of the conditions that produce the levels of
performance in retailing remains scarce.Previous investigations of retail store performance
have been "soft" on adequate theoretical conceptualizations,
and overly sinplistic in both measurement and statistical
analyses. In this study, a holistic construal is used to
develop and empirically test a model for the explanation of
retail store performance.This study proceeds from the general assumption that
the performance of a retail store can be explained,
substantially, by the actions, behavior or patterns of
conduct that a unit follows in adopting and adjusting to its
market. Hence, performance is posited to be a complex
function of unit behavior, which in turn is a function of
market conditions. Eleven nonobservational research
hypotheses, each containing several subhypotheses are
empirically tested in a retail setting.
- i V -

The results of the empirical analyses indicate that
market demand conditions (e.g., quality and potential
demand) have a primary influence on retail market structure
(e.g., overstoring and competitive intensity). The research
findings also indicate that the "direct" relationships
between market conditions and various elements of unit
behavior (e.g., managerial and marketing effectiveness) are
not as strong as they were initially expected. However,
both the conditions of market demand and supply, as well as the elements of unit behavior, are found to have important
direct and indirect effects on retail store performance.
- V -

ACKNOWLEDGEMENTS
Over the past five years, I have been richly blessed
with a large cadre of friends, colleagues, and teachers at
the University of Oklahoma. In these pages, I would like to
pay a personal tribute to these people who gave me so much
and to whom, I feel, I have given so little.
Professor James M. Kenderdine and his family have
been a major guiding and loving force in my personal and
professional growth. Without the unfailing support, warmth,
affection and caring of Jim, this effort could not have been
completed. To him, I owe a very personal gratitude and a
debt I can not possibly repay.
Professor Robert F. Lusch has been a very close
personal friend, a mentor, a colleague, and my thesis
chairperson. I have enormously benefited from our close
association, and this thesis represents only a small
fraction of the outcome. I thank him, and his wife,
Virginia, for their friendship, affection and understanding
in the most difficult times of yester years.
Throughout my doctoral studies at Oklahoma,
Professor Bert C. McCammon, Jr. has been a source of
constant support and scholarly inspiration. Working with
VI -

him has been a wonderfully trying and deeply enriching
experience. The research project from which this thesis
evolved was singularly due to his encouragement and support.
I thank him for giving me the opportunity to be a part of
his research efforts and the Distribution Research Program.
Professor Adele M. Hughes has been a close personal
friend, counsel and a wonderful teacher. She has been very
instrumental in my learning of the quantitative tools and
statistical analyses. Professors Malcolm L. Morris and
James A. Constantin have been always helping, listening and
guiding throughout my studies. I have enjoyed and benefited
from their teaching and friendship.
Professors Shane R . Moriarity from the School of
Accountancy, and Joe L. Rodgers from Psychology graciously
accepted to be part of my thesis committe. I thank them for
their participation. And for all my committe members, I am
grateful for providing me the freedom and guidance which
made the thesis writing long but also an enriching and
enjoyable experience. Special thanks also go to the senior
management of the company who helped us collect and
interpret data and teach us about retailing.
I also wish to acknowledge a number of others who
have been a source of much joy to know and be with in
Ok1ahoma.
VI 1 -

I benefited greatly from my discussions with the
fellow doctoral student Humayun Akhter, who has always been
a close and helping friend. Debbie Coykenda11 read and
commented on portions of this manuscript. I will miss her
absence at Toronto. The staff at the Division of Marketing
and the Center For Economic and Management Research were
most accomodating in letting me use the facilities. I would
like to thank them for their understanding and patience over
the years.Knowing Deanna Jackson has been a very special part
of my life in Norman. Her caring and affection were most
instrumental in the completion of this thesis. I will
sorely and dearly miss her in the years to come.
Finally, I like to express my gratitude to a most
loving sister, Ismet Serpkenci, and a dear friend, Haluk
Baristiran, who were always there vjhen I needed them. When
significant others gave up, they gave generously. I thank
them for their unfailing support, trust and faith.
This thesis is humbly dedicated to my beloved
parents. Dr. and Mrs. Ethem Serpkenci.
v m -

TABLE OF CONTENTS
A B S T R A C T ........................... 1v
ACKNOWLEDGEMENTS ....................................... vipage
INTRODUCTION ............................................ 1
Streams Of Research In Retailing ................. 4The Theme Of The Present Study..................... 8Objectives Of The S t u d y ................ 10The General Framework Of The Study................ 13The Significance Of The Research.................. 15The Organization Of The Thesis .................. 17
NATURE AND SCOPE OF R E S E A R C H .............................18
Organization Of The C h a p t e r ...................... 18Retail Store Performance-- Preliminary Definitions 19
Retailing And The Retail S t o r e ................ 19The Concept Of Performance.................... 22
Conceptual And Definitional Issues ........ 23Measurement Issues ........ 28Implications And Definitions .............. 30
Scope Of R e s e a r c h .................................32The 3-D Model-- Nature And Scope Of Research In
Marketing .......................... 32A Classificatory Schema ....................... 39
The Paradigm Of Research . ...................... 44The Concept Of A Paradigm...................... 44Paradigms In Marketing ....................... 46Paradigm-In-Use In Retailing ................. 47
CONCEPTUAL FOUNDATIONS AND PREVIOUS STUDIES OF RETAILINGPERFORMANCE.....................................51
Organization Of The C h a p t e r ...................... 53Conceptual Foundations Of Studies In Enterprise
Performance.............. 53The Market System Concept-- Origins Of Studies
In Enterprise Performance . . . . . . . . 55Major Streams Of Research In Enterprise
Performance...............................58
- ix -

An Evaluation Of Research Streams In EnterprisePerformance...............................67
Macroretailing Performance Studies ............... 68Longitudinal Studies Of Retailing Performance . 69 Cross-Sectional Studies Of Retailing
Performance ........................ 72An Evaluation Of Macroretai1ing Performance
Studies............................. 94Microretailing Performance Studies ............... 97
An Evaluation Of Microretailing PerformanceStudies............................... 112
A MODEL FOR THE EXPLANATION OF RETAIL STORE PERFORMANCE 114
Organization Of The C h a p t e r ................... 114Theoretical And Derived Concepts And Their
Definitions............................. 115Nonobservational Research Hypotheses .......... 121
The Relations Between Elements Of Market Demandand S u p p l y ........................... 123
The Relations Between Elements Of MarketDemand, Supply And Store Performance . 139
The Relations Between Elements Of MarketDemand, Supply And Unit Conduct . . . . 148
The Relations Between Conduct Elements AndStore Performance..................... 161
The Proposed Model Of Retail Store Performance-- ASummary . . . . . . . . . 171
RESEARCH INSTRUMENTS, EMPIRICAL DEFINITIONS AND THESTATISTICAL RESEARCH METHODOLOGY .......... 175
Organization Of The C h a p t e r ................. 175The Sampling D o m a i n ........................... 176The Research Design And Instruments .......... 180Correspondence Rules And Empirical Definitions . 184
Empirical Definitions Of The PerformanceConstruct............................. 187
Empirical Definitions Of The ConductC o nstructs........................... 193
Empirical Definitions Of Market Demand andSupply Constructs...................... 200
The Statistical Research Methodology .......... 206
RESULTS FROM STATISTICAL ANALYSES ..................... 212
Organization Of The Chapter . . . . . 212The General Framework Used In Hypotheses Testing 213
The General Format Of Presentation ........ 213The LISREL Methodology ..................... 216
- X -

Assessment Of Goodness-Of-Fi t In LISRELMethodology............................. 221
Assessment Of Measurement Properties In LISRELMethodology............ 229
Results from Statistical Tests Of NonobservationalResearch Hypotheses ..................... 247
The Relations Between Elements Of Market DemandAnd S u p p l y .......... 249
The Results For Hypothesis-1 .............. 249The Results For Hypothesis-2 .............. 256
The Relations Between Elements Of MarketDemand, Supply And Store Performance 262
The Results For Hypothesis-3.............. 262The Results For Hypothesis-4.............. 268
The Relations Between Elements Of MarketDemand, Supply And Unit Conduct . . . . 274
The Results For Hypothesis-5.............. 274The Results For Hypothesis- 6 .............. 280The Results For Hypothesis-7 .............. 282The Results For Hypothesis-8 .............. 287The Results For Hypothesis-9.............. 292The Results For Hypothesis-10 . . . . . . 302
The Relations Between Conduct Elements AndStore Performance................... 308
The Results For Hypothesis-11 308Parameter Estimates For More Complex Models . . 316
A Model Of Supply Structure, Unit Conduct andRetail Store Performance ............ 317
A Model Of Market Structure, Unit Conduct andRetai1 Store Performance ............ 324
AN INTERPRETATION OF RESULTS AND CONCLUSIONS ........ 332
Organization Of The C h a p t e r ..................... 332An Interpretation Of Results From Empirical
Analyses................................333Objectives Of The Research Revisited . . . . 333An Evaluation Of Statistical Results . . . . 335
An Evaluation Of Research Results-- H-1 andH - 2 ..............................335
An Evaluation Of Research Results-- H-3 AndH - 4 ..............................345
An Evaluation Of Research Results-- H-5 AndH - 6 ..............................350
An Evaluation Of Research Results-- H-7,8,9and 1 0 ......................... .... 351
An Evaluation Of Research Results-- H-11 . 355An Overall Evaluation Of Empirical Analyses . 356
Implications Of Research For The Management OfRetail Enterprises ....................... 359
- XI -

Some Further Thoughts And Reflections On TheResearch .............................
Contributions To Theory ................Contributions To Research Methodology . .Contributions To Practice ..............
Summary and Conclusions ............ ..
377377379384386
REFERENCES.............................................. 388
Aooendi x page
A. THE CORRELATIONS AMONG ALL THE MANIFEST VARIABLES . 427
B. THE VARIANCES AND COVARIANCES AMONG ALL THE MANIFESTVARIABLES ....................................431
C. THE RESEARCH INSTRUMENTS USED IN THE STUDY . . . . 435
- XI 1

LIST OF EXHIBITS
Exhibi t page
1. A Classificatory Schema For Retail PerformanceStudies.................... 40
2. A Classification Of Previous Retailing PerformanceR e s e a r c h ......................................... 43
3. A Path Analytic Schemata Of Research Hypotheses InIndustrial Organization Studies ........ 61
4. A Path Analytic Schemata Of Harvard Studies OnEnterprise Performance ........ 64
5. A Path Analytic Schemata Of PIMS Studies On BusinessPerformance....................................... 66
6. A Causal Schemata Of The Effects Of Per CapitaIncome On Retail Labor Productivity ............ 76
7. A Causal Schemata Of The Effects Of PopulationGrowth On Retail Labor Productivity ............ 78
8. Results Of A Regression Analysis From Bucklin(1978b).......... 82
9. Results Of A Regression Analysis From Bucklin (1977) 84
10. Marketing Approach To Productivity Analysis InRetailing......................................... 88
11. Research Hypotheses Advanced By Lusch and Ingene(1980b)........................................... 91
12. Determinants Of Labor Productivity From Ingene(1982) 93
13. The Set Of Predictor Variables From Clawson (1974) 106
14. Definitions Of The Theoretical Concepts In TheStructure-Conduct-Performance Paradigm . . . . 118
XI 1 1

15. Definitions Of The Derived Concepts In TheStructure-Conduct-Performance Paradigm . . . . 119
16. A Summary Of The Relationships Between The ElementsMarket Demand And Supply ...................... 126
16. A Summary Of The Relationships Between The ElementsMarket Demand And Supply (Cont.) .............. 127
17. The Proposed Relationships Between Elements OfMarket Demand And Supply ...................... 134
18. The Proposed Relationships Between Elements OfMarket Demand, Supply And Performance .......... 147
19. Elements Of Retailer Conduct From Alderson (1965) 151
20. The Proposed Relationships Between Market ConditionsAnd Elements Of Unit C o n d u c t ............... 159
21. The Proposed Relationships Between Elements Of UnitConduct And Unit Performance.................. 168
22. Structure Of The Proposed Model For The ExplanationOf Retail Store Performance .................... 173
23. The Scope Of The Market Research S t u d y ............ 177
24. The Operating Profile Of The Sample Stores . . . . 179
25. The Empirical Definitions Of The Latent Variables 188
25. The Empirical Definitions Of The Latent Variables(Cont.)......................................... 189
26. Results Of A Common F.A. On The Dimensionality OfThe Performance Construct ...................... 192
27. The Latent Variable Model In LISREL .............. 218
28. The Measurement Model In L I S R E L ....................219
29. A Hypothetical Model For The Assessment OfMeasurement Properties ........................ 235
30. Summary Of Statistical Measures In Assessing ResultsFrom Statistical Analyses ...................... 244
31. Operationalizations Of The Latent Variables . . . 245
31. Operationalizations Of The Latent Variables (Cont.) 246
XIV

32. Correlation Matrix For Hypothesis-1 250
33. Model Specification And Standardized Estimates ForHypothesis-1 252
34. ML Measurement Parameter Estimates For Hypothesis-1 253
35. ML Structural Parameter Estimates For Hypothesis-1 254
36. Correlation Matrix For Hypothesis-2 ............. 258
37. Model Specification And Standardized Estimates ForHypothesis-2 259
38. ML Measurement Parameter Estimates For Hypothesis-2 260
39. ML Structural Parameter Estimates For Hypothesis-2 261
40. Correlation Matrix For Hypothesis-3 264
41. Model Specification And Standardized Estimates ForHypothesis-3 265
42. ML Measurement Parameter Estimates For Hypothesis-3 266
43. ML Structural Parameter Estimates For Hypothesis-3 267
44. Correlation Matrix For Hypothesis-4 ............. 27045. Model Specification And Standardized Estimates For
Hypothesis-4 ................................. 271
46. ML Measurement Parameter Estimates For Hypothesis-4 272
47. ML Structural Parameter Estimates For Hypothesis-4 273
48. Correlation Matrix For Hypothesis-5 276
49. Model Specification And Standardized Estimates ForHypothesis-5 277
50. ML Measurement Parameter Estimates For Hypothesis-5 278
51. ML Structural Parameter Estimates For Hypothesis-5 279
52. Correlation Matrix For Hypothesis-6 ............. 282
53. Model Specification And Standardized Estimates ForHypothesis-6 ................................. 283
54. ML Measurement Parameter Estimates For Hypothesis-6 284
- XV

55. ML Structural Parameter Estimates For Hypothesis-6 285
56. Correlation Matrix For Hypothesis-7 288
57. Model Specification And Standardized Estimates ForHypothesis-7 289
58. ML Measurement Parameter Estimates For Hypothesis-7 290
59. ML Structural Parameter Estimates For Hypothesis-7 291
60. Correlation Matrix For Hypothesis-8 ............. 293
61. Model Specification And Standardized Estimates ForHypothesis-8 294
62. ML Measurement Parameter Estimates For Hypothesis-8 295
63. ML Structural Parameter Estimates For Hypothesis-8 296
64. Correlation Matrix For Hypothesis-9 298
65. Model Specification And Standardized Estimates ForHypothesis-9 299
66. ML Measurement Parameter Estimates For Hypothesis-9 300
67. ML Structural Parameter Estimates For Hypothesis-9 301
68. Correlation Matrix For Hypothesis-1 0 ................304
69. Model Specification And Standardized Estimates ForHypothesis-10 ................................. 305
70. ML Measurement Parameter Estimates ForHypothesis-10 ................................. 306
71. ML Structural Parameter Estimates For Hypothesis-10 307
72. Correlation Matrix For Hypothesis-11................309
72. Correlation Matrix For Hypothesis-11 (Cont.) . . . 310
73. Model Specification And Standardized Estimates ForHypothesis-11 ................................. 311
74. ML Measurement Paramater Estimates ForHypothesis-1 1 .................. 313
75. ML Structural Parameter Estimates For Hypothesis-11 314
- XVI -

76. Goodness Of Fit Measures For Hypothesis-11 . . . . 315
32077. Supply Conditions, Unit Behavior and Retail Store
Performance-- All Stores ..........
78. Supply Conditions, Unit Behavior and Retail Store Performance-- Metro Stores ........
79. Supply Conditions, Unit Behavior and Reta Performance-- Nonmetro. Stores . . .
80. Market Conditions, Unit Behavior and Reta Performance-- All Stores ..........
81. Market Conditions, Unit Behavior and Reta Performance-- Metro. Stores ........
82. Market Conditions, Unit Behavior and Reta Performance-- Nonmetro. Stores . . .
1 Store
1 Store
1 Store
1 Store
322
323
327
328
. . . 329
83. A Summary Of Results From Empirical Analyses . . . 336
83. A Summary Of Results From Empirical Analyses(Cont.)..........................................337
84. Profitability And RDI Impact Of Relative Size AndOverstoring.................. 363
85. Profitability And ROI Impact Of Relative Size AndTarget Market Reach ........................... 364
86. Profitability And RDI Impact Of Overstoring AndTarget Market Reach .................... 366
87. Profitability And RDI Impact Of Target Market Reachand Intercept Competition ..................... 367
88. Profitability And RDI Impact Df Relative Size AndIntercept Competition ......................... 369
89. Profitability And RDI Impact Of Marketing AndManagerial Effectiveness ..................... 371
90. Profitability And RDI Impact Of ManagerialEffectiveness And Expertness ................ 372
91. Profitability And RDI Impact Of Target Market ReachAnd Marketing Effectiveness ............. . . . 374
92. Profitability And RDI Impact Of InterceptCompetition And Marketing Effectiveness . . . . 376
xvn -

CHAPTER I
INTRODUCTION
Over the past decade marketing scholars have substantially
resolved two controversies that were major stumbling blocks
in the development of the discipline. The "is marketing a
science?" controversy, and the extensive discussions on the
viability of constructing the theory of or theories in
marketing,’ seems to have culminated in an essay by Hunt
(1976a) where he concluded that:The study of positive dimensions of marketing can be appropriately referred to as marketing science^(p.28).
The "broadening the concept of marketing" debate also
resulted in several papers where the conceptual domain of
marketing as the "study of human exchange behaviors" was
firmly established.^ The resolution of these controversies
’ The literature on this topic is extensive. Hunt (1983),Carman (1980), and Schwartz (1963) give summaries. For asample of original and contrasting views the reader is referred to Converse (1945), Bartels (1951), Buzzell (1963), Hutchinson (1952), Jeuck (1953), Vaile (1943b), Baumol (1957), Alderson and Cox (1948).
2 In retrospect, of course, Hunt's paper is significant notso much for its mapping of the nature and scope of studies in marketing but for the injection of a philosophy of science perspective into the discussion.
3 A sample of these debates can be found in Kotler (1972b), Kotler and Levy (1969), Kotler and Zaltman (1971), Luck (1969,1974),Bagozzi (1974, 1975). For a review of attempts at formalization of a theory of exchange in
- 1 -

2
was important since, collectively, they established a
distinct subject matter of study and broadly defined the
nature and scope of the investigations in the marketing
discipline.
In the years following these debates, we have
witnessed a significant shift in both the conceptual
emphasis and the research interest in the marketing
discipline. Marketing scholars are increasingly moving away
from simple descriptions or classifications of marketing
phenomena, towards construction and refinement of
middle-range theories and more rigorous testing of such
theories (Bagozzi 1980b, Zaltman et al 1982). This evolution in the overall discipline, however, has not been
uniformly internalized or diffused in all areas of marketing
research.
The field of retailing is frequently viewed as one
area where such an evolution has been painstakingly slow.
From an historical perspective, this view appears
paradoxical. Retailing as a link in the exchange process
has been a subject of intense inquiry, speculation, and much
implicit theorizing in and out of the marketing literature
(Hollander 1981). Dixon (1982), for example, traces the
intellectual interest in retailing to early Greek
philosophers, while Bartels (1976) credits Paul H. Nystorm
marketing, the reader is referred to Bagozzi (1979) and Ferrell and Perrechione (1979).

"for the initial conceptualization and development of
retailing thought" in the United States at the turn of the
century. Richness of thinking in retailing is also evident
in BucKlin's (1972) Competi tion and Evolution in the
Distributive Trades. as well as in Barger's (1955)
Distribution's Place In The American Economy Since 1869. In
a recent essay on retail patronage preference and behavior,
Sheth (1983) notes that
The Journal of Retailing predates the Journal of Consumer Research by half a century, the Journal of Marketing Research by four decades, and eventhe Journal of Marketing by at least a decade!..,What is conspiciously lacking in this impressiveresearch tradition is the development of a theory.., an attempt at integrating existing substantive knowledge in terms of at least a conceptual framework, or better yet, of a theory of patronage behavior (p.9-10).
Other authors have echoed similar opinions in the contexts
of retailing macrotheory (Hollander 1981), retail location
(Huff 1981), institutional evolution (Hollander 1980), and
retailing in general (Bartels 1981, Hirschman and Stampfl
1980b).
In summary, one is tempted to conclude that despite
this rich tradition of research we are yet to have any
explicit theories of retailing. Furthermore, when examined
from a philosophy of science perspective, much of what we
have in the way of laws, theories, models and so forth, are
woefully inadequate in explaining and predicting retailing
phenomena. Therefore, it is not surprising that retailing

4research is often viewed as backward, and that researchers
in this field are frequently seen as scientific laggards
(Hirschman and Stampfl 1980, p.71)
With this research an attenpt is made to bring a
degree of rigor to the area of inquiry in retailing broadly
known as retailing performance studies. In the following
two sections, the major streams of research in retailing are
briefly reviewed and the specific area of study in this thesis is introduced. The chapter concludes with the
objectives and the significance of this investigation for
theory, practice, and methodology in marketing.
Streams Of Research In Retailing
The retailing process, as in most other areas of
inquiry in the marketing discipline, is simple to describe
and classify. However, it is also an extremely complex
phenomena to analyze, predict and "explain." The need to
simplify the complexities of this reality has forced most
marketing students to focus on rather limited, narrow
aspects of retailing. As one reviews previous retailing
studies, it appears that the research and theorizing is a
relatively disjointed effort, lacking a "unified" focus or
thrust. Aside from the more managerial retailing studies,
the following major streams of research cociprise the bulk of

5contemporary thought in retailing.*
Beginning with the works of Reilly (1931), Converse
(1949), and continuing in the studies by Huff (1964), and
Stanley and Bewail (1975,1978), a number of marketing
scholars have examined the attraction of retail trade areas,
retail sites, and stores with increasing rigor in their
research methods. This stream of research, largely an extension of and adaptation from Central Place Theory has
been, until recently, a relatively distinct area of inquiry.Another major stream, involving the institutional
evolution and patterns of change in retailing, has also been
a relatively isolated area of thought, with a rich
descriptive content, yet largely devoid of any predictive quality.5 More recently, Davidson et al (1976), McCammon and
Hammer (1974), Bucklin (1972) and Hirschman (1978) have been
significant contributors to the literature on institutional
structure and the changes in the structure of retailing,
continuing in the “empiricist" orientation of their
predecessors.
* What is reported here is a rather cursory review of the major research programmes. No effort or claim is made for its completeness, since it is only illustrative in thepresent context. Reader may refer to Hirschman (1981),Hirschman and Stampfl (1980), and Hollander (1980,1981) for similar treatments.
5 See, for example, Hower (1943), Hollander (1966), McNair (1958) and Gist (1968).

6
Other scholars such as Hall et al (1961),
Schwartzman (1971), Bucklin (1977), Hoidren (1960), and more
recently Ingene and Lusch (1981) have investigated the
determinants of retail structure and productivity at
different levels of aggregation. Although it would appear
that the institutional change and determinants of structure
have a common thread by necessity, the latter stream of
research has not been integrated with the earlier works.
In the past several years, we have observed an
intensification of research building upon Martineau's (1958) Personalitv of the Retai1 Store.® Research in this area has
helped bring together the thinking in the behavioral area
(e.g., shopping preference, intentions, motivations, store
image), strategy (e.g., store positioning, location), and
the characteristics of the market (of buyers and sellers) in
"retail patronage" studies.? What is conspicuously absent in
this promising stream of research, however, is any reference
to the notion of performance. Many times, it appears that
"patronage," per se, or some measure of shopping frequency
is posited as the sole indicator of "performance" for the
® The studies by Fisk (1961), May (1971,1972,1981), Pessemier (1979,1980), Darden (1979,1980), Arnold et al(1983), Sheth (1983), and Tigert (1983) are illustrative of these efforts. Peterson and Kerin (1983) provide an excellent review of research, progress, and gaps in this literature.
? See, for example. Journal of Retailino. Winter 1974-75 Special Issue, Darden and Lusch (1983), and Lusch and Darden (1981).

7retail unit. Trying to understand why people shop in the
places they do without examining the results of such
behavior from the establishment's perspective lacks closure.
The stream of research which may be loosely
categorized as retailing performance studies also has a long
tradition. In many ways, however, it is difficult to
separate marketing performance studies from the
investigations of retailing performance. This is especially
true in reviewing the earlier literature which had a
predominantly macro outlook, and when marketing was
primarily seen as distribution.®
More recent investigations, especially those of
Bucklin, Lusch, and Ingene, have a tight institutional focus
in sharp contrast to earlier studies. These authors have
utilized aggregated data at either the sectoral or the SMSA levels, and have employed a common methodology in their
research.® However, this is a mixed blessing, since the
research methods used in these studies have significant
® See, for example, Alderson (1948), Cox (1948), Vaile (1949,1956) Bucklin (1975), Sevin (1965). In this regard, a collection of papers published following a marketing productivity symposium is also illuminating (University of Illinois Bulletin 1960).
® For a representative sample of the literature due to these authors, the reader is referred to Bucklin's short text published by the American Marketing Association (1978a), and to Bucklin (1972,1977,1978b), Bucklin and Takeuchi (1977), Ingene and Lusch (1980), Lusch and Ingene (1980), and Ingene (1982,1983a,b,c).

8
limitations.’°In summary, marketing and nonmarketing scholars have
•both shown a great deal of interest in the description,
organization, and "explanation" of the various aspects of
the retailing phenomena. Clearly, much has been learned in
the process. However, it is also true that more theorizing
needs to be done, and many aspects of the retailing process
remain to be explored and understood (cf., Hollander 1981,
Bartels 1981, Rosenbloom and Schiffman 1981, Hirschman and
Stampfl 1980). With this cursory review as a background,
the balance of this chapter presents an overview of the
major theme, objectives, and the significance of the present
investigation.
The Theme Of The Present Study
With the growing importance of the service economy
and the much publicized state of lagging productivity gains
in this sector, the area of retailing performance has been
one of special interest to a number of marketing scholars.’’
What initially started as a defensive effort (i.e., whether
"distribution costs too much?") has subsequently evolved
’0 The reference here is to statistical tools (i.e.,correlational or regression analyses) that are used inthe empirical research in this area.
” We should also note the extensive research done bynonmarketing scholars, notably the group associated with the NBER. See, for example, Stigler (1956), Kendrick(1961,1973), and Fuchs (1968).
9into inquiries of deeper and more conceptual issues, (e.g.,
why and how distribution institutions or systems perform the
way they do?). However, despite the vast amount of research
generated, our knowledge of the conditions that produce the
levels of performance in retailing remains limited.
The "macro" approach which has come to dominate
research in this area has not produced actionable new
Knowledge. This is because retailing is principally a
"local" phenomena and such macro findings are of little use
or interest to retail managers in programming their
operations. Hence, if one were to view productivity and
financial performance of the retail sector as the
culmination of the operations of the individual units, and
for a moment accept the conclusions of most retail analysts,
our "record" in theorizing and research in retailing is
dismal at best. In order to understand what influences the
levels of financial and economic performance in retailing,
one must look at the microcosm--the retail store.
These comments should not be construed as a call for
"managerial relevance" in our thinking of retailing
phenomena. However, the present study does call for
"breaking away from undifferentiated macro concepts" and
turning to a more rigorous study of the real retail
"industry" itself. In this regard, investigations in
retailing at the macro level (i.e., so called industry

10studies) are defective not so much because they are not
managerial1y relevant but because they are conceptually
unsound.Consider, for example, the following theoretical
definition of an industry from economics:
An industry refers to a group of sellers or of close-substitute outputs who supply a common group of buyers (emphases added, Bain 1968, p.6).
In this sense, the retail industry clearly exists only at
the level of a rather limited market area and not at the
level of aggregates produced by the census. Hence, if onedesires a true understanding of the retailing process, and
especially of the performance of the retailing industry, one
must think of retailing in microcosm. Therefore, it appears
that there is a significant need for us to reformulate our
thinking, and to investigate the factors, linkages, and
mechanisms that have been posited to influence retailing
performance under this light.
Dbiectives Of The Studv
What aspect of retailing phenomena to choose for a
"scientific inquiry" is essentially an arbitrary choice
depending on the interests and the resources of the
researcher. However, although the conventional and
practical considerations weigh upon any choice, a scientific
inquiry into retailing should attempt to contribute to the
theoretical foundations of the marketing discipline.

11As part of this researcher's commitment to the
inquiry into the meaning and measurement of economic
performance in channels of distribution and in channel
institutions» the objective of the present study is to
investigate the determinants of retail store performance.
The primary research question in this study is sinply the
following:
Why do retail stores perform the way they do?
Of the four levels of understanding in explanation, the
question why is indeed the most difficult to answer.'z An
adequate answer requires not only the determination and
specification of relevant factors, but also the structure
and causal ordering of the relationships among them (Bagozzi
1976). In this research, therefore, an attenpt is made:
1. To identify a set of factors thatsystematically impact retail store performance, and
2. To investigate some of the possiblemechanisms through which they operate in a retail setting.
12 The four levels of understanding refer to simple statements of fact and to answers for the “what," "how," and "why" questions. As Bagozzi (1980) notes, "the achievement of understanding in explanation can be seen to occur on various levels ranging from weak or descriptive explanation on the one hand to strong or "why" explanation on the other." The reader is referred to Zaltman et al (1973, p.129-131) and Bagozzi (1980, p.84-5) for more extensive treatments.

12As most philosophers of science point out, however,
science and scientific inquiry not only try to understand
the world and explain phenomena but also seek to control it
(Hunt 1983, Henpel 1366). Therefore, closely related to the primary research question of this investigation, a second
question inevitably follows:
What can one do to change the performance of a retail store?
Accordingly, an inseparable second purpose of this study will be to attempt to bridge the gap that so often seems to
exist between theory and practice.'s However, given the
assumptions and limitations that are inherent in any study
of this kind, the answer(s) to this question can only be
suggestive in nature.
13 Traditionally, the twin questions posed above are dichotomized into positive (what is or happens) or normative (what ought to be). As Machlup (1969) eloquently explains, however, there is a third type, the "instrumental" questions (i.e.,what can happen). In many respects these questions do not have a normative content. The secondary research question is posed in this spirit.

13
The General Framework Of The Studv
In any attempt at explanation, prediction and
understanding of a phenomenon, there is always a framework
that guides the research and the researcher. Such
frameworks, maps or paradigms, however, are rarely
explicated in our professional discourse. As Bagozzi (1976)
notesany theoretical approach builds on a number of premises, and proceeds from a particular orientation, or Wettanschauung, and consequently conflicts on a priori basis with alternative approaches (p.3).
In a recent text on Theorv Construction In Marketing Zaltman
et al (1982) express identical sentiments, noting that
As researchers, managers or consumers, we are constantly making observations about ourenvironment which are organized to form a "map" of our experiences... This map represents our point of view or frame of reference in approaching a particular problem, developing a theory orcollecting and interpreting observations (p.141).
Therefore, it is incumbent on the researchers, in the
interest of intellectual honesty, to make these assumptions
and limitations explicit (Bagozzi 1976, p.3).
Essentially, the paradigm used in this research is
similar to the Structure-Conduct-Performance (SOP) world
view, which is an extension of the generic
Stimulus-Organism-Response (SOR) paradigm of social
sciences.
1 The adoption of a paradigm should not be seen in the same light as the choice of a research problem. Clearly the

14Hence, this study proceeds from the general
assumption that
at any given point in time, the performance of a retail store can be explained, substantially, by the actions, behaviors or the patterns of conduct that a unit follows in adopting and adjusting to its market.
It is important to note that the concept of a "market" in this paradigm refers to ^ closely interrelated group of
buyers and sellers in a given geographical area. In this
regard, the market concept includes but is not restricted to
the notion of "structure" (of the sellers) in industrial organization theory.
In summary, then, the overall objective of this
study is twofold. In trying to explain and understand the
phenomenon of retail store performance:
1. It is hoped that a contribution can be made to the existing thought and theory in the marketing discipline, and further,
2. A frame of reference can be provided for the retail executive and manager, which can be used to more effectively manage retail es tab1ishments.
latter is a normative decision, whereas the paradigm-in-use is an assumption on the part of the researcher as to how the world works.

15The Significance Of The Research
The research questions in this study are important
for several reasons. The order of presentation which
follows reflects the order of importance as perceived by
this writer.
First, in its present form the retailing literature
in the marketing and allied disciplines is soft on adequate
theoretical conceptualizations and, consequently, weak in
its practical implications. Previous investigators have
been reluctant or, at best, ambiguous in providing a general
paradigm of research and a clear conceptualization of the
factors for the explanation of retail store performance. In
this regard, this researcher strongly concurs with Bagozzi
(1976) in that
the time is ripe for marketing to progress frombeing a form of technology where theories and methods of allied disciplines are applied to so called marketing problems to a stage where marketers propose and test theories of their own (p.3).
With this study a step will be taken in this direction.
Second, in the area of research methodology,
previous studies of retailing performance have been overly
simplistic in both measurement and statistical analysis. In
most cases, reliability and validity issues have been
completely ignored, and the testing of hypotheses have
typically relied on simple operationalizations of,
admittedly, latent variables. In this study a holistic

16
construai will be introduced for representing and testing a
proposed model of retail store performance (Bagozzi and
Phillips 1982, Bagozzi 1984). By explicitly modeling the
theoretical and empirical concepts, nonobservable
hypotheses, and the extent of measurement errors, it is
hoped that some of the deficiencies of previous research
will be avoided.Finally, the study is significant in an instrumental
sense. From the perspective of the firm, a purported theory
of retail store performance, to the extent it stands up when
confronted with data from the real world, can be used to
better understand the phenomena.’® Through knowledge that
may be gained with this and other similar studies, one may
help retail managers to better locate, open and operate
retail stores, to more effectively manage retail
establishments and resources, and to better control their
operations.From the viewpoint of society, then, the study is
also significant. To the extent new knowledge is created,
diffused, and used in the field, one can hope to see a
better allocation and management of the physical, financial,
and human resources of retail enterprises, and ultimately.
’® "The term 'real world' is employed in reference to all situations not constructed for, or altered by, theconduct of research. It is not meant to Imply that research settings do not have their own reality" Calder, Phillips and Tybout (1981, p.197).

17a better utilization of the resources of society.
The Organization Of The Thesis
The thesis is organized around seven chapters.
Chapter two defines the primary subject matter of study and
delineates the nature and scope of the present research. Chapter three provides an overview of the conceptual and
theoretical foundations of research, followed by a selective
review of the previous studies of retailing performance.
Chapter four contains definitions of the theoretical
and derived concepts used in the study and presents the
nonobservat i ona1 research hypotheses. These research
hypotheses, collectively, form a tentative model for the
explanation of retail store performance. Chapter five
summarizes the research methodology, including a description
of the data sources and the statistical tools used in the
empirical tests of the research hypotheses.
Chapter six presents a general framework for
empirical analysis, followed by the results of the
statistical tests. The analysis and interpretation of the
substantive findings are summarized in Chapter seven. The
thesis concludes with a discussion of the implications,
significance, and the contribution of this investigation to
theory, practice and research methodology in marketing.

CHAPTER II
NATURE AND SCOPE OF RESEARCH
In most fields of social science, an investigator rarely has
the benefit of well formulated theories to help delineate
the boundaries of research. In this regard, the fields of marketing in general and retailing research in particular
are no exceptions. It is necessary, therefore, for the
researcher to specify the subject matter under
investigation, and to establish the nature and scope of the
inquiry. The purpose of this chapter is to communicate what
precisely is being investigated, with what frame of
reference, and where and how this study fits within the
larger mosaic of investigations in the field of retailing.
Organization Of The Chapter
This chapter is in three major sections. The first
section begins with a description of subject matter of this
study where the terms retailing, retail store, and the
concept of "performance" are defined. In the next section,
a brief commentary on the nature and scope of investigations
in marketing and a classificatory schema is presented to
delineate the scope bf the study. The last section explores
the meaning and role of paradigms in marketing and retailing
18 -

19
research. The chapter concludes with the specification of
the paradigm used in this study.
Collectively, the views expressed in this chapter
should provide the reader with a general idea of the major
guiding assumptions, beliefs and biases of this writer, and
hence the limitations of this inquiry.
Retai1 Store Performance-- Preliminary Définitions
Retail store performance is an extremely broad phenomenon which may take on an entirely different meaning,
depending on how one views the retailing process and at what
level of aggregation one chooses to analyze it.
Furthermore, several unique attributes of the "performance"
notion itself, coupled with the laxity with which the term
is used, also add ambiguity to the dicussion. Therefore, it
is useful to define each of the Key concepts as they are
used in the context of this investigation.
Retailino And The Retai1 StoreHirschman and Stampfl (1980) in a recent paper have
noted that
at the heart of many problems in retail research seems to be a lack of focus and a clear definition of retailing itself (p.68).
Although such a view is sure to have its skeptics, it points
to an often overlooked development in retailing. These

20problems in defining what retailing is and what precisely
constitutes retail research can be traced to the evolution
of thought in the marketing discipline itself. As a branch
of inquiry in the marketing discipline, the field of
retailing could not and has not been immune to the debates
concerning the proper conceptual domain of the construct
labelled marketing.’®
It is not, therefore, surprising that the concept of
retailing today has come to embrace activities of such
diverse conduits as stores, mail-order establishments,
house-to-house sales, hospitals, educational institutions,
and even churches. Although such a "broadened" concept of
retailing may have much heuristic and pedagogical value, it
is of little use in a study of this kind.’?
For the purposes of this research, the retailing
process is defined as those set of activities involved in
the selling of goods and services to ultimate consumers
(Stern and El-Ansary 1982, p.43). This traditional
definition is the most parsimonious and is the same
conceptualization expressed by the definitions committee of
’® The latter discussions have been well summarized in the marketing literature (e.g.. Hunt 1983,1976, Kotler 1972b, Robin 1977a, Bagozzi 1974,1975, Bartels 1974). In retailing the literature is scanty at best (see, for example, Bartels 1981 and Hirschman and Stampfl 1980).
’? In fact, it is an open question if we could ever hope to explain the behavior of all "retailing" forms within a single theoretical framework.
21
the American Marketing Association nearly four decades ago
[Journal of Marketing 1948, p.213 1.
Retail stores, of course, are but one of a large
number of institutional forms which are set up to engage in
selling or exchange activities with ultimate consumers.
Several key characteristics of retail stores, however, set
them apart from other forms of organization. With these
characteristics in mind a retail store in this study is
defined as a profit seeking reseller establishment which
employs people, in a unique spatial location and with
permanent physical facilities, operating within a well
definable local area, and where merchandise and services are provided in exchange for money to the ultimate user or
consumer. Hence, by this "intensions 1" definition,’® many
forms of retail establishments which would otherwise fall
into the domain of the retail store concept are excluded
from analysis.’®
’® An intensional definition of a concept "lists a set of properties such that the term applies to all things having that set of properties, and to nothing else." Although controversial, criteria for "good" intensional definitions include: a good definition must not be toowide or too narrow; it ought to avoid unnecessarily vague, ambigious, obscure, or metamorphical language; it must not be circular; and it should state the essential properties of the things named by that term (Kahane 1973, p.179-184).
’® For example, mail-order retailers (no unique location or local operations), vending machines (no people employed), hotels, motels, restaurants etc., (no merchandise is offered), all nonprofit (retail) service organizations and so forth.

22The Concept Of Performance
The problems with defining and measuring the
performance concept are not new (Buzzell 1972). Economists
have been debating the issue since Adam Smith and they are
no closer to agreement today than they were then (cf., Bain
1968, Vernon 1972, Weiss 1974, and Scherer 1980). When
marketing emerged as a separate area of study at the turn of
the century, some of the earliest writings dealt with the
meaning and measurement of productivity in marketing or of
marketing institutions--a key aspect of performance. ° As
Buzzell (1972) points out
so much has been said and written on [marketing and economic] performance that it is very difficult to offer any new ideas on the subject (p.1).
Over a decade later, marketers, like the economists, are
unable to form a consensus on either the meaning of the
concept or its measurement (Arndt and Helgesen 1981, Bucklin
1975,1978a,b). Two aspects of this problem, one relating to
the several characteristics of the term itself, and the
other concerning the efforts at measurement, are closely
intertwined and are the source of much of this difficulty.
2 0 There is extensive literature on these issues. See, for example. Walker (1946), Alderson (1948), Cox (1948), Vaile (1949a,1956), Banks (1951), Smith (1953), Barger (1955), Converse (1957), and Beckman and Buzzell (1958).

23
Conceptual And Définitional Issues.
The term "performance," in both ordinary discourse
and in a technical, scientific sense, refers to a remarkably
ambiguous concept. This ambiguity stems from the unique
quality of the term in that it derives meaning only in the
context of its use. Hence, we either speak of economic
performance, financial performance, etc., or performance of a firm, industry, actor or product, etc. In either case, if
an explicit definition is lacking, the meaning of the
concept is usually implied by some sort of a consensus
criteria assumed to be known and accepted by all parties.
However, when a number of unique properties of the term are
overlooked in such implicit discourse, it creates confusion.
In this regard, three key attributes of the concept, namely, the nonnegative/relativity, the process-product ambiguity,
and the inherently multidimensional nature are especially
worthy of attention. It is useful to briefly review these
features of the term in order . to understand what
"performance" means in the context of the present
discussion.Nonnegative/relativity of a termor concept refers
to an attribute, when a term or concept does not appear to
have an "absolute zero." In the case of "performance,"
however one may choose to qualify the term, it is not
meaningful to speak of nonperformance, but only of its

24degree or the quality of its p r e s e nce.Hence, we
frequently refer to "high vs. low," "good vs. bad," or
"satifactory vs. unsatisfactory" levels (or amounts) of
performance due to an act, actor or thing, but never to its
absence. To the extent this quality of being absent can be
equated with a state having an absolute zero, the
performance construct does not seem to have such an origin.
Thus, in the absence of a unique starting point, we tend to
anchor a level of performance as a criterion, and measure the amount due to a given source accordingly.22 Because of
this unique quality, the concept of performance always
implies a relative and, ultimately, a normative content.
Process-product Ambiguity refers to a common
attribute shared by a group of terms or concepts, such as harvest, education, science, deduction, e t c . 23 All of these
21 For example, if your car did not start on a cold Januarymorning, it is not true that it has zero performance,rather it simply did not start. The point is that the"performance" concept is meaningful only in the contextof living, functioning or existing actors, things or organisms.
22 The performance of a football team (a given number of W/L record, total amount of offensive/defensive yardage), a jet engine (fuel consumption per mile/hour/passenger, rpm, etc), Roger Moore as 007 (Sean Connery as 007), a business firm (a level of RDI, market share, or growth), an economy (a level of employment, or price stability,absence/presence of normal profits etc) are examples.Obviously, all these anchors may or may not have anobjective basis but the "choice" of a level is generallyarbi trary.
23 In the interest of clarity, it should be noted that "process-product" ambiguity is a label given to these

25terms, like performance, are
used to refer both to a certain activity or process, and also to an outcome, eventuation or product of that process" (Rudner 1966,p.8).
The Oxford English Dictionary (1971), for example, defines
performance as both: [a] "carrying out of a command, duty,
purpose... an act of execution, or fulfillment," and [b] "an
accorrplishment, something performed or done, an achievement,
or a deed" (p.689). In other words, performance may be used
to refer not only to an act but, also to the result or
consequences of the act.This distinction is not a trivial matter. In fact,
it underlies, at least partially, the differences among the
early economists and marketers concerning the "unproductive"
nature of marketing.z* The significance of this distinction
may be summarized as follows:
terms by philosophers of language (Rudner 1966). The previous labelling, "nonnegative/relativity," is a concoction of this writer.
24 It is well known that the classical economists have condemned marketing activities (e.g., advertising and promotion) on the premise that they add no real value to physical products (cf., Bain 1968, Scherer 1980, Buzzell 1972). Here, the view of marketing's "performance" is a set of "activities or behaviors." Marketing scholars, on the other hand, having long resolved the "value" of marketing's functions (e.g.. Weld 1917, Ryan 1935, Jones 1943, Alderson 1965), have viewed marketing's "performance" in its latter context, i.e., the "results" of the marketing behavior or actions (cf., Barger 1955, Alderson 1948, Cox 1948, Bucklin 1978b).

25An explanation of performance as a "behavior" or an
"act" versus performance as the "results" or "outcomes" of
that behavior, although somewhat interrelated, are different
inquiries. Whereas the latter explanation would be
substantially incomplete without the knowledge of the
antecedent actions; the former explanation of performance
(in the sense of behaviors) may have antecedents which may
be completely unrelated to outcomes. Hence, given the "inport of close interrelation between concept and theory
formation," it is important that such ambiguities are
resolved (Hempel 1972).On the final attribute of the performance concept,
i.e. its Multidimensional Nature, there appears to be no disagreement. Scherer (1980), for example, notes
"performance is a multidimensional attribute" as does Bain
(1968), pointing out that "performance... however we measure
it, is complex and has many aspects or dimensions." Not
unlike economists, marketing scholars share substantially
the same view (cf., Buzzell 1972, Bucklin 1978b, Stern and
El-Ansary 1982). The disagreement between (and among)
economists and marketers, however, lies in three
interrelated questions;
1. What are the (relevant) dimensions of performance?
2. Are some dimensions more/less important than others? and.

273. How do we go about measuring each?
There are no clear cut answers to any of these questions.
In the context of the present study, for example, one can
enumerate a number of performance dimensions for a retai1
store, such as:
An Economic Performance Dimension [e.g., profitability, productivity, growth, contribution to material well-being of a community, nation etc. ]A Social Performance Dimension [e.g., consumer content/discontent, quality of worklife, service levels to elderly, etc.], and
A Political Performance Dimension [e.g., lobbying efforts, power or influence in elective processes or in a channel environment].
Obviously, such a list can be extended and various
combinations of each dimension can be devised to produce
other unique dimensions of performance.The second question is a normative query and an
answer to it will depend on the orientation, interest,
and/or curiosity of a given researcher. Thus, it would
appear that the first two questions can be disposed of with
relative ease, since the relevance and importance of any one
dimension depends on the perspective and the purpose of
study. The question on measurement, however, can not be
brushed aside as easily.

28Measurement Issues.
The issues with measuring economic dimensions of
performance can be best described under two major headings.
The first set of issues are more conceptual and concern the
philosophical or methodological orientations found in
econcsnics and in the marketing discipline. The more
frequently discussed second set of issues are more practical
and concern the tasks in “taking measurements" in the course
of an empirical investigation.
The conceptual problems of measurement arise when
the "gaps between the languages of theory and eiipirical
research" are overlooked (Blalock 1968). In this regard,
the earlier forms of positivism and empiricism appear to be
still in vogue in the conduct of research in most areas of
economics and marketing (Bagozzi 1980,1984, Bagozzi and
Phillips 1982). According to this orientation due to
operationalists (Bridgman 1927, Eddington 1933), Hempel
(1952) notes:
any scientific statement, however abstract, could be transformed, by virtue of the definitions of its constituent technical terms, into an equivalent statement couched exclusively in observation terms: Science would really dealsolely with observables (p.24).
Hence, the triumph of science, in this view, consists of
establishing numerical connections among several pointer
readings, since
there must and can be only one operational definition for each scientific term or concept (Bridgman 1927, p.6).

29
Since this radical empiricist position has long been
refuted in the philosophy of science literature, one would
expect that the notions associated with it are avoided in
social science r e s e a r c h . Unfortunately, the firm and
industry performance literature in both the economics and
marketing disciplines are replete with examples where a
single "proxy" is used to measure economic performance.
This practice of ascribing an unwarranted unidimensionality
to the performance concept combined with naive assumptions
about reliability of our instruments are at the heart of the
conceptual problems of measurement in this area.
The second set of issues which deals with problems
of obtaining or taking measurements, are well recognized and
little elaboration is needed. However, this does not imply
that they are of little or no importance. The following
passage from Morgenstern (1972a) summarizes the issues
involved:Much of what goes on as "measurement" hardly deserves this name. This applies, for example, to the hollowed "GNP," a largely useless notion which as a scalar (?) is supposed to tell about growth of a complex system, forever increasing in complexity, and which, stupidly, even, records any ma 1funetion of the systern as a positive change. e Thus there are good as well as useless concepts.
25 See, for example. Hunt (1983) for a brief review of the notions and criticisms of operational ism. Blalock (1968) also provides an excellent review and discussion of the same.
2 6 " I f you are stuck in a traffic jam on the ground or in the air, GNP goes up..." (Principle author's footnote).

30
As to measurement accuracy, there is hardly any discussion and awareness... So it is not surprising, albeit regrettable, that the inevitable measurement errors... are never systematically incorporated in theory, in confutation or in interpretation. There almost seems to exist a conspiracy against the recognition and study of measurement errors (p.701-2).
Imolications And Définitions.
The implications of the preceding discussion can be
summarized as follows: First, the major concern in this
study is with the identification and causal ordering of the
factors which may impact the "systematic variation" in store
performance. This is in contrast to a study of the
determinants of high vs. low, or good vs. bad performance,
which inevitably begs an evaluative or normative criterion.
Accordingly, the performance construct in this research is
not and should not be viewed as a relative or normative
feature of a retail unit. Second, in this study the notion
of performance is viewed as the "results or consequences" of
the actions of the retail unit (and other environmental
variables) as opposed to the "behavior" of the retail unit.
Generally, this is the established usage of the concept in the marketing discipline.2? Third, in this study only a
single dimension of the performance concept, the "economic
results" of store operations, is considered. It should be
27 other terms, such as, behavior, conduct or strategy are more suitable to describe the process-oriented meaning of the performance construct.

31
noted, however, that the term economic results, in itself,
implies multiple constructs. In this regard, this
distinction serves not as a definitional criteria but as a
delineation of the scope of this investigation. Finally,
performance concept in this study is viewed as an
unobservable, latent variable which derives its meaning in
part through its formal definition and in part through its
relation to a number of observable variables (see. Chapters
4 and 5).In summary, performance in the context of the
present study is defined as the composite economic outcomes
of the functioning of a (retail) unit in a given time and
market. Furthermore, it is assumed that these economic
outcomes are manifested and fully represented in measures of physical and financial efficiency of a store's cperation.
In this regard, physical efficiency or productivity is
defined as the rate at which the physical, capital and human
resources of the (retail) unit are combined and converted to
outputs, and similarly, the financial efficiency or
profitability is defined as the degree to which a (retail)
unit's outputs, valued at current prices, exceed its costs.

32
Scope Of Research
The primary intent of the previous discussion on
retailing, the retail store and the concept of performance
was to establish the subject matter of the present study.
Clearly, some of the issues alluded to in the previous
paragraphs can also be regarded as elements of the scope of this research.
In this section, attention is turned to some of the
possible alternative foci that one may use in viewing the
retail unit and the level of analysis that one can choose in a given study. The discussion is structured around a
classificatory schema which summarizes the scope of both the
previous studies and the present effort, as well as pointing
out some areas yet to be explored in retailing research.
While the proposed schema incorporates some of the notions due to Hunt's (1976a) general framework, it also presents
some new viewpoints. In this regard, a brief review of the
controversies generated by Hunt's (1976a) essay provides a
good point of departure to introduce the scope of present
research.
The 3-D Model-- Nature And Scope Of Research In Marketing
Since its publication, The Three Dichotomies Model
has become somewhat of a "norm" in delineating the nature
and scope of research in marketing. A 1 though frequent 1y

33
used and its basic tenets well accepted, the model has not been imnune to criticism.28 While some of these criticisms
concern definitional issues, others are more philosophical,
raising important questions on how we conduct scientific research in the marketing discipline.2s
The most recent and relatively less complicated of
the definitional issues is illustrated in the controversy
over the micro/macromarketing dichotomy proposed in the
original essay. The essence of the debate on the
micro/macromarketing distinction has centered around Hunt's
original criterion for the classification of the
micro/macromarketing events.3° The level of aggregation of
the actors "as the primary delineating criterion among the
two sets of events," it is argued, was incomplete and
inadequate (White and Slater 1978). The critics proposed
that
the level of aggregation of the impacts or effects of the activities of the marketing actors to be the primary determinant of the distinction between
28 See, for example, Robin (1977a,b), Etgar (1977), Ross(1977), White and Slater (1978), White (1979), Hunt(1978), Hunt and Burnett (1982).
29 At the time this section was written. Hunt's (1983) Marketing Theory The Philosophv of Marketing Science was not published. Some of the views expressed here have been incorporated in this new edition.
3 0 Micromarketing is defined to "refer to the marketingactivities of individual units, firms, consumers orhouseholds," whereas macromarketing "refers to a higher level of aggregation, usually marketing systems or groups of consumers" (Hunt 1976a, p.20).

34micro-macro" (White 1979).
According to this view, the societal impacts of a firm's
activities could be viewed as a macromarketing
investigation, similar to a study of the environmental
impacts of the marketing sector as a whole. In a recent
article in the Journal of Marketing. Hunt appears to have
modified his original criteria to conform more closely to
the critics' view (Hunt and Burnett 1982). However, the new
taxonomical model proposed by Hunt and Burnett (1982) goes
further, suggesting not two, but
three classificatory criteria to be both necessary and sufficient to specifymacromarketing/micromarketing dichotomy: level ofaggregation [of actors], perspective of Ian actor or society], and consequences of [the activitiesof an actor or group of actors]" (p.23).
Hence, as the authors also concede,
many of the problems in the literature [presumably, including Hunt's own] concerning thedistinction between micro/macromarketing havedeveloped from ill-guided efforts to find a single classificatory criterion" (Hunt and Burnett 1982).
The more conceptual issues raised regarding thenature and scope of research in marketing are not unique to
our discipline. All social science disciplines in various
stages of their growth have tried to answer similar
questions without complete success. In the context of
marketing, the normative/positive dichotomy proposed by Hunt
and the subsequent controversy generated illustrate some of
the issues involved.

35The distinction made by Hunt (1976) between positive
and normative studies of marketing by Hunt was vigorously
challenged in the literature (Robin 1977a,b, Ross 1977,
Etgar 1977). The debate here, unlike the one on the
macro/micromarketing discussion, centered not so much on
definitional issues, but on the necessity and meaningful ness
of the dichotomy itself. Critics argued that
positive studies in marketing are of little interest unless they are given prescriptive overtones, and that... such [positive] issues are barren except where they have prescriptive [normative] implications (Robin 1977a).
In this regard, the critics questioned whether the conduct
of, and justification for, research in marketing and the
ultimate use of its results could be separated in a
discipline where
the ultimate test of a marketing theory is not the acceptability of the theory on the part of marketing researchers... but its acceptance by marketing managers (Churchman 1965, p.33).
This is a hollow point and has been extensively addressed by
Hunt in a rejoinder to his critics (1978) as well as in his
recent text.®’
Another dimension to this problem which has received
a fair amount of attention in other social science
disciplines has only recently reached the marketing
literature. This issue concerns not only the "conduct of
®’ By analogy, this would imply that the theories of physics are not theories unless the engineers say they are and accept them as such.
36
scientific research," per se, but also the special nature of
the "subject matter" in social sciences. Morgenstern
(1972a), in an. excellent essay on the descriptive,
predictive and normative aspects of theory and scientific
research in economics discipline summarizes the view as
follows:32
Nature does not care--so we assume--,whether we penetrate her secrets and establish successful theories about her workings, or apply these theories successfully in predictions. In the social science, the matter is more complicated and in the following lies one of the fundamental differences between . these two types of theories: the kind of economic theory that is known to the participant in the economy has an affect on the economy itself... Thus a "backcoupling" or "feedback" that exists between theory and the object of the theory is an interrelation which is definitely lacking in the natural sciences (p.706-7).
Morgenstern's observations have important implications for
the proposed normative/positive dichotomy in marketing. It
can be argued that positive marketing studies, by attenpting
to describe, explain, and predict the marketing activities,
processes or phenomena that actually exist, via absorption
among the participants, may also lead to what marketing
organizations and individuals (ought to) do. In other
words, social scientists, by observing the economic or
social phenomena and theorizing about them, may change them.
32 Similar views to Morgenstern's are also expressed by Machlup (1978, chapters 12-14) and Schütz (1953). Machlup's essay, "If Matter Could Talk," written in response to Nagel (1961) is especially illuminating.
37Hence, after a finite interval, questions "what is" and
"what ought to be, is" become no longer clearly
distinguishable. The extensive literature generated through
the PIMS program, especially the widely publicized empirical
link between ROI and market share, is illustrative in this
regard.The position of this writer on this difficult
subject and the perspective taken in this research are as
follows; It is a valid argument that the social, economic
and marketing phenomena are all, indeed, due ultimately to value-laden human actions and behavior. However, this
should not obscure the distinction between the "nature" of
the phenomena and the "conduct" of research on such
phenomena. The values or evaluative criteria human actors
use in various capacities (as consumers, business
executives, etc) influence their decisions to exchange, buy,
sell, hire, invest, borrow and so forth. These, however,
are "datums" that come with social and economic phenomena and are in "the nature of things." This status quo,
decidedly different from the one found in natural science,
does not preclude the social scientist from dealing
objectively with the subjective values of such actors,
manifested in their behavior, actions and reactions. This,
in essence, underlies the distinction made in this study
between the inherently normative character of the
38performance notion and the study of its systemic, impartial
determinants.ss
This brief discussion on the key elements of Hunt's
3-D model illustrates that the delineation of the nature and
scope of research is anything but a routine, pigeonholing
exercise. It requires a specification of not only the
classification of research in the traditional sense, i.e.,
what it purports to analyze and how, but also a
specification of the world view that guides the research and the researcher.
3 3 Another debate that has emerged in the marketing discipline and its implications for the nature and scopeof research in marketing should also be noted here. Someof these issues were a source of much of the discussion at the 1982 and 1984 AMA Theory Conferences (cf., Peter et al 1982, Sauer et al 1982, Ryan and Shaughessy 1982,Brodbeck 1982, Hunt 1982). With the ascendance of agroup of marketing scholars who espouse a "realist" and "contemporary" philosophy of science, the foundations of the normative/positive dichotomy, the logical empiricist position, has come under severe attack (see, for exairple, the special issue of the Journa1 of Marketing. Fall, 1983). Although each group is far from being a unified collectivity, several issues sharply divide them (e.g.. Is scientific research a dispassionate, value free endeavor where the researcher is an objective observer?. Does there exist a reality independent of the researcher's perceptions?, Is there one scientific method?, etc). Contemporaries who dissent on an affirmative answer to such questions, by extension, reject the normative/positive dichotomy as a useful classificatory criterion in marketing research.

39
A ClassifIcatory Schema
Exhibit 1 presents a classificatory schema to
delineate the alternative perspectives or foci one may take
in the study of the retail store and its performance.
Several definitions are useful for a proper interpretation
of the schema.
The perspective on level of analysis, the
micro-macro distinction, refers to the degree to which the
activities of an entity and/or consequences of such
activities are viewed internally, from the unit's
perspective, or externally, from the society's perspective.3< Hence, in this conception, microretailing
performance studies primarily deal with the retail unit, the
retail firm or a group of firms where the perspective is
predominantly that of the individual store or firm.
Macroretailing studies, on the other hand, focus on societal
impact of the performance of retail units, most commonly but
not necessarily, at the level of an industry or sector.as
The perspective on unit of analysis, the vertical
dimension, refers to the primary conceptualization of the
retailing unit either as an economic entity or a
3* In this respect, the term "degree" implies and emphasizes the difficulties in a simple dichotomy.
35 This is because studies at the firm level can also be properly classified as "macro" studies (e.g., the impact of Sears or Penneys on the consumption patterns of the aged).

40EXHIBIT 1
A Classificatory Schema For Retail Performance Studies
Perspective on The Unit Micro
Perspective on Level Of Analysis
Macro
ECONOMIC ENTITYAn Independent Business Unit
An Economic Unit
Distribution Channel Unit
Strategic Business Unit in a Firm's Portfolio
Unit profitability, productivity, growth, and market share gain
State of supra-normal economic rent, return per unit of resourceUnit's contribution to system profits, efficiency, or costs
Contribution to the corporate profits, cash flow, resource use and/or supply
SOCIO-POLITICAL ENTITY
Unit in Itself
Unit as a Channel Member
Unit in the Social and Political Envi ronment
Intragroup interactions, quality of worklife, contribution or role of the unit to work group and aspirations
Role of the unit in power, conflict or cooperation in the system
Contribution to the community welfare or promotion of local causes,part icipation in local affairs
Sectoral studies of productivity and/or profitability
Contribution to the economic welfare or resource allocation
Comparative systems analysis, retailers role in alternative systems performance
Input-output study of resource use and allocation at the national level
Sectoral studies of quality of work1ife in service economy societal satisfaction with different retai1 formatsDistribution of the sectoral power or influence on the resource allocation
Contribution to the social welfare, or the effectiveness in lobbying, impact on legislation

41socio-political entity. The conceptualization of retail
unit as an economic entity emphasizes the activities and
outcome of activities directed towards the production of
outputs, value and wealth. The socio-political
conceptualization, on the other hand, stresses the
activities or patterns of behavior directed towards the
generation of social welfare, and the effects or outcomes of the distribution and use of power and influence.
Furthermore, within each perspective, the retail entity may
be viewed either as an independent unit in itself or as part of a larger "system" such as a distribution channel.
Clearly, neither the micro-macro distinction nor the
economic vs. socio-political perspectives are mutually
exclusive. Micro units, taken together, form macro
entities, and in either case the unit of analysis exists,
simultaneously, as a complex economic, socio-political
entity. It is necessary, however, to conceptually isolate
the way we view the phenomena in order to conduct any
meaningful research. Furthermore, such a delineation of
perspective and level of analysis has the added benefit of
bringing into a tighter focus, the primary performance
dimensions that are most relevant and, hence, guide one in
identifying the factors that may influence each dimension.
In order to better orient the reader, several
previous studies of retailing performance have been

42classified into various cells in Exhibit 2. A majority of
the previous retail performance research seems to fall
within the economic entity view at a micro level of
analysis. On the other hand, both the macro and micro level
retailing performance research with a view of the unit as a
socio-political entity have been relatively unexplored in
the literature.Within this classificatory schema, then, the scope
of the present investigation may be characterized as a
micromarketing study where the view of the retail store is
one of economic entity. The performance dimension of
primary interest is the economic results of the operations
of such entities.

43EXHIBIT 2
A Classification Of Previous Retailing Performance Research
Perspective on The Unit
Perspective on Level of Analysis
Micro
ECONOMIC ENTITY
An Independent Business Unit
An Economic Unit
Distribution Channel Unit
Strategic Business Unit in a Firm's Portfolio
SOCIO-POLITICALENTITY
Unit in Itself
Clawson (1974) Cottrell (1973) Applebaum (1965) Bass (1956,1958) Hansen and Weinberg (1979)
Dalrymple (1966)Holdren (1960) Arndt (1977) Kinney (1969) Alderson (1965)
Etgar (1976)Page (1979) Porter (1976)
Buzzell and Dew(1980)
Kinney (1969) Kerin and Mi 11er(1981)
Lusch and SerpKenci
Macro
■-961Hal 1 et a1 (1 Schwartzman (1971 Barger (1955) Bucklin (1977) Fuchs (1968) McCammon and Hammer (1974)
Bucklin (1978a) Ingene (1982) Lusch and Ingene (1980b)
Porter (1976)
Fuchs (1968) Kendrick (1971
(1984)Hirschman and Stampfl (1980a)
Unit as Channel
aMember
theUnit in Social Environment
EtgarLusch
(1976)(1976)
Assael (1968)
Hirschman (1981) Palamountain (1955)

44
The Paradigm Of Research
The space limitations in our academic journals and
other constraints in our professional communications all too
often preclude us from stating how we view the natural and
social phenomena around us. In studies such as this thesis,
however, where the writer is not bound with such
constraints, it is appropriate, if not essential, that the
paradigm adopted in research is made explicit.
The Concept Of A Paradigm
The concept of paradigm and its meaning and role in
scientific inquiry has been a subject of vigorous debate in
the philosophy and history of science literatures (Kuhn
1970,1971, Shapere 1964, Lakatos and Musgrave 1970, Zaltman
et al 1982). The purpose here, of course, is not to discuss
the various definitions of the term or to pursue the
implications of each definition for scientific research.
The discussion here is limited to a brief description of the
term "paradigm" and to an explication of one such paradigm,
as a prelude to a discussion of the major assumptions made
in this investigation.
In the course of daily contact with physical,
economic and social phenomena, we all make constant
observations and acquire what may loosely be termed "facts."
45These "facts," however, become significantly reorganized in
the course of an initiation to a (scientific) community.
Thus, we all acquire a constellation of beliefs, values,
shared commitments and rules, in short, a world view of
nature which importantly shapes our research (Kuhn 1970,
Zaltman et al 1982). Organization of such elements, in
time, provide us with what are variously described as
"maps," "frames of reference," "models" or "patterns" with
which we approach particular problems, develop theories, and
sense, collect and interpret our observations (Zaltman 1982,
p.121). To the extent that such world views come to be
shared by a large number of investigators in a given
community, disciplines acquire their dominant paradigms.
Thus, intrinsically circular:
a paradigm is what the members of scientific community share and; conversely, a scientific community consists of men/women who share a paradigm (Kuhn 1970, p.176).
More specifically, a paradigm refers to;
an accepted model, a frame of reference or a world view through which we choose to look at nature, to physical, social or economic phenomena and from which springs through time, a coherent tradition of scientific research (adopted from Kuhn 1970 and Zaltman et al 1982).

46Paradigms In Marketing
The long-standing traditions of inquiry in the
natural sciences are all too often touted as the only
disciplines with universal paradigms. Kuhn (1970), for
example, quips that
it remains an open question what parts of social science have yet acquired paradigms at all (p.15).
This notion is partly due to a misconstrued equivalence of
paradigms with the existence of universal laws ortheories.3 6 Although the existence or acquisition of such
universal world views are commonly associated with the
degree of "maturity" in a scientific discipline, paradigmsare present in any discipline, although with various degrees
of acceptance at any given point in time (Kuhn 1970, p.79).
Although not reaching the level of generality or
universality in acceptance found in natural science, social
science in general, and the marketing discipline inparticular, are rich in paradigms. Bagozzi (1980b), for
example, presents "four generic paradigms" of social
science, in Stimu lus-Response (SR),
S t i mu1us-Organ i sm-Response (SOR), Organism-Response (OR),
and Response-Response (RR) which have significantly shaped
behavioral research in and out of marketing. Much of the
3 6 In this respect, the view that the central theme of social science, i.e. human behavior and action, "can never be predicted with certainty" (Valle 1981, p.433), is an equally damaging claim.

47consumer behavior literature, including the major theories
of consumer behavior are direct outgrowths of such
paradigms. Zaltman et al -(1982), on the other hand, liken
"the shift to a broadened concept of marketing to include
both profit and nonprofit agencies and a view of marketing
as an exchange or transaction system to... an extreme change
in mapping... akin to Kuhn's paradigm shift" (p.124-5). A
recent essay by Stern and Reve (1980) on distribution
channels as Political Economies is yet another illustration
of the existence, development, role, and significance of
paradigms in the marketing field.
Paradigm-In-Use In RetailingGiven the status quo in the marketing discipline,
the next logical question is whether or not we have
paradigms in the field of retailing? and if so. Where do we
find them? Kuhn (1970) suggests that:close historical investigation of a given specialty at a given point in time discloses a set of recurrent and quasi-standard illustration of various theories in their conceptual, observational and instrumental applications...These are the community's paradigms, revealed in its textbooks, lectures... and so forth (p.43).
37 For an application of this paradigm in theory construction, see, Lusch and SerpKenci (1982) and Arndt (1983).

48A satiple of the textbooks in the field of retailing reveals
that there is indeed a strong communality in their basic
orientation to the retailing phenomena (cf., Lusch 1982,
Mason and Meyer 1981, Rosenbloom 1981, Duncan and Hollander
1977). In general, all writers view retail institutions as
complex economic, socio-political organisms, which exist in
constant interaction with, and in response to, various
environmental stimuli (competitors, consumers, technology,
social and economic events) through a variety of tactical,
operational or strategic actions and in various structural
or institutional forms. This is, in essence, the world view or the paradigm that dominates the retailing field today.
Although lacking the elegance of similar expressions in
natural science, and in many respects common-sensical, this
world view of retailing, is no less a paradigm than the
characterization of natural phenomena in Newton's Princioia
and Ooticks. b
The paradigm of research that guides this
investigation is an extension of this general view of the
retailing process. Popularly known as the
Strueture-Conduct-Performance (SCP) paradigm, this view is
commonly associated with an applied branch of economics,
industrial organization research. In its most essential
aspects, this framework is also similar in nature to the
3® It should be noted that paradigms are only "vehicles" for the development or establishment of "theories."

49generic S-O-R paradigm in social science. Bain (1958)
summarizes the general approach as follows:
Casual observation, common sense judgement, and formal economic theory all suggest that there are two main sorts of determinants Iof firm performance]. First, the organization or structure of a group of competing enterprises is widely thought to have a strong conditioning or determining influence on the performance of the group [and the firm]. Market structure, hence, provides a constraining and canalizing influence on enterprise activities and their results, i.e., variation in structure may lead to associated variation in performance. Second, the conduct of enterprise, embracing the practices, policies and devices which they employ in arriving at adjustments to the markets in which they participate likewise influences performance.Thus, we must look to the characteristics of market structure and conduct as probable primary determinants of enterprises' performance (p.3).
With this view as a general background, this investigation
proceeds from the assumption that the performance of a
retail unit is fundamentally due to the conduct and behavior
of the unit in its adjustments to the elements of the
market. In any given point in time, it is logically
inconsistent to expect a "causal" loop or feedback from
present performance to conduct.a* Nonetheless, it may be
argued that "expected" performance may be a causal factor inexplaining the present behavior, akin to the permanent
income hypothesis in economics, and hence, the possibility
of a reverse ordering of causal schemata. In this case,
however, one would no longer refer to "performance" as
3® Recall that, by definition, the notion of performance implies behavioral "outcomes."

50outcomes, but "potential" outcomes.^® Hence, given the
definitional scheme adopted in this study, a one way,
nonrecursive causal ordering of events is a s s u m e d . O f
course, given a sufficiently long time frame, the SCP
paradigm does not preclude the possibility of a causal link
from either Performance to Structure or from Conduct to
Structure. These possibilities, however, are not explicitly
modeled or tested in this research.
40 This construct is not explicitly considered in the definitional scheme adopted in this study.
41 A likely influence on the elements of unit conduct is also from "prior performance." In this regard, the reference is made to a "lagged endogenous" concept, which is not inconsistent with the assumptions made in the study.

CHAPTER III
CONCEPTUAL FOUNDATIONS AND PREVIOUS STUDIES OF RETAILING PERFORMANCE
Initial conception and development of marketing thought as a
separate field of inquiry is frequently viewed as a reaction
to and a departure from the abstract world view of
economics. At the turn of the 19th century, a number of
scholars opined that the deterministic nature of the
classical theories of value, exchange, consumer and firmbehavior were too constraining to account for the complexity
and dynamism observed in the real world. Hence, as Bartels
(1976) notes, a group of marketing students
evolved a body of thought that, by its nature, scope and application set them apart from the economists... in studies that were more empirical than theoretical, more practical than abstract, and more descriptive than philosophical (p.9)
This departure from classical economic thinking, however,
has neither been as smooth, nor as complete as Bartels seems
to imply. In fact, Anderson (1982) observes that
although marketing has rejected much of thephilosophical methodology of economics, it hasretained a significant portion of its ontology... in the profit maximization paradigm ofneoclassical economic theory (p.20-21).
Implications of this development for research in
marketing are numerous, some of which have been noted in the
essay by Anderson (1982). One implication, however, is most.
- 51 -

52relevant in the context of this review and may best be
summarized in the following passage from Kuhn (1970):In the absence of a paradigm*2 or some candidate for a paradigm, all of the facts that could possibly pertain to the development of a given discipline are likely to seem equally relevant.As a result, early fact gathering is a far more nearly random activity and is usually restricted to the wealth of data that lie ready to hand. But though this sort of fact collecting... is essential to the origin of many significant sciences... it also produces a morass (emphases added, p.15-16).
Indeed, when one looks at the previous studies of retailing
performance, they collectively present a rather disjointed
collage. This is due, in part, to the absence of a general
framework which can accofimodate the different orientations
of the researchers. And, in part, it is due to the
diversity in the level of analyses (i.e., retail sector,
industry, firm or unit), and the variety in the purposes of
research (i.e., prediction, description, explanation). The
purpose of this chapter is to briefly review these "islands"
of research, and to try to forge some links among these
disparate research orientations.
*2 For a definition of a paradigm, see the section on Research Paradigm in this chapter.

53Organization Of The Chapter
This chapter is in three major sections. In the
first section, the conceptual and theoretical foundations of
the studies in enterprise performance is reviewed, and the
major streams of research that have emerged in the study of
the firm are summarized. Next, the studies of marketing and
retailing performance at both the macro and micro levels of
analysis are discussed, and some of the empirical findings
are presented. The chapter concludes with an examination of
some of the more managerial studies of retail store
per formance.
Conceptual Foundations Of Studies In Enterprise Performance
It comes as no surprise to any student of business
enterprise that there is no universal theory of the firm.
No one discipline in the social science arena can claim to
have a uniform, well-established body of thought which
purports to describe all aspects of firm behavior and to
explain the multitude of the dimensions of enterprise
performance. The picture is generally bleaker when one makes a distinction among the manufacturing or producer
enterprises on the one hand and the distribution or service
enterprises on the other (Morgenstern 1972a,b).
It is outside the scope of this study to discuss in
any significant detail the content of the various theories

54of the firm and their implications for present research.
Suffice it to say that the conceptual foundations of studies
in enterprise performance ultimately rest with the
neoclassical economic theories of the firm.<3
A brief review of the origins of enterprise
performance in economics is useful for several reasons.
First, the scope of this study is limited in its view of
retailing as an economic process and the retail unit as an
economic entity. As such, an investigation into performance
of retail stores has its roots ultimately in the economicmodels of the firm. Second, since the development of
marketing thought began and evolved in a period when
economics provided the most dominant paradigms for research,
its influence on marketing students has been substantial
(Bartels 1976, Sheth and Gardner 1982, Kirkpatrick 1982).
Thus, for a proper appraisal of the previous studies of
retailing performance, it is essential to be acquainted with
this body of economic thought. Finally, the economic models
*3 The more recent behavioral theories (e.g., Baumol 1959, Baumol and Stewart 1971, Williamson 1967,1970, Cyert and March 1963, Simon 1959,1962) can be viewed as significant extensions of these economic theories where the separation of ownership . and control and the attendant difficulties with the profit maximization principle as the sole motivator of firm or individual action have been modified to more closely represent reality (see, for example, Wildsmith 1973, Scherer 1980, and Anderson 1982 for reviews). The resource-dependency or constituency based model of the firm (e.g., Pfeffer and Salancik 1978, Williamson 1975, Anderson 1982), in turn, are further extensions of the behavioral theories.

55of the firm have been a significant source of
generalizations, deductions and hypotheses which have
produced a number of research streams, and which as Bain
(1968) notes
has the same wish to understand why enterprises perform as they do; and in particular, why some perform differently, or better or worse than others (p.3).
The Market Svstern Concept-- Origins Of Studies In Enterorise Performance
Any economic system must solve, in some fundamental
way, the problems of production and allocation of goods and
resources (SiIberberg 1978, p.324). Thus, in all economic
systems, there have evolved several mechanisms or approaches
in determining what goods and services need to be produced,
how much of each to produce, and how scarce resources are to
be allocated to each use. Furthermore, alternative
mechanisms exist as to how the values and spoils created in
this process are to be divided and distributed among the
system participants (Moyer 1972, Scherer 1980). Although a
number of such alternative mechanisms can be found in any
economic system (e.g., redistribution, reciprocity,
tradition, central planning etc.) one approach, the market
system, has been the most intensely studied in contemporary
economics (Bohannon and Dalton 1962, Moyer 1972). Within
the market system, as Scherer (1980) notes

56consumers and producers act in response to price signals generated by the interplay of supply and demand forces, in more or less freely operating markets, with each participant seeking to make the best of the market conditions, i.e., by maximizing profit or subjective utility (p.D
To be sure, no economic system can be found where
such a market mechanism exists in its conceptually pure form
(Moyer 1972). Furthermore, profit and utility maximization
assumptions on the part of the economic actors have been
intensely challenged in various disciplines (Scherer 1980,
Anderson 1982). However, although the "realism" of the market system has been under severe criticism in social
science, it has nevertheless remained as the primary driving
force in theory development.
The emphasis on market system, both to its
proponents and its critics, however, is not for its own
sake. The ultimate concern to the economist and to the
social scientist is somewhat normative in content. In other
words, the discussion on the market system, in the final
analysis, centers around an assessment as to how
"satisfactory" a job it does in helping solve the
fundamental problems in production and allocation of goods
and resources, i.e., the performance of the economy.
** These crit icims on the validity of the market system as a viable approach in the determination of the fundemental economic questions are not our primary concern here. For an extensive discussion of the issues involved, the reader is referrred to a seminal piece by Morgenstern (1972b).

57Two related branches in the economics discipline
approach this question with quite disparate orientations in
both methodology and theory. One branch, comparative
economics, looks at the market system as one alternative
market mechanism and compares the actual performance of it
with other mechanisms' performance. The level of analysis
is usually, but not always, macro and the method of analysis
is predominantly inductive. In overall orientation, for
instance, several studies in the marketing literature have
this general character (e.g., Buck1in 1978b, Takeuchi and
Bucklin 1977, Hall et al 1961).
Another branch of economics, the field of welfare
economics, proceeds from a set of normative performance
standards for the market system (such as the presence or
attaintment of ful1-employment, price stability, equity in
income distribution and resource allocation etc.), and
compares the actual performance of the system against the"ideals" of the same. More importantly,
since the economy wide performance is viewed as emerging from the independent actions of many private enterprises... how well the economy performs, ultimately, depend on the performance of business firms (Bain 1968, p.9).
At the level of the overall economy such investigations are
known as general equilibrium analysis and at the level of
the firm or industry, are called partial equilibrium
analysis. A number of studies in the marketing field can

58also be characterized in this spirit (e.g., Barger 1955,
Fuchs 1968, McCaiimon and Hammer 1974, McCammon and Bates
1976).
In sunmary, and admittedly much sitiplified, it is
clear that the conceptual foundations of the general area of
inquiry into enterprise performance has evolved in
economics, principally in the pursuit of understanding the
microcosm's performance as a vehicle to explain the
performance of the overall economy. With the market system
as the primary causal mechanism guiding the behavior of
economic actors, studies on enterprise performance can thus
be viewed as a continuation of a general orientation that
dates back to Adam Smith and other early classical
economists.
Maior Streams Of Research In Enterprise Performance
Against the general backdrop of the market system
concept, three major streams of research have evolved in the
study of enterprise performance. The first stream, known as
industrial organization studies is a direct outgrowth of the
efforts of a group of applied economists in attempting to
confront the notions associated with price theory by using
empirical and statistical evidence from the real world.
Starting from a set of normative performance goals for the
overall economy and its constituent element, the business

59firm, the field of industrial organization economics seeks
to assess the influence of a number of variables on the
economic performance of enterprises. Stern and Grabner
(1970) summarize the basic approach as follows;
The study of industrial organization centers around three variables: market structure, marketconduct, and market performance.
Market structure refers to the organizational characteristics of a given market. Market structure is usually expressed in terms of (1) some measure of concentration of the total assets or sales of all firms in an industry controlled by a stated number of its largest members; (2) the analysis of the "barriers of entry" confrontino potential new competitors in an industry; and (3) the amount of differentiation existing among similar products competing for the same market.
Market conduct refers to the actual commercial behavior of the firms competing in an industry.The most commonly accepted line of reasoning is that the structure existing in an industry strongly influences the conduct observed in that industry.
Market performance refers to how well a particular industry has served society in terms of its allocative and technical efficiency, its innovativeness and progressiveness, and so on. Efforts to measure industry performance are, in effect, attempts to measure the net contribution of an industry to the "social welfare." A priori reasoning suggests that performance is the outcome of the interaction between structure and conduct (p.8-9).
Historically, a significant portion of the
industrial organization studies have centered around a
limited number of hypotheses, derived from the neoclassical
theory of the firm. These research hypotheses are
summarized in a path analytic framework in Exhibit 3.

60Of these hypotheses, the set of relationships among
the elements of market structure and technical efficiency
(i.e., the links/331, Y11*^31, and yl2*j831 on Exhibit 3) are
relatively unexplored empirically. The core of industrial
organization research has, and in large part, remains to be
focused on the relationships between the elements of market
structure and allocative efficiency (i.e., excesses of revenues over costs) of enterprises.*®
Although much disputed, results of the empirical
research reported over the past several decades give general
support to each of the linkages (M2*Y23, ^42*Y22, /342*Y21). In other words, the higher level of seller concentration,
entry barriers, and product differentiation, singularly and collectively seem to be strongly associated with higher
levels of profitability in a diverse set of industries.*®
Although the distributive sector of the economy, and
especially the retailing enterprises, conform most closely
to the assumptions of a theoretical industry, there has been
no significant research in this sector of the economy. Bain
(1968) attributes this lack of research to an absence of
*® Bain (1968) and Scherer (1980) give yood summaries of the empirical literature prior to the time of publication of their respective texts (see, also, Mann 1966, Collins and Preston 1968, Weiss 1971,1974, and Vernon 1972).
*® The criticisms of industrial organization studies and/or empirical findings are summarized in Scherer (1980), Bock (1972). In the marketing literature, see, Bass, Cattin and Wittink (1977,1978).
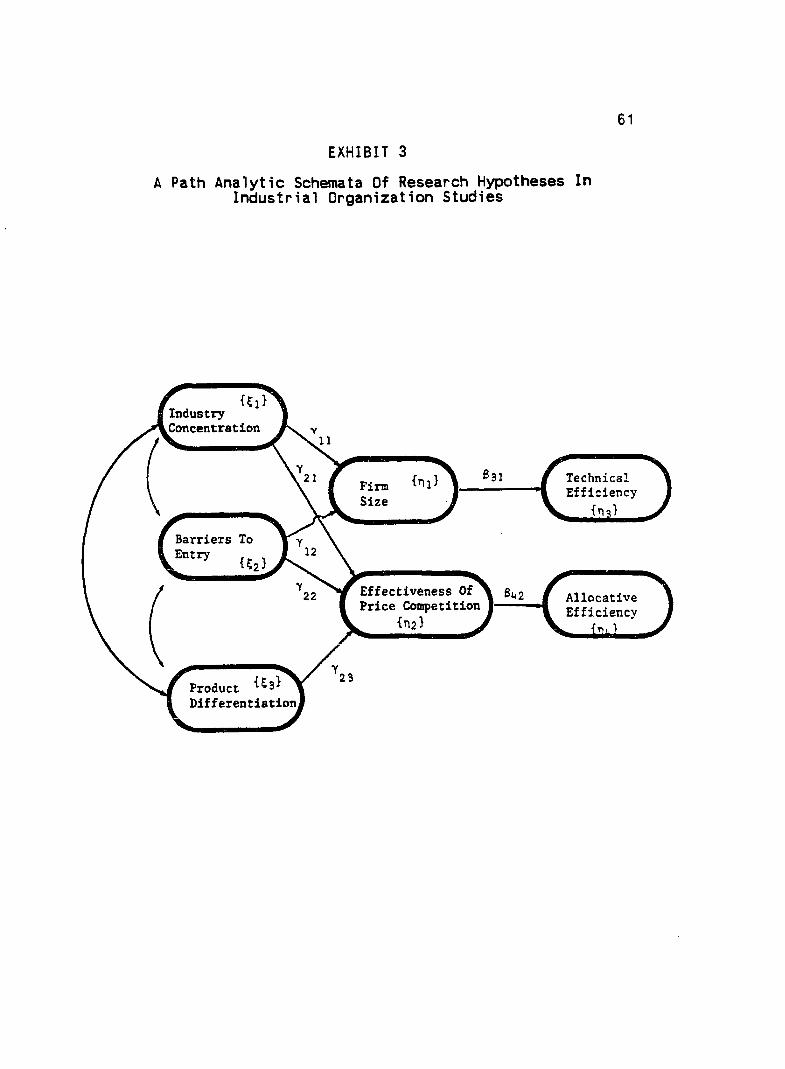
61EXHIBIT 3
A Path Analytic Schemata Of Research Hypotheses In Industrial Organization Studies
H iIndustry Concentration
Technical Efficiency
{nq}
22 -, Effectiveness Of ^ 6,2 f AllocativePrice Competition Efficiency
Product ^ 3 Differentiation

62"systematic data... in distributive and service trades"
(p.469). However, part of the reason here also lies in the
difficulties in transplanting the concepts associated with
manufacturing enterprises to service enterprises.^’
The second stream which may be labelled as the
Harvard Studies in Strategy-Structure-Performance have also
evolved in roughly the same period as industrial
organization research. In general, the Harvard studies in
enterprise performance share the same basic goal of
industrial organization research. In both research streams,
the overall purpose is one of understanding the determinant
conditions of firm performance. However, despite the
similarity in semantic terminology; the research paradigms,
definitions and the methodological orientation of these
studies have significant differences.
The genesis of Harvard studies lie in the study of
individual companies or "cases" as opposed to price theory
of industrial organization research. Hence, whereas
industrial organization research is "deductive" (deriving
its propositions and hypotheses from micro-economic theory),
Harvard studies are on the other extreme, using an
"inductive" methodological orientation based on historical
data gathering and analyses.
47 See Scherer (1980, Chapter 9) for several exceptions in studies of the banking enterprises.

63The overall research paradigm of the two streams
also have significant differences. Whereas industrial
organization studies predominantly relate the structural
conditions of "market" organization to economic performance,
Harvard studies seek to relate the structural conditions of
the "organizational unit" and its strategy to performance.
In this respect the term structure, which is common to both
streams of research, defines a completely different
phenomenon.
A crucial difference in these two streams arise in
the role of the structure of the market in effecting firm performance. Whereas industrial organization research
assumes a direct link from market organization to firm
performance. Harvard studies see an indirect link through
firm strategy. Rumelt (1974) summarizes this position as
follows:
Although most of the difference in financial performance among firms can... be attributed to a strong association between a firm's industry and its strategy, the association is so strong that it is virtually impossible to separate their relative effects... therefore [strategy] can not be viewed simply as a result of management action, but must be seen as bound up with the technological, economic and competitive characteristics of the industry of which the firm is a part (p.79).
In Exhibit 4, a simplified path analytic schemata is
presented to illustrate the general thrust of the Harvard
studies. A good example of the research in this stream can
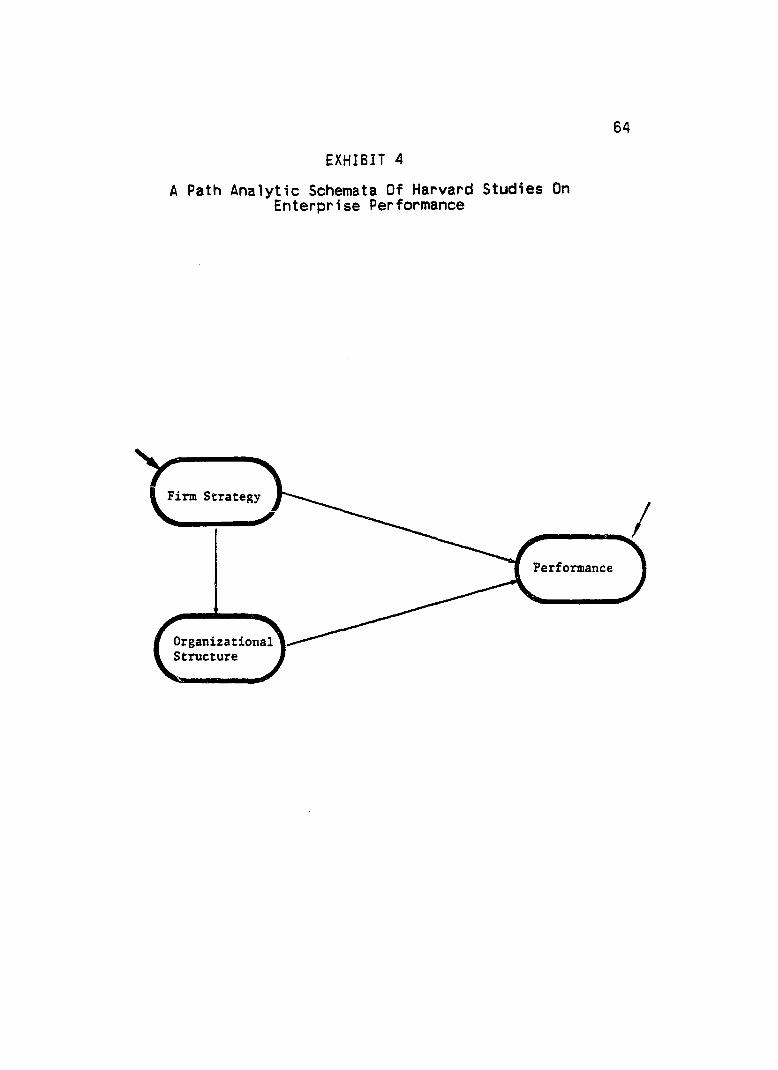
64EXHIBIT 4
A Path Analytic Schemata Of Harvard Studies On Enterprise Performance
Firm Strategy
Performance
OrganizationalStructure

65be found in the study by Rumelt^®(1974).
The third stream of research in the study of
enterprise performance is the Profit Impact of Market
Strategies (PIMS). Although the impact of PIMS studies has
been relatively recent, the genesis of these studies date
back to to an internal research program of the General
Electric Company undertaken in the 1980's (Schoeff1er et al
1974). The PIMS studies are designed to answer two basic
questions :
1. What factors influence profitability in a business--and how much?, and
2. How does ROI change in response to changes in strategy and in market conditions? (Schoeff1er et al 1974, p.139).
Combining archieval research with financial data from COMPUSTAT reports, Rumelt investigated the financial performance of firms belonging to different strategic (i.e., diversified vs. undiversified) and organizational (i.e., functional vs. divisional) categories. He found that firms that were diversified by building upon a key internal resource have significantly higher financial performance (i.e., return on investment, sales and earnings growth and variability etc.) than those firms with diversification strategies that were not based on such resources. Furthermore, firms with product-division structures were found to have significantly higher levels of financial performance compared to those with other types of organizational forms. For similar studies on other countries, see, Channon's (1973) study of the British Enterprises, Dyas's (1972) study of the French Industrial Experience, Pavan's (1972) study of the Italian Enterprises, and Thanheiser's (1972) work on the German industrial firms, all of Harvard Business School.
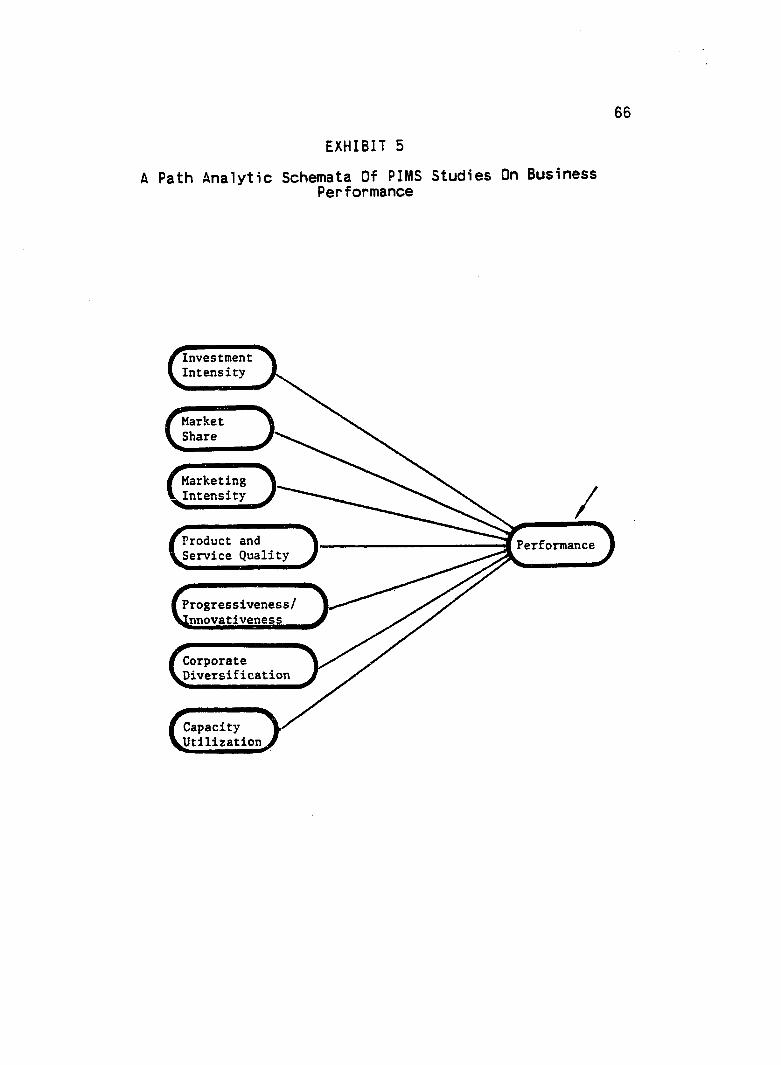
66
EXHIBIT 5A Path Analytic Schemata Of PIMS Studies On Business
Performance
InvestmentIntensity
MarketShare
Product and Service Quality Performance
Progressiveness/^Innovativeness
CorporateDiversification

67To answer these questions, PIMS researchers have sought to
buHd a series of regression models based, in part on
economic theory, and in part "on the opinions and beliefs of
experienced executives" (Schoeff1er et al 1974). Although a
number of reports by the researchers associated with the
PIMS project are available, the statistical models used in
their analyses have remained confidential.^® Exhibit 5
illustrates the general orientation of these studies and
presents some of the key determinants of firm performance
found in this research programme.
An Evaluation Of Research Streams In Enterprise Performance
Investigators in all these research programmes have
shown a curious ambivalence towards the study of the service
sector, and especially, retail enterprises. On closer
inspection, the reasons for this neglect are not difficult
to find. Most of these probably lie in one or more of the
following;
1. Until recently, the greater perceived importance of the manufacturing sector in the U.S. economy,
2. The lingering belief of some economists in the unproductive nature of distributive instutions.
See, for example, Schoeff1er et al (1974), Schoeff1er(1977), Buzzell et al (1975), Gale (1975), Branch (1978), and Buzzell and Wiersama (1981).

683. The difficulties in conceptualizing and
measuring the service outputs,4. The difficulty in obtaining enpirical data
due to the local nature of retailing and service operations, and the diversity of the enterprises in the industry, and
5. The large role of nonprofit organizations in the service sector and the absence of a theoretical framework in analyzing their behavior.
However, despite this ambivalence, and a combination of
difficult conceptual problems, biases, and inadequate
statistical coverage, over the years, a body of literature
has evolved in the study of retailing performance.
Beginning with a historical overview of the sectoral studies
of retailing performance, a selective review of these
studies is presented in the next two sections.
Macroretai1ing Performance Studies
Over the last three decades, two overlapping
research streams have investigated the determinants of
retail productivity and growth in economics and marketing.
The first research stream has utilized a time-series
approach, and has generally been more exploratory and
descriptive in its orientation. The second stream, on the
other hand, has sought to establish "explanatory" links
between various market factors and retail productivity,
using a cross-sectional approach. A number of studies that

69were undertaken by a group of economists associated with the
National Bureau of Economic Research (NBER) are illustrative
of the first research stream.
Longitudinal Studies Of Retai1ing Performance
The first major study conducted by Barger (1955) for
the NBER was an extensive research on the productivity
trends in the distributive sector of the U.S. economy.
Although Barger's work was primarily intended toward
compiling a comprehensive data base on distributive trades, it is often credited as the pioneering study of productivity
in retailing. The major conclusion of the Barger study,
which set the stage for a number of others, was that productivity growth (i.e., output growth per person) in the
retail sector was significantly lower than it was for
mining, manufacturing, and agricultural sectors of the
economy. Barger attributed the low level of productivity
gains in retailing to:
1. The relatively slow adoption of technological innovations in distribution,
2. A steady increase in the fraction of labor force engaged in commodity distribution; and
3. A relatively large reduction in the weekly hours per employee in this sector.

70Two extensions of Barger's study were undertaken by
Kendrick, the first published in 1961, covering the period
from 1929 to 1949, and the second study published in 1973,
extending the research to the postwar years of 1948-1968,
In both of these investigations, the purpose of the research
was "to trace the productivity story for the U.S. economy
and its major divisions,” and the interest in the retailing
sector was incidental to the general aim of the study.
Nonetheless, the results from Kendrick's studies led to a
significant revision of the productivity trends reported in
Barger's work. Bucklin (1978b) notesA conparison between the trade and production sectors [due to Kendrick] now reveals the former to be in a vastly improved position relative to [Barger's] early estimates... while the trade sector continues to lag behind developments in agriculture and mining, its gains are now comparable to those achieved in manufacturing (p.52).
Several "causal" factors believed to influence the rate of
productivity change in manufacturing was also undertaken by
Kendrick.®® However, the analyses on 21 manufacturing
industries were not extended to the distributive trades.
so Specifically, the rate of change in total factorproductivity (i.e., ratio of value added to weightedaverages of man-hours and tangible capital assets) was regressed on a number of "causal" factors (e.g., rate of change in output, real capital, education levels ofemployees, ratio of R&D to sales, average work hours, concentration ratio, rate of change in concentration,unionization). Of these variables, only two, the rate of output change (as an indicator of scale efficiency) andunionization, were found to be significant. (Kendrick 1973, p.132-143).

71Two other studies undertaken by Fuchs (1968) and
Schwartzman (1971) for the NBER more specifically dealt with
the productivity of service and retailing industries. In
both of these studies the basic findings of the earlier
research (i.e., low productivity gains) were reiterated.
Fuchs (1968) attributed the differentials observed to: (a)
the decline in the hours worked, (b) the lower quality of
the labor force, and (c) the relatively low level of capital investment per person in retailing, much in line with
Barger's conclusions. Schwar tzman (1971), on the other
hand, concluded that the primary source of low productivity
gains in retail trade was the declining service level per transaction. This was attributed to the growing incidence
of self-service in retail operations. A nuntoer of other
investigations conducted independently from the NBER
confirmed the main conclusions of these prior studies®’
(e.g., George and Ward 1973, Beckman and Buzzell 1958,
Ruttan 1964, Konopa 1968, Waldorf 1971, McCammon and Hammer
1974).
Several common characteristics of the studies in
this research stream can be noted. First, with few
exceptions (e.g., Kendrick 1961,1973), in all of these
studies the term productivity was frequently used synonymous
with labor productivity. This was partly due to the ready
5 1 For a recent example of the longitudinal research, see, Lusch and Serpkenci (1983).

72availability of data on the labor resource, and partly to
the intensity of labor use in the retail trade. Second,
although there was relatively close agreement on the
conceptual definition of the productivity notion, the
studies in this stream were quite diverse in their
operationalizations of either of its components (i.e., outputs and labor input). It is not, therefore, surprising
that each study has found a different point estimate for the rate of change in labor productivity.® 2 Finally, although
most of these investigators advanced similar "explanations"
for the low levels of productivity growth, given the
exploratory nature ot their studies, they generally did not
explicitly state or test any a priori hypotheses.®®
Cross-Sectional Studies Of Retai1ing Performance
The second stream of macroretai1ing research has
investigated the influence of market forces on retail productivity cross-sectionally. Probably the first and most
comprehensive of these studies was the investigation by Hall
et al (1961). These authors, noting that
5 2 Part of the reason here also lies in the diversity of the data sources used by different researchers (Bucklin 1978b). Nonetheless, all of the studies were unanimous in their main conclusion (i.e., a relatively low productivity growth in the retail trade).
53 George and Ward (1973) and Schwar tzman (1971) are exceptions.

73there exists, at present, no articulate and empirically documented theory either of the determinants of productivity in distribution or of how the structural features, associated with variations in production, such as numbers of shops, size of shops or [their] organization or the type of operations come about (p.5)
undertook an extensive study, comparing the structure and
productivity of the retail and service trades in Great
Britain, Canada and the U.S. The major aim of research was
to compare the level of productivity and the structure of
the retail trade in the three countries, and to develop a
conceptual framework to account for the possible
differences.
Using the Census of Business reports for the three
countries for comparable years. Hall et al found significant
differences in the market structure (i.e., number of shops,
shops per population, average sales per shop), outlet
operating modes and organization (i.e., stockturns, types of
merchandise sold, chain vs. independent stores), and retail
productivity (i.e., sales per employee). In their
evaluation of the possible reasons for the observed
differences, the authors proposed a number of "causal"
factors and a series of mechanisms through which they impact
retailing productivity. These primary determinants were
operationalized in per capita income, population density,
the rate of population growth and the age of settlement of
the region or trade area. However, As Hall et al (1961)
noted

74although emphasis has been placed on these particular variables... they may... themselves be indicating the effect of other variables [which are] not explicitly included [in the proposed framework] ... therefore, it is important to give hypotheses on the whole chain of causes of which these variables [may] form a part (p.134).
The “Modus Operandi" of these four "cause"
variables®* and the hypotheses that were advanced by Hal 1 et
al have had a profound influence on later empirical
research. Two of the proposed causal schemata, the
influence of per capita income and rate of population
growth, are reproduced in Exhibits 6 and 7, and a brief description of each is given below.
According to Hall et al, the first major factor, per
capita income, influenced retail labor productivity through
two interrelated mechanisms: the scale of the market and
changing shopping patterns ; and changes in the industry
structure and in the pattern of labor use (see. Exhibit 6).
For the first mechanism, which dealt with the changes
induced by demand related factors. Hall et al (1961) noted
that:®5
®* Modus Operandi here and elsewhere is used to imply the "manner" or the "mechanism" through which one variable impacts another variable.
Another factor proposed by Hall et al, population density, also impacts retail productivity through the scale and structure of the trade. With increasing population density, it is argued, the business potential within the trade area is expected to expand. This encourages more retailers to enter the market and will lead to increased competitive intensity, forcing retailers to upgrade their stores. These developments.

75Higher per capita income in general, raises expenditure [marked A in Exhibit &ch34] in any particular trade... In the short run, this must give rise to an increase in custom (ü) for the existing shops so that their average sales-size (K) must rise. In the longer run, whether the average [sales] size rises... depends on [the number of new] shops... attracted into the trade.
The higher mobility of wealthier customers afforded by higher incomes (B) would tend to favour the chains (0), as those who travel afieldto shop (I) name... In reduced by [increased] the chainsi ndependen t s , r i s1ng tend to increase the
tend to favour a store with a known this way market imperfection (P) is [both] greater mobility... and the extent of the market for chains. As are [generally] much larger than the
income would, in this way average scale of operation
for all stores (K and 0) (p.134)
As to the second mechanism, which concerned the market
organization and resource use in the retail industry, Hall
et al (1961) argued that :
a powerful influence on the number of independents... are supply factors (C,D, and E).The supply price of management (D) reflects the relative demand of other sectors on management... and also the alternative jobs open to people who would otherwise set up shop.Where labor is costly (E introduce labour-saving arrangements is greater, important in retailing, is to management provided by best use of labour that i former effect, involving finance for investment, wi far as capital is more wealthier areas (F) (p.135)
the incentive to devices (M) and
Perhaps equally the increased incentive high wages to make the s employed (L). Theas it does the use of11 be made easier in so readily available in
as in the case of high per capita income, similarly enhances labor productivity in the trade.

76EXHIBIT 6
A Causal Schemata Of The Effects Of Per Capita Income On Retail Labor Productivity
Per cop jto e x p e n d i tu re
■““55---M obility of c u t t o m e r t
5 T “Supply o f
e n t e r p r i s e
P e r c o p i y Incom e
(P ) (H)D e g re e o f C onsum ption
m o rk e t o f hom e im p e rfec tio n p roduce
(I)D eg re e of c o m p e titio n
•erfec tfon p roduce \
I I iE x te n t of p o te n t ie l m o rk e t fo r o g iv en
Shop
(kMore s h o p s in , M etropo litan e re o s
(0w
C hain s to re s o r e la rg e r
( i i ) In poo r a r e a s in d e p e n d e n ts w illing to s e t up v e ry sm o ll
sh o p s
(K)SCOle of
e s ta b lis h m e n t
755Supply p ric e
o f m o n o g e m e n t
5T“A voiloOility o f co p ilo t
Supplyprice ofWOour
C o re fü l
lo b o u r
(o)L arg e s c a l e o f
o rg a n is a t io n (C h a in s)
(C)Sice of
t r a n s a c t io n
(M)F lex ib ility a n d h ig h e r c a p i ta l
la b o u r ro t io
(N)S o le s p e r p e r s o n e n g o g sd
Source: Hall, Margaret, et al (1961), Distribution in Great Britain andNorth Anerica-A Study in Structure and Productivity, London: Oxford University Press.

77According to Hall et al (1961), the rate of
population growth also "afffects retail structure and
productivity both from the demand side, by way of inducement
to invest, and also from the supply side, by the
availability of sites for new and conveniently laid-out
shops" (p.137). As the authors noted (see. Exhibit 7):Conditions of expansion [due to rising population] are in many ways favourable to technical change. [Retailers] find their markets are expanding [marked F in Exhibit fichSB] simply because there are more people around (A) and are induced to innovate and expand (K), and not only inducement to investment is increased but the availability of capital is also increased (D), both by the accumulation of private means and undistributedprofits (C), and, usually at any rate, by theimproved credit facilities (E) that go with development.
What is probably a very important feature is the fuller use of existing store capacity (I) in an expanding area, a result of the inevitable time-lag in adjusting capacity to expanding markets. Furthermore, the availability of sites (in areas of high growth) and less traditionalism (E) facilitates the growth of modern stores (0)...A higher rate of growth, ceteris paribus, would tend to raise the size of establishment (N) and increase sales per person by the improved lay-outs (0) associated with newer and better equipped shops (L) (p.137).
In the years following this investigation, a number
of studies in both the U.S. and abroad were undertaken to
empirically test some of the propositions advanced by Hall
et al. In a study of retailers in British towns, George
(1966) hypothesized that town size, per capita income (Y),
tightness of labor market (T), the degree of chain store

78EXHIBIT 7
A Causal Schemata Of The Effects Of Population Growth On Retail Labor Productivity
Role o f f r o a th of population
wC ro o itr number
of people
0»)Greater eonw m ption o u t o f eieen income
(C)
Creoter
(D)A ttraction o f capital
(E)1*0* troaitionollem I g reo ie r availobilitir
from other oreo*
oecum uiotion o f profit*
C reoter ovoilability Of COpitOI
G reater ineeitm entfuller uoo i oeiitinpcopoclty
n(L) Hifhor eep ito l
lobour ra tioG reater e iie o f both chain* (
Indepenoent itoro*
Higher proportion of shop* eith new loy out
Source: Hall, Margaret, et al (1961), Distribution in Great Britain andNorth Anerica-A Study in Structure and Productivity, London: Oxford University Press.

79presence (C), and the average (sales) size of stores (S)
were positively associated with labor productivity.
Contrary to his initial expectation, no significant relation
was found between productivity and size of . town. George
conjectured that since the towns of smallest size in his
study averaged over 60,000 inhabitants, they were of already
sufficient size to accomodate optimal store sizes. A linear
regression of the remaining factors on labor productivity
(i.e., weighted average sales per employee) accounted for 82
percent of the variance in productivity among the retail
trades in 160 British towns.®® For individual lines of
trade, similar findings were found for grocery shops, but
associations for clothing, footwear and general stores were
insignificant (George 1966, p.40).
In a later study, George and Ward (1973) using
similar data for 1966, extended the earlier research,
investigating three interrelated questions. The Key
hypotheses in this research were;
1. Whether the long term upward trend in labor productivity reflects improved methods of selling, such as substitution of capital for labor (The Internal Efficiency Hypothesis), or
The regression equation estimated in George (1966) was:
LP = 800+63.5T+.0355+12.5C+4.3Y
with all regression coefficients statisticaly significant at p < .001.

80
2. If it is due to short-run lags in labor supply in adjusting to higher levels of sales (Short-Term Lag Hypothesis), and
3. Whether the productivity gains in retailing is due to the concentration of sales brought about by the elimination of marginal shops (Sales Concentration Hypothesis).
Using both time series and cross-sectional analysis on a
sample of the 50 largest towns in Great Britain, the authors
found strong support for the short-term lag hypothesis.
However, their statistical analyses also indicated the two
hypotheses (Lag vs. Internal Efficiency) not to be mutually exclusive but complementary in the long-run. They argued,
if the tightness of labor supply persisted into the
long-term, then, the retail stores would be forced to
introduce improved methods of sales which usually entailed
substitution of capital for labor.
The sales concentration hypothesis which predicts
greater sales per shop in the towns with the largest
productivity gains was also supported. A regression
analysis for 42 towns, relating productivity growth (AY) to
changes in labor tightness (AL), sales per shop (AS), per
capita income (AY/H), and the average household income
(Y/H), indicated change in sales per shop to be the most important factor.S7
57 The regresssion equation estimated by George and Ward (1973) was:

81
A series of other studies, by Bucklin (1977,1978b)
and by Takeuchi and Bucklin (1977) report the results of
similar research efforts. These authors investigated some
of the hypotheses advanced by Hal 1 et ai in the context of
the U.S. and Japanese retail trades. In these studies,
"major political units were employed as the
observât ions--the mainland states of the U.S. for 1964 and
1968, and the fortytwo prefectures of Japan for 1963 and
1967" (Bucklin 1978b, p.75).
Bucklin (1978b) examined the impact of seven factors effecting productivity in retailing (i.e., deflated sales
per employee). Six of these factors; i.e., role of scale in
retailing, price of labor, per capita income, population
density, population growth, and a dummy variable for time,
were all expected to be positively associated with labor
productivity. For a seventh factor, importance of
department stores, no definitive hypothesis was advanced.
The results of a log-linear regression analysis from
Bucklin (1978b) along with the operationalizations of each
of the variables are reproduced in Exhibit 8. Generally,
moderate to strong support was found for all factors, except
for the population growth and time variable for the U.S.
sample, and population growth and urban density for Japan.
AY = 19.5+2.89AL+.167AS+.379AY/H-.037Y/H
with all regression coefficients statistically significant at p < .05.

82EXHIBIT 8
Results Of A Regression Analysis From Bucklin (1978b)
Predictor Parameter EstimatesVariables Operational Measure Japan U.S.
Scale of Operations
Stores per capita -.53* -.11*
Tightness of Labor Market
Trade Wages .25* .40*
PopulationGrowth
Percentage Change in Population .01 .00
TransactionSize
Income per capita .65* .07*
Competi tion Urban Density -.03* -.00
ServiceLevel
Proportion of (Sales) Department Stores .02* -.08*
T ime Dummy -.06 .02*
Constant - - 2.33 -1.02
2R .96 .63
* p < .05 (one tail test)

83The results of a similar analysis, based on the same
data sources is summarized in another paper by Bucklin
(1377). In this study, however, the dependent variable was
real output (measured as deflated sales), and an additional
independent variable, number of retail employees, was
included in the regression model. As Bucklin (1977) noted
this form of the model does not reflect productivity directly.., since no explicit output/input ratios are produced. However, the impact of changes in variable upon partial productivities can be readily discerned. For example, if the coefficient for per capita income is positive... the higher per capita will create a greater level of output when labor is held constant. Such development results, in effect, in a more efficient use of labor; productivity thereby has been improved (p.226).
Results from the regression analysis from Bucklin (1977) are
reproduced in Exhibit 9. Bucklin attributed the near
perfect fit of the regression equation for both samples to
the close association between retail employment and retail
sales. Otherwise, the results of this latter study
reiterated the findings of Bucklin (1978b).Takeuchi and Bucklin (1977), in an extension of
these earlier studies, investigated the factors that may
effect the retail structure (i.e., the number of stores per
capita), which in turn, was posited to be a major influence
on retail productivity. Although the primary interest in
this work centered around estimating the influence of
various environmental variables on the structure of retail

84EXHIBIT 9
Results Of A Regression Analysis From BucKlin (1977)
2Adjusted R .99 .99Observations 96 92
* p < .01p < . 1 0
PredictorVariables U.S.
Parameter Estimates t-Score Japan t-Score
t-Score Difference
Constant .30 2.8* . 14 3.0* .8Time Dummy
PRODUCTIONFUNCTION:
.01 3.7* -.02 2.6* 3.7*
Employment Establishment
.99 210.4* 1.09 58.6* -.5.8*
per capita -.07 -1.9** -.24 -2.1** 1.6Trade Wages Income per
.36 4.8* .23 3.3* 1.0
capi ta Department Store Market
.07 1.7** .65 6.9* -6.1*
Share
STRUCTURE:
-.08 -4.6* .04 2.7* -4.1*
Urban density Population
.00 .4 -.04 -3.6* 3.9*
Growth .18 3.8* .17 1.7** . 1

85trade, an aspect of this study was rather untraditional. In
this paper, the authors advanced a number of latent
construct, such as "personal wealth," "the level of
technology employed" and "degree of competitiveness," all
hypothesized to impact another unobservable (i.e., the
"structure in retail trade"). Hence, some of the
traditional empirical concepts that had been used to test
research hypotheses, for the first time in this study, were
associated with more general, unobservable constructs. The
single equation linear regression analysis used in the
empirical tests of the hypotheses, however, was unjustified
given the conceptual underpinnings of the proposed model.®®
Recently, in a focused effort to integrate several
prior approaches. Ingene (1981,1982,1983c), Ingene and Lusch
(1980,1981) and Lusch and Ingene (1980b) have undertaken a
number of studies investigating the retail productivity in
the U.S. SMSAs.In an essay outlining the conceptual framework for
the subsequent mathematical and empirical analyses. Ingene
(1981) distinguished between three interrelated conceptual
models of productivity in retailing. The first of these
conceptual models, according to Ingene, was an economic
approach, which was largely based on the notions associated
®8 The reference here concerns the inability of traditional regression analyses to account for measurement errors.

86with production functions.®® In this conception, the outputs
of a retail unit were typically viewed as the result of
three interrelated factors: the technology of the retail
.unit, scale economies, and the degree of factor
substitutability. Hence, according to the economic model of the retail firm, the level of productivity achieved was seen
as a function of two fundamental questions of
1. how much to produce?, and
2. how to produce it?
Ingene argued that an answer to the first question
generally lies in a firm's assessment of the expected level
of demand, the degree of scale economies implicit in theproduction function, the costs of producing and holding
inventories, and on the attitudes of the retailer toward
risk. Given a desired level of output, then, the answer to
the second question was one of deciding what amount and what
combination of inputs to employ in the production (Ingene
1981, p.7). However, as Ingene noted
[since] the economic view of productivity... is fundamentally a manufacturing [i.e., production] notion... it is predicated upon the possibility of output even in the absence of sales (p.8).
59 por a sample of articles which deal with production functions and retail productivity, see, for example. Ingene (1983b), Bucklin (1983), Lusch and Ingene (1980a), White (1976), Malien and Haberman (1975), Savitt (1975), Ofer (1974), Arndt and Olsen (1975), Bishop and Hughes(1967), Tilley and Hicks (1970). Bucklin (1978b) gives a limited review of these articles.

87Because in a service establishment such as retailing no
output occurs in the absence of an exchange or transaction,
Ingene (1981) further argued that
caution must be exercised in applying the economic approach to productivity analysis in the marketing sector of the economy (p.8).
According to Ingene (1981), the second conceptualmodel in productivity analysis, the behavioral approach,
centered around "labor efficiency." Here, it wasexplicitly recognized that people, in contrast to automaton
concept of human resource in economic approach,work with differing levels of efficiency... which is influenceable throuah both hiring practices and by employee treatment land training] (p.8).
Thus, with a behavioral approach, the productivity of a
retail unit primarily depended on the efficiency of labor,
which in turn, was viewed as a function of the personal
abilities, training, motivation of the labor, and their
expectations of the pecuniary and psychological rewards.®®
According to this second model, then, the productivity of a
retail unit was a function of not only the economic
phenomenon of scale economies but it also depended on the
behavioral phenomena implicit in the selection, training and
maturation of the retail work force.
®o Ingene (1981,1983c) did not explicitly define the concept of "labor efficiency" in his essays. It would appear, however, the concept implicitly refers to a number of innate or learned personality traits, which are posited to be factors which are instrumental in producing retailing services, i.e., outputs.

88EXHIBIT 10
Marketing Approach To Productivity Analysis In Retailing
P r o J u c l iv i t y
A c t i u ldem and
( 1 8 )
O ther inputs (7 )
L a b o r (8 )
P o ten ti a lo u t p u t
(1 9 )
Prom otion(1 3 )
Input costs iS )
Expected d em and (2 )
A ctual environm ental
dem and (actors 117
Actual co m p etitio n i IS i
Perceived environm ental
d em and factors (1 6 )
inSource: Ingene, Charles A. (1983), "A Conceptual Model and Empirical
Evidence of Labor Productivity in Department Stores," Productivity and Efficiency in Distribution Systems,David A. Gautschi (Ed.), N.Y: North Holland.

89A third conceptual model proposed by Ingene (1983c),
labelled the marketing approach, is a synthesis of the two
early approaches (see, Exhibit 10). According to Ingene,
this new framework incorporated the key elements from both
the internal paradigm (i.e., the behavioral approach), and
the external paradigm (i.e., the economic approach). Ingene
(1983c) described the new paradigm as follows:
Internally, managerial decisions ( (1) in Exhibit 10) are made on how to motivate (10) employees (8) to create effective employees (11), Managerial decisions about number of laborers (8), capital (6), and other inputs (7), in conjunction with motivation, cont>ine in the production function (9) to create potential output (19).., (i.e.).., thevalue of output that an establishment is capable of producing in a given time span... Such factors as hours of operation, number of employees, merchandise on hand, and so forth affect potential output. However, in the absence of demand, this output remains potential because no exchange occurs... (Hence), managerial decisions (1) are made on the basis of the expected level of demand (2), relative input costs (5), the manager's risk attitude (12), and the amount of "inventory" on hand (p.80-81).The external paradigm is focused upon the relationship between the expected level of demand(2) and the actual level of demand (18). Expected demand is determined on the basis of two sets of factors (14). First, are the anticipated environmental factors (14)-- psychographic and demographic profiles of customers and environmental factors like the transportation network. Second are the perceived efforts of competitors (16). Of course, these factors are related to the actual environmental demand characteristics (15) and the actual effort by competitors (17). These actual factors interact in the minds of the consumers to create an actual level of demand (18) for the establishment's potential marketing output. An important influence on actual as well as expected demand is promotional effort (13) (p.82).

90Finally, marketing productivity is determined by the lesser of actual demand and potential output.That is, the marketing approach to productivity shows that the internal and the external paradigms of productivity are both important in ascertaining marketing output and therefore the level of productivity in marketing (p.82).
In two other studies, the first dealing with retail
labor productivity (Lusch and Ingene 1980b), and the second
on retail market structures (Ingene and Lusch 1981), the
authors have developed a number of econometric models in an
attempt to "axiomatize" some of the notions associated with
Ingene's “marketing approach.“Starting with the standard assumptions of
neoclassical economics,®’ and a mathematical definition for
the demand and cost functions, Lusch and Ingene (1980b)
derived a theoretical productivity function and examined itsbehavior by differentiating it with respect to a set of
variables.®2 The theoretical propositions that were advanced
by Lusch and Ingene (1980) which deal with productivity
performance of retail units are reproduced in Exhibit 11.
®’ For example, profit and utility maximization for firmsand consumers, a downward sloping, and identical linear demand curves for all households in the market, a circular trade area with stores in the locus, etc.
®2 Although there is overlap in the variables, the firststudy (Lusch and Ingene 1980b) dealt with retailing productivity, while the second study (Ingene and Lusch1981) was primarily concerned with retail market structure.

91EXHIBIT 11
Research Hypotheses Advanced By Lusch and Ingene (1980b)
P-1. As each employee in department store can serve more households labor productivity will rise.
P-2. As household transportation costs rise labor productivity wi11 decline.
P-3. As the maximal demand price households arewilling to pay for the conposite commodity department stores sell labor productivity will rise.
P-4, As variable costs in department stores riselabor productivity will decline.
P-5. As density (households per square mile)increases labor productivity will rise.
P-6. As retail wages rise labor productivity wi11rise.
P-7. As retail wages in apparel stores riserelative to department stores then labor productivity in department stores will rise.
P-B. As conpetition (nurriaer of department storesper household) rises labor productivity will increase.
P-9. As the breadth of assortments in departmentstores increase and as amenities increase labor productivity will rise.
P-10. Rapid market growth will stimulate laborproductivity.

92
Ingene attempted to empirically test some of these
and other hypotheses for grocery retailing (Ingene 1982),
and for department store retailing (-Ingene 1983c). In both
of these studies the data sources employed, and the major
research questions posed by the author were almost
identical. Hence, only the former study is reviewed here.
Ingene (1982) investigated the determinants of
retail productivity (i.e., sales per employee), using data
from various published reports at the level of the U.S.
SMSA markets. The proposed determinant factors, their
enpirical definitions and the direction of hypothesized
relations to retail labor productivity are reproduced in
Exhibit 12. The results of a ridge regression analysis gave
moderate to strong support to all of Ingene's hypotheses
except for the variable population growth. Using the same
methodology, data source, and variables. Ingene (1983c) reported similar findings for department store retailing.®^
In the latter study, "congestion," as an indicator of consumer mobility was found to have a positive association to labor productivity, contrary to the author's prior expectation.

93EXHIBIT 12
Determinants
Name
Of Labor
FradietedSign
Productivi
Symbol
ty From Ingene (1982)
Definition Source*Capital intensity + (F/L) total grocery sto re floor
space in th ousands of square feet in the SMSA divided by num ber of em ployees
CRT
Average store size (F/N) thousands of square feet of total grocery store floor space in the SMSA divided by num ber of stores
CRT
Retail space saturation IF/POP) thousands of square feet of total grocery store floor space in SMSA divided by SMSA population
CRT. SBP
Retail w age rate -t- (W) annual w age rate in grocery stores
CRT
Population growth + (G) percentage population grow th in the SMSA, 1970-1972"
SBP
Labor efficiency/com petitiveness
+ (NMPH) num ber of "m om and pop" sto res per 1,000 households
CRT, SBP
Income + (V) average household effective buying incom e (state and local taxes are excluded)
SBP
Household size + IPOP/H) SMSA population divided by num ber of households
SBP
Mobility (availability private transportation)
+ (M,| autom obiles per household MVR, SBP
Mobility (congestion) (M,) autom obiles per square mile
MVR, CCD8
Sales per em ployee (S/Ll sales in grocery stores with payroll divided by num ber of paid em ployees
CRT
*SBP » "S u rv ey o< B uying P o w er" (Sties end Merketing Minegement 1973): MVR « "M o to r V ehicle R eg is tra tio n s" (U.S. D ep artm e n t of T ran sp o rta tio n 1973): CCDS - "C o u n ty a n d City D ata B ook" (U .S . O e p a r tm tn t o f C o m m erc e 1972b); CRT « "C en su s of Retail T rad e" (U.S. D ep artm en t of C o m m e rce 1972a).'S o m e SM SA s h a d a n eg a tiv e G: th e re fo re . G w a s tra n s fo rm e d u p w a rd by .1 fo r e v e ry o b s e rv a tio n in o rd e r to be ab le to take logarithm s. This a ffec ts th e im arcap t v a lua .
Variable Bata Standard Error t-atatlsticIntercept ,231 .024 9.51'F/L .156 .035 4.48*F/N -.0 5 9 .025 -2.40*F/POP -.0 7 6 .034 -2.22"W .690 .030 23.32*G .010 4)14 0.70NMPH .038 .008 4,51"Y .186 .043 4.33'POP/H .181 .047 3.84*M, 222 .036 6.15*M, -.024 .006 -4 .3 3 'A* « ,754; th e coeffic ien t v a lu e s s tab ilize b y K < F • 65.33; P < .001d.f. - 199_______________________________________
* p < .01• p < .025
0.2.

94
An Evaluation Of Macroretai11ng Performance Studies
The macroretailing studies of retail performance reviewed in
this section share a number of common characteristics. Some
of these characteristics concern the general assumptions
underlying these investigations, and hence, are more
conceptual in nature. Others, however, have to do with the
empirical analysis and the statistical inferences drawn from
these studies, and hence, are methodological.
The macroretailing studies of retail performance
have traditionally d.erivèd their major theoretical
propositions and research hypotheses from the collective
behavior patterns "attributed" to a group of retail stores
and/or to the outcomes of their collective behavior. In
this regard, for example, when tightness of labor supply is posited to influence retail productivity, the inplicit
assumption has generally been that all firms, in adjusting
to such an environmental condition act in an identical
manner (e.g., substitute capital for labor) and that the
outcome of such actions (e.g., retail productivity) are
similar for all stores. On common sense grounds alone, this
probably may not be so. However, given the nature of
empirical data sources employed in this stream (i.e.,
sectoral, or SMSA data sources), it is impossible to test
the validity of such assumptions.

95As it was indicated in the introduction to this
research, macroretai1ing studies are also based on a faulty
conception, of the "retail industry." To the extent a retail
industry exists only at the level of a limited geographical area, in many cases much "smaller" than even an SMSA, these
studies are several stages removed from assessing the impact
of market forces on "retail store" performance.
On the methodological side, the macroretai1ing
studies are also defective. In all of these studies, the
investigators have posited a nuirt>er of factors such as
market demand, mobility, congestion, competitive intensity,
and so forth to have a significant impact on retailing
performance. Few, if any, of these variables, however, are
readily observable or measurable with a single indicator.
Furthermore, in these studies whether the proposed
influences of these variables are direct, indirect or both,
have never been explicitly tested.
In part, these shortcomings are a direct result of
the traditional statistical techniques used in this research
stream (e.g., regression analyses). Single equation
regression analyses are generally incapable of separating
out such direct vs. indirect effects and/or controlling for
the influence of intervening variables. More importantly,
the strict assumption about errorless measurement in
variables, given the nature of variables involved in most
investigations, are simply not defensible.

96
A number of other methodological problems with these
studies were noted by Ingene (1982). Following a review of
the major research in this field, Ingene pointed to
difficulties in making substantive inferences based on the
regression coefficients. Acording to Ingene (1982), the
problems could be attributed to four major reasons:®^
First, specific concepts have been measured with several variables, causing ambiguity as to the relative importance of each variable in contributing to the concepts. Second, each of the variables employed in the regression has proxied for several concepts, which leaves unanswered the question of the importance of each concept separately. Third, some authors have included sales on both sides of regression equation, thereby biasing the results. Fourth, there has often been a high degree of col linearity between the independent variables which can cause instability in regression coefficients. Not all of the works however possess all the weaknesses(p.80).
Some of these points raised by Ingene are followed up in a
recent paper by Hughes and Serpkenci (forthcoming) and will
be discussed in more detail in the next sections.
Despite these and other shortcomings, however,
macroretai1ing performance studies have collectively
identified a series of key concepts and variables which have
significantly shaped research in this area. Further,
studies by Hall et al, Bucklin, Ingene and Lusch and others
have posited or introduced a number of mechanisms through
which these concepts operate in influencing retailing
Table 2 of Ingene's paper is illuminating in this regard (1982, p.80).

97performance. Hence, although marred by methodological
problems, these studies have nonetheless established the
beginnings of a rich conceptual network for future research.
Microretai1ino Performance Studies
Whereas the major interest of macroretai1ing studies
has been on retailing at some goegraphical or census
aggregation, the general focus of microretai1ing performance
is typically on the individual retail unit, and in some
occasions, on the departments within a retail store. Because of this micro interest, the research in this stream
has generally involved either costly primary data collection
and/or proprietary studies done for individual retail firms.
Therefore, it is not surprising that only a fraction of
these studies have reached the forums of academic discourse.
Despite this, however, a body of literature has evolved
through the years which provides additional insights into
the inquiry of retail store performance.
Aside from the level of analysis, a major difference
between the micro and macroretailing studies involves the
operational measures of economic performance utilized in
research. In this regard, macroretai1ing investigations are
predominantly oriented towards assessing retail
productivity. The primary interest in most microretai1ing
studies, however, is on the financial efficiency or

98
profitability of retail establishments. A number of earlier
studies are illustrative in this regard.In mid-1950's and 1960's, a number of scholars have
attempted to uncover the factors which impact retail margins
and expenses, and hence the profitability of retail units.
In one of the earlier studies, for example, Bass (1956)
undertook
to derive quantitative estimates of the relationships of sales, location, store type and city size to expenses and gross margins for retail drug stores (p.236).
Using data from 1948 profit-and-loss statements for a sample
of independent drug stores in the U.S., Bass hypothesized
that the variation in gross margin was a function of the
variation in the product mix employed by the drug stores.
The results of a simple regression analysis, where grossmargin (in percent) was related to percentage prescription
sales gave support to his hypothesis. As for variation in
expense (in percent), Bass hypothesized that the sales
volume, store type, location within a city, business
efficiency, product mix and city size were the determinant
factors.®® The results of a partial correlation and
regression analysis on a subset of these factors (i.e.,
sales volume, product mix, gross margin, and city size)
indicated that
®® Store "expense" was defined as "the sum of all of the customary expense items except proprietor's withdrawals" (Bass 1956, p.236).

99percentage expense (over a brief range of sales volume): (1) to decline as sales increase; (2) to increase as percentage gross margin increases; and(3) to increase as the size of city in which the stores is located increase (All with significant discontinuity in the relationships) (p.241).
in a number of related studies, Bass (1958,1959),
and others (e.g.. Brooks 1958, Converse 1959) explored thepossible determinant conditions of a phenomenon observed in
retailing, due to an earlier study by Seerist (1933).
Secrist had observed that stores whose percentage expense
and gross margins that were far removed from the average in
a particular year, tended, in later periods to revert to the
overall average for the entire group of stores (Bass 1958). An "explanation" for this pervasive phenomenon labelled,
"regression to type," Secrist argued, could be found in
competitive pressures which somehow forced retailers to take
steps that would bring them closer to the group norm.
Bass (1958) undertook a study to determine whether
these tendencies could also be observed in drug store
retailers, and if so, how they may be "explained." A
time-series analysis of gross margin and expense percentages
for a sample of 100 drug retailers for each of the five
years (1948-1952) generally supported, "Secrist's conclusion
of 'regression to type' as a general phenomenon of
retailing" (Bass 1958, p.310). As for the possible "causes"
of this phenomenon, Bass examined the behavior of a nuntoer
of other operating ratios (i.e., sales growth, changes in

100
labor, occupancy, and advertising expenses) for upper and
lower quartile drug retailers. Results of a series of
qualitative conparisons indicated that decreased expense
percentages (for high expense stores) to be due to sales
growth, and the increased expense percentages (for low expense stores) to be due to increased labor expense. Bass
concluded that the ability of the high expense stores in
gaining sales growth, and alternatively, the inability of
low expense stores (which were presumably already using
labor and space to capacity) to control their labor
expenses, could be an alternative "explanation" to Secrist's
competitive pressures hypothesis.In a later study. Converse (1959) offered several
other conjectures as to why such a phenomenon would occur.
Converse appeared less troubled with the "regression" of high expense stores to a lower norm, since it seemed
"obvious... high cost operator's must reduce their expenses
or go out of business" (p.419). The more interesting
question, Converse argued, would be to find out "why low
cost [efficient] operators allow their expenses to increase
and their rate of profit to decrease?" According to
Converse (1959), the possible reasons for the gradual
decline in profitability for retail stores could be found in
one or more of the following:®®
®® Converse (1959) did not, however, provide any empirical support for any of his conjectures.

101
1. Entreprenurial inertia of the store owners,
2. Increasing waste and obsolesence in or of store operations,
3. Increased service offers which add to the expenses of the unit, and
4. General decline in the quality of management through time.
These studies, in general, are illustrative of some
of the earlier investigations of retailer performance at the
micro level. In this early research, investigators have
generally combined a conjectural, speculative orientation
with a research methodology conducive more to provide
empirical generalizations than "explanations." In later
studies, identification of factors posited to influence
retail store profitability have followed a similarapproach.G7
Applebaum (1965), for example, proposed that store
location, income of population served, store size and age,
gross margin and expenses were major determining factors of
store sales and profitability. Based on a number of studies
that the author undertook for six supermarket chains,
Applebaum presented a series of cross-tabulât ions for each
of the hypothesized factors with several indicators of
financial performance (e.g., sales per square foot, profit
It is worth noting that several papers by Alderson (1950), Alderson and Shapiro (1964), and the chapters 8 and 9 in Dvnamic Marketing Behavior (1965). are clearly exceptions.

102
per square foot, percent profits, etc.). Results of his
analyses indicated that the stores located in planned or
neighborhood shopping centers tended to generate higher
levels of profitability than those with downtown or small
town locations. Further, Applebaum observed that the stores
located in higher income areas, with superior facilities
(compared to a major competitor) had higher sales, sales per
square foot, and profitability. Finally, the results also
indicated that the stores in the declining stages of their
life cycle (10 years or older) had the lowest profitability:
the stores in the ascent stage of their life cycle (3 years or newer) had below average profitability; and the stores in
the maturity phase (3 to 10 years of age) had the highest
levels of profitability.
A more rigorous study investigating the role of
locational factors on retail unit performance was undertaken
by LaLonde (1962). Lalonde's primary research hypothesis
posited that
store size and store complex [are] significant I factors] in influencing the consumers' decision on the distance they will travel to fulfill their food purchasing objectives (p.5).
More specifically, a number of auxiliary hypotheses derivedfrom the primary research question stated t h a t ® s
G8 These hypotheses appear as separate research questions in LaLonde's monograph. Here they have been combined into one compact statement.

103the drawing power [average distance traveled by consumers], and sales per capita of a supermarket [dollar sales per person per week] to be higher, when the product offering in a retail complex [number and type of different stores] and the size of the store [square feet of selling area] are larger (p.5-6).
The results of an analysis of variance, based on a sample of
15 supermarkets and 5,300 consumer interviews, indicated a
strong association between (a) product offerings and the
size of complex, and (b) the drawing power and sales per
consumer. However, no systematic association was found
between either (a) the individual store size and drawing
power, or (b) per capita sales and the size of store.
A similar study, investigating the impact of
locational factors on the performance of a service establishment was undertaken by Hansen and Weinberg (T979).
Using data from 60 banking offices in 17 shopping centers
in California, the authors posited market performance
(market share) of a banking office was a function of its
locational characteristics (relative distance to a central parking center); branch features (presence of walk-up and
drive-up windows); newness of the unit (age of branch); and the name of the parent organization.Further, it was
hypothesized that the market share (as an indicator of
branch performance) was inversely related to distance (i.e..
The variables for market share and location were expressed as fractions. All other variables were codedas dummy variables, 0-1, presence indicated by a nonzero element.

104
location), and positively associated with the indicators of
branch features and image (e.g., age, services offered andaffliation). A multiple regression analysis derived from
.Nakanishi and Cooper's (1974) extension of the MCI model
indicated that all the variables except for one (drive-up
window) were statistically significant (p < .01). Hansen
and Weingberg (1979) concluded that
the significance of the coefficient for location supports the hypothesis that relative location in a shopping area is an important factor in banking office's market share (p.45).
A number of other studies, where financial
performance of retail or service establishments were related
to a series of demographic, competitive, and store's own
charateristics are illustrative of another research thrust
in microretailing research. In general, these studies are
not concerned with the identification or assessment of
"determinant conditions" of retail store performance. The
purpose of research with these investigations is typically
to build quantitative, predictive models for a retail firm
which could subsequently be used as a tool in managerial
decision making. Several studies are illustrative of this research orientation.
Clawson (1974), for example, undertook a study to
illustrate the usefulness of regression models to
more effectively screen new branch locations, set realistic performance standards for differentcommunities, and pinpoint remedial actions (p.8).

105
More specifically, the main purpose of the study, as Clawson
noted, was
to explore the marketing management applications of the regression approach rather than [its implications for] the research methodology or the specific findings (p.12).
Using data from a sample of 26 branches of a local savings
and loan company, 24 variables aggregated into three general
blocks-- local population, competitive characteristics, and
own branch features --were posited as general correlates of
savings performance."^® The list of 24 variables and their
operationalizations are reproduced in Exhibit 13. Theresultant stepwise regression equation with ten significant
variables, Clawson argued, could be used as a managerial,
diagnostic tool by comparing the actual performance of the
branch with the predicted performance obtained through the
regression model. ’"Measuring and evaluating the performance of outlet
managers in multioutlet businesses" was the theme of a
similar study by Kinney (1969). As the author noted
7 0 Performance was defined as the net savings gain in abranch in one year. Furthermore, all of the data forpopulation and competitive variables pertained to acircular area with a radius of two miles surrounding each branch location.
7 1 In a later article, Alpert and Bibb (1974) noted thatClawson's model, which involved 24 predictor variables and 26 observations, was methodologically problematic, since the resulting F ratio with only one degree offreedom could not be used for statistical significance testing.

106
EXHIBIT 13
The Set Of Predictor Variables From Clawson (1974)
Units Mean
Dependent VariableXi Net savings gain, 12 months, in branch $000 3441
Population Block (P)X i Renter-occupied dwellings % 50.9Xi S&L savings per capita (total savings held in all
local S&L tacilities, divided by local population) $ 2.645X. Income per capita $ 3.492Xi Median value of owner-occupied homes $ 30247X i Persons age 45-64 % 22.8Xi Persons age 65 and over H 11.1
Competition Block (C)X i Competing S&L facilities No. 44X» Population per S&L facility No. 18461Xw Commercial bank facilities No. 104Xn Average net savings gain of local
S&L competitors, 12 months $000 2,970Xu Share of total local S&L savings held by local main
and executive offices of competitors % 274Xu Branch of Colossal S&L Association nearby 1 or 0 047Xu Total assets of competing S&L associations
having local branches $000,000 2,742
Branch Block (B)Xu Retail sales per year within
one-half mile radius of SPC branch $000.000 46.7Xu Branch inside formal shopping center 1 or 0 0.15Xu Branch opposite formal center 1 or 0 0.15Xu Branch approaching formal center 1 or 0 0.04Xu Branch in central business district 1 or 0 040Xu Branch in free-standing building 1 or 0 0.81Xn Age of branch Years 13.1Xn Exterior attractiveness (rating) 1-5 34Xu Interior decor (rating) 1-5 3.8Xu Parking adequacy (rating) 1-5 3.6Xu Branch advertising and promotion cost $000 234
VariableNo. Description* Block.
RegressionCoefficient
Initial Increase
in R*Final
t-Value
X» Average net gain by compeutors C 0.708 .449 349
X. Age 45-64 P 147.191 .147 149Xu Exterior
attractiveness B 1131.404 .106 345X. Income per capita P 1.142 J)53 2.53Xu Local promotion B 29.987 j029 244Xu Main and executive
offices C -35.401 J036 -2.99X. Population per
S&L facility C 0.087 j035 3.16Xu Retail sales B 20431 428 240X . Renters P -52.925 419 -243Xu Approaching
center B -2505.012 413 -141— (Intercept) -9342463

107outlet managers generally have no choice as to the outlet to which they are assigned, the size, location or facilities of the outlet, and they have little control over the income, buying habits or other characteristics of the population. Yet, the performance measure (the net contribution of the outlet) include the effect of these factors which are not controllable by the outlet manager(p.6).
Hence, since the differences in measured performance among
outlets were a result of variations in locations, facilities
of outlets, as well as the differences in the performance of
the outlet managers, Kinney argued that the effects of the
former should be extracted before evaluating the performance
of the outlet manager. Accordingly, to augment the
traditional accounting reports used in managerial
evaluation, Kinney undertook to construct a regression model
to factor out the impact of uncontrollable factors on the
financial performance of the unit.Using the catalog order centers of a national retail
chain as his sanpling unit, Kinney related a number of
demographic (e.g., population, median family income, age
etc.), locational (e.g., distance to a central warehouse),
competitive (e.g., presence of Key competitors) and store
characteristics (e.g., remodeling, age of unit, number of
catalogs issued, etc.) to sales and the controllable
expenses of the unit. Results from a series of statistical
tests (e.g., analysis of variance) indicated that
nearly four times as much of the variance in sales among outlets is explained by the levels of nonmanageria 1 factors under which the outlets were

108in operation than by differences among managers, after considering the nonmanageria 1 factors (p.39).
Hence, according to Kinney, a poor reported contribution
margin for a unit, based on responsibility accounting
methods, could give a faulty indication on the viability of
the retail unit and the performance of its manager, since
A poor reported contribution can be due to a poor location or poor facilities or poor management or some combinations of these factors. A good location with poor facilities and poor manager should probably be remodeled and restaffed, not eliminated. A poor location with good facilities and a good manager should be eliminated and the funds and manager, thus freed, could be transferred to a better location (p.26).
Kinney concluded that an environmental model developed in
this fashion could provide much needed information for such
decisions.
Cottrell (1973) reported the results of a similar
investigation based on a sample of 37 outlets, randomly
selected from a population of 800 supermarkets. Cottrell
related a number of indicators of financial performance
(sales, gross margins, controllable and noncontrollable
expenses), both at the level of the establishment and
departments within the store to a number of nonmanageria 1 f a c t o r s . ^ 2 Cottrell argued that the regression equations
72 The 20 predictor variables, similar to the earlier studies by Kinney and Clawson, were categorized into several blocks-- store operations (e.g., square feet of selling space, number of check out counters); competitive factors (e.g., discount store presence, number and size of competitors); and demographics of the market (e.g.,

109derived from such an analysis were, "a significant
inprovement over the more traditional estimators of
performance based on outlet size alone or on extrapolations
of past performance" (p.61). However, he also cautioned
that the model was useful only as a short-run forecaster of
store performance, since the relationships among the variables could change over time.’®
Another research thrust in microretiling performance
studies is i1 lustrated by Dalrymple (1966). Dalrymple investigated the relationships between the departmental
profitability and a number of internal factors. Hence, in
contrast to previous studies, which have examined the inpact
of external variables in predicting profit performance,
Dalrymple focused on only the managerially controllable
factors (e.g., stock turnovers, merchandise price levels,
initial markups and markdowns, etc.) internal to the firm.
Sinple correlation and stepwise regression analysis
based on monthly and yearly data for the individual
departments of one department store indicated that sales
volume was the most important merchandising variable in
determining profitability. The importance of markups and
markdowns appeared to be mixed, while stock turnover was
sales potential, size of trade area, population and density).
73 A recent example of the application and use of quantitative tools for retail decision making can be found in Lodish (1982).

110
"unable to contribute to the explanation of department store
profits" (p.38).In another study, Morey (1980) examined the sales
response to changes in the level of service provided by a chain of grocery outlets. Using a before-after research
design, Morey investigated the effect of a change in the
staffing policy in 61 government-run Navy commissaries on
the change in sales per person-month.Several variables on
store characteristics (e.g., the price levels, physical
attractiveness, sales per retired consumers) were introduced
as control variables, and a regression analysis was
performed to discern the effects of (a) hours of operation,
and (b) the number of store personnel, on store sales.The results of the statistical analysis indicated
that
every 1 percent improvement in the service levels [were] accompanied by about 2.9 percent increase in real sales... [however] there was diminishing returns from improving service level, i.e., store sales respond at a slower rate as the level of services improves (p.90).
Two other factors, the physical attractiveness of the store
and the relative pricing advantage were also found to have a
significant influence on changes in sales volume.
74 "A person-month is the level of effort associated with one person working for one month or, alternatively, two persons working one-half month" (Morey 1980, p.83). According to the author, a substantial personnel cutback was implemented in most of these stores which resulted in stores either reducing their hours of operation or store personnel or both.

111
Specifically, the stores with poorer facilities and less
competitive price advantage were observed to respond faster
to service improvements than the more attractive stores
and/or stores offering larger savings.A final illustration of the studies with a
microretailing focus is a PIMS pilot project reported by
Buzzel1 and Dew (1880). The PIMS study was based on a
sample of 60 SBU's,’® that had complete information on the
operating and financial statistics, and other estimates on
various market factors (e.g., market share, market growth,
locational and facility characteristics, merchandise
assortments, etc.). Using statistical techniques similar to
those of the regular PIMS program, the authors summarized
their key findings as follows:
1. Profitability improves with higher market share, measured at the level of local markets.
2. Businesses operating in high growth markets . are generally more profitable, (cf.. Hallet al 1961, Buck!in 1978b, Ingene 1982).
3. As store expansion and modernization increase, profitability declines--at least in the short run. (cf.. Hall et al 1961,Buck1i n 1978b).
75 A recent example of this research thrust can be found in Curhah, Salmon and Buzzel1 (1983).
7 5 Strategic Business Unit (SBU) was defined "as a group of stores of a given type (e.g., budget, junior apparel, etc.), located in a given market area (i.e., SMSAs or ADIs)" (p.3).

112
A . Those stores which were most profitablewere definitely the most productive in terms of sales per square foot of floor space. (cf., Ingene and Lusch 1980b, Takeuchi 1977, WicKern 1966).
5. The most profitable businesses operated primarily in mall locations (cf., Applebaum 1965, LaLonde 1952).
6. A retailer's profitability is higher, on average, when his primary competitors also enjoy high space productivity. (cf., Bucklin 1978b).
7. High employee compensation, relative to competition, has a positive impact on enployee productivity and consequently store profitability. (cf., Bucklin 1977,1978b, Lusch and Ingene 1980b, Ingene 1982,1983c).
8. High relative prices adversely effect profitability, (cf.. Hoidren 1960)
Interestingly, a number of the findings from the PIMS pilot
study strongly reinforce some of the earlier findings and
research hypotheses from both the macro and microretailing
studies. In order to highlight these synergies in research
results, studies with conclusions similar to PIMS findings
are noted in the parentheses.
An Evaluation Of Microretai1ina Performance Studies
The microretai1ing studies reviewed in this section
are but only a sample of the published literature.
Predictably, a significant amount of similar research exists
in nonpublic domain in the form of proprietary studies. The

113purpose here, as it was throughout the chapter, was to
provide a selective but representative review of the
previous and present thinking in retailing.
Traditionally, the microretai1ing studies have aimed
to generate quantitative, forecasting models for retail
decision making. In most of these investigations, there is
neither an intent nor an attempt to make inferences beyond
that of the immediate research setting. Although these
studies can also be criticized for common methodological
flaws (e.g., redundancy or communality of variables on
either side of regression equations), these issues are
largely irrelevant, given the general nature of these
studies.
Collectively, however, these studies are valuable
for two reasons. First, since the researchers in this
research stream have closely worked with individual retail
firms or establishments, these studies generally give a good
indication of the "common wisdom" in the field. This is a
useful starting point for generating "theories in use"
(Zaltman et al 1982). Second, as it was noted at the end of
the preceding section, some of the results from these
studies’provide reinforcing conclusions. In this sense,
microretailing research also acts as a form validity check
on the results of other studies.

CHAPTER IV
A MODEL FOR THE EXPLANATION OF RETAIL STORE PERFORMANCE
In this chapter, the structure of a proposed model for the
explanation of retail store performance is presented. In
its most essential aspects, the proposed model is derived
from and builds upon the previous research at both the macro
and micro level analyses. The major constituent elements of
the model, i.e. the theoretical and derived concepts, are defined and linked together through a number of research
hypotheses. Collectively, the proposed relationships
closely follow the S-C-P paradigm adopted in this research
(see. Chapter 2). Specifically, it is asserted that the
performance of a retail unit is a complex function of a
number of market related factors and how the unit adjusts to
these market forces.
Organization Of The Chapter
This chapter is organized around three major
sections. In the first section, the definitional scheme for
the central theoretical and derived concepts are presented.
Collectively, these definitions form the constituent
elements of the proposed model. The specific research
hypotheses where these elements are interrelated, are
- 114

115discussed next. In the final section, a causal schemata is
presented to bring together all of the research hypotheses
in a structural equations framework.•
Theoretical And Perived Concepts And Their Definitions
A major weakness in all the previous studies of
retailing performance has been a lack of rigorous conceptual
definitions of the primary theoretical and derived concepts.
In this regard, there appears to be a silent conspiracy, or
at a minimum, a strange apathy, towards clearly defining
what is meant by the terms used in research.
This is probably due, in part, to the nature of
social science itself, where the subject matter of study is
centered around human actions and behavior which, more so
than in physical sciences, force one to think, observe and
study the subject in lay terms. As Hempel (1952) notes
The vocabulary of everyday discourse does permit the statements of generalizations, such as that unsupported body will fall to the ground ; that wood floats on water but metal sinks in it (p.20).
However, such generalizations when couched in everyday terms
tend also to have various shortcomings which make it
difficult to formulate theories. Hence, for example, store
location influencing store performance, or technology of the
store effecting retail productivity, are as easy to refute
as they are to confirm, depending on how one defines the

116terms location, technology, performance or productivity.
The tendency that is all too clear in the previous
literature is to equate the theoretical definitions of these
or other concepts with a set of "operational" or "empirical"
definitions. As Bagozzi (1980) observesMarketers implicitly follow an operational definition model when they rely exclusively on observable variables in their theories, assume no error in measurements, or rely exclusively on empirical associations to model and test their theories (p.122).
Thus, for example, performance is variously "defined" as
sales per square foot, or as profits per dollar of sales; or
location is "defined" as a number of miles to or from a
point in a loosely defined geographical space. This is
unfortunate, since, as Hempel (1952) notes
In order to attain theories of great precision, wide scope and high empirical confirmation, [every scientific discipline must evolve] a system of special concepts... [which] are highly abstract and bear little resemblance to the concreteconcepts that we use to describe the phenomena of our everyday experience (p.21)
Clearly, rigorous conceptual definitions by themselves, are
not a panacea for the advancement of any scientific
discipline. However, in the absence of a well-defined set
of variables, there is also no clarity in any scientific
discourse, and more importantly, it is impossible to
establish any meaningful relationships among these
77 Assuming, for the sake of argument, we live in a world of perfect measurements.

117variables. The definitions of the key concepts that are
used in the present study, therefore, are presented in this
spirit. Exhibits 14 and 15 summarize these concepts and
their definitions.The theoretical concepts listed in Exhibit 14 refer
to abstract, unobservable properties or attributes of social
and economic entities, or phenomena due to these entities.
These concepts, as Bagozzi and Phillips (1982) note
achieve their meaning through formal connections to other derived, and empirical concepts as well as their definition... and usually consist of descriptors of phenomena provided by sentences reflecting the conceptual vocabulary of the theory (p.465).
For example, the theoretical concept, performance, obtains its meaning in part through its own definition, and partly,
in its connection with the derived concepts of productivity
and profitability. Similarly, the conduct of a retail firm
is related to other derived concepts such as effectiveness of store management and marketing effort.
Derived concepts (Exhibit 15), like theoretical
concepts, are also unobservable constructs. Unlike
theoretical concepts, however, derived concepts must be tied
to empirical concepts, i.e., operational definitions.’®
’® For example, profitability of a retail unit can be "observed" through a number of manifest Indicators such as profits or gross margin expressed in dollars or as a percentage of sales.

118EXHIBIT 14
Definitions Of The Theoretical Concepts In The Structure-Conduct-Performance Paradigm
TheoreticalConcept Defini tion
1. Market
2. Potential Demand
3. Potential Supply
4. Structure
5. Industry
6. Competition
7. Performance
8. Conduct
A closely interrelated group of sellers and buyers in a geographical area.The aggregate level of total serviceoutputs that may be desired in a market.
The aggregate level of the potential for service outputs available in a market.
The organizational properties of a market.
A group of sellers of closely substitutable outputs u'ho supply s common group of buyers.
The rivalrous efforts of two or more units, acting independently, to secure mutually desired resources of limited supply.
Composite (economic) outcomes of theactivities of a given unit in a given time period and market.
The patterns of behavior that a unit follows in adopting and adjusting to the market.

119EXHIBIT 15
Definitions Of The Derived Concepts In The Structure-Conduct-Performance Paradigm
Derived Concept Defini tion
2.1 Character of Market Demand
2.2 Demand Growth
3.1 Intensity of Competition
3.2 Overstoring
7.1 Productivity
7.2 Profitability
8.1 ManagerialEffectiveness
8.2 Manager i a 1 Expertness
The relative degree of upscaledness or quality in market demand.
The rate of potential.
change in market demand
The strength of actual or perceived level of competition in an industry.
The degree to which the capacity for service outputs may exceed the potential for market demand.
The rate at which the resources of a unit are combined and converted to outputs.The degree to which a unit's outputs valued at current prices may exceed its costs.
The perceived ability of a unit's manager(s) to achieve the unit's overall objectives.The degree to which manager(s) may be considered to have differential skills or training in operating a uni t.
8.3 MarketingEffectiveness
8.4 Target Market Reach
The amount of influence a unit has in a market, relative to other units in developing and facilitating market exchanges.
The degree to which a unit's trade area characteristics matches its intended demand base

120
Four possible types of relationships connect the
theoretical, derived and empirical concepts of theories.’®
The first set of relationships, theoretical definitions,
refer to actual or stipulated statements of equivalence
between the theoretical concepts and derived concepts. In
the context of the present research for example, performance
of a unit, by definition, is stipulated to equal the level
of productivity and profitability of the retail unit. The
second set of relationships, nonobservationa1 hypotheses,
interrelate the theoretical and derived concepts, most
frequently, through a series of covariance statements
(Blalock 1969b). Collectively, such statements form the
primary structural relations entertained in research. The
third type of relationships, the correspondence rules,
specify the manner in which the manifest or observable
variables are related to latent or unobservable constructs of a theory. In this regard, correspondence rules form the
secondary structural relations entertained in research.®®
Finally, the empirical definitions describe or summmarize
the results of the physical operations in taking
’® The discussion here is adopted from Bagozzi and Phillips (1982).
80 The nature of correspondence rules is a hotly contested area in research methodology (c.f., Bollen 1981, Namboodiri et al 1975, Bagozzi 1980), and in philosophy of science (c.f., Carnap 1956, Campbell 1969, Keat and Urry 1975). A discussion on these issues will be deferred until the measurement section in the next chapter.

121
measurements (e.g., observation, recording etc.), to the
observed concepts.In the ne-xt section the discussion centers on the
first of these relationships, the nonobservationa1 research
hypotheses. The measurement of the theoretical and derived
concepts (i.e., correspondence rules) and the empirical
definitions of the observed variables are presented in
Chapter 5.
Nonobservat iona1 Research Hvootheses
Both the macro and microretai1ing studies reviewed
in the previous chapter posit that a number of market and
establishment related factors influence a unit's
performance. The predominant mode of analysis in this
literature, with some exceptions (e.g.. Ingene and Lusch
1980b, Kinney 1969 Dalrymple 1966, Morey 1980), can be
characterized as structurally oriented where the behavior of
the retail unit is either implicitly assumed away or
considered simultaneously with all the other factors.®’
®’ Part of the reason here probably lies in the strong influence of the neoclassical economic thinking on marketers, which posits retail markets to be laboratories of atomistic competition (Bain 1968, Hoidren 1960). According to this view, the decisions as to what and how much to produce, and how to produce it, are imposed on all retailers given a set of market conditions approaching the neoclassical assumptions of perfect competition. Other reasons probably include the ready availability of data on structural elements, and the difficulties in conceptualizing the elements of conduct for a retailer.

122
The general approach of this study and the proposed
model for the explanation of store performance modifies this
view in a significant way. More specifically, it is
proposed that the economic performance of a retail unit is
fundamentally related to the conduct and/or behavior of the
unit as it adjusts to the various elements of the
marketplace. Hence, the influence of market demand and
supply elements, as well as other environmental factors, are
not ignored in this framework. However, the influences of
these factors, in many instances, are hypothesized to have indirect links to performance, operating through the
elements of a unit's conduct.
In the next four sections, an incremental model
building approach is followed in presenting the major
research hypotheses of this study. In the first section,
the relations between the structural elements of market
demand and supply are considered. In the next two sections,
the elements of market demand and supply are first related
to the unit's conduct, and then, to store performance.
Finally, in the last section, the relations between the
elements of unit conduct and retail store performance are
discussed.

123The Relations Between Elements Of Market Demand and Supp1v
The general nature of the associations between
market demand and supply factors have been widely and
intensely investigated in retailing. The genesis of this
interest, in part, lies with the conceptual framework
provided by Central Place Theory (Christaller 1934, Losch
1964, Berry 1967), and in part, with the enpirical
literature provided by gravitational studies (Reilley 1931,
Converse 1942,1949, Reynolds 1953, dung 1959).
Central Place Theory provides a general framework
which seeks to explain how and why economic exchanges
develop in geographical space. Within this framework, a
central place is defined as an agglomeration of people and
people serving functions which is similar to the market concept defined in this s t u d y . B e r r y and Garrison (1958)
have extended the notions associated with Central Place Theory, introducing the concepts of threshold and the range
of a function. The former is defined as the minimum size of
an agglomeration of people (or purchasing power) necessary
before a function is provided in a central place. The
latter refers to the maximum distance people are willing to
travel to obtain a function. Hence, the range of a service,
or more appropriately, a function, delineate the trading
area of a central place. The trading area, then, has a
Function, within this conception, refers to any type of institution, service, etc., which serves a population.

124lower limit which incorporates the threshold, and an upper
limit beyond which the central place is no longer able to
support the function (Berry and Garrison 1958). Although
independently developed, some of the early gravitational
formulations derived and tested by Reilley (1931) and
Converse (1949) have provided general empirical support to
these notions. A nun6er of research programmes in retailing
are a direct outgrowth of the conceptual framework provided
by Central Place Theory and gravitational research done by
Reilley and Converse (Ingene and Lusch 1981).The first research programme, the measurement and
determination of trading areas, have sought to delineate the
physical boundries of retail markets, and is generally
considered to be the precursor of store location research in retailing. Here, the initial investigations have been
either at the level of cities (e.g., Converse 1949, Forbes
1972, Douglas 1949a,b, Mackay 1973, Thompson 1964), or at
the level of shopping centers (e.g.. Huff 1966, LaLonde
1962). More recently a number of authors, incorporating
various "image" inputs to the probabilistic formulations of
Huff, have extended this research to the individual store
level (Jain and Mahajan 1979, Stanley and Sewall 1976,1978).
A second research programme has focused on the
correlates of retail sales or sales potential of trade
areas. Some of these studies have investigated the

125associative links at the level of cities (e.g., Russell
1957, Ferber 1958, Liu 1970,1972, Ingene and Lusch 1980b),
while others have looked at the factors at the level of
individual stores (e.g.. White and Ellis 1971, Kelley 1967,
Applebaum 1966, Hughes 1966).A third research programme has attenpted to identify
the determinant conditions of retail trade structure. Some
of these investigations have been cross-cultural studies,
much in line with the study by Hall et a1 (1961) (e.g.,Takeuchi and Bucklin 1977, Bucklin 1972, Arndt 1972).
However, the bulk of the research here has concentrated on
metropolitan markets as the primary unit of analysis (e.g.,
Ingene and Lusch 1981, Ingene 1983c, Hoidren 1961, Bruce
1969, Thompson 1967, Cox, dr. 1969, Hindersman 1960).
Although the literature is voluminous in each of the
three research programmes, these studies share significant
communa1ities in their research hypotheses. In fact, the
major "theoretical" relationships proposed in all three
streams are surprisingly few.®^ These relationships are
summarized in Exhibit 16 in a series of covariance
statements.®*
®® This requires that the myriad operational definitions adopted in these studies are reformulated in a set of latent constructs.
® Some of the popular operational definitions of the theoretical concepts are given in the parentheses.

126EXHIBIT 16
A Summary Of The Relationships Between The Elements MarketDemand And Supply
The higher the level of demand (e.g., size of population, households or income), and/or mobility of demand in a market (e.g., incidence of auto ownership):
a) the greater the amount of functions (e.g.7 number, and type distribution of retailers), and
b) the greater the range of functions offerred in a central place (i.e., the geographical size of trade area).
The greater the concentration of demand (e.g., population or automobiles per squaremi le):a) the greater the concentration of
functions in the market (e.g., stores or size of stores per population or household).
3. The greater the rate of change in demand (e.g., population or household growth), and/or mobility of demand (e.g., growth or distribution of income):
a) the greater the probability that certain types of functions will increase (e.g., stores selling specialties or higher order goods),
b) certain other functions will decline (e.g., stores selling necessities or lower order goods), and
c) the greater the propensity for the consolidation of offer in such markets (e.g., the average physical or sales size of stores to increase).

127EXHIBIT 16
A Summary Of The Relationships Between The Elements Market Demand And Supply (Cent,)
The propensity of demand agents to travel, and/or the probability of their retail patronage are:
a)
b)
c)
inversely related perceived spatial the demand agents in a market,
directly related perceived amount assortment, size operation), and
to the distance and the
actual or separating functions
orto the actual of functions (e.g., of shop, hours of
directly related to quality of functions central places (e.g., employees, merchandise, and other store images)
the perceived available in quality of
store atmosphere
The greater the availability or application of new technology in the creation or supply of functions (e.g., capital to labor ratios, relative wage rates), and/or its dissemination (e.g., the incidence of 'department' stores):
a) the greater the propensity for functions to be consolidated in central places (e.g., average sales or physical size of stores).

128Underlying these general propositions, of course,
are also a number of assumptions. Some of these assumptions
are derived directly from economic theory (e.g., the
relative ease of functions to enter and exit central places,
propensity of markets to rest or equi1ibriate, utility or
profit maximization principle, etc.), while others are more
behavioral in nature (e.g., preferred utility of convenience
or the disutility of travel, relatively free availability and uniform processing of information, etc.). For each of
these general propositions, there appears to be a fair
amount of conceptual and empirical support. However,
through the years, two aspects of this general area of inquiry have resisted a satisfactory resolution.
First, in investigating the relations between
elements of demand and supply, there appears to be no
clear-cut way to specify the causal ordering or to explicate
the precise manner in which these relations may unfold in
time. On the one hand, for example. Central Place Theory
implies that the incidence of function formation in a
central place is due to the existence of certain elements of
market demand (e.g., Cox 1959, Thompson 1967). Hence, the
causal ordering of phenomena appears to flow from the
elements of demand, as the causative factors, to the supply
conditions, as the effects. On the other hand, the
existence of functions in a central place also seems to

129"attract" demand elements, as evidenced by retailgravitational r e s e a r c h . *5 Thus, the implied causal ordering
in this case appears to be from a given set of supply
factors to the elements of demand. Clearly, given a
sufficiently long time frame, a case can be made for a
pattern of reciprocal influences. However, in the short run
and with cross sectional research designs, its exceedingly
difficult to assess which "snapshot" of this process is
captured by an investigator.
A second problem concerns the difficulties
associated with the delineation of the eirpirical referents
for the elements of market demand and supply. For example,
the level of demand vs. the mobility of demand; the
technology vs. consolidation of functions; or the growth of
demand vs. the availability of technology in central places,
are all distinct phenomena in themselves. Each of these,
however, have proved to be very difficult to "capture" in
easily differentiable "operational definitions."®® These
problems are especially exasperating in investigations where
secondary data sources, at aggregated levels of analysis,
are utilized in empirical research. Clearly, the issue here
is not one of "bigness correlated with bigness" (e.g..
®5 Note, also, the "causal schemata" proposed by Hall et al (1961) relating income per capita to retail productivity (see. Chapter 3).
®® At least, with the current or available state of research technology.

130Ingene and Lusch 1981). But rather lies in our inability,
in nrast cases, to operationalize meaningful referents for
these constructs.*?
The set of nonobservationa1 research hypotheses that
are discussed in this section are not totally free of the
issues raised here. Since the general design of the
research is cross-sectional, the causal ordering between
market demand and supply elements can only be "inferred"
from the proposed relationships. As the issues surrounding
empirical referents are closely tied to hypotheses testing,
these will be taken up in the next chapter.
In this study, the relationships between three
elements of market demand and two elements of market supply
are considered. The first demand element, the Character of
Market Demand, refers to the relative degree of the
upscaledness or the quality of the "average" purchasing
power in the market. The second element, the Potential
Market Demand, is defined as the "total" or aggregate
capacity of purchasing power in the market. Finally, the
third demand element, the Demand Growth, refers to the
relative rate of change in the potential for market demand.
*? That is, to specify indicators which are valid in the sense of that they are both convergent and discriminant of the phenomena under investigation.

131The two elements of market supply, Overstoring and
Competitive Intensity are closely interrelated, yet distinct
concepts. The former refers to the degree to which capacity
for the provision of services may exceed the potential for
market demand, while the latter is defined as the degree of
actual or perceived rivalrous activity among the retail
units in the market.®®
The choice of these five elements is guided in part
by the body of existing research, and in part, by the
exigencies of the real world. The conceptual framework from
Central Place Theory and the empirical research from the
gravitational studies both indicate that the level of
competitive interaction in a trading area is a function of
various demand conditions. Furthermore, the studies of retail market structure have consistently found that the
level, density and growth of demand elements are among the
primary factors associated with the number, size and
distribution of functions at various levels of aggregation
(see, Chapter 3). The validity of these conclusions and
their practical relevance, however, rest on the assumption
that similar relationships hold at the micro level.®®
®® Hence, "overstoring" is similar to the notion of "centrality" of Central Place Theory (i.e., excess of functions provided in a central place over those needed by the local population) (Christaller 1966). Some researchers have also labelled this phenomenon as "retail space saturation effect" (Ingene 1982).
®® In this regard, one should be aware of "ecological

132In this and forthcoming sections, therefore, three
issues are simultaneously explored. The first issue
concerns whether some of the hypothesized relationships from
the previous studies, at high levels of aggregation, will
also hold within intra-urban retail trading areas. A
related second issue concerns whether there are differences in these relationships across metropolitan and rural
markets. Finally, the last set of issues concern whether
these variables have direct influences on performance, as
the previous investigations seem to imply, or if these
influences are indirect, possibly mediated through various
elements of unit behavior or conduct.
It should be noted that none of these issues, given
the nature of this study's design and the nature of
retailing phenomena, can be subjected to a "crucial test,"
The major objective here, as well as in the next sections,
is to provide a "skeleton" of the type of relationships that
may be further explored and refined in future research
directed towards understanding the determinant conditions of
store performance.
fallacy," i.e. the hazard of false inferences drawn from a set of relations that hold at one level, to also hold at another (Langbein and Lichtman 1978). Hence, theresearch hypotheses advanced in this section and their empirical tests later in the research, may be construed as a test of "validity" of such assumptions.

133The primary set of relationships between the set of
demand and supply elements investigated in this section
closely follow in the tradition of earlier research. These
hypothesized relations are stated in a series of research
hypotheses below, followed by a brief commentary on each of
the proposed links. Exhibit 17 provides a path analytic
schemata which summarize the proposed relationships.
H-1: Markets are more likely to be overstored:
1. where demand character or quality is high;
2 . where demand potential is high; and
3. where the demand growth Is high.
H-2: Relative competitive intensity is likely tobe high:
1. where potential demand is low; and
2. where markets are relatively overstored.
The first set of hypotheses (H-1), concern a
phenomena which is relatively unexplored in marketing.
Until recently, marketing scholars have shown a curious
ambivalence towards the study of the conditions which may
lead to overstoring of markets or of its possible impact on
store performance.BO This is probably due, in part, to the
80 Ingene and Lusch (1981), Lusch (1982), Bucklin (1983) are among the recent exceptions.

134EXHIBIT 17
The Proposed Relationships Between Elements Of Market DemandAnd Supply
Demand Charac.
Overstoring
Demand Poten.
Comp. Intens.
Demand Growth

135belief that overstoring is a short-run aberrance which
market forces, in time, stabilize. Hence, as Ingene and
Lusch (1981) have argued, such conditions are unlikely to
exist in the long-run, since
we know from economic and financial theory that when the rate of return on net worth in an industry falls below an acceptable level... some firms leave the industry... and the process of exit continues until the rate of return attains an acceptable [equilibrium] level (p.124).
Although the general modus operandi, as stated, is
consistent with the notions associated with classical price
theory it is, nevertheless, at some variance with the
realities of most retail markets^^ (cf., Karch 1984,
Davidson 1980, Bucklin 1983). Furthermore, as some
industrial organization researchers have also noted
a number of important industries of atomistic market structures have been plagued with chronic overcapacity of plant and a chronic redundancy of labor force (Bain 1968, p.471).
Reasons which may induce and/or sustain such
overcapacity, according to Bain (1968) include:
1. Inability of sellers to restrict industry output and/or adjust prices to overcome excess capacity;
2. Relative ease of entry to, but slowness of exit from, the industry;
8 1 There is a considerable consensus among most retail analysts that most metropolitan markets in North America are, and for some time have been, overstored.

1363. Relative lack of mobi11ty of the labor
force to exit the industry characterized by overcapacity; and
4. Various historical or isolated chance events.
These factors, no doubt, have much relevance in the context
of most retail markets. With the exception of the "ease of
market entry" argument (point 2 above), however, these set
of factors do not "explain" why overstoring o c c u r s . To the
extent that retail functions are "created" in anticipation
of demand conditions, and to the extent actual or, potential
retail "outputs" exist in interaction with elements of
demand, the reasons for occurance of overcapacity in retail
markets must lie with such demand factors.*3
Hall et al (1961) in their investigations of retail
structures in three countries have observed that in markets
where incomes are high and population is growing, the
incidence of chain stores is more prevalent and the average
size of shops is larger. Ingene and Lusch (1981) and Ingene
(1983c) have reported similar findings for metropolitan
These factors are probably plausible "explanations" of why overcapacity "persists" or is "sustained."
It is not implied here that overstoring comes about, automatically, due to conditions of demand, without the collective actions of decision making agents. Hence, one may argue that the decision calculi of such agents are also important factors in a fuller understanding of the conditions which bring about overstoring. Clearly thisis so, but it also takes us into an infinite regress on possible "causes."

137markets.94 Although Hall et al have not specifically
considered a direct linkage between demand elements and
overstoring, they have nevertheless noted that
the rate of growth of an area affects retailstructure both from the demand side, by way ofinducement to invest, and also from the supply side, by the availability of site for new and conveniently laid-out shops (p.137).
Hence, it is possible to infer from Hall et al's analyses
that the demand character and growth in retail markets,
coupled with Bain's observations on the imperfections in
such markets, may provide a more conducive setting foroverstoring to occur than otherwise.
In a recent paper, Davidson (1980) also attributes
overstoring to "favorable demographics," manifested for
example, in increasing levels of income and to "favorable
financial markets." However, Davidson, and in another paper
Bucklin (1983), speculate that overstoring may also result
from the expansion of resources by existing retailers in the
market who are trying to secure greater market share or to preempt new entries.9s To the extent decisions to expand
capacity are in response to high or growing demand
conditions in the market, the two possible "explanations"
9 4 Of course, to the extent chain stores are also of larger size than other retail units, these effects may be interpreted as referents of a more global single factor, rather than two distinct phenomena.
9 5 The question as to which modus operandi is more important can be answered in a longitudinal research design, and hence, is not specifically explored here.

138are of course closely interrelated. In general, then, it is
reasonable to expect that markets with favorable demand
conditions manifest in the character, potential and growth
of demand, to also have greater propensity for overcapacity.
The second set of hypotheses (H-2) concern the link
between relative degree of competitive intensity, and the
levels of overstoring and demand potential in retail markets. A positive association between overstoring and
competitive conditions is in part implicit in the
expectations expressed for H-1. More specifically, new
retail entries or the expansion of existing facilities in a
trade area would raise the level of competitive activity for
two reasons. First, with additional capacity for service,
retail units would be expected to at least maintain their
respective market shares. Second, since most retail units
operate close to their breakeven points, the availability of
a new potential for service outputs would also lead to more competitive activity than otherwise.
However, although a positive association is
intuitive, the possible "causal ordering" of these phenomena
is troublesome. This is because an alternative hypothesis,
i.e., competitive intensity leading to overstoring is also
plausible. As both Davidson (1980) and Bucklin (1983)
speculate, the motivation for store expansion may be a
result of an intensified struggle for market share or of

139intense jockeying for a favorable competitive position in
the market through new capacity. Hence a reciprocal link
between overstoring and competitive intensity could also be
entertained.The inverse relationship between demand potential
and level of competitive intensity is probably based more on
common sense than on any "theory." Markets that have a
greater amount of aggregate purchasing power would generally
be expected to have lesser competitive activity if
everything else were assumed constant. However, as H-1.1
ii^lies, everything else is not constant. Hence, the
proposed link here is interesting not so much because of a
trivial direct link to competitive conditions, but in its
value in the network of relationships expressed in H-1 and
H-2.
The Relations Between Elements Of Market Demand. Supply And Store Performance
Classical economic theory, as well as previous
investigations of retail unit performance generally imply
that, ceteris paribus, the economic performance of a retail
unit will be higher, the higher the potential and growth of
demand in a trade area. The traditional argument here can
be summarized as follows: A higher level of demand (e.g.,
household or personal incomes) is closely associated with a
greater proportion of disposable income spent on retailing

140services. The larger retail transaction sizes and the
greater degree of mobility for "custom" to travel within the
trading area are generally seen as further confirmations of
this phenomenon. Hence, the level of demand, all else being
equal, is posited to be a primary factor in influencing the
volume of sales, and with an invariant cost structure, the
profitability and/or productivity of the retail unit. The
demand potential and its growth have similar effects on the
volume of retail output and the performance of the retail
unit (cf.. Hall et al 1961, Cottrell 1973, Clawson 1974,
Kinney 1969, Takeuchi and Bucklin 1977, Bucklin 1972, Ingene
1982). However, two aspects of this line of reasoning, one
dealing with the analytical usefulness of ceteris paribus assunption, and the other, concerning the applicability of
such direct linkages in micro level anaysis are open to
question.
It is generally recognized that demand conditions,
as well as the forces that they may set into motion are
significant contributors in shaping the structure of retail
trade and other elements of supply (cf.. Ingene and Lusch
1981, Hall et al 1961, Bucklin 1972). However, to the
extent that the trade structure is also a factor in
affecting unit performance, the meaningfulness of the
ceteris paribus assumption becomes rather tenuous. For
example, if favorable demand conditions lead to a higher

141level of competitive activity, and further, if the economic
performance is inversely related to the level of competitive
activity, the relationships between demand conditions and
store performance are not very clear. In fact, the
associations between demand conditions and performance may
be "positive" or "negative," depending on the relative
strength of associations in the sequence®® and the probable impact of other intervening factors (e.g., how well a store
is run). The previous research streams, although cognizant of this broader reasoning, have not investigated these
possible indirect links.*?
The second issue, the applicability of such direct
links in a micro setting, naturally follows from the first.
The recent research on determinant conditions of store
patronage (e.g., Tigert 1983, Pessemier 1979, Stanley and
Sewall 1977) indicate that the frequency of customer
patronage, and by extension, the sales volume and
performance outcomes, are a function of the relative
marketing effort or the "position" of a unit in the
marketplace. The influence of these factors are clearly
S6 For instance, if the link between favorable deîTtographics and competitive activity is consistently stronger than the link between the latter factor and store performance, a negative relationship among favorable demographics and performance would not be surprising.
®? In any case, such indirect links could not have been uncovered with the single equation parameter estimating techniques used in these investigations.

142quite independent of the more global demand elements in
themselves. ' In fact, in the absence of these and other
factors, one would be left with the unreasonable inference
that only favorable markets would harbor “better" performing
stores. Therefore, it is plausible to speculate that the
level, potential or growth of demand may not be "primary"
determinant factors of store performance at the level of
intra-urban trading areas. In this regard, it may be more
appropriate to think of such demand elements as part of the
"market conditions," around which the conpetitive environment is shaped, and within which the retail unit
operates in constant interaction.
Before a statement can be made linking demand
conditions to store performance, it is useful to examine the
associations that may exist between supply elements and performance. In regard to these latter relationships, two
alternative views can be identified in the literature.
The first view, which may be termed as "the
structural paradigm," is closely associated with industrial
organization studies. According to this view, a directes
but an inverse link would be expected between store
performance and supply elements entertained in this study
(i.e., overstoring and competitive intensity). The
Note that, here, "direct" is used as an antonym to"indirect." This is the standard usage of the term instructural equations methodology which implies a"valence" but not a direction.
143following passage from Bain (1968) illustrates the general
orientation;
There should be some long-run tendency for higher . seller concentration within industries to be associated with relatively higher profits and for lower concentration to be associated with lower profits... In a more specific form, this hypothesis should read as follows: High sellerconcentration within industries should be associated with substantial excesses of selling price over long run average costs, moderately high concentration with appreciable but lower excesses over costs, and lower concentration with no excesses at all (p.439).
In transplanting this view to retail markets, several points
are noted.
First, it is generally argued that retail industries
can be appropriately characterized as relatively
unconcentrated since the market share of the top few sellers seldom reaches 50 to 60 percent in most local markets (Lusch
1982). Second, retail markets can also be characterized as
being relatively easy to enter, and furthermore, more prone
to plant overcapacity because of the imperfections in
resource mobility (Bucklin 1983). Finally, it is generally
assumed that the unique location of each unit, although it
gives each retail store some degree of "offer
differentiation," and hence, a unique advantage,
nevertheless does not appreciably influence the
cross-elastici ties of demand due to "scrambled
merchandising" (Hoidren 1960). In summary, according to
Bain (1968)

144Chronically subnormal earnings to enterprises and to labor in an industry [may be] linked to "destructive competition" which is, in turn, based on chronic redundancy of plant capacity and labor force relative to demand... a good example of [this] phenomenon is exemplified in some industries in distributive trades Ip.470).
The second view, which may be termed as "the
behavioral paradigm" has its roots in the notions of
biological competition in life sciences®® (Henderson 1983).
Bucklin (1978b) provides a summary of the central themes in
this orientation:In general, we may expect that firms or their establishments operating in the more competitive markets will function at higher levels of productivity. [In such markets], the pressures should be such that only the most efficient organizations could continue to operate under such conditions. Those with less capable management and less modern plant would be weeded out... [Hence] stiff conpetition might bring about a greater discipline in both employees and management; thereby causing enhanced productivity (p.89-90).
This alternative view, however, is cognizant of possible
anomolies, and as Bucklin further notes
it may be important to distinguish between markets where competition is strong but the forces of supply and demand have weakened. The latter situation may produce lower performance because resources can not exit the market sufficiently fast (p.90).
®® It is important to note that the structural paradigm is also cognizant of the behavioral elements. Creation of overcapacity, decisions to enter markets with favorable demand conditions, differentiation of offer through unique location are examples of such elements.

145Hence, when the behavioral elements attributed to the firm
are ignored (or for whatever reason they are inoperable),
the two views seem to converge in their conclusions. On the
basis of these observations and speculations, several
research hypotheses can be advanced. Exhibit 18 provides a summary of the proposed relationships. When the individual
demand and supply elements are considered in isolation,
their respective relationships to store performance can be
summarized in the following set of research hypotheses;
H-3: Retail stores operating in marketscharacterized by favorable demand conditions manifested in:
1. higher character or quality of demand ;
2 . higher demand potential; and
3. more rapid demand growth,
would be expected to have higher levels of
per formance.
H-4: Retail stores operating in marketscharacterized by
1. relatively high overstoring; and
2 . higher competitive intensity,
would be expected to have lower levels of
performance.

146These hypotheses are the traditional statements of
covariation when the ceteris paribus assumption is in
effect. However, when the intermediate links due to H-1 and
H-2 are also considered, Hypothesis-3 can be modified as
follows:
H-3A: The favorable demand conditions in retailmarkets would lead to lower levels of store performance when:
1. each of H-1, H-2 and H-3 holds; and when
2. the influence of H-4 is greater than H-3.
A similar alternative hypothesis regarding H-4 can also be
advanced. Before this is done, however, it is appropriate
to look more closely at some of the elements of unit
behavior.

147EXHIBIT 18
The Proposed Relationships Between Elements Of Market Demand, Supply And Performance.
Demand Charac.
Overstoring
Demand Poten. Performance
Comp. Inten.
Demand Growth

148
The Relations Between Elements Of Market Demand. Su p p 1y And Uni t Conduct
Within the general S-C-P paradigm, the relationships
between behavioral elements of unit conduct and market
conditions are the least understood and researched of all
the linkages. In the proposed associations between market
forces and performance, however, there is always an
underlying behavioral posture implied or attributed to the
firms in the industry. Despite this, the general posture
taken in marketing has closely paralleled the prevailing
attitude in economics. This orientation is well summarized
in the following passage from Bain (1968):%In a priori theory... we may envisage a
three-stage sequence of causation running from market structure to market conduct to market performance. That is, structure is systematically associated with or determines conduct; and the conduct, as determined by structure, determines performance. Therefore, structure is associated sytematically with performance by the link of its systematic association to conduct. But as we try through empirical investigation to implement or verify this sort of explanatory-predictive hypothesis, we find that actual patterns of market conduct cannot be fully enough measured to permit us to establish an empirically meaningful association either between market conduct and performance, or between structure and market conduct. It thus becomes expedient to test directly for net associations of market structure to market performance, leaving the detailed character of the implied linkage of conduct substantially unascertained (p.329).

149In reading through Bain's statement, one may be led to
believe that "measurement" of conduct elements is the key
issue in the investigation of such elements. This is, of
course, a gross oversimplification.
Although the problems in "measuring" firm conduct
are real, they are not any more complex than those in
"measuring" the elements of demand, supply or performance.
If the sheer volume of literature in the
strategy-performance area is any indication, the measurement
of firm conduct has not been a "major" problem in linking
behavioral elements to firm performance. Hence, the main
issue at hand would appear to be not so much a problem of measurement, or of establishing empirically meaningful
associations, but what may probably be best described as
lack of adequate conceptualizations.’®®As it was noted in Chapter 3, the previous studies
at both the macro and micro level analyses are replete with
various referents of conduct elements. These factors have
usually been subsumed under various empirical definitions of
location, store or facility factors, service levels
provided, or managerial attributes (cf., Clawson 1973,
Kinney 1969, Mise et al 1983, Hansen and Weinberg 1979).
10® According to Blalock (1982), "conceptualization involves a series of processes by which theoretical constructs, ideas, and concepts are clarified, distinguished, and given definitions that make it possible to reach a reasonable degree of consensus and understanding of the theoretical ideas we are trying to explain" (p.11).

150These elements of retail conduct can be more broadly
categorized into a descriptive tripartite classification in
"strategic" or long-term decision variables (e.g., location,
store size), "operational" or short-term decision variables
(e.g., price, promotion, service levels), and managerial
variables. Such labelling, however, makes it difficult to
operationalize the underlying theoretical constructs.
Probably the most parsimonious conceptualization of
the elements of store conduct is provided by Alderson (1965)
in Dvnamic Marketing Behavior. Noting that "for the most
part, retailers are engaged in adapting themselves to the
market environment" (p.214), Alderson has identified four
major problem areas which "call for decisions, and, in some
cases, a continuing flow of decisions" in a retail
setting.’*” These elements are arranged into two DecisionDomains [in Establishment and Offer], and two Decision
Levels I in Capacity vs. Blaze] (See Exhibit 19). According
to Alderson (1965):
Decisons in the Establishment Domain are generally concerned with enterprise differentiation, [whereas] decisions in the Offer Domain pertain to
’*” It should be noted that the elements of retail conduct, by neccessity, are the products or outcomes of various decisions made at either the firm or unit level. Hence, the resultant position of a store in the marketplace, in either its capacity for service or in the nature of its offer, is the ultimate manifestation of such decisions. In this sense, Alderson's terminology (in decisions or decision areas), and the one adopted in this study (in elements of store conduct) are closely intertwined, and in many cases, are conceptually inseparable.

151the products and services which the store is trying to sell (p.213).
EXHIBIT 19
Elements Of Retailer Conduct From Alderson (19651
----------- Decision Domains------Establishment Offer
Decison Levels
Capacity Store Location Assortmentand Size
Blaze Store Image Promotion
Establishment domain decisions are further delineated in Capacity vs. Blaze decision levels. The former decision
area is broadly comprised of those elements which determine
the "capacity" of service for the retail unit (e.g.,
location, size, layout and design, and other physical
characteristics). The latter decision area, the blaze
level, consists of those decision elements which influence
the "propensity of customers in the relevant population" to
differentially trade in a store without specific regard for
their immediate needs.'o*
102 Alderson (1965) notes that "the term blaze... seems especially appropriate in retailing where there is a continuous effort to keep a light burning to which

152The Offer Domain decisions are similarly divided
into two decision levels. The Offer/Capacity decisons
include the nature and scope of service availability (e.g.,
merchandise assortment, prices, discounts, credit terms and
warranties). The Offer/Blaze decisions, on the other hand,
subsume "promotion" in its broadest sense (i.e., including
within-store informational displays and "advertising through
all kinds of medium). As Alderson repeatedly cautions, however,
A store cannot make any of 'these decisions in isolation as, for example, developing an assortment without any consideration for store image!., lor as] in the area of structure and layout [where] considerations shade from factors affecting physical operating capacity over into others affecting mainly store image. [Hence], while the four areas can be discussed separately, they are always combined in competitive impact (p.216-217).
Five elements of unit conduct, the first based on
the notions due to Alderson, and the others based on the
previous empirical research are considered in this study.
In the balance of this section these elements are defined
and a series of research hypotheses linking these elements
among themselves and to other market factors are presented.
customers will respond. It is the only word which seems general enough to cover both store image and promotion which are somewhat different ways of accomplishing the same thing" (p.213-214).

153The decision areas in Alderson's framework are
highly interdependent and overlapping, not only at a
conceptual level but also in terms of their manifestations
in the elements of unit conduct. There is little doubt, for
example, that retail assortments (e.g., dollar inventories,
or number of SKU's) is highly correlated with the size of
unit (e.g., square feet of selling space): or that the
amount of service and promotional effort influence a unit'sperceived position or image; or that the design or layout of
physical facilities has an impact on both the service
"capacity" and the store "atmosphere." One possible way out of this difficulty in conceptualization is to think through
"higher order constructs" where the lower order elements can
be viewed as manifestations of a more abstract concept.
Effectiveness of Marketing Effort as a central
notion in market behavior of the retail unit may be defined
in this spirit. This construct refers to the aggregate
influence of a retail unit's position in the marketplace, in
relation to other stores.According to this definition,
all the principal elements of unit behavior such as
locational convenience, customer service, assortments,
promotion, and so forth can be subsumed under a single,
higher order construct.
103 Here, the notion of "influence" is restricted to mean the results of a unit's actions and/or decisions in developing and/or facilitating exchanges.

154A second component of retail unit conduct considered
in this study concerns what may be broadly labelled as the
"quality of store management." Although the role of store
management as the ultimate implementor of the various
decisions is well recognized, this is another area weak in
conceptualization in the retailing literature.
In studies which focus on retailing in the
aggregate, for example, the "wage rate" has frequently been
used as a proxy variable for such disparate notions as the
quality of labor force, the efficiency in use of labor, the
scarcity of labor, or the quality of supervision in
retailing (cf.. Ingene 1982, Takeuchi 1977, George 1966).
In other studies, where the focus of analysis is the
individual retail units, various operational measures of the
qualifications and social or economic status of the store
manager (e.g., age, marital status, education, etc.) have
been prominent explanatory factors of store performance.
Although such empirical definitions may have predictive
significance in individual research studies, they are of
little value in establishing meaningful theoretical
1i nkages.
The dual notions of managerial expertness and
effectiveness considered in this study are two concepts
which underlie most of empirical definitions used in the
previous research. In this regard. Managerial Expertness is

155defined as the degree to which a store manager is considered
to have differential skills or training in operating a retail unit. Managerial Effectiveness, on the other hand,
refers to the overall ability of a store manager to achieve
a retail unit's objectives.
The two remaining elements, the relative size and
the target market reach of a store, concern the outcomes of
previous strategic decisions evaluated under the prevailing
market conditions. The Relative Size of Unit refers to the
amount of differential capacity of a store in relation to
its main competitors.’®^ Target Market Reach, on the other,
refers to the degree to which a retail unit's choice of a market to locate matches its intended demand b a s e . ’ ®®
As to the linkages among these conduct elements or
to their possible relationships with the market factors, there initially appears to be little or no a priori
theoretical basis. Hence, although some of the individual relationships considered may appear to be exploratory in
nature, this is misleading. It should be recalled that the
relationships considered here are essentially aimed at an
explication of the various implicit or explicit assumptions
’® In this regard, relative size also defines an aspect of what may be termed "felt competitive intensity," which results from a unit's own capacity decision.
i®5 Location, in this sense, does not imply spatial "convenience." In the definitional scheme adopted, this appears as an element of marketing effectiveness.

156of previous research. Therefore, the research hypotheses
advanced in this section, collectively, have significant
"confirmatory" overtones.
In the discussion of the "behavioral paradigm" in
the previous section, it was noted that an explanation of
the influence of market conditions on unit performance
requires an intervening link in the behavior of the firm in
the marketplace. In retailing performance research, the
genesis of the discussion on these behavioral elements
probably lies with the study by Hall et al (1961). These
authors proposed that demand conditions in retail markets
were closely associated not only with the organization of
supply (i.e., the structure of trade), but also with various
elements of retail unit behavior (e.g., availability of
enterprising people, careful use of labor, higher capital
labour ratios, fuller use of existing capacities, etc.). A
number of other marketing scholars (e.g., Bucklin
1977,1978b, Ingene and Lusch 1981, Ingene 1982) have
extended this general line of reasoning by incorporating
similar behavioral elements in their justifications of the
patterns observed in empirical research. However, most of
these assumptions and implicit hypotheses, attributed to
behavior of the firm(s) in the marketplace, have not been
empirically tested in the previous literature.

157The following research hypotheses are posed in order
to determine if, and to what extent, some of these implied
linkages exist at the level of individual retail units.
Exhibit 20 provides a path analytic schemata which summarize
the proposed relationships.
H-5: Managerial and marketing effectiveness in aretail unit is higher:
1. the greater the overstoring; and
2 . the higher the competitive intensity in the market.
H-6: The managerial effectiveness in a retailunit is higher:
1. the higher the demand potential; and
2 . the higher the rate of demand growth in the market.
H-7: Managerial expertness has a positiveinfluence on managerial effectiveness.
H-8: Managerial effectiveness has a positiveinfluence on the effectiveness of the marketing effort.
The positive link from competitive conditions to
store performance, according to the behavioral paradigm,
hinges on a series of implicit assumptions in the "ability
of stores, in growth areas, to attract the best managers'

158(H-6), and In "stiff conpetition bringing about greater
discipline in both employees and management" (H-5 and H-8)
(cf., Bucklin 1978b, p.90-91, Ingene 1982, p.82).
Hypothesis-7, in this regard, follows as a corollary.
Collectively, the network of relationships above and the
hypotheses advanced in the previous sections provide an
explication of the general mode of reasoning implicit in the
behavioral paradigm.The relative size of unit, as a manifestation of a
strategic decision made at the time of market entry, to a
certain extent does overlap with the structural/competitive
conditions in the marketplace. For example, if one were to
assume a fairly uniform space utilization or space
productivity across all competitors, operationalization of
such a variable would probably approximate relative market
shares in the market. This is, however, neither inplied nor
assumed in this study. It is proposed that:
H-9: The greater the relative size of a retailunit in the market:
1. the higher the managerial effectiveness; and
2. the higher the marketing effectiveness for the unit.
The expectation here is that retail units which have a
differential capacity advantage over their main competitors

159EXHIBIT 20
The Proposed Relationships Between Market Conditions And Elements Of Unit Conduct
Target Market Reach
ManagerialExpertness
Demand Poten.
Overstoring
ManagerialEffectiveness
Comp. Inten.
Demand GrowthMarketing Effet.
Relative Store Size

160would have a major resource flexibility (in store space),
which could be adjusted as the demand and supply conditions
vary over time. Further, such a posture in the marketplace
would also reduce the impact of competitive intensity, and
hence, favorably inpact the effectiveness of marketing and
managerial effort.
Target market reach, the second strategic decisions
variable, also has some overlaps with the elements of market
(demand) conditions. The assumption here is that all retail
units, by strategic choice or otherwise, have identified a "relevant" or "target" demand base (Alderson 1965).
However, through time this initial "base business," may or
may not coincide with the current configuration of demand in
marketplace. Of course, to the extent such "market-matching" continues to be in force, a retail unit
would be expected to have a relatively "insulated" position
in the market from competitive pressures. Furthermore, when
the target demand base comprises a significant portion of
the total demand base, the unit would also be expected to
have a unique advantage as "preferred source" for service
outputs.A negative association between market matching and
competitive intensity, in this regard, would lend empirical
support to the "market matching-insulation" speculation. On
the other hand, a positive association between target market

161reach and effectiveness of marketing and management effort
would give credence to "preferred source" conjecture. The
following research hypotheses summarize the expected
relationships among these factors:
H-10: The greater the target market reach of aretail unit;
1. the higher the managerial effectiveness; and
2. the higher the marketing effectiveness.
H-10A: The target market reach of a retail unitis expected to have an inverse relationship to competitive intensity in the marketplace.
The Relations Between Conduct Elements And Store Performance
The last set of nonobservationa1 research hypotheses
concern the relationships between various elements of store
conduct and the performance of the retail unit.
Performance, as the central theoretical construct in this
research, refers to the composite economic and/or financial
outcomes of a store's operations. In this regard, the
performance concept, similar to the notion of marketing
effectiveness discussed earlier, represents a higher order
construct.’®® However, although the preceding definition of
106 There is an increasing recognition in all areas of social science research that a rigid dichotomy between

162
the term delineates the major dimension of interest, it does
not lend itself to a direct operationalization.i
In order to overcome the operationalization problem
and to further explicate the meaning of the construct, two
other concepts derived from the general notion of economic
performance are used in this research. The first of these,
the store Productivity, refers to the rate at which the
resources employed in a retail unit are combined and
converted to outputs. The second derived concept, store
Profitability, is defined as the degree to which the outputs of the retail unit, valued at current prices, exceed their
costs.The two derived notions, as Bucklin (1978b) notes,
are closely interrelated:
Although productivity and profitability are fundamentally different concepts, there is nevertheless an important association between the two. In particular, the productivity level of the firm or other economic unit is positively
unobservable and observable terms is untenable (Bent 1er 1982, Bagozzi 1984). Bagozzi, for example, argues that there are "three" types of unobservables and "two" kinds of observables. One of the unobservables, according to Bagozzi (1984) is an "unobservable in principle, and includes certain primitives and theoretical terms not subject to observation in even indirect, inferential ways" (p.23). Performance, as a global construct, probably fits this description. However, specific dimensions of performance, as defined above, are certainly amenable to indirect observation.
107 Operationalization, in this context, refers more to further "explication" of a concept, rather than the traditional use of the term as an "empirical défini tion."

163associated with the degree of profitability (p.3)
The association between these two concepts is more evident
when profitabi1ity is also expressed as a "rate" notion
(i.e., "Revenues/Costs" as opposed to the "spread" notion
implied by "Revenues-Costs"). Consider, for example, the
following algebraic representation, frequently used to
highlight the distinction between these two concepts:
R/C = (O/I) * (Po/Pi)
Where:R: Revenues or Sales
C: Costs
0: Physical Outputs
I: Physical Inputs
Po: Unit Price of Outputs
Pi: Unit Price of Inputs
According to this formulation, profitability is indeed a
direct positive function of the efficiency of physical
resource use (O/I). Further, if "terms of trade," (Po/Pi),
is assumed to be relatively constant in the short run,
profitability in such a case becomes an algebraic multiple
of resource efficiency. in other words, the two concepts
converge in their operational definitions.’®® Despite this
’®® More will be said on the empirical measures of these constructs in the next chapter. For the purposes of the present discussion, the term performance is used to

164close conceptual and operational association, previous
studies of retailing performance have followed somewhat
different research orientations in relating the elements of
unit conduct to store performance.Productivity studies, representing more of a
structuralist research orientation, have primarily
investigated the relationships between elements of market
conditions and "labor" productivity (e.g., Hall et al 1961,
Schartzman 1971, George 1966, Bucklin 1977,1978b, Ingene
1982,1983c). Although there is frequent reference to
conduct elements in these studies, the nature of the
proposed relationships between these elements and store
performance are often entangled in the structural or
conpetitive conditions in/of retail markets.In a recent investigation of the "impact of market
forces on labor productivity," for example. Ingene (1982)
has hypothesized thatAn increase in capital intensity in retailing in a geographical market, when store size and retail space saturation are held fixed, will increase labor productivity (p.81).
Hence capital intensity, as a manifestation of the level of
technoIcgy employed in a retail market, represents an
attribute of the nature of supply or competitive conditions.
However, as Ingene (1982) further noted, capital intensity
also
refer to both derived concepts simultaneously.

165reflects the macro level outcomes of investment and personnel decisions made by individual retail establishments... resulting from any one or a contination of four events: [a] The labor marketmay be tight, causing retailers to hire feweremployees; Ib] Retailers may choose to offer less personal service; [c] Retailers may be open fewer hours; [and] [d] Retailers may possess better technology thus they would need fewer employees(p.81).
Aside from the tautological argument presented by (d) a b o v e , 109 it is difficult to make a clear distinction
between capital intensity as a "structural/competitive
condition" in the marketplace versus capital intensity as a
"behavioral response" by retail units. This situation, of
course, is not unique to Ingene's work (cf., George and Ward1973, Tekeuchi and Bucklin 1977).
In profitability studies, the approach taken is
generally more direct. These studies, with more of a
behavioral orientation, have often focused on the influence
of various strategic and operational decision elements
(e.g., actual or perceived characteristics of store facilities or services, locational and managerial factors)
on the sales volume, expenses and profit margins of retail
units (e.g., Kinney 1969, Dalyrmple 1966, LaLonde 1962, Cottrell 1973, Clawson 1974, Morey et al 1983, Curhan et al
1983). Despite the ready availability of data at the level
of the firm, however, the profitability studies are
i®9 That is, the level of technology present in the market to be due to retailers possessing such technology.

166generally oriented toward building forecasting models, and
hence, in most cases lack the conceptual emphasis of
productivity studies. In most cases, these studies can be
characterized as "data driven" where the inclusion of
variables into statistical models are dictated by their
availability or the exigencies of the individual
investigations, rather than their substantive "explanatory"
value. Collectively, these disparate research programs
parallel the duality among the industrial organization
research and Harvard studies in enterprise performance (see
Chapter 3). The research paradigm and the definitional
scheme adopted in this study aims to bring the general thrust of these two orientations together. The proposed
relationships between conduct elements and store performance
are summarized in a series of research hypotheses below.
Exhibit 21 provides a path analytic schemata of the proposed
1i nkages.
H-11: The level of retail store performance ishigher;
1. the higher the effectiveness of marketing and managerial effort;
2. the higher the expertness of store management and/or manager(s);
3. the greater the target market reach, and
4. the larger the relative size of the retail unit in the marketplace.

167The effectiveness of marketing effort, it will be
recalled, represents a higher order construct which embodies
a number of subdimensions related to various store level
decisions. In the previous profitability studies, these
subdimensions and their relationships to various measures of
store performance have been a primary focus of analysis (e.g., Hansen and Weinberg 1979, Morey 1980). Productivity
studies, on the other hand, due in part to a lack of primary
data, have often resorted to rather distant proxies for the
same dimensions (e.g., wage rate as a measure of quality of
employees or service, population growth as a measure of
store atmospherics, etc., see Ingene 1982, 1983). More
importantly, however, the emerging body of thought and
empirical research from retail patronage studies suggest
that it is the cumulative impact of these attributes which
generally leads to differential patronage of stores, and
hence, to favorable store performance (e.g., Tigert 1983,
Ring et al 1980).
The conceptualization developed in this study, with
the aid of a structural equations methodology, offers a way
to assess these influences simultaneously (i.e., individual
and collective effects). In this regard, the proposed
"direct" link between marketing effectiveness and store
performance may be thought of as the "cumulative impact
hypothesis" from the irore recent retail patronage

168EXHIBIT 21
The Proposed Relationships Between Elements Of Unit ConductAnd Unit Performance
Target Market Reach
ManagerialExpertness
ManagerialEffectiveness Performance
' Marketing ' Effectiveness
Relative Store Size

169literature. At the same time, through the more
"operational" dimensions (e.g., locational convenience,
customer service, etc.), one may also be able to assess the
"indirect" influences of each subdimension on store
performance individua11y .
The two variables which describe the "quality of
store management," (i.e., the managerial expertness and effectiveness), are closely interrelated, yet are distinct
concepts. Although intuitively one would expect expertness
of the store management to be a positive influence on the
effectiveness of managerial effort, in time, a causal
influence in the reverse order is also plausible. Despite
the difficulties in ordering the nature of influences among
the two concepts, their individual associations with store
performance are relatively straightforward. Hypothesis-11.2
simply states that retail stores which are staffed with
managerial personnel who have greater experience and training in a particular market location, and in retailing
in general, are expected to have a higher level of
performance than otherwise. Similarly, the second part of
H-11.1 states that the performance of retail units will be
higher, when stores are staffed with manager(s) who have
differential ability, for example, in making rapid
decisions, monitoring the market conditions, facilitating
information exchange with the higher management, etc.

170Target market reach and the relative size of the
retail unit in the marketplace are the outcomes of strategic
decisions which are relatively irreversable in the shortrun. With the former concept, we refer to the degree to
which the present posture or position of the unit "fits”
with the demand base it was intended to exploit at the time
of market entry. Hence, it is expected that retail units
which continue to operate under favorable demand conditions in their relevant market will perform at a higher level than
otherwise. The relative size of the unit in the
marketplace, as a measure of the differential advantage due
to larger capacity for both merchandise and service offer,
is also expected to have a positive influence on store
performance. It should be noted, however, that the proposed
link implied here is not one between the size of store, per
se, and store performance, but rather that of "relative" unit size and unit performance. Whereas, the former
relationship is the traditional view on scale economies, the
latter conceptualization provides an assessment of an aspect
of differential competitive advantage in the marketplace.

171The Proposed Model Of Retai1 Store Performance-- A Summary
Although each of the "individual" relationships
advanced in the previous sections have some degree of "face
validity," it is important to note that their value lies not
so much in the proposed one-to-one associations, but rather
in the role they play within the overall "network of
relations." Hence, whereas an empirical corroboration or
falsification of each link may give some evidence for the
existence or absence of a simple association, one gains an
understanding of the overall phenomena only through the
network of these relationships. In this final section,
therefore, it is appropriate to briefly summarize the
general thrust of this network.
The model advanced in this study posits that the
economic performance (i.e., profitability and productivity)
of a retail unit is a direct function of the elements of
store conduct (e.g., effectiveness of managerial andmarketing effort), which in turn, are a function of the
various demand and supply conditions in the marketplace
(e.g, potential and growth of demand, level of competitive
intensity). Stated alternatively, it is proposed that the
level, potential and growth of demand have a "primary"
influence on the degree of overstoring and conpetitive
intensity in the trade area, which collectively create a
market environment within which the retail units operate.

172Hence, to the extent economic results are a direct outcome
of retail unit operations, these market forces do have an
"indirect" influence on store performance.
In the conceptualization of this study, the conduct
of a retail unit is viewed as emanating from a series of
strategic and tactical decisions made, in response and adjustment to these and other market conditions. In many
cases, however, the distinction between tactical and
strategic decisions are not only difficult to make, but they
are also overlapping in a retail setting. For example,
effectiveness of marketing effort, as an aggregate response
of the unit to the competition in the marketplace, is
comprised of both strategic and tactical elements. Similarly, the target market reach of a unit, as a strategic
locational response of the unit, overlaps with some of the
elements of market demand.
Clearly, the proposed model is a highly simplified
account of the realities of both the retail marketplace and
of the retail unit itself. Neither the variables
conceptualized nor the linkages specified in this study are
exhaustive or complete. There is, for example, little doubt
■ that the collective actions or responses of the retail units
are the ultimate determinants of the nature and intensity of
competition, and in time, of the overstoring in retail
markets. In a similar vein, one may legitimately argue that

EXHIBIT 22Structure Of The Proposed Model For The Explanation Of
Retail Store Performance
KanagetlalExpertness
DemandCharacter
ManagerialIffectivenessOverstoring
DemandPotential
Target Mkt Reach Performance
CompetitiveIntensity
DemandGrowth Relative
Size
CO

174the actual or potential level of performance influences the
actions of the unit itself, as well as the actions of the
present or future competitors in the marketplace. These and
other relationships which are not entertained here, of
course, are limitations which need to be acknowledged.
Exhibit 22 provides a summary of all the primary
structural relations advanced in this study. Collectively,
these relationships comprise a general model for the
explanation of retail store performance. Each of the arrows
originating from an ellipse and ending in another,
corresponds to a specific research hypothesis listed in one
of the previous sections. The arrows which originate
independently and point to an ellipse signify all other
possible factors which are not explicitly modeled. Finally,
it should be noted that all of the concepts labelled in the
ellipses are "unobservable" variables. These variables are
typically associated with one or more indicators which are
described in the next chapter. For simplicity, these
secondary structural relations are omitted from the Exhibit.

CHAPTER V
RESEARCH INSTRUMENTS, EMPIRICAL DEFINITIONS AND THE STATISTICAL RESEARCH METHODOLOGY
The nonobservationa1 research hypotheses advanced in the
previous chapter were aimed at generating the primary
structural relationships entertained in this study. These relationships, however, are not empirically testable without
formal connections to observable, manifest variables. In
this chapter, therefore, the attention is focused on the
formal rules of correspondence which lin% the constituent
elements of the proposed model to a series of empirical definitions. It is important to note that these secondary
links are also "structural relations," and hence, form a set
of auxiliary hypotheses. Both sets of relationships are
empirically tested in the next chapter.
Organization Of The Chapter
The chapter is organized around four sections. In
the next two sections, the sampling domain and the research
instruments are described, and the design of research is
outlined. Next, following a brief discussion on the meaning
and importance of correspondence rules, the empirical
definitions for each of the concepts are presented. The chapter concludes with an overview of the statistical
methodology employed in empirical research.
- 175 -

176The Sanol ing Domain
The data sources used in this reserch are derived
from a comprehensive market research study that was
conducted for a regional, general merchandise chain in the
U.S. The general scope of this study, including some of the
areas investigated for the company,’’® are summarized in
Exhibit 23. The shaded areas in this Exhibit indicate the
portions of the overall market research which form the primary focus of empirical analyses in the present study.
The empirical research reported here involves nearly
250 retail units of the company. The statistical analyses,
however, are limited to a subset of 211 retail stores for
which continuous and conplete data for fiscal years 1979,
1980 and 1981 were available for each of the units.
All of the company stores are in a relatively
homogeneous three state area, located nearly equally in
metropolitan (i.e., SMSAs) and nonmetropolitan markets.
Metropolitan market stores typically operate in neighborhood
or strip shopping centers, while the stores in
nonmetropolitan markets are often found in downtown shopping
areas. Regardless of market location, the older units of
the company are of relatively small size, averaging 7,000 to
10,000 square feet of selling area, whereas the newer units
” 0 Throughout the discussion, "the company" refers to the corporate entity, and "the store or unit" refer to the individual retail establishments of the company.
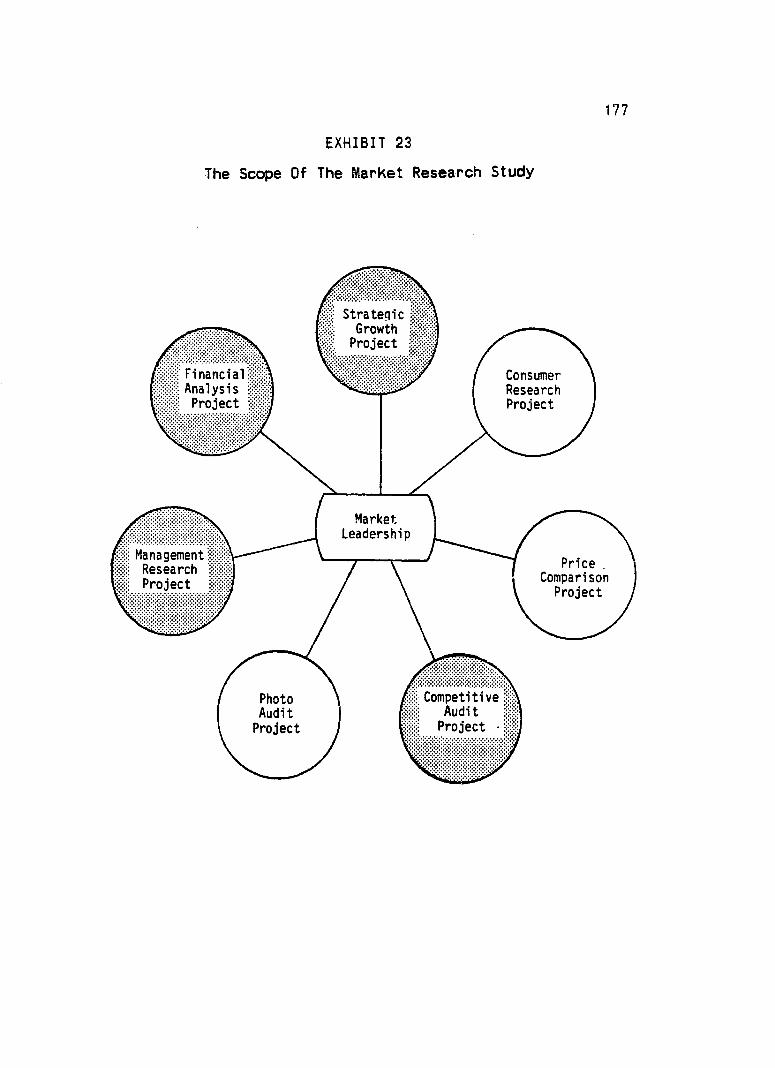
177EXHIBIT 23
The Scope Of The Market Research Study
StrategicGrowthProjectFinancialAnalysisProject
ConsumerResearchProject
MarketLeadershipManagementResearchProject
Price . Comparison Project
Competitive Audit Project •
Photo Audi t Project
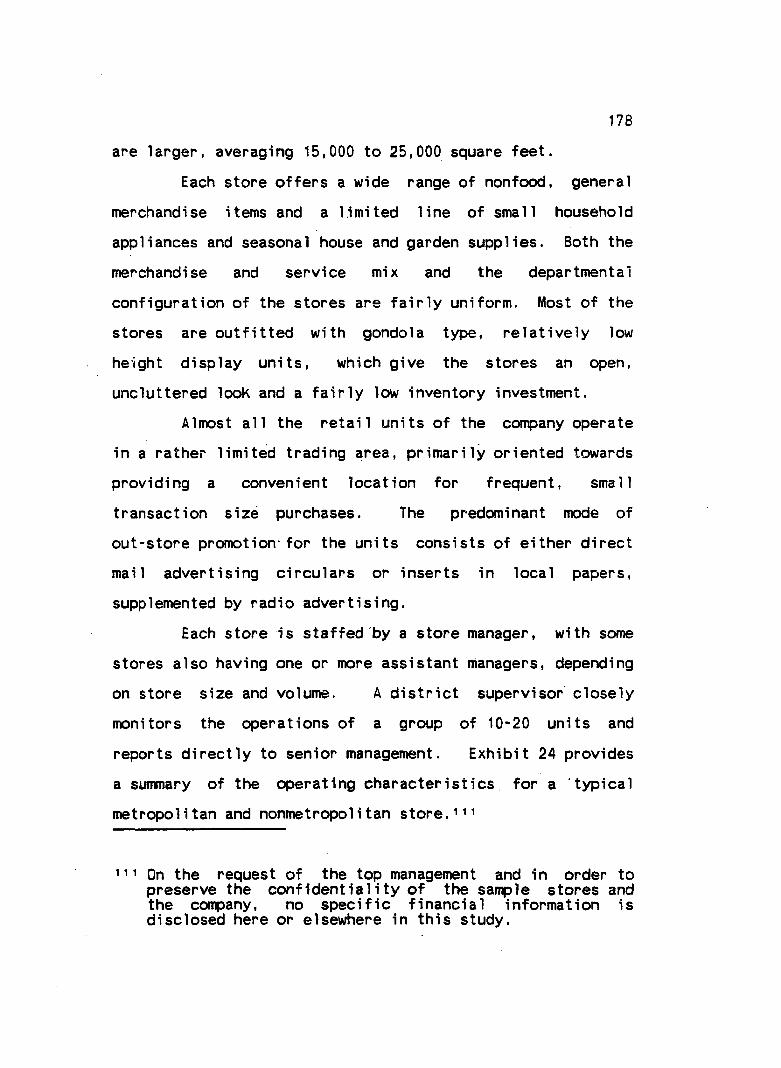
178are larger, averaging 15,000 to 25,000 square feet.
Each store offers a wide range of nonfood, general
merchandise items and a limited line of small householdappliances and seasonal house and garden supplies. Both the
merchandise and service mix and the departmental
configuration of the stores are fairly uniform. Most of the
stores are outfitted with gondola type, relatively low
height display units, which give the stores an open,
uncluttered look and a fairly low inventory investment.
Almost all the retail units of the company operate
in a rather limited trading area, primarily oriented towards
providing a convenient location for frequent, small
transaction size purchases. The predominant mode of
out-store promotion for the units consists of either direct
mail advertising circulars or inserts in local papers,
supplemented by radio advertising.
Each store is staffed by a store manager, with some
stores also having one or more assistant managers, depending
on store size and volume. A district supervisor closely
monitors the operations of a group of 10-20 units and
reports directly to senior management. Exhibit 24 provides
a summary of the operating characteristics for a typical metropolitan and nonmetropolitan store.’’’
’’’ On the request of the top management and in order to preserve the confidentiality of the sample stores and the company, no specific financial information is disclosed here or elsewhere in this study.

179EXHIBIT 24
The Operating Profile Of The Sample Stores
StoreCharacteristics
Nuittoer of Part-Time Employees
Number of Full-Time Employees
Average Hourly Wage
Metropolitan Nonmetropolitan Stores Stores(112) (99)
3.5
9.9$3.40
2.5
8.9$3.40
Square Feet Of Selling Area
•Square Feet Of Total Space
Number of Customer Checkout Counters
Number of Customer Parking Spaces
10,696
12,298
3.944
9,452
10,994
3.5
32
Age Of Store Percent Of Stores
Remodeled Number of Years Since
Last Remodeling Number Of Hours Store
Open Per Week
18
50.0% 9 years
64 hours
18
56.6%
7 years
58 hours
Net Sales Per Customer Checkout Counter
Net Sales Per Store Hour
$162,577
$ 186
$174,190
$199
Inventory Investment Break-Even Sales As
A Percent Of Current Sales
$138,916
89.7%
$128,965
82.3%

180
The Research Desian And Instruments
The design of this research is nonexperimental and
may be broadly classifed as a cross-sectional field study.
The research instruments consist of a series of field
surveys and secondary data obtained from the 1980 U.S.
Census of Population and Housing at the trade area level.
All field surveys and the economic/demographic data for the
trading areas of the retail units were collected in the spring and summer of 1982. The survey instruments were
specifically designed, in collaboration with the executives
of the company, to be used in this research.
The trading area of a unit was defined as the geographical area from which the unit derives seventy
percent or more of its revenues. According to this general
criterion, the trading area of each unit was evaluated, with
the senior executives of the company, on a store by store
basis. Data from a number of independent firms for a
limited sample of stores were obtained to compare the
consistency of the economic/demographic data computed with
different algorithms.I'z Operationally, it was decided that
for metropolitan area stores, the trading area consisted of
a circular geography of one-and-one half miles radius with
’ ’2 These stores were selected with a fairly well a priori Knowledge of the existing trade area characteristics.

181
the unit at the locus of the circle. For nonmetropolitan
stores, it was determined that either the place or
city limits data gave a fairly accurate representation of
the trading area for almost all retail units.’’*
A copy of the research instruments, along with the
accompanying cover letters and instructions, are reproduced
in Appendix-C. A sample report which describes the data
items obtained from the trade area geography is also
included in this Appendix. The following is a brief
description of these instruments.
The Survey Of Store Operations Data Form (SOSO) is
designed to provide base-line information on the operational
and financial statistics of each retail unit for the most
recent three years (1979-1981) of operation. Items from
this survey are primarily used to operationalize the
performance, i.e., profitability and productivity of the
units. A number of conduct elements (e.g., capital and
advertising intensity), although not explicitly tested in
the present study, can also be derived from this instrument.
” 3 Minor Civil Divisions (MCDs) are primary divisions of counties established under State law. In some states, all incorporated places are also MOD's. In other states, incorporated places are subordinate to or part of the MOD'S in which they are located.
” * For all metropolitan area stores similar data for three and five mile radii, and for some nonmetropolitan stores, one-and-one half and three miles circular geographies were also obtained. However, in the present study, only the operational definitions described above are used in statistical analyses.

182
All the data for this survey instrument were hand-coded from
the internal records of the company.
The Survey of Managerial Effectiveness Data Form
(SOME) is designed to provide an assessment of the
effectiveness of management, as perceived by the immediate
supervisors of the retail unit. This research instrument
also provides key background data for each of the store
managers compiled from the company records. These data
forms, precoded with the store number and the name of the
unit manager, were distributed to the district supervisors
in a midyear staff meeting. Each supervisor executed
approximately 10-15 data forms, covering the units under his
or her responsibility in the past several years.
Approximately 15 forms which had a disproportionate amount
of "aye" or "nay" type of responses were returned to the
supervisors for reexecution at a later time.
The Competitive Audit Data Form (CA) is designed to
provide detailed information on the nature of competition in
each trading area as well as an overall measure of the
attractiveness or potential of the market area. The survey
instrument also provides a subjective rating of each store
vis-a-vis the top competitor on 20 key attributes. The CA
data form was sent to individual store managers to be
completed per instructions attached to a cover letter. The
trade area boundries for each unit was predefined and

183
precoded on all forms. All the returns were individually
reviewed by the researcher and the district supervisors for
missing or miscoded items. Where necessary, the data form
was sent back to the store manager for reexecution in order
to assure complete and accurate responses.
Nineteen eighty U.S. Census of Population and
Housing (CPH) data were obtained from a private firm which
commercially supplies current demographics for trading
areas. The STF-2 data files of the most recent census were
used to compile the figures. This file, and the reports generated for use in this research, contained detailed
complete-count population and housing data for each unit's
trading area. Identical data items for the 1970 census, on
comparable geographical definitions, were also obtained. Depending on a priori classification of the units (as an
SMSA or Rural store), the data from this source contained
extensive information on the socio-economic structure of the
trading areas for 1 and 1/2, 3 and 5 mile rings or on an
MOD, place or city limits bases.
Collectively, these research instruments comprise
the general data base that are used to empirically define
the theoretical and derived concepts described in the
previous chapter.

184
Cor respondence Rules And Empirical Défini tiens
In the previous chapter, the meaning of the
constituent elements of the proposed model were provided by
the semantic content of the terms used in their definitions.
The conceptual meaning of theoretical terms, however, are
distinct from their empirical meanings, which are formally
provided through a set of correspondence rules.
Correspondence rules describe the process through
which theoretical, latent variables are given observational
or empirical content. Bagozzi (1984) identifies three
formal models of correspondence rules in scientific inquiry:
the operational definition model, the partial interpretation
model, and the causal indicator model.
The operational definition model has been the most
commonly used correspondence rule in previous studies of
retailing performance (see Chapters 2 and 4). According to
this modelwe mean by any concept nothing more than a set of operations: the concept is synonymous with thecorresponding set of operations (Bridgman 1927,p.5)
The shortcomings of this model are well Known and
demonstrated elsewhere (e.g., Bagozzi 1980b,1984, Hunt 1983,
Blalock 1968,1982) and need not be repeated here.
The partial interpretation model of correspondence
rules provides for multiple operationalizations of
theoretical terms but does not allow such terms to have

185semantic content over and above that provided by the
empirical definitions. Hence, although the partial
interpretation model is an improvement over the operational
model, it similarly implies "a change in the meaning of a
construct" when there is a change in the measurement
procedure for the indicator variables (Bagozzi 1984, p.22).
The formal correspondence rule adopted in this
study, the causal indicator model, is an extension of the
partial interpretation model. In this conception,
correspondence rules are viewed as causal links specified
between the theoretical termis), a test operation(s) and its
result(s). More specifically, in causal indicator model:
A phenomenon or state repres.ented by a theoretical term is thought to imply or explain observations.The correspondence rule, then, functions as a scientific law linking theoretical term to experimental test procedure to observed results... (hence) correspondence rule is not part of the theory or the observations to which it is linked. Rather it is an auxiliary hypothesis concerning theoretical mechanisms existing between theoretical terms and observations (Bagozzi 1984,p.22)
An important property of the causal indicator model is that
the theoretical and derived notions are assumed to have an independent semantic interpretation, apart from the
empirical content assigned to them in any given context.
Hence, it is possible for constituent elements in a
theoretical network to be operationalized in different ways
across different studies, since the relationships of

186interest are generally not the ones between the indicator
variables, but those between the latent constructs. To the
extent it can be demonstrated that the manifest variables
are reliable and valid measures of the concepts in question,
and further, that there is theoretical or conceptual support
for the proposed linkages, similar relationships between the
concepts should hold regardless of the specific empirical
content provided by the observational variables.
To illustrate, consider for example the relationship
hypothesized between target market reach and performance.
Both of these constructs can conceivably be operationalized
in ways that are different from the ones adopted in this
study. In fact, target market reach, as it is
conceptualized and defined in the preceding chapter, would
be "expected" to have different operational definitions
across different retail units. Similarly, the economic
performance of the unit can be empirically defined in
various ways. However, the intent here is not to "find" a
simple empirical association between any two measures, but
to assess the influence or importance of a firm's position resulting from a strategic locational decision on the
aggregate economic outcomes.
Exhibit 25 provides a summary of the empirical
measures for all the latent or unobservable concepts defined
in Chapter 4. In the balance of this section these measures

187are defined and some of the issues in their
operationalizations are briefly reviewed.
Empirical Definitions Of The Performance Construct
The economic performance of a retail unit is
represented through two derived concepts (productivity and
profitability), and five empirical measures. All empirical
measures are obtained from the company's internal records
via the Survey of Store Operations (SOSO) data form (see,
Appendix-C). All the data items are for the 1981 fiscal year.
Productivity of the unit is represented by three
conventional measures :
1. NSTSA: Net sales per square foot ofselling area
2. NSTIN: Net sales per dollar of (average)inventory investment
3. NSTFE: Net sales per full-time equivalentemployee
In all the operationalizations, net sales is conceived as a
measure of aggregate retail outputs. Three alternative
measures of retail outputs;
1. Gross Margin, as a close approximation of value added,
2. Contribution Margin, operationally defined as the gross margin less the corporate overhead allocated to the unit, and

EXHIBIT 25
The Empirical Definitions Of The Latent Variables
188
Latent Constructs Mnemonic Empirical Definitions
1. Productivity
2. Profitability
3. Managerial Effectiveness
4. Managerial Expertness
5. Marketing Effectiveness
NSTSA Sales per square footof se11i ng space
NSTIN Sales per dollar ofaverage inventory
NSTFE Sales per full-timeequivalent employee
NPBT Net profit before taxas a percent of sales
ROCA Contribution marginreturn on controllable assets
MGREFF 7-LiKert scale itemsfrom SOME-A
MGRSKL 7-Likert scale itemsfrom SOME-A
MGRACH 5-Likert scale itemsfrom SOME-A
MGRSAT 8-Semantic Scalefrom SOME-A
MGRYRS Tenure (yrs) of managerMGRRTL Manager's (yrs) retail
experience
LOCAT 2-Semantic scale itemsfrom CA-5
SERVC 5-Semantic scale itemsfrom CA-5
OFFER 7-Semantic scale itemsfrom CA-5
ATMOS 5-Semantic scale itemsfrom CA-5
SOME: Survey of Managerial Effectiveness CA : Competitive Audit Data Form

189EXHIBIT 25
The Empirical Definitions Of The Latent Variables (Cent.)
Latent Constructs Mnemonic Empirical Definitions
6. Competitive Intensi ty
Relative Overstoring
Relative Size of Unit
9. Target Market Reach
10. (Character Of) Market Demand
DDSTRS Number of discountdepartment stores
INTCPT1 Proportion of interceptconpetitors (number)
INTCPT2 Proportion of interceptcompetitors (size)
SPCPHH Total retail spaceper household
CSTCS Most relevant competitor'stotal space to unit's total sel1ing area
MINORS Percent of minoritiesCHLD14 Percent of children
age 14 or younger INC 14M Percent of households
with income $14m or less
AVGINC Average household incomeAVGHSV Average housing valueAVGRTV Average rent value
11. (Potential Of) Market Demand
12. Market Growth
TINCHH Total personal incomeTRNTVA Total value of rentsTHSNVA Total value of housing
TINCGH Annual rate of incomegrowth-1
TINCGP Annual rate of incomegrowth-2
POPG Annual rate of populationgrowth

1903. Three year average of net sales to smooth
the yearly fluctuations,
were also considered. The product-moment correlations among
the ratios computed with these operationalizations and the
one used above (i.e., net sales) are all in excess of .90,
and give the same statistical conclusions with respect to
the other dependent and independent variables. Similarly,
an alternative measure of NSTSA in "net sales per linear
foot of shelf space," and of NSTFE in "net sales per employee hours," were also highly correlated with the
respective empirical definitions above, and hence, only the
former are used.
A second set of performance measures empirically
define the notion of store profitability through the
following indicators:
1. NPBT; Net profits before corporate tax allocation expressed as a percent of sales
2. ROCA: Return (gross margin less direct controllable expenses) on control 1 able assets (average inventory plus replacement value of fixtures)
Although the profitabi1ity concept, in the definitional
schemata adopted in this study, represents a "spread"
notion, it is necessary to "scale" the absolute difference
between revenues and costs to have a common basis for

191comparison across stores with different sales volumes.
This, however, algebraicly reduces the empirical definition
of profitability to a rate notion similar to productivity
measures and the two concepts converge in their
operationalizations (see Chapter 4).
A common factor analysis using an oblique (promax)
rotation of factor axes indicates the degree to which the
two derived notions are intercorrelated. The simple correlation matrix, the target matrix for procrustean
transformation and the rotated (oblique) factor "pattern"
and "structure" are reproduced in Exhibit 26.
A scree plot of eigenvalues against the principal
factors indicates that, with these 5 measures, there is only
one interpretable factor accounting for 95.4 percent of the
variation in the manifest variables. The interfactor
correlations among dual notions of productivity and
profitability also indicate a very close association between
the two concepts (see Exhibit 26).
An analysis of the general pattern of the product
moment and the squared multiple correlations for these set
of indicators (not shown here), further suggests that the
ROCA measure is a redundant indicator (with SMC = .99). A
115 Selling space, dollar sales, expenses and inventory investment in stores are almost perfectly correlated. Hence high dollar profits for one unit, without such scaling, merely represents size differential and not the differential performance of the unit.

192EXHIBIT 26
Results Of A Common F.A. On The Dimensionality Of The Performance Construct
Pearson product-moment correlations
ROCANPBTNSTSANSTFENSTIN
ROCA
1.000 .866 .805 .712 .898
NPBT
1 . 000.697.611.662
NSTSA
1.000.670.759
NSTFE
1 . 000.673
NSTIN
1 . 000
Target Matrix For Procrustean Transformation
Factor 1 Factor 2
ROCA .552 .423NPBT .112 1.000NSTSA .986 .124NSTFE .624 .361NSTIN 1.000 .118
Rotated Factor Pattern (Std. Reg. iFactor 1 Factor 2
ROCA .585 .486NPBT .056 .878NSTSA .763 .085NSTFE .469 .309NSTIN .870 .083
Rotated Factor Structure (Correli
Factor 1 Factor 2
ROCA .930 .707NPBT .824 .632NSTSA .933 .905NSTFE . .690 .645NSTIN .686 .919
Interfactor correlation: .712

193similar factor analysis with ROCA deleted from the
computations yields an interfactor correlation of .78.
Therefore, in the statistical analyses presented in the next
chapter, the ROCA variable is deleted from the set of
manifest variables and the four variables are taken to be
indicators of a factor which may be labelled as "financial"
performance.
Empirical Définitions Of The Conduct Constructs
The elements of store conduct in this study are
restricted to five derived concepts, collectively
represented by fourteen indicators. The two related
notions, managerial effectiveness and managerial expertness,
are operationalized using two instruments and two items from
the Survey Of Managerial Effectiveness (SOME). The former
concept is empirically defined through four indicators, and
the latter concept is represented by two empirical measures.
The four indicators of managerial effectiveness are
derived from the responses of district supervisors to the
first two scales of the survey instrument” ® (see
In the construction of these scales, there was an a priori expectation that certain items would cluster around subdimensions such as overall managerial ability, managerial skills, relations with supervisors, achievement orientation, etc. A common factor analysis of these items, however, indicated only three major subdimensions which collectively accounted for all the variation in the scale items. The scores above represent the summation of those items which had the highest loadings with the respective factor(s).

194Appendix-C, Parts A and B of SOME):
MGREFF: Represents a sunmated scoreobtained from seven LiKert (5-pt.) scaleitems (Questions, A: 1,3,5,9,12,15 and 16). These i terns concern the abi1i ty of the store manager in solving day-to-day store problems, adjusting to new situations in the marketplace, in coping with pressure or strain in the job, and monitoring demand and supply conditions in the marketplace.
MGRSKL: Represents a summated scoreobtained from seven Likert (5-pt.) scaleitems (Questions, A: 8,11,15,18,19, 21 and22). Collectively, these items provide an overall measure of the work ethic, commitment and work practices of the manager within the unit and vis-a-vis the company.MGRACH: Represents a summated scoreobtained from five Likert (5-pt.) scaleitems (Questions, A: 6,7,10,13 and 19).These items provide a measure of the general ability of the store manager to achieve the target goals and objectives set for the store by the company.MGRSAT: Represents the final testcondition, replicating the items from MGREFF through a seven item bi-polarsemantic differential (7-pt.) scale (Questions, B: e,f,g,h,i,j and k). Here,instead of an evaluation of the manager with respect to key attributes, the district supervisor is asked to indicate the degree of his or her satisfaction with the manager on the same attributes.
The concept of managerial expertness is also operationalized
through the same survey instrument (i.e., SOME) using two
i terns :
1. MGRYRS: is the tenure (in number of years)of store manager in the unit in question, obtained from the company personnel records

1952. MGRRTL: is the number of years that the
store manager has worked in retailing (including his or her tenure as the store manager in the unit, in other stores of the company, and other firms in the industry).
Although the notion of managerial expertness has a distinct
"conceptual" meaning, given the model for correspondence
rules adopted in this study, the operationalization of this
concept in these measures are somewhat problematic.
According to the causal indicator model, the phenomenon in
question (i.e., managerial expertness) is assumed to be
"manifested" via a test operation (i.e., SOME data form), in
the reçult(s) obtained (i.e., MGRYRS and MGRRTL). Hence,
the implied direction of the "structural" links between the
latent construct and observables are hypothesized to "run" from the former to the latter (i.e., effect or reflective
indicator mode) (cf., Bollen 1981, Namboodiri et al 1975,
Fornell and Bookstein 1982). Obviously a case can be made
that the measures Of managerial expertness, as they are
defined above, may better fit the "cause" or "formative"
indicator mode. In other words, years spent in retailing
and/or store management may be thought of as indictors which
"lead" one to acquire expertise, rather than manifestations
of the same. In the tests of the statistical relations, it
is useful to keep in mind these reservations.
A third element of unit conduct, the concept of
marketing effectiveness, is measured by four indicators.

196
The four measures are constructed from a 20 item, bi-polar
semantic differential (7-pt.) scale that was obtained from
the responses of each store manager to Question 5 in the
Coirpetitive Audit Data Form.ii? The items for the semantic
scale are developed in conjunction with those used in the
consumer research survey (see Exhibit 23) in order to
qualitatively assess the degree of key informant bias which
may be present in these responses.’’®
An approximately equal number of items in the survey
instrument were also randomly reversed in order to minimize
'aye/nay' responses, and further, all CA survey instruments
were reviewed by the district supervisors to prevent
miscodes, incomplete questionnaires, and other anomolies in
their completion.
Ideally, a similar instrument would have been
executed for a number of competitors in the trade area.
However, due to the length of the survey instrument and
other exigencies of the research, this strategy could not be
’’7 Note that, by design, this scale elicits "reverse" responses in comparing the the most relevant competitor to the focal store. With the appropriate reversals of these items, a high combined score indicates a "higher" marketing effectiveness for the unit.
’’® The two scales used in the latter research involves a standard 22 item importance-performance analysis of the focal unit and a number of competitors on similar store attributes using a 1 to 10 rating scale. However, since the consumer survey was conducted in a limited number of metropolitan areas, the number of units which are common to both surveys are limited.

197
followed.’’® The four operationalizations of the marketing
effectiveness construct are summarized oelowi’ o
1. LOCAT: Represents a 2 item summatedscore, measuring the degree ofaccessabi1ity and quality of store location compared to the most relevant conpetition in the trading area.
2. SERVC: Represents a 5 item summatedscore, measuring the level of service offered by the unit in relation to competition in the marketplace (e.g., enployee service, parking facilities,customer checkout counters, etc.)
3. OFFER: Represents a 7 item summatedscore, measuring the level and quality of merchandise offer, (e.g., the relativeprice, quality, value, and the depth, selection, availability of national brands), in relation, to those offered by the most relevant competition in the trade area.
4. ATMOS: Represents a 5 item summatedscore, measuring the quality of the store atmosphere, interior design, prestige and in-store displays in relation to the most relevant competition.
Of the two remaining elements of store conduct, the
relative size of unit is operationalized by a single
indicator, and the target market reach is empirically
defined by three measures.
” ® The most relevant competition in the following operationalizations refer to the establishment which was perceived to be the top competitor of the unit in the market (see Question 4.a of CA).
’20 The delineation of item clusters here were also obtained through a common factor analysis of the above semantic differential scale.

198The relative size of a unit is defined as the degree
of differential capacity of a retail unit in relation to its
main competitors in the marketplace. Conceivably, a large
nuntoer of variables influence the "capacity" for retail
outputs. In this regard, for example, the size of the unit,
the reach and intensity of out-store advertising and
promotion, the location and/or accessabi1ity of the unit,
operating hours of the store and its design, are all
relevant factors. Although indicators for each of these
factors were available for the focal units in the sample, similar data points for the relevant competiton, with the
exception of the first factor (i.e., the store size) could
not be obtained. Hence, using the total unit space from
SOSO, and the estimated gross leasable space for the
relevant competitors from CA data form (Question 4:a-c), two
ratio variables are constructed:
1. CSTCS: Representing the ratio of grossleasable space of the most relevant competitor in the trade area to the unit's total space
2. TSTCS: Representing the ratio of totalgross leasable space of the most relevant "three" competitors in the trade area to the unit's total space.
In some trade areas, however, where there were less than
three "top competitors," the variable TSTCS was not
comparable across stores. In order to have the largest

199possible sairple size with a consistent measure for all
stores, the former operationalization is retained as asingle indicator of the c on c e p t .
The last element, the target market reach of the
unit, is measured through three indicators, obtained by
combining a number of data points from the Census of
Population and Housing. The company and its units, through
the years and by design, have been strategically positioned
to elicit differential patronage from a relevant consumer
base. Although a detailed description of this customer base
is available, due to the confidential nature of these data,
no specific information is disclosed here. Suffice it to
say that these consumers, in general, have relatively low »
incomes and are primarily convenience oriented households.
These households are also less mobile, more store loyal and generally have a larger family size with more younger
children than the average for all households in the trade
area. The following are the three indicators of the target
market reach of a focal unit:
1. MINORS: Represents the proportion ofminorities in the trade area, as a percent of the total population.
’21 It should be noted that, in lieu of the conceptual definition of the relative size, the CSTCS measure here is a "reversed" operationalization. This should be kept in mind in the interpretation of the statistical results.

200
2. CHLD14: Represents the proportion of households with children age fourteen or younger, as a percent of the total households in the trade area.
3. INC14M: Represents the proportion of thehouseholds with an annual household income of $ 14,000 or less in the trade area.
Empirical Défini tions Of Market Demand and Su p p 1v Constructs
The three elements of market demand and the two
elements of supply conditions defined in Chapter 4 are
collectively operationalized through thirteen indicators.
The empirical measures of the three market demand variables are derived from the Census of Population and Housing. The
indicators of supply conditions are obtained using data
points from both the census data and the competitive audit
data form. Both of these research instruments are based on
similar trade area definitions across different retail
units.The elements of market demand and supply, partly
because of the relatively aggregated nature of the
theoretical notions involved, and partly due to the limited
availability of data points from the Census reports at the
time of this research, were the most difficult to
operationalize. Furthermore, given the model for the
correspondence rules adopted in this study, auxiliary theory
formulation (i.e., the links between the theoretical
concepts and empirical definitions) once again appears
rather problematic.

201
The notion of market demand character, representing
the degree of upscaledness or quality of demand is
represented by three Indicators:
1. AVGINC: is the estimated average income per household in the trade area
2. AVGHSV: is the estimated average housing value in the trade area
3. AVGRTV: is the estimated average rent value per apartment or housing unit in the trade area
In conformity with the causal interpretation model, it
appears plausible to think that the quality of demand may
indeed be "reflected" in higher rent and housing values in
the marketplace. Howevtr, a similar argument for the third
indicator (i.e., average household income) does not appear
to fit the same model. In fact, it seems more reasonable to
hypothesize that average income acts as a "cause" indicator,
"leading to" the quality of demand in the market.
However, even if one were to assume that all
measures fit the "reflective" indicator mode, additional
complications exist. These issues concern the "clarity" of
the "true underlying factor" which may be influencing the
observed measures. For example, it is possible to speculate
that high levels of rents and/or housing values in the
marketplace may be partly or substantially due to a relative
scarcity of housing. Hence, the aggregated nature of such

202
theoretical concepts bring along serious complications in operationalizations which are difficult to o v e r c o m e ^ 2
The concept of market demand potential,, conceptually
and in its indicators, is closely related to the preceding
notion. Whereas the character of market demand provides an
indication of the quality of buying power at the level of
the "households," the potential market demand provides a
measure of the total purchasing power by taking into account
the total trade area population. Three empirical measures
of potential market demand can be identified:
1. TINCHH: Represents the total trade areaincome, obtained as a product of averageper capita income and population of trade area
2. TRTVAL: Represents the total dollar valueof the rents, obtained as a product ofaverage rental value and the number ofrental units in the trade area
3. THSVAL: Represents the total housingvalue, obtained as a product of averagehome value and the nuirtser of homes in the trade area
’22 In many cases, the global nature of these constructs, conceivably all with multiple subdimensions, make it difficult to apply any one correspondence rule in its pure form. One possible way out of this difficulty is to try to fit several models to the same variance-covariance structure presented by the empirical measures and to observe the fit of these alternative models and to reformulate the auxiliary links accordingly. A number of illustrations using this approach are presented in the next chapter.

203A similar problem concerning the true underlying factor
which may account for the observed variables also exists
here. Since the trade area boundries for stores located in
metropolitan markets are defined uniformly for all units
(i.e., one-and-one half miles radius), the preceding
operationalizations lend themselves to another alternative
interpretation in the "density of demand or population." If
the latter concept (i.e., density) is the true underlying
factor, it would not be surprising to find that the
hypothesized relationship in (H-1.1) is reversed. In other
words, while the higher level of demand potential is
expected to have a conducive effect on overstoring of the
markets, the density of population would be expected to have a depressive effect on the same. 3
The rate of growth in potential demand in the trade
area is operationalized in three indicators. The first two
indicators measure the change in buying power on a per
capita and household basis. The third indicator is a
measure of population growth in the trade area:
1. TINCGH: The annual rate of growth inhousehold incomes for the period 1970-1982.
’23 However, since the units located in nonmetropolitan areas are largely free of the problem brought about by the uniform geography definition, an assessment of such confounding may be possible by estimating the same set of relationships separately for metropolitan and nonmetropolitan stores.

2042. TINCGP: The annual rate of growth in per
capita income for the period 1970-1982.
3. POPG: The annual rate of growth intrade area population for the period 1970-1980.
Clearly, the growth in overall demand in a given
geographical area is a function not only of the changes in
income but also of the change in the size of the population.
In this sense, it may be more appropriate to think of demand growth as a bidimensional construct, rather than an
unidimensional phenomenon. In the statistical analyses,
this bidimensionality can be represented in two derived
notions of demand growth, first measuring the growth in
incomes, and a second measuring the population growth.
The final two concepts in the theoretical framework
deal with the nature of supply conditions. The first
variable, the relative competitive intensity, refers to the
overall strength of the rivalrous activity in the
marketplace and is operationalized through three indicators:
1. DDSTRS: Represents the number of discountdepartment stores in the trade area of each focal unit.
2. INTCPT1: Represents the proportion of theintercept competitors in the market as apercent of all competitors in the market.
3. INTCPT2: Represents the proportion of theretail space due to the interceptcompetitors as a percent of total retailspace in the market.

205In these measures, Intercept Competitors refer to units
which fail under any one of four categories of retailers,
such as cont)ination stores, super-drug stores, catalog
showrooms and discount retailers. These retail formats, as
McCammon et al (1980) note "are a dis locative force in all
of the markets in which they compete." Collectively, these
stores also have a differential capacity advantage and a
growing consumer franchise to divert a significant amount of
traffic and volume from most traditional retail outlets.
Hence, it is assumed that in markets where there is a
disproportionate presence of such retailers, the competitive
activity is higher than otherwise.
Finally, the notion of overstoring in a given market
is operationalized by a single measure:
1. SPCPHH: Represents the amount of totalretail space per household in the trade area.
The theoretical definition of overstoring refers to the
degree to which the capacity for service outputs may exceed
the potential for market demand. In the above measure, the
total retail space in a given trade area is assumed to give
a fair approximation of capacity potential, and similarly,
the number of households is assumed to be reflective of the
potential for market demand in the marketplace.

206The Statistical Research Methodology
In the Introduction, as well as in various other
parts of the manuscript, it was repeatedly emphasized that
previous studies of retailing or retail store performance
have been overly simplistic both in measurement and in
statistical analyses. More specifically, it was pointed out
that a major shortcoming in this general area of inquiry was
a lack of interest in assessing the reliability and validity
of the research instruments.Of course, since the major purpose of investigation
in some of these studies is one of "exploration" or of
formulating predictive, forecasting models, the questions of
validity or reliability are of little or no significance
(e.g., Kinney 1969, Cottrell 1973, Hise et al 1981, Clawson
1974). However, in other studies, where the major objective
of the research is to establish structural links among
variables and of inferring a series of causal or
"explanatory" relations (e.g., George and Ward 1973, Bucklin
1977,1978b, Takeuchi and Bucklin 1977, Ingene 1982,1983c),
statistical tools which are based upon conventional
regression analysis are at best deficient, and at worst,
simply not appropriate (Goldberger 1973, p.1). In this
regard, ordinary least squares (OLS) regression and other
correlational analyses are especially inadequate statistical
tools, since they neccessarily assume all constituent

207elements to be perfectly measured, with no error, by theirrespective indicator(s).’ 4
However discomforting it may bis, the "fact of
scientific life" is that measurement and other
methodological errors are common in all areas of scientific
research. Measurement errors, unfortunately, do not "go
away" by assumption. Such an assumption is especially
difficult to justify in social science research where
measurement errors are typically the rule rather than the
exception (Blalock 1969a,b,1979, Namboodiri et al 1975,
Bagozzi and Phillips 1982, Bagozzi 1984).
Until recently, in marketing as well as in other
social science disciplines, the standard practice has been
one of formulating theoretical links in abstract terms, and
then, testing the predictions from these theoretical links,
using concrete observations typically provided by single
empirical definitions. This conventional approach has a
number of serious shortcomings in substantive hypotheses
testing. As Bagozzi and Phillips (1982) have recently noted
although there are we11-developed criteria to guide the formulation of theory, and statistical and observational standards can be found to direct empirical analysis, the linkages between theoretical concepts and their measurement are often left unspecified or else stipulated in loose, unverifiable ways. This failure to
’24 Implications of such errors in parameter estimation in regression analysis is well known and need not be repeated here (see, for example, Namboodiri et al 1975, p.535-549 or Bagozzi 1980b, p.86-91).

208represent the degree of correspondence between measurements and the concepts undermines the test of the theory, [since] a hypothesis may be rejected because of [a] inadequate theory, [b] a lack of correspondence between measurements and the concepts that the measurements are intended to represent, and/or [cl excessive random error in measurements (p.459).
In order to represent the set of structural
relations discussed in the previous chapter in a form that
readily leads to parameter estimation and hypotheses
testing, and where errors in measurement are specifically
recognized in statistical analyses, it is useful to employ a
structural equations methodology (Bagozzi 1976,1980b,1984,
Blalock 1982, Bagozzi and Phillips 1982, Aaker and Bagozzi
1979). In this regard, structural equations modeling
provides a powerful methodological paradigm which not only
permits a direct assessment of the degree of correspondence
between measurements and concepts (i.e, validity) and the
errors in measurement (i.e., reliability), but more
importantly, takes these relationships into account in the test of substantive research h y p o t h e s e s . ’
’25 Background material on structural equations modeling may be found in Duncan (1975), Bagozzi (1980b), and in Blalock (1964,1969b). A special issue of the Journal of Marketing Research, on Causal Modeling provides a number of current applications, including an article by Joreskog and Sorbom (1982) which summarizes the recent developments in the LISREL program. Several econometrics texts (e.g., Maddala 1977, Johnston 1972) give introductions, and a number of articles provide reviews of the literature (e.g., Goldberger 1971, Long 1976, Bielby and Hauser 1977). More advanced treatments of structural equations methodology can be found in Goldberger and Duncan (1973), Joreskog and Sorbom

209Two closely related statistical methods for
estimating the parameters in a structural equations
framework with latent variables have been developed, one by
Joreskog (1969,1973,1978) using the LISREL version of the ML
(maximum likelihood) approach, and the other by Wold (1980)
using the PLS (partial least squares) estimation technique.
In general, the PLS analysis is simpler, since it does not
require multinormal distributional properties for the
observed variables, whereas ML approach requires such
assumptionsHowever, as Wold (1980) notes
This parting of ways... is technical rather than real, for ML aims for optimal accuracy but PLS for consistency. Under regular conditions, ML and PLS estimates are co-consi stent ; so that there is no substantial difference between the two set of estimates (p.52).
In this study, the latest available version of the computer program developed by Joreskog and Sorbom (1983),
LISREL (Release 6.3), is used. LISREL is a general program for estimating the coefficients in a set of linear
structural equations which
(1979), Joreskog and Wold (1982), and in Wold and Joreskog (1982).
126 In the marketing literature, examples of the LISREL approach can be found in Bagozzi (1977,1978,1980a,b), Aaker and Bagozzi (1979), Phillips (1981,1982) and Phillips et al (1983). For the PLS approach, examples can also be found in Fornell et al (1982), Fornell and Larcker (1981a), Fornell and Robinson (1983), and in Hui and Jagpal (1979). In two recent papers, Fornell and Bookstein (1982) and Joreskog and Wold (1982b) contrast and compare the two approaches.

210
provides a statistical [maximum likelihood and unweighted least squares] solution to the problem of reconciling alternative estimates for over identified path models containing observable and unobservable variables. The objective [with LISREL] is to reproduce the observed-variable covariance matrix as closely as possible, and to determine the goodness-of-fit of the model to the data (Fornell 1983, p.443).
Hence, the variables in the equation system with LISREL can
be either directly observed variables (in which case a
standard two or three stage linear regression is performed)
or they may be latent variables which are not observed but
related to other observed variables. The LISREL program is
particularly designed to handle models with latent
variables, measurement errors and reciprocal causation. In
its most general form, the LISREL model assumes that there
is a "causal" structure among a set of latent variables, and
in turn, the latent variables appear as the underlyingcauses of the observed v a r i a b l e s . ’ 7
A more detailed, nontechnical description of the
LISREL methodology can be found in the User's Guide
(Joreskog and Sorbom 1983), as well as in various other
texts (e.g., Pedhazur 1982, Bollen 1983, Bagozzi 1980b). In
general, LISREL requires a measurement and a structural
model to be simultaneously specified for parametere s t i m a t i o n . ’28 The measurement model specifies how the
’27 This is essentially the causal view of correspondence rules (Bagozzi 1980b,1984, and Bagozzi and Phillips 1982).

211theoretical and derived concepts are measured in terms of
the observed variables and is used to assess the measurement
properties (validities and reliabilities) of the observed
variables (see Exhibit 25). The structural model, on the
other hand, specifies the hypothesized relationships among
the latent constructs, and is used to "describe" the causal
effects and the amount of unexplained variance (see Exhibit 17) .
Since a significant amount of research which uses
structural equations modeling has already been accumulated
in the marketing literature and elsewehere (see the
preceding text and footnotes for references), no technical
background is provided here. Issues relating to identification of structural equation models, and
goodness-of-fit tests, as well as recent developments in overall assessment of fit of structural m o d e l s ’ 29 (e.g.,
incremental fit tests) will be discussed in the next
chapter. •
’28 Since both sets of equations are essentially structural links, a more appropriate description of these two models would be "latent variable model" and the "measurement or observed variable model" respectively (Bagozzi 1984, Bent 1er 1982).
’29 See, for example. Bent 1er and Bonett (1980), Sawyer and Page (1983), Fornell and Larcker (1981a,b,1984), Bagozzi (1981), Acito and Anderson (1984) for a discussion of methods and issues.

CHAPTER VI
RESULTS FROM STATISTICAL ANALYSES
In this chapter, the results from empirical, statistical
analyses are summarized and the parameter estimates for
several models of retail store performance are presented.
Throughout the discussion, the proposed structural relations
among the constituent elements and the measurement
properties of these elements are evaluated simultaneously.
In this regard, the rules of correspondence between the
theoretical concepts and the observed variables form a set
of "secondary structural linkages." Hence, the measurement
properties of these concepts are also "hypotheses" that are
explicitly tested in the process.
Organization Of The Chapter
This chapter is in three major sections. In the
first section, the general framework used in the statistical
analyses is described and the test statistics which are
uniformly reported in the latter sections are defined.
Next, the results from the statistical analyses of
nonobservat iona1 research hypotheses are presented. In the
final section, parameter estimates for a number of models of
increasing complexity are summarized and discussed.
212 -

213
The General Framework Used In Hypotheses Testing
The purpose of this section is to provide a detailed
outline of the general research strategy followed in* the
empirical analyses. The statistical methodology, test
statistics, and other qualitative criteria defined and
described below form the basis of discussion in the next two
sections.
The LISREL methodology typically generates a wealth
of statistical information which can quickly reach a point
of diminishing returns. ; A significant part of this
information is for diagnostic purposes, intended to be used
in variously modifying the model(s) at hand. Throughout
this chapter, the statistical results from LISREL analysis that are most relevant for the present discussion will be
uniformly summarized in four key exhibits. The contents of
these exhibits are briefly described below.
The General Format Of Presentation
In the forthcoming sections, the correlations which
are input to statistical analyses are given as the first set
of exhibits. Unless stated otherwise, in all the
correlation matrices the (p) indicators (i.e., y-variables)
of the endogenous (n) concepts are listed first, followed by
the (q) indicators (i.e., x-variables) of the exogenous (f)

214c o n c e p t s .’30 The level of statistical significance obtained
for all the eleirents are indicated on each of the
matrices.’®’ The Coefficients of Determination for the y and
X variables, obtained from a subsequent LISREL analysis, are
also noted at the end of each exhibit. Collectively, the
information contained in these exhibits provide a point of
reference for an initial assessment of the measurement
properties of the constructs.
In the second set of exhibits, an arrow schema is
used to summarize the major structural links advanced in each of the hypotheses.’®® In this regard, the arrow
schemata provide a convenient, pictorial representation of
the proposed relations between the latent constructs, as
well as those between the observed and unobserved variables.
Collectively, these linkages comprise the "specification" of
’30 It is important to note that the labelling of the theoretical concepts as endogenous or exogenous variables is always specific to the context of a given model. Hence, a latent variable which is termed exogoneous (independent) in one model may appear as an endogenous (dependent) variable in another. Since the hypothesis testing here closely follows the incremental model building approach of Chapter 4, in the forthcoming sections this contextual and differential labelling occurs frequently.
’3’ The correlations, variances and covariances for all the manifest variables used in the study are reproduced in Appendix-B.
’32 It is important to note that most of the nonobservationa1 research hypotheses from Chapter 4 contain a number of subhypotheses. The arrow schemata described here contain "all" of these subhypotheses.

215
a model which is evaluated by the LISREL program. In all
the exhibits, the standardized parameter estimates obtained
from the LISREL analyses are shown on the arrow schemata.
The parameter estimates which summarize the
"measurement" properties of the constructs (i.e., Xy's and
Ax's) are generally "invariant" in the evaluation of an
overall hypothesis and in any of its parts. Hence, these
parameters are presented, separate from the structural
parameters, in the third set of exhibits. These exhibits
also contain the Squared Multiple Correlations (SMCs)
obtained for each of the manifest variables.The fourth set of exhibits present the Maximum
Likelihood (ML) parameter estimates for the [primary]
"structural" relations and their level of [statistical]
significance. Unless noted otherwise, the first column in
this exhibit always contains the parameter estimates for an
overall hypothesis, followed by the results for an
individual subhypothesis and/or a special case of the
overall hypothesis.’®® The measures of overall goodness of
fit (e.g., Chi Square, GFI and RMR) are shown at the end of
each exhibit.’®* The latter quantities collectively indicate
133 An overall hypothesis is designated, for example, as H-1 and a subhypothesis as H-1.1. If a modified version of a hypothesis is reported, it is designated as H-1M or H-1.1M.
’®4 These quantities are defined and described in the next section.

216the degree of correspondence among the variance/covariance
structure inplied by the hypothesized relations and the one
actually observed among the manifest variables.
In the next section, a nontechnical overview of the
LISREL methodology is presented. This is followed by a
discussion on the assessment of fit with LISREL models. In
the final section the general criteria used in the
evaluation of the measurement properties are summarized.
The LISREL Methodoloov
The system of structural equations in a LISREL model
specify the hypotheses about the phenomenon under study in
terms of tentative cause and effect variables and various causal effects.135 Each equation in both the latent variable
model and the measurement model represents an inplied causal
link rather than an empirical association. Hence, the
structural parameters generally do not coincide with
coefficients of regression among observed variables
(Goldberger 1971,1973). In this regard, the structural
parameters represent relatively unmixed, invariant, and
autonomous features of the mechanisms that generate the
observed variables (JoresKc^ and Sorbom 1982).
135 The discussion of LISREL methodology described in this section, unless stated otherwise, are taken fromJoreskog and Sorbom (1982) and the User's Guide to LISREL. Versions V and VI. (Joreskog and Sorbom 1983).

217When all the observed and latent variables are
expressed as deviations from their mean values, the most
general LISREL model is defined as shown in Exhibit 27. In
this model, the elements in the vectors [n] and lé] are the
latent or unobservable variables. The rules of
correspondence among the unobserved variables and the
observed elements [i.e., y'=(y1,y2,......yp) andx'=(x1,x2, xq)] are given in a second set of
structural equations which are summarized in Exhibit 28.
When the observed variables are assumed or
demonstrated to have a multivariate normal distribution, the
information about these variables can be fully described by
the mean vector and the covariance matrix.’3® The parameter
estimation with LISREL, given the structural and measurement
models above, is one of fitting the covariance matrix
"implied" by the model, [2], to the one given by the samplecovariance matrix, [S]. More specifically, as Bent 1er and
Bonett (1980) noteIn covariance structure analysis a sample of multivariate data based on N subjects and [p+q] variables is summarized in the I(p+q)x(p+q)] sample covariance matrix, S, based on N-1 degrees of freedom. The elements [sij] of S are thevariances of the variables and their covariances.
It is hypothesized that the corresponding population covariance matrix, [2], with elements I oij] is generated by [t] true though unknown parameters that can be assembled in the [txl]
13® Hence, information about parameters provided by moments of higher order are ignored in LISREL analysis.

218
EXHIBIT 27
The Latent Variable Model In LISREL
n = Bn +rf +4
Where :n'=(n1,n2,...nm), is a random vector of latent endogenous
(dependent) variables,
f =(^1,f2,...^n), is a random vector of latent exogenous(independent) variables,
B =(mxm) is a matrix of coefficients, representingdirect causal effects among the n's,
r =(mxn) is a matrix of coefficients, representingdirect causal effects between the f's and n's,
C'=(41.C2,...Cm), is a random vector of residuals or errors- in equations.
With the assumptions:E(n) = 0,E(f) = 0,E(C) = 0,C uncorrelated with f , and (I-B) is nonsingular
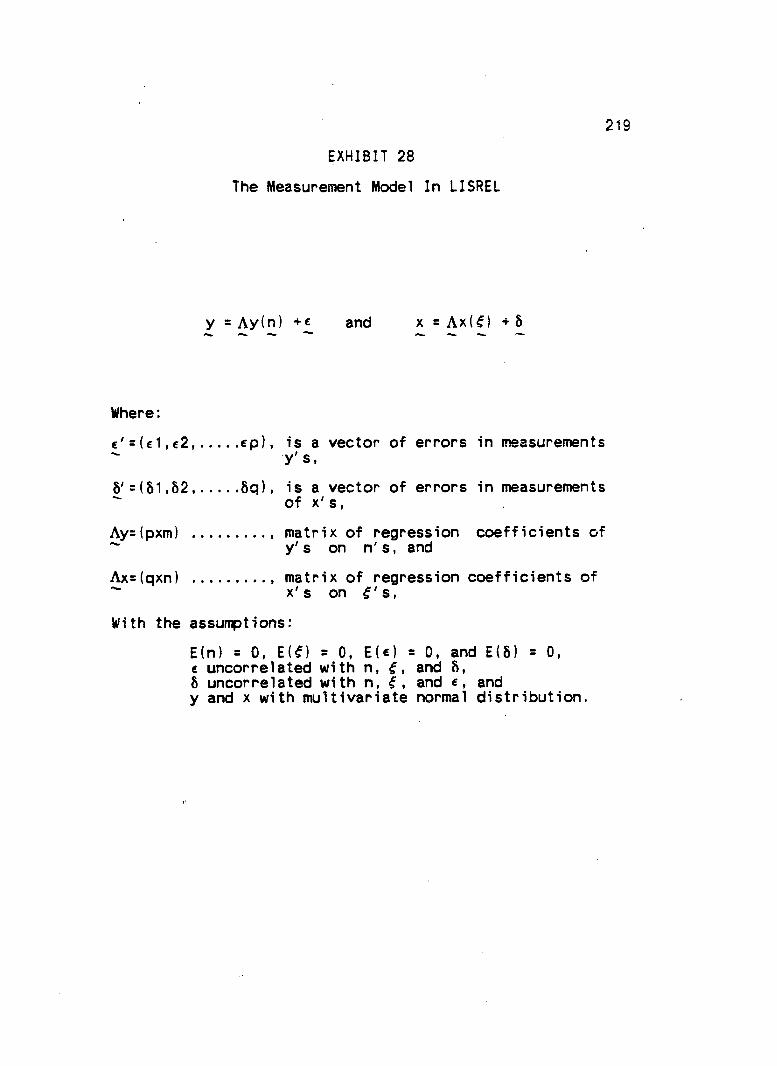
219EXHIBIT 28
The Measurement Model In LISREL
y = Ay(n) and x = Ax($) +Ô
Where:e'=(e1,e2 cp), is a vector of errors in measurements_y s,8'=(81,02..... 8q), is a vector of errors in measurements
of x's,Ays(pxm) ......... matrix of regression coefficients of
y's on n's, andAxs(qxn) ......... matrix of regression coefficients of
x's on f's.
With the assumptions:E(n) = 0, E(f) = 0, E(e) = 0, and E(8) = 0, e uncorrelated with n, and 8,8 uncorrelated with n, f , and c, and y and x with multivariate normal distribution.

220vector [B], so that each element of the covariance matrix is a function of the It] elements of IB) under a given model.
Thus, [ aij=fij*(B)] may be said to be the model for the covariance structure, where the function [fij] describes the particular structure under investigation that relates [t] parameters in IB] to I 0 ij] (notation adapted to that of Joreskogand Sorbom 1983, p.589).
In LISREL methodology, the Maximum Likelihood (ML) parameter
estimates in vector [B] are obtained by means of an
iterative procedure which minimizes the fitting function;
F = log |Z| + t r ( S 2 ’) - log |S| - (p+q),
by successively improving a given set of initial estimates
for al1.parameters.’3’ The fitting function, F, is regarded
as a function of the independent parameters in [B], which in
turn has as its elements, all the free and constrained
parameters in [Ay, Ax, B, F , $, Ÿ , Be, and Bd]. Here, [$,
'i', Be, and Bd] are the covariance matrices of K, C , e , andÔ] respectively. The outcome of, and the implications from,
this estimation procedure is summarized by Bent 1er and
Bonett (1980):
Assuming a theory to be correct, if the sample size N were arbitrarily large, IS] would converge to 12], and it would be obvious whether the sample
137 A description of the Initial Estimates (IE) end the Unweighted Least Squares (ULS) parameter estimates which Can also be obtained with LSREL VI is given in Joreskog and Sorbom (1982, p.405*407). Since we will be reporting only the ML estimates in statistical analyses, other parameter estimates are not discussed here.

221data matrix S correspond to a particular hypothesized structure. In data analysis, however, where 121 and 18] are not Known and where N is not very large, it is first necessary to estimate the parameters of the model, yielding [0-hat] and 12-hat], via I a ij=fij*(B-hat)].
The closeness of the model-based estimated covariance matrix, [2-hat], to [S] not only serves as a criterion to be optimized in estimating the parameters, but it [also] represents an index of the validity of the model itself. If [2-hat] is virtually identical element by element under the model to [S], the model [fij*(8)] that generates [2-hat] via [fij*(8-hat)] is a possible candidate for the structure underlying the population [2].
If even the best estimate of [2] under the model is very different from [S], it is unlikely that the hypothesized model accurately mirrors the process that generates the data, thus providing a basis for using sample data to reject a given hypothesized model (p.590).
Assessment Of Goodness-Of-Fit In LISREL Methodology
An important part in the application of the LISREL
methodology is the assessment of the "overall" fit of the
proposed relationships, and the detection of lack of fit of
a model implied in research hypotheses. The most recent
version of the LISREL program provides several "tools" for
this purpose. These measures are uniformly reported as part
of the arrow diagrams in the second set of exhibits. A
brief description of these quantities, as well as some of
the issues in their interpretation, are summarized below.
The Chi square with its associated degrees of
freedom is probably the most frequently used test statistic

222in the structural equations methodology. The statistic ,
which is a function of sample size N< and the closeness of
I2-hat] to IS], provides a probabilistic basis for
evaluating the overall goodness of fit of a model. In
standard LISREL applications, the Chi square test statistic
is defined as follows:
Chi square = (N-1) * F
With the degrees of freedom given by:
d.f = (1/2) * K * (K+1) - t
where :
IF] = is the minimum of the fitting function,
[k] = is the number of (p+q) observed variables, and
[t] = is the total number of independent (free) parameters
estimated in a given model.
The chi square statistic provides a test of the proposed
model, I <ri jsf i j*(B) ], against the general alternative
that the variables are simply correlated to an arbitrary
extent. In other words, the alternative model "proposes"
that I 0 ij=f.s.ij(0s)], where IBs] contains all Ip+q]
elements of 2- If chi square value is large compared with
the degrees of freedom, one concludes that the proposed

223model, Ifij*(6)], does not appropriately mirror the process
that generates the data in the population. If the statistic
is small compared with degrees of freedom, one concludes
that the model provides a "plausible" representation of the
system of influences among the variables in the p o p u l a t i o n .’38 Hence, the associated probability level of
Chi square can be interpreted as the probability of
obtaining a Chi square value greater than the one actually
obtained, given that the model is "correct."
Although the chi square test provides valuable
information about a "statistically false" model, its
dependency on the sample size mitigates the value of the
information obtained. As Bent 1er and Bonett (1980) note
The increase in ability to detect a false model with increasing sample size represents animportant aspect of statistical power, but in the context of most applications [e.g., LISREL], in which the exactly correct model is almost certainly unknowable, this effect of sample size is a mixed blessing.Since the chi square is a direct function ofsample size, the probability of rejecting any model increases as N increases, even when theresidual matrix [S-2] contains trivial discrepancies...
As a consequence, in very large samples virtually all models that one might consider would have to be rejected as statistically untenable... [On the other extreme], one's favorite model will stand
138 In other words, the structure implied by the model relations summarized in [2] are compared to the implicit set of relations in the actual covariance matrix, [S]. For a more detailed discussion of the logic of Chi square test in LISREL, see Bent 1er and Bonett (1980).

224the best chance of being accepted when tested against the data of small samples (p.591).
Furthermore, as Joreskog and Sorbom (1982) point out, the
Chi square is a valid test statistic only when:
1. The observed variables have a multivariate normal distribution,
2. The analysis is based on the sample covariance matrix, and
3. The sample size is fairly large (p.408).
All three assumptions, however, are seldom, if ever,
fulfilled in practice.With the growing applications of the LISREL
methodology in marketing and other disciplines, a number of
other problems associated with the Chi square statistic have
also been discussed. Among these are, for example.
1. The reversal of the role of researchhypothesis, and the consequent reduction in the "power" of the chi square teststatistic (Gentler and Bonett 1980, Fornell 1983),
2. The inverse relationship between the overall goodness of fit and the strength of associations within and across observed variables or indicators (Fornell andLarcker, 1981 a,b,1984, Fornell 1983), and
3. The trivial fit, indeterminacy, andimproper solutions in many LISRELapplications (Fornell 1983)
Collectively, these problems with the Chi square test
statistic make an assessment of the overall fit, based

225"only" on this measure, of limited value. Partly for these
reasons, with the most recent version of the LISREL program,
a number of other measures of overall fit have been
implemented.The two new measures of overall fit provided by
LISREL 6.3 are the Goodness of Fit Index (GFI) and the Root
Mean Square Residual (RMR). The Goodness of Fit Index for
the ML solutions is defined as follows:
GFI= 1A , 2
tr(2*’ S-I)
A _ , 2tr(2 S)
A
In this equation, 2 refers to the fitted or inplied variance
covariance matrix obtained from the hypothesized relations,
and S defines the actual covariance matrix. When adjusted
for the degrees of freedom, the GFI can be redefined as:
AGFIs 1- (k*(k+1)/2*d.f]»(1-GFI).
Both the GFI and AGFI are independent of the sample
size. These quantities can be interpreted as an overall
measure of the (relative) amount of variances and
covariances jointly accounted for by the model.
Unfortunately, however, the statistical distribution and

226other properties of either measure are generally unknown.
Furthermore, there are no theoretical standards against
which these measures can be compared. The experience of
this researcher with the LISREL analyses suggests that a GFI
at or exceeding .95, and a AGFI at or exceeding .90, are
reasonably high values which generally indicate a good
overall fit for a given model.
The second measure, RMR, is also free of the sample
size problem associated with the Chi square. Furthermore,
as Joreskog and Sorbom (1982) note, RMR "is relatively robust against departures from normality" (p.408). Root
mean residual, defined as:
RMR =
1/2, 2
2 2 2 (sij-oij) / k (k+1)
is a measure of the average of residuals which can be
interpreted only in relation to the elements in IS].’®® Root
mean square residual is most meaningful in comparing the fit
of two different models for the same data but it can also be
used to assess the goodness of fit of alternative models
139 Since RMR is a quantity which is always related to the magnitude of the actual correlations or covariances, there is no practical standard against which it can be compared.

227with different data.1*0
As with most new statistical methodologies, it seems
inevitable that the "rules" of acceptance or rejection of
test conditions come to be established through the
collective trials and errors of their users. In this
regard, LISREL is no exception. Predictably, certain rules of thumb concerning the "proper" application and evaluation
of LISREL methodology such as, the appropriate sample size,
the reliability level(s) in indicators, and probability
value associated with the Chi square statistic have been
reported in the literature (e.g., Joreskog and Sorbom
1982,1983, Boomsa 1982, Bagozzi 1983,1984, Fornell 1983,
Fornell and Larcker 1981a, Bent 1er and Bonett 1980, Bonett
1982).
Despite the problems associated with the Chi square
measure, for example, a p value of ^ 1.101 has become the
"magical" probability level in accepting the fit of a LISREL
model as a satisfactory solution (see, for example, Bagozzi
1976,1977,1980a,1982b, Aaker and Bagozzi 1979, Aaker et al
1980, Phillips 1981, Joreskog and Sorbom 1982,1983).
According to her analysis of the small sample properties of
LISREL, Boomsa (1982) has suggested a sample size of at
least 100 data points for making any substantive inferences
140 For example, alternative specifications of a model with a different set of variables as indicators, holding the basic structural relations the same.

228with LISREL. Bagozzi (1981), on the other hand, has argued
that "the (LISREL) approach is justifiable when the sample
size minus the number of parameters to be estimated is
greater than 50" (p.380).
Most of the problems in the evaluation of LISREL
models are clearly unresolved. As Bagozzi (1981) notes:
Some of these [issues] are statistical (e.g., sensitivity of chi square test to sample size, lack of satisfactory R2 analog, fallible standard errors of parameter estimates, unknown robustness of test procedures), others are philosophical (e.g., the meaning of causality, correspondence rules, and unobservables), and still others are methodological (e.g., assessment of construct validity, the design and conduct of research)(p.380).
Despite these issues, however, the LISREL modeling provides
a significant improvement over the more traditional
correlational analyses where the relations between
theoretical concepts are frequently ill defined and, by
design, the measurement errors are never accounted for
. (Bagozzi and Phillips 1982). In the construction and
evaluation of the LISREL models, and more specifically, in
the assessment of the goodness of fit of these models,
probably the most important point to remember is the need to
consider the various test conditions discussed above in an
integrated fashion, always keeping in mind the theoretical
rationale for the hypotheses which generate them. It is for
this reason, Joreskog and Sorbom (1983) have repeatedly
cautioned that

229the measures chi square, GFI and RMR are measures of the overall fit of the model to the data and do not express the quality of the model Judged by any other internal or external criteria. For example, it can happen that the overall fit of the model isvery good but with one or more of therelationships in the model very poorly determined, as judged by squared multiple correlations, or vice versa. Furthermore, if any of the overall measures indicate that the model does not fit the data well, it does not tell what is wrong with themodel or which part of the model is wrong (p.41).
Therefore, it is essential to remember that the results from
the LISREL methodology, and especially the goodness of fitof the models, should be assessed considering not only the
test statistics described above, but also the measurement
properties of the individual constructs.
Assessment Of Measurement Properties In LISREL Methodology
One of the major advantages in using structural
equations methodology lies with the stringent requirements
imposed on the researcher to explicate the numerous
assumptions ordinarily made in empirical analyses. Among
the most important of these assumptions are those involving
the measurement properties of the theoretical concepts
employed in research.
In social science research, it is still a common
practice to make the unrealistic assumption that measurement
errors are negligible, and therefore, can be completely
ignored in data analysis. This assumption is especially
prevalent in retailing performance studies.

230Implications of errorless measurement on parameter
estimation with regression type statistical analyses are
well known and are not repeated here (see, for example,
Goldberger 1964, Blalock 1964,1965,1968,1969a, 1979, Bagozzi
1980b,1984, Bagozzi and Phillips 1982, Namboodiri et al
1975). In the latter work, Namboodiri et al propose a
general strategy which provides an excellent explication of
the nature and scope of the issues involved. A brief review
of this research strategy is useful in describing several
features and statistical measures available in LISREL.In order to effectively deal with measurement
errors, Namboodiri, Carter and Blalock (1975) have suggested
a three step research strategy. According to the authors:
First, one must attempt to define one's theoretical variables as clearly as possible so that some sort of highly specific measurement error model can be constructed. This is usually the most difficult but also the most crucial step in the whole process. Here, one must be especially careful not to let the existence of a reasonably simple metric dictate a definition of a variable that is not intended.
Second step [involves] writing down an equation linking the "true" value to the measurement indicator... [given] a rigorous theoretical definition of the variable.
A final third step... [involves] the deductive task of extracting the implications of the measurement-error models for testing, and for estimating, the relevant parameters (p.536-8).
The overall progression of this thesis is illustrative of an
attempt at application of this prescriptive criteria. It

231
will be recalled, in Chapter 4 one of the aims of the
discussion was to define and describe the theoretical
variables of interest in this study. Similarly, in Chapter
5, the discussion centered around correspondence rules and
empirical definitions for these constructs. Collectively,
the contents of these chapters correspond to the first step
suggested by Namboodiri et al. The second step of the
research strategy proposed by the authors is described in a LISREL modeling framework in the present chapter. In this
regard. Exhibit 28 defines and describes how empirical definitions are linked to the unobserved, theoretical
notions used in this research. The third and final step
prescribed by the authors is a subject matter yet to be
addressed, and in part, forms the basis for the balance of
the discussion in this section.
Before and during the application of a structural
equations methodology to any substantive research question,
it is well advised that the measurement properties of the
key constructs used in research are carefully examined. As
Bagozzi (1983) notes "although it is true that the analysis
of covariance structures allows for the simultaneous assessment of measurement and theory, it is often meaningful
and useful to examine measurement models Independent of the
entire theoretical structure in which they are embedded"
(p.449). According to Bagozzi, at least four situations
might arise where one might want to do this:

232
[1] Within the context of a larger theoretical model, one might want to look at measurement models of constructs for diagnostic purposes. It would-be premature to stop at the rejection of a larger theoretical model, based on goodness of fit measures, without asking why the model failed to perform as predicted... Investigation of submodels or measurement models can help one discover flaws not readily visible in larger systems.
[2] For more exploratory studies, in pretests, or in the early stages of confirmatory studies, one can [also] examine measurement models as an aid in item selection, the assessment of reliability, and construct development.
[3] It is sometimes useful to investigate measurement models in construct validation contexts. Examination of convergent,discriminant, and concurrent validity can be accomplished with the use of measurement models.[4] An examination of measurement models might be done occasionally for pragmatic reasons. Some models may be so large with many measurements and many constructs that a basis is needed to form subindices (p.449-450).
In this regard, the information summarized in the variance
covariance structure and the correlation coefficients among
the observed variables provide a useful starting point.
Although it is well known that no measure of covariation, in
itself, implies "causation," the overall "patterns" of the
correlations or covariances provide important insights intothe measurement properties of the c o n s t r u c t s ' (e.g..
'4' In the context of the discussion here, it is worthwhile to note that the correspondence rules adopted in this research imply a "causal relation" among the latent and empirical variables.
'*2 The examination of the patterns of associations within and across the indicators of latent constructs has its

233Formel 1 and LarcKer 1981a,b, Bagozzi 1981, Bollen 1981,1983,
Curtis and Jackson 1962).
In structural equations methodology, when there is a
set of unobservable variables each measured with two or more
indicators, and further, when:
1. the latent variables are assumed and/or demonstrated to be unidimensional,
2. the causal correspondence rules are assumed and/or justified, (i.e., the reflective or effect indicators are present),
3. it is assumed and/or demonstrated that there is no systematic error in measurements, (i.e., the first point holds), and finally
4. there is no excessive random error in measurements,
then certain, a priori patterns of associations (e.g.,
correlations) are expected among the indicators. In order
to illustrate these patterns and to evaluate their implications for the measurement properties of the latent
constructs, consider the two construct model (with three
indicators for each construct) shown in Exhibit 29. Two
genesis and justification in the method of concomitant variation due to Mill (1959). According to this rule, two phenomena are said to be causally related, if they are found to covary in a regular way (Bagozzi 1979), Hence, the method of concomitant variation fundamentally rests on the notion that if two things are related by cause and effect, then, they must, by definition, be correlated.

234broad "logical" criteria can be specified with respect to
the hypothetical relations illustrated in this Exhibit.'*3
The first criterion, the rule of convergence in
measurement, describes the condition where indicators of a
given concept are highly correlated.'*^ More specifically,
for convergence in measurement to hold, the following
expectations need to be confirmed:
Measures of the same construct, [given that each of the conditions 1,2,3 and 4 above holds], should be highly intercorrelated among themselves, and be uniform in their overall pattern of intercorrelations (Bagozzi 1981, p.375).
In other words, convergence in measurement for construct-B
requires that all the elements in the first "measurement"
triangle [i.e., ry2y1, ry3y1, ry3y2] be large in magnitude,
and of approximately the same value (see, Exhibit 29).
Similarly, the elements in the second measurement trianglefor construct-A, [i.e., rx2x1, rx3x1, rx3x2], should also be
high and of about the same value. Hence, according to
Feme 11 and Larcker (1981a):As these correlations become larger (smaller), the convergent validity or reliability of the associated constructs [e.g., A and B in the example] becomes higher (lower) (p.41).
'*3 Unless otherwise stated, the discussion and narrativehere is adopted from Bagozzi (1981) and Fornell andLarcker (1981a). Convergence in measurement anddifferentiation in constructs are terms originally used by Bagozzi.
'** Assuming reflective or effect indicator mode incorrespondence rules.

235EXHIBIT 29
A Hypothetical Model For The Assessment Of MeasurementProperties
^ CONCEPT-A ^ COHCEPT-B
^2 j ^ 3 ^ J ^2 j ^ 3 ^
Lj ÜÉJ GDCIDl OÎ Î t t t t
E2 E3
y, y, f , *1y, 1.000y. 1.000y. ffp} 1.000
1.0001.000*a •lf\ ^•J.l
1.000

236Although the criteria for convergence in measurement
is similar to Canpbell and Fiske's (1959) notion of
convergent validity, it differs from it in one important
respect (Bagozzi 1981). Convergent validity represents the
degree to which two or more attempts to measure the same
concept, through maximally different methods or test
conditions, agree. Hence, as it was originally conceived, convergent validity is designed as a test condition where a
single measure of a construct (i.e., a trait) is obtained
through different methods. The test of convergence in
measurement, however, primarily applies to cases where the
same method is used more than once to obtain multiple
indicators of a given construct.'*® Therefore, when
convergence in measurement is generalized to instances where
multiple methods are used to obtain multiple indicators with each method, then convergent validity becomes a special case
of the rule of convergence in measurement. As Bagozzi
(1981) notesIt is more difficult to establish convergence by using multiple procedures than by using multiple applications of the same procedure, because method variation in the former tends to produce correlations differing in value (p.376).
Hence, in the context of structural equations methodology
with multiple indicators, convergent validity can best be
viewed as a special case of convergence in measurement.
i<5 Note that this is not a test-retest measurement but alternative measurements of a given concept.

237where with the former one can distinguish trait from methods
variation, while with the latter this is not possible.
The second "logical" criteria that can be specified
with respect to the model of Exhibit 29 is termed the rule
of differentiation in constructs. According to this
criterion, the following patterns of associations (e.g.,
correlations) are expected: ’The cross-construct correlations among [empirical] measures of causally related [latent] variables should be highly intercorrelated but shouldcorrelate at a lower level than that of the wi thin-construct correlations. Further, thepattern of correlations thus obtained should be uniform [in magnitude] (Bagozzi 1981, p.376).
According to this rule, therefore, the model relations
depicted in Exhibit 29 require the following desiderata:
1. All the elements in the theory rectangle[i.e., rxiyj correlations] should be highand statistically significant,
2. The elements [rxiyj] should be smaller inmagnitude than elements in the measurement triangles [i.e., ryiyj and rxixj], and
3. The values of [rxiyj] should be uniform inmagnitude (where i = 1,2,3; j=1,2,3, and i t.J ) '
A third criteria which is termed criterion related or concurrent validity can be obtained by a rewording of the rule of differentiation. According to Bagozzi (1981) this rule would read as follows:
The cross-construct correlations among measures of constructs hypothesized to be related empirically should be correlated but at a lower level than the wi thin-construct correlations. In addition, the pattern of cross-correlations should be uniform (p.376).

238If one or more of these requirements are violated then the
irrplication is either (a) one or more of the initial conditions [i.e., unidimensionality, correspondence rules,
systematic and/or excessive random error in measurements]
are at some variance with the data at hand; or (b) no causal
relation exits between the concepts in question.
The rule of differentiation in constructs is also
similar to Campbell and Fiske's (1959) idea of discriminant validity. However, it differs from it in the sense that
different measurement procedures are not required, and it is
more general than discriminant validity in the sense that it
entails the latter within the context of structural equation
models. Contrary to the rule of convergence, however, it is
easier to achieve discrimination with multiple procedures
than with multiple applications of the same procedure. This is, in part, a consequence of the methods variation inherent
in multiple procedures (Bagozzi 1981, p.377).In summary, if one were comparing measure validation
obtained through multiple procedure tests, with those
obtained through multiple applications of a single procedure
tests of validity:
1. The test of convergent validity would be a more stringent criterion for demonstrating convergence than the rule of convergence in measurements, but
2. The rule of differentiation in constructs would be a more stringent criterion for showing discrimation than the test of discriminant validity.

239
These logical criteria are uniformly used in the
forthcoming sections in assessing the measurement properties
of the constructs. However, it is important to note that
the rules of convergence and differentiation have
implications not only for the measurement properties of the
constructs, but also for the overall goodness of fit of a
model. As Fornell and Larcker (1981a) noteThe criterion for a perfect fit [in LISRELmethodology] is structural consistency, whichimplies that all elements of [the theory rectangle] are identical.n? If structuralconsistency is violated, goodness of fit will suffer. For example, if the correlations in [the theory rectangle] differ widely, a two construct model... will not adequately summmarize the relationships between the original variables.This is because large divergence between [theseelements] suggests that there is more than one construct relationship between x and y variables.Thus, if the data are forced into an inappropriate two construct structure, a poor fit will result (p.42).
Hence, in LISREL methodology, the assesment of goodness of
fit of the model and the assesment of the measurement
properties of the construct are closely intertwined. As
Joreskog and Sorbom (1982) suggest, in assessing the results
from LISREL analyses, it is important to pay careful
attention to all of the following quantities:
1. Parameter estimates.
2. Standard errors (with ML only).
147 Structural Consistency, in this regard, is the limiting case of the rule of differentiation in constructs.

2403. Squared multiple correlations.
4. Coefficients of determination.
5. Correlations of parameter estimates (with ML only) (p.407).
An unreasonable value for any of these quantities typically
indicates that the model is fundamentally wrong and/or is
misspecified to a degree that the actual covariance
structure cannot account for the hypothesized relationships.
Two of these quantities, the squared multiple
correlations (SMC), and the coefficients of determination
(COD), under certain conditions, can also be used as
measures of reliability. The SMC for the ith observed
variable, defined as:
I 1 - Bii/sii ],
where :
[Bii] : is the error variance, and
[sii] : is the variance of the ith observed variable,
is the theoretical formulation of the reliability for a
single measure (Peter 1979, Fornell and Larcker 1981a).
Hence, when the constructs are assumed to be unidimensional
the SMC gives an indication of the amount of error present
in each of the observed variables’*® (Fornell and Oded
’*® It is useful to note that in a standardized LISREL

241Gur-Arie 1983).
Similarly, the coefficient of determination (COD),
def i ned as :
[ 1 - |B|/|S| ],
where:
[|0|] : is the determinant of the error variance-covariance
matrix, and
I|Sl] : is the determinant of the covariance matrix of the
observed variables,
can also be used as an "overall" measure of reliability,
considering all of the manifest variables collectively. To
reiterate, these quantities (i.e., SMC and COD) are
"measures [which] show how well the observed variables
serve, separately [SMC] and jointly [COD], as measurement
instruments for the latent variables" (Joreskog and Sorbom,
p.407).
A minimum criterion for reliability in most
applications of LISREL methodology is that trait variance
exceed error variance. According to this criterion, each of
the observed variables must have at least 50 percent
variance shared with the associated construct. Hence, an
solution, square root of the regression coefficients in Ay and Ax are equal to SMC's for the corresponding observed variables.

242SMC equal to or greater than 50 percent is generally
considered to be of sufficient magnitude in most LISREL
applications to warrant further analyses (Fornell and
Larcker 1981a, Bagozzi 1983, Fornell and Oded Gur-Arie
1983). This rule also applies for all the variables
considered collectively, (i.e., the COD measure).
Finally, two other quantities provided in LISREL
VI.3 can be used as pseudo-R2 measures. The first measure,
the squared multiple correlations for structural equations
(SMC-SE) is defined as:
I 1 - Van (4i)/Var (ni) ],
where the subscript refers to the structural equation, [i],
which links a set of latent constructs. The second measure,
total coefficient of determination (TCD), for all structural
equations, is similarly defined as:
I 1 - l^|/|Cov (n )! ],
where :
[ iSkl ] : is the determinant of the covariance matrix
These two measures provide an assessment of the variance
accounted for by each structural equation (SMC-SE) and the
set of all equations collectively (TCD). However, since
there is no statistical test associated with either of the

243measures, they can be used only as a "qualitative" tool.
These measures, along with other quantities provided by
LISREL may be especially useful in comparing alternative
specifications of .the same set of variables.Exhibit 30 summarizes all of the statistical
measures and other qualitative criteria reviewed in this
section. In the next sections, these measures are uniformly
presented for each hypothesis in sets of four exhibits.
Since no specific reference will be made to substantive
interpretations of these measures, the reader should refer
to this section for clarification and/or justification for
the conclusions drawn from the statistical analyses.
The empirical definitions of all the manifest
variables which were presented in Chapter 5 are repeated in
Exhibit 31 in order to facilitate references to the
measurements of theoretical constructs in the next sections.

244EXHIBIT 30
Summary Of Statistical Measures In Assessing Results FromStatistical Analyses
CRITERIA FOR ASSESSING
Measurement Properties; Summarized in:
Rule of Convergence Rule of Differentiation Coefficients of Determination Standardized Regresssion. Coeff. Maximum Likelihood Estimates Squared Multiple Correlations
FirstFirstFirstSecondThirdThird
Exhibi ts Exhibi ts Exhibi ts Exhibi ts Exhibi ts Exhibi ts
B. Overall Goodness of Fit
Chi Square Fourth ExhibitsGoodness of Fit Index Fourth ExhibitsAdjusted Goodness of Fit Index Fourth ExhibitsRoot Mean Square Residual Fourth Exhibits
C. Hypothesized Stuctural Relations
Maximum Likelihood Estimates Fourth ExhibitsStandardized Parameter Estimates Second ExhibitsStandard Errors Fourth ExhibitsT-values Third ExhibitsSquared Multiple Correlations for
Structural Equations Fourth ExhibitsTotal Coefficient of Determination
for all Structural Equations Fourth Exhibits

EXHIBIT 31Operationalizations Of The Latent Variables
245
Latent Constructs
1. Productivity
Mnemonic Empirical Definitions
2. Profitability
3. Managerial Effectiveness
4. Managerial Expertness
5. Marketing Effectiveness
NSTSA Sales per square footof selling space
NSTIN Sales per dollar ofaverage inventory
NSTFE Sales per full-timeequivalent employee
NPBT Net profit before taxas a percent of sales
ROCA Contribution marginreturn on controllable assets
MGREFF 7-Likert scale itemsfrom SOME-A
MGRSKL 7-Likert scale itemsfrom SOME-A
MGRACH 5-Likert scale itemsfrom SOME-A
MGRSAT 8-Semantic Scalefrom SOME-A
MGRYRS Tenure (yrs) of managerMGRRTL Manager's (yrs) retail
exper i ence
LOCAT 2-Semantic scale itemsfrom CA-5
SERVC 5-Semantic scale itemsfrom CA-5
OFFER 7-Semantic scale itemsfrom CA-5
ATMOS 5-Semantic scale itemsfrom CA-5
SOME: Survey of Managerial Effectiveness CA : Competitive Audit Data Form
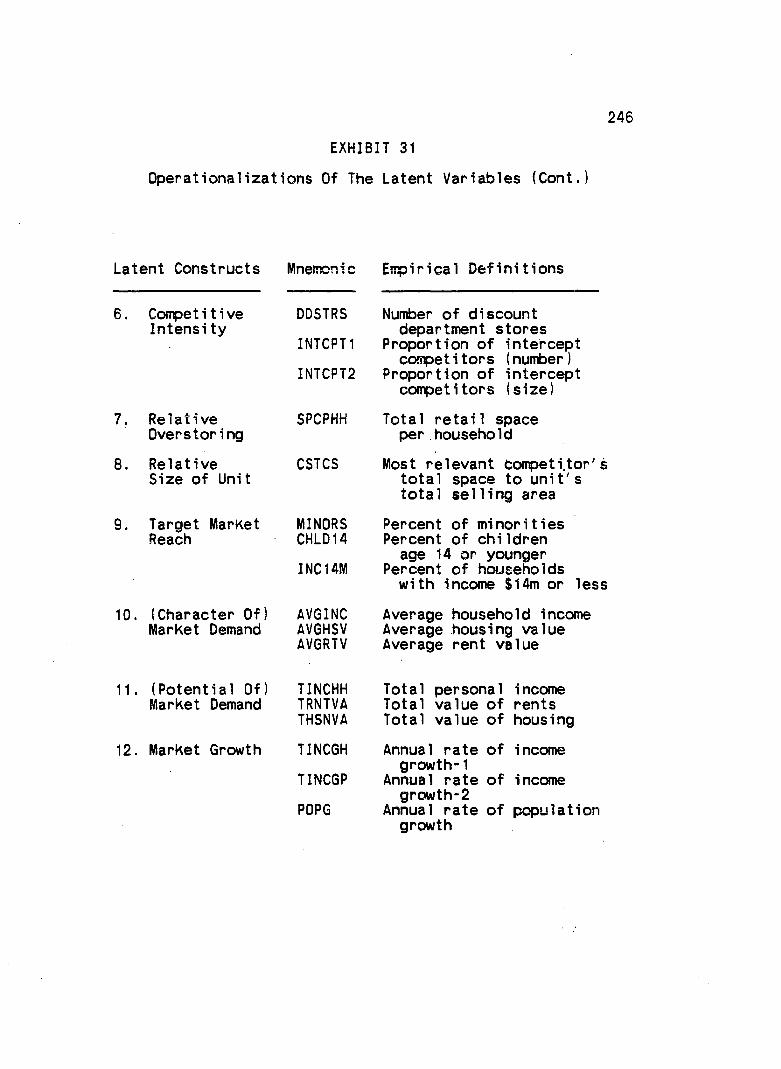
246EXHIBIT 31
Operationalizations Of The Latent Variables (Cent.)
Latent Constructs Mnemonic Empirical Definitions
6= Competitive Intensity
Relative Overstoring
Relative Size of Unit
9, Target MarKet Reach
10. (Character Of) MarKet Demand
DDSTRS Number of discountdepartment stores
INTCPT1 Proportion of interceptcompetitors (number)
INTCPT2 Proportion of interceptcompetitors (size)
SPCPHH Total retail spaceper household
CSTCS Most relevant tonpeti.tor'stotal space to unit's total selling area
MINORS Percent of minoritiesCHLD14 Percent of children
age 14 or younger INCI 4M Percent of households
with income $14m or less
AVGINC Average household incomeAVGHSV Average housing valueAVGRTV Average rent value
11. (Potential Of! Market Demand
12. Market Growth
TINCHH Total personal incomeTRNTVA Total value of rentsTHSNVA Total value of housing
TINCGH Annual rate of incomegrowth-1
TINCGP Annual rate of incomegrowth-2
POPG Annual rate of populationgrowth
247
Results from Statistical Tests Of Nonobservationa1 ResearchHypotheses
It is well known that in many LISREL applications,
it is almost always possible to find a subset of
measurements or relationships that yield a satisfactory fit
to data (Bagozzi 1883). For example, as Fornell (1983)
notesOne way to [get a "better" LISREL model] is to make the matter of fit trivial by increasing the rank of the solution, that is, by reducing the var i ab1es- to-factor ratio (p.445).
This can easily be accomplished, for example, by deleting
certain indicators from the measurement m o d e l o r by
allowing some of the measurement residuals to be
correlated.’®® In order to avoid some of the pitfalls in
post hoc model modification, in this study several general
rules are followed.First, given the sample size sensitivity of several
quantities in LISREL (e.g., Chi square, critical ratios),
the statistical results reported in the following sections
’♦9 The limiting case with this approach is the standard econometric applications of two or more stage simultaneous equations. If such models are properly specified, they are almost always just identified with zero degrees of freedom (i.e., the covariance structure is perfectly reproduced by model relations).
ISO Note that this is equivalent to introducing an additional "factor" or "systemic influence" to account for the variation in the observed variable(s).

248are uniformly based on a sample of 211 stores. Hence, all
cases with one or more missing values were eliminated from
statistical analyses.
Second, with few exceptions, the findings reported
from LISREL analyses are based on "all" the available
indicators of a given concept. This is done in order to
minimize the selection biases, i.e., choosing only a subset
of indicators or relations which may provide the best
overall fit. As Bagozzi (1983) suggests, "the best practice
within a single study is to always present findings based on
all measurements," (p.450).Third, in most cases correlated measurement
residuals are avoided in the LISREL analyses. Although
correlated measurement errors are "justifiable" under certain conditions,’®’ they "are fall-back options nearly
always detracting from the theoretical elegance and
empirical interpretabi1ity of a study" (Bagozzi 1983,
p.450).Finally, although all LISREL runs were performed
using both the correlation and the covariance matrices, only
the results from the analysis of correlation matrices are
’5’ Bagozzi (1983) notes "correlated residuals should not be used in a model unless (1) It is warranted on theoretical or methodological grounds, or (2) It does not significantly alter the structural parameter estimates, [and] (3) It does not significantly alter the measurement parameter estimates" (p.450).

249r e p o r t e d .’®2 This is partly due to the arbitrary units of
measurement in the observed variables, and partly because of
easier interpretabi1ity of the results from LISREL analyses.
In general, the choice of the analyses matrix does not alter
the conclusions reported in this study.
The Relations Between Elements Of Market Demand And Su d d 1v
The Results For Hvpothesis-1.
In Hypothesis-1, the degree of overstoring is
posited to be a positive function of character (H-1.1),
potential (H-1.2), and growth in market demand (H-1.3).
Here, the three demand elements are the exogenous latent
variables operationalized in nine indicators (x1-x9).
Overstoring is the endogenous latent variable measured by
one indicator (y1). The product-mcxnent correlations among
the manifest variables are given in Exhibit 32. The
hypothesized relationships are summarized in a path analytic
schemata in Exhibit 33.
In examining the correlations among the indicators,
it appears that all three exogenous concepts have a high
degree of convergence in measurement. In Exhibit 32, all
’52 However, it should be noted that analysis of correlation matrices in LISREL methodology have an effect on the final solution. Specifically, the estimates of standard errors obtained on the basis of correlation matrix rather than the covariance matrix are generally downward biased, inflating the critical ratios (Boomsa 1982, Fornell 1983).

EXHIBIT 32
Correlation Matrix For Hypothesis-1
250
SPCPHH AVGINC AVGHSV AVGRTVSPCPHH (yl) 1.000AVGINC (x1) 0.275* 1.000AVGHSV (x2) 0.231** 0.777* 1.000AVGRTV (x3) 0.240* 0.868* 0.777* 1.000TINCHH (x4) -0.382* 0.164* 0.313* 0.310*THSNVA (x5) -0.320* 0.288* • 0.540* 0.425*TRNTVA (x6) -0.318* 0.155** 0.369* 0.272*TINCGP (x7) 0.346* 0.529* 0.277* 0.519*TINCGH (x8) 0.370* 0.632* 0.381* 0.560*POPG (x9) 0.387* 0.707* 0.506* 0.654*
TINCHH THSNVA TRNTVATINCHH 1.000 -------THSNVA 0.909* 1.000TRNTVA 0.881* 0.886* 1.000TINCGP -0.066ns -0.084ns -0.166**TINCGH -0.164** -0.135** -0.234*POPG -0.148** -0.049ns -0.215*
TINCGP TINCGH POPGTINCGP 1.000TINCGH 0.940* 1.000POPG 0.869* 0.938* 1.000
* p < .01** p < .05*** p < .10ns Not Significant
TCOD (y Variables) TCOD (x Variables) 1.000

251three "measurement triangles" contain high and uniform
correlations. However, the differentiation in constructs
between character, •potential and growth of demand are fairly
low. This is especially evident in the theory rectangle for
character and growth in demand. Here, some of the
correlations "across" indicators are as high as those found in the respective measurement triangles. In summary,
although there is a high degree of reliability in measuring
the exogenous constructs, the discrimination or
differentiation among the same is questionable.’®®
Exhibit 33 provides a causal schemata summarizing
the proposed relationships in H-1. Maximum likelihood
parameter estimates for the structural links are given in
Exhibits 34 and 35. The standardized parameter estimates
are shown on the path schemata.Of the three subhypotheses, demand character (H-1.1)
and growth (H-1.3) are found to have a positive influence on
overstoring. Both of these parameter estimates are in the
direction predicted and are statistically significant. For
a third subhypothesis, the influence of demand potential on
overstoring (H-1.2), the parameter estimate is also
significant. However, here the direction of influence is
opposite to the one predicted in the research hypothesis
(see Exhibit 35).
153 Note also the SMCs in the last column of Exhibit 34 as well as the standardized estimates on Exhibit 33.

252EXHIBIT 33
Model Specification And Standardized Estimates ForHypothesis-1
J = { !(3 "4 x3 I
I
6a
69 - E D
DEM. GSOOTHÇ3
)/.711
OVERSTORINGn El
.92
Not Shown Above : (t>i2 * «658 and $ 1 3 = •‘♦29

253EXHIBIT 34
ML Measurement Parameter Estimates For H y p o t h e s i s - 1
Estimate StandardParameter (ML) Error I-Va lue SMC
iyi 1.000* .000 0.0 1.000
1x1 .984 .040 24.85 .8541x2 .887 .047 19.02 .6941x3 1.000* .000 0.0 .8821x4 .983 .028 34.96 .897U 5 1.000* .000 0.0 .9311x6 .960 .031 30.51 .8541x7 .947 .024 39.17 .8891x8 1.000* .000 0.0 .9901x9 .921 .020 45.03 .888
tel 0.000* .000 0.0
tdl .146 .023 6.21td2 .306 .035 8.84td3 .118 .022 5.30td4 .103 .014 7.26tdS .069. .014 5.00tdS . 146 .017 8.46td7 .111 .012 9.56tdS .010* .000 0.0td9 .112 .012 9.59
* Fixed Parameter

254EXHIBIT 35
ML Structural Parameter Estimates For Hypothesis-1
H-1 H-1.1 H-1.2 H-1.3Estimate Estimate Estimate Estimate
Parameter* (S.E.) (S.E) (S.E) (S.E)
GA11 .456 .297(.104) (.074)
GA12 -.525 -.379(.077) (.069)
GA13 .027 .376(.090) (.065)
Phi 13 .407(.060)
Phi 12 .645(.079)
Psi .688 .923 .869 .860(.069) (.091) ( .085) (.084)
Goodness-Df-Fi tMeasures
.sp 2CHI-SQUARE: 336.56 1.02 5.98 9.72d.f. : 31 2 2 3p-Value : .000 .600 .050 .021
GFI ; .779 .998 .986 .978AGFI : .608 .988 .930 .926RMR : .105 .008 .015 .013SMC-SE : .289 .077 .131 .140TCODSE : .289 .077 .131 .140
(*) Note that a null entry in any row indicate that the corresponding parameter is a fixed (zero) element in the specification of that model.

255Note that in the overall test of Hypothesis-1 (i.e.,
when all the links are considered simultaneously), the
relationship between demand growth and overstoring is no
longer significant. Furthermore, compared to the parameter
estimates from the subhypotheses, the magnitude of
structural parameters are different for H-1. This situation
is similar to the case in OLS regression analysis with
correlated predictor variables. However, as opposed to
deleting the correlated (predictor) variables from the
regression equation, in LISREL analyses these associations
are incorporated into the specification of the model (i.e.,
phi 12 and phi 13).
Of the three subhypotheses, only H-1.1 indicates a
good overall fit (see lower half of Exhibit 35). For both
H-1.2 and H-1.3, Chi square test statistic is not
significant. However, the average of the residuals (RMR) in
both cases are fairly low, indicating a moderate fit to
data.For the overall hypothesis (H-1), the Chi square
value is very large compared to degrees of freedom.
Furthermore, both GFI and RMR indicate a poor overall fit to
data (see Exhibit 35).

256The Results For Hvpothesis-2.
In Hypothesis-2, conpetitive intensity is posited to
be an inverse function of demand potential (H-2.1) and a
positive function of relative overstoring (H-2.2). In the
specification of the overall hypothesis (H-2), competitive
intensity and overstoring are the latent endogenous
variables, measured by four indicators (y1-y4). Demand
potential is the latent exogenous variable with three
indicators (x1-x3). The correlations among the observed
variables are given in Exhibit 36.
All of the correlations among the indicators of
competitive intensity are high, uniform and statistically significant, indicating high convergence in measurement.
The elements in the theory rectangles (i.e., correlations
across indicators) are also significantly lower than the within construct c o r r e l a t i o n s ^4 indicating high
differentiation among the constructs. However, some of the
correlations across indicators, especially those between the
demand potential and ccsipetitive intensity, exhibit wide
variations in magnitude. Furthermore, two of these
correlations are not statistically significant.^ss .
'54 "Within construct correlations" and elements in the "measurement triangle" , are the same quantities. Similarly, "correlation across indicators" and the "theory rectangle" also refer to the same quantities in the correlation matrices.
155 Note that the two nonsignificant correlations have DDSTRS variable in common. This pattern, coupled with

257Exhibit 37 summarizes the hypothesized relations in
a path analytic schemata. Note that, here the specification of the link between demand potential and overstoring is from
H-1. Exhibits 38 and 39 present the ML parameter estimates
for the measurement and latent variable models.
The structural parameter estimate for subhypothesis
H-2.1 (i.e., the link between demand potential and
competitive intensity) indicates that the direction of
influence is opposite to the one predicted in H-2. For the
second subhypothesis [H-2.2] (i.e., the relationship between
overstoring and conpetitive intensity), the structural
parameter estimate is in the direction predicted.
Furthermore, both of these parameters are statistically
significant. When the subhypotheses are considered
simultaneously (H-2), similar conclusions hold with respect
to both the direction of influence and the statistical
significance of the structural parameter estimates’®® (see
Exhibit 39).Of the three alternative model specifications, only
H-2.2 fits the data well. Both the overall hypothesis (H-2)
and the first subhypothesis (H-2.1) have relatively high
the SMC for DDSTRS (see Exhibit 38), suggest that competitive intensity may not be a unidimensional construct.
’®® Since the relationship between demand potential and overstoring were treated in H-1.2, the ML parameter estimates are not reported in Exhibit 39.

258EXHIBIT 36
Correlation Matrix For Hypothesis-2
SPCPHH DDSTRS INTCPT1 INTCPT2SPCPHH (yl ) 1.000DDSTRS (y2) 0.305* 1.000INTCPT1 (yS) 0.249* 0.780* 1.000INTCPT2 (y4) 0.318* 0.825* 0.868* 1.000TINCHH ( X l ) -0.382* 0.275* 0.377* 0.315*THSNVA (x2) -0.320* 0.194ns 0.325* 0.257*TRNTVA (x3) -0.318* 0.191ns 0.255* 0.197*
TINCHH THSNVA . TRNTVATINCHH 1.000THSNVA 0.909* 1.000TRNTVA 0.881* 0.886* 1.000
* P < .01** P < .05*** P < . 10ns Not Significant
TCOD (y Variables) TODD (x Variables) .964

259EXHIBIT 37
Model Specification And Standardized Estimates ForHypothesis-2
866
OVERSTORING \ 1.0
-.366DEH. POTENT. .505
503 678COMP. IKTEN
.86
El
CHU ED EDt t t£2 E3 E4

260EXHIBIT 38
ML Measurement Parameter Estimates For Hypothesis*2
ParameterEstimate
(ML)StandardError T-Value SMC
lyl 1.000* .000 0.0 1.000ly2 .902 .045 20.0 .743lyS .952 .041 23.0 .826ly4 1.000* .000 0.0 .912
1x1 1.000* .000 0.0 .9231x2 .988 .032 30.6 .9011x3 .959 .036 27.0 .849
tel 0.000* .000 0.0te2 .257 .031 8.4te3 .174 .026 6.8te4 .088 .022 3.9
tdl .077 .015 5.2td2 .099 .016 6.3td3 .151 .019 8.0
* Fixed parameter

261EXHIBIT 39
ML Structural Parameter Estimates For Hypothesis-2
ParameterH-2
Estimate (S.E.)
H-2.1Estimate(S.E)
H-2.2Estimate(S.E)
be21
gal 1
ga21
psi 1
psi 2
.482 (.062)
-.381 (.069)
.500 (.066)
.866(.085)
.618 (.070)
.313 (.069:
,821,091)
.309 (.0651
.827(.098)
Goodness-Of-Pi t Measures
.sp 2CHI-SQUARE d.f. p-Value
GFI ■AGFIRMRSMC-SE1 SMC-SE2 TCODSE
51.7012
.000
.936
.850
.035
.134
.322
.346
30.148
.000
.956
.884
.038
.098
.098
.292
.193
.992
.962
.016
.104
.104

262residuals and the Chi square value is large compared todegrees of freedom, indicating a poor overall fit to data.
The Relations Between Elements Of Market Demand. Su p p 1v And Store Performance
The Results For Hvpothesis-3.
In Hypothesis-3, the character (H-3.1), potential
(H-3.2), and growth in market demand (H-3.3) are posited to
have a direct and positive influence on retail store
performance. Here, the three demand variables are the
latent exogenous variables, and their operationalizations
are the same as in H-1 (x1-x9). Performance construct,
measured by four indicators (y1-y4), is the latent
endogenous variable. The product-moment correlations among
the manifest variables are given in Exhibit 40.
As it was noted in H-1, the indicators of demand
constructs are highly reliable measures, but provide low differentiation among these concepts. All three demand
elements, however, are well differentiated from the
performance construct. The SMCs for the performance
measures indicate that the reliability of the individual
indicators are relatively lower than they are for the
indicators of demand elements. However, within construct
correlations in the measurement triangle are generally high
and are of even magnitude. Furthermore, the TCOD for the

263y-variables suggests that, collectively, these indicators
are good overall measures of performance.
The specification of the model for the overall
hypothesis (H-3) is summarized in a path analytic schemata
in Exhibit 41. The ML parameter estimates for the
measurement and latent variable models are given in Exhibits
42 and 43. The standardized parameter estimates are shown
on the arrow schemata.
Contrary to the predictions of H-3, the direction of
influence for the structural parameter estimates are
negative in all three subhypotheses. However, of the three
subhypotheses, only the link from demand character to
performance (H-3.1) is statistically significant.’®’ When
the subhypotheses are considered simultaneously (H-3), the
signs of parameter estimates for H-3.2 and H-3.3 are
reversed, and the fit of the overall model significantly
deteriorates.
This situation generally implies a model
misspeci ficat ion. However, in this case other evidence
suggests that there may be no significant relationship
between demand potential and growth, and store performance.
For example, in Exhibit 40, note that the correlations
across indicators of performance and the two demand
157 Note that the link between demand growth and performance also approaches significance, with the parameterestimate almost twice as large as the associated standard error.

264EXHIBIT 40
Correlation Matrix For Hypothesis-3
NPBT NSTSA NSTFE
NPBT yl) 1.000NSTSA y2) 0.697* 1.000NSTFE y3) 0.611* 0.670* 1.000NSTIN y4) 0.662* 0.759* 0.673*AVGINC xl ) -0.279* -0.164* -0.110***AVGHSV x2) -0.261* -0.168* -0.164**AVGRTV x3) -0.333* -0.184* -0.141**TINCHH x4) -0.067ns -0.049ns -0.106nsTHSNVA x5) -0.074ns -0.052ns -0.109nsTRNTVA x6) -0.076ns -0.060ns -0.135**TINCGP x7) -0.188** -0.040ns -0.052nsTINCGH x8) -0.225* “0.111** -0.022nsPOPG x9) -0.217* -0.123** -0.027ns
AVGINC AVGHSV AVGRTV
AVGINC 1.000AVGHSV 0.777* 1.000AVGRTV 0.868* 0.777* 1.000TINCHH 0.164* 0.313* 0.310*THSNVA 0.288* 0.540* 0.425*TRNTVA 0.155** 0.369* 0.272*TINCGP 0.529* 0.277* 0.519*TINCGH 0.632* 0.381* 0.560*POPG 0.707* 0.506* 0.654*
TINCHH THSNVA TRNTVA
TINCHH 1.000THSNVA 0.909* 1.000TRNTVA 0.881* 0.886* 1.000TINCGP -0.066ns -0.084ns -0.166**TINCGH -0.164** -0.135** -0.234*POPG -0.148** -0.049ns -0.215*
* P < .01** p < .05 TCOD (y Variables)#** p < .10 TCOD (x Variables)ns Not Significant
NSTIN
1.000 -0.262* -0.251* -0.248* 0.034ns 0,015ns
-0.010ns -0.046ns -0.139** -0.178*
.9031 . 000
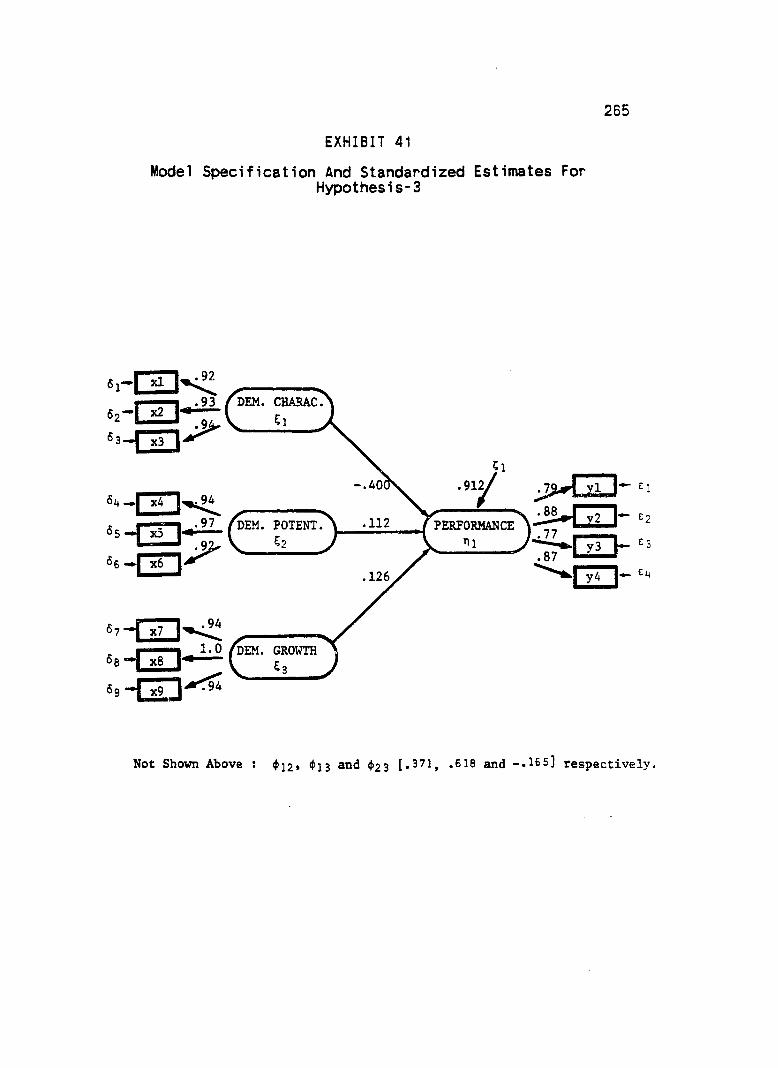
265EXHIBIT 41
Model Specification And Standardized Estimates ForHypothesis-3
r — — 1 , .93 f DEM.
3-n n
xA
- G O
DEM. POTENT52
.94« 7 -0 0 y« B - m * ^ rDEM. GROWTH 53
PERFORMANCE ni
" G O ^
E;
E4
Not Shown Above : 4ii2» *f*13 and ^>23 [.371, .618 and -.165] respectively.

EXHIBIT 42266
IL Measurement Parameter Estimates For Hypothesis-
Estimate StandardParameter (ML) Error T-Value SMC
lyl .901 .066 13.7 .620ly2 1.000* .000 0.0 .765lyS .880 .066 13.2 .593ly4 .989 .063 15.7 .7481x1 .982 .042 . 23.6 .8541x2 .883 .049 18.0 .6891x3 1.000* .000 0.0 .8851x4 .972 .032 30.2 .8841x5 1.000* .000 0.0 .9361x6 .954 .034 27.7 .8511x7 .946 .024 38.9 .8871x8 1.000* .000 0.0 .9901x9 .947 .025 39.2 .889
tel .380 .045 8.4te2 .235 .036 6.4te3 .407 .047 8.8te4 .252 .037 6.8
tdl .146 .023 6.2td2 .511 .035 8.9td3 .115 .022 5.2td4 .116 .017 6.9tdS .064 ,014 4.5td6 .149 .019 7.9td? .113 .012 9.6tdS .010* .000 0.0td9 .111 .012 9.5* Fixed parameter

267EXHIBIT 43
ML Structural Parameter Estimates For Hypothesis-3
H-3 H-3.1 H-3.2 H-3.3Estimate Estimate Estimate Estimate
Parameter (S.E.) (S.E) (S.E) (S.E)Gall -.372 -.263
(.116) (.069)Gal2 .101 -.054
(.086) (.068)Ga13 .111 -.125
(.099) ( .065)phi 12 .338
(.070)
Phi 13 .579(.079)
Phi23 -.159(.069) .
Psi .700 .707 .773 .759(.092) (.092) (.099) ( .097)
Goodness-Of-Fi tMeasures
.sp 2CHI-SQUARE: 450.70 25.72 11.36 46.10
d.f. : 60 13 13 13p-Value : .000 .019 .580 .000
GFI : .754 .968 .985 .944AGFI : .629 .930 .968 .878RMR : .070 .043 .034 .058SMC-SE : .088 .078 .003 .021TCODSE : .088 .078 .003 .021

268constructs contain a nuntfcer of nonsignificant elements, all
with large differences in their magnitudes. Also note that
the structural parameter estimates for the two subhypotheses
(H-3.2 and H-3.2) are lower than some of the correlations
among the manifest variables. This is generally an
indication that there is no significant relationship between
the corresponding latent variables and the data is forced
into an inappropriate structure.
Of the three subhypotheses, H-3.1 provides a
moderate fit to data while the model for H-3.2 fits the data very well. However, for both H-3.3 and the overall
hypothesis (H-3), all LISREL quantities in Exhibit 43
indicate a poor overall fit.
The Results For Hvpothesis-4.
In Hypothesis-4, store performance is posited to be
an inverse function of overstoring (H-4.1) and conpetitive
intensity (H-4.2). In the specification of the LISREL
model, competitive intensity and overstoring are the latent
endogenous variables with seven indicators (y1-y7).
Overstoring is the latent exogenous variable measured with
one indicator (xl). The correlations among the manifest
variables are summarized in Exhibit 44.
The measurement properties of these constructs were
discussed in the previous sections. To reiterate briefly,
both competitive intensity and performance have fairly high

269convergence in measurements and are well differentiated (see
Exhibit 44). However, some of the indicators of either
concept have low SMC's which suggests that the reliability
of individual measurements are not uniform (see Exhibit 45).
Exhibits 48 and 47 present the ML parameter
estimates for the measurement and latent variable model.
The path analytic schemata in Exhibit 45 summarize the
hypothesized relationships in H-4 and provide the
standardized estimates.The structural parameters for both subhypotheses
indicate that the influence of overstoring (H-4.1) and
conpetitive intensity (H-4.2) are in the direction
predicted. However, both parameter estimates are less than
twice the associated standard errors, and hence, are not
statistically significant; similar conclusions hold for the
overall hypothesis (H-4).
The two subhypotheses as well as the overall
hypothesis provide a good overall fit to data (see Exhibit
47). Although the Chi square measure for H-4.2 is not
significant, other measures of goodness of fit (GFI and RMR)
indicate that the model does reasonably well in reproducing
the correlations in Exhibit 44.

EXHIBIT 44
Correlation Matrix For Hypothesis-4
270
DDSTRSINTCPT1INTCPT2NPBTNSTSANSTFENSTINSPCPHH
(yl)(y2)(y3)(y4)iy5)(y6)(y?)(xl)
DDSTRS
1 . 000 0.780* 0.825*
-0.196* -0.171* -0.115** -0.231* 0.305*
INTCPT1
1 . 000 0 .888* •0.116** -0.119** ■0.091ns ■0.134** 0.249*
INTCPT2
1 . 00 0 -0.127** -0.083ns -0.060ns -0.101ns 0.318*
NPBTNSTSANSTFENSTINSPCPHH
NPBT
1 . 0 0 00.697*0.611*0.662*-0.029ns
NSTSA
1 . 0 0 00.670*0.759*-0.025ns
NSTFE
1 . 00 0 0.673* -0.003ns
NSTIN
1 . 0 0 0 -0.087ns
* P < .01** P < .05*** P < . 10ns Not Significant
TCOD (y Var iables) : .994TCOD (x Var iables) :

271EXHIBIT 45
Model Specification And Standardized Estimates ForH y p o t h e s i s -4
OVERSTORING
-.001
-.146
INTEN
.97s/ .75, i v4 K E4.8 ^ 1 y5 I-
PERFORMANCEt)2
i ^ n n -
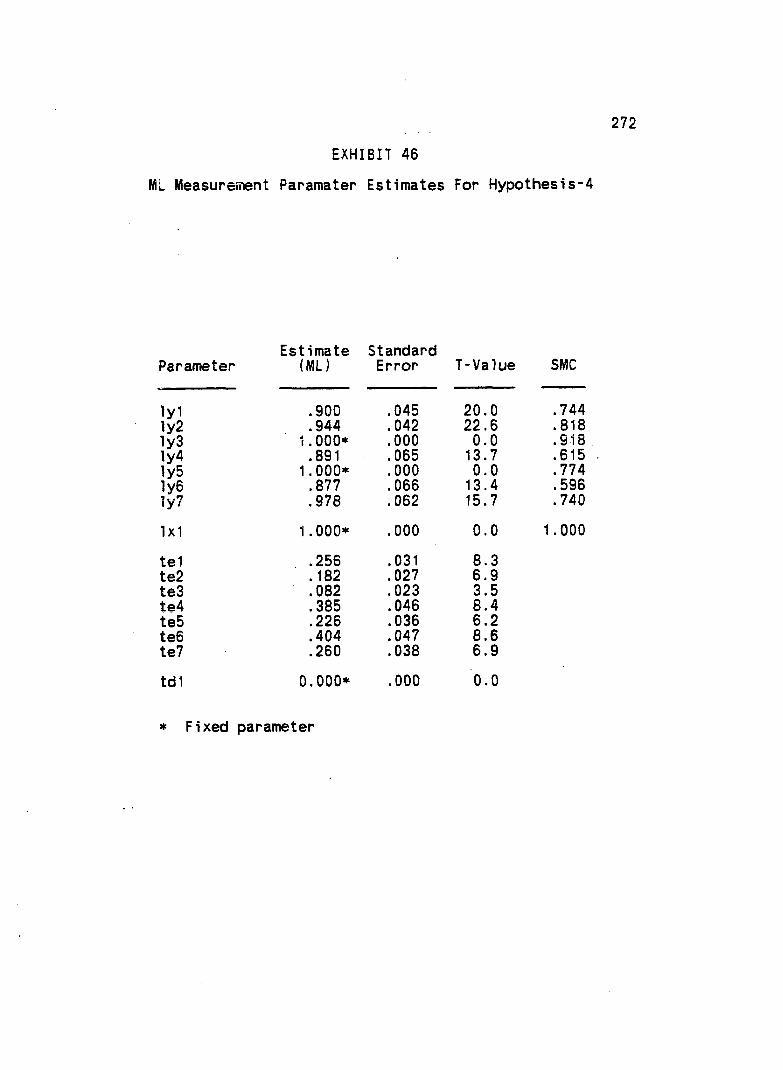
272EXHIBIT 46
ML Measurement Paramater Estimates For Hypothesis-4
ParameterEstimate
(ML)StandardError T-Value SMC
Iy1 .900 .045 20.0 .744ly2 .944 .042 22.6 .818lyS 1.000* .000 0.0 .918ly4 .891 .065 13.7 .615ly5 1.000* .000 0.0 .774lyS .877 .066 13.4 .596ly? .978 .062 15.7 .740
1x1 1.000* .000 0.0 1.000
tel .256 .031 8.3te2 .182 .027 6.9te3 .082 .023 3.5te4 .385 .046 8.4te5 .226 .036 6.2teS .404 .047 8.6te? .260 .038 6.9
tdl 0.000* .000 0.0
* Fixed parameter

273EXHIBIT 47
ML Structural Parameter Estimates For Hypothesis-4
Parameter
bë2Ï
gal 1
ga21
psi 1
psi 2
H-4 Estimate (S.E.)
“-.134(.072)
.308 ( .06.5)
- . 0 0 1(.067)
.823 (.090)
.758 ( .097)
H-4.1Estimate(S.E)
-.042(.064:
.773(.099:
H-4.2Estimate(S.E)
-.136(.068)
.758(.097:
Goodness-Measures
Of-Fit
.sp 2CHI-SQUARE
d.f.p-Value
GFIAGFIRMRSMC-SE1 SMC-SE2 TCODSE
25.64 18
. 108
.971
.943
.033
. 103
.022
.103
3.585
.611
.993
.980
.016
.002
.002
20.17 13.091.975.945.035.022
.022
274
The Relations Between Elements Of Market Demand. Supply And Uni t Conduct
The Results For Hvpothesis-5.
In Hypothesis-5, the two elements of market supply
are related to two elements of unit conduct. In the first
set of relationships, "managerial effectiveness" is posited
to be a direct, positive function of overstoring (H-5.1) and
competitive intensity (H-5.2). In the second set of
relationships, "marketing effectiveness" is hypothesized to
be a positive function of overstoring (H-5.3) and competitive intensity (H-5.4).
In the specification of the overall model (H-5),
managerial and marketing effectiveness, and competitive
intensity are the latent endogenous variables, collectively measured by eleven indicators (y1-y11). Overstoring, with
one indicator (xl), is the latent exogenous variable. The
product-moment correlations for the manifest variables are
given in Exhibit 48.
The measurement triangle for managerial
effectiveness indicate that the indicators of this concept
are highly correlated, statistically significant and fairly
uniform in magnitude, indicating high convergence in
measurement. Managerial effectiveness is also well
differentiated from other concepts.

275However, measurement properties of the marketing
effectiveness concept present several problems. First note
that correlations in the measurement triangle for this
concept are statistically significant. But the correlations
for LOCAT variable are nearly half the size of the other
correlations. Second, the pattern of correlations for LOCAT
also suggests that this measure has very little common
variance with the other three indicators. Finally, the SMC
for LOCAT 1.190] (see discussion of H-B) is significantly
lower than the minimum acceptable reliability for any one
measure (i.e., 50 percent trait variance). Hence, in the
LISREL analyses, LOCAT variable is deleted from the
indicator set for the marketing effectiveness concept.is*
Exhibit 49 summarizes the hypothesized relationships
in H-5, and provides the standardized parameter estimates.
Note that the link between overstoring and competitive
intensity are from H-2, while the link between managerial
and marketing effectiveness is from H-8. The ML parameter
estimates for the measurement and structural models are
given in Exhibits 50 and 51.
The structural parameter estimates for all four
subhypotheses have signs opposite to the ones predicted in
H-5. However, of the four subhypotheses, only H-5.2 (i.e..
158 For a third indicator of marketing effectiveness, ATMOS, squared multiple correlation is also low (.508), indicating high measurement error. However, thisvariable is retained in the statistical analyses.

EXHIBIT 48
Correlation Matrix For Hypothesis-5
276
DDSTRS INTCPT1 INTCPT2
DDSTRS (yl ) 1.000INTCPT1 (y2) 0.780* 1.000INTCPT2 (yS) 0.825* 0.868* 1.000MGREFF (y4) -0.102ns -0.007ns -0.030nsMGRSKL (yS) -0.112*** -0.070ns -0.097nsMGRACH (yS) -0.095ns -0.051ns -0.030nsMGRSAT (y?) -0.074ns -0.045ns -0.037nsSERVC (yS) -0.323* -0.319* -0.360*OFFER (yS) -0.383* -0.416* -0.434*ATMOS (y10) -0.185* -0.182* -0.223*LOCAT (y11) -0.070ns -0.159** -0.141**SPCPHH (xl) 0.305* . 0.249* 0.318*
MGREFF MGRSKL MGRACH MGRSATMGREFF 1.000MGRSKL 0.771* 1.000MGRACH 0.765* 0.659* 1.000MGRSAT 0.862* 0.736* 0.740* 1.000SERVC 0.078ns 0.066ns 0.073ns 0.068nsOFFER 0.093ns 0.067ns 0.063ns 0.088nsATMOS 0.158** 0.095ns 0.071ns 0.092nsLOCAT 0.042ns 0.032ns 0.048ns 0.074nsSPCPHH -0.099ns -0.101ns -0.085ns -0.054ns
SERVC OFFER ATMOS LOCAT
SERVC 1.000OFFER 0.729* 1.000ATMOS 0.643* 0.590* 1.000LOCAT ===> 0.395* 0.306* 0.372* 1.000 <===SPCPHH -0.108ns -0.078ns -0.070ns -0.048ns
* P < .01** P < .05*** P < .10ns Not Signi ficant
TCOD (y Variables! TCOD (x Variables!
.993
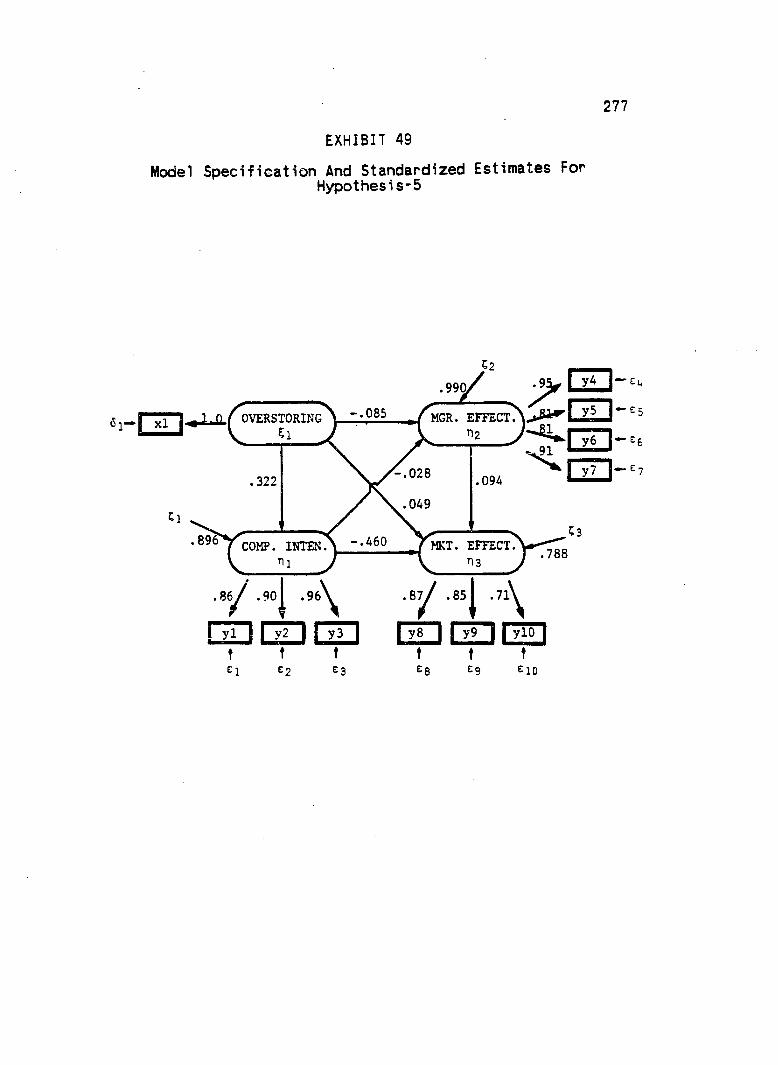
277EXHIBIT 49
Model Specification And Standardized Estimates ForHypothesis-5
l->j x l I « ' 0 ^; ^ r - ,
MGR. EFFECt N.>8*^I 1*"'^t12
5l
OVERSTORINGGl
-.028
MKT. EFFECTns
COMP. INTEN
I I-
: i r c z ] -
.86 .9o| .96^
un QD nnt t tE ] t2 E3
ED EDEIOt t tEb Eg Eio

278EXHIBIT 50
ML Measurement Paramater Estimates For Hypothesis-5
ParameterEstimate
(ML)StandardError T-Value SMC
1y1 .894 .045 20.1 .7401y2 .938 .041 22.7 .814lyS 1.000* .000 0.0 .9251y4 1.000* .000 0.0 .8981y5 .857 .050 17.2 .6601y6 .854 .050 17.1 .656ly7 .960 .042 22.8 .827ly8 1.000* .000 0.0 .758iy9 .971 .076 12.8 .714ly10 .819 .075 11.0 .508
1x1 1.000* .000 0.0 1.000
tel .260 .031 8.4te2 .186 .026 7.1te3 .075 .023 3.3te4 . 102 .022 4.6te5 .340 .038 . 9.0te6 .344 .038 9.1te7 .173 .025 6.9teB .242 .049 4.9te9 .286 .050 5.8telO .492 .057 8.6
tdl 0.000* .000 0.0
* Fixed parameter

279EXHIBIT 51
ML Structural Parameter Estimates For Hypothesis-5
H-5 H-5.1 H-5.2 H-5.3 H-5.4Estimate Estimate Estimate Estimate Estimate
Param. (S.E.) (S.E) (S.E) (S.E) (S.E)be21 - 027 -.055
( 078) (.072)beSI - 416 -.408
( 068) ( .065)be 32 086
( 064)
gall 310( 065)
ga21 - 081 -.095{ 071 ) ( .066)
gaSI 042 -.089( 062) • (.067)
psi 1 829( 090)
psi2 890 .786 .609( 098) (.107) (.086)
psi 3 597 .890 .918( 085) (.098) (.099)
Goodness -Of-FitMeasures
CHI-SQUARE 45.18 .23 16.50 1.96 13.01d.f. 39 2 13 5 8p-Value .229 .891 .223 .854 .112
GFI .962 .999 .978 .996 .979AGFI .936 .997 .954 .989 .945RMR .034 .006 .026 .011 .045SMC-SE 1 . 104 .012 .003 .009 .201SMC-SE2 .010SMC-SE3 .212TCODSE .112 .012 .003 .009 .201

280the relationship between competitive intensity and marketing
effectiveness) is statistically significant.
All. of the subhypotheses as well as the overall
hypothesis (H-5) fit the data very well. Average residuals
in all model specifications are relatively low, and in every
case the Chi square measure is statistically significant
(see Exhibit 51).
The Results For Hypothesis-6 .
In Hypothesis-6, market demand potential (H-6.1) and
growth in demand (H-6.2) are posited to have a direct,
positive influence on managerial effectiveness. Here, the
two demand variables are the latent exogenous concepts,
measured with six indicators (x1-x6). Managerial
effectiveness is the latent endogenous variable with four indicators (y1-y4). Exhibit 52 provides the correlations
among all the manifest variables.
Within construct correlations among the indicators
of each of the three latent variables indicate high
reliability in measurements. The correlations across these
indicators also indicate high differentiation among all
three constructs.^®®
159 Note that compared to the elements in the respective measurement triangles, the correlations "across" the indicators of demand potential and growth are very low. Hence, the problem of differentiation among demand constructs is essentially between the quality and potential of demand, and not among the two discussed above.

281The path analytic schemata in Exhibit 53 summarize
the hypothesized relationships in H-6 and provide the
standardized estimates. The ML parameter estimates for the
measurement and latent variable model are given in Exhibits
54 and 55.
The direction of influence for H-6.1 (i.e., the link
between demand potential and managerial effectiveness) is as
predicted in H-6. However, note that in both the
specification of the subhypotheses and the overall model
(H-6), this estimate is nearly equal to zero and, in either
case, it is not statistically significant.’®® For the
subhypothesis H-6.2 (i.e., the relationship between demand
growth and managerial effectiveness), the sign of the
structural parameter estimate is opposite to the one
hypothesized but it is not statistically significant.
Of the two submodels, the two construct relationship
of H-6.1 fits the data very well while the subhypothesis
H-6.2 provides a moderate fit. The average residuals for
the overall hypothesis (H-6) are large compared to the
correlations of Exhibit 52 and the Chi square measure is not
significant, indicating a poor overall fit to data.
160 Given the correlations in Exhibit 52, this is not surprising. Note that half of the correlations among the indicators of these concepts are negative, and the other half are positive. More importantly none of these correlations are statistically different from zero.

282EXHIBIT 52
Correlation Matrix For H y p o thesis-6
MGREFF MGRSKL MGRACH .MGRSAT
MGREFF (y1) 1.000MGRSKL (y2) 0.771* 1.000MGRACH (y3) 0.765* 0.659* 1.000MGRSAT (y4) 0.862* 0.736* 0.740* 1.000TINCHH (xl) 0.057ns 0.076ns 0.001ns -0.036nsTHSNVA (x2) 0.049ns 0.083ns 0.006ns -0.027nsTRNTVA (x3) -0.055ns -0.005ns -0.021ns -0.116nsTINCGP (x4) -0.030ns -0.026ns -0.024ns -0.039nsTINCGH (x5) -0.038ns -0.072ns -0.070ns -0.020nsPOPG (x6) -0.022ns -0.037ns -0.071ns -0.016ns
TINCHH THSNVA TRNTVA
TINCHH 1.000THSNVA 0.909* 1.000TRNTVA 0.881* 0.886* 1.000TINCGP -0.066ns -0.084ns -0.166**TINCGH -0.164** -0.135** -0.234*POPG -0.148** -0.049ns -0.215*
TINCGP TINCGH POPG
TINCGP 1.000TINCGH 0.940* 1.000POPG 0.869* 0.938* 1.000
* P < .01* * P < .05* * * P < .10ns Not Signi ficant
TCODTCOD I:
Variables)Variables)
,951,000

283EXHIBIT 53
Model Specification And Standardized Estimates ForHypothesis-6
POTENT.
<5 3— I x3
,94GROWTH2
-.046
\92
M. 9 ^ 1 yl 1 - 1
MGR. "ËmCT?\-<^’ ^
y4 I— El.

284EXHIBIT 54
NIL Measurement Parameter Estimates For Hypothesis-6
Estimate StandardParameter (ML) Error T-Value SMC
1y1 1.000* .000 0.0 .897ly2 .858 .050 17.2 .6601y3 .855 .050 17.1 .6561y4 .961 .042 22.8 .8281x1 .990 .028 34.8 .9031x2 1.000* .000 0.0 .9151x3 .966 .032 30.4 .8591x4 .949 .024 39.7 .8911x5 1.000* .000 0.0 .9901x6 .920 .020 45.8 .884
tel .103 .022 4.7te2 .340 .038 9.0te3 .344 .038 9.1te4 .172 .025 6.8
tdl .097 .014 6.8td2 .085 .015 5.6td3 .141 .017 8.3td4 .109 .011 9.5.td5 .101 .013 9.2tdS .116 .012 9.6
* Fixed Parameter

285EXHIBIT 55
ML Structural Parameter Estimates For Hypothesis-6
Parameter
H-6Estimate(S.E)
H-6.1Estimate(S.E)
H-6.2Estimate(S.E)
gal 1
gal 2
psi
.003 (.071)
-.043(.068)
.895 (.099)
.055 (.075)
.892 (.104)
-.042 (.068)
.895 (.099)
Goodness-Of-Fi t Measures
CHI-SQUAREd.f.p-Value
GFIAGFIRMRSMC-SETCODSE
112 . 6833
.000
.910
.850
.070
.002
.002
.654
.618
.995
.981
.020
.003
.003
37.2214
. 00 1
.956
.913
.014
.002
.002

286
The Results For Hypothesis-?.
In Hypothesis-?, managerial expertness, measured by
two indicators (x1,x2), is posited to have a direct,
positive influence on managerial effectiveness. As in
previous hypotheses tests, managerial effectiveness is
measured by four indicators (y1-y4). The correlations among
the manifest variables are given in Exhibit 56.
In the discussion of H-5, it was noted that
managerial effectiveness has a high degree of convergence in
measurement. The correlations across the indicators in
Exhibit 56 indicate that the two concepts are also well
differentiated. Since managerial expertness is measured
with only two indicators, an assessment of reliability can
not be made by examining the correlations. However, the
SMC's in Exhibit 58, as well as the standardized
(measurement) parameter estimates in Exhibit 5?, provide
single measure reliability for each indicator. The squared
multiple correlation for MGRYRS indicates that the reliability of this variable is lower than the minimum
acceptable level in most LISREL analyses.
Exhibit 59 provides the results of LISREL analyses
from two alternative model specifications. In H-?, the
MGRYRS variable is retained as an indicator of managerial
expertness, despite the large measurement error present in
this variable. In H-?M, MGRYRS is deleted from the analysis

287and the LISREL model is reestimated with a single indicator
(x2) of managerial expertness.
Exhibit 58 and 59 provide the ML parameter estimates
for the measurement and latent variable models for H-7. The
hypothesized relationship is summarized in a path analytic
schema in Exhibit 57.
The structural parameter estimates from either model
specification are nearly identical and are in the direction
predicted. In both H-7 and H-7M, the parameter estimate is
statistically significant. However, of the two alternative
model specifications, H-7M provides a better fit to data
(see Exhibit 59).
The Results For Hvoothesis-8.
In Hypothesis-8, marketing effectiveness is posited
to be a direct and positive function of managerial
effectiveness. Here, marketing effectiveness is the latent
endogenous variable, measured by four indicators (y1-y4).
Managerial effectiveness, also measured by four indicators
(x1-x4), is the latent exogenous variable. The correlations
among the eight manifest variables are given in Exhibit 60.
The measurement properties of the two constructs
were summarized in the discussion of H-5. It will be
recalled that one of the indicators of the marketing
effectiveness construct, LOCAT, was determined to be an
unreliable measure and deleted from the analyses of H-5.
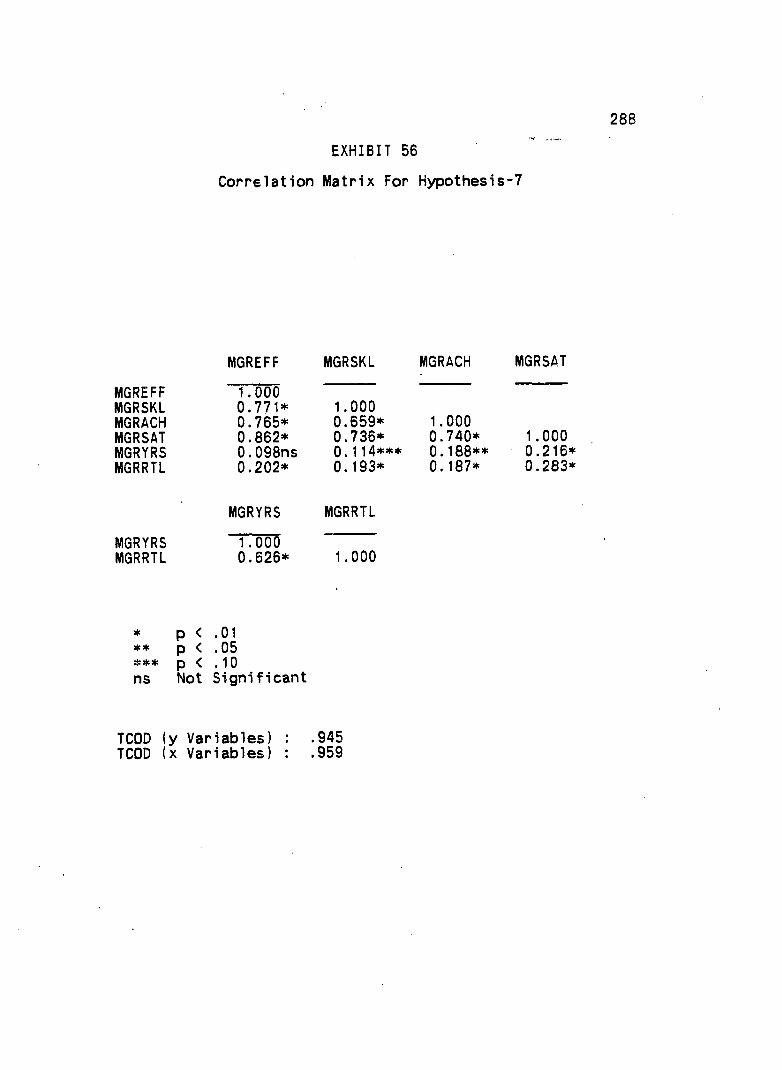
288EXHIBIT 56
Correlation Matrix For Hypothesis-7
MGREFFMGRSKLMGRACHMGRSATMGRYRSMGRRTL
MGREFF
1.000 0.771* 0.765* 0.862* 0.098ns 0 .202*
MGRSKL
1 . 0000.659*0.736*0.114*** 0.193*
MGRACH
1 . 0000.740*0.188** 0.187*
MGRSAT
1 . 0000.216*0.283*
MGRYRSMGRRTL
MGRYRS
1 . 0 0 00.626*
MGRRTL
1 . 000
* p < .01** p < .05*** p < .10ns Not Significant
TCOD (y Variables) : .945 TCOD (x Variables) : .959
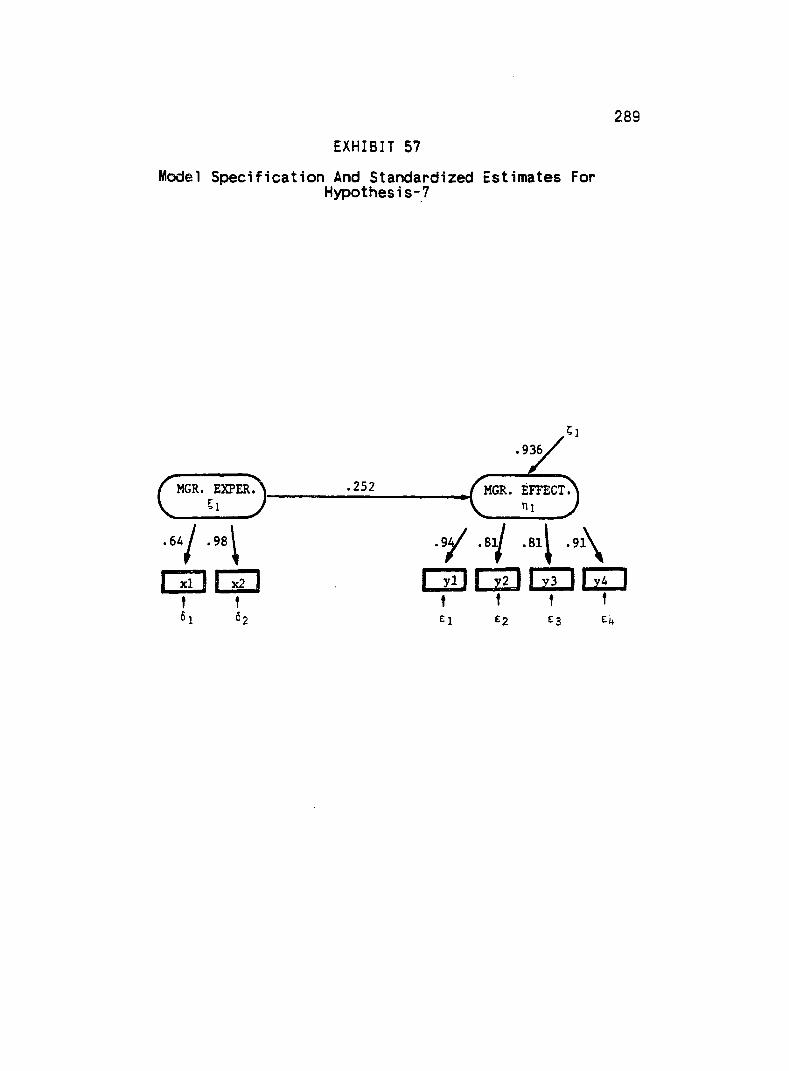
289EXHIBIT 57
Model Specification And Standardized Estimates ForH y p o t h e s i s - 7
.936,
(MGR. EXPER.'N__________ -252 MGR. EFFECtTN_ £ _ J \ -I J
. b h j .98^ . 9 ^ .81^ .8 l| .9 l\^
I xl i X x2 I I yl) 1 y2 j I y3 j I yV It t t t t
6l 62 Ej £.2 Eg E|+

290EXHIBIT 58
ML Measurement Paramater Estimates For Hypothesis-7
Estimate StandardParameter (ML) Error T-Value SMC
1y1 1.000* .000 0.0 .891ly2 .861 .050 17.1 .660ly3 . .858 .050 17.0 .656Iy4 .967 .042 22.9 .834
1x1 .654 .225 2.9 .409 <1x2 1.000* .000 0.0 .957 .
tel .109 .022 4.9te2 .340 .038 9.0te3 .344 .038 9.0te4 .166 .025 6.7
tdl .591 .148 4.0td2 .043 .319 0.1
* Fixed parameter

291EXHIBIT 59
ML Structural Parameter Estimates For Hypothesis-7
ParameterH-7
Estimate(S.E)
H-7.MEstimate(S.E)
gall
psi
.243(.104)
.835(.095)
.233(.065:.837
(.093:
Goodness-Of-Fi t Measures
CHI-SQUAREd.f.p-Value
GFIAGFIRMRSMC-SETCODSE
17.818
.023
.973
.930
.027
.064
.064
6.895
.229
.987
.962
.017
.061
.061

292Here, the LISREL analysis is conducted on two alternative
model specifications. In the first model (H-8), LOCAT
variable is retained as an indicator of marketing
effectiveness. In the second model, (H-8M), LOCAT is
deleted from the LISREL analysis. The standardized
estimates for the measurement and structural relations
obtained for H-8 are shown in Exhibit 61. ML parameter
estimates for the same parameters are given in Exhibits 62
and 63.The structural parameter estimates and the overall
goodness of fit of the two alternative models are nearly identical. In either specification, the parameter estimate
is in the direction predicted. However the path
coefficients for either model specification (H-8 and H-8N1)
are not statistically significant.The Chi square value for both models are small
compared to degrees of freedom. However, the average of the residuals are lower for H-8M, indicating a better overall
fit to data in H-8M (see Exhibit 63).
The Results For Hvoothesis-9.
In Hypothesis-9, a third variable, relative size of
unit, is added to the relations of H-8. Here, relative size
of unit is posited to have a direct and positive influence
on both the managerial (H-9.1) and marketing effectiveness

293EXHIBIT 60
Correlation Matrix For H ypothesis-8
SERVC OFFER ATMOS LOCAT
SERVCOFFERATMOSLOCATMGREFFMGRSKLMGRACHMGRSAT
(yl ) (y2) (yS) (y4) (xl ) (x2) (x3) (x4)
1.0000.729*0.643*0.395*0.078ns 0.066ns 0.073ns 0.068ns
1.0000.590*0.306*0.093ns 0.067ns 0.063ns 0.088ns
1.0000.372*0.158**0.095ns0.071ns0.092ns
1.000 0.042ns 0.032ns 0.048ns 0.074ns
MGREFF MGRSKL MGRACH MGRSAT
MGREFFMGRSKLMGRACHMGRSAT
1.0000.771*0.765*0.862*
1.0000.659*0.736*
1.0000.740* 1.000
* P < .01** P < .05*** P < .10ns Not Significant
TCOD (y Variables) : .877TCOD (x Variables) : .946

294EXHIBIT 61
Model Specification And Standardized Estimates ForHypothesis-8
yGi.987^ ^ y
^MGR. EFFECT^________ "113 , T . EFFECT?^
. 9 ^ .81^ .81^ .91 . 8 y ^ . 8 2 ^ .72^ .44
CZ][Z3GDGD QDCIDQDQDt t t t t t t t
El E2 £3 E4

295EXHIBIT 62
ML Measurement Paramater Estimates For Hypothesis-8
Estimate StandardParameter (ML) Error T-Value SMC
Iy1 1.000* .000 0.0 .800ly2 .904 .072 12.5 .655ly3 .814 .072 11.3 .5301y4 =s“> .487 .078 6.2 .190 <
1x1 1.000* .000 0.0 .8971x2 .858 .050 17.2 .6601x3 .855 .050 17.1 .6561x4 .961 .042 22.8 .828
tel .200 .049 4.1te2 .345 .051 6.8te3 .470 .056 8,4te4 ===> .810 .082 9.9
tdl .103 .022 4.6td2 .340 .038 9.0td3 .344 .038 9.1td4 .172 .025 6.8
* Fixed parameter

296EXHIBIT 63
ML Structural Parameter Estimates For Hypothesis-8
ParameterH-8
Estimate(S.E)
H-8.MEstimate(S.E)
gall
phi
.107(.071
.790(.099:
(106071:
.780
.099:
Goodness- Measures
Of-Fit
CHI-SQUAREd.f.p-Value
GFIAGFIRMRSMC-SETCODSE
15 .1619.712.983.968.021.013.013
9.1913
.759
.988
.974
.018
.013
.013
297(H- 9 . 2 ) . i G i In model specification, the latter two concepts
are the latent endogenous variables. The correlations among
the seven indicators of dependent constructs (y1-y7) and one
indicator of relative size (xl) are given in Exhibit 64,
The path analytic schemata in Exhibit 65 summarize the hypothesized relations. The ML parameter estimates for
the measurement and latent variable model are presented in
the Exhibits 66 and 67. Note that in Exhibit 67, two
alternative model specifications are shown for the overall
hypothesis. Here, H-9 is a less restrictive model where the relationship between managerial and marketing effectiveness are retained in LISREL a n a l y s e s . the second model
specification (H-9M) this link is fixed to zero, implying
that no relationship exists between the two endogenous
concepts.The structural parameter estimates for both of the
subhypotheses (H-9.1 . and H-9.2), as well as the two
alternative specifications of the overall model (H-9 and
H-9M), are nearly identical. All of the path coefficients
are also in the direction predicted and statistically
161 Note, however, the operationalization of the relative size is a reversed variable where the size of the competitor is compared to the focal retail unit. Hence, a structural parameter with a negative sign would be "confirming" the hypothesized relationship.
1G2 It will be recalled that the results from the previous analyses (H-8) indicated that this link is not statistically significant.
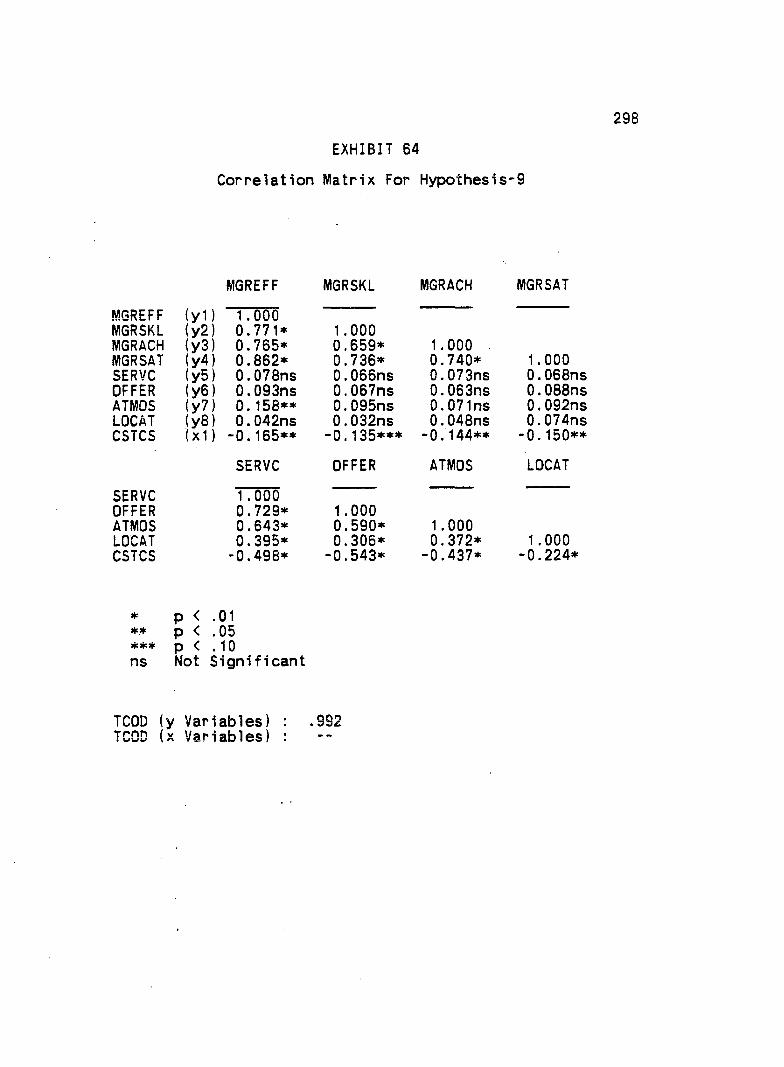
298EXHIBIT 64
Correlation Matrix For Hypothesis-9
MGREFF MGRSKL MGRACH MGRSAT
MGREFF (yl ) 1.000MGRSKL (y2) 0.771* 1.000MGRACH (y3) 0.765* 0.659* 1.000 .MGRSAT (y4) 0.862* 0.736* 0.740* 1.000SERVC (y5) 0.078ns 0.066ns 0.073ns 0.068nsOFFER (y6) 0.093ns 0.067ns 0.063ns 0.088nsATMOS (y7) 0.158** 0.095ns 0.071ns 0.092nsLOCAT (yO) 0.042ns 0.032ns 0.048ns 0.074nsCSTCS (xl) -0.165** -0.135*** -0.144** -0.150**
SERVC OFFER ATMOS LOCAT
SERVC 1.000OFFER 0.729* 1.000ATMOS 0.643* 0.590* 1.000LOCAT 0.395* 0.306* 0.372* 1.000CSTCS -0.498* -0.543* -0.437* -0.224*
* P < .01** P < .05*** P < .10ns Not Significant
TCOD (y Variables) : .992 TCOD (x Variables) :

299EXHIBIT 65
Model Specification And Standardized Estimates ForHypothesis-9
E 2 E g El *
LiiJ Liij GO.811
G
•95 / m g r . e f f e c t. .971
E D.632.012
MKT. EFFECT-.171E D— . 604
.72REL. SIZE
E5
E?

300EXHIBIT 66
ML Measurement Paramater Estimates For Hypothesis-9
ParameterEstimate
(ML)StandardError T-Value SMC
Iy1 1.000* .000 0.0 .8971y2 .858 .050 17.2 .6601y3 .855 .050 17.1 .656ly4 .961 .042 22.8 .8281y5 1.000* .000 0.0 .7481y6 .974 .073 13.3 .7101y7 .837 .074 11.3 .524
1x1 1.000* .000 0.0 1.000
tel . 103 .022 4.7te2 .340 .038 9.0te3 .344 .038 9.1te4 .172 .025 6.9te5 .252 .046 5.5te6 .290 .047 6.2te7 .476 .056 8.6
tdl 0.000* .000 0.0
* Fixed parameter ■

301EXHIBIT 67
ML Structural Parameter Estimates For Hypothesis-9
H-9 H-9.M H-9.1 H-9.2Estimate Estimate Estimate Estimate
Parameter (S.E) (S.E) (S.E.) (S.E.)
be21 .011(.058)
gall -.152 -.164 -.162(.066) (.067) (.066)
ga21 -.523 -.524 -.524(.057) (.056) (.056)
psil .871 .868 .871, (.096) (.102) (.096)
psi2 .473 .473 .473(.069) (.069) (.069)
Goodness-Of-Fi t Measures
CHI-SQUAR 12.42 10.16 .20 3.22d.f. 18 13 5 2p-Value .825 .681 .999 . 199
GFI .986 .987 1.000 .992AGFI .972 .972 .999 .962RMR .018 .020 .003 .016SMC-SE1 .029 .030 .029SMC-SE2 .368 .367 .367TCODSE .378 .380 .029 .367

302significant.
All four models fit the data very well. However,
note that although the "omission" of the relationship
between managerial and marketing effectiveness does not
alter the conclusions of LISREL analyses, the resulting goodness of fit measures indicate that H-9 specification
does a better job in reproducing the correlations in Exhibit
64.
The Results For Hvoothesis-IO.
In Hypothesis-10, the target market reach is posited
to have a direct and positive effect on managerial (H-10.1)
and marketing effectiveness (H-10.2). Furthermore, it is
also hypothesized that target market reach is negatively
associated with competitive intensity (H-10A). In the
specification of the LISREL model, target market reach is
the exogenous variable, measured by three indicators
(x1-x3). The other three constructs are the latent
endogenous variables with eight indicators (y1-y8). The
correlations among the manifest variables are given in
Exhibit 68.
The correlations in the measurement triangle for
target market reach indicate that there is no convergence in
measurement. The product-moment correlation between INC14M
and CHLD14 is very low and statistically not significant.
The results of a LISREL analysis with all three manifest

303variables indicate that the SMCs for both INC14M and CHLD14
variables are less than .10, Hence, both of these variables
are deleted from LISREL analyses, and H-10 relationships are
estimated with a single indicator of target market reach(x1 ).
Exhibit 69 summarizes the hypothesized relationships
in a path analytic schemata. The ML parameter estimates for
the measurement and latent variable model are given in
Exhibits 70 and 71.
The structural parameter estimates for both H-10A (i.e., the link between target market reach and competitive
intensity) and H-10.1 (i.e., the link between target market
reach and managerial effectiveness) are in the direction
predicted in the research hypotheses. However, only the latter path coefficient (for H-10.1) is statistically
significant. The direction of influence for parameter
estimate in subhypothesis H-10.2 (i.e., target market reach
and marketing effectiveness) is opposite to the one
predicted, and it is not statistically significant.
All of the subhypotheses as well as the overall
hypothesis (H-10) fit the data well. The Chi square
measures for all model specifications are significant, and
the average residuals are low compared to correlations of
Exhibit 68.

304EXHIBIT 68
Correlation Matrix For Hypoth e s i s - 10
MINORSCHLD14INC14M
DDSTRS (y1 )
-0.155**-0.001ns-0.286*
INTCPT1(y2)
-0.106ns -0.003ns -0 .222*
INTCPT2(y3)
-0.081ns-0.016ns-0.293*
MINORSCHLD14INC14M
MGREFF(y4)
“0.257* 0.154** 0.142**
MGRSKL(y5)0.162** 0.170** 0.052ns
MGRACH(y6)
0.168** 0.154** 0.164**
MGRSAT(y7)
0 .2 1 2*0.192*0.098ns
MINORSCHLD14INC14M
SERVO(y8)•0.061ns ■0.151** 0.137**
OFFER(y9)
•0.137** ■0.174** 0.135***
ATMOS(ylO)
■0.053ns ■0 . 121** 0.033ns
LOCAT(yli)■0.094ns ■0.132** 0 .014ns
MINORSCHLD14INC14M
MINORS(x1 )
1 . 0000.594*0.569*
CHLD14(x2)
1.0000.235ns
INC14M(x3)
1.000
* p < . 01** p < .05*** p < .10ns Not Significant
TCOD (y Variables! TCOD (x Variables!
.999

305EXHIBIT 69
Model Specification And Standardized Estimates ForHypothesis-10
El E34 4 4
\ yi 11 y2 11 y3 i
. 86
COMP. INTEN. .988
-.029-.108.938,
.243 MGR. EFFECTTGI. MARKT.
-.4761.0.123-.219
E ] MKT. EFFECT.
.73 / .99 .60
Eu
E5
i v8 I I y9 J I ylO 1 t t t
E g E g E l O

306EXHIBIT 70
ML Measurement Parameter Estimates For Hy p o t h e s i s - 10
ParameterEstimate
(ML)StandardError T-Value SMC
lyl .902 .045 20.0 .744ly2 .950 .042 22.8 .824iy3 1.000* .000 0.0 .914ly4 1.000* .000 . 0.0 .9021y5 .854 .050 17.2 .657ly6 .851 .050 17.1 .653ly? .957 .042 23.0 .826Iy8 .745 .093 8.1 .543ly9 1.000* .000 0.0 .979lylO .602 .086 7.0 .355 <
1x1 1.000* .000 0.0 1.000
tel .256 .031 8.3te2 .176 .026 6.8teS . 086 .023 3.8te4 .098 .022 4.5te5 .343 .038 9.1teS .347 .038 9.1te? .174 .025 6.9teS .457 .073 6.2te9 .021 .105 0.2telO .645 .074 8.7
tdl 0.000* .000 0.0
* Fixed parameter

307EXHIBIT 71
ML Structural Parameter Estimates For Hypothesis
ParameterH-10Estimate (S.E) •
H-10AEstimate(S.E)
H-10.1Estimate(S.E)
H-10.2 Estimate (S.E)
be21 -.029(.071)
be31 -.492 (.066)
be32 .129 (.067)
gal 1 -.103 (.067)
-.103 (.067)
ga2l .231(.066)
.234 (.065)
ga31 -.217 ( .062)
-.088 (.065)
psi 1 .903(.098)
.905 ( .099)
psi2 .846 (.093)
.846. (.093)
psi 3 .725(.127)
.780 ( .106)
Goodness-Of-Fi t Measures
CHI-SQUARE d.f. p-Value
GFI AGFI RMRSMC-SE1 SMC-SE2 SMC-SE3 TCODSE
40.2238.372.966.942.029.012.062.260.122
4.582
.101
.989
.947
.021
.012
.012
3.105
.684
.994
.982
.014
.061
.061
2.922
.232
.993
.966
.020
.010
.010

308
The Relations Between Conduct Elements And Store Performance
The Results For Hvoothesis-11.
In the last research hypothesis, H-11, all five
elements of unit conduct are collectively related to retail
store performance. More specifically, it is posited that
managerial effectiveness (H-11.1A), marketing effectiveness
(H-11.IB), expertness of management (H-10.2), target market
reach (H-11.3), and relative size of unit (H-10.4) have a
direct and positive influence on store performance. In the
model specification, however, all of these factors are not
exogenous variables.Exhibit 73 provides a summary of. the hypthesized
relationships and shows the specification of the LISREL
model. Note that of the five conduct constructs, two (i.e.,
managerial and marketing effectiveness) are latent
endogenous variables (y1-y7), while the three remaining
elements (i.e., managerial expertness, target market reach
and relative size of unit) are the exogenous variables
(x1-x4). The correlations among all the manifest variables
are summarized in Exhibit 72.
The ML parameter estimates for the measurement model
is given in Exhibit 74. The structural parameter estimates
are summarized in Exhibit 75. Note that in Exhibit 75, only

EXHIBIT 72309
Correlation Matrix For Hypothesis- 11
NPBT NSTSA NSTFE NSTINNPBT (y9) 1.000NSTSA (yiO) 0.697* 1.000NSTFE (yll) 0.611* 0.670* 1.000NSTIN (y12) 0.662* 0.759* 0.673* 1.000MGREFF (y1) 0.481* 0.394* 0.421* 0.427*MGRSKL (y2) 0.383* 0.397* 0.376* 0.378*MGRACH (yS) 0.466* 0.333* 0.389* 0.390*MGRSAT (y4) 0.484* 0.328* 0.426* 0.440*SERVO (y5) 0.150** 0.106** 0.148** 0.097nsOFFER (yS) 0.207* 0.116*** 0.175** 0.164**ATMOS (y?) 0.162** . 0.193** 0.200* 0.183***LOCAT (yS) 0.144** 0.150ns 0.164** 0.169**MGRAGE (xl) 0.283* 0.272* 0.156** 0.221*MGRRTL (x2) 0.233* 0.242* 0.176** 0.250*MINORS (x3) 0.260* 0.284* 0.244* 0.250*CHLD14 (x4) 0.057ns 0.197* 0.214* 0.272*INC14M (x5) 0.330* 0.241* 0.122*** 0.332*CSTCS (xB) -0.137** -0.152** -0.222* -0.133**
MGREFF MGRSKL MGRACH MGRSAT
MGREFF 1.000MGRSKL 0.771* 1.000MGRACH 0.765* 0.659* 1.000MGRSAT 0.862* 0.736* 0.740* 1.000SERVC 0.078ns 0.066ns 0.073ns 0.068nsOFFER 0.093ns 0.067ns 0.063ns 0.088nsATMOS 0.158** 0.095ns 0.071ns 0.092nsLOCAT 0.042ns 0.032ns 0.048ns 0.074nsMGRAGE 0.098ns 0.114*** 0.188ns 0.216*MGRRTL 0.202* 0.193* 0.187* 0.283*MINORS 0.257* 0.162** 0.168** 0.212*CHLD14 0.154* 0.170** 0.154** 0.192*INC14M 0.142** 0.052ns 0.164** 0.098nsCSTCS -0.165** -0.135*** -0.144** -0.150**

310EXHIBIT 72
Correlation Matrix For H y p o t h es i s - 11 (Cont,
SERVC OFFER ATMOS LOCAT
SERVC 1.000OFFER 0.729* 1.000ATMOS 0.643* 0.590* 1.000LOCAT 0.395* 0.306* 0.372* 1.000MGRAGE 0.076ns 0.044ns 0.022ns 0.037nsMGRRTL 0.051ns 0.008ns 0.037ns 0.043nsMINORS -0.061ns -0.137** -0.053ns -0.094nsCHLD14 -0.151** -0.174** -0.121*** -0.132***INC14M 0.137** 0.135*** 0.033ns 0.014nsCSTCS -0.498* -0.543* -0.437* -0.224*
MGRAGE MGRRTL
MGRAGE 1.000MGRRTL 0.626* 1.000MINORS 0.053ns 0.059nsCHLD14 0.029ns 0.019nsINC14M 0.117ns 0.020nsCSTCS -0.109ns -0.120***
MINORS CHLD14 INC14M CSTCS
MINORS 1.000CHLD14 0.594* 1.000INC14M 0.569* 0.235ns 1.000CSTCS -0.017ns 0.034ns -0.173*» 1.000
* p < .01** p < .05*** p < .10ns Not Significant
TCOD (y Variables) TCOD (x Variables)
.999

311
EXHIBIT 73Model Specification And Standardized Estimates ForH y p o t h e s i s - 11
LÀO GD
63-
.84 /MGR. EFFECT.ni
PERFORMANCETGT. MARKT(2
-.142
-.038MCT. EFFECT.
t\2
R£L. SIZE (31 y 5 i I y 6 I I y 7 J66 67
CZ]fiu

312thé parameter estimates for the "hypothesized links" are s h o w n . 163 The overall goodness of fit measures for all the
subhypotheses as well as the overall hypothesis (H-11) are
presented separately in Exhibit 76.
The second column in Exhibit 75 summarizes the
structural parameters obtained from the individual
subhypothesis. All of the parameter estimates are in the
direction predicted and are statistically significant.i
In general, all the subhypotheses fit the data well.
With the exception of H-11.1A, Chi square measure for all
submodels are significant, and the residuals from all five
model specifications are low compared to the correlations of
Exhibit 72. However, the fit of the overall model (H-11) is
not as good as those obtained from the submodels.
Nonetheless, both the GFI and RMR quantities indicate a
moderate fit to data.
163 For a proper specification of these submodels, one needs to add or delete the appropriate psi's in the structural equations.
164 It should be recalled that the operational measure for relative size of unit is reversed. Hence, negative sign for this parameter estimate is also in the expected direction.

313EXHIBIT 74
ML Measurement Parameter Estimates For Hy p o t h e s i s - 11
ParameterEstimate
(ML)StandardError T-Value SMC
lyl 1.000* .000 0.0 .894ly2 .860 .050 17.1 .661ly3 .858 .050 17.0 .6581y4 .964 .042 22.8 .8301y5 1.000* .000 0.0 .727lyB 1.002 .074 13.5 .729ly7 .849 .075 11.3 .524lyB .919 .067 13.8 .637ly9lylO
1.000* .000 0.0 .754.894 .068 13.2 .603
lyll . .988 .064 15.4 .736
1x1 .907 .206 4.4 .5681x2 1.000* .000 0.0 .6901x3 1.000* .000 0.0 1.0001x4 1.000* .000 0.0 1.000
tel .106 .022 4.9te2 .339 .037 9.1te3 .342 .038 9.1te4 .170 .025 6.9te5 .273 .046 6.0te6 .271 .046 5.9te7 .476 .055 9.0te8 .363 .044 8.3te9 .246 .036 6.8telO .397 .046 8.6tel 1 .264 .037 7.2
tdl .432 .013 3.3td2 .310 .015 2.0td3 0.000* .000 0.0td4 0.000*
* Fixed Parameter
.000 0.0

314EXHIBIT 75
ML Structural Parameter Estimates For H y p ot h e s i s - 11
Parameter
H-11Estimate(S.E)
Estimate(S.E) Subhypothesis
be21 .048(.061)
beSI .385 .501 <== (H-11.1A)(.063) (.063)
be32 .208 .204 <== (H-11.IB)(.087) (.077)
gal 1 .260(.094)
ga21 -.034(.073)
gaSi .226 .389 <== (H-11.2)(.080) (.100)
ga12 .218(.063)
ga22 -.111(.053)
ga23 . 193 .276 <== (H-11.3)(.054) (.062)
ga3l -.134(.063)
gaS2 -.517(.056)
gaSS .032 -.164 <== (H-11.4)(.068) (.063)
psi 1 .769(.087)
psi 2 .445(.066)
psi 3 .446(.063)

315EXHIBIT 76
Goodness Of Fit Measures For Hy p o t h e s i s - 11
H-11.1A H-11.IB H-11.2 H-11.3 H-11.4
Goodness-Of-Fi t Measures
CHI-SQUARE 45.15 14.71 7.69 1,38 5.04d.f. 19 13 8 5 5p-Value .001 .326 .464 .926 .411
GFI .954 .981 .988 .997 .991AGFI .913 .959 .968 .992 .972RMR .037 .034 .023 .008 .022SMC-SE1 .298 .042 .126 .098 .035SMC-SE2SMC-SE3TCODSE .298 .042 .126 .098 .035
Goodness -Of-FitMeasures H- 11
CHI- SQUARE: 124. 64d.f. p-Value
GFI AGFI RMRSMC-SE1SMC-SE2SMC-SE3TCODSE
80.001.934.900.043.127.391.396.530

316
Parameter Estimates For More Complex Models
In the preceding section, the models for individual
subhypotheses involved sinple, two construct relationships.
In the test of the overall hypotheses, the relationships
among multiple constructs were examined. In this final
section, results of LISREL analyses for more complex models
are reported.
In the development of research hypotheses, there was
some speculation whether the set of relationships between
market conditions and unit behavior, and their collective
impact on retail store performance, were similar across
metropolitan and nonmetropolitan stores. However, in all the previous LISREL models, the hypotheses tests were
performed for the sample of 211 stores, regardless of their market location. In this section, two sets of complex
models are evaluated.First, the relationships between market supply
conditions, unit behavior and store performance are
collectively examined for all stores (N=211). Then, the
same set of relationships are tested for two separate
subsamples of metropolitan (N=112) and nonmetropolitan
(N=99) market stores. Second, the general model is expanded
further, incorporating some of the demand conditions into
the analyses. These relationships are also evaluated for
all stores, as well as the two subsamples.

317Since the measurement properties of all concepts
were discussed in the previous sections, correlation
matrices for these models are not reported. Furthermore, in
order to simplify the presentation of the LISREL results,
only the standardized structural parameter estimates are
shown on the path diagrams. The measures of goodness of fit
and the level of significance of the path coefficients are also given on each exhibit.
It should be noted that both of these models are
extremely large and the sample size of this study is fairly
small. In the first model, 53 independent parameters are
estimated, while in the second model, the number of
parameter estimates is 78. Hence, especially for the
subsamples, the results of LISREL analyses have only
heuristic value and the parameter estimates as well as the
goodness of fit measures should be viewed with caution.
A Model Of SuDPlv Structure. Unit Conduct and Retai1 Store Performance
In the first complex model, the relationships among
market supply elements, unit behavior and retail store
performance are examined. The path analytic schemata of
Exhibit 77 summarize all the linkages for the total sample.
Here, overstoring, measured by a single indicator, is the
exogenous latent variable. All other variables represent
endogenous latent concepts. Target market reach and

318relative size of unit are also measured by one indicator.
Managerial effectiveness and performance have four
indicators, while marketing effectiveness has three, and the
managerial expertness has two measures (see the previous
section for empirical definitions).
For all stores, overstoring has a positive and
significant influence on competitive intensity. None of the
other links from overstoring to conduct elements or to
performance are significant. The results from LISREL
analysis indicate that competitive intensity has an inverse
relationship with marketing effectiveness, i.e., higher
competitive intensity adversely affecting marketing
effectiveness. All other links between competitive
intensity and conduct elements are not statistically
signi ficant.
Each of the links between target market reach,
managerial and marketing effectiveness, and store
performance are significant. However, note that the
influence of target market reach on marketing effectiveness
is negative, contrary to a priori expectation.
There appears to be no significant relationship
between managerial effectiveness and marketing
effectiveness. However, each of these factors has a positive and significant influence on retail store
performance. The relative impact of managerial

319effectiveness is also more than twice the magnitude of
influence for marketing effectiveness. On the other hand,
managerial expertness has an equally, important effect on
both the effectiveness of management and store performance.
Relative size of unit has a direct and significant
impact on the effectiveness of marketing effort, a
relatively smaller effect on managerial effectiveness, and
an insignificant negative impact on store performance. It
will be recalled that the empirical measure of relative size
was defined as the competitor's total retail space to the total space of the focal unit. Hence, to the extent that
the retail unit has smaller capacity in relation to the main
competitor in the marketplace, the marketing and managerial
effectiveness of the unit is significantly and adversely
affected.The results of a similar analysis for metropolitan
market stores are summarized in Exhibit 78. In general, the
conclusions for the overall sample of stores also hold for
this subsairple. But there are also some differences in the
LISREL results.For example, note that the relationships between (a)
overstoring and performance; and (b) target market reach and
marketing effectiveness are opposite to those reported for
all stores. Furthermore, several path coefficients have
significant differences in their magnitudes.

E XHIBIT 77S u p p l y Conditions, Unit B e havior and Retail StorePerformance-- All Stores
d.f.; 137 lp=.000]GFI : .884RMR : .094
- . 0 6 3
227'- . 0 6 1 22!Overetorlng
0 5 722 4 2
2 2 9Target Mit Reach Performance3 2 2
1 7 0 0 6 3 186 '
5 0 8 - . 0 1 2
- . 2 5 5 ' - 0 5 2CompetitiveIntenalty
52- . 0 5 9Relative
Size
2 302.81COlOo
A : p < "01 □ : P <

321For example, marketing effectiveness is no longer a
significant influencer of store performance, while relative
size of store has an important and . adverse impact on the
same. Similarly, competitive intensity for metropolitan
stores has a lesser influence on marketing efffectiveness,
but the impact of relative overstoring is now more important
on the same factor. Also note that the relationship between
overstoring and competitive intensity is far stronger for
metropolitan stores.
Relative size of unit and managerial expertness both have similar impacts on the managerial effectiveness, store
performance, and managerial effectiveness. In almost all
cases, the relationships generally appear to be stronger
than was the case with the all store sanple.
The results of the same model for nonmetropolitan
stores are given in Exhibit 79. All of the links for this
subsample mirror the findings for all stores. The
relationships between all latent variables are in the same
direction, but the magnitude or degree of influence among
them are quite different.
For example, the results of LISREL analysis for
nonmetropolitan stores suggest that relative size of unit is
a crucial factor in the marketplace. The direct inflence of
this factor on marketing effectiveness is significantly
larger than for metropolitan stores. Hence, the indirect

EXHIBIT 78S u p p l y Conditions, Unit Behavior and Retail StoreP e r f ormance-- M e t r o Stores
Overetorlng
. 5 1 6
CompetitiveIntensity
- . 0 6 2 ^
— , 0 6 0
ManagerialExpertnese
. 0 6 8
Target Met. Reach
9096 - . 0 7 5
- . 1 1 7 *
Managerial Sffectlveneas.
. 2 6 7 ^
^ S ^ O 19. 0 2 0 \ . 0 34 % ^ .
?erformence
Marketing !ffectiveneesi V. 1 4 3
- . 0 5 5 - . 4 0 3'*
RelativeSize
X" : 287.20d . f . ; 137GFI : .798RMR : .120
A : p < « 0 1a ; p < *05
[p=.0 0 0 ]o>roro

EXHIBIT 79Supp l y Conditions, Unit Behavior and Retail StorePerformance-- Nonmetro. Stores
055
218067 Managerial
Iffectiveneas217Overatorlng
008 m 2 3ff
Target Mit Reach Performance
328033 16
038■7115174 Marketing
ffectiveneaa- 0 33
70 0-.059
X2 : 237.46d. f . : 137GFI .810RMR .108
A : p < *01□ ; p < .05
tp=.0001 COroCO

324impact of relative size on store performance is greater than
its direct influence on the same. Note that target market
reach is also a far more important factor for
nonmetropolitan stores than it is for metropolitan stores.
The same variable also has a large and inverse relationship
to marketing effectiveness, in contrast to the positive but insignificant relationship found in metropolitan stores.
A Model Of Market Structure. Unit Conduct and Retai1 Store PerformanceIn the second set of coup lex models, two elements of market
demand (i.e. demand quality and potential) are added to the
previous relationships.’®® A preliminary LISREL solution
indicated that demand growth had no significant relationship
with any of the eight previous variables, and hence, was not
included in these analyses.’®®Exhibit 80 summarizes the relationships among the
ten constructs in a path analytic schemata for all stores.
In general, the addition of the two exogenous demand
’®® In the specification of LISREL models, demand character is measured by two variables (AVGINC and AVGRTV). The potential demand is also operationalized using two indicators (TINCHH and THSNVA).
’66 Also recall that the character of demand and growth were not well differentiated concepts. In the preliminary LISREL analyses, the iterations with demand growth as a third variable did not converge and several quantities were outside the admissable parameter space (e.g., negative variances, correlations greater than one in magni tude).

325variables has an enhancing affect on all parameter
estimates. Hence, the conclusions with respect to
relationships between supply conditions, unit behavior and
store performance also hold here.
Two links that were not formally introduced as
research hypotheses are specified in this model. The first
link is a direct relationship between demand character to
competitive intensity, and the second is also a direct
relationship between demand potential and marketing
effectiveness. For the sample of all stores, none of these
links are statistically significant.’®’For all stores, the quality of market demand (i.e.,
demand character) appears to have a conducive effect on
relative overstoring in the marketplace. Demand potential,
on the other hand, has a strong depressing effect on the
same. The latter relationship, it will be recalled, is
contrary to the a priori expectation from the first research
hypothesis. Demand potential also has a strong positive
impact on the competitive intensity in the marketplace.
In chapters 4 and 5, it was suggested that the
empirical measures of demand potential may have a
"confounding" effect on the theoretical variable of
interest. More specifically, the measurement of total
incomes, housing and rent values with uniform trade area
167 These links will be useful in the interpretation of the results in the next chapter.

326definitions may have the effect of producing a set of
indicators that not only represents "potential demand" but
also, what may be termed, "density of demand." Furthermore,
it was conjectured that the level of rent and housing values
may equally indicate, in addition to demand potential, the
"scarcity of housing" in the marketplace. Clearly, all
three concepts are interrelated, (i.e., the higher the
potential demand in a given, fixed geographical space, the
higher the density of demand, and possibly, the higher the
demand for housing).
When the relationships of Exhibit 80 are interpreted with this post hoc conceptualization, the results apppear
plausible. For example, as prior research suggests, the
more densely populated areas are less conducive to new
retail entries as well as expansion of existing facilities.
Hence, the negative influence of "demand potential" over
overstoring. Similarly, the more densely populated and
higher income areas would also have a larger proportion of
intercept competitors, which are a dis locative force in the
marketplace, and hence the positive relationship between
"demand potential" and competitive intensity.
Exhibits 81 and 82 summarize the same relationships
for metropolitan and nonmetropolitan stores respectively.
Several things are evident from the results of these two
LISREL analyses. First, note that the path coefficient

EXHIBIT 80M a r k e t Conditions, Unit Behavior and Retail StorePe r formance-- All Stores
085 09DemandCharacter 381'
233a-.029’ 200Managerial
ffectiveneaaOveratorlng071 261,
173DemandPotential
Target Mit Reach514
507 062196'
0 2 1
194 Marketingffectiveneaa
CompetitiveIntenaity -.157
-.05Relative
Sise-.062
: 554.07 d.f.: 198GFI : .841RMR : .096
[p=.0 0 0 ]wN»-J
a : P < *01 a : p < *05

EXHIBIT 81Market Conditions, Unit Behavior and Retail StoreP e r formance-- Metro. Stores
DemandCharacter
.021*. 5 2 3
DemandPotential
yOveratoring
, 147
.419“
. 2 9 !
, 0 9 2
, 62 8 Target Mit. Reach
CompetitiveIntensity
, 0 9 6
1 4 l '
. 0 1 8
187 ManagerialBxpertneaa
: . 3 i 9 “
ManagerialEffectiveneaa.
. 1 4 5 °
^ ' S . , . 0 73 . 0 0 3\ . 0 30 x " ^
. . 3 5 9
Performance
Marketing Effectiveneaaj r - . 187
. 140- . 3 :
- . 1 7 6 RelativeSire
: 435.30d. f . : 198GFI : .772RMR : .112
[ p = . 0 0 0 ] CON3CD
A : p < - 0 1
□ : p < . 0 5

EXHIBIT 82Market Conditions, Unit Behavior and Retail StorePerformance-- Nonmetro. Stores
0 79 127Deaand
Character 2 392 06,
234ManagerialffectiveneaaOveratoring
38368Demand
PotentialTarget Mit
Reach Performance680 027 205223
-.0 57023 Marketing
ffectiveneaaCompetitiveIntenalty 025
182140
d . f .GFIRMR
366.41198
.771
.127
tp=.000] toroto
A : p < ‘ 01 o : p < "05

330between demand character and competitive intensity are both
statistically significant,’®® but of opposite signs.
Second, also note the changes in the magnitudes of the path
coefficients linking "demand potential" to both overstoring
and competitive intensity.
As it was speculated in Chapter 5, the
"interprétâtional confounding" of demand potential is "greater" for metropolitan stores than it is for
nonmetropolitan stores. Recall that all metro market
trading areas are uniformly one-and-one half miles in
radius. Hence, one would expect the relative size of both
of these coefficients to be larger for these market
locations than for other stores. This conjecture is
partially corroborated in these results.
As to the reverse signs of path coefficients between
demand quality and coirpetitive intensity, a plausible post
hoc explanation could be found in the focus units' locations within metropolitan and nonmetropolitan markets. In
general, metropolitan stores in the sample are predominantly
in the inner city locations, and hence, the "quality of
demand" is rather low. Thus, the demand character does not
appear to have a positive influence on the competitive
intensity (i.e., disproportional presence of intercept
168 Given the number of data points in the two samples, and the number of parameters estimates in these models, this conclusion should be a tempered one.

331competitors). For nonmetropolitan stores, where the trading
area generally spans the city limits or beyond, this
conjecture, of course, does not necessarily hold.

CHAPTER VII
AN INTERPRETATION OF RESULTS AND CONCLUSIONS
At the conclusion of Chapter 4, it was noted that the value
of the proposed linkages in this study lie not so much in
their simple, one-to-one associations, but rather in the
role they play within the overall network of relationships.
For this reason, the results from statistical analyses in the preceding chapter were presented without a lengthy
discussion or an evaluation. In this final chapter, a brief
summary and interpretation of findings are performed and the
results from more complex, multiple construct relationships are evaluated. Following an overall assessment of the
empirical analyses, the managerial implications of the
research are noted. This chapter, and the study, concludes
with some further thoughts and reflections on the research.
Organization Of The Chapter
This chapter is in three major sections. In the
first section, a summary and interpretation of the findings
are presented. Next, the implications of the results for
the management of retail enterprises are summarized. In the
final section, the significance of this research for theory,
methodology and practice are noted and a number of
suggestions for future investigations are outlined.
- 332 -

333An Interpretation Of Results From Empirical Analyses
The results from enpirical analyses of the twenty
eight [28] subhypotheses are summarized in Exhibit 83. The
structural parameter estimates for these hypotheses indicate
that only eighteen [18] of the twenty eight individual
relationships are "statistically" significant. Furthermore,
of the proposed linkages, only seventeen [17] are in the
direction predicted by the research hypotheses.
Given the objectives and the orientation of this
study, however, these "win-loss" statistics may be misleading. In order to put things in perspective, it is
useful to briefly review the major theme of this study and
to reiterate the rationale behind the construction and
development of some of these research hypotheses.
Objectives Of The Research Revisited
It will be recalled that this study began by noting
several conceptual and methodological limitations of the "macro" orientation in previous retailing performance
research (see Chapter 1). More specifically, it was argued
that these studies were based on a faulty conceptualization
of the retail "industry" and, hence, they had little
relevance in practical terms. Thus, this investigation was
undertaken with the basic premise that there is a
significant need to reformulate the "conventional" thinking

334on the determinants of retailing performance. This, it was
argued, can best be accomplished by looking at retailing in
microcosm, (i.e., at the level of the retail store, see Chapter 2).
Following a selective review of the retailing
performance studies, a series of research hypotheses and
conjectures were derived, based partly on the "conventional" thinking, and in part, on the insights provided by the more
recent retail patronage research.
In the development and construction of the research
hypotheses, and especially those due to the conventional,
macro approach, it was noted that some of these linkages
were based on certain "behavioral assumptions" attributed to
a group of retail units. Hence, in the statement of some of
these research hypotheses, several competing, implicit
paradigms were explicated (see Chapter 4). Furthermore, in
the proposed "network" of structural and simultaneous
relationships, many of the ceteris paribus assumptions of
the conventional reasoning were effectively removed from the
analyses. Thus, in the development of both the conceptual
basis for this study, and the formulation of the research
hypotheses, there was always the expectation that some of
the relationships would indeed "fail," when confronted with
the data from the real world.

335For these reasons, the results from empirical,
statistical analyses of this study should not be evaluated
solely on the basis of the "statistical" significance of the
structural parameters. In fact, in many cases, some of the
path coefficients obtained in this research are important
precisely because of their "statistical insignificance."
An Evaluation Of Statistical Results
Exhibit 83 provides a summary of all the findings
from the "individual tests" of the research hypotheses.
Chronologically, the first group of relationships lH-1 and
H-2] concern the direct linkages between the demand and
supply conditions in the marketplace. In the second group,
these "market conditions" are first related to store
performance [H-3 and H-4], and then to two elements of unit
conduct [H-5 and H-6]. In the third group of research
hypotheses, the elements of unit conduct are first
interrelated, lH-7 through H-10], and finally, are
collectively linked to store performance [H-11].
An Evaluation Of Research Results-- H-1 and H-2.
The findings from empirical analyses indicate that
all of the theoretical relationships between demand and
supply conditions, with the exception of those involving the
"demand potential" variable, are in the direction predicted
and statistically significant.

336EXHIBIT 83
A Summary Of Results From Empirical Analyses
PROPOSEDLINKS RELATIONSHIP
PRED(EST
H-1.1 Dem. Charac. Overstoring + ( + )* Good
H-1.2 Dem. Potent. ==> Overstoring + (-)* Modr
H-1.3 Dem. Growth. ==> Overstoring + ( + )* Modr
H-2.1 Dem. Potent. Compet. Int - ( + )* Poor
H-2.2 Overstoring s = > Compet. Int + ( + )* Good
H-3.1 Dem. Charac. Performance + (-)* Modr
H-3.2 Dem. Potent. = £> Per formance + (-)ns Good
H-3.3 Dem. Growth. z = > Performance + (-)** Poor
H-4.1 Overstoring Performance - (-)ns Good
H-4.2 Comp. Inten. Performance - (-)** Good
H-5.1 Overstoring Mgr. Effect + ( - )ns Good
H-5.2 Overstoring Mkt. Effect + ( - )ns Good
H-5.3 Comp. Inten. Mgr. Effect + (- Ins Good
H-5.4 Comp. Inten. Mkt. Effect + (-)** Good
H-6.1 Dem. Potent. Mgr. Effect + ( + )ns Good
H-6.2 Dem. Growth. Mgr. Effect + (-)ns Good
CTION/ ■ GOODNESS MATE) OF FIT
* p < 1** p < 5 ns Not gnificant

337EXHIBIT 83
A Summary Of Results From Enpirical Analyses (Cent,
PROPOSEDLINKS RELATIONSHIP
PRED(EST
H-7 Mgr. Expert. Mgr. Effect + / ( + )* Good
H-8 Mgr. Effect. Mkt. Effect + / ( + )ns Good
H-9.1 Relat . Size Mgr. Effect - / (-)* GoodH-9.2 Relat . Size ==> Mkt. Effect - / ( - ) * Good
H-10.A Tgt. Market Comp. Inten - / ( - )ns GoodH-10.1 Tgt. Market ==> Mgr. Effect + / ( + )* GoodH-10.2 Tgt. Market = = > Mkt. Effect + / ( - )ns Good
H-11.1A Mgr. Effect. ==> Performance + / ( + ) * Modr
H-11.IB Mkt. Effect. ==> Performance + / ( + )* GoodH-11.2 Mgr. Expert. ==> Performance + / ( + )* Good
H-11.3 Tgt. Market Performance + / ( + )* GoodH-11.4 Relat . Size ==> Performance - / I - ) * Good
CTION/ GOODNESS MATE) OF FIT
* p < .01** p < .05 ns Not Significant

338These results, in general, reinforce the conclusions
of prior research at both the macro and micro level
analyses. Specifically, at the level of individual store
trading areas, in both metropolitan and nonmetropolitan
markets, favorable demand conditions (i.e., demand quality
and growth) appear to have a strong positive influence on
relative overstoring in the marketplace.However, this general conclusion, based on the
ceteris paribus assumption may need to be modified when all
three variables are considered simultaneously (H-1).. In the latter case, of the three demand elements, "demand growth"
is not only of lesser influence on overstoring, but in both
metropolitan and nonmetropolitan markets, it is no longer a
(statistically) significant factor’®® (see Exhibits 33 and
35 in Chapter 6). As to the negative (and statistically
significant) influence of "demand potential" on overstoring,
two possible post hoc interpretations can be advanced.The first plausible alternative "explanation" can be
attributed to the presence of an "interpretational
confounding" in the empirical content of the demand
potential construct. More specifically, when the total
incomes, housing and rent values are computed within a
uniformly defined, fixed geographical space, one risks these
’®® In the more complex models, demand character remains to be a positive and (statistically) significant factor in all the analyses.

339
indicators to be reflective of not only the "aggregate
amount of purchasing power," but also the "concentration of
demand," and even, the "scarcity of housing." This
situation, of course, is true for all metropolitan market
stores in this study.
However, since this uniformity in trading area
definitions does not apply to nonmetropolitan markets, in
Chapter 5 it was conjectured that the difficulty in the
interpretation of this factor could be resolved if the same
set of relationships were tested separately for the two
subsamples. Here, the a priori expectation was that, if
demand potential indicators were indeed "measuring" the
aggregate purchasing power, and given that H-1.2 was true,
then its relation to overstoring in nonmetropolitan trading
areas would be in the direction hypothesized (i.e., the
structural parameter estimate would be positive and
significant).
The results from the.complex models for the two
samples, however, do not support this conjecture (see
Exhibits 81 and 82 in Chapter 6). The path coefficient
between "demand potential" and overstoring for metropolitan
[-.531] and nonmetropolitan markets [-.411] are both
negative and statistically significant [p < .01]. Similar
results (not shown in the study) are obtained when the
simple, two construct relationships are tested for the two
subsanples.

340The second plausible alternative "explanation" can
be attributed to the possibi1ity of a "statistical artifact"
which may arise due to the empirical definitions of both
demand potential and overstoring. This conjecture is based
on the premise that the relationships between "ratio"
variables have special statistical characteristics which may
"favor" one direction of association over a n o t h e r . A s
Schuessler (1975) notes
In general, the correlations between opposite component terms (numerator - denominator) will tend to depress the correlation between ratios, whereas the correlation between adjacent terms (numerator - numerator) will tend to elevate it. other things being equal. When these tendencies are confirmed in a substantive investigation, one may be concerned that the outcome is no more than a statistical artifact. When these tendencies are reversed, one's concern is with the specific conditions that brought about that reversal and their possible substantive significance (p.386).
Hence, as in the case of demand potential and overstoring,when two highly correlated components [population and
households] appear as opposite terms in the empirical
measures of both concepts, and according to Schuessler's
criteria, a negative correlation would be expected. Thispossibility, however, can be discounted for two reasons.
17° There is a growing literature on this topic. Several articles, building upon the work of Pearson (1897), can be found in the sociology literature. For a sample of these papers, see, Long (1979), Fuguitt and Lieberson (1973), Freeman and Kronenfeld (1973), Kasarda and Nolan (1979), Mac Mil Ian and Daft (1979), Chayes and Kruskal (1966) and Schuessler (1973,1975).

341First, two of the three indicators of demand
potential, ITHSNVA and TRNTVA], have no common components
with the operational measure of overstoring, and yet, the
correlations across these indicators are still in the same
direction. Second, a similar communality in the component
terms between the measures of overstoring and competitive
intensity (i.e., total retail space) does not appear to
influence the direction of correlations, as it is suggested
by Schuessler (1975). On the contrary, these findings are
supportive of the conclusions reached by Long (1979) in that
this belief [i.e., ratio variables have built-in dependencies], despite its intuitive appeal, is groundless. The use of ratio variables with common components in theory building, regardless of the relative position of the shared component, does not constrain or make more likely one sign or direction over another (p.38).
Thus, it appears that the possibility of an
"interpretational confounding" is still the more plausible
of the two alternative explanations.’’’ According to this
conjecture, and possibly unique to this study, "demand
potential" in both metropolitan and nonmetropolitan markets
seems to represent a multifaceted construct, possibly more reflective of the concentration of population and housing
’” This conclusion, of course, assumes that H-1.2 is generally a plausible hypothesis. The conjecture that high potential demand has a "depressive" influence on (the creation of) supply potential is not logically consistent with either the realities of the marketplace or the assumption of a profit seeking enterprise in economic theory.

342than aggregate purchasing power in the trading area. This
post hoc interpretation of the statistical results is
generally consistent with the findings of prior research
(e.g., Hall et al 1961). More specifically, previous
research suggests that markets which are characterized by
higher levels of "population and housing density" are less
conducive to expansion of existing facilities and/or to the
entry of new retailers into the trading area.'?: Hence, it
seems reasonable to conclude that an "inverse" relationship
between "demand potential" and overstoring is a plausible
finding.
The findings from the empirical analyses of the
second set of hypotheses (H-2) indicate that the theoretical
relationship between the demand potential, relative
overstoring, and the level of competitive intensity are both
positive and (statistically) significant. However, note
that only the latter link (H-2.2) is in the direction
predicted in the research hypotheses.
The strong positive influence of overstoring on
competitive intensity reinforces the conclusions of other
researchers (e.g., Davidson 1982, Bucklin 1983). In other
words, the findings of this study generally supports the
claim that overstoring of retail markets has a "conducive"
17 2 This conclusion is also consistent with the development and growing importance of planned shopping centers at some distance from the densely populated urban areas.

343effect on the level of competitive intensity. Furthermore,
as it would also be expected, this effect is much more
pronounced in metropolitan markets than in nonmetropolitan
markets [.628 vs .368, respectively] (see Exhibit 81 and
82).
The direct and positive relationship between "demand potential" and competitive intensity, however, is quite
unexpected. This finding implies that the higher levels of
aggregate purchasing power and/or concentration of demand
also has a conducive effect on conpetitive intensity.
A possible reason for this direct, positive
relationship may be found in the empirical measures of
competitive intensity. As it will be recalled, the presence
of discount department retailers (DDSTRS) and the relative
importance of intercept stores (INTCP1 and INTCP2) are indicators which reflect the importance of larger scale
establishments in the marketplace. Since most of these retailers, in order to sustain their operations, require a
large base level demand, the positive relationship between
"demand potential" and competitive intensity does not seem
implausible. However, note that this post hoc
interpretation assumes that "demand potential" is reflective
of aggregate purchasing power in the marketplace.
But even when demand potential is interpreted as a
"density" notion, the preceding post hoc justification still

344appears reasonable. More specifically, if the notion of
competitive intensity is indeed partly reflective of larger
size retail units, then the "trading area" for these stores
are also significantly larger than the one-and-one half mile
radius assumed (for metropolitan stores) in this study.
Hence, the relationship between "demand potential" and
competitive intensity should be considerably stronger in
nonmetropolitan markets than it is in metropolitan
m a r k e t s . 3 The complex model relationships seem to support
this line of reasoning. Note that the link between "demand
potential" and competitive intensity is much stronger [.680] in nonmetropolitan markets, compared to the same link in
metropolitan markets [.295] (see Exhibits 81 and 82).
It should also be noted that "demand potential,"
irrespective of its substantive interpretation, has both a
"conducive" direct effect, and a "depressive" indirect
effect on competitive intensity. In fact, for metropolitan
markets, this inverse indirect effect is large enough to
offset the positive direct effect. Hence, when only the
"net effect" is considered, the initial expectation
expressed in H-2.1 generally holds for metropolitan markets.
However, for neither the overall sample of stores nor for
nonmetropolitan markets, one can not draw similar
17 3 This is because the trading areas for nonmetropolitan areas are generally much larger than the one-and-one half miles radius assumed for metropolitan markets.

345inferences.
An Evaluation Of Research Results-- H-3 And H-4.
The theoretical relationships between "market
conditions" and store performance are summarized in the five
subhypotheses of H-3 and H-4. Here, the first set of
conjectures represents the “naive" expectation (i.e.,
ceteris paribus), that favorable demand conditions have a
positive direct influence on store performance. In the
second set of subhypotheses, it is similarly conjectured
that unfavorable supply conditions also have a direct but negative influence on store performance.
The results of the empirical analyses indicate that
all three demand conditions have an influence opposite to
those predicted, while the effects of supply conditions are all in the direction hypothesized. However, note that these
results represent only the "direct effects" from simple, two
construct relationships (i.e., ceteris paribus assumption).
When all three demand variables are assessed
simultaneously, the direction of influence on store
performance for both demand potential and demand growth are
positive but neither path coefficient is statistically
significant. However, both the negative influence and the
(statistical) significance of the quality of demand variable
remain unchanged.

346The strong inverse relationship between demand
quality and store performance, especially for the sample
stores, is not surprising. As it was briefly noted in
Chapter 5, the target group of consumers for the typical
focus store are low income, convenience oriented households.
Hence, as the correlations among the indicators of these two
concepts indicate (see Appendix-A), quality of market demand
is a factor, quite opposite to the one represented by target
market reach [the interfactor correlation = -.825].
However, although the preceding interpretation is
clearly context specific, the results from empirical
analyses also have implications for all retail stores. More
specifically, when considered collectively, the findings of
this study generally imply that, at the level of individual
trading areas, the "aggregate" market demand conditions may
have no neccessary relationship to store performance. As it
is illustrated in the "network" of relationships for both
metropolitan and nonmetropolitan markets (see. Exhibits 81
and 82), none of the individual demand conditions has a
significant path coefficient. This conclusion, however,
does not preclude the possibility of various indirect
relationships.
174 In order to simplify the presentation, some of the "insignificant" links are not shown on these path diagrams.
’75 This conclusion, however, does suggest that the "empirical" associations reported between high demand

347The direct relationships between market supply
conditions and store performance are generally more
consistent with the expectations. Here, relative
overstoring appears to have a negative but insignificant
impact on store performance. However, note that although
the "sign" of the estimate in Exhibit 83 is consistent with
the prediction, the magnitude of this path coefficient,
I".001], indicates nearly complete independence (see Exhibit 45 in Chapter 6). Nevertheless, in more complex
relationships, and in both metropolitan and nonmetropolitan
markets, overstoring appears to be an "important depressive
element" on store performance. In general, this negative
influence is more pronounced in metropolitan markets [-.187] than it is in nonmetropolitan markets [-.127] isee Exhibits
81-82).As for the direct relationship between relative
competitive intensity and store performance, there appears to be a fairly consistent pattern of inverse association
across all markets. In the two construct relationship, the
path coefficient among these two concepts is negative and
statistically significant. Generally, the data also fits
the model relationship well. However, note that when all
other variables are brought into the analysis (see. Exhibits
conditions and high "labor productivity" in the studies of SMSA markets are probably an artifact of the aggregated statistics used in empirical analyses (e.g.. Ingene 1982,1983c, Ingene and Lusch 1982).

34880-82), relative influence of conpetitive intensity
diminishes. In general, the direct influence of competitive intensity appears to be more pronounced in metropolitan
markets than it is in nonmetropolitan areas. In the latter
case, however, the path coefficient is not statistically
significant.
On the basis of these findings, an assessment of the
auxiliary hypothesis (H-3A) can also be made. In this
subhypothesis, it was conjectured that
1. if there is a direct and positiverelationship between demand and supply conditions (i.e., H-1 holds), and
2. if there is an inverse association between supply conditions and store performance (i.e., H-4 holds), and finally,
3. if the latter effect was found to be greater than the former,
then a negative association would be expected among elements
of market demand and store performance. As the results of
the previous analyses indicate, however, this conjecture is
not supported for all demand elements. Although both the
first and second conditions are partially corroborated by
the enpirical analyses, the last condition does not hold in
either the overall sanple of stores or in any of the two
subsamples.
Reflecting on the first two sets of hypotheses, the
results from the empirical, statistical analyses are

349generally not very conclusive. This is partially due to
the inability of the measuring instruments used in this
study to "discriminate" among the various demand constructs.
Therefore, it is not surprising that the problems of
interpretation in the preceding analyses frequently involve
various demand variables.” ®
A related difficulty in the interpretation of these
results can also be attributed to the multiple
operationalizations of the various demand constructs.
Clearly, the latent demand variables considered in this
study are fairly aggregated, multifaceted notions. Hence,
as it was illustrated by "demand potential," the empirical
centent of these concepts are relatively more prone to
alternative interpretations. In this regard, th$ use of
multiple indicators exasperates the situation since through
multiple measures, the likelihood of "tapping" into
different facets or dimensions of these constructs is
greatly increased. This situation, in turn, makes it
difficult to interpret the primary structural relations
since these concepts no longer represent unidimensional
constructs.
17 6 Also note that the overall goodness of fit of the proposed models are almost always "poorer" when there is more than one demand element in the LISREL analyses.

350An Evaluation Of Research Results-- H-5 And H-6.
It win be recalled that the major "rationale"
behind the proposed relationships in H-5 and H-6 was to
"explicate" some of the implicit assumptions of the
behavioral paradigm (see Chapter 4). According to this
paradigm, the positive influence of "market conditions" on
store performance was predicated upon various "mediating"
conditions such as the "ability of the stores in growth
areas to attract the best managers" (H-6), and/or the
"competitive conditions bringing about greater discipline in the management and operation of the retail stores," (H-5).
The results of the empirical analysis for H-5
indicate that none of these relationships are in the direction suggested by the behavioral paradigm. In other
words, the findings of this study generally indicate that
neither overstoring nor competitive intensity have a positive influence on either the marketing effectiveness of
the stores or the effectiveness of the store manager(s ).
Furthermore, of the four subhypotheses, only the
relationship between competitive intensity and marketing
effectiveness is (statistically) significant.’”
” 7 Also note that for H-5, the proposed relationships forall the subhypotheses, as well as the overallhypotheses, fit the data very well (see Exhibit 51 in Chapter 6).

351As to the relationships between market demand
conditions (potential and growth of demand) and managerial
effectiveness, the results of the empirical analyses indicate that neither path coefficient is statistically
significant. Furthermore, the magnitude of the structural
parameter estimates for both subhypotheses suggest that neither demand potential [.003], nor growth of demand
I-.046] have any relationship to managerial effectiveness.
The results from a similar analysis, involving the same
demand conditions and a related behavioral element,
"managerial expertness," essentially give the same
conclusions (these findings are not reported in this study).In summary, on the basis of the empirical results of
this study, the conjectures of the behavioral paradigm can
not be supported.
An Evaluation Of Research Results-- H-7.8.9 and 10.
In the third group of research hypotheses, various
elements of unit conduct are interrelated in four structural
models of increasing complexity.
In H-7, managerial effectiveness is posited to be a
direct and positive function of the expertness of
management. This conjecture is substantially corroborated
in the empirical analyses. However, a similar two construct
relationship between managerial and marketing effectiveness
(H-8), although in the direction hypothesized, is not
statistically significant.

352In more complex models, the relationship of H-7 is
fairly uniform in both metropolitan and nonmetropolitan
markets, indicating that experience or expertness of store
manager(s) has a strong positive influence on the
effectiveness of store management. However, the parameter
estimates for the managerial-marketing effectiveness link
are generally very close to zero, indicating that these two
factors are nearly independent (see Exhibits 80-82).
The influence of relative unit size on both the
marketing and managerial effectiveness is significant in all
empirical analyses. In general, it appears that the more a store is "undersized" in relation to major competition, the
greater the loss in relative market position and the lower
the effectiveness of managerial effort. However, the
results from both the simple and complex relationships indicate that the former effect is much stronger than the
latter. The analyses of the two subsatiples further suggest
that the "relative influence" of size differential on
marketing effectiveness is far more important in
nonmetropolitan markets [-.681] than it is in metropolitan
markets [-.377].
Finally, in H-10, the target market reach of a
retail unit is first related to an element of market supply
(competitive intensity), and then to two elements of unit
conduct. Of the three subhypotheses, only the relationship

353between target market reach and managerial effectiveness is
in the direction predicted (positive) and statistically
significant. However, when all of the subhypotheses are
considered simultaneously, the link between target market
reach and marketing effectiveness is also significant. But
the direction of influence (negative) is opposite to the one
predicted.
The latter relationship is quite unexpected, since
it implies that retail units which are located in markets
with favorable "demographics" have a worse competitive
position relative to the competition. A possible reason for
this result may lie in the operationalizations of the two
concepts.It will be recalled that for the target market reach
construct, the patterns of correlations in the measurement
triangles indicated that convergence in measurement could
not be obtained. Hence, in the empirical analyses, two of
the three indicators were deleted from the statistical
analyses. Similarly, one of the four indicators of
marketing effectiveness, representing the relative quality
of store location, was also deleted from analyses. Thus, it is clear that neither concept has strong measurement
properties.
However, it is interesting to note that in the
"original set of seven indicators," one of the measures of

354target market reach, (INC14M), has a consistent pattern of
"positive" cross correlations, while the same correlations
for the other two indicators are negative (see Exhibit 68).
This situation is generally indicative of a violation in either the assumption of (construct) unidimensionality or
the rule of causal correspondence (between the latent and
manifest variables). In other words, if all three
indicators are indeed "reflective" of target market reach,
then the unidimensionality assumption is clearly not met;
if, on the other hand, the concept is believed to be
unidimensional, then clearly, these measures are not
"reflective" of target market reach but possibly are
"formative or cause" indicators of the same. In either
case, these conditions are in violation of standard LISREL
assumptions and/or the model relationships are misspecified.
For these reasons, it is difficult to evaluate the
"substantive" meaning of the relationship between target
market reach and marketing effectiveness, despite the
"statistical" significance of the path coefficient. ^
17 8 Here, one may also conjecture that the "negative relationship" between target market reach and marketing effectiveness may be reflective of the "theory in use" in the management of retail enterprises. More specifically, for those stores which are "already" located in markets with favorable demographics (to the focal unit), it may be that the "marketing effort" is "reduced and/or reallocated to other uses" in developing and facilitating exchanges. This post hoc hypothesis is worthy of further examination in future research.

355An Evaluation Of Research Results-- H-11.
In the final set of research hypotheses, the direct
relationships between the elements of unit conduct are
individually and collectively related to store performance.
In general, the results of the empirical analyses from all
three samples indicate that these links are in the direction
predicted, and with few exceptions, statistically
significant.’ ® However, it should be noted that the
"relative influence" of these factors on store performance
are not uniform across metropolitan and nonmetropolitan
markets.Target market reach, for example, is a more
important factor in nonmetropolitan markets, while the
relative size of unit is similarly more important in metropolitan markets. On the other hand, although both
managerial effectiveness and expertness have similar
influences on store performance, it appears that these
factors "count" more in metropolitan markets. Furthermore,
for stores located in metropolitan markets, marketing
effectiveness seems to have no significant impact on store
performance.
179 Here, the two exceptions are the insignificant links between the relative store size and performance in the complex models for both the overall sample and nonmetropolitan market subsample; and the link between marketing effectiveness and performance in nonmetropolitan markets.

356An Overal 1 Evaluation Of Empirical Analvses
Reflecting on the analyses and interpretation of the
findings from the empirical analyses, it is important to
note and reemphasize several points.
First, as it was noted at the begining of the
statistical analyses in Chapter 6, in this research no attempt was made to obtain "better" fitting models. For
example, throughout the statistical applications, correlated
errors were not allowed despite the favorable diagnostics from LISREL analyses. Similarly, with few exceptions, every
attempt was made to use "all" the possible indicators of a
given concept. The former strategy was used in order to
avoid further interpretational confounding that would have
been introduced by the post hoc systemic factors. The
latter strategy, on the other hand, was employed in order to
avoid selection biases.’®®
Second, up to this point no mention was made of the
"identification" status of the model specifications. Hence,
here it is appropriate to note that, in all of the LISREL
applications, the diagnostics from the analyses did not
signal a problem with respect to the identifiability of any
of the parameters. In general, all the correlation and
covariances were well behaved and there was no
’®® In this regard, the preceding discussion on target market reach is illustrative of some of the potential problems.

3571 11-conditioning in these matrices. For all models, the
identification status of the LISREL specification was
checked using the following algorithm suggested by Joreskog
and Sorbom (1983): after choosing a set of reasonable
values for the free parameters, î2l was computed. Then the
program was rerun with this 12) as the "input matrix," and
all the free parameters in the original model were
reestimated. According to the authors.
If this results in the same estimated values as those used to generate , then it is most likely that the model is identified. Otherwise, these parameters which gave a different value [in the second run] are probably not identified (p, 1.24).
In all the LISREL analyses, application of the preceding
algorithm did not give an indication of an unidentified
parameter.
Third, as it was noted in Chapter 6 and in the
preceding discussion, the measurement properties of the
constructs Used in this research were mixed at best. Of the
eleven unobservables, two were assumed to be measured
perfectly by a single indicator (i.e., overstoring and
relative size), another two were "forced" to have single
indicators on the basis of post hoc analyses (i.e., target
market reach and managerial expertness). These assumptions,
of course, are rather difficult to justify. Hence, some of
the findings from the empirical analyses should be seen as
only "tentative" conclusions, subject to empirical

358verification in other contexts with hopefully "better"
measurements.
Fourth, it should be noted that all of the "causal
inferences" in this research were based only on logical
criteria and not on the statistical results. Hence, for
example, when demand character was hypothesized and/or
evaluated to have a "direct influence" on overstoring, the
inference was based on the logical inconsistency (and hence
elimination) of the alternative "explanation" that some
measure of store space "produces" incomes or wealth in the
trading area.
Finally, it should be emphasized that both the
conceptual development and the empirical analyses of this
study were restricted to a very limited set of market
conditions and behavioral elements. Although these factors
are fairly representative of some the factors which may
impact retail store performance, they certainly are not
exhaustive of all the possible factors. The intent here has
been to provide a "skeleton" of the type of factors and
relationships that can be entertained in future research.

359Implications Of Research For The Management Of Retai1
Enterprises
Although the empirical, statistical analyses of the
preceding section provide important insights into some of
the factors that influence retail store performance, these
theoretical findings are not any more "directional" in
practical terms than those reported by the previous research. Furthermore, the "substantive" conclusions drawn
on the basis of statistical significance does not
neccessarily imply "practical significance." It is also
conceivable that, in some cases, statistical insignificance
may have significant practical import.
Probably the most effective way to communicate the
managerial implications of this study is to "recast" some of
the previous findings in a number of policy matrices.’®’ In
the following series of Exhibits, a limited sample of these
matrices are presented and their implications for the
management of retail enterprises are discussed.It will be recalled that both overstoring’® 2 and
relative size of unit’®® were found to have an inverse
’®’ A policy matrix is essentially a two-way contingency table (or a cross-tabulation), where the two axes represent the independent factors, while the cell entries correspond to a "dependent" variable.
’®2 Overstoring is measured by SPCPHH, i.e., total retail space per household.
’®® Relative size of unit is measured by CSTCS, i.e., gross leasable space of top competitor to total ratai 1 space of focal unit.

360relationship to store performance. The results from
structural equations, however, indicated that overstoring
was not a (statistically) significant factor. The relative
influence of these factors on store performance is
sunmiarized in a policy matrix in Exhibit 84.i**
Note that both overstoring and relative size of unit
have an important depressive effect on the ROI and
profitability of the retail units.’®® In markets where there
is a "low" level of overstoring, both ROI and profitability
moderately "declines" as the unit is progressively more undersized. However, in markets where there is a "high"
degree of overstoring, the relative size of unit becomes a
"significantly more important" factor. Note that compared
to the best scenario (i.e., the low-low cell), the worst
scenario (i.e., the high-high cell) results in dramatically
lower level of RDI (41.3% vs 25.1%) and profitability
performance (6.5% vs 2.6%).Clearly, however, relative size of store is the more
dominant of the two factors. Note that at all levels of
overstoring, as the relative size of of competition gets
’® In this and other exhibits, the "subdivisions" of the factors were determined by examining the frequency distributions of the relevant manifest variables in order to obtain approximately equal cell sizes.
’®® ROI is defined as net profit before taxes and (corporate) overhead divided by the sum of average inventory investment and replacement value of store fixtures. Profitability is defined as the net profit before taxes expressed as a percent of net sales.

361larger, both the ROI and profitability of the stores
significantly declines. This is especially evident in
moderately to highly overstored areas where the "penalty"
for lower capacity potential is a reduction in the ROI
performance of nearly 50 percent, and for profitability
performance, a decline of close to 65 percent.
Exhibit 85 summarizes the results of a similar
analysis where target market reach’®® and relative store
size are the two independent variables. In the structural
relations, it will be recalled that target market reach as a
strategic locational element was found to have an important
positive influence on store performance. The figures in the
policy matrices of Exhibit 85 substantially corroborate this finding.
Note that, regardless of the relative size of the
unit in the marketplace, the higher levels of target market
reach invariably leads to higher levels of ROI and
profitability performance. In the best of all possible
worlds, (i.e., high target market reach and low relative
size of competition), the average ROI for the sample stores
is 60.2 percent. Compared to the worst case scenario,
(i.e., high relative size of competition and low target
market reach), this figure is approximately three times as
large for ROI [20.7%], and nearly four times as large for
186 Target market reach is measured by MINORS, i.e., the percentage of "minorities" in the trading area.

362profitability performance [8.7% vs 1.8%, respectively].
However, it should be noted that despite the "gains"
from reaching the intended demand base, relative size of
unit in the marketplace is still an important "depressive"
factor on store profitability and ROI. As both policy
matrices clearly indicate, irrespective of the level of
target market reach, both the ROI and profitability of the
stores decline as the unit is progressively undersized.
This negative influence is especially traumatic for those
stores with moderate to low target market reach (cf., the
first and third "rows" in Exhibit 85).
In Exhibits 86 and 87, the relative influence of
target market reach on store performance is assessed in the
context of two supply conditions.
The figures in Exhibit 86 generally suggest that
when there is a close match between the actual and target
demand base in the marketplace, the level of overstoring is
no longer a major negative influence on store performance.
More specifically, these policy matrices indicate that at any level of overstoring, the closer the fit between the
actual and target demand base, the higher the ROI and
profitability performance. However, at moderate to high
levels of target market reach, progressively higher
overstoring does not significantly alter either the ROI or
profitability of the retail units.

363EXHIBIT 84
Profitability And ROI Impact Of Relative Size AndOverstoring
Relative Size Of Competition
OverstoringLow Moderate High
Low 41.3* 41.4 34.3
Moderate 49.6 34.1 34.2
High 50.0 31.3 25.1
Relative Size Of Competition
OverstoringLow Moderate High
Low 6.5** 5.5 4.8
Moderate 8.8 5.3 4.1
High 7.5 4.0 2.6
* Return On Controllable Assets (%)** Net Profit Before Taxes

364EXHIBIT 85
Profitability And ROI Impact Of Relative Size And TargetMarket Reach
Target Market Reach
Relative Size OfLow Moderate High
Competi tionLow 38.5* 49.0 60.2
Moderate 24.4 45.2 44.7
High 20.7 28.8 50.6
Target Market Reach
Relative Size OfLow Moderate High
CompetitionLow 6.6** 7.9 8.7
Moderate 2.4 7.2 6.8
High 1.8 3.2 7.8
* Return On Controllable Assets (%)** Net Profit Before Taxes (%)

365The relative presence of intercept competitors in
the marketplace,’®’ on the other hand, has an important
negative influence on store performance (see Exhibit 87).
It will be recalled that intercept competitors (e.g.,
discount retailers, super drug or combination stores) with
their large size, operating economies, and broad assortments
are a dislocative force in most retail markets. The results
of the two way analyses suggest that in those markets where
there is a strong presence of such retailers, the ROI for
the focal units is lower approximately 10 to 12 percentage
points, regardless of the relative target market reach. Similar conclusions also hold when profitability performance
of the stores is considered. However, in the latter case, it appears that high target reach does have an alleviating
(positive) influence (cf., the first and last "rows" in the
second policy matrix of Exhibit 87).
The two factors which appear to have an important
"negative" influence on store performance are combined in the two policy matrices of Exhibit 88. Although the
preceding analyses indicate that both the presence of
intercept competitors and the relative size of unit are
strongly depressive of store performance, one may be curious
to know which one of the two is the more "evil" factor.
187 Presence of intercept competitors is measured by INTCP2, i.e., the percentage of retail space accounted by these competitors (see Chapter 5).
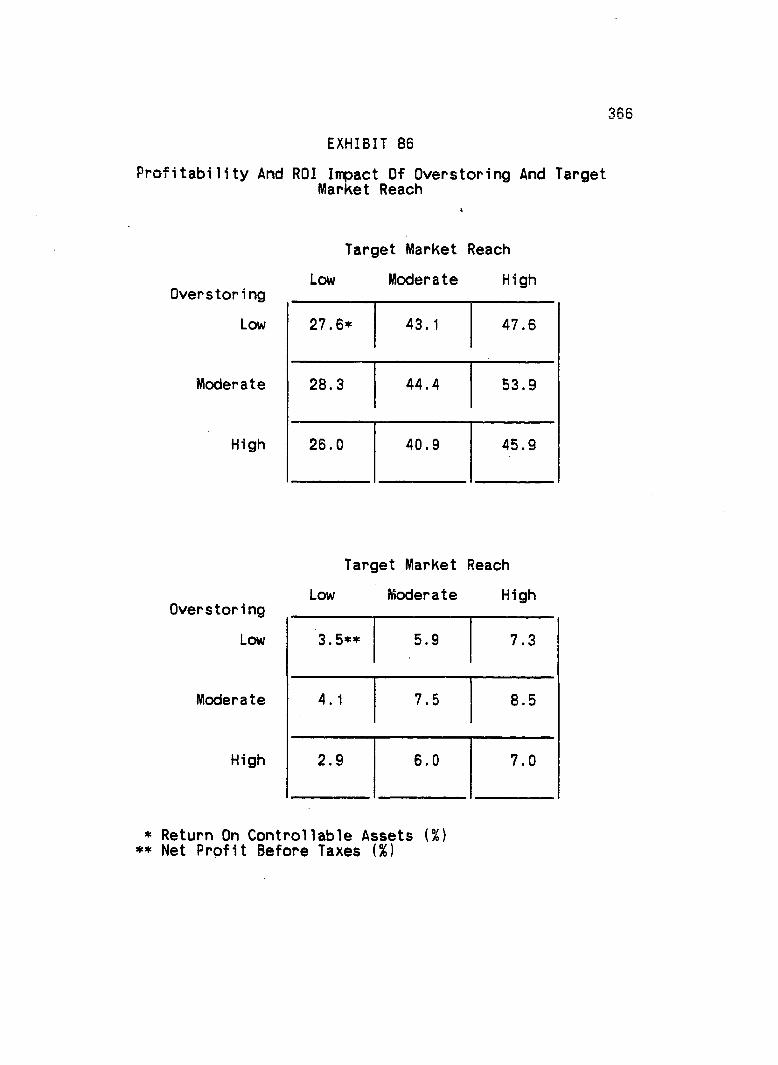
366
EXHIBIT 86Profitability And ROI Impact Of Overstoring And Target
Market Reach
Target Market Reach
OverstoringLow Moderate High
Low 27.6* 43.1 47.6
Moderate 28.3 44.4 53.9
High 26.0 40.9 45.9
Target Market Reach
OverstoringLow Moderate High
Low 3.5** 5.9 7.3
Moderate 4.1 7.5 8.5
High 2.9 6.0 7.0
* Return On Controllable Assets (%)** Net Profit Before Taxes

367EXHIBIT 87
Profitability And ROI Impact Of Target Market Reach andIntercept Competition
Relative Presence Of Intercept Conpetitors
Market ReachLow Moderate High
Low 32.3* 29.1 24.3
Moderate 49.0 39.2 40.0
High 60.7 40.4 48.0
Target Market Reach
Low
Moderate
High
Relative Presence Of Intercept Competitors
Low Moderate High
4.8** 3.9 2.6
7.1 6.3 5.4
8.1 6.7 7.9
* Return On Controllable Assets (%)** Net Profit Before Taxes (%)

368The figures in the policy matrices of Exhibit 88
suggest that relative size of the unit (in relation to top
competi tion) is clearly the more dominant negative influence
on store performance. Compared to the ROI for the most
"favorable" situation (i.e., 52.1% in the low-low cell), the
most undersized retail units have an ROI performance of 25.7
percent, whereas the concentration of intercept competitors results in an ROI of 37.2 percent. The figures for
profitability performance give essentially the same
conclusions.In the structural relations, the "qualities" of
marketing and managerial effort’®® were found to be two
independent factors. However, the results of the empirical
analyses also indicated that these two factors have
significant "direct" effects on store performance. In
Exhibit 89, the ROI and profitability impact of these two
factors are summarized in the two policy matrices.Note that in the worst case scenario (i.e., low
levels of both managerial and marketing effectiveness), the
retail stores average an ROI of 13.7 percent and a negative
level of profitability performance [-1.1%]. However, as the
figures of both policy matrices indicate, stores with
progressively "more able" managers "turn-in" increasingly
1®® These two variables are measured by the summated scores of the items that make up their indicators (see Chapter 5).

369EXHIBIT 88
Profitability And ROI Impact Of Relative Size And InterceptCompeti tion
Presence Of
Relative Size Of Competition
Low Moderate High
Competi torsLow 52.1* 41.4 25.7
Moderate 36.0 35.0 30.0
High 37.2 32.3 24.0
Presence Of
Relative Size Of Competition
Low Moderate High
Competi torsLow 8.3** 6.3 2.1
Moderate 6.1 4.1 3.7
High 5.7 4.6 2.0
* Return On Controllable Assets (%)** Net Profit Before Taxes ( % )

370higher levels of ROI (44.9%) and profitability (7.5%).
The effect of higher marketing effectiveness, on the
other hand, is generally less dramatic. Note that, when
managerial effectiveness is low, stores with the best
relative overall position in the marketplace (compared to
top competition), produce an ROI of only 23.6 percent and a
profitability of 2.9 percent.
The figures of Exhibit 89 generally reinforce the
conclusions from the earlier statistical analyses (i.e.,
managerial effectiveness is the "more" important of the two factors). However, these figures also suggest that the
"cofribined" influence of the two factors have a significant
impact on store performance which is not immediately
apparent from the structural relations.The profit payoff from another dimension of the
quality of management, the expertness of store manager,’®®
is summarized in Exhibit 90. As the figures of the two
policy matrices indicate, the combination of experience and
abilities produces the best RDI and profitability
performance. However, if one had to choose between
experience and abilities alone, the results of the two way
analyses suggest that "experience," other things being
equal, is probably a safer "bet" for higher retail store
performance.
’®® Managerial expertness is measured by MGRRTL, i.e., store manager's total years of retailing experience.

371EXHIBIT 89
Profitability And ROI Impact Of Marketing And ManagerialEffectiveness
Managerial Effectiveness
MarketingLow Moderate High
EffectivenessLow 13.7* 29.3 44.9
Moderate 25.1 40.4 . 60.5
High 23.6
. . . . .
52.5 60.9
Managerial Effectiveness
Low Moderate High
EffectivenessLow -1.1** 4.1 7.5
Moderate 2.4 6.3 9.2
High 2.9 9.9 9.8
* Return On Controllable Assets (%)** Net Profit Before Taxes (%)

372EXHIBIT 90
Profitability And ROI Impact Of Managerial Effectiveness AndExpertness
Managerial Effectiveness
ManagerialLow Moderate High
ExpertnessLow 18.2* 23.2 27.2
Moderate 35.4 41.6 40.2
High 47.8 54.3 63.3
ManagerialExpertness
Low
Moderate
High
Managerial Effectiveness Low Moderate High
0.6** 1.7 3.5
5.3 7.3 6.5
8.3 7.9 10.0
* Return On Controllable Assets (%)** Net Profit Before Taxes { % )

373Exhibit 91 summarizes the impact of target market
reach and marketing effectiveness on store performance. It
will be recalled that the results of the statistical
analyses, contrary to a priori expectations, indicated that
target market reach had a "negative" influence on marketing
effectiveness. Hence, the structural relations were
indicative of an "indirect" negative link between target
market reach and store performance.
However, note that in all markets, irrespective of
the level of target group reach, both the ROI and
profitability of the stores are higher, the higher the
relative effectiveness of marketing effort. Similar
conclusions also hold for the target market reach when the
marketing effectiveness of the unit is held constant. More
importantly, however, also note that progressively "higher"
levels of ROI and profitabi1ity performance consistently
result from the "combined" effects of these two factors
(cf., the ROI and profitability percentages in the diagonal
cells). Hence, although target market reach may have a
depressing "indirect" effect on store performance, the "net
effect" of these two factors are substantially in the
direction expected in the research hypotheses.
Finally, the profit payouts from "better" marketing
effort in the nore competitive markets are illustrated in
the two policy matrices of Exhibit 92. Here, note that when
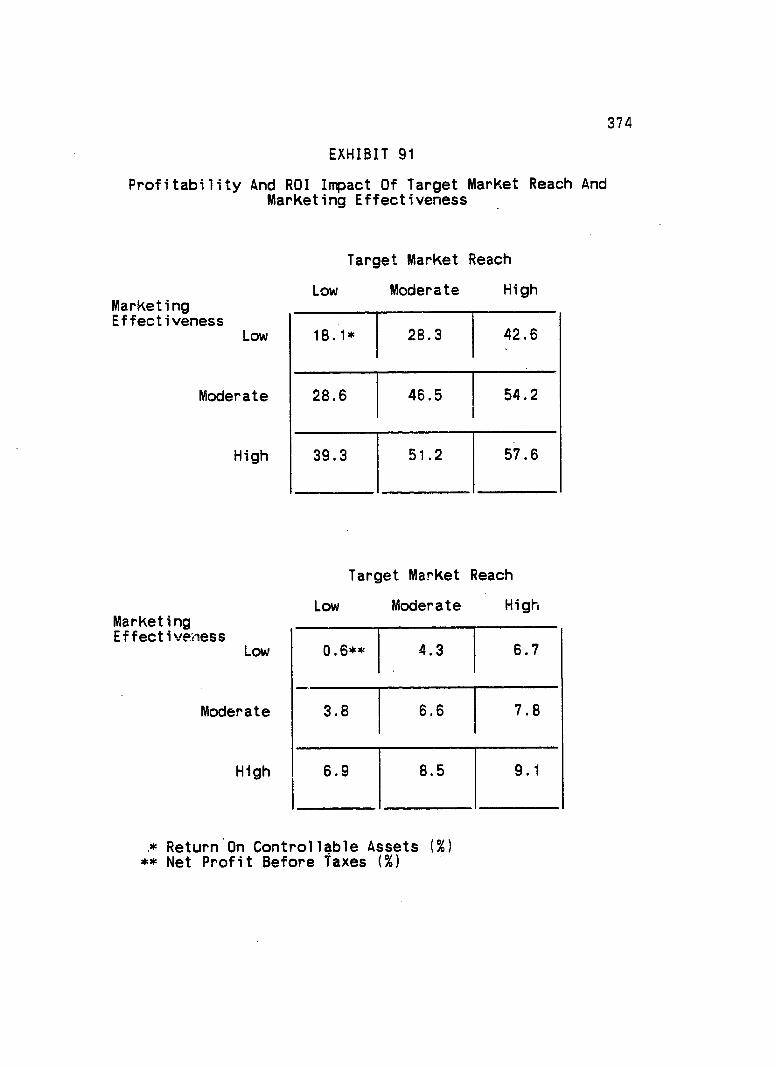
374EXHIBIT 91
Profitability And ROI Impact Of Target Market Reach AndMarketing Effectiveness
Target Market Reach
MarketingLow Moderate High
EffectivenessLow 18.1* 28.3 42.6
Moderate 28.6 46.5 54.2
High 39.3 51.2 57.6
Target Market Reach
MarketingLow Moderate High
EffectivenessLow 0.6** 4.3 6.7
Moderate 3.8 6.6 7.8
High 6.9 8.5 9.1
* Return On Controllable Assets (%)** Net Profit Before taxes (%)
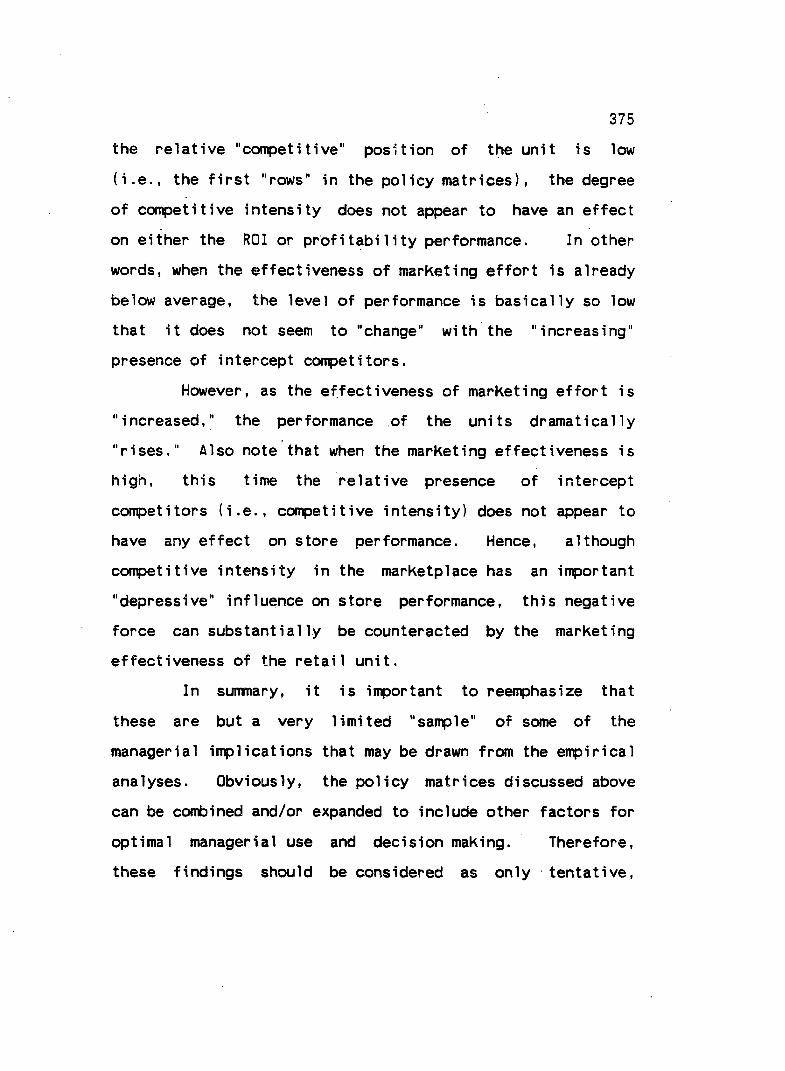
375the relative "competitive" position of the unit is low
(i.e., the first "rows" in the policy matrices), the degree
of competitive intensity does not appear to have an effect
on either the ROI or profitability performance. In other
words, when the effectiveness of marketing effort is already
below average, the level of performance is basically so low that it does not seem to "change" with the "increasing"
presence of intercept competitors.
However, as the effectiveness of marketing effort is "increased," the performance of the units dramatically
"rises." Also note that when the marketing effectiveness is
high, this time the relative presence of intercept
competitors (i.e., competitive intensity) does not appear to
have any effect on store performance. Hence, although
competitive intensity in the marketplace has an important
"depressive" influence on store performance, this negative
force can substantially be counteracted by the marketing
effectiveness of the retail unit.
In summary, it is important to reemphasize that
these are but a very limited "sample" of some of the
managerial implications that may be drawn from the empirical
analyses. Obviously, the policy matrices discussed above
can be combined and/or expanded to include other factors for
optimal managerial use and decision making. Therefore,
these findings should be considered as only tentative.

376EXHIBIT 92
Profitability And ROI Impact Of Intercept Competition AndMarketing Effectiveness
Relative Presence Of Intercept Competitors
MarketingLow Moderate High
EffectivenessLow 22.7* 26.2 22.4
Moderate 50.5 39.1 34.5
High 49.4 43.0 40.1
Relative Presence Of Intercept Competitors
Low Moderate High
EffectivenessLow 2.7** 2.8 2.9
Moderate 7.0 5.6 4.9
High 8.2 8.2 8.1
* Return On Controllable Assets (%)** Net Profit Before Taxes (%)

377instrumental conclusions, subject to further analyses,
testing, and empirical study.
Some Further Thoughts And Reflections On The Research
In the Introduction to this research, the overall
objective of the study was summarized under two headings.
Specifically, it was hoped that, in trying to explain and
understand retail store performance, this study would
1. contribute to the existing thought, theoryand methodology in the marketingdiscipline, and further,
2. provide a frame of reference for; the retailexecutive and manager which can be used tomore effectively manage retailestablishments.
In this final section, it is appropriate that a "self"
evaluation and an assessment of these objectives are made.
Contributions To Theorv
The contribution of this effort to the existing
thought and theory in the marketing discipline lies in the
proposal and development of an explicit research paradigm
and a model for the explanation of retail store performance.
In all the previous studies of retailing performance, few
researchers have proposed theoretical models, and even fewer
have tested their conjectures.

378Most of the investigations reviewed in Chapter 3
were studies that were based on readily available, secondary
data sources, frequently with no clear conceptualization of
the constituent elements. Still others were predictive,
forecasting models which, by design, had no a priori
hypotheses, and simply reported the results of "good
fitting" empirical models. In all of these studies, the
scope of research was also limited to fairly narrow, limited
aspects of retail markets and/or unit behavior.
In sharp contrast to these earlier investigations,
the model outlined in this thesis presents a skeleton for a
general theory for the explanation of retail store
performance. In this study, probably for the first time in
retailing performance research, a number of theoretical and
derived notions are proposed, defined, and interrelated in a
network of structural relations. In this regard, the
conceptualizations of this study provide a general frame of
reference which other researchers can build and expand upon
in the future.The paradigm of research which has importantly
guided this study combines the elements from the economic
theory of the firm with those from the more behavioral
models of the enterprise. In the previous marketing and
retailing literature, these two models have been relatively
isolated, and hence, the research streams have been severely

379disjointed. In this regard, the model proposed in this
thesis is also illustrative of some of the “ways and means"
through which various research programmes in, for example,
retail patronage, retail structure, retail image, and
retailing performance studies can be brought together in one
general theoretical network. In this sense, this study is
also a modest attempt at suggesting a viable avenue for a general theory of retailing.
Contributions To Research Methodology
The primary contribution of this investigation to
research methodology lies in its introduction of a
structural equations methodology to the retailing
performance literature.
To date, retailing researchers have neither proposed
nor tested theoretical models which hypothesize relationships between theoretical and derived concepts
(i.e., nonobservat i ona1 research hypotheses). But more
importantly, in none of the previous studies have the
researchers accounted for the measurement errors in their
operationalizations of these concepts.’®®
’80 Rather, the past practice has been to hypothesize relationships among ill or undefined concepts, and then to empirically test these relationships based solely on single operationalizations.

380As it was noted in Chapters 4 and 5, there is an
important distinction between the ''theoretical" definitions
of the concepts and their empirical referents. When this
distinction is ignored, an investigator must necessarily
assume perfect measurements (reliability) and perfect
correspondence between a concept and its indicators
(validity). These are not only untenable assumptions in all
areas of social science research, but more importantly, such
assumptions have important bearings on the estimated
regression and path coefficients. Hence, without a
consideration of the measurement properties, the
(statistical) results from most empirical analyses are
necessarily biased, inefficient, and/or unstable. This
strict adherence to the defunct operationalist mode of
thinking (or conducting research) in retailing has
undoubtedly contributed to the current characterization of
researchers in this field as "scientific laggards," and
their research as "backward."The structural equation methodology used in this
research provides a means for representing theoretical
constructs, theoretical relationships, and the
correspondence procedures among the theoretical concepts and
empirical measures in a single structure. Hence, the
measurement properties of the hypothesized model can be
tested simultaneously with the structural relationships.

381Thus, with this procedure, it is possible to discover and/or
confirm relatively unmixed, invariant effects of one
variable on another. This is in sharp contrast to the
simple empirical association given by the correlation
coefficient or, the conditional mean of a dependent variable as a function of a set of "explanatory" variables, given by
the regression analysis.The rigor afforded by the structural equations
methodology, however, does not come without its costs and
difficulties. First, the technique requires a reasonable
facility in psychometric theory and econometric methods as
well as a good working knowledge in multivariate statistics.
For a more informed use of the technique, it is useful that
one also have some background in what are generally
considered to be fairly esoteric discussions on the role of
causality, the rules of correspondence, and the philosophy
of science in general. Few researchers, and certainly not
this writer, can claim to have equal facility in all of
these areas.Second, it is rather easy to make "mistakes" in the
specification of the structural relationships. This may
partly be a result of the relative "scarcity" of conceptual
and/or theoretical knowledge in the field, and partly be due
to the "complexity" of the model(s) entertained. Whatever
the case may be, it is important to note that in none of the

382solution algorithms (e.g., LISREL) are there clear cut
"statistics" which tell the user what or where the
"mistakes"•are, or how to correct them. It is for this
reason that it is "widely" encouraged that there be a fairly
good theory, or at least, some conceptual basis for the
hypothesized relationships. Otherwise, as it was noted in
Chapter 6, it is almost always possible to find a subset of
measures or structural relations which will fit the data
without any substantive meaning.
Third, as with any emerging statistical technique,
there are a number of unsettling ambiguities as to what certain (statistical) quantities mean, how they are to be
interpreted, and what conclusions could be drawn from them.
There are a number of rules of thumb, many of which are
still debated and discussed in the literature. Hence, the
structural equations methodology is a "dynamic" statistical
tool which requires constant review of the current
literature and learning while doing.
Fourth, structural equations modeling requires
fairly costly data collection and processing methods. In
order to tap the full potential and power of the statistical
methodology, several indicators of the each theoretical
notion need to be obtained. In many cases this may not be
feasible in actual research settings. Furthermore, for
fairly large models (e.g., 10-12 constructs, each measured

383with 2-3 indicators) and/or in the case of poorly
operationalized or ill-defined models, the computer time may
be a real constraint.’®’
Finally, and probably the most important value (and
difficult part) in using structural equations methodology
lies in the stringent requirements imposed on the researcher
to fully explicate the assumptions typically made in
empirical research. In most other statistical analysis
methods, the researcher can probably "get by" with a minimum
of the requirements for any one technique. With structural
equations methodology, however, these assumptions become an
integral part of the hypothesized network of relationships.
As it was noted in previous chapters, for example,
the measurement properties of the theoretical concepts in a structural model are a set of "auxiliary hypotheses."
Similarly, every error term "specified" and/or any parameter
that is "not specified" in a model, in effect, represents an
assumption to be evaluated in the statistical relations.
For models such as the multiple construct
relationships of Exhibit 22, this is indeed an arduous, if
not an impossible task. But as Blalock (1964) eloquently
noted two decades ago
19’ The data processing for this research was done on an IBM 3081 Model D computer, using remote job entry from IBM 3278 or its equivalent terminals. For the more complex models, CPU time for LISREL applications was typically 1 to 5 minutes.

384
a failure to state one's assumptions explicitly does not make them disappear in some magical way. It does, however, make it much more difficult to evaluate and reject a given theoretical system. Theoretical inadequacies are harder to spot, and untestable theories remain to clutter up the literature. Such a state of affairs is hardly desirable (p.171).
In summary, although no claim can be made as to its
error-free application, the attempt at utilizing this
powerful technique in this study is a significant
contribution to the methodology of research in retailing
discipline.
Contributions To Practice
Some of the more specific managerial implications of
the empirical, statistical analyses of this investigation
are already noted in the preceding sections and need not be
repeated here. At a more general level, the contribution of
this study to the practice of retailing lies not so much in
these extant "findings" but probably in the "overall
methodology" of the research.
As it was noted earlier, the previous investigations
of retailing performance have been "soft" on adequate
conceptualizations, and hence, weak in their practical
implications. Furthermore, these studies have utilized a
set of statistical tools which also have significant

385shortcomings. The combination of these two factors produce
a state of affairs which is highly undesirable from both a
theoretical and a practical point of view. Clearly, the
limitations of statistical analyses may "bias" not only the
extant research findings, but also the substantive,
practical implications or inferences that may be drawn from
them.
The holistic construal that was introduced in this
investigation has the potential for not only the testing of
substantive research hypotheses, but also for the
"exploration" of the nature of retailing phenomena in a way
that was not possible a few years ago. In this regard, it
is important to note that there is nothing in the "nature"
of structural equations methodology that would preclude its use as a forecasting or exploratory tool. The added benefit
here is a more rigorous and "realistic" way of looking at
the "interdependencies" among the various factors, which
standard applications of single stage, OLS regression
analyses are not designed and/or capable to do.
In summary, the more rigorous empirical analyses,
and the potential benefits from them, are not exclusive to
the domain of scientific research but can be profitably used
in more practical applications as well. In this regard, it
is hoped that this investigation provides not only a
"theoretical framework" for future research, but also a

386"practical framework" for the retail analysts and executives
in programming their operations.
Summary and Conclusions
Clearly, the conceptual and empirical research
reported in this study is but only a modest "beginning" to
understanding and "explanation" of retail store performance.
As It was noted at the start of this investigation, "there
is much more theorizing that needs to be done, and many
aspects of retailing process remain to be explored and
understood."In the short-run, and for ultimate theoretical
elegance and managerial relevance, we must bring together
the retail patronage research and the retailing performance
research. Both of these research programmes, in themselves,
lack a disturbing closure. Retailing performance research,
without a consideration of the factors due to the primary
agents to the "exchange," is deficient in a major way. So
is retail patronage research, where the economic "outcomes"
of the "exchange" are frequently ignored. The
complementarities of these two research programmes should
not be ignored in future research.As for the long-run, we should be constantly
searching for alternative, newer and bolder perspectives in
looking at the retailing phenomena. This study was based on

387"a" world view popularly known as the
Structure-Conduct-Performance paradigm. This paradigm, as
with all paradigms, has its shortcomings. It is the
"belief" of this . writer that we may obtain a richer
description and mapping of retailing phenomena through a
game theoretic, "response-response" paradigm. This approach
is infinitely more complex than the one adopted in this
study and yet is much more realistic.If the metaimplications of this research as well as
the "realities" of the marketplace are any guidance, the
structure of the retail markets change, various
institutional forms evolve or die, differential retail
patronage occurs, and the performance of retail units results, ultimately, from the individual and collective
"responses" of retail units to the actions or decisions of
other units and to various market forces. And if "history"
is any guidance, we should not be able to ever "capture"
retailing at rest, but only in snapshots through time.
Collectively, then, these are the challenges facing
us in the future.

REFERENCES
Aaker, David A. and Richard P. Bagozzi (1979), "Unobservable Variables in Structural Equation Models with an Application in Industrial Selling," Journal of Marketing Research. 16 (May), 147-158.
Aaker, David A., et al (1980), "On Using Response Latency to Measure Preference." Journal of Marketino Research. 17. 237-244. "
Abel 1, Derek J. (1980), Defining The Business--The Strateav Point of Strategic Planning. Englewood Cliffs: Prentice Hall.
Acito, Franklin and Ronald D. Anderson (1984), "On Simulation Methods for Investigating Structural Modeling," Journal of Marketing Research. 21 (February),107-112.
Alderson, Wroe (1948), "A Formula For Measuring Productivity in Distribution," Journal of Marketing. 12, (April), 442-448.
Alderson, Wroe (1950), "Survival and Adjustment in Organized Behavior Systems," in Theorv in Marketing. R. Cox and W. Alderson (Eds.), Chicago: Richard D. Irwin, Inc., 65-87.
Alderson, Wroe (1965), Dvnamic Marketing Behavior-AFunctionalist Theorv of Marketing. Homewood, Illinois: Richard D. Irwin, Inc.
Alderson, Wroe and Reavis Cox (1948), "Towards A Theory Of Marketing," Journal of Marketing. 13 (October), 137-152.
Alderson, Wroe and Stanley J. Shapiro (1964), "Towards a Theory of Retail Competition," in Theorv in Marketing. R. Cox, W. Alderson and S. J. Shapiro (Eds.), Homewood. ILL : Richard D. Irwin, Inc., 190-212.
Alt, Richard M. (1949), "Competition Among Types of Retailers in Selling the Same Coomodity," Journal of Marketing. 14 (October), 441-447.
- 388 -

389Alwin, D. F. and R. C. Tessler (1974), "Causal Models,
Unobserved Variables, and Experimental Data," The American Journal of Sociology. 80, 58-86.
Anderson, Paul F. (1982), "Marketing, Strategic Planning and The Theory of the Firm," Journal of Marketing. 46 (Spring), 15-26.
Anderson, Ronald D., Jack Engledow and Helmut Becker (1979), "Evaluating the Relationships Among Attitude Toward Business, Product Satisfaction, Experience and Search Effort," Journal of Marketing Research. 16 (August), 394-400.
Applebaum, William (1951), "Studying Consumer Behavior in Retail Stores," Journal of Marketing. 15 (October), 172-178.
Applebaum, William (1965), "Store Performance in Relation to Location and Other Characteristics," Chain Store Age, (November), E14-E16.
Applebaum, William (1966), "Methods for Determining Store Trade Areas, Market Penetration and Potential Sales," Journal of Marketing Research. 3 (May), 127-141.
Arndt, Johan (1972), "Temporal Lags in ComparativeRetailing," Journal of Marketing. 36 (October), 40-45.
Arndt, Johan (1977), "Exploring Relationships Between Market Structure and Performance in Retailing," in Strategv+Structure=Performance. The Strategic Planning Imperative Hans B. There11i TËd.TT"Indiana University Press, 237-246.
Arndt, Johan (1983), "The Political Economy Paradigm:Foundations For Theory Building in Marketing," Journal of Marketing. 47 (Fall), 44-54.
Arndt, Johan and Leif Olsen (1975), "A Research Note on Economies of Sale in Retailing," Swedish Journal of Economics. 77, No:2, 207-221.
Arndt, Johan and Thorolf Helgesen (1981), "Marketing and Productivity: Conceptual and Measurement Issues," in1981 American Marketing Association Educators' Conference Proceedings. 81-84.
Arnold, Stephen J., Tae H. Oum and Douglas J, Tigert (1983), "Determinant Attributes in Retail Patronage: Seasonal, Temporal, Regional and International Comparisons,"Journal of Marketing Research. 20 (May), 149-157.

390Asher, H. B. (1976), Causal Modeling. Sage University Paper
Series on Quantitative Applications in the Social Sciences, Beverly Hills: Sage Publ.
Assael, Henry (1968), "The Political Role of Trade Associations in Distributive Conflict Resolution,"Journal of Marketing. 32 (April), 21-28.
Bagozzi, Richard P. (1974), "Marketing as an OrganizedBehavioral System of Exchange," Journal of Marketing, 38 (October), 77-81.
Bagozzi, Richard P. (1975), "Marketing as Exchange," Journal of Marketing. 39 (October), 32-39.
Bagozzi, Richard P. (1976), Toward A General Theorv For The Explanation of The Performance of Salespeople," Unpublished Ph.D Dissertation, Northwestern University.
Bagozzi, Richard P. (1977), "Structural Equation Models in Experimental Research," Journal of Marketing Research. 14 (May), 209-226.
Bagozzi, Richard P. (1978), "Reliability Assessment By Analysis of Covariance Structure," in 1978 American Marketing Association Educators' Conference Proceedings. 71-75.
Bagozzi, Richard P. (1979), "Towards a Formal Theory of Marketing Exchange," in Conceptual and Theoretical Development in Marketing. 0. C. Ferrell et a l (Eds.), Chicago: American Marketing Association, 431-447.
Bagozzi, Richard P. (1980a), "Performance and Satisfaction in an Industrial Sales Force: An Examination of Their Antecedents and Simultaneity," Journal of Marketing. 44, 65-77.
Bagozzi, Richard P. (1980b), Causal Models in Marketing. New York: John Wiley and Sons.
Bagozzi, Richard P. (1981), "Evaluating Structural Equation Models With Unobservable Variables and Measurement Error : A Comment," Journal of Marketing Research. 18 (August), 375-381.
Bagozzi, Richard P. (1982), "A Field Investigation of Causal Relations Among Cognitions, Affect, Intentions, and Behavior," Journal of Marketing Research. 19 (November), 562-584.

391Bagozzi, Richard P. (1983), "Issues in the Application of
Covariance Structure Analysis: A Further Comment,"Journal of Consumer Research. 9 (March), 449-450.
Bagozzi, Richard P. (1984), "A Prospectus for Theory Construction in Marketing," Journal of Marketing. 48 (Winter), 11-29.
Bagozzi, Richard P., Claes Forne11 and David Larcker (1981), "Canonical Correlation Analysis As A Special Case of Structural Relations Model," Multivariate Behavioral Research. 16, 437-454.
Bagozzi, Richard P. and Claes Fornell (1982), "Theoretical Concepts, Measurements, and Meaning," in A Second Generation of Multivariate Analvsis. Vol.Tl: Measurement and Evaluation. N.Y.: Preager.
Bagozzi, Richard P. and Lynn Phillips (1982),."Representing and Testing Organizational Theories: A HolisticConstrual," Administrative Science QuarterIv. 27 (September), 459-489.
Bain, Joe S. (1968), Industrial Organization. 2nd Edition. N.Y: John Wiley and Sons, Inc.
Balderston, F.E. (1956), "Assortment Choice in Wholesale and Retail Marketing," Journal of Marketing. 21 (October), 175-183.
Banks, Seymour (1951), "Comments on Alderson's Index of Sorting Balance," Journal of Marketing. 15 (January), 331-335.
Barger, Harold (1955), Distribution's Place in the American Economv Since 1869. New York: National Bureau ofEconomic Research, Princeton University Press.
Bartels, Robert (1951), "Can Marketing Be a Science?"Journal of Marketing. 15 (January), 319-328.
Bartels, Robert (1974), "Identity Crisis in Marketing," Journal of Marketing. 38 (October), 73-76.
Bartels, Robert (1976), The Historv of Marketing Thought.2nd Edition. Columbus, Ohio: Grid, Inc.
Bartels, Robert (1981), "Criteria for Theory in Retailing," in Theorv in Retai1ino: Traditional and Nontraditional Sources. Ronald W. Stampfl and Elizabeth C. Hirschman,(Eds.), Chicago: American Marketing Association,108-114.

392Bass, Frank M. (1956), "Expense and Margin Functions in Drug
Stores," Journal of Marketing. 20 (January), 236-24.
Bass, Frank M. (1958), "Mediocrity versus Chance in Drug Store Operating Ratios," Journal of Marketing. 22 (January), 307-312.
Bass, Frank M. (1959), "The Question of the 'Regression' Fallacy," Journal of Marketing. 23 (July), 420-424.
Bass, Frank M., Philippe Cattin and Dick R. Wittink (1977), "Market Structure and Industry Influences on Profitability," in Strategy+Structure=Performance. The Strategic Planning Imperative Hans B. There11i (Td.), Indiana University Press, 181-197.
Bass, Frank M., Philippe Cattin and Dick R. Wittink (1978),"Firm Effects and Industry Effects in the Analysis of Market Structure and Profitability," Journal of Marketing Research. 15 (February), 3-10.
Baumol, William J. (1957), "On The Role of Marketing' (April), 417 "Theory, " Journal of Marketing. 1 Anrill L M - ù O C s
Baumol, William J. (1959), Business Behavior. Value and Growth. N.Y: McMillan Book Co.
Baumol, William J. and Edward A. Ide (1956), "Variety in Retailing," Management Science. 3 (October), 93-101.
Baumol, William J. and M. Stewart (1971), "On The Behavioral Theory of The Firm," in The Corporate Economv. R. L. Marris and A. J. Woods (Eds.), London : McMillan Book Co.
Bearden, William 0., Subhash Sharma and Jesse E. Teel(1982), "Sample Size Effects on Chi-square and Other Statistics Used in Evaluating Causal Models," Journal of TWarketing Research. 19, 425-430.
Beckman, Theodere N. (1960), "Productivity in Wholesaling," in Productivitv in Marketing Its Measurement and Change. University of Illinois Bulletin, 58 (August), 80-104.
Beckman, Theodore N. (1961), "Measuring Productivity in Marketing," in Proceedings Of The Business and Economics Section. Washington, D.C.: Ameri'-an StatisticalAssociation, 308-318.
Beckman, Theodere N. and Robert D. Buzzell (1958),"Productivity: Facts and Fiction," Business Horizons. 1 (Winter), 24-38.

393Bender, Wesley C. (1964), "Consumer Purchase Cost--Do
Retailer's Recognize Them?" Journal of Retailino. 40 (Spring), 1-8,52.
Gentler, P. M. (1980), "Multivariate Analysis with Latent Variables: Causal Mode1ino." Annual Review of Psvcholoav. 31, 419-456.
Gentler, P. M. (1982), "Linear Systems with Multiple Levels and Types of Latent Variables," in Svstems Under Indirect Observation- Causalitv * Structure * Prediction. K.G. Joreskog and H. Wold (Eds.), N.Y.: North-Holland Publishing Co., 101-130.
Gentler, P. M. and D. G. Gonett (1980), "Significance Tests and Goodness-of-fit in the Analysis of Covariance Structures," Psvchological Bulletin. 88, 588-606.
Gentler, P. M. and D. G. Weeks (1980), "Linear Structural Equations with Latent Variables," Psvchometrika. 45, 289-308.
Gerry, Brian J. L. (1967), Geoaraohv of Market Centers and Retail Distribution. Englewood Cliffs, N.J: Prentice Hall.
Gerry, Brian J . L. and William L. Garrison (1958), "Recent Development of Central Place Theory," Papers and Proceedings of the Regional Science Association. 55, 107-120.
Gielby, William T. and Robert M. Hauser (1977), "Structural Equation Models," Annual Review of Sociology, 3 (Month), 137-161.
Bishop, Willard R. and G. David Hughes (1967), "SomeQuantitative Aids to Merchandising Management," Journal of Retailing. 43 (Fall), 39-49.
Blalock, Hubert M. (1962), "Four Variable Causal Model and Partial Correlations," The American Journal of Sociology. 68 (September), 182-194.
Blalock, Hubert M. (1964), Causal Inferences inNonexoerimental Research. New York: W.W. Norton andCompany, Inc.
Blalock, Hubert M. (1965), "Some Implications of Random Measurement Error for Causal Inferences," The American Journal of Sociology. 71, 37-47.

394Blalock, Hubert M. (1968), "The Measurement PrcrfaTem: A Gap
Between the Languages of Theory and Research," in Methodology in Social Science Research. H. M. Blalock and A. B. Blalock (Eds.I, N.Y: McMillan Book Co., 5-27.
Blalock, Hubert M. (1969a), "Multiple Indicators and the Causal Approach to Measurement Error," The American Journal of Sociology. 75, 264-272.
Blalock, Hubert M. (1969b), Theory Construction: FromVerbal to Mathematical Formulation. Englewood Cliffs, N.J.: Prentice-Hal1, Inc.
Blalock, Hubert M. (1979), "Measurement andConceptualization Problems: The Major Obstacle to Integrating Theory and Research," American Sociological Review, 44, 881-894.
Blalock, Hubert M. (1982), Conceotualization and Measurement in the Social Sciences. Beverly Hills, CA: Sage Publ.
Bliss, Perry (1956), "Preretailing and Consumer Buying Patterns Over Time," Journal of Marketing. 21 (July), 83-85.
Bloom, Gordon F. (1971), "Productivity: Weak Link in ourEconomy," Harvard Business Review. 49 (January- February), 4-14,145.
Bock, Betty (1972), Dialogue on Concentration. 01iooDolv and Profit: Concepts and Data. Conference Board.
Bohannon, Paul and George Dalton (1942), Markets in Africa. Evanston, ILL: Northwestern University Press.
Bollen, Kenneth A. (1983), Structural Eouations With Latent Variables. Draft Manuscript, Darthmouth.
Bollen, Kenneth A. (1981), "Multiple Indicators: InternalConsistency or No Necessary Relationship," Working Paper, Department of Sociology, Dartmouth, NH.
Bookstein, Fred L. (1980), "Data Analysis by Partial Least Squares," in Evaluation of Econometric Models. Academic Press, 75-90.
Boomsa, A. (1982), "The Robustness of LISREL Against Small Sample Sizes in Factor Analysis Models," in Svstems Under Indirect Observation: Causalitv * Structure * Prediction. K. G. Joreskog and H. Wold (Eds.T, N.Y.: NorTh-Hoi land, 148-173.

395Boone, Louis E. et al (1974), "City Shoppers and Urban
Identification," Journal of Marketing. 38 (July), 87-69.
Bowman, Edward H . and John B. Stewart (1956), "A Model for Scale of Operations," Journal of Marketing. 20 (January), 242-247.
Branch, Ben (1978), "The Impact of Operating Decisions on ROI Dynamics," Financial Management. 7 (Winter), 54-60.
Bridgman, Percy W. (1927), The Logic of Modern Physics. N.Y: McMillan Press.
Brock, James Leslie (1980), The Future of the Grocery Retai1ino Industry: A Forecast for the 1980's.Unpublished Ph.D Dissertation, Michigan State Uniyersity.
Brodbeck, May (1982), "Recent Deyelopment in the Philosophy of Science," in Marketing Theory: Philosoohy of Science Perspectives. R. F. Bush and S. D. Hunt (Eds.TT Chicago: American Marketing Association, 1-6.
Brooks, Robert C. (1958), "A Recent Example of theRegression Fallacy," Journal of Marketing. 23 (July), 64-68.
Bruce, Grady D. (1969), "The Ecological Structure of Retail Institutions," Journal of Marketing Research. 6 (February), 48-53.
Buck1in, Louis P. (1963), "Retail Strategy and theClassification of Consumer Goods," Journal of Marketing. 27 (January), 50-55.
Bucklin, Louis P. (1965), "Postponement, Speculation and the Structure of Distribution Channels," Journal of Marketing Research. 2 (February), 26-31.
Bucklin, Louis P. (1966), A Theory of Distribution Channel Structure. Berkeley, Calif.: IBER Special Publications.
Bucklin, Louis P. (1967a), "The Concept of Mass Intra-Urban Shopping," Journal of Marketing. 31 (October), 37-42.
Bucklin, Louis P. (1967b), "Competitive Impact of a New Supermarket," Journal of Marketing Research. 4 (November), 356-361.
Bucklin, Louis P. (1970), "National Income Accounting and Distributive Trade Cost," Journal of Marketing. 34 (April), 14-22.

396Bucklin, Louis P. (1971), "Trade Area Boundries: Some
Issues in Theory and Methodology," Journal of Marketing Research. 8 (February), 30-37.
Bucklin, Louis P. (1972), Comoetition and Evolution in the Distributive Trades. Englewood Cliffs, N.J.: Prentice-Hal 1.
Bucklin, Louis P. (1975), "A Synthetic Index of Marketing Productivity," in 1975 American Marketing Association Educators' Conference Proceedings. 556-560.
Bucklin, Louis P. (1977), "Structure, Conduct and Productivity in Distribution," inStrateov+Structure=Performance. The Strategic Planning Imperative Hans B. There11i (Ed.). Indiana University Press, 219-236.
Bucklin, Louis P. (1978a), "Research in Productivity Measurement for Marketing Decisions," in Research in Marketing. Volume-1. Jaodish Sheth (Ed.), JAI Press,1 - 2 2 .
Bucklin, Louis P. (1978b), Productivitv in Marketing. Chicago: American Marketing Association.
Bucklin, Louis P. (1981), "Growth and Productivity Change in Retailing," in Theorv in Retai1ino: Tradi tional andNontraditional Sources. Ronald W. Stanpfl and Elizabeth C. Hirschman, (Eds.), Chicago: American MarketingAssociation, 21-23.
Bucklin, Louis P. (1983), "Capital Productivity in Retailing," in Productivity and Efficiency in Distribution Svstems. David Gautschi (Ed.1, N.Y; North- Hol land, 63-73.
Buzzell, Robert D. (1963), "Is Marketing A Science," Harvard Business Review. 41 (January-February), 32-48.
Buzzell, Robert D. (1972), "Marketing and EconomicPerformance: Meaning and Measurement," Marketing ScienceInstitute, (August).
Buzzell, Robert D., Bradley T . Gale and Ralph G.M. Sultan(1974), "Market Share, Profitability and Business Strategy," Working Paper, Marketing Science Institute.
Buzzell, Robert D., Bradley T. Gale and Ralph G.M. Sultan(1975), "Market Share-A Key To Profitability," Harvard Business Review. 53, 1 (January-February), 97-106.

397Buzzell, Robèrt D. and Narci Kosann Dew (1980), "The Pilot
Study of the Profit Impact of Marketing Strategies in Retailing," Working Paper, The Strategic Planning Insti tute.
Buzzell, Robert D. and Frederik D. Wiersema (1981),"Successful Share Building Strategies," Harvard Business Review. Vol. 59 (January-February), 135-144.
Byrne, Rusty Stieff (1981), "Sources on Productivity," Harvard Business Review. Vol. 59 ( Septeirtoer-October ), 36-42.
Cady, John F. (1975), Structural and Comoetitive Effects of Retai1 Trade Regulation: A Studv of the Impact of PublicPolicv in Retai1 Market for Prescription Drugs Unpublished Ph.D Dissertation, SUNY at Buffalo.
Calder, Bobby J., Lynn W. Phillips and Alice H. Tybout(1981), "Designing Research For Application," Journal of Consumer Research. 8 (September), 197-207.
Campbell, Donald T . (1969), "Definitional versus Multiple Operationism," et aj., 2 (Summer), 14-17.
Campbell, Donald T. and Donald W. Fiske (1959), "Convergent and Discriminant Validation By The Multitrait-MuItimethod Matrix," Psvchological Bulletin. 56 (March), 81-105.
Carman, James M. (1980), "Paradigm for Marketing Theory" in Research In Marketing. Vol.3. Howard Sheth (Ed.), JAI Press.
Carnap, R. (1956), "The Methodological Character of Theoretical Concepts," in Minnesota Studies in the Philosophv of Science. H. Feigl and M. Scriven (Eds.), Minneapolis, MN: University of Minnesota, 38-76.
Channon, Derek F. (1973), The Strateov and Structure of British Enterprise. Boston: Harvard University.
Chayes, Felix and William Kruskal (1966), "An Approximate Statistical Test For Correlations Between Proportions," Journal of Geoloov. 74 (September), 692-702.
Christaller, W. (1966), Central Places in Southern Germany. Englewood Cliffs, N.J: Prentice Hall.
Churchill, Gilbert A. Jr. (1979), "A Paradigm for Developing Better Measures of Marketing Constructs," Journa1 of Marketing Research. 14 (February), 64-73.

398Churchill, Gilbert A., Nei1 M. Ford and Orville C. Walker,
dr., (1981), "Managing the Retail Salesforce," in Theorv in Retailing: Tradi tional and Nontradi tional Sources.Ronald W. Stampfl and Elizabeth C. Hirschman, (Eds.), Chicago: American Marketing Association, 34-50.
Churchman, West C. (1965), "Reliabi1i ty of Models in the Social Sciences," in Models. Measurement and Marketing. Peter Langoff (Ed.), Englewood Cliffs, N.d: Prentice Hall, 23-38.
C1 ague, Ewan (1985), "An Evaluation of Current Productivity Measure for Trade," in Froductivitv in Marketing. d.L, Heskett (Ed.), Columbus, Ohio: College of Commerce and Administration, Ohio State University, 11-25.
Clark, d. M. (1961), Competition As A Dvnamic Process. Washington; The Brookings InstituTe.
Clawson, doseph C. (1974), "Fitting Branch Locations,Performance Standards, and Marketing Strategies to Local Conditions," dournal of Marketing. 38 (danuary), 8-14.
Cohen, Arthur I. and Ana Loud dones (1978), "Brand Marketing in the New Retail Environment," Harvard Business Review. 56 (September-October), 141-148.
Collins, Norman R. and Lee E. Preston (1968), Concentration and Price-Cost Margins in Manufacturing Industries. Berkeley: University of California Press.
Converse, Paul D. (1942), "A Retail Trading Area," dourna1 of Marketing. 12 (October), 160-164.
Converse, Paul D. (1945), "The Development of a Science ofMarketing," dournal of Marketing. 10 (duly), 14-23.
Converse, Paul D. (1949), "New Laws of Retail Gravitation,"dournal of Marketing. 14 (October), 379-384.
Converse, Paul D. (1957), "The Puzzle of Marketing Costs," dournal of Marketing. 21 (April), 439-441.
Converse, Paul D. (1959), "Mediocrity in Retailing," dournalof Marketing. 23 (Apri1), 419-420.
Cook, Victor, Rolando Polli and Susan Douglas (1971), "The Value of Retail Exchange Servi ces--A Measure of Market Performance," Working Paper, Marketing Science Institute, (danuary).

399Costner, Herbert L. (1971), "Theory, Deduction and Rules of
Correspondence," in Causal Models in the Social Sciences■ H. M. Blalock (Ed.), Chicago: Aldine-Atherton, 299-310.
Costner, Herbert L. and Ronald Schoenberg (1973),"Diagnosing Indicator Ills in Multiple Indicator Models," in Structural Equation Models in the Social Sciences. A. S. Goldberger and 0. D. Duncan”TEds.), N.Y.: Seminar Press, 167-199.
Cottrell, James L. (1973), "An Environmental Model For Performance Measurement." Journal of Retailino. 49 (Fall), 51-60.
Cox, Reavis (1948), "The Meaning and Measurement ofProductivity in Distribution." Journal of Marketino. 12 (April), 433-441.
Cox, Reavis (1959), "Consumer Convenience and the Retail Structure of Cities." Journal of Marketino. 23 (Aoril). 355-362.
Cox, William E. Jr. (1969), "A Commercial Structure Model for Depressed Neiqhborhoods." Journal of Marketina. 33 (July), 1-9.
Crawford, Gerald L. (1974), ^ Analvsis of ManagementFactors That Mav Contribute to the Success or Failure of Selected Smal1 Retailers. Unpublished Ph.D Dissertation, University of Arkansas.
Cundiff, Edward W. (1965), "Concepts in ComparativeRetailing," Journal of Marketing. 29 (January), 59-63.
Cunningham, Ross M. (1951), "Evaluation of Census Tracts," Journal of Marketing. 15 (April), 463-470.
Curhan, Ronald C., Walter J. Salmon and Robert D. Buzzell(1983), "Sales and Profitability of Health and Beauty Aids and General Merchandise in Supermarkets," Journal of Retailing. 59 (Spring), 77-99.
Curtis, Richard F. and Elton F. Jackson (1962), "Multiple Indicators in Survey Research," The American Journal of Sociology, 68 (September), 195-204.
Cyert R. M. and J. G. March (1963), A Behavioral Theorv of The Firm. Englewood, N.J: Prentice Hall.
Dalrymple, Douglas J. (1966), Merchandising Decision Models For Department Stores. Bureau of Business and Economic Research, Michigan State University.

400Darden, Wi111am R. (1980), "A Patronage Model of Consumer
Behavior, in Comoeti tive Structure in Retai1 Markets : The Department Store Perspective. Ronald W. Stampfl and Elizabeth C. Hirschman (Eds.), Chicago: American Marketing Association, 43-52.
Darden, William R. et ai (19B3), "Review of Measurement Models in Marketing," in 1983 American Marketing Association Winter Educators Conference Proceedings. Chicago, IL., 84-89.
Darden, William R. and Robert F. Lusch (Eds.), (1983), Patronage Behavior and Retai1 Management. N.Y: North Hoi land.
Davidson, William R. (1970), "Changes in DistributiveInstitutions," Journal of Marketing. 34 (January), 7-10.
Davidson, William R. (1980), "To Understand Retailing in 1980's Analyze Firm's Response to Trends," Marketing News. 13 (March7), 1,13.
Davidson, William R., A.D. Bates and S.J. Bass (1976), "The Retail Life Cycle," Harvard Business Review. 54 (November-Decenter), 89-96.
Davidson, William R. and John E. Smallwood (1980), "An Overview of Management of the Retail Life Cycle," in Comoeti tive Structure in Retai1 Markets : The DepartmentStore Perspective. Ronald W. Stampfl and Elizabeth C. Hirschman,(Eds.), Chicago: American MarketingAssociation, 53-62.
Davidson, William R. and Nancy E . Johnson (1981), "Portfolio Theory and Retailing Life Cycle," in Theorv in Retai1ino: Tradi tional and Nontraditional Sources. Ronald W. Stampfl and Elizabeth C. Hirschman, (Tds.), Chicago: AmericanMarketing Association, 51-63.
Dean, Joel (1960), "Marketing Productivity andProfitability," in Productivitv in Marketing Its Measurement and Change. University of Illinois Bulletin, 58 (August), 53-65.
Dent, Warren and John Geweke (1980), "On Specification in Simultaneous Equation Models, in Evaluation of Econometric Models. Academic Press, 169-198.
Dholakia, Ruby Roy and Louis W. Stern (1976), "Market Power and the PIMS Data," in 1976 American Marketing Association Educators' Conference Proceedings. 451-455.

401Dietz, Stephans (1973), "How to Measure Productivity in
Marketing," in 1973 American Marketing Association Educators' Conference Proceedings. 163-165.
Dixon, Donald F. (1982), "The Historical Origins Of The Channel Concept," in Marketing Channels: Domestic andInternational Perspectives. Michael G. Harvey and Robert P. Lusch (Eds.), Norman, OK: Center for Ecomomic and Management Research, 146-151.
Douglas, Edna (1949a), "Measuring the General Trading Area-A Case Study: I." Journal of Marketing. 13 (April),481-497.
Douglas, Edna (1949b), "Measuring the General Trading Area-A Case Study: II," Journal of Marketing. 14 (July), 46-60.
Doutt, Jeffrey Thomas (1976), Productivitv in Fast-Food Retailing, Unpublished Ph.D Dissertation, University of California, Berkeley.
Dow, Louis A. (1955), "Marketing Costs and Economic Theory," Journal of Marketing. 19 (April), 346-350.
Dow, Louis A. (1957), "A Note on Marshall and Selling Costs," Journal of Marketing. 21 (January), 332-335.
Duncan, Otis D. (1966), "Path Analysis: Sociological Examples," American Journal of Sociologov. 72, 1-16.
Duncan, Otis D. (1975), Introduction to Structural Eouation Models. N.Y.: Academic Press.
Dyas, Gareth P. (1972), The Strategy and Structure of French Industrial Enterprise. Unpublished Ph.D Dissertation, Harvard Business School.
Eddington, Arthur S. (1933), The Nature of the Phvsical World. N.Y: McMillan Press.
Ekeblad, Frederick A. and A. A1spaugh (1959), "Errors in Estimates of Retail Sales," Journal of Marketing. 23 (January), 282-286.
El-Ansary, Adel I. (1979), "Perspectives on Channel Systems Performance," Working Paper, The George Washington University.
Etgar, Michael (1976), "Effects of Administrative Control on Efficiency of Vertical Marketing Systems," Journal of Marketing Research. 13 (February), 12-2^.

402Etgar, Michael (1977), "Letters to the Editor," Journal of
Marketing. 41 (October), 14-15, 146.
Etgar, Michael (1978), "Some Methodological Issues ofEmpirical Research in Macromarketing," in 1978 American Marketing Association Educators' Conference Proceedings. 295-297.
Evans, Duane W. (1952), "Marketing Uses of Input-Output Data," Journal of Marketing. 17 (July), 11-21.
Farris, Paul W. and Robert D. Buzzell (1976), "TheRelationships Between Changes in Industrial Advertising and Promotion Expenditures and Changes in Market Share," Working Paper, Marketing Science Institute.
Farris, Paul W. and David Reibstein (1979), "How Prices and Expenditures and Profits are Linked," Harvard Business Review. 57 (November-December), 173-184.
Ferber, Robert (1958), "Variations in Retail Sales Between Cities," Journal of Marketing. 22 (January), 295-303.
Ferber, Robert, William J. Hawkes and Manuel D. Plotkin(1976), "How Reliable are National Retail Sales Estimates," Journal of Marketing. 40 (October), 13-22,
Ferell, 0. C. and J. R. Perrachione (1979), "An Inquiry into Bagozzi's Formal Theory of Exchange," in Conceptual and Theoretical Development in Marketing. 0. C. Ferrell et al (Eds.), Chicago: American Marketing Association, 158-161.
Fisk, George (1961-1962), "A Conceptual Model for Studying Customer Image," Journal of Retailing. 37 (Winter), 1-8, 54.
Forbes, J. D. (1972), "Central Place Theory-- An Analytical Framework for Retail Structure," Land Economics. 48, 15-22.
Fornell, Claes (Ed.), (1982a), A Second Generation ofMultivariate Analvsis: Measurement and Evaluation. N.Y.: Preager Press.
Fornell, Claes (Ed.), (1982b), A Second Generation of Multivariate Analvsis: Methods. N.Y.: Preager Press.
Fornell, Claes (1983), "Issues in the Application of Covariance Structure Analysis: A Comment," Journal of Consumer Research. 9 (March), 443-448.

403Formel 1, Claes and Fred Bookstein (1982), "Two Structural
Equation Models: LISREL and PLS Applied to Consumer Exit- Voice Theory," Journal of Marketing Research. 19 (November), 440-452.
Formel 1, Claes and Oded Gur-Arie (1983), "ValidityAssessment in Covariance Structure Analysis Via Selection Procedures," in 1983 American Marketing Association Fal1 Educators Conference Proceedings. 253-257.
Formel 1, Claes and David Larcker (1981a), "Evaluating Structural Equation Models with Unobservable Variables and Measurement Error," Journal of Marketing Research. 18 (February), 39-50.
Formel 1, Claes and David Larcker (1981b), "Structural Equation Models with Unobservable Variables and Measurement Error: Algebra and Statistics," Journal of Marketing Research. 18 (August), 382-388.
Formel 1, Claes and David Larcker (1984), "Misapplication of Simulations in Structural Equation Models: Reply to Acito and Anderson," Journal of Marketing Research. 21 (February), 113-117.
Formel 1, Claes, Gerard J. Tel lis and George M. Zinkhan(1982), "Validity Assessment: A structural Equations Approach Using Partial Least Squares," in 1982 American Marketing Association Fal1 Educators Conference Proceedings. 405-409.
Formel 1, Claes and William T. Robinson (1983), "Industrial Organization and Consumer Satisfaction/Dissatisfaction," Journal of Consumer Research. 9 (March), 403-412.
Freeman, John H . and Jerrold E. Kronenfeld (1973), "Problems of Definitional Dependency: The Case of Administrative Intensity," Social Forces. 52 (September), 108-121.
Friedman, Brian and J.L. Corey (1974), "Productivity in Gasoline Stations," MonthIv Labor Review. 97 (October), 26-32.
Frye, J.R. (1975), "Marketing Productivity Can Be Measured if You Want to do so," in 1975 American Marketing Association Educators' Conference Proceedings. 551-555.
Fuchs, Victor R. (1968), The Service Economv. New York: National Bureau of Economic Research, Princeton University Press.

404Fuguitt, Glenn V. and Stanley Lieberson (1973-1974),
"Correlation of Ratios or Difference Scores Having Common Terms," Sociological Methodology. H. Costner (Ed./, San Francisco: üossey-Bass Publishers, 128-144.
Gale, Bradley T. (1975), "Selected Findings From the PIMS Project: Market Strategy Impacts on Profitability," in1975 Amer i can Marketing Associ at ion Educators' Conference Proceedings. 471-475.
Gale, Bradley T. (1980), "Can More Capital Buy Higher Productivity?" Harvard Business Review. 58 (July- August), 78-86.
Gautschi, David Alan (1979), Models of Individual Retai1 Center Choice. Unpublished Ph.D Dissertation, University of California, Berkeley.
George, Kenneth D. ( 1966), Productivitv in Distribution. London: Cambridge University Press.
George, Kenneth D. and T. Ward (1973), "Productivity Growth in the Retail Trade," Oxford Builetin of Economics and Statistics, 35 (February), 31-47.
Geweke, J. F. and K. J. Singleton (1980), "Interpreting the Likelihood Ratio Statistic in Factor Analysis Models When Sample Size is Small," Journal of the American Statistical Association. 73, 133-137.
Gillett, Peter L. (1970), "A Profile of Urban In-Home Shoppers," Journal of Marketing. 34 (July), 40-45.
Gist, Ronald R. (1968), Retailino: Concepts and Decisions.New York: John Wiley and Son.
Goldberger, Arthur (1964), Econometric Theory. New York:John Wiley and Sons, Inc.
Goldberger, Arthur (1971), "Econometrics and Psychometrics:A Survey of Communa1ities," Psvchometrica. 36, 2 (June), 83-107.
Goldberger, Arthur (1973), "Structural Equation Models: An Overview," in Structural Equation Models in the Social Sciences. A. S. Goldberger and 0. D. Duncan (Eds.), N.Y: Seminar Press, 1-17.
Goldberger, Arthur (1977), "Structural Equation Models in the Social Sciences," Econometrics. 40, 979-1000.

405Goldberger, Arthur S. and Otis Dudley Duncan (Eds.), (1973),
Structural Equation Mode 1s in the Social Sciences. N.Y.: Seminar Press.
GoIdstucker, Jac (1965), “Trading Areas" in Science in Marketing. George Schwartz (Ed.), New York: John Wileyand Sons, Inc., 287-300.
Greenberg, Leon (1973), A Practical Guide to Productivi tv Measurement. Washington, D.C.: Bureau of NationalAffairs, Inc.
Greyser, Stephen (1980), "Marketing Issues," Journal of Marketing. 44 (Winter), 89-92.
Guiltinan, Joseph P. (1973), "Implications of a V&lue-Added Tax for Marketing Efficiency," in 1973 American Marketing Association Educators' Conference Proceedings. 455-458.
Haines, George H. Jr., Leonard S. Simon and Marcus Alexis (1972), "Maximum Likelihood Estimation of Central City Trading Areas," Journal of Marketing Research. 9 (May), 154-159.
Hall, Margaret and J. Knapp (1957), "Productivity in Distribution," Productivitv Measurement Review. 8 (February), 22-38.
Hall, Margaret, John Knapp and Christopher Winsten (1961), Distribution in Great Britain and North America-A Studv in Structure and Productivitv. London: Oxford UniversityPress.
Halsey, Kenneth D. (1973), A Comparison of SelectedFranchised and Independent Businesses and Their Success and Profitabi1itv in the State of Nebraska. Unpublished Ph.D Dissertation, University of Northern Colorado.
Hansen, Robert A., Terry Deutscher and Eric N. Berkowitz (1977), "Institutional Positioning: A Dynamic Conceptfor Retail Positioning," Journal of the Academv of Marketing Science. 5, 3 (Summer), 185-194.
Hansen, Michael H. and Charles B. Weinberg (1979), "Retail Market Share in a Competitive Market," Journal of Retailing. 55, 1 (Spring), 37-46.
Heeler, Roger M. et al (1973), "Modeling Supermarket Product Selection," Journal of Marketing Research. 10 (February), 34-37.
406Heeler, Roger M. and Michael L. Ray (1972), "Measure
Validation in Marketing," Journal of Marketing Research.9 (November), 361-370.
Henpel, Carl G. (1952), Fundamentals of Concept Formation in Empirical Sciences. The University Of Chicago Press.
Hempel, Carl G. (1966), Philosoohv of Natural Science. Englewood Cliffs, New Jersey: Prentice-Hal1, Inc.
Herrmann, Robert 0. and Leland L. Beik (1968), "Shoppers' Movements Outside Their Local Retail Area," Journal of Marketing. 32 (October), 45-51.
Hindersman, Charles H. (1960), "The Evolving Downtown- Suburban Retail Pattern," Journal of Marketing. 25 (October), 59-62.
Hirschman, Elizabeth C. (1978), "A Descriptive Theory of Retail Market Structure," Journal of Retailing, 54, 4 (Winter), 29-48.
Hirschman, Elizabeth C. and Ronald W. Stampfl (1980a), "Role of Retailing in the Diffusion of Popular Culture: Microperspectives," Journal of Retailing. 56 (Spring).
Hirschman, Elizabeth C. and Ronald W. Stampfl (1980b),"Retail Research: Problems, Potentials and Priorities,"in Comoetitive Structure in Retai1 Markets: TheDepartment Store Perspective. Ronald W. Stampfl and Elizabeth C. Hirschman, (Eds.), Chicago: AmericanMarketing Association, 68-77.
Hirschman, Elizabeth C. (1981), "Retail Research and Theory," Paper presented at the First Annual Faculty Consortium--Retailing in the Contemporary Environment. Madison, Wisconsin (July).
Hise, Richard T. et al (1983), "Factors Affecting the Performance of Individual Chain Store Units: AnEmpirical Analysis," Journal of Retailing. 59 (Summer), 22-39.
Holdren, Bob R. (1960), The Structure Of A Retai1 Market And The Market Behavior Of Retai1 Units. Englewood Cliffs,New Jersey: Prentice-Hal1, Inc.
Hollander, Stanley C. (1966), "The Wheel of Retailing," Journal of Marketing. 30 (July), 37-42.

407Hollander, Stanley C. (1980), “Oddities, Nostalgia, Wheels
and Other Patterns in Retail Evolution," in Conpetitive Structure in Retai1 Markets: The Department StorePerspective. Ronald W. Stanpfl and Elizabeth C.Hirschman, (Eds.), Chicago: American MarketingAssociation, 78-87.
Hollander, Stanley C. (1981), "Retail Theory: SomeCriticism and Some Admiration," in Theory in Retailino: Traditional and Nontraditional Sources. Ronald W. Stampfl and Elizabeth C. Hirschman, [Eds.), Chicago: AmericanMarketing Association, 84-94.
Hower, Ralph (1943), History of Macv's of New York. Cambridge, Mass.: Harvard University Press.
Huff, David L. (1964), "Defining and Estimating A Trade Area," Journal of Marketing. 28 (July), 34-38.
Huff, David L. (1966), "A Programmed Solution for Approximating an Optimum Retail Location," Land Economics. 62 (April), 293-303.
Huff, David L. (1981), "Retail Location Theory," in Theory in Retailing: Tradi tional and Nontradi tional Sources.Ronald W. Stampfl and Elizabeth C. Hirschman, (Eds.), Chicago: American Marketing Association, 108-121.
Hughes, David G. (1966), "Developing Marketing Strategy Through Multiple Regression," Journal of Marketing Research. 3 (November), 112-115.
Hughes, Adele M. and Ray R. Serpkenci (forthcoming),"Comments On Labor Productivity in Retailing," Journal of Market i no
Hui, Baldwin S. and Jagpal S. Harsharanjett (1979), "The Partial Least Squares (PLS), Approach to Causal Models With Latent Variables," 1979 American Marketing Associ at ion Educators' Conference Proceedings. 90-92.
Hunt, Shelby (1976a), "The Nature and Scope of Marketing," Journal of Marketing. 40 (July), 17-28.
Hunt, Shelby D. (1976b), Marketing Theorv: Conceptual Foundations of Research in Marketing. Columbus, Ohio: Grid, Inc.
Hunt, Shelby (1978), "A General Paradigm of Marketing: In Support of the 3-D Model," Journal of Marketing. 42 (April), 107-110.

408Hunt, Shelby (1982), "Are The Logical Empiricist Models of
Explanation Dead?" in MarKeting Theorv: Philosoohv of Science Perspectives. R. F. Bush and S. D. Hunt (Eds.), Chicago: Amarican Marketing Association, 7-10.
Hunt, Shelby D. and John J. Burnett (1982), "TheMacromarketing/Micromarketing Dichotomy: A.TaxonomicalModel," Journal of Marketing. 46 (Summer), 11-26.
Hunt, Shelby (1983), Marketing Theorv The Philosoohv of Marketing Science. Homewood, Illinois: Richard D. Irwin, Inc.
Hutchinson, K. D. (1952), "Marketing As A Science: AnAppraisal," Journal of Marketing. 16 (January), 286-293.
Ingene, Charles A. (1981), "Analyzing Productivity in Marketing: A Model and Some Hypotheses," Working Paper, The University of Texas at Dallas, (November).
Ingene, Charles A. (1982), "Labor Productivity in Retailing," Journal of Marketing. 46 (Fall), 75-90.
Ingene, Charles A. (1983a), "Productivity in Spatial Retailing: Private and Public Perspectives," Working Paper, University of Washington (January).
Ingene, Charles A. (1983b), "Are There Scale Economies in American Retailing," Working Paper, University of Washington (April).
Ingene, Charles A. (1983c), "A Conceptual Model andEmpirical Evidence of Labor Productivity in Department Stores," in Productivi tv and Efficiency in Distribution Systems. David A. Gautschi [Ed.), N.Y: North Holland, 77-92.
Ingene, Charles A. and Robert F. Lusch (1980) "Market Selection Decisions For Department Stoes," Journal of Retailing. 56,3 (Fall), 21-40.
Ingene, Charles A. and Robert F. Lusch (1981), "A Model of Retail Structure," in Research in Marketing. Volume-5, Jagdish Sheth (Ed.), JAI Press, 101-164.
Jain, Arun K. and Vi jay Mahajan ( 1979), "Evaluating the Competitive Environment in Retailing Using Multiplicative Competitive Interactive Model," in Research in Marketing. Vol.2, 217-235.
Jeuck, John E. (1953), "Marketing Research--Milestone or Millstone," Journal of Marketing. 17 (April), 381-387.

409Johnston, J. (1972), Econometric Methods. 2nd Ed., New York:
McGraw-Hill Book Co.
Jones, Fred M. (1943), "A New Interpretation of Marketing • Functions," Journal of Marketing. 7 (January), 256-260.
Jones, Larry D. (1973), ^ Analysis of Behavior and Performance in the Food Retai1ing Industry Using Experimental Business Gaming. Unpublished Ph.D Dissertation, Purdue University.
Joreskog, Karl G. (1966), "Testing a Simple Structure Hypothesis in Factor Analysis," Psvchometrika. 31, 165-178.
Joreskog, Karl G. (1969), "A General Approach of Confirmatory Maximum Likelihood Factor Analysis," Psvchometrika. 34, 183-202.
Joreskog, Karl G. (1973), "A General Method For Estimating Linear Structural Equation System," in Structural Eouation Models in the Social Sciences. A. S. Goldberger and 0. D. DuncanTEds. ), N.Y.: Seminar Press, 85-112.
Joreskog, Karl G. (1978), "Structural Analysis of Covariance and Correlation Matrices," Psvchometrika. 43, 443-477.
Joreskog, Karl G. and Arthur S. Goldberger (1972), "Factor Analysis by Generalized Least Squares," Psvchometrika.37, 243-260.
Joreskog, Karl G. and Arthur S. Goldberger (1975), "Estimation of a Model with Multiple Indicators and Multiple Causes of a Single Latent Variable," Journal of ■American Statistical Association. 70, 631-639.
Joreskog, Karl G. and H. Wold (Eds.), (1982a), Systems Under Indirect Observation- Causalitv * Structure * Prediction. Part I. N.Y.: North-HoTland Publishing Co.
Joreskog, Karl G. and H. Wold (1982b), "The ML and PLS Techniques For Modeling With Latent Variables," in Systems Under Indirect Observation: Causalitv * Structure * Prediction K.G. Joreskog and H. Wold (Eds..)., N.Y.: North-Holland Publishing Co., 263-270.
Joreskog, Karl G. and D. Sorbom (1979), Advances in Factor Analysis and Structural Eouation Models. Cambridge: Abt Books.

410Joreskog, Karl G. and D. Sorbom (1982), "Recent Developments
in Structural Equation Modeling," Journal of Marketing Research. 19 (November), 404-416.
Joreskog, Karl G. and Dag Sorbom (1983), LISREL: Analvsis of Linear Structural Relationships bv the Method of Maximum Likelihood. USER'S GUIDE-Versions V and VI. Department of Statistics, University of Upsala, Sweden.
Jung, A. F. (1959), "Is Reilley's Law of Retail Gravitation Always True?" Journal of Marketing. 27 (October), 62-63.
Kahane, H. (1973), Logic and Philosoohv. 2nd Ed., Belmont, Calif.: Wadsworth.
Karch, Nancy (1984), "Excellent American Retail Companies," New York: McKinsey and Company.
Kasarda, John D. and Patrick D. Nolan (1979), "Ratio Measurement and Theoretical Inference in Social
• Research," Social Forces. 58 (September), 212-227.
Kasulis, Jack J. and Robert F. Lusch (1981), "Validating The Retail Store Image Concept," Journal of Academv of the Marketing Science. 9, 4 (Fall), 419-435.
Keat R. and J. Urry (1975), Social Theorv as Science.London : Rout ledge and Kega Paul.
Kelley, Eugene J. (1963), "Retail Concentration andExpansion: Scope, Problems and Opportunities," in 35thAnnua 1 Boston Conference on Distribution. International Marketing Institute, 101-110.
Kelley, Robert F. (1967), "Estimating Ultimate Performance Levels of New Retail Outlets," Journal of Marketino Research. 4 (February), 13-19.
Kendrick, John (1961), Productivi tv Trends in the Uni ted States, New York: National Bureau of Economic Research,Princeton University Press.
Kendrick, John ( 1973), Postwar Productivi tv Trends in the Uni ted States 1948-1969. Columbia University Press for NBER.
Kendrick, John W. and A. Creamer (1965), Measuring Company Productivi tv. New York: National Industrial ConferenceBoard, Inc.

411Kerin, Roger A. and Richard D. Miller (1981), “Diversity of
Retail Operations and Financial Performance," in 1981 American Marketing Association Educators' Conference Proceedings. 24-25.
Kinney, William R. Jr. (1969), Measuring Performance in Multi-Outlet Businesses. Division of Research, East Lansing: Michigan State University.
Kirkpatrick, Jerry (1982), "Theory and History inMarketing," in Marketing Theorv: Philosoohv of Science Perspectives. R. F. Bush and S. D. Hunt (EdsTT, Chicago: American Marketing Association, 47-51.
Konopa, Leonard J. (1968), "An Analysis of Some Changes in Retail Productivity Between 1948 and 1963," Journal of Retailing. 44, 3 (Fall), 57-67.
Kotler, Philip and Sidney J. Levy (1969), "Broadening the Concept of Marketing," Journal of Marketing. 33 (January), 10-15.
Kotler, Philip (1971), Marketing Decision Making: A ModelBuilding Approach. New York: Holt, Rinehart and Winston,Inc.
Kotler, Philip (1972a), "A Generic Concept of Marketing," Journal of Marketing. 36 (April), 46-54.
Kotler, Philip (1972b), "Defining The Limits of Marketing," in Marketing Education and The Real World and Dvnamic Marketing in a Changing Environment. B. W. Becker and H. Becker (Eds.), Chicago: American Marketing Association, 48-56.
Kotler, Philip and Gerald Zaltman (1971), "Social Marketing: An Approach to Planned Social Change," Journal of Marketino. 35, (July), 3-12.
Kuhn, Thomas (1970), The Structure of ScientificRevolutions. 2nd. Ed.. The University of Chicago Press.
Kuhn, Thomas (1971), "Second Thoughts on Paradigm," in The Structure of Scientific Theories. Frederick Suppe (Ed.), Urbana, Illinois.
LaLonde Bernard J. (1962), Differentials in Supermarket Drawing Power. Bureau of Business and Economic Research, Michigan State University.
Lakatos, Imre and Alan Musgrave (Eds.), (1970), Criticism and The Growth of Knowledge. Cambridge University Press.

412Langbein, Laura Irwin and Allan d. Lichtman (1978),
Ecological Inference. Beverly Hills, California: SagePublicat ions.
Langhuff, Peter (Ed.), (1965), Mode1s. Measurement and Marketing. Englewood, New Jersey: Prentice-Hal1, Inc.
Lazer, William and Eugene J. Kelley (1960),“Interdisciplinary Horizons in Marketing," Journal of Marketing. 25 (October), 24-30.
Li, C. C. (1975), Path Analysis- A Primer. Pacific Grove,CA: Boxwood Press.
Lipstein, Benjamin (1981), "A Review of Retail StoreExperiments,” in Theorv in Retailing: Tradi tional andNontraditional Sources. Ronald W. Stampfl and Elizabeth C. Hirschman, (Eds.), Chicago: American MarketingAssociation, 95-107.
Liu, Ben-chieh (1970), "Determinants of Retail Sales in Large Metropolitan Areas, 1954 and 1963," Journal of the American Statistical Association. 65 (December),1460-1473.
Liu, Ben-chieh (1971), "Growth of Retail Sales, Population and Income in SMSA's, 1952-1966," The Quarterly Review of Economics and Business. 11 (Summer), 17-25.
Lockley, Lawrence C. (1951), "A Measure of RetailEfficiency," Journal of Marketing. 15 (April), 482-483.
Lodish, Leonard M. (1982), "A Marketing Decision Support System for Retailers," Marketing Science. 1 (Winter), 31-56.
Long, Scott J. (1976), "Estimation and Hypothesis Testing in Linear Models Containing Measurement Error," Sociological Methods and Research. 5 (November), 157-206.
Long, Susan B. (1979), "The Continuing Debate Over The Use Of Ratio Variables: Facts and Fiction," Sociological Methodology. K. F. Schuessler (Ed.), San Fransisco: Jossey-Bass Publishers, 37-67.
Losch, A. (1954), The Economics of Location. New Haven: Yale University Press.
Luck, David (1969), "Broadening the Concept ofMarketing--Too Far," Journal of Marketing. 33 (July), 53-55.

413Luck, David (1974), “Social Marketing: Confusion
Compounded," Journal of Marketing. 38 (October), 70-72.
Lusch, Robert F. (1976), "Sources of Power: Their Impact on Intrachannel Conflict," Journal of Marketing Research. 13 (November), 382-390.
Lusch, Robert F. (1982), Management of Retai1 Enterprises. Boston: Kent Publishing Company.
Lusch, Robert F. and Charles A. Ingene (1980a), "ThePredictive Validity of Alternative Measures of Inputs and Outputs in Retail Production Functions," in 1980 American Marketing Association Educators' Conference Proceedings. 330-333.
Lusch, Robert F. and Charles A. Ingene (1980b), "A Theory of Labor Productivity in Department Store Retailing," in Conoetitive Structure in Retai1 Markets: The DepartmentStore Perspective. Ronald W. Stampfl and Elizabeth C. Hirschman,TËdsTT, Chicago: American MarketingAssociation, 98-107.
Lusch, Robert F. and Ray R. Serpkenci (1982), "Correlates of Working Capital Productivity in Marketing Channels: A Macromarketing Perspective," in Marketing Theorv:Philosoohv of Science Perspectives. R. F. Bush and S. D. Hunt (Eds.), Chicago: American Marketing Association, 273-276,
Lusch, Robert F. and Ray R. Serpkenci (1983) Your Financial Performance in Retailing," (January-March), 9-18
Lusch, Robert F. and Ray R. Serpkenci (1984) of Retail Store Managers," Working Paper, of Oklahoma (January).
"Improving Business. 33
"Job Outcomes The University
Lusch, Robert F. and Ronald W. Stampfl (1981), "NewRealities of Retail Management," in Theorv in Retailing: Tradi tional and Nontradi tional Sources. Ronald W. Stampfl and Elizabeth C. Hirschman, HEds.), Chicago: AmericanMarketing Association, 122-132.
Lusch, Robert F. and William R. Darden (Eds.), (1981),Retai1 Patronage Theorv--Workshop Proceedings. Norman, Oklahoma: Center For Economic and Management Research.
Mac Mil Ian, Alexander and Richard L. Daft (1979),"Administrative Intensity and Ratio Variables: The Case Against Definitional Dependency," Social Forces. 58 (September), 228-248.

414Machlup, Fritz (1969a), "Positive and Normative Economics,"
in Economic Means and Social Ends: Essays in Political Economies. Robert L. Hei1borner (Ed.), Englewood, N.d: Prentice-Hal1, Inc, 99-124.
Machlup, Fritz (1969b), "If Matter Could Talk," in Philosoohv. Science, and Method: Essavs in Honor of Ernest Nagel, Sidney Morgenbener et al (Eds.), N.Y: St. Martin's Press, 286-305.
Machlup, Fritz (1978), Methodoloov of Economics and Other Social Sciences. N.Y: Academic Press.
Mackay, David B. (1973), "Spatial Measurement of Retail Store Demand," Journal of Marketing Research. 10 (November), 447-453.
Maddala, G.S. (1977), Econometrics. New York: McGraw-HillBook Co.
Malien, Bruce and M. Haberman (1975), "Economies Of Scale: A Determinant of 'Overstoring and Superstoring?'," in Canadian Association of Administrative Sciences Proceedings. 4/158-4/167.
Mammone, James L. (1980), "Productivity Measurement: AConceptual Overview," Management Accounting. 62 (June), 36-42.
Mammone, James L. (1980), "A Practical Approach ToProductivity Measurement," Management Accounting. 52 (July), 40-44.
Mann, M. (1966), "Seller Concentration, Barriers to Entry and Rate Of Return in 30 Industries, 1950-1960," Review of Economics and Statistics. 48 (August), 296-307.
Mark, Jerome A. (1975), "The BLS Program for Measuring Productivity in the Marketing Area," in 1975 American Marketing Association Educators' Conference Proceedings. 561-563.
Martineau, Pierre (1958), "The Personality of the Retail Store," Harvard Business Review.-36 (January-February), 47-58.
Mason, Joseph Barry and Charles T. Moore (1970-71), "An Empirical Reappraisal of Behavioristic Assumptions in Trading Area Studies," Journal of Retai1ing; 46, 4 (Winter), 31-37.

415Massy, William F. and Ronald E. Frank (1966), "Analysis of
Retailer Advertising Behavior," Journal of Marketing Research. 3 (November), 378-383.
May, Eleanor G. (1971), "Image Evaluation of A Department Store," Working Paper, Marketing Scoeice Institute
. (October).
May, Eleanor G. (1972), "Store-To-Store and Department-To- Department Image Comparisons," Working Paper, Marketing Science Institute (March).
May, Eleanor G. (1981), "Product Positioning andSegmentation Strategy: Adaptable to Retail Stores?" inTheorv in Retailino: Tradi tional and Nontradi tionalSources. Ronald W. Stampfl and Elizabeth C. Hirschman, (Eds.), Chicago: American Marketing Association,144-154.
McAnally, A. (1963), "The Measurement of RetailProductivity," Journal of Industrial Economics. 11 (April), 87-95.
McCammon, Bert C. Jr (1971), "Alternative Explanations of Institutional Change and Channel Evolution" in Towards Scientific Marketing. Stephen A. Greyser (Ed.), Chicago: American Marketing Association, 477-490.
McCammon, Bert C. Jr. and William Hammer (1974), "A Frame of Reference for Improving Productivity in Distribution," Atlanta Economic Review. 59 (Septentoer-October), 9-13.
McCammon, Bert C. Jr. and Albert D. Bates (1977), "Reseller Strategies and the Financial Performance of the Firm," in Strateav + Structure = Performance. Hans Thorelli (Ed.), Bloomington: Indiana University Press, 146-178.
McCarranon, Bert C. Jr., Jack J . Kasulis and Jack A. Lesser (1980), "The New Parameters of Retail Competition: The Intensified Struggle for Market Share," in Comoeti tive Structure in Retai1 Markets: The Department Store Perspective. R. W. Stampfl and E. C. Hirschman (Eds.), Chicago: American Marketing Association, 108-118.
McConnel, Campbell R. (1979), "Why is U.S. Productivity Slowing Down?" Harvard Business Review, 57 (March- April), 36-60.
Mclnnes, William (1956), "The Analytical Problem Approach to Marketing and Market Potentials," Journal of Marketing,20 (October), 190-192.

416McNair, Malcolm P. (1931), "Trends in Large Scale
Retailing," Harvard Business Review. 10 (October), 31
McNair, Malcolm P. (1958), "Significant Trends and Developments in the Postwar Period," in Comoeti tive Distribution in a Free High-Level Economv." A.B. Smith (Ed.), Pittsburgh, Pa.: University of Pittsburgh Press.
McNulty, Paul J. (1967), "A Note on the History of Perfect Competition," Journal of Political Economy. (August), 395-399.
McNulty, Paul J. (1968), "Economic Theory and The Meaning of Comoetition." Quarterly Journal of Economics, (Novent)er), 639-656.
Mill, J. S. (1959), A System of Logic, 8th. Edition, London: Longmans.
Mills, Harlan D. (1961), "Marketing As A Science," Harvard Business Review, 39 (September-October), 137-142.
Montgomery, David B. and Glen L. Urban (1969), Management Science in Marketing. New Jersey: Prentice-Hal1, Inc.
Morey, Richard C. (1980), "Measuring the Impact of Service Level on Retail Sales," Journal of Retailing, 56, 2 (Summer), 81-90.
Morgenstern, Oskar (1972a), "Descriptive, Predictive and Normative Theory," Kvklos. 25 , 699-714.
Morgenstern, Oskar (1972b), "Thirteen Critical Points in Contemporary Economic Theory: An Interpretation," TheJournal of Economic Literature. 10 (December), 1163-1189.
Moyer, M.S. (1972), "Management Science in Marketing," Journal of Marketing. 36 (January), 3-9.
Mueller, Willard and Leon Garoian (1961), Changes in the Market Structure of Grocery Retai1ing. Madison: TheUniversity of Wisconsin Press.
Naert, Phil lippe and Peter Leeflang (1978), BuiIding Imolementable Marketing Models. Leiden, Netherlands: Martinus Nijhoff, Social Science Division.
Nagel, Ernest (1961), The Structure of Science: Problems in the Logic of Scientific Explanation. N.Y: Harcourt, Brace and World.

417Nakanishi, Masao and Lee G. Cooper (1974), "Parameter
Estimation for Multiplicative Competitive Interactive Models-- Least Squares Approach,” Journal of Marketing Research. 11 (August), 303-311.
Namboodiri, Krishnan N., Lewis F. Carter and Hubert M. Blalock (1975), Applied Multivariate Analvsis and Experimental Designs. N .Y.: McGraw Hill Book Co., 535-572.
National Association of Marketing Teachers (1935),"Definitions of Marketing Terms," National Marketing Review. (Fall), 166.
Nevin, John R . and Ruth A. Smith (1981), "The predictive Accuracy Of A Retail Gravitation Model: An Empirical Evaluation," in 1981 American Marketing Association Educators' Conference Proceedings.
Oaks, Clinton L. (1956), "Organizing For RetailDecentralization," Journal of Marketing. 20 (January) 255-261
Ofer, Gur (1973), "Returns To Scale In Retail Trade," Review of Income and Wealth. 20, 4 (December), 263-384.
Page, Albert L. (1979), "A Test Of The Share/Price Market Planning Relationship In One Retail Environment," Journal Of The Academv Of Marketing Science. 7 (Winter), 25-39.
Palamountain, J. C. Jr., (1955), The Politics ofDistribution. Cambridge, MA: Harvard University Press.
Parameswaran, Ravi et al (1979), "Measuring Reliability: A Comparison of Alternative Techniques," Journal of Marketing Research. 16 (February), 18-25.
Parsons, Leonard J. and Randall L. Schultz (1976), Marketing Models and Econometric Research. N.Y: North-Holland.
Paul, Robert J. and Robert D. Schooler (1970), “Activity - Productivity Analysis in Large and Small Department Stores-- A Comparative Review," Journal of Retailino. 46 (Spring), 41-49, 76.
Pavan, Robert J. (1972), The Strateav and Structure of Italian Enterprise. Unpublished Ph.D Dissertation,Harvard Business School.

418Pearson, Karl (1897), "On A Form of Spurious Correlation
which may arise when Indices are used in the Measurement of Organs," Proceedings of the Royal Society of London,60 (February), 489-497.
Pedhazur, Elazor J. (1982), Multiple Regression inBehavioral Research. Holt Rinehart and Winston, Ch.16.
Pessemier, Edgar A. (1979), "Retail Patronage Behavior," Working Paper, Purdue University.
Pessemier, Edgar A. (1980), "Store Image and Positioning," Journal of Retailing. 56 (Spring), 94-106.
Peter, J. Paul (1979), "Reliability: A Review ofPsychometric Basics and Recent Marketing Practices," Journal of Marketing Research. 16 (February), 6-17.
Peter, J. Paul (1981), "Construct Validity: A Review of Basic Issues and Marketing Practices," Journal of Marketing Research. 18 (May), 133-145.
Peter, J. Paul (1982), "Current Issues in the Philosophy of Science: Inplications for Marketing Theory-- A Panel Discussion," in Marketing Theorv: Philosoohv of Science Perspectives. R. F. Bush and S. D. Hunt (Eds.77 Chicago: American Marketing Association, 11-16.
Peters, William S. (1957), "Controls of Stocks in Grocery Retailing," Journal of Retailing. 22 (October), 148-153.
Peterson, Robert A. and Roger A. Kerin (1983), "Store Image Measurement in Patronage Research," in Patronage Behavior and Retai1 Management. William R. Darden and Robert F. Lusch (Eds.), N.Y: North Holland.
Pfeffer, J. and G. R. Salancik (1978), The External Control of Organizations. N.Y: Harper and Row.
Phillips, Charles F. (1958), "Trading Stamps and Retail Failures," Journal of Retailing. 22 (January), 304-305.
Phillips, Lynn W. (1981), "Assessing Measurement Error In Key Informant Reports: A Methodological Note On Organizational Analysis in Marketing," Journal of Marketing Research. 18 (November), 395-415.
Phillips, Lynn W. (1982), "Exploring Control Losses in Corporate Marketing Channels : An Organizational Analysis," Journal of Marketing Research. 19 (November), 525-549. ~

419Phillips, Lynn W., Dae R. Chang and Robert D. Buzzell
(1983), "Product Quality, Cost Position and Business Performance: A Test of Some Key Hypotheses,” Journa1 of Marketing. 47 (Spring), 26-43.
Pickle, Hall et al (1970-71), "Customer Satisfaction in Small Business," Journal of Retailing, 46 (Winter),38-49.
Porter, Michael E . (1976), Intrabrand Choice. Strateav and Bilateral Market Power. Cambridge, MA: Harvard University Press.
Preston, Lee E. and Norman R. Collins (1966), "The analysis of Market Efficiency," Journal of Marketing Research. 3 (May)., 154-162.
Rao, Vithala R. (1972), "Alternative Econometric Models of Sales-Advertising Relationships," Journal of Marketing Research. 9 (May), 177-181.
Rei1 ley, Wi11iam R . (1931 ), The Law of Retai1 Gravi tation. N.Y: W. J. ReiIley Co.
Reynolds, Robert F. (1953), "A Test of the Law of Retail Gravitation," Journal of Marketing." 17 (January), 273-277.
Ring, Lawrence J., Charles W. King and D. J. Tigert (1980), "Market Structure and Retail Position," in Comoeti tive Structure in Retai1 Markets: The Department Store Perspective. R. W. Stampfl and E. C. Hirschman (Eds.), Chicago: American Marketing Association, 149-160.
Rivers, Richard and Robert Welker (1981), "Estimating Profit Performance from Similar Profit Centers, " Journal of the Academv of Marketing Science. 9 (Spring), 127-146.
Robicheaux, Robert A. (1981), "GMROI/Share Product Portfolio Analysis," in 1981 American Marketing Association Educators' Conference Proceedings. 31-34.
Robin, Donald (1977a), "The Boundaries of Marketing," in 1977 Fal1 Educators Conference Proceedings. Chicago: American Marketing Association, 548.
Robin, Donald (1977b), "Letters to the Editor," Journal of Marketing. 41 (January), 136-137.
Rosenbloom, Bert (1976), "The Trade Area Mix and Retailing Mix: A Retail Strategy Matrix," Journal of Marketing. 40 (October), 58-66.

420Rosenbloom, Bert and Leon G. Schiffman (1981), "Retailing
Theory: Perspectives and Approaches," in Theorv in Retailino: Tradi tional and Nontradi tional Sources. Ronald W. Stampfl and Elizabeth C. Hirschman, (Eds.), Chicago: American Marketing Association, 168-179.
Ross, Will H. (1977), "Letters to the Editor," Journal of Marketing. 41 (April), 10-11.
Rudner, Richard (1966), Philosoohv of Social Science. Englewood Cliffs, N.J: Prentice-Hal1, Inc.
Rumelt, Richard P. (1974), Strateav. Structure and Economic Performance. Boston: Harvard University.
Russell, Vera Kilduff (1957), "The Relationship Between Income and Retail Sales in Local Areas," Journal of Marketing. 21 (January), 239-332.
Rut tan, Vernon W. (1964), "Measuring Productivity Changes in Marketing," in Marketing Concepts in Changing Times■ American Marketing Association Educators' Conference Proceedings, Chicago: American Marketing Association, 339-351.
Ryan, Franklin W. (1935), "Functional Elements of Market Distribution," Harvard Business Review. 13 (January), 205-234.
Ryan, Michael and John 0'Shaughnessy (1982), "Scientific Explanation and Technological Prediction," in Marketing Theorv: Philosophv of Science Perspectives. R. F. Bush and S. D. Hunt (EdsTT, Chicago: American Marketing Association, 22-25.
Saris, W. E., W. M. de Pijper and P. Zegwaart (1979),"Detection of Specification Errors in Linear Structural Equation Models," in Sociological Methodoloav. Karl F. Schuessler (Ed.), S.F.: Jossey-Bass Publishers, 151-171.
Sauer, William J., Nancy Nighswonger and Gerald Zaltman (1982), "Current Issues in Philosophy of Science: Implications for the Study of Marketing," in Marketing Theorv: Philosoohv of Science Perspectives. R. F. Bush and S. D. Hunt (EdsTT, Chicago: American Marketing Association, 17-21.
Savitt, Ronald (1975), "Efficiency and Size in Canadian Supermarkets," in Canadian Association of Administrative Sciences Proceedings. 4/225-4/232.

421Sawyer, Alan G. and Thomas J. Page (1983), "Incremental
Goodness of Fit in Structural Equation Models inMarketing Research," 1983 American Marketing AssociationWinter Educators Conference Proceedings. 249-252.
•
Scherer, F. M . (1980), Industrial Market Structure and Economic Performance. 2nd. Ed., Chicago: Rand McNally College Publishing Co.
Schiff, Michael (1960), "The Sales Territory as a Fixed Asset," Journal of Marketing. 25 (October), 51-53.
Schiffman, Leon G., Joseph F. Dash and William R. Dillon(1977), "The Contribution of Store-Image Characteristics to Store-Type Choice," Journal of Retailing, 53 (Summer), 3-14, 46.
Schoeff1er, Sidney (1977), "Cross-Sectional Study ofStrategy, Structure and Performance: Aspects of the PIMS
, Program," in Strategy + Structure ± Performance: The Strategic Planning Imperative. Hans B. Thorelli (Ed.), Indiana University Press, 108-121.
Schoeff1er, Sidney, Robert D. Buzzell and Donald F. Heany (l974), "Impact of Strategic Planning on Profit Performance," Harvard Business Review. 52 (March-Apri1), 137-145.
Schoenberg, Ronald (1982), MILS- A Computer Program to Estimate the Parameters of Multiole Indicator Linear Structural Models. National Institutes of Health, Bethesda, MO 20205.
Schuessler, Karl (1973), "Ratio Variables and Path Models," in Structural Eouation Models in the Social Sciences. A. S. Goldberger and D. D. DuncanTEds.), N.Y: Seminar Press, 201-228.
Schuessler, Karl (1975), "Analysis of Ratio Variables: Opportunities and Pitfalls," American Journal of Sociology. 80 2, 379-396.
Schultz, Randall L. (1971), "Market Measurement and Planning With a Simultaneous-Equation Model," Journal of Marketing Research. 13 (May), 153-164.
Schütz, Alfred (1953), "Common Sense and Scientific Interpretation of Human Action," Philosophv and Phenemenological Research. 16 (September), 3-36.
Schwartz, George (1963), Development of Marketing Theory, Cincinnati, OH: South Western Publishing Co.

422Schwartzman, David (1971), The Dec1ine of Service In Retai1
Trade. Pullman, Washington: Bureau of Economic and Business Research, Washington State University.
Secrist, Horace (1933), The Triumph of Mediocritv. Chicago; Northwestern University Bureau of Business Research.
Seelye, Alfred L. (1947), "The Importance of Economic Theory in Marketing Courses," Journal of Marketing. 11 (January), 223-227.
Sevin, Charles H. (1965), Marketing Productivitv Analvsis. N.Y: McGraw Hill Book Co.
Shapere, Dudley (1964), "The Structure of Scientific Revolutions," Philosophical Review. 73, 383-394.
Sharma, Subbash, Richard M. Durand and Oded Gur-Arie (1981), "Identification and Analysis of Moderator Variables," Journal of Marketing Research. 18 (August), 291-300.
Shepard, Geoffrey (1955), "The Analytical Problem Approach to Marketing," Journal of Marketing. 20 (October), 173-177.
Sheth, Howard (1983), "An Integrative Theory of Patronage Preference and Behavior," in Patronage Behavior and Retai1 Management. William R. Darden and Robert F. Lusch (Eds.), N.Y: North Holland, 9-28.
Sheth, Howard and David M. Gardner (1982), "History of Marketing Thought: An Update," in Marketing Theorv:Philosoohv of Science Perspectives. R. F. Bush and S. D. Hunt (Eds.), Chicago: American Marketing Association, 52-58. .
Shonkwi11er, Larry R. (1974), Consumer Atti tudes Toward Food Selection and Perception of Store Conduct : Implications for Market Performance. Unpublished Dissertation, The Ohio State University.
Shubik, Martin (1959), Strateov and Market Structure. N.Y: John Wiley and Sons, Inc.
SiIberberg, Eugene (1978), The Structure of Economics. N.Y: McGraw Hill.
Simon, Herbert A. (1959),."Theories of Decision Making in Economic and Behavioral Sciences," American Economic Review, 49 (June), 553-583.

423Simon, Herbert A. (1962), "New Developments in The Theory Of
The Firm," American Economic Association Paper and Proceedings. (May).
Simon, L. S. and N. Freimer (1970), Analytical Marketing, N.Y: Harcourt, Brace and World.
Smith, Charles W. (1953), "Increasing DistributionEfficiency by Better Organized Research," Journa1 of Marketing. 17 (January), 233-245.
Soldiver, Helmut (1976), "Conceptual Models For Retail Strategy Formulation," Journal of Retailing. 52 (Fall), 47-56, 96.
Stach, Stanley F. (1969), "Systems Analysis for Controlling and Improving Marketing Performance," Journal of Marketing. 33 (April), 12-19.
Stanley, Thomas J. and Murphy A. Sewall (1976), "Image Inputs to a Probabilistic Model : Predicting Retail Potential," Journal of Marketing. 40 (July), 48-53.
Stanley, Thomas J. and Murphy A. Sewall (1978), "Predicting Supermarket Trade: Implications for Marketing Management," Journal of Retailing. 54 (Summer), 13-22, 91-92.
Stern, Louis W. and John R. Grabner (1970), Comoetition in the Marketplace. Glenview, IL: Scott, Foresman and Co.
Stern, Louis W, and Torger Reve (1980), "Distribution Channels As Political Economies: A Framework for Comparative Analysis," Journal of Marketing. 44 (Summer), 52-64.
Stern, Louis W. and A. El-Ansary (1982), Marketing Channels. 2nd. Ed.. Englewood Cliffs, N.J: Prentice Hall.
Stigler, George J. (1956), Trends in Employment in the Service Industries. Princeton University Press for NBER.
Stigler, George J. (1957), 'Perfect Competition,Historically Contemplated," Journa1 of Political Economv. (February), 1-17.
Strohkarck, Frank and Katherine Phelps (1950), "Mechanics of Constructing a City Market Map," Journal of Marketing. 15 (July), 61-64.

424Stewart P. W., J. F. Dewherst and L. Field (1939), Does
Distribution Cost Too Much?" N.Y: The Twentieth Century Fund.
Thanheiser, Heinz T. (1972), Strateav and Structure ofGerman Enterprise. Unpublished Ph.D Dissertation, Harvard Business School.
Takeuchi, Hirotaka (1977), Productivitv Analvsis As A Resource Management Tool in Retai1 Trade. Unpublished Ph.D Dissertation, University of California, Berkeley.
Takeuchi, Hirotaka and Louis P. Bucklin (1977),"Productivity in Retailing; Retail Structure and Public Policy," Journal of Retailing. 53 (Spring), 35-46, 94-95.
Thompson, Donald L. (1964), Analvsis of Retai1 Potential in Metropolitan Areas. Institute of Business and Economic Research, University of California, Berkeley.
Thompson, Donald L. (1967), "Consumer Convenience and Retail Area Structure," Journal of Marketing Research. 4 (February), 37-44.
Tigert, Douglas J. (1983), "Pushing the Hot Buttons for a Successful Retailing Strategy," in Patronage Behavior and Retai1 Management. W. R. Darden and R. F. Lusch (Eds.), N.Y: North-Holland, 89-113.
Tigert, Douglas J. and Sylvia Ma (1979), "In Search of a Supermarket Strategy: Albertson's Drives on Tampa-St. Petersburg," in Attitude Research Under The Sun. John Eighmey (Ed.), Chicago: American Marketing Association.
Tilley R. P. R. and R. Hicks (1970), "Economies of Scale in Supermarkets," Journal of Industrial Economics. 19 (November), 1-5.
Tucker, K. A. (1975), Economies of Scale in Retailing: An Empirical Studv of Plant Size and Cost Structure, Westmead, England: Saxon House.
University of Illinois Bulletin (1960), Productivitv in Marketing- Its Measurement and Change. Volume 58,(August).
Vaile, Roland S. (1949a), "Productivity in Distribution," Journal of Marketing. 13 (January), 385-386.
Vaile, Roland S. (1949b), "Towards A Theory Of Marketing--A Comment," Journal of Marketing. 13 (April), 520-522.

425Vaile, Roland S. (1956), "Efficiency in Distribution,"
Journal of Marketing. 20 (April), 410-411.
Vaile, Roland S., E . T . Grether and R. Cox (1952), Marketing in the American Economv. N.Y: Ronald Press.
Vernon, John M. (1972), Market Structure and Industrial Performance. Boston: Allyn and Bacon, Inc.
Vernon,, John M. and Robert E. M. Nourse (1972),"Profitability and Market Structure: An Analysis of Major Manufacturers of Non-Durable Consumer Products," Working Paper, Marketing Science Institute.
Wait, Donald J. (1980), "Productivity Measurement: AManagement Accounting Challenge," Management Accounting. 62 (May), 24-30.
Walker, Forest Q. (1953), "The nature of Distribution Cost Problem," Journal of Marketing. 11 (October), 151-168.
Weiss, Leonard W. (1971), "Quantitative Studies ofIndustrial Organization," in Frontiers of Quanti tative Economics, Michael D. Intriligator (Ed.TT Amserdam: North Holland, 363-411.
Weiss, Leonard W. (1974), "The Concentration-ProfitsRelationship and Antitrust," in Industrial Concentration: The New Learning. Harvey J. Goldschmid, et a 1 (Eds.), Boston: Little, Brown and Company.
Weld, Louis D. H. (1917), "Marketing Functions and Mercantile Organization," American Economic Review.(June), 306-318.
Werts, Charles E., Karl G. Joreskog and Robert L. Linn(1978), "Identification and Estimation in Path Analysis with Unmeasured Variables," American Journal of Socioloov. 78 No:6, 1469-1485.
Werts, Charles E. and R. L. Linn (1970), "Path Analysis: Psychological Examples," Psvcholoaical Builetin. 74, 193-212.
White, Lawrence J. (1976), "The Technology of Retailing:Some Results For Department Stores," in Studies in Non- Linear Estimation. S. Goldfeld and R. Quandt (Eds.), N.Y: Bal1inger, 127-139.
White, L. A. and J. B. Ellis (1971), "A System Construct for Evaluating Retail Market Locations," Journal of Marketing Research. 8 (February), 43-46.

426White, Phillip D. and Charles C. Slater (Eds.), (1978),
Macro-Marketina: Distribution Processes from a Societal Perspective. An Elaboration of Issues. Boulder, Colorado: Business Research Division.
White, Phillip D. (1979), "Macro-Marketing versus Micro- Marketing: Level of Aggregation As A Suffic.ient Definitional Criteria," in 1979 American Marketing Associ at ion Fal1 Educators' Conference Proceedings. Chicago: American Marketing Association, 619-623.
Wickern, Joseph (1966), "Store Space Allocation and Labor Costs in Theory and Practice," Journal of Retailino. (Spring), 36-43, 63.
Wildsmith, J. R. (1973), Managerial Theories of the Firm. N.Y: Dunelles Co., Inc.
Williamson, Oliver E. (1967), The Economics of Discretionarv Behavior. Chicago: Markham.
Wi1liamson, Oliver E. (1970), Corporate Control and Business Behavior. Englewood Cliff, N.J: Prentice Hall.
Williamson, Oliver E. (1975), Markets and Hierarchies : Analvsis and Antitrust Implications. N.Y: Free Press.
Wold, Herman (1980), "Model Construction and Evaluation When Theoretical Knowledge is Scarce," in Evaluation of Econometric Models. Academic Press, Inc., 47-76.
Wold Herman and Karl G. Joreskog (Eds.), (1982), Svsterns Under Indirect Observation- Causalitv ± Structure ± Prediction. Part II. N.Y.: North-Holland Publishing Co.
Wrigley, Leonard (1970), Divisional Autonomv andDiversification. Unpublished Ph.D Dissertation, Harvard Business School.
Zaltman, Gerald, Christian R. A. Pinson and Reinard Angelmar (1964), Metatheorv and Consumer Research. N.Y: Holt, Rinehart and Winston, Inc.
Zaltman, Gerald, Karen LeMasters and Michael Heffring(1982), Theorv Construction in Marketing. N.Y: John Wiley and Sons.

Appendix A
THE CORRELATIONS AMONG ALL THE MANIFEST VARIABLES
- 427 -

428
ROCA NPBT NSTSA NSTFE NSTIN MGREFF
ROCA 1.000NPBT 0.866 • 1.000NSTSA .0.805 0.697 1.000NSTFE 0.712 0.611 0.670 1.000NSTIN 0.897 0.662 0.759 0.673 1.000MGREFF 0.457 0.481 0.394 0.421 0.427 1.000MGRSKL 0.320 0.383 0.397 0.376 0.378 0.771MGRACH 0.452 0.466 0.333 0.389 0.390 0.765MGRSAT 0.487 0.484 0.328 0.426 0.440 0.862MGRAGE 0.306 0.283 0.272 0.156 0.221 0.098MGRRTL 0.255 0.233 0.242 0.176 0.250 0.202SERVC 0.141 0.150 0.106 0.148 0.097 0.078OFFER 0.199 0.207 0.116 0.175 0.164 0.093ATMOS 0.124 0.162 0.193 0.200 0.183 0.158LOCAT 0.106 0.144 0.150 0.164 0.169 0.042CSTCS -0.147 -0.137 -0.152 -0.222 -0.133 -0.165MINORS 0.357 0.260 0.284 0.244 0.250 0.257CHLD14 0.201 0.057 0.197 0.214 0.272 0.154INC14M 0.322 0.330 0.241 0.122 0.332 0.142S.PCPHH -0.046 -0.029 -0.025 -0.003 -0.087 -0.099DDSTRS -0.237 -0.196 -0.171 -0.115 -0.231 -0.102INTCPT1 -0.178 -0.116 -0.119 -0.091 -0.134 - -0.007INTCPT2 -0.139 -0.127 -0.083 -0.060 -0.101 -0.030ÎNTENCO -0.164 -0.122 -0.146 -0.135 -0.150 -0.080AVGINC -0.284 -0.279 -0.164 -0.110 -0.262 -0.066AVGHSV -0.276 -0.261 -0.168 -0.164 -0.251 -0.106AVGRTV -0.315 -0.333 -0.184 -0.141 -0.248 -0.116TINCHH -0.077 -0.067 -0.049 -0.106 0.034 0.057THSNVA -0.086 -0.074 -0.052 -0.109 0.015 0.049TRNTVA -0.093 -0.076 -0.060 -0.135 -0.010 -0.055TINCGP -0.086 -0.188 -0.040 -0.052 -0.046 -0.030TINCGH -0.148 -0.225 -0.111 -0.022 -0.139 -0.038POPG -0.182 -0.217 -0.123 -0.027 -0.178 -0.022HHSG -0.219 -0.266 -0.160 -0.054 -0.200 -0.053
MGRSKL MGRACH MGRSAT MGRAGE MGRRTL SERVC
MGRSKL 1.000MGRACH 0.659 1.000MGRSAT 0.736 0.740 1.000MGRAGE 0.114 0.188 0.216 1.000MGRRTL 0.193 0.187 0.283 0.626 1.000SERVC 0.066 0.073 0.068 0.076 0.051 1.000OFFER 0.067 0.063 0.088 0.044 0.008 0.729ATMOS 0.095 0.071 0.092 0.022 0.037 0.643LOCAT 0.032 0.048 0.074 0.037 0.043 0.395CSTCS -0.135 -0.144 -0.150 -0.109 -0.120 -0.498MINORS 0.162 0.168 0.212 0.053 0.059 -0.061

429CHLD14 0.170 0.154 0.192 0.029 0.019 -0.151INC14M 0.052 0.164 0.098 0.117 0.020 0.137SPCPHH -0.101 -0.085 -0.054 0.067 -0.002 -0.108DDSTRS -0.112 -0.095 -0.074 -0.029 0.053 -0.323INTCPT1 -0.070 -0.051 -0.045 -0:086 0.074 -0.319INTCPT2 -0.097 -0.030 -0.037 -0.089 0.081 -0.360INTENCO -0.044 -0.106 -0.135 0.017 0.070 -0.377AVGINC -0.014 -0.155 -0.066 -0.146 0.031 -0.158AVGHSV -0.034 -0.110 -0.121 -0.169 -0.064 -0.136AVGRTV -0.055 -0.140 -0.110 -0.219 -0.009 -0.212TINCHH 0.076 0.001 -0.036 -0.159 0.093 -0.231THSNVA 0.083 0.006 -0.027 -0.162 0.042 -0.197TRNTVA -0.005 -0.021 -0.116 -0.157 0.039 -0.178TINCGP -0.026 -0.024 -0.039 -0.008 0.031 -0.163TINCGH -0.072 -0.070 -0.020 -0.032 -0.005 -0.116POPG -0.037 -0.071 -0.016 -0.064 -0.034 -0.090HHSG -0.065 -0.094 -0.052 -0.091 -0.028 -0.103
OFFER ATMOS LOCAT CSTCS MINORS CHLD1.
OFFER 1.000ATMOS 0.590 1.000LOCAT 0.306 0.372 1.000CSTCS -0.543 -0.437 -0.224 1.000MINORS -0.137 -0.053 -0.094 -0.017 1.000CHLD14 -0.174 -0.121 -0.132 0.034 0.594 1.000INC14M 0.135 0.033 0.014 -0.173 0.569 0.235SPCPHH -0.078 -0.070 -0.048 0.089 -0.186 0.141DDSTRS -0.383 -0.185 -0.070 0.422 "0.155 -0.001INTCPT1 -0.416 -0.182 -0.159 0.339 -0.106 -0.003INTCPT2 -0.434 -0.223 -0.141 0.453 -0.081 -0.016INTENCO -0.506 -0.269 -0.205 0.259 0.031 -0.008AVGINC -0.162 -0.038 -0.034 0.182 -0.446 -0.086AVGHSV -0.098 -0.033 -0.057 0.056 -0.403 -0.304AVGRTV -0.222 -0.094 -0.077 0.217 -0.377 -0.105TINCHH -0.280 -0.148 -0.133 0.218 0.204 -0.215THSNVA -0.221 -0.072 -0.106 0.160 0.078 -0.259TRNTVA -0.189 -0.161 -0.116 0.139 0.085 -0.403TINCGP -0.217 -0.131 -0.061 0.105 0.103 0.479TINCGH -0.152 -0.082 -0.014 0.050 -0.131 0.334POPG -0.102 -0.047 -0.034 0.051 -0.244 0.244HHSG -0.126 -0.040 -0.029, 0.048 -0.267 0.218
INC14M SPCPHH DDSTRS INTCPT1 INTCPT2 INTEN'
INC14M 1.000SPCPHH -0.368 1.000DDSTRS -0.286 0.305 1.000INTCPT1 -0.222 0.249 0.780 1.000INTCPT2 -0.293 0.318 0.825 0.868 1.000INTENCO -0.108 -0.003 0.359 0.448 0.413 1.000AVGINC -0.890 0.275 0.251 0.277 0.309 0.177

430AVGHSV -0.647 0.231 0.284 0.283 0.250 0.185AVGRTV -0.781 0.240 0.240 0.303 0.334 0.233TINCHH 0.079 -0.382 0.275 0.377 0.315 0.413THSNVA -0.080 -0.320 0.194 0.325 0.257 0.380TRNTVA 0.181 -0.318 0.191 0.255 0.197 0.280TINCGP -0.500 0.348 0.152 0.141 0.137 0.107TINCGH -0.827 0.370 0.152 0.108 0.108 0.087POPG -0.890 0.387 0.121 ■ 0.102 0.090 0.045HHSG -0.710 0.384 0.152 0.143 0.126 0.091
AVGINC AVGHSV AVGRTV TINCHH THSNVA TRNTVAAVGINC 1.000AVGHSV 0.777 1.000AVGRTV 0.888 0.777 1.000TINCHH 0.184 0.313 0.310 1.000THSNVA 0.288 0.540 0.425 0.909 1.000TRNTVA 0.155 0.389 0.272 0.881 0.886 1.000TINCGP 0.529 0.277 0.519 -0.088 -0.084 -0.188TINCGH 0.832 0.381 0.580 -0.164 -0.135 -0.234POPG 0.707 0.508 0.854 -0.148 -0.049 -0.215HHSG 0.730 0.543 0.892 -0.089 -0.002 -0.157
TINCGP TINCGH POPG HHSGTINCGP 1.000TINCGH 0.940 1.000POPG 0.889 0.938 1.000HHSG 0.858 0.942 0.982 1.000

Appendix B
THE VARIANCES AND COVARIANCES AMONG ALL THE MANIFEST VARIABLES
431

432
ROCA NPBT NSTSA NSTFE NSTIN
ROCA 807.981NPBT 158.601 41.512NSTSA 539.492 105.879 555.875NSTFE 256.504 49.893 200.206 160.630NSTIN 38.450 6.432 26.986 12.863 2.274MGREFF 54.182 12.926 38.746 22.255 2.686MGRSKL 38.603 10.473 39.724 20.224 2.419MGRACH 48.617 11.361 29.709 18.656 2.225MGRSAT 120.185 27.074 67.140 46.875 5.761MGRYRS 45.473 9.533 33.527 10.337 1.742MGRRTL 70.483 14.598 55.482 21.691 3.666SERVC 18.749 4.521 11.691 8.775 0.684OFFER 39.370 9.283 19.035 15.437 1.721ATMOS 19.513 5.778 25.191 14.033 1.528LOCAT 8.328 2.564 9.775 5.745 0.704CSTCS -13.768 -2.908 -11.808 -9.271 -0.661MINORS 302.392 49.919 199.530 92.152 11.234CHLD14 32.886 2.114 26.735 15.612 2.361INC14M 85.890 19.952 53.320 14.510 4.698SPCPHH -14.064 -2.010 -6.340 -0.409 -1.411DDSTRS -10.981 -2.058 -6.572 -2.376 -0.568INTCPT1 -13.732 -2.028 -7.615 -3.130 -0.548INTCPT2 -54.394 -11.265 -26.941 -10.469 -2.097INTENCO -27.038 -4.559 -19.965 -9.924 -1.312AVGINC -45.296 -10.086 -21.696 -7.823 -2.217AVGHSV -128.600 -27.565 -64.928 -34.071 -6.205AVGRTV -53.947 -12.927 -26.137 -10.767 -2.253TINCHH -23.857 -4.705 -12.592 -14.644 0.559THSNVA -25.030 -4.882 -12.553 -14.145 0.232TRNTVA -135.782 -25.151 -72.661 -87.883 -0.775TINCGP -14.220 -7.046 -5.486 -3.834 -0.404TINCGH -22.149 -7.633 -13.779 -1.468 -1.104POPG -21.868 -5.910 -12.258 -1.446 -1.135HHSG -27.054 -7.448 -16.395 -2.974 -1.311
MGRSKL MGRACH MGRSAT MGRYRS MGRRTL
MGRSKL 18.012MGRACH 10.583 14.319MGRSAT 27.119 24.311 75.377MGRYRS 2.529 3.719 9.804 27.332MGRRTL 7.965 6.881 23.892 31.824 94.556SERVC 1.310 1.292 2.762 1.859 2.320OFFER 1.979 1.659 5.318 1.601 0.541ATMOS 2.232 1.487 4.422 0.637 1.992LOCAT 0.375 0.502 1.776 0.535 1.156CSTCS -1.888 -1.795 -4.291 -1.878 -3.845

433MINORS 20.488 18.944 54.848 8.257 17.095CHLD14 4.153 3.354 9.595 0.873 1.063INC14M 2.071 5.823 7.984 5.740 1.825SPCPHH -4.610 -3.460 -5.043 3.768 -0.209DDSTRS -0.775 -0.586 -1.047 -0.247 0.840INTCPT1 -0.806 -0.524 -1.060 -1.220 1.953I.NTCPT2 -5.667 -1.563 -4.422 -6.406 10.843IWTENCO -1.083 -2.326 -6.798 0.515 3.948AVGINC -0.333 -3.291 -3.215 -4.283 1.691AVGHSV -2.365 -8.823 -17.220 -14.483 -10.201AVGRTV -1.406 -3.192 -5.754 -6.898 -0.527TINCHH 3.516 0.041 -3.407 -9.061 9.857THSNVA 3.607 0.232 -2.400 -8.672 4.182TRNTVA -1.090 -4.082 -51.729 -42.159 19.479TINCGP -0.642 -0.528 -1.970 -0.243 1.753TINCGH -1.603 -1.395 -0.914 -0.881 -0.256POPG -0.664 -1.136 -0.587 -1.414 -1.398HHSG -1.199 -1.546 -1.962 -2.068 -1.163
OFFER ATMOS LOCAT . CSTCS MINORS
OFFER 48.442ATMOS 22.733 30.647LOCAT 5.887 5.692 7.640CSTCS -12.453 -7.971 -2.040 10.857MINORS -28.414 -8.743 -7.742 -1.669 887.980CHLD14 -6.971 -3.856 -2.100 0.645 101.885INC14M 8.817 1.714 0.363 -5.349 159.112SPCPHH -5.839 -4.168 -1.427 3.154 -59.616DDSTRS -4.345 -1.669 -0.315 2.266 -7.529INTCPT1 -7.858 -2.734 -1.193 3.032 -8.573INTCPT2 -41.585 -16.996 -5.365 20.549 -33.230INTENCO -20.426 -8.637 -3.286 4.950 5.358AVGINC -6.327 -1.180 -0.527 3.365 -74.572AVGHSV -11.181 -2,995 -2.583 3.025 -196.851AVGRTV -9.309 -3.135 -1.282 4.308 -67.686TINCHH -21.242 -8.931 -4.007 7.830 66.251THSNVA -15.749 -4.081 -3.000 5.398 23.799TRNTVA -67.566 -45.781 -16.469 23.525 130.101TINCGP -8.786 -4.219 -0.981 2.013 17.854TINCGH -5.570 -2.390 -0.204 0.867 -20.553POPG -3.001 -1.100 -0.397 0.710 -30.734HHSG -3.811 -0.962 -0.348 0.687 -34.578
INC14M SPCPHH DDSTRS INTCPT1 INTCPT2
INC14M 88.059SPCPHH -37.144 115.692DDSTRS -4.375 5.347 2.657INTCPT1 -5.654 7.269 3.451 7.366INTCPT2 -37.853 47.089 18.513 32.432 189.530INTENCO -5.878 -0.187 3.394 7.052 32.977

434AVGINC -46.862 16.597 2.296 4.218 23.869AVGHSV -99.523 40.728 7.588 12.590 56.417AVGRTV -44.157 15.553 2.357 4.955 27.704TINCHH 8.081 -44.786 4.886 11.153 47.269THSNVA -.7.687 -35.242 3.238 9.051 36.227TRNTVA 77.602 -175.686 15.991 35.547 139.304TINCGP -27.293 21.648 1.441 2.226 10.971TINCGH -30.978 20.953 1.304 1.515 7.828POPG -27.370 17.595 0.834 1.170 5.237HHSG -28.956 17.015 1.077 1.687 7.539
AVGINC AVGHSV AVGRTV TINCHH THSNVA
AVGINC 31.483AVGHSV 71.465 268.698AVGRTV 29.344 75.738 36.301TINCHH 10.030 55.925 20.358 118.810THSNVA 16.546 90.632 26.218 101.449 104.837TRNTVA 44.672 310.683 84.175 493.243 465.962TINCGP .17.266 26.413 18.190 -4.185 -5.003TINCGH 18.670 32.882 17.764 -9.412 -7.278POPG 16.768 35.060 16.656 -6.819 -2.121HHSG 17.801 38.683 18.120 -4.216 -0.089
TINCGP TINCGH POPG HHSG
TINCGP 33.837TINCGH 28.789 27.720POPG 21.367 20.875 17.868HHSG 21.640 21.555 18.040 18.888

Appendix C
THE RESEARCH INSTRUMENTS USED IN THE STUDY
- 435 -

STORES, INCORPORATED SURVEY OF STORE OPERATIONS
SPECIAL INSTRUCTIONS
Please provide us with data for all the items on the SURVEY OF STORE OPERATIONS DATA FORM. If you have any questions about any items please call: Robert F. Lusch or Ray Serpkenci at (405) 325-3561.It should be noted that there are several pages at the end of the questionnaire that you may use to explain why a data element may be missing or why it takes on an "unusual" value. For instance if sales dropped substantially in a particular month (due to a fire for example) then you should make note of this.Our ability to produce meaningful analysis is directly related to the quality of the data you provide. Therefore please take care in completing the SURVEY OF STORE OPERATIONS DATA FORM. Pay particular'attention to the following:
QUESTION A.7, Other Operating Expenditures. The only operating expenses we need are rent, advertising and corporate overhead. We recognize that the procedures and/or the amount of corporate overhead allocated to stores has changed over the last couple of years. By obtaining the corporate overhead expenses we can add it to net profit to get a cleaner profit figure.
QUESTION A.8, Net Profit. Please provide a dollar figure before income taxes but before any assignment of corporate overhead to each store.
QUESTION B.2, Gross Book Value of Fixtures and Equipment. Please provide an end-of-year dollar figure before accumulated depreciation and/or amortization.
QUESTION B.3, Net Book Value of Fixtures and Equipment. Please provide an end-of-year dollar figure after accumulated depreciation and/or amortizatibn.
QUESTION B.4, Replacement Value of Fixtures and Equipment. Estimate how much it would have cost at year end 1981 to replace all fixtures and equipment in the store. Assume that you would replace with the identical or similar fixtures and equipment.
QUESTION Cl.2, Major Remodeling. We define a major remodeling as replacing at least 50% of all the fixtures and equipment in the store. Or redesigning at least 50% of the exterior of the store.
QUESTION Cl.3, Remodeling Expenditures. Please provide either the actual cost or an estimate of the actual cost of the last major remodeling.

- 2 -
QUESTION CIII.l, Number of Full-Time Employees. What is theaverage number of full-time employees (including managers).You may compute this by taking the number of full-time employees at the beginning of each month and obtaining an average for the year.
QUESTION C.III.2, Number of Part-Time Employees. What is theaverage number of part-time employees. You may computethis by taking the number of part-time employees at thebeginning of each month and obtaining an average for the year.
QUESTION CIV.l, Hours of Operation. We need to know the typical store hours for each day of the week for 1979, 1980 and 1981. If there was any change during a particular year, please give us the store hours that occurred most frequently during the year.

STORES, INCORPORATED
SURVEY OF STORE OPERATIONS DATA FORM
CONFIDENTIAL
Store Number : #
Store Address :
(address) (city) (state)
A. FINANCIAL STATISTICS- Revenues and Expenditures
1. Net Sales (Revenues)(Total revenues from merchandise sold, net o f returns and allowances. Please enter in nearest dollars)
1978 1979 1980 1981
January
February
March
April
May
June
July
August
Septem ber
O ctober
November
December
TOTAL

□ □ □
Survey of StoresData Form P.2
1979 1980 1981
2. Target Gross Profit for the Year:
%
3. Realized Gross Profit for the Year:
4. Hourly Employee Payroll
(Wages paid to all non salaried employees, excluding payroll taxes and employee benefits)
January
February
March
April
May
June
July
August
September
October
November
December
TOTAL
5. Salaried Employee Payroll(Salaries paid to all non-hourly employees, excluding payroll taxes and employee benefits)
TOTAL

□ □ □
Survey of StoresData Form P.3
1978 1979 1980 1981
6. O ther Operating Expenditures (in nearest dollars)
a. R ent
b. Advertising
c. Corporate Overhead
TOTAL
7. Net Profit (Before Tax)
B. FINANCIAL STATISTICS- Assets and Investments
1. End o f Year Inventory
2. Estim ated Replacem ent Value o f Fixtures and Equipm ent
C OPERATING STATISTICS
I. AGE O F STORE
1. Date Store First Opened
2. Date o f Last Major Remodeling (if any)
3. Remodeling Expenditures
(m onth) (year)
(m onth) (year)

SIZE OF STORE
□ □ □
Survey of StoresData Form P.4
1979 1980 1981
1. Total Sq. F t o f Spacefor the store
2. Total Sq. F t o f Selling
Space for the store
3. If there has been an increase in store space, please provide an estim ate o f the expansion cost per sq. f t
4. Number o f Check-out Counters
5. Number o f Parking Spacesa. S treet Parking
b. Lot Parking
III. EMPLOYEE PROFILE
1. Number o f Full-Time Employees
2 Number o f Part-Time Employees
TOTAL
3. Average Hourly Wage Rate per Hourly Employee (Excluding payroll taxes and employee benefits) $

□ □ □
Survey of StoresData Form P.S
1979 1980 1981
IV. STORE OPERATIONS
1. Hours o f Operation for this store (Hours per day)
Monday
Tuesday
Wednesday
Thursday
Friday
Saturday
Sunday
Total Hours per Week
2 Merchandise Lines Carried in 1981 (Please Circle the appropriate response)
a. A uto Accessories and Parts
b. Sporting Goods
c. Appliances (excluding smallappliances. )
yes
yes
yes
nono
no

□ □ □
Survey of StoresData Form P.6
Please indicate in the spaces provided below any comments you may have regarding the data you provided to us in prior pages. These comm ents should pertain to any unusual trend, abnorm ality o r dis-continuity in the operations o f the store or any other material facts that could help us in evaluating the data.
DATA FORM PAGE NO. RELEVANT FIGURES COMMENTS
Thank You.

Dear Store Manager:H p i j l B i s in the process of conducting a major market research study.This study will help us identify the customers we serve and the competition we face in each market. As you might expect, this information will help you better operate your store for improved profitability. I hope I can count on your assistance in this research effort.Enclosed is a questionnaire entitled, "COMPETITIVE AUDIT DATA FORM". Predictably, this questionnaire may take a fair amount of time to complete.In fact, it would not be unusual if it took an entire day of your time.I would like you to take the necessary time to fill it out as accurately and completely as possible. If you do not have the precise answer to someof the questions, please use your best judgment or estimate.Before you begin to answer the questions in the Competitive Audit Data Form, please take a few minutes to acquaint yourself with its contents and the accompanying "special instructions." In completing the questions you will find it necessary to drive the trade area of your store. This will not only insure that you provide us with more accurate information but also will allow you to inspect and examine who and where your competitionI S .
Best of luck on this important D r y e c ^ j m ^ ^ y o u have any questions please feel free to call me at Please return the completedquestionnaire to your District 28.Cordially,
SPECIAL INSTRUCTIONS FOR COMPLETING ' ::'Y • .. . \ 'V*-■■• •É* ■.. COMPETITIVE AUDIT,DATA FORM^, ;
It is critical that the Competitive Audit Data Form be accurately and "
_ A. Please note for purposes of this survey that your store has. been classified as either"an SMSA store, or a Non-SMSA store' % : %' h (see cover page of questionnaire). It is important for you‘ f__I 1__ _•____• 1 ^ »___'•______ # "W.'t- . .
Please note on page-1 of the survey (question-1) that your' store's trading area has already been defined for you. It -1"'is important that you keep this trade area definition in mind ■ when answering all of question-1. \ ; ''• C. In question-1 we are asking that you provide us with the approxi- _ mate gross leasable space of all comoetitors in your trade area.: •■'/'By gross leasable space we mean the total square feet,of sellingi and nonselling space. Please also note that the size categories that we provide you with change for different lines of retail V ;..trade--when filling out the survey please keep this in mind.'%-'.
In question-1 we have indicated the names of several^key re- *J^-^:'?T'%tailers that may be currently present in your .trade,area, AND “• &P-:^''LEFT,SPACES FOR YOU TO ENTER OTHERS. ;;;If there are. other cotnpe- ’ Æ iiVy.'ftitive retail establishments in your trading area Whose names J', !%%y%;':.t;'do not appear in question-1, please enter their names in the Ÿ 4
G. in qùestion-2, which deals'with retail establishments OUTSIDE••V'-->?' '!'YOUR DEFINED TRADE AREA, we are only interested in retail estab- lishments that you feel are major competitors. BY MAJOR COMPEr J'- TITOR we mean that you have direct knowledge (either from your ' customers, friends, family, etc.) that this competitor is taking ' : . ; a significant number of customers away from your store.. Please note the instructions for questions 3a and 3b. Question' should be completed ONLY IF, your store has been classified
I. Question-5 asks you to assess how your top competitor compares. ;/,1n relation to your store. Please enter the name of this top . À, V .competitor in the space provided. This will allow you to keep ' 'r . this top competitor in mind when you respond to the various ‘.v -v:items in question-5.J. On the last page of the survey, section-B should only be completed'■ t if your store is classified as an SMSA-store. ,;0n the other hand,section-C should be completed only if your store is classified as a ". . . . . . . .
THANK

store Number: □ □ □
C O M P E T I T I V E A U D I T D A T A F O R M
store Number.
Store Address:(address) (city) (state)
The following survey is designed to provide us with a better understanding of the competitive environment in your trade area or township. Since the trade area boundaries are different depending on where the store is located, p lease follow the instructions ca refully and answ er only those questions that are relevant for th is ■ ■ ■ S t o r e .
For th e purposes of th is survey, your store is classified as: □ An SMSA Store D A Non-SMSA Store
FOR INTERNAL USE ONLY
SMSANon-SMSA (Large Town/Radius) Non-SMSA (Small Town/City Limits) County Seat
RRDATA PROCESSING
EditCodeKeypunch
R□Edited By (Initials) □ □□

Store Number: D □ □
A. STRUCTURE OF COMPETITION (For both SMSA and non-SMSA Stores)
1. We have indicated below, the nam es of several key retailers that may be currently present In your trade area, and left sp aces for you to en ter o thers. If there are other competitive retail estab lishm ents In your trading area w hose nam es do not appear below, p lease enter their nam es in the appropriate segm ents and circle the colum n that best approxim ates the g ross leasable sp ace (In sq . ft.) for each.
For the purposes of this questionnaire, your trading area Is defined as;
D Approximately Two (2) mile driving distance from t h l s ^ m ^ S t o r e
□ City Limits Only
D City Limits and County
P le a s e c irc le th e a p p r o x im a te g r o s s l e a s a b le s p a c e (in s q . ft.)
C h e c k E s t im a te d D riv ing D is ta n c e L e s s T h a n 10,000- 20 .000- 40 ,000- 6 0 .000 - If O ver 80 .000 If P r e s e n t (to t h e n e a r e s t % o f a m ile) 10 ,000 2 0 ,0 0 0 40 ,0 0 0 6 0 ,0 0 0 ^ , 0 0 0 P le a s e E s tim a te
A . N ATIONAL C H A IN S
S E A R S
R e g u la r S to r e _____
C a ta lo g S to r e ...........
□□
PE N N E Y S
R e g u la r S to r e DC a ta lo g S to r e □
W A R D S
R e g u la r S to r e DC a ta lo g S to r e □
D ISC O U N T D EPA R TM EN T S T O R E S
K.M ar* . H 1 2 3 4 5
W a l-M a r t......................... n 1 2 3 4 5
G ib s o n 's .. .. .. .. .. .. .. .. .. .. .. n 1 2 3 4 5
T a r g e . ...m.......m.......h...
W o o lc o .. . . . . . . . . .
n 1 2 3 4 5
n 1 2 3 4 5
T .G ftV ........ ..................... n 1 2 3 4 5
□ 1 2 3 4 5
□ 1 2 3 4 5
n 1 2 3 4 5
n 1 2 3 4 5
P le a s e c ir c le t h e a p p r o x im a te g r o s s l e a s a b le s p a c e (in s q . ft.)
C h e c k E s t im a te d D riv ing D is ta n c e If P r e s e n t ( to th e n e a r e s t % o f a m ile)
U n d e r5 ,0 0 0
5,000-10 ,000
10,000-15 ,000
15,000-2 0 ,0 0 0
20 ,000-2 5 ,0 0 0
If o v e r 25,000 P le a s e E s t im a te
VARIETY S T O R E S
B e n F ran k lin .... .. .. .. .. .. n 1 2 3 4 5
W o o ltv o r th . .. .. .. .. .. .. .. . n 1 2 3 4 5
M cC o ry . . . . . . . . . . . . . . . . . . . . . n 1 2 3 4 5S p r o u s e R e i tz _______ n 1 2 3 4 5
□ 1 2 3 4 5
n 1 2 3 4 5
n 1 2 3 >i’ 5
n 1 2 3 4 5
n 1 2 3 4 5

store Number: □ □ □
CheckIf Present
0 . DRUG S T O R E S
EckerO s ^^3
Mu tfCO ####*#— []W a lg r e e n ------------------------ □
S u p e r X.. □□□□□
P le a s e c irc le th e a p p ro x im a te g r o s s l e a s a b le s p a c e (In s q . ft.)
E s t im a te d D riv ing D is ta n c e U n d e r 5 ,000 - 10,000- 15,000- 20 ,000 - If o v e r 25 .000( to th e n e a r e s t % o f a m ile ) 5 ,0 0 0 10 ,0 0 0 15 ,000 2 0 ,0 0 0 2 5 ,0 0 0 P le a s e E s t im a te
3
3
3
3
3
3
3
3
4
4
4
4
4
4
4
4
5
5
5
5
5
5
5
5
E . FAM ILY C L O T H IN G S T O R E S
C .R . A n th o n y ......................... □
B e a lls
J .B . W h i t e _______________ □
W e in e r s ______ D □ □ □ □
3
3
3
3
3
3
3
3
4
4
4
4
4
4
4
4
F . FA B R IC S T O R E S
C lo th W o rld ..........
H a n c o c k F a b r i c s .
□□□□□
G . DOLLAR S T O R E S
D o lla r G e n e ra l . . . . . . . DB ill 's D o lla r______________ □
□ □
2222
5
5
5
5
H. HARDWARE STOREST ru e V a lu e ... .. .. ._____
A rfE....H..H..MM........MHi
C o a s t - T o - C o a s t -------
□□□□□□
222222
3
3
3
3
3
3
4
4
4
4
4
4
5
5
5
5
5
5
I. H O M E & AU TO S T O R E S
W e s te rn A u to ............... DO t a s c o ....................... DW h ite s .............. DY ellow F r o n t ........................... D □ □ □
2222222
3
3
3
3
3
3
3
55
5
5
5
5
5

store Number □ □ □
P le a s e c irc le t h e a p p ro x im a te g r o s s le a s a b le s p a c e (in s q . ft.)
CheckIf Present
J . H O M E C E N T E R S /L S M D E A L E R S
P a y le s s C a s h w a y s ---------- DH a n d y
A la m o E n te r p r i s e s DW ic k e s . . . . . . ----------- DH o m e rs
P a y N P a k ____________ DH a n d y n^an
□
E s t im a te d D riv in g D is ta n c e ( to t h e n e a r e s t v< o f a m ile)
U n d e r10,000
□
10,000-20,000
2222222222
20,000-30 ,000
3
3
3
3
3
3
3
3
3
3
30,000-40,000 40.000-50 ,0 0 0
5555555555
If o v e r 50 .000 P le a s e E s tim a te
P l e a s e c irc le t h e a p p r o x im a te g r o s s l e a s a b le s p a c e (in s q . ft.)
C h e c k If P r e s e n t
K . SU P E R M A R K E T S
S a f e w a y _______________ DK ro g e r (SuptrmarKsts)................... O
H E B .................................................. □
H a n d y A n d y ................................. O
A lb e r t s o n 's (Supamutnaisi D
U n ite d .............................................. DF u r r s ................................................. DP Ig g ly W ig g ly .............................. □
M in im a x -------- ... .. DIGA......................................... » □ □ □ □ □
E s t im a te d D riv in g D is ta n c e U n d e r ( to t h e n e a r e s t V< o f a m ile ) 10 ,000
10,000-15 ,000
22222222222222
15,000-20,000
3
3
3
3
3
3
3
3
3
3
3
33
3
20,000-3 0 ,0 0 0
30 ,000-4 0 ,0 0 0
55555555555555
If O v e r 40 ,0 0 0 P le a s e E s t im a te
P le a s e c irc le t h e a p p r o x im a te g r o s s l e a s a b le s p a c e (in s q . ft.)
C h e c k E s t im a te d D riv in g D is ta n c e 30 ,000 - If P r e s e n t ( to t h e n e a r e s t V* o f a m iie ) 4 0 ,0 0 0
L . C O M B IN A TIO N S T O R E S
S k a g g s ------------------------------- D
H a n d y D a n ..............------- .... DT o m T h u m b /P o g e — D
A lb e r ts o n 's (Suptrstofa)........ O
K ro g e r (Family cam ari)............ O
□ □ □
40,000-50 ,000
22222222
50,000- If O v e r 60 .0 0 0 6 0 ,0 0 0 P le a s e E s t im a te
3
3
3
33333

store Number: D D GCheck
It PresentM. CA TA LO G S H O W R O O M S
B e s t P r o d u c ts . . . . ; --------------------------- □
H .J . W ils o n _______________ □
O .G . W i l s o n _______________________ □
S e rv ic e M e r c h a n d is e ______________ D
□ □
E s t im a te d D riv ing D is ta n c e ( to t h e n e a r e s t V< o f a m ile )
E s t im a te d G r o s s L e a s a b le S p a c e (In s q . ft.)
N . O T H E R SPEC IA LT Y RETAILERS
R a d io S h a c k __________________ DC a r d S h o p s :
H a llm a rk _______ D
□ □T o y /H o b b y S to r e s :
T o y s R U s ......................... □ □ □All O th e r R e ta ile r s :
□□□□□
2. After com pleting the first question, do you think there are o ther retail estab lishm ents ou tside of your trading area a s we defined it, which you feel are major com petitors to th i s p H H iS to r e ?
□ N o
D Y e s . If Y es , p l e a s e c o m p le te t h e fo llo w in g :
N a m e o f R e ta i le rT y p e o f R e ta i le r
( s e e c a t e g o r ie s in Q u e s t io n 1)E s t im a te d D riv ing D is ta n c e ( to t h e n e a r e s t Vi o f a m ile )
E s t im a te d G r o s s L e a s a b le S p a c e (in s q . ft.)

store Number. D □ □3a. (if SMSA Store, p lease answer th is question, otherw ise go to 3b). P lease indicate the NUMBER of com
petitive retail operations within your:N u m b e r o f S to r e s
a. P r im a ry T ra d in g A rea {2-mlle d riv in g d i s t a n c e ) ___
b . S e c o n d a r y T ra d in g A re a (4-m ile d r iv in g d i s t a n c e ) .
c . T e r t ia ry T ra d in g A re a (6 -m ile d riv in g d i s t a n c e ) .......
C u m u la tiv e T o ta l ....____ :.______ ......__
3b. (If non-SMSA Store, p lease answ er this question, otherw ise go to the next question). P lease indicate the NUMBER of competitive retail operations in your:
N u m b e r o f S to r e s
a. T o w n o r C ity l im i t s _____
b . C o u n ty -----------------
Think of the m ajor com petitors you’ the TOP THREE Com petitors to th is"
indicated in the first question. Which of them would you say are store?
N a m e o f R e ta ile r
E s t im a te d D riv ing D is ta n c e T o T ftis S to r e
(to t h e n e a r e s t V< o f a m ile)
W o u ld Y o u S a y , ,(•flWf cecnptlitor)
h a s :
A p p ro x im a te S to r e S ize (G ro s s L e a s a b le S p a c e )
(in s q . ft.)
a. N u m b e r o n e c o m p e t i to r ....
b. N u m b e r tw o c o m p e t i to r ....
c . N u m b e r t f t re e c o m p e ti to r . .
For each of th e following characteristics, p lease circle the number that you believ TOP COMPETITOR (the store you indicated in 'a'-above), IN RELATION TO T H IS P
t describes the store.
T tia n T h i s ! I S to re ?
b e t t e r lo c a t io n 1 2 3 4 5 6 p o o re r lo c a t io n
h ig h e r e v e r y d a y p r ic e s ' 1 2 3 4 5 6 lo w e r 'e v e ry d a y p r ic e s '
s m a l le r s to r e 1 2 3 4 5 6 la rg e r s to r e
b e t te r q u a l i f ie d e m p lo y e e s ? 2 3 4 5 S le s s q u a lif ie d e m p lo y e e s
n a r ro w e r s e le c t io n 1 2 3 4 5 6 w id e r s e le c t io n
la e tte r q u a l i ty m e r c h a n d is e 1 2 3 4 5 6 p o o re r q u a li ty m e rc h a n d is e
l e s s a d v e r t is in g 1 2 3 4 5 6 m o re a d v e r t is in g
p o o re r s a l e p r ic e s ' 1 2 3 4 5 6 b e t te r 's a l e p r ic e s '
h ig h e r p r e s t ig e 1 2 3 4 5 6 lo w e r p re s t ig e
lo w e r p a id e m p lo y e e s 1 2 3 4 5 6 h ig h e r p a id e m p lo y e e s
b e t t e r in te r io r d e s ig n 1 2 3 4 5 6 p o o re r In te r io r d e s ig n
m o re p a rk in g s p a c e 1 2 3 4 5 6 l e s s p a rk in g s p a c e
p o o re r s t o r e f ix tu re s 1 2 3 4 5 6 b e t te r s to r e f ix tu re s
b e t te r r e tu r n p o l ic ie s 1 2 3 4 5 6 p o o re r r e tu rn p o l ic ie s
p o o r e r s t o r e a tm o s p h e r e 1 2 3 4 5 6 b e t t e r s t o r e a tm o s p h e r e
b e t t e r d is p la y s 1 2 3 4 5 6 p o o re r d is p la y s
l e s s n a t io n a l b r a n d s 1 2 3 4 5 6 m o re n a t io n a l b r a n d s
b e t t e r v a lu e fo r th e m o n e y ' 1 2 3 4 5 6 p o o re r 'v a lu e fo r th e m o n e y
b e t te r a c c e s ib i i i ty 1 2 3 4 5 6 p o o re r a c c e s s ib i l i ty
l e s s c h e c k o u ts 1 2 3 4 5 6 m o re c h e c k o u ts

Store Number D □ DB. TRADE AREA ATTRACTIVENESS (For SMSA S to res Only)
The last few Questions are about th e trade area in general. P lease provide u s your a sse ssm en t of the tradeThe last tew Questions are about th e trade area in area for thisfljH U jBstore. (Circle your responses)
1. Within a 2-mile driving d istance from t h i s f l |H |s t o r e , would you say now is a good tim e to open a | store?
' D e fin ite ly N o t 1 2 3 4 5 6 7 D e fin ite ly Y e s
2. In general, how satisfied are you with the annual sa le s volume of f h i s ^ ^ j ^ s t o r e ?
V ery S a t is f ie d 1 2 3 4 5 6 7 V ery D is s a t i s f ie d
3. How would you describe the ‘competition* that this store faces within:
a. 2 -m ile d r iv in g d i s t a n c e
V ery W e a k 1 2 3 4 5 6 7 V ery S tro n g
b . 4 m ile d r iv in g d i s ta n c e
V ery W e a k 1 2 3 4 5 6 7 V ery S tro n g
c . 6 -m ile d riv in g d i s ta n c e
V ery W e a k 1 2 3 4 5 6 7 V ery S tro n g
4. How would you describe the overall econom ic conditions in th is community?
V ery S tro n g 1 2 3 4 5 6 7 V ery W ea k
C. TRADE AREA ATTRACTIVENESS (For Non-SMSA S to res Only)
The last few q u e s t io n ^ m about the trade area In general. P lease provide us your candid asse ssm e n t of the trade area for t h i s n H K t o r e . (Circle your responses)
1. In your town or city, would you say now is a good tim e to open a ^ ] ^ ^ s t o r e ?
D e fin ite ly N o t 1 2 3 4 5 6 7 D e fin ite ly Y es
2. In your county, would you say now is a good tim e to open a 0 0 0 sto re?
D e fin ite ly N o t 1 2 3 4 5 6 7 D e fin ite ly Y e s
3. How would you describe the ‘com petition that this sto re faces in th is town or city?
V e ry W e a k 1 2 3 4 5 6 7 V e ry S tro n g
4. How would you describe the overall econom ic conditions in this town o r city?
V ery s t r o n g 1 2 3 4 5 6 7 V e ry W e a k
5. How would you describe the overall econom ic conditions in th is county?
V ery s t r o n g 1 2 3 4 5 6 7 V ery W e a k
6. In general, how satisfied are you with the annual sa le s volume of t h i s 0 0 | | | | s t o r e ?
V ery S a t i s f ie d 1 2 3 4 5 6 7 V ery D is s a t is f ie d
T h s tn W V r i i i y /A rv K411 ^ h Vr» - » r

Dear District Supervisor:As you may have already heard, N j ^ ^ i s in the process of conducting a major research study on the customers we serve and the competition we face in each of our markets. As part of this research effort, we would also like to get an insight into the effectiveness of our store managers in order that we can initiate programs to help them perform even better in the future. For this purpose we have developed a two page Survey of Managerial Effectiveness questionnaire. It is our hope that this questionnaire will provide us with this insight into how our store managers perform on a variety of tasks and responsibilities.Enclosed you will find a sufficient number of questionnaires for each of the stores that are currently under your supervision. We need to have each of these questionnaires completed for the person who was the store manager in each of these Winn's stores for fiscal 1981.
* If the present manager (in 1982) is not the same person who was the manager in 1981, please complete the questionnaire with the former manager in mind. That is, do not evaluate the current manager if he was not in tenure with the store in 1981.
* If the store in question did not have a single managerin fiscal 1981, that is, if there was more than one managerin this store in 1981, please evaluate the manager who had at least a 6 month tenure or longer in that store in 1981.
* If the store in question had no managers with a tenure ofat least 6 months with that store in 1981, then please state this on the cover page of the questionnaire and do not fill out the survey for that store.
We are confident that you will provide us with your most candid evaluation of each store manager. Please do take the necessary care and give attention to reading and responding to each question, keeping in mind the strict confidentiality of this survey. The results of this research will only be useful if we receive accurately and completely filled questionnaires. Your cooperation in this important phase of our research is very much appreciated.Please do not hesitate to call me a t H | m | | H i f you have any questions or if I may be of any assistance.Cordially,

store Number O D D
S U R V E Y O F M A N A G E R I A L E F F E C T I V E N E S S
CONFIDENTIAL
ENTER HERE IF AND WHY SURVEY CANNOT BE COMPLETED:
For Internal Use Only
FILING STATUS: DATA PROCESSING:
□ Full Tenure 1981 C ode □□ Half T enure 1981 Edit □□ No Tenure 1981 Keypunch □

store Number D □ DThe following is a one page Survey of Managerial Effectiveness f o r N B & t o r e m anagers. Ws would like you to candidly evaluate the perform ance of this sto re m anager, for the n lc a n s S I period. To ease the task, we have itemized the key attribu tes of perform ance for you. P lease indicate for each of the following item s your a sse ss m ent of th is store m anager’s perform ance, by circling the appropriate number.
5 STRONGLY AGREE4 AGREE
3 UNDECIDED2 DISAGREE
1 STRONGLY DISAGREE
A. T H IS S T O R E M ANAGER:
1. H a s th e a b i l i ty t o s o lv e m o s t d a y -to -d a y p r o b le m s --------------------------- ....— ------- -
2 . H a s d if f ic u lty in m a k in g r a p id a n d s o u n d d e c i s i o n s . . . . . . . . . . . . . . ............hmhm.h..h..
3 . C a n q u ic k ly a d ju s t t o n e w s i t u a t io n s -
4. T a k e s r e s p o n s ib i l i ty in h is w o r k -----------------
5 . D is p la y s u p - to -d a te k n o w le d g e o fs t o r e o p e r a t i o n s -------------------------------------......
6 . F a i l s t o m e e t th e t a r g e t g o a l s s e t fo r t h e s t o r e ____________ _____________ ____
7 . H a s d if f ic u lty in m a k in g o p e ra t in g d e c i s i o n s to a c h ie v e t h e g o a l s s e t fo r th e s to r e .
8 . K e e p s a n o p e n line o f c o m m u n ic a t io n w ith t h e d i s t r i c t s u p e r v i s o r ___
9 . C a n c o p e w ith p r e s s u r e o r s t r a in o n
10 . k X a in ta ln s p h y s ic a l fa c i l i t ie s o f t h e s to r e In g o o d o r d e r . . .
1 1 . H a s m a n a g e r ia l in te g rity ..
5 STRONGLY AGREE4 AGREE
â UNDECIDED2 DISAGREE
1 STRONGLY DISAGREE
11 . M o n ito rs c u s to m e r s a n d c o m p e ti to r sIn th e t ra d in g a r e a . . . . . . . . . . . . . . . . . . . . . . . . . . . . . . . . . . . . . .
12 . F a ils t o p ro v id e u p - to -d a te in fo rm a tio nt o to p m a n a g e m e n t . . . ---------------- . . . . .
13. R ea d ily a s s u m e s r e s p o n s ib i l i t y . . . --------------
14 . I s a n h o n e s t e m p lo y e e _____________________
15. H a s t h e c r e a t iv e a b ility to s o lv e r.ew p r o b le m s ________________________
16. S e e k s t o Im p ro v e th e o p e r a t io n s o f th e
17. H a s g o o d w o rk in g r e la t io n s w ith o th e r s to r e p e r s o n n e l --------------------------------- ---------
18. Fully s u p p o r t s a n d c a r r ie s o u t th e c o ^ n p a n y p o l ic ie s . . . . . . . . . . . . . . . . . . . . . . . . . . . . . . . . . . . . . .
19. M a k e s v ig o ro u s a t t e m p t s to a c h ie v e th e o b je c t iv e s s e t fo r th e s t o r e ....................
20. M a k e s a n e f fo r t t o im p ro v e h is m a n a g e r ia l s k i l l s ...—
21. W o rk s lo n g h o u r s w h e n n e c e s s a r y ---------
B . ( P le a s e k e e p in m in d , w e a r e f o c u s in g o n ly c n f i s c a l 1981).C O N S ID E R IN G EVERY TH IN G , H O W SA T ISFIE D W E R E YOU W ITH T H IS M A N A G E R 'S:
a . A c h iev in g t h e t a r g e t s a l e s v o lu m e _____________. . . . . . ........ V ery S a t i s f i e d 1 2 3 4 5 6 7 V ery D is s a tis f ie d
b . C o n tro ll in g s to r e e x p e n s e s . — .........— . . . . . . .______. . . . . __. . . . . . . . . . . . V ery S a t i s f ie d 1 2 3 4 5 6 7 V ery D is s a tis f ie d
c . A c h ie v in g t h e t a r g e t g r o s s p r o f i t -------------------------------------------- V ery S a t i s f i e d 1 2 3 4 5 6 7 V ery D is s a tis f ie d
d . C o n tro ll in g in v e n to r ie s . . . . . . . . . . . . . . . . . . . . . . . . . . . . . . . . . . . . . . . . . . . . . . ___ V ery S a t i s f i e d 1 2 3 4 5 6 7 V ery D is s a tis f ie d
a . M a n a g e r ia l s k i l ls . . . . . L . . . . . . . . . . . . . . . . . . . . . — . . . . . . . . ___ V ery S a t i s f i e d 1 2 3 4 5 6 7 V e iy D is s a tis f ie d
f. T a k in g r e s p o n s ib i l i ty . . . . . . . . . . . . . . . . . . . . . . . . . . . . . . . . . . . . . . . . . . . . . . . . . . . . . . . . . . . . V e ty S a t i s f i e d 1 2 3 4 5 6 7 V ery D is s a t is f ie d
g . L evel o f m o t iv a t io n . . . . . . . . . . . . — ..— --------------- -— ...__ . . . . . ---------- V ery S a t i s f i e d 1 2 3 4 5 6 7 V ery D is s a t is f ie d
h . D e c is io n m a k in g a b i l i t y . . . . . . . . . . . . . . .— ...................... ........ V ery S a t is f ie d 1 2 3 4 5 6 7 V ery D is s a t is f ie d
I. K n o w le d g e o f t r a d e a r e a ...................— .— •— .............................................. V ery S a t i s f i e d 1 2 3 4 5 6 7 Ve ry D is s a tis f ie d
j. T o le r a n c e fo r p r e s s u r e . . . --------- — -------------------- . .. V ery S a t i s f i e d 1 2 3 4 5 6 7 V ery D is s a tis f ie d
k . R e la t io n s w ith s u p e r v i s o r s -----------. . . . . . . . . . . ---------------- . . . — . . . . . . V ery S a t i s f i e d 1 2 3 4 5 6 7 V ery D is s a tis f ie d
I. M a n a g e r ia l p o te n t i e l V ery S a t i s f i e d 1 2 3 4 5 6 7 V ery D is s a tis f ie d
ïfi. O v e ra ll p e r ro i 11 ï s n c i t . . . . . . . . . . . . . . . . . . . . . . . . . . . . . . . . . . . . . . . . . . . . . . . . . . . . . . . . . . . . . . . . . . V ery S a t i s f i e d 1 2 3 4 5 6 7 V ery D is s a t is f ie d

store Number: □ □ □
C . T h e fo llo w in g a re t h e f in a l s e t o f q u e s t i o n s . P le a s e p ro v id e u s w ith b a c k g r o u n d d a t a f o r th is s t o r e m a n a g e r .
1. W h a t is t h e a g e o f th i s s t o r e m a n a g e r ? y rs .
2. H ow iong was he or has he been a store manager a t t h i s N M A s i o r e ? D D D yrs.
3 . H a s h e b e e n a s t o r e m a n a g e r a t a n y o t h a r ^ g ^ S l o r e s ?
□ N o
□ Y e s . If Y es, fo r h o w lo n g ? y rs .
4 . H a s h e w o rk e d f o r M H f e o t h e r th a n Iw ln g a s to r e m m n sg e r?
□ NO
D Y e s . If y e s , fo r h o w lo n g ? y rs .
5 . H ow lo n g h a s h e w o rk e d in re ta ilin g M f h ^ j j ^ j ^ a s w e ll a s o th e r s in th e r e ta il in d u s try )? __________________________y rs .
6 . W h a t is t h e h ig h e s t lev e l o f e d u c a t io n h e h a s a t t a in e d ?
C h e c k O n e
a . 8 th G ra d e o r l e s s __________
b . S o m e H igh S c h o o l ...
c. H igh S c h o o l D ip lo m a______
d . S o m e C o l le g e ....__________
e . C o lle g e D e g re e ... .. .. .. .. .. .. .. ..
f . S o m e G ra d u a te S c h o o l . . . . . .
□□□□□□
g . G ra d u a te D e g re e ..-------------------------------------- D

3£MQj=tAg-IIC TA3JLATI5N FOR STORES» I'JCORPCRATEO
'.TATE:
’ARKET a r e a : Store No. 24 - 1.5 Mile Rinq
OR MATRON
1. Population trend data:# CHANGE
1970 427091930 41434
(Est.) 1932 4-1143 70 -82 -1551 -3 .66(ProJ.) 1937 40211 32 -37 -937 -2.28
Household trend data:a CHANGE
1973 120431930 12952
(Est.) 1932 12355 70 -82 807 6.70(Proj.) 1937 12572 32 -87 -233 -2.20
Inc ome trend data :AVERAGE HOJ3EHOL3 PER CAPITA AV3 HH__ I'JCOMr____ % CHANGE
1969 * 7750 * 2194(Est.) 1932 % 221&5 *10535 135.99
Inc one distribution trend data:— 1959---- ----- 1982----
üiJüSO____ % ____Less than $ 7»533 5611 54.9 3508 27.3$ 7»500 to S14»999 4209 34.9 3193 24.8*15,900 to {24,993 1032 8.6 2436 18.9*25,000 to *34,999 108 0.9 1363 10.6*35,390 to *49,999 57 0.5 1268 9.9*50,030 and over 31 0.3 1037 8.5
Median Inc one * 6834 * 14357
Numoer and percent of persons by
Total White 3lac k American Aslan and Other
Indian» Eskino and Aleut Pacific Is lander
Soanish Ori;in
1:
41434 100.0032348 76.071603 3.88
56 0.1395 0.23
7327 17.63
23146 67.93

'ARKET a r e a : store No. 24 - 1 . 3 Mils Rinj
6. Numoer end oercsnt of osrsons by so* and sex:
Page 2
ï£ a rs I2 I1 L m i l ' l l MAJLS f e m a l e PERCENTTotal 41434 100.00 19702 47.55 21732 “ 52.450- 4 3933 9.63 2009 4.35 1979 4.785 9 3989 9.63 2061 4.97 1928 4.65
10-14 3542 8.55 1770 4.27 1771 4.2815-17 2567 6.19 1317 3.13 124 9 3.0218-24 5414 13.07 2577 6.22 2837 6.8525-34 6455 15.33 3196 7.71 3259 7.3735-44 3327 9.24 1805 4.36 2022 4.8845-54 3676 8.87 1624 3.92 2053 4.9555-64 3674 a . 37 1679 4.05 1995 4.8165* 4302 10.38 1663 4.01 2639 6.37Median Age: 26.7 25.3 23.1
Numoer and oercent of persons oy hojseholo status:
Persons In households: Persons In grouo quarters:
41013421
Eiaiilll93.981.02
Numoer and oercent of persons 15 years old and over by sex and marital status:
m a r i t a l STATUSTotalSingleMarried (not seo. Separated Ui do wed Divorced
TOTAL29915
17393
23832123
I L l l U l100.3024.2553.142.537.937.10
MAL:1386138498639249356719
EIEilüI 46.34 12. 37 29.05 0.33 1.19 2.40
1605434068704
203014 0 5
£î££îill53.6611.3329.101.70 6.794.70
Numoer and percent of households oy household tyoe:
H0Uiiii2L2sai-I2E^Total nousenolds
One-person households Ma le Fe-na le
Two* person households Total Families
Married couole families Other tyoe families
Non-family households
Average numoer of persons oer household:
Average numoer of persons oer family:
NUMBER” l2952
2399902
1597105531023381892044321
PERCENT100.0013.52
12.3381.4879.0163.2215.782.48
3.17
3.70
Numoer and oercent of housing units by occupancy status* py race, and oy Spanish origin of householder:
HOUjtNS UNITS TOTAL 4ERC[NT SLACK PERCENT SPAN._OR. PERCENTTotal year-round Î3394 "ÎÔÔTÔÔTotal occupied 12432 96.70 566 4.22 7334 55.13Owner occupied 8362 62.43 333 2.63 4651 34.72Renter occupied 4390 34.27 213 1.59 2733 23.40Vacant units 442 3.30

•!A!«<ET A«C4: Stire No. 24 - 1.5 Ml le Ri-19 page 3
13. Munoer and percent 9 * year-round units oy units at address and rooms in unit:
uNiii-ii-iia £111 Unit 2-9 Jnits 10* Units iobiLe home or trailer
liil ££1111111419 33.251503 11.24435 3. 2534 0.26
imi-il-Ulil NUM3E9 ££11111 1 Room 13 3 “ 1.572-3 Rooms 1848 13.504-5 Rooms 7072 52.306* Rooms 4290 32.03
14. Numoer and oercent of soecified o..'ner-occuoied non-condominium housing units oy value:
H 0 U S Î N 5 VALUE PERCENTUnder *20,000 17Ô4 22.73
*20,030- *39,999 4304 57.41*43,000- *49,999 Bi3 11.12*50,000- *79,999 549 7.32*83,030- *99,999 36 0.48
*103,333-*149,999 36 0.43$153,300-*199«993 16 0.21*203,000 ♦ 18 0.24Median value * 2 8651
Number and percent pf soecified renter rent :
occupied housing units by cent ract
CONTRACT R E N T N U M B E R PERCENTUnder"*!30 9Î3 21.36S100-S149 823 19.71*153-5199 1068 25.57*200-5249 688 16.47*250-5299 381 9.12*303-5399 260 6.22*400-5499 39 0.94*503 ♦ 5 0.11Median rent * 163
Numoer and oercent of condominium housinq unjts oy occuoancy status (with average value provided for soecified owner-occuoied units):
C0M30MINI1JM UNITS TotalOwner occuoied Renter occuoied Vacant
NUMBER PERCENT1Ô0.0Ô11.6983.31
0 . 0 0
feVEPAGE VALUE
*101571