Thesis-1967D-F532i.pdf - ShareOK
137
I. THE ISOLATION AND CHARACTERIZATION OF A SOLUBLE WHEAT FLOUR PROTEIN II. PROTEIN CHANGES IN.THE WHEAT KERNEL DURING.MATURATION By WAYNE WILLIAM FISH " Bachelor of Science Oklahoma State University . Stillwater, Oklahoma 1963 .Submitted to the faculty of the Graduate College of the Oklahoma State University . in parttal fulfillment of the requirements for the degree .of DOCTOR OF PHILOSOPHY July, 1967
-
Upload
khangminh22 -
Category
Documents
-
view
0 -
download
0
Transcript of Thesis-1967D-F532i.pdf - ShareOK

I. THE ISOLATION AND CHARACTERIZATION OF A
SOLUBLE WHEAT FLOUR PROTEIN II. PROTEIN
CHANGES IN.THE WHEAT KERNEL
DURING.MATURATION
By
WAYNE WILLIAM FISH "
Bachelor of Science
Oklahoma State University
. Stillwater, Oklahoma
1963
.Submitted to the faculty of the Graduate College of the Oklahoma State University
. in parttal fulfillment of the requirements for the degree .of
DOCTOR OF PHILOSOPHY July, 1967

O•,lAHOi',1,: ST/ITE Ur\!iVER;,lfV LIBRARY
JAN 10 1968
I. THE ISOLATION AND CHARACTERIZATION OF .A t Q.k.i:<1.:::~~: • . ..-.;·.<r.'~7':"'"'":<~, •·:1.~!"'-V•·:·:i'';.•.,,,I .. 'c,,,~,//,).'". ·• ;.,.,., ~:l'i:,.,<;-_-,,,;;:i/
SOLUBLE WHEAT FLOUR PROTEIN II. · PROTEIN
.CHANGES IN THE WHEAT KERNEL
DURING MATURATION
Thesis Approved~
Dean f the Graduate College
558736
ii

ACKNOWLEDGMENTS
The author gratefully acknowledges the guidance and.advice by his
major professor, Dr. Donald C. Abbott, during the course of this investi
gation.and the preparation of the thesis.
Thanks are due to Dr. K. E. Ebner and Dr. G. Gorin for their stimu
lating discussions on protein studies. The suggestions and encourage
ments of Ors. R. E. Koeppe~ D. R. Wilken~ E. J. Eisenbraun, and G. V.
Odell are sincerely appreciated.
The.author would. like to thank Mrs. Julia Watson for her technical
help in the protein isolation studies and Miss Deretha Rainey for her
assistance in the studies on developing wheat endosperm.
A very special thanks are due his wife, Sue, for her understanding
and encouragement during these years of graduate studies.
Finally, he wtshes to.acknowledge the support of a National Defense
Education Fellowship and the Oklahoma State University Biochemistry De
partment for facilities and financial support during these investiga=
·tions.
iii

TABLE OF CONTENTS
Chapter
I. INTRODUCTION
II. LITERATURE REVIEW ••
The Soluble Proteins of Wheat Flour • Protein Changes During Kernel Maturation ••
III. THE ISOLATION AND CHARACTERIZATION OF A WATER SOLUBLE WHEAT
Page
1
4
4 16
FLOUR PROTEIN . • • • • • • • • • • • • • • • • • • • • 26
Experimental Procedure •• Flour •• ••• •• Ion Exchange Chromatography. Gel Filtration Experiments • • ••••••• Analysis of Flour Extracts and Fractions From the
CMC and Sephadex Columns •••••••••••• Electrophores i s Apparatus and Procedures • Photography of Starch Gels ••••••• Amino Acid Analysis ••••••••••• Reduction and Alkylation of Di sulfide Bonds . Carboxy- and Amino- terminal Amino Acid
Determinations • ••••• •••• • Results and Discussion •••• • ••••••
Preliminary CMC Chromatography Studies • Preparat ive CMC Column . Chromatography •• Fractionation by Gel Filtration of Protein Eluted
From CMC by 0.28 M NaCl • •• •••• Test of Purity of the Isblated Protein by
Electrophoresis. • • • • • ••• Absorption Spectra • • • • • • • • • ••• Physical Studies Employing Gel Filtration •• Analytical Ultracentrifuge Analysis ••• Amino Acid Aqalysis. • • • • ••• Spectrophotometric Determination of Free Sulfhydryl
Groups • • • • • • • • • . • . . • • • • • N- terminal Amino Acid Determination ••• C-terminal Amino Acid Determination ••• Reduction and Alkylation of Disulfide Bonds. General Discussion and Conclusions ••
26 26 26 27
28 29 30 30 31
31 33 33 48
51
58 63 64 69 72
81 82 84 85 88
IV. THE MOLECULAR WEIGHT DISTRIBUTION OF LACTIC ACID EXTRACTABLE PROTEINS FROM MATURING WHEAT. • • • • • • • • • • • • • • 91
iv

TABLE OF CONTENTS (CONTINUED)
Chapter
Experimental Procedure •••••• ~ •••••••••• Endosperm Samples. • • • • • • • Gel Filtration Columns • • ••••••• Isolation of the Free Amino Acids ••••••
Results and Discussion •••• (I O O Q t)
SUMMARY •••
REFERENCES ••
Protein Extraction •••••••• Gel Filtration Studies •••••• Starch Gel Electrophoresis Analysis. Fluctuation in the Free Amino Acids of
• • 0
the Maturing Endosperm. oQoOobagOQO
Conclusions. • • • •• •oOOQO(IQQ•Oo
V
Page
91 91 92 92 93 93 97
108
118 120
123
125

LIST OF TABLES
Table
I. Amino Acid Recoveries After Acid Hydrolysis. . . . · II. Amino Acid Composition of the Isolated Wheat Flour
Protein. o o o o o o o o o o o o o· o o o o
HL Amino Acid Composition of 11 Soluble 11 FractioQ.s and Gaxmna Gliadin:From Wheat Flour ••••••••••••••
IV. Extraction of Flour Proteins by Various Solvents.
V. Extraction of Protein From Kaw and Triumph Endosperm.
VI. · Changes in the Free Amino Acid Composition During Endosperm. Development. • • •••••••••••
vi
Page
77
78
. . . 80
94
96
119

LIST OF FIGURES
Figure Page
1. CMC Column Chromatography of the Water Solubles Fraction From a Sephadex G .. 100 Column •••••••.• , • • • • • • • • 35
2. Starch Gel Electt;"ophoresis of Fractions From CMC Chromatography of a Sephadex G .. lOQ Fraction • • • • • • • • • • • • 37
3. CMC Column Chromatography of a Water Extract of Flour. 40
4. Starch Gel Electl;:'ophoresis of Fractions From CMC Chromatography of a Water Extract of flour, • • • • • • • • • • • • • 42
5. CMC Column Chromatography of a Water Extract of flour Eluted by a Discontinuous Gradient •• , •••••••••••• , • 45
6. ·Starch Gel Electrophoresis of Fractions From a Step-wise Elution of Water Soluble Flour Proteins From CMC •••
7. Preparative CMC Column Chromatography of a Water Extract of Flour. . , . • . ~ , • . • . . • , . , , . , . . . .
8. Starch Gel Electrophoresis of Fractions From a Prepc;trative CMC Column • • . • • .• • • , • • • • • • • . • , • • • • •
9, Gel Filtration on Sephadex G-75 of the P;t"otein Eluted From CMC by O. 28 M NaCl • • • • • , • , • • • • • • • • •
10. ·. Starcl:i Gel ;ll:lectrophoresis of the Fractions From a Sephadex
47
50
. . . 53
. . 55
G .. 7 5 Column. • • • • • • • • • • • • • • • • • • • • 5 7
· 11. Chromatography and Rechromatography of the Isolc;tted Protein on Sephadex G-75 • , ~ • • • • • • • • • • • • • 60
· 12. Electrophores~s of the Isolated Protein in Starch Gel and Polyacrylamide Gel at Various pH's. • • • • • • • • • • • • 62
13. Ultraviolet Ab~orption Spectra of the Isolated Soluble Whe~t Flour PJ;".ot ein •. • • • • • • • • • • • • • • • • • • • • • 66
14. Molecular Weight Estimation of tl:ie Isolated Protein by the Gel Filtration Technique. • • • • • • • • • • • • • • • 68
. 15.· . Estimation of ·the Diffusion Coefficient of the Isolated Protein by the Gel Fil~ration Technique ••• , •• , • • • • • • • • 71
vi.i

LIST OF FIGURES (CONTINUED)
Figure
16 . Schlieren Pattern of the Isolated Protein ••••••••
17. Effect of Concentration on the Sedimentation. Coefficient (s20 ~w) of the Isolated Protein ••••••••
18. Gel Filtration and Starch Gel Electrophoresis of the I solated Protein Aftei Reduction ,and Alkylation of the Disulfide Bonds. 0 . . . . . 0 . 0 . 0 . . . . . . . . . . .
19. Gel Filtration on Sephadex G-200 of Kaw Endosperm Proteins
20. Gel Filtration on Sephadex G-200 of Triumph Endosperm · Proteins . . . . . . . . ' . . . . . . . .
21. Molecular Weight Distribution of the Kaw Endosperm Proteins at Various Stages of Kernel Development . . . . 0
22. Molecular Weight Distribution of the Triumph Endosperm Proteins
Page
74
76
87
99
101
104
at Various Stages of Kernel Development ••••••••••• 106
23. Distribution of Carbohydrates and Ninhydrin Positive Material in Kaw Endosperm During Maturation ••••••••••••• 110
24. Starch Gel Electrophoresis of Fractions From Filtration of Kaw Samples •••••••••
25. Starch Gel Electrophoresis of Fractions From Filtration of Triumph Samples •••••••
26 . Starch Gel Electrophoresis of Crude Extracts Endosperm During Maturation ••••••••
viii
G-200 Gel
G-200 Gel
of Kaw and 0 . . . .
. . . . 112
. . . . 114
Triumph . . . . 117

CHAPTER I
INTRODUCTION
The importance of wheat as a leading world staple has focused much
attention on the role of flour proteins in the production of baked goods.
Experience has shown that the dough properties and the quality of the
loaf of bread made from a hard wheat flour are directly related to the
quant ity and quality of the proteins of that flour.
The earliest comprehensive investigation of wheat proteins was that
done by Osborne (1) who employed various solvents to separate the pro
teins of wheat into five main fractions. With the impetus given by this
classic study, many investigators have devoted their attention to the
separation, constitution, structure, and rheological properties of the
wheat proteins.
The endosperm of hard wheat flour commonly used for breadmaking
contains a mixture of proteins ranging from 10 percent to 15 percent
total protein, These flour proteins are complex and diverse in constia
tution and biological function. Gluten, the water-insoluble major frac
tion of flour proteins, is a mixture constituting about 80 percent of
the total proteins. It is classically divided into two groups of pro
teins. The gliadins are prolamines which are soluble in alcohol; the
glutenins are glutelins which are soluble in dilute acid and alkali and
insoluble in alcohol. The elastic, cohesive properties of gluten en
ables it to . provide a structure that holds the carbon dioxide generated
1

dur i ng fermentation .
The water soluble albumins and the salt soluble globulins are of
interest for two principle reasons. The first is concerned with their
enzymatic activity . For example, beta~amylase appears to be an albumi n
(2, 3) j while one of the proteinases of flour may be a globulin (4) .
Other proteins in these groups ~ay also prove to be enzymes which func
t ion to modify flour · baking properties. The second reason for interest
in the soluble proteins involves their functional properties i n the
baki ng process. It has been shown (5) that the albumins and globul ins
are required for maximum baking performance of all fl.ours except durum
. wheat f l our.
2
Analyses of the different classes of wheat proteins have produced
some conflicting results i n the literature. This may be attributed t o
a lack of adequate means for the separation of individual components
resulting in het~rogeneous protein preparations. Meaningful evaluation
and comrarison of physical and chemical properties of flours at the
mo l ecu lar level will be possible only when su i table separation and pur i
fication of the indi vidual protei~s are achieved.
A number of factors contribute to the baking quality of the mature
wheat flours. Among these are weather conditions during the growth of
the plant , genetic differences, soil conditions, and certain types of
damage. Therefore, another .approach to the understanding of basic dif
ferences among flours is the study of changes occurring . in the proteins
of the Il:18tu.ring ··wheat grain.
Th is i nvestigation was undertaken to study wheat flour proteins by
t wo approaches : first, . by isolating and characteri zing one of the water
extractable wheat proteins from a mature flour; and second, by surveyi ng

.the changes in the distribution of proteins according to.their molecu
. lar weight during maturation of the wheat kernel.
3

CHAPTER .II
LITERATURE REVIEW
The Soluble Proteins of Wheat Flour
Much of the early work on wheat proteins was carried out on the
gluten proteins because of their apparent role in baking. In the last
ten years, however, there has been an increase in the amount of work
devoted to . the study of the soluble proteins of wheat flour. This is
due to . two principal factors. First, it was demonstrated that the al
bumins and globulins were required for the maximum baking performance
of a flour (5). Second, the solubility of these proteins in water or
dilute salt soLutions made them easier to work with than the gluten
proteins.
Early work demonstrated that the albumins and globulins are highly
heterogeneous. Laws and France (6) were .among the first to note this
heterogeneity; when they demoffstrated, by moving boundary electrophoresis,
three protein components in the water solubles. At about the same time,
Danielsson (.7), in 1949, noted a molecu~ar weight heterogeneity, of gl.ob
ulins in · wheat . f101,1r. {!sing the analytical. ultracentrifuge, he observed
two components of widely different molecular weights; one of 210,000 and
one of 29,000.
Their work. in. the early 1950 1 s on the effects of tbe soluble pro
tein fractions on baking behavior, encouraged Pence and Elder (8) to
. further purify. the albumins and globulins. The albumins were extracted
4

5
from flour with a dilute neutral phosphate buffer. · Precipitation of t he
albumins between . 0.4 Mand 1.74 M ammonium sulfate removed gliadins and
pentosans present as contaminants. Globulins were extracted from flour
with one M sodium chloride and were purified by fractional precipitation
with ammo~ium. sulfate. D~alysis against distilled water precipitated
the globulins, thus separating them from the albumins. Certain physi~al
and chemical properties of these two purified fractions w~re determined
by electrophoretic, ultracentrifugal, osmotic pressure, and chemical
analyses. Moving . boundry electrophoresis of the purified albumin prep
aration in a sodium cacodylate buffer, pH 6.0, showed it to be highly
heterogeneous. Electrophoresis on filter paper in the same buffer sys
tem demonstrated the presence of at least six .components • . Analytical
ultracentrifuge analysis indi~ated t4at these albumin components were
of nearly the same moLecular weight. With the globulin preparation,
sedimentation patterns showed marked heterogeneity, and three components
were observed.
Pence (9) further resolved the albumin fraction (prepared by the
method described above) by paper electrophoresis and determined the ap
proxilllate isoelectric points for eleven discernible components. He
grouped these -eleven components into three groups on the basis of their
isoelectric points. The isoelectric points ranged from pH 4.5 to 4.8
for the four alpha group components, pH 4.9 to 5~9 for the four beta
_group . components, and pH 6. 7 to 8. 7. f.or the three gamma group component s .
The relative amounts .of .the eleven .components were estimated visually
on the basis of staining intensity with .a protein stain. The major
components were found in .the beta group, while most of the minor com
ponents occurred in .the gamma group. The components of the alpha group

6
- behaved most nearly aLike in t:heil;' J:"elative migration at various pH 1 s;
whereas, the gamma group.components exhibited the most diverse range of
migration rates.
Perhaps the greatest st:i.muh.1s to wheat protein research was the
application of starch gel and polyacrylamide gel electrophoresis to
wheat proteins. At present, these are the most widely used techniques
for the analysis of protein extracts and the evaluation of the purity
of fractions isolated by other procedures. Their sensitivity to charge
and molec-ular size difference was first used to demonstrate the hetero
geneity of flour proteins fractionated by solubility differences.
· Woychik il !.!.• (10) were the first t.o employ the starch gel techn;i.que
of Smithies (U) for this purpose. Woychik' s group used an aluminum
lactate buffer, pH 3.1, Jl:;:: 0.05, containing three M urea.· Nine
electrophoretic components were observed in a water soluble fraction
isolated from gluten. Elton and _Ewart (12)- later applied starch gel
electrophoresis to purified albumins and globulins from flour. The
albumin fraction, prepared by ammonium sulfc1,te fractionation, included
eight components, while the g1obulin fraction, prepared by ammonium
sulfate fractionation'_and dialysis, contained three components.
Kaminski (13}1 employing starch gel electrophoresis, showed the pres
ence of 22 components in a distilled ~ater extract and 23 in a salt
extract of wheat flour. This is almost three times as many components
as Kelley and Koenig (l4) observed when they examined the composition
of extracts of soft -wheat flour by the use of moving boundary electro
phoresis. They had reported a minimum of nine components in a 0.1 M
sodium chloride extract of wheat flour. Graham (15), using vertical
starch gel electrophoresis on.flour extracts obtained with a variety

7
of solvents, demonstrated that simi~ar protein .components occurred in
the y.arious extracts. There were, however, marked- differences in the
proportions of the, components found in the various solvents. Electro
phoresis in .agar gel, together with immunoelectrophoretic analysis,. was
used by Grabar and coworkers (16) in their study of water- and salt
soluble pr.oteins from wheat_ and barley. Immunoelectrophoretic , analysis
revealed eight to ten protein components in ,wheat _and 17 . to 22 in
barley. Of these, several were of similar mobilities but of distinct
antigenic specificity·. Gehrke, Oh, and Freeark (17) reported nine com
ponents in .an albumin prepara.tion obtained by repeated ammonium sulfate
fractionation. They .also observed seven to. ten . components in ,a globulin
preparation. Four components in varying amounts were common to the al-
· bumin, globulin, and gliadin fractions. These components were termed
11 base11 proteins.
Elton .and Ewart (18) have recently reported that s~arch gel elec
trophoresis of water extraGts of flour .and bran from the same wheat
demonstrates that bran is rich in proteins of mobilities corresponding
to. albumins.
The application of &.tarch gel electrophoresis as a preparatory
. procedure for -wheat proteins was first reported by Elton _and Ewart (19) •
. A vertical apparatus was designed with a horizontal slot across the gel,
and an arrangement was included for periodic flushing of the slot with
buffer in order to elute protein: bands as they, reached the slot during
. electrophoresis. tfsing _this procedure on .a water soluble protein frac
tion of flour they obtained two successive fractions, each of which con
tained the same single component. Twoother- fractions contained only
two components. The fr.actions obtained in this 11).anner were identified

with corresponding components resolved by e l ectrophores is of the ori~-
inal mixture in a separate experi~ent. A total of 17 . components were
present in the original extract. The recovery of isolated fractions
from the preparatory apparatus was about 0.2 to 0.5 mg per fraction.
The. advent of cellulose cation .and anion exchange chromatography
.and gel Ultration chromatography in the early, 1960's provided a stimu-
lus for renewed efforts to is.olate individual, "soluble" proteins, as
well as the gluten components.
Coates and Simmonds (20) descr,ibed the cellul9se anion exchange
chromatography of O .01 M sodium pyrophosphate (pH 7) extr-acts of two
different flours on DEAE-cellulose. 1 The separation was effected using
a six mM glycil)e buffer, pH 9.5, at the beginning of the elution, fol-
· 1.owed by .a slow linear gradient of increasing . ionic strength to 0.3 M
sodium chloride. Material remaining on the -column was elµted in two
successive fractions by the use of 0.05 M acetic . acid followed by 0.1 N
sodium hydroxide. Six major fr~ctions were obtained by this procedure.
Three of the fractions eluted from the column in the salt gradient were
desigµated as peaks D, E, and F and were rechromatogr.aphedon DEAE-
cellulose to yield single symmetrical peaks. · When effluent. fractions
combined from .the individual peaks were examined by moving boundry
8
electrophoresis, a total of six components were detected. Simmonds (Ql)
later refined this procedure to yield eight subfractions. Three of
these fractions were recbromatogr.aphed on DEAE-cellulose to yield sym-
metrical elution patterns. These refined fr.actions gave symmetri~al
moving boundry electrophoretic patterns showing only small amounts of
·1Abbreviations are in accordance with the IUPAC-IUB Combined Commission on Biochemical Nomenclature, .!!_. Biol. Chem., . 241, 527 (1966).

10
. mM phospl'!,ate buffer, pH 7 .O. The proteins remaining on the .CMC .column
were eluted w:l.th _a gradient of increasing. ionic strength. - Those, applied
. to the DEAE. column __ . were eluted in the same manner. Analysis of the
fractions from. the .CMC. column. for .acid .p.hosp~atase activity showed .it
to, be conce1;1tr.ated. in. one peak :while beta amylase_.activity,e:was found in
.one of the peaks from the·DEAE column. ~arbohydrate_a11atysis on·the
· DEAE_.fractions suggested the presence of a glycoprotein, in one of the
pealcs. Six varieties of vulgare.wheat and two yarieties of durum.wheat
. were studied. by. these techniques. , The vulgare wheat protein elution
. patter-q.s were cq.a:i;acter;i.zed. by ,a lllarked interyarietal similarity. On
the other lland, one buffer .. solu.ble protein-which-was promine:i:i.t in
lvulgare wheat .. :was not found in.durum wheats.
,Jones ~,&• (25) were the first to investi&ate the applicability
of gel filtration to. the se;i:,aration, of wheat. proteins in gluten, par~
ticu,larly_,glutenin and gliadin •. Sepliadex ~-75, ~aving a nominal molec-
· ular ·weight exclusion limit of f;i.fty. tho4san9, gave only partial refine-
ment of the cnide preparation. _A fraction.corresponding :to the water
soluble protei~s was the iast to elute from.the column.
Abbott and J.ohq.s·on (26) investigated the l,lsefulness of gel filtra-
·tion,as a means of separating the protein components i.n the water ex-
·tr.acts of. flour and found the most effective combination to be S~plladex
G ... 100. with'. 0.5 N. tactic acid as the el~ant. Starch gel electrophoresis
showed that this system permitted a simplific::ation .of the pr.otein. mix-
ture.and a concentr.ation.of some compone.nts inrelatively.small frac-- . .. '
tions of the el4ate fronLgel columµs, Gluteni~s and gliadins present
·.1n_the l!fater extract were found in.the fraction~ from the f.irst peak.
· The secol\ld peak .. con;ained the compone9t;s ge~e;rally,.assoc!ated with tl;i.e

water solubles.
Fei.llet and Bourdet (27) studied the be~avior of flour.albumins on
:Sep_hadex. The. albumins examined were prepared. by .,ammonium. sulfate Jrac-
t.ionat.ion,of a water extract of flour, Gel filq:ation of these albumins
on Sephadex G-75, G-.100, .and G-.150 gave essentially_ the same results for
,.all -three gel types. Four fr.actions were obtained, each of which rep-
resented only .,a par.t,ial. refinement of the origi"O,al prepa:i;-ation.
~ankiewicz .and ;Pomeranz (28) ;f:i::act.ionated several. different. types
of extracts on.a Sepl:l,adex 9-100.co.lumn whichl::tad been.calibrated. by
measuring.:the elution volumes of several proteins of- known molecu,lar
weight. A-five mM acetate buffer, pH.4.1, was used as elµant. One
fr.action obtained from a .01 M pyrophosphate buffer (pH 7) extract of
.flour rechromatog;aphed as a single peak. The components in . .this frac-
tion,had an ,average molecu_lar wei_ght of -1.8,000 and migrated rapidly
to~ard the. anode at low pll. during electro,phoresis in. polyacrylamide gel. , '
From .the e;v;i.dence reported thus fa:r, it wouldappear.·that the tso-
· lation.of individ~al prote;i.~s in quantities ~arge enough to.permit
chemical,and physical cha:i;-acterizat:i,.on.must come about.by.the combi~a
tion of two or·more techniques. To.~ate, there has beenonly one re-
· ported .iso~ation of a 11 so.1,uble11 wheat .£four protein, other than beta-
.amylase,· in su.fficient q~antity and purity to permit further studies on
it. Thts ~as accomplished in 1964 by Kelley (,29) who, isolated :a salt-
soluble prot·ein, from _a soft. -wheat flour· by. u.sing, a combin,at.ion of
salting out with .potassium. phosphate. and c~romatog3:-aphy on DEAE-cellu-
l9se. The·. iso~ated protein. was 96 percent pure,.as jud&ed by;moving
;bou:qdry. electrophoresis.
- Since only .a few individ1;1al proteins have· been :i:,so~ated, nea-rly

12
. all. reported physicochemical properties of soluble flour proteins per-
tain, to. the globulin or .albumin.classes of proteiI).s rather t4an pure
componer,.ts. The early work in· the area of physical. and chemical inves-
tigation was that of Pence and Elder (8). Ultracentrifugal a;nalysis .of
their isolated.albumins indicated.ti?-at .these albumin components were of
nearly the same· molecular s:i,ze. The single peak ;i.n O .1 M .. sodiµm cl:tlor-
ide had an s20 w value of2.54. · Osmot.icpressure·measurements showed . '
the number average molecular weight of these albumi,ns to be 28,000. in a
dil4te salt solution. · !t?,.\a dissoctl;lting :medium. such:as 15 percent
sodi'µm :sa.Ucy+ate .or ten ~. urea, the. molecular weight dropped to 17,000.
The.albumins were chemically,.characterized by ,a higher tryptophan con-
tent and a lower.amide nitrogen content thanthe other classes of wheat
proteit'ls. The globu.li~s were heterogeneous with,respect to molecu~ar
weight. U.Ltracentrifugal. ap.alysts showed that. a garmna-globulin (s20 -= .. . ,w
7-•. 65) was present. in, the highest concentration, followed by ,an a~pha-
globulin, .(s20. w = 2.n) ': and a small. amount of a delta-globulin, (s 20 w·= ,., ' . '
10.64). - Chemically, the globulins were -CQaracterized by low tr,yptopq.an . , .. '
,and amide ... nitrogen .cor:itents and by,,a high .,a;rginine content. Globulin
prepa;atio11s containing :widely, different ratios of c.omponents were not
significantly. .different in ,amide and tryptophan .contents. llowever,
prepafat;i.oi:?,s c.on~a-ining la:rger perc.ent:ages of alpba globulin ~ad .sig-
· nifi,c:antly lower arginine content:~ t~an preparations containing less
aLph.a globulin. - lt- :j,s _pc;,ssible· t.hat the.alp't!,a globulin f;.action,W'as
act~ally,an ,albumin, since its lower.arginine conten~.and its s20 ,w,.=
2,.22 agree rather well with the chemical, and physic:al properties 01;>-
. served .for .the. albumins.
l:fol@e (30),.puri.fied the water so,luble proteills from. cake flour .and

13
demonstrated five components in the albumin fraction by moving boundry
. electrophoresis. Sedimentation runs in .a synthetic boundary cell indi ..
cated a marked heterogeneity in the dbumin fraction. Although this
observation disagrees with that of Pence and Elder, the s20 ,w value cal
culated for the broad albumin peak was 2.1 and compares favorably with
earlier values.
Coates and Simmonds (20) further studied .two fractions obtained by
chromatography of a dilute salt e:letract of flour on, .DEAE-cellulose.
Ultracentrifugal analysis showed the presence in·both fractions of two
components having sedimentation coefficients of approximately 58 and
28. The 28 component compjires favora-bly in size,to the albumin fraction
of Pence and Elder (8) or to that reported by .Holme (30). The heavier
component appears to correspond to Pence and Elder•s gamma globulin (8).
Atnino.acid analysis of the two fractions showed that they contained a
lower amide and glutamic acid content than the gluten proteins and also
,a higher content <>f arginine, .aspartic acid, glycine, leuci,ne, and tyro
sine. TJ;iese results aha agree with those reported by Pence and Elder
(8).
· ~Y- chromatographing a crude extract containing essentially .all of
the flour proteins on .a Sephadex-G-200 column equilibrated with a dis
sociating soivent, ~eredith and Wren (31) effected a separation of the
proteins into three molecular weight groups. The elution volume of the
. smallest molecular weight group was the same as that of an albumin frac
tion prepared by "conventional"_ means. The dissociating medium employed
consisted of three M1,1rea and .Ol M cetyltrimethylammonium bromide (a
cationic detergent}':irt O .1 M acetic acid. The column was calibrated
with. 15 proteins of known molecular ·.weight. so that the molecular weight

14
of each protein peak.could be esti~ted. The molecular ·weight of t.he
albumin :fraction. :l:las 16,000_ as esti~ted by this method. This ~alue is
in close agreement with. the molecular weight observed for .·the albumi11-s
by Pence _and Elder (8) ,.when they employed. dissoc~ating .. solvents for
m0Lec:t,1lar·weight determination.
The soluble.flour protein.prepared by Kelley, (29) was partially
; char.acter:f.zed physically ,and chemically. ';Fhe sedimentation :coefficient
at in;fit1ite dilu_tion, for th~s prot-ein :Was 5-.95 s, while the weight
averagemolecular·weight was approxim~tely:75,000. Calculated mobili
·ties-of the protein.·in·.buffers of different pH's yielded an isoelectric
poi~t. of..~. 2. The amin,.o acid comp.osition.·of. Kelley• s globulin. differed
from.tbat of the·water solubles and whole gluten:as reported by Woychik
il. !l• (U). The arginine content '<fas higher and the ammonia ( indica-
ting amide-nitrogen) was considerably\ lower than· those of the. water
solubles and whole gluten, This agrees with .. the results obt:ained by
. Pence and Elder (,8) on the crude globuliqs. The isoelectric point of
. the protein:at pH_6.2 is comparable to.the value of 5.7. reported by
Queqsel (33). for gamiiJ,a globulin of ~arley. · The.sedimentation coef ..
ficient of 7-.65: S reported by Pep,ce and Elder (8) for gaIIIII!,a .slobuli:qs
of wheat, however,. is somewhat hi.gher than.the 5.·958 of Kelley's pro-
tein.
The chemical nature of the soluble pi;-otein ·fractioi;i.s of flour ,and
.of a few purified preP,aratiot?,s bas been.concerned princiP,ally.with
amino a~id .com.,osj.t ion. One of: the earlier .:amino; acid_: analyses on
. wheat flour proteiI_ls was t~at of Woych.:ik and cp .. worke:r-s (32). Their
results q.ave· been:us.ed as.a l)as:i,s tor comparison.in.subsequent work by
J)lany., inV!=S.tigato:r,s •. Soluble pi-otein,_preparatiqt:1,s isolated to date

15
exhibit only slight differenc~s in their _.amino, acid compositions. These
preparations.have· been obtain~d by, such diverse methods as gel filtra-
. tion, cellulose ion-exchange chromatog;aphy, and. ammonium. sulfate frac
tionat.ioll, The over"'.all, amino_,acid content of ·these soluble prepa,;:.a
tions is in-. get}.~ral agreement with. the y.alues obtained for wheat .albu
mins. a.nd globuli:qs by Pe:qce and Elder (8), and for the "'°ater -solubles by
<Woychtk ·.!'E. !!., (32). · On. the other band, there ;Ls a marked .difference
.between the. amino, acid composition of .the so1ubl_e proteins and the amino
acid composit.;i.on. of the gliadi11s and glutenins.
Stevet:1:s. and co .. workers (34) examined the over~all, amino. acid com
p<;>sition .of ehe proteins in, the .aleu-rone cel~s. a.nd. found a marked
similarity;to the composition, of the. so,luble fractiori.s .of f.lour •. A
high,arg:Ln:f.ne conte"-t, which.is a d.htinctive feature.of the soluble
c.omponents,. was also noted in,the.aleurone prote;L;s.
ln,addition,to,amino.acid composition, a fewresults have been
reportedon,the end _gl;'oup_analrsts of tbe protein,components of flour.
l,Jsing l-f.luoro-2,4-dinitrobenzene, Rohr,lich .and SchlU,ssler (35) p.er
formed N•terminal. amino 1 acici analyses on _all four protein., solubility
.. classes. and found glu~amic a.cic;l, glycine, alanine, valine,. leucine, and
hhtidine to be prese11t. These, together with,serine, threonine, and
.. aspartic .acid qave been s_hown :.to be present in .gluten ,and gliadin
_-prepar.atiO!).S of yarying. degrees of _purity, by numerQus investigators
(36). Simmond$ (21) fou11,d serine.as the onlyN-terminal:amino,acid.in
· two .fr.actio~s he o~~ained by,..DEAE. column cq.romatography, of a pyroph9s ..
phate extract .. of flour. No, data have been ,repCi>rted for the G-terminal
. amino_,acids of the soluble protei~s. The mE;!aningful determination-.of
end groups. and.:_amino .. acid_ sequences must a~ait. the· pre)?a:i:ation of more

. homogeneous protei~s.
Before the co.ntribution: made by the soluble :(.Theat flour prote-ip.s
can: be clearly,, associated. with; spec.ific: biologi~al functions :i.n. the
kernel or.with:the qaking,perforillance of ·flours, each.of these pro-
16
teins must be isolated and c~aracterized, both _physica.lly .,and chemically.
Thus, th:f.s study was under;aken ._to isolate._ a "t9"ater soluble wheat f.lour
protein in .suff.icient_ amou:nts to permit further chemical and physif.al
studies on the protein.
Protein .Changes During: Kernel ~ .. atur.ation
. A· d:l.ff erent approach. to the. study,- of the prot.eins of wheat. flour
is the investigation ·.of. the wheat kerQel · during its- development. A :,
number of worketta have ~aken this. apprc;,ac~, and .. such. v.aried metl:ioc;ls. as ' '
morphological .st:udies,. ,labeling ,;studies,. and chemical fr..actio~ation of
the kernel co:qstituents have been.employed.
Buttrose (3,7) made sonie of -the early electron microscope obse:t"'(a ..
tiop.s of developing wheat ertdosperms. Pr.oteirt-deposit;s appeared to be
.spherical to .oyal _gra.nules from_O. l µ up to ei_ght µ in• dtameter. .These
depqsits US1ial1y,..appea;ed to be loosely,.enclosed within large ~·acs de
limited by ,a si.ngle membrane. and could be recognized as E:!arly_. as one
week_after.· fertili:i:ation. ijo ttiorphologi~al ya,riations corresponding to
heterogeneity.of proteins either within a protein g:i:anuleor·between
g;anul~s were observed.
Jennin~s, Mprton,. and Palk; (38) a.lso noted osmiophilic, electron-
· dense bodies wit~in _ yacuQ~ar .· structures in, the developing. wheat endo-
sperillo lt.:lr?as concluded. tJ;iat. these were. predomi~antly· composed of pro-
tei~, and they,were designated 11 protein:bodies. 11 The ~solation.of

. 17
these protein bodies ~as accompiished by deris~ty g:i::adieq.t centrifuga ..
tion ,after: homogen;lzing :the endosperm. in ,phosp_hate buffer. containing. one
percent af a non.ionic. detergent (39). · Two fractions of protein_ bodies
were ob;ai.:aed. The "sll!-811 protein. body" fra.ction .contained protein
• bodies from.O. l to 0.3. )l in dtameter. The "protein, body" fraction con-
tained particles of 0.25, to L2 µ in diameter. The larger protein
,. bodies (up to ten.p in. dtameter). cou.ld not be· isolated in: 11pure11 form.
A n,i.arked en.,la;-gement of the protein, bodielil. ~as observed during kernel
develqpment between. the second, and t_l;lird weeks. after. fl.owering .of the
plant. The use of a novel fix,ation.procedure .showed tqat.,the protein
i. ho.dies. were loca.lized :wit.bin lipoprotein,.membranes. Some of the· lipo-
pr.ot.ein ,structure appeared to be. an· inte,gl;'.al part of the ptotein:. body.
St.a:i:-ch_gel elecf:rqphoretic patteri;is of the protein,bodies showed_a pre-
dominance of the s'lo:w-moving components cqa1;.acter;i.stic of the. acet;i.c
acid-soluble proteins of ·whole endosperm. The h:i,g)l-speed.supernatant ' .
from the isolation.showed only,proteins corresponding to.the pyrophos-
pl:iate soluble proteips. .Incorpc.>:1:at~1m of :. ~?s:· sulfai:e and 14'.
C
glycine i_nto the proteiq.s indicated that tbe protein, bod,.ies were sites
of accumulation .-Of .stor.age proteins af wheat endosperm.
Radiqact:lve tracers have· been employed to,study .flour protein
.changes assoc~ated_.with-.wheat .endpsperm.developme:n.t. In.19Sf3, Bilinski
and ijcConnel1 (40) . injected_ acetate-1-14c :and acetate-2.:. 1~c into wheat
p~ant stems. at. selected. s;a.ges of ~turation .• and examined the di_stribu-
. f 14c ·· h . f th k 1 Th 1 · . . . tion o - .int _e prote1~s o ·. e Illature erne , _e ear 1est -1nJect1.011s
were_, at_ a time· when ·_the kerI1,e.ls were in. "early, doug~" Ci>r. "late millc"
s:t:age. · Proteiq.s weJ:e isolated. accorditJ.g to. the c~assical solubility
., scnerne. Gl3:adins had the highest specific activity .at t;he varim.is

18
stages of lllaturity, followed by the gluteniris. The specific,.activities
of. the. albumins and globulins were similar to each. other and. were con
siderably, lower than that of the gluten proteins. The gliadins showed
a marked increase in ,specific activity when tsotope '."as injected at suc
cessively later stages of maturity,. whereas, the glutenins, alb~mins,
and globulins showed comparatively/little change in specific,.activity
,with,later dates of injection. Similar measurements were made on glu
tamic acidisolated fromthe protein.fractions. These results sug
gested that gliadins reached a maximum rate of biosynthesis at.a later
period tl:ian did. glutenins, albumins, , and globuli1;1s. More methyl carbon
of acetate was incorporated into glutamic;:.acid th,an.carboxyl carbon,
with the greatest difference in incorporation of the two carbons being
.shown bygliadin. Bran proteins showed markedly increasing radio
.activity with later injection. 'I:his suggested that their formation
.occurs.at. still later stages of Inaturation.
Finlayson and McConnell (41, 42) later employed performic acid to
oxidize a gliadin.fraction soluble in dilute.annnonium hydroxide. F.ive
fractions were isolated from.this performic, acid-oxidized preP,aration
by chroi:natography on DEAE-cellulose. The fractions d.iffered from each
.other in chemical pr0perties,,amino,acid compositioi:i, and carbon-14
content. The specific activities of glutamic.acid isolated.from'.acid
hydrolysates of the Live gliadin fractions were also different from
each_ other. - The glutamic acid specific activity. of each fract,ion was
also, affected by the time at which tr_acer was administered •. Two pos
sible explanations for the results were offered. l'he oxidation of intra-
. m0lecular disulfide lin~ages facili~ated. separation of different gliadin
proteins, in which the·. re~ative efficiencies 0f carbon-14 incorporation

19
'(aried during kernel formation,and maturation. Or, by,r~pturing inter~
peptide disulfide bonds, the oxidation proqucedpolypeptide cha:Lns each
·with its own chemical properties,.amino,acid composit:ion, and biqsyn-
·thetic .history. The fact that performic.acid oxidation destroys trypto-
phan residues in a polypeptide chain.thus breaking it .at that point, was
not mentioned as a p<;>ssibility.
Lee.and Reynolds (4.3)·inJected 3?s sulfate into the.stell).s of ma
turing wheat, and examined the distribution of· 3,5s in the mature plants.
Injections were made 28, 23, .18, 13,and 8 days before·harvest. The
kernels. appeared to be the most active. site .of 35s accumulation, but
I only/about 1me-half o:f. the administered sulfate was utilized. Gluten
was the most radioactive component of flour milled from the labeled
kernels. The spe.cific. act.ivity of the gliadins and glutenins was
greater when the tracer was present in the plant for longer periods of
time. The results indicated that at any st1;1ge during the growth period
studied, the gliadin fraction increased in specific activity about 20
percent faster than the glutenin.fraction.
Gra]::iam and Morton (44) reported a rapid uptake and incorporation
.of 35s sulfate.and 14c glycine by wheat heads when they.were removed
fromthe plant.at about20 days after flowering.and placed in.a beaker
conta;i.ning a s.olution of the radioisotopes. After nine hours, approxi~
mately 80 percent of the total radioactivitywas incorporated into the
protein fractions. The total radioacti.vity.of the acetic acid soluble
proteins from the endosperm exceeded that of the pyrophosphate·· soluble
proteins .. ·Jiowever, the specific .. activity,of the pyrophosphate soluble
· p'rotei~s based on pg of .nitrogen was significantly greater than that of
the.acetic acid soluble proteins. This was true whether the 35s sulfate

20
or the uniformly, .labeled 14c glycine was t,1sed. S~arch gel electroph,o-
resis of the extracted proteiqs showed the stow-moving components in
. the.acetic. acid.extract and the fast moving c9mponents in the pyrophos-
po.ate extract. Radioautographs· oL the starch gels showed a correspond-··
ence of label with dyed .protein bands.
fl'.'.actiori-ationof the proteins of niaturing wheat.endosperm.with the
subsequent study of their cllemical and physi~al properties was proqably
· the first mea11s of . studying kernel. development. · In· the· ,late 1930 1 s re=
-sults by !-;fcCalla {45) suggested t~at .the potassium iodide-soluble ma-
terial (gliadin) was the tast protein fraction.formed. It was further
.concluded that the earliest formed gluten.fractions became the most in-
soluble portion (gh:ltenins) of the protein. in the mature kernels.
Recently, Jennings. and Morton· (46) found that, .at about 19 days
after.flowering.and thereafter, there was a rapid increase in the
. amount of acet:i,c acid-soluble protei11s per grain ,as compared with pyro-
phosphate-soluble proteins. The amino acid composition of the endo-
·Sperm proteins remained relatively cot1stant from 19 days after .flowering
•to.maturity. The interpretation derived from these results suggested a
i:apidaccuinulation of storage (acetic acid soluble) proteins at th.is
early, date. The amount of amide nitrogen per grain '\vas shown to.in-
crease almost .linearly during development. · Since -the gluten protei11s
of wheat- flour h,ave a relatively high proportion.of glut.amine residues,
this was.also taken,as-anindication of increasing.amounts of gluten
·. proteiI1S.
Graham et al. (47) chromatographed $odium pyrophosphate soluble ' . ..
protei11,s on:DEA~-cellulgse,andacetic.acid soluble proteins on CMG.
The chrolllatographic elutionpatter11s from both.types of columris remaiqed

relatively; const:ant for each variety throughout the period of kernel
development. Only; the quantity of protein in.each fraction from the
columns was shQwn to increase. It.was suggested that these results
indic:ated that the changes in protein composition.are quantitative
rather t~an qualitative. No attempt was made to.correlate the.acetic
acid soluble proteins and sodium hydroxide soluble proteir:is with.the
gliadi11s or glutenins. Based on their opserv:atioµs of the incr~asing
amounts of both the pyrophosphate extractable protei11,s and the.acetic
.acid_soluble protei11s with.maturity, these workers took exception to
earlier evidence (46, 44, 41) that gliadin,is formed at a·later stage
of development and independently of other protein,components.
21
lt· has been shown (32, 48) that the amino ,acid composit.ions of the
glutenins, gliadins, and .. soluble proteins are signifi~antly differento
·On. this J:?asi.s, studies of the changes of the. amino acid compos.ition of
developing wheat endqspermhave been employed as a measure of protein
changes. Jennings and Mor.ton- (49) found that there were considerable
differences inthe.amino,acid compositions of the fractions extracted
by pyrophosphate, acetic acid, and dilute alkali. The compc;>sition of
the fraction extracted by,acetic_acid remained refatiyely constant from
· 14 days after flowering· through maturity. The amino ,acid composit.ion
changes t}:iat were noted in the pyrophqspllate extract, e.g. glutamic,
proline,. lysine, were explained as being the result of the extraction
·. of more of the gluten-type proteins with. this solvent. as the endosperm
.maturedo
Jennin~s a.nd Morton (49) aho improved the technique for the iso=
lation of the protein bodies and isolated a large proportion of the ' - ' I
tc;,tal protein bodies of the endosperm. The amino acid composition of

22
the protein· bodies s.howed little cllange between. 18 ~ays after flowering
and matu-rity. Their .am.ino .acid composit.ion·resem.bled the acetic .acid
soluble p-rot-eins. · ,The s!llaller proteitl bodies were isolated: by.,an
earlier.method (3-9),,and their.amino.acid composition,was determined.
Ihe comp9sit.ion.of these bodies differed from.tqat of the total protein
.body. fraction. It .more c.lc;>sely resembled the composition of the dilute
. s,odium :hydroxide soluble prote.i11s tllan. that. of the acetic. acid soluble
prot.eins at.18. days a.fter flowering. ·· Comparisons were not ~ade .on more
~ture .samples. · ·T.be differences in·. the .. amino ,acid compositions of the
proteins from.the proteinbodies.sug~ested that.these bodies were not
· necessarily uniform in composition.
Pomeranzet_al. (50) determined.the amino,acid composition of
flou;rs from.two hard red.winter-wheat varieties harvested at various .. . . ' .. ' .
s~ages of maturity. DuringII1aturatio11, the amount of lysine, aspartic
ac.ic:l, glycine,. alanine,. and. ya line decreased in .the flour while glutamic
acid: and proline increased •. A.l.t;:hough no ,allowance was m.ad.e for ·the
. fl::-ee amino .aci4s,. the results. agree with i:nany of the earlier findings
that the q~antity, of the gluten.proteins (high in glutamic .acid and
pr(l).Une) ,increases at the later st:ages of maturity.
Coulson. and S.i,m (51), employing. starch gel electrophoresis,
. studied cq.anges in. the wheat protein systel!l, particularly endosperm
proteiI1S, during.the life .cycle of the plant. The proteins were ex-
tracted from the endosperm with dilute acetic .acid. Fractions ef low
electrophoretic. mobility.·were progressively degraded during germination
_and progress-ively_ synthesized towards the end .of the ripe·ning period.
In.contrast, fractions ef higher mobility were less affected during
germination._and were utilized at a tater stage. . Similarly, these com-

23
ponents of higher electrophoreticmobility were synthesized first during
ripening and remained at a relatively constant level during the build
up.of apparently high molecular weight material.
Hoseney and co-workers (52) used three M urea in a pyrophosphate
buffer, pH 7, to extract the proteins of two hard red winter wheat
flours at different stages of kernel development. They reported a cor
relation between a decre,!;lse in the absorbance at 280 mµ and a gradual
increase in molecular weight and complexity of the proteins in the ex-
tract as the kernels matured. The increase in formation of gluten pro
teins was accompan;i.ed by a decrease in water and salt soluble proteins
and paralleled improvement in bread making properties of the flours.
Changes observed in compounds closely associated wii:h protein syn
thesis, i.e. free amino acids and nucleic acids, have provided addi
tional information related to the development of proteins in wheat.
Jennings and Morton (47, 49) noted that the non-protein nitrogen formed
a high proportion of the total nitrogen (about 25 percent) in the endo
sperm at 14 days after flowering but declined rapidly to about two per
cent at maturity. Free amino acids present in large amounts during
early kernel development.(14 days after flowering) were glutamic acid,
alanine, glutamine and asparagine, serine, and aspartic acid. At
maturity, the free amino acids present in largest amounts were glutamine
and asparagine, glutami~ acid, aspartic acid, alanine, and proline. The
.amounts of free glutamic acid and proline declined dµring the period in
.which incorporation of these amino acids into protein showed a marked
increase. Aspartic acid and ai;-ginine increased in relative amounts
during development, whereas most of the other amino acids showed
relatively little change. These variations were interpreted.to be a

24
.reflection of the rate of supply of ;an ,amino acid to the pool as com-
pared to the rate of·its incorporation.into protein.
Eased on two dimensional paper chromatographyof ninhydrin posi-
tive compounds, Coulson and Sim (51) made some q4alitative observations . .
about the cl:;tanges in the free amino acids during the life cycle of the
wheat plant. About ten weeks before maturity, the major ninhydrin
positive constituents were glutamic acid, alanine, asparagine, glutamine,
prol:)ably citrulline, and proline. Chromatographic separation of nin ..
hydrin positive substances of mature endosperm revealed glutamic acid,
asparagine, glutamine, proline,. and probably citrulline as major con-
stituents. These observations are in.agreement with the results of
Jennings and Morton· ( 49) •
Research on proteindevelopment in the wheat kernel has been
carried out using a ~ariety of techniques. Radioactive tracer studies,
together with fractionation by solubility. characteristics, l:;tave sug
gested a late.and rapid synthesis of the gliadinproteins. Morpho-
logical studies have indicated a build up of protein bodies in the endo-
spermduringmaturation. Isolation of these protein bodies and.sub
sequent electrophoresis on starch gel have shown the contents of the
protein bodies to be the slow ... migrating, gluten-type proteins. Ion
exchange chromatography of .the endosperm proteins indicates a qllanti-
tative build up of the various proteins rather th.an a qllalitative
change in.the protein composition.
· Wheat flour proteins range in molecular weights from about 16,000
. for the. albumins (31). to about one million for some of the glutenins
(:53). Thus, separation of the proteins according to.their molecular
weight offers an .additional method to .. study the protein changes associ- ..

25
. ated witl;i. zµaturation of the kernel. The second phase of this in:yesti ..
gation, therefore, was the utilization of the gel-filt~ation technique
to determine the molecular weight distributions of the flour proteins
at various stages of maturity.

Flour
CRA,PTER IU
THE ISOLATION A~D CHARACTERIZATIPN OF A WATER
SOLUB~E WHEAT FLOUR PROTEIN
.. Experimental Procedure
Straight .. grade expe;rimentally milled flour from a composite of Hard
Red Winter Wheats grown in 1963 at Stillwater, Oklahoma, was used. Pro
tein (N x 5 •. 7) and ash contents were 12.3.5 percent anc;l 0.42 percent,
respectively. Solutions of water soluble protdns for ion exchange
chromatography were prepared by stirring flour with water at a ratio of
l;l.5 (W/V) at room: temperature. The slurry was stirred at five m~nute
:Lntervals for 30 mintltes, then centrifuged at 13,000 x g for 30 minutes
at 2° C. The clear supernatant solution was dialyzed against two
changes of ten voluXI1es of O .05 M acetate buff er, pH 4. 6, for 24 hours •.
Ion E~change Column Chromatography
Ca.rbox~ethyl cellulose (1218 Mannex .. CM, Lot. 2042, Mann Research
Lab., New York, N. Y.) was purified by washing in 0,05 N NaOH for five
minutes followed by treatment i~ Q • .5 N HCl for 15 minutes. It was then
repeatedly washed with deioniied water until no trace of acid reniained.
The CMC was th.en equilibrated with the starting bufhr whic)i was O ¥05 M
$Odium acetate, pH 4.6. 'i'he pH of the CMG.slurry was 4.6 and thecon
ductivity was one millimh9. The columns were poured from a slurry of
CMC in this buffer.
26

27
Two. sizes of columns were employed. S~ll glass columns with CMC
. bed dimensions of 2.2 cm x 15.0 cm were U$ed for exploratory experiments
while columns with 4.4.cm x 15.0 cm bed dimension of CMC.were used.for
preparatory. experiments.
Ip experiments using.the SII!a.11 columns, 40 ml of dialyzed extract
containing ab9ut 250 mg of protein as determined by microkjeldahl
assay were applied to. the tpp of the CMC bed. The walls of the column
.were washed twice with five nil of buffer, then.200 ml of s~artingbuf
fer were passed.through the column.to.remo'O'e any·unadsorbed material.
Stepwi.se elution. of the.adsorbed proteil').S was carried out. using the
following volumes of increasing.concentrations of sodium-chlci>ride; 1.5
1 of 0.15 M NaCl, ,500.ml of 0.28.M NaC.1, and 250 ml of 0.40. M NaC.l.
The same conditions were used for the preparatory CMC columns
except that four times the amounts of sample and.eluting solutions were
used. Effluent from.the columns was collected by means of a Packard
drop-counting. :fraction c.ollector. For small columns, ten ml fractions
were collected. Preparatory column fractions were· 20. ml.
Gel FiltrationExperiments
For _preparatory. gel filtration columns, cross-linked dextran gel,
S~phadex G-.75,. was used. It was a commercial preparation obtained from
Pl:1:arII1acia, Uppsala, Sweden. The dimensions of the column gel bed were
2.0 cm x 70.0 cin. The lower ends of the columns were nearly flat and
.were equipped with twomm Leur. joints to.allow the fitting of a syringe
needle. This needle was, in turn, connected to canular tubing which
carried the effluent from the co.lui:nn to the fraction collector. Gels
were retained in. the column by .a disc of Whatlllan 11 54 filter paper.
Protein.solutioqs were placed on the column by layering under the

28
eluant. Either 0~5 M lactic.acid or 0.02 M Tris, (pH7'.4, containing
five mM MgC12) was used as the eluting· buffer. Effluent from the columns
was collected.in three ml fractions.
For the estimation of the molecular weight and the diffusion coef-
ficient of the isolated protein, a 1 •. 3 cm x 100.0 cm column of Sephadex
G-75 was used.· The buffer employed was that described by Andrews (54).
The gel column was calibrated with the following proteins: ovalbumin,
MW.= 45,000. (54), n20 ,w,= 7.76 x 10⁻⁷ (55); c(-chymotrypsinogen, MW=
( ) o -7 ( ) ( ) 25 9 000 54, n20 .= 9.5 x 10 56 ; cytochrome c, MW.= 12ll400 54, . sW
n°20 . = 13·.0 .. llW
x 10-7 (57) (all from Sigma Chem. Co., St. Louis, Mo.);
,6' .. lactoglobulin, MW,= 35,000 (54); 0(-lactalbumin, MW.= 15,500 (54)
(gifts from Dr. Kurt E. Ebner); papain,. MW,= 20,700. (58), D~O,w = 10 .• 23
x 10-7 (58) (Difeo. Labor.atories, Detroit, Mich.); bovine pancreatic
ribonuclease, MW= 13,700. (54) ,· ?~o,w = 11 .• 9 x 10⁻⁷ (59) (Mann ResE;!arch
Laboratories, New York, N, Y.).
Analysis of Flour Extracts and Fractions From the CMC and Sephadex
Columns
Proteins appearing in the effluent from·CMC and Sephadex.columns
were detected by measuring the.absorbance at 280 and 260 mp for each
tube •. A Becknl.an·.Model DU spectrophotometer equipped with a Gilson
Medical Electronics transferator was used for absorbance measurements.
The protein content in flour extracts placed on CMC columns was deter-
mined by ,a microkjeldahl procedure or by.a Biuret method. (60). In.the
CMC preparatory column ru~s, the correspondence of the 280 nv.absorbance
.with protein concentration ~as checked by allalysis of the fractions by
the method of Lowry~ al, (61). Carbohydrate was determined by the
anthrone procedure (62). · The ionic strength gradient on the CMC

columns was followed by. measuring the conductivity of the fractions on
a Radiometer cond1,.1ctivity,meter.
Electrophoresis Apparatus and Procedures
29
The apparatus and procedures for starch-gel electrophoresis were as
previously reported by Abbott and Johnson (26). Thin gels on glass
plates were used exclusively in th;i.s investigation.
Polyacrylamide gels contained 7.5 gm of Cyanogum 41 (American
Cyanimid Co., New York, N. Y.) per 100 ml of buffer and were prepared
in-the same manner as the thin starch gels with the heat step.being ex
cluded.
Electrophoresis on Sepraphore III strips (Gelman Instrument Co.,
Ann Arbo:i;-, Mich.) was conducted on a Buchler Universal Electrophoresis
Cell using a Buchler D.C. power supply (Buchler Instruments, Fort Lee,
N. J.). Strips were SC?aked in buffer for four hours; the excess buffer
was then blotted ~ff, and the protein sample applied with a Gelman
sample applicator.·
Three buffer systems were employed for electrophoresis. An eight
. mM aluminum lactate .. three M urea buffer, pH, 3·.3 (11) was used for the
analysis of the column frac.tions by starch gel electrophoresis •. Two
additional. buffers were used for the electrophoretic examination of the
isolated protein. One was a 20 mM sodium cacodylate-HCl buffer, pH
6.1. The third b1,.1ffer contained 15 mM T)'.'is, three mM citric acid,
eight mM boric acid, and 0.5 M urea. Sufficient.sodium hydroxide was
added to give.a final pH of ~.6.
· Protein bands in the gels were detected by staining with one of
three stains: .a saturated solution of Buffalo Black NBR (Amido Black
-lOB) (Allied Chemical Corp., New York, N. Y.) in five percent acetic

30
acid for 30 minutes, 0.007 percent Nigrosine (Allied Chemical Corp.,
New York, N. Y.) in two percent trichloroacetic .acid for ·20.hours, or . . '
0.2 percent Ponceau S (Allied Chemical Corp., New York, N. Y.) in·f.ive
percent trichlor9acetic acid for two hours. Excess stain was removed
·by allowing the gels to stand in.a five percent acetic acid wash solu-
tion .for about 48 hours with occasional agitation. The solvent was
changed occasionally, and washing was continued until the gels were
suitable for photography. The Sepraphore,IIl strips were stained in·the
Ponceau S stain.for .15·minutes. Washing of the strips was accomplished
by passing the stained strils tb.r<4Ugh a bath of five percent acetic acid.
Photography of Starch Gels
The stained starch gels were mounted on.glass plates and photo
graphed. by transmitted light. The plates were placed on the opal glass
cover of.a light.box.equipped w:i;th twelve 50-watt bulbs. An.enlarger
equipped with film.holders was used as a camera. Panatomic X fi.lmwas
employed, and.a Wratten Series A (red) filter used on the camera to
;incr~ase the contrast. Film was developed in, DK-50 developer while
prints were developed in Dektol.
.Amino.Acid tnalysis
Amino acid a~alyses were cl;lrried ou.t on a Beckman ;model 120 C
automatic 0amino acid analyzer.according to the method of Moore and
.Stein (63). Sample$ were hydrolyzed at 1109 C for 12,. 24, 48, and 72
hour periods in:sealed ev:acuated tubes by placing the sealed tubes in
, refluxing. toluene. - llydrolysis w-as incomplete in 12 hours and resulted
·· in low.yalues·for.all amino acids. The v.alues for threonine, serine,
andb.,alf .. cystine were determined by extrapolation.of the data to zero
t.ime. of hydrolysis. No significant. change with time in the V,alues for

31
the other amino acids was observed. - Half-cystine ~as also determined
by oxidizing the cystine residues to. cysteic _.acid by the performic acid
oxidation procedure of Schram, Moore, and Bigwood (64). Nitrogen.re
covery ,after chromatography of th_e hydrolysates was about 98 percent.
Tryptop~an.content .and the ratio. of tyrosine to tryptophan were deter~
mined by the spectrophotometric. method of Goodwin and.Morton (65) .as
outlined by Beaven.and Holiday· (66) using .a Cary 14 recording spectro-
-photometer. The value for ammonia ~as obta:i,ned by subtracting losses
in_serine, threonine, and half .. cystine after 24 hours hydrolysis, to
gether with twice the tryptophan content, from the observed ammonia
value at 24-hours.
Free sulfhydryl groups were determined by the spectrophotometric
method of Boyer (.67) according _to the procedure of Fraenkel-Conrat (.6.8).
Ovalbumin was run.at the same time as a check. Samples were assayed in
buffer with and .. without 0.6 percent sodium lauryl sulfate.
Reduction.and Alkylation_of Disulfide Bonds
Reduction of the disulfide bonds was performed at pH. 8.0in.0.05 M
-Tris buffer. containing five M guanidine hydrochloride. Five mg (about
-Oo25 µmoles) of protein.and 40 )lmoles of dithiothreitol (Calbiochem,
Los Angeles, Calif.) were added to one ml ef solvent .and incubated at
_ 25° C. for two hou:r;s.
A ten perc.ent molar excess (over reagent -Sll) of iod9acetamide
(Sigma Chemical Co.~ St.- Louis, Mo.) in0.05 M Tris, pH7.4, ~as added
.in.equal volume to.the solution of reduced protein. The pH was ad-
- justed.to8.0.with dilute base, and the reaction.mixture allowed to
incubate one hour.
- ~arboxy- _and Amino-terminal Amino Acid Determinations

32
The fluorodinitrobenzene method.for.amino end group analysis was
c.arried out according to the method of Fraenkel-Conrat et !! . ( 6-9). The
dinitrophenylamino ,acid deriyatives were identified by two dimensional
paper chromatography by,comparison with known deriyatives.
The Edmanpheny.lisothiocyanate method for step-wise degradation
·from the amino end was done by, the ~aper strip technique (70). · Egg
,white lysozyme (~utrition,al Biochemicals.Corporation, Cleveland, Ohio)
~as degraded at the same time as a means of checking techniques. The
phenylthiohydantoins .of the amino acids were identified by one dimen
.sional P,aper chromatographyaccording.to.themethod of SJlquist: (71).
· Standards were synthesized from the free amino acids and.twice re ..
crystallized (70).
For c.arboxyJ .. terminal studies,. Carboxypeptidase A treated with di~
isopropylfluorophosphate was used at a one to, fifteen or a one to.fifty
·molar ratio.of enzyme to.substrate. The protein substrate was sus
pended in cold five percent trichlorqacetic acid (one mg protein/100µ1)
and centrifuged down to remove free amino.acids or polypeptide impuri
ties. The protein substrate ~as then treated with carboxypeptidase at
pH, 8.0 and 25° C. . Aliquots were reI11oved at interyals during an eight
hour incubation period.· The addition of trichloroacetic .acid to.a
final concentration of five percent served to terminate the reaction
as well as to precipitate resid~al protein, which ~as then removed by
_centrifugation. The supert?,atant solutions were then spotted on Whatnian
l!l chroI11atography 1_>aper. ., The descending chromatogram ~as developed
with the upper ,phase of ann-butanol-acetic acid ... ~ater (4:1:5) mixture.

33
Results and Discussion
Preliminary CMC ChromatographyStudies
Abbott and Johnson (26) employed Sephadex G-100 to resolve the
complex mixture of; water soluble flour proteins into corisiderably·less
heterogeneous fractions. One component, appearing as the most heavily
stained.band in.a water extract of flour subjected to starch gel elec
trophoresis, was concentrated in one of the fractions. l)sing a pre
parative starch gel electrophoresis technique, they isolated small
amounts of this protein from the fraction. It appeared that a dif
ferent method of separation based on charge differences might be suc
cessfully applied to. the is0lation of this protein from the G-100 frac
tion. Therefore,. a study, of the 1,tse of ion-exchange chromatography on
.CMC was undertaken f0r this purpose.
In preliminary experiments, the fraction prepared according to the
procedure of Abbott and Johnson (26), was chromatographed on a CMC
column. Figure 1 shows a typical elution pattern.together with a de
scription of the experimental conditions. The starch gel electrophoresis
patterns of the fractions from this coiumn.are shownin Figure 2. The
first peak contained II\aterlal which was not adsorbed on the columnand
no bands were ,o~served upon starch gel electrophore~;i.s. The fractions
eluted by the 0.1 M NaCl contained a portion of nearly all the proteins.
The linear graclient from. 0 .1 to O ~ 18 M NaCl yielded two pea~s. The
first of these peaks appeared to contain.about equal amounts of three
proteins, 1:;me of .them being the protein of interest. The second peak
.containedpredominantly this major soJuble protein. There was insuf-
ficient material in.the re111aining fractions to be visible on,starch gel.
Although ion exchai:ige chromat0gr.aphy had further purified the

Figure 1. CMC Column Chromatography of the Water Solubles Fraction From a Sep}i.adex G-100 Column
Two hundred fifteen mg of the protein fr.action from the Sepha-
dex G-100 column were dissolved in five ml of 0.05 M acetate buffer,
pH 4.6, and applied.to .a CMC column (2.2 x 8cm) previously equili-
brated with the buffer. After washing the column with 75 ml of the
same buffer, the proteins remaining on.the column were eluted with
a series of continuous and discontinuous gradients, (-----), from
0.00.to 0.28 M NaCl. (-), protein distribution in the eluate
f:t:actions.

NaCl Concentration (M)
('I") . 0
. 0
N . 0
I
\..--- .....
(I") . 0
I
I I '-
08Z V
N . 0
.-I 0 . . 0 0
.-I . 0
0 00 ..:-i
0 N .-I
0 0 .-I
0 00
0
'°
0 N
35
,.... QJ
~ ~ i:: 0
•r-1 .µ 0 Ill ,....
lz<

Figure 2 •. starch Gel Electrophoresis of Fractions From CMC.Chromato.graphy of a S.epHadex· G.,100 Fraction:
·· Electrophoresis was for 15 hours at six V /cm in ,aluminum
lactate-urea buffer, pH.J.3. Protein bands were stained with
Amido Black 10 Bin five percent acetic acid.
1. Fractions I/: 6 - IF 16 2. Fractions IF 20 - IF 36 3. Fractions I/: 40 - IF 64 4. · Fractions It 65 - IF 117 5. ·· Fractions IF 127 - IF iso
'•·

37
(-)
2 3 4 5
38
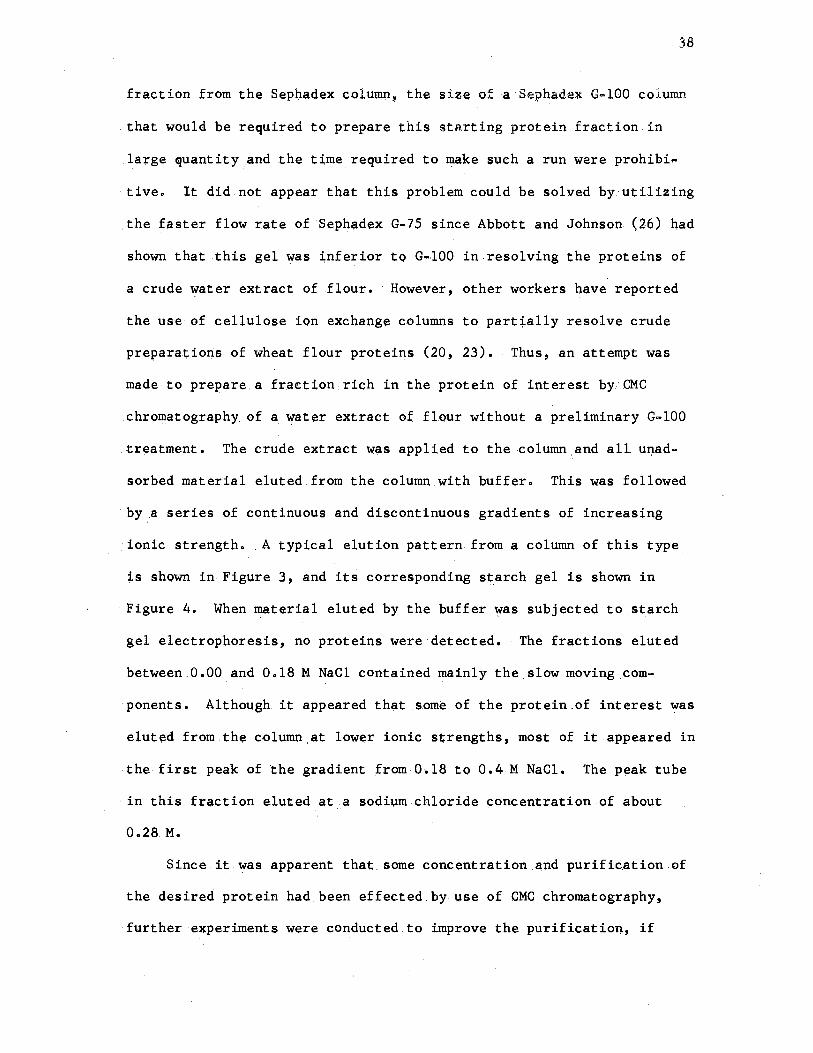
fraction from the Sephadex column, the size of a Sephadex G~lOO column
that would be required to prepare this starting protein fraction in
·large quantity and the time required to make such a run were prohibi ..
tive. It did not appear that this problem could be solved by.utilizing
the faster flow rate of Sephadex G-75 since Abbott and Johnson (26) had
shown that this gel was ;inferior to G-100 in resolving the proteins of
a crude water extract of flour. However, other workers 4ave reported
the use of cellulose ion exchange columns to partially resolve crude
preparations of wheat flour proteins (20, 23). Thus, an. attempt was
made to prepare.a fraction.rich in the protein of interest byCMC
.chromatography of a water extract of flour without a preliminary G-100
.treatment. The crude extract was appl:i,ed to the column and all unad-
sorbed material eluted from the column with buffer. This was followed
·by a series of continuous and discontinuous gradients of increasing
ionic strength •. A typical elution pattern from a column of this type
is shown in Figure 3, and its corresponding starch gel is shown in
Figure 4. When material eluted by the buffer was subjected to.starch
gel electrophoresis, no proteins were detected. · The fractions eluted
. between 0.00 and 0.18 M NaCl contained mainly the slow moving Com
ponents. Although it appeared that some of the protein of interest was
eluted from.the column.at lower ionic strengths, most of it.appeared in
the first peak of the gradient from 0.18 to 0.4 M NaCl. The peak tube
· in this fraction eluted at a sodium chloride concentration of about
0.28.M.
Since itwas apparent that.some concentration and purification of
the desired protein had been effected by use of CMC chromatography,
further e}l:periments were conducted.to improve the purification, if

Figure 3. CMC Column Chromatography of a Water Extract of Flour
The extract (40 ml) which contained 230 mg of protein (N x 5.7)
was dialyzed against 0.05 M acetate buffer, pH 4.6, overnight and
applied to a GMC column (2.2 x 15 cm) previously equilibrated with
the buffer. After washing the column with 150 ml of buffer, the
proteins were eluted by a series of stepwise and linear gradients
(--~-~) of NaCl from 0.1 M to 0.6 M. (~), protein distribu~
tion in eluate fractions as measured by the absorbance at 280 mv.

I I '- . --- --
Lt'l . 0
NaCl Concentration (M)
---.., I I I I
' ' ' ' ' ' '
('I') . 0
' ' ' ' ' ' '
N
0
' , ...
N
0
' '1 I
I I I I
..-1 . 0
\
0
\ l I I I I I..,
0 Lt'l N
0 0 N
0 Lt'l ..-1
0 0 ..-1
0 Lt'l
40
1,..1 Q)
~ i i:: 0
•,-I .j.J
u Cll H ~

Figure 4. Starch Gel Electrophoresis of Fractions From Q-.IC Chromatography of a Water Extract of Flour
Electrophoresis was for 15 hours at six.V/cm in.aluminum
lactate-urea buffer, pH 3.3. Protein bands were stained with
Amido Black 10 B in f.i,ve percent ac;etic acid.
1. Water extract 2o Fractions f/:. 6 - :/I= 12 3. Fractions ff, 20 - ://: 40 4. Fractions ://:. 50 - ://:. 65 5. Fractions :/I= 65 - :/I= 85 6. Fractions ://: 90 - ://: 105 7. Fractions .fl= 106 - fl= 125 a. Fractions ://: 170 - fl=. 193 9. Fract::i,ons fl= 194 - ://: 2.15
10. Fractions :fl=. 220 - :/I= 230

42
(-}
1 2 4 5 6 7 8 9 10

, 43
pqss,ible •. A discontinuot1s 1 or stepwise, elution .&chedule, based on
previous results, was investigated with.typical results shown in Figures
5 and 6 •. After ~ashing unadsorbed mater~al through the column with buf~
fer, 0.15 M NaCl was passed through ,the column until. no further ·prot.ein
could be detected as meast,ired by the. absorbance .. at· 280 tDfl~ Proteins
remaining .on the column were eluted by successive 0.28 and 0.40 M Na~,1
steps. As in the previous experiment, the protein of concern.was found·
predominantly .. in the fraction eluted with Q.28. M NaCl. A small amount
of this protein was also elµted in. the preceding peak. together with
another protein of slightly slower migration rate. This second protein
was always found associated with the protein of interest, and eluting
.with 0.15 M.NaCl until the br9ad, plateau-sJ:,.aped.region (Figure.5,
elution volume from 900. ml to 1400 ml) appeared was necessary to. sepa
rate the c.ontaminating protein from the major portion of the protein
. being isolated. I)lo further work was done to determine .if these two
proteins might associat.e or whether the charges on the two proteins
just. happened to be very similar. Thirty milligrams of material (es
sentially 100 percent prot~:i.n by the Lowry protein assay on .lyophilized
material) were obtaiped from the fraction eluted with 0.28. M NaCl when
, 200. milligrams of protein (N x .5.7) tvere applied to a column. Re
chromatography. of the material in this fraction with the same elution
procedure fielded a single peak which eluted with the 0.28 M NaCl step.
Efforts to. further improve the seJ>aration of components by the use
of v.arious types of continuous gradients between 0.15 Mand 0.28 M NaCl
were uns1,1ccessful. Therefore, the CMC fracti.onation procedure employing
· the discontinuous elution.system was scaled up for use in preparatory
. work.

Figure .5. CMC Column Chromatography of a Water Extract of Flour Eluted by a Discontinuous Gradient
The extract (40 ml) which containecl 210 mg of protein (N x.5.7)
was dialyzed against 0,05 M acetate buffer, pH 4.6, for 24 hours
and applied to a CMC column (2.2 x 15 cm) previously equilibrated
with the'buffer. Proteins were eluted from the c0luml'\ by a step-
wise gradient ~--- - -1 from O .o to O. 4 M NaCl. (---), absorbance
of each fraction.at 280 mp. (----~), absorbance of each fraction
.at 260 mp..

..::t
0
t 0 00 N
it 0
'° N
I.
.c: .I,.)
00 $: Q) 1-1 .I,.) Cl)
C) •r-l p: 0
H
NaCl Concell1ltration (M)
M
0
N
0
--
0
---------
, ( , ,
• \ . ' \
I I I I I I
----- ---- --- -- --~
C") N . 0 0 0
a:,ueq.:rosqv
I , , I
I ,
0 0 If)
N
0 0 0 N
0 0 If) ..-1
0 0 0 ..-1
g If)
45
-..-1 s -Q)
s ::,
..-1 0 > ~ 0
•r-l .I,.) ::,
..-1 w

Figure 6. Starch Gel Electrophoresis of Fractions From a Stepwise Elution of Water Soluble Flour Proteins From CMC
Abo1,1t 700 to 900 Jl8 sample was applied to each wick. Electro-
phoresis was for 17 hours at five V/cm in aluminum lactate-urea
buffer, pH 3.3. Protein bands were stained with Amido Black 10 B
in five percent acetic acid.
1. Fractions from eh,1tion volume of 320 ml to 470 ml 2. Fractions from elution .volume of 520 ml to 640 ml 3. Fractions from elution volume of 710 ml to 860 ml 4. Fractions from elution volume of 890 ml to 1100 ml 5. Fractions from elution volume of 1120 ml to 1400 ml 6. Fractions from elution volume of 1630 ml to 1900 ml 7. Fractions from elution volume of 2190 ml to 2350 ml

47
(-)
- -1 2 3 4 5 6 7

48
Preparative CMC Column Chromatography
A column of twice the diameter as the column used in the prelimi-
nary experiments was employed; this permitted a four-fold increase in
the amount of protein applied to a column. The elution pattern from the
iar$e column was very similar to that of the smaller column.as measured
by the absorbance at 280 mp.
Since the elution patterns of the columns had been monitored only
by measuring the absorbance of each fraction at 280.and 260 mp, it was
of interest to determine the protein and carbohydrate content of each
fractirono Protein assays by the Lowry procedure (61) and carbohydrate
assays by the anthrone method (62) were performed on each tube from a
large CMC column. The results, together with the absorbance readings
at 280 m1-1, ct.re shown in Figure 7. These data show that, indeed, each
absorbance peak contained protein. All 480 mp absorbance peaks, except
the fi:rst one, contained large amounts of protein and essentially no
carbohydrate. The first peak, however, contained about 40 mg of carbo
hydrate for eachmgof protein. This would not permit enough protein
to be placed on a ~tarch gel to yield visible dyed protein bands after
electrophoresis. The material in the first peak also gave a positive
carbohydrate test by the Molish test and a positive test for pentose
sugar~ by the Bial's procedure.· Coates and Simmonds (20) isolated a . . ;
fraction which passed unretarded through both.a DEAE-cellulose column
.and a CMC column. The fraction contained both carbohydrate and protein,
and yielded arabinose and xylose upon acid hydrolysis. They suggested
that this material corresponded to the ~entosan ·fraction of wheat flour.
These preliminary results indicate that the unadsorbed matertal from
the CMC column corresponds to.the pentosan fraction of Coates and Simmonds.

Figure 7. Preparative CMC Column Chromatography of a Water Extract of Flour
One gram of protein (N x 5.7) in 190 ml of extract was dialyzed
against 0.05 M acetate buffer, pH 4.6, for 36 hours and applied to
a CMC column (4.4 x 15 cm) previously equilibrated with acetate
buffer. Proteins were eluted from the col~mn by a discontinuous
gradient of NaCl from 0.0 M to 0.4 M. (~~-) absorbance of each
fraction at 280 mp. (-----) protein in ug/ml in each fraction as
measured by the Lowry method. ~---.~ cal;'bohydrate in pg/ml in
.each fraction as measured. by the anthrone procedure.

(IW/liW) 01 x £- 3l'!l!lOAHOB!lVO
"° lit> . '¢ i ff i
11111.16ml) z.01 u flll310~r.! co It) ·s::t
----:-=.-:.. - ~
--- ------------ -- - - - - - - - - -
.e ~ -a
C: >,
.,:;;;
0 .e 0 00 .c N
0 -- C <( 0.. <.:>
<N l
N
" ," __ , I
I
I
I I i
I I
I I I I I I
I I
I I
0
l 0
'O g_ 0
lg ,0
I a).
0 0 0 ,q'
-----~~::::~:-" -------- - -- - - - -- - ----- - ----- - -'~-C:-:-::_:-::_.,.., ____ ..;1
~--·---------------- ·----------- ---1---,q--',----~""-.---~o~.----oo"----'°~---~.,.~--.....,""~--~oo ~ 0 ci ci ci d
50
~.
w :;; ::::, ...J 0 >
z ~ I-::::, ...J w

51
After analysis for carbohydrate and protein, the tubea from the
column were pooled into appropriate fractions~ dialyzed to remove the
NaCl, and lyophilized. The fractions were then examined by starch gel
electrophoresis, with the results shown in Figure 8. Both Amido Black
and Ponceau S stains revealed the same protein bands in a fraction with
corresponding relative intensities. The protein of interest again was
found in the fraction eluted with 0.28 M NaCl (elution volume 8160 ml
to 8900 ml).
Fractionation by Gel Filtration of Protein Eluted FromCMC by 0.28 M
NaCl
Earlier work by other groups indicated that gel filtration on
Sephadex G-75 did not effect a clean separation of albumin and gluten
proteins in a crude water extract (25, 26). However, it appeared that
such a separation might be possible with a more refined starting ma
terial since the molecular weights reported for wheat flour albumins
have been from 15,000 (31) to 28,000 (8), and Sephadex G-75has a nomi
nal exclusion limit of fifty thousand. Therefore, a solution (ten
mg/ml) of the protein which eluted from a CMC column in 0.28M NaCl was
placed on a Sephadex G-75 column and eluted with0.5 N lactic acid. The
eluti.o"Q. pattern for a typical experiment is shown in Figure 9, and the
starch gel electrophoresis pattern of the appropriately pooled fractions
is shown in Figure 10. Proteins in the first peak were totally excluded
from the gel matrix and were eluted from the column in the void volume.
Their migration rates in starch gel were similar to.those of the gliadin
proteins. The second peak contained the protein of interest which ap=
pei;ired to be nearly homogeneous electrophoretically. Occasionally, one
or two faint protein bands were observed when large amounts of some

Figure 8. Starch Gel Electrophoresis of Fractions From a Preparative CMC Column
From 300 to 800 pg. of each sample we:i:e applied to each wick.
·· Electrophoresis was. for 20 hout;"s at. five V /cm in aluminum. lactate-
urea buffe.ri, pH 3·.3. Pi:otein bands were stained with Amido Black
.10 Bin five percent acetic acid.
L Fractions from elution volume of 1400. ml to 1460 ml 2. Fractions from elution volume of 1700 ml to 1760 ml 3.. Fracti-ons from elution volume of 2000 ml to . 2080 ml 4. fractions from elution· volume of 5340 ml to 5520 ml 5. Fl;."act:i,ons from elution volume· of 8160 ml to 8900 ml 6. Fractions from elution volume of 10,460 ml to 10,800 ml

53
2 3 4 5 G

Figure 9. Gel Filtration on Sephadex G~75 of the. Protein Eluted From CMC by 0.28 M NaCl
Thirty mg of prot~in from the CMC preparation were dissolved
in three ml of 0.5 N lactic acid and applied to a 2 x 70 cm G-75
column. Protein was eluted with 0.5 N lactic acid. O, protein
distribution in the eluate fractions.

55
1.0
0.8
0.6
0,4
0.2
50 100 150 200
Elution Volume (ml)

Figure lOo Starch Gel Electrophoresis of the Fractions From a Sephadex G"i'75 Column
About 800 }18 of sample were applied to each wick. Electro-
phore.sis was for 20 hours at five V/cm in aluminum lactate .. urea
buffer, pH 3o3o Protein bands were stained with Amido Black
10 B in five percent acetic acid.
L Fractions from elution •volume of 66 ml to 90 ml 2o Fractions from elution volume of 90 ml to 108 ml 3. Fractions from elution volume of 108 ml to 123 ml 4. Fractions from elution volume of 123 ml to 156 ml 5. Fractions from elution volume of 156 ml to 180 ml

57
(-)
2 3 4 5

58
preparations were subjected to starch gel electrophoresis (see Figure
10, protein sample 4). Lowry protein assays on the fractions from a
Sephadex G ... 75 column showed that two-thirds of the protein placed on
the column was ~n the second peak. The same results were obtained when
a five mM Tris buffer, pH 7.4, was used as the eluant instead of 0.5 N
lactic acid.
Reversible aggregation of wheat protein- fractions has been reported
. by several investigators (72, 73~ 74). Therefore, the possibility of
some of the proteins in the first peak from the G~75 column being an
aggregate of the protein in the second peak was inv\?stigated. When the
material in the second peak from a a-75 column was re-chromatographed
on the same column, no protein, as llleasur_ed by the absorbance at 280 mu,
was observed in the elution volume corresponding to the first peak (Fig
ure 11). Thus, it appears that the isolated protein is not a monomer
unit of some of the larger proteins in the first peak. This is not con
clusive, however, since this experiment was not repeated at any higher
protein concentrations.
Test of Purity of the Isolated Protein by Electrophoresis
The isolated protein was subjected to electrophoresis in various
buffer systems of different pH and in both starch and polyacrylamide
gels as the supporting med:;.a. Figure 12 shows the results of these
experiments. ·The protein as revealed with aµy one of several protein
stains 3 generally migrated as a single band at pH 3~3 in both types of
support. As shown i.n gel 6, electrop):io:resis of greater amounts of ,the
preparation revealed a trailing shadow area behind the protein band
when the gel was stained by the sensitive dye, nigrosineo At pH 6.0,
the protein migrated very slowly toward the cathode, and a diffuse area

Figure 11. Chromatography and Rechromatography of the Isolated Protein on Sephadex G~75
· Fifteen mg of protein from the 0.28 M NaCl peak of a CMC
column were dissolved in 1.5 ml of 0.5 N iactic acid and eluted
from a Sephadex G .. } 5 column (2 x 71 cm). The second peak :f;rom
this fraction was freed of lact!c acid by dialysis and lyophilized.
The dried material was dissolved in 1.5 ml of 0.5 No lactic acid
.and chromatographed on the sa;me column. o, prote;i.n distribution
.in the eluate fractions after c;:hromatography of the CMC prepara ..
tion. I, protein distribution in the eluate fractions upon re-
chromatography of the second peak.

60
0.5 ,··"" --~-·
0.4
I I
I I I
0 0.3 I I 00
"' < I I I I I
I I
0.2 I
0.1
50 100 150 200
Elution Volume .(ml)

· Figure 12. Electrophoresis of the Isolated Protein in Starch Gel and Polyacrylamide Gel at Various pH 1 s
Gel 1. Electrophoresis in s~arch gel, pH 8.6, at five V/cm for 18 hours. Five hundred µg of protein were applied to the wick~ Protein bands were stained, with Amido Black 10 B.
Gel 2. Electrophoresis in polyacrylamide gel, pH 8,6, at five V/cm for 18 hours. Five hundred µg of protein were applied to the wick. Protein bands were stained with Amido Black 10 B.
Gel 3. Electrophoresis in polyacrylamide gel~ pH 5.9~, at four .V/cm for 14 hours. Seven hundred pg of protein were applied to the wick. Protein bands we.re stained with .Amido Black 10 B.
Gel 4. Electrophoresis in star~h gel, pH 3.3, at five V/cm for 17 hours •. Seven hundred µg of protein were applied to the wick. · Protein bands were stained with Amido- Black 10 B.
Gel 5. Electrophoresis in polyacrylamide gel, pH 3,3, at five V/cm for 21 hours. Three hundred pg of protein were applied to the wick. Protein bands were stained with Amido Black 10 B.
Gel 6. Electrophoresis in starch gel, .PH 3.3, at five V/cm for 14 hours. Seven hundred pg. of protein .were applied to the wick.· Protein bands were stained with Nigrodne.
The cathode end of the gels is to the left of the Figure. The qrigins are marked with.arrows.

62
2
3
+
5

63
appeared behind the lllain'component. At pH 8~6, three protein bands,
two faint and one heavy, were clearly seen in both starch gel and poly-
. acrylamide gel. The number of prote:i.n bands al)pearing at this pH were
the same regardleu of the protein i;tain employed. A picture of a
Ponceau S-stained gel was not included due to the difticult;.y of photo
graphing the red stain.
Scherr (75) demonstrated that the b:i.nding of .Ponceau S dye to each
of t;.he blood serum proteins produced a chromoprotein which obeyed Beer's
law over a wide range of protein concentrations. In this report, the
prote:i.n bands in blood serum subjected to electJ;"ophoredi; on cellulose
acetate strips were stained with Ponceau S dye and the relative amount
of each of the bands was determined. This technique was therefore ap
pl:i,ed to the isolated pJ:'otein as a means of estimating its purity,
Electrophoresi$ of the isolated protein fraction on cellulose acetate
strips at pH 8,6 revealed three protein bands when stained with Ponceau
Sas was found for starch and acrylamide gel at this pH. After each
band was sectioned from the strip and dissolved in a chloroform-ethanol
solvent, the absorbance of each solution was measured against an ap
prop:date blank. The percentage of each protein band was deteJ;"mined by
dividing its absorbance by the· sum of the absorba:nces of the three pro
teiq.bands. The absorbance of the dye .. protein comple~ of each band was
found to be a linear function of the amount of .sample applied to the
gel. · The heavy ban.d constituted 90 percent of the fraction, while the
slower migrating protein made up about two percent and the faster mi
grating component about eight percent of the fraction •
. Absorption Spectra
· The ultra.violet absorption spectra of the ;isolated protein

(Figure 13) was similar to.that of most proteins and exhibited an.ab-
sorption maximum at 2J8 mp. The extinction coef!icient of a one per=
lto cent solution of the protein, E278 , was 13.1. Based on nitrogen, the
mgN extinction coefficient, E278 , was 8.5. These results agree favorably
with the results of Jankiewicz and Pomeranz (28) who observed an ab=
sorption maximum at about 278 mp. for a pyrophosphate extract of flour.
The extinction coefficient for their extract, based on mg of nitrogen,
was approximately 8.8. The absorption spectra of the isolated p:rote.in
in 0.1 N NaOH indicated that there were tryptophan residues present in
the protein. The tyrosine to tryptophan ratio was 2.1 when calculated
64
from.the absorption spectra in base by the method of Goodwin.and Morton
(65) as described by Beaven and Holiday (66).
Physical Studies Employing Gel Filtration
Andrews (54) showed that the use of gel=filtration columns cali=
brated with globular proteins of known molecular weight provides a
reasonably accurate estimation of the molecular weight of other globular
proteins. Thi.s technique was therefQre employed to obtain a molecular
weight estimate for the isolated protein. Figure 14 shows a semi,,log
plot of the elution volume from Sephadex G-.75 versus the molecular
weight for eight protein standards and the isolated wheat.albumin pro-
tein. The isolated protein eluted in the same volume over a concentra-
tion range of one mg/ml to ten mg/ml in this system. A least squares
regression·line was fitted to the experimental points. The molecular
weight of the isolated protein calculated from the regression equation
was 19~300 ± 2000 at the 95 percent confidence level. Thi~ value falls
in the general range of reported molecular weights for the wheat flour
albumins [16,000 (31) to, 28~000 (8)}. It might be noted that the large

Figure 13. Ultraviolet Absorption Spectra of the Isolated Soluble Wheat Flour Protein
The protein (Oo622 mg per ml) was dissolved i.n five mM lactic

Q)
u i::
0.7
0.6
0.5
], 0.4 H 0 Ill
,.0
<
0.3
0.2
0 .. 1
2400 2600 2800
Wavelength (1)
66
.• 3000

Figure 14. Molecul~r Weight Estimation of the Isolated Protein by . the Gel Filtratio~ Technique
Semi~log plot of elution volume versus molecular weight for
seven proteins of known molecular.weight. The molecular weight
of the isolated protein extrapolated from its elution volume
(96.5 ml) was 19,,300.

-..... 13 -· I .-I 0 > i:::
llO
.100
90
-~ 80 .l,J
.··. ::, ·@
70
=. 60 Vo 10,000
• c,c-Lactalbumin
Cytochrome c. Dimer •
.20,000
Molecular Weight
30,000 40,000 50,000
°' 00

deviation of oeqlactalbumin from the standard curve may be due to an
error in its assumed molecular wei&ht. R.ecent evidence2 indicates a
molecular weight of 12~500. to 13,000 for bovine milk «:-lactalbumin
rather than 15,500 which was the value used in this experiment.
69
A relationship between the gel filtration behavior of proteins and
their equiyalent hydrodynamic radii, r, has been demonstrated by Laurent
and Killander (76) and Ackers (77) in their theoretical treatments of
the gel filtration process. Since the Stokes-Einstein law for the free
diffusion of spherical particles of radius, r, and the diffusion coef~
fici~nt, D, are inversely related, a useful correlation between the
elution volume (or Kd) and the diffusion coefficient, D, was shown to
exist. Although there is considerable uncertainty in many of the dif-
fusion coefficients, and free diffusion coefficients are not strictly
applicable to restricted diffusion through porous gels, a reasonable
estimation of the diffusion coefficient may be obtained from gel fil-
trat ion data ( 7 8). . As shown in Figure 15, a linear re lat ion was ob-
tained when the elution volumes of the standard proteins employed in
this experiment were plotted versus the reciprocal of the diffusion co-
efficients. A straight line was fitted to the exper;i.mental points by
the method of least squares. The diffusion coefficient of the isolated
protein calculated from the regression equation at the 95 percent con-
-7 2 fidence level was 10.47 ± .09 x 10 cm /sec.
Analytical Ultracentrifuge Analysis
The sedimentation properties of the isolated protein were analyzed
in a Beckman Model E ultracentrifuge. The isolated protein sedimented
2 · Dra K. E. Ebner, personal communication.

Figure 15. Estimation of.the Diffusion Coefficient of the Isolated Protein by the Gel Filtration Technique
The elution volume versus the recfprocal of the diffusion ccief-
fic:i;ent for five standard proteins, The diffusion coefficient of
the isolated J?rotein extrapolated from it!? elution volume (96.5 ml)
was 10947 x 10·7 cmi/sec.

....... ,....., fl '-'
Q) s ,-I
0 > s::
100
90
-~ 80 ,I.I ;I ,.....,
r:c:I
70
Cytochr_ome
o(-Chymotrypsinogen
V = 60...__~~~~--~~~~~--~~~~ .......... ~~~~~~~~~~--~~~~~--~~~~~..._~~~~_. .0 0.7 0.8 0.9 1.0 1.1 1.2 1.3
1 DX 10-6 ( sec) cm2
·-..J I-'

as a single symmetrical peak in 0,1 M NaCl as shown in Figure 16. The
dependence of the sedimentation coefficient (s20 ,w) upon protein con
centration is shown in Figure 17. A sedimentation coefficient of 2.45
was obtained by extrapolation of the data to. infinite dilution •. The
increase in the sedim,entation coefficient with increasing protein con-
centration is not the typical behavior of most proteins •. Schachman
(,79), howevel!', has reported that associating-dissociating single
COlllponent systems involving.rap:i.dly attained equilibria exhibit this
phenomenon. A single, almost symmetrical botJndry is usually observed,
and S increases with concentrat:i,.on in dilute solutions. The increase
72
in S with concentrationin dilute solutions is presumed to be the result
of a shift in the equilibrium toward the higher aggregates as the con
centration increases. Several other wheat protein preparations have
been shown to exhibit the same behavior (29, 72, 73).
A molecular weight of 20,400 for the isolated protein was calcu
lated from the sedimentation coefficient, the diffusion coefficient,
and the p~rtial specific volume (calculated.from the.amino acid composi
tion). Thh value :i,.s in reasonable agreement with the molecular weight
estimated by gel filtration.
Amino Acid Analysis
The raw data for the amino.acid analyses of the isolated protein
,after different. periods of hydrolysis are shown in Table I. · Literature
values for amino acid compositions of wheat proteins have been expressed
in several different units •. Therefore, the amino acid ~alues found in
this investigation were expressed in four different ways to.facilitate
comparison with the literature.· These calculated results are presented
in.Table II. _Also included in this table are '\l'alues for half-cystine

Figure 16. Schlieren Pattern of the lsolated Protein
The sedimentation pattern of the isolated protein at a con~
centration of 6,5 mg/ml in 0,1 M NaCl, pH 6.95, in a synthetic
boundary cell. Photographs were taken at the time indicated after
the full rotor speed of 59,780 r.p.m. was attained, The tempera
ture was 20° C, and the phase plate angle was 70°. Sedimentation
:i.s from right to left,

60 45 30
Time in Minutes
15 0
" .p-

Figure 17. Effect of Concentration on the Sedimentation Coefficient (s20 ,w) of the lsoiated Protein

\
\ \ \
\ \ \
0 00 '° ·o . . C'"l N N
pas) not x "1'0Z s
..;:f" N . • N N.
0 •
0 ,-!
0 .
0 . co
0 .
0
'°
0 . LI")
0 . ..;:I"
0 . M
0 . N
0 . ,-!
76
-,...; ~ gfl ._,
i:: 0
•r-l .µ Ill :.4 .µ i:: Q) (.) i::
8 i::
•r-l Q) .µ 0 :.4
P-t

77
TABLE I
AMINO ACID RECOVERIES AFTER ACID HYDROLYSIS 1
12 Hour 24 Hour 48· Hour 72 Hour Amino Hydrolysis Hyc;lrolysis · Hydrolysis Hydrolyi:;is Acid (1) (1) (2) (3) (1) (1) (2)
Lys 16,61 18.78 .. 22.40 21.47 20;81 20.74 21.18 His 8.31 9.39 11.60 10.69 10.30 10.37 11.30 NH 72 .672 71.99 94.08 99,28 95.07 91.85 123.23 3 Arg 35.30 42.25 46.30 42.75 44.12 42.96 42.36 Asp 37.38 42,25 44.80 42.75 44.12 42.96 40.44 Thr 16.61 u.91 19.41 16.79 18.01 16.30 15.40 Ser 37.38 39.13 43.31 38.n 36,74 34.07 32.74 Glu 68.52 75.U 66.62 76.33 80.24 81.48 77 .02 Pro 49.83 51.65 . 56. 75 53.43 55.01 57.78 53.92 Gly 53.99 59.47 68.69 61,07 62.86 63.72 · 6.1.62 Ala 83,06 89.20 104.54. 99.24 97.72 93.33 96.28 (Cys .. ) 41.53 51.65 53.76 48.85 48.62 45.93 46 .21 Val 43.60 53 .21 . 58.24 50,38 57.63 60,74 51.99 Met 14.53 . 18.78 19.41 16~79 18.,58 17.79 15.40 Ile 12.46 17.21 i? .• 92 . 16.79 17.39 17.79 17.33 Leu 49,83 54.77 62.72 5.4. 96 58.56 57.78 55.92 Tyr 24.92 28.17 29.86 27.48 28,76 28,15 26.96 J;"he 10,38 10,95 13.44 12,21 12.89 11.85 11.65
1valuE1s are given as niiUimoles ami.noacid per 100 g protein.,.
2shoulder on a.mm6ni~ Peak.

78
TABLE II
AMINO ACID COMPOSITION.OF THE ISOLATED WHEAT FLOUR PROTEIN
Amino mmoles g . a.a. N as Residues! (
Acid 100 g Pro. 100 a :J?ro • % Totai N Molecule . ·I I
Lys 20.89 J.06 4.29 4 llis2 10.60 L64 ·3,26 2 NH 48.29 0.82 4.96 9 ' '3 Arg 43.,45 7.56 . 17 .80 8
. Asp3 . 43. 45 5 •. 78 4,45 8 . Thr.'.3 21..50 .2,.74 •2.36 4 Ser ·42.00 4,41 4.31 8 Glu 79.46 11.76 8.20 15 Pro 54.90 6.32 5.63 10 Gly 63.24 4. 74 6.49 12 Ala 96.71 8.61 9.91 18 (Cys-) 3 . 53 .• 50 6 .• 54 . 5.49 10
.as ~so3H 51. 70 6.21 . Val 5,5.36 6.97 6.11 11 Met 17.79 2. 72 1.87 3 (or ·4) Ile 17 .40 .2.31 1.81 3 Leu 57.56 7.56 5 .• 91 11 Tyr4 28.23 5.20 2.95 6 Tyr4 . 32. 40 . 5.87 Trp5 15.30 . 3.12 2.96 3 Trp 14.40 . 2.94 Phe 12.10 . 2.00 1.24 2 (or 3)
1Auumed molecu,lar weight of 19,300.
2 ' Cys, Thr, .· and Ser at 24 hour, · Adjusted for loss of Trp, see
Materials and Methods.
3 Extrapolated value.
4FromUV.analysis.
5 From Tyr/l'rp = 2.1.

79
determined as cysteic ac:i,d and for tyrosine determined by ultraviolet
spec;:tral analysh in conjunction with the t;ryptophan determination.
Microkjeldahl analysis of the isolated protein showed it to con-
tain 15.5 percent nitrogen,
The apparent specific volume of the isolated protein was estimated
from its amino acid composition by the method outl;i.ned by McMeekin and
Marshall (80). The apparent specific volumes of the amino acids were
those reported by Cohn and Edsall (81). To take into account the am-
monia present as amide groups, it was assumed that these were equally
distributed between the glutam:i.c and aspartic residues. The partial
3 ' specific volume calculated in this manner was 0,727 ctXi, /g.
The minimal molecular weight of the isolated protein was calculated
from its am:i.no acid composition assuming one mole of histidine per mole
of protein. This gave a value of 9,550. If two histidines were present
per molecule of protein, the molecular weight would then be about 19,100.
This is in reasonable agreement with the values estimated from the sedi-
mentation coefficient and by gel filtration.
ln order to illtistrate the similarity of the isolated protein to
other soluble flour protein preparations, the amino acid composition of
several soluble flour protein preparations, together with a gliadin
preparation are shown in Table Ill, 'l;'he fraction described by Nimmo
il tl• (22) was from a water extract of flour fractionated on DEAE-
cellulose while that .of Coates and Simmonds (20) was from a dilute pyro-
phosphate buffer extract chromatogrciphecl on. DEAE. The water solubles
preparation used byWoych:i.k et!.!.• ~32) was obtained by fractionation
on CMC. Waggle and co-workers (48) obtained their preparation by
chromatography of a phosphate buffer extract of flour on Sephadex G-100.

Amino Acid
Lys His NH Ari Asp Thr Ser Glu Pro Gly Ala (Cys-) Val Met Ile
· Leu Tyr Trp Phe
TABLE III
AMINO ACID COMPOSITION 0F"80LUBLE 11 FRACTIONS AND GAMMA GLIADIN FROM WHEAT FLOUR1
Ninnno . et ~o (22)
Fract. 5
5o2 4. 7 7.3
16.0 4.5 2.0 3.7 8.7 5.3 5.8 7.0 3.9 5 .• 2 1.3 1.6
. 4.9 2.3 2.9 1.1
Woychik Coates & Waggle Kelley Woychik et.al. (32) Simmonds (20) . et ~o (48) (29) et al. (32)
H20 Solubles Peaks D+E Fracto 6 Globulin 7!-Gliadin
4.6 5.6
. 17 .o . 11.4
3.8 2.7 3.9
11.7 5.7 4.4 4.2 7.0 4.1 1.1 3.0 4.8
. 1.5 2 .• 2 1.2
6.4 6.2
10. 7 ·18.6
6.4 3.0
. 4.5 12.5
6.8 6.2
5.4
2.9 . 6.3 2.6
1.8
4.4 2.8
16.8 .. 9.2
4.3 2.3 4. l
18.2 9.8
. 5 .1 4.5 4.0 4.3 0.8 2.0 4.1 1.6
2.0
3.2 3-. 6
11.8 18.l 5.1 4.1 4.4 8.9
. 8.5 5.6 3.7 3.3 4.3 1.7 2.6 6.4 2.9
. 1. 7
0.8 2.7
26.4 3.4 1.2 1.5 3.1
25.5 12.7 2.2 2.1 3.1 2.7 0.7 2.8 4.2 0 .. 8 0.4 J. 5
1composition expressed as amino acid N as percentage of the total amino acid N.
00 0

81
Kelley 1 s globulin (29) was prepared by fractio~al precipitation.in phos
phate buffer and chromatography on DEAE-cellulose. The gamma gliadin
preparation was obtained by the fractio~ation of gluten on CMC. A com
parison of the·~alues for the protein isolated in this investigation
(Table Ill) column 3) with the values in Table III reveals the similarity
between this protein and other soluble protein preparations. All of
these preP,arations differ considerably from the 7'-gliadiu. composition •
. An ;Lnteresting similarity is noted between the amino acid composi~
tion of the isolated protein and fraction 5 of Nimmo et.al. The major
protein.component in their fraction migrated slowly toward the cathode
in cacodylate buffer, pH 6, when subjected to electrophoresis in poly
acrylamide gel. This was similar to the behavior of the isolated pro
tein under the same conditions (see Figure lZ).
Spectrophotometric Determination of Free Sulfhydryl Groups
The spectrophotometric procedure for free sulfhydryl groups (6,7)
takes advantage of the shift in the absorption maximum of p-chloro
mercuribenzoate when it reacts with sulfhydryl groups to form a mer
captide. The isolated protein was assayed for free sulfhydryl content
by this method with egg albumin being assayed at the same time as a
check for the procedure. In buffer, the assay showed egg albumin to
contain 1.9 moles of -SH per mole of protein while in buffer containing
0.6 percent sodium lauryl sulfate, it gave a value of 3.8.-SH groups
per mole of protein. The number of free sulfhydryls reported in I'!,ative
egg albumin is two or three, whereas four moles of -SH per mole of pro
tein .are observed when the·. assay is carried out in the presence of a
denaturing agent such.as detergent or u!ea (67). The isolated protein
exhibited only 0.1 moles of sulfhydryl per mole of protein b9th in the

82
presence and absence of the detergent. These data indicate the absence
of free sulfhydryl groups in the isolated protein.and are compatible
with the amino acid data showing ten moles· of half .. cystine (equivalent
to five disulfide bonds) per mole of protein.
N~terminal Amino Acid Determination
The determination of the N-terminal amino acid of the isolated
protein utilized the procedure for the preparation of the Dnp-derivative
of the N-terminal amino acid as outlined by Fraenkel-Conrat (68). Seven
mg of protein were reacted with l-fluoro-2,4-dinitrobenzene. The re
sulting Dnp-protein was hydrolyzed in six N HCl and the hydrolysate
extracted with ether. The ether phase components were separated by two
dimensional paper chromatography. Four yellow-colored areas were
visible on the developed chromatogram. These four spots were present
whether the Dnp-protein was hydrolyzed four hours or si;xteen hours at
100° c. Exposure of the largest spot to HCl gas resulted in its dis
appearance indicating that it was 2,4-dinitrophenol, a reaction by
product. Two of the remaining spots were tentatively identified by
their location on the chromatogram relative to the dinitrophenol spot.
They were 2,4-dinitroaniline, also a reaction by-product, and Dnp
serine. The Rf of the suspected Dnp-serine spot was identical to that
of authentic Dnp-se.rine when the two samples were chromatographed side
by side. The free amino acid, serine, could not be regenerated since
base hydrolysis of the Dnp-deriyative destroys serine. The fourth
spot was as intense as the Dnp-serine spot and was located in an area
on the chromatogram corresponding to. the degradation products of Dnp
proline. Since Scanes (82) has shown that Dnp-proline is very rapidly
destroyed upon acid hydrolysis,. shorter hydrolysis times would not add

83
further information.
Because Dnp-histidine, Dnp-arginine, and Dnp-cysteic acid are
soluble in the aqueous phase of the hydrolysate, the aqueous phase was
chromatographed in.a different solvent system. Only one yellow spot was
observedi>.and its Rf suggested it to be either e .. onp .. lysine or Dnp ..
. arginine. Upon spraying the chromatogram with ninhydrin, the yellow
spot turned brown; this indicated the spot ~as €-Dnp-lysine. This fact
was further substantiated by spraying a similar chromatogram with
Sakaguchi's reagent~ The spot remained yellow; by comparison, authentic
Dnp .. arginine turned orange and €-Dnp-lysine remained yellow (83).
Results from the fluorodinitrobenzene procedure indicated that
serine and perhaps praline were present in the protein as N-terminal
amino acids. Because.acid hyd!olysis of the Dnp-protein destroys Dnp
proline., the phenylisothiocyanate method was employed for the N-terminal
amino acid determination. The PTH-derivative of the N-terminal amino
acid of egg white lysozymewas determined simultaneously to check the
procedures. The isolated protein was precipitated with five percent
trichloroacetic acid before treatment with the phenylisothiocyanate to
remove any. small amino-containing compounds. After reaction, cycliza
tion, and.extraction., the only, PTH-.derivative isolated from the sol.uble
wheat proteinwas PTH-serine. In.agreement with the known data for
lysozyme,· PTH-lysine was the only deri\rative obtained. The unknown
derivatives were compared with synthesized standards by one dimensional
chromatography in two different solvent systems (77) •. A second treat
ment of the isolated protein with phenylisothiocyanate released a single
PTH-amino acid deri~ative whiehhad an absorption spectra and a chroma
tography Rf value similar to 1iterature values for.PTH-glycine. This

84
derivative was not compared with.a standard,.and its identification is
only tentative. Neither the PTH-amino acids nor the Dnp-amino acids
were quantitated.
A possible expla,:iationfor the extraneous spots in the Dnp-prepara ..
tion is the presence of contaminating amines in the protein preparation.
These ~ay ~ave contaminated the protein during dialysis of the protein
,against steam condensate .. distilled water. This possibility was not
.checked by precipitation of the protein before treatment with the 1-
c~Terminal Amino Acid Determination
Efforts to. determine the C-terminal.amino ;;lcid of the isolated
protein employed the method of enzymatic C-termirid grc;>up a*alysis ., by
carboxypeptidase A (70). Lysozyme was also subjected to the procedure
.as a check. The substrate was denatured before incubation with carboxy-
peptidase.A, thus minimizing the possibility that the C-terminal residue
would be inaccessible to.the enzyme due to the native configuration.of
the protein substrate. The C-terminal amino acid of the isolAted prp-
tein was not susceptible to.hydrolysis by carboxypeptidase a at molar
ratios of enzyme to protein.as great as one toi;ifteen and incubation
peri.ods up. to eight hours at 25° C, pH. a. On the other hand, the C-
terminal amino. ac.id of lysozyme, leucine,. was released after two hours . '
of incubation.at a molar ratio of enzyme to substrate of 1:50 under the
same conditions of temperature and pH.
lhe resistance of the C-terminal amino.acid to,at~ack by carboxy-
peptidase A under the conditions mentioned above may offer a clue to
.the chemical nature of this amino acid. ~eurath (84)·has stated that
carboxypeptidase A is inactive toward protein substrates in three cases:

85
when the carboxyl group of the C-terminal amino acid.is s~bstituted,
when .the C-terminal. amino acid is lysine or arginine, and when proline
(or hydroxyproline) is the C-termina,l or penultimate amino acid. The
J>Ossi.bility that the C-terminal amino acid of the isolated protein may
fall into one of the categories mentioned above suggests that the next
approach for determination of the C-terminal amino.acid be either treat
ment of the protein with carboxypeptidase B, which is specific for C"
terminal arginine or lysine, or a chemical determination such as hydra
zinolysis.
- Reduction and Alkyl~tion of Disulfide Bonds
Changes in.the elution pattern fromSephadex 0-75 and the electro
phoretic pattern in.starch gel were studied after reduction.and alkyla
tion of the disulfide bonds of the isolated protein. Figure 18 A shows
the G-.75 elution pattern of the native and reduced protein, while Fig
ure 18 B shows the starch gel electrophoresis pattern of each. It is
apparent that the native protein was eluted from the column.as a single
symmetrical peal<~ whereas the reduced and alkylated protein was eluted
in.a broadll unsymmetrical peak. The results suggest an array of ran
domly coiled configurations for the reduced protein polypeptide chain
,as opposed to a more ordered, globular structure in the native protein.
When lysozyme, a single polypeptide chain with five intramolecular di
s~lfide bonds, was subjected to the same treatment, an elution pattern
similar to. that for the reduced and alkylated isolated protein was ob
ti!!ined.
The reduced and alkylated protein migrated essentially as one band
in starch gel and exhibited about -70 percent of the mobility of the
native protein. Two explanations may be offered for the presence of

Figure 18. Gel Filtration and Starch Gel Electrophoresis of the Isolated Protein After Reduction and Alkylation of the Disulfide Bonds
A. Chromatography on a Sephadex G-75 column (1.3 x 100 cm)
of the isotated protein before and after reduction. O, five mg of
protein treated with five M guanidine hydrochloride. I, five mg
of protein after reduction and alkylation of the disulfide bonds.
B, Starch gel electrophoresis for 14 hours at five V/cm in
aluminum lactate-urea buffer, pH 3.3. Protein bands were stained
with Amido Black 10 B, The cathode end was toward the left of
the gel.
1. Native protein 2. Protein after reduction and alkylation of disulfide bonds

87
A
Q3
@ (\J 0.2
<!
0.1
15 45 75 105 ELUTIQ\J VOLUME (ml)
B
(- )
1

88
about eight minor bands in the reduced and alkylated protein prepara
tion: (1) reduction.and/or al~ylation Qf all ten cysteine residues in
volved in the disulfide bonds may not have been complete, thus leaving
five different protein species, each with different degrees of unfolding;
(2) some of the free am:i,no groups in the protein may have been.alkylated
by the iodcacetamide., thereby changing the net positive charge on the
protein at low pH.· It·~as been shown that a histidine residue of ribo
nuclease is attacked by some so-called sulfhydryl reagents such as
iodoacetate and bromoacetate (8S). Although the nitrogens in the~~
amino group of lysine and the guanido group of arginine are in an
electron environment different from the nitrogens in the imidazole ring
.of histidine, it may be possible that certain of these amino groups
would be in.an environment within the protein molecule which would
permit alkylation.
General Discussion and Conclusions
The wheat protein isolated in this investigation appears to belong
to the class of wheat flour albumins by v:i,rtue of its solubility,
molecular weight, and starch gel electrophoretic properties. Several
of the chemical. and physical properties of this protein have been
established, but other work of this~nature will be required to complete
its characte.ri,zation, Future physical property stud:(.es should include
a determination of the isoelectric point, and the evaluation of the
optical. rotatory dispersion properties of this protein. The determina
tion of the C-terminal amino.acid and fingerprinting after treatment
with proteolytic enz~es are two additional chemical characterization
studies which should be included.
The next avenue of investigation on. this protein is the investiga-

89
tion of its biological role in the wheat kernel. The role generally
ascribed to the soluble wheat proteins is enzymatic in nature. It is
believed that a~ some time during.kernel development some of the soluble
proteins serve.as en.zymes, or subunits of enzymes, involved in the syn ..
thesis of cell constituents. Others are hydrolytic enzymes such as
proteinases, lipases, or amylases, which degrade the seed storage com
ponents to furnish metabolites ta the embryo of the germi~ating.seed.
If the biological role of the protein isolated in this investigation
· is that of an enzymes the discovery of th;i.s fact may.come from.a direct,
systeID.$tic screening of possible enzymatic activities. Or, incidental
to these :i,solation.and ch~racteJ;"ization.studies, an enzyme (or its sub ..
unit) which may be purified from wheat flour in the future may be shown
to have chemical.and physical·properties corresponding to. those of the
protein isolated in this study.
The fact that the isolated protein appears to be the most abundant
protein in a water extract of hard red winter wheat flour suggests that
it might play a role in the structure of some of the gluten constituents.
Preliminary evidence from.starch gel electrophoresis of reduced glutenin
protei'QS reported by Woychik (86) indicated that some 9f the water solu
ble proteins :may be incorporated into the glutenin structure. This
pooibility. might. be a11swered by the· isolation of these. albumin-like
proteins from reduced glutenin and comparison of their properties with
those of the protein :i,solated in this study.
Although subsequent, perhaps, to the determination of its bio
·log:i,.cal role, a study of the distribution of the isolated protein in
:.the kernel components, it). the ~arious botanical groups of wheat,. and
in the other cereal grains may.add further insight. into.some of the

90
relationships among these groups.
The present work has resulted in the isolation.and partial charac
terization of one of the components of. the water soluble flour proteins.
The biological role of this protein and of other water soluble components
i.s yet to be established. Only after other soluble flour pJ;"otein.s and
gluten proteins have been isolated and characterized, will there emerge
a clearer perspective of their relationships to. one another and of their
contributions to the properties of wheat flour and dough.

CHAPTER IV
THE MOLECULAR WEIG~T DISTRIBUTION OF LACTIC ACID
EXTRACTABLE PROTEINS FROM MATURING WHEAT
· Experimental Procedure
Endosperm Samples
Two ~arieties of ttard Red Winter wheat, Triumph and Kaw, were used
in this experiment. Samples of Kaw were collected 8, 11, 25, and 35
(mature) days after h~ading. Triumph. samples were collected 11, · 13,
21, 2~, and 38 (mature) days after heading.· Flowering ~ates for these
. samples would be one to.two days later.
The two.most. immature samples from each variety were collected by
removing.the heads in the field and immediately placing.them in dry ice.
The samples were stored at -20° C until the endosperm was isolated.
The endosperm ~as collected by excising the germ with a razor blade and
squeezing the endosperm out of the. testa. Endosperms were lyophilized
and then ground in a Wiley mill to pass through. a ff: 30 screen. The
ground samples were stored at -20° C.
The mpre .mature sample heads were threshed by hand, and the grain
was allowed to. d:ry at room temperature under .. a stream of air. · These
samples were then.milled on a micromill designed by the Departments of
Biochemistry and Agriculture Engineering (87). Flour samples were
. stored at •2.0° C.
Samples for gel. filtration experiments were prepared by. stirring I
91

one g of finely ground, dry endosperm with six ml of 0.5 N lactic, acid
for 16 hours at 4° c. The suspension was then centrifuged at 95,000 x g
for 30 minutes in a Spinco Model L preparative ultracentrifuge. An,ali
quot of the supernatant solution equal to a given amount of protein for
each variety,was,made up,to two ml and placed on the column. Protein
in the supernatants was determined by, the Biuret method (60), by a
microkjeldahl procedure, or by the method of Lowry et al. (61). The
protein remaining in the residue was assayed by macrokjeldahl analysis
or by a modified Biuret procedure for flours (88).
Gel Filtration Columns
Sepl:!,adex G-200 equilibrated in 0.5 N. lactic acid was used as the
gel filtr.ation medium for all experiments. Column dimensions were 2 cm
x 72 cm. Conditions were kept as uniform as possible for each series
of samples of a given yariety. The columns were calibrated withthe
following proteins: Catalase (Worthington Biocqemical Corporation,
Freehold, N. J.), Bovine Serum Albumin (Mann Research Laboratories,
Inc., New York), Ovalbumin (Sigma Chemical Co., St. Louis, Mo.), and
lysozyme (Nutritional BiochemicaLs Corporation, Cleveland, Ohio).
Fractions from the columns were.analyzed by one or more of the
methods previously described and will be disct1ssec;l in more detail in
the results. The protein recovery from the columns was 93 ± six per
cent as estimated by Lowry protein assays.
Isolation.of the Free.Amino Acids
The free.amino,acids were isolated by a method similar to,that
described by Jennings anc;l Morton (46). Two grams of endosperm.were
extracted.in ten ml of deionized water for 30.minutes with stirring.
The mixture was then centrifuged at 10,000 x g for ,30 minutes. The

93
supernatant solution was saved.and the precipitate re-extracted twice
in the same manner. The pooled supernatant solutions were dialyzed
against seven volumes of deionized water,.·. The dialysis water was
changed every.six.hours over .a period of.18. hours. The three dialysates
were pooled (about 450 ml total) and lyophili2;ed. The dialyzable ma-
terials thus obtained were dissolved in citrate· buffer, filtered through
,a frittedglass filter, and assayed by>a quantitative ninhydrin.pro
cedure (89) •. Aliqvots were ar,.alyzed for amino acids on a Beckn!an· model
120 C automatic .amino.ac:l,d analyzer using the analysis system for
physiological.samples. Recovery of ninh.ydrin positive material from
the columns was 95 + five pei-cent. . -·
Results and Piseussion
. Pr.otein Extraction
Due to. the .different solubility characteristics of the· ~arious
flour protei~s, a preliminary study was undertaken to find a solvent
system most suitable for extraction of the proteins from the endosperm
. samples, Many.· solvent systems }).ave been employed by different workers
for the extX"action.of Uour proteins 1 but the system-of Meredith.and
Wren. (31) appeared to give superi.or yields. · The solvent which they
employed was three M urea and 0.01 M ce.tyltrimethylammonium bromide in
·. 0.1 N acetic acid. This solvent system, which.they termed AUC, ex-
tracted about 95 percent of the total flour proteins under the c.ondi-
tions employed in.their studies.
· Since it. was desirable· to. solubilize as much of tlte. endosperm
protein as possible, the AUC systezn,as well as several other solvents
were examined for com.P,arative purpc;,ses~ These preliminary experiments

94
·were carried.out on a composite flour niade up-of several hard red winter
wheat V,arieties. Six.ml of solvent and one g: of flour were. stirred in
the cold over night and centrifuged at 90,000 x g_for 30.minutes. The
supernatant yolumes were measured and biuret protein determi17,atior:,.s
were niade on aliquots of the supernatants. The percent of the-total
flour proteins extr.acted by each solvent is shown ,in Table IV.
TABLE IV
EXT:aACTION.OF FLOUR PROTEINS BY\TARlOl,JS SOLVENTS
Solvent Percent ef Total Flour Prot~in Extracted
AUC
. LUCl
.. o~s N ~actic _acid
8.. mM aluminum lactate buffer, pH 3·.3
,Q.l N acetic acid
76
72
63
60
51
1o.5 N. lactic _acid.+ three M urea+ O.Ol M cetyltrimethylanunonium
. br.omide.
The AUC_and LUC_syste111s gave the best extractions, and they were
next.tried as eluants for the gel filtrat:iop. columns.· Both-solvent
syste111s gave similar results when usedtoextract·the flour protei~s
and: as eluant for a Sepll.adex G-200 column. Three prote.in- peaks, as
indicated by:-the absorQance at -.280. Ilfl, were obtained. The result:s were
comparable to;those obtained by- Meredith:and Wren(31) who used.the A.UC
solvent. '.I'he fract·ions from. each. peak were pooled, dialyzed, lyophil
ized, anc,l. the .dried material was eJC:a,mined by starch g«;!l electrophoresis

.q
at pH 3 .• 3. The electrophoresis patterns of ,all three protein peaks
. were cq.aracterized. by heavily strea~ed. areas showing only :a few very
·~aint bands. The presence of precipitated pr-0teins loias suggested.by
95
: heavily. .impacted areas. at the sample origins of the gels. Tht,ts, it. was
decidedthat the.AUC.and LUC systems were utiutisfactory.solvent sys-
tems for this investigation, since starch.gel electrophoresiJS "7as to
:be used fpr .a q!Jalitat;ive eyal~ation. of the proteins found in the
fracti.ons of .. different molecular. weight. Because its extracting cap ...
abilities were the next best, 0.5 N .. iactic .acid l\l'as tried as the pro-
tein. extracting .solvent and column elt,1,an; ... Three protein. peaks were
.observed when 1a 0.5 N.~actic .acid extract was chrom,atographed on 0-200.
Starch.gel electrophoresis patterns of the protein-peaks were very . , ...
, satisfactory .and. showed tq.at. each. 'jieak .contained a different group. of
proteiD:s• .Therefore, 0.5 N)actic ac.id wa$ employed in,the subsequent
studies on the maturing·wbeat endosperm;as both the ext,;acting_and the
eluting.solvent.
Extr.acts of the four Kaw. samples and five· Triumph samples were
prepared ~sing lactic_.acid. as described .above. Table V shows the prp-
tein.c-ontents of the·yarious en,dqsperm,samples, the.amount of nitrogenoµs
Illateri,als extr_acted into the Q.5 N. iactic _ acid solvent,. and the amount
of nitrogenous tnaterfals left-· in the res.idue. Column 1 shows tl;lat the
nitrogen .ccmtent of the various end9sperm _samples ;Ls of -the same magni-
tude, but direct comparfsoz:,.s are not. feasible .. since ,the two .most im-
. ~ture. samples from .. each· ~ariety, were prepared by. squeezing. the kernel
while the other.samples were milled. Coluµu;is 2 .and 3 or 6.and7_sug-
gest.th;at the ;Lmmature.samples cont:,ained a iarger percentage of non-
protein.nitragen than did the more mature samples. This is shown by

. TABLE V
EXTRACTION OF PROTEIN FROM KAW AND TRIUMPH ENDOSPE&M SAMPLES
mg. Endosperm· Protein mg Extract Protein1 mg. Residue Protein.1 %· Protein· Extracted g Flour · g Fl~our g Flour
.. ·.· ·- (1) . (2) (3) (-4) (5) 2 (6) (7) Sampl.~.,-. Kjeldahl;: Biuret ··· Kjeldahl Kjeldahl Biuret Biur~t ~~eldahl
Kaw, 8 days afterheading 116.5 45.0 66.4 51.3 46.5 38.6 57.0 . Kaw, 11 days after heading . 121.0 62.5 78.4 . · 40.9 . 51. 7 64.8 Kaw,. 25 days after heading . 108.1 67.2 90.6 . 21.0 62.2 83.8 Kaw, IIJ.ature 111.0 · 72"'3 77.2 35.0 . 33.3 65.1 69.2
Triumph, 11 days after heading 121.25 63.0 . 80.1 39.9 52.0 . 66. l
Triumph, -13. days after heading 115.1 64.0 81.2 37.6 55.6 70.5
Triumph, 21 days after·heading · 108. 9 · 66.5 88.1 23.1 61.1 80,,9
Triumph, 28 days after·heading 113.4 .79.5· 89.8 23.7 .. 70.1 79, .• 2
Triumph, mature 122.5 . 85.0 . 96.9 27·. l 69.4 •·.·79. l
-1 .From one g flour extracted with.six ml of 0.5 N lactic.acid.
2Biuret auay modified for flour-by Jennings (88).
'° ~

97
_ the greater discre1;>ancies between the b:l.uret assay of exti::.aeted pro ..
teins_ and the Kjeldahl. assay:of e)ctracted- nitrogen-containing compounds.
Column .4 indicates t~at ce-1'1~ainly .not .all of ,the nitrogenous ~ter~al is
extracted, while· column: 5_ shows tl:lat this material in._the residue is ,in-
deed p.ratein. · In: fact, the immature sample appeared to b.ave more non ..
extractable protein,than,t.he in:ature sample. ·These data .limit the
. quantitative interpretatioQ.s tq.at can be derived from the gel filtra-., . . ,,,
· tion. experiments and. will be disc1.1ssed in greater detail, in ,conjunction
,withthc;,se experiments.
Gel FiltrationStudies
For. each ,y,ariety, the elution patterns of the prateins from ,samples
at.various s;ages c;,f ~turity.,were compared on the same G-200 column.
The two columi:is ~sedwere calibrated with.five proteins af known molecµ
lar we:i,gh;s so. that .t.he molec:U:lar weights of the protein: fractions could
be estimated. OupUcate column runs were.made on each.sample of both
~arieties. The. amouq.t of protein placed.Qn the column·was the same for
each_ sample of a v:ariety. Thh w.as accomplhhed by, diluting :an aliquot
af each_ sample to. the, 1Jame :r;>rotein concentration. (by the l3iuret _ assay)
. as that of the m.9st dilute_ sample. For both, Kaw .and Tr.iumph, the most
:lII!lllature, sample yielded the exq:act of lowest pt"otein concentration.
Two mHliliters of extract were applied to the column; -this represented
19, mg of protein,for the ~w samples and.25 mg:of protein-for the
l'-riumph. samples. The el:ttiate w.as collected. in three ml fract:i.ons, and
.the al;>sorb.ance of ~ach:fraction,w.as determined.at ·280 and.260.mp. Fig-
ure 19. shows the elution patter~s Qf the four Kaw samples,.and F:i,gure
.20_shows the elution,I?atterns of the five Triumph samples •. The mater:i;.al
in the first peak ,was eluted. in the column- void volume. -· The po~s-ib-il.ity

. Figure 19. Gel Filtration. on Sephadex 9-200 of Kaw Endosperm: Proteins
Two ml of a 0.5 N ~actic. aci.d extract t4at con~ail).ed 19. mg of
protein.were placed.on a .1.85 x.71.5 cm.column of Sep}:i.adex G-200.
The sample was eluted.with 0.5 N.lactic.acid. (---),.absorbance
at 280 Il91• (-----), atisorbance at.260.~ •
. A. Kaw sample collecteg. May ll, 1965, eight days after· heading~
The elution volume of the ~ast peak was 201 ml,. A260 .= 1.70, A280 .=.
O .-6,40.
B. Kaw sample collected May 14, 1965, 11 days after: heading.
· The eluti·on :volume of the last peak was 201 ml, A260 = 0,820,
c. Kaw. sample collected May 28, 1965, 25 days after h~ading,
D, Kaw sample collected June 17, 1,965, mature graiz:i,

. 99
A. . 5-.11-65 lB. 5~14 .. 65
0.4
I
0.3 I (I) I 0
I i:: (U
I .0 1-1 0.2 0 Ul
.0 <
0.1 I
I
c. 5-28-65 D. Mature
0.4
0.1
50 100 150 200 50 100 . 150 . 200
Elution Volume (ml) . Elution Volume (ml)

Figure 20. Gel Filtration on Sephadex: G-200 of Tr,iumph Endosperm :Proteins
Two ml of .a 0.5 N~actic .acid extract that contain.ed 25,mg. of
protein were placed on a 2.0 x .73·.5 cm.column of Se,p~adex ~-200.
The sample ~as elt;tted with Q.5 N ~actic acid. (--. ) , , absorb,ance
at 280. mp. (------),, abE!orbance at 260. mµ •
. A ... Triumph samph callected May 11, 1965, 11 days after. heading •
. The elution, volume Qf the iast peak _was 270 m.1, A260 = 1..10,, A280 =
0.460.
~. - T.riumph. sample (:ollected May 13, .1965, ,13, days after heading.
The elution volume of the last peak 't,Yas 270. ml, A260 .= 0.980, A280 =
0.407.
C. Triumph sample collected May 21, 1-965,, 21 days after heading.
The elut,iort volume of. the iast pel;lk · was 270, ml, A260 = O. 715.
l). Triumph. sample collected May_,28, :1965, 28 days after heading.
E. Triumph sample collected June ,17, 1965, mature grain.

0.4
cu 0.3 ~ 111
,.c-1-1 0.2 0 Ill ..c <
0.1
9.4
0,3
0.2
0.1
o.
cu O. 0 s::: cu .a 1-1 0 Q .• Ill .
..0 <
o.
50
. A •... 5-11-65
·" , , I I I f I ' ''
I I I
c. 5 .. 21.,65
E. Mature
15Q 250
Elut;ion Voh1me (ml). -
I
I I I I I I
I I I
I I
I I
I
101
B • · 5-13.65 I I I I I I
I
I
D. 5-28•65
50 . 150 250
. Elution Volume.· (ml) \ •.

102
that the first absorbance peak from the more immature samples contained
large amounts of non-protein materi.als such as nucleic acids was indi
cated by its greater absorbance at 260 mp. A predomiqance of protein
was indicated in the first peak of tl:ie more mature samples since the
absorbance at 280 mp surpassed that at 260 IllJl• The height of the second
and third absorbance peaks varied little among the samples of a variety.
The aqsorbance maximum of the last peak was at 260 mp for all. samples,
and the quantity of mater~al in this peak decreased with maturity.
Fractions selected from this peak.exhibited an,absorption spectrum
characteristic of. the adenosine .. containing .nucleotides. This would not
seem unreasonable since the biosynthesis of kernel constituents is
occurring at a very rapid rate in the more immature samples. Enzyme
co-factors such as NAD+, NADP+, and ATP, as well as the various nucleo
tides, would be present in.larger concentrations at this stage of
development. The substrate for starch synthesis, ADP-glucose, might
also be expected to be present in greater amounts during formation of
the kernel.
In order to obtain.a more accurate estimate of the protein distri-
. but ion in the column eluate from each endosperm sample, the column
fractions were assayed for protein by the Lowry procedure (61). Dup
licate protein assays were made on each Triumph sample, but only a
single protein assay was made on each Kaw sample. The results for the
Kaw samples are shown in Figure 21, and those for the Triumph samples
in Figure 22. The elution pattern of each variety was arbitrarily
divided into.six groups (Figure 21, D and Figure 22, E). Group l eluted
in the column,void volume and corresponded to a molecular weight of
greater than·250,000to 300,000. Group.2 was in the molecular weight

Figure 21. Molecular Weight Distribution of the Kaw Endosperm -Proteins at Various Stages of Kernel Development
Two ml of extract containing 19 mg of protein were placed on
a 1.85 cm x 71. 5 cm column of Sephadex G-200. Protein ( ) in
the fractions 'tlTas measured by the Lowry method.
A. Kaw sample collected May 11, 1965, eight days after heading.
B. Kaw. sample collected May 14, 1965, 11 days after heading.
c. Kaw sample collected ;May. 28, 1965, 25 days after heading.
D, Kaw. sample cellected ~une 17,- 1965, mature grain,

280
s:: ·a: . 140 .µ 0 ,...
Pol
-,-1
s ...... bO ::lo -~ .... QI ,I.I ·o ,.. Pol
70
280
210
140
.70
104
A. · 5-11-65 B. 5-14-65
c. 5-28-65 · D. · Mature
50 · 100 150 2'00 50 100
.Elution Volume (ml) Elution Volume (ml)

· Figure. 22. Molecu~ar-Weight Distribution .of the Triumph Endosperm .. Proteins at Various Stages of ~ernel Development
Two ml of extract containing 25 .mg.of protein were placed on
.a 2.0 cm.x 73.5 cm c.olumn of Sephadex G•200. Protein ( ) in
,the fractions was measured by the Lowry method.
A. Triumph _sample collected May U, 1965, ll days after heading.
B •.. Triumph _sample collected !-lay 13, 1965, 13 days after heading.
c~ Triumph _sample collected- May 21, 1965, 21 days after heading.
o. Triumph,sample collected May ·2.8~ 1965, 28 days after ·heading.
E. · Triumph, sample C<i>llected .June 17, 1-965, mature grain.

280
-a 210 .......... . bO ·;;i.. .._,_ s:: 140 ..... QJ ,I.I, 0 1--1 ~ 70
280
-1 210 bO =.. .._, i:: 140
•.-I QJ ,I.I 0
~ 70
280
210
140
70
50
A. 5 .. 11-65.
c. 5-21-65
· E. Mature 1
. 150
4
. Elution Volume (ml)
50
250
106
B. 5-13-65
. ,·
D. 5-28-65
150 250
Elution Volume (ml)

107
range from:UO,OOO.to,250,000. Group.J.correspondedto a range of
60,000 to U0,000 molecular weight, while the group 4 proteit:ts were in
. the molecu_lar weight range of 30,000 to 60,000. The proteins of group
.' 5 ranged from.10,000. to 30,000, and the mater~al .in group 6 was less
tqan 5,000 molecular-weight and.had_a Kd ~ 1.
· For both. varieties the proportion of group 1 proteins in the ex-
trq.ctable proteins increased with maturation. of the kernel. Although
difficult to estimate, it appears t~at the relative amounts of extract-
.able group .2 and group·3 proteins change very litt1e during.the develop-
ment period.stud:l.ed. Figure 21, A indicates that the group.2 proteir;ts
made up t:he. first protein, peak. of t.he most inunature Kaw. sample. The
re~ative amounts of the ext.ractable prote.ins in groups 4 and 5 appear
to undergo only, slight cqanges duringdevelQpment. These observations . ,. '
are ~ore distinct with,the Kaw-samples, probably because the Kaw.was
sampled at ear.lier s;ages of its kernel development than was the Triumph.
In, fact, the elution patterns of. the Kaw harvested 5-14-65 (,11. days
after heading) .and the Triumph harvested.5-U-65 (11 days after. heading)
correspond.rather well.
l'he IIl8ter~al .in group 6 gave_.a very ~nteq.se color development with
, Lowry reagent in. the i~ture ,amples and eluted slightly ahead <;>f .the
. 260 ID)l absorbi,ng- peak. The large elution-.volume and tl:).e disappearance
of this peak.with Ill8turity_suggest that tb,e ~ter~als in this peak are
not proteiµs. ;I:t- ~as been reported that tryptophar;i, tyrosine, most
phenols,.and guan;i.ne give color development.with. the Lowry reagent (90).
·· In, order to. further cqa:r.:acterize the material in the last absorbance
pea~, q~antit:ative ninhydrin assays for amino acids and quantitative
anthrone assays for carbohydrates were run on.selected fractions from
108
the G-200.co!umns of the Kaw samples. The results. are shown.in Figure
.23. The elution vol:umes of the peak fractions were the same for, both
as.says apd were consistenUy three nil less t}i,an the elution volume of
the peak fraction of the 260 mµ absorbance peak.· There were.about 84 mg
of ~arbohydrate n:,.ater~al and about 61 )lmoles of ninhydrin,positive ma
terial in the Kaw. sample collected eight days after heading. These
amounts decreased as the kernel matured to;a value of abo~t three mg of
carb~hydl;'.ate m.ater~al and .. less than one µmole of ninhydrin positive I!la
terial in the mature Kaw sample.
Carbohydrate analyses were also r~n on fractions from the first
three.absorbance peaks of the most immature Kaw sample and the mature
Kaw flour. · No carbohydrate was. detected in these fr act ions of the
. mature flour, while the imm1;tture sample showed a sm1;tll carbohydrate
peak with.the same elution volume as the first absorbance peak.
This observation supports the poss.ibili,ty of a significant amount
of non .. pr.otein material in. the first absorbance peak of the immature
samples.
· Starch Gel, Electrophoresis Analysis
The fractions in each molecular weight group.from the G-200 columns
were pooled, dialyzed, and lyophilized. The dry material was then sub
jected to electrophoresis on starch .. gel, with the results shown in Fig
ure 24,and Figure 25 •. A comparison of the starch gel electrophore~is
1>atter11s of a given molecular weight group of proteins illustrates the
fact.that regardless of variety. or. i.tage of maturity, there is prac
tically no qualitative v:ariat;i.on of the proteins w~thin a group.
The first. -three molecular weight groups e~hibited some impaction
,at the gel origin.and various degrees of streaking through.the starch

,Figure 23, Distribution of Carbohydrates and NinhydrinPositive· Material in,Kaw Endosperm.During. Maturation
Two ml of extract were placed on .a: 1,75 cm x 71.5 cm column.'
of Sephadex G-200. ~---), carbohydr,te measured by the anthrone
procedure.' (-- ...... -), ninhydrin positive material.
A. Kaw sample collected May 11, 1965, eight days after heading.
· B, Kaw sample collected May 14, 1965, 11 days after heading.
C, . Kaw. sample collected May 28, 1965, .25 days after heading.
· D. Kaw. sample collected June 17, 1965, mature grain.

110
A. 5-11-65 B. 5-14-65 ~ - 11 ..... 4.0 4.0 O" a 0 - ::J" a,· '<. ..... Cl,. 0
3.0 11
!. 3.0 II>. rt
I (1)
..... I I -IU . 'i::
•,-f 2.0 I 2.0 (IQ 1-1 I -Q) I a .l,J I I-'
! ,. '-' I 1.0 I 1.0 ~
N
i I I-' , 0 I I i
/. l,.) I
c. 5-28-65 D. Mature C') ll) -....... -4.0 El -Q) .....
11
4.0 O" 0 ::r '< c:i. .
i . 3.0 -t,'I
3·.0 II> rt (1)
..... IU
•,-f·· 2,0 1-1 Q)
-£'' 2.0
OQ. -a. .l,J I-' IU '-' ~
N LO 1.0 X
~ I
I ~,
I-' 0
I l,.)
50 100 . 150 200 . 50 100 . 150 200
Elu-tion Volume .(ml) lUution Volume (ml)

Figure 24. Starch. Gel .Electrophoresis of Fractions From G-200 Gel Filtrat;ion of Kaw. Samples
Approximately 250 pg.of mater;ial were.applied to eachwick,
· Electrophoresis was for ten hours at 6.5 V /cm in. aluminum lactate-
urea buffer, pH,3.3. Protein bands were stained with.Amino Black
·,10 Bin five percent acetic acid. The cathode end is tothe left
of the gel.
A. Kaw, eight days after heading B. Kaw, 11 days after heading
1. Region 1 1. Region 1 '2 •. Region. 2 2. · Region ,2 3. · Region 3 3. Region 3 4. Region 4 : 4. Region,4
,.5 • . Region 5 5. Region,5 6. Region 6 6. Region 6, dialyzed
7. Region 7, not dialyzed
c. Kaw, 25 days after beadirig D. Kaw, mature
1. Region 1 1. Region 1 2. Region,2 2. · Region 2 3. · Region 3 3. Region· 3
'4. Region 4 4. Region 4 .5. Region 5 5. Region 5 6 • . Region 6 6. Region 6

' 5
4
3
2
C
6
5
4
3
2
f
(-) B
D
112
7
' 4
3
2

. Figure 25 •. Starch Gel Electrophoresis of Fractions From G-200 Gel Filtration of Triumph Samples ·
Approximately 300 pg of material were applied to each wick.
Electrophoresis was for. ten hours at 6.5 V/cm in.aluminum-lactate-
-urea buffer, pH 3.3. Protein.l,ands were stained with Amido Black
10 B. in fi:ve percent acetic acid. The cathode end :i,s to. the left
of the gel.
A. Triumph, 11 days after heading B. Triumph, 13 days after heading
1. Region 1 1. Region, 1 ' 2. Region 2 2. Region 2 3. Region ,3 3. Region 3 '4. · Region· 4 .4. Region4 .5. Region 5 5. Region·5
c. Triumph, 21 days after heading D. Triump~, 28 days after heading
' 1. Region .1 i. Region 1 ' 2. Regi'on ,2 2. · Region 2 3. Region 3 3. Region 3 4. Region 4 6. Region 6
·5o Region 5 4. Reg;i.on 4 5. Region. 5
E. triumph, mature
1. Region 1 2. Region 2
-3. Region 3 '4. Region. 4 5. Region 5

114
(-) A (-) B
4
3
2
C D
I s 5
14 4
J 3 6
3
I 2 2 .
j 1
E 5
3
2

115
gel. This electrophoretic behavior is typical of the glutenins (10) as
is aho.the large molecular weight of 105 to 106 (53). The group 4
-proteins exhibited a migration.rate similar to.that reported for the
gliadiI;1s (10), and the molecular weight of about 45,000 from these
studies agrees with report$ in. the literature (31, 74). The. albumins,
or l\l'ater solubles, appear to be in the group 5 proteins, as demonstrated
. by. both their starch. gel electrophoresis mobilities (lo, 26) and their
molecular weight of about 20,000 (8, 28, 31). · Electrophoresis of both
dialyzed and undialyzed samples from the gr.oup 6 material failed to
reveal any protein bands (Figure24~ B, samples 6 and7). This further
demonstrates the absence of protein in this fraction.
C~anges in.the relative.amounts of some of the endosperm proteins
with maturation of the kernel as shown by gel filtration were.also
demonstrated by the starch gel electrophoresis patterns of the crude
extracts. . As illustrated :i,n Figure 26, the more mature samples ex
hibited a darkly.stainec:l, impacted area at.the origin of the gel. This
area was not detectable in·. the more immature samples. It, is probable
that this impacted area shows the presence of glutenin proteins since
it qas been reported. by others that the glutenins fail to migrate into
the gel Il)atrix, thus causing impaction at the origin (10).
The results of this study indicate that qualitatively, the same
proteins are extracted fr.om. the endosperm ,at all stages of maturity
. ~xamined. · However, changes with maturity. in the relative amounts of
some of the proteins are reflected by changes in the gel filtration
elution patterns and the starch gel electrophoresis patterns of the
crude extracts.

F:1,.gure 26. Starch Gel Electrophoresis of Crude Extracts of Kaw and Triumph Endosperm During Maturation
Electrophoresis was for ten hours at 6.5 V/cm in.aluminum
.. lactate-.urea buffer, pll. 3.3. Protein ~ands were stained with Amido
Black 10 B in five percent acetic acid. The cathode end of the
gel is to.the left side of the figure.
A. Kaw samples, about 400 pg of protein we~ applied to
each wick,
1. eight days after heading 2. ll days after heading 3. 25 days after heading
. 4; mature
B. Triumph samples, about 600 pg of protein were applied
to each wick.
1. 11 days after heading 2. · .13 days after heading 3. 21 days after hjaading 4. . 28 days after heading 5, :mature

11 7
4
3
A
2
(-)
5
4
3 B
2

118
Fluctuation in the Free Amino Acids of the Maturing.Endosperm
Ewart (91) has recently reported that the glutenins possess much
higher proportions of lysine, glycine, and tryptophan.than the gliadins,
and somewhat highel;' proportions of arginine, tyrosine, threonine, as
~artic acid +~sparagine, serine, and alanine. The gliadins contained
more pro.line, glutamic acid+ glutamine, cystine, phenylalanine, and
.isoleucine.
In an attempt to.correlate fluctuations in the levels of these
free amino acids with the synthesis of the higher molecular weight pro
teins, the amount of each ,amino.acid in the various samples was deter
mined. The free amino acids were separated from the proteins and high
.. molecular weight carbohydrate II)aterial of a· water extract of the endo
sperm by a dialysis procedure similar to.that described by Jennings and
J1orton (48) •.. Aliquots corresponding to six to eight ymoles of ninhydrin
.positive material were placed on.an.automatic .amino acid analyzer with
,the results shown in Table VI. Several unidentified amino-containing
compounds are not listed~ This isolation and analyses were done only
. once f9r each, sample. · 1'Io general trends were ·Observed when the fluctua
tions of the amino acids present in,large amounts in the.glutenins were
com~ared with the fluct~ations of those abundant in the gliadins. This
sug~ests that earlier _and more frequent analyses would be necessary to
detect any, significant trends. The absolute amount of each, amino acid
decreased with.maturation of the kernel. On the other, qand, comparison
.. of the percentages of the amino acids reveah tliat a:t;"ginine,. aspartic
, acid, phenylalanine, tyrosine,.· and isoleucine showed sul;>stantial in
creases in relative, amounts, while alanine, serine, proline, .. and glutamic
acid exhibited marked decreases. The relative.amounts of ·the other amino

TABLE VI
CHANGES IN THE FREE AMINO ACID COMPOSITION DURING ENDOSPERM DEVELOPMENT
Micromoles of Amino Acid eer Gram Dri Flour Percent of Total Free Amino Acids . Amino Kaw1 Dais After Heading 1 ·Triumeh, Dais After Heading Kaw1 Dais After Heading Tri!!!!!l!h 1. Dais After Headins Acid 8 11 15 Mat 11 13 21 28 Mat 8 11 15 Mat 11 13 21 2.8
Ala 42.31 27.50 3.60 0.60 20.41 15.46 13.77 1.86 0.66 19.08 20.73 10.61 8.40 15.82 16.01 24.38 12.58 Arg 1.92 0.78 0.28 0.12 1.03. 0.93 0.25 0.30 0.17 0.86 0.59 0.97 1.68 0.80 0.96 0.44 2.03 Asn + Gln 17.58 14.22 3.72 0.76 14.23 10.05 4.29 1.67 0.58 7.93 10.72 12.89 10.64 11.03 10.41 7.60· 11.30 Asp 3.30 3.44 2.11 1.11 2.68 2.78 1298 1.19 1.02 1.48 2.59 7.31 15.55 2.08 2.88 3.51 8.05 (Cys-) 1.37 o.47 0.17 0.07 0.41 0.16 tr o.u 0.02 0.61 0.35 0.59 0.98 0.32 0.17 ----- 0.74 Glu 22.25 24.06 2.89 0.43 19.38 11.44 2.31 1.14 0.44 10.03 18.13 10.02 6.02 15.02 11.85 4.09 7.71 Gly 19.23 10.94 l.50 0.59 16.29 10.98 4.21 1.00 0.52 8.67 8.25 5.20 8.26 12.62 11.37 7.45 6.77 His 1.37 0.63 0.33 0.12 0.82 0.62 0.33 0.19 0.11 0.61 0.48 1.14 l.68 0.80 0.96 0.44 2.03 Ile 1.92. 0.78 0.44 0.01 0.82 1.08 1.32 0.26 0.13 0.86 0.59 1.53 1.40 0.64 1.12 2.34 1.76 Leu 2.47 1.09 0.61 0.22 1.24 1.55 1.24 0.41 0.22
.. 1.11 0.82 2.11 · 3.08 0.96 l.61 2.20 2.77
Lys 3.85 1.72 0.39 0.14 2.10 2.16 0.42 0.30 0.24 1.73 1.30 1.35 1.96 1.63 2.24 0.74 2.03 Met 2.20 0.78 0.22 0.06 1.86 1.39 0.66 0.22 0.08 0.99 0.59 0.76 0.84. 1;44 1.44 1.17 1.49 Phe 1.65 0.78 0.3-9 0.14 1.03 0.93 0.75 0.24 0.14 -0.74 0.59 1.36 1.96 0.80 0.96 1.33 1.76 Pro. 8.52 2.50 0.39 0.16 2.68 2.01 1.48 0.22 0.19 3.84 1.88 1.36 2.24 2.08 2.08 2.62 1.49 Ser 24.73 13.75 2.11 0.73 18.97 13.45 5.36 1.37 0.82 11.15 10.36 7.31 10.22 14.70 14.85 9.49 9.27 Thr 4.67 . 2.50 0.78 0.22 2.89 2.63 1.74 0.45 0.24 2.10 2.24 2.11 2.80 2.24 2.72 3.08 3.04 Trp ----- 0.50 0.11 tr ----- ·0.91 0.48 0.10 ----- ----- 1.73 1.54 ----- ----- 1.61 3.25 Tyr 1.65 0.78 o.44 0.14 0.82 0.62 2.23 0.26 0.17 0.74 0.59 1.53 1.96 0~64 0.64 3.95 1.76
' Val 4.67 2.50 0.78 0.22 2.06 2.32 1.90 0.48 0.22 2.10 1.88 2.70 3.08 1.60 2.40 3.36 3.25
Aad 0.27 0.47 0.06 0.01 0.41 0.31 0.42 tr 0.37 0.12 0.35 0.21 0.14 0.32 0.32 0.74 ---·--Abu 0.27 tr tr tr tr tr 0.16 tr ---- 0.12 ----- ----- ----- ----- ----- 0.28 -----7Abu 22.53 8.13 2.56 0.14 7.63 2.94 5.03 1.44 0.52 10.16 6.13 8.87 1.96 5.91 3.04 8.91 9.74 NH 18.68 7.97 1.78 0.49 10.72 6.49 2.97 0.09 0.31 8.42 6.01 6.17 6.86 8.31 · 6.72 5.26 0.61 cd tr tr 0.06 0.01 tr tr tr t·r tr ----- ----- 0.17 0.14 ----- -----Sar tr tr tr tr tr 0.31 tr tr tr ----- ----- ----- ----- ----- 0.32 Taurine 0.27 tr 0.11 ---- tr tr tr tr tr 0.12 ----- 0.38 · ----- ----- -----Urea 8.52 3.75 2.22 ---- ----- 2.78 ----- 0.67 ---- 3_.84 2.82 7.69 ---- ---- 2.88 -----· 4.53
1Mat = mature 2 . tr= trace
Mat
9.07 2.34 7.97
14.01 0.30 6.04 7.14 2.34 1.79
.3.02 3.30 1.10 1.92 2.61
11.26 3.30 1.51 2.34 3.02
5,08 ___ ..,,_
7;14 4.26
I-' F-' \0

120
:acids r~inedrelativelyconstant. These results are in,partial agree ...
ment with Jennings a11d ~orton (49) who reported.significant increases
in aspartic.a-eid and.arginine.and decreases in lysitle and pro.line •
. Ammonia, urea, and 4 .. amino-butyric.acid, although.not directly,:in-
volved in prote.i,n synthesis, were present in rather·large.amounts in
·. the more immature samples.
These results show that the.quatttity of each.amino acid in the
kernel decreased with n,iaturation.and tl).at .the relative proportions of
cer;ain.amino acids varied with kert1el development •. Similar results
obtained by.· others (46, 49) were interpreted as indie:ating. v.ariations
in the rate of supply of an amino acid. to the pool of protein precursors ' '
compared with the r.ate of its incorporation into protein.
Conclusions
Gel filtration and s;arch gel electrophoresis experiments show an
increase in.the qt.Jantity. of high-molecular-weight protein components
in. the extractable protein fraction.!as the wheat endosperm_ matures.
· Since appreciable amounts ,qf protein could not be extracted under the
conditio~s employed, the results must be· interpreted with reservations.
_Jjowever, several possible e)[planations for the oI?served cJ::ianges may be
'.offered.
The most obv.ious possibility· is that the glutenin pr.oteins are
· the last stora,ge proteins to be synthesized. . Although not fu.lly soluble
- in the solvent system.employed, enough·of these proteins were extracted
.. from the m~re 111:8ture samples to change the gel filtration patterqs.
The occurrence of ~arge amounts of un-extracted protein material in the
. iIIIJl1.8turesamples might be explained by the presence of high_proport:io11-s
of proteiµ-containing organelles such.as the endoplasmic reticulum and

·121
the ribosomes which are,auociated with ceU development.
If the protein.bodies described by ijorton et al. (38, 3,9) are the ---.- .
sites of $luten,protein storase,and if a change occurs in the physical
structure, of these protein: ho.dies, then the second possible explanation
for the ol;>served c~anges might be that. the glutenins became more access-
ible to the solvent. Jennin$5' °Qas suggested that the protein,bodies
enlarge-with maturity; thus, rupture of some of these bodies or an
,;alteration in. the lip<:>-prote.in meinb+ane enclosing the storage proteins
might allow solv,ation of the contents. This hypothesis would require
·t4at the protein:bodies contain essentially only glutenins because the
amount of gliadins appeared to. relll8in- nea-rly constant for .all dates
sampled.
The third possible explanation.ID.ay be that many of the high
molecular weight proteins were synthesized early in the kernel develop-
ment and re~ined insoluble throughout. liowever,. in the later stages
of devele>pI1J.ent, proteins, perhaps g.liadin type proteins, are synthe-
sized .. and these new proteins are combined with some of the pre-
existing. ;liadins and albumins through intermolec.ular disulfide bondiP.g
or non-co~alet:it. associations to fo-rm the larger molecular weight pro-
teins ob~~rved in.these experill!,ents. This behavior has been observed
in the.ca§e of wheat proteins by several groups (?2, 73, 74, 86).
· Thi1:1 investigation has answered. a few. of the questions about
cl:ianges occurring.in the proteins during kernel i:naturation; however,
II)any questions have been left ui:ianswered. Perl:iaps the paramount pre-
requisite· to. further studies of this type will be the finding of a
solvent system.which will extract all of the endosperm proteins without
gre>ssly disrupting their.confol,"Ill8tions. Other parameters which.must be

more closely,controlled in further experiments of this type include
earlier and more frequent sampling and further proof of differences
122
.among the protein fractions from the gel filtration;columns such as
amino,acidanalysis •. Sepai:ation of the variot.ls wheat flour proteins
according. to their molecular weight by the gel. filtration. technique
might complement some of the other techniques in future work. For
example, this technique could be employed to fractionate radioisotope
labeled proteins by.a criteria other than thetr solubility charac
teristics. Or, together with ion exchange chroll),atography, it may be
· useful in,further charactertzing the storage proteins contained in the
isolated.protein bodies at v,arious stages 9£ kernel development.

S~RY
.. A combination of ion excl,.ange chromatography on CMC and gel .filtra-
tion on_Sepq.adex G-75 was employed.in the isolation of a water -soluble
- wheat flour protein. The prei,>aration was judged to be· 90 percent pure
· by. zot1e electrophoresis •.. Sedimentation ,at1alysis yielded a single s~
met-rical peak with.an ~;O,w of 2.45. }.folecular weight estimation by
gel filtration.yielded a value of 19,300. The diffusion coefficient,
as estimated by gel filtration, "i'as 10.47 x 10⁻⁷• The molecular weight
calculated. from the sedimentation and diffusion. coefficients was 20,400.
Amino acid a11,alysis showed the proteinto q.ave_a compc;,sition similar to
- other soluble wheat flour protein preparat.ions·. · The par-tial specific
volume of the protein,. when. calculated .from the_ amino acid compc;>sition,
was 0.727 c((:./g •. A min;i.~l molecular weight of 9,550. was obtained. from
the amino acid.comp9sition. - The ultraviolet absorption,spectra showed
1% a Illaximum at_ 278 mp,_ and from. this ~as calcu.lated an ~278 of 13 .1. · No
free sulfhydryl groups were detected. Reduction.and alkylation.of the
isolated protein.resulted ;in the appearance of several minor components
upon.s;arch.gel electrophoresis and a decreased electrophoretic mobility
of the main component as compared to the untreated protein. Serine was
found to. be -the only N-termi~al amino_ acid. The C-te-rminal amino acid
was resistant to attack by carboxypepti~ase A.
Changes in the lactic.acid extractable proteins of developing wheat
endosperms were also.studied. Gel filtration.on Sephadex G-200; as well
as starch gel electrQphoresis of the crude extracts, demonstrated that
123

,124
tlie proportion.of higlier molecu~ar weight endqsperm proteins increased
_ with. I1U1turati<;m of the kernel. There appeared to, be no qualitative
cll.anges in the proteins. No correlationbetweenfluctuations in the
levels of the free amino_acids and changes in.the endospermproteins
could J:,e shown.

REFERENCES
,1. Osborne, T. B., The Proteins of the Wheat- Kernel. Carnegie Inst. of Wash-ington; Washington, 0:-c., (1907).
--2. _Meyer, K.· H., Spahr, P. F.,. and F:i,scher, E. H., HeLv. Chim. ,Acta,
36, :1924 (i953).
3. Elton, G. A. H. and Ewart, J. _A. D., J. Sci. ~ Agr., .!l, 62 (1962).
-4. Pence; J.· w., Mecham, D. K., and Olcott, H. s.; !!_._Agr. Food Chem., !t., 712 (1956).
5. · Pence, J. W., Weinstein, N. E.,.and Mec°Q.am, D. K., Cereal Chem., 1!., _303 (195,4). . •'
6. Laws, W. D. and Frat1-ce, W. G., Cereal Chem., ll, 231 (1948).
7. Danielss.oi:i, C. E., ]}iochEµn. !!_., 44, 387. (1949).
8. Pence, J. W. and- Elder,_A.- H., Cereal Chem., 30, 275 (1953).
9. Pence, J. W., Cereal Chem., 22,, ~28 (195:3).
,10. Woychi\<., J, H., Boundy, J. A., and Dimler, R. J.,_Arch. Biochem. l}ioJi?hys~, 2,a, 477·(1961). ·
11. Smithies, O., .Biochem. I•, .§.!., 629 (1955).
i2. Elton, G._A. H. __ and Ewart, J. A. D0 I•§£!• Food Agr., 13, 62 '(1962).
13. Kaminski, E., i!.• Sci. FoodAgl'.",, 13, .603 (1962).
_14. - ~elley, J. J. and Koenig; V.· L., I• Sci. Food Agr., Q, 644 (1962).
-15. Graham, J ... S, D.,-Australian !!_. ~· Sci., 16, 3-42 (1963).
16. Graqar, P .• ,· BenQ.amon, N., and Daus$ant, J,_, Arch. Biochem •. Biophys. Suppl. !,· 187 · (,1962).
17. Gehrke, C.-- W., O~, Y. H.,. and, Freeark, C.-- W., Anal.-_Biocheni., l, 439 (1964).
18. Elton, G. A, H, _and Ewart, J. _A. D., J •. Sci. Food Agr., 15,- 119 . (196-4).
125

126
19. Elton, G. A~ H. and Ewart, J • . .f\. D., J. Sci. Food Agr., 14, 175 (1963).
20. Coates, J. H. and Simmonds, D. H., Cereal Chem., 38, 256 (1961).
21. Simmonc;ls, D. H., Cereal Chem., 40, 110 (1963).
22. Nimmo, c. C., O•Sulliv:an, M. T., Mohammad, A., and Pence, J. W., Cerea 1 . Chem. , 40, 390 (1963) • ·
23. Oh, Y. H. and Gehrke, C. W., Anal. Biochem., .!Q, 409 (1965).
24. Clayton, J. W., Cereal Chem., 43, 495 (1966).
25. Jones, R. W., Babcock, G. E., Taylor, N. W., and Dimler, R. J., Cereal Chem., 40, 409 (1963).
26. Abbott, D. C. and Johnson, J. A., l• Food Sci., 11, 38 (1965).
27. Feillet, P. and Bourdet, A., Compt. Rendq 263, 2030 (1966).
28. Jankiewicz, M. and Pomeranz, Y., l• Sci. Food Agr., .!.2_, 644 (1965).
29. Kelley, J. J., Arch. Biochem. Biophys., 106, 167 (1964).
30. Holme, J., Cereal Chem., 39, 132 (1962).
31. Meredith, O. B. and Wren, J. J., Cereal Chem., 43, 169 (1966).
32. Woychik, J. H., Boundy, J, A., and Dimler, R. J., Agr. and Food Chem., 2, 307 (1961).
33. Quensel, O., Dissertation, University of Uppsala, Sweden, 96 pp, ( 1942).
34. Stevens, D. J., McDermott, E. E., and Pace, J., J. Sci, Food Agr., 14, 284 (1963) •
. 35. Rohrlich, M. and Schlussler, H. J., Lebenson Untersuch • ., 108, 405 0958).
36, Winzor, D. J. and Zenter, H,, l• Sci. Food Agr,, 11., 428 (1962).
37. Buttrose, M. S., Australian l• Biol. Sci., .!.£, 305 (1963).
38. Jennings, A. C., Morton, R. K., and Palk, B, A., Australian J. ~. Sci.,.!.£, 366 (1963).
39. Graham, J. S. D,, Morton, R. K., and Raison, J. K., Australian. J. Biol. Sci.,.!.£, 375 (1963).
40. Bilinski, E. and McConnell, W. B., Cereal~., 35, 66 (1958).

41.
42.
43 •
. 44.
45.
46.
47.
48.
- ,49.
50.
51.
52.
.53.
54.
55.
56.
57.
58.
59.
. 6().
127
Finlayson, A. J. and McConnell, W. B., Can. J. Biochem. Physiol., 40, 219 (1962).
· Finlayson, A. J. and McConnell, w. B., Cercaal ~-, 40, 137 (1963).
· Lee, C. C. and ~eynolds, L. M., Cereal Chem., 40, 487. (1963).
Graham, J. S. D. and Morton, R. K., Australian J. Biol. Sci., 16, 357. (1963).
McCalla, A. G., ~· l.• Research, 16C, 263 (1938).
Jennings, A. C. and Morton,. R. K., Australian J. Biol. Sci., 1.§., 318. ( 1963).
Graham, J. S. D., Morton, R. K., and Simmonds, D. H., Australian J. lli!_. Sci., .!.§_, 350 (1963).
Waggle, D., Deyoe, C. w., and Pomeranz, Y., J. Sci. Food Agr., 11., 269 (.1966).
Jennings, A, C. and Morton, R. K.,. Australian J. Biol. Sci., .!.§_, 384 (1963).
Pomeranz, Y., Finney, K. F., and Hoseney, R. C., J. Sci. Food Agr., 11., 485 (1966).
Coulson, C. B. and Sim, A. K., !!_. Sci. Food Agr., .!.§_, 499 (1965).
·Hoseney, R.C.,Finney, K. F., and Pomeranz, Y., !!_, Sci.Food Agr • , Q, 2 7 3 (19 6 6 ) •
Taylor, N. M. and Cluskey, J. E., Arch. Biochem, Biophys .• , !fl., .399 (1962).
Andrews, P., Biochem. !!_., 2!_, 222 (1964).
· Lamm, o. and Polson, A., Biochem. 1•, 30, 528 (1936).
Schwert, G. W., 1• 1!!tl• Chem., 190, 799 (1951).
· Edsal 1, J. T., in H. Neurath. and K. Bailey (Editors), The Proteins, Vol. 1, Academic;: Press, Inc., New York, 1953, p. 634. ·
Smith, E. L. and Kimmel, J. R., in P. D. Boyer, H. Lardy, and K. ~yrback (Editors), ~ Enzymes, Vol. 4, Academic Press, Inc .• , New York, 196(), p. 137.
Rothen, R. ,· 1• Gen. Physiol., 24, 203 (1940).
Layne, E., in S. P. Colowick and N. O. Kaplan (Editors), Methods .!:!!. Enzymology, Vol. 3, Academic Press, Inc., New York, 1957, p. 447.

61. Lowry, H. o., Rosenbrough, N. J., Farr, A., and Randall, R. J., !!_.~.Chem., 1.21, 265 (1951).
62. Mokrasch, L. c., !!_. ~· Chem.,~' 55 (1954).
63. · Moore, s. and Stein, W. H., ins. P. Co1owick and N. o. Kaplan . (Editors), Methods .!!!.. Enzymology, Vol. 6, Academic Press, Inc., New York, 1963, p. 819.
64. Schram, E,, Moore, s., and Bigwood, E. J., l3iochem. !!_., R, 33 (1954) •
. 65. Goodwin, T. W. and Morton, R. A., Biochem. !!_., 40,628 (1946).
128
66. Beaven, G. H~ and Holiday, E. R., in M. L. Anson, K. Bailey, and J. T. Edsall (Editors), . Advances in Protein Chemistry, Vol. 7, Academic Press, Inc., New York, 1952, p. 319.
67. Boyer, P. D., !!_.Am.Chem. Soc., 76, 4331 (1954).
68. Fraenkel-Conrat, H., in S, P. Colowick and N. o. Kaplan (Editors), Methods .!.!! EnzymG>logy, Vol. 4, Academic Press, Inc., New York, 1957, p. 258.
69. Fraenkel-Conrat, H., Harris, J.- I., and Levy, A. L .• , in D. Glick . (Editor), Methods of Biochemical Analysis, Vol. 2, Inter
science Publisherslnc., New York, 1955, p. 360.
70. Fraenkel-Conrat, H., Harris, J. I., and Levy, A. L., in D. Glick - (~ditor), Methods of Biochemical Analysis, Vol. 2, Inter
science Publishers Inc., ~ew York, 1955, p. 392.
71. Sjsf>quist, J., Acta Chem~ Scand., l, 447 (1953).
72. · Oh, Y. H., Sanders, B. E., and Gehrke, c. W., Can. J. Biochem., 44, 917 (1966).
73. · Winzor, D. J., Biochim. Biophys. Acta, 74, 144 (1963).
74. Be-rnardin, J. E., Kasarda, D. D., and Mecham, D. K., !!.• Biol. ·.Chem., _ 242, 445 ( 1967).
75. . Scherr, G. H.; Tral'!,s. !• y. _Acad. Sci., 23, 519 (1961).
76. -Laurel}t, T.C. andKillander, J., !!_. Chromatog.,14, 317(1964).
77. Ackers, G. K., Biochemistry, 1, 723 (1964).
78. Andrews, P., Biochem. !!•, 96, 595 (1965).
79. Schachman, H.K., The Ultracentrifuge_in Biochemistry, Academic Press, Inc., New York, i959, p. 152.
80. McMeekin, T. L._and Marshall, K., Science, 116, 142 (1952).

129
81. Cohn, E. J. ,;tnd Edsall, J. T., Proteins, Amino Acids, and Peptides, Reinhold Publishing Corp., New York, 1943, p. 370.
82. Sc,;tnes, F. s. and Tozer, B. T., Biochem • .:!•, 63, 282 (1956).
83. Greenstein, J.P. and Winitz, M., Chemistry of the Amino Acids,. Vol. 2, John Wiley & Sons, Inc., New York,. 1961, p. 1512.
84. Neurath, J., in P. D. Boyer, H. Lardy, and K. Myrb~ck (Editors), ~ Enzymes, Vol. 4, 2nd ed., Academic Press, lnc., New York, 1960, p. 12.
85. Barnard, E. A. and Stein, W. D., .:I.• Mol. Biol., L 339 (1959).
86. Woychik, J. H., Proceedings, Seed Protein Conference, Jan., 1963, p. 27.
-e7-. Turnquist, P. K., Porterfield, J. G,, and Abbott, D. C., Oklahoma State University Experiment Station Bulletin, B-603, March, 1963.
88. Jennings, A. C., Cereal ~·, 38, 467 (1961).
89. Moore, S. and Stein, E. H., .:!• Biol. Chem., 176, 367 (1948).
90. Layne, E., in S. P. Colowick and N. O. Kaplan (Editors), Methods in Enzymology, Vol. 3, Academic Press, Inc., New York, 1957, p. 449.
91. Ewart, J •. A. D., J. Sci.~ Agr., 18, 111 (1967).

VITA
Wayne William Fish
Candidate for the Degree of
Doctor of Philosophy
Thesis: I.· THE ISOLATION AND CHARACTERIZATION OF A SOLUBLE WHEAT FLOUR PROTEIN IL PROTEIN CHANGES IN THE WHEAT KERNEL DURING MATURATION
Major Field: Chemistry
Biographical:
Personal Data: Born in Cherokee, Oklahoma, April 21, 1941, the son of Earl C. and Hazel A. Fish.
Education: Attended grade school and high school in Helenaj Oklahoma; received the Bachelor of Science degree in Agricultural Chemistry from Oklahoma State University in August, 1963; completed the requirements for the Doctor of Philosophy degree in July, 1967.
Professional experience: Instructor, Department of Chemistry, Oklahoma State University, December, 1966, to June, 1967.
Professional organizations: The American Chemical Society, the Society of Sigma Xi, Phi Lambda Upsilon.