2021_Vincent_Taylor_Thesis.pdf - ShareOK
151
UNIVERSITY OF OKLAHOMA GRADUATE COLLEGE BRIDGING THE GAP BETWEEN HUMANS AND MACHINES FOR THE DRILLING INDUSTRY A THESIS SUBMITTED TO THE GRADUATE FACULTY in partial fulfillment of the requirements for the Degree of MASTER OF SCIENCE By TAYLOR C. VINCENT Norman, Oklahoma 2021
-
Upload
khangminh22 -
Category
Documents
-
view
5 -
download
0
Transcript of 2021_Vincent_Taylor_Thesis.pdf - ShareOK
UNIVERSITY OF OKLAHOMA
GRADUATE COLLEGE
BRIDGING THE GAP BETWEEN HUMANS AND MACHINES
FOR THE DRILLING INDUSTRY
A THESIS
SUBMITTED TO THE GRADUATE FACULTY
in partial fulfillment of the requirements for the
Degree of
MASTER OF SCIENCE
By
TAYLOR C. VINCENT
Norman, Oklahoma
2021

BRIDGING THE GAP BETWEEN HUMANS AND MACHINES
FOR THE DRILLING INDUSTRY
A THESIS APPROVED FOR THE
MEWBOURNE SCHOOL OF PETROLEUM AND GEOLOGICAL ENGINEERING
BY THE COMMITTEE CONSISTING OF
Dr. Catalin Teodoriu, Chair
Dr. Scott Gronlund
Dr. Ramadan Ahmed

© Copyright by TAYLOR C. VINCENT 2021
All Rights Reserved.

iv
Acknowledgments
This was one of the most challenging but rewarding experiences of my lifetime. Through
the highs and lows, I was supported by an incredible team: advisors and colleagues, family and
friends, as well as my communities.
Above all, I want to thank my supervisor, Dr. Catalin Teodoriu. He guided me through
the many and unknown rigors of a master’s degree program, trusted me to develop my own
experiments, and respected my personal challenges along the way. Without his unrelenting
support, this journey would have been improbable. I also owe many thanks to Dr. Scott
Gronlund, who delivered my absolute favorite course through my undergraduate and graduate
years. His teachings led to so much inspiration in the evolution of my topic. Lastly, thank you to
Dr. Ramadan Ahmed for his involvement in my thesis and defense.
Another group of people who made this journey so memorable are my colleagues – they
were nothing short of exceptional. Each person in my research group has their own unique set of
strengths and ideas. I am forever grateful for their open mind towards my divergent approach to
drilling research. The times shared in Romania, backyard cookouts, restaurants, coffee shops,
and beyond will never be forgotten. I would also like to thank the students and volunteers who
acted as research participants. I hope they learned as much from me as I did from them.
To say I was busy during my pursuit of this thesis is an understatement. During this
journey, I started my very own nutrition coaching business. What began as an exciting hobby
quickly evolved into an unavoidable passion. While nutrition coaching seems so contrary to
petroleum engineering, there were many more parallels than one might imagine. One day I
would be helping professional drillers understand the impact of their verbal and non-verbal
communications, and the very next day, I would be actively practicing the same ideas with
nutrition clients. I cannot thank my amazing clients enough for their patience and understanding
of my commitment to completing my engineering degree.
Outside of the academic and professional settings, I felt endless support from my family,
friends, and communities. I am humbled and proud to be the first member of my family with an

v
advanced degree. While they have not gone through this experience firsthand, they were with me
every step of the way. To my closest friends – thank you. Between a few needed vacations, lots
of gamedays, and the occasional FaceTime, you all offered a fun balance to my academic
pursuits. Special shout-outs to Gabi, Michelle, and the boys.
I have a few random thanks, too. Upon moving to Oklahoma, the Koda fitness
community quickly took me into their family and gave me a refreshed purpose in health and life.
As it pertains to this thesis, the countless hours of writing would not have been possible without
the open and inviting spaces of my favorite coffee shops—Haystack, Michelangelo’s, and
Second Wind. I also want to thank the beautiful music that acted as the soundtrack to my life
during this period—Anjunabeats, trance, and techno for the endless energy.
Peace, love, muscles, and thanks,
Taylor

vi
Table of Contents
Acknowledgments.......................................................................................................................... iv
Table of Contents ........................................................................................................................... vi
List of Figures ................................................................................................................................ xi
List of Tables ............................................................................................................................... xiii
List of Abbreviations and Acronyms ........................................................................................... xiv
Abstract ........................................................................................................................................ xvi
1. Introduction ............................................................................................................................. 1
A. Motivations....................................................................................................................... 1
i) Human connection............................................................................................................ 1
ii) Communication ............................................................................................................ 2
iii) Coaching ....................................................................................................................... 2
B. Outline of the Thesis ........................................................................................................ 2
2. Drilling Diversity and Transformation ................................................................................... 3
A. Diversity Within the Drilling Industry ............................................................................. 3
i) By location ....................................................................................................................... 3
ii) By source ...................................................................................................................... 4
iii) By technology or application ........................................................................................ 6
B. Proposal of the Human-Machine Axis ............................................................................. 7
i) Human Axis...................................................................................................................... 8
ii) Machine Axis ................................................................................................................ 8
iii) Human-Machine Axis................................................................................................... 9
C. Design for Drilling’s Future ........................................................................................... 11
i) Product Design ............................................................................................................... 12

vii
ii) User Interface/Experience Design .............................................................................. 12
iii) Interaction Design ....................................................................................................... 13
3. Review of The Human Axis ................................................................................................. 15
A. Human Factors ............................................................................................................... 15
B. Crew Resource Management ......................................................................................... 17
C. Cognition ........................................................................................................................ 20
i) Paying attention and distraction ..................................................................................... 21
ii) Language .................................................................................................................... 22
iii) Distributed cognition .................................................................................................. 23
iv) Heuristics .................................................................................................................... 24
D. Communication .............................................................................................................. 24
v) Types of Communication ........................................................................................... 25
vi) Using Non-staged Videos to Study Communication .................................................. 26
vii) Proposal of the Universal Drilling Language ............................................................. 28
E. Situational Awareness .................................................................................................... 29
4. Review of the Machine Axis................................................................................................. 31
A. Simulators by Definition and Types............................................................................... 31
i) Partial-task simulator (PTS) ........................................................................................... 32
ii) Procedural simulator (PS) ........................................................................................... 33
iii) High-fidelity simulator (HFS) .................................................................................... 34
iv) Engineering simulator (ES) ........................................................................................ 35
B. Simulators Available for Study ...................................................................................... 35
i) DrillSIM:50 simulator .................................................................................................... 36
ii) NOV-HIL simulator ................................................................................................... 42

viii
C. Simulation in Context – Time, Human, and Sensory Immersion .................................. 44
i) Live simulation ............................................................................................................... 44
ii) Virtual simulation ....................................................................................................... 45
iii) Constructive simulation .............................................................................................. 46
D. The Future of Drilling Machines .................................................................................... 48
i) Spec-driven technology .................................................................................................. 48
ii) Newer drilling applications ........................................................................................ 49
iii) The digital transformation .......................................................................................... 50
iv) Mathematical and algorithmic approaches ................................................................. 51
5. Testing the Effectiveness of Drilling Communication ......................................................... 53
A. Introduction .................................................................................................................... 54
B. Training Stage ................................................................................................................ 55
i) Drilling education ........................................................................................................... 55
ii) Simulator and system familiarity ................................................................................ 57
iii) Briefing ....................................................................................................................... 58
C. Testing Stage .................................................................................................................. 60
i) Equipment ...................................................................................................................... 60
ii) Task Complexity and Completion .............................................................................. 61
iii) Testing Phases A, B, and C ........................................................................................ 63
D. Results ............................................................................................................................ 65
i) Rate of Task Completion................................................................................................ 65
ii) Time to Task Completion – Beginner-Level .............................................................. 66
iii) Time to Task Completion – Intermediate-Level ........................................................ 68
iv) Time to Task Completion – Advanced-Level ............................................................ 69

ix
v) Voice Recordings ....................................................................................................... 69
E. Discussion ...................................................................................................................... 70
i) Projecting results onto reality ......................................................................................... 70
ii) Why these results matter ............................................................................................. 71
iii) Future directions ......................................................................................................... 72
6. Testing Attention Inside the Drill Shack .............................................................................. 73
A. Introduction .................................................................................................................... 74
i) Two perspectives ............................................................................................................ 74
ii) Cognitive demands of high-risk jobs .......................................................................... 75
B. Cognitive Tools for Study .............................................................................................. 77
i) Attention ......................................................................................................................... 78
ii) Dichotic listening tests................................................................................................ 80
iii) Verbal shadowing ....................................................................................................... 82
C. Experimental Design ...................................................................................................... 83
i) Setup ............................................................................................................................... 83
ii) Participants ................................................................................................................. 84
iii) Apparatus .................................................................................................................... 84
iv) Stimulus ...................................................................................................................... 86
v) Drilling scenario ......................................................................................................... 90
D. Training Stage ................................................................................................................ 91
E. Testing Stage .................................................................................................................. 93
i) Experimental Phase A-C (Active-Control) .................................................................... 93
ii) Experimental Phase N-S (No-Shadow) ...................................................................... 94
iii) Experimental Phase W-S (With-Shadow) .................................................................. 95

x
iv) Feedback Session ........................................................................................................ 96
F. Results ................................................................................................................................ 96
i) Average drilling task completion ................................................................................... 96
ii) Performance errors ..................................................................................................... 97
iii) Time-step results for task completion ........................................................................ 98
iv) Subjective negative feedback ................................................................................... 102
v) Subjective positive feedback .................................................................................... 104
G. Discussion .................................................................................................................... 104
i) Shared errors ................................................................................................................ 104
ii) Preventative structure ............................................................................................... 105
iii) Primary language interference .................................................................................. 106
iv) Number usage and design ......................................................................................... 106
v) Study limitations ....................................................................................................... 107
vi) Results mirror the literature ...................................................................................... 108
H. Conclusion .................................................................................................................... 109
i) Novelty of this study .................................................................................................... 109
i) Future directions ........................................................................................................... 110
7. References ........................................................................................................................... 112
8. Appendix 1 – Roadmaps for DRM ..................................................................................... 120
9. Appendix 2 – Non-staged Videos for Analysis .................................................................. 124
10. Appendix 3 – Command Roadmaps for VSDS ............................................................... 126
11. Appendix 4 – Audio/Video Distractors for VSDS .......................................................... 130
12. Appendix 5 – Driller’s Roadmap Data ............................................................................ 131
13. Appendix 6 – Verbal Shadow Drilling Study Data ......................................................... 133

xi
List of Figures
Figure 2-1: world map of oil reserves (EIA 2017) ......................................................................... 4
Figure 2-2: 2020 U.S. energy consumption by source (EIA 2020) ................................................ 5
Figure 2-3: proposed human-machine axis for drilling innovation ................................................ 9
Figure 2-4: Venn diagram of interaction design and related disciplines ...................................... 14
Figure 3-1: Swiss Cheese Model for offshore operations (Mainside Limited 2018) ................... 16
Figure 3-2: dichotic listening test with attended channel (left) and rejected channel (right) ....... 22
Figure 3-3: video analysis – a) eye contact before b) catching thread protector .......................... 27
Figure 4-1: Google Books search for 'simulation' ........................................................................ 31
Figure 4-2: reinterpretation of Millheim's simulator classification types (Millheim, 1986) ........ 32
Figure 4-3: DrillSIM:50 user panels (Drilling Systems, 2005) .................................................... 33
Figure 4-4: DrillSIM:5000 at Universitatea Petrol-Gaze in Ploiesti, Romania ............................ 34
Figure 4-5 a) Airbus full-flight simulator (Leiro, 2016), b) cockpit of CAE flight simulator
(Leiro, 2016) ................................................................................................................................. 35
Figure 4-6: drilling console for DrillSIM:50 ................................................................................ 39
Figure 4-7: NOV-HIL drilling simulator room ............................................................................. 42
Figure 4-8: view from the Driller's cyber chair of NOV-HIL simulator ...................................... 43
Figure 4-9: live simulation of CPR ............................................................................................... 44
Figure 4-10: virtual simulation of CPR ........................................................................................ 46
Figure 4-11: constructive simulation of CPR ............................................................................... 47
Figure 4-12: unconventional vs conventional wells in the US ..................................................... 48
Figure 4-13: drilled footage and well counts (EIA 2020) ............................................................. 49
Figure 4-14: machine learning applications for drilling operations (Olukoga and Feng 2021) ... 52

xii
Figure 5-1: DRM's stages and integrated phases .......................................................................... 54
Figure 5-2: claw machine reference for helping draw the TDS .................................................... 56
Figure 5-3: Learning drilling in 10 seconds lecture slide ............................................................. 56
Figure 5-4: student-drawn illustration of the drilling console ...................................................... 58
Figure 5-5: simulator setup for DRM experiment ........................................................................ 61
Figure 5-6: rate of drilling task completion across phase and complexity ................................... 66
Figure 5-7: time to completion for beginner-level tasks ............................................................... 67
Figure 5-8: time to completion for intermediate-level tasks ......................................................... 68
Figure 5-9: time to completion for advanced-level tasks.............................................................. 69
Figure 6-1: everyday drill rig tasks; all involve some degree of cognitive energy ...................... 76
Figure 6-2: using a stage spotlight as an analogy for cognitive attention ..................................... 78
Figure 6-3: the cocktail party effect .............................................................................................. 80
Figure 6-4: simulator setup for the Verbal Shadow Drilling Study .............................................. 84
Figure 6-5: audio/video stimulus of rainfall used for active-control stages (YouTube) ............... 88
Figure 6-6: general-purpose audio/video distractor of rig equipment (YouTube) ....................... 89
Figure 6-7: proposed flow of the training stage ............................................................................ 92
Figure 6-8: averaged completed tasks and cumulative errors for the VSDS ................................ 97
Figure 6-9: baseline drilling performance in the Active-Control condition ................................. 99
Figure 6-10: distracted drilling without verbal shadow versus baseline performance ............... 100
Figure 6-11: distracted drilling with verbal shadow versus baseline performance .................... 101
Figure 6-12: averages of baseline, No-Shadow, and With-Shadow ........................................... 102
Figure 6-13: "How useful was verbal shadowing for distracted drilling?" survey question ...... 103

xiii
List of Tables
Table 1: DRM task parameters ..................................................................................................... 63
Table 2: desired parameters for the unscripted "Natural" Phase A............................................... 64
Table 3: "Imperfect" phrase examples from Phase B ................................................................... 64
Table 4: "Perfect" phrase examples from Phase C ....................................................................... 65
Table 5: examples of drilling task requests ................................................................................... 87

xiv
List of Abbreviations and Acronyms
As with most technical writing, there is an abundance of industry-specific jargon and acronyms
found herein. To optimize the flow of reading and writing, many abbreviations are initially
defined and then carried forward throughout this text.
AD Assistant driller
AI Artificial Intelligence
BOP Blowout preventer
CPR Cardiopulmonary resuscitation
CRM Crew Resource Management
DoD United States Department of Defense
DRM Driller’s Roadmap Language experiment
DS:50 DrillSIM:50 drilling simulator
DSC Drilling Simulator Center
ECD Equivalent circulating density
EEG Electroencephalography
ES Engineering simulator
HIL Hardware-in-the-loop
HF Human factors
HFES Human Factors and Ergonomics Society
HFS High-fidelity simulator
HSE Health, safety, and environment
IADC International Association of Drilling Contractors
IWCF International Well Control Forum

xv
IxD Interactive design
LVC Live, Virtual, Constructive simulation
M&S Modeling & Simulation
MMC Multi Machine Control
NOV National Oilwell Varco
OU University of Oklahoma
PD Product design
PS Procedural simulator
PTS Partial-task simulator
ROP Rate of penetration
RPM Revolutions per minute
SA Situation awareness
SCM Swiss Cheese Model
SOP Standard Operating Procesures
SPM Strokes per minute
TDS Top drive system
UDL Universal Drilling Language
UI User Interface design
UX User Experience design
VSDS Verbal Shadow Drilling Study
WOB Weight on bit
xvi
Abstract
Drilling is perhaps the most revolutionary advancement humanity has ever experienced.
Since its invention, man has seen extraordinary and rapid improvements in quality of life. At the
core of drilling’s rapid evolution are the deep motivation for improving performance, profit
margins, and efficiency. But with all of the advances also comes more significant risks to
humans and more demanding operational settings. One issue of late is the growing divide
between drilling technologies and the humans who invented them. Human involvement in the
drilling process is dramatically decreasing while all the new technological solutions keep moving
in. Yes, machines and technology might be bearing more of the workload, but there will always
be a need for humans during the drilling process – invention, input, intervention, and
termination. Furthermore, as long as companies continue to preach “safety” and “efficiency,”
there will always be a requirement for keeping humans “in-the-loop” of drilling’s future
innovations.
This thesis spans many essential topics from both sides of this growing divide. Perspectives
helping push the human-centric concept forward include practical applications borrowed from
cognitive psychology, design, human factors engineering, and crew resource management. The
machine perspective is a review of drilling simulators and mathematical approaches, plus a
proposal of the future of drilling machines due to spec-driven technological requirements and
future drilling applications. This thesis also presents a series of drilling simulator experiments
that test humans' communication and awareness abilities, and the cumulative results suggest that
the drilling industry might benefit from a standardized drilling language. This thesis concludes
with ideas for future research and a new framework to adopt. Above all, this thesis encourages a
new paradigm that promotes innovation while bridging the gap between humans and drilling
machines.

1
1. Introduction
This thesis does much more than present a narrow focus on a subtopic from previous
knowledge. It also provides many novel contributions to the future directions of drilling,
simulation training, and human factors. This chapter highlights the underlying motivations
before outlining the goals and structure of the thesis.
A. Motivations
While most of my colleagues and industry professionals pursue technical-, mathematical-, or
data/information-driven careers, I have not. Instead, I have blazed my own path with more
humanistic motivations like human connection, communication, and coaching. These
motivations are based on my personality and the natural skills I have gained through the years.
A sharper motivation for the direction of my work comes from a personal anecdote. Early
into my career (working as an MWD engineer in Deepwater Gulf of Mexico), I was
unexpectedly assigned to a new drillship. For an MWD, this usually means an inconvenient
learning curve: working with a new crew, schedule, surface system setup, and more. In the early
hours of my first unsupervised night shift, everything was working just fine – downhole tools,
surface sensors, my computers, even the weather. Unfortunately, one part of the operation was
not in sync with the rest – me. When I came on tour, the drilling crew provided me with a two-
way radio to communicate to the drillshack when necessary. After a routine drilling connection
and survey task, the drillers call angrily into my shack. While I thought my good survey was
displayed obvious on their monitors, they were waiting for me. Apparently, on this rig and with
this crew, my radio communication after a survey is required. One mistake led to another. Later,
the crew stopped again because they misinterpreted my message. I was embarrassed, and
nervous because drillships are expensive! I had cost the operating company thousands of dollars
because of my communication errors. This stinging memory has stayed with me to today.
i) Human connection
I am inspired by and crave human connection, a uniquely personal perspective that I
attempt to apply to my drilling and petroleum engineering interests. This craving for

2
connection also inspires my desire to help the drilling industry keep the “human-in-the-
loop.” My vision is that future drilling generations will continue to innovate
Lastly, because I care so much for the human condition, I feel a moral and ethical
obligation to help protect the drilling world. Health and safety are common themes
throughout this work.
ii) Communication
Another personal motivation comes from my love of communication, which has its own
subset of skills and potential. The ability to handle abstract ideas and convey them back
and forth with the world is a beautiful miracle and one that I embrace with all of my
extroversion. This motivation comes through clearly in this thesis as one of the
significant recommendations is a drilling-specific communication language.
iii) Coaching
I love to teach and coach others. The experiments designed and explained here are more
than research. They also serve as training (or “coaching”) for those that participate. My
passion for connecting and communicating with humans converges with petroleum
engineering, and the result is a proposal for drilling’s first-ever communication
framework.
B. Outline of the Thesis
The structure of this thesis takes the form of chapters, sections, and subsections, as follows:
• Chapter 1 outlines the purpose and structure of the text.
• Chapter 2 presents how the current state and directions of the drilling industry finds
influence from a diverse history across geographic location, energy source, drilling
technology, and applications. This chapter also provides an updated paradigm for
dealing with the industry’s ongoing and future transformations.
• Chapter 3 reviews some human influences on the drilling industry. Major sections
include human factors, crew resource management, communication, situation
awareness, and cognition.

3
• Chapter 4 reviews the machine, technology, and non-human influences for drilling.
Extensive detail for drilling simulators is present in this chapter’s primary section.
• Chapter 5 is the Driller’s Roadmap Language Experiment. This study considers the
redesign and application of effective communication for drilling-specific tasks. A pair
of research participants are asked to complete drilling tasks in a drilling simulator, but
the rules for how they communicate is varied across three phases of experimental
testing.
• Chapter 6 is the Verbal Shadow Drilling Study, an experiment surrounding the
cognitive concept of attention in a simulated drilling scenario. A research participant
must use a verbal shadowing technique to help focus their attention while attenuating
distraction. Distraction varies across different drilling scenarios that differ by external
stimuli.
• Chapters 7 and beyond are home to the references and appendices that provide
background and support to this work.
2. Drilling Diversity and Transformation
This chapter is not meant to provide a brief history of drilling. Instead, it highlights the many
and different divisions the industry has experienced since its recent beginning. By closely
examining past diversity and current trends, one can better understand how and why a disparity
exists between humans and machines. This critical understanding will enable us to embrace new
frameworks, optimize before future developments, and subsequently “bridge the gap.”
A. Diversity Within the Drilling Industry
i) By location
One of the most obvious ways to demonstrate the diversity of the drilling industry is by
acknowledging the vast stretch of geographic locations. Now, depending on the definition
of drilling, it is difficult to pinpoint the exact number of countries and cultures that the
industry has impacted. For a quick example, one can look at a 2017 map of the world’s
proven oil reserves and see that drilling (for oil) is happening on all the major continents
(Figure 2-1). Some estimates even show that a majority of the world’s oil is found in

4
around 1500 fields, spanning approximately 25 countries (Ivanhoe and Leckie 1993).
That is a lot of different languages and standards of operation.
Figure 2-1: world map of oil reserves (EIA 2017)
ii) By source
Another perspective to demonstrate the breadth of the drilling world is by looking at what
drilling is aiming for (i.e., the sources). While the first few sources were not derived from
drilling, they are still helpful for giving perspective to the “extraction from earth” story.
Although drilling was not the exact extraction mode, there was still a degree of digging,
boring, or mining involved. Dates and locations are approximate.
• Coal (China, 2000 BC via drift mining and bell pits)
• Natural Gas (China, 200 BC via boring and bamboo pipes)
• Nuclear energy (e.g. Uranium – Czech Republic, early 19th century via
mining)
Before fossil fuels (mid-19th century), wood was the primary energy source for heating,
cooking, and lighting (EIA 2021). Today, there is a much more extensive portfolio of
energy sources and a wide range of collection methods to match. This mix comes from a
mix of non-drilling renewable sources (like solar, hydroelectric, wind, biomass) and

5
drilling-related energy sources. Drilling for non-renewable resources is mostly focused
on energy and includes:
• Petroleum
• Hydrocarbon gas liquids
• Natural gas
Drilling for renewable resources is currently a very small list but includes:
• Geothermal
• Water (not for energy)
Figure 2-2: 2020 U.S. energy consumption by source (EIA 2020)
Renewable resources were the primary energy source for most of human history, but non-
renewable energy resources have become the majority of the last two centuries. For an
example of drilling’s modern-day importance, the resources extracted by drilling make up
68.8% of the United State’s energy consumption in 2020 (EIA 2021).

6
iii) By technology or application
While most of the history of drilling focuses on extraction for energy sources, drilling is
an essential technology for many other reasons: extraction of non-energy mineral
resources (e.g., gold, silver, sand, Uranium), injection and storage (e.g., industrial waste,
wastewater, hydrocarbon), underground excavation and infrastructure, environmental
remediation and monitoring, as well as for research (National Research Council 1994).
When it comes to the primary scope of this thesis, drilling refers to the mechanical
drilling techniques involved in energy extraction. This subsection highlights many of the
technological advancements that have helped unlock new waves of progress for drilling.
• Spring pole drilling – manual reciprocation method using a long wooden pole,
fulcrum, counterweight, downhole tools like a percussion bit, and a lot of manual
labor. This was the first known mechanical drilling method for earth.
• Four-legged derrick – the physical structure of modern rigs enabled for supporting
heavier equipment, deeper wells, and more. Today, derricks come in robust sizes,
shapes, and materials.
• Water circulation – system to help remove cuttings, lubricate downhole equipment,
and eventually to help support downhole pressure difference.
• Evolution of cutting methods – rotary auger, drilling jars, percussion, reverse
circulation, diamond core, and compressed air are all unique methods explored.
• Rotary table – a drilling system in which the rotating equipment exists at the drilling
floor.
• Top drive systems – drilling system in which the rotating, hoisting, and circulation
systems all exist at the same location, and above the drilling floor.
• Reaming – drilling tools which then allowed for smoother and wider holes thereby
enabling better wellbore geometries and new completion/production systems.
• Horizontal drilling – This application grew wildly after the discovery of
unconventional energy sources like shale gas in horizontal lithologies (unlocked by
hydraulic fracturing completion techniques). Directional drilling was initially
accomplished by specialized downhole angled motors.

7
• Rotary steerable – the ability to directionally drill a well became much more effective
and precise with the invention of technology that allowed the drillstring to rotate
continuously and a pivot point closer to the bit.
Note: this is an extremely concise list compared to all of the amazing technology that has
shaped the industry. Some advancements were large and obvious, but many
advancements came from minuscule changes. An entire thesis, book, or course could be
dedicated to this topic. However, to broaden the concept just a little bit more, a few other
methods are also worth mentioning for their “hole-making” ability. Thermal drilling,
trepanning, laser drilling, and ice boring are just a few examples of alternative or adjacent
methods.
These lists are not exhaustive. Rather, this section intends to show how broad the drilling
industry is. There is some crossover between location, source, and application, but there is just as
much separating them. Thus, it is disadvantageous to get caught up thinking about drilling from
only a single perspective. Instead, this thesis offers multiple paradigms across multiple
disciplines to help unify and strengthen the drilling industry. This research believes in the future
of drilling, so bringing its humans and future machines closer together is a monumental step.
B. Proposal of the Human-Machine Axis
There has always been a healthy amount of diversity and change for the drilling industry.
However, the transformations of the last decade are occurring at warp speed, especially
compared to the previous two centuries. Currently, drilling companies are committed to
impressive and pervasive visions like net-zero sustainability and digital transformations. These
new trends and motivations are valuable and worth pursuing, no doubt. But there is an essential
piece of the puzzle too easily overlooked– the humans.
Upon scouring the “About Us,” mission statement, and vision website pages of the industry’s
leading companies, one does not have to look very far to see that humans are still the central key
to unlocking all innovations. While machines and technology might be taking more of the
workload, there will always be the need for human involvement and intervention. This is an
inexcusable fact. Listen up. As long as companies continue to cite “safety,” protecting their

8
people, and “efficiency” of their drilling operations, there will be an ever-increasing need to
consider the adoption of the mental framework known herein as the Human-Machine Axis.
Throughout this text, the human is always referred to before the machine, and this is an
important distinction to pick up on. It becomes clear that addressing human-related factors for
drilling is still just as necessary as all the machine-, technology-, and simulator-related factors.
For this reason, a new paradigm needs consideration. At all points into the future, someone needs
to be thinking, “how do our humans fit into the picture?”
i) Human Axis
Thinking on the human side of the axis is not new, thankfully. A depth of literature
supports concepts such as human involvement in high-reliability fields. But for the
brevity of this thesis, only five main topics are explored:
• Human Factors
• Crew Resource Management
• Human cognition
• Communication
• Situational Awareness
ii) Machine Axis
Thinking on the machine axis is a newer perspective that needs to be embraced. The
innovations from the machine axis are happening at warp speed, and therefore an
awareness of it is greatly needed. A few main machine-related viewpoints explored in
this thesis include:
• Specification-driven technology
• The digital (data) revolution
• Drilling simulators
• Mathematical and algorithmic approaches like machine learning, data mining,
artificial intelligence, and the like

9
iii) Human-Machine Axis
The proposed human-machine axis should consider all aspects of a human’s strengths and
weaknesses in drilling, so the above topics are only a starting point. Furthermore, there is
no perfect ratio between humans and machines. Each process, task, or operation will
likely need a unique ratio. Without a doubt, some processes need to be fully automated
by algorithms and machines. Meanwhile, other processes will forever require human
inputs for cognitive, ethical, or practical reasons. Three examples of this human-machine
balancing act are shown in Figure 2-1: how a drilling crew handles pipe connections
during tripping operations, how a driller creates drilling reports, and how a drilling crew
detects and handles a drilling kick.
Figure 2-3: proposed human-machine axis for drilling innovation
10
According to the proposed axis, the general trends suggest that as machines get more
involved, the drilling activity will get safer and more efficient – this is the ultimate goal
with innovation, so this makes sense. But the three examples in Figure 2-3 tell a deeper
story.
• Processing drilling reports was once written entirely manually and was more or
less for record-keeping and eventually became more useful for similar wells,
locations, and applications. Once computers made their way into the industry,
drilling reports were standardized, typed more quickly, and could be saved and
searched much easier. A future idea for drilling reports (that involves much more
computer interaction and algorithms) would be voice-recognized/dictated reports
in real-time. A secondary future step would be to have a system that predicts rig
activity and recommends actions to the team.
• Handling drill pipe connections on the rig floor has already come a long way in
the past few decades. This process was once extremely high-risk and involved
multiple men using chains and close proximity to thousands of pounds of force.
With the invention of powered (or hydraulic) tongs, both efficiency and safety see
significant improvements because less manpower is needed, while pipe makeups
become far more consistent. In the pursuit of fully automated drilling rigs, there
are many rigs capable of doing pipe handling and connection makeups without
any men on the drill floor. For example, National Oilwell Varco uses their Multi
Machine Control (MMC) system with mostly automated steps. The Assistant
Driller can operate ALL of the rig floor equipment using ONE joystick,
advancing from task to task with the push of a button.
• Detecting and handling a well kick is one of the most well-known high-risk
activities on a drilling rig. Unfortunately, most experienced drilling personnel will
experience and handle multiple drilling kicks in their careers. The training,
equipment, and methods behind well control are essential to the industry’s success
and future. Until today, detecting and handling a kick have been done mainly by
man: constant vigilance of surface sensor data, subjective detection of kick,

11
unpopular decision to handle kick, manually/hydraulically function equipment,
and finally the human touch of working the remote choke to release pressure on a
hand-calculated schedule. Now that data analytics is getting more involved, the
process of detecting a kick is pushing drilling crews into a hybrid model.
One very important reason this example is included on this axis is that it is an
example of adding more human involvement to push the overall process higher
into safety/efficiency. It is not impossible to think of a system capable of
detecting the driller’s awareness and thereby adjusting the algorithm's control of
detection/handling. Similar to MMC, a well control process should allow the
human to input the calculated pressure schedule and then move all of the required
equipment for the driller.
Again, there is no perfect ratio. Instead, this thesis proposes that the drilling industry
needs to reconsider the entire continuum. Designing the future of the industry with
only technology in mind would be a terrible mistake. The future success of the
drilling industry needs a healthy balance between the two sides.
C. Design for Drilling’s Future
One of the repeated themes of this thesis is the idea of keeping “humans-in-the-loop” and
designing for a unique industry-specific application. The drilling industry should continue to
borrow great ideas from and then test/fine-tune them. One of the most frequent sources drilling
borrows from is aviation, a high-risk and technology-reliant industry. But there is also a case to
be made for a softer source – the field of design. While design primarily revolves around
translating ideas into form, it now encompasses form, function, analog, digital, and much more.
Understanding how to design with the human (drilling) mind in consideration is essential for
bridging the gap between humans and machine.
Design concepts like Product Design, User Interface/Experience Design were born around
Human Factors, but their latest iterations might be the most impactful yet. This section focuses
on these concepts, so bridging the gap becomes a process of synthesizing knowledge and

12
methods from different disciplines. The shift from an intradisciplinary approach to a
multidisciplinary to an interdisciplinary is one goal of this thesis.
For simplicity, the word “product” is used in place of “machines,” “software,” or any other
term related drilling equipment/tools.
i) Product Design
Product Design (PD) is a principle that comes from the overarching perspective of
Industrial Design and has been around much longer than the following design concepts.
Fundamentally, PD involves building a good, service, or product with a specific end goal
in mind. A problem is defined, and its solution is specifically designed. These solutions
are meant to satisfy the creator's needs, and thus they are company-, task-, or purpose-
built. As a result, product design ends up being more business-oriented.
For drilling’s context, most technical innovations in this industry likely stem from an
overemphasis on product design. There is much overlap between design techniques, but
PD treats a user’s needs as secondary. This thesis consistently encourages a shift to a
more human-centered approach.
ii) User Interface/Experience Design
While some design approaches center on an end goal, many newer approaches have
evolved to focus on a process goal and are primarily user-centered. Two of these are User
Interface Design (UI) and User Experience Design (UX). In the modern day, these user-
centered disciplines are mainly used in digital contexts (electronic devices, for example),
but as one design consultant suggests, “the experience of users does not stop at the edge
of the screen” (Boag 2017). This text treats UI and UX as the more generalized
relationship between humans and systems/products (whether digital or physical).
The exact definitions of UI and UX vary wildly. As creative disciplines, their rules and
applications have transformed a lot in their short 20 to 30-year history. Instead of cherry-
picking the most convenient definition, these concepts are explained using accessible and
simplified perspectives.

13
User experience design is the creative process concerning how a user will interact with a
product and is often more conceptual in nature. UX design will often depend on an
information architect's ability to research, observe, and understand a user’s behaviors and
point of view across many scenarios. A UX designer might also put together prototypes
and test/refine them with the intended users. Where the user experience begins and ends
is often up for debate, but the central theme of UX is that how a user interacts with a
product should have as little friction as possible. Usability is everything.
When it comes to UI, this design concept is an indispensable complement to UX. User
Interface design enables a user to make sense of the product. Put another way, if UX is
the “left-brain,” then UI would be the “right-brain.” While UX often deals with the
conceptual function and interactivity, UI deals with a product’s specific form. This design
principle is much more surface-level – visual design and the other elements that make a
user’s journey with a product possible. UI might be the job of a graphic designer who
concentrates on features like color, balance, contrast, spatial layouts, typography, texture,
and more. Keep in mind that UX does not necessarily have to come before UI. Instead, it
is the collaboration amongst designers and engineers that ultimately leads to a successful
and usable product.
iii) Interaction Design
The previous design principles are used consistently throughout most industries, and
drilling is no exception. In fact, many of the drilling industry's major operating and
technology companies already employ UI/UX designers. Unfortunately, in the posted
minimum requirements, the companies do not require any previous experience in
drilling/industry. This absence of industry-specific experience is rather unfortunate and
could be unfavorable for drilling “products” to be adequately optimized for their drilling
humans and applications.
Drilling companies looking for UI/UX designers is an example of a multidisciplinary
approach when multiple disciplines bring their different perspectives and ideas to the
table. Instead, this thesis proposes to keep the “human-in-the-loop” as much as possible,
14
so it might be better to have an interdisciplinary approach, where multiple disciplines
come together to synergize their ideas rather than merely adding unique perspectives.
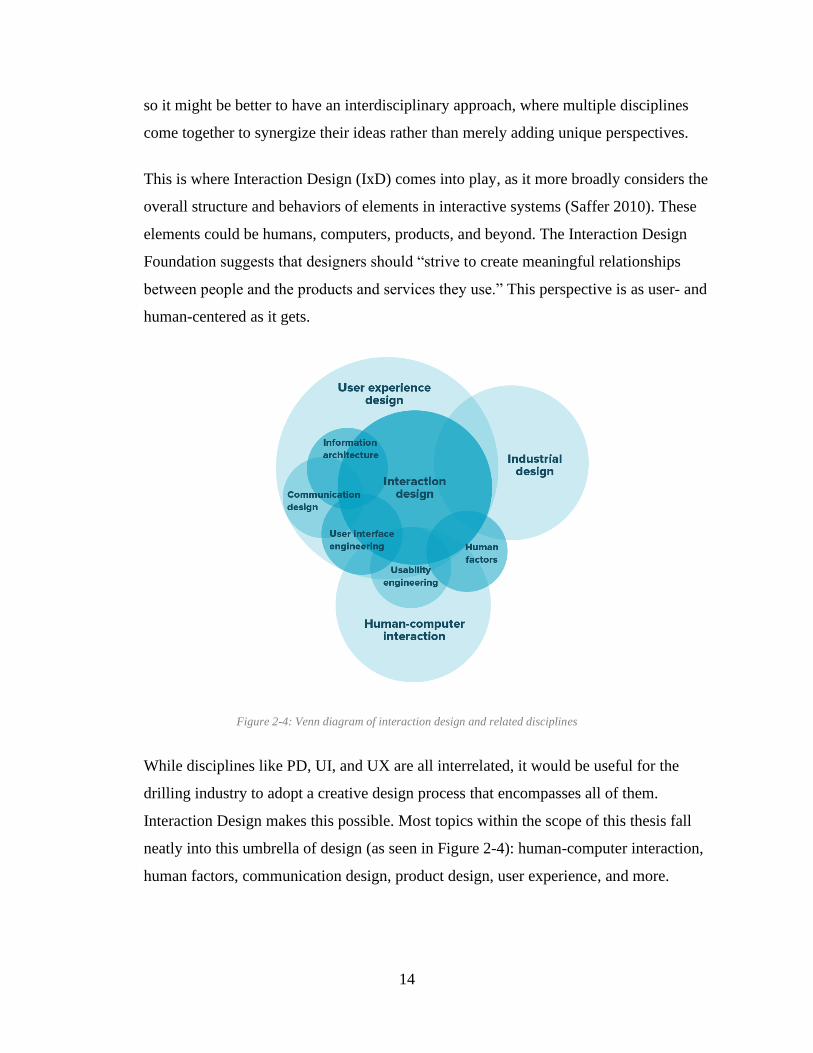
This is where Interaction Design (IxD) comes into play, as it more broadly considers the
overall structure and behaviors of elements in interactive systems (Saffer 2010). These
elements could be humans, computers, products, and beyond. The Interaction Design
Foundation suggests that designers should “strive to create meaningful relationships
between people and the products and services they use.” This perspective is as user- and
human-centered as it gets.
Figure 2-4: Venn diagram of interaction design and related disciplines
While disciplines like PD, UI, and UX are all interrelated, it would be useful for the
drilling industry to adopt a creative design process that encompasses all of them.
Interaction Design makes this possible. Most topics within the scope of this thesis fall
neatly into this umbrella of design (as seen in Figure 2-4): human-computer interaction,
human factors, communication design, product design, user experience, and more.

15
3. Review of The Human Axis
This chapter outlines fundamental knowledge helping support the rest of this thesis from the
human-centric perspective. Additionally, this chapter highlights many of the author’s lesser-
known motivations while providing ideas for future implementation.
A novel approach is necessary for the future development of the drilling industry, and much
of it comes from the human perspective. Sections of this chapter’s discussion include an
overview of human factors, current models for human-involved work, preexisting
communication protocols, and some influences from cognitive psychology. Some of these
concepts are interrelated and congruent, while others are seemingly less consistent. This review
lays the theoretical groundwork for why drilling systems must continuously and appropriately
focus on their human inputs.
A. Human Factors
Modern engineering and high-risk operational settings, like the drilling landscape, require a
more profound understanding of human factors. In a broad sense, the objective of the human
factors discipline is “to optimise the relationship between the human operator, technology and
the environment” (Adams 2006). Moreover, the human factors (HF) concept spans many
different disciplines (e.g., ergonomics, aviation, user experience, visual design) and can involve
the study of human performance, human-computer interactions, design, and technology. Based
on the advancements of man and technologies, there is an extremely wide range of definitions for
HF.
The Human Factors and Ergonomics Society (HFES) cites nearly twenty different definitions
from professional societies, scientific literature, government agencies, industry, and open
sources. The most common theme for human factors is understanding how to apply human
thinking and behaviors to elements of a broader system.
When it comes to risk analysis and risk management, one of the most helpful contributions to
the field is the Swiss Cheese Model (SCM), a model by James Reason in 1990. The basic
concept is that the likelihood of an accident can be mitigated by layering different barriers

16
behind one another. Furthermore, each barrier might represent a different source of failure:
institutional, organizational, team, individual, technical, to name a few. Like Swiss cheese, each
of these layers of defense has its own set of “holes,” or weaknesses, that contribute to the entire
system’s risk profile. Practically speaking, each defense barrier/slice’s weakness will vary in
position and size; therefore, a major accident is only possible when all of the less-apparent and
active errors line up, creating the “perfect storm.” Mismanagement of hazards (input to model)
can lead to losses (output of model). An example of this model (with an application to the
offshore drilling world) is shown in Figure 3-1.
Figure 3-1: Swiss Cheese Model for offshore operations (Mainside Limited 2018)
The most memorable accident in drilling’s recent history is the drilling rig explosion and fire
at the Macondo Well, which led to 11 fatalities, 17 injuries, and severe environmental damage.

17
The post-accident investigation (US Chemical Safety Hazard and Investigation Board 2016)
highlights a comprehensive number of human errors: organizational influences, confirmation
bias, fatigue, distraction, simultaneous operations, communication gaps, competency, non-
technical skills, among others. Other notable Human Factor events from other high-reliability
industries include the accidents of Chernobyl (nuclear), Texas City (onshore refinery), Air
France Flight 447 (aviation), and Piper Alpha (offshore production). These accidents led to the
short-term deaths of 90, 15, 228, and 167, respectively.
This review of Human Factors and the notable accidents from high-reliability industries
make a strong case for the inclusion of human-centric systems. Ideas that support a human-
centric approach are detailed in the following sections of Crew Resource Management (groups of
humans working together), cognition (the study of the human mind), communication
(transferring ideas between humans), and situational awareness (human attention during an
operation).
B. Crew Resource Management
One of the earliest motivations in developing this thesis was understanding the overall
concept of Crew Resource Management (CRM), its application in other industries, and whether
it can also help improve the drilling industry. This section provides a definition and discusses the
basic tenets of CRM.
In its original form, Crew Resource Management is a “specialized form of human factors
training” and emerged as a more immediate response to serious aviation accidents (Flin et al.
1998). Many of the suspected leading causes of these accidents, identified as early as 1979 at a
NASA/Industry workshop, were HF influences, including failures with interpersonal
communication, decision making, and leadership (Cooper, White, and Lauber 1980). The
research surrounding CRM has since identified many more causes, including problem-solving,
stress management, and much more. Adjacent to the NASA proceedings was a flight simulation
study that observed the vigilance of airline pilots. Measures of heart rate (an indirect
measurement of arousal) were recorded and compared against the pilots' performance metrics.
The results show that higher workloads and longer exposures to “aircraft abnormalities” led to
increased errors and decreased overall performance (Ruffell Smith 1979).

18
One of the biggest takeaways from these early CRM investigations is the need for
standardized and industry-wide training of airline crews. Today, this involves a combination of
classroom lectures, practical exercises, simulator training, case studies, films, and more. Much of
this training now revolves around a handful of core tenets. The following tenets of Crew
Resource Management are readapted from a depth of literature (Flin, O’Connor, and Crichton
2008) (O’Connor and Flin 2000) (Flin and Wilkinson 2013), and these modules are commonly
cited across many different CRM training curriculums:
• Communication. This module is considered the foundation of all the modules, and is
explained in-depth later in this chapter.
• Situational awareness. This module is also explained in-depth later in this chapter.
• Decision making. This is the step-wise process involving the selection of an action,
executing that action, and assessing the resulting outcome (Flin et al. 1998). For
applications involving a high degree of Standard Operating Procedures (SOP), such
as a flight, there can be a large division between standardized pre-determined
decisions and those that are made spontaneously by humans. Balancing the decision
architecture between procedures and humans can be difficult, but teaching crews how
to make decisions using sound reasoning and communication can make a great
overall impact.
• Teamwork. The power of working as a crew lies in the cumulative effect of
indivudal efforts. Whethere a team is small or large, a common theme is that
differeing personalities and approaches must come together for achieving a common
goal. This category of CRM relies on team-specific and non-technical skills such as
maintaining team focus, considering others, supporting others, team decision making,
and resolving conflicts (O’Connor and Flin 2000).
• Leadership/supervision. A critical component of a team’s success lies in the ability
to work cohesively as a unit, and under the efffective supervision of a designated
leader. Hawkins (1987) defines this sort of leader as the “person whose ideas and
actions influence the thought and behavior of others”. Apart from using effective
communication, a leader helps by providing guidance and direction while also

19
maintaining the standard. The leader does not need to be an expert in CRM, but
should naturally embody and practice the core tenets.
• Awareness of performance shaping factors. While the previous modules are more
universally understood and applicable, this one is the most specific towards varying
human factors and scenarios. There are large individual, personal, and contextual
differences among different scenarios and this module can help identify, assess, and
augment those. Some of these differing sources “can be imposed by external factors
such as organizational and task design, team structure and work schedule, and the
design and layout… as well as cultural and environmental factors” (IOGP 2014).
Again, this module is diverse. Another perspective to help understand it is thinking
about all the factors that might keep an individual/team alert and performing at a high
level. This modeule can help improve awareness around and highlight factors like
stress, fatigue, distractions, health, shift patterns, environmental settings, and much
more.
The above modules of CRM are well established and defined for the aviation industry, but
“in order to train (or assess) non-technical skills, the specific skill set for a given occupation
should be determined” (Flin and Wilkinson 2013). So, while CRM originates with the aviation
industry, it is important to understand how it has been adapted for other high-risk and high-
reliability industries. Lessons learned in one industry can dramatically shorten the learning curve
for others. In the past few decades, other industries that have implemented their own version of
CRM include airspace, nuclear power plants, other power generation, maritime, surgery. An
important connection to make here, and which will be expanded upon later, is that some of these
industries are the same ones in which simulators started and evolved. Learning, testing, and
iterating using drilling simulators is an important step for human factors and crew resource
management.
Just as early thoughts behind CRM revolved around the “social psychology on the flight
deck” (Cooper, White, and Lauber 1980), this thesis further highlights the need to bring
psychology directly to the drilling rig with more of a “human-in-the-loop” approach. The need
for transcribing and updating the existing CRM models for the drilling industry cannot be
overstated. As an industry that still heavily relies on human intervention, improving the

20
management of drilling crews and teams is needed. For this reason, all of the above CRM tenets
are baked into the experiements designed throughout this thesis. Instead of passively describing
what CRM and its associated modules are, our trainings and experiments actively teach them.
CRM principles are baked into the process thereby engaging our students and research
participants into the paradigm.
Moreover, now that computers and technology are taking a more central role in drilling
processes, the industry needs to reconsider the definition of “crew.” The necessity to consider
machines as part of the crew is essential. Whether for safety or efficiency, the drilling industry
“cannot prevent future incidents without giving equal attention to failures of less visible, non-
physical barriers and support systems” (U.S. Chemical Safety Hazard and Investigation Board
2016). One of the newest and less-understood barriers for the drilling industry is the integration
between humans and its fantastic new drilling machines and methods.
The remainder of this chapter will uncover more possibilities on how we might fill the
current divide between drilling humans and drilling machines. The following sections on
communication and situational awareness are closely linked with the CRM topic, but deserve
their own in-depth explanation. Each of these subtopics are explored at depth in their own
experiments.
C. Cognition
One of the most dominant non-drilling influences on this thesis is the study of cognitive
psychology. This branch of psychology is commonly acknowledged as the “science of the
mind”: how humans think, remember, and know (Reisberg 2016). On a more specific level,
cognitive psychology includes mental processes like visual perception, recognition, attention,
memory, concepts and general knowledge, language, reasoning, problem-solving, creativity, and
more (American Psychology Association 2013). Altogether, these cognitive processes merge to
help us understand how humans behave and derive meaning from the world around us. Of
particular interest to the research done in this thesis are the cognitive processes of paying
attention, distraction, language, and distributed cognition.

21
i) Paying attention and distraction
One of the most significant cognitive processes humans are capable of is that of paying
attention. The American Psychology Association (2013) defines attention as “a state in
which cognitive resources are focused on certain aspects of the environment rather than
on others, and the central nervous system is in a state of readiness to respond to stimuli.”
In recent decades, the study of attention has categorized many different types: arousal,
focused attention, sustained attention, selective attention, alternating attention, divided
attention, amongst others. For simplicity, this section considers the general cognitive
process.
After much research, the general assumption is that there is likely a limited capacity
(Navon and Gopher 1979) for cognitive resources like attention and memory. A
consequence of this observation is the phenomenon of distraction. William James (1890),
one of the earliest cognitive psychologists, suggests that attention has “focalization,
concentration” at its core. He implies that a human must withdraw “from some things in
order to deal effectively with others, and is a condition which has a real opposite in the
confused, dazed, scatterbrained state which… is called distraction.”
From these definitions, much of the research involves figuring out which factors improve
or attenuate focus on a given task. The earliest studies (E. C. Cherry 1953) of the balance
between attention and distraction have included an experimental design known as
dichotic listening (Figure 3-2). In this setup, a participant wear headphones, and a
different stream of speech enters each ear. The participant is then asked to pay attention
to one input (attended channel) and ignore the other (rejected channel).

22
Figure 3-2: dichotic listening test with attended channel (left) and rejected channel (right)
A technique known as shadowing is often used in these tests to help the participant focus
their attention on the attended stimulus and away from the distracting (and hopefully
rejected) one. This technique requires that the participant repeat the stream of speech
from the attended channel, word for word. Cherry’s 1953 results show that participants
using the shadowing technique can repeat almost 100% of the intended stimulus. In a
similar shadowing experiment, Treisman (1964) shows that only 4 of her 30 participants
detect a particular message from the rejected channel.
These same shadowing and dichotic listening techniques are tested in this thesis but
specifically applied to a simulated drilling context.
ii) Language
A central theme of this research is the topic of communication, which is not possible
without the cognitive concept known as language. Generally, language is defined as “a
system for expressing or communicating thoughts and feelings through speech sounds or
written symbols” (APA 2013). On a deeper level, language is actually a hierarchical
structure consisting of phonemes (units of sound), morphemes (units that carry meaning),
words, phrases, and sentences (a single coherent message). Regardless of scope, humans
have an exceptional ability to perceive, interpret, and think using language mechanisms.

23
As it relates to the drilling industry and the research presented here, understanding the
cognitive ability of language is vital for future communication designs. Establishing a
new standardized drilling language is foolish without an appreciation for language’s basic
structure or its link to cognitive thinking.
iii) Distributed cognition
Tying together some of the previous concepts discussed herein (communication, crew
resource management, and situation awareness) is the idea of distributed cognition. As
defined by Razzouk and Johnson (2012), distributed cognition is the “collective cognitive
activity from individual group members where the collective activity has an impact on on
the overall group goals.” This idea is also commonly referred to as shared knowledge,
shared mental models, shared understanding, or team knowledge (Klimoski and
Mohammed 1994). Although there are slight differences between each, these terms will
be used interchangeably here.
To broaden this description, Cannon-Bowers, Salas, and Converse (1993) discuss how
shared mental models can lead to more expert teams versus novice teams. Instead of each
person paying attention to all the minute steps and details individually, the whole unit
ends up subconsciously sharing them. If cognitive resources are limited, sharing them
among a group can be a safe, effective, and necessary strategy.
This ability to share in cognition was commonly observed in many of the YouTube
videos (Appendix 2) analyzed by drilling students. When the drilling floor crews stopped
communicating directly, they still appeared to be in a sort of group “flow.” Making
drilling connections at such a fast pace is an extremely high-risk experience that requires
skill and coordination by multiple team members. Previous research shows that it is
possible to distinguish between individual and team-based mental models and that
“expert teams tend to share cognitive processes and complete tasks similarly” (Mathieu et
al. 2000). Knowledge, skills, attitudes, and more can all be shared across teammates.
How a team interacts across specific jobs, tasks, and with certain equipment all lead to
different degrees and types of shared cognition.

24
As an example, it is easy to assume that throwing a night-shift driller into the day-shift
crew might drastically alter the performance of the crew. As a result, the efficiency and
safety of drilling performance might also depend on shared cognitive tools and
approaches. This is something to be aware of and worth testing in future experiments.
Furthermore, this is an important concept to consider when programming future
communication and CRM protocols for the drilling industry. Understanding the
psychology of an individual is essential, but understanding an entire team’s psychology
can help improve team performance even more.
iv) Heuristics
Heuristics, a mental “shortcut,” is a cognitive tool for solving problems and making
decisions more efficiently (APA 2020). Heuristics are an experience-based strategy that
usually leads to a faster outcome but cannot guarantee success. There are many examples
and models, such as the availability heuristic, representative heuristic, and systemic bias.
Teodoriu and Salehi (2019) explore some of the most important and common heuristics
that humans make in well integrity decision-making, such as falling into the traps of
status quo and confirmation bias. They recommend that industry professionals should
receive training with psychological biases and heuristics in the form of case studies.
Heuristics can be a major limiting factor for humans and organizations, and it is easy to
imagine these same “mental shortcuts” taking place in other chapters of a well’s lifespan,
such as drilling. Combining an understanding of heuristics with attention,
communication, and other cognitive human factors can help the industry improve its
decision-making and lead to safer and more efficient work.
D. Communication
Communication, as defined by Flin et al. (1998), involves the exchanging of ideas,
knowledge, and instructions via verbal or non-verbal methods. Although communication is listed
as an individual core tenet of Crew Resource Management, it is best understood as the
foundational skill supporting all other modules.

25
Communication is the fundamental skill required for humans to live and work together
towards a common goal. From personal relationships to professional encounters, meaningful
progress is made possible with effective communication. The drilling industry is no exception.
Because the drilling sector is such a team-oriented and “live” process, communicating effectively
is essential for safe and efficient work. Moreover, the drilling industry has the power (and
obligation) to train its professionals to become more effective communicators. This thesis
demonstrates that using real-time technology to train humans will safely and efficiently drive the
drilling industry forward.
This section is an analysis of different perspectives on communication. Before studying and
teaching trainees using drilling simulators, it is important to have a loose understanding of the
primary communication types. Then, we can apply these to our engineering and drilling projects.
v) Types of Communication
Communication is a very broad field, so the following descriptions of types is only a
starting point. When it comes to communication mode, the most dichotomous perspective
is verbal versus non-verbal. The following points are developed from multiple
presentations by Kamelia Gulam (professor at the University of Jeddah), but
communication information is pervasive on the Internet. Definitions and applications
vary widely.
Verbal communications refer to the dissemination of ideas through words and can
typically include oral or written mediums. Oral communications can be quick, flexible,
and personal, but can suffer from message length and lack clarity. Written
communications use signs and symbols and more fit for lengthy messages.
Non-verbal communications can include mediums like kinesics (body language),
haptics (touch), proxemics (spatial), chronemics (timing), sign languages, and
paralanguage (like pitch and volume).
These two types of communications can be found in all sorts of scopes: intercultural,
interpersonal, intrapersonal, mass, organizational, and in a dizzying amount of modes:

26
conversation, book, film, radio, television, mail, etc. A comprehensive study of
communication is well beyond the scope of this thesis, but the main point for our research
is to be aware that communication is a multi-modal (and necessary) part of human-based
research. Learning how to use and study communication is vital for the success of this
thesis’ vision.
vi) Using Non-staged Videos to Study Communication
The author and supporting research team use an innovative teaching method to help
students better understand how and why communication matters at the drilling rig. This
updated approach is necessary because education’s current teaching methods are aging,
while the expectations of new learners are radically shifting. Engaging Generation Z
(born 1997-2012) and Alpha (born 2012-current) learners is proving to be far different
than previous generations, and the classroom needs to adapt to their needs (Schwieger
and Ladwig 2018). One of the standard means of conveying knowledge today is through
the archaic means of a static slide show. Our more dynamic, efficient, and engaging
method is through analysis of publicly available videos. This newer technique also brings
a greater level of realism, which fits in well with this thesis’ focus on simulation-based
training.
Further motivation for this video analysis method is the fact that creating original videos
for the classroom is not simple. Instead, this is usually a very time, money, and labor-
intensive process. Plus, when producing videos in-house, they are overly scripted and
staged. This results in a non-realistic view of the material, and the intended stimulus is
potentially lost. Today, several online multimedia platforms allow users to upload videos
spanning all genres and applications. For our use, a quick search reveals an abundance of
oilfield-related videos. While many videos are posted to advertise company products or
services, others help share technical knowledge and personal experiences. We use the
latter for classroom teaching and safety training of our young oilfield population.
For example, one of our classroom exercises focused on rig crews performing drilling
and tripping pipe connections. In one video (“Tripping Pipe Nabors 266“), our students
assigned each crew member a number, defined their roles and responsibilities, and

27
timestamped every observable communication occurrence between them. During this 9-
minute video, the students find a total of twenty-seven positive communication events
alongside five adverse ones. Specifically, there are eight examples of positive nonverbal
communication, including one event of eye contact. The crew member finished removing
the rig tong and simultaneously looked across the rig floor at his partner, who then threw
a thread protector to him (Figure 3-3). No words were exchanged, and it happened all in a
fraction of a second.
Figure 3-3: video analysis – a) eye contact before b) catching thread protector
This exercise becomes even more valuable when the video of interest shows inefficient or
risk-taking crews (like in the video “Canadian Drilling Rig – Worst Connection Ever”).
Of the worst videos analyzed, communication gaps are present at a rate higher than four
“mistakes” per minute.
From the safety and comfort of the classroom, students’ analyses reveal many
problematic and risky patterns in the operations, especially those related to the crews’
verbal and nonverbal communications. Other videos used in this exercise can be found in
Appendix 2.
These findings underscore the fact that effective communication skills is one of the
underpinnings of safety and efficiency at the rig site. Our use of this teaching method
shows evidence that non-staged videos can be analyzed and are suitable for in-class
teaching and training. Whether applied to communication, teamwork, or other concepts

28
discussed in this thesis, this new teaching approach should be considered for future pieces
of training intended for the drilling workforce.
vii) Proposal of the Universal Drilling Language
Language standardization is not a new topic altogether. Other industries, such as aviation
and medicine, have led the way. Many aviation processes are already streamlined via
specific communication protocols, leaving zero room for misinterpretation. As an
oversimplified example, when the experienced Australian captain says “prepare for
landing,” the German copilot knows exactly what to do. The copilot deploys the landing
gear, then follows up with many subsequent confirmation phrases and actions. These two
pilots might speak different native languages, be of different genders and ages, and
routinely fly different aircraft. But, together, they can safely and efficiently get their
cargo and passengers to the target. Is this a reality for a drilling team and drilling target?
What if America’s shale drillers were assigned to work with the geothermal drilling
teams in Romania? Could they at least communicate the basic commands on the drill
floor? Would the management team in the office be able to effectively communicate pre-
section requirements? Probably not… yet. A “universal drilling language” would enable
our hard-working people to reduce non-productive time while minimizing lost-time
incidents.
This Universal Drilling Language (UDL) development could take many forms and might
need to happen over an entire generation of users. If so, some of the earliest ideas for how
to implement it include:
• Start with numbers. The findings from this thesis suggest that standardizing how
numbers are used and communicated might see the most immediate benefit. After
numbers, the UDL could move on to the most common equipment, tasks, phrases,
etc.
• Start with an emerging drilling application, like geothermal drilling, because a
newer landscape might be more likely to accept and adopt new ways of thinking,

29
speaking, acting, etc. After implementation here, the UDL could be tweaked and
then retroactively applied to more traditional drilling applications.
• Start with one company or project. This approach might help the universality of
the proposed language. One can think of so many places a company might iterate
their language: legal work, conversations in the conference room, drilling and
technical reports, onboarding and training instruction, and beyond. Integrating
these communication changes within a community so deeply would improve the
adoption rate and increase the potential and magnitude of permanent change.
Lastly, this approach might serve as a case study for other companies,
applications, or projects.
• Create annual reports, conference proceedings, or associations dedicated to
growing the UDL. These might come in the form of digital training, in-person
simulations, and more.
E. Situational Awareness
Some drilling processes might involve a straightforward and singular task, but most are a
long series of complex tasks involving multiple systems, inputs, and operators. As these
processes become increasingly more complex, so will the risks and potential for disastrous
outcomes. Finally, adding dynamic humans (or brains) to the mix is a recipe for a highly error-
prone situation. These highly dynamic situations require humans to have a loose understanding
of “what is going on around” them or themselves. This general sense is the most straightforward
and practical definition of situation awareness (Flin, O’Connor, and Crichton 2008).
A more complex (but common) definition comes from Endsley (1995): situational awareness
is “the perception of the elements in the environment within a volume of time and space, the
comprehension of their meaning and the projection of their status in the near future.” This
concept of situation awareness (SA) is borrowed from its origins in aviation psychology and has
since been adapted to newer fields: video gaming, anesthesiology, military, and more. Largely,
any field incorporating CRM training has particularly embraced the cognitive concept of SA.
This thesis envisions future drilling simulator experiments incorporating more SA elements.

30
While a critical concern for SA is the dynamic nature of the system or situation, Flin and
Wilkinson (2013) also suggest that humans must employ a dynamic awareness of the changing
task environments, risks, and more. But what leads to a human’s understanding of a situation?
The awareness of “what is going on around you” can be tested with a long list of cognitive tools,
resources, and methodologies. Durso and Gronlund (1999) outline three approaches to assessing
a person’s situational awareness: subjective measures (like self-ratings), query methods
(randomized questions during situation-present), and implicit performance. There are a number
of cognitive tools that impact SA, but Durso and Gronlund consider attention, pattern
recognition, working memory, mental models, and naturalistic decision-making as the most
significant factors.
While not explicitly tested in the current experiments of this thesis, the author acknowledges
its significant role in reality and the lab. Previous research (Kiran et al. 2019; Salehi et al. 2018)
at the OUDSC proves that eye-tracking technology can test SA in a drilling laboratory setting.
Furthermore, the results show that performance correlates with situation awareness, and eye-
tracking might be an effective way to assess and quantify cognitive abilities. Eye-tracking
applications are widespread in other industries, but not learning how to use these applications for
the drilling industry is the next step. Eye-tracking experiments like these will continue to push a
more human-centric approach towards safety and efficiency.
More “human-in-the-loop” experiments should be designed in which SA is the primary
focus. For example, there might be a premeditated interruption in a sequence of drilling tasks
when the participant would be asked a series of questions testing their SA. This mid-task survey
would span three of the most common SA elements: general comprehension of current tasks,
perception of specific elements in the environment, and a prediction of future status. As
mentioned elsewhere in this text, a mid-task SA intervention might also be paired with many
other psychophysiological measures to get a comprehensive view of their attention, situation
awareness, etc. A panel of subjective and objective measures might include pre-/intra-/post-task
self-ratings, electroencephalography (EEG), heart rate variability, eye blinks, or eye-tracking,
just to name a few (Bolstad and Cuevas 2010).

31
4. Review of the Machine Axis
This overview of simulators includes a definition, types of simulators available to industry,
types of simulators available for this study, and the breadth of context they serve. Beyond that,
this chapter will describe how spec-driven technology and innovative mathematical approaches
are shaping the future of the drilling industry. Together, these concepts make up the machine
side of the proposed axis framework.
A. Simulators by Definition and Types
From a semantic standpoint, the term ‘simulation’ began appearing in the literature in the
1950s, when computing technology finally became more widespread. A quick Google Books
search (Figure 4-1) demonstrates the rapid increase of word usage until the 1990s, when
knowledge sharing transitioned to the digital space of the Internet. The word is defined as “to
look, feel, or behave like something else especially so that it can be studied or used to train
people” (Merriam-Webster, 2020). Today, we commonly think of it as its physical embodiment –
the simulator. The ordinary perception is that it must resemble something like a supercomputer
toy, but one must understand that simulators exist in a great diversity of type, form, and
application. The amount of people who use them has also considerably increased. It is highly
likely that most people from industrialized countries are already consistent users. From their
inception, simulators have experienced an incredible evolution and have become essential to
every industry.
Figure 4-1: Google Books search for 'simulation'

32
A discussion of simulators is inappropriate without referencing K.K. Millheim. He proposes,
“a simulator is defined as a device or piece of equipment that replicates some physical process or
operation to some level of fidelity. Simulation… is the numerical or logical replication of some
process, operation, or phenomenon” (Millheim, 1982). This definition is wonderfully applicable
because his paper directly addresses simulators in drilling. Examples of these simulator types are
detailed below, but a reinterpretation (Figure 4-2) might be a helpful analogy.
Figure 4-2: reinterpretation of Millheim's simulator classification types (Millheim, 1986)
As shown in Figure 4-2 and explained in the subsections below, the analogy is like
comparing what you see through different sets of stained glass windows. The quality of
the window represents the simulation architecture, and what you can see on the other side
represents the degree of realism.
i) Partial-task simulator (PTS)
PTS systems lack complete models to simulate all functions of the drilling process.
Instead, they simulate a portion of the entire process. They can range from simple control
panels with pictorial depictions all the way to full-scale realistic equipment. An example
of a PTS simulator is an entry-level well control simulator (Figure 4-3). This type
simulates only a distinct part of a more extensive operation. From the stained glass
reinterpretation (Figure 4-2), this is like viewing only 60% of a monochromatic window.

33
Figure 4-3: DrillSIM:50 user panels (Drilling Systems, 2005)
ii) Procedural simulator (PS)
This type of simulator can reproduce a more complete system of operations, albeit with a
lower level of fidelity. PS systems use more robust engineering models compared to PTS
but are also typically more expensive. Training drilling fundamentals is very appropriate
for this system. Figure 4-4, a rig floor simulator, is one of the most common examples of
a PS in the drilling industry. This picture includes life-size equipment: physical hand
brake, foot pedal, weight indicator, analog gauges, and hand levers. Continuing the
stained glass analogy (Figure 4-2), this is now like viewing 100% of the monochromatic
window – one can confidently say this is a stained glass window, but still cannot see
through it.

34
Figure 4-4: DrillSIM:5000 at Universitatea Petrol-Gaze in Ploiesti, Romania
iii) High-fidelity simulator (HFS)
The HFS type can reproduce an entire system of operations with a higher level of realism
and reliability. Sensory cues, hardware, and simulation models are distinctly more
advanced than PS systems. The most advanced modern drilling simulators are between
PS and HFS classification. The best example of an HFS is the aircraft simulator shown in
Figure 4-5, which sports enclosed cockpits with total sensory immersion (including 4 to 6
degrees of motion freedom). This HFS example can fully reproduce all of the complex
systems available in the Airbus A350 flight deck (Leiro, 2016). Returning to the stained
glass analogy (Figure 4-2), the monochrome window now has color, and a blurry nature
scene is visible beyond. One can more confidently state that this is a stained glass
window and might feel being a part of a bigger scene.

35
Figure 4-5 a) Airbus full-flight simulator (Leiro, 2016), b) cockpit of CAE flight simulator (Leiro, 2016)
iv) Engineering simulator (ES)
These simulator types help design and evaluate operational processes while also allowing
for robust real-time interactivity. A major differentiator is that ES systems can simulate
multiple environments without the need to redesign calculation models or hardware. So,
not only are these simulators realistic, but they are also scientifically robust enough to
carry out engineering problems and solutions in real-time. Few exist in any industry, and
no examples are shown herein. The level of realism is nearly perfect, so the stained glass
analogy (Figure 4-2) is also nearly perfect – one can see an exact and crystal clear picture
of the nature scene beyond the colorful window.
B. Simulators Available for Study
“Tell me, and I forget. Teach me, and I may remember. Involve me, and I learn”. While the
source of this wise quote is not confirmed (debate rages between Benjamin Franklin, Confucius,
and others), the deeper implications are ever-present in the world of education. This quote is
shared with the University students and research participants passing through the Drilling
Simulator Center and should remain an important motivation for the continuation of simulator-
involved research.
Fully involving participants with the two available simulators at the University of Oklahoma
is where the learning and progress happens. The Drilling Simulator Center (DSC) at OU is home
to the DrillSIM:50 manufactured by Drilling Systems and the immersive hardware-in-the-loop
(HIL) simulator manufactured by National Oilwell Varco (NOV). Together, these simulators

36
provide a fantastic breadth of opportunity for hands-on learning and research. Visitors and
research participants can undergo basic and advanced training in all of the following:
• Well planning
• Drilling practices*
• Tripping practices*
• Downhole drilling and equipment problems*
• Blowout prevention*
• Well control*
• Downhole well control and equipment problems*
• Pressure testing
• Running and cementing casing
• Crew resource management*
• Hoisting system operational control*
• Rotating system operational control*
• Circulating system operational control*
• Mud treatment and control
All of the training programs utilized during this thesis are demarcated above, with an
asterisk (*). The two simulators available for running these pieces of training are described in
great detail below. More background is provided for DrillSIM:50 than the NOV-HIL, due to the
projects that evolved from the team’s current research ideas.
i) DrillSIM:50 simulator
The DrillSIM:50 is the more user-friendly option available for study and is used
extensively for this thesis. According to the previously defined Millheim simulator types,
the DrillSIM:50 is a PTS or PS, depending on setup and intended use. While being
certified by the International Association of Drilling Contractors (IADC) and the
International Well Control Forum (IWCF) as an accredited well control training platform,
it can still simulate most other aspects of the drilling process (Drilling Systems, 2020).

37
DrillSIM:50 (DS:50) uses a sophisticated mathematical model to simulate surface and
downhole conditions, thereby immersing trainees in realistic drilling and well control
exercises. Relevant to this thesis, the downhole model is capable of kicks, gas expansion
and migration, formation fluid type and pressures, bottom hole effects such as equivalent
circulating density (ECD), bit washout and plugging, rock strength, hole cleaning, and
much more (Drilling Systems, 2020). The number of possible exercises that can be
designed and prescribed from this downhole model is remarkable. While the software and
algorithms of this simulator are great, it is the deep integration with its hardware that sets
it apart. The DS:50 is an extraordinarily effective and accessible system for training and
research.
The hardware panels and consoles available with the DS:50 can function like those of a
simple Kelly rotating or top drive system (TDS) rig. A touchscreen display allows for
additional visualizations of surface equipment, log displays, circulation system, and
more. For the auditory sense, DrillSIM:50 can reproduce many rig sound effects
synchronized with the controls and displays. A user can hear the drawworks, pressure
bleed-off, pump pop-off, pump strokes, and more. While the consoles might look
plasticky and feel elementary, they are capable of very complex operations. Each console
panel is discussed in detail below:
(1) Drilling Controls Console and Gauges Console – This is part of the
standard equipment for the DrillSIM:50 package (Figure 4-3, blue) and is a
centerpiece of the simulator setup, regardless of intended use. After reviewing
the below options of the drilling console, it should seem obvious just how
valuable and powerful this single console can be for a user. While the other
consoles complement the drilling console, almost all of the central drilling
actions of a rig can be accessed and monitored in one single place – just like
the Driller’s chair on the rig floor. Due to its importance, the drilling console
is given the greatest amount of detail and is used the most through the
research projects of this thesis. Furthermore, it has been singled out for
reference in Figure 4-6, below.

38
Access to the three fundamental drilling systems (rotation, circulation,
hoisting/weight on bit) are all present on this central unit:
a. For the rotation system, the user can manipulate a control knob for the
Rotary/TDS while monitoring revolutions per minute (RPM) and
torque on the digital data gauges.
b. For the circulation system, the user can operate control knobs for
Pump 1 and Pump 2 while monitoring a large number of parameters:
pump pressure, strokes per minute (SPM) for Pump 1, SPM for Pump
2, total SPM, total strokes following a counter reset, return flow
percentage, trip and strip tank volumes, pit deviations. Additionally,
there are light-emitting diode (LED) alarms for return flow, pit
deviations, and trip/strip tank. Lastly, the trip/strip tanks each have
their own dedicated controls for filling, pumping, or dumping.
c. For the hoisting/weight on bit system, the user can set the drawworks
direction (raise or lower) via a two-way switch. Accompanying the
bidirectional switch is a manual driller’s hand brake control. This
lever-operated mechanism has a default position (down) that engages
the drawworks drum brake. The user must lift the brake (up)
approximately two-thirds of the way before the brake is disengaged,
allowing the drawworks drum to move in the desired direction. The
brake is shown in the bottom-right of Figure 4-6.
d. Extra equipment and process-oriented controls are accessible on this
console, which helps simplify some pipe handling operations. These
shortcut buttons include setting and removing the slips, adding or
removing a single, adding or removing a stand, and installing or
removing the TDS/Kelly. Lastly, there is a button available to install
or remove the inside-blowout preventer (IBOP). The researcher can
show all of these operations in-depth using the NOV-HIL simulator
(also available at the DSC).

39
e. In addition to the above, the drilling console has an alarm system that
allows upper and lower limits for return flow percentage, pit deviation,
and trip/strip tank volume.
Figure 4-6: drilling console for DrillSIM:50
(2) Instructor Laptop PC – This is the brain of the simulator and another
standard piece of equipment necessary for all intended simulator uses, shown
in the bottom-right Figure 4-3. There are many preset initial conditions
available, and these are known as “snapshots.” There are many preconfigured
snapshot scenarios such as Top Drive with Surface BOP, Kelly with Surface
BOP, Work-over, Cementing, and more. More importantly, for research and
customizable training, the instructor (or researcher) can change all sorts of
surface (rig type, mud system, rig equipment) and subsurface parameters

40
(wellbore geometry, formation/geology data) and save them as new snapshots.
The instructor can introduce many malfunctions into the exercises, like
equipment failures (rig pumps, hoisting, rotary, BOP, choke, electricity and
water supply, gauge malfunction, solids control) or downhole problems (drill
bit, washouts, twist offs, hole cleaning, lost circulation, tight hole, stuck pipe).
The configuration of well snapshots and monitoring of real-time simulations
are the primary functions of the Instructor Laptop PC station. Simulation can
be started, frozen, or adjusted for faster runtime speeds. Secondarily, the
instructor laptop is also a dedicated graphics station. Depending on the
simulator’s intended use, the instructor can hide or display certain graphics
such as downhole graphics, trip and strip tank alignment, mud pump and tank
line up options, runtime data pages, and more.
(3) Touchscreen Student and Graphics Panel – This panel (Figure 4-3, bottom-
left) connects to and extends the Instructor Laptop PC. In its passive state, this
panel functions as a place for the user to observe data, parameters, and self-
configure relevant log graphs. Importantly, a dynamic image of the surface
equipment also allows the user to see the ongoing operations around the drill
floor and derrick. Equipment visible includes the traveling block and
TDS/Kelly, elevators, pipe rack and stands, and slips. A set of arrows
indicates rotary motion, and a red/yellow/green indicator is used to show the
status of the Inside BOP.
This touchscreen device also enables users to interact with the data and
graphics more naturally. In its active state, this panel is where a user can edit
drilling fluid parameters related to the mud control system, like changing the
mud fluid density. The automatic driller option can also be found on this
panel, and it functions by adjusting the Driller’s brake to maintain the current
weight on bit.

41
(4) Blowout preventer (BOP) Console – The DS:50 sports a surface BOP
control console (Figure 4-3, red) with two parts: a pictorial setup of the system
and data gauges. This console is a central function of the DS:50 as a well
control simulator and allows the user to practice one of the most dangerous
and necessary drilling rig processes. The pictorial section has open and close
control buttons for the annular preventer, upper pipe rams, blind/shear rams,
lower pipe rams, kill line, and choke line. The data gauges section shows
pressures for the rig air, annular, accumulator, and manifold. This section has
two additional controls: a momentary switch (push and hold to operate) plus
an accumulator pump control.
(5) Standpipe and Choke Manifold – This control panel (Figure 4-3, white)
serves the same function as a standpipe manifold found at a drilling rig. It is
“installed” downstream from Pump 1 and Pump 2 to direct drilling fluid to
where the drilling user needs, as required by the scenario. There are many 2-
position switch valves here: Mud Pump 1 inlet, Mud Pump 2 inlet, and
left/right/center crosses. Two standpipe pressure gauges are present: left and
right. Lastly, there are isolation valves from the standpipe manifold to the
choke manifold, kill line, bleed off line, and standpipe itself.
The choke and kill manifold also serves the same realistic functions as on a
real drilling rig and is installed downstream from Pump 1 and Pump 2. It can
direct fluid to the choke line, kill line, or standpipe. There are two casing
pressure gauges, left and right of center. This set of valves and pipes includes
two chokes: a manual choke for the kill line and a remote choke (see part 6,
below) on the choke line.
(6) Remote Choke Control – The remote choke (Figure 4-3, orange) is a panel
that helps make the DrillSIM:50 such a fantastic (and accredited) tool as a
well control simulator. Like a live drilling rig, this panel helps manage the
amount of drilling fluid allowed to circulate through the choke line, a critical
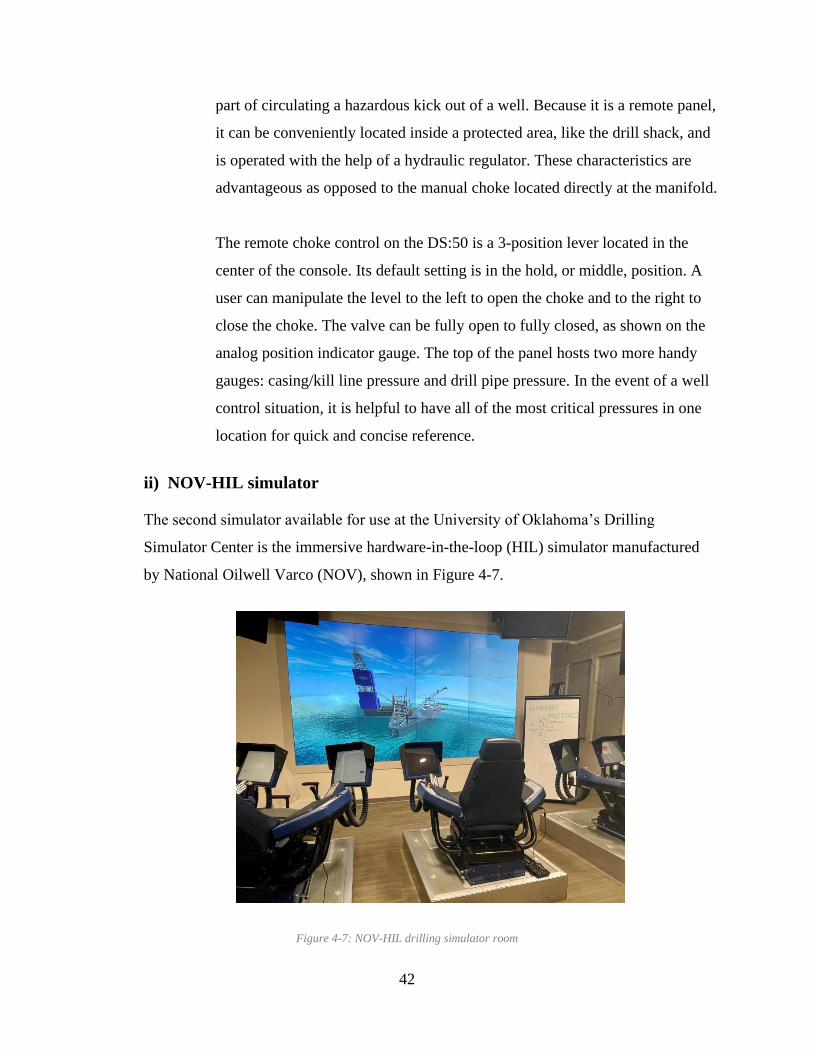
42
part of circulating a hazardous kick out of a well. Because it is a remote panel,
it can be conveniently located inside a protected area, like the drill shack, and
is operated with the help of a hydraulic regulator. These characteristics are
advantageous as opposed to the manual choke located directly at the manifold.
The remote choke control on the DS:50 is a 3-position lever located in the
center of the console. Its default setting is in the hold, or middle, position. A
user can manipulate the level to the left to open the choke and to the right to
close the choke. The valve can be fully open to fully closed, as shown on the
analog position indicator gauge. The top of the panel hosts two more handy
gauges: casing/kill line pressure and drill pipe pressure. In the event of a well
control situation, it is helpful to have all of the most critical pressures in one
location for quick and concise reference.
ii) NOV-HIL simulator
The second simulator available for use at the University of Oklahoma’s Drilling
Simulator Center is the immersive hardware-in-the-loop (HIL) simulator manufactured
by National Oilwell Varco (NOV), shown in Figure 4-7.
Figure 4-7: NOV-HIL drilling simulator room
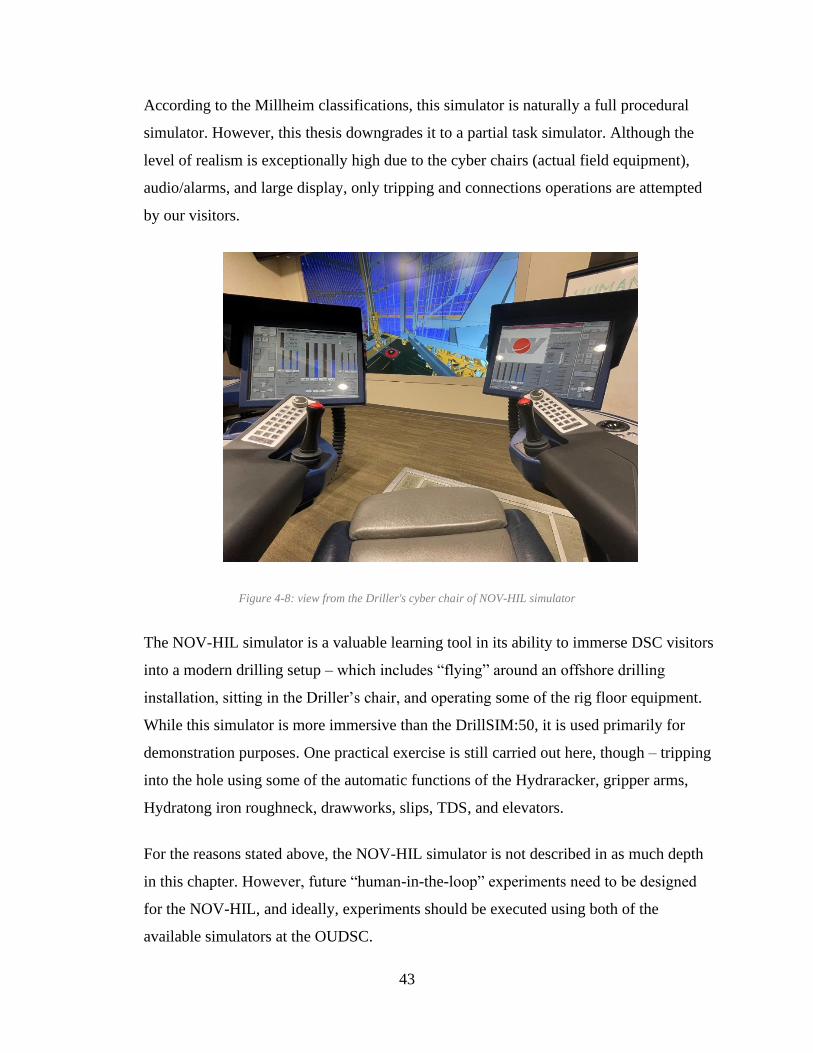
43
According to the Millheim classifications, this simulator is naturally a full procedural
simulator. However, this thesis downgrades it to a partial task simulator. Although the
level of realism is exceptionally high due to the cyber chairs (actual field equipment),
audio/alarms, and large display, only tripping and connections operations are attempted
by our visitors.
Figure 4-8: view from the Driller's cyber chair of NOV-HIL simulator
The NOV-HIL simulator is a valuable learning tool in its ability to immerse DSC visitors
into a modern drilling setup – which includes “flying” around an offshore drilling
installation, sitting in the Driller’s chair, and operating some of the rig floor equipment.
While this simulator is more immersive than the DrillSIM:50, it is used primarily for
demonstration purposes. One practical exercise is still carried out here, though – tripping
into the hole using some of the automatic functions of the Hydraracker, gripper arms,
Hydratong iron roughneck, drawworks, slips, TDS, and elevators.
For the reasons stated above, the NOV-HIL simulator is not described in as much depth
in this chapter. However, future “human-in-the-loop” experiments need to be designed
for the NOV-HIL, and ideally, experiments should be executed using both of the
available simulators at the OUDSC.

44
C. Simulation in Context – Time, Human, and Sensory
Immersion
Millheim provides a great starting point for categorizing the industry’s available simulators.
Although his paper is dated, the proposed types still remain valid. Advancements in technology,
computing power, industry knowledge, and more have led to the need to further differentiate
from Millheim’s four classifications. Millheim’s approach looks at the physical models and how
much of the process they replicate, but simulators can also be classified by the level of human
and sensual immersion they provide. The timescale in which they operate might also matter. In
reality, most modern drilling simulators are a blend of all the mentioned types.
This section’s purpose is to expand upon Millheim’s types with categories borrowed from the
United States Department of Defense’s (DoD) studies in the field of Modeling and Simulation
(M&S). The DoD describes its classification system as “a mixture of live simulation, virtual
simulation, and constructive simulation.” Note that this live, virtual, and constructive simulations
(LVC) always include a natural or synthetic person in the simulation” (Department of Defense
2011). This is an important distinction, especially because this thesis focuses on the “human-in-
the-loop” concept for training and simulation exercise. Each of these LVC modes is described in
greater detail below regarding their time, human involvement, and sensory immersion. Examples
of each simulation mode are provided across two domains: medical and drilling.
i) Live simulation
This simulation mode generally involves “real people operating real systems” (DoD
2011).
Figure 4-9: live simulation of CPR

45
a. A live simulation takes place in real- or normal time. Real-time simulations have
decisions, computing, and other variables occurring in that present moment.
Normal time refers to the idea that the operations are happening at a natural and
normal pace, not sped up or slowed down.
b. For a human-to-human scenario, the simulated exercise must involve the same
people that the simulation is intended for; for a human-with-machine scenario,
live simulations require the actual equipment (or perfect duplicates).
c. As for sensory immersion, all possible (or relevant) senses should be involved,
emphasizing touch and haptic feedback. These senses are stressed because the
virtual and constructive modes will lack
d. Environment – simulation performed in exact or duplicated space as where the
real event would occur
e. Example (medical domain) – first responder or doctor performing CPR on a
human acting as the victim (Padilla, Diallo, and Armstrong 2018). Figure 4-9
shows a live simulation with the human-to-human scenario happening in real-
time.
f. Examples (drilling domain) – 1) wellsite crew function testing BOP equipment as
part of a biweekly drill represents a human-with-machine scenario; 2) pump
operator troubleshooting and fixing actual pump system installed directly on the
actual field service truck, but in a practice scenario; 3) weekly fire drill occurring
on the drillships in the Gulf of Mexico represents a human-to-human live
simulation.
ii) Virtual simulation
This DoD simulation type involves “real people operating simulated systems. Virtual
simulations inject human-in-the-loop in a central role by exercising motor control
skills… decision skills… or communication skills”. Virtual refers to “the essence or
effect of something” and not the whole, unrefined fact (DoD 2011).
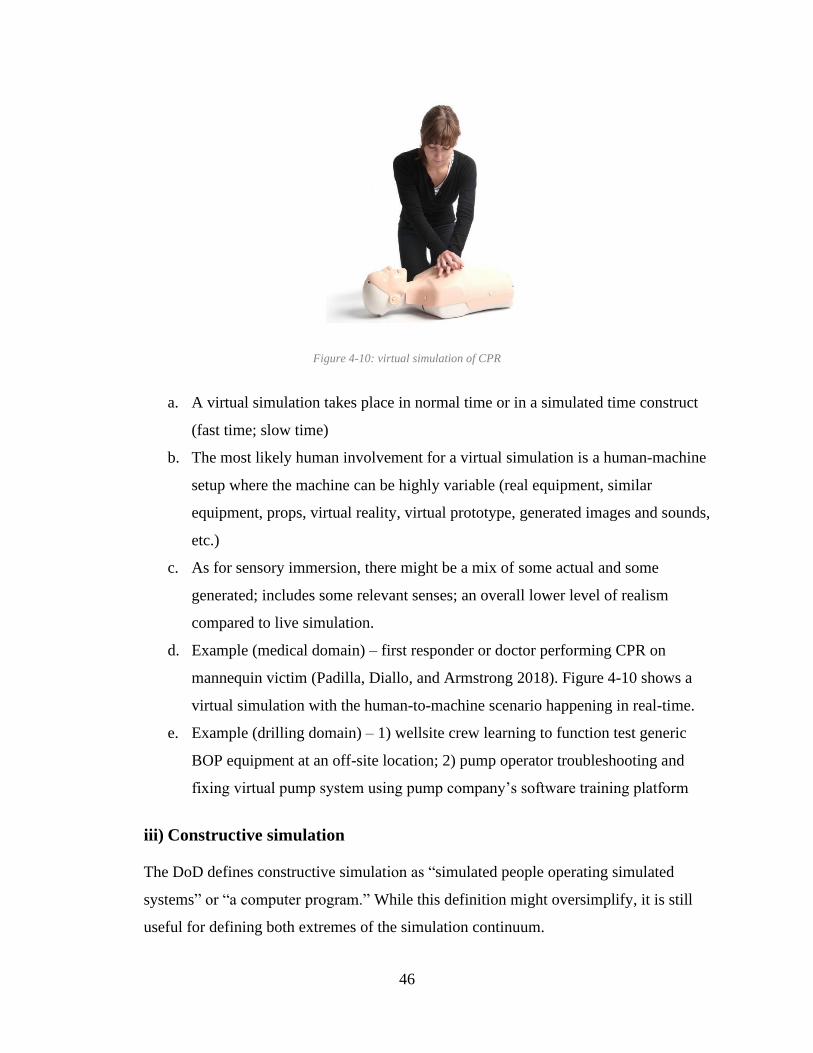
46
Figure 4-10: virtual simulation of CPR
a. A virtual simulation takes place in normal time or in a simulated time construct
(fast time; slow time)
b. The most likely human involvement for a virtual simulation is a human-machine
setup where the machine can be highly variable (real equipment, similar
equipment, props, virtual reality, virtual prototype, generated images and sounds,
etc.)
c. As for sensory immersion, there might be a mix of some actual and some
generated; includes some relevant senses; an overall lower level of realism
compared to live simulation.
d. Example (medical domain) – first responder or doctor performing CPR on
mannequin victim (Padilla, Diallo, and Armstrong 2018). Figure 4-10 shows a
virtual simulation with the human-to-machine scenario happening in real-time.
e. Example (drilling domain) – 1) wellsite crew learning to function test generic
BOP equipment at an off-site location; 2) pump operator troubleshooting and
fixing virtual pump system using pump company’s software training platform
iii) Constructive simulation
The DoD defines constructive simulation as “simulated people operating simulated
systems” or “a computer program.” While this definition might oversimplify, it is still
useful for defining both extremes of the simulation continuum.

47
Figure 4-11: constructive simulation of CPR
a. A constructive simulation can take place using all of the available time constructs:
normal time, simulated time (fast time, slow time), reiterative, recursive, etc.
b. The only human involvement involves any required stimulation (inputs) to begin
the simulation. The human does not get involved again until assessing the
outcomes.
c. The only sensory immersion involves the available perception of the simulation.
d. Example (medical domain) – a YouTube video (or computer program) that
instructs the CPR operation from various angles and applications, as seen in
Figure 4-11
e. Example (oil & gas domain) – 1) watching the briefing video before boarding
helicopter to go to the rig; video explains the safety functions and emergency
options of the helicopter 2) pump company’s design engineer inputs a new
hydraulic plan into the system, and the pump software automatically performs
vibrations predictions on all the available options
While LVC simulations, by definition, must include a “real or synthetic” human in the
simulation, it is important to remember the many non-human-involved scenarios can be modeled
with simulators. For our drilling industry context, the human-centric subject can be replaced by
an entire well, reservoir, or other similar types of phenomenon. One such example is the Petrel
well and completion design program by Schlumberger, and the DoD (2011) defines this
simulation style as a “science-based simulation.” While a human is not directly “in-the-loop” of
these simulations, it is the human who is ultimately responsible for its inputs and interpreting its
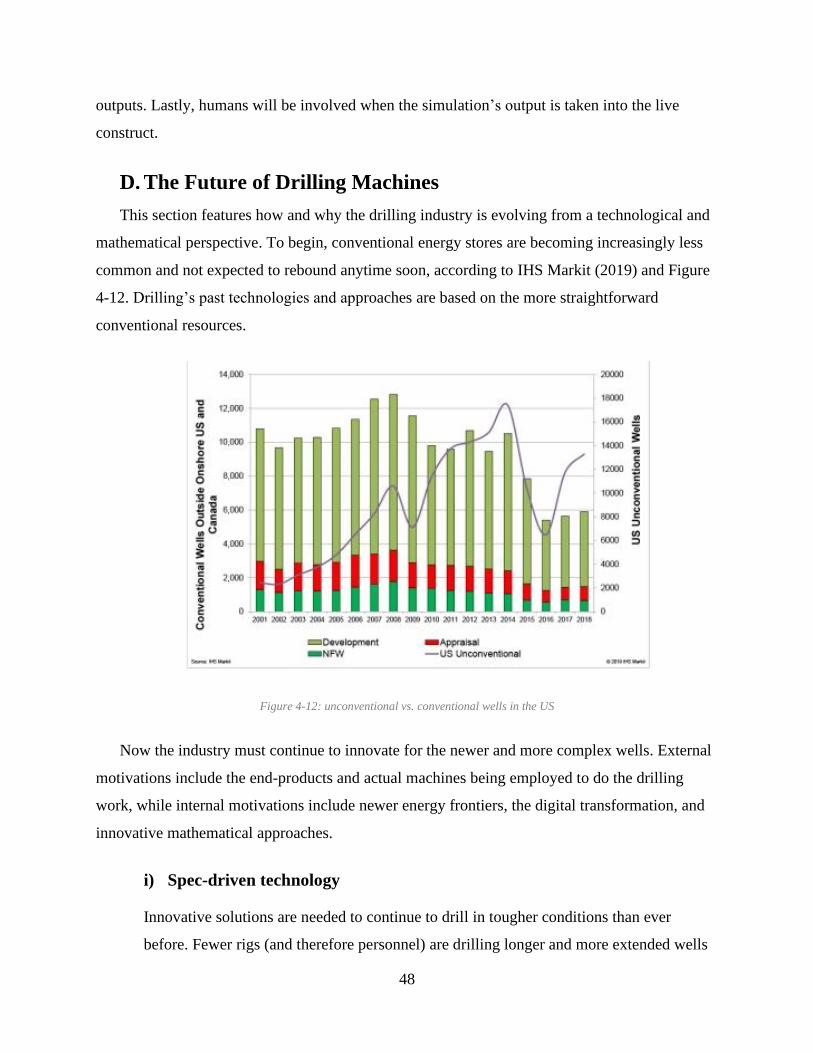
48
outputs. Lastly, humans will be involved when the simulation’s output is taken into the live
construct.
D. The Future of Drilling Machines
This section features how and why the drilling industry is evolving from a technological and
mathematical perspective. To begin, conventional energy stores are becoming increasingly less
common and not expected to rebound anytime soon, according to IHS Markit (2019) and Figure
4-12. Drilling’s past technologies and approaches are based on the more straightforward
conventional resources.
Figure 4-12: unconventional vs. conventional wells in the US
Now the industry must continue to innovate for the newer and more complex wells. External
motivations include the end-products and actual machines being employed to do the drilling
work, while internal motivations include newer energy frontiers, the digital transformation, and
innovative mathematical approaches.
i) Spec-driven technology
Innovative solutions are needed to continue to drill in tougher conditions than ever
before. Fewer rigs (and therefore personnel) are drilling longer and more extended wells
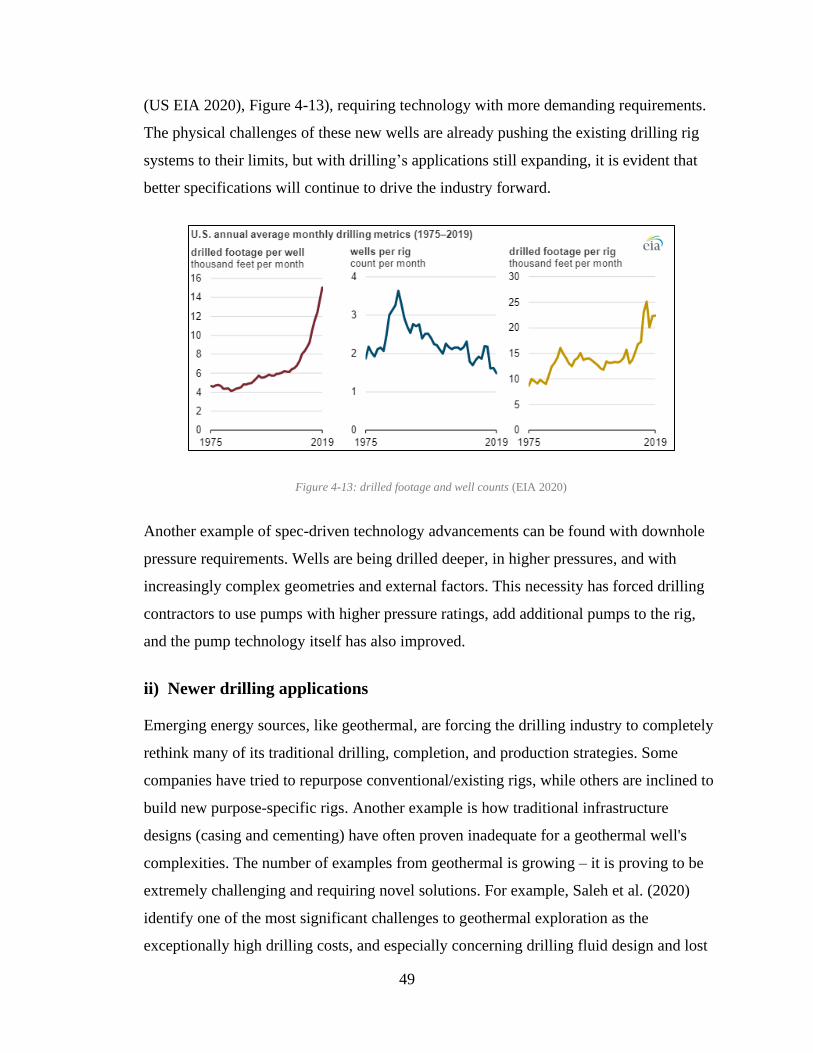
49
(US EIA 2020), Figure 4-13), requiring technology with more demanding requirements.
The physical challenges of these new wells are already pushing the existing drilling rig
systems to their limits, but with drilling’s applications still expanding, it is evident that
better specifications will continue to drive the industry forward.
Figure 4-13: drilled footage and well counts (EIA 2020)
Another example of spec-driven technology advancements can be found with downhole
pressure requirements. Wells are being drilled deeper, in higher pressures, and with
increasingly complex geometries and external factors. This necessity has forced drilling
contractors to use pumps with higher pressure ratings, add additional pumps to the rig,
and the pump technology itself has also improved.
ii) Newer drilling applications
Emerging energy sources, like geothermal, are forcing the drilling industry to completely
rethink many of its traditional drilling, completion, and production strategies. Some
companies have tried to repurpose conventional/existing rigs, while others are inclined to
build new purpose-specific rigs. Another example is how traditional infrastructure
designs (casing and cementing) have often proven inadequate for a geothermal well's
complexities. The number of examples from geothermal is growing – it is proving to be
extremely challenging and requiring novel solutions. For example, Saleh et al. (2020)
identify one of the most significant challenges to geothermal exploration as the
exceptionally high drilling costs, and especially concerning drilling fluid design and lost

50
circulation. These particular issues can cost an exploration company anywhere from
$200,000 to $1.4 million per well, as per Cole et al. (2017). The sooner the industry can
find solutions to these new problems, the better.
There is an ever-increasing demand for energy (and renewable energy, more
specifically), so the drilling industry will continue to have to innovate its drilling
technologies and practices. The future of drilling machines will need to reach new deeper
targets with higher pressure and temperature subsurface conditions. Leaning on
preexisting drilling technologies and knowledge is a starting point, but tackling more
complex and unexplored geological frontiers will require further evolution. However,
many new mathematical approaches are enabling the drilling industry like never before.
There is more surface, drilling, and subsurface data, and some drilling machines are even
becoming fully automated. Importantly, the learning curve for geothermal and other new
drilling applications can become shorter and safer, especially by leveraging and
connecting the digital transformation with algorithmic approaches (Bello et al. 2020).
iii) The digital transformation
Unlike previous generations, humans now live in an age that has blurred the lines
between analog and digital. The modern economy is experiencing a rapid and
fundamental shift due to significant advancements in digital technologies, robotics, and
the information sciences (Ershaghi and Paul 2020). More than ever before, there is now
an abundance of smaller and more intelligent sensors, high-resolution data, and the
mathematical approaches available to deal with all that data. These advancements are
being implemented across many other industries, and fortunately, the drilling industry is
extremely amenable to this movement known as the “digital transformation.” These
digital improvements changes will have long and pervasive impacts on the industry, from
educating its students to research and development and the operating companies
themselves.
What exactly is “Big Data,” and how is it actively being used by the drilling industry?
Currently, there is a serious “data overload” issue stemming from an overabundance of
collected and unprocessed information. For example, previous estimates propose that less

51
than 5% of the available data is ever analyzed and put into use. Udofia et al. (2020)
suggest that “Big Data” actually involves moving the mass of acquired data from storage
to drilling’s decision-making points. In essence, it is much more than just acquiring data.
Rather, it is what you do with it-connecting the data to real-time machines and decisions.
Furthermore, many data scientists and researchers, like Braga (2019), will also emphasize
the critical importance of properly cleaning and preparing data before applying it. Using
all available data at the decision-making point is a worthwhile goal, but only as long as
the information is practically usable. The next-level step is not only using lots of this Big
Data but also building a new generation of “smart” machines, capable of making dynamic
decisions based on previous data and real-time modeling.
Also, this “data overload” is also responsible for many technological advancements
within the last decade. Mohammadpoor and Torabi (2020) suggest that big data (and data
analytics) are responsible for improving drilling safety while reducing drilling time.
Recent improvements to downhole acquisition (e.g., logging while drilling and measuring
while drilling tools) and sensors provide more and higher quality to the surface in real-
time. At the surface, advanced computers are now more able to combine all of the
available data and use it in real-time, especially when it is tied into larger and remotely
operated frameworks.
iv) Mathematical and algorithmic approaches
What are we doing with all that new data? Applying it, of course. It is hard to attend an
industry conference, tech talk, or read a new research paper without also seeing
buzzwords like machine learning, data analytics, artificial intelligence (AI), and more.
All of these techniques are being applied across most modern industrial and engineering
fields, and they are leading to amazing insights. When used appropriately, these
analytical methods are generating far safer, more efficient, and more profitable work
processes. These improvements have caught the attention of the drilling world.
Olukoga and Feng (2021) analyze the current drilling literature for practical applications
of these new mathematical and algorithmic approaches. The literature (Figure 4-14)
shows that these machine learning techniques are primarily used to predict drilling events

52
such as rate of penetration, differential pipe sticking, and drillstring vibrations. Other uses
include prediction of rheological properties of drilling fluids, estimations of formation
properties, well planning, pressure management, well placement, among others. Olukoga
and Feng (2021) go on to report the most common machine learning techniques currently
in use are artificial neural networks (18%), support vector machines (17%), and
regressions (13%).
Figure 4-14: machine learning applications for drilling operations (Olukoga and Feng 2021)
There is an abundance of literature diving into the many trends, advantages, and
limitations of artificial intelligence applications. Bello et al. (2015) identify some of the
earliest drilling applications as interface development for simulators, drill bit diagnosis,
pump operation diagnosis, drilling operation optimization, and optimal well design using
genetic algorithms. To expand on one of these AI applications, well planning, Bello et al.
uncover the potential of using a trained artificial neural network (ANN) for important
pre-drilling decisions like selecting the proper drill bit. The inputs for the ANN include
geological data, rock mechanics, well drilling, and location data. The outputs of this

53
ANN example would end up being bit type, performance predictions, and operating
guidelines.
But artificial intelligence techniques can also be used for real-time drilling optimization
too. Managing bit wear for improved ROP, monitoring frictional drag and load transfer,
as well as estimating the hole cleaning are all among real-time applications for AI.
Srivastava and Teodoriu (2020) investigate the potential of classifying vibrations by
connecting surface vibration data (torque, RPM, ROP, WOB) with lithology and
drillstring design information. This AI technique, using classification models, helps by
recognizing patterns in the data it has been trained on and is a promising beginning to a
complex problem.
As with most algorithmic tools, there are many limitations such as poor data
collection/filtering, the “black box” effect, the gap between statistical and physical-based
models, reaching an “optimal” solution, lack of human input for outlying cases, and
system requirements for data processing (Bello et al. 2015; Noshi and Schubert 2018).
Despite some of these drawbacks, there is still an undeniable benefit from using
algorithmic approaches for drilling: cost-effective, fewer errors than humans for boring
large datasets, identification of non-linear relationships, among others. Safety and
efficiency, the drilling industry’s end goals, are likely long-term consequences of
properly using these methods. Now, learning how to integrate machine-based methods
with the current human population is the next-level vision of this thesis.
5. Testing the Effectiveness of Drilling Communication
How we communicate on the drill floor needs significant improvement because the current
drilling vocabulary exists on a continuum from nonexistent to moderately effective. This chapter
demonstrates that trainees with different backgrounds and experience levels can improve their
communication with simulation-based training and a standardized language. Enhanced and
modernized communication protocols will prove essential for the next generation of drillers to
work safer and more efficiently. The proposed Universal Drilling Language (UDL) is motivated
by the need to consistently transfer drilling ideas, commands, requests, and confirmations with

54
optimized precision. The UDL considers what information is necessary, excludes the extraneous,
and then shares it clearly – leaving no room for misinterpretation.
A. Introduction
This experiment is designed to understand better and quantify the impact of effective
communication within drilling activities. The ultimate goal is to prove that if communication
protocols are standardized between drilling participants, then task completion improves. This is a
“human-in-the-loop” experiment in which verbal phrases vary across multiple testing phases and
multiple levels of task complexity. The uniqueness of this experiment is that final results are
quantifiable: time to task completion and rate of task completion. Another uniqueness of this
experiment is that it also serves as a communication training course for the research participants.
The experimental process for arriving at this improved language is iterative. Pairs of trainees
perform drilling tasks in distinct phases: first using their intuitive and “natural” expressions, then
with scripted “imperfect” phrases, and finally with a set of iterated “perfect” phrases. This multi-
stage, multi-phase test is known as the “Driller’s Roadmap” (DRM) language experiment. The
DRM is carried out on the DrillSIM:50, according to the timeline presented in Figure 5-1. The
remainder of this chapter describes the DRM, including phases, participants, equipment,
procedures, results, and a discussion of conclusions.
Figure 5-1: DRM's stages and integrated phases
Training Warmup Briefing
Testing"Natural"
Phase A"Imperfect"
Phase B"Perfect"
Phase C
Learning Debriefing
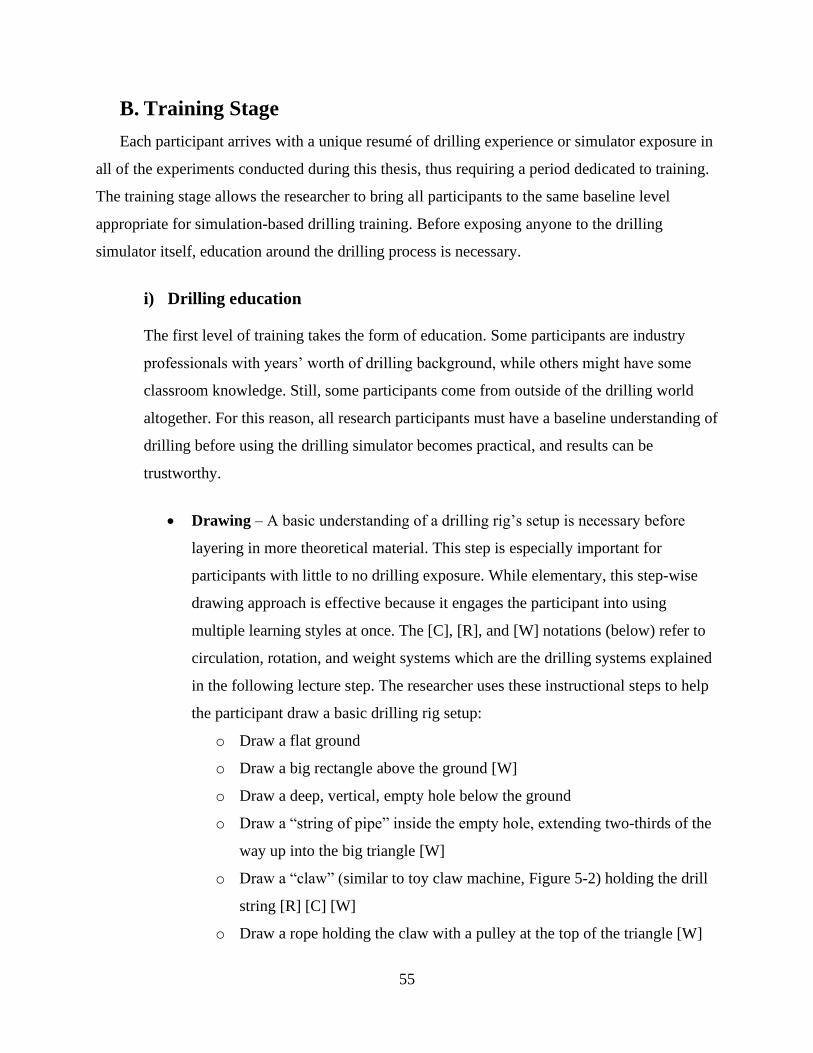
55
B. Training Stage
Each participant arrives with a unique resumé of drilling experience or simulator exposure in
all of the experiments conducted during this thesis, thus requiring a period dedicated to training.
The training stage allows the researcher to bring all participants to the same baseline level
appropriate for simulation-based drilling training. Before exposing anyone to the drilling
simulator itself, education around the drilling process is necessary.
i) Drilling education
The first level of training takes the form of education. Some participants are industry
professionals with years’ worth of drilling background, while others might have some
classroom knowledge. Still, some participants come from outside of the drilling world
altogether. For this reason, all research participants must have a baseline understanding of
drilling before using the drilling simulator becomes practical, and results can be
trustworthy.
• Drawing – A basic understanding of a drilling rig’s setup is necessary before
layering in more theoretical material. This step is especially important for
participants with little to no drilling exposure. While elementary, this step-wise
drawing approach is effective because it engages the participant into using
multiple learning styles at once. The [C], [R], and [W] notations (below) refer to
circulation, rotation, and weight systems which are the drilling systems explained
in the following lecture step. The researcher uses these instructional steps to help
the participant draw a basic drilling rig setup:
o Draw a flat ground
o Draw a big rectangle above the ground [W]
o Draw a deep, vertical, empty hole below the ground
o Draw a “string of pipe” inside the empty hole, extending two-thirds of the
way up into the big triangle [W]
o Draw a “claw” (similar to toy claw machine, Figure 5-2) holding the drill
string [R] [C] [W]
o Draw a rope holding the claw with a pulley at the top of the triangle [W]
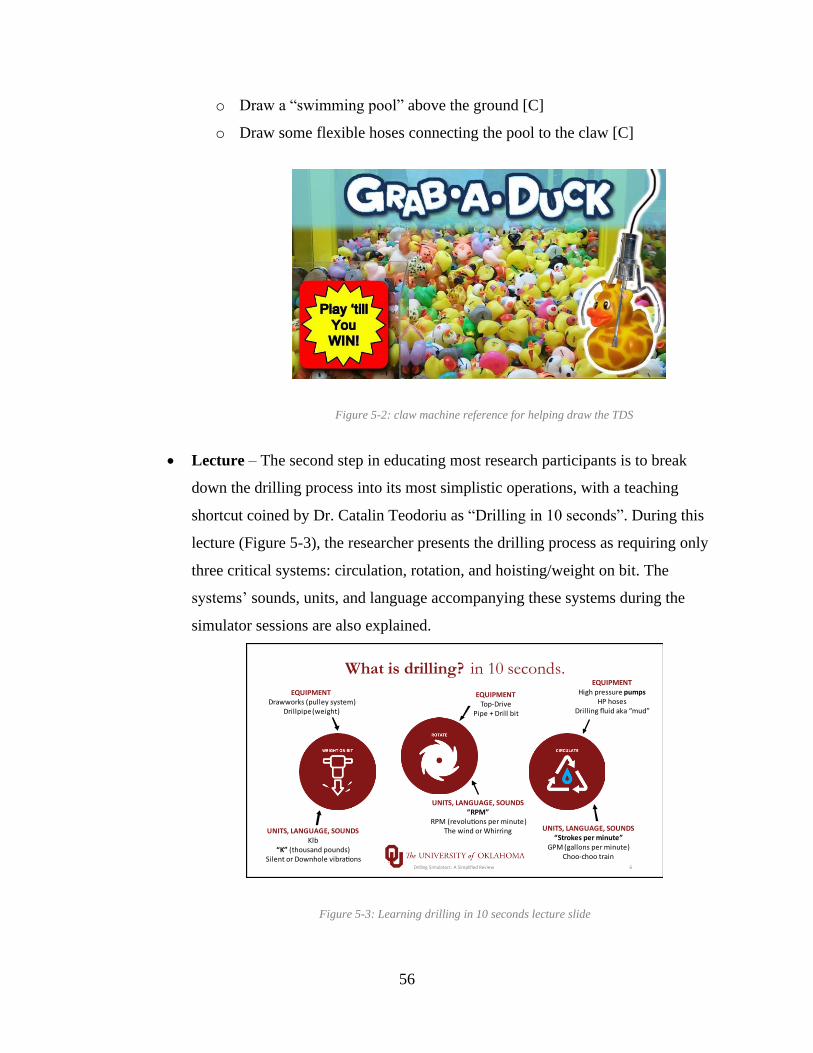
56
o Draw a “swimming pool” above the ground [C]
o Draw some flexible hoses connecting the pool to the claw [C]
Figure 5-2: claw machine reference for helping draw the TDS
• Lecture – The second step in educating most research participants is to break
down the drilling process into its most simplistic operations, with a teaching
shortcut coined by Dr. Catalin Teodoriu as “Drilling in 10 seconds”. During this
lecture (Figure 5-3), the researcher presents the drilling process as requiring only
three critical systems: circulation, rotation, and hoisting/weight on bit. The
systems’ sounds, units, and language accompanying these systems during the
simulator sessions are also explained.
Figure 5-3: Learning drilling in 10 seconds lecture slide

57
The requisite systems and equipment are related back to the rig drawing from the
previous educational step. These three drilling systems were teased during the
drawing activity with the [W], [R], and [C] demarcations.
ii) Simulator and system familiarity
Once a foundation of knowledge is built (or confirmed for more experienced
participants), getting hands-on experience with the drilling simulator is the next step.
Before trainees advance to more meaningful exercises, it is first necessary to train them
on the system. Knowing how to operate the simulator confidently is a prerequisite to any
objective data collection. No meaningful subjective conclusions can be made until these
early familiarization exercises are completed:
• Draw – Hand illustrations of the drilling console (like Figure 5-4), identifying the
most relevant controls and displays, and listing all of their corresponding functions.
Trainees perform this drawing exercise only after drawing the dashboard of their own
car’s vehicle. This parallel exercise underscores the importance of understanding a
system’s setup, available control functions, inputs, and outputs. From a cognitive
perspective, these exercises help demonstrate how much relevant information a
person might typically store in short-term versus long-term memory. Most trainees
learn that their vehicle’s dashboard illustrations lack critical details. This exercise is
usually an eye-opening experience for participants and keeps their attention higher
during simulator familiarity.
• Troubleshoot – In this two-part exercise, the instructor first presets the simulator’s
control knobs, dials, and switches into erroneous and/or random positions. Then, a
hypothetical drilling scenario is verbally presented to the trainee, who must
troubleshoot correct or incorrect settings before proceeding into the live simulation.
• Red Light, Green Light – In this exercise, the instructor provides continuous stop-
and-go instructions carried out by the trainee. Red Light, Green Light is usually a
trainee’s first exposure to live simulation, tripping, and/or drilling operations.
Tripping in and out of the simulated hole is practiced in two ways: via elevators and
directly screwed into the TDS. As for drilling operations, the early exercises do not

58
include any forced issues or malfunctions. Similarly, the surface equipment,
downhole drilling conditions, and geology are purposely homogenous and
straightforward.
Figure 5-4: student-drawn illustration of the drilling console
Remember, the above steps are critical for helping participants understand drilling and
how to apply that knowledge to and on the drilling simulators. Research participants
commonly report feeling very confident with drilling basics and using the DrillSIM:50.
The consistency of these confidence ratings shows that the training stage is very effective
in its current format. Across two studies, the above-defined training stage has extended
into multiple 60-90 minute sessions or compressed to as short as a single 45-minute
session.
iii) Briefing
The previous exercises (regarding drilling education and simulator familiarity) are part of
a more pure warmup phase (Figure 5-1), whereas the Briefing is a unique phase dedicated

59
to explaining the specifics of the DRM’s first testing stage. The DRM language
experiment requires two research participants, so the Briefing phase is also essential as it
assigns roles and communicates responsibilities to the research participants.
Participant 1 is chosen randomly and assigned the role of Driller. According to the
Schlumberger Oilfield Glossary (2020), a driller is “the supervisor of the rig crew. The
driller is responsible for the efficient operation of the rig site as well as the safety of the
crew […]. His or her role is to supervise the work and control the major rig systems. The
driller operates the pumps, drawworks, and rotary table via the driller's console… and is
sometimes referred to as the person who is ‘on the brake.’” This definition underscores
the importance of precise language by highlighting the Driller’s expectations of
efficiency and safety. Thus, our experiment uses the Schlumberger definition and applies
it to a string of simulated drilling tasks. The DRM’s Driller must safely operate the
simulator’s control panels (Figure 4-3) and can communicate at any time and in any
manner. This participant’s ultimate responsibility is to drill according to a “roadmap” of
provided parameters. The Driller’s “hands-on” actions are the dependent variable. It is
the reaction time and outcomes which we eventually measure.
Participant 2 is assigned the role of Assistant Driller (AD). In contrast to the Driller, this
participant’s responsibilities are unique for each of the experiment’s three testing phases.
The most important responsibility for the AD comes in the form of communication, not
actions. The AD is “hands-off” and is not allowed to touch any of the physical consoles
at any point during the experimental procedures. Instead, the AD communicates drilling
parameter changes (according to each phase’s predefined rules and “roadmap”) directly
to the Driller. Thus, the Assistant Driller’s verbal instructions are the experiment's
independent variable and can be found in Appendix 1 – Roadmaps for DRM. As these
verbal instructions are varied, the Driller’s reactions and outcomes will either improve or
worsen.
At the time of publishing, twelve participants (six groups) had completed the study. Of
these, four participants are professional drillers with 7-15 years of drilling experience,
five are undergraduate students, and the remaining three are graduate students.

60
Professional drillers are only paired with professional drillers, and students are only
paired with students. This segregation ensures that each pair has similar experience
levels.
Again, the Briefing stage sets the rules before beginning Phase A of Testing can begin. A
short briefing is also necessary before Phase B and Phase C of Testing to update the
Assistant Driller on the updated rules of each of those phases.
C. Testing Stage
The second distinct stage of the experiment is Testing, in which the participant pairs attempt
to accomplish the pre-determined drilling tasks. This section will include descriptions of
equipment, an explanation of each phase, and some necessary definitions.
i) Equipment
This experiment requires only two of the DrillSIM:50 consoles: drilling console and
touchscreen panel (see Chapter 4, section B). Only these two consoles are necessary due
to the intentional simplicity of the experimental design – parameter changes and task
completions. No data are collected from the BOP panel, remote choke, and manifold
consoles, but they are essential in helping participants become simulator-ready, as
described in the training stage.
As seen in Figure 5-5, the simulator system is set up on a table with both consoles in
front of Participant 1’s chair (right). Participant 2 is sitting to the left with a clear sight of
both consoles. Because verbal communication is the researcher’s variable of interest,
wireless microphones are provided and secured to each participants’ shirt collar. The
communications between participants are recorded for later analysis.
An important note: some participant groups attended this research-training during
COVID-19; therefore, wearing masks is strictly enforced, as per University policy. This
health and safety practice marginally affected the sound quality of voice recording, as
tested by the researcher prior to beginning the study.

61
Figure 5-5: simulator setup for DRM experiment
Because drilling actions are the dependent variable, the drilling console is the primary
console and displays all of the requested drilling parameters in real-time. This console
(Figure 4-6) is also home to all the physical buttons, data gauges, and drilling brake that
the Driller needs to complete the requested tasks. Because some incoming participants
have limited drilling or simulator experience, providing a secondary mode of data
representation is beneficial. The touchscreen station is a graphical user interface that
helps participants visualize the parameters and drilling process completely. Both
participants are allowed to observe all of the available data throughout the entirety of the
experiment.
ii) Task Complexity and Completion
Each Testing phase (A, B, and C) uses an identical structure of task complexity, time
intervals, and completion cutoffs. These are defined directly below, but the complete
experimental parameters are also shown in Table 1.
Task complexity. Varying difficulty levels are used to test communication efficiency
for simple tasks versus complex (or potentially more stressful) ones. This range of
task complexity simulates the wide range of tasks experienced daily at the rig site.
Parameters varied include the rotary speed (RPM), pump speed (total SPM), and rate

62
of penetration (ROP in ft/hr). Beginner-level tasks are single parameter changes, as
seen in the white/left column of the tables in Appendix 1 – Roadmaps for DRM.
Intermediate-level tasks are double parameter changes, and seen as the first four tasks
of the grey/right column. Advanced-level tasks require simultaneous parameter
changes plus follow-up monitoring, which are the last/bottom task in the grey/right
column.
Time interval. Only a certain amount of time is allotted for each individual drilling
task, which aids data collection and overall experiment efficiency. Each level of task
complexity has its own time interval (30 seconds for beginner, 60 secs for
intermediate, and 120 for advanced). A preconfigured smartphone app (“SmartWOD
Timer – WOD Timer” available on all app stores) facilitates these intervals. The
participants are instructed to proceed to the next drilling task when the app makes an
audible alert tone. The interval method enables the experimenter to have a properly
defined ‘start’ and ‘stop’ time for each task. These time intervals are present in the
far-left side of the tasks boxes shown in Appendix 1 – Roadmaps for DRM.
Task completion. While time to completion is an important measurement, it is
important to define exactly when a task is considered “complete.” Due to the
sensitivity of the small radius control knobs for Pump 1 SPM, Pump 2 SPM, and
Rotary/TDS RPM (Figure 6, bottom left), we defined completion as a range of getting
“close enough.” That is when the requested parameter is continuously maintained
within three units for three seconds. We acknowledge that this definition of task
completion probably differs from an outside source’s. However, this definition is
applied consistently across all groups within this study.
For example, if the Assistant Driller requests 140 RPM, the drilling task reaches
completion when the Driller maintains a rotary speed between 137 and 143 RPM for
three continuous seconds.
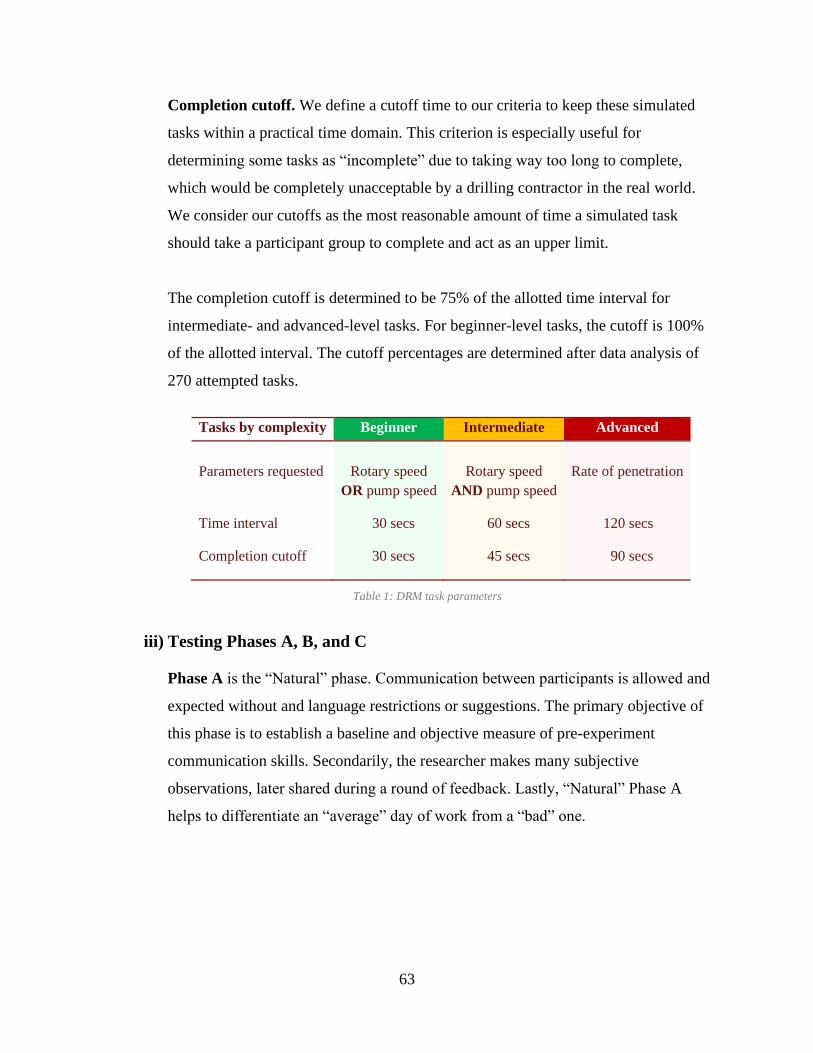
63
Completion cutoff. We define a cutoff time to our criteria to keep these simulated
tasks within a practical time domain. This criterion is especially useful for
determining some tasks as “incomplete” due to taking way too long to complete,
which would be completely unacceptable by a drilling contractor in the real world.
We consider our cutoffs as the most reasonable amount of time a simulated task
should take a participant group to complete and act as an upper limit.
The completion cutoff is determined to be 75% of the allotted time interval for
intermediate- and advanced-level tasks. For beginner-level tasks, the cutoff is 100%
of the allotted interval. The cutoff percentages are determined after data analysis of
270 attempted tasks.
Tasks by complexity Beginner Intermediate Advanced
Parameters requested Rotary speed
OR pump speed
Rotary speed
AND pump speed
Rate of penetration
Time interval 30 secs 60 secs 120 secs
Completion cutoff 30 secs 45 secs 90 secs
Table 1: DRM task parameters
iii) Testing Phases A, B, and C
Phase A is the “Natural” phase. Communication between participants is allowed and
expected without and language restrictions or suggestions. The primary objective of
this phase is to establish a baseline and objective measure of pre-experiment
communication skills. Secondarily, the researcher makes many subjective
observations, later shared during a round of feedback. Lastly, “Natural” Phase A
helps to differentiate an “average” day of work from a “bad” one.

64
Example
#
Desired Parameter How To Say It
1 ROP: 85 ft/hr [Assistant Driller’s choice]
2 110 RPM [Assistant Driller’s choice]
3 140 SPM [Assistant Driller’s choice]
4 80 SPM [Assistant Driller’s choice]
Table 2: desired parameters for the unscripted "Natural" Phase A
Phase B is the “Imperfect” scenario representing that worst possible “bad” day of
work. The researcher provides the Assistant Driller with a script of words to dictate to
the Driller during each timed interval. The AD can respond to the Driller, but still
only in the original prescribed manner. The “Imperfect” phrases come from a review
of effective communication skills (Chapter 3, section D).
A few examples of these Phase B scripted commands are in Table 3 below.
“Imperfect” phrases highlight the importance of appropriate volume, timing,
relevancy, specificity, logicality, and more. From a theoretical standpoint, we expect
task completion results to suffer dramatically during Phase B. However, we are also
looking to observe any subjective frustrations, increased anxieties, or negative
interactions between participants.
Example
#
Scripted “Imperfect” Phrase How To Say It
1 “Drill no faster than 90 feet per hour” Normal volume, normal pace
2 “Without changing weight on bit,
without changing pump strokes,
change the rotation to revolutions per
minute of 110”
Normal volume, slower pace
3 “Hey... Uhh... Pump at 140 strokes per
minute”
Wait 7 seconds after hey.. uhh..,
then normal volume, normal pace
4 “Decrease pump strokes to 80 SPM” “Whisper” volume, normal pace
Table 3: "Imperfect" phrase examples from Phase B
For a complete list of the “Imperfect” phrases, see Appendix 1.

65
Phase C, known as the “Perfect” language phase, also uses scripted drilling
commands from AD to Driller. These phrases continuously evolve into future
research as we conduct more language studies and develop the Universal Drilling
Language. A goal of the UDL is to iterate to match the evolution of drilling
communication design. Table 4 shows some of the iterated phrases from Phase A and
B into Phase C (example numbers are maintained for consistency).
Example
#
Scripted “Perfect” Phrase How To Say It
1 “Increase weight on bit to 35k and
drill at 85 feet per hour”
Normal volume, normal pace
2 “Increase RPM to 110” Normal volume, normal pace
3 “Increase pump strokes to 140 SPM” Normal volume, normal pace
4 “Decrease pump strokes to 80 SPM” Normal volume, normal pace
Table 4: "Perfect" phrase examples from Phase C
D. Results
Results from the Driller’s Roadmap Language Experiment are measured and presented in
two primary ways: time to task completion and rate of task completion. These two measures are
important because drilling companies obviously want to get things done but care just as much
about how long tasks and processes take.
i) Rate of Task Completion
While efficiency always matters, it is important to know whether a task is even getting
done in the first place. One popular business viewpoint is “time is money,” while another
is “what have you done for me lately?” and the DRM results show improvements for both
viewpoints. Effective communication has a clear impact on consistently and successfully
completing tasks. More specifically, Figure 5-6 shows completion rates broken down by
task complexity across all three testing phases.

66
Figure 5-6: rate of drilling task completion across phase and complexity
Important conclusions from this rate of completion analysis include:
• every single task by all groups is completed when using a “Perfect” language model;
• ineffective communication models are abysmal for performance, and especially for
advanced-level tasks;
• most, but not all tasks are completed using an intuitive and “Natural” baseline; and
• advanced-level tasks see the most significant improvements with improved language
protocols.
ii) Time to Task Completion – Beginner-Level
The previous subsection focuses on how often tasks reach completion, but now the focus
turns to efficiency. Completing tasks is a fundamental requirement for business, but how
long it takes to complete a task becomes more relevant.
Each participant group did establish a unique “Natural” baseline but demonstrated the
most significant time savings for beginner-level tasks. As expected, all groups show their
worst performance in “Imperfect” Phase B and best performance in “Perfect” Phase C.

67
These observations alone demonstrate that the effectiveness of drilling communication
might drastically affect drilling task performance.
Figure 5-7: time to completion for beginner-level tasks
Across all groups and trials, the average completion times started at a baseline of 17.4
secs, slowed to 26.4 secs in the “Imperfect” phase, and quickened to 12.6 secs in the
“Perfect” phase. Figure 5-7 illustrates the complete dataset for beginner-level tasks. Dark
shaded bars represent incompleted tasks due to the cutoff time. The completion rate is
highlighted at the bottom of each graph but will be discussed further in its own section of
results.
More specifically, each testing phase (A, B, and C) includes ten beginner-level tasks to
attempt. The results show that when drilling pairs use more effective communication
phrases, they complete the beginner-level tasks approximately 4.8 seconds faster than
baseline performance. Although these single parameter tasks are considered “simple”,
one cannot ignore the accrued time savings from improved language. As language shifts
towards a standardized “perfect” approach:
• the average group saved 48 seconds over 10 tasks with the “Perfect” language versus
“Natural,”
• the average group saved 138 secs over 10 tasks with the “Perfect” language versus
“Imperfect,” and
• the spread of data decreases, thereby showing all groups became more consistent.

68
iii) Time to Task Completion – Intermediate-Level
To make this language standardization argument even more compelling, a deeper dive
into more complex tasks is necessary. In addition to the beginner-level tasks, each
participant group also attempts four intermediate-level tasks per phase. Again, the general
performance pattern continues: each group demonstrates a unique “Natural” baseline and
poorest performance in “Imperfect” Phase B. This time, however, performance only
mildly improves in “Perfect” Phase C. Average completion times started at 25.7 secs for
“Natural,” slow to 45.5 secs for “Imperfect,” and marginally improve to 23.3 secs for
“Perfect.” Figure 5-8 shows the complete results for intermediate-level tasks. Again, the
darker shaded bars represent incompleted tasks due to the cutoff time. The completion
rate is highlighted at the bottom of each graph but will be discussed further in the next
section of results.
Figure 5-8: time to completion for intermediate-level tasks
While the average only marginally improves by 2.4 secs from “Natural” to “Perfect,”
there are still noteworthy observations:
• the spread of data decreases slightly – groups become more consistent,
• the time to task completion decreases for the average, and
• the worst-performing groups experience the greatest improvement from language
standardization.

69
iv) Time to Task Completion – Advanced-Level
During each testing phase, each participant group only attempts one advanced-level task:
achieve a specific rate of penetration. During the “Natural” phase, the groups tackle this
challenge in an open-ended manner, and results vary wildly. While the “Imperfect”
attempt is a complete fail, the “Perfect” attempt saw significant improvements across
time, rate, and consistency.
Figure 5-9: time to completion for advanced-level tasks
Figure 5-9 shows full results for the advanced-level drilling tasks. The darker shaded bars
represent incomplete tasks based on completion cutoff, and the completion rates and
average completion times are denoted at the top.
v) Voice Recordings
Although the researchers originally intended to use and analyze the participants’ voice
recordings, they were archived for future reference instead. The DRM’s hypothesis was
proven true, so the researcher moved on to designing a new experiment. However, these
archived voice recordings might be most helpful for a future review of what “natural” and
intuitive drilling language sounds like.

70
E. Discussion
The most significant results from the DRM study come from a somewhat unintuitive
direction: beginner-level tasks. While one can assume the Universal Drilling Language will
provide the most upside for complex scenarios (e.g., well-control events), maybe more
straightforward applications deserve more immediate consideration. The DRM results show that
basic-level tasks can see dramatic time savings. If one considers the volume of basic-level tasks
occurring at a rig site over a well’s life span, then standardizing language protocols around these
tasks might seem like an idea worth exploring.
i) Projecting results onto reality
The DRM experiment uses a small sample size of ten simple tasks per language phase,
but this is not enough to represent the reality on a drilling rig. In the oilfield, no two days
are the same. Each day requires a drilling team to effectively balance the complex and
demanding challenges with the more routine and easy ones. Now, since this beginner-
level task data already shows such promise, we ask: exactly how many simple tasks is a
drilling rig performing on any given day? Just 10, like in this experiment? How about 100
tasks? Maybe 1000? For a reality check, we extrapolate our experimental sample size to a
more practical scope, one that might represent beginner-level tasks over an entire
workday.
When expanding from 10 tasks into a more realistic 240 (or 10 per hour), our data show
that improving language protocols from “Imperfect” to “Perfect” saves upwards of 55.2
minutes (3,312 secs). On the conservative side, improving from the “Natural” baseline to
“Perfect” saves 19.2 minutes (1,152 secs) for every 250 beginner-level tasks performed.
It looks like we can go home a few minutes earlier today, right?
The DRM experiment described herein shows some potential for measurable
improvements on the drill floor when implementing more effective standardized
language. While these objective results might be a first of their kind, this thesis also
includes a subjective analysis of publically available videos to help examine the realities
of rig floor communication and actual human behaviors. This separate analysis (Chapter

71
3, Subsection Dii) tallies crews’ communication successes and failures. It is now realistic
to place some of these poorest performing crews towards the “Imperfect” end of the
communication continuum. Bringing these two studies together underscores the potential
for improving the coordination between crew members with a standardized drilling
language.
ii) Why these results matter
As a human-involved process, the drilling industry can agree that some non-productive
time (NPT) is unavoidable. However, this chapter proposes that NPT should not be lost to
something as invisible as communication. This experiment shows that drilling crews
might consistently save time and complete more tasks by using a more precise
communication framework. By isolating and optimizing drilling phrases, the results
provide optimism for how small one-time changes might compound into significant
savings in the long term. Knowing what to say and how to say can make a substantial
difference.
There is always room for improvement. From industry professionals to emerging
technologies and innovative ideas, the opportunities are endless. As an industry, we are
looking to reduce non-productive time, reduce risk, drill faster, improve safety, improve
environmental impacts, and the list goes on and on.
This language experiment has shown that student populations can see immediate and
significant improvements to their communication skills with simulation-based training
and research. Furthermore, it also suggests that drilling professionals can experience
benefits by being taught new ways of communicating. These professionals can then bring
these improvements back to their rig floor today. Together, these observations suggest
that for maximal time savings throughout a drilling career, communication training needs
to begin on the first day on the job (or before). Incorporating industry-specific
communications training into university curriculum would be fantastic.
These results also so that a dedicated drilling language will improve consistency across
all levels of tasks.
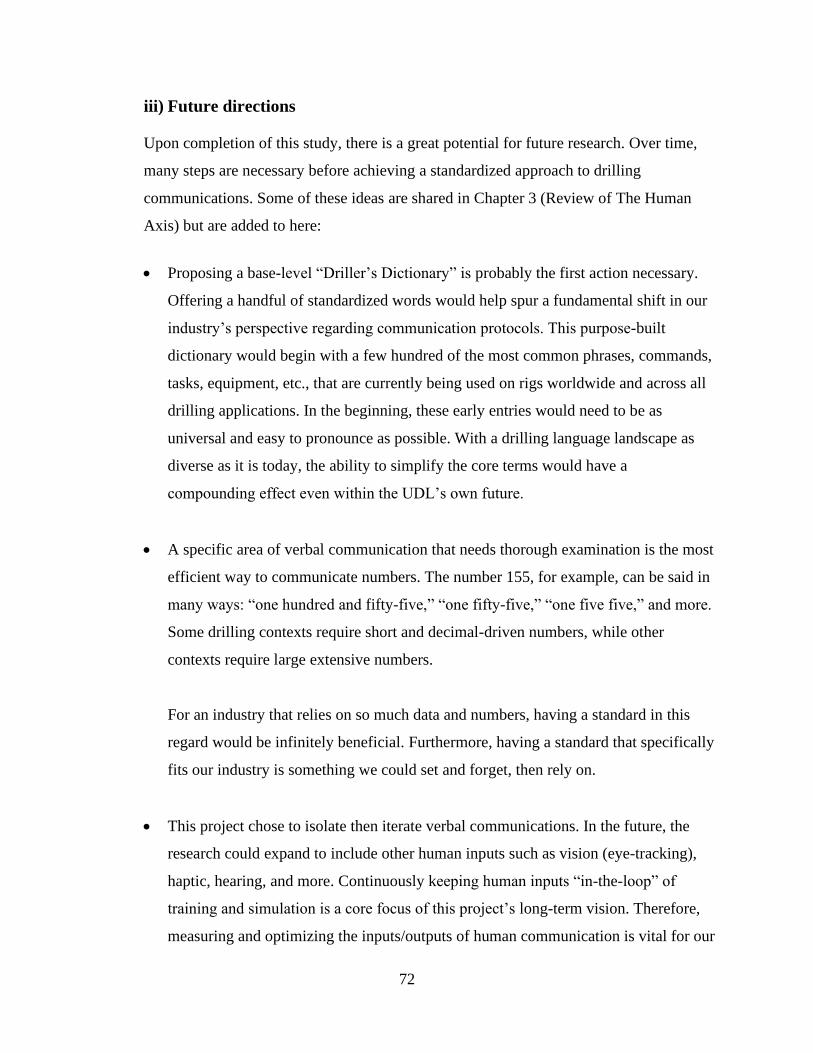
72
iii) Future directions
Upon completion of this study, there is a great potential for future research. Over time,
many steps are necessary before achieving a standardized approach to drilling
communications. Some of these ideas are shared in Chapter 3 (Review of The Human
Axis) but are added to here:
• Proposing a base-level “Driller’s Dictionary” is probably the first action necessary.
Offering a handful of standardized words would help spur a fundamental shift in our
industry’s perspective regarding communication protocols. This purpose-built
dictionary would begin with a few hundred of the most common phrases, commands,
tasks, equipment, etc., that are currently being used on rigs worldwide and across all
drilling applications. In the beginning, these early entries would need to be as
universal and easy to pronounce as possible. With a drilling language landscape as
diverse as it is today, the ability to simplify the core terms would have a
compounding effect even within the UDL’s own future.
• A specific area of verbal communication that needs thorough examination is the most
efficient way to communicate numbers. The number 155, for example, can be said in
many ways: “one hundred and fifty-five,” “one fifty-five,” “one five five,” and more.
Some drilling contexts require short and decimal-driven numbers, while other
contexts require large extensive numbers.
For an industry that relies on so much data and numbers, having a standard in this
regard would be infinitely beneficial. Furthermore, having a standard that specifically
fits our industry is something we could set and forget, then rely on.
• This project chose to isolate then iterate verbal communications. In the future, the
research could expand to include other human inputs such as vision (eye-tracking),
haptic, hearing, and more. Continuously keeping human inputs “in-the-loop” of
training and simulation is a core focus of this project’s long-term vision. Therefore,
measuring and optimizing the inputs/outputs of human communication is vital for our

73
next point regarding the human-machine axis. Some of these additional inputs are
tested and observed in Chapter 6.
• Bridging the gap between humans and machine needs to come from a forward-
thinking generational perspective. It is paramount to gain an understanding of our
existing technologies and user population. We believe that communication
improvements can help our current drillers and companies in the short term, but we
need to consider the next generation if we want to enable a step-wise improvement.
We need to project our human-machine connections into the next generation. Future
hardware and software need to match how humans actually behave and will use them.
Additionally, these tools should all be designed from a unique drilling industry-
centric perspective.
As a baseline, pioneers of this proposed movement need to have the requisite
understanding of the drilling process, of course. But they also need a deeper
understanding of human psychology, communication protocols, graphical design,
process design, communication design, among so many other human-centric topics.
This breadth of knowledge and wisdom will help build a more comprehensive inter-
relationship between the drilling humans and the drilling machine technologies.
A major success of this study is that it maintains and tests the underlying human factors with
an experimental environment similar to real-life. Using a drilling simulator allows the
researchers to reach industry-specific conclusions with industry-specific solutions. Above all,
this experiment demonstrates that task completion can dramatically improve when language
models shift away from “imperfect” and towards a more “perfect” future.
6. Testing Attention Inside the Drill Shack
This chapter describes an experiment that further examines the crosssection between human
abilities and the requirements of drilling operations. This experiment, known as the Verbal
Shadow Drilling Study (VSDS), uses many of the lessons learned about communication from the
Driller’s Roadmap Experiment and then applies them into unexplored territory using cognitive

74
psychology techniques. The overarching goal of the VSDS is to test some of the limitations of
human psychology directly in a simulated drilling environment. High-risk industries, like
drilling, have an abundance of competing stimuli, so the VSDS aims to improve drilling
performance with cognitive tools.
A. Introduction
One current problem is that the interconnections between drilling technologies and human
psychology are not well known, or worse – ignored. For better or worse, the drilling industry is
rapidly moving toward less work from humans and much more from automated processes and
systems. Generally, rapid technological advancements are a positive thing, but this improvement
can be a double-edged sword. If new machines and methods continue to overlook “human-in-
the-loop” design, then the industry’s future operations will inevitably experience unexpected
struggles and plateaus – a figurative headache.
i) Two perspectives
The human psychology contribution of the VSDS comes from the cognitive perspective,
which is previewed in Chapter 3, Section C. As a reminder, cognitive psychology
concerns itself with the science of the mind and includes domains like perception,
memory, knowledge, thinking, and beyond. Of particular interest for the direction of this
experiment is the scope of attention. More specifically, subtopics such as dichotic
listening and verbal shadowing are tested.
The drilling technology component of this research is considering ongoing developments
that are helping guide the industry towards an assisted and fully automated drilling
process. Special considerations for this project are (1) the proposal of developing a
Universal Drilling Language (UDL), (2) using drilling simulators to test, train, and teach
the drilling process to individuals and crews, and (3) a human-factors approach to drilling
tasks and system design.
Human psychology and drilling technology do not have to be at odds with each other.
Instead, the remainder of this chapter will test and explore their compatibilities. In terms
of outcomes and consequences, human psychology significantly impacts all drilling

75
activities that require any degree of human decision. Thus, it is imperative to frame the
drilling process as one in which the human demands are as extreme as the risks. Once
these human factors are understood, then the most optimal cognitive approaches can be
applied to the drilling processes.
ii) Cognitive demands of high-risk jobs
Everything we do, think, feel, or say stems from our foundational human capability
known as cognition (refer to Chapter 3, Section C). Without exploring and understanding
this “science of the mind,” optimizing the intersection between drilling humans and
drilling machines remains impossible. One might think of computers and machinery as
our greatest tools, but human cognition is the most necessary of all. Human abilities are
required to accomplish every single one of the most excellent, challenging, and hazardous
tasks known to man (with or without the aid of machines). Remember this – marvelous
engineering solutions do not create themselves. Without cognition, we are without a lens
to even perceive the problem. Without cognition, we cannot even begin to speculate on
some solutions. Our ability to thrive and work together begins with the science of the
mind.
Understanding cognition is a great start, but how we use and apply it to the demands of
risky jobs needs further investigation. Many commonly known and well-respected
industries expose their workers to dangerous situations daily – construction, mining,
logging, fishing, to list a few. From the individual to the organization, it is imperative to
realize the range of inputs that might lead to failure, harm, injury, or worse.
Some risks are inherently physical, while many others can be mental, process-oriented,
technological, etc. These sets of risks and their subsequent consequences must come
together, and high-risk jobs need a way to characterize them. Tveiten and Schiefloe
(2014) suggest developing risk images for high-risk integrated operations, especially
when introducing new technologies. They define a risk image as the “combination of
hazard identification and risk perception.” The most relevant high-risk industry to this
research, and still growing in complexity and vulnerability, is the drilling and oil and gas
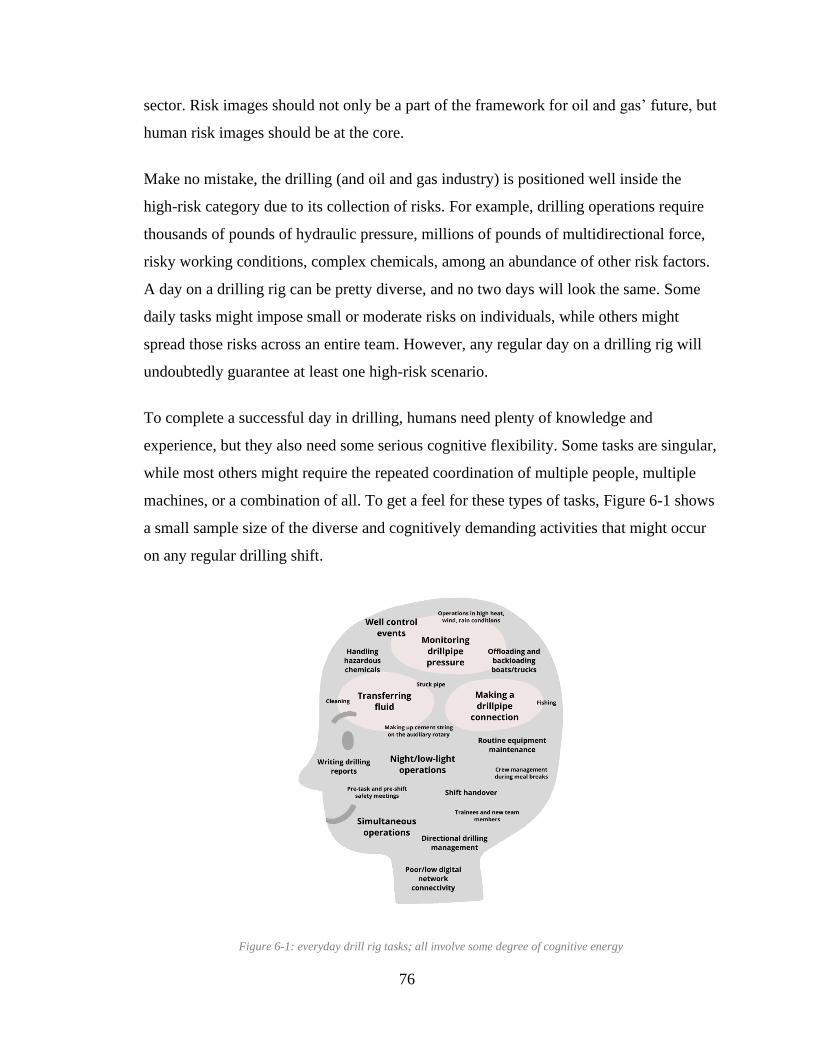
76
sector. Risk images should not only be a part of the framework for oil and gas’ future, but
human risk images should be at the core.
Make no mistake, the drilling (and oil and gas industry) is positioned well inside the
high-risk category due to its collection of risks. For example, drilling operations require
thousands of pounds of hydraulic pressure, millions of pounds of multidirectional force,
risky working conditions, complex chemicals, among an abundance of other risk factors.
A day on a drilling rig can be pretty diverse, and no two days will look the same. Some
daily tasks might impose small or moderate risks on individuals, while others might
spread those risks across an entire team. However, any regular day on a drilling rig will
undoubtedly guarantee at least one high-risk scenario.
To complete a successful day in drilling, humans need plenty of knowledge and
experience, but they also need some serious cognitive flexibility. Some tasks are singular,
while most others might require the repeated coordination of multiple people, multiple
machines, or a combination of all. To get a feel for these types of tasks, Figure 6-1 shows
a small sample size of the diverse and cognitively demanding activities that might occur
on any regular drilling shift.
Figure 6-1: everyday drill rig tasks; all involve some degree of cognitive energy

77
Now, not every drilling task requires the same level of cognitive function, but ultimately
they will still accumulate throughout a shift. One side effect of these varying tasks is that
the cognitive demands (and risk images) will compound. While health, safety, and
environment (HSE) have long been foundational to the oil and gas industry, additional
frameworks need to be developed around the complexities of human behavior.
Instead of merely trying to protect humans via external safety protocols, the industry
should embrace the fragile interconnections between man and its machines going
forward. Optimizing human behavior is just as important as optimizing machine
processes. Building drilling machines with human behavior in mind will help industry
flourish with dramatic improvements in HSE and productivity. The first human tool
studied and tested here was communication, and the next is the cognitive ability of
attention.
B. Cognitive Tools for Study
Humans are inherently social creatures looking to improve our quality of life over time – we
interact in groups to solve all sorts of problems for our greater good. Still, to interact effectively,
humans must perceive and subsequently process vast amounts of inputs continuously flooding
into our sensory systems.
For example, let us consider this present moment. Sound waves are collecting on your outer
ear, causing your eardrums to vibrate; your body is experiencing tactile pressures as it contacts
the seat or floor beneath you; tastes and smells of your environment are marvelously uniting; and
don’t forget – you are effortlessly reading these words thanks to your visual system. The real
magic of this moment lies in your cognitive ability to focus attention when and where it is
necessary. Imagine, for a moment, that you were incapable of “paying attention.” It would take
hours to accomplish just a few simple tasks. Worse, you might miss out on essential features,
lack personal safety, or be rendered completely ineffective as a productive human being. Life
would lose a lot of its meaning and would become quite tedious. Fortunately, we have lots of
cognitive tools at our disposal.

78
i) Attention
One of the most important cognitive tools is attention, which is the human ability to
actively choose and focus on relevant stimuli while tuning others out (CogniFit 2016). A
helpful analogy for understanding attention is an overhead spotlight for a stage play (as
seen in Figure 6-2). When used effectively, a spotlight automatically directs the crowd’s
attention towards specific positions on the stage. The light illuminates performers and
other relevant parts of a scene while stimuli in the shadows lose priority. The crowd
essentially has a filter for what is essential and what is not.
Figure 6-2: using a stage spotlight as an analogy for cognitive attention
Human attention works similarly. Unfortunately, it appears that there are limits to many
of our cognitive abilities (Oberauer 2019). Overall cognitive load, working memory, and
attention are limited resources and are being tested with every passing day. Constrained
human attention becomes an even greater issue when the stakes are high, as in high-risk
jobs.
As it relates to jobs like drilling, individuals need to process so many ideas, identify
complex patterns, and think critically far beyond the primary senses. Furthermore, crews
of individuals must come together to accomplish complex tasks as safely and efficiently
as possible. Luckily, the human brain has adapted to filter and process the massive flood
of sensory inputs almost automatically.

79
But exactly how much stimulus is the human brain have to process? Previous analysis
shows that humans are processing an almost unfathomable amount of information every
single day. For example, Bohn and Short (2012) measure how much media Americans
“consume” outside of work hours, and the team reports that 10.8 trillion words were
consumed in 2008. This count was a staggering growth from the mere 4.5 trillion words
in 1980. This latest amount equates to around 100,500 words per American per day. This
amount of input is almost unfathomable for an average human on an average day.
However, dealing with this amount of words becomes possible with the cognitive ability
to focus one’s attention.
Today’s population is becoming overwhelmed with an abundance of technology, data,
and general information. The “information economy” and ongoing competition for
human attention is still growing. In 1971, the American cognitive psychologist Hubert
Simon was already proclaiming the need for entire organizations to better rebalance their
workers’ limited attention with the overabundance of data flows. “A wealth of
information creates a poverty of attention and a need to allocate that attention efficiently
among the overabundance of information sources that might consume it” (Simon 1971).
The shortening (or perception of shortening) of attention is only becoming exacerbated as
data-, information-, and machine-technology creep further into society and (for our
context), deeper into the drilling industry. So, a critical question needs exploring – how
do we help our drilling teams pay more attention while their operational environments are
growing with distraction?
One of the solutions proposed by this research team is the continuous testing and
development of the Universal Drilling Language (UDL). The UDL might bring a cascade
of positive effects for drilling safety and efficiency with proper communication design.
More specifically, the UDL creates a communication framework that naturally shifts a
human limitation into a strength. It will help users to focus their attention through
language, and that is what this current experiment tests.
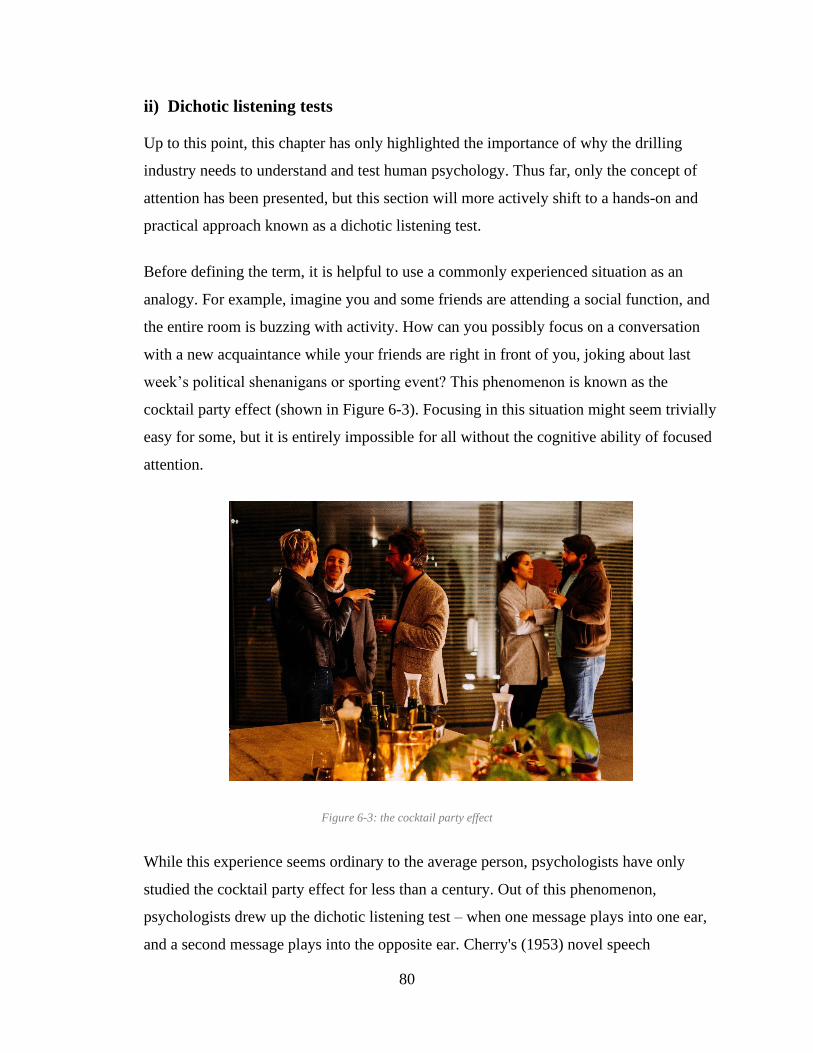
80
ii) Dichotic listening tests
Up to this point, this chapter has only highlighted the importance of why the drilling
industry needs to understand and test human psychology. Thus far, only the concept of
attention has been presented, but this section will more actively shift to a hands-on and
practical approach known as a dichotic listening test.
Before defining the term, it is helpful to use a commonly experienced situation as an
analogy. For example, imagine you and some friends are attending a social function, and
the entire room is buzzing with activity. How can you possibly focus on a conversation
with a new acquaintance while your friends are right in front of you, joking about last
week’s political shenanigans or sporting event? This phenomenon is known as the
cocktail party effect (shown in Figure 6-3). Focusing in this situation might seem trivially
easy for some, but it is entirely impossible for all without the cognitive ability of focused
attention.
Figure 6-3: the cocktail party effect
While this experience seems ordinary to the average person, psychologists have only
studied the cocktail party effect for less than a century. Out of this phenomenon,
psychologists drew up the dichotic listening test – when one message plays into one ear,
and a second message plays into the opposite ear. Cherry's (1953) novel speech

81
recognition experiments help us better understand the brain’s potential to filter out
simultaneous, irrelevant, and unnecessary messages.
During one of Cherry’s dichotic listening experiments, his results show that a subject has
zero difficulties tuning into one line of speech while “rejecting” the other. Interestingly,
when the rejected line of speech switches from one language to another, the subject later
reports that the language switch was neither registered nor intelligible. This shows that
the human brain is capable of illuminating some stimuli while downgrading the priority
of others. Overall, these dichotic listening tests prove that attention can indeed act as a
spotlight.
There is one downside to Cherry’s observations, unfortunately. Even if his research
subjects successfully tune into one message and reject the other, they might not always
understand the desired message. So, while attending to the desired stimulus is necessary,
extracting meaningful information from it is also important. Furthermore, when the
desired stimulus happens to be a task-relevant command (in a high-risk job, for example),
it is imperative to acknowledge it, understand it, and also take action.
These insights are underlying motivations for reproducing and studying the cocktail party
effects within the drillshack. This experiment highlights this connection between
attending to a command stimulus and accurately and efficiently carrying out the request.
Again, it is wonderful to understand psychology's theories and concepts, but it is way
more useful to apply and assess them uniquely for a new industry. One of cognitive
psychology’s enduring questions is how exactly an individual can maintain focus despite
distracting inputs from nearby irrelevant tasks. When it comes to improving human
factors in the drilling industry, this thesis has a vision of actively testing new methods.
The goal here is to apply cognitive tools to drilling and see which ones will make the
industry safer and more efficient. One cognitive method that this experiment uses is a
technique borrowed from dichotic listening tests, known as verbal shadowing.
82
iii) Verbal shadowing
An essential element of a classical dichotic listening test is a verbal shadow, the act of
repeating the stimulus from the attended channel verbatim. By repeating the primary
stream of speech, the participant uses their attentional resources on the target stimulus
and demonstrates that the phrases are recognized. One of the positives of this technique,
as observed in Cherry's (1953) experiment, is that subjects do not report significant
processing from the unattended ear – except that sounds were heard.
There is one adverse consequence, unfortunately. As speech streams become more
complex, much of the emotional and semantic underpinnings are lost during shadowing.
However, these repeated streams were passages of phrases linked together (much longer
than a few words). So while this comprehension deficit is undesirable, it might have been
due to the length and randomness of the messages’ content. Overall, the shadowing
technique proves to be an excellent mechanism for using attention to separate concurrent
speech streams.
While this verbal shadowing has appeared in experimental literature, it has also shown up
in practice. For example, pilots and air traffic controllers must shadow many of their
instructions and commands before fulfilling them. In aviation, this is known as
“readback.” This step is vital in aviation communications as it supports acknowledgment
and verification.
While some posit shadowing might be superfluous, other research (Schneider, Healy, and
Barshi 2004) breaks the technique down and examines the effects of auditory and visual
modalities, command wordiness, and more. This readback research shows that not all
verbal shadows are equally effective. Performance can vary based on a message’s
modality or length. For example, a long stream of information might pose more
interference than a concise one. And in high-risk industries like aviation (or drilling) even
minor differences in comprehension or reaction time can have serious implications.
Applying verbal shadowing to drilling is an exciting approach, but will need unique
considerations and honest assessment.

83
Although some research analyzes readback as it relates to memory, this experiment
focuses on shadowing’s potential effect on attention. This thesis believes that perfectly
continuous readback would cause deficits in command comprehension, and these deficits
would increase with phrase length. Instead, the experiment described herein implements
reduced- or partial-shadowing as a means to improve attention for the required tasks. This
research team believes that consistently incorporating a verbal shadow into drilling
communications will help focus attention on drilling tasks. If successful, then the
technique will be part of the proposal for the Universal Drilling Language.
A new framework for drilling communications is proposed and should include deep
influences from cognitive tools, such as attention and verbal shadowing. These
standardized communication protocols would naturally help improve the cognition and
focus of our drilling personnel. The following experiment uses standardized concise
phrases from the UDL and tests the effectiveness of verbal shadowing in different phases
of varying external stimuli.
C. Experimental Design
This section’s purpose is to share experimental design, including participants and roles,
setup, materials, stumuli, and more.
i) Setup
The entirety of the experiment takes place within an acoustic-shielded room of the
Drilling Simulator Center at the University of Oklahoma (OUDSC). As seen in Figure
6-4, the participant is seated in front of the drilling simulator and external display while
the researcher sits to the right to provide instructions, supervise procedures, record
subjective observations, and verbalize the experimental drilling commands. All sessions
occur during daytime hours, so the blinds are opened while the artificial overhead
lighting is turned off. The room is well lit, comfortable, isolated, and free from external
interruptions.

84
Figure 6-4: simulator setup for the Verbal Shadow Drilling Study
ii) Participants
Seven adults participate in this experiment (ages 21–37, mean 27; 6 male; 5 with industry
experience), all fluent in English (2 average languages, 3 with English as primary
language), with self-reported normal hearing and corrected-to-normal vision. Signed
informed consent is mandatory from each participant before the experiment can
commence, in compliance with the University’s human research guidelines.
Each participant simulates the role of Driller, which is defined the same as in the DRM.
The Driller must operate the simulator’s control panels (Figure 4-3) and his or her
ultimate responsibility is to drill according to the researcher’s drilling parameters
requests.
iii) Apparatus
Physical equipment necessary includes a real-time drilling simulator, speaker system, and
an external monitor.

85
• Drilling simulator. A portable real-time drilling and well control simulator
(DrillSim:50) is provided to the OUDSC by Drilling Systems and meets accreditation
standards set forth by the International Well Control Forum (IWCF) and the
International Association of Drilling Contractors (IADC). The complete system
includes four physical interactive consoles (drilling, remote choke, BOP, manifold), a
touchscreen student panel, in addition to the instructor’s laptop station.
The full simulator is shown in Figure 4-3, and described in great detail in Chapter 4,
Section B. The OUDSC has two DS:50 hardware units, one designated as a primary
(serial number 125) and another designated as a backup (serial number 113) in case of
hardware or software issues. Both units and all consoles are used during training
exercises, but all experimental sessions only require the primary driller’s console and
touchscreen student panel.
• Speaker system. The stereo in use is a 2-channel Superscope R-1220 system, using
the standard audio output from the lab’s secondary laptop with internet access. The
output volume of the stereo system is adjusted to transmit at an approximate output of
80 decibels. This level simulates indoor conversation (60 decibels) plus background
noise (additional 20 decibels) from the drill floor, in an effort to match industry
estimates (WorkSafeBC 2018). The left speaker is positioned 5 feet (30 deg anterior)
from the participant's left ear, while the right speaker mirrors the positioning to the
right.
• External video. The external monitor is a 47-inch display by LG, and its sole
function is to transmit the audio-visual distractor stimuli mentioned in the following
subsection section. The monitor’s position is in the participant’s background field of
vision, approximately 3 feet behind the DS-50, at eye level, and almost entirely in
unobstructed view. The monitor connects to the lab’s secondary laptop using the
extended display functionality.
• Lap timer. The researcher uses a lap timer to record how long each drilling task takes
to complete.
• Not included in the VSDS. Multiple apparatuses (such as microphones, eye-tracking
devices, and heart rate monitors) are considered for the VSDS, but ultimately

86
excluded. Using a wireless microphone to record the participants’ communications
would help archive the actual content of exchanges for subjective analysis. The eye-
tracking devices would aid in measuring attention, attention awareness, and process
safety, as previously shown in aviation and offshore drilling studies (Salehi et al.
2018). Finally, heart rate monitors would help by measuring the level of arousal of
the participants, which might rise and fall depending on the complexity of the
simulated drilling scenarios. While these apparatuses are not included in this study,
they are primary candidates for future research involving drilling communication
design, human factors, and simulators.
iv) Stimulus
There are multiple sources of input stimulus required for the VSDS experiment, which
includes verbal drilling commands (4 sets), audio/video stimuli (active-control “natural”
soundscape, general-purpose “rig white noise,” and a conversational distractor. Lastly,
there is a specific drilling scenario used for all participants and phases.
• Verbal drilling commands. The researcher verbally requests drilling parameters
(input), and the participant is expected to manipulate the drilling simulator (output),
accordingly. This experiment isolates parameters from the three fundamental systems
(circulation, rotation, weight) by requesting changes to the rotary speed of the top-
drive system (TDS) in revolutions per minute (RPM), pump speed in strokes per
minute (SPM), weight on bit (WOB) in thousand-pounds (k-lb), rate of penetration
(ROP) in feet per hour (FPH), bit depth in feet, slips status, and total pump strokes.
Examples of these verbal command phrases, their systems, and outcomes are
presented in Table 5.

87
Example # Verbal Command Systems Outcome
1 “Increase pump strokes to
100” Circulation Flow begins
2 “Increase RPM to 140” Rotation
Drillstring
movement initiates
3 “Drill ahead using 20k
weight on bit” Weight
Bit touches
bottom, drilling
begins
4 “Increase RPM to 160” Rotation
Torque increases,
ROP increases
5 “Increase pump strokes to
130” Circulation
Pump pressure
increases, return
flow increases
Table 5: examples of drilling task requests
Regarding the pumps, the simulator system has two pumps; therefore, the researcher
requires that participants simply match the total strokes per minute using any
combination of pumps 1 and 2. This experiment keeps downhole drilling conditions
constant (see drilling scenario sub-section below) while only manipulating ROP by
varying RPM and WOB.
Verbal drilling requests (full collection in Appendix 3) are “perfect” phrases
developed from the previous DRM experiment involving the Universal Drilling
Language. All participants of the VSDS are tested using the same sets of roadmap
commands.
• Audio/video distractors. The overarching goal is to test if effective communication
techniques (like verbal shadowing) can aid a drilling team by focusing their attention
on the task at hand. To test this in our simulation-based environment and make the
experiment even more practical, our participants attempt the simulated drilling tasks
while realistic environmental distractions are present. This is simulated with sights
and sounds that any drilling team can expect at the rig site, in the drillshack.
The experimental procedures use two unique sets of background stimuli: one for an

88
active-control phase and another for the testing stages. Both stimuli sets are industry-
relevant, but what differentiates them is the intended level of arousal (or distraction).
While we could have excluded audio and video completely from the control stages,
we create an active-control scenario instead by using decibel-matched audio and
video. These distractions are replicated in the lab because all rigs, regardless of
application or location, are noisy and ever-present with environmental interference.
We intend for the active-control stimuli to be as non-distracting and focus-inducing as
possible since low-arousal background noises have been show to produce a less
significant interference effect (Han et al. 2013). The active-control stage uses a video
of rainfall for the background audio and visual stimuli. Since background noise is
inevitable at the rig site, this “natural” soundscape seems as low-arousal and focus-
inducing as possible, as suggested by (DeLoach, Carter, and Braasch 2015). For
audio, the rainfall does not include thunder noises or accompanying music. For video,
the rainfall is hardly visible, mostly leaving the impression of a dark screen (Figure
6-5). Lastly, rain is a universal stimulus for any rig site and therefore is both a neutral
and relevant stimulus for our experiment.
Figure 6-5: audio/video stimulus of rainfall used for active-control stages (YouTube)
The experimental stages, in contrast, must include distractors that represent the
average noisy activity occurring at the rig. The video chosen here includes moving

89
machinery (e.g., drawworks, iron roughneck, elevators, automatic slips), humming
motors, and the occasional beeping alarms. One can think of this distraction as
general “rig white noise.” You will find these noises at every rig in the world, and so
for this reason, we include them in our study of a driller’s attention. This general-
purpose audio/video distractor (Figure 6-6) comes from a drillship building a stand of
drillpipe on the auxiliary side of the rig floor, which requires a second pair of drilling
personnel inside the drillshack. Building up extra/future drilling strings using
auxiliary rig equipment is an everyday operation available to most modern
simultaneous operating (SIMOPs) rigs. Plus, as a reminder, any SIMOPs working
environment is generally high-risk and prime for implementing our UDL. This
general-purpose audio distractor also serves as the video distractor (Figure 4).
Figure 6-6: general-purpose audio/video distractor of rig equipment (YouTube)
While there are no salient actions or people in this distractor, it is a continuous and
monotonous stimulus in which machinery moves slowly in and out of the focal point
while drillpipe is run vertically down into the hole. The camera angle is unchanging
for the entirety of the video. This video stimulus is helpful as a realistic view out of
the driller’s cabin while synchronously matching the “rig white noise” audio.
Altogether, this distractor helps increase the level of realism in this simulated drilling
scenario.

90
A secondary audio stimulus is a conversational distractor. In a practical sense, this
might be an ongoing conversation inside the drillshack (behind or around the active
drilling personnel) that is not immediately relevant to the task at hand. A distracting
conversation (like the cocktail party effect) is often as irrelevant as friendly banter
about sports, politics, weather, or future/past days off. Other times, these
conversations might be more rig-relevant such as about future or ongoing operations
elsewhere on the rig. From years of field experience, our research team understands
that the active drilling personnel is often listening to (if not actively taking part in)
these distracting conversations. For these reasons, the VSDS experiment uses a
drilling podcast for the conversational distractor, which seems suitable for diverting a
driller’s attention.
In the chosen podcast episode (refer to Appendix 4), the two hosts discuss the 2022
outlook for U.S. frac activity. Like the cocktail party effect, this drilling podcast
episode offers many opportunities for a driller to be distracted by industry-specific
and salient details. Discussion includes many references to numbers (pricing, rig
counts, money), oilfield locations (Houston, TX), standard oilfield equipment and
activities, among other drilling-related topics. The vision of the VSDS is for verbal
shadowing to act as a “barrier” to these distractors by helping a driller focus his/her
attention on the drilling tasks at hand.
Links for all of these audio/video distractors are found in Appendix 4.
v) Drilling scenario
In reality, there are thousands of surface and downhole variables to consider within
drilling. Fortunately, the DS:50 simulator comes equipped with advanced software
enabling real-time calculations of complex downhole conditions like gas expansion and
migration, pressure gradients, and rate of penetration changes (just to name a few). This
deep customization enables simulator users to experience a wide range of drilling rig
scenarios such as drilling ahead, tripping pipe, and well control events, all at the click of
a button.

91
This experimental design isolates a single drilling scenario to minimize the variability
between participants. During the experimental design phase, the researcher preconfigures
a set of surface and downhole variables, then saves the scene as a snapshot to be run and
rerun on command. This snapshot is labeled “smooth drilling high ROP”; the downhole
conditions allow for 23 feet of uninterrupted and homogenous drilling before any
lithology changes. Based on drilling roadmaps (Appendix B and C), intended ROP, and
other factors, the 23 feet mentioned previously is more than what each participant will
drill through. Most participants might only drill ahead by about 5 feet. Downhole
variables of this snapshot include:
• Formation type: Shetland
• Rock strength (drillability): 1.25
• Abrasion factor: 1.00
• Fluid type: Water
• Permeability: 1 mD
• Pore pressure: 0.544 psi/ft
• Vertical wellbore
• Drilling fluid: 12.3 ppg water-based mud
• Land rig with blowout preventer, top-drive system, two triplex mud pumps with max
stroke rates of 120 SPM, standard manifold
All experimental sessions use the same drilling snapshot for consistency because we want
objective results derived from the driller’s actions, inactions, and communications
surrounding each simulated drilling task and not from the drilling environment.
D. Training Stage
All sessions of this attention study include a customizable set of training/learning phases
(Figure 6-7) followed by standardized phases. The customizable phases include a general tour of
the OUDSC, a general lecture on fundamentals to drilling, and training exercises on the
simulator. These phases are customizable in length and intensity due to each participant’s unique

92
starting point in terms of experience and knowledge. The objective of this learning stage is to
teach participants the basics of drilling (if expertise is limited) and consequently bring all
participants to the same baseline level of performance.
Figure 6-7: proposed flow of the training stage
The general flow of the training stage used in the DRM proved to be highly effective, so the
same set of warmup exercises are used in this drilling simulator experiment (and can be referred
to in Chapter 5, Section B). Depending on each participant's previous knowledge and experience,
any combination of these exercises are considered:
• Draw a vehicle dashboard
• Draw the driller’s console

93
• Lecture of “Drilling in 10 Seconds”
• Draw a drilling rig site
• Point-To
• Red-Light, Green-Light
Most participants can begin drilling with the DS:50 simulator in less than an hour (even
without prior drilling experience). Any participants that do not feel confident after these stages
are provided more coaching and time until they are ready to proceed.
E. Testing Stage
Once the training/learning stage is complete, the standardized phases of this experiment can
commence. This experimental stage includes three unique testing phases, a survey, and a
feedback session. Across all three experimental phases, is timing the researcher notes any
subjective errors, plus any dispositions the participant expresses. The three experimental phases
include (a) active-control, without distraction; (b) no-shadow, with distraction; and (c) with-
shadow, with distraction.
The definition of task completion remains the same as for the DRM: when the requested
parameter is continuously maintained within three units for three seconds, and this definition is
applied consistently across all groups within this study. For example, if the Assistant Driller
requests 140 RPM, the drilling task reaches completion when the Driller maintains a rotary speed
between 137 and 143 RPM for three continuous seconds.
i) Experimental Phase A-C (Active-Control)
There would be minimal distraction in an ideal drilling world, so this first experimental
phase simulates that, and a performance baseline is set. The researcher calls out drilling
commands, and the participant attempts to complete each using the drilling simulator.
The researcher only repeats a command if the participant is wildly off-track or needs
additional clarification.
Phase A-C characteristics:

94
• Audio stimulus – rainfall only
• Video stimulus – rainfall only
• Driller’s communication protocols – none required; as intuitive and natural as
possible
• Complete when Driller completes all 25 drilling tasks, or 5 minutes have passed,
whichever comes first
• Drilling roadmap commands – Set 1 from Appendix 3
This phase is considered an active control because the non-distracted drilling includes the
neutral stimulus, instead of dead silence. Phase A-C is always attempted first. The
subsequent experimental phases are varied across participants in hopes of attenuating any
sequencing effects.
ii) Experimental Phase N-S (No-Shadow)
This phase introduces some drilling-specific distractions to the Driller: task-irrelevant
conversation in the drill shack and the “white noise” of the drilling equipment. Thus, this
phase is considered distracted drilling without any benefits from communication
protocol. The question tested here is whether or not these distractions affect the Driller’s
performance versus their baseline?
Phase N-S characteristics:
• Audio stimulus – general-purpose rig “white noise” and conversation distractor
(podcast)
• Video stimulus – drilling rig equipment only
• Driller’s communication protocols – none required; as intuitive and natural as
possible
• Complete when Driller completes all 25 drilling tasks, or 5 minutes have passed,
whichever comes first
• Drilling roadmap commands – Set 1 or Set 2 from Appendix 3, whichever is
unused in the preceding phase. The minor changes of task order and numerical

95
targets prevent the Driller from using short-term memory as a means of
operational efficiency while not drastically changing the completion potential
Like the cocktail party effect, the research team believes that the driller is likely to waste
attentional resources on the distractors, especially if the conversation holds some top-
down relevancy or bottom-up saliency. Top-down relevancy includes any information
that is likely to provoke an emotional response, memory, etc., while bottom-up saliency
is something that might be abrupt, loud, etc.
The hypothesis is proven right if more drilling errors, slower completion times, and fewer
completed tasks will occur during this phase. The audio and video distractors are paused,
the simulator’s drilling scenario is reset once more, and a break is provided before any
future phases are attempted.
iii) Experimental Phase W-S (With-Shadow)
This phase is considered distracted drilling but with verbal shadowing. We posit that this
communication intervention will have an attention-focusing effect and lead to drilling
performance gains.
Before this phase commences, however, a learning session is required to teach the
participant how to use the verbal shadowing technique. Phase W-S can not begin until the
participant is comfortable and confident with the verbal shadowing practice (Appendix 4,
Part D). Phase W-S uses many of the characteristics as Phase N-S:
• Audio stimulus – general-purpose rig “white noise” and conversation distractor
(podcast)
• Video stimulus – drilling rig equipment only
• Driller’s communication protocols – verbal shadow required
• Complete when Driller completes all 25 drilling tasks, or 5 minutes have passed,
whichever comes first
• Drilling roadmap commands – Set 1 or Set 2 from Appendix 3, whichever is
unused in the preceding phase.

96
The research team hopes that the results from Phase W-S will match Phase A-C (or are
improved).
iv) Feedback Session
After completing the experimental phases, participants must complete a general survey
before the feedback session. This helps facilitate data collection and leads to an effective
feedback session. Furthermore, this debrief is an opportunity to give specific and
actionable feedback to each participant based on their unique performance.
Each participant leaves the study feeling capable of improving their verbal
communications in other contexts (such as the rig, the classroom, personal relationships,
etc.). Lastly, the researcher explains the experimental design and shares the current
collection of results.
F. Results
The Verbal Shadow Drilling Study results are measured in two objective ways: tasks
completed and performance errors. The objective results are shown using two perspectives:
overall totals in a bar graph and a time-step graph. The overall totals bar graph quickly
demonstrates the broad differences in number, whereas the time-step graphs give a little more
context to the data. Due to this research’s underlying human factors motivations, the
participants’ subjective feedback is also included.
i) Average drilling task completion
The bar graph in Figure 6-8 shows the average number of completed drilling tasks,
whereas the errors and major faults are summated across all participants. The testing
condition with the most drilling tasks completed is the With-Shadow phase (22.4 avg),
which is approximately 9.8 to 12.6% more than the Active-Control (20.4 avg) and No-
Shadow (19.9 avg) conditions. A quick and overgeneralized evaluation of the task
completion results would imply that using a verbal shadow is recommended, but
observations surrounding the ineffective drilling behaviors are also collected and shared.
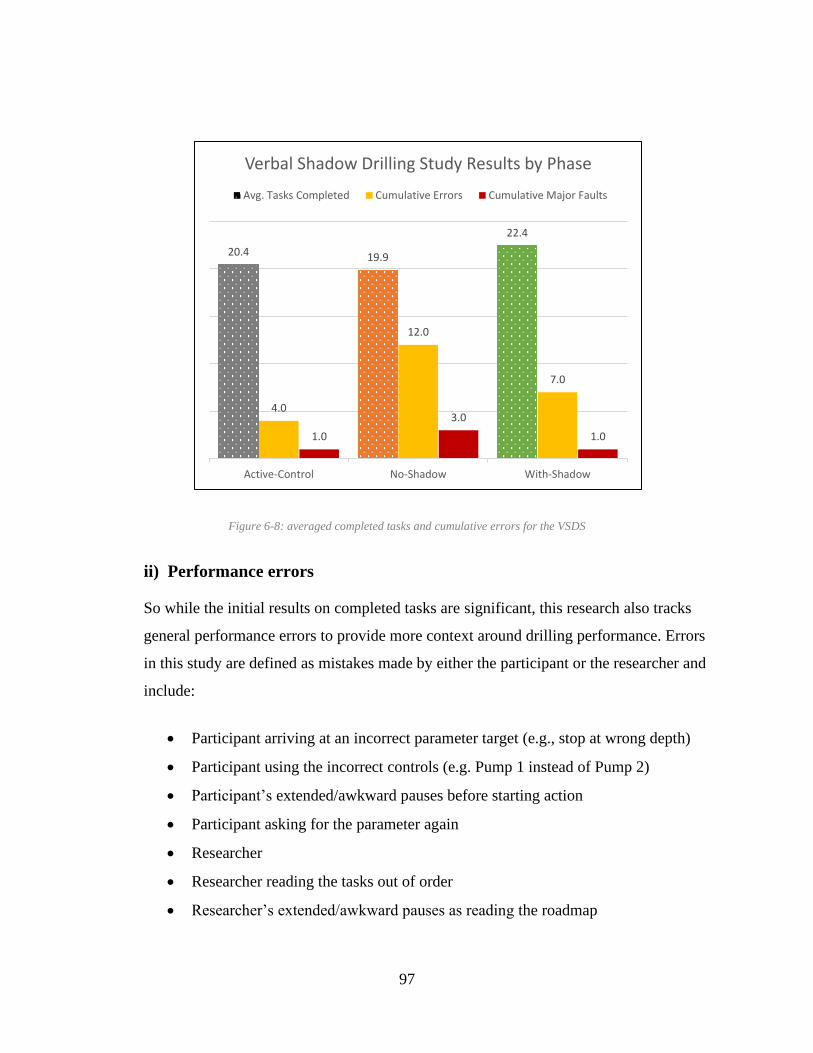
97
Figure 6-8: averaged completed tasks and cumulative errors for the VSDS
ii) Performance errors
So while the initial results on completed tasks are significant, this research also tracks
general performance errors to provide more context around drilling performance. Errors
in this study are defined as mistakes made by either the participant or the researcher and
include:
• Participant arriving at an incorrect parameter target (e.g., stop at wrong depth)
• Participant using the incorrect controls (e.g. Pump 1 instead of Pump 2)
• Participant’s extended/awkward pauses before starting action
• Participant asking for the parameter again
• Researcher
• Researcher reading the tasks out of order
• Researcher’s extended/awkward pauses as reading the roadmap
20.4 19.9
22.4
4.0
12.0
7.0
1.0
3.0
1.0
Active-Control No-Shadow With-Shadow
Verbal Shadow Drilling Study Results by Phase
Avg. Tasks Completed Cumulative Errors Cumulative Major Faults

98
Overall, it is clear to see that performance errors were at a minimum (4 total) during the
Active-Control phase. Remember, Phase A-C is performed first for all participants in the
study, and so while this might have been their first attempt at drilling using the simulator,
the least amount of mistakes occur here.
Once distracting stimuli are introduced in the subsequent phases, errors increase. There
are 12 total errors in the No-Shadow condition and 7 total errors in the With-Shadow
condition. Yet again, this suggests that a verbal shadow might be an effective
intervention.
All of the drilling tasks in the VSDS have a complexity level of beginner or intermediate.
Now, across two studies, these levels are known to take an average of 13 to 17 seconds to
complete, so a new subcategory of performance errors is defined: major faults. If a
drilling task takes more than 40 seconds to complete, it is classified as a major fault. In
reality, this means something problematic was going on, thereby making the task hard to
complete. Only 1 major fault occurs in the Active-Control and With-Shadow phase, while
the No-Shadow phase saw 3. Again, the verbal shadow technique seems effective.
iii) Time-step results for task completion
This method of charting the results was born simply out of curiosity. The researchers
want to view how tasks were being completed over time instead of just looking at the
final number, which was a limitation of the Driller’s Roadmap Language Experiment. It
was believed that more could be learned by observing the performance over time. This
time-step method highlighted the need to look at major faults, not just general
performance errors. The visual feedback of seeing a trajectory deviate from the pack
made it evident that performance errors are not created equal.
The original attempt at charting all of the participants' attempts on one single graph led to
a messy and complicated web of data. Instead, the data is segregated by testing condition
and then average tendlines are used to compare the cohort. The Active-Control phase
shows the participants exhibit a pretty wide range of baseline performance (Figure 6-9).
Baseline performances show that participants completed as few as 18 drilling tasks and as

99
many as 24 drilling tasks. The dark emboldened line is the mathematical average of all
seven participants and is carried forward into the following plots for comparison.
Figure 6-9: baseline drilling performance in the Active-Control condition
Next, the No-Shadow condition is plotted against the average baseline found in Active-
Control, as shown in Figure 6-10. Distracting stimuli is added, yet the overall drilling
performance does not change much. Remember, the average number of tasks completed
in the baseline is 20.4, while the average number of tasks completed in No-Shadow is
19.9. One might expect the drilling to improve due to a sequencing effect (earlier trials
might interfere and improve later trials), but it seems the distractions are enough to
nullify this. This time, the minimum completed is 19 tasks, and the maximum is 21 tasks,
so the results are at least a bit more consistent. The mathematical average of the No-
Shadow data is the orange emboldened line.
0
50
100
150
200
250
300
0 1 2 3 4 5 6 7 8 9 10 11 12 13 14 15 16 17 18 19 20 21 22 23 24 25
Tota
l Ela
pse
d T
ime
(sec
s)
Drilling Tasks Completed
Baseline Drilling Performance (No Distraction)

100
Figure 6-10: distracted drilling without verbal shadow versus baseline performance
Finally, the results that compare baseline performance versus distracted drilling with the
verbal shadow shows a significant effect, as seen in Figure 6-11. Almost the entire cohort
(6 out of 7) drill more efficiently than the average baseline. The mathematical average of
the With-Shadow data is the green emboldened line.
0
50
100
150
200
250
300
0 1 2 3 4 5 6 7 8 9 10 11 12 13 14 15 16 17 18 19 20 21 22 23 24 25
Tota
l Ela
pse
d T
ime
(sec
s)
Drilling Tasks Completed
No-Shadow vs Baseline (Avg)

101
Figure 6-11: distracted drilling with verbal shadow versus baseline performance
These segregated results are brought together into one plot to show the average
performances in the distracted versus non-distracted drilling conditions and the major
effect that verbal shadowing had. The performance gains happen quickly (within the first
3 or 4 tasks) and then continuously accumulates until the end of the 5-minute trial. This
accumulated performance gain is proposed in the DRM, but proven explicitly here in the
VSDS.
0
50
100
150
200
250
300
0 1 2 3 4 5 6 7 8 9 10 11 12 13 14 15 16 17 18 19 20 21 22 23 24 25
Tota
l Ela
pse
d T
ime
(sec
s)
Drilling Tasks Completed
With-Shadow vs Baseline (Avg)

102
Figure 6-12: averages of baseline, No-Shadow, and With-Shadow
iv) Subjective negative feedback
If this research only looks at the objective findings, it would be easy to say verbal
shadowing is a necessity. However, the subjective feedback given by the participants in
the feedback session cannot be ignored. There is a combination of negative and positive
feedback.
From a negative viewpoint, there is critical feedback given regarding the intervention’s
general usefulness. When asked if the verbal shadowing technique was helpful, the
participants’ responses were relatively split. Only one participant admits the intervention
was very useful, whereas two claim it was not useful whatsoever (Figure 6-13).
0.0
50.0
100.0
150.0
200.0
250.0
300.0
1 2 3 4 5 6 7 8 9 10 11 12 13 14 15 16 17 18 19 20 21 22 23 24 25
Tota
l Ela
pse
d T
ime
(sec
s)
Drilling Tasks Completed
No-Shadow (Avg) vs With-Shadow (Avg) vs Baseline (Avg)

103
Figure 6-13: "How useful was verbal shadowing for distracted drilling?" survey question
Another issue that came up multiple times is from participants for whom English is not
their primary language. These participants all admit that the shadowing technique is
complex and adds more friction to their performance. These participants commonly
described an overburden because they needed to translate/transcribe the content of all
these messages too many times.
Another interesting (and negative) feedback came from participants for whom Spanish
was their primary language. These two participants both reported unique challenges when
dealing with English numbers. Having to simultaneously listen to, shadow, and visually
search for English numbers (on the data displays) was noticeably difficult. One of the
participants claimed, “it became difficult to do the shadow because I had to use my ears,
my hands, and my mouth all at the same time.”
All of this language-specific feedback prompts the researcher to return to the objective
results to verify if primary language significantly affects the data. The data is visually
separated into two groups: the solid lines represent English-primary speakers and the
104
dashed lines represent non-English-primary speakers. In the Active-Control condition
(Figure 6-9), the best and worst performers were non-English-primary speakers, while the
English-primary speakers performed near the average. In the With-Shadow condition
(Figure 6-11), the best and worst performers are English-primary speakers, while the non-
English-primary speakers were all very close to the overall average. There is no
significant difference between the two groups for the No-Shadow condition (Figure
6-10). There is no discernable pattern here.
Despite the survey’s usefulness question and general feedback provided by the non-
English-primary speakers, the actual data does not support the self-reported added
difficulties.
v) Subjective positive feedback
This study's greatest and most positive takeaway is that 100% of the participants report
having zero issues understanding what each drilling task command means. The phrases
used herein are the iterated “perfect” phrases taken from the DRM experiment.
One participant explicitly states, “I really liked the direct and precise orders.” Using
concise language is a fundamental characteristic of effective communication and an
overall goal of the proposed Universal Drilling Language.
G. Discussion
This section explores the results, their deeper consequences, and how they might lead to
some practical conclusions. Some of the implications can be discovered by looking at the
average performances, while others are learned on a participant-by-participant basis.
i) Shared errors
An essential point of discussion surrounds the measurement of errors. The initial idea was
only to count the participant’s mistakes, but once distractors were introduced in the No-
Shadow and With-Shadow conditions, the researcher quickly started making errors
alongside the participant. This is a highly significant observation – the researcher knows
exactly what is supposed to happen (and uses a script) yet still makes many more

105
mistakes—adding additional and distracting stimuli into the simulation affected
everyone. This unexpected complication suggests that distractions are pervasive and will
affect the whole drilling team.
These shared errors prove that communication, attention, and distractions are part of a
shared experience. Communication, for example, is a two-way skill, and any
communication gaps lead to more overall mistakes made by the whole “system.” Our
research suggests that some of the additional errors might disappear when a structured
language protocol is in place.
Another concept that these shared errors support is that of distributed cognition (Chapter
3, Section C). It is plausible that attentional resources are heightened, lowered, and
ultimately shared between participant and researcher. When one subject is in flow with
narrowed attention, the other is likely also experiencing that narrowed focus. Conversely,
when one subject’s awareness is clouded with distraction, so is the other. This thesis
suggests that one of the resources within Crew Resource Management might actually be
cognitive.
ii) Preventative structure
One remarkable observation that does not appear explicitly in the results is the protective
nature of a verbal shadow. Like the swiss cheese model (see Chapter 3, Section A), the
verbal shadow step can be an additional layer of safety, helping to prevent errors before
they ever occur. When a drilling participant makes a transcription during the shadow, the
researcher can correct the mistake sooner. In this context, transcription is the act of
converting the researcher’s speech into a usable idea but then converting the concept
back into their own speech.
This preventative structure came into play for multiple participants during the VSDS. In
one example, the researcher requests “135 RPM,” but the participant shadows “130
RPM.” This incorrect verbal shadow allowed the researcher to immediately address the
issue rather than wait to see what number the participant would eventually fixate the
rotary speed. The participant is still able to move his hands to the rotary speed knob but

106
had the correct target in mind before ultimately reaching it. Correcting mistakes before
they are carried out is overall more efficient but also much safer.
iii) Primary language interference
The subjective feedback from non-English-primary speakers was hard to ignore, even
though their performances were not significantly different. Their reported friction and
frustrations in applying the verbal shadow is a crucial observation.
From a broader perspective, it seems that communication designers for the Universal
Drilling Language will need to work with native users from other languages to navigate
the nuances of each.
iv) Number usage and design
Overlapping with the previous discussion point, there is serious potential for the UDL to
improve how numbers are communicated in the drilling industry. Numbers are so
common in the drilling industry (due to its technical nature), so special consideration
needs to take place if a standardized language protocol is to be implemented. The
complication of numbers in the UDL is not new. Rather, this is a repeated discussion
point that was first discovered in the DRM experiment. The number complication is
repeated but also exacerbated in the VSDS because non-English-primary speakers have
to hear, transcribe, and verbally repeat numbers back to the researcher. These findings
suggest that there might be many unique differences in how specific languages read,
write, and process numbers.
Even within the English language, there are multiple ways to read/say the same number.
For example, the number 155 can be read as “one-hundred and fifty-five,” “one-fifty-
five,” or “one five five.” This issue becomes even more complex when looking at the
extremes: small numbers using decimal points or large numbers. Add a non-English-
speaker into this mix, and the results can vary wildly. Even minor misinterpretations of a
number could end up being disastrous in a high-risk and high-pressure world. A future
iteration of research for the UDL team should revolve specifically around number usage
and design.

107
v) Study limitations
A major limitation to this study is the total sample size of participants. Due to the
complex nature of drilling simulators, there is an unavoidable learning curve for most
participants. Each participant requires a unique and unspecified amount of time to learn
the drilling process, equipment, or simulator. A more experienced participant can
complete all learning and experimental stages in approximately 60-90 minutes. Less
experienced participants might require up to 120 minutes. Limited time availability and
poor access to eligible participants lead to a smaller sample size.
The objective measures from this study are significant but potentially inflated as a
smaller sample size might magnify the effect. With more participants, the additional trials
might squeeze more data towards the average. However, the general trends of the
objective findings are still very encouraging. Despite these objective limitations, the
subjective feedback and observations are revolutionary. Without testing living humans on
the simulator and in these communication conditions, some of the findings are not
possible.
This constraint of time also leads to a fundamental flaw in the experimental design. As
mentioned, the testing phases total only 15 minutes, but there is usually an additional 60+
minutes of non-testing. It is difficult to recruit participants for multiple days without
compensation incentives and expect to keep retention high, thus all three experimental
phases take place on the same day in a single session. Some performance improvements
are naturally expected from back-to-back-to-back sessions. The researchers acknowledge
that a participant’s increasing exposure and experience with the simulator might
influence performance measures.
In choice-reaction experiments (such as the DRM or VSDS), there is an unavoidable
influence from a previous phase on the current phase. This influence is known as a
sequential effect, and it is a recognized limitation of this experimental design. To
attenuate this effect, the order of the No-Shadow and With-Shadow phases are
randomized across participants. However, the Active-Control phase always comes first as
a performance baseline test.

108
An underlying flaw in this study’s design is the human factor of the researcher’s input. If
the researcher’s responsibilities could be automated, then some of the study’s variability
would be removed. In its current form, the VSDS requires that the researcher provide the
verbal commands, determine task completion status, observe and note errors, use the lap
timer, and facilitate feedback sessions.
vi) Results mirror the literature
One general aim of scientific pursuit is the ability to repeat effects in previous studies.
Because this study is applying psychology concepts into a new application, it was curious
which previous findings would be replicated here. Aspects of dichotic listening tests and
the cocktail party effect were both observed in the VSDS.
After all the experimental phases conclude, the researcher asks the participants a handful
of questions. One of these had to do with the conversation distractor (the drilling
podcast). Like in the classical dichotic listening tests, the participants using the verbal
shadowing technique were much less likely to recall specific details from the podcast
distractor. All participants admit to hearing the podcast and experiencing some degree of
distraction. Most participants admit to understanding the general gist/topic of the podcast
but might not be able to recall any of the specific details. This is the same observation E.
C. Cherry (1953) makes in his original study when the rejected stream of speech slips
past the subject's short-term memory. In the VSDS, more podcast specifics are blocked
out during the With-Shadow phase due to the participant actively engaging in the
shadowing technique.
Conversely, participants are more likely to experience the cocktail party effect when no
verbal shadowing is in place. Without using the verbal shadow technique, the research
observes much more “dead air” and the potential for participants to tune into the
conversational distractor. One participant recalls immediately being distracted when his
hometown (“Katy, Texas”) is mentioned on the podcast stimulus.

109
H. Conclusion
The principal goal of the study is to determine whether a verbal shadow is a helpful
technique for the drilling industry. If the intervention proves to negate the impacts of distracting
stimuli, then it should be considered for inclusion into the proposed Universal Drilling
Language. Furthermore, this study attempts to make a case for including cognitive tools and
techniques in building a “human-in-the-loop” framework for future drilling developments.
From a subjective standpoint, the results are mixed. Only some participants report
experiencing an improvement in their performance and communications, while others describe
more friction and workload for their brains. From an objective standpoint, the results are indeed
promising. The data shows a clear separation in performance because more drilling tasks are
completed with fewer errors when using a verbal shadow.
Overall, the results suggest that a cognitive technique like verbal shadowing might positively
impact drilling performance, but more research must confirm these findings. The sample size and
experimental design limitations, along with the novelty of these concepts, need further
consideration before UDL implementation.
i) Novelty of this study
While much research exists on human factors, crew resource management, and cognition,
no drilling research has yet to combine and test them for industry-specific applications.
Furthermore, no existing research has yet to offer such specific changes to how humans
or machines interact. However, the studies within this thesis are the first to combine these
concepts into practical drilling experiments. The DRM and VSDS objectively test, collect
data, and propose solutions for the growing disconnect between humans and drilling
machines.
This research borrows proven concepts from psychology and applies them to humans
using a simulated drilling environment. Borrowing best practices from other industries
can be useful as a shortcut, but creating industry-specific protocols is a long-term
solution. The Verbal Shadow Drilling Study is unique in that it tests drilling-specific

110
tasks with drilling-specific language. This work and its findings lay the groundwork for
the drilling industry’s future communication design.
i) Future directions
Due to the high cognitive demands of particular high-risk jobs, it remains essential to
keep human aspects, such as attention, in mind. Human-machine systems are already
commonplace in most industries but are also rapidly showing up in the drilling industry.
Incorporating human factors into system design is critical. The next generation of drilling
systems needs to be flexible enough to adjust their operation based on the attention
required or provided at any particular time. For example, many modern vehicles have a
form of “lane assist,” so if a driver loses attention and drifts in their lane, the vehicle can
autocorrect/nudge back to the center.
Future drilling systems that efficiently assign resources to automated processes will be
the safest and fastest options. Furthermore, these same systems will need to be smart
enough to reassign automatic functions back to humans for abnormal events, such as well
control or equipment failures. The proposed “human-in-the-loop” drilling system should
be capable of continuously monitoring the cognitive workload of its human driller
operator. As suggested by Parasuraman (1990), these attention/human monitoring
systems will unlock improvements for personal effectiveness, decrease attentive lapses
due to fatigue, decrease safety incidents due to human errors, and provide continuous
feedback to and from the current working environment.
These ideas are not new, though. In 1995, Gevins et al. suggested the need for adaptive
human-computer interfaces that continually assess the mental workload required for
complex working environments. Drilling operations are a perfect application of their
proposed EEG monitoring due to the high-risk and around-the-clock vigilance that is
necessary. Now, while emerging technologies such as continuous EEG monitoring, eye-
tracking, and eye reaction are not impossible to imagine in the drillshack, they need much
further exploration in the lab first.
111
A future iteration of the VSDS experiment should test a driller’s attention, arousal, and
communication skills with other sensory inputs. As in previous studies (Mandal and
Kang 2018; Salehi et al. 2018), continuous tracking of participants’ eye-gaze positions
with an eye-tracking device might prove helpful. This device collects eye movement data
with a 0.5 – 1.0 degree visual angle error accuracy for classifying gaze fixations. This
apparatus would enable researchers to triangulate a participant’s attention with their
communication and drilling skills.
An additional idea for this experimental series might also include a form of the
“troubleshoot” training exercise in which drilling issues are triggered by the researcher
and the participant is required to react. Objective measurements would be collected via
eye-tracking and heart rate and complement the available performance metrics. Lastly,
self-ratings from before, during, and after the experiment would be a comprehensive
collection of data. An investigation of this nature would build on the successes of
previous experiments.
While these potential drillshack technologies are enticing, more immediate (and human)
improvements can be made. Increasing attention, efficiency, safety, and more is
achievable by refining the existing drilling language and strengthening communication
skills. Implementing a standardized drilling language, requiring verbal shadows, and
improving communication training will help us drill deeper and safer into the future.
112
7. References
Adams, David. 2006. “A Layman’s Introduction to Human Factors in Aircraft Accident and
Incident Investigation.” ATSB Safety Information Paper, no. June.
American Psychology Association. 2013. “Glossary of Psychological Terms.” APA Dictionary
of Psychology. 2013. https://dictionary.apa.org/cognitive-psychology.
Bello, Opeyemi, Javier Holzmann, Tanveer Yaqoob, and Catalin Teodoriu. 2015. “Application
of Artificial Intelligence Methods in Drilling System Design and Operations: A Review of
the State of the Art.” Journal of Artificial Intelligence and Soft Computing Research 5 (2):
121–39.
Bello, Opeyemi, Roy Okech, Saket Srivastava, and Catalin Teodoriu. 2020. “Enabling a Digital
Transformation for Geothermal Drilling Performance and Operation Management.” In First
EAGE Workshop on Geothermal Energy and Hydro Power in Africa, 1–5.
https://doi.org/https://doi.org/10.3997/2214-4609.2020625009.
Boag, Paul. 2017. “What Is UX Design? UI and UX Designers Are Not the Same!” Boagworld.
2017. https://boagworld.com/usability/what-is-ux-design/.
Bohn, Roger, and James Short. 2012. “Measuring Consumer Information.” International Journal
of Communication 6 (1): 980–1000.
Bolstad, C A, and H M Cuevas. 2010. “Integrating Situation Awareness Assessment Into Test
and Evaluation.” ITEA Journal 31: 240–46. http://commons.erau.edu/publication.
Braga, Daniel Cardoso. 2019. “Field Drilling Data Cleaning and Preparation for Data Analytics
Applications Part of the Applied Statistics Commons, Artificial Intelligence and Robotics
Commons, Categorical Data Analysis Commons, Longitudinal Data Analysis and Time
Series Commons, and T.” LSU Master’s Theses 4952.
https://digitalcommons.lsu.edu/gradschool_theses.
Cannon-Bowers, Janis A., Eduardo Salas, and Sharolyn Converse. 1993. Shared Mental Models

113
in Expert Team Decision Making. Edited by Jr. Castellan, N. John. Individual. Hillside, NJ:
Lawrence Erlbaum Associates, Inc.
CogniFit. 2016. “What Is Attention?” 2016. https://www.cognifit.com/attention.
Cole, Patrick, Katherine Young, Clayton Doke, Neel Duncan, and Bill Eustes. 2017.
“Geothermal Drilling: A Baseline Study of Nonproductive Time Related to Lost
Circulation.” In 42nd Workshop on Geothermal Reservoir Engineering, 13–15. Stanford.
Cooper, George, Maurice White, and John Lauber. 1980. “Resource Management on the
Resource Flight Deck: Proceedings of a NASA/Industry Workshop.” In NASA CP-2120.
San Francisco, CA.
DeLoach, Alana, Jeff Carter, and Jonas Braasch. 2015. “Tuning the Cognitive Environment:
Sound Masking with ‘Natural’ Sounds in Open-Plan Offices.” Journal of the Acoustical
Society of America 137: 2291. https://doi.org/10.1121/1.4920363.
Department of Defense. 2011. “Modeling and Simulation ( M & S ) Glossary.”
Durso, Francis T., and Scott D. Gronlund. 1999. “Chapter 10: Situation Awareness.” Handbook
of Applied Cognition, no. January 1999: 283–314.
E. C. Cherry. 1953. “Some Experiments on the Recognition of Speech, with One and Two Ears.”
Journal of Acoustical Society of America 25: 554–59.
Endsley, Mica. 1995. “Toward a Theory of Situation Awareness in Dynamic Systems.” Human
Factors: The Journal of Situation Awareness in Dynamic Systems 37 (1).
https://doi.org/10.1518/001872095779049543.
Ershaghi, Iraj, and Donald L. Paul. 2020. “Engineering the Future of Petroleum Engineering and
Geoscience Graduates.” In SPE Annual Technical Conference and Exhibition.
https://doi.org/10.2118/201423-ms.
Flin, Rhona, Paul O’Connor, and Margaret Crichton. 2008. Safety at the Sharp End: A Guide to

114
Non-Technical Skills. Taylor & Francis Group. Boca Raton, FL: CRC Press.
https://doi.org/10.7748/ns.31.28.64.s47.
Flin, Rhona, Paul O’Connor, Kathryn Mearns, and Rachel Gordon. 1998. “Crew Resource
Management for Offshore Teams: Lessons from Aviation.” Society of Petroleum Engineers
- SPE International Conference on Health, Safety, and Environment in Oil and Gas
Exploration and Production 1998, HSE 1998. https://doi.org/10.2523/46766-ms.
Flin, Rhona, and Jill Wilkinson. 2013. “Non-Technical Skills and Crew Resource Management.”
Society of Petroleum Engineers - SPE European HSE Conference and Exhibition 2013:
Health, Safety, Environment and Social Responsibility in the Oil and Gas Exploration and
Production Industry, no. April: 259–66. https://doi.org/10.2118/164974-ms.
Gevins, Alan, Harrison Leong, Robert Du, Michael E Smith, Jian Le, Don Durousseau, Jenny
Zhang, and Joel Libove. 1995. “Towards Measurement of Brain Function in Operational
Environments.” Biological Psychology 40: 169–86. https://doi.org/10.1016/0301-
0511(95)05105-8.
Han, Longzhu, Yunzhe Liu, Dandan Zhang, Yi Jin, and Yuejia Luo. 2013. “Low-Arousal Speech
Noise Improves Performance in N-Back Task: An ERP Study.” PLoS ONE 8 (10): 1–7.
https://doi.org/10.1371/journal.pone.0076261.
Hawkins, F.H. 1987. Human Factors in Flight. Vermont: Gower Publishing Company.
Human Factors and Ergonomics Society. n.d. “What Is Human Factors and Ergonomics?”
https://www.hfes.org/About-HFES/What-is-Human-Factors-and-Ergonomics.
IHS Markit. 2019. “Conventional Discoveries Have Fallen to Lowest Levels in 70 Years; Major
Rebound Unlikely.” 2019. https://news.ihsmarkit.com/prviewer/release_only/slug/energy-
conventional-discoveries-have-fallen-lowest-levels-70-years-major-rebound-unlik.
IOGP. 2014. “Guidelines for Implementing Well Operations Crew Resource Management
Training.” Report No. 502. London.

115
Ivanhoe, L.F., and G.G. Leckie. 1993. “Global Oil, Gas Fields, Sizes Tallies, Analyzed.” Oil and
Gas Journal, 87–91.
James, William. 1890. The Principles of Psychology. Volume 2. New York, NY: Dover.
Kiran, Raj, Seyed Ali Naqavi, Saeed Salehi, and Catalin Teodoriu. 2019. “Human Factors and
Non-Technical Skills: Towards an Immersive Simulation-Based Training Framework for
Offshore Drilling Operations.” Proceedings - SPE Annual Technical Conference and
Exhibition 2019-Septe. https://doi.org/10.2118/195838-ms.
Klimoski, R., and S. Mohammed. 1994. “Team Mental Model: Construct or Metaphor?” Journal
of Management 20: 403–37.
Mainside Limited. 2018. “Process/Technical Safety.” 2018.
https://www.mainsidelimited.com/process-technical-safety/.
Mandal, Saptarshi, and Ziho Kang. 2018. “Using Eye Movement Data Visualization to Enhance
Training of Air Traffic Controllers: A Dynamic Network Approach.” Journal of Eye
Movement Research 11 (4). https://doi.org/10.16910/jemr.11.4.1.
Mathieu, John E., Gerald F. Goodwin, Tonia S. Heffner, Eduardo Salas, and Janis A. Cannon-
Bowers. 2000. “The Influence of Shared Mental Models on Team Process and
Performance.” Journal of Applied Psychology 85 (2): 273–83. https://doi.org/10.1037/0021-
9010.85.2.273.
Mohammadpoor, Mehdi, and Farshid Torabi. 2020. “Big Data Analytics in Oil and Gas Industry:
An Emerging Trend.” Petroleum 6 (4): 321–28.
https://doi.org/10.1016/j.petlm.2018.11.001.
National Research Council. 1994. Drilling and Excavation Technologies for the Future.
Washington, D.C.: National Academic Press.
Navon, David, and Daniel Gopher. 1979. “On the Economy of the Human-Processing System.”
Psychological Review 86 (3): 214–55.

116
https://doi.org/https://content.apa.org/doi/10.1037/0033-295X.86.3.214.
Noshi, Christine, and Jerome Schubert. 2018. “The Role of Machine Learning in Drilling
Operations: A Review.” In SPE/AAPG Eastern Regional Meeting. Pittsburgh.
https://doi.org/https://doi.org/10.2118/191823-18ERM-MS.
O’Connor, P., and R.H. Flin. 2000. “Crew Resource Management for Offshore Teams:
Development and Evaluation.” In SPE International Conference on Health, Safety, and the
Environment in Oil and Gas Exploration and Production. Stavenger, Norway.
https://doi.org/10.2118/61244-ms.
Oberauer, Klaus. 2019. “Working Memory and Attention – A Conceptual Analysis and Review.”
Journal of Cognition 2 (1): 1–23. https://doi.org/https://doi.org/10.5334/joc.58.
Olukoga, T.A., and Y. Feng. 2021. “Practical Machine-Learning Applications in Well-Drilling
Operations.” SPE Drilling and Completion. https://doi.org/https://doi.org/10.2118/205480-
PA.
Padilla, Jose J., Saikou Y. Diallo, and Robert K. Armstrong. 2018. “Toward Live Virtual
Constructive Simulations in Healthcare Learning.” Simulation in Healthcare : Journal of
the Society for Simulation in Healthcare 13 (3S Suppl 1): S35–40.
https://doi.org/10.1097/SIH.0000000000000317.
Parasuraman, Raja. 1990. Event-Related Brain Potentials and Human Factors Research. Edited
by John Rohrbaugh, Raja Parasuraman, and Ray Johnson Jr. Event-Rela. New York, NY:
Ocford University Press.
Razzouk, Rim, and Tristan Johnson. 2012. “Shared Cognition.” In Encyclopedia of the Sciences
of Learning, Seel N.M. Springer, Boston, MA. https://doi.org/https://doi.org/10.1007/978-1-
4419-1428-6.
Reason, James. 1990. Human Error. UK: Cambridge University Press.
Reisberg, Daniel. 2016. Cognition: Exploring the Science of the Mind. Edited by Ken Barton.

117
Sixth. W.W. Norton & Company.
Ruffell Smith, H P. 1979. “A Simulator Study of the Interaction of Pilot Workload With Errors,
Vigilance, and Decisions.” In NASA TM-78482. Ames Research Center.
Saffer, Dan. 2010. “What Is Interaction Design.” Designing for Interaction. 2010.
https://www.interaction-design.org/literature/topics/interaction-design.
Saleh, Fatemeh K, Catalin Teodoriu, Chinedum P Ezeakacha, and Saeed Salehi. 2020.
“Geothermal Drilling: A Review of Drilling Challenges with Mud Design and Lost
Circulation Problem.” In Stanford Workshop on Geothermal Reservoir Engineering, 1–8.
Salehi, Saeed, Raj Kiran, Jiwon Jeon, Ziho Kang, Catalin Teodoriu, and Edward Cokely. 2018.
“Enhancing Situation Awareness and Process Safety in Offshore Drilling Operations:
Applications of Eye-Tracking System.” In Offshore Technology Conference, 5:3719–36.
Houston, TX. https://doi.org/10.4043/28849-ms.
Schneider, Vivian I., Alice F. Healy, and Immanuel Barshi. 2004. “Effects of Instruction
Modality and Readback on Accuracy in Following Navigation Commands.” Journal of
Experimental Psychology: Applied 10 (4): 245–57. https://doi.org/10.1037/1076-
898X.10.4.245.
Schwieger, Dana, and Christine Ladwig. 2018. “Reaching and Retaining the Next Generation:
Adapting to the Expectations of Gen Z in the Classroom.” Information Systems Education
Journal 16 (3): 45–54.
Simon, Herbert A. 1971. “Designing Organizations for an Information-Rich World.” In
Computers, Communications, and the Public Interest, edited by M. Greenberger, 37–72.
John Hopkins University Press.
Srivastava, Saket, and Catalin Teodoriu. 2020. “Characterizing Drilling Vibrations by
Interlinking Surface Data , Drillstring Design and Lithology of Rock in Utah FORGE Deep
Test Well 58-32.” In Geothermal Reservoir Engineering, 1–7. Stanford.

118
Teodoriu, Catalin, and Saeed Salehi. 2019. “How Heuristics and Biases Impact Judgment and
Decision Making in Well Integrity Operations.” In International Conference on Offshore
Mechanics and Arctic Engineering. https://doi.org/https://doi.org/10.1115/OMAE2019-
96820.
Treisman, Anne. 1964. “Verbal Cues, Language, and Meaning in Selective Attention.” American
Journal of Psychology, no. 77: 206–19.
Tveiten, Camilla K, and Per Morten Schiefloe. 2014. “Risk Images in a Changing High-Risk
Industry.” Risk Management 16 (1): 44–61. https://doi.org/10.1057/rm.2014.3.
U.S. Energy Information Administration. 2020. “U.S. Crude Oil and Natural Gas Production in
2019 Hit Records with Fewer Rigs and Wells.” Today in Energy. 2020.
https://www.eia.gov/todayinenergy/detail.php?id=44236.
———. 2021a. “Renewable Energy Explained.” 2021.
https://www.eia.gov/energyexplained/renewable-sources/.
———. 2021b. “U.S. Energy Consumption by Source, 2020.” Monthly Energy Review. 2021.
https://www.eia.gov/energyexplained/what-is-energy/sources-of-energy.php.
Udofia, Emmanuel, Stanley Buduka, Julius Akpabio, Saviour Egwu, Edwin Udofia, and Daniel
Olagunju. 2020. “Digital Transformation: After the Big Data, What Next?” SPE Nigeria
Annual International Conference and Exhibition 2020, NAIC 2020.
https://doi.org/10.2118/203614-ms.
US Chemical Safety Hazard and Investigation Board. 2016. “Investigation Report - Drilling Rig
Explosion and Fire at the Macondo Well” 3: 247.
WorkSafeBC. 2018. “How Loud Is It? - Oil and Gas.”
https://www.worksafebc.com/en/resources/health-safety/hazard-alerts/how-loud-is-it-oil-
gas-ws-2018-10?lang=en.
Drilling Systems. (2005). Drilling & Well Control Simulator Operator's Manual.

119
Drilling Systems. (2020, February). DrillSIM Downhole Model. Retrieved from Drilling
Systems: https://www.drillingsystems.com/drillsim-downhole-model/
Drilling Systems. (2020, February). DrillSIM:50. Retrieved from Drilling Systems:
https://www.drillingsystems.com/product/drillsim50/
Leiro, R. (2016, April 19). AIRBUS INSTALLS A350 XWB FULL-FLIGHT SIMULATOR IN
MIAMI. Retrieved from Airways Magazine: https://airwaysmag.com/industry/airbus-
installs-a350-xwb-full-flight-simulator-miami/
Millheim, K. (1982). The Role of the Simulator in Drilling Operations. SPE paper 11170. New
Orleans, LA.
Padilla, J., Diallo, S., & Armstrong, R. (2018). Toward Live Virtual Constructive Simulations in
Healthcare Learning. The Journal of the Society for Simulation in Healthcare.
United States Department of Defense. (2011). Modeling and Simulation (M&S) Glossary.
Alexandria: Modeling and Simulation Coordination Office. doi:DoD Directive 5000.59
Schlumberger (2020). Driller. In Schlumberger’s Oilfield Glossary. Retrieved March 21, 2020,
from https://www.glossary.oilfield.slb.com/en/Terms/d/driller.aspx
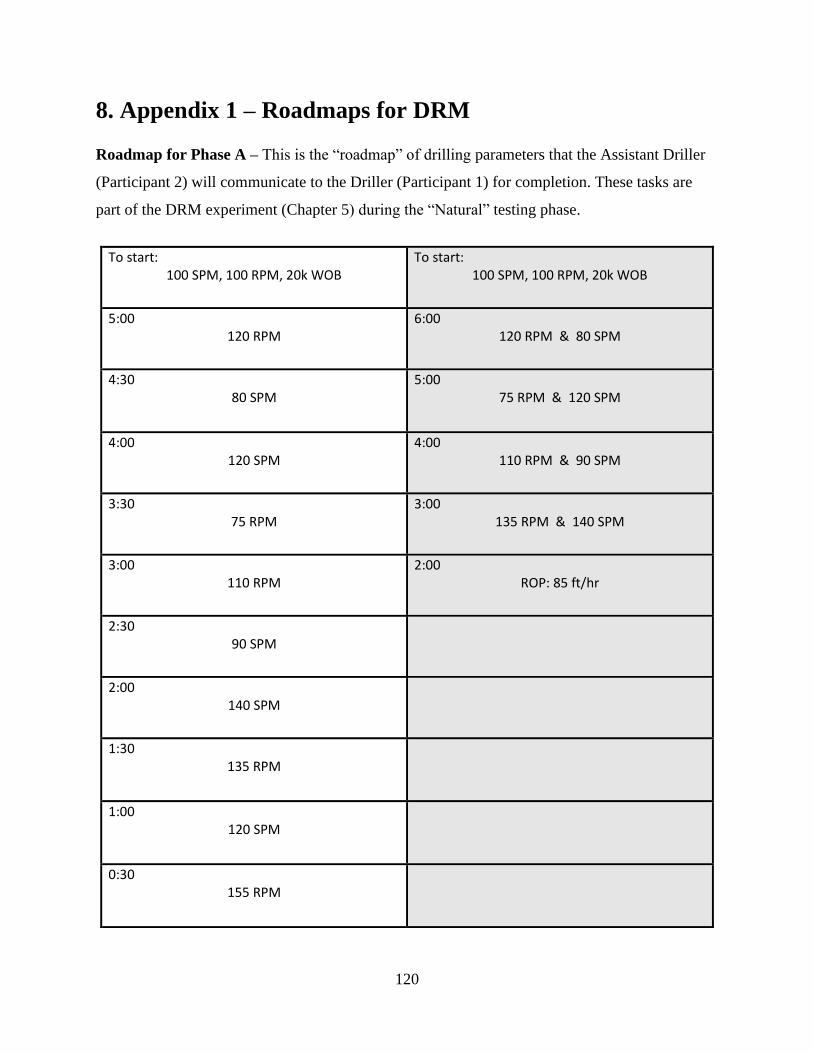
120
8. Appendix 1 – Roadmaps for DRM
Roadmap for Phase A – This is the “roadmap” of drilling parameters that the Assistant Driller
(Participant 2) will communicate to the Driller (Participant 1) for completion. These tasks are
part of the DRM experiment (Chapter 5) during the “Natural” testing phase.
To start: 100 SPM, 100 RPM, 20k WOB
To start: 100 SPM, 100 RPM, 20k WOB
5:00 120 RPM
6:00 120 RPM & 80 SPM
4:30 80 SPM
5:00 75 RPM & 120 SPM
4:00 120 SPM
4:00 110 RPM & 90 SPM
3:30 75 RPM
3:00 135 RPM & 140 SPM
3:00 110 RPM
2:00 ROP: 85 ft/hr
2:30 90 SPM
2:00 140 SPM
1:30 135 RPM
1:00 120 SPM
0:30 155 RPM

121
Roadmap for Phase B – This is the prescribed phrase “roadmap” that the Assistant Driller
(Participant 2) must communicate to the Driller (Participant 1) for completion. These tasks are
part of the DRM experiment (Chapter 5) during the “Imperfect” testing phase.
To start: [normal pace, normal volume] “ 100 , 100 , 20
OB”
To start: [normal pace, normal volume] “ 100 , 100 , 20
OB”
5:00 [normal]
“I 120 ”
6:00 [normal] “ 80”
“ , I 120 ”
4:30 [whisper volume ONLY]
“ 80 ”
5:00 [normal] “ by 45 ”
“ , by 40 ”
4:00 [normal, you can only repeat yourself ONCE]
“ , f ”
4:00 [normal] “I 100… 110 ”
“ , 80 90 ”
3:30 [normal]
“ by 45 ”
3:00 [whisper volume ONLY] “I 135 ”
[wait until achieved, then whisper] “ , 140 ”
3:00 [slower pace, normal volume] “ ,
changing pump strokes, change the rotation to f 110”
2:00 [normal]
“ f 90 f / ”
2:30 [normal] “I .
f ?” [respond however you want, must be irrelevant]
2:00 [wait 10 seconds f … …, then in a
normal pace, normal volume] “ …U … 140 ”
1:30 [normal] “I 130… 140.
”
1:00 [use non- ONLY…
get driller to pump at 120 SPM]
0:30 [do not say anything at all]

122
Anticipated Questions for AD before Phase B – This set of questions and answers are prepared
and presented to the Assistant Driller (Participant 2) before the “Imperfect” testing phase
commences. The AD is free to ask the researcher more questions, if they have any.
What does “normal pace” and “normal volume” mean?
• Normal pace means at your natural speaking speed. Not rushed, not unnaturally slow.
• Slower pace should sound unnaturally slow.
• Normal volume means at your natural speaking volume. Loud enough to be heard,
without being obviously loud.
What if they ask me to repeat myself?
• Yes, you may repeat your script, but ONLY the words from your “script”.
• Yes, but you must say it in the same [manner]. If it says [whisper volume], you must
whisper it the same way every time you repeat.
• EXCEPT for the prompt that says [normal volume, you can only repeat yourself ONCE]
What is non-verbal communication?
• “The act of giving or exchanging information without using any spoken words”
• Examples: hand gestures, body language, postural, appearance, facial expressions, sign
language, touch, eye contact, maps, silence, writing, etc.
For the requests involving math (beginner @ 3:30, intermediate @ 5:00), what if the driller does
not remember the previous parameter?
• You can respond with the previous setting, but only if they ask.

123
Roadmap for Phase C – This is the prescribed phrase “roadmap” that the Assistant Driller
(Participant 2) must communicate to the Driller (Participant 1) for completion. These tasks are
part of the DRM experiment (Chapter 5) during the “Perfect” testing phase.
To start: 100 SPM, 100 RPM, 20k WOB
To start: 100 SPM, 100 RPM, 20k WOB
5:00 “I 120”
6:00 “I 120” “ 80”
4:30 “ 80”
5:00 “ 75” “I 120”
4:00 “I 120”
4:00 “I 110” “ 90”
3:30 “ 75”
3:00 “I 135” “I 140”
3:00 “I 110”
2:00 “I 35 85
f / ”
2:30 “ 90”
2:00 “I 140”
1:30 “I 135”
1:00 “ 120”
0:30 “I 155”
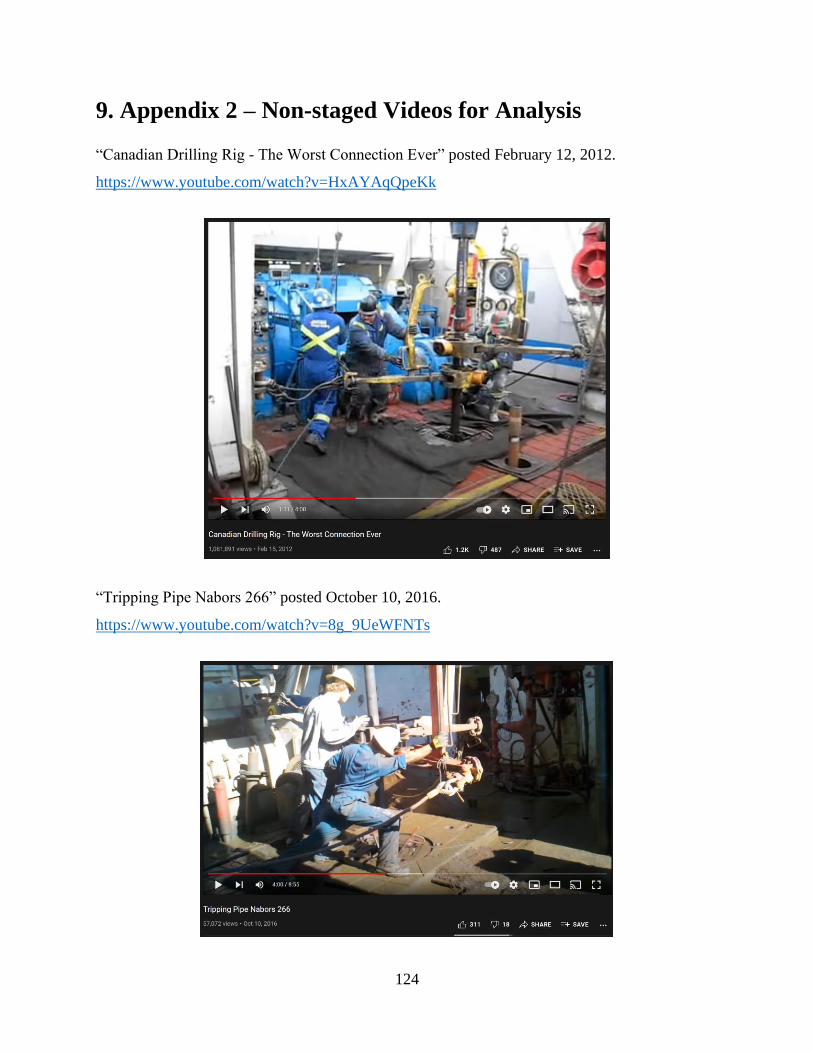
124
9. Appendix 2 – Non-staged Videos for Analysis
“Canadian Drilling Rig - The Worst Connection Ever” posted February 12, 2012.
https://www.youtube.com/watch?v=HxAYAqQpeKk
“Tripping Pipe Nabors 266” posted October 10, 2016.
https://www.youtube.com/watch?v=8g_9UeWFNTs

125
“The World’s Fastest Roughnecks” posted July 12, 2008.
https://www.youtube.com/watch?v=aqLALzUft8Y
“Roughnecks at Work in HD – Drilling Rig Pipe Connection” posted July 29, 2014.
https://www.youtube.com/watch?v=KZxUiFFVEAQ

126
10. Appendix 3 – Command Roadmaps for VSDS
A. Drilling Commands after Scenario Reset
The verbal drilling commands below are used throughout the experiment any time the
drilling scenario is reset. Any variance in tone or volume researcher never verbalizes a new
command until the previous task is completed. A lap timer is used to measure is adjusted for
during the warmup exercises. Experimental procedures do not commence until the researcher is
confident that the participant consistently comprehends the researcher’s warmup commands and
drilling with 100 SPM, 100 RPM, and 20k WOB is maintained.
TASK # TASK COMMAND
A1 “Using Pump 1, increase pump strokes to 50 SPM.”
A2 “Using Pump 2, increase pump strokes to 100 SPM.”
A3 “Increase rotation to 100 RPM.”
A4 “Lower the drill string to a bit depth of 5605 ft.”
A5 “Apply 20k weight on bit and drill ahead.”
A6 “Drilling parameter changes will begin in 10 seconds.”

127
B. Drilling Commands for Testing, Set 1
These are the verbal commands given by the researcher to the participant. Set 1 and Set 2 are
alternated to reduce short-term memory advantages. The researcher a) must not commence until
the participant is drilling ahead using 100 SPM, 100 RPM, and 20k WOB, b) can repeat a
command if the participant is noticeably off track, and c) can never verbalize a new command
until the previous task reaches completion.
TASK # COMMAND PHRASE
B1 “Increase rotation to 120 RPM.”
B2 “Using Pump 1, decrease pump strokes to 80 SPM.”
B3 “Using Pump 1, increase pump strokes to 120 SPM.”
B4 “Increase weight on bit to 30k.”
B5 “Decrease rotation to 110 RPM.”
B6 “Decrease rotation to 75 RPM.”
B7 “Using Pump 1, decrease pump strokes to 90 SPM.”
B8 “Raise the drill string to a bit depth of 5583 ft.”
B9 “Decrease rotation to zero. Stop rotating.”
B10 “Decrease all pump strokes to zero. Stop pumping.”
B11 “Set the slips.”
B12 “Lower the drill string down onto the slips.”
B13 “Raise the drill string up out of the slips.”
B14 “Remove the slips.”
B15 “Using Pump 2, increase pump strokes to 70 SPM.”
B16 “Increase rotation to 135 RPM.”
B17 “Lower the drill string to a depth of 5589 ft.”
B18 “Using Pump 2, increase pump strokes to 90 SPM.”
B19 “Increase rotation to 165 RPM.”
B20 “Lower the drill string to a depth of 5600 ft.”
B21 “Decrease rotation to 100 RPM.”
B22 “Lower the drill string to a depth of 5607 ft.”
B23 “Apply 25k weight on bit and drill ahead.”
B24 “Increase rotation to 140 RPM.”
B25 “Using Pump 2, decrease pump strokes to 75 SPM.”

128
C. Drilling Commands for Testing, Set 2
These are the second set of verbal commands given by the researcher to the participant. Set 1
and Set 2 are alternated to reduce short-term memory advantages. The researcher a) must not
commence until the participant is drilling ahead using 100 SPM, 100 RPM, and 20k WOB, b)
can repeat a command if the participant is noticeably off track, and c) can never verbalize a new
command until the previous task reaches completion.
TASK # COMMAND PHRASE
C1 “Increase rotation to 150 RPM.”
C2 “Using Pump 2, increase pump strokes to 125 SPM.”
C3 “Increase weight on bit to 27k.”
C4 “Decrease rotation to 120 RPM.”
C5 “Using Pump 2, decrease pump strokes to 80 SPM.”
C6 “Decrease rotation to 80 RPM.”
C7 “Using Pump 2, increase pump strokes to 110 SPM.”
C8 “Raise the drill string to a bit depth of 5578 ft.”
C9 “Decrease rotation to zero. Stop rotating.”
C10 “Decrease all pump strokes to zero. Stop pumping.”
C11 “Set the slips.”
C12 “Lower the drill string down onto the slips.”
C13 “Raise the drill string up out of the slips.”
C14 “Remove the slips.”
C15 “Using Pump 1, increase pump strokes to 65 SPM.”
C16 “Increase rotation to 125 RPM.”
C17 “Lower the drill string to a bit depth of 5584 ft.”
C18 “Using Pump 1, increase pump strokes to 90 SPM.”
C19 “Increase rotation to 160 RPM.”
C20 “Lower the drill string to a bit depth of 5999 ft.”
C21 “Decrease rotation to 120 RPM.”
C22 “Lower the drill string to a bit depth of 5607 ft.”
C23 “Apply 25k weight on bit and drill ahead.”
C24 “Increase rotation to 140 RPM.”
C25 “Using Pump 1, decrease pump strokes to 75 SPM.”

129
D. Practice Commands for Learning Shadowing
Before proceeding to the With-Shadow Testing Phase, the researcher must spend some time
teaching and training the participant on incorporating a verbal shadow into their simulated
drilling operations. Examples D1-D3 show the traditional verbal shadow technique taken from
the literature, which is a verbatim reproduction. This technique is not our intended application
but helps for learning.
EXAMPLE REQUESTED TASK COMMAND TRADITIONAL VERBAL
SHADOW D1 “Increase rotation to 150 RPM.” “Increase rotation to 150 RPM.”
D2 “Using Pump 2, increase pump strokes
to 125 SPM.”
“Using Pump 2, increase pump strokes
to 125 SPM.”
D3 “Increase weight on bit to 27k.” “Increase weight on bit to 27k.”
Examples D4-D8 show some examples of how verbal shadowing is intended to be applied for
this experiment and in the Universal Drilling Language. The participant is expected to glean and
repeat the most important parameters from the verbal command. It should be a shortened version
of the original request. The verbal shadow would likely include the requested number and either
the name of the equipment, parameter, or unit. Participants are asked not to aim for perfect
shadows but instead encouraged to repeat the most relevant information they need.
EXAMPLE REQUESTED TASK COMMAND EXPERIMENTAL VERBAL
SHADOW D4 “Decrease rotation to 120 RPM.” “Rotation to 150.”
D5 “Using Pump 2, decrease pump
strokes to 80 SPM.”
“Pump 2, strokes to 125.”
D6 “Decrease all pump strokes to zero.
Stop pumping.”
“All pump strokes to zero.”
D7 “Lower the drill string to a depth of
5584 ft.”
“Bit depth to 5584.”
D8 “Remove the slips.” “Removing slips.”
A few more practice exchanges between researcher and participant are completed (using
commands from Appendix 3, Part C) until the participant is comfortable with verbal shadowing.

130
11. Appendix 4 – Audio/Video Distractors for VSDS
“3 HOURS of GENTLE NIGHT RAIN, Rain Sounds to Sleep, Study, Relax, Reduce Stress, help
insomnia” posted November 25, 2014. https://youtu.be/q76bMs-NwRk
“West Aquila Drillship Multi Machine Control Automatic Stand Building (360 View)” posted
August 1, 2017. https://youtu.be/BqCi_KpJS5w
“The Drilldown [Ep208] - Frac Activity” posted August 22, 2021. https://youtu.be/gbRmmBarh-
I

131
12. Appendix 5 – Driller’s Roadmap Data
Group 1
Group 2
Group 3
Time (sec) Time (sec) Time (sec)
No Script
Imperfect Script
Perfect
Script
No Scrip
t Imperfect Script
Perfect
Script
No Script
Imperfect Script
Perfect
Script
1 14 16 12 1 30 16 12 1 25 17 10
2 16 24 8 2 16 24 14 2 23 20 12
3 15 30 13 3 19 30 16 3 21 30 13
4 25 28 8 4 16 19 15 4 24 30 10
5 14 27 11 5 14 27 11 5 23 29 13
6 10 30 9 6 22 30 23 6 21 30 12
7 13 25 11 7 20 21 14 7 30 30 17
8 18 18 14 8 15 19 11 8 28 22 11
9 10 21 10 9 13 30 13 9 20 25 10
10 27 30 7 10 15 30 12 10 25 30 14
AVG 16.2 25.9 10.3 AVG 18.0 25.6 14.1 AVG 24 27.3 12.2
1 22 25 24 1 16 22 21 1 21 23 18 2 30 30 22 2 20 34 30 2 30 33 19
3 19 52 21 3 16 60 25 3 35 60 22
4 29 32 26 4 21 38 29 4 25 58 23
AVG 25 38 23.3 AVG 18.3 44.0 26.3 AVG 27.8 50.3 20.5
1 105 120 60 1 48 120 39 1 75 105 50
Task Completion %
100% 67% 100%
90% 56%
100% 90% 44% 100%
100% 67% 100%
100% 67%
100% 100% 33% 100%
0% 0% 100%
100% 0%
100% 100% 0% 100%
A shaded square means the group did not accomplish the task in the
required time interval ( B=30, I=45, A=90). Therefore max time is applied. Red is used to differentiate because this test was designed as a baseline. It
always ends up being the fastest time. Not used for average.
Group 4
Group 5
Group 6
Time (sec) Time (sec) Time (sec)
No Script
Imperfect Script
Perfect
Script
No Script
Imperfect
Script
Perfect
Script
No Script
Imperfect
Script
Perfect
Script

132
1 12 12 11 1 13 13 11 1 9 12 10
2 15 22 20 2 13 30 16 2 15 27 11
3 13 30 14 3 20 30 16 3 17 30 12
4 12 30 7 4 15 16 13 4 18 21 20
5 17 29 12 5 16 27 15 5 13 29 9
6 15 30 18 6 14 30 14 6 22 30 15
7 20 21 15 7 17 23 17 7 21 27 11
8 18 22 12 8 16 30 12 8 16 17 10
9 9 28 11 9 16 21 10 9 13 28 11
10 14 30 10 10 14 30 14 10 16 30 10
AVG 14.5 26.9 13.0 AVG 15.4 26.3 13.8 AVG 16.0 26.6 11.9
1 26 26 22 1 26 24 24 1 18 21 18
2 25 36 22 2 26 60 23 2 27 31 21
3 30 60 25 3 26 60 26 3 27 60 21
4 43 43 23 4 29 50 29 4 29 22 25
AVG 31 46.3 23 AVG 26.8 56.7 25.5 AVG 25.3 37.7 21.3
1 65 120 40 1 69 120 35 1 80 119 47
Task Completion %
100% 56% 100%
100% 44%
100% 100% 67% 100%
100% 67% 100%
100% 0%
100% 100% 67% 100%
100% 0% 100%
100% 0%
100% 100% 0% 100%
Advanced
Time (sec) Total
Imperfect Natural
Perfect
Imperfect Natural
Perfect
AVG 117.3 73.7 45.2
Beginner (< 30 sec) 56% 97% 100%
A1 120 105 60
Intermediate (< 45
sec) 50% 100% 100%
A2 120 48 39
Advanced (< 90 sec) 2% 83% 100%
A3 105 75 50
A4 120 65 40
A5 120 69 35
A6 119 80 47

133
13. Appendix 6 – Verbal Shadow Drilling Study Data
Active-Control Total Elapsed Time (secs)
Participant
Number 1 2 3 4 5 6 7 Avg
0 0 0 0 0 0 0 0 0.0
Task
Nu
mb
er
1 11.9 15.4 7.9 14.8 13.3 13.7 11.2 12.6 2 29 29.4 21.7 34.3 29.3 30.1 26.8 28.7 3 48.7 41.8 40.9 64.6 50.7 44.2 40.3 47.3 4 59.6 52.1 53.8 83.5 58.6 55.3 55.4 59.8 5 69.1 68.9 65 97.2 71.4 63.2 68.8 71.9 6 88.2 81.8 77.9 116.6 88.5 72.1 80.2 86.5 7 104.2 94.2 89.3 140.5 107.2 90.3 98.8 103.5 8 130.7 114.3 141.8 167.1 131.2 116.5 129.4 133.0 9 141.6 119.8 150.4 178.3 138.1 122.2 140.6 141.6
10 154.2 128.3 159.1 189.1 146.9 132.2 150.1 151.4 11 158.9 134.5 164.4 197 158.8 136.6 154.3 157.8 12 168 140.1 172.9 205.6 167 146 164.4 166.3 13 176.3 146.1 180.1 215.4 186.5 152.6 170.2 175.3 14 181.5 149.8 190.2 220.3 191.8 157.8 175.7 181.0 15 198.9 161.4 210.3 238.4 209.1 179.6 190.1 198.3 16 215.2 173.7 228.8 260.7 226.3 202.5 208.1 216.5 17 248.8 188.2 252.8 284.3 245.9 235.2 226.1 240.2 18 258.8 198.6 266.6 297.6 259.6 246.9 237.5 252.2 19 269.3 210 281.2 314.1 272.7 260.9 250.5 265.5 20 291.9 242.4 296 330.6 289.1 288.1 275 287.6 21 252.4 290.3 287.8 22 272.1 23 288.6 24 297.5 25
4 How many
errors? 0 0 1 1 1 0 1
20.4 Tasks
completed 20 24 19 18 20 21 21
1 Major Faults
0 0 1 0 0 0 0

134
No-Shadow
Total Elapsed Time (secs)
Participant Number 1 2 3 4 5 6 7 Avg
0 0 0 0 0 0 0 0 0.0
Task
Nu
mb
er
1 16.9 10.7 12.8 16.2 12 15.2 9.7 13.4
2 30.4 26.9 28.4 36.1 22.4 33.8 22.8 28.7
3 40.8 43.4 43.8 45.7 32.2 45.8 37.6 41.3
4 54.5 63.9 61.4 61.8 44.7 55.9 50.3 56.1
5 69.4 74.7 69 75.3 103.3 75.7 60.9 75.5
6 85.5 89.3 83.3 91 113.3 87.6 73.8 89.1
7 101.3 106.5 98 102.1 130.6 103.7 89.7 104.6
8 127.3 147.2 118.4 126.1 155.5 137.1 121.1 133.2
9 135.3 155.3 123.7 133.8 160.2 143.4 126.6 139.8
10 147.1 164.3 132.7 144.7 168.8 154.4 134.9 149.6
11 151.5 172.8 136.8 152.9 177 159.3 149.6 157.1
12 158.4 179.7 172.2 160.7 183.4 166.2 156.9 168.2
13 166.7 186.7 177.7 172.3 190.1 173.1 161.9 175.5
14 170.7 192 181.6 188.9 195.4 178.4 183.5 184.4
15 188.7 207.4 200.3 206.9 211.3 196.2 211.5 203.2
16 202.1 224.1 211.6 229.3 227.9 212.6 239.8 221.1
17 237.9 240.4 234.7 246.4 253.1 228.4 249.6 241.5
18 250.9 252.8 243.8 257.3 264.5 245.4 263.7 254.1
19 262.6 263.4 258 292.8 279.7 256.2 290.5 271.9
20 295.9 281.1 277.9 308.2 294.42 291 305.8 293.5
21 291.7 299.3 22 23 24 25
12 How many
errors? 3 2 1 1 4 0 1
19.9 Tasks completed
20 21 21 19 19 20 19
139 Major Faults
0 1 1 0 1 0 0

135
With-Shadow
Total Elapsed Time (secs)
Participant Number 1 2 3 4 5 6 7 avg
0 0 0 0 0 0 0 0 0.0
Task
Nu
mb
er
1 8.9 10.5 10.6 11.8 9.8 7.2 12.5 10.2
2 25.8 25.4 22.4 26.9 29.3 18.8 26.7 25.0
3 38.9 39.4 29.9 40.9 48.9 38.7 37.8 39.2
4 47.8 49.3 39.8 54.3 72 54.6 48.1 52.3
5 55.9 58.3 57 64.4 84.5 63.1 64.6 64.0
6 65.7 73.1 71.7 77.3 100.3 73.1 74.2 76.5
7 79.5 86.1 85.7 94 119.5 84.1 84.8 90.5
8 101.6 95.3 110.6 117.3 141.4 102.5 108.7 111.1
9 107.9 119.6 116.1 126.6 149.3 108.2 114.3 120.3
10 118.6 125.6 123.6 130.5 159.4 117.5 125 128.6
11 122.8 134.4 128 138.1 174.7 122.5 130.1 135.8
12 129.6 140.5 136.2 147.3 182.1 130.9 140.2 143.8
13 136 147.9 143.3 153.4 191.4 137.8 146.6 150.9
14 140.5 154.8 148.8 162.3 196.6 142.5 151.3 156.7
15 157 172.1 170.3 170.5 213.1 158.4 165.2 172.4
16 172.9 186.2 188.5 188 232.2 172.8 181.8 188.9
17 192.6 207.8 212 205.4 258.8 206.1 230.4 216.2
18 204.3 218.4 221.8 223.9 272.2 215.6 243 228.5
19 215.7 227.3 236.5 238.9 282.5 225.9 253.2 240.0
20 234.4 249.3 269.1 251.4 298.7 245.3 287.7 262.3
21 247.8 260.2 277.6 285.1 313.6 253.3 296.9 276.4
22 263.5 275.5 293.4 298.8 328.5 274.1 311.04 292.1
23 278.7 291.3 289
24 295.9 299.5 299.1 25
7 How many
errors? 1 1 1 1 1 1 1
22.4 Tasks completed
24 24 22 22 20 24 21
1 Major Faults
0 0 0 0 0 0 1