Application of Blind Deconvolution Denoising in Failure Prognosis
Upload
khangminh22Category
view
4download
0
Research ArticlePrognosis Relevance of Serum Cytokines in Pancreatic Cancer
Carolina Torres,1 Ana Linares,1 Maria José Alejandre,1 Rogelio J. Palomino-Morales,1
Octavio Caba,2 Jose Prados,3 Antonia Aránega,3 Juan R. Delgado,4 Antonio Irigoyen,4
Joaquina Martínez-Galán,4 Francisco M. Ortuño,5 Ignacio Rojas,5 and Sonia Perales1
1Department of Biochemistry and Molecular Biology I, University of Granada, 18071 Granada, Spain2Department of Health Sciences, University of Jaen, 23071 Jaen, Spain3Department of Human Anatomy and Embryology, University of Granada, 18012 Granada, Spain4Oncology Service, Virgen de las Nieves Hospital, 18014 Granada, Spain5Department of Computer Architecture and Computer Technology (CITIC-UGR), University of Granada, 18071 Granada, Spain
Correspondence should be addressed to Carolina Torres; [email protected]
Received 4 November 2014; Revised 5 January 2015; Accepted 12 January 2015
Academic Editor: Wen-Bin Wu
Copyright © 2015 Carolina Torres et al.This is an open access article distributed under the Creative Commons Attribution License,which permits unrestricted use, distribution, and reproduction in any medium, provided the original work is properly cited.
The overall survival of patients with pancreatic ductal adenocarcinoma is extremely low. Although gemcitabine is the standardused chemotherapy for this disease, clinical outcomes do not reflect significant improvements, not even when combined withadjuvant treatments. There is an urgent need for prognosis markers to be found. The aim of this study was to analyze thepotential value of serum cytokines to find a profile that can predict the clinical outcome in patients with pancreatic cancer andto establish a practical prognosis index that significantly predicts patients’ outcomes. We have conducted an extensive analysis ofserum prognosis biomarkers using an antibody array comprising 507 human cytokines. Overall survival was estimated using theKaplan-Meier method. Univariate and multivariate Cox’s proportional hazard models were used to analyze prognosis factors. Todetermine the extent that survival could be predicted based on this index, we used the leave-one-out cross-validation model. Themultivariate model showed a better performance and it could represent a novel panel of serum cytokines that correlates to poorprognosis in pancreatic cancer. B7-1/CD80, EG-VEGF/PK1, IL-29, NRG1-beta1/HRG1-beta1, and PD-ECGF expressions portend apoor prognosis for patients with pancreatic cancer and these cytokines could represent novel therapeutic targets for this disease.
1. Introduction
Pancreatic ductal adenocarcinoma (PDAC) accounts for only2.68% of all cancers, but it represents the fourth leadingcancer-related death worldwide just remaining after lung andbronchus, prostate, and colorectum cancers in men and afterlung and bronchus, breast, and colorectum cancers in women[1]. The dreadful prognosis of patients with this disease, lessthan 5% reaching 5 years of survival after diagnosis, is dueto the little impact of the available chemotherapy on thecourse of the disease and to tumormetastasis at presentation.The development of the disease is a result of a complexand does not yet fully understood process encompassing theaccumulation of mutations and the alteration of multiplepathways.This could partly explain the clinical heterogeneityof this disease and the great difference seen in the outcomes
between individual patients.Thereby, there is a trend towardstailored therapies to specific genetic characteristics of indi-vidual tumors, not only for PDAC but also for the majorityof the cancers [2, 3]. Throughout past years there has notbeen remarkable survival improvement in PDAC patients;consequently it is urgent that novel biomarkers are identifiedfor PDAC in order to reduce its mortality rate [4, 5].
As defined by the NIH Biomarker Working Group, abiological marker (biomarker) is a characteristic that isobjectively measured and evaluated as an indicator of normalbiological processes, pathogenic processes, or pharmacologicresponses to a therapeutic intervention [6]. In PDAC, threetypes of biomarkers are desirable: those that help in thedetection of the disease onset (diagnosis biomarkers); thosethat predict responses to treatments (predictive biomarkers);and those that forecast the likely course of the disease,
Hindawi Publishing CorporationBioMed Research InternationalVolume 2015, Article ID 518284, 12 pageshttp://dx.doi.org/10.1155/2015/518284

2 BioMed Research International
including survival and recurrence pattern in the absence oftherapy (prognosis biomarkers). Finding a biomarker or apanel of biomarkers that would be able to predict the clinicalimpact of a chemotherapy regimen even before it is initiatedis highly warranted to (1) identify those patients more likelyto benefit fromaggressive therapies; (2) reduce risks of uselessside effects and help to set expectations for doctors andpatients; and (3) make attempt to apply new combination oftherapies or individualized treatment protocols according totheir expected responses. In addition, markers that displayprognosis significance also offer the potential to becomeemergent therapeutic targets and novel strategies in themanagement of PDAC [7, 8]. In the recent years, an extensiveresearch has been focused on the discovery of prognosisbiomarkers for PDACusing immunohistochemistry,WesternBlot, PCR, miRNA, proteomics, or DNA methylation basedmethods amongst others [9–16].
Here we have focused on those inflammatory media-tors that may constitute useful prognosis biomarkers forPDAC detection. Altered levels of circulating inflammatorycytokines have been found in cancer patients for nearly everycancer examined, even at early stages of the development,indicating that immune response has an important role dur-ing carcinogenesis and that circulating inflammatorymarkersmay be useful cancer biomarkers [17, 18]. Cytokines aresignaling molecules that are key mediators of inflammationor immune response. We presume that, due to the extremelyimportant role of microenvironment and desmoplastic reac-tion in PDAC [19, 20], cytokines expression patterns withinthe tumor and the surrounding microenvironment couldrepresent potential prognosis biomarkers for PDAC.
The aim of this study was to investigate the prognosissignificance of serum cytokines as a reflection of the hostresponse to tumor in PDAC patients. A conditional stepwisealgorithm based on likelihood rate analysis according to theCox’s proportional hazardmodel was used to identify the bestcombination of significant prognosis factors. An equationwas then derived for modeling the survival in our specificcohort. A leave-one-out cross validation was developed toassess the model.
2. Material and Methods
2.1. Patients and Sample Collection. All patients in the studywere diagnosed with PDAC at Hospital Virgen de las Nieves(Granada, Spain) from 2008 to 2011 (𝑛 = 14). All infor-mation from patients, including gender, age, disease grade,and symptoms was recorded. The mean age of the patientswas 66 years (range, 41–79 years) with a male to femaleratio of 50 : 50. Clinical staging for patients with pancreaticadenocarcinoma was as follows: stage III (28%) and stageIV (72%) (Table 1). PDAC patients had an overall survivaltime of 12.6 months, all being treated under Gemcitabine +Erlotinib combined therapy following the pattern previouslydefined by Moore et al. [21]. There was not any history ofpancreatitis but 36% had type II diabetes mellitus and 36%were smokers. Blood samples were collected after obtainingthe approval of relevant ethics committees and informedconsents of donors. Serum samples were collected from 2008
Table 1: Clinicopathologic characteristics of the study population(𝑛 = 14).
Age at diagnosis, years (mean ± StD) 66 ± 10.5
Gender Male: 50%Female: 50%
Disease stage III (28%)IV (72%)
Type of chemotherapy Gemcitabine + Erlotinib
Clinical responsePR (14.29%)SD (21.43%)PD (64.28%
Survival time, months (mean ± StD) 12.6 ± 12.6Outcome:Follow-up months (mean ± StD) 12.6 ± 12.6Death from pancreatic cancer 100%Alive 0%Lost to follow-up (censored cases) 0%
CEA level [𝜇g/L] (mean ± StD) 2219 ± 5017Healthy: 0–37
CA 19-9 level [U/L] (mean ± StD) 899 ± 3185Healthy: 0–5
PR: partial response; SD: stable disease; PD: progressive disease; StD:standard deviation.
to 2011 using standard procedures at the Oncology Service ofVirgen de las Nieves Hospital. Blood samples were obtainedfrom patients diagnosed with PDAC at baseline and at twoweeks after initiation of therapy (Gemcitabine + Erlotinib)and also from healthy individuals (14 samples). However, forthis study only pretreatment serum samples from patientswere considered to propose the prognosis cytokine panel.Serum was obtained after blood centrifugation at 1500 rpmfor 10min at 4∘C. Samples were aliquoted and stored at−80∘C.
2.2. Cytokine Antibody Assay. Soluble proteins in the seraof PDAC patients were measured using a biotin label-basedhuman antibody array (Human Antibody L-series 507 Array(RayBiotech, Norcross, GA, USA)), according to the rec-ommended protocols. Briefly, all samples were biotinylated.Antibodies were immobilized in specific spot locations onglass slides. Incubation of array membranes with biologicalsamples resulted in the binding of cytokines to correspond-ing antibodies. Signals were visualized using streptavidin-HRP conjugates and colorimetric. Final spot intensities weremeasured as the original intensities subtracting the back-ground. Data were normalized to the positive controls inthe individual slide. The antibody array data is provided inSupplementary Table 3 (see SupplementaryMaterial availableonline at http://dx.doi.org/10.1155/2015/518284).
2.3. Statistical Analysis. All statistics and data analysis wereperformed using the IBM SPSS statistic 20 software or thestatistical language R. Quality analysis was performed usingthe “ArrayQualityMetrics” package in R to eliminate anyfeasible outlier [22]. Average survival after administration of
BioMed Research International 3
Gemcitabine andErlotinibwas calculated from the beginningof the treatment to death, in months. For overall survival(OS) analyses, the Kaplan-Meier curve was used as a methodthat estimates the probability of survival to a given timeusing proportion of patients who have survived to that time[23]. The OS method has been widely applied in severalrelevant studies to analyze how well a treatment works[24–26]. The log-rank test was used to determine survivaldifferences between groups. Kaplan-Meier survival curves forindividual markers were obtained after dichotomization.Thecut-off values for eachmarker were those which displayed themost significant discrimination between short (<6 months)and long (>6 months) survival. In order to determine themost significant variables contributing to the OS, univariateand multivariate analyses were performed with the Cox’sproportional hazard regression model [27] to determineassociations between serum cytokines and cancer-relatedmortality. First, we analyzed associations between death andlevels of cytokines in patients before treatment, consideringone factor at a time. Second, amultivariate Cox’s proportionalhazard model was applied. The wrapper analysis was usedas the feature selection method, using conditional forwardstepwise algorithm based on likelihood rate, as applied inother works [16, 28]. Wrapper methods attempt to jointlyselect sets of variables with good predictive power for apredictor [29]. Forward selection starts with an empty setand selects the variable that gives the best classification result.Given this first variable, another variable is added that realizesthe largest improvement of performance. Variables are addeduntil the performance does not improve [30].
The overall model fit was considered significant based onchi-squared statistic test (𝑃 < 0.05). Besides, Wald indexwas shown to determine the weight of each variable in theglobal model, both uni- and multivariate. The cytokine levelswere introduced in the models as continuous parameters andresults were expressed as the hazard ratio (HR) or relativerisk ratio for one unit change. By analysis of these variables, aprognosis index (PI) that considers the regression coefficientsderived by Cox’s model of all significant factors was obtained.This model and the PI calculation were carried out accordingto the equations provided by Cox [27]. Differences wereconsidered significant when 𝑃 < 0.05.
Leave-one-out cross validation (LOOCV) was applied toassess the performance of the prognosismodel as the simplestand most widely used method for estimating predictionaccuracy [31]. For this validation, one patient was removedfrom the initial set, leaving a temporary training set and oneleft-out sample (test sample). The training set was used toobtain the Cox regression model. Subsequently, the PI ofthe test sample was obtained from the previously performedmodel. This PI was also applied to classify this patientaccording to the OS as poor (<6 months) and fair (>6months) prognosis.
3. Results
3.1. Survival Analysis of Patients with PDAC. Clinical char-acteristics of the PDAC patients are summarized in Table 1.For the whole study population, the OS rates were 46.15%
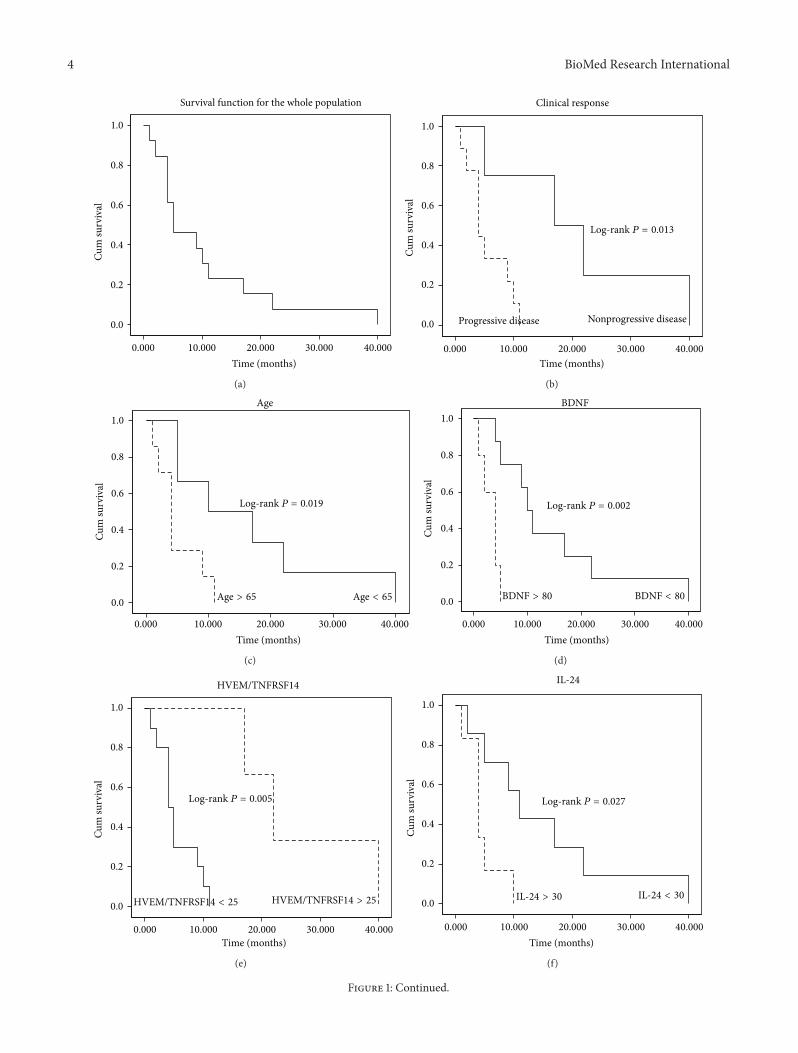
at 6 months, 23.08% at 12 months, and 7.69% at 24 months.Mean duration of the follow-up for the entire study groupwas 12 months (range: 1–40 months) and during that timethe 100% of the PDAC patients died due to the disease.Survival probabilities were calculated using theKaplan-Meiermethod. The survival curve for the whole cohort of patientsis shown in Figure 1(a).
3.2. Univariate Analysis between Serum Cytokines and Sur-vival. First, a univariate approach was used in this studyto identify relevant and independent measurable factorsat prognosis that could be associated to a higher risk ofPDAC death. Serum levels of cytokines before treatment andclinicopathologic parameters such as age, gender, stage, andclinical response were analyzed. Amongst the clinicopatho-logic parameters, age and the clinical response (progressiveor nonprogressive disease, according to the RECIST criteria[32]) were associated with poor prognosis on univariate ana-lysis (𝑃 = 0.030 and 𝑃 = 0.013, resp.). Concerning cytokines,at univariate analysis after feature selection, expression levelsof BDNF (𝑃 = 0.034, HR 1.005, 95% CI (1.000–1.009));HVEM/TNFRSF14 (𝑃 = 0.039, HR 0.924, 95% (CI 0.858–0.996)); IL-24 (𝑃 = 0.023, HR 1.041, 95% CI (1.006–1.078));IL-29 (𝑃 = 0.021, HR 1.012, 95% CI (1.002–1.023)); leptin R(𝑃 = 0.018, HR 1.008, 95% CI (1.001–1.015)); LRP-6 (𝑃 =0.022 HR 1.027, 95% CI (1.004–1.051)), and ROBO4 (𝑃 =0.045 HR 1.002, 95% CI (1.000–1.004)) showed a significantinfluence on prognosis. Results of the univariate analysisof each cytokine as independent prognosis factors and itsbeta-coefficients (𝛽), hazard ratios (representing the factor bywhich the hazard changes for each one-unit increase of thecytokine expression), 95% CI (upper and lower limits of theconfidence interval with a significance level of 0.05), and 𝑃values are shown in Table 2. In order to determine survivaldifferences of these individual markers in PDAC patients,Kaplan-Meier survival curves were generated using the cut-off points providing the most significant discrimination interms of survival between groups (short and long survival).Figures 1(b)–1(j) depict Kaplan-Meier survival plots of indi-vidualmarkers showing significant prognosis differences. Foreach curve, the log-rank 𝑃 value was provided to show thatthe differences between the two groups were significant.
3.3. Multivariate Analysis between Serum Cytokines andSurvival. Despite the fact that often only those statisticallysignificant variables in univariate analysis are included inmultivariate analysis, some variables not being significantin univariate analysis may appear jointly significant in amultivariate analysis. Thus, in addition to the statisticallysignificant variables related to poor prognosis on the uni-variate analysis, those also selected by the features selectionprocedure were also included in the multivariate model. Inproteomics studies, the number of samples is usually lowcompared to the number of variables, due to the limitedavailability or the cost of measurements. Taking this intoaccount and in order not to introduce bias due to the smallsample problem, a wrapper was used as a feature selectionmethod using conditional forward stepwise algorithm basedon likelihood rate to reduce the dimensionality of the data
4 BioMed Research International
Time (months)
Cum
surv
ival
Survival function for the whole population
1.0
0.8
0.6
0.4
0.2
0.0
0.000 10.000 20.000 30.000 40.000
(a)
Cum
surv
ival
Progressive disease Nonprogressive disease
Clinical response
1.0
0.8
0.6
0.4
0.2
0.0
Time (months)0.000 10.000 20.000 30.000 40.000
Log-rank P = 0.013
(b)
Cum
surv
ival
Age1.0
0.8
0.6
0.4
0.2
0.0
Time (months)0.000 10.000 20.000 30.000 40.000
Log-rank P = 0.019
Age > 65 Age < 65
(c)
Cum
surv
ival
BDNF1.0
0.8
0.6
0.4
0.2
0.0
Time (months)0.000 10.000 20.000 30.000 40.000
Log-rank P = 0.002
BDNF > 80 BDNF < 80
(d)
Cum
surv
ival
HVEM/TNFRSF14
1.0
0.8
0.6
0.4
0.2
0.0
Time (months)0.000 10.000 20.000 30.000 40.000
Log-rank P = 0.005
HVEM/TNFRSF14 < 25 HVEM/TNFRSF14 > 25
(e)
Cum
surv
ival
IL-24
1.0
0.8
0.6
0.4
0.2
0.0
Time (months)0.000 10.000 20.000 30.000 40.000
Log-rank P = 0.027
IL-24 > 30 IL-24 < 30
(f)
Figure 1: Continued.

BioMed Research International 5
Cum
surv
ival
IL-29
1.0
0.8
0.6
0.4
0.2
0.0
Time (months)0.000 10.000 20.000 30.000 40.000
Log-rank P = 0.006
IL-29 > 35 IL-29 < 35
(g)
Cum
surv
ival
Leptin-R
1.0
0.8
0.6
0.4
0.2
0.0
Time (months)0.000 10.000 20.000 30.000 40.000
Log-rank P = 0.0003
Leptin-R > 120 Leptin-R < 120
(h)
Cum
surv
ival
LRP-6
1.0
0.8
0.6
0.4
0.2
0.0
Time (months)0.000 10.000 20.000 30.000 40.000
Log-rank P = 0.021
LRP-6 > 30 LRP-6 < 30
(i)
Cum
surv
ival
ROBO4
1.0
0.8
0.6
0.4
0.2
0.0
Time (months)0.000 10.000 20.000 30.000 40.000
Log-rank P = 0.014
ROBO4 < 30 ROBO4 > 30
(j)
Figure 1: (a) shows Kaplan-Meier disease-specific survival curve for the whole population in the study. The Kaplan-Meier survival curveis defined as the probability of surviving in a given period of time. Each period of time is the interval between two nonsimultaneousterminal events.There were no survival data censored as no information about the survival time of any individual was lost. (b–h) Plots depictKaplan-Meier survival curves of individual biomarkers tagged as significant prognosis markers: (b) clinical response; (c) age; (d) BDNF; (e)HVEM/TNFRSF14; (f) IL-24; (g) IL-29; (h) leptin-R; (i) LRP-6; and (j) ROBO4.The cut-off values were determined considering those pointswhich maximized the dichotomization between poor and fair prognosis. The 𝑃 values for the log-rank tests are shown for every variable.
[30]. To assess the performance of the multivariate survivalmodel, a leave-one-out cross-validation (LOOCV) analysiswas performed. All estimated models using the differenttraining sets in the LOOCV displayed an average goodness offit (R-squared measurement) of 0.914.These results representthat a 91.4% of the variability in the survival time is accountedfor by the statistical model. In the test set, this validationshowed an accuracy of 92.3%, sensitivity of 85.57% (true-poorprognosis rate) and specificity of 100% (true-fair prognosisrate) for all the left out samples (test samples). All estimatedmodels are depicted in SupplementaryMaterial (Supplemen-tary Figure 1).
The best combination of cytokines selected by the multi-variateCox’s proportional hazard analysis is shown inTable 3.None of the clinicopathologic parameters demonstrated a sig-nificant trend towards shortened overall survival (𝑃 > 0.05)and were not considered in the global model. Concerningcytokines at multivariate analysis, expression levels of B7-1/CD80 (𝑃 = 0.043, HR 77.574, 95% CI (1.138–5289.4)); EG-VEGF/PK1 (𝑃 = 0.049, HR 1.003, 95% CI (1.000–1.005))and IL-29 (𝑃 = 0.026, HR 1.084, 95% CI (1.010–1.164))showed a significant influence on prognosis. The significantinfluence on survival observed in univariate analyses for IL-29 was confirmed in multivariate analyses. Beta-coefficients
6 BioMed Research International
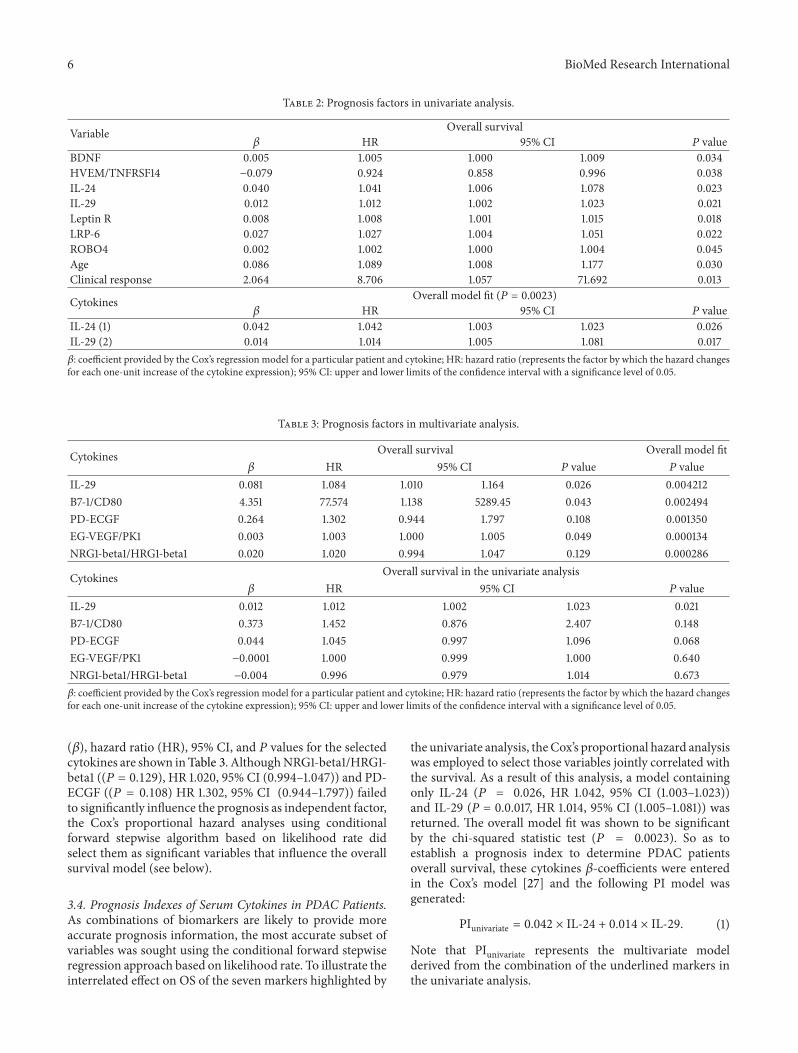
Table 2: Prognosis factors in univariate analysis.
Variable Overall survival𝛽 HR 95% CI 𝑃 value
BDNF 0.005 1.005 1.000 1.009 0.034HVEM/TNFRSF14 −0.079 0.924 0.858 0.996 0.038IL-24 0.040 1.041 1.006 1.078 0.023IL-29 0.012 1.012 1.002 1.023 0.021Leptin R 0.008 1.008 1.001 1.015 0.018LRP-6 0.027 1.027 1.004 1.051 0.022ROBO4 0.002 1.002 1.000 1.004 0.045Age 0.086 1.089 1.008 1.177 0.030Clinical response 2.064 8.706 1.057 71.692 0.013
Cytokines Overall model fit (𝑃 = 0.0023)𝛽 HR 95% CI 𝑃 value
IL-24 (1) 0.042 1.042 1.003 1.023 0.026IL-29 (2) 0.014 1.014 1.005 1.081 0.017𝛽: coefficient provided by the Cox’s regression model for a particular patient and cytokine; HR: hazard ratio (represents the factor by which the hazard changesfor each one-unit increase of the cytokine expression); 95% CI: upper and lower limits of the confidence interval with a significance level of 0.05.
Table 3: Prognosis factors in multivariate analysis.
Cytokines Overall survival Overall model fit𝛽 HR 95% CI 𝑃 value 𝑃 value
IL-29 0.081 1.084 1.010 1.164 0.026 0.004212B7-1/CD80 4.351 77.574 1.138 5289.45 0.043 0.002494PD-ECGF 0.264 1.302 0.944 1.797 0.108 0.001350EG-VEGF/PK1 0.003 1.003 1.000 1.005 0.049 0.000134NRG1-beta1/HRG1-beta1 0.020 1.020 0.994 1.047 0.129 0.000286
Cytokines Overall survival in the univariate analysis𝛽 HR 95% CI 𝑃 value
IL-29 0.012 1.012 1.002 1.023 0.021B7-1/CD80 0.373 1.452 0.876 2.407 0.148PD-ECGF 0.044 1.045 0.997 1.096 0.068EG-VEGF/PK1 −0.0001 1.000 0.999 1.000 0.640NRG1-beta1/HRG1-beta1 −0.004 0.996 0.979 1.014 0.673𝛽: coefficient provided by the Cox’s regression model for a particular patient and cytokine; HR: hazard ratio (represents the factor by which the hazard changesfor each one-unit increase of the cytokine expression); 95% CI: upper and lower limits of the confidence interval with a significance level of 0.05.
(𝛽), hazard ratio (HR), 95% CI, and 𝑃 values for the selectedcytokines are shown inTable 3. AlthoughNRG1-beta1/HRG1-beta1 ((𝑃 = 0.129), HR 1.020, 95% CI (0.994–1.047)) and PD-ECGF ((𝑃 = 0.108) HR 1.302, 95% CI (0.944–1.797)) failedto significantly influence the prognosis as independent factor,the Cox’s proportional hazard analyses using conditionalforward stepwise algorithm based on likelihood rate didselect them as significant variables that influence the overallsurvival model (see below).
3.4. Prognosis Indexes of Serum Cytokines in PDAC Patients.As combinations of biomarkers are likely to provide moreaccurate prognosis information, the most accurate subset ofvariables was sought using the conditional forward stepwiseregression approach based on likelihood rate. To illustrate theinterrelated effect on OS of the seven markers highlighted by
the univariate analysis, theCox’s proportional hazard analysiswas employed to select those variables jointly correlated withthe survival. As a result of this analysis, a model containingonly IL-24 (𝑃 = 0.026, HR 1.042, 95% CI (1.003–1.023))and IL-29 (P = 0.0.017, HR 1.014, 95% CI (1.005–1.081)) wasreturned. The overall model fit was shown to be significantby the chi-squared statistic test (𝑃 = 0.0023). So as toestablish a prognosis index to determine PDAC patientsoverall survival, these cytokines 𝛽-coefficients were enteredin the Cox’s model [27] and the following PI model wasgenerated:
PIunivariate = 0.042 × IL-24 + 0.014 × IL-29. (1)
Note that PIunivariate represents the multivariate modelderived from the combination of the underlined markers inthe univariate analysis.

BioMed Research International 7
0
0.5
1
1.5
2
2.5
3
3.5
4
4.5
5
0 5 10 15 20 25 30 35 40 45
Prog
nosis
inde
x
Time (months)
R2= 0.6644
PI-2
(a)
0
5
10
15
20
25
30
35
40
45
0 5 10 15 20 25 30 35 40 45
Prog
nosis
inde
x
Time (months)
R2= 0.9257
R2= 0.7269 R
2= 0.9056
PI-5PI-4
PI-3Logarithmic (PI-3)
(b)
Figure 2: The Cox’s regression model. Observed (denoted by square, diamonds and triangles points) and predicted (denoted by solid line)prognosis curves for the PDAC patients according to (a) univariate o and (b) multivariate Cox’s proportional hazard model analysis. Asexplained in the text, the stepwise procedure based on the likelihood ratio was used to select a model containing a statistically significantsubset of prognosis factors. The three predicted prognosis curves in (b) are derived from step 3 (where three cytokines are included), step4 (four cytokines included), and step 5 (five cytokines included) of this stepwise procedure. The predicted survival curves are adjusted to alogarithmic distribution function, as expected. The coefficient of determination R2 is illustrative of the model goodness of fit. As coefficientattested, these models would yield useful predictions, being the five cytokines multivariate model the most accurate, reaching a 92.6%. Thismeans that our PI properly models approximately 93% of the survival variation.
Regarding filtered cytokines obtained by multivariateanalysis, a second statistically significant (𝑃 = 0.0003)survival model was built and the following PI model wasgenerated:
PImultivariate = 4.351 ×B7-1CD80+ 0.003 ×
EG-VEGFPK1+ 0.081
× IL-29 + 0.020 × NGR1-beta1HRG1-beta1
+ 0.264 × PD-ECGF.(2)
Note that PImultivariate represents the multivariate modelderived from the best of all possible combinations using thecytokines in themultivariate analysis having being previouslyselected by the wrapper feature selection method.
Whether these PI can contribute to accurately modelsurvival for this patient cohort was assessed by regressionanalyses. R-squared measurement was given as a proof ofgoodness of fit. Applying the equations for both PIs, scoresof the proposed PIunivariate and PImultivariate were calculated,ranked, and correlated to OS. As expected, both survivalmodels showed a logarithmic tendency when plotted againsttime. Figure 2 depicts observed PI scores and predicted log-arithmic adjustments for these models. For the multivariatemodel, although the overall model with five cytokines wasprobed to be statistically significant, regression analyses formodels containing 3 and 4 cytokines were also evaluated.R-squared values obtained were 0.664, 0.727, 0.906, and0.926 for PIunivariate and 3, 4, and 5 cytokines PImultivariate,respectively. These results can be translated into that 66.4%,72.7%, 90.6%, and 92.6%, respectively, of the variability
in the survival time are accounted for by the statisticalmodel. All models yield satisfactory results but multivariatemodel embracing B7-1/CD80, EG-VEGF/PK1, IL-29, NRG1-beta1/HRG1-beta1, and PD-ECGF stood out from the rest.
Prognosis index for multivariate model with these fivecytokines ranged from 0 to 40 in our cohort. Patients werecategorized into two groups according to their prognosisindex: poor prognosis (PI > 17) and fair prognosis (PI <17). Survival curves were then compared among these twoprognosis groups (Figure 3(b)).The proposed groups are ableto properly differentiate between low (<6 months) and high(>6 months) overall survival time. Overall survival in thesegroups was highly statistically significant (𝑃 < 0.00056).Indeed, as shown in Supplementary Table 2, the 100% of thePDACpatients were correctly classified as long/short survivalaccording to the previously proposed cut-off in the prognosisindex (PI = 17). Prognosis index for univariate model wasalso depicted and it ranged from 0 to 5. According to thisPI, patients were again categorized into two groups: poor (PI> 1.5) and fair prognosis (PI < 1.5). Furthermore, survivalcurves were compared among these two prognosis groups(Figure 3(a)) and a significant correlation with the overallsurvival was also obtained as low (<6 months) and high(>6 months) survival. Overall survival in these groups wasless but still significant (𝑃 < 0.004) compared with the PImultivariate.
4. Discussion
In this work, we have conducted an extensive analysis ofserum prognosis biomarkers using an antibody array com-prising 507 humanproteins including cytokines, chemokines,adipokines, growth factors, angiogenic factors, proteases,

8 BioMed Research International
Time (months)
Cum
surv
ival
1.0
0.8
0.6
0.4
0.2
0.0
0.00 10.00 20.00 30.00 40.00
Log-rank P = 0.004370
PI > 1.5 PI < 1.5
PIunivariate
(a)Cu
m su
rviv
al
Time (months)
1.0
0.8
0.6
0.4
0.2
0.0
0.00 10.00 20.00 30.00 40.00
Log-rank P = 0.00057
PI > 17 PI < 17
PImultivariate
(b)
Figure 3: Kaplan-Meier PI survival curves. (a) shows survival plot for PI derived from univariate model, embracing 2 cytokines. A cut-off of1.5 was chosen to divide cohort of patients in short (<6 months) and long (>6 months) survival times. (b) shows survival plot for PI derivedfrom multivariate model, embracing 5 cytokines. A cut-off of 17 was chosen to divide cohort of patients in short (<6 months) and long (>6months) survival times. Both PI cut-off values were established considering the best discrimination between poor and fair prognosis. The 𝑃values for the log-rank tests are shown for both comparisons.
soluble receptors, soluble adhesion molecules, and otherproteins.Themain objective of this analysis was to determineif a specific cytokine panel in patient before Gemcitabineand Erlotinib treatment could influence the survival timeafter this treatment. This is a powerful tool with great poten-tial in applications for biomarker discovery [33]. To assessthe impact of altered cytokine profiles on overall survival(OS), Cox’s proportional hazard modeling and Kaplan-Meiercurves were developed. The effect of serum cytokines levelson OS was dually explored. Initially, a univariate analysisof the cytokines along with some clinicopathologic featureswas carried out to determine possible significant explanatoryvariables to model a prognosis index (PI). Whilst univariateanalysis returned those highly significant markers to be usedas independent prognosis factors, it must not be impliedthat the combination of these markers would represent thebest performance for the multivariate model. Furthermore,univariate selection methods have certain restrictions andmay lead to less accurate classifiers. Hence, themost adequateapproach to define the multivariate model would be inde-pendent from the former, so disregarded variables could alsobe considered to complete the multivariate model. Then, assome variables may not be significant in univariate analysisbut become significant inmultivariate analysis, a multivariateapproachwas used in this study to identify jointlymeasurablefactors that could be used to model risk of PDAC mortality.To overcome the noise and overfitting problem derived fromthe fact that there weremore candidate features than samples,a robust feature selection model was carried out [34]. Aslong as feature selection is performed reasonably, accurateprediction is achieved evenwith the simplest of the predictivemodels [35].
In the course of our evaluation, we first identified 2cytokines that correlated with patients’ prognosis in uni-variate analysis. Following, a panel of 5 cytokines clearlydemonstrated a remarkably better overall performance formodeling OS.Therefore, themultivariate model consisting ofB7-1/CD80, EG-VEGF/PK1, IL-29, NRG1-beta1/HRG1-beta1,and PD-ECGF was shown to be more accurate than theunivariate model considering the most significant markers.The effectiveness of our model is clearly demonstrated withthe evaluation performed by the LOOCV.
Notwithstanding proposed roles for B7-1/CD80, EG-VEGF/PK1, and NRG1-beta1/HRG1-beta1 in PDAC, to thebest of our knowledge this is the first time that this combi-nation of serum cytokines has been collectively described asprognosis factors for PDAC.An overview of these biomarkersis subsequently given.
B7-1/CD80. The B7 system is one of the most importantsecondary signaling mechanisms and is essential in main-taining the delicate balance between immune potency andsuppression of autoimmunity. B7-1 (CD80) and B7-2 (CD86)are ligands expressed on antigen-presenting cells and theyare responsible of the costimulatory signaling whereby T cellpriming, growth, maturation, and tolerance are regulated.Upon binding to their receptors, T cell activation and survivalare promoted. On the other hand, they can also deliver coin-hibitory signaling binding to their inhibitory receptors andblocking T cell response [36]. An inadequate costimulationhas been suggested to contribute to the progressive growth oftumours [37]. The combination of B7-1 and B7-H1 has beenproposed as prognosis factor for PDAC [38, 39]. Althoughthe role of B7-1 seems to be antitumoral, overall emerging

BioMed Research International 9
picture is that the aberrant or unbalanced expression of B7family members can contribute to the escape of the immunesurveillance.
EG-VEGF/PK1.This molecule was first described as an exam-ple of a class of highly specific mitogen that acts to regulateproliferation and differentiation of the vascular endotheliumin a tissue-specific manner. Although this protein does notshow any structural homology to the VEGF family, they doshare multiple regulatory functions related to proliferationand migration [40]. EG-VEGF/PK1 has been described tobe related to multiple cancer types including ovarian [41],colorectal [42], prostate [43], hepatic [44], pancreatic [45]and neuroblastoma [46]. It has also been described as a factorfor placenta angiogenesis [47].
IL-29. Also referred as IFN-𝜆1, it belongs to the type III INFfamily and it has been described to induce similar biologicalactivities to type I INF family (INT-𝛼 and 𝛽). Althoughboth are able to induce antiproliferative responses in manycell types, IFN-𝜆1 appears to be more limited. Signallingvia the IFN-𝜆1 results in activation of STATs, MAPKs andPI3K pathways [48–50]. However, the ability of IFN-𝜆1 totrigger these alternative pathways could be cell-type specificor altered in cancer cells. Contrasting conclusion has beenderived from other study that suggests growth induction inhuman multiple myeloma cells through MAPK activation[51]. The precise role of IL-29 in the host responses andimmune surveillance has yet to be defined in the context ofcancer in general and in PDAC in particular.
NRG1-beta1/HRG1-beta1. Neuregulin-1 or heregulin-1 is anextracellular protein ligand meant to bind to the ErbB recep-tors family members, ErbB3 and ErbB4. Upon interactionwith their receptor, a wide range of biological events includ-ing the induction and progression of several epithelial cancersare prompted. The NRG1/HRG1 proteins play essential rolesin the nervous system, heart, and breast and are involved inthe development of human diseases, including schizophreniaand breast cancer [52, 53]. An upregulation of the angiogenicfactor VEGF by NRG1/HRG1 has also been described [54].Their proliferative effects are likely to be achieved throughthe combined action of multiple pathways, including PI3K,MAPK, and p38MAPK pathways [55] which has been specif-ically described in PDAC cells. A worse survival rate wasrelated to those PDAC patients with higher expression ofHRG-𝛽 mRNA [56]. ErbB3 has a pivotal role in pancreatictumorigenesis promoting in vitro and in vivo cancer cellproliferation [57]. It has been recently described that cancer-associated fibroblasts release NRG1/HRG1 ligand, activatingPDAC cells by ErbB3/AKT-mediated signalling and enhanc-ing tumorigenesis. This could be related to the insufficienteffect of Erlotinib (EGFR inhibitor) when combined withGemcitabina in PDAC patient treatment [58].
PD-ECGF. It is also known as thymidine phosphorylase;its activity and expression in carcinomas of the esophagus,
stomach, colorectum, pancreas, and lung are significantlyhigher than in the adjacent nonneoplastic tissue and mayhave an important role in the proliferation of these solidtumours. PD-ECGF is expressed not only in the tumorcells but also in the tumor associated stromal cells [59, 60].Regression analyses in bladder, colorectal, gastric, renal andpancreatic carcinoma have marked PD-ECGF as a prognosisfactor for poor outcome [61].
It may not be possible for one single biomarker to providethe necessary prognosis information about the patient to basetreatment options on. For this reason, panels of biomarkersare advisable to accurately predict the stage of the diseaseand how it will progress. Previous studies have indicated thattumor prognosis is closely associated with immune escapeby tumor cells. A dynamic relationship between the hostimmune system and cancer is emerging [62]. Present prog-nosis scoring system, based on serum cytokines, has beendeveloped to identify patients at the highest risk of cancerprogression and death. Due to the emerging role of tumourmicroenvironment on cancer progression and aggressive-ness, cytokines could represent successfully predictors ofcancer outcomes as they can be considered as a reflection ofthe complex tumour immunosuppressive network underly-ing PDAC. The worsened prognosis associated with tumorsharboring this cytokine panel could be associated to a deregu-lation of growth factor-mediated paracrine loops, particularlyin relation to proliferation and angiogenesis. Given theinterplay between B7-1/CD80, EG-VEGF/PK1, IL-29, NRG1-beta1/HRG1-beta1, and PD-ECGF and poor prognosis, thesecytokines could be considered as novel molecular targets thatmay lead tomore successful therapeuticmodalities for PDACpatients.
We are aware of the limitation imposed by populationsize in this study. However, we have tried to apply arobust statistical analysis and validation. Although PDACis amongst the less prevalent cancer and studies with largesample size are difficult to be carried out, its aggressive-ness and the poor outcome urge to search novel prognosisbiomarkers as the basis for rational treatment decisions,analysis of novel therapeutic interventions, and tailoredtreatment approaches [63]. For this model to be applied inclinical decisions making, further validations are impera-tive in order to assure that this combination of cytokineswould successfully model the outcome in other patientspopulations.
In summary, we have identified for the first time apanel of five serum cytokines comprising B7-1/CD80, EG-VEGF/PK1, IL-29, NRG1-beta1/HRG1-beta1, and PD-ECGFwith prognosis significance in PDAC.These molecules mightnot only allow a more accurate prediction of prognosis ofpatients with PDAC but also represent novel targets for ther-apeutic agents. Studies in prognosis biomarkers achievingtrue clinical impact and improving patient management andoutcome are a matter of the utmost importance in PDAC.Besides, being able to foresee the prognosis of a PDACpatient may help to avoid futile therapy approaches and toimprove quality of life of those whose long-term survival isunpromising.

10 BioMed Research International
Abbreviations
PDAC: Pancreatic ductal adenocarcinomaOS: Overall survivalHR: Hazard ratioPI: Prognosis indexCI: Confidence interval.
Conflict of Interests
No potential conflict of interests was disclosed.
Acknowledgments
The study was fully supported by ROCHE FARMA S.A (ref.H/OH-TAR-10/131 and ref. H/OH-TRR-08/59) and Institutode Salud Carlos III (ISCIII) (Clinical trial ref. EC08/00009),and the Government of Andalusia Project P12-TIC-2082.
References
[1] R. Siegel, D.Naishadham, andA. Jemal, “Cancer statistics, 2012,”CA: Cancer Journal for Clinicians, vol. 62, no. 1, pp. 10–29, 2012.
[2] N. Samuel and T. J. Hudson, “The molecular and cellularheterogeneity of pancreatic ductal adenocarcinoma,” NatureReviews Gastroenterology and Hepatology, vol. 9, no. 2, pp. 77–87, 2012.
[3] K. Zieger, “High throughput molecular diagnostics in bladdercancer—on the brink of clinical utility,”MolecularOncology, vol.1, no. 4, pp. 384–394, 2008.
[4] M. Hidalgo and D. D. Von Hoff, “Translational therapeuticopportunities in ductal adenocarcinoma of the pancreas,” Clin-ical Cancer Research, vol. 18, no. 16, pp. 4249–4256, 2012.
[5] E. Costello, W. Greenhalf, and J. P. Neoptolemos, “Newbiomarkers and targets in pancreatic cancer and their appli-cation to treatment,” Nature Reviews Gastroenterology andHepatology, vol. 9, no. 8, pp. 435–444, 2012.
[6] A. J. Atkinson Jr., W. A. Colburn, V. G. DeGruttola et al.,“Biomarkers and surrogate endpoints: preferred definitions andconceptual framework,” Clinical Pharmacology and Therapeu-tics, vol. 69, no. 3, pp. 89–95, 2001.
[7] J. M. Winter, C. J. Yeo, and J. R. Brody, “Diagnostic, prognostic,and predictive biomarkers in pancreatic cancer,” Journal ofSurgical Oncology, vol. 107, no. 1, pp. 15–22, 2013.
[8] G. M. Clark, “Prognostic factors versus predictive factors:examples from a clinical trial of erlotinib,”Molecular Oncology,vol. 1, no. 4, pp. 406–412, 2008.
[9] N. B. Jamieson, C. R. Carter, C. J. McKay, and K. A. Oien,“Tissue biomarkers for prognosis in pancreatic ductal ade-nocarcinoma: a systematic review and meta-analysis,” ClinicalCancer Research, vol. 17, no. 10, pp. 3316–3331, 2011.
[10] G. Garcea, C. P. Neal, C. J. Pattenden, W. P. Steward, and D. P.Berry, “Molecular prognostic markers in pancreatic cancer: asystematic review,” European Journal of Cancer, vol. 41, no. 15,pp. 2213–2236, 2005.
[11] Y. Luo, Z. Qiu, L. Tian et al., “Identification of novel predictivemarkers for the prognosis of pancreatic ductal adenocarci-noma,” Human Pathology, vol. 44, no. 1, pp. 69–76, 2013.
[12] C. D. Mann, C. Bastianpillai, C. P. Neal et al., “Notch3 and hey-1as prognostic biomarkers in pancreatic adenocarcinoma,” PLoSONE, vol. 7, no. 12, Article ID e51119, 2012.
[13] A. Dallol, J. Al-Maghrabi, A. Buhmeida et al., “Methylation ofthe polycomb group target genes is a possible biomarker forfavorable prognosis in colorectal cancer,” Cancer EpidemiologyBiomarkers and Prevention, vol. 21, no. 11, pp. 2069–2075, 2012.
[14] S. M. Denley, N. B. Jamieson, P. McCall et al., “Activation ofthe IL-6R/Jak/stat pathway is associated with a poor outcomein resected pancreatic ductal adenocarcinoma,” Journal of Gas-trointestinal Surgery, vol. 17, no. 5, pp. 887–898, 2013.
[15] E. Giovannetti, A. van der Velde, N. Funel et al., “High-throughputmicroRNA (miRNAs) arrays unravel the prognosticrole of MiR-211 in pancreatic cancer,” PLoS ONE, vol. 7, no. 11,Article ID e49145, 2012.
[16] S. O. Dima, C. Tanase, R. Albulescu et al., “An exploratory studyof inflammatory cytokines as prognostic biomarkers in patientswith ductal pancreatic adenocarcinoma,” Pancreas, vol. 41, no.7, pp. 1001–1007, 2012.
[17] A. J. Schetter, N. H. H. Heegaard, and C. C. Harris, “Inflamma-tion and cancer: interweavingmicroRNA, free radical, cytokineand p53 pathways,”Carcinogenesis, vol. 31, no. 1, pp. 37–49, 2009.
[18] G. Germano, P. Allavena, andA.Mantovani, “Cytokines as a keycomponent of cancer-related inflammation,” Cytokine, vol. 43,no. 3, pp. 374–379, 2008.
[19] X. Li, Q. Ma, Q. Xu, W. Duan, J. Lei, and E. Wu, “Targeting thecancer-stroma interaction: a potential approach for pancreaticcancer treatment,” Current Pharmaceutical Design, vol. 18, no.17, pp. 2404–2415, 2012.
[20] M. V. Apte, S. Park, P. A. Phillips et al., “Desmoplastic reactionin pancreatic cancer: role of pancreatic stellate cells,” Pancreas,vol. 29, no. 3, pp. 179–187, 2004.
[21] M. J. Moore, D. Goldstein, J. Hamm et al., “Erlotinib plusgemcitabine compared with gemcitabine alone in patients withadvanced pancreatic cancer: a phase III trial of the NationalCancer Institute of Canada Clinical Trials Group,” Journal ofClinical Oncology, vol. 25, no. 15, pp. 1960–1966, 2007.
[22] A. Kauffmann, R. Gentleman, and W. Huber, “arrayQualityMetrics—a bioconductor package for quality assessment ofmicroarray data,” Bioinformatics, vol. 25, no. 3, pp. 415–416,2009.
[23] E. L. Kaplan and P. Meier, “Nonparametric estimation fromincomplete observations,”The Journal of theAmerican StatisticalAssociation, vol. 53, pp. 457–481, 1958.
[24] Y.-C. Hou, Y.-J. Chao, H.-L. Tung, H.-C. Wang, and Y.-S. Shan,“Coexpression of CD44-positive/CD133-positive cancer stemcells and CD204-positive tumor-associated macrophages is apredictor of survival in pancreatic ductal adenocarcinoma,”Cancer, vol. 120, no. 17, pp. 2766–2777, 2014.
[25] J. Lemke, D. Schafer, S. Sander, D. Henne-Bruns, and M.Kornmann, “Survival and prognostic factors in pancreatic andampullary cancer,” Anticancer Research, vol. 34, no. 6, pp. 3011–3020, 2014.
[26] B. C. Ozdemir, T. Pentcheva-Hoang, J. L. Carstens et al.,“Depletion of carcinoma-associated fibroblasts and fibrosisinduces immunosuppression and accelerates pancreas cancerwith reduced survival,” Cancer Cell, vol. 25, pp. 719–734, 2014.
[27] D. R. Cox, “Regression models and life-tables,” Journal of theRoyal Statistical Society Series B:Methodological, vol. 34, pp. 187–220, 1972.
[28] A. Anjomshoaa, Y.-H. Lin, M. A. Black et al., “Reducedexpression of a gene proliferation signature is associated withenhanced malignancy in colon cancer,” British Journal of Can-cer, vol. 99, no. 6, pp. 966–973, 2008.
BioMed Research International 11
[29] A.-C. Haury, P. Gestraud, and J.-P. Vert, “The influence offeature selection methods on accuracy, stability and inter-pretability of molecular signatures,” PLoS ONE, vol. 6, no. 12,Article ID e28210, 2011.
[30] S. Smit, H. C. J. Hoefsloot, and A. K. Smilde, “Statistical dataprocessing in clinical proteomics,” Journal of ChromatographyB: Analytical Technologies in the Biomedical and Life Sciences,vol. 866, no. 1-2, pp. 77–88, 2008.
[31] R. Simon, M. D. Radmacher, K. Dobbin, and L. M. McShane,“Pitfalls in the use of DNA microarray data for diagnosticand prognostic classification,” Journal of the National CancerInstitute, vol. 95, no. 1, pp. 14–18, 2003.
[32] E. L. van Persijn van Meerten, H. Gelderblom, and J. L. Bloem,“RECIST revised: Implications for the radiologist. A reviewarticle on themodified RECIST guideline,” European Radiology,vol. 20, no. 6, pp. 1456–1467, 2010.
[33] R. Huang,W. Jiang, J. Yang et al., “A biotin label-based antibodyarray for high-content profiling of protein expression,” CancerGenomics and Proteomics, vol. 7, no. 3, pp. 129–141, 2010.
[34] Y. Saeys, I. Inza, and P. Larranaga, “A review of feature selectiontechniques in bioinformatics,” Bioinformatics, vol. 23, no. 19, pp.2507–2517, 2007.
[35] R. Simon, “Supervised analysis when the number of candidatefeatures (p) greatly exceeds the number of cases (n),” ACMSIGKDD Explorations Newsletter, vol. 5, no. 2, pp. 31–36, 2003.
[36] B. Seliger andD.Quandt, “The expression, function, and clinicalrelevance of B7 familymembers in cancer,”Cancer Immunology,Immunotherapy, vol. 61, no. 8, pp. 1327–1341, 2012.
[37] L. Chen, P. McGowan, S. Ashe et al., “Tumor immunogenicitydetermines the effect of B7 costimulation on T cell-mediatedtumor immunity,” Journal of ExperimentalMedicine, vol. 179, no.2, pp. 523–532, 1994.
[38] L. Wang, Q. Ma, X. Chen, K. Guo, J. Li, andM. Zhang, “Clinicalsignificance of B7-H1 and B7-1 expressions in pancreatic carci-noma,” World Journal of Surgery, vol. 34, no. 5, pp. 1059–1065,2010.
[39] L. Wang, H. Liu, X. Chen, M. Zhang, K. Xie, and Q. Ma,“Immune sculpting of norepinephrine on MHC-I, B7-1, IDOand B7-H1 expression and regulation of proliferation andinvasion in pancreatic carcinoma cells,” PLoS ONE, vol. 7, no.9, Article ID e45491, 2012.
[40] J. LeCouter, J. Kowalski, J. Foster et al., “Identification of anangiogenicmitogen selective for endocrine gland endothelium,”Nature, vol. 412, no. 6850, pp. 877–884, 2001.
[41] S. Balu, L. Pirtea, P. Gaje, A. M. Cimpean, and M. Raica, “Theimmunohistochemical expression of endocrine gland-derived-VEGF (EG-VEGF) as a prognostic marker in ovarian cancer,”Romanian Journal of Morphology and Embryology, vol. 53, no.3, pp. 479–483, 2012.
[42] H. Nagano, T. Goi, K. Koneri, Y. Hirono, K. Katayama, andA. Yamaguchi, “Endocrine gland-derived vascular endothelialgrowth factor (EG-VEGF) expression in colorectal cancer,”Journal of Surgical Oncology, vol. 96, no. 7, pp. 605–610, 2007.
[43] D. Pasquali, V. Rossi, S. Staibano et al., “The endocrine-gland-derived vascular endothelial growth factor (EG-VEGF)/prokineticin 1 and 2 and receptor expression in human prostate:up-regulation of EG-VEGF/prokineticin 1 with malignancy,”Endocrinology, vol. 147, no. 9, pp. 4245–4251, 2006.
[44] Q. Li, B. Xu, L. Fu, and X. S. Hao, “Correlation of four vascularspecific growth factors with carcinogenesis and portal vein
tumor thrombus formation in human hepatocellular carci-noma,” Journal of Experimental and Clinical Cancer Research,vol. 25, no. 3, pp. 403–409, 2006.
[45] X. Jiang, I. Abiatari, B. Kong et al., “Pancreatic islet and stellatecells are the main sources of endocrine gland-derived vascularendothelial growth factor/prokineticin-1 in pancreatic cancer,”Pancreatology, vol. 9, no. 1-2, pp. 165–172, 2009.
[46] E. S.W.Ngan, F. Y. L. Sit, K. Lee et al., “Implications of endocrinegland-derived vascular endothelial growth factor/prokineticin-1 signaling in human neuroblastoma progression,” ClinicalCancer Research, vol. 13, no. 3, pp. 868–875, 2007.
[47] S. Brouillet, P. Hoffmann, J. J. Feige, and N. Alfaidy, “EG-VEGF:a key endocrine factor in placental development,” Trends inEndocrinology andMetabolism, vol. 23, no. 10, pp. 501–508, 2012.
[48] S. V. Kotenko, “IFN-𝜆s,” Current Opinion in Immunology, vol.23, no. 5, pp. 583–590, 2011.
[49] S. G. Maher, F. Sheikh, A. J. Scarzello et al., “IFN𝛼 and IFN𝜆differ in their antiproliferative effects and duration of JAK/STATsignaling activity,” Cancer Biology and Therapy, vol. 7, no. 7, pp.1109–1115, 2008.
[50] R. P. Donnelly and S. V. Kotenko, “Interferon-lambda: a newaddition to an old family,” Journal of Interferon and CytokineResearch, vol. 30, no. 8, pp. 555–564, 2010.
[51] A. J. Novak, D.M.Grote, S. C. Ziesmer, V. Rajkumar, S. E. Doyle,and S. M. Ansell, “A role for IFN-𝜆1 in multiple myeloma B cellgrowth,” Leukemia, vol. 22, no. 12, pp. 2240–2246, 2008.
[52] D. L. Falls, “Neuregulins: functions, forms, and signalingstrategies,” Experimental Cell Research, vol. 284, no. 1, pp. 14–30, 2003.
[53] N. V. L. Hayes andW. J. Gullick, “The neuregulin family of genesand their multiple splice variants in breast cancer,” Journal ofMammary Gland Biology and Neoplasia, vol. 13, no. 2, pp. 205–214, 2008.
[54] L. Yen, X.-L. You, A.-E. AlMoustafa et al., “Heregulin selectivelyupregulates vascular endothelial growth factor secretion incancer cells and stimulates angiogenesis,” Oncogene, vol. 19, no.31, pp. 3460–3469, 2000.
[55] C. Stove and M. Bracke, “Roles for neuregulins in humancancer,” Clinical and Experimental Metastasis, vol. 21, no. 8, pp.665–684, 2005.
[56] A. Kolb, J. Kleeff, N. Arnold et al., “Expression and differentialsignaling of heregulins in pancreatic cancer cells,” InternationalJournal of Cancer, vol. 120, no. 3, pp. 514–523, 2007.
[57] J. S. Liles, J. P. Arnoletti, C.W. D. Tzeng et al., “ErbB3 expressionpromotes tumorigenesis in pancreatic adenocarcinoma,” Can-cer Biology andTherapy, vol. 10, no. 6, pp. 555–563, 2010.
[58] J. S. Liles, J. P. Arnoletti, A. V. Kossenkov et al., “TargetingErbB3-mediated stromal-epithelial interactions in pancreaticductal adenocarcinoma,” British Journal of Cancer, vol. 105, no.4, pp. 523–533, 2011.
[59] A. Bronckaers, F. Gago, J. Balzarini, and S. Liekens, “The dualrole of thymidine phosphorylase in cancer development andchemotherapy,” Medicinal Research Reviews, vol. 29, no. 6, pp.903–953, 2009.
[60] S. Liekens, A. Bronckaers, M.-J. Perez-Perez, and J. Balzarini,“Targeting platelet-derived endothelial cell growth factor/thymidine phosphorylase for cancer therapy,” BiochemicalPharmacology, vol. 74, no. 11, pp. 1555–1567, 2007.
[61] L. Wang, X. Huang, Y. Chen, X. Jin, Q. Li, and T. N. Yi,“Prognostic value of TP/PD-ECGF and thrombocytosis ingastric carcinoma,” European Journal of Surgical Oncology, vol.38, no. 7, pp. 568–573, 2012.

12 BioMed Research International
[62] G. P. Dunn, C. M. Koebel, and R. D. Schreiber, “Interfer-ons, immunity and cancer immunoediting,” Nature ReviewsImmunology, vol. 6, no. 11, pp. 836–848, 2006.
[63] Z. V. Fong and J. M. Winter, “Biomarkers in pancreatic cancer:diagnostic, prognostic, and predictive,” Cancer Journal, vol. 18,no. 6, pp. 530–538, 2012.

Submit your manuscripts athttp://www.hindawi.com
PainResearch and TreatmentHindawi Publishing Corporationhttp://www.hindawi.com Volume 2014
The Scientific World JournalHindawi Publishing Corporation http://www.hindawi.com Volume 2014
Hindawi Publishing Corporationhttp://www.hindawi.com
Volume 2014
ToxinsJournal of
VaccinesJournal of
Hindawi Publishing Corporation http://www.hindawi.com Volume 2014
Hindawi Publishing Corporationhttp://www.hindawi.com Volume 2014
AntibioticsInternational Journal of
ToxicologyJournal of
Hindawi Publishing Corporationhttp://www.hindawi.com Volume 2014
StrokeResearch and TreatmentHindawi Publishing Corporationhttp://www.hindawi.com Volume 2014
Drug DeliveryJournal of
Hindawi Publishing Corporationhttp://www.hindawi.com Volume 2014
Hindawi Publishing Corporationhttp://www.hindawi.com Volume 2014
Advances in Pharmacological Sciences
Tropical MedicineJournal of
Hindawi Publishing Corporationhttp://www.hindawi.com Volume 2014
Medicinal ChemistryInternational Journal of
Hindawi Publishing Corporationhttp://www.hindawi.com Volume 2014
AddictionJournal of
Hindawi Publishing Corporationhttp://www.hindawi.com Volume 2014
Hindawi Publishing Corporationhttp://www.hindawi.com Volume 2014
BioMed Research International
Emergency Medicine InternationalHindawi Publishing Corporationhttp://www.hindawi.com Volume 2014
Hindawi Publishing Corporationhttp://www.hindawi.com Volume 2014
Autoimmune Diseases
Hindawi Publishing Corporationhttp://www.hindawi.com Volume 2014
Anesthesiology Research and Practice
ScientificaHindawi Publishing Corporationhttp://www.hindawi.com Volume 2014
Journal of
Hindawi Publishing Corporationhttp://www.hindawi.com Volume 2014
Pharmaceutics
Hindawi Publishing Corporationhttp://www.hindawi.com Volume 2014
MEDIATORSINFLAMMATION
of
Copyright © 2022 FDOKUMEN