Novel Detection and Treatment Strategies for Pancreatic ...
338
University of Nebraska Medical Center University of Nebraska Medical Center DigitalCommons@UNMC DigitalCommons@UNMC Theses & Dissertations Graduate Studies Spring 5-9-2020 Novel Detection and Treatment Strategies for Pancreatic Ductal Novel Detection and Treatment Strategies for Pancreatic Ductal Adenocarcinoma Adenocarcinoma Joseph Carmicheal University of Nebraska Medical Center Follow this and additional works at: https://digitalcommons.unmc.edu/etd Part of the Diagnosis Commons, and the Therapeutics Commons Recommended Citation Recommended Citation Carmicheal, Joseph, "Novel Detection and Treatment Strategies for Pancreatic Ductal Adenocarcinoma" (2020). Theses & Dissertations. 429. https://digitalcommons.unmc.edu/etd/429 This Dissertation is brought to you for free and open access by the Graduate Studies at DigitalCommons@UNMC. It has been accepted for inclusion in Theses & Dissertations by an authorized administrator of DigitalCommons@UNMC. For more information, please contact [email protected].
-
Upload
khangminh22 -
Category
Documents
-
view
3 -
download
0
Transcript of Novel Detection and Treatment Strategies for Pancreatic ...

University of Nebraska Medical Center University of Nebraska Medical Center
DigitalCommons@UNMC DigitalCommons@UNMC
Theses & Dissertations Graduate Studies
Spring 5-9-2020
Novel Detection and Treatment Strategies for Pancreatic Ductal Novel Detection and Treatment Strategies for Pancreatic Ductal
Adenocarcinoma Adenocarcinoma
Joseph Carmicheal University of Nebraska Medical Center
Follow this and additional works at: https://digitalcommons.unmc.edu/etd
Part of the Diagnosis Commons, and the Therapeutics Commons
Recommended Citation Recommended Citation Carmicheal, Joseph, "Novel Detection and Treatment Strategies for Pancreatic Ductal Adenocarcinoma" (2020). Theses & Dissertations. 429. https://digitalcommons.unmc.edu/etd/429
This Dissertation is brought to you for free and open access by the Graduate Studies at DigitalCommons@UNMC. It has been accepted for inclusion in Theses & Dissertations by an authorized administrator of DigitalCommons@UNMC. For more information, please contact [email protected].

1
Novel Detection and Treatment Strategies for
Pancreatic Ductal Adenocarcinoma
By
Joseph J. Carmicheal
A DISSERTATION
Presented to the Faculty of
the University of Nebraska Graduate College
in Partial Fulfillment of the Requirements
for the Degree of Doctor of Philosophy
Biochemistry and Molecular Biology Graduate Program
Under the Supervision of Professor Dr. Surinder K. Batra
University of Nebraska Medical Center
Omaha, Nebraska
March 2020
Supervisory Committee:
Jason Foster M.D.
Sukhwinder Kaur Ph.D.
Chi Lin M.D. Ph.D.
David Lyden M.D. Ph.D.
Michel Ouellette Ph.D.

2
Novel Detection and Treatment Strategies for Pancreatic Ductal Adenocarcinoma
Joseph Carmicheal, Ph.D.
University of Nebraska Medical Center, 2020
Advisor: Surinder K. Batra
Pancreatic ductal adenocarcinoma (PDAC) is one of the most lethal malignancies
with an estimated 5-year survival rate of less than 9%. The high lethality of PDAC is due
to two primary reasons: the discovery of PDAC at later stages, with locally invasive or
metastatic disease present at the time of initial diagnosis as well as the lack of efficacious
therapeutic interventions that significantly impact survival. In this dissertation, we sought
to discover and test novel detection and treatment strategies for PDAC. Firstly, serum EVs
were investigated as potential non-invasive liquid biopsy biomarkers, to serve as a means
of early cancer detection. Secondly, a recently discovered form of cell death, ferroptosis,
was investigated as a means of potentiating radiation therapy.
The investigation into the potential of extracellular vesicles (EVs) as circulating
biomarkers began with a label-free analysis of EVs via surface-enhanced Raman
Spectroscopy (SERS) and principal component discriminant function analysis (PC-DFA),
to identify tumor-specific spectral signatures. This method differentiated EVs originating
from PDAC or normal pancreatic epithelial cell lines with 90% overall accuracy. The
proof-of-concept application of this method to EVs purified from patient serum exhibited
up to 87% and 90% predictive accuracy for healthy control and early PDAC individual
samples, respectively. The specific EV surface proteins that may contribute to the observed
SERS differences were investigated via surface shaving LC-MS/MS. This analysis
provided protein targets that were selected and validated with a combination of
3
bioinformatics, western blot, and immunogold labeling techniques. The first target protein
selected for assessment via ELISA, EPHA2, showed elevated expression in complete
cancer patient serum as compared to benign controls. Further, EV specific EPHA2
expression was capable of predicting cancer status in 25% (5/20) of the patient samples
with 100% specificity. These data suggest a potential role of EV surface profiling for the
early detection of PDAC. However, further work is required to increase the overall
accuracy.
Additionally, we sought to investigate the involvement of ferroptosis, in radiation-
induced cell death. Ferroptosis is a non-apoptotic form of cell death that requires labile
ferrous iron (Fe2+) and is caused by the reactive oxygen species (ROS) mediated build-up
of lipid hydroperoxides. Further, we tested if the pharmaceutical induction of ferroptosis
via the small molecule Erastin can potentiate the lethal effects of radiation in vitro and in
vivo. We observed that radiation produces an increase in ROS and free Fe2+ leading to lipid
hydroperoxidation, which was enhanced with the addition of Erastin culminating in the
likely induction of ferroptosis. The combination of radiation and Erastin synergistically
increased cell death in monocultures and patient-derived organoids as well as significantly
reduced tumor size in xenograft mouse models. These findings suggest the potential of
ferroptosis induction to improve radiation therapy, though specific mechanistic
components require further evaluation. Therefore, further studies must be conducted to
elucidate the specific role of ferroptosis in radiation-induced cell death.
The combination of early detection and novel therapeutic intervention strategies
offers a means of improving the survival of those with this dreaded disease.
4
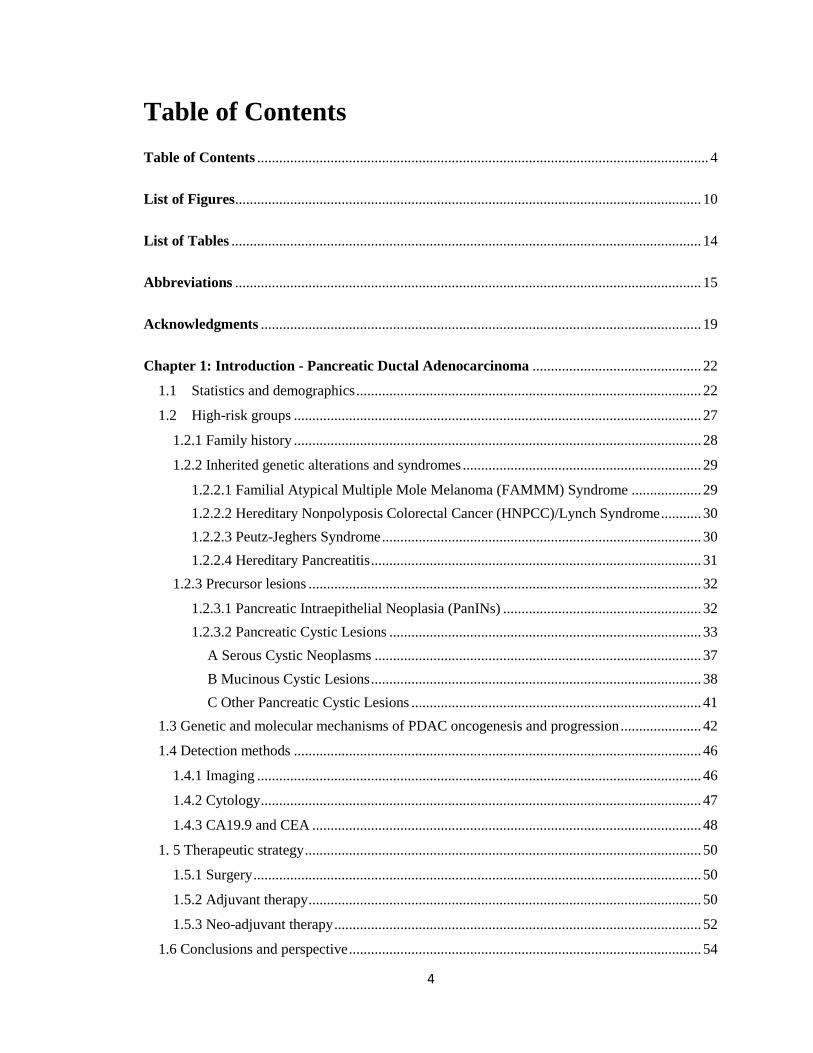
Table of Contents Table of Contents ........................................................................................................................... 4
List of Figures ............................................................................................................................... 10
List of Tables ................................................................................................................................ 14
Abbreviations ............................................................................................................................... 15
Acknowledgments ........................................................................................................................ 19
Chapter 1: Introduction - Pancreatic Ductal Adenocarcinoma .............................................. 22
1.1 Statistics and demographics .............................................................................................. 22
1.2 High-risk groups ............................................................................................................... 27
1.2.1 Family history ............................................................................................................... 28
1.2.2 Inherited genetic alterations and syndromes ................................................................. 29
1.2.2.1 Familial Atypical Multiple Mole Melanoma (FAMMM) Syndrome ................... 29
1.2.2.2 Hereditary Nonpolyposis Colorectal Cancer (HNPCC)/Lynch Syndrome ........... 30
1.2.2.3 Peutz-Jeghers Syndrome ....................................................................................... 30
1.2.2.4 Hereditary Pancreatitis .......................................................................................... 31
1.2.3 Precursor lesions ........................................................................................................... 32
1.2.3.1 Pancreatic Intraepithelial Neoplasia (PanINs) ...................................................... 32
1.2.3.2 Pancreatic Cystic Lesions ..................................................................................... 33
A Serous Cystic Neoplasms ......................................................................................... 37
B Mucinous Cystic Lesions .......................................................................................... 38
C Other Pancreatic Cystic Lesions ............................................................................... 41
1.3 Genetic and molecular mechanisms of PDAC oncogenesis and progression ...................... 42
1.4 Detection methods ............................................................................................................... 46
1.4.1 Imaging ......................................................................................................................... 46
1.4.2 Cytology ........................................................................................................................ 47
1.4.3 CA19.9 and CEA .......................................................................................................... 48
1. 5 Therapeutic strategy ............................................................................................................ 50
1.5.1 Surgery .......................................................................................................................... 50
1.5.2 Adjuvant therapy ........................................................................................................... 50
1.5.3 Neo-adjuvant therapy .................................................................................................... 52
1.6 Conclusions and perspective ................................................................................................ 54

5
Chapter 2: Methods ..................................................................................................................... 61
2.1 Cell Culture .......................................................................................................................... 61
2.2 Immunoblotting.................................................................................................................... 61
2.3 Statistical Methods ............................................................................................................... 62
2A Extracellular vesicle surfaceome characterization for the early detection of pancreatic
ductal adenocarcinoma ................................................................................................................ 62
2A.1 EV isolation from cell medium and serum ....................................................................... 62
2A.2 FiberCell ........................................................................................................................... 63
2A.3 Transmission Electron Microscopy (TEM) ...................................................................... 66
2A.4 Immunogold ...................................................................................................................... 66
2A.5 Atomic Force Microscopy (AFM) .................................................................................... 69
2A.6 Nanoparticle Tracking Analysis (NTA) ............................................................................ 72
2A.7 SERS Measurement .......................................................................................................... 72
2A.8 SERS spectra processing and Principal Component –Discriminant Function .................. 73
Analysis ..................................................................................................................................... 73
2A.9 EV surface proteomics ...................................................................................................... 73
2A.10 Bioinformatics Pipeline ................................................................................................... 74
2A.11 Sandwich enzyme-linked immunosorbent assay (ELISA).............................................. 75
2A.12 Lectin array ..................................................................................................................... 75
2A.13 Isolation of genomic DNA from EVs ............................................................................. 76
2A.14 Mutation detection by digital droplet polymerase chain reaction (ddPCR) .................... 76
2B Radiation Potentiation via Ferroptosis for the improved treatment of pancreatic ductal
adenocarcinoma ........................................................................................................................... 77
2B.1 Bioinformatics ................................................................................................................... 77
2B.2 MTT .................................................................................................................................. 78
2B.3 In vitro cell migration assay .............................................................................................. 78
2B.4 Immunohistochemical staining of human tissues .............................................................. 78
2B.5 siRNA knockdown and transient transfection ................................................................... 79
2B.6 In vitro irradiation ............................................................................................................. 80
2B.7 In vitro radiation response determination .......................................................................... 80
2B.8 Combenefit analysis .......................................................................................................... 81
2B.9 Patient-derived organoids .................................................................................................. 81
2B.10 Patient derived organoid radiation response determination ............................................ 82
6
2B.11 In vivo orthotopic xenograft model ................................................................................. 83
2B.12 Treatment plan and experimental design ......................................................................... 83
2B.13 Glutathione assay ............................................................................................................ 84
2B.14 Measurement of reactive oxygen species production ...................................................... 84
2B.15 Intracellular free iron (Fe2+) assessment via FeRhoNox™-1 .......................................... 87
2B.16 In vitro assessment of lipid peroxidation via BODIPY™ 581/591 C11 ......................... 87
2B.17 Thiobarbituric acid reactive substances (TBARS) assay ................................................ 88
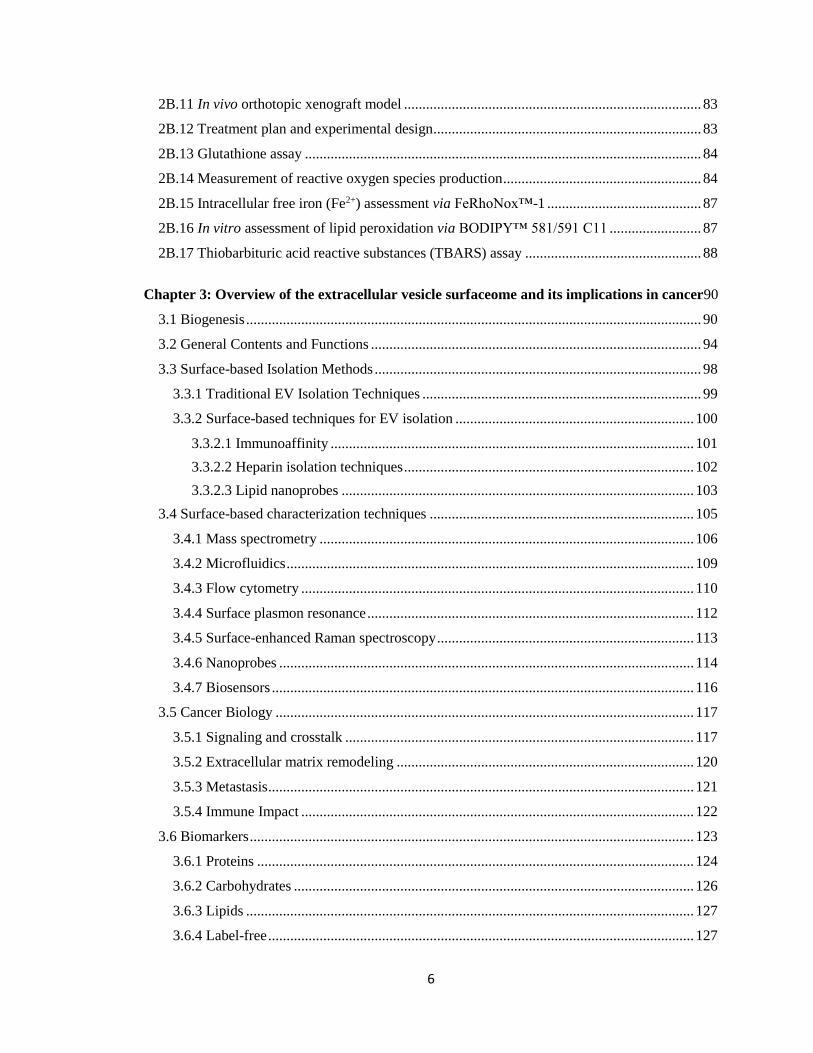
Chapter 3: Overview of the extracellular vesicle surfaceome and its implications in cancer90
3.1 Biogenesis ............................................................................................................................ 90
3.2 General Contents and Functions .......................................................................................... 94
3.3 Surface-based Isolation Methods ......................................................................................... 98
3.3.1 Traditional EV Isolation Techniques ............................................................................ 99
3.3.2 Surface-based techniques for EV isolation ................................................................. 100
3.3.2.1 Immunoaffinity ................................................................................................... 101
3.3.2.2 Heparin isolation techniques ............................................................................... 102
3.3.2.3 Lipid nanoprobes ................................................................................................ 103
3.4 Surface-based characterization techniques ........................................................................ 105
3.4.1 Mass spectrometry ...................................................................................................... 106
3.4.2 Microfluidics ............................................................................................................... 109
3.4.3 Flow cytometry ........................................................................................................... 110
3.4.4 Surface plasmon resonance ......................................................................................... 112
3.4.5 Surface-enhanced Raman spectroscopy ...................................................................... 113
3.4.6 Nanoprobes ................................................................................................................. 114
3.4.7 Biosensors ................................................................................................................... 116
3.5 Cancer Biology .................................................................................................................. 117
3.5.1 Signaling and crosstalk ............................................................................................... 117
3.5.2 Extracellular matrix remodeling ................................................................................. 120
3.5.3 Metastasis .................................................................................................................... 121
3.5.4 Immune Impact ........................................................................................................... 122
3.6 Biomarkers ......................................................................................................................... 123
3.6.1 Proteins ....................................................................................................................... 124
3.6.2 Carbohydrates ............................................................................................................. 126
3.6.3 Lipids .......................................................................................................................... 127
3.6.4 Label-free .................................................................................................................... 127

7
3.7 Therapy .............................................................................................................................. 128
3.7.1 The endogenous EV surface ....................................................................................... 129
3.7.2 Functionalized the EV surface .................................................................................... 129
3.7.3 Targeting the EV surface ............................................................................................ 131
3.8 Conclusion and perspective ............................................................................................... 131
Chapter 4: Extracellular vesicle surfaceome characterization for the early detection of
pancreatic ductal adenocarcinoma ........................................................................................... 134
4A Label-free characterization of extracellular vesicles via Raman spectroscopy .............. 134
4A.1 Synopsis .......................................................................................................................... 134
4A.2 Background and Rationale .............................................................................................. 134
4A.3 Results ............................................................................................................................. 138
4.3.1 EVs of appropriate size can be isolated from cell line conditioned media ................. 138
4.3.2 Isolated EVs maintain morphological characteristics ................................................. 141
4.3.3 EV consensus marker validation and substrate distribution assessment ..................... 141
4.3.4 Surface-enhanced Raman spectroscopy (SERS) spectral shifts from EVs are predicated
on the cell type of origin. ..................................................................................................... 146
4.3.5 EV SERS spectra are highly reproducible .................................................................. 149
4.3.6 Principal Component - Discriminant Function Analyses can discriminate between
PDAC and normal cell line EV SERS spectra with high accuracy ...................................... 152
4.3.7 EVs can be isolated from patient sera and are elevated in cancer patient samples
compared to benign controls ................................................................................................ 159
4.3.8 The cell line trained PC-DFA algorithm can be applied to SERS spectra of serum EVs
to predict patient cancer status ............................................................................................. 159
4.4 Discussion .......................................................................................................................... 164
4.5 Conclusions and future directions ...................................................................................... 168
4B: Biomarker discovery via extracellular vesicle surface profiling ..................................... 170
4B.1 Synopsis .......................................................................................................................... 170
4B.2 Background and rationale ................................................................................................ 170
4B.3 Results ............................................................................................................................. 172
4B.3.1 LC-MS/MS EV surface proteomic profiling identifies proteins of interest pool ..... 172
4B.3.2 Bioinformatics discernment of eight specific target EV surface proteins ................ 177
4B.3.2.1 Proteins of interest gene expression in adjacent normal and PDAC tissues .... 177
4B.3.2.2 Target genes are correlated in two distinct datasets ......................................... 177
4B.3.2.3 Target protein genes have high diagnostic accuracy ........................................ 180

8
4B.3.3 All target proteins are present in greater concentrations in EVs from PDAC cell lines
compared to those from HPDE ............................................................................................ 185
4B.3.4 EPHA2, ECM1, CD151, and HSPB1 are verifiably present on the EV surface ...... 190
4B.3.5 EPHA2, ECM1, CD151, and HSPB1 expression in TCGA and effects on survival 190
4B.3.6 EPHA2 is present on CD63 positive EVs and is reliably detected with ELISA ...... 195
4B.3.7 EPHA2 is increased on EVs originating from PDAC cell lines compared to HPDE
cells ...................................................................................................................................... 200
4B.3.8 Complete PDAC patient serum has a greater concentration of EPHA2 compared to
healthy controls .................................................................................................................... 200
4B.3.9 EV surface EPHA2 evaluation is more specific than complete serum EPHA2 levels
for predicting patient cancer status ...................................................................................... 205
4B.4 Discussion ....................................................................................................................... 205
4B.5 Conclusions and future directions ................................................................................... 209
Chapter 5: Radiation potentiation via ferroptosis for the improved treatment of pancreatic
ductal adenocarcinoma .............................................................................................................. 217
5.1 Synopsis ............................................................................................................................. 217
5.2 Background and rationale .................................................................................................. 218
5.3 Results ................................................................................................................................ 222
5.3.1 GPX4 and SLC7A11 are differentially expressed in pancreas cancer ........................ 222
5.3.2 SLC7A11 protein expression is increased in the majority of PDAC cell lines compared
to HPDE ............................................................................................................................... 227
5.3.3 Most PDAC cell lines are more sensitive to Erastin than HPDE ................................ 232
5.3.4 Erastin inhibits cellular migration ............................................................................... 237
5.3.5 Erastin treatment decreases intracellular GSH ............................................................ 237
5.3.6 Radiation promotes GPX4, SLC7A11 expression and the phosphorylation of NRF2 in
vitro ...................................................................................................................................... 242
5.3.7 SLC7A11 is increased in PDAC and radiated patient tissues ..................................... 243
5.3.8 SLC7A11 gene expression is significantly correlated with survival in radiated patients
............................................................................................................................................. 243
5.3.9 GPX4 knockdown sensitizes cells to radiation-induced cell death in vitro ................ 250
5.3.10 Erastin and radiation synergistically induce cell death ............................................. 250
5.3.11 Combination radiation and erastin treatment-induced cell death is mitigated with the
addition of Ferrostatin-1 ...................................................................................................... 258
5.3.12 Erastin potentiates radiation-induced cell death in patient-derived organoids ......... 261
5.3.13 Erastin potentiates radiation treatment in vivo .......................................................... 264
5.3.14 Radiation increases intracellular reactive oxygen species (ROS) ............................. 264

9
5.3.15 Combination treatment causes lipid peroxidation in vitro ........................................ 269
5.3.16 Radiation increases intracellular free iron (Fe2+) ...................................................... 269
5.3.17 Lipid peroxidation can be measured in radiated PDAC patient serum samples ....... 276
5.4 Discussion .......................................................................................................................... 281
5.5 Conclusions and future directions ...................................................................................... 284
Chapter 6: General conclusions and future directions ........................................................... 286
Chapter 7: References ............................................................................................................... 302

10
List of Figures
Chapter 1
Figure 1. 1 SEER database overall survival for PDAC patients from 1992-2016 ........... 23
Figure 1. 2 Organ system distribution of new cancer incidences and deaths in 2019. .... 25
Figure 1. 3 Chart depiction of pancreatic cystic lesion types. ......................................... 35
Figure 1. 4 Survival of SEER patients (1992-2016) treated with currently available
therapies. ........................................................................................................................... 56
Chapter 2
Figure 2A. 1 Isolation of EVs via density gradient ultracentrifugation. .......................... 64
Figure 2A. 2 FiberCell Systems® high-density hollow-fiber bioreactor system. ........... 67
Figure 2A. 3 Schematic of the immunogold TEM staining protocol............................... 70
Figure 2B. 1 Small animal radiation machine and treatment planning ............................ 85
Chapter 3
Figure 3. 1 Mechanisms of EV biogenesis and secretion ................................................ 91
Figure 3. 2 EV surface and intravesicular content ........................................................... 95
Chapter 4
Figure 4A. 1 Nanoparticle Tracking Analysis of cell line EVs ..................................... 139
Figure 4A. 2 TEM images of EVs isolated from conditioned media ............................ 142
Figure 4A. 3 EV surface marker validation and substrate distribution verification ...... 144
Figure 4A. 4 SERS spectra of cell line EVs .................................................................. 147

11
Figure 4A. 5 Repeated SERS spectra collections from cell line EVs and gold
nanoparticles ................................................................................................................... 150
Figure 4A. 6 Principal component analysis of cell line SERS spectra .......................... 153
Figure 4A. 7 Discriminant functional analysis of SERS generated principal components
......................................................................................................................................... 155
Figure 4A. 8 Serum isolated EV quantification via protein concentration .................... 160
Figure 4A. 9 Morphological validation of EVs isolated from patient serum ................ 162
Figure 4B. 1 Gene ontology pathway analysis of EV surface proteins ......................... 173
Figure 4B. 2 Identification of cancer EV surface proteins of interest ........................... 175
Figure 4B. 3 Gene expression profiles for EV proteins of interest ................................ 178
Figure 4B. 4 Correlation of target proteins in two distinct datasets .............................. 181
Figure 4B. 5 Receiver operator characteristics curve of the eight target protein genes 183
Figure 4B. 6 Evaluation of consensus EV markers via western blot analysis ............... 186
Figure 4B. 7 Evaluation of EV surface target proteins via western blot ....................... 188
Figure 4B. 8 Immunogold staining of EV surface proteins ........................................... 191
Figure 4B. 9 EPHA2, ECM1, CD151, and HSPB1 expression in TCGA and effects on
survival ............................................................................................................................ 193
Figure 4B. 10 EPHA2 expression in cancer vs. normal tissue across major cancer types
......................................................................................................................................... 196
Figure 4B. 11 EPHA2 ELISA of CD63 positive EVs ................................................... 198
Figure 4B. 12 EPHA2 ELISA of PDAC and HPDE cell lines ...................................... 201
Figure 4B. 13 EPHA2 ELISA of complete patient serum samples ............................... 203
Figure 4B. 14 EPHA2 ELISA of patient seromic EVs .................................................. 206
Figure 4B. 15 Preliminary lectin array of CD18/HPAF and HPDE EVs ...................... 211
Figure 4B. 16 Digital droplet PCR analysis of cell line EVs ......................................... 213

12
Chapter 5
Figure 5. 1 Schematic of Erastin induced ferroptosis .................................................... 220
Figure 5. 2 GPX4 expression in pancreas cancer compared to normal and relative to
cancers of various origin ................................................................................................. 223
Figure 5. 3 SLC7A11 expression in pancreas cancer compared to normal and relative to
cancers of various origin ................................................................................................. 225
Figure 5. 4 GPX4 and SLC7A11 expression and survival in the TCGA PDAC cohort 228
Figure 5. 5 GPX4 and SLC7A11 protein expression in PDAC cell lines ...................... 230
Figure 5. 6 Project DRIVE analysis of RNAi SLC7A11 knockdown in PDAC cell lines
......................................................................................................................................... 233
Figure 5. 7 Erastin MTT survival curves in PDAC cell lines and HPDE ...................... 235
Figure 5. 8 Erastin impact on CD18/HPAF migration .................................................. 238
Figure 5. 9 Erastin depletion of glutathione ................................................................... 240
Figure 5. 10 mRNA and protein analysis of PDAC cell lines after radiation ................ 244
Figure 5. 11 GPX4 and SLC7A11 protein expression in patient tissue samples ........... 246
Figure 5. 12 SLC7A11 survival of radiated PDAC patients in TCGA .......................... 248
Figure 5. 13 Impact of GPX4 knockdown on CD18/HPAF and Panc1 survival in the
setting of radiation .......................................................................................................... 251
Figure 5. 14 Response of CD18/HPAF and Panc1 to combination radiation and Erastin
treatment ......................................................................................................................... 254
Figure 5. 15 Direct comparison between CD18/HPAF and Panc1 of response to 1 µM
and 2 µM Erastin with 5Gy radiation treatment ............................................................. 256
Figure 5. 16 the lethal effects of radiation and Erastin combination are synergistic ..... 259
Figure 5. 17 Effect of combination treatment in the setting of apoptosis, necroptosis, or
ferroptosis inhibition ....................................................................................................... 262
Figure 5. 18 Response of patient-derived organoids to combination treatment ............ 265

13
Figure 5. 19 Effect of Erastin and radiation in an orthotopic PDAC murine model ..... 267
Figure 5. 20 Radiation production of reactive oxygen species (ROS) ........................... 270
Figure 5. 21 Effect of combination therapy on lipid peroxidation in CD18/HPAF cells
......................................................................................................................................... 272
Figure 5. 22 Effect of combination therapy on lipid peroxidation in Panc1 cells ......... 274
Figure 5. 23 Effect of treatment on intracellular free iron (Fe2+)................................... 277
Figure 5. 24 Malondialdehyde (MDA) assessment in radiation patient samples .......... 279
Figure 5. 25 Schematic of the proposed mechanism for Erastin potentiation of radiation
via ferroptosis.................................................................................................................. 282

14
List of Tables
Chapter 4
Table 4A. 1 Prediction of cell line cancer status via SERS PC-DFA ............................ 157
Table 4A. 2 Application of cell line PC-DFA algorithm on SERS of EVs isolated from
patient serum ................................................................................................................... 165

15
Abbreviations
5-FU 5-Fluorouracil
AF4 asymmetric flow field-flow fractionation
AFM – Atomic Force Microscopy
ASCO – American Society of Clinical Oncology
AUC - Area Under Curve
AuNPs – Gold Nanoparticles
BSA - Bovine Serum Albumin
CEA – Carcinoembryonic Antigen
CT – Computerized Tomography
D/I - Death to Incidence Ratio
DNA – Deoxyribonucleic Acid
EBRT – External Beam Radiation Therapy
ECM – Extracellular Matrix
ESCRT – Endosomal Complex Responsible for Transport
EUS – Endoscopic Ultrasound
EV – Extracellular Vesicle
FBS – Fetal Bovine Serum
FNA – Fine Needle Aspirate
GLC - Gas Liquid Chromatography
GPX4- Glutathione Peroxidase 4
GSH - Glutathione

16
Gy - Gray
HA - Hyaluronic Acid
HFBR - Hollow Fiber Bioreactor
hFC - High-Resolution Flow Cytometry
HSPG – Heparin Sulfate Proteoglycan
IHC - Immunohistochemistry
ILV – Intraluminal Vesicle
IPMN – Intraductal Papillary Mucinous Neoplasm
kDA - kilo Dalton
KO - knock out
LC-MS/MS – Liquid Chromatography-Tandem Mass Spectrometry
LEC - Lymphoendothelial Cysts
mAB monoclonal antibodies
MCN – Mucinous Cystic Neoplasm
MDA - Malondialdehyde
miRNA - MicroRNA
MRI – Magnetic Resonance Imaging
mRNA – Messenger RNA
MSI - Microsatellite Instability
MTT - 3-(4,5-Dimethylthiazol-2-yl)-2,5-diphenyltetrazolium bromide
MVB – Multivesicular Body
NCCN – Nation Clinical Cancer Network
NTA – Nanoparticle Tracking Analysis

17
PanIN – Pancreatic Intraepithelial Neoplasia
PBA - Proximity Dependent Barcoding Assay
PBS – Phosphate Buffered Saline
PCA – Principal Component Analysis
PD-DFA – Principal Component Discriminant Function Analysis
PCL – Pancreatic Cystic Lesion
PCR – Polymerase Chain Reaction
PDAC – Pancreatic Ductal Adenocarcinoma
PJS - Peutz Jeghers Syndrome
PNEN – Pancreatic Neuroendocrine Neoplasms
PS - Phosphatidyl Serine
RIPA - Radio immunoprecipitation Assay Buffer
RNA – Ribonucleic Acid
ROS – Reactive Oxygen Species
RT - Room Temperature
SBRT – Stereotactic Body Radiation Therapy
SCA - Serous Cystadenomas
SCN – Serous Cystic Neoplasm
SEC - Size Exclusion Chromatography
SEM – Scanning Electron Microscopy
SERS – Surface-Enhanced Raman Spectroscopy
SMA - Serous microcystic Adenoma
SPR – Surface Plasmon Resonance

18
TBARS - Thiobarbituric Acid Reactive Substances
TEM – Transmission Electron Microscopy
TLC - Thin layer chromatography
TME – Tumor Microenvironment
UC - Ultracentrifugation

19
Acknowledgments
I would like to thank my Ph.D. mentor Dr. Surinder K. Batra for his mentorship,
guidance, and coaching throughout the duration of my training. When I initially inquired
into joining his lab he accepted me with unwavering support. He gave me a chance that
few others would have and for that, I am extremely grateful. He has allowed me to test
hypotheses of my own design and has supported me the entirety of the way. His ever-
present encouragement and unrelenting determinism for fellowship applications and paper
submission have been invaluable to my success. Above all, his concern for my welfare
outside of the lab was deeply moving and provided me with the confidence that he will
make every effort to do what is best for me and my future.
I would also like to thank Dr. Sukhwinder Kaur for her day-to-day mentorship and
for serving on my supervisory committee. She was always available whenever a technical
or theoretical issue needed to be addressed and provided her years of expertise in biomarker
research to my studies. She was always present when I needed help in navigating the world
of science, publications, and presentations. For that and many other reasons, I thank her.
I would also like to thank the other members of my supervisory committee Dr.
Jason Foster, Dr. Chi Lin, Dr. David Lyden, and Dr. Michel Ouellette for their suggestions,
criticisms, and encouragement throughout this process.
I would like to extend my appreciation to all the members of the Batra lab, past and
present, with whom I have had daily interactions and shared a workspace. These
interactions helped shape my science and I learned a great deal from the other students,
postdocs, instructors, and professors. Specifically, I would like to thank Dr. Alexey
Krasnoslobodtsev, Dr. Maneesh Jain, Dr. Moorthy P. Ponnusamy, Dr. Sushil Kumar, Dr.

20
Parthasarathy Seshacharyulu, Dr. Satyanarayana Rachagani, and Dr. Imayavaramban
Lakshmanan for their willingness and ability to offer guidance and help when asked. My
sincere thanks also go to Dr. Wade Junker, Dr. Prakash Kshirsagar, Dr. Abhijit Aithal, Dr.
Shailendra Gotham, Dr. Sakthivel, Dr. Samy Ponnusamy, Dr. Rakesh Bhatia, Dr. Jawed
Siddiqui, Dr. Raghupathy Vengoji, Dr. Sanjib Chaudhary, Dr. Ramesh Pothuraju, and Dr.
Ashu Shah for giving advice and suggestion over this period. My warm thanks and
gratitude go to Karen, Amy, Jeanette, Coleen, and April for all their help and support they
provided during my graduate training.
I would like to extend a special thank you to the friends I have made during my
time in graduate school. Specifically Andrew Cannon, Christopher Thompson, Rahat
Jahan, Koelina Ganguly, and Pranita Atri. These are the people with whom I have
interacted with the most and have put up with my antics daily. The life of a graduate
student is tough and without individuals helping you get through it, the chances of success
are greatly diminished. They have been integral to the completion of my degree and
provided a stress outlet through comedy, banter, and theoretical whimsy.
I am indebted to my parents, Mark and Tamara Carmicheal, whose sacrifices and
parenting made it possible for me to even contemplate this career path, let alone see it
through to fruition. Them, along with my siblings Cory, Talia, and Laura have always been
there to support me in every stage of life. I have never given up on myself because they
have never given up on me. Finally, my wife Cassandra is my partner in life and best friend.
Without her, none of this would be possible. Her patience, strength, resilience, and grace
are the cause of me being where I am today. For that, I will be eternally grateful and will
strive to do the same for her.

21
Chapter 1: Introduction
Pancreatic Ductal Adenocarcinoma
Portions of the content covered in this chapter are the subject of a published
article in Biochim Biophys Acta Rev Cancer by Carmicheal et al. 1.

22
Chapter 1: Introduction - Pancreatic Ductal Adenocarcinoma
1.1 Statistics and demographics
Pancreatic ductal adenocarcinoma (PDAC) is a devastatingly lethal disease with a
five-year survival of 9% 2. The patients in the SEER database (1992-2016) have even worse
mortality ranging from 28.2% of patients remaining alive one year after diagnosis down to
only 6.2% at the five-year time-point (Figure 1.1). It is currently the third leading cause of
cancer-related death and is projected to replace colon cancer as the second leading cause
within the next decade 3. In fact, the mortality rate of PDAC is one of the highest out of
all major cancer types including those with the greatest number of total patient deaths such
as lung, colorectal, breast, and prostate 2. While the incidence of PDAC is not as high as
many of the other major cancer types at 56,770 in 2019, the number of deaths occurring
during this same time totaled 45,750, leading to a shockingly high death to incidence (D/I)
ratio. Where lung, colorectal, breast, and prostate cancers have D/I ratios of 0.63, 0.51,
0.16, and 0.18 respectively, the ratio associated with PDAC is the worst at 0.81 2 (Figure
1.2).
Unfortunately, the early stages of PDAC typically are asymptomatic in nature.
Further confounding diagnosis of this disease is the fact that when symptoms are present,
they are often transient or intermittent, as well as frequently mild and quite ambiguous. For
example, nausea, lethargy, and abdominal pain 4. When patients do start to experience more
serious symptoms including jaundice, weight loss (cachexia), and migratory phlebitis the
disease has often advanced to later (and more lethal) stages. Later stage presentation with
greater disease burden comes with an inherent increase in the probability of local invasion
at the primary site preventing surgical resection (currently the only means of curative

23
Figure 1. 1 SEER database overall survival for PDAC patients from 1992-2016
The overall survival trend observed within the SEER database for the PDAC population
who underwent surgery and chemotherapy treatments was 28.2% at one year, 13.1% at two
years, 9.0% at three years, 7.2% at four years, and 6.2% at 5 years.

24
Figure 1.1

25
Figure 1. 2 Organ system distribution of new cancer incidences and deaths in 2019.
A. Estimated incidences of major cancer types along with the estimated number of deaths
caused by that cancer during the same one year time period. The death to incidence ratio is
presented in panel B. Notably, PDAC has the worst overall ratio among all the cancers.
(Numbers sourced from Siegel RL, Miller KD, Jemal A. Cancer statistics, 2019. CA
Cancer J Clin. 2019;69(1):7-34.).

26
Figure 1.2
A
B
27
therapy available) as well as the prevalence of metastasis. Further, it confers a diminished
probability that adjuvant treatment options, such as chemotherapy, will be efficacious.
1.2 High-risk groups
Like many other cancers, the general risk of developing pancreatic cancer depends
on a variety of controllable and non-controllable factors. Some of the controllable clinical
factors which confer an increased risk of PDAC include tobacco use, being overweight,
long-standing Diabetes Mellitus Type II, and chronic pancreatitis arising from poor diet
and/or heavy alcohol use 5-9. Conversely, many uncontrollable factors are present such as
age, gender, race, chronic pancreatitis resulting from a genetic abnormality, family history,
inherited genetic syndrome, and those with pancreatic cancer precursor lesions 10.
However, it is worth noting that the sudden onset of diabetes after the age of 50 is highly
correlated with the presence of PDAC and not merely an increase in risk 11.
Only some of these groups confer an increased level of risk large enough, relative
to the extremely low incidence of PDAC in the general population, to merit identification
as a high-risk group; that is, only those groups of patients with a greater than 5% lifetime
risk, or an increased relative risk >5, are considered high-risk as suggested by the
International Cancer of the Pancreas Screening (CAPS) consortium meeting 12. Along with
that, the American College of Gastroenterology has recently published clinical guidelines
regarding the classification of high-risk groups, which ones require continuous
surveillance, and exactly what that surveillance entails 13. The six recommendations
pertaining to PDAC screening and continual surveillance are summarized as follows: 1.
Warranted for hereditary syndromes associated with PDAC; 2. Should be conducted at an
experienced center with a multidisciplinary approach; 3. It should be conducted via EUS

28
or MRI and not CT; 4. Begin at 50 years of age or 10 years prior to the earliest age of
familial onset; 5. Cystic lesions require evaluation at the center with expertise in the area
of high-risk patients; 6. Surgical intervention decisions must be individualized and made
via multidisciplinary approach 13. The high-risk groups that will be discussed herein are
those fitting the criteria of both of these expert panels. They are those with a family history,
inherited genetic syndromes, and history or current diagnosis of pancreatic cystic lesions
(a clinically identifiable cancer precursor) 14.
1.2.1 Family history
The individuals comprising this group have at least two first-degree relatives (or 3
relatives of any degree) diagnosed with pancreas cancer but do not fulfill the criteria set
for a specific genetic syndrome 15. The overall risk for these individuals to get PDAC is
6.4% for those with two first-degree relatives affected and climbs to 32% if three first-
degree relatives are diagnoses 16, 17. Aside from the increase in general probability, this
population tends to be diagnosed 10 years earlier than the previous generation 18, which is
valuable information required for timely monitoring. Congruently, many of these patients
are diagnosed before the age of fifty compared to those diagnosed without a family history
19.
Though a unifying germline mutation or genetic signature is not known for a strong
hereditary pattern of PDAC (in the absence of a known genetic syndrome), recent studies
have discovered some genetic germline perturbations present in small subsets of the
population. One such mutation is in the PALB2 gene which has been detected in around
3% of those with familial PDAC 20. Other gene mutations and their respective prevalence
in familial cases of PDAC include BRCA1 at 1.2%, BRCA2 at 3.7%, and CDKN2A at

29
2.5% according to a study by Zhen et al. 21. Incredibly, germline mutations in these genes,
along with PALB2, were present in over 10% of those with familial PDAC 21. Roberts et
al. corroborated these findings in another study incorporating whole-genome sequencings
of familial PDAC 22. The importance of BRCA1 and 2 is also highlighted by the fact that
a family's strong family history of breast and ovarian cancer associated with germline
mutations in one of the two BRCA family members also confers an increased risk of
developing PDAC 23. Even though they represent a small subset of the total group, the
discovery of these novel tumor susceptibility genes suggests a possible role for genetic
testing in the monitoring of this cohort, along with the current imaging and laboratory
modalities.
1.2.2 Inherited genetic alterations and syndromes
Many inherited genetic alterations and syndromes have been acknowledged that
confer an increased risk of developing PDAC to a level that required screening
intervention, as per the CAPS consortium recommendation. These include familial atypical
multiple mole melanoma (FAMMM), hereditary nonpolyposis colorectal cancer
(HNPCC)/Lynch Syndrome, hereditary pancreatitis, and Peutz-Jeghers Syndrome. These
syndromes along with their associated mutation and relative percent increase in the
probability of PDAC are listed in this section.
1.2.2.1 Familial Atypical Multiple Mole Melanoma (FAMMM) Syndrome
A germline mutation in the gene that encodes p16/CDKN2A is responsible for
Familial Atypical Multiple Mole Melanoma (FAMMM) 24. Notably, p16/CDKN2A has
known tumor suppressor functions and somatic mutations and/or loss of function are
associated with the progression of early precursor lesions, PanINs, to invasive PDAC and

30
are found in the majority of patients 25. However, p16/CDKN2A germline mutations were
originally only associated with the occurrence of melanoma and the formation of various
benign nevi and it was only later when it was found to be implicated in multiple other types
including sarcoma, breast, lung, and pancreatic cancers 26. These patients harbor a 16%
lifetime risk of developing PDAC 26.
1.2.2.2 Hereditary Nonpolyposis Colorectal Cancer (HNPCC)/Lynch Syndrome
As indicated by the name, hereditary nonpolyposis colorectal cancer or Lynch
Syndrome is more often associated with colorectal cancer than the pancreas. It arises due
to alterations in the mismatch repair genes MLH1, MSH2 & 6, and PMS2, or germline
mutation of EpCAM which silences the transcription of MSH2 by epigenetic modification
27, 28. Usually, one of the alleles is deleted followed by a second mutational hit to the
remaining allele, thus causing a loss of function and an inability to efficiently repair DNA.
Many of these patients are identified by high-levels of tumoral microsatellite instability
(MSI) via polymerase chain reaction (PCR) and/or DNA mismatch repair deficiencies via
immunohistochemical (IHC) staining 29. While many of these patients are in fact
characterized by early-onset colorectal cancer, HNPCC also confers an 8.6 fold cumulative
lifetime risk of developing PDAC compared to the general population 30.
1.2.2.3 Peutz-Jeghers Syndrome
A germline STK11/LKB1 mutation, which encodes a member of the
serine/threonine kinase family and regulates cell polarity, is autosomal dominant and leads
to the Peutz-Jeghers Syndrome (PJS) phenotype. This is a syndrome characterized by
hyperpigmentation of mucocutaneous areas as well as the formation of harmartomatous
polyps throughout the gastrointestinal tract 31. PJS leads to an incredibly high risk of

31
developing a myriad of cancers including esophageal, lung, breast, uterus, ovary, stomach,
colon, and pancreas 32. Specifically, PJS confers the largest cumulative lifetime risk of
developing PDAC out of all the familial syndromes at 36% by age 65 33, thus routine
surveillance is warranted in this population.
1.2.2.4 Hereditary Pancreatitis
Hereditary Pancreatitis presents as recurrent bouts of acute pancreatitis manifesting
with sudden onset of severe epigastric abdominal pain that radiates to the back often with
concurrent nausea and vomiting 34. This presentation is much like other etiologies of
pancreatitis (i.e. alcohol/diet-induced and idiopathic) yet differs in a number of key ways.
One of which is that symptoms often present themselves at far younger ages than other
forms of pancreatitis (as young as ten-years-old in one study) 35. The hereditary form of
pancreatitis is thought to occur because of mutations that alter the homeostatic balance
between secreted proteases and inhibitors, thus leading to autodigestion of the pancreas
itself and inflammation 36.
The overwhelming majority of these cases (80%) are caused by an autosomal
dominant mutation in PRSS1, which is a gene that encodes cationic trypsin 37. The normal
physiological function of cationic trypsin is the conversion of zymogens into active forms
when excreted into the duodenum to digest food. PRSS1 mutations likely facilitate the
premature conversion of trypsinogen (the inactive form of trypsin) into trypsin prior to
excretion, thus causing autodigestion and the associated symptoms of pancreatitis 37. The
other known mutation that causes hereditary pancreatitis is SPINK1, which has the same
result as PRSS1 mutations, i.e. trypsin over activation and autodigestion of the pancreas
parenchyma, except via a slightly different mechanism. SPINK1 encodes a trypsin

32
inhibitor, thus mutations which result in a loss of function or expression of SPINK1 protein,
cause an over activation of trypsin leading to autodigestion 38, 39. Importantly, hereditary
pancreatitis, regardless of the mutation that causes it, confers a dramatically increased risk
of PDAC. Specifically, the cumulative risk by the age of 70 was found to be 40% for all
patients and up to 75% for those with paternally inheritance 40. Another study corroborated
this finding and found a 44% cumulative risk by age 70 41.
1.2.3 Precursor lesions
1.2.3.1 Pancreatic Intraepithelial Neoplasia (PanINs)
Pancreatic Intraepithelial Neoplasia (PanINs) are asymptomatic lesions < 0.5 cm
in diameter found inside the intralobular ducts of the pancreas and consist of neoplastic
proliferation of intraluminal columnar and cuboidal cells 42, 43. These cells often produce
mucin and have different proportions of cytological and architectural atypia leading to the
formation of papillary structures 44. PanINs are classified into three distinct grades that are
predicated on histological characterization with the unifying feature that none of them are
invasive. PanIN-1A (flat) and 1B (papillary) possess little atypia and are minimally
dysplastic (low-grade). Progression to PanIN-2 involves mild to moderate nuclear atypia
and cytoarchitectural changes and these are classified as intermediate-grade lesions.
Finally, high-grade lesions with extreme mitotic atypia, cribriform structures, and possible
necrosis comprise PanIN-3 lesions 45. Progression through the PanIN stages to invasive
cancer is considered the canonical route of pancreatic oncogenesis 46. Notably, almost all
high-grade PanIN lesions have been reported with concomitant infiltrating PDAC 47.
However, a recent study has highlighted cases of rare high-grade PanINs in the absence of
PDAC, which can infiltrate the lumen causing upstream duct dilation 48.

33
Immunohistochemical staining of PanIN lesions displays an elevated expression of mucin
proteins MUC1 and MUC5AC with a concomitant decrease in the level of MUC6 49, 50.
PanIN progression is posited to be caused/accompanied by the accumulation of
sequential genetic alterations that culminate in the formation of malignancy 51 (these
chronological genetic changes that are associated with the formation of PDAC are
discussed subsequent sections in this thesis). Those that harbor these precursor lesions
theoretically represent a high-risk patient population that could be identified prior to the
formation of cancer. Yet, these lesions are not able to be detected by modern radiological
assessment methods including cross-sectional imaging [Computerized tomography (CT),
magnetic resonance imaging (MRI)] and endoscopic ultrasound (EUS). Additionally, as
mentioned prior, it is only possible to speculate the incidence within the general population
because almost all of the high-grade PanINs heretofore identified are with concomitant
PDAC with rare exceptions. Unfortunately, these facts, combined with the asymptomatic
nature of PanIN lesions, prevent this cohort from being a screenable population from a
biomarker perspective.
1.2.3.2 Pancreatic Cystic Lesions
The group that consists of the patients perhaps most amenable to early detection
among the determined high-risk groups are those with a current or previous diagnosis of a
pancreatic cystic lesion (PCL) 52. Importantly, this is an identifiable cohort because, unlike
PanINs, PCLs are clinically observable lesions (via imaging) that can provide a means of
identification and thus, will be expounded on in this section. Patients harboring a cystic
lesion are more likely to progress to cancer than even those with a family history of PDAC
53 making them a prime target population for screening and surveillance modalities.

34
However, complexities arise because PCLs present a variable risk for malignant
progression: while some PCLs carry up to a threefold increased risk of developing PDAC
54, 55, others present with a marginal risk or low probability of developing into PDAC 56
(Figure 1.3). Thus, PCL patients represent one of the ideal populations to screen for
PDAC.
It is estimated that 0.7-2.6% of the general asymptomatic population harbors some
form of PCLs 57. The prevalence of these lesions increases with age; autopsies of 70 to 79-
year-old patients revealed that 25% harbor a pancreatic cyst, increasing to 37% for patients
older than 80 58-60. These proportions extrapolate to an estimated 3.5 million people with
cystic lesions in the U.S. alone. The transformation potential of all cysts is minimal and an
investigation utilizing the SEER database found that 33.2 per 100,000 pancreatic cysts will
progress to PDAC 61.
Though screening and intervention are warranted in this high-risk group, the
pervasiveness of PCLs leads to thousands of unnecessary medical and surgical
interventions per year. These high-risk procedures carry great comorbidity, especially for
the elderly. Even if surgery is not required, immense amounts of time and resources are
utilized to monitor patients for years following initial discovery 62. This monitoring is
multimodal and can involve expensive sequential imaging methods along with invasive
procedures such as repeat Endoscopic Ultrasound-guided Fine Needle Aspiration (EUS-
FNA), culminating in eventual excision. This leads to an increased economic burden on
the health care system. Importantly, the anxiety and stress imparted on the patient after a
PCL diagnosis cannot be understated, and the ability to ameliorate this burden would be
immensely impactful 63.

35
Figure 1. 3 Chart depiction of pancreatic cystic lesion types.
All PCLs are divided into three main types, inflammatory, serous and mucinous. Those
grouped under the “Other” heading are rare cyst types that include pseudopapillary tumors
(SPT), lymphoendothelial cysts (LEC), and pancreatic neuroendocrine neoplasia (PNEN).
The inflammatory type is predominately comprised of pseudocysts. Importantly, serous
type cysts are rarely malignant. Mucinous cysts, however, divided into intraductal
pancreatic mucinous neoplasms (IPMN) and mucinous cystic neoplasms (MCN), harbor a
greater potential for malignancy. Thus, this is the primary PCL population that undergoes
surgical resection. The prevalence of IPMN types (branch, main, and mixed duct), as well
as sub-classifications (gastric, intestinal, pancreaticobiliary, and oncocytic), are shown
along with their respective proportions that harbor concurrent malignancy. (Carmicheal J
et al. Elevating pancreatic cystic lesion stratification: Current and future pancreatic cancer
biomarker(s). Biochim Biophys Acta Rev Cancer. 2020;1873(1):188318).

36
Figure 1.3

37
As per WHO classification (2000) 64-66 PCL’s can be divided into; A. Serous
tumors- including serous cystadenoma and serous cystadenocarcinoma B. Mucinous
tumors- including mucinous cystadenoma, mucinous cystadenocarcinoma, intraductal
papillary-mucinous adenoma and intraductal papillary-mucinous adenocarcinoma C. Solid
pseudopapillary tumors.
A Serous Cystic Neoplasms
Serous cystadenomas/Serious cystic neoplasms (SCAs/SCNs) are benign tumors
that can be sub-divided into serous microcystic adenoma (SMA) and serous oligocystic
adenoma 64. SMAs have a proclivity towards body or tail in 50-75% of cases while the rest
involve the head of the pancreas 67, 68. SMAs account for 1-2% of all exocrine pancreatic
tumors. Females (70%) are affected more than males with a mean age of 66 years (range
34-91 years) at presentation. SOAs are far less common than SMA with no sex predilection
and are located mainly in the head and body of the pancreas 69, 70. On cross-sectional
imaging with computed tomography (CT) or magnetic resonance imaging (MRI), SCAs
are often multilocular with a honeycomb-like appearance and contain a central stellate scar
71. This characteristic appearance can often lead to a definitive diagnosis via imaging.
Histologically, the cysts are lined with glycogen-rich simple cuboidal epithelium, which is
positive on periodic acid-Schiff stain without diastase digestion 72. If imaging results are
inconclusive, EUS/FNA of cystic fluid can also be done but has low sensitivity though the
addition of cytobrushing can improve the sensitivity of EUS-FNA 73, 74. SCNs have
relatively lower carcinoembryonic antigen (CEA) levels than other PCL types with a higher
risk of malignant progression 71. However, there is no concrete evidence to support a direct
correlation between CEA levels and the risk of malignant progression 75.

38
SCAs are considered benign lesions that do not communicate with the pancreatic
ducts 76. Their progression to serous cystadenocarcinoma is exceedingly rare, with an
incidence rate of less than 1%, including the largest series that reported three cases of
cystadenocarcinoma out of 2622 patients 77. For this reason, the clinical recommendation
is to observe serous cystadenomas, with or without serial imaging, to check on the growth
rate of the tumor. Resection is warranted only if mass effect symptoms are present such as
abdominal pain, nausea, jaundice, or rapid cystic growth. Palliative resection can also be
considered if the lesion transforms into a serous cystadenocarcinoma and becomes
malignant 78.
B Mucinous Cystic Lesions
B.1 Mucinous Cystic Neoplasms
Mucinous cystic neoplasms (MCNs) represent 2-5% of all exocrine pancreatic
tumors 69. The mean age at diagnosis is 49 years (20-82 years) and these lesions are
predominantly found in women (F: M > 20:1) 69, 79. MCNs are mainly located in the body
and tail of the pancreas and if present in the head of the pancreas, they are highly suspicious
for mucinous adenocarcinoma 80, 81. MCN’s are typically a single lesion, that can be
unilocular or multilocular, which does not communicate with the pancreatic duct 82.
Morphologically, MCNs are characterized by a large, solitary, septated, thick-walled cyst
with a pseudo-capsule containing either mucin or mixture of mucin and hemorrhagic
material 83. Histological analysis can reveal ovarian-like stroma in addition to columnar
cells with abundant mucin production 84. As per international consensus in 2004, the
histological presence of unique ovarian-type stroma was necessary to confirm the diagnosis
of MCNs 85. In contrast to the aforementioned serous cystic lesions, MCNs have an

39
increased propensity to be malignant or progress to a malignant state. The incidence rate
of mucinous adenocarcinoma varies between 6-36% 86. If the lesion is multilocular,
contains papillary projections, and/or contains mural nodules the risk of malignancy
drastically increases 87. The spectrum of differentiation in terms of histology ranges from
normal-appearing columnar epithelium to the atypical epithelium. Tumors can be classified
as MCN with low/intermediate grade dysplasia, MCN with high-grade dysplasia, or MCN
with an associated invasive carcinoma 88.
In an analysis of 163 patients with resected MCNs, the prevalence of
adenocarcinoma was reported to be 17.5% by Crippa et al. 89. The older patients with
invasive adenocarcinoma in this cohort suggested a progression from adenoma to
carcinoma. Thus, this group stated that resection should be considered in patients with
high-risk MCNs and patients with low-risk MCNs, defined as size less than 4 cm and no
nodules, can be considered for non-radical resections 89.
B.2 Intraductal papillary-mucinous neoplasms
Intraductal papillary-mucinous neoplasms (IPMNs) are mucin-producing tumors
arising from the main pancreatic duct or its branches 90. These lesions are characterized by
a dilation of the pancreatic duct resulting from immense mucus production and papillary
growth of ductal epithelium. IPMNs comprise 1-3% of exocrine pancreatic neoplasms,
with an incidence rate of 1 per 100,000 per year 59, 91, 92 and their frequency is higher in
males than in females with a median age of diagnosis in the 6-7th decade 82, 93. IPMNs can
be divided into low-risk and high-risk, with the latter defined as dilated main pancreatic
duct >5 mm or the presence of a mural nodule. The pooled cumulative incidence of high-
grade dysplasia or pancreatic cancer for low-risk IPMNs is 0.02%, 3.12% and 7.77% at 1

40
year, 5, and 10 years, respectively. While that for high-risk IPMNs is 1.95%, 9.77% and
24.68 % at 1 year, 5 and 10 years, respectively 94. IPMNs can involve the main duct (MD-
IPMN) or side branches (BD-IPMN) or both, which are known as mixed IPMN. BD-
IPMNs are not only the most common IPMNs but also the most common pancreatic cyst.
MD-IPMNs carry a higher risk of malignancy than BD-IPMN, with 38-68% of the resected
specimens of MD-IPMNs showing high-grade dysplasia or cancer 95. The relative risk of
malignant transformation for multifocal IPMNs is not at higher risk as compared to a single
cystic lesion 96. Mixed-type IPMNs contain features of both, yet behave most similarly to
MD-IPMNs in terms of progression and malignant potential and are clinically treated as
such. Differentiating IPMNs that are malignant/invasive from those that are benign is a
persistent and important problem to address.
Based on the cytoarchitectural features and mucin immunohistochemistry (i.e.
MUC1, MUC2, and MUC5AC), IPMNs have been classified into four histopathological
types; gastric (49-63%), intestinal (18-36%), pancreaticobiliary (7-18%), and oncocytic (1-
8%) 96-98. Recent investigations showed benign EUS findings (cyst size < 5mm and the
absence of a mural nodule) are associated with gastric type IPMN 99. Corroborating this
finding, Furukawa et al. found prognostic relevance to IPMN classification, where patients
with gastric type had a better prognosis than patients with intestinal-type IPMNs 100.
Gastric type is associated with the more indolent BD-IPMN, whereas intestinal type is
often associated with MD-IPMN 101. The pancreaticobiliary type has been regarded by
some as a high-grade version of the gastric type. These lesions are uncommon, not well
characterized, and the invasive carcinoma associated with this type is more aggressive 102,
103. Oncocytic type is relatively uncommon, tends to be large lesions with obscure

41
intraductal appearance, and is less invasive 104. A retrospective study of patients with cystic
lesion type verified on pathology found that even though gastric type IPMN had a better
prognosis than intestinal type, those with the gastric type who developed invasive disease
had worse outcomes when compared to those with progression arising from intestinal-type
100. The reason for this phenomenon was that gastric IPMNs had the potential to develop a
more aggressive tubular (ductal) carcinoma as opposed to the colloid (mucinous)
carcinoma arising from intestinal IPMNs 100.
C Other Pancreatic Cystic Lesions
Other cystic lesions of the pancreas include solid pseudopapillary tumors (SPT),
lymphoendothelial cysts (LEC), and neuroendocrine neoplasms (PNENs). SPT is a rare
tumor seen most frequently in young women in their 20’s. Less than 10% of SPT’s have
aggressive tumor behavior pathologically with a 5- year disease-specific survival of over
98% 105. The tumor is considered indolent given the high survival rates of patients even
when metastases are present 106. The diagnostic accuracy of preoperative imaging for SPT
is high with a sensitivity of 95% 107. LECs are extremely rare complex lesions that are often
round and exophytic that predominately occur in males 108. They are often anechoic or
hypoechoic on EUS and can present with elevated CEA and amylase levels in the cyst fluid
aspirate 108. While these lesions can harbor malignancy, their rarity has prevented adequate
pathological characterization 109. PNENs are also rare and may be solid, cystic, or mixed
in morphology. They are usually non-functioning and may occur sporadically or in
individuals with multiple endocrine neoplasia type 1 (MEN1) and/or Von Hippel-Lindau
(VHL) 110. They usually present in the sixth decade and have equal gender predisposition.
42
Unlike SPTs, the diagnostic accuracy of preoperative imaging for PNEN is low (sensitivity
of 53.3%) 107. However, EUS-FNA of PNENs has a 90% diagnostic accuracy 111.
Inflammatory pseudocysts are non-malignant fluid-filled sacs often filled with
necrotic and hemorrhagic material along with pancreatic enzymes 112. These are not true
cysts as they do not have an epithelial lining. In the absence of any clinical symptoms, they
can be monitored with imaging while symptomatic lesions can be effectively treated with
steroids and/or surgical drainage 113. Notably, pseudocysts are often associated with a
history of chronic and/or acute pancreatitis 114, alcoholic pancreatitis 115, or autoimmune
pancreatitis 116. These studies found that 42-56% of pancreatitis patients harbor
pseudocysts 114, 115. Unfortunately, some cystic neoplasms, including those with malignant
potential, can initially present with pancreatitis or even cause recurrent bouts of pancreatitis
63, 117. Along with this, serum amylase and lipase levels, the standard metrics by which
pancreatitis is assessed in clinics, are unable to differentiate between MCNs and
pancreatitis without supplemental imaging and invasive procedures 118. Up to 15% of
IPMN patients present with pancreatitis 119 as well as 9% of those with MCNs 89 and some
IPMNs can elicit an immune response thus inducing autoimmune pancreatitis 120. BD-
IPMNs, in particular, can be difficult to differentiate from pseudocysts in the setting of
pancreatitis and thus, many pseudocysts are often mismanaged as IPMNs 63. It has been
reported that 10-15% of cystic lesions discovered with a background of pancreatitis can be
malignant 116, 121. Large cyst size and poor response to steroids increase the likelihood of
the presence of malignancy 116, 121.
1.3 Genetic and molecular mechanisms of PDAC oncogenesis and progression

43
Recent comprehensive genomic analyses have built upon this foundation and have
yielded influential insights regarding the genetic alterations associated with pancreatic
tumorigenesis 122-124. These whole-exome/genome sequencing studies have confirmed the
importance of traditional somatic oncogenic driver genes but have also elucidated a number
of less frequently mutated driver genes as well as uncovered germline tumor susceptibility
genes in PDAC patients without a family history or genetic syndrome 125. Though these
are important and impactful findings (e.g. National Comprehensive Cancer Network
(NCCN) guidelines no recommend germline testing for all confirmed PDAC cases), they
lie outside the purview of this section and the traditional genetic progression model will be
the focus in this section.
The first characterized mutation in PDAC was in a cancer cell line (T3M4) in codon
61 of KRAS (Glu-His) 126. This study initiated the search and eventual discovery of myriad
genes determined to be involved in various aspects of PDAC including initiation,
development, and progression. These include oncogene activation/overexpression such as
KRAS 127 and tumor suppressor gene inactivation/downregulation such as DPC4/SMAD4
128, TP53 127, and p16/CDKN2A 25. Concurrent telomere dysfunction and shortening have
also been proven to be a component of PDAC formation 129. These studies culminated in
the current generally accepted progression model proposed by Hruban and colleagues in
2000 51.
Among the earliest events associated with progression to PDAC are alterations in
the KRAS oncogene, telomeric shortening, and CpG island hypermethylation 130. KRAS
encodes for a RAS GTP-binding protein family member that dictates cellular proliferation
and survival 131. Activated KRAS initiates many different pro-survival signaling

44
mechanisms including RAF-MAPK and PI3K pathways 132. KRAS mutations are one of
the earliest genetic abnormalities in the PDAC progression model and have been well
characterized as driver mutations the pathogenesis of pancreatic cancer 133 134, 135. The most
common activating point mutations (most often residing in codons 12 and 13) produce a
constitutively active protein resulting in unrestricted growth signaling 136, 137. Alterations
in KRAS are thought to be an early event in IPMN and PanIN biogenesis as it is found in
all types without significant differences 138, 139.
Another one of the earliest events in PanIN formation and progression to PDAC is
telomeric shortening. Telomeres protect the end of chromosomes preventing unwanted
chromosomal fusion events and telomere shortening can lead to aberrant chromosomal
fusion resulting in unstable chromosome structures and subsequent DNA fragmentation 129,
140. Loss of telomere protection can also lead to the accumulation of chromosomal
amplification and/or deletions causing aberrant protein expression profiles 141. Along with
KRAS, this telomeric shortening is considered integral to the initiation of PanIN lesions
formation and the subsequent trajectory towards PDAC.
CpG island methylation within a gene promoter region is an epigenetic
modification that leads to a silencing of gene transcription under normal physiological
circumstances 142. However, hypermethylation of a number of genes (namely tumor
suppressors) has been observed in the setting of PDAC 143, 144. Additionally, CpG island
hypermethylation has been observed in low-grade PanIN lesions, thus implicating its role
in initiation 145. Some of the important tumor suppressor genes that are affected, and most
relevant to PDAC progression, include p16/CDKN2A, TP53, and DPC4/SMAD4 42.
45
p16/CDKN2A inactivation has been observed in later PanIN 1. The influence of
p16/CDKN2A as a tumor suppressor (as a function of cell cycle regulation at G1 phase) is
highlighted by the fact that homozygous deletion of 9p21 locus (location of p16/CDKN2A)
is seen in up to 40% of PDAC cases and loss of function is seen in 90% of patients (40%
homozygous deletion, 40% single allele loss with concomitant mutation, and 10%
hypermethylation silencing) 25. TP53 is mutated in 50-75% of all PDAC patients, and this
is usually an allelic loss followed by a concomitant missense mutation in the remaining
allele 146. It functions as a tumor suppressor facilitating and maintaining G2/M arrest as
well as induces apoptosis, thus the mutations occurring in the gene encoding for this protein
results in cell cycle and cell death deregulation 147. With this, DPC4/SMAD4 controls
growth via the transformation growth factor β (TGF-β) pathway and the regulation of pro-
growth genes 128, 148 and loss of this gene leads to a decrease in growth inhibitory signaling.
In contrast to p16/CDKN2A, TP53 and DPC4/SMAD4 loss seem to arise only at the
PanIN-3 stage and continue through PDAC, thus emphasizing their functions as key
molecules preventing malignant transformation to an invasive phenotype 149.
Many other somatic mutations in oncogenes have been implicated in PDAC
progression involving a wide array of signaling pathways. These include G-protein
signaling (cAMP production) via GNAS 150, transcriptional regulation via MYC
(chromosome 8q24 amplification) 123, and EGFR signaling via ERBB2 151 and EGFR 152.
Additionally, many other tumor suppressor gene mutations have been brought to light
including RNF4 124. The continual discovery of genes along with their diverse mechanisms
of action, emphasizes the intense complexity associated with PDAC initiation,
development, and progression.

46
1.4 Detection methods
The decades-old challenge still remains to identify the high-risk patients harboring
early malignancy or precursor lesions that will eventually progress to PDAC. The
incredibly low incidence of PDAC in the general population prevents wide use of
conventional screening modalities as the quantities of false positives leading to erroneous
procedures would eclipse the number of detected cancers 153. Therefore, the high-risk
groups previously discussed (those with greater than 5% lifetime risk of developing PDAC)
are the only populations for which screening and possible early detection is recommended.
Current detection methods used in the clinic are threefold: Imaging, EUS-FNA cytology,
and the use of molecular markers CA19.9 and carcinoembryonic antigen (CEA).
1.4.1 Imaging
Various imaging methods including computerized tomography (CT), magnetic
resonance imaging (MRI), magnetic resonance cholangiopancreatography (MRCP), and
abdominal ultrasound are integral to the monitoring of high-risk individuals, presenting
symptomatic patients, and lesion differentiation 154-156. Guidelines regarding surveillance
of patients with a family history of PDAC, hereditary pancreatitis, genetic syndromes, and
PCLs all incorporate the use of sequential imaging with EUS and/or pancreas MRI as the
initial means of patient screening 13, 14. However, the level of clarity proffered by these
myriad imaging modalities is not adequate for the actual diagnosis of PDAC. Conventional
imaging does not have the resolution to detect PanIN lesions at any stage and nowhere is
this problem of ambiguous imagining results more apparent than with the PCL population.
The overall prevalence of all PCL types in the general population has increased in recent
years due to the ubiquitous use of cross-sectional imaging modalities. According to the

47
American Gastroenterological Association (AGA), the proportion of incidental PCL
discoveries in patients who undergo magnetic resonance imaging (MRI) for an unrelated
reason is 15% 157.
Any abnormalities found on imaging require further investigation via tissue biopsy,
laboratory testing, and more invasive/expensive imaging modalities including and
endoscopic ultrasound (EUS), endoscopic retrograde cholangiopancreatography (ERCP),
and positron emission tomography (PET). So while imaging is an incredibly important
component of monitoring those at high-risk and assessing symptomatic patients, it is in no
way definitive. Inherently this increases the total number of patients that require continual
monitoring (image-guided) or even subjected to more invasive testing. Imaging will always
be a mainstay for high-risk patient monitoring and its diagnostic shortcomings will need to
be reduced. With this in mind, efforts are currently underway to increase the diagnostic
efficacy of imaging for PDAC including but not limited to radiomics 158, FDG-PET/CT 159,
and molecular imaging facilitated by mAB conjugated nanoparticles 160.
1.4.2 Cytology
Historically, cystic fluid has been collected and assessed for markers for two
primary reasons; discerning between mucinous and serious cysts, and differentiating
benign from malignant lesions. Coupled with EUS imaging, fine-needle aspiration (EUS-
FNA) is a procedure used to obtain cystic fluid for analysis. This fluid can be assessed for
the presence of dysplastic cells. Patients harboring cysts with worrisome features, or those
greater than 3 cm, are recommended to undergo EUS. Each cyst subtype has discreet
characteristic cellular typology, morphology, and immunohistochemical staining.
Pseudocysts demonstrate inflammatory cells while serous mucinous neoplasms

48
demonstrate glycogen-containing cells 76. Mucinous cystadenocarcinomas demonstrate
cells with malignant features (increased nuclear/cytoplasmic ratio, pleomorphism,
anaplasia, hyperchromatism, prominent nucleoli, and mitoses) nearly 50% of the time, but
the yield is usually low 161. MUC2 and CDX2 are indicative of intestinal differentiation
and can be used as immunohistochemical markers to identify intestinal-type IPMN 103, 162.
A meta-analysis by Suzuki et al. showed a sensitivity and specificity of EUS-FNA cytology
to be 65% and 91%, respectively, for distinguishing malignant and benign IPMNs 163.
There has always been a concern with peritoneal seeding secondary to EUS/FNA; however,
a study found no significant increase in metastatic disease secondary to the procedure in
patients with IPMNs who underwent EUS/FNA 164.
While cystic fluid cytology can help differentiate between various cyst types and
can be highly specific, the cellular yield is often too low to be diagnostically useful thereby
greatly diminishing the sensitivity. In the Cooperative Pancreatic Cyst study (CPC study)
that involved 341 patients with PCLs, the sensitivity of cyst fluid cytology for diagnosing
mucinous cysts was only 34% because of the low number of cells found in cystic fluid 165.
In conjunction, a multiloculated cystic lesion leads to the compartmentalization of fluid
species, thus, FNA may not be representative of the lesion’s gestalt.
1.4.3 CA19.9 and CEA
CA19.9 is a Sialyl Lewis A glycan present on multiple glycoproteins and is
currently used in the clinic to monitor patients for PDAC progression and/or evaluation
after surgical resection. It is often elevated in PDAC making it one of the most clinically
useful markers to date 107. Carcinoembryonic antigen (CEA) is a secreted glycoprotein
involved in cell adhesion and has been used as a biomarker for various gastrointestinal

49
malignancies 166, 167. It is one of the most clinically useful cystic fluid biomarkers for PCLs
and the prediction of malignancy. These proteins are often aberrantly expressed and
detectable in cystic fluid and serum, and much research has been conducted to discern their
respective diagnostic and prognostic significance.
Cystic fluid CEA and CA19.9 levels have also been shown to be higher in
malignant compared to benign cysts 168. In this study, the sensitivity/specificity for CEA
and CA19.9 for predicting malignancy were 92%/64% and 81%/69%, respectively 168. A
meta-analysis looking at the ability of serum CA19.9 and CEA to identify invasive and
malignant IPMNs found CA19.9 had a pooled sensitivity of 52% and 40% and specificity
of 88% and 89%, respectively while CEA has a pooled sensitivity of 18% for both invasive
and malignant IPMNs and a specificity of 95% and 93%, respectively 169. A combination
of serum CA19.9 and CEA was used to determine the presence of malignancy in resected
IPMNs 170. CA19.9 alone had a sensitivity/specificity of 74%/86%, CEA had a
sensitivity/specificity of 40%/92%, and a combination of CA19.9 (cutoff >37U/mL) and
CEA (cutoff >5 g/mL) had a sensitivity/specificity of 80%/82% 170.
While these two markers are the current gold standards and prove beneficial for
therapeutic monitoring and recurrence detection, they do not exhibit the required sensitivity
nor specificity levels required for screening purposes. CA19.9 is limited in its diagnostic
utility as Le(a-b-) patients do not have the necessary fucosyltransferase enzyme to produce
it and also, this phenotype is highly variable among different ethnic groups: Asian (7%),
European (8%), African (19%) 171. CEA can be expressed in serum resulting from other
diseases including lung fibrosis, Alzheimer’s disease, and a variety of other cancers 172.
Further, neither of these proteins has been capable of adequately differentiating benign vs

50
malignant disease in cystic fluid specimens nor serum. With this, these studies demonstrate
that clinically used cystic fluid and serum markers are variable in their diagnostic potential
and that more accurate biomarkers are needed to determine the presence of malignancy.
1. 5 Therapeutic strategy
1.5.1 Surgery
Surgical resection is the mainstay of treatment for PDAC as it is the only curative
treatment option available 173. This can be accomplished with distal or total
pancreatectomy, or a pancreaticoduodenectomy (Whipple) procedure, depending on the
location of the tumor 174. Unfortunately, surgery alone is necessary but not sufficient as
>80% of patients relapse and succumb to the disease if no other therapy is administered
175. Further, the overwhelming majority of patients (80-85%) present at a time when
surgery is no longer a viable option due to the presence of locally advanced and/or
metastatic disease 176. Thus, while surgery is the cornerstone of PDAC therapy,
improvements on outcomes have been reliant upon adjuvant and neo-adjuvant
administration of systemic and/or localized therapies to further improve survival as well as
decreased tumor volumes to sizes capable of being resected. Current guidelines American
Society for Clinical Oncology (ASCO) and NCCN guidelines recommend the addition of
adjuvant chemotherapy for all patients that have undergone surgical resection as well as
neoadjuvant therapy for those with unresectable tumors 177, 178.
1.5.2 Adjuvant therapy
One of the earliest studies investigating the possible role of adjuvant therapy for
PDAC discovered a significant increase in overall survival from 11 months to 20 months
with the administration of 5-Fluorouracil (5-FU) after resection compared to resection

51
alone 179. This study also formed the basis for the current opinion that adjuvant radiation is
not beneficial in terms of survival outcomes as no difference was observed between the
chemotherapy alone and chemoradiation therapy arms. This was a finding corroborated by
the ESPAC-1 trial where chemoradiation was reported to provide no additional benefit to
chemotherapy alone 180. Following this a seminal study, CONKO-001, was conducted
decades later in which adjuvant gemcitabine was found to be equally as effective as 5-FU,
but with less toxicity 181. Gemcitabine efficacy was found to be potentiated with the
addition of capecitabine in the ESPAC-4 trial published in 2017, resulting in 5-year
survival of 30% for patients undergoing combination treatment following surgery 182. This
trial set the new standard for PDAC therapy. With these results, this is the recommended
therapeutic regimen provided by the current ASCO guidelines 177.
The combination treatment regimen of folinic acid, fluorouracil, irinotecan, and
oxaliplatin (FOLFIRINOX) has been used to treat metastatic and recurrent PDAC patients
with favorable impacts on survival compared to gemcitabine 183. Results of a recent clinical
trial (NCT01526135) investigating the use of adjuvant FOLFIRINOX compared to
gemcitabine showed an impressive increase in median overall survival between the two
groups increasing from 35.0 months in the gemcitabine arm to 54.4 months in the
FOLFIRINOX arm 184. Additionally, the 3-year overall survival percentage was 39.7% and
21.4% in the FOLFIRINOX and gemcitabine groups, respectively. Of note, this study used
a modified version of FOLFIRINOX (decreased doses of the constituent drugs) to try and
mitigate the associated toxicities, yet 75.9% of patients still experienced high-grade
toxicities and many had to discontinue treatment 184. This result has led the NCCN to add
FOLFIRINOX as a consideration for patients that can tolerate the therapy 178.

52
1.5.3 Neo-adjuvant therapy
Even with the substantial benefit offered by adjuvant therapy up to 75% of patients
relapse with disseminated disease 185. Neo-adjuvant therapy could eliminate micro
metastasis and shrink the primary tumors and thus diminish the probability of disease
recurrence 186. The NEOPA trial looked at the potential benefits of chemotherapy and
radiation therapy prior to surgical resection and found that neo-adjuvant combination
gemcitabine and external beam radiation provided a 12% increase in overall survival
compared to surgery alone 187. PREOPANC-1 trial is currently underway that aims to
further expound the role of neoadjuvant therapy in the setting of resectable disease 188.
As described previously, the majority of patients present at a borderline or locally
advanced stage, when surgery is complicated or not possible. Borderline resectable disease
is often defined as confined to the pancreatic bed with limited involvement of the adjacent
vasculature where vascular reconstruction is possible 189. Locally advanced disease is often
defined as involvement of the celiac artery (CA) or >180o encasement of the superior
mesenteric artery (SMA) and/or superior mesenteric vein (SMV) or portal vein (PV) 190.
The mean 30-month survival of those with locally advanced disease has been reported as
low as 8% 191. These two groups of patients comprise 30-40% of initial presentations and
represent a group of patients that stand to benefit from neo-adjuvant therapy 175, 192.
FOLFIRINOX has begun to emerge as an excellent neo-adjuvant chemotherapeutic
agent in recent studies 193One study found FOLFIRINOX treatment of locally advanced
PDAC facilitated the eventual surgery of 61% of patients involved in the study 194. Along
with this, a meta-analysis incorporating data from 253 patients found this strategy to cause
43% of those treated to become resectable 195. However, a different study found

53
FOLFIRINOX treatment in locally advanced PDAC to facilitate surgery in only 29% and
a large proportion of participants (86%) had to discontinue or modify the chemotherapy
regimen due to toxicity (Of note, total sample size was small at 14 and did not have a
control group comparison) 196. Interestingly, the addition of chemoradiation (25Gy in 5
fractions and capecitabine) with FOLFIRINOX for patients with borderline resectable
disease lead to an impressive 67% resection rate (all but one of those had pathologically
negative margins (R0)) and a median overall survival of 37.7 months 197. Congruently, a
meta-analysis incorporating 19 studies involving borderline resectable or locally advanced
disease found that neo-adjuvant treatment (76.9% involving radiation and 74.4% involving
chemoradiation) facilitated resection in 40.2% of patients 186.
One of the most prevalent neo-adjuvant therapeutic modalities is the administration
of external beam radiation therapy (EBRT), in dose ranges from 25-50 Gray (Gy) typically
in 2Gy fractions, with or without concurrent chemotherapy 198. There have been many
studies that have reported the benefit of incorporating EBRT into therapeutic regimens and
these have reported resection rates up to 85% 199-201. Along with this, a greater portion of
those who are able to undergo surgery after EBRT achieve R0 resections reaching 100%
in one study 202 and many reported increases in overall survival compared to non-radiated
control groups 198.
In contrast to EBRT, stereotactic body RT (SBRT) is a highly conformational
technique capable of delivering large radiation doses in a small number of fractions (hypo
fractionated) with concurrent image guidance, thus limiting radiation delivery to
surrounding tissues thereby abrogating toxicity and facilitating local ablation of the tumor
203, 204. The benefits associated with SBRT has caused it to become heavily studies in

54
conjunction with traditional chemotherapeutic agents 205. One study even found hypo
fractionated SBRT spared lymphocytes from radiation-induced cell death compared to
EBRT with conventional fractionation in PDAC patients 206. A trial utilizing SBRT to
deliver 33Gy in 5 fractions (6.6Gy/fraction) achieved a one-year overall survival rate of
59% with extremely low toxicities 207. Additionally, the high-conformational ability of
SBRT can be taken advantage of to deliver high-doses along the contours of vasculature
adjacent to the tumors in borderline resectable and locally advanced patients. For example,
one trial delivered 30Gy in 5 fractions to the entire tumor and 40Gy in 5 fractions (with
concomitant gemcitabine) to the tumoral surface abutting the vasculature to increase
shrinkage 207. Importantly, 51% of borderline resectable patients went on to receive
surgical treatment and 96% of those achieve an R0 (negative surgical margins) resection
207. Even with these high doses administered via hypo fractionated, in-field recurrence has
been found to still occur in 26.1% of patients, which highlights the problem of radiation
resistance in PDAC 208.
1.6 Conclusions and perspective
The ability to determine the need and level of intervention in high-risk populations
depends upon an accurate diagnosis. This must be achieved prior to the onset of symptoms
as these do not often occur until later-stage disease. Initial presentation to the clinic is most
often at stages III and IV 209. Importantly, only stage I and II patients even have a possibility
of being resected predicated on the structures involved. While tissue-based classification
can be incredibly accurate and allow for true histological

55
analysis and verification of disease by a pathologist, sample acquisition can carry
significant comorbidities due to the invasive nature of the procedure.
Further, single-site biopsies do not account for the entirety of the lesion, thus
increasing the possibility of missing malignant disease. Conversely, the use of imaging for
classification is non-invasive and can take into account the holistic state of the lesion.
Unfortunately, current imaging modalities are expensive, are susceptible to observer
variation, cannot visual extremely early malignancy, and have limited accuracy in
differentiating malignant vs non-malignant cysts. Cystic fluid (via EUS/FNA) and serum
(via blood draw) offer a less invasive means of analysis than biopsy. Yet many FNA
samples have scant cellularity leading to inconclusive results and the current serum-based
biomarkers are inadequate for detection.
An intense investigation into biomarkers for the noninvasive characterization of
high-risk patients is required and these biomarkers must be able to consider the diversity
in the genetic origins of PDAC 210. Biomarkers should be used in conjunction with the
current consensus for imaging guidelines to determine the potential of malignancy. In
effect, the task remains to identify the most at-risk patients within the high-risk populations.
These include options such as the assessment of circulating endothelial cells 211, cell-free
DNA measurements 212, improved imaging/biopsy modalities 165, and extracellular vesicle
(EV) analysis 213, 214. EVs are an especially attractive target as a means of detecting PDAC
and further analysis of the intravesicular and surface contents may lead to the discovery of
unique circulating biomarkers.
Once detected, medicine must be able to offer a treatment that provides a
meaningful extension of life to the patients suffering from this dreaded disease. Surgical

56
Figure 1. 4 Survival of SEER patients (1992-2016) treated with currently available
therapies.
The 5-year survival of all patients within the SEER database is relatively unchanged
regardless of therapeutic modality. The addition of chemotherapy and/or radiation to
surgery marginally improves survival at the one-year and two-year time points but does
not confer any survival advantage at later time points.

57
Figure 1.4
58
resection of the primary tumor remains the only curative option for pancreas cancer. Only
marginal increases in the life span of PDAC patients by just a couple of months have been
achieved over the last 30 years 215. While the current therapeutic strategies (i.e. surgery,
chemotherapy, and radiation therapy) do confer an improvement in outcomes compared to
no treatment, the 5-year survival of PDAC patients in the SEER database (1992-2016) is
still incredibly low, even with combination regimens (Figure 1.5). Traditional mild
chemotherapeutic options such as gemcitabine and paclitaxel offer very little benefit in
overall survival and conversely, very few patients are eligible or capable of undergoing
more effective treatments such as FOLFIRINOX due to intense chemo-toxicities. Along
with this, many PDAC patients are refractory to radiation treatment and thus, this has not
been a traditional first-line therapy.
There exists a fervent need to improve the therapeutic armamentarium when it
comes to PDAC. One that may take into consideration some of the unique aspects of this
disease and prevent some of the toxicities associated with pan-cytotoxic chemotherapies.
With the advent of SBRT, site-directed radiation treatment is possible, at higher doses that
the past with limited off-target toxicities. Additionally, it was shown capable of reducing
the volume of non-resectable PDAC tumors, to a size amenable to resection. Unfortunately,
there remains a portion of the patient population that remains resistant to radiation therapy.
A means of potentiating this site-specific and targeted therapy would prove highly
advantages in the fight against this horrible malignancy 216.
The high lethality of PDAC is due to two primary reasons: 1. the discovery of
PDAC at later stages, with metastatic disease present at the time of initial diagnosis 177. 2.
The lack of efficacious therapeutic interventions. In a time when average survival for most

59
cancers is climbing, PDAC continues to remain stagnant 2. The goal of this thesis is to
develop novel detection and treatment strategies for PDAC. Firstly, serum EVs will be
investigated as potential non-invasive liquid biopsy biomarkers, to serve as a means of
early cancer detection. Secondly, a recently discovered form of cell death, ferroptosis, will
be investigated as a means of potentiating radiation therapy.

60
Chapter 2: Methods
2A: Extracellular vesicle surfaceome characterization for the early detection of
pancreatic ductal adenocarcinoma
2B: Radiation potentiation via ferroptosis for the improved treatment of
pancreatic ductal adenocarcinoma

61
Chapter 2: Methods
2.1 Cell Culture
MiaPaCa, CD18/HPAF, T3M4, BxPC3, Panc1, Colo357, AsPC1, and Capan1
(pancreatic ductal adenocarcinoma) cell lines were cultured in Dulbecco’s modified
Eagle’s high glucose medium (Hyclone, South Logan, UT, USA) with 10% FBS and 1%
streptomycin at 37oC in a humidified atmosphere containing 5% CO2. HPDE (human
pancreatic ductal epithelium) cell line was cultured in keratinocyte serum-free medium
supplemented with epidermal growth factor (EGF) and bovine pituitary extract (Invitrogen,
Carlsbad, CA, USA) with 10% FBS and 1% streptomycin at 37°C in a humidified
atmosphere containing 5% CO2. (Note: This is a nonmalignant pancreatic ductal epithelial
cell line immortalized from a normal human specimen via retroviral transduction of HPV16
E6/E7. Neither oncogenic mutations nor neoplastic morphological changes are present in
this cell line.) At 70-80% confluence the plates were washed with PBS and serum-free
medium was added. The cells were cultured in serum-free medium for 48 hours followed
by the collection of medium for the EV isolation experiments.
2.2 Immunoblotting
Protein was extracted from purified EVs using ice-cold RIPA (50mM Tris-HCl,
150mM NaCl, 1% NP-40, 0.5% sodium deoxycholate and 0.1% SDS) containing protease
(1mM phenyl-methyl sulphonyl fluoride, 1mg/ml aprotinin, 1mg/ml leupeptin) and
phosphatase inhibitors. EV lysates were spun at 13,000 RPM for 30 minutes at 4oC, the
pellet was discarded the supernatant collected. Proteins were resolved using acrylamide;
bisacrylamide gels and transferred to a PVDF membrane. The membranes were then

62
blocked with 5% milk, probed with primary antibodies overnight at 4°C. Membranes were
washed (3 x 8min) with phosphate-buffered saline and .01% Tween 20 (PBST) at room
temperature and subsequently probed with 1:3000 dilution of horseradish peroxidase-
conjugated anti-mouse or anti-rabbit secondary antibodies (Thermo Fisher Scientific,
Waltham, Mass, USA). After secondary antibody incubation for one hour, the membrane
was again washed (4 x 8min) with PBST and the protein of interest was visualized by
enhanced chemiluminescence detection (Thermo Fisher Scientific, Waltham, MA, USA)
and exposed on an X-ray film for signal detection.
2.3 Statistical Methods
Statistical analysis was conducted using JMP Pro software with either student T-
test, or Mann-Whitney-U and Wilcoxon rank test for non-parametric testing of groups that
did not meet the normal distribution assumption. Survival curves were evaluated via a log-
rank test with p ≤ 0.05 considered statistically significant.
2A Extracellular vesicle surfaceome characterization for the early detection of
pancreatic ductal adenocarcinoma
2A.1 EV isolation from cell medium and serum
Three hundred ml of cell medium was centrifuged in 50 ml aliquots at 11200G for
ten minutes at 4°C to remove dead cells and cellular debris. The supernatant was then
filtered and concentrated with a 100kDA centrifugal filtration to a total of 10ml. The six
solutions used of different quantities of sucrose by weight% in PBS with respective relative
densities (g/ml) are as follows: 5% - 1.0178, 15% - 1.0596, 30% - 1.1270, 40% - 1.1765,
50% - 1.2295, 60% - 1.2884. 500 µl of each mixture was layered into 4 ml ultracentrifuge
tubes with the highest densities added first. The concentrated cell line supernatant was
63
deposited on top of the sucrose density gradient and the EVs were isolated via sequential
ultracentrifugation as detailed earlier 217. Notably, the target EV population density ranges
from 1.15 – 1.19 g/ml. thus the expected population should settle in the 30 and 40% layers
(i.e. fractions 3 and 4). A flow diagram of this protocol and isolated EVs can be seen in
Figure 2A.1. The purified particles were washed using 10mM Borate Buffer, suspended
in 50ul of buffer and stored at -20°C.
EVs were isolated from benign control patients and pancreatic cancer patients with
early-stage (IA-IIB) disease (IRB # 517-15-EP). For the isolation of EVs from serum, a
modified version of the cell line supernatant isolation protocol was used. One ml of patient
serum was added to 1.5 ml PBS and centrifuged at 500G for 10 minutes at 4°C. The
supernatant was collected and then centrifuged at 12000G for 20 minutes at 4°C. Again,
the supernatant was collected and centrifuged at 100000G for six hours at 4°C. The pellet
that formed was suspended with 3 ml PBS and centrifuged for the final time at 100000G
for two hours at 4oC. From here the EV pellet was treated with the same density gradient
steps as described for isolation from cell medium. The particles from each fraction were
suspended in 50ul of PBS and stored at -20°C.
2A.2 FiberCell
Though density gradient ultracentrifugation is the currently used gold standard
method of isolation, it is incredibly time-consuming and few particles are isolated from
high volumes of conditioned media. In an effort to streamline this process, a High-density
hollow-fiber bioreactor from FiberCell Systems® (Figure 2A.2) was acquired for the
large-scale production of EVs to decrease the time spent and increase the yield for
experiments. Cells grow in high densities on the external portion of the hollow fibers in the

64
Figure 2A. 1 Isolation of EVs via density gradient ultracentrifugation.
Flow diagram depiction of the sequential steps required for EV isolation from the cell-
conditioned media beginning with 150 ml of media and finally ending up with concentrated
EV samples. The relative densities of the target EV population and the sucrose solutions
are presented on the right side of the figure along with an image showing isolated EVs
within the third sucrose layer inside a 4 ml ultracentrifuge tube.

65
Figure 2A.1

66
bioreactor cartridge, while the media is retained on the inside of these fibers. This prevents
the contamination of cell-line exosomes by bovine exosomes present in fetal bovine serum
(FBS), allowing complete media to be used during production. This has major advantages
including 1) no longer requiring serum starvation of cells to prevent FBS contamination
which is the current method used in the field, 2) nutrient and waste exchange through the
pores resultant from the constant flow-through of fresh media, and 3) constant production
and vast increases in the number of exosomes produced compared to standard multi-plate
cultures. In one week, the equivalent number of EVs as would result from 80 to 100,
145mm cell culture dishes at 80% cellular confluence may be produced. The yield of EVs
ranged from 24-26 µg/ml with the use of the FiberCell system and only 8-12 µg/ml when
using the conventional isolation method (Figure 2A.2).
2A.3 Transmission Electron Microscopy (TEM)
Formvar coated copper grids were glow discharged for two minutes to facilitate EV
binding and even distribution upon deposition. 6 µL of purified EVs were loaded onto each
grid and allowed to dry for three minutes followed by removal of the excess sample.
Nanovan vanadium negative stain (6 µL) was then added to the grid and allowed to rest for
one minute when excess was removed and the grids were then incubated for five minutes
at room temperature (RT). Samples were then analyzed by a Tecnai G2 Spirit transmission
electron microscope (FEI Inc., Hillsboro, Oregon, USA)
2A.4 Immunogold
EVs were deposited onto a formvar coated copper grid after glow discharge with
excess removed after 3 minutes and allowed to incubate at RT for 7 minutes. All washing,
blocking, antibody treatments, and gold nanoparticles binding steps were performed by

67
Figure 2A. 2 FiberCell Systems® high-density hollow-fiber bioreactor system
The picture is of the FiberCell® unit purchased and utilized for some EV experiments in
this thesis. The close-looped system allows for cells located on the external surface of the
capillaries to produce EVs that remain uncontaminated from complete medium flowing
through the internal aspect of the capillaries. The 3-D architecture, release from the
requirement of serum-free media, and continual culture all allow for the production of EVs
far superior to conventional methods. Indeed, FiberCell can produce 2-4 times the quantity
of EVs as compared to conventional isolation via ultracentrifugation.
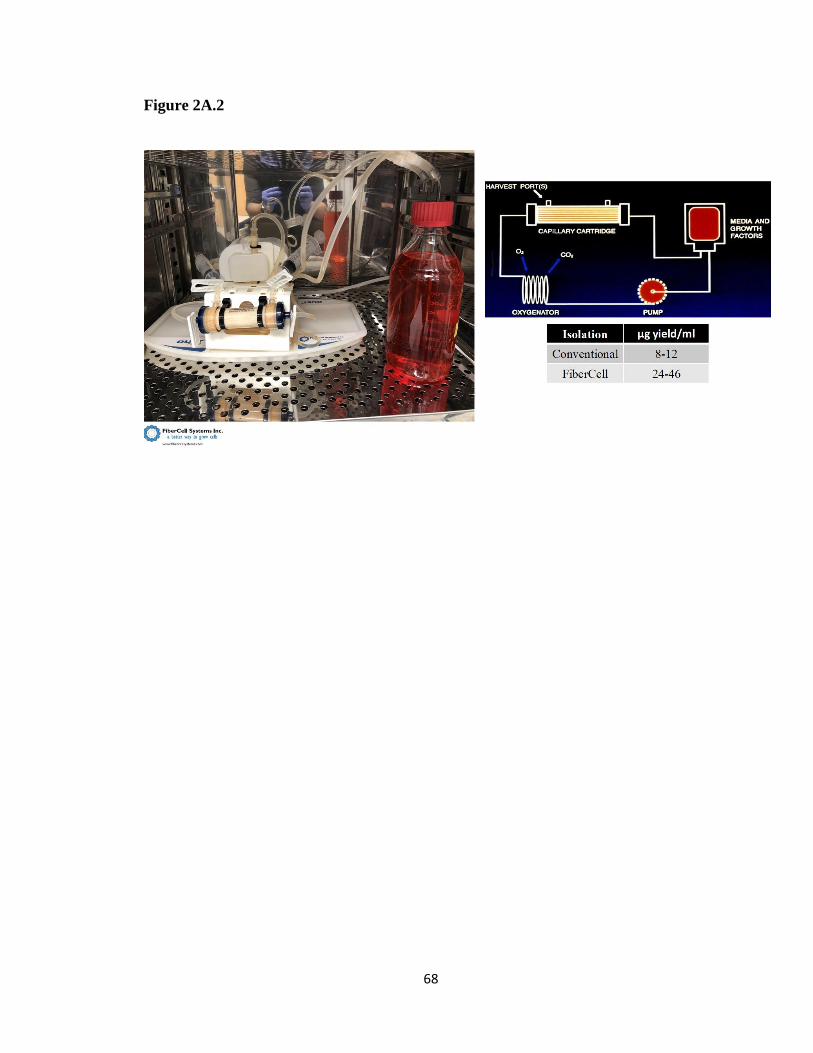
68
Figure 2A.2

69
floating the grids containing EV samples on 100 µl droplets of the solution with the side
containing sample facing the surface of the droplet at RT. Briefly, the grids were washed
with PBS 2min X 3 and blocked with 3% goat serum for 30min. They were next washed
2min X 3 in 0.1% BSA-c then transferred to an antibody droplet and allowed to incubate
for 1 hour at RT while covered to prevent evaporation (antibodies dilutions made in 0.1%
BSA-c with specific dilution concentrations predicated on target of interest. Isotype control
species antibodies or no primary antibody deposition served as controls for all immunogold
experiments). Grids were again washed with .01% BSA-c 2min X 6. They were next
incubated with Protein-A conjugated 10 nm gold nanoparticles (AuNPs) (Nanocs GP10-
PA-1) at a 1:25 dilution in 0.1% BSA-c for 1 hour. They were washed with 0.1% BSA-c
2min X 6 and then with PBS 2min X 3. Antibody and protein-A binding were fixed with
2% glutaraldehyde for 5min, washed with deionized water 2min X 6, and subsequently
were prepared for TEM analysis as described above (Figure 2A.3).
2A.5 Atomic Force Microscopy (AFM)
The overall negative charge of EVs was exploited for depositing them on positively
charged mica substrate modified with aminopropylsilatrane (APS) and prepared as
described in previous publications 218. EV samples (5 µL) were left to incubate for a total
of 2 min. Excess samples were washed with DI water and dried under argon flow. AFM
images were acquired using a MultiMode AFM NanoScope IV system (Bruker
Instruments, Santa Barbara, CA, USA) operating in tapping mode with a 1.5 Hz scanning
rate using a TESPA-300 probe from Bruker with a resonance frequency of 320 kHz and a
spring constant of about 40N/m. Images were processed using the FemtoScan Online
software package (Advanced Technologies Center, Moscow, Russia).

70
Figure 2A. 3 Schematic of the immunogold TEM staining protocol

71
Figure 2A.3

72
2A.6 Nanoparticle Tracking Analysis (NTA)
The concentration, size, and size distribution of the purified EV samples were
measured with a NanoSight LM10 Nanoparticle Analysis System and processed with NTA
2.3 Analytical Software (Amesbury, Wiltshire, UK). The purified samples were diluted at
1:200 in PBS. A 1 mL syringe was used to inject the particle chamber with the diluted
sample for NanoSight LM10 readings. For all samples, 60-second videos were recorded
with the shutter speed set to 250 and gain at 680, and subsequently analyzed.
2A.7 SERS Measurement
Ti/Au 40 nm/100 nm coated 25mmx75mmx1.1mm microscope slides were
purchased from Deposition Research Lab Inc. (St. Charles, MO, USA) 10 nm AuNPs
coated with Branched Polyethyleneimine (BPEI) were purchased from nanoComposix,
Inc. (San Diego, CA USA). A 250 uL amount of 10-nm-diameter Au nanoparticles were
centrifuged at 5500RPM for 10 minutes and the supernatant subsequently removed. The
pellet was suspended with 250 uL of 2 mM Borate Buffer and this mixture was spun at
5500 RPM for 10 minutes. The supernatant was again removed and the pellet was
suspended in 250 uL of 2 mM Borate Buffer. EVs from each cell line were then added to
the mixture in a 1:1 ratio. These samples (5 µL each) were dropped onto the gold slides
and allowed to incubate overnight at room temperature. They were allowed to dry
completely and then stored at 4°C prior to SERS measurement.
The SERS measurements were conducted using a commercial microscope
(Renishaw InVia Reflection, Wotton-under-Edge, United Kingdom) with 785-nm diode
laser excitation. The laser power was set to be 10 mW. The laser beam was focused by a

73
50×microscope objective with a numerical aperture of 0.75 (Leica n PLAN EPI 50×/0.75.
Buffalo Grove, IL, USA) to a spot size of around 1 μm in diameter. They were recorded
with an acquisition time of 1s and accumulated 10 times.
2A.8 SERS spectra processing and Principal Component –Discriminant Function
Analysis
The raw spectra were baseline corrected via the Vancouver Raman algorithm with
5-point boxcar smoothing along with fifth-order polynomial fit. Normalization of spectra
was conducted via the standard normal variant method thus removing multiplicative error
while maintaining the same level of contribution to the measurement for each spectrum 219.
The preprocessed spectra were then analyzed by the PC-DFA method utilizing the
“mixOmics” package in R software. The PCA reduced the dimensionality of the SERS
spectrum from 1004 variables (from 719 cm-1 to 1800 cm-1) to 20 PCs. These 20 PCs were
further analyzed by DFA for the development of a classification model. Classification
efficacy was evaluated by cross-validation and external validation for the cell lines and
patient serum samples, respectively.
2A.9 EV surface proteomics
EV surface protein profiling of the EV proteins was conducted through an outside
partner, System Biosciences Inc (SBI). EVs isolated from four pancreatic cancer cell lines,
CD18/HPAF, MiaPaCa, T3M4, and Capan1 as well as EVs isolated from an immortalized
normal human pancreatic ductal epithelium cell lines, HPDE were used for these
experiments. Briefly, 100 µg of purified EVs were treated with proteinase-A to cleave the
surface proteins from the external surface of the EV membranes and the EVs were
separated from the cleaved proteins via size exclusion chromatography. The cleaved

74
surface proteins were treated with trypsin to facilitate proteolytic cleavage into peptides at
lysine and arginine residues. Purified peptide samples were analyzed via liquid
chromatography-tandem mass spectrometry (LC-MS/MS). Given the possibility of
ultralow concentrations of proteins present on the EV surfaces, two peptides were set as
the determiner cutoff for the presence a protein, in an effort widen the size of the initial
pool utilized for subsequent analyses. Of note, EVs isolated from the Capan1 cell line were
excluded from further analyses due to Golgi-marker 130 (GM-130) protein being present,
which is not found in EVs and is a marker of cellular contamination.
2A.10 Bioinformatics Pipeline
Surface proteins identified by LC-MS/MS from HPDE EVs were compared to the
pooled protein population found on all cancer cell line EVs. Proteins shared between the
two populations were subtracted from being possible targets. Remaining proteins within
the cancer population that were expressed on the surface of two or three of the cancer EV
populations were considered for further analysis. The expression level of the genes
encoding each protein was compared between PDAC tissue and adjacent normal tissue
from 45 individual patients in the publicly available GSE28735 dataset. The genes with the
greatest difference between the two tissues were further paired down by determining which
were able to make a Receivers Operator Characteristics (ROC) curve with the largest AUC
using The Cancer Genome Atlas (TCGA) dataset. The target genes were then assessed for
cancer stage-based expression level, correlations, and impact on survival as well as
pathway analysis in both datasets. Further, GO analysis was performed on the EV surface
proteins to determine their functional implications 220.
75
2A.11 Sandwich enzyme-linked immunosorbent assay (ELISA)
The in-house ELISA assay was produced as previously described 221. Briefly, a 96-
well microplate was coated with .25ug/well of capture antibody against an EV target
protein (i.e. CD63, EPHA2, TSG101) diluted in carbonate buffer (0.05M, pH 9.2). The
microplate was allowed to incubate overnight at RT then washed X 3 with phosphate-
buffered saline and 0.1% Tween-20 (PBS-T) in an automated plate-washer. The plates
underwent blocking with 3% filtered bovine serum albumin (BSA) in PBS for 3 hours at
37oC and again washed 3 times. EVs purified from cell lines or patient serum samples were
diluted with 1% BSA, added to each well (in duplicates), allowed to incubate overnight at
4oC, and again washed 3 times. A mixture of biotinylated anti-CD63 and ant-CD9
antibodies diluted 1:2500 in 1% BSA served as the detection cocktail and incubated at 37oC
for 2 hours. After washing, Pierce Streptavidin conjugated Poly-HRP (Thermo Scientific)
was added to each well, covered, and allowed to incubate for 30 minutes at RT, then
washed the final 3 times. 3,3′,5,5′-Tetramethylbenzidine (TMB) solution was deposited
into each well and allowed to react in the dark for 20 minutes at RT. 1M sulfuric acid was
used to stop the reaction and absorbance at 450 and 650 nm was measured. Further EPHA2
measurement in cell line EVs, patient serum, and patient serum EVs was conducted with a
commercial kit (RayBio®).
2A.12 Lectin array
A 40-lectin array (RayBiotech) was used to investigate possible cancer-specific EV
glycan patterns. EVs isolated from HPDE and CD18/HPAF were used to discriminate
possible targets. Amines and azides inhibit the biotinylation reaction thus EV samples were
dialyzed in PBS (pH 8.0) using a floating rack, dialysis tubes provided, and a stir plate.
76
The first dialysis period was 3 hours, fresh buffer was added, and continued overnight at
4oC. BCA protein analysis was then completed and 30µg of sample was biotinylated with
the reagents provided according to the manufacturer’s recommendations. The glass slide
containing the lectin array was blocked for 2 hours, blocking solution decanted away, and
10 µg of biotinylated sample added and to each well and incubated overnight at 4oC. The
slide was washed and incubated with Cy3 equivalent dye-streptavidin for one hour at room
temperature. The slide was washed, dried with compressed N2, and sent to the manufacturer
for fluorescence measurement.
2A.13 Isolation of genomic DNA from EVs
DNA was extracted from HPDE and Panc1 EVs using QIAamp DNA Micro Kit
(Qiagen) according to the manufacturer's instructions. DNA was quantified with a
NanoDrop One spectrophotometer (Thermo Scientific). 130ng of EV DNA was
subsequently utilized for KRAS G12D and TP53 R273H mutation analysis by digital
PCR.
2A.14 Mutation detection by digital droplet polymerase chain reaction (ddPCR)
Two probe-based mutation detection assays were conducted for KRAS G12D and
TP53 R273H mutants in genomic DNA isolated from HPDE and Panc1 EVs: respective
probe sequence COSMIC_ID and unique assay ID are as follows: KRAS G12D -
COSM521, dHsaMDV2510596; TP53 R273H – COSM10660, dHsaMDV2010109.
Mutant target and WT assays are provided mixed together, with FAM conjugated to the
probe for the mutant allele and HEX attached to the probe for the WT allele. The reaction
mixture was made containing 10µl probe supermix, 1µl probe, 1µl restriction enzyme, and
130ng EV DNA diluted in 10µl nfH20 (22µl total). (Of note, sample DNA was able to be

77
digested directly in each ddPCR reaction with 5 units of HaeIII restriction enzyme diluted
in 1µl of dilution buffer at room temperature prior to thermocycling). Sample mixture and
70µl of droplet generation oil were added to a DG8 cartridge and droplets generated with
the QX200 automatic droplet generator. After droplet generation, samples were carefully
transferred to a 96-well ddPCR plate, sealed, and underwent thermocycling with the
following conditions: Enzyme activation at 95oC for ten minutes – 1 cycle, denaturation at
94oC for 30 s followed by annealing/extension at 55oC for 1 minute – 40 cycles, enzyme
deactivation at 98oC for 10 minutes – 1 cycle, and held at 4oC indefinitely. All cycles were
conducted with a 2oC ramp rate. QX200 ddPCR droplet reader and QuantaSoft Software
were used for data acquisition and analysis.
2B Radiation potentiation via ferroptosis for the improved treatment of pancreatic
ductal adenocarcinoma
2B.1 Bioinformatics
The expression levels of genes of interest were analyzed in publicly available RNA
sequencing data from PDAC patients within The Cancer Genome Atlas (TCGA) acquired
from the UCSC Xena portal (http://xena.ucsc.edu) as well as in the GSE2783 (preprocessed
with R-preprocessing and affy package version 1.50.0) microarray dataset. TCGA was
additionally used for elucidation of genes of interest effects on survival. Further, MiPanda
222 and Gepia 223 webserver tools were used to investigate the expression of GPX4 and
SLC7A11 with a merged dataset containing TCGA data and GTEx cell lines sequencing
data. The protein-protein interaction information was extracted with the Biological General
Repository for Interaction Datasets (BioGRID) homo sapiens database 224. Along with this,
78
Project DRIVE (a database built to uncover cancer genetic dependencies with large scale
deep RNAi screening) was used to investigate the effects of SLC7A11 inhibition in the
setting of PDAC 225.
2B.2 MTT
The cytotoxic effect of Erastin treatment was assessed using a 3-(4, 5-
dimethylthiazol-2-yl)-2, 5-diphenyl tetrazolium bromide (MTT) assay. 2,500 cells were
seeded per well in a 96-well plate and allowed to adhere and proliferate for 24 hours. Two
plates were treated with Erastin at various concentrations (100 nM – 10 µM) for 24 and 48
hours. Subsequently, 10ul of MTT (5mg/ml PBS) was added to each well and incubated
for 3-5 hours at 37oC. The media was aspirated out of each well and replaced with 100 µl
DMSO and mixed vigorously to release the intracellular contents. Cytotoxicity values were
measured with a Spectramax 190 (Molecular Devices) microplate reader at a wavelength
of 520 nm.
2B.3 In vitro cell migration assay
The ability of Erastin to inhibit CD18/HPAF cell migration was tested using a
wound-healing assay. Cells were seeded in each well of a six-well plate and allowed to
gain 80-90% confluence. A 1-ml pipet tip was used to make cross-pattern scratches in the
cell cultures at which point fresh media with different concentrations (0, 1, 5, and 10 µM)
of Erastin were deposited into three wells for technical replication. Pictures of the
cruciform scratch were taken at 0, 24, 48, and 72 hours and the percent wound closure
recorded at each time point.
2B.4 Immunohistochemical staining of human tissues

79
Formalin-fixed normal pancreas, PDAC, and irradiated PDAC tissues were
embedded in paraffin and sectioned at 5 µm thickness. Slides were incubated overnight at
58oC and deparaffinization of tissue sections was facilitated 10 min X 4 incubations in
xylene with subsequent rehydration via sequential graded ethanol (20-100%). A solution
of 3% hydrogen peroxide and methanol was used for 30 minutes to quench endogenous
peroxidases. Then, sections were deposited into 90OC 0.01% citrate buffer (pH 6.0) for 15
minutes for antigen retrieval. Once the samples cooled to room temperature, they were
washed with PBS and blocked with horse serum for 2 hours (IMMPRESS kit; Vector
Labs). The sections were incubated overnight in primary antibody (either anti-GPX4 at
1:500 dilution in PBS or anti-SLC7A11 at 1:500 dilution in PBS). They were washed in
PBS for 10 minutes x 4 and incubated with universal anti-rabbit/anti-mouse peroxidase-
labeled secondary antibody (IMMPRESS kit; Vector Labs) for 1 hour at room temperature.
Slides were again washed and developed via DAB as a substrate. Hematoxylin counterstain
was applied and slides were washed with tap water. Subsequently, they underwent
dehydration with decreasing ethanol concentration (100-20%) and finally incubated in
xylene for 5 minutes. The slides were mounted with permount mounting medium (Fisher
Scientific) and photographed using an EVOS FL Auto Microscope (Life Technologies).
Slides were graded by a licensed pathologist and H-scores were obtained by application of
the formula: 3 x percentage of cells with strong staining + 2 x percentage of cells with
moderate staining + percentage of cells with weak staining resulting in a range of 0-300.
2B.5 siRNA knockdown and transient transfection
Glutathione peroxidase 4 (GPX4) siRNA was purchased from Ambion with
sequences as follows; sense: GGCAAGACCGAAGUAACUtt; antisense:

80
AGUUUACUUCGGUCUUGCCtc. Cells were seeded in a six-well plate 24 hours prior to
transfection. They underwent serum starvation for 4 hours when Lipofectamine 2000
reagent (Invitrogen) was used for transient transfection as per the manufacturer’s protocol.
Six hours following transfection, serum-containing media was added to the wells. Proteins
were collected or all experiments (i.e. colony-forming assays) were performed 48hours
post-transfection to allow for optimal GPX4 KD.
2B.6 In vitro irradiation
Cells were plated in T75 flasks and allowed to become 50-60% confluent. A linear
accelerator in the Radiation Oncology Department at the University of Nebraska Medical
Center was utilized to irradiate the cells. Flasks were placed onto the LINAC couch within
a 40 cm2 radiation field on the top of a 10 cm solid water block (a material used for radiation
beam calibration). X-rays were delivered with 6MV at 2.73 Gy min-1 through the bottom
of the flask (aspect containing the cell monolayer) which was located 100cm from the X-
ray target. Cell lysates were collected at 6, 12, 24, 48, and 72 hours post-radiation exposure.
2B.7 In vitro radiation response determination
Colony survival assay was used to determine the effect of radiation and the ability
of Erastin (Tocris) to act as a potentiator. Briefly, 500 cells/well were seeded in triplicates
in separate 6-well plates and treated with various concentrations of Erastin (0.0, 0.1, 0.5,
1.0, and 2.0 µM). The separate plates were exposed to different dosages of radiation (0, 1,
3, 5, and 7 Gy) and allowed to proliferate until the no treatment control colonies were in
close proximity to each other and were near to merging. Cells were washed, fixed in
MeOH, and stained with 0.4% crystal violet in 25% MeOH. Colonies (defined as >50 cells)
were counted for each well separately and the numbers associated with each technical

81
replicate (same radiation and Erastin doses) were averaged. The colony numbers from each
experimental condition were divided by the total colonies in the no treatment control to
yield proportional survival. The log of the proportional surviving fraction was plotted
against radiation dose. The linear-quadratic model used to fit the clonogenic survival curve
for each experimental condition was Y=e^-[α*X+β*X2]. Where α and β were calculated
according to the Fertil method 226, which was also used to determine the radiation
enhancement ratio (ER) (i.e. the area under the curve) for each Erastin concentration. The
ER was calculated as the ratio of the mean inactivation dose without any drug divided by
the mean inactivation dose under various experimental conditions such as Erastin treatment
and differing cell lines) where values >1 are indicative of radiation sensitization. This was
plotted using GraphPad Prism (GraphPad Software Inc., La Jolla, CA, USA).
2B.8 Combenefit analysis
Erastin synergistic and/or additive effect on radiation-induced cell death was
determined with the publicly available Combenefit web server 227. This free software
analyzed the colony survival assay data with three known synergy assessment methods:
Highest single agent (HSA) 228, BLISS 229, and Loewe 230 models. The interpretation of
synergy scores can be assumed as follows: < -10 is considered likely antagonism, -10 to
10 is considered likely additivity, and >10 is considered likely synergism. The Combenefit
package offers myriad graphical representations of the survival and synergy scores and
from these, the contour and matrix views are presented herein.
2B.9 Patient-derived organoids

82
Patient derived organoids graciously supplied by Dr. Michael Bouvet from the
University of San Diego were revived and maintained in complete DMEM/F12 medium
supplemented with HEPES [Invitrogen], Glutamax [Invitrogen], penicillin/streptomycin
[Invitrogen], B27 , Primocin [1 mg/ml, InvivoGen], N-acetyl-L-cysteine [1 mM, Sigma
Aldrich], mouse recombinant Wnt3a [100ng/ml, EMD Milipore], human recombinant
RSpondin1 [1μg/ml, PeproTech], Noggin[0.1 mg/ml, PeproTech], epidermal growth factor
[EGF, 50 ng/ml, PeproTech], Gastrin [10 nM, Sigma], fibroblast growth factor 10 [FGF10,
100 ng/ml, PreproTech], Nicotinamide [10 mM, Sigma], and A83- 01 (0.5 mM, Tocris
Biosciences). Once healthy and proliferating the organoids were seeded into 4-wells each
(8 total) of two black walled 96-well plates.
2B.10 Patient derived organoid radiation response determination
After seeding, both plates of organoids were allowed to grow for 48 hours at which
point one well on each plate was treated with various concentrations of Erastin (0.0, 1, 2.5,
and 5 µM). One of the plates was irradiated with 5Gy radiation using a linear accelerator
in the University of Nebraska Medical Center Department of Radiation Oncology (as
described above) 24 hours after the initiation of Erastin treatment, and the other plate
remained radiation free. Organoids were then allowed to proliferate for 4 days and pictures
of each experimental condition were taken with an EVOS FL Auto Microscope (Life
Technologies) at 24, 48, 72, and 96-hour time points. At 4 days post-radiation treatment,
CellTiterGlo® 3D cell viability assay (Promega) to detect the presence and quantity of
ATP as an assessment of overall organoid survival. The assay was conducted according to
the manufacturer’s recommendations and luminescence measurements were taken with a
SynegyNeo2 Multimode Reader (BioTek). The relative luminescence was compared

83
between the no treatment control and the various experimental conditions and plotted using
GraphPad Prism (GraphPad Software Inc., La Jolla, CA, USA).
2B.11 In vivo orthotopic xenograft model
Eight-week-old nude mice were used for orthotopic implantation of CD18/HPAF-
L luciferase transfected cells. Mice were anesthetized by intraperitoneal injection of
xylazine (10mg kg-1) and ketamine (100mg kg-1) and a laparotomy performed on the left
lateral flank to expose the head of the pancreas. 2.5 X 10⁵ CD18/HPAF-L cells were
suspended in 50 µl of PBS and injected into the head of the pancreas and the incision
closed. Monitoring of tumor growth was performed via in vivo bioluminescence imaging
using the Xenogen IVIS-100 (Xenogen Corporation) after intraperitoneal injection of D-
luciferin (150 mg kg-1) while mice were anesthetized with isoflurane.
2B.12 Treatment plan and experimental design
On day 10 post-implantation, the mice were randomized into four groups of five
mice each, based on luminescence intensity on IVIS imaging. Group 1: no treatment
control, Group 2: Radiation only, Group 3: Erastin (SelleckChem) only, and Group 4:
Radiation plus Erastin. A total of 42 Gy of radiation was administered to groups 2 and 4 in
six fractions over the course of six sequential days in a Strahl Small Animal Radiation
Research Platform (SAARRP). This unit provides onboard 3D volumetric image guidance
via high-resolution cone beam-CT for target localization and dose delivery. In addition, the
precision beam radiation source can be arced around the animal, thus conferring conformal
dose distributions in three dimensions with limited off-target dose spillage. The tumor and
other tissue contouring, isocenter, beam arrangements, and dose calculations were
conducted with MuriPlan Software (Figure 2B.1). Beginning post-implantation day 14

84
(radiation day 4) groups 3 and 4 received intraperitoneal injections of Erastin (25 mg kg-1)
for 6 consecutive days. IVIS monitoring was conducted again at days 18 and 26 at which
point it was determined the no treatment group tumors were getting to a size that required
sacrifice. On post-implantation day 29, all animals were sacrificed and the tumors
harvested and weighed. The University of Nebraska Medical Center Institutional Care and
Use Committee approved the procedures for all experiments performed with mice.
2B.13 Glutathione assay
A GSH/GSSG ratio and detection assay kit (Fluorometric – Green, Abcam) was
used to determine the total glutathione (GSH) present in cells after treatment with Erastin
and radiation exposure as per the manufacturer’s protocol. Briefly, Panc1 and CD18/HPAF
cell lines were treated with Erastin and irradiated and cells were collected and lysed after
24 hours. These lysates were next deproteinated with 4M perchloric acid (PCA) and
subsequently neutralized with 2M KOH to prevent enzymatic degradation of cellular GSH.
Total glutathione was measured with a provided dye that fluoresces only in the presence of
GSH. Fluorescence was measured at excitation/emission wavelengths of 490/520 nm using
a SynegyNeo2 Multimode Reader (BioTek) and has been reported in this thesis as the
relative proportional fluorescence of Erastin and radiation treatment groups compared to
no-treatment controls.
2B.14 Measurement of reactive oxygen species production
Cells undergoing ROS evaluation were first washed with PBS and a 10 μM solution
of H2DCFDA in HBSS was added to each well of a 96-well plate and allowed to incubate

85
Figure 2B. 1 Small animal radiation machine and treatment planning
A. Still image captured from a video of the Strahl Small Animal Radiation Research
Platform (SAARRP). This image displays the ability of the radiation source to
circumnavigate the treatment couch where the mouse is positioned to provide increased
dose delivery to the tumor while limiting off-target delivery. B. A screenshot of the
MuriPlan software displaying the capability of the real-time CT imaging and determination
of the dose isocenter relative to tumor location. Importantly, the software also allows the
user to visualize the percentage of the prescribed dose (in our case 7Gy) received within
the colored contours. For example in the image provided, the tumor is falling within the
red-colored line and thus is receiving the entire 7Gy prescribed dose.

86
Figure 2B.1
87
for 30 minutes at room 37oC in the dark. Non-fluorescent H2DCFDA is cleaved by
endogenous esterases into the DCF which is trapped inside the cell and is oxidatively
sensitive. When DCF interacts with ROS it gets oxidized into the fluorescent dye
fluorescein. The fluorescence was visualized using the Cy3 filter with an EVOS FL Auto
Microscope (Life Technologies) and the intensity was assessed at an excitation/emission
of 480/529 using a SynegyNeo2 Multimode Reader (BioTek).
2B.15 Intracellular free iron (Fe2+) assessment via FeRhoNox™-1
The effect of radiation and Erastin treatment on the level of unbound catalytically
active iron (Fe2+) was determined via assessment with FeRhoNox™-1 (Goryo Chemical)
as per the manufacturer’s protocol. Briefly, the solid dye was reconstituted with 109 µl of
DMSO to make a 1mM stock solution. This was diluted with Hank’s Balanced Salt
Solution (HBSS) to make a 5 µM working solution. Cells under the previously described
experimental conditions were washed twice with HBSS and 100 µl of the 5µM FheRhoNox
solution per well was added and allowed to incubate at 37oC for 1 hour. The fluorescence
was measured at excitation/emission of 520/570 nm using a SynergyNeo2 Multimode
Reader (BioTek).
2B.16 In vitro assessment of lipid peroxidation via BODIPY™ 581/591 C11
Lipid peroxidation was determined by measuring the alteration in the fluorescence
of C11-BODIPY 581/591 from red to green 231. Cells were seeded on slide coverslips at
the bottom of a 12-well plate. They were treated with 1 µM or 2 µM Erastin, 5Gy radiation,
or both, and lipid peroxidation was assessed at 12 and 24-hour time points. 10µM of C11-
BODIPY dye (Invitrogen) was added to the cells (diluted in DMEM) and they were
allowed to incubate for 30 minutes at 37oC. They were then washed with PBS and nuclei

88
stained with DAPI mounting media and mounted onto slides. Cells were imaged with a
710 Confocal Laser Scanning Microscope (Zeiss) and dye fluorescence analyzed via Zen
software (Zeiss). Determinations regarding the red/green ratio are the result of three
independent location measurements in each sample.
2B.17 Thiobarbituric acid reactive substances (TBARS) assay
When lipid peroxidation cannot be directly visualized (i.e. when the system being
evaluated is a cancer patient), byproducts of peroxidation such as malondialdehyde (MDA)
can be used as a surrogate marker to estimate the relative level of lipid peroxidation. A
commonly used method of doing so is with a thiobarbituric acid reactive substances
(TBARS) assay232. When TBA and MDA interact, they form an adduct that can be
measured in a colorimetric or fluorometric manner. A TBARS assay was purchased and
used according to the manufacturer’s protocol (Caymen Chemical). For the experiments in
this thesis, 100µl of irradiated patient serum samples were pipetted in sealable 5 ml vials
and the equivalent volume of SDS solution was added then mixed. 4 ml of the provided
TBARS reagent was added to each vial, which was subsequently placed in a styrofoam
floating rack and boiled in water for one hour, then incubated on ice for 10 minutes. After
incubation, the samples were centrifuged for at 1,600G at 4oC for 10 minutes then allowed
to come to room temperature. 150 µl from each vial was loaded in duplicates into a 96-
well black-walled plate for fluorometric evaluation. Fluorescence was measured at
excitation/emission wavelengths of 530/550 nm with a SynegyNeo2 Multimode Reader
(BioTek).

89
Chapter 3: Overview of Extracellular Vesicle
Surfaceome and its Implications in Cancer

90
Chapter 3: Overview of the extracellular vesicle surfaceome and its implications in
cancer
3.1 Biogenesis
All mammalian cells and human tissues secrete membranous-organelles
nanometers in diameter which are collectively classified as extracellular vesicles (EVs) 233.
This group is comprised of two primary vesicle populations, exosomes (50-150 nm) and
microvesicles (100-1000 nm), distinguished by separate mechanisms of biogenesis. EVs
begin as the inward budding of late endosomes to create a multi-vesicular body (MVB)
harboring intraluminal vesicles (ILVs). The MVB is trafficked to and fuses with the plasma
membrane, releasing its ILV content into the extracellular space where these vesicles are
referred to as EVs 234 (Figure 3.1). Conversely, microvesicles are the results of direct
plasma membrane budding into the extracellular space and subsequent release 235.
Traditionally, size-based classifications for EVs and microvesicles were utilized in studies.
However, a preponderance of evidence has shown that overlap in sizes can lead to the
assumption of homogeny in an incredibly heterogeneous vesicle population in relation to
biogenesis 236, vesicular content 237, and biological functions 238.
While the author recognizes that these categorical differences are important,
biologically pertinent, and warrant further investigation, they lie outside the purview of
this thesis. Along with this, many studies specifically investigating “exosomes” were doing
so in the setting of size-based categorization which may inadvertently yet incorrectly
muddle the differences between attributable vesicle subpopulation contents and functions.
Vesicles of different origin with synonymous size ranges harbor synonymous biophysical
attributes including size, density, and membrane orientation making disparate populations
difficult to differentiate 239. Thus, the reference of “extracellular vesicles” will be used as
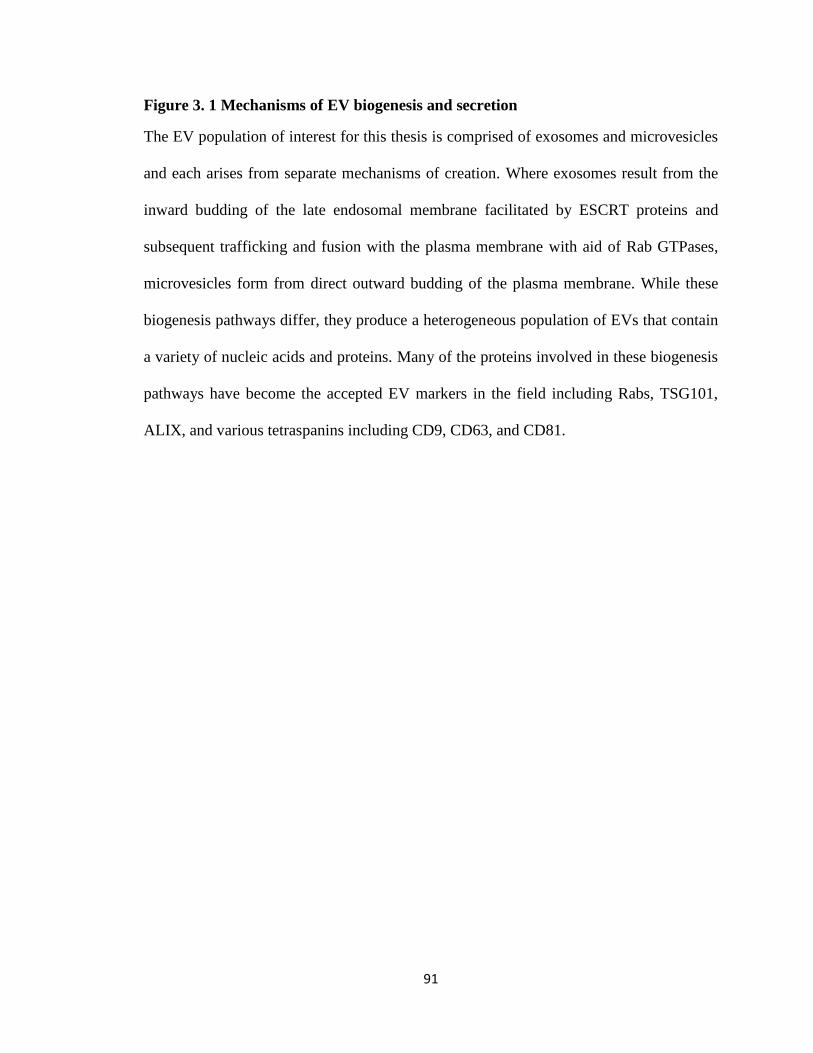
91
Figure 3. 1 Mechanisms of EV biogenesis and secretion
The EV population of interest for this thesis is comprised of exosomes and microvesicles
and each arises from separate mechanisms of creation. Where exosomes result from the
inward budding of the late endosomal membrane facilitated by ESCRT proteins and
subsequent trafficking and fusion with the plasma membrane with aid of Rab GTPases,
microvesicles form from direct outward budding of the plasma membrane. While these
biogenesis pathways differ, they produce a heterogeneous population of EVs that contain
a variety of nucleic acids and proteins. Many of the proteins involved in these biogenesis
pathways have become the accepted EV markers in the field including Rabs, TSG101,
ALIX, and various tetraspanins including CD9, CD63, and CD81.

92
Figure 3.1

93
an all-encompassing nomenclatural designation, unless otherwise specified throughout the
manuscript.
One of the best-studied mechanisms of EV biogenesis is the endosomal sorting
complex required for transport (ESCRT) family of proteins (ESCRT 0-III) 240. The
ESCRTs, along with other proteins including tumor susceptibility gene 101 (TSG101) and
ALIX, are required for cargo sorting and the formation of ILVs within the MVB (Figure
3.1) 234. For years these proteins were used as EV specific markers, however, all of these
complexes are required for other vesicular formation events and are not exclusive to EV
biogenesis 240, 241. Additionally, tetraspanins, such as CD9, CD63, and CD81 have also
been shown to impact EV cargo packaging as well as MVB formation 242-244. Of note, these
are the consensus markers and most frequently used metrics by which the presence of EVs
is assessed. After ILV formation, transport of MVBs throughout the cell, as well as to the
plasma membrane, is facilitated by Rab GTPases 245 including Rab35 246 and Rab27a/b 247.
Finally, Rab11 248 and soluble N-ethyl-maleimide-sensitive fusion attachment protein
receptors (SNAREs) 249 facilitate MVB membrane fusion with the plasma membrane.
Conversely, ESCRT independent EV biogenesis has also been reported. Trajkovic
et al. found that vesicular contents form separate subdomains on the membrane of the late-
endosome and observed that the molecular cargo present within these subdomains required
the sphingolipid ceramide for transport into vesicles, sans the requirement of ESCRT 250.
Along with ceramide, further implicating the role of lipids in EV biogenesis is the enriched
of a variety of other lipid species in EV membranes, as compared to their cell of origin,
including phosphatidylserine (notably often with reverse orientation) 251, sphingomyelin
252, phosphatidyl inositides 253, and cholesterol 254. Indeed, the presence and orientation of

94
specific lipid moieties are shown to be required for vesicular biogenesis. For example,
syndecan/syntenin complex-mediated phosphatidic acid manipulation, which requires
phospholipase D (PLD2), is required for ILV formation (again, independent of ESCRT)
255. Congruently, ARF6, a small G protein that activates PLD2, mediates microvesicle
formation and shedding from the plasma membrane 235. Finally, Cholesterol and
sphingomyelin interaction with ostreolysin A (OlyA), a cholesterol/sphingomyelin
nanodomain binding protein, which is required for the formation of MVs 256. Notably,
many of the aforementioned sorting machinery, mechanisms, and molecular species are
shared between exosome and microvesicle biogenesis 257.
3.2 General Contents and Functions
EVs were originally thought to have only one function, which was providing a
means of cellular waste disposal and the removal of contaminants 258. However, it was
discovered decades later that these entities harbor a variety of molecular species that impact
recipient cell functions. Some of the initial examples of this were antigen presentation and
the associated molecules including MHC Class I 259 and MHC Class II 260 from monocytes
and B lymphocytes, respectively. Understanding of EV content continued to evolve when
it was discovered that they contain deliverable mRNA and miRNA that remain functional
when delivered to target cells 261. Since the time of these important initial findings, EVs
have been found to contain many deliverable biologically impactful molecules including
proteins 262, nucleic acids 263, and lipids 264 (Figure 3.2).
EV mechanisms of creation and selective cargo sorting necessitates that their
components reflect the cell of origin and produce vesicles with shared intrinsic properties.
Some of the specific EV protein contents include adhesion molecules, such as integrins,

95
Figure 3. 2 EV surface and intravesicular content
The surface of EVs is decorated with a wide array of proteins including the aforementioned
tetraspanin markers, immunoregulatory molecules such as PDL-1 and MHCs, annexins,
and adhesion proteins such as integrins. However much of the research to date has been
completed on the intravesicular content of EVs and its implications in cancer. EVs can
harbor metabolically active enzymes, a variety of nucleic acid species including DNA,
mRNA, miRNA, and lncRNA, biogenesis molecules ALIX and TSG101, and many
proteins with chaperone functions or signaling capabilities.

96
Figure 3.2
97
which are present in many EV subpopulations 237. Mentioned previously, as a result of their
biogenesis, these vesicles harbor various tetraspanin markers, namely CD9, CD63, and
CD81 243, which have become the consensus markers for EVs throughout the field. Other
proteins involved in ILV formation, cargo sorting, and trafficking are found including Rab
GTPases 245, TSG101, and ALIX 265. Additionally, membrane-binding proteins such as
annexins 266 and carbohydrate-binding proteins such as galectins 267, are also present in
EVs. Along with these, heat-shock proteins, including HSP70 and HSP90, are often
observed 268. Signaling molecules are also often present such as EGFR 269 and HIF-1α 270.
Along with proteins, a variety of nucleic acid molecules are frequently present
within EVs. These include microRNA (miRNA) 271, messenger RNA (mRNA), long non-
coding RNA (lncRNA), and circular RNA (circRNA) 272. The deposition of the different
RNA types into the recipient cells (either by receptor-mediated endocytosis of the EVs or
direct membrane fusion) can alter endogenous gene expression patterns 261. Along with
these, single-stranded DNA (ssDNA) and double-stranded DNA (dsDNA), 273 from
genomic and mitochondrial sources have also been found in vesicles 274. Kahlert et al.
found EVs to contain genomic DNA spanning all 23 chromosomes as well as harbor
identifiable mutant (mt) KRAS and mtP53 DNA 275. One of the primary roles that EVs fill
includes cell-to-cell communication 276. An elegant experiment by Lai et al. utilized
fluorescent-tagged mRNA within a donor cell being packaged into EVs, the fluorescent
EVs subsequently were observed in the tumor microenvironment (TME) and were taken
up by recipient cells, where the fluorescent-tagged mRNA was still able to be detected 277.

98
While many of the EV constituents' functional implications have not yet been fully
appreciated they have attributions to cellular homeostasis 278. EV components have proven
capable of altering recipient cell functionality via delivery of their cargo 279, target cell
signaling initiation 280, and propagation of disease process 281. With these discoveries, EV
implications in cancer progression 282, metastasis 283, 284, and drug resistance 285 have
become an incredibly ubiquitous and highly informative area of research. Many of these
EV functions are influenced or are directly facilitated by the vesicle surface and its
necessary interaction with a target cell 286. However, heretofore, a preponderance of studies
and reviews have focused on the functional implications of cancer EVs ascribed to
intravesicular cargo transfer 287, 288. Further, traditional methods of EV assessment have
often neglected to segregate the intravesicular vs. surface constituents. With this
dissertation, I aim to highlight the recent investigations into the EV surfaceome in the
setting of cancer and subsequent elucidation of EV surface-specific isolation techniques,
characterization techniques, surfaceome effects on cancer biology, EV biomarkers, and
therapeutic implications.
3.3 Surface-based Isolation Methods
The recognition that EVs possess cancer-associated surface characteristics has led
to the emergence of myriad novel surface profiling techniques. These methods often exploit
surface features such as the presence of specific target proteins, lipid composition, and
carbohydrate moieties for EV isolation, characterization, or a combination thereof. Some
of these are the simple product of the new application of old technology to EVs while others
have been fabricated and engineered from the bottom-up. This section will give examples
of the EV surface profiling methods heretofore attempted.

99
3.3.1 Traditional EV Isolation Techniques
One of the most commonly utilized EV isolation methods is sequential
ultracentrifugation (UC), first outlined by Théry where conditioned media or biological
fluid specimens are subjected to multiple centrifuge steps that increase in speed and relative
gravitational force 289. This method first removes unwanted cellular contaminants from the
vesicle population (i.e. cell membrane particles, apoptotic bodies, etc.) and then vesicles
are pelleted at very high rotation speeds topping 100,000G. A sucrose gradient can be
utilized to further differentiate the vesicle population predicated on size and relative density
289. This is the most frequently used isolation method for EVs and is considered the current
gold standard. However, this method is incredibly time-consuming, expensive, requires
large starting samples volumes, and special equipment. The ultracentrifugation process can
also lead to EV clustering upon pelleting under such force, thus making it difficult to
suspend the individual vesicles in solution. This clumping can diminish overall EV yield
as well as hinder downstream analyses (e.g. flow cytometry, ELISA, SERS) and functional
studies (e.g. target cell uptake) 290.
Another frequently used method is commercial EV isolation kits that utilize
polymer-based precipitation and subsequent column isolation, which facilitates high-
throughput and facile EV isolation from conditioned media as well as biological fluid
samples 291. However, these commercially available kits, while efficient at removing EVs
from solution, can be contaminated by various non-EV debris including apoptotic bodies
and cellular plasma membranes, protein aggregates (e.g. bovine serum albumin (BSA)
from media 292, albumen and lipoproteins from serum 293, Tamm-Horsfall protein in urine
294, lipids from non-vesicular sources, and extra-vesicular nucleic acids.
100
Another traditional method involves the incorporation of isolation predicated on
size through modification of various techniques including size exclusion chromatography
(SEC) 295, ultra-filtration 296, and microfluidics. For example, the application of
microfluidics to an obstacle array can be utilized for vesicle isolation with a specific size
cutoff 297. The combination of microfluidics and size exclusion filters is also able to
efficiently separate EVs based on the size as well as decrease exogenous protein
contamination within the sample 298. A new technique pioneered by the Lyden group uses
asymmetric flow field-flow fractionation (AF4) for size-based EV isolation 238, 299.
Interestingly, this method yielded a new subpopulation of EV (< 50 nm in diameter), which
has been termed an “exomere” 238. Two main problems persist when considering size-based
isolation methods: 1. size is not mutually exclusive to a specific subpopulation (i.e. size
overlap between exosomes and microvesicles). 2. an inherent lack of site-specificity, which
is important when considering EV use as biomarkers or as vehicles for therapeutic delivery.
3.3.2 Surface-based techniques for EV isolation
Other methods have begun to take advantage of various EV surface characteristics
including protein content, lipid composition, and surface charge. Importantly, the exposed
EV surface is amenable to interaction with lipid probes, antibodies, lectins, heparin-binding
proteins, and aptamers. In addition, these vesicles often harbor a negative surface charge
(as measured by ζ-potential), thus making them behave in a predictable manner when
interacting with an electric field or charged particle. All of these features allow for the
incorporation of EV surface features into novel isolation techniques with increased
specificity and the capability of direct isolation from biofluids without the need for prior
UC.

101
3.3.2.1 Immunoaffinity
The EV surface proteome has become one of the primary methods by which
vesicles are isolated from various biofluids and/or cell culture supernatant. The majority of
these techniques utilize immunoaffinity capture methods in some manner. Usually, these
involve surfaces functionalized with antibodies against EV surface proteins including
printed antibody arrays on various substrates (e.g. glass or metal slides), antibody decorated
magnetic beads, and antibody decorated latex beads. Samples containing EVs (i.e. biofluids
or conditioned media) can be directly deposited onto the antibody decorated substrates, or
beads can be added directly into the solution. The antibodies can then be pulled out of
solution via centrifugation or a magnet. Aside from the obvious time saving and simplicity
of direct isolation, another primary benefit of these surface isolation techniques as
compared to conventional ultracentrifugation is that individual EV’s can be chemically
released from the antibody functionalized substrate/beads with minimal morphological or
structural changes and subsequently utilized for functional experiments.
Many of the first attempts at EV surface protein-based isolation techniques utilized
the consensus tetraspanin markers including CD9, CD63, and CD81 for vesicle
sequestration. Specifically, magnetic beads decorated with antibodies against these three
proteins have proven capable of separating EVs from solution. Isolation and release of EVs
by magnetic beads were determined to be superior to that of conventional techniques
including ultracentrifugation and polymerization kits, as determined via flow cytometry,
immunogold TEM, and western blot 300. While this technique allows for facile and
immediate isolation from fluids, it still requires a release step where some EVs may be lost
or damaged, and EVs must undergo an additional processing step for further analyses, i.e.

102
rebinding to latex beads for flow cytometry assessment. A slightly different approach
involved EVs isolated from conditioned media directly with anti-CD9, anti-CD63, and
anti-CD81 functionalized latex beads with these vesicles able to be directly assessed by
flow cytometry 301.
The same direct assessment capabilities have been demonstrated with other EV
specific proteins. For example, anti-epithelial cell adhesion molecule (EpCAM), another
known EV protein, coated beads have successfully isolated EVs 302. Also, vesicle capture
with anti-EpCAM on a solid substrate, in combination with microfluidics, has also proven
capable of adequate EV isolation and can facilitate further vesicle characterization by SEM,
AFM, and SERS 303. Along these same lines, a synthetic peptide capable of binding
canonical heat-shock proteins (venceremin, Vn) also proved capable of adequately
isolating EVs directly from samples and was multiparametricly validated 304. Though quite
promising and a needed step towards facile EV isolation, immunoaffinity capture with a
single antibody (our few antibodies) may be too selective and will prevent the acquisition
of EVs which lack the known surface protein. In conjunction, large scale isolation can be
difficult and large antibody cocktails are quite cumbersome and diminish reproducibility.
3.3.2.2 Heparin isolation techniques
One of the alternatives to immunoaffinity EV capture that has recently been brought
to light takes advantage of studies interpreting the effect of heparin sulfate proteoglycans
(HSPGs) on vesicular uptake in target cells. HSPGs are known cell-surface receptors whith
structural homology to heparin 305. It has been shown that ligand binding to HSPG on the
cell surface can be blocked by the addition of heparin. The addition of heparin has proven
capable of preventing the uptake of labeled EVs into target cells 306 and further, mitigate

103
EV mediated migration of cancer cells when added contemporaneously with EVs 307.
Congruently, HSPG expression on the surface of cells was found to be required for
recipient cell uptake of EVs 308. These findings led Balaj et al. to investigate if heparinized
agarose beads can bind to vesicles for large scale and facile isolation 309. Indeed, EVs from
conditioned media as well as human serum could bind to and be isolated by heparin beads
with 60% efficiency compared to conventional UC. This binding was prevented when
beads were pre-washed with a heparinase solution. They validated these findings via
western blot, TEM, and RNA yield/quality. Further, the isolated EVs were subsequently
labeled with red fluorescent lipid dye and their internalization was not hindered by this
isolation process 309. Thus, heparin isolation provides a platform for the investigation of all
EVs from a sample, agnostic of protein expression.
3.3.2.3 Lipid nanoprobes
Another surface-based isolation method seeks to exploit the enrichment and altered
orientation of lipid species in EVs as compared to parental cells. Lipid probes, which
tightly intercalate with EV phospholipid bilayers, can be conjugated to a variety of species
including magnetic beads or biotin to facilitate isolation. One such probe used a biotin-
conjugated 1, 2-di-stearoyl-sn-glycero-3-phosphoethanolamine-poly (ethylene glycol)
(DSPE-PEG) probe which tagged EVs from serum-free cell culture supernatant as well as
human serum 310. NeutrAvidin coated magnetic particles were added to the solution and
were able to bind to the biotin-conjugated lipid probes and separate EVs from the
media/serum. This lipid nanoprobe was able to rapidly and efficiently isolation EVs with
a dramatic reduction in the procedure time (as compared to UC) to only 15 minutes 310.

104
Microfluidics, in conjunction with lipid probes conjugated to a substrate with a
silica nanostructured surface, has proven capable of efficient vesicle isolation 311. This
method was able to isolate EVs and characterize the intravesicular DNA content (measured
by KRAS point mutations) directly from pancreatic cancer patient serum samples 311.
Along the same lines, another group was able to immobilize individual EVs on PEG-lipid
“brushes” conjugated to a silica surface 312. Another interesting microfluidics-lipid-based
assay is ExoChip®, a commercial product from the company BioTEK, and is marketed as
an on-chip isolation method that is capable of both quantifying and characterizing
circulating EVs. It accomplishes this by targeting exposed phosphatidylserine (PS) on the
surface of EVS (a lipid species that is normally on the intracellular leaflet of a plasma
membrane unless undergoing apoptosis 313) with the PS specific protein, annexin V 314. A
unique aspect of this design is the simple procedure for the release of EVs from annexin V
with Ca2+ chelation. While this assay was capable of isolating 90% of cancerous EVs (and
a larger total quantity than an anti-CD63-functionalized system), it also isolated 38% of
healthy EVs, thus limiting its use for diagnostic and functional assessment of cancerous
vesicles 314. Importantly, Annexin V functionalized beads have been utilized for flow
cytometry analyses 315 as well as another PS specific protein Tim4 316.
All of the surface-based isolation techniques heretofore discussed have proven to
be simple tools for easy and timely EV isolation in vitro as well as from human biofluids.
Efficient yield, minimal impact on surface features, and maintenance of a vesicular
structure, coupled with ease of release and vesicle recovery, allows the EVs isolated with
these methods to be utilized for subsequent analyses. Congruently, surface-based isolation
allows for the preservation of EV functional characteristics, organ specificity, and

105
propensity to interact with target cells, which are required for EV use as therapeutic
delivery systems (discussed later in the text). These combined advantages are causing
surface isolation and characterization methods to become preferred over traditional means
and as such, they are becoming more ubiquitous throughout the field. What remains to be
seen is if these isolation methods are specific enough to be viable separation methods for
research as well as in the clinic. Immunoaffinity based assays are limited by the fact that
only a certain number of EVs express the target proteins and those that do express them
have variations in the quantity. Thus, immunoaffinity can yield a heterogeneous EV
population in regard to biogenesis, tissue/cell of origin, or pathological involvement. While
the lipid composition is different in EVs as compared to parental cells, these lipid species
are not mutually exclusive to EVs, thus allowing for the possibility of diminished assay
specificity.
3.4 Surface-based characterization techniques
Given the promise of the surface-based isolation techniques described in the
previous section, many have been mingled with existing technologies to yield more
efficient, lower cost, timely, and specific profiling assays. Specific techniques include;
mass spectroscopy (MS), which has been able to elucidate a vast array of protein, glycan,
and lipid targets for EV isolations and/or profiling. Microfluidics, which has provided an
excellent means of increasing sample volumes tested and increases the ability of
multimarker assessment within a single sample. Surface plasmon resonance (SPR), flow
cytometry, and labeled-nanoprobe studies, which have improved quantitative analysis of
specific EV proteins in total populations as well as on individual vesicles. Surface-
enhanced Raman spectroscopy (SERS), which has proven capable of assessing the EV

106
surface in a labeled (antibody-mediated) or label-free manner. Finally, various electro
kinetic and impedance-based biosensors, which have been able to semi-quantitatively
assess EVs in a facile and reproducible manner.
The remainder of this section will describe some of these methods used to profile
the EV surfaceome. The discussed studies are not an exclusive or exhaustive list, yet seek
to emphasize some of the key examples of techniques utilized for surface-based
characterization of EVs. Further, many of these techniques are used to determine EV
associated cancer biomarkers, which will be further highlighted within that section.
3.4.1 Mass spectrometry
Mass spectrometry (MS) has been in existence and utilized for many years for the
discernment of protein components within a sample. This sensitive technique has
successfully been applied to extracellular vesicles in an effort to determine their general
(internal and external) protein content 317. These studies have shown that EV proteins are
dramatically altered predicated on the conditions under which the originating cell exists
including stress 318, immune-inflammatory state 319, and pathological state such as cancer
320. These differences have thus provided valuable insight into disease processes including
oncogenesis, tumor progression, and metastasis as well as provided novel targets for EV
based biomarkers.
Though few in number, recent studies have utilized LC-MS/MS to determine the
surface proteomic profile of EV populations. These studies have provided valuable insight
into the morphology as well as possible functions of EVs after cellular uptake. One such
study utilized a triple proteomic profiling method that combined LC-MS/MS of in vitro

107
purified EVs analyzed directly, after proteinase K surface protein separation, and after
biotinylation with trypsin digestion followed by subsequent column-based separation 321.
Notably, luminal proteins are not affected by enzymatic digestion due to the protection
from the vesicle membrane, thus this method allowed for the identification of proteins
expressed on the vesicular membrane as well as presumptions about the membrane location
of these proteins (luminal or external surface). They found a distinct population of proteins
on the vesicle surface relative to the intravesicular contents. Interestingly, they found that
some of these proteins could have a “reverse topology” where the cytosolic domains were
located on the superficial aspect of the vesicle surface. Unexpectedly, surface proteins were
enriched in nucleic acid binding proteins and nuclear proteins (i.e. histones). These MS/MS
findings were further verified via flow cytometry and fluorescent microscopy 321 and this
was one of the first studies to elucidate the luminal and external proteomic differences.
Surface-specific proteomic profiling of EVs isolated from a variety of biofluids
have also been conducted. MS/MS analysis of serum EV surfaces have yielded specific
proteomic signatures used to isolate cancer-specific vesicles from patient samples 322.
Urinary EV surface proteomes have also been investigated and it has been found that at-
least forty-nine proteins are unique to the urinary vesicle surface 323. Further, these results
corroborated the aforementioned Cvjetkovic et al. findings that vesicular surface proteins
may have an inverted topology compared to expected cellular membrane orientation. The
majority of these surface proteins were glycosylated, much like cell-surface proteins,
implying similar protein-protein interactions and functional mechanisms 323. Thus
providing another aspect of surface profiling that may be elucidated via mass spectroscopy,
that of glycosylation status.

108
With the realization that one of the primary topographical constituents of EV
membranes are carbohydrate moieties, it stands to reason to investigate and characterize
their glycosylation profiles. One such study outlined and utilized an approach with
MALDI MS to measure the number and quantity of N-glycans of urine EVs after enzymatic
digestion and permethylation 324. They found Paucimannosidic, high-mannose, and
complex type glycans in the EV samples and further structural details of N- as well as O-
glycans were assessed via LC-MS/MS 324. A materials engineering approach taken by
another group allowed for further clarification of their MS/MS illuminated glycoproteome
associated with EVs by utilizing a hydrazide thermosensitive polymer that selectively binds
to N-glycans 325. The polymer couples with oxidized glycoproteins present in solution and
self-assembles into large aggregates that fall out of solution at room temperature and may
be pelleted via centrifugation. These polymer chains decouple and again become soluble
when heated. Thus, facilitating the selective enrichment of the N-glycans present within
the mixture. This technique was applied to EVs isolated from healthy and glioma patient
serum samples by with a commercial isolation kit and found that 26 N-glycoproteins to be
significantly different between the two populations 325.
Another application of mass spectroscopy that has proved advantageous for EV
surface characterization is lipid constituent assessment. Many studies have found
differential lipid compositions in EVs relative to parental cells 252, 254. Ratiometric increases
in the relative amounts of many lipid species have been realized between parental cell
membranes and EVs including cholesterol, sphingomyelin, ceramide, phosphatidylserine,
and phosphatidylethanolamine 326, 327. Lipid species differences have also been observed
between vesicle subpopulations such as exosomes (enriched in glycolipids and free fatty

109
acids) and microvesicles (enriched in ceramides and sphingomyelins) 328. Importantly,
several studies have profiled the lipid content of EVs isolated from human biofluids
including urine and found differences between cancer and healthy cohorts 329. Of note, co-
isolation of lipid droplets and lipoproteins present a problem for many of these MS
techniques and as such, require further laboratory validation.
The majority of these LC-MS/MS EV studies conducted to date have focused on
the presence of proteins and glycosylations, agnostic as to their location. The select few
that have chosen to focus on the surface proteome/glycome and EV membrane lipidome
have proven the capability of this global technique to identify unique surface features
linked to specific EV populations, both in vitro as well as in patient samples. Increased
application of mass spectroscopy could provide novel insight into the proteomic, glycomic,
and lipidomic differences observed in EVs isolated from various biofluids and in different
pathological settings, including cancer. This, in turn, could identify novel biomarkers,
improve isolation capabilities, help discern EV functions in target cells, and aid in the
understanding of how EVs interact with their surroundings. One must remain cognizant
that MS data can be muddled and much uncertainty persists upon data collection. Any
result found with these methods must be further experimentally validated.
3.4.2 Microfluidics
Microfluidics platforms have become integral to EV isolation and content
assessment. When combined with antibodies, lectins, or aptamers microfluidic platforms
offer an easy and high-throughput method of profiling the EV surface. Importantly, this
technique can be combined with various electrochemical analyses to improve overall
sensitivity and population characterization. One study utilized immunoelectrophoresis to

110
detect EV bound antibodies via alterations in surface ζ-potential, without the requirement
of fluorescent labeling 330. Additionally, microfluidics facilitates ease in multiplexed
analyses within a single sample involving the quantitative detection of specific markers.
Vaidyanathan et al. used a tunable alternating current electrohydrodynamic method to
detect multiple cancer-associated molecules including epidermal growth factor receptor 2
(HER2) and prostate-specific antigen (PSA) 331. Concurrently, He et al. has produced a
microfluidics platform for the concurrent analysis of EV surface and internal contents 332.
The design incorporates an integrated cascading circuit of analytical procedures including
immunoisolation (surface protein profiling), EV lysis, protein immunoprecipitation
(intravesicular protein profiling), and chemifluorescent sandwich assays. They were able
to apply this technology for the direct assessment of EVs in patient plasma samples,
accurately characterize EV subpopulations based on surface proteins, and determine
Insulin-like growth factor 1 receptor (IGF-1R) phosphorylation status 332.
3.4.3 Flow cytometry
Flow cytometry is an ideal candidate for individual vesicle analyses with the simple
yet impactful caveat that EVs are too small to be accurately assessed. Therefore, many
different methods have been proposed to increase the accuracy and reproducibility of flow
cytometry analysis 333, 334. Many of these methods evolve directly from the antibody
functionalized beads used for EV isolation by flow cytometry 301, 302, 335. In these instances,
EVs can be isolated directly from the media or patient sample with EV consensus proteins
and subsequently profiled with a second probe antibody/antibodies against a protein(s) of
interest. A profile of protein expression on EV populations can be compiled specifically
for discriminating the tissue of origin and/or pathological involvement (i.e. cancerous vs

111
non-cancerous). However, due to the possibility of multiple EVs binding onto a single
bead, or not harboring both distinct analytes for antibody binding, this method is considered
to be only semi-quantitative.
Evolving from this notion, Yoshioka et al. produced an assay coined “ExoScreen”,
whereby EV specific antibodies on two distinct photosensitizer beads are combined to
produce a fast and facile profiling technique 336. Briefly, streptavidin-conjugated donor
beads are bound to a biotinylated antibody against an EV protein of interest. A second
bead-antibody conjugate for the same EV specific protein will act as an acceptor bead. The
first bead (donor) is excited with a laser, which releases oxygen causing the excitation of
the second bead (acceptor) when in close proximity (within 200nm). This proximity
requirement is a benefit, particularly when one is hoping to assess smaller EV populations
such as exosomes and smaller microvesicles, and improve the accuracy of quantitative
assessment 336.
Another evolution from standard bead-based flow cytometry is the recent
development of high-resolution flow cytometry (hr-FC). This is a technique with great
potential in profiling EV surfaces because it is a mass through-put method capable of
analyzing individual EV in a multiparametric fashion. Perhaps most importantly, hr-FC
has a dynamic range of size assessment within the EV range (50-1000nm), thus abrogating
the requirement of bead conjugation a priori 337. Unfortunately, the reproducibility of EV
characterization via hr-FC is minimal and attempts are still being made and standardizing
fluorescent labeling methods and inter-instrumental variations 338. For instance, highly
concentrated samples can cause an underestimation of particle number 339. Never-the-less,
with the inherent benefits hr-FC possesses, along with the potential of combining with

112
affinity-based methods, this is a technique that holds great promise in the future of
individual EV surfaceome analysis.
3.4.4 Surface plasmon resonance
Surface plasmon resonance (SPR) is a long-known method for the sensitive
detection of molecular components within a sample. Importantly, SPR sensors can be
functionalized with antibodies against a protein of interest 340, lectins for carbohydrate
moieties 341, or aptamers reactive to particular nucleotide sequences 342. Given the potential
it has of specifically identifying and quantifying a wide array of biological molecules,
coupled with its long-time use for sensitive detection, SPR has recently been used to
characterize EV surfaces 343, 344. For example, Gool et al. found that SPR analysis was
capable of detecting far more antibody-EV pairs compared to flow cytometry, due
primarily to high blank and isotype control signals in the latter technique 345.
Recently, localized SPR (LSPR, where light is incident with metal nanostructures
thus producing an extremely high electromagnetic field in the local environment which can
be detected with an interferometer 346) has been highlighted as an ultrasensitive technique
that is an excellent method of assessing EV surfaces with aptamer conjugated metal
nanoparticles 347 or with nanostructured metal surfaces 348. Interestingly, one group was
able to optically differentiate via LSPR, exosomes from microvesicles, without the
requirement of a functionalized antibody using a self-assembled monolayer of gold
nanoislands (SAM-AuNIs) 349. Conversely, Wang et al. were able to use labeled LSPR (i.e.
aptamer reactive to CD63 for capture and conjugated gold nanoparticles AuNPs) to isolate
and characterize EVs with AuNP proximity ligation (via aptamer interaction) signal
amplification 350.

113
3.4.5 Surface-enhanced Raman spectroscopy
Surface-enhanced Raman spectroscopy (SERS) is another ultrasensitive technique
predicated on vibrational patterns of molecules present within a sample producing inelastic
photonic scattering that is amplified by the presence of surface plasmon on a noble metal
surface 351. Scattered photons are identifiable to the molecular species with which they
interact, thus yielding a highly specific spectral shift 352. In the label-free SERS approach,
Raman shifts are measured from endogenous molecules present within the EV samples.
While these spectra necessarily depend on the vibrational patterns of the molecules present,
the abundance of molecular species and heterogeneity of the system produce an intensely
complex pattern. A myriad of statistical methods have been applied to deduce EV
population-specific patterns such as principal component analysis (PCA) 353 and partial
least squares discriminant analysis (PLS-DA) 354, within the Raman spectra. Nanoparticle
alterations (i.e. silver-shelled AuNPs) have been produced that increase the specificity of
label-free signals thus facilitating accurate population discrimination 355. Conversely, the
labeled SERS approach uses mAB conjugated metal nanoparticles to increase assay
specificity when a specific marker is known 356. This comes with the obvious requirement
of knowing the molecule that you looking for, and in the case of cancer-associated species,
remains quite elusive.
Recent progress in the SERS field has allowed for the analysis of individual
vesicles, rather than the bulk EV solution. Many of these use optical tweezers to trap
vesicles and conduct SERS measurements on each distinct vesicle 357. This technique was
able to further categorize CD9+ EVs into subpopulations based on Raman shifts as a
function of differences in surface molecules including proteins, lipids, and nucleic acids
114
358. One of the primary benefits that may be attributed to individual vesicle analysis is
increasing the discriminatory potential between distinct populations, whether that is within
the same biological sample or within the same sample grouping such as serum from healthy
donors or cancer patients.
3.4.6 Nanoprobes
One of the most prevalent of these techniques involves brute force investigation of
EV surfaces by large numbers of antibody arrays. In a large study involving 431 lung
cancer patient samples and 150 healthy controls, an antibody array consisting of 49
different mABs was used to capture EVs from serum samples 359. The arrays were then
probed with detection antibodies against the consensus EV markers CD9, CD63, and CD81
and surface proteins were identified that separated cancer patients from controls based on
area under curve (AUC); CD151: AUC = 0.68; CD171: AUC = 0.60; and tetraspanin 8
(TSPAN8): AUC = .60) 359.
Yang et al. engineered a surface profiling method called Exosome-Oriented
Aptamer Nanoprobe-Enabled Surface Proteins Profiling and Detection (ExoAPP) 360. EVs
are immobilized onto surfaces of aldehyde sulfate beads and treated with the ExoAPP
nanoprobes, which are linked to quenching graphene oxide (GO) surfaces conjugated to
fluorescent aptamers. When aptamers come into proximity with EVs they preferentially
bind the proteins of interest thus restoring fluorescence. Once the signal is measured,
DNase can be used to digest the aptamers thereby facilitating repeat probing for different
targets in the same EV population. This sequence can then be repeated with different
aptamers thereby facilitating multi-marker profiling and delineation of patterns between
disparate populations (i.e. healthy vs cancer). This has allowed for ultrasensitive protein

115
marker detection and profiling (as few as 1.6 x 10⁵ vesicles) 360. Similarly, another group
combined microfluidic size separation with γ-DNA/aptamers protein assessment and
machine learning, to yield a profiling assay predicated on EV EpCAM and Her2 expression
361.
In an effort to detect ultralow quantities of proteins on individual vesicles, Wu et
al. composed a proximity-dependent barcoding assay (PBA) to sensitively assess the EV
surface proteome 362. They selected 38 protein targets which are converted to DNA
sequences by antibodies conjugated to DNA. The bound oligonucleotide conjugates
polymerize with rolling circle amplified (RCA) protein tags and amplified by PCR. The
amplified RCA-PBA complex is decoded with next-generation sequencing (NGS), which
identifies the specific proteins present within the sample 362. This elegant fusion of
immunoaffinity and barcoding techniques was able to discern distinct surface protein
patterns predicated on cells of origin, even at ultralow quantities as determined by the
percentage of the total sample. The group posited this assay could improve EV
characterization studies by first identifying the tissue from whence the vesicle originated
and isolating the population of interest from the myriad others within a biofluid sample.
Some researchers have begun to utilize lectin arrays to profile the surface glycome
of EVs 363. In an evolution from the traditional lectin array method, one study again took
advantage of RCA mediated conversion of EV surface molecules into DNA mediated
fluorescent detection moieties, but this time with lectin profiling of surface glycans 364.
Briefly, EVs were isolated via UC and deposited in hydrophilic wells. These EVs were
probed with various lectin-oligonucleotide conjugates (i.e. sialic acid, fucose, and
truncated O-glycans) and in situ RCA was performed for glycan signal DNA conversion

116
and amplification. They validated these findings with sialidase treatment and subsequent
re-analysis as well as flow cytometry. They were able to improve the limit of detection
(LOD) from traditional lectin array performance. The assay was able to distinguish
between vesicles arising from different cell sources (HeLa and Panc1 cell lines) based on
glycan signaling intensities (i.e. Siaα2-6Gal/GalNac and truncated O-glycans) as well as
differences between EVs and parental cell lectin affinities (i.e. Jacalin, PNA, & HPA) 364.
Thus, providing a novel method by which EV glycans can be monitored and their
functional impact investigated.
3.4.7 Biosensors
An increasingly wide variety of other biosensors take advantage of electrochemical
and physics principals to efficiently segregate and characterize EV surfaces. A
representative sample of some of these innovative and novel technologies including electro
kinetics, electro generated chemiluminescence, and thermophoretics are described thusly.
Electro kinetic microarrays combine alternating AC current dielectrophoretic
separation with aptamer/mAB capture for surfaceome profiling of vesicle subpopulations
requiring ultralow quantities of patient fluid 365, 366. Electro generated chemiluminescence
(ECL, materials/chemicals capable of emitting light in the presence of electro generated
redox reactants) combined with mAB functionalized electrode surfaces has also been
applied for the successful characterization of EV surfaces 367. Astoundingly, this group has
reported an ultrasensitive limit of detection (LOD) of 125 particles µL-1 with an in-house
ECL nanoprobe produced from Ti3C2 MXenes nanosheets 367.
Finally, thermophoresis is a phenomenon found in mixtures of distinct and movable
particles, where particle subpopulations behave differently in response to gradation in

117
temperature. In an elegant study, Liu et al. took advantage of this property of physics and
thermophoretically enriched from patient plasma samples and subsequently profiled their
surface with aptamers 368. These various biosensor technologies have been briefly
discussed herein to provide insight into some of the newer technologies that have the
potential to play a greater role in EV surface profiling in the near future.
3.5 Cancer Biology
Many studies have uncovered the role of EVs in cancer 287, 369. Unfortunately, most
of these neglect to differentiate between the intravesicular and surface contents of EVs
leading to a relative paucity in surface-specific studies relative to the compendium of EV
research. However, interactions that take place at the EV surface and cell surface interface
are critical in cancer biology as these are the initial events that dictate EV-cell binding
resulting in the eventual intake of vesicular contents or signal transduction 370. Conversely,
some of the surface molecules themselves are biologically active and thus can interact with
and affect the tumor microenvironment (TME) as well as augment the surrounding stroma.
This section will discuss some of the EV associated impacts on cancer biology that have
been attributed to the vesicle surface.
3.5.1 Signaling and crosstalk
EVs can directly interact with cell surface receptors without the need to deliver
their intravesicular cargo 371. The same holds true in cancer. HSP90α on the surface of
breast cancer EVs interacts with low-density lipoprotein receptor-related protein-1 (LRP-
1) receptor in an autocrine manner (of note, these EVs have a paracrine function and
interact with the surrounding stroma as well but will not be included in the crosstalk
subsection) 372. Conversely, EVs can also carry molecules on their surface which initialize

118
pro-tumorigenic signaling after internalization. Case in point, a highly-glycosylated form
of extracellular matrix metalloproteinase inducer (EMMPRIN) on EV surfaces initiates
p38/MAPK signaling after internalization 373. One of the most interesting aspects of this
particular study is that the putitive primary function of EMMPRIN is to induce MMPs in
the tumor microenvironment 374, yet the form found on the EV surfaces only had an effect
once internalized into cancer cells and did not induce MMP degradation of the TME 374.
Much of the cancerous phenotype including tumor initiation and progression is
propagated by crosstalk between the cancer cells themselves as well as between the
malignant cells and the surrounding tumor milieu 375, 376. EVs have a substantial role in
cellular crosstalk and the initiation of signaling events throughout normal homeostasis and
just as integral, if not to an even greater extent, in the setting of cancer 377, 378. There is a
paucity of studies regarding specifically the surfaceome yet some groups have begun to
investigate its impact on cellular communication. For example, heparin sulfate
proteoglycans (HSPGs) residing on the surface of tumor-associated EVs and recipient cells
have been found to be integral for EV uptake across different cell types 379. Christianson et
al. corroborated this finding and observed that HSPGs on the surface of EV are necessary
for both internalization and functional delivery of cargos including signaling molecules,
metabolites, and RNA 308. This led the authors to posit that HSPG could be a novel
therapeutic target for the treatment of cancer.
Another example of tumor EV crosstalk with the tumor microenvironment (TME)
is TGFβ-1 bound to the surface of tumor-associated EVs induced a migratory phenotype
in surrounding mesenchymal stem cells (MSCs) 380. Further, EV-TGFβ-1, which gets
trafficked into the cell and remains in the endocytic compartment, induced this phenotype
119
via SMAD dependent signaling for a longer period of time compared to free TGFβ-1 380.
In the same direction, a separate study uncovered that fibroblasts within the TME can gain
malignant characteristics including resistance to cell death and invasive properties (through
the FAK pathway) when exposed to tissue transglutaminase (tTG) cross-linked fibronectin
(FN) on the surface of EVs from breast cancer and glioma cell lines 381. Endothelial cells
can also be affected by tumor-associated EVs. E-cadherin on the surface of ovarian tumor
EVs has been shown to heterodimerize with vascular E-cadherin on the surface of
endothelial cells thus activating β-catenin and NFκB mediated angiogenesis 382.
Of course, cellular communication within the TME also occurs in the other
direction, from the surrounding stromal cells to the cancer cells. One study found that EVs
arising from senescent cells within the TME push breast cancer cells to a more aggressive
phenotype via EphA2 mediated interaction with ephrin-A1 at the surface interphase.
Ephrin-1 activation initiates reverse signaling through the Erk pathway leading to cell
proliferation 383. Congruently, glioma-associated stem cells (GASCs) release vesicles that
produce an invasive and migratory phenotype in glioma cells through the presence of
Semaphorin7A (SEMA7A) on the EV surface 384. This effect was mediated by SEMA7A
interaction with integrinβ-1 and activation of the focal adhesion kinase (FAK) pathway
leading to the increase in cell motility 384. Finally, EVs from cancer-associated fibroblasts
(CAFs) contain fibronectin which facilitates invasion and promotes anchorage-
independent growth of cancer cells 385. Interestingly, the promotion of invasion was not
accomplished when fibronectin was located inside vesicles but only when it was on the
surface via direct interaction with its receptor, integrin α5β1, thereby initiating the FAK
and Src family kinase pathways 385.
120
The TME is not the sole origin of EVs that interact with and affect cancer cells in
patients. Shtam et al. conducted a study with interesting implications. They found that
plasma EVs, isolated from healthy donors, were able to stimulate breast cancer
aggressiveness, again via FAK 386. By combining enzymatic EV surface modification
(trypsinization) with mass spectrometry, they deduced that this signaling was mediated by
EV surface proteins that had previously been shown to be involved in FAK signaling
including extracellular matrix protein 1 (ECM1), fibrinogen (FGA), and fibronectin (FN1)
to name a few 386. This study has far-reaching implications regarding the effects of normal
EVs on cancer cells, thus warranting further investigation.
3.5.2 Extracellular matrix remodeling
Augmentation and refinement of the extracellular matrix (ECM) surrounding a
tumor are required for migration, invasion, and metastasis 387. A few studies have shown
how the EV surfaceome facilitates some of the manipulations of the ECM compartment.
Proteases and glycosidases have been observed on the surface of EVs providing direct
implications of ECM remodeling 388. Slightly more nuanced is CD44+ EVs released by
tumors that can bind with hyaluronic acid (HA) and accumulate at the invadopodia, thereby
effecting stroma and increasing the ability of cancer cells to invade 389. EVs harboring
CD151 and Tspan8 on their surfaces have been shown to support matrix degradation and
activate the stromal cells to release a variety of cytokines and proteases that propagate an
invasive phenotype 390.
The ECM remodeling capability of EVs can be modified/enhanced with the
introduction of chemotherapy. Bandari et al. found that heparinase on the surface of EVs
collected from myeloma cells was impressively elevated after the administration of various
121
standard chemotherapies. The surface localization was a requirement to allow for
heparinase mediated degradation of heparin sulfate found in the ECM. Further, they found
that uptake of these EVs by untreated cells activated ERK signaling and caused a
concomitant increase in heparinase loaded EVs as well as enhanced shedding of the heparin
sulfate proteoglycan syndecan-1 (SDC1) 391. This is an incredibly informative finding with
huge implications in possible therapeutic resistance and/or disease recurrence.
3.5.3 Metastasis
One of the initial studies to delineate EV implications in cancer metastasis involved
the formation of a premetastatic niche by EVs released from pancreatic cancer cells in the
liver 392. This study, while not concerned specifically with the EV surface, was a seminal
finding in the field and ignited an explosion of research revolving around EVs in
metastasis. Following this, the same group discovered that integrins on the EV surface are
responsible for metastatic organ tropism 393. They showed that EVs from specific organ-
tropic tumor cells are selectively up taken by or cells within that organ to form a
premetastatic niche. Further, they were able to change the tropism of cancer by pretreating
with EVs from a different organ-tropic cancer (i.e. bone-tropic to lung-tropic), specifically
integrins α6β1 and α6β4 facilitate lung metastasis and integrin αvβ5 is correlated with
metastasis to the liver 393.
An addition to the EV integrin story was provided by Zhao et al. when they
investigated the role of two tetraspanins located on the EV surface previously implicated
in metastasis: Tspan8 and CD151 394. They found that metastasis was drastically reduced
in an MCA tumor induced in a Tspn8-/- and CD151-/- knock out (KO) murine model. Tspn8-
/-/CD151-/- EVs interactions with integrins, CAMs, and selectins were inhibited and cancer

122
cell migration and invasion were diminished. Along with this, no change in the growth rate
and survival of the primary tumor was observed. This resulted in the conclusion that
Tspan8 and CD151 mediate their metastatic enhancement via EV-Tspan8/CD151-
integrin/CAM interactions 394. Another group corroborated the notion that EVs facilitate
cellular adhesion and found that small EVs harbor extracellular matrix and adhesion
proteins 395. They went one step farther and observed that tumor cells that were deposited
onto surfaces coated with EVs showed and improved adhesion, thus displaying the
functional relevance of their findings 395.
3.5.4 Immune Impact
Seemingly contrarian to the majority of EV studies conducted in recent years, a
much larger proportion of research investigating the role of EVs on the immune system
specifically involves their surface. EV surfaces have been shown to contain
immunologically impactful molecules such as complement 396, MCH class I & class II 397,
and bioactive lipids 398, as well as act as damage-associated molecular patterns (DAMPS)
themselves 399. Conversely, responses mediated by immune cells can be mediated by EV
surfaces including PMN release of EV-neutrophil elastase (NE) 400, macrophage release of
EV-histones that activate toll-like receptor 4 (TLR4) 401, and myeloid-derived suppressor
cell (MDSC) chemotaxis facilitated by MDSC release of EV-CD47, TSP1, and SIRPα 402.
With the prevalence of EV surface-mediated immune effects, it is natural to
investigate some of these in the setting of cancer. Indeed, the EV consensus markers, CD9
and CD81, along with other tetraspanins including CD151, CD53, CD37, and Tssc6 seem
to have a defining role in antitumor immunity 403. B-cell surface antigens including CD19,
CD20, CD24, CD37, and HLA-DR are on the surface of EVs from B-cell lymphoma cell

123
lines, which could feasibly diminish the efficacy of immunotherapy 404. An incredibly
impactful finding was made in the field of EV immunology when it was discovered that
tumor-associated EV surface expression of PD-L1 contributes directly to tumor mediated
immune suppression in melanoma 405. It was also observed that EV-PD-L1 surface
expression was positively correlated with IFN-γ and modulates the effect of anti-PD-L1
therapies. Further, EV-PD-L1 expression can also be used as a predictor of response to
anti-PD-L1 therapy 405. This result was corroborated by the findings by separate groups 406,
407.
Another impactful study by Muller et al. found that the regulation of regulatory T-
cell (Tregs) functions mediated by tumor-associated EVs was facilitated by interactions at
the EV surface Cell surface interface and did not require EV uptake 408. Interestingly, other
immune cell types including B-cells, NK cells, and monocytes internalized many of the
EV originating from cancer cells but Tregs did not. This surface interaction sustained Ca2+
influx into Treg cells which translated increased conversion of extracellular ATP to inosine
by the Treg, thus suggesting functional consequences of the interaction 408.
3.6 Biomarkers
Liquid biopsy-based biomarkers for the successful detection of cancer in a less/non-
invasive manner has become a subject of increasing interest 409, 410. EVs hold many
advantages for use as liquid-based biomarkers. They are expressed by every tissue/cell in
the body and are present in almost all biofluids including serum/plasma 411, urine 412, breast
milk 413, semen 414, ascites 415 and bronchiolar lavage 416, and can even cross the blood-
brain barrier (BBB) 417. EVs also contain proteins, carbohydrates, lipids, and RNA/DNA
molecules that reflect their cell of origin and have a measure of tissue specificity 418. This

124
feature can be taken advantage of to provide a means for the peripheral assessment of
residing cancer. Importantly, many of these molecules can be found on the surface of EV,
which has led to the use of surface profiling and characterization for the diagnosis and
prognosis of cancer.
3.6.1 Proteins
A preponderance of the studies attempting to evaluate the potential of EVs as
biomarkers do so by characterization the surface proteome. Predefined antibody
microarrays are widely used for experimental biomarker discovery. An array of 49
antibodies against EV proteins found that NY-ESO-1, EGFR, PLAP, EpCAM, and ALIX
were able to prognosticate non-small cell lung cancer (NSCLC) patient survival 419.
Another prognostication study was able to accurately predict High-grade and low-grade
glioma patients using an array identified EV protein, syndecan-1 (SDC1), with a 71%
sensitivity (SN), 91% specificity (SP), and an area under ROC curve (AUC) of 0.81
(30679164). Another study used an antibody array on cancer cell line EVs [LIM1215-
colon cancer, MEC1- B-cell chronic lymphocytic leukemia (CLL)] to select protein targets
used to probe EVs isolated from CLL patient serum. A subset of the targeted proteins
including an assortment of tetraspanin markers and HLA molecules were expressed at
high-levels on the surface of CLL patient EVs and not expressed at all on those of healthy
individuals 420.
As eluded to in the profiling and characterization section found herein, mass
spectrometry can also be used as a global approach to identify EV surface proteins capable
of serving as biomarkers. However, special requirements are necessary, such as proteinase
K treatments and size exclusion chromatography to compare with untreated EVs, in order

125
to assure an external EV membrane location. For example, Castillo et al. used proteomics
to identify multiple pancreatic cancer EV markers: CLDN4, EpCAM, CD151,
LGALS3BP, HIST2H2BE, and HIST2H2BF. They were able to use antibodies against
these surface proteins to selectively isolate cancer-associated EVs from patient plasma, as
determined by the enrichment of detectable KRAS mutations 322. Glypican-1 is another
pancreatic cancer EV surface marker that was discovered by MS proteomics and verified
by flow-cytometry 421. Along with pancreas cancer, EV surface proteins identified by MS
and have also been able to facilitate target identification in gliomas (with surface location
validation conducted by proximity extension assays) 422 and colorectal cancer 423. Of note,
much more mass spectrometry proteomic assessment has been conducted on EVs but
almost all of them have been concerned with the complete vesicle proteome and the
proteins identified are unable to be specifically attributed to the EV surface.
Other protein profiling techniques have been utilized as well. Logozzi et al. used
an enzyme-linked immunosorbent assay (ELISA) to assess the levels of specific proteins:
CD63, Rab-5b, and caveolin-1 in EVs purified from melanoma patient serum. They found
a consistent increase in the expression level of CD63 and caveolin-1, as well as an increase
in the abundance of caveolin-1 within the CD63+ population, in EVs from cancer patient
serum as a comparison to healthy controls 424. High-sensitivity flow-cytometry is another
technical approach that has also been adapted to help identify cancer-associated proteins
on the surface of EVs. This study found CD147 expression to be significantly increased on
the surface of EVs from colorectal cancer patients as compared to healthy donors 425.
Another group utilized plasmonic profiling EVs from pancreatic cancer patients, to find a
five-marker signature able to predict patient cancer status with some accuracy. The assay

126
sensitivity of 86% and specificity of 81% offered produced higher accuracy than the current
gold standard marker CA19-9 426. Congruently, Liang et al. were able to use labeled LSPR
(i.e. anti-EphA2 mAB conjugated metal nanoparticles) to discriminate between healthy and
pancreatic cancer patient serum requiring only 1uL of sample 427.
3.6.2 Carbohydrates
Aberrant glycosylation of cells and the extracellular matrix in the setting of cancer
has been known for many years 428, 429 and the presence of glycans on the surface of EVs
has been discussed in previous sections. With this, investigations into the presence and
patterns of carbohydrate moieties on the surface of EVs have proven fruitful for use as
cancer biomarkers 430. For example, the presence of sialic acid on EV-CD133 isolated
from ascitic fluid of pancreatic cancer patients was linked with a better prognosis in
advanced-stage patients 431. In a related experiment, a lectin array that focused on tumor-
associated glycans such as sialic acids, fucose, and truncated O-glycans was able to
determine differential expression of surface glycans between EVs and parental cervical and
pancreas cancer cells 364.
Likewise, flow cytometry mediated lectin evaluation of melanoma EVs revealed an
increase in the presence of fucose and complex N-glycans with bisecting GlcNAc 432.
Along with the serum-based studies, urine N-glycosylation status was found to be
associated with EVs released in the setting of prostate cancer 433. The majority of these
studies are starting points of glycosylation-based biomarkers in cancer because just as with
proteins, many more studies involving EV glycosylation status have been conducted
without necessarily focusing on surface localization of the moieties.

127
3.6.3 Lipids
Lipids offer another means of EV population differentiation. Targeted lipidomic
analysis of EVs isolated from non-tumorigenic prostate cells and prostate cancer cells
elevation in the presence of fatty acids, glycerolipids and prenol lipids in the former while
the latter harbored more sterol lipids, sphingolipids, and glycerolipids 327. “Shotgun”
lipidomic profiling of EVs isolated from a different cancer type, colorectal, corroborated
these prostate cancer findings and found an increase in sphingolipids, sterol lipids,
glycerolipids, and glycerophospholipids 434. A final study applied lipid characterization to
the actual diagnosis of prostate cancer patients. The abundance of nine lipid species was
altered in urinary EVs isolated from healthy donors and prostate cancer patients. The two
lipids with the most differential expression levels were phosphatidylserine (18:1/18:1) and
lactosylceramide (d18:1/16:0), and when combined phosphatidylserine (18:0/18:2) were
capable of predicting patient cancer status with 93% sensitivity and 100% specificity 329.
Importantly, the overlap in lipid species between these two individual studies, while not
complete, reinforces the notion of selective lipid species incorporation into EVs and
supports their use as possible biomarkers.
3.6.4 Label-free
An increasingly ubiquitous label-free method of treating the EV surface as a cancer
biomarker is surface-enhanced Raman spectroscopy (SERS). This technique, in
combination with a variety of statistic methods discussed previously in the profiling
section, has allowed for the reproducible, non-destructive, and non-targeted assessment of
EVs isolated from cancer cell supernatant and patient samples. Examples include SERS
measurements and PCA analysis of EV surfaces isolated from NSCLC cells, which were

128
similar in pattern to SERS spectra of the EGFR protein. Thus, the authors concluded that
much of the cancer EV spectra is conferred by the presence of EGFR on the surface of the
EVs 435. SERS was again applied to cell line EVs and proved capable of distinguishing
between lung cancer and non-malignant origins with very high accuracy (95.3% sensitivity
and 97.3% specificity) 436. Another study took another step towards the application of
SERS technology to patient samples and involved SERS-based analysis of pancreatic
cancer cell line EVs that was used to train a PC-DFA (discriminant function analysis)
algorithm, which was subsequently applied to SERS spectra collected from EVs isolated
from patient samples. This method was able to predict patient status with up to 87%
accuracy for healthy controls and up to 90% accuracy for early pancreatic cancer 353. SERS
characterization has also been successfully applied to EVs originating from breast cancer
cells 437 as well as prostate cancer cells 438.
3.7 Therapy
A plethora of studies have investigated the use of EVs as a delivery vehicle for
various therapeutic molecules including cytotoxic drugs and inhibitory RNA with a variety
of loading techniques 439, 440. EVs have many advantages which make them ideal candidates
for cancer therapy including protection of intravesicular contents (i.e. prevention of RNA
degradation), minimal immunogenicity (especially when of autologous origin), ability to
be loaded with therapeutic cargo, and the capability of surface modification for selective
targeting 441. The methodology and effectiveness of these strategies lie much out of the
purview of this thesis, with the exception of the role the EV surface may play in the
facilitation of drug delivery or enhancement of vaccine potency.

129
3.7.1 The endogenous EV surface
Generally speaking, EV surface proteins are important for their pharmacokinetic
profile. EVs treated with proteinase k which significantly lowered the volume of
distribution as well as diminished EV lung localization, presumably through enzymatic
cleavage of integrin α6β1 442. This study highlighted the importance of the EV surface on
vesicle distribution and its use as a therapeutic delivery method. The distribution of
tetraspanin expression on the surface of EVs is another factor that contributes to target
selection and uptake 443. Another observation that holds immense therapeutic importance
is the fact that cancer cells seem to have a preference for the uptake of EVs originating
from themselves, that is, they possess a degree of autologous tropism 444.
Some EV-based therapies take advantage of the importance of endogenous surface
profiles. For example, Li et al. bound doxycycline loaded superparamagnetic iron oxide
nanoparticles to the surface of EVs with antibodies against A33, a protein expressed in
cells of origin as well as the EV surfaces. These duplex particles were preferentially up
taken by the parental cells thereby facilitating delivery 445. Another method is isolating EVs
from a patient and loading them with various cargos using different methods including
electroporation, sonication, and freeze-thaw cycles 446, 447. Notably, some of the traditional
isolation methods such as UC, polymer-based precipitation kits, and ultrafiltration can
cause vesicle lysis, aggregation, and morphological changes 290 all of which, could be
ameliorated by the surface-based isolation methods previously discussed herein.
3.7.2 Functionalized the EV surface
One of the most prevalent strategies is the use of surface modification to influence
the tissue-tropism, stability, and/or cancer specificity of EVs. EV surfaces can be decorated

130
directly with myriad exogenous targeting molecules through biochemical engineering
facilitated by linker molecules 448. Some of the surface functionalization methods that have
had success include deposition of tumor-specific antibodies 449 and aptamers 450. Notably,
the PEGylation of EV surfaces after modification can serve the dual purpose of preserving
the conjugation as well as increase the stability and circulation time of EVs in the body 451.
A slightly more refined approach to increase EV tumor homing is a genetic vector
transfection harboring construct coding for the expression of tumor-targeting molecules on
the surface of EVs. For example, a vector coding for anti-EGFR nanobodies linked to
glycosylphosphatidylinositol (GPI) was transfected into cells and their EVs subsequently
isolated 452. These EVs successfully displayed the nanobodies on their surface and resulted
in selective internalization by EGFR overexpressing tumor cells 452. Interestingly, a
different surface modification made with RNA nanotechnology induction of folate
expression on the EV surface did not necessarily increase the uptake of EVs in cancer cells
but prevented their subsequent trapping in the endosomal compartment. This facilitated the
EV delivery of functional siRNA which subsequently inhibited tumor cell growth 453.
Along with targeting cancer cells for improved therapeutic delivery, EV surface
modifications can be conducted that facilitate targeting of antigen-presenting cells, thus
improving antigen delivery as a vaccine 454. Lactadherin binds to the external EV surface
via interaction of its C1C2 domain with EV lipids 455. Hartman et al. took advantage of this
by constructing a vector expressing the extracellular domains of tumor-associated antigens
(TAAs) linked with lactadherin. They found that indeed, this caused the TAAs to be located
on the surface of EVs and further, that administration of these EVs provided a significant
enhancement of the antigen-specific immune response in vivo 456. Importantly, this study

131
suggested EV surfaces as a possible method of anti-cancer vaccine. Congruently, if the
glycocalyx is modified on tumor-associated EVs to possess high-manno glycans, they are
preferentially take up by dendritic cells and result in a higher degree of CD8+ T cell
priming than compared to unmodified EVs 457.
3.7.3 Targeting the EV surface
Since EVs have been proven to facilitate cancer progression, invasion, and
metastasis (see previous sections), some researchers have attempted to target the EVs
themselves in an effort to slow disease progression. For example, targeting integrin α3β1
expressed by EVs originating from ovarian cancer cells by peptide LXY30 reduced uptake
into the parental cancer cells, thus demonstrating a possible use in therapy 458. A functional
application of this notion came when heparinoids added to EVs, bound to their surface and
subsequently prevented uptake into cancer cells. Further, the cancer cells exposed to
heparinoid treated EVs displayed inhibited migratory potential 307. In a slightly different
approach, EV surface molecules can be targeted to prevent undesired downstream
signaling. For example, activated T-cells release EVs with Fas ligand (Fas-L) on their
surface which induces T-cell apoptosis. Cai et al. showed that targeting FAS-L on the
surface of EVs with a mAB prevents T-cell dying and mitigates the tumor growth rate 459.
Few studies have been conducted that investigate this notion of targeting EVs yet this is a
novel concept with great potential that requires further exploration.
3.8 Conclusion and perspective
The biological implications of the EV surfaceome in the setting of cancer are just
beginning to come to light. The mechanism of biogenesis for these particles provides a
window into the cancer cell from whence they came and thus, is inherently is a close look

132
into the processes and mechanisms of tumor biology. Surface-based isolation and profiling
techniques have proved invaluable in the study of these EVs and continue to provide
information on tumor biology including initiation, progression, and metastasis as well as
how they interact with target cells, affect the tumor microenvironment, alter the
extracellular matrix, and impact immune cells. Additionally, the surface of these vesicles
provides a platform for the discovery of liquid biopsy-based biomarkers to facilitate the
early detection of cancer. They are ubiquitous in human biofluids and possess cancer-
specific signatures. Finally, understanding the surface of EVs facilitates their utilization as
drug delivery vehicles. Surfaces can also be modified to improve cellular uptake or increase
target specificity. Thus, given these many attributes, further study involving the surface of
EVs and its impact in all these areas is highly warranted, if not required.

133
Chapter 4: Extracellular vesicle surfaceome
characterization for the early detection of
pancreatic ductal adenocarcinoma
4A: Label-free characterization of extracellular vesicles via Raman spectroscopy
4B: Biomarker discovery via extracellular vesicle surface profiling
Portions of the content covered in this chapter are the subject of a published
article in Nanomedicine: Nanotechnology, Biology, and Medicine by Carmicheal et al. 353

134
Chapter 4: Extracellular vesicle surfaceome characterization for the early detection
of pancreatic ductal adenocarcinoma
4A Label-free characterization of extracellular vesicles via Raman spectroscopy
4A.1 Synopsis
Pancreatic cancer is a highly lethal malignancy and early detection is key to
improved survival. Lack of early diagnostic markers makes timely detection of pancreatic
cancer a highly challenging endeavor. EVs have emerged as information-rich cancer-
specific biomarkers. However, the characterization of tumor-specific EVs has been
challenging. This study investigated the potential of extracellular vesicles (EVs) as
circulating biomarkers for the detection of pancreatic cancer. Label-free analysis of EVs
purified from normal and pancreatic cancer cell lines was performed using surface-
enhanced Raman Spectroscopy (SERS) and principal component discriminant function
analysis (PC-DFA), to identify tumor-specific spectral signatures. This method
differentiated EVs originating from pancreatic cancer or normal pancreatic epithelial cell
lines with 90% overall accuracy. The cell line trained PC-DFA algorithm was applied to
SERS spectra of serum-purified EVs. SERS spectral signatures of circulating EVs, with
PC-DFA analysis, exhibited up to 87% and 90% predictive accuracy for HC and EPC
individual samples, respectively.
4A.2 Background and Rationale
Pancreatic cancer is characterized by insidious onset and relentless progression.
According to the American Cancer Society (ACS), this disease is the third-leading cause
of cancer death in both men and women, with an estimated 44,330 deaths in 2019 2. As per

135
ACS statistics, for all pancreatic cancer diagnoses, the five-year survival rate is 9% and
falls to 3% when the diagnosis is made after metastasis has occurred 2.
The only curative option for this lethal malignancy is surgical resection. Surgical
resection of the primary tumor, before it has given off metastases, confers the largest
increase in overall patient survival 177. Unfortunately, surgery is often not possible. At the
time of initial discovery, primary tumors have often locally invaded to the point of being
nonresectable and/or have produced metastases. The primary reason for this is the
predominantly asymptomatic nature of early disease. Congruently, symptoms, when
present, are mild and ambiguous such as nausea, malaise, and right upper quadrant pain
460. Only in later stages do patients experience more dramatic clinical symptoms such as
jaundice, cachexia, and migratory phlebitis. Thus, it is important to develop non-invasive
and label-free tools for the early detection of pancreatic cancer. A liquid biopsy-based
tumor biomarker for the screening and early diagnosis of pancreatic cancer is a promising
area of research that could change the outcome of this lethal malignancy and improve
patient survival.
Among a variety of serum-based cancer markers put forth as a possible means of
pancreatic cancer detection 461, extracellular vesicles (EVs) are highly sought after and
valuable targets. EV genesis begins as vesiculation of late endosomes. They are a product
of the inward pinching of the endosomal membrane and subsequently are released to the
extracellular space via direct fusion with the external cellular membrane 462. Inherent in
this mechanism of creation is that the intravesicular contents of EVs mirror the cell of
origin. A variety of functions have been attributed to EVs including intercellular

136
communication 463, pathogen transmission 464, and immune response induction 465. And
recently, the functional capabilities of EVs have been extended to include a role in the
progression and metastasis of various cancers 393, 466, 467. Because of this, many
investigators have begun to examine the potential of EVs as cancer markers 421, 468-470.
A portion of circulating RNA and DNA (extracellular nucleic acids found in
serum) is located within these membrane-bound vesicles, and studies have focused on their
genomic profiles 471, 472. Further, these vesicles are easily accessible via non-invasive liquid
biopsies involving saliva, blood, urine, breast milk, and ascitic fluid 473, 474. Due to these
myriad attributes, EV purification and characterization are imperative in the ongoing
pursuit of liquid biopsy-based cancer biomarkers. New techniques are being investigated
for better characterization and analysis of cancer-derived EVs to distinguish them from
those of normal physiologic origin.
One technique that has unique attributes that make it a promising candidate for EV
analysis is Raman spectroscopy 475, 476. This is a vibrational technique that measures
inelastically scattered photons after a sample interacts with incoming monochromatic laser
light. These photons change their energy by exciting vibrational modes of molecules. The
result is a Raman spectrum that corresponds with known vibrations of specific chemical
groups. Such a spectrum can accurately identify the molecular composition of a sample.
Raman spectroscopy has several advantages making it ideal for EV
characterization. Of great importance is that it is a label-free and a non-destructive
technique. This holds a translational advantage in that immediate analysis of EVs is
possible without undue risk for the patient nor long waiting periods. Raman scattering can

137
also provide a unique fingerprint signature based on the molecular composition of a
sample. Hence, this method can differentiate EVs as a function of membrane lipid/protein
content along with other various surface modifications. Finally, the Raman signal can be
enhanced by several orders of magnitude by employing noble metal nanoparticles (Au/Ag)
or rough nanostructures. As a result, only a small concentration of EVs in a sample is
needed for detection and analysis.
The primary limitation of this method is weak Raman scattering efficiency (lower
than 1 in 107 photons). In the presence of surface plasmon on metallic (usually Au or Ag)
nanoparticles or nanostructured surfaces, Raman signals can be significantly enhanced.
This phenomenon is called surface-enhanced Raman scattering and the technique is called
surface-enhanced Raman spectroscopy (SERS) 477, 478. This technology has been widely
studied and applied for many years; however, it has only recently been employed to analyze
EVs 436, 479. When combined with multivariate analytical techniques that can condense a
large amount of spectral information gathered, SERS can serve as a valuable tool to
separate EV subpopulations and can potentially be utilized for the characterization of EVs
for cancer diagnoses.
One method for the mathematical processing of SERS data is principal component
discriminant function analysis (PC-DFA) 219. With this technique, principal component
analysis (PCA) is performed initially on SERS spectra. This reduces total variables
considered and accentuates the amount of variation within a data set. In so doing, it allows
for the determination of which combination of variables contributes the greatest to the
overall variance measured between samples. PCA conducts a linear (orthogonal)

138
transformation on the SERS data, compressing a multitude of correlated variables (i.e.
Raman shift peaks) into linearly uncorrelated variables known as principal components
(PCs). PCs can then be used as input independent variables for discriminant function
analysis (DFA). This applies yet another linear discriminant transformation to the SERS
data that further differentiates EV subpopulations and provides classification efficacy via
a cross-validation or external-validation method.
In this experiment, SERS and PC-DFA were utilized to characterize subpopulations
of EVs from various cellular origins as well as patient sera. The SERS spectra of EVs
derived from one healthy and two pancreatic cancer cell lines were successfully
characterized and classified by a PC-DFA algorithm. Further, the PC-DFA algorithm
trained from the three cell lines was applied to the SERS spectra of EVs isolated from
pancreatic cancer patient serum samples to investigate the diagnostic efficacy of EV
spectral signatures.
4A.3 Results
4.3.1 EVs of appropriate size can be isolated from cell line conditioned media
EVs were isolated from the cell culture supernatants of representative pancreatic
cancer cell lines CD18/HPAF and MiaPaCa, as well as from the untransformed pancreatic
epithelial cell line HPDE, by diffusion gradient ultracentrifugation as described in the
methods section. Size distribution and concentration of the EV isolates were discerned
through the use of nanoparticle tracking analysis (NTA) that revealed the CD18/HPAF cell
line-derived EVs modal hydrodynamic size to be 132 nm, those from MiaPaCa to be 221
nm, and HPDE EVs to have a modal size of 261 nm (Figure 4A.1).

139
Figure 4A. 1 Nanoparticle tracking analysis of cell line EVs
EVs were purified via density gradient ultracentrifugation from cell line supernatant as
described in the methods section. Nanoparticle tracking analysis (NTA) was conducted on
EVs isolated from two pancreatic cancer cell lines, CD18/HPAF and MiaPaCa, as well as
one normal human immortalized epithelial cell line, HPDE. The results showed size
distributions within the expected range for heterogeneous EV isolation ranging from 50-
500 nm in diameter. Importantly, the quantities of each EV population were sufficient to
be used in subsequent experiments.

140
Figure 4A.1
141
4.3.2 Isolated EVs maintain morphological characteristics
Morphology and size of the extracellular vesicles were visualized with transmission
electron microscopy (TEM) (Figure 4A.2). Imaged EV isolated from all three cell line
supernatants contained particles with diameters ranging from 40 nm to 200 nm as can be
seen by the individual vesicle measurements on the TEM images. The mounting, fixing,
and staining process required for TEM visualization of EVs results in dehydration creating
a concavity in the center of the vesicles where vanadium negative stain can pool. This
pooling increases the electron opacity at that location thereby conferring the characteristic
“saucer shape” morphology 480. Fewer EVs were noted in the HPDE isolates as compared
to those isolated from the two cancer cell lines. Of note, the larger EV sizes measured via
NTA can be attributed to the combination of possible vesicular agglomeration in NTA
making them measured larger and/or the preparation of the samples required for TEM with
the aforementioned dehydration and resultant shrinkage making them look smaller than
their true hydrodynamic size.
4.3.3 EV consensus marker validation and substrate distribution assessment
Further characterization of the EVs was conducted via immunoblotting in order to
validate the presence of the accepted EV markers as well as their increased concentration
compared to the respective EV whole cell lysate (CD18/HPAF) (Figure 4A.3A). 10 µg of
protein from each of the six fractions formed via the density gradient was utilized. The
accepted tetraspanin protein markers, CD9 and CD63, along with the adhesion molecule
EpCAM 420, were used as proof of the presence and increased concentration of EVs by the
ultracentrifugation process. As seen in the figure, all three of these markers were prominent
in sucrose layers three and four, denoting high EV concentration within these fractions.

142
Figure 4A. 2 TEM images of EVs isolated from conditioned media
TEM images of EVs isolated from CD18/HPAF, MiaPaCa, and HPDE, show spherical
consistency and size homogeneity of each population. Notably, morphology is unaltered
with the exception of the characteristic “cup” shape due to dehydration from the TEM
mounting/staining procedure. These images prove the ability to efficiently isolate EVs
from cell-conditioned media via density gradient ultracentrifugation.

143
Figure 4A.2

144
Figure 4A. 3 EV surface marker validation and substrate distribution verification
A. EV samples residing in the various layers/fractions of the sucrose density gradient were
tested for the presence of known EV protein markers CD9, CD63, and EpCAM along with
pancreatic cancer-associated molecule glypican-1 via western blot. The results showed the
consensus markers along with glypican-1 settled in sucrose layers 3 and 4 (as predicted by
comparable density with EVs, 1.15 – 1.19 g/ml). Thus, subsequent experiments were
conducted on one EV population produced by the combination of EVs collected in fractions
3 and 4. B. Atomic force microscopy (AFM) of EVs isolated from CD18/HPAF verified
that the ionic interactions between the EV surface and the gold substrate allowed for strong
and efficient binding of EVs to the substrate surface which is required for eventual SERS
analysis. Further, AFM provided verification that the EVs were adequately and evenly
dispersed over the surface, which is another prerequisite for accurate SERS measurement.

145
Figure 4A.3
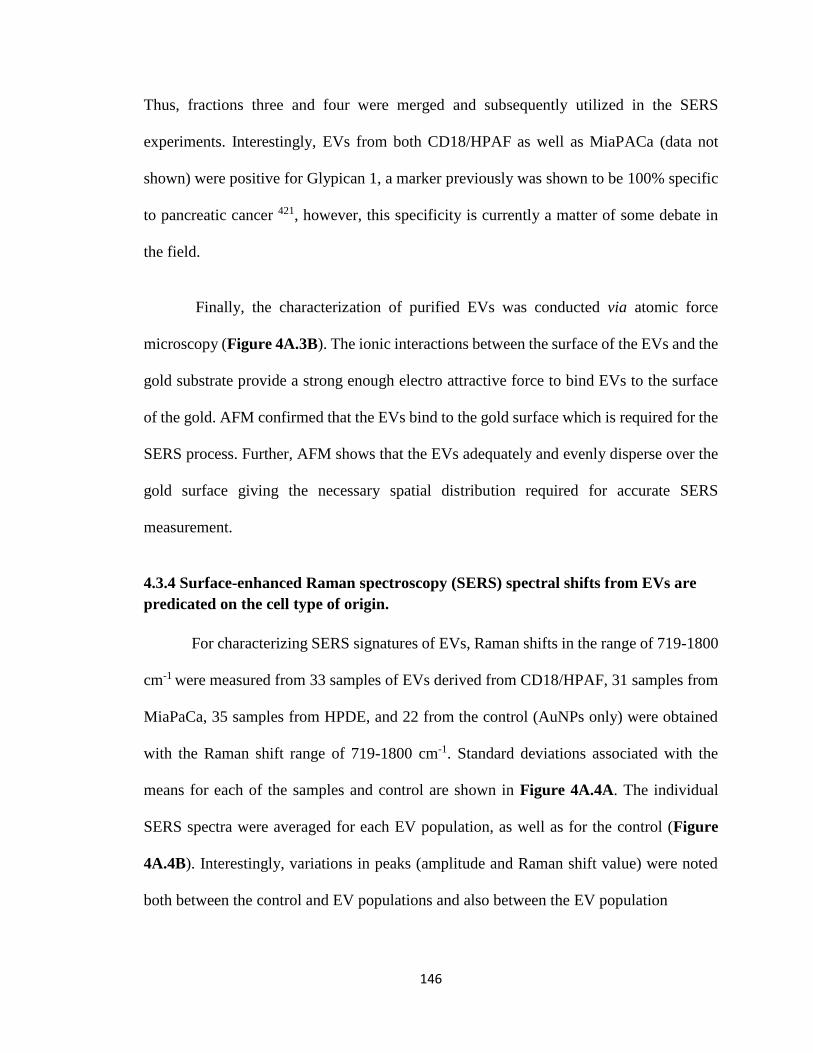
146
Thus, fractions three and four were merged and subsequently utilized in the SERS
experiments. Interestingly, EVs from both CD18/HPAF as well as MiaPACa (data not
shown) were positive for Glypican 1, a marker previously was shown to be 100% specific
to pancreatic cancer 421, however, this specificity is currently a matter of some debate in
the field.
Finally, the characterization of purified EVs was conducted via atomic force
microscopy (Figure 4A.3B). The ionic interactions between the surface of the EVs and the
gold substrate provide a strong enough electro attractive force to bind EVs to the surface
of the gold. AFM confirmed that the EVs bind to the gold surface which is required for the
SERS process. Further, AFM shows that the EVs adequately and evenly disperse over the
gold surface giving the necessary spatial distribution required for accurate SERS
measurement.
4.3.4 Surface-enhanced Raman spectroscopy (SERS) spectral shifts from EVs are
predicated on the cell type of origin.
For characterizing SERS signatures of EVs, Raman shifts in the range of 719-1800
cm-1 were measured from 33 samples of EVs derived from CD18/HPAF, 31 samples from
MiaPaCa, 35 samples from HPDE, and 22 from the control (AuNPs only) were obtained
with the Raman shift range of 719-1800 cm-1. Standard deviations associated with the
means for each of the samples and control are shown in Figure 4A.4A. The individual
SERS spectra were averaged for each EV population, as well as for the control (Figure
4A.4B). Interestingly, variations in peaks (amplitude and Raman shift value) were noted
both between the control and EV populations and also between the EV population

147
Figure 4A. 4 SERS spectra of cell line EVs
For this experiment, 33 sample spectra of CD18/HPAF, 31 from MiaPaCa, 35 from HPDE,
and 22 from the control were obtained and pre-processed. A. Individual SERS spectra
collected from CD18/HPAF, MiaPaCa, and HPDE EVs in addition to gold nanoparticles
(GN) only. B. The averages for all the technical replicate SERS spectra. The GN spectra
serve as a control to elucidate what spectral features are associated with particles alone,
and subsequently factored out of any variance observed in the spectra collected from the
various EV populations. Differences in peak presence and amplitude are observed between
all the EV groups. Amplitude does fluctuate over repeated measurements, as noted by the
red dotted line representing the standard deviation but importantly the pattern does not
change.
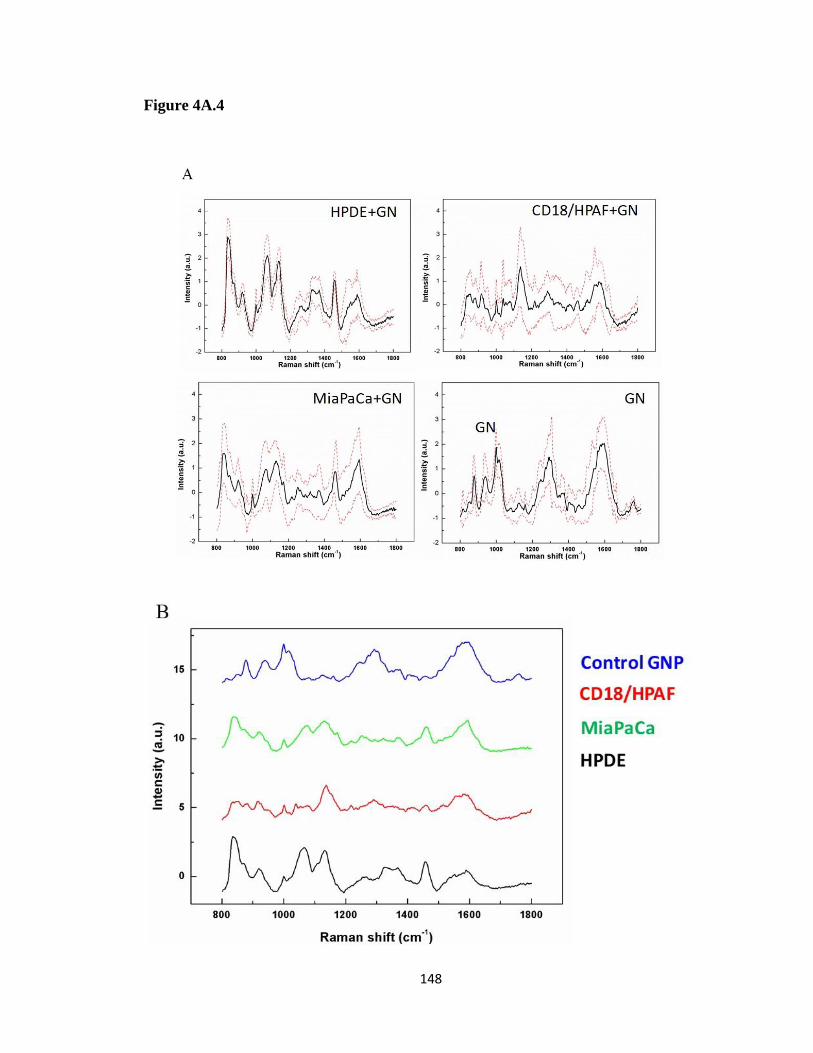
148
Figure 4A.4

149
samples themselves thus providing the foundation for differential characterization of the
particles.
In the 719-1800 cm-1 region, spectra exhibited peaks characteristic of vibrations
corresponding to lipids and proteins which are the major contributors of EV surface
composition. For example, vibrations due to the C-C skeletal stretching appear as peaks at
1051 cm-1 and 1124 cm-1. Another peak that can be clearly distinguished lies at 1450 cm-1
that is due to CH2 bending vibration and is very typical of lipids 481. The peaks in the 1300-
1400 cm-1 region can be attributed to CH2 twisting vibrations. An intense peak at 830 cm-
1 is also observed corresponding to C-O-O vibration typical of phospholipids 475.
4.3.5 EV SERS spectra are highly reproducible
High reproducibility and consistency of SERS spectra were observed (Figure
4A.5) providing validity to each individual SERS peak as specific to that sample EV
population and not merely arising from background noise. Although most repeated peaks
of each group were identified, not every spectrum exhibited all of these specific peaks and
not every specific peak was surface-enhanced. The possible reason for this variable peak
enhancement could be the randomness in the interaction and subsequent bonding between
gold nanoparticles and EVs. To address this issue, adequate spectral numbers and whole
fingerprint spectral data were acquired for multivariate analysis. Of note, in addition to
common spectral features across EV populations, distinct differences in peaks’ profiles
and intensities were observed in SERS. This observation highlights the ability of Raman
spectroscopy to distinguish EVs by their lipid composition. To increase the SERS output,
we have used gold nanoparticles as well as gold substrate as an improvement over the

150
Figure 4A. 5 Repeated SERS spectra collections from cell line EVs and gold
nanoparticles
Repeated collections of SERS spectra are plotted for each experimental condition.
Importantly, the spectral shifts arising from different EV populations are highly
reproducible. Overlapping peaks are appreciated in each sample by a thickening of the
black patternation, denoting spectral continuity and specific peaks unique to each
population, which is required for eventual use as a means of differentiation.

151
Figure 4A.5

152
previous design 420. To identify differential peaks associated with pancreatic cancer,
principal component, and discriminant function analyses were conducted on the collected
SERS data.
4.3.6 Principal Component - Discriminant Function Analyses can discriminate
between PDAC and normal cell line EV SERS spectra with high accuracy
After pre-processing of the raw SERS spectra, PCA was used to reduce the number
of variables considered from 1004 variables to 20 PCs, which counted for 88.2% of the
total variance. Principal Component #1(PC #1) contained the most important data with
35.4% of the total variance. The next two PC #2 and PC #3 represented 14.4% and 6.6%
of the total variance, respectively. A three dimensional (3D) PCA plot for the first three
PCs (PC #1, PC #2, and PC #3) is shown in Figure 4A.6. Although these three PCs
contributed 56.4% of the total variance, it is still not enough for high-efficiency
classification. Twenty PCs were chosen for the trade-off between low data dimensionality
and high variance observed in samples.
The PC-DFA plots for the three discriminant function classifiers (DA1, DA2, and
DA3) of the total 121 spectra from four groups (HPDE, CD18/HPAF, MiaPaCa, and
Control) are shown in Figure 4A.7. The EV groups and control group are clearly separated
by DA1 and DA2 (the two upper plots in Fig. 4A.7) due to the absence of EV peaks within
the control group, leading to a distinct spectral pattern. The EV subpopulations formed
discrete clusters and separated from each other by all the classifiers, as shown in the 3-
dimensional PC-DFA plot (lower right plot in Fig. 4A.7). The classification accuracy was
calculated via the cross-validation method and is shown in Table 4A.1. As shown, only
one spectrum of healthy cell-derived EVs was misclassified as having a cancer cell origin.

153
Figure 4A. 6 Principal component analysis of cell line SERS spectra
Principle component analysis (PCA) was first conducted on raw SERS spectra from both
normal human pancreatic ductal epithelial cell line (HPDE) and pancreatic cancer cell lines
(CD18/HPAF, MiaPaCA) to reduce the dimensionality of the data from 1004 individual
wavenumber variables (from 719 cm-1 to 1800 cm-1) to 20 PCs. The 3D plot shows the
SERS measurements segregated as a function of the first three PCs which account for 56%
of the total spectral variance. Spectra collected from HPDE and GNs are beginning to
efficiently cluster yet their remains widespread dissemination of cancer EV spectra
dispersed throughout the area. Notably, this suggests a degree of similarity between the
EVs isolated from cancer cell lines as compared to those from HPDE. To increase the
population clustering the PCs were used as the input independent variables for DFA.

154
Figure 4A.6

155
Figure 4A. 7 Discriminant function analysis of SERS generated principal
components
The PCs were used as the input independent variables for the DFA. A. 2D DFA plot of
DA1 vs. DA2. B. 2D DFA plot of DA1 vs. DA3. C. 2D PC-DFA plot of DA2 vs. DA3. D.
3D DFA plot of DA1 vs. DA2 vs. DA3. Especially in the last 3D plot it can be observed
that all four EV populations have clustered into distinct areas predicated cell of origin.
These graphical representations visually display the capability of the PC-DFA algorithm
to efficiently separate differing EVsubpopulations based on SERS spectra.

156
Figure 4A.7

157
Table 4A. 1 Prediction of cell line cancer status via SERS PC-DFA
The table depicts the number of EV sample spectra taken from each cell population (in the
two left columns) as well as the population with which each cell was clustered via PC-
DFA. The number of spectra out of the total that was correctly classified as the EV
population of origin is joined with the percent correct in parenthesis in each of the
subsequent columns. The accuracy associated with classifying SERS spectra as arising
from CD18/HPAF, MiaPaCa, HPDE, and GN control was 97%, 93%, 71%, and 100%,
respectively.

158
Table 4A.1

159
Congruently, six spectra of cancer cell-derived EVs were misclassified as having a
healthy cellular origin, with none of these being CD18/HPAF spectra (MiaPaCa spectra
were classified as healthy six times, and as CD18/HPAF spectra 3 times). The overall
accuracy of PC-DFA classification was 90.0% for the three cell lines and the control. Since
CD18/HPAF and MiaPaCa are cancer cell lines and HDPE is a healthy cell line, the
sensitivity and specificity are calculated to be 90.6% and 97.1% respectively, regardless of
the control.
4.3.7 EVs can be isolated from patient sera and are elevated in cancer patient
samples compared to benign controls
To investigate the potential diagnostic efficacy, EVs were isolated as described in
the experimental section from the sera of ten healthy subjects and ten early-stage pancreatic
cancer patients. The quantity of EV protein isolated from equivalent quantities of serum
from each of the three groups can be seen in Figure 4A.8. Corroborating previous work,
the quantity of EVs is significantly higher in early and late-stage PDAC patients as
compared to healthy controls. The presence, size, and number of EVs in these samples
were verified with NTA (Fig. 4A.9A). Though the size and concentration were less than
what was measured for cell line-derived EVs, their presence was confirmed by direct
visualization by TEM, where the vesicles exhibited the characteristic “cup shape”
morphology (Figure 4A.9B). Adhesion to the gold substrate surface and adequate SERS
address distribution was verified by AFM (Figure 4A.9C).
4.3.8 The cell line trained PC-DFA algorithm can be applied to SERS spectra of
serum EVs to predict patient cancer status

160
Figure 4A. 8 Serum isolated EV quantification via protein concentration
The relative quantity of EVs present in 500 µl of human serum isolated via
ultracentrifugation was estimated by protein concentration. While the median EV protein
concentration of healthy individuals was below 0.2 mg/ml, and an equivalent volume of
early-stage (I-IIB) and late-stage (III-IV) PDAC patient serum harbored EV protein
concentrations above 0.7 and 0.6, respectively. This 3-4 fold increase in the setting of
cancer is in line with previous findings and is important for the justification of utilizing
seromic EVs as cancer-specific biomarkers.

161
Figure 4A.8
162
Figure 4A. 9 Morphological validation of EVs isolated from patient serum
A. NTA showing size distribution and concentration of EVs purified from patient sera. The
hydrodynamic size ranged from 50-200 nm in diameter, which is synonymous with those
isolated from cell line supernatant. B. TEM showing spherical individual vesicle
morphology purified from patient sera displaying the capability of ultracentrifugation to
isolate EVs from serum without damage. C. AFM of the substrate surface (gold) displaying
presence and adequate coverage of EVs for SERS.
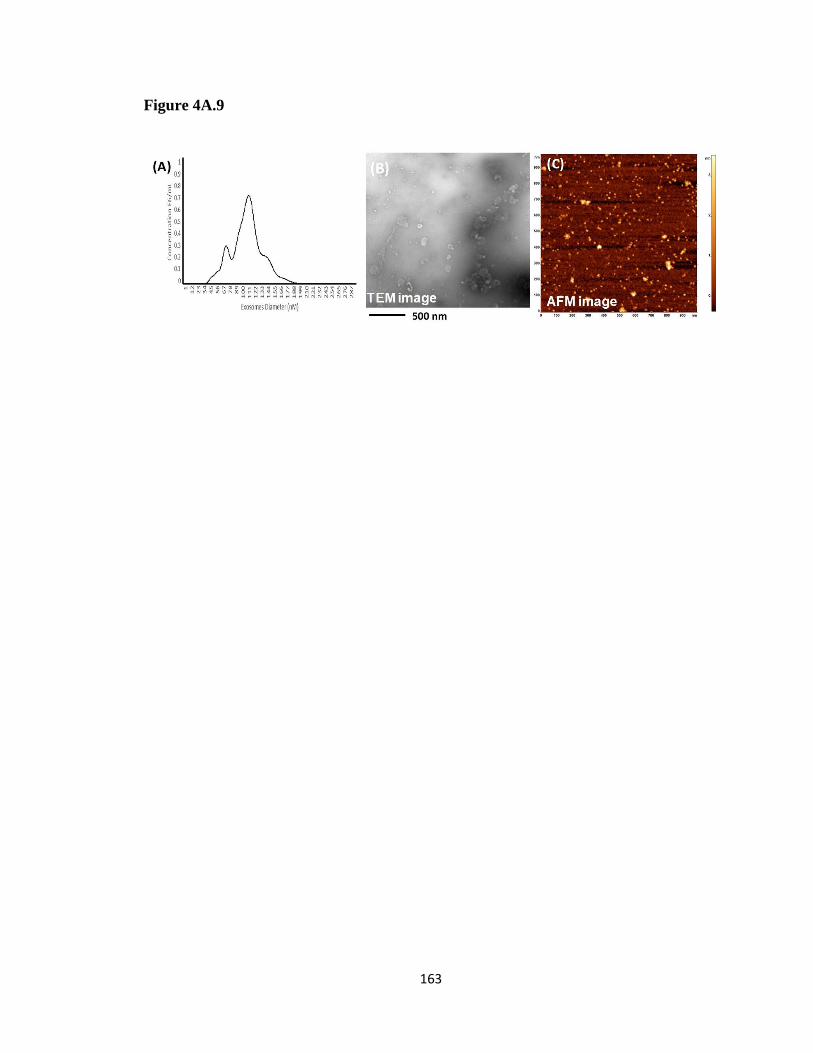
163
Figure 4A.9

164
For each of the twenty EV samples purified from sera, 10-20 SERS measurements
were collected for external validation. The PC-DFA algorithm, trained from the previous
SERS of cell line EVs, was applied to the SERS measurements of the patient sera EV
samples. With the application of this algorithm, the SERS spectra measured from EVs
derived from serum exhibited a range of predictive accuracies. HC samples ranged from
20-87% characterization efficiency while EPC sample characterization efficiency was
from 30%-90% (Table 4A.2).
4.4 Discussion
Label-free technologies offer many advantages that are amenable to the
characterization and utilization of liquid biopsies as diagnostic markers. Conventional
methods such as immunohistochemistry, flow cytometry, PCR, and immunoblotting use
known targets of interest which require predetermined markers or probes. This narrow
focus inherently limits the possible information gathered from a given sample and
precludes the possibility of discovery. Conversely, label-free modalities circumvent the
requirement of predetermination, thereby offering a universal metric by which all species
are measured and compared. Further, novel species characteristics can be elucidated that
can be quantified and used as a biomarker metric.
Many investigators have recognized the value in label-free techniques and as such,
a variety of methods have recently been evaluated. Surface plasmon resonance is used in
the quantification and detection of multiple serum-based biomarkers by refractive index
changes predicated on binding interactions 482. Surface proteomics is a technique that
involves “shaving” proteins off the surface of EVs 322. Mass Spectrometry is then utilized
to discern the identity of the shaved proteins that may subsequently be used as cancer-

165
Table 4A. 2 Application of cell line PC-DFA algorithm on SERS of EVs isolated
from patient serum
The left part of the table shows the PC-DFA predicted cancer status of EVs isolated from
the SERS of ten different healthy individual serum controls (HC) while the right part of
the table shows the PC-DFA predicted cancer status from the SERS of EVs isolated from
the serum of ten different early pancreatic cancer patients (EPC). Note: The number in
parentheses in the population type column is the total number of SERS measurements taken
from serum samples of each healthy individual or pancreatic cancer patient. The number
in parentheses in the predicted columns is the number of SERS measurements with that
predicted characterization. Individual assay efficiency ranged from 20%-87% and 30% to
90% for HC and EPC samples, respectively.

166
Table 4A.2
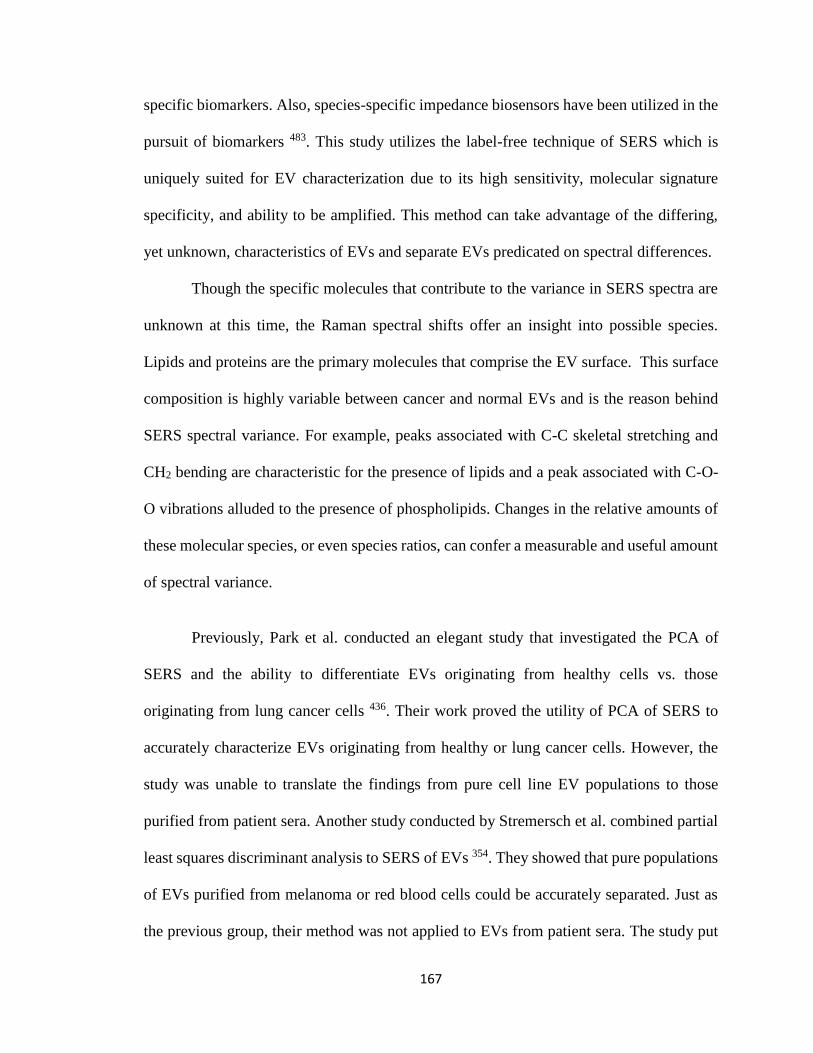
167
specific biomarkers. Also, species-specific impedance biosensors have been utilized in the
pursuit of biomarkers 483. This study utilizes the label-free technique of SERS which is
uniquely suited for EV characterization due to its high sensitivity, molecular signature
specificity, and ability to be amplified. This method can take advantage of the differing,
yet unknown, characteristics of EVs and separate EVs predicated on spectral differences.
Though the specific molecules that contribute to the variance in SERS spectra are
unknown at this time, the Raman spectral shifts offer an insight into possible species.
Lipids and proteins are the primary molecules that comprise the EV surface. This surface
composition is highly variable between cancer and normal EVs and is the reason behind
SERS spectral variance. For example, peaks associated with C-C skeletal stretching and
CH2 bending are characteristic for the presence of lipids and a peak associated with C-O-
O vibrations alluded to the presence of phospholipids. Changes in the relative amounts of
these molecular species, or even species ratios, can confer a measurable and useful amount
of spectral variance.
Previously, Park et al. conducted an elegant study that investigated the PCA of
SERS and the ability to differentiate EVs originating from healthy cells vs. those
originating from lung cancer cells 436. Their work proved the utility of PCA of SERS to
accurately characterize EVs originating from healthy or lung cancer cells. However, the
study was unable to translate the findings from pure cell line EV populations to those
purified from patient sera. Another study conducted by Stremersch et al. combined partial
least squares discriminant analysis to SERS of EVs 354. They showed that pure populations
of EVs purified from melanoma or red blood cells could be accurately separated. Just as
the previous group, their method was not applied to EVs from patient sera. The study put

168
forth in this paper is a proof-of-concept experiment, proving the power and potential for
PC-DFA of EV SERS to serve as a means to diagnose pancreatic cancer at an early stage,
when curative resection is still possible, that heretofore had not been successful.
Lower prediction efficacies were observed when the PC-DFA was applied to SERS
of patient sera. This is a direct result of the diverse origin of EVs in patient serum. In
addition, the sera from cancer patients, especially from those with early-stage disease,
inherently have a larger portion of EVs arising from normal epithelium rather than tumor
cells. This increases the complexity of the SERS spectra and therefore the difficulty of
algorithmic determination increases significantly. Even so, this study opens the door to a
novel cancer detection method. Congruently, the trend of multiple testing outcomes (i.e.
characterization as HC or EPC) from a single patient could serve as a means of allying or
increasing suspicion of cancer. The use of this technique in high-risk patients and/or those
with high-risk features could give insight into the disease gestalt.
4.5 Conclusions and future directions
Surface-enhanced Raman spectroscopy, in conjunction with PC-DFA
methodology, was applied for the classification of EVs derived from a healthy cell line and
two pancreatic cancer cell lines via a cross-validation method in the present study. The
sensitivity and specificity were 90.6% and 97.1%, respectively. Moreover, a proof-of-
concept experiment was conducted to investigate the diagnostic efficacy of the SERS
spectra of EVs collected from pancreatic cancer patient serum samples when the PC-DFA
algorithm was applied. The present work demonstrates that EVs can be analyzed by SERS
and combined with PC-DFA as a liquid biopsy-based detection of pancreatic cancer.

169
The practical use of this technology and lack of specificity can be ameliorated via
multiple means and are possible future directions for the continuation of this research. The
first will be to conduct and intragroup comparison between well-characterized and poorly
characterized samples, as determined by the current PC-DFA algorithm. This will elucidate
peaks or areas within the spectra that may be diminishing assay efficacy. Second, we will
establish an EV SERS spectral library collected from a large sample set of healthy
individuals and pancreatic cancer patients of various stages and use those for the basis of
the PC-DFA predictive algorithm. The multiple spectra would then be utilized to enhance
the accuracy and power of the data and further solidify what Raman shift peaks contribute
the greatest to the overall variance between healthy and tumor purified EVs. Additionally,
larger serum sample volumes may be used to increase the total amount of pancreatic cancer
originating EVs. Further investigation is planned to discover if different metrics such as
proteomics, metabolomics and RNA sequencing of EV contents, in combination with
SERS, would improve on the aforementioned sensitivity and specificity. Isolation of EVs
via ultracentrifugation is expensive and time-consuming. Alternative methods of
purification include EV specific ELISA and magnetic bead isolation, to purify directly
from serum. Implementing these methods would allow for more facile isolation. Finally,
we plan to investigate other various biological sources of EVs, such as urine and ascites,
and apply PC-DFA. This could uncover novel EV sources for noninvasive liquid-based
biopsies.

170
4B: Biomarker discovery via extracellular vesicle surface profiling
4B.1 Synopsis
The experiments presented herein (Chapter 4B of this thesis) began with EV surface
proteomic profiling using a novel “surface shaving” technique via proteinase-A trypsin
digestion, size exclusion chromatography, and liquid chromatography-tandem mass
spectrometry (LC-MS/MS), which allowed for the specific analysis of proteins exposed on
the external membrane compartment. Clinical significance and reduction of potential
biomarkers from the LC-MS/MS detected proteins were determined by bioinformatics
assessment of The Cancer Genome Atlas (TCGA) and GSE28375 microarray datasets.
Protein target presence was validated in cell lines and patient samples via western blot and
their surface localization with immunogold TEM. The first target protein assessed via
ELISA analysis, EPHA2, showed elevated expression in complete cancer patient serum as
compared to benign controls. Further, EV specific EPHA2 expression was capable of
predicting cancer status in 25% (5/20) of the patient samples with 100% specificity.
4B.2 Background and rationale
Experiments in Chapter 4A of this thesis utilized EVs from normal pancreatic
ductal epithelial cells (HPDE) and two pancreatic cancer cell lines (MiaPaCa,
CD18/HPAF) representing the wide mutational spectrum of PDAC were isolated via
density gradient ultracentrifugation. Surface-enhanced Raman spectroscopy (SERS), in
conjunction with principle component-discriminant function analysis (PC-DFA), was used
to classify EVs originating from cells in vitro high overall accuracy. The proof-of-principal
application of the cell line-derived PC-DFA algorithm to SERS spectra collected from EVs

171
isolated from patient serum samples proved the possibility of using EV surface differences
as a biomarker for the early detection of PDAC.
However, the limited overall accuracy of the label-free SERS PC-DFA algorithm
requires further investigation into the surface of EVs to discover specific molecular species
that may be used as biomarkers. Many studies have illustrated the potential of discovering
cancer-specific markers in EVs including proteins, miRNA, lncRNA, and genomic DNA
484. However, the majority of these studies investigate the entirety of the EV contents
without specific consideration of the EV surface. Studies that have investigated the EV
surface per se are limited in number yet have provided valuable prospects for biomarker
discovery. Much like the studies assessing EVs in their entirety, surface profiling has
elucidated myriad cancer-associated molecular species including proteins, DNA, glycans,
and lipids, many of which have been comprehensively discussed in Chapter 3 of this thesis.
Surface characterization of EVs has many benefits that make it an ideal method for
the discovery of clinically useful biomarkers. Molecular species positioned on the exposed
surface of the EV membrane are capable of being targeted by immunoaffinity techniques
485, 486 thereby providing a means of rapid isolation and characterization directly from
patient samples. The presence of specific surface proteins can also provide clues into the
organ tropism of particular cancer as in the case of integrin αvβ5 association with liver
metastasis in the setting of PDAC 393. Congruently, therapeutic efficacy can be surmised
from the EV surfaceome as when the response to PD-L1 blockade predicted via the
quantity of EV surface PD-L1 487. These attributes are in addition to the general EV
advantages previously described including presence in all biofluids, the capability of use

172
as a non-invasive liquid-biopsy, present at higher concentrations in cancer patients, and
contents mirroring the cell of origin.
Given the promising yet limited results of our SERS PC-DFA study, the dearth of
surface-specific characterization studies, and the potential of EV surface biomarkers, we
sought to profile the surface of PDAC cell line EVs in an effort to uncover a novel clinically
useful biomarker.
4B.3 Results
4B.3.1 LC-MS/MS EV surface proteomic profiling identifies proteins of interest pool
EVs from four PDAC cell lines (CD18/HPAF, MiaPaCa, T3M4, and Capan1) and
HPDE were isolated via density gradient ultracentrifugation and underwent surface
proteomic profiling as described in the methods section. Notably, Capan1 EV proteins were
withdrawn from subsequent analyses because of the presence of GM-130 protein, which is
a Golgi marker that is not present in EVs and thus, is indicative of cellular contamination.
Interestingly, gene ontology (GO) pathway analysis confirmed that the top upregulated
pathways associated with the remaining proteins identified on the EV surface (other than
those directly involved with EV biogenesis and transport) were involved in adhesion and
binding (Figure 4B.1). This finding is in line with previous studies implicating EVs in
cancer dissemination and metastasis 393, 488.
A total of 114 surface proteins were detected on HPDE EVs and a total of 229 on
the surfaces of the pooled EV population comprised of the three remaining cancer EV
populations. Of these, 101 proteins were shared between the two groups yielding a unique
cancer-associated pool of 128 proteins of interest (Figure 4B.2). This total pool was further
evaluated to find the proteins that were present on the surface of all three cancer EV

173
Figure 4B. 1 Gene ontology pathway analysis of EV surface proteins
GO pathway analysis showed that other than the expected presence of proteins associated
with EV biogenesis and transport, the primary upregulated pathways involved cellular
adhesion and binding. These pathways, including cell-substrate junction, focal adhesion,
and cell adhesion molecule binding, have been highlighted with a red box in the figure.

174
Figure 4B.1

175
Figure 4B. 2 Identification of cancer EV surface proteins of interest
Venn diagrams depict 114 proteins from the healthy (HPDE) EV population in light blue,
the 239 pooled cancer EV protein group (all three PDAC cell lines) in purple, and the 204
from CD18/HPAF, the 135 from MiaPaCa, and the 104 from T3M4 in yellow, blue, and
red, respectively. The overlap of 101 proteins between the healthy and cancer group was
removed from subsequent analysis followed by identification of the proteins present on all
three PDAC cell line EVs (n = 86) as well as those present on two of the three EV
population surfaces. After factoring in redundancy in these four subgroups, a total of 30
proteins of interest proceeded to undergo bioinformatics analysis.

176
Figure 4B.2

177
populations individually as well as to find the proteins that were expressed on the surface
of at least two of the individual cancer EV populations (Figure 4B.2). In the end, 30 surface
proteins met all these criteria and underwent further bioinformatics evaluation.
4B.3.2 Bioinformatics discernment of eight specific target EV surface proteins
4B.3.2.1 Proteins of interest gene expression in adjacent normal and PDAC tissues
The GSE27385 microarray dataset was used to determine the relative expression
levels of the 30 proteins of interest in the setting of PDAC. This dataset is comprised of 45
matching tumor and adjacent tumor samples, from the same patient, which provides a
unique opportunity to assess what genes may be selectively upregulated or downregulated
in PDAC utilizing an internal patient control. The gene expression for each of the proteins
was internally normalized (i.e. each gene individually) and the z-scores were used to
determine relative expression levels. Many of the genes associated with the LC-MS/MS
identified proteins are upregulated in the setting of PDAC compared to adjacent normal
tissue (Figure 4B.3). Among these, those with the most consistent pattern of increased
expression were cluster of differentiation 151 (CD151), galectin-1 (LGALS1), cofilin
(CFL1), tyrosine 3-monooxygenase/tryptophan 5-monooxygenase activation protein zeta
(YWHAZ), extracellular matrix protein-1 (ECM1), ephrin A2 (EPHA2, integrin alpha 3
(ITGα3), and heat-shock protein family B (small) member-1 (HSPB1) (these have been
identified by red boxes in Figure 4B.3).
4B.3.2.2 Target genes are correlated in two distinct datasets
In an attempt to further evaluate the potential of these eight markers to serve as
clinically relevant biomarkers all 30 of the proteins of interest were correlated with one

178
Figure 4B. 3 Gene expression profiles for EV proteins of interest
Heat map representation of Z-scores of internally normalized (within gene normalization)
genes coding for the 30 EV surface proteins of interest. Many of the selected genes were
overexpressed in the setting of PDAC. Eight of the most consistently overexpressed targets
in cancer tissue compared to adjacent normal tissue are CD151, LGALS1, CFL1, YWHAZ,
ECM1, EPHA2, ITGα3, and HSPB1 and these are highlighted with red boxes in the figure.

179
Figure 4B.3

180
another The Cancer Genome Atlas (TCGA) RNA sequencing dataset was analyzed along
with the GSE23785 microarray dataset. TCGA was not used in the previous analyses
because it contains only 3 samples from healthy pancreas tissue but can serve for evaluation
of cancer patient expression levels. In both of these datasets CD151, LGALS1, CFL1,
YWHAZ, ECM1, EPHA2, ITGα3, and HSPB1 proteins were among the most correlated
genes with each other (Figure 4B.4). Additionally, they were highly correlated with the
consensus EV marker, CD9 in both sets. The black boxes within the figure highlight the
size and intensity of the blue circles for the target proteins. This suggests that the eight
target proteins are upregulated in the setting of PDAC and could serve as an additive
combinatorial biomarker platform.
4B.3.2.3 Target protein genes have high diagnostic accuracy
Finally, these target genes were also assessed for their ability to differentiate between
normal and tumor samples in the GSE27385 dataset. Impressively, the combination of the
tissue expression profiles of these eight genes identified by EV surface proteomics
produces a receiver operator characteristics (ROC) curve with an area under the curve
(AUC) of 0.9136 (Figure 4B.5). For reference, the current gold standard blood-based
protein biomarker used in clinics, CA19.9, produces an AUC ranging from 0.66-0.836 489-
492. Importantly, these results enhance the findings of our in vitro EV proteomics data by
displaying the real-world validation of our target proteins. With this bioinformatics
analysis, the target protein list was able to be efficiently narrowed down from 30 to eight
which is a much more manageable and testable quantity.
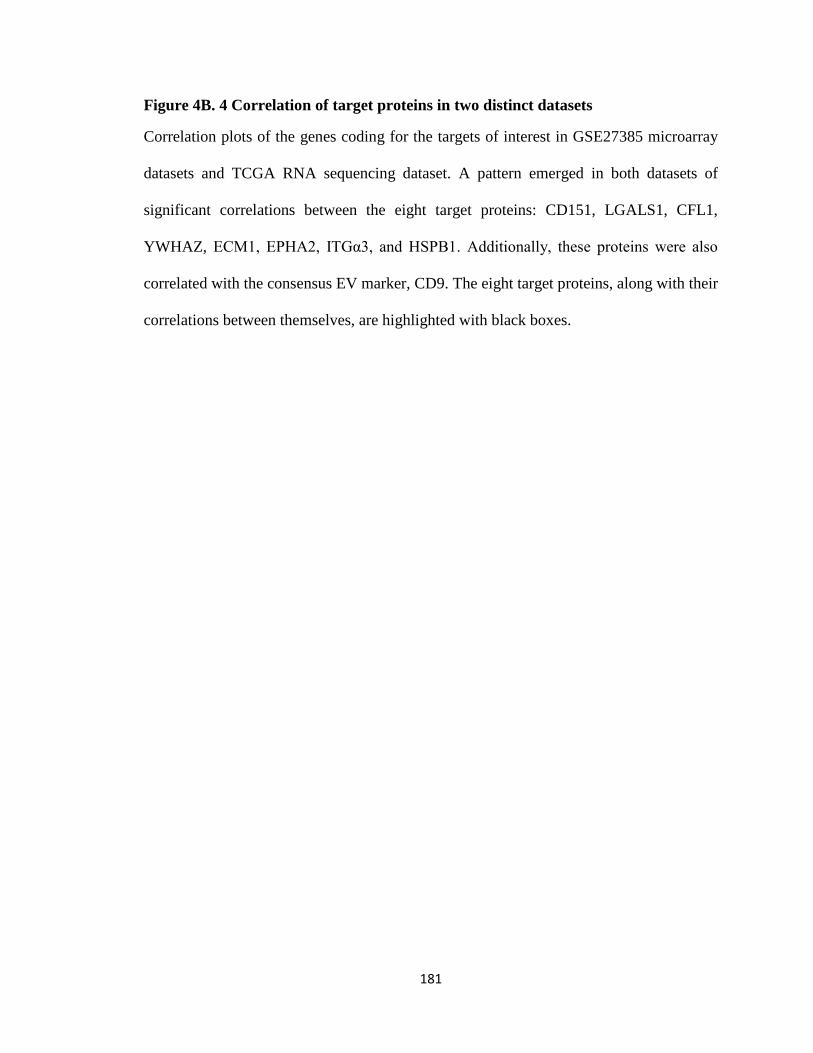
181
Figure 4B. 4 Correlation of target proteins in two distinct datasets
Correlation plots of the genes coding for the targets of interest in GSE27385 microarray
datasets and TCGA RNA sequencing dataset. A pattern emerged in both datasets of
significant correlations between the eight target proteins: CD151, LGALS1, CFL1,
YWHAZ, ECM1, EPHA2, ITGα3, and HSPB1. Additionally, these proteins were also
correlated with the consensus EV marker, CD9. The eight target proteins, along with their
correlations between themselves, are highlighted with black boxes.

182
Figure 4B.4

183
Figure 4B. 5 Receiver operator characteristics curve of the eight target protein
genes
The ROC curve generated from the combination of the tissue expression profiles of CD151,
HSPB1, CFL, LGALS1, YWHAZ, ECM1, ITGα3, EPHA2 results in an AUC of 0.9136.

184
Figure 4B.5
Gene components of ROC curve:
CD151, HSPB1, CFL, LGALS1, YWHAZ, ECM1, ITGα3, EPHA2

185
4B.3.3 All target proteins are present in greater concentrations in EVs from PDAC
cell lines compared to those from HPDE
EVs used for these experiments were isolated via density gradient
ultracentrifugation as well as the FiberCell® hollow-fiber bioreactor system. Verification
of EV enrichment was initially conducted by assessing the protein levels of a variety of
consensus markers including CD9, CD63, and TSG101 (Figure 4B.6). These markers were
markedly increased in the EV samples as compared to the paired whole cell lysates,
regardless of the cell type of origin. Suggesting an adequate collection of EVs from both
cancer and healthy cell lines. Importantly, calnexin, a chaperone protein found only in the
endoplasmic reticulum, was absent in the EV samples and present in whole-cell lysates
(Figure 4B.6). This served as a positive marker of lysate loading as well as making the
possibility of cellular contamination in the EV samples is far less likely.
Next, the presence and amount of all eight of the target proteins were assessed via
western blot analysis (Figure 4B.7). CD151 and HSPB1 were enriched in EVs from T3M4,
MiaPaCa, and CD18/HPAF as compared to their matched whole cell lysates. Additionally,
the expressions of CD151 and HSPB1 were greatly diminished in HPDE EVs, suggesting
possible cancer specificity (Figure 4B.7A-B). Conversely, ITGα3 was expressed in EVs
and cell lysates in the cancer cell lines as well as HPDE, although EVs from CD18/HPAF
and MiaPaCa harbored a greater quantity. ECM1 is far more concentrated in cancer EVs
than in lysate (Figure 4B.7C). EPHA2, CFLN, LGALS1, and YWHAZ seem to be
virtually absent in HPDE EVs, which is an important feature for possible use as PDAC
specific biomarkers (Figure 4B.7D).

186
Figure 4B. 6 Evaluation of consensus EV markers via western blot analysis
A-B. Isolated EV populations from T3M4, MiaPaCa, CD18/HPAF, and HPDE were
verified with the consensus markers CD9 and CD63. Selective enrichment can be seen in
the EV samples and is minimal/absent in equivalent quantity (10 µg/well) of cell lysate. C.
Measurement of a third marker, TSG101, in EVs isolated via density gradient
ultracentrifugation as well as with the FiberCell® system. D. Blot showing the absence of
calnexin (a marker for cellular contamination) in isolated EV samples.

187
Figure 4B.6

188
Figure 4B. 7 Evaluation of EV surface target proteins via western blot
Equal protein concentrations (20 µg) of EV samples and cell lysates were loaded in each
well. The relative expression of each protein was assessed between cancer EV samples and
matched whole-cell lysates. Concurrently, the number of target proteins were compared
between EVs isolated from cancer cells and EVs isolated from the normal HPDE cell line.
Each panel displays a unique protein(s) as follows. A. CD151. B. HSPB1. C. ITGα3 and
ECM1. D. EPHA2, CFLN, LGALS1, and YWHAZ.

189
Figure 4B.7

190
4B.3.4 EPHA2, ECM1, CD151, and HSPB1 are verifiably present on the EV surface
Vesicular rupture during EV isolation, sample preparation, surface shaving, and/or
the LC-MS/MS procedure can contaminate the surface molecules with intravesicular
contents. Thus, immunogold staining and TEM evaluation were conducted in order to
verify the location and accessibility of the target proteins on the external aspect of the EV
membrane outer leaflet. Briefly, protein-A conjugated gold nanoparticles 10 nm in size
interact with primary antibodies bound to a protein of interest and appear as black spheres
on the TEM image. This provides a means of directly visualizing the location of a protein
within a sample. The immunogold protocol was first standardized with EV proteins known
to be present on the EV membrane, CD63, and TSG101 in CD18/HPAF EVs (Figure 4B.
8). Next, the eight target proteins were evaluated with this method. Four out of the eight,
EPHA2, ECM1, CD151, and HSPB1 were observed to be definitively located on the
external surface of the EVs (Figure 4B.8).
4B.3.5 EPHA2, ECM1, CD151, and HSPB1 expression in TCGA and effects on
survival
In an effort to discern which one of the targets would provide the most diagnostic
and prognostic significance, stage-wise FPKM expression levels and survival analysis was
conducted using the TCGA datasets on the proteins verified via immunogold staining to be
present on the EV surface: EPHA2, ECM1, CD151, and HSPB1 (Figure 4B.9). The gene
expression levels for CD151, ECM1, and EPHA2 were increased in cancer patients
compared to healthy patient tissue samples, even in stage I disease. Notably, the increase
in EPHA2 expression was greater than the other two targets. HSPB1 expression was not
about the same between healthy samples and throughout tumor progression. Congruently,
191
Figure 4B. 8 Immunogold staining of EV surface proteins
TEM images of immunogold staining showing the surface localization of consensus EV
protein markers CD63 and TSG101 as well as the four out of the eight target proteins:
EPHA2, CD151, ECM1, and HSPB1. The black spheres in the images are protein-A
conjugated 10 nm gold nanoparticles bound to the IgG primary antibodies against the target
proteins in question. Importantly, the isotype control (mouse IgG not reactive with target
proteins) is lacking the presence of black spheres around the EV surface, thus supporting
the observed positive staining.

192
Figure 4B.8

193
Figure 4B. 9 EPHA2, ECM1, CD151, and HSPB1 expression in TCGA and effects
on survival
TCGA stage-specific gene expression and survival curves were generated for the proteins
that were verified to be on the EV surface: ECM1, HSPB1, CD151, and EPHA2. No
difference in gene expression nor a significant impact on survival was observed for HSPB1.
However, the other three proteins were differentially expressed in PDAC as compared to
normal samples and all had a significant negative impact on survival. Notably, EPHA2 had
the largest discernible difference in expression between the two groups and the associated
survival curve was the most significant of all the proteins assessed (Log-Rank test p =
0.0137, Wilcoxon test p = 0.0111).

194
Figure 4B.9
195
the associated Kaplan-Meier curves for the three overexpressed proteins show that high
expression of CD151, ECM1, and EPHA2 are significantly correlated with worse overall
survival (Figure 4B.9). The most significant effect on survival was EPHA2, as determined
by both Log-Rank test, p = 0.0137 as well as Wilcoxon test, p = .0111. These findings
regarding the potential of EPHA2 were supported by results from the MiPanda Portal (a
combination database containing both TCGA and GTEx datasets) where EPHA2 was
found to be the most significantly upregulated in pancreas cancer (p = 2.48 e-36, relative to
normal tissue) when compared to other major cancer types (Figure 4B.10).
4B.3.6 EPHA2 is present on CD63 positive EVs and is reliably detected with ELISA
With the verified surface location of the protein, differential gene expression, and
prognostic capability EPHA2 became the first protein analyzed via ELISA. An in-house
sandwich-based ELISA was produced (specifics on in-house ELISA production are
presented in the method chapter of this thesis) utilizing an mAB antibody against EPHA2
(R&D Systems: MAB3036) to capture EVs and biotinylated CD63 (Abcam: ab134331) for
the detection antibody [CD63 was chosen because of the high level of expression in EVs
compared to the other consensus markers (CD9 and TSG101) in the previous western blot
analysis]. As a positive control, another ELISA was developed using CD63 as both the
capture and detection antibodies.
EVs isolated from the MiaPaCa cell line were deposited in duplicates into wells at
serially diluted concentrations beginning at 100 µg/well and ending at 1.6 µg/well. EPHA2
capture was able to efficiently capture EVs as well as produce a concentration-dependent
curve (Figure 4B.11). Interestingly, the signal intensities associated with EPHA2 capture
and CD63 detection were far greater than those produced from CD63 capture and detection

196
Figure 4B. 10 EPHA2 expression in cancer vs. normal tissue across major cancer
types
MiPanda portal was used to assess the relative level of EPHA2 expression in cancer vs.
normal tissues and cells of various origins. EPHA2 is the most significantly upregulated in
the setting of pancreas cancer (p = 2.48 e-36) compared to the other major cancer types.

197
Figure 4B.10
198
Figure 4B. 11 EPHA2 ELISA of CD63 positive EVs
A sandwich ELISA platform utilizing EPHA2 capture antibody and CD63 detection
antibody proved efficacious for the quantification of EPHA2 on CD63 positive EVs
isolated from CD18/HPAF supernatant. 100 µg of CD18/HPAF EVs were serially diluted
down to 1.6 µg and produced a concentration-dependent curve. Interestingly, the signal
amplitude achieved by EPHA2 capture and subsequent detection with CD63 was far
greater than what was produced by CD63 capture and detection (red and black bars,
respectively).

199
Figure 4B. 11

200
(Figure 4B.11). Possible reasons for this unforeseen observation could that CD63 harbor
a large quantity of surface EPHAS or conversely, CD63 is present in small numbers and
thus is unavailable for detection antibody binding when utilized for capture.
4B.3.7 EPHA2 is increased on EVs originating from PDAC cell lines compared to
HPDE cells
In order to minimize technical variation in the assay set up as well as to facilitate
both capture and detection with EPHA2 antibodies, a commercial EPHA2 ELISA kit was
purchased for subsequent experiments (RayBiotech). 50 µg/ml of EVs isolated from
CD18/HPAF, MiaPaCa, and HPDE, along with the same quantity of matched respective
whole cell lysates, were assayed in duplicates. Indeed, EPHA2 is enriched in EVs
compared to cell lysates and further, EPHA2 enrichment is far greater in cancer EVs
compared to EVs originating from HPDE (Figure 4B.12).
4B.3.8 Complete PDAC patient serum has a greater concentration of EPHA2
compared to healthy controls
39 completed patient serum samples from benign controls (comprised of chronic
pancreatitis, cystic lesion, biliary obstruction, and family history patients, n =13), early-
stage PDAC (I – IIB, n = 13), and late-stage PDAC (III-IV, n = 13) were diluted 1:1 in
PBS and assessed with the EPHA2 ELISA kit. The median expression of EPHA2 in
complete patient serum was 0.14 ng/ml for benign controls while the medians for early and
late-stage PDAC patient serum was 0.53 ng/ml and 0.57 ng/ml, respectively (Figure
4B.13). Using a cutoff above the benign control median value of 0.15 ng/ml, the assay
accuracy had a sensitivity of 76% and specificity of 62%. These data suggest a role for
EPHA2 assessment for PDAC diagnosis and monitoring but requires further refinement.

201
Figure 4B. 12 EPHA2 ELISA of PDAC and HPDE cell lines
50 µg/ml of isolated EVs and matched whole cell lysates from CD18/HPAF, MiaPaCa,
and HPDE cell lines were analyzed. EPHA2 was present in all whole cell lysate samples
(black bars). However, HPDE EVs had far less concentration of EPHA2 that the EVs
isolated from the two PDAC cell lines (red bars).

202
Figure 4B.12

203
Figure 4B. 13 EPHA2 ELISA of complete patient serum samples
ELISA analysis of complete patient serum samples from 13 patients each in benign control,
early-stage PDAC (I-IIB), and late-stage PDAC (III-IV) groups showed increased
expression of EPHA2 in cancer patient serum samples as compared to benign control. The
median for each cohort is denoted by the thick red bar in the middle of each violin plot and
is 0.14 ng/ml, 0.53 ng/ml, and 0.57 ng/ml for benign control, early-stage, and late-stage
PDAC, respectively.

204
Figure 4B.13

205
4B.3.9 EV surface EPHA2 evaluation is more specific than complete serum EPHA2
levels for predicting patient cancer status
In an effort to further refine the results of the complete serum analysis, ELISA was
next conducted on patient seromic EVs. EVs were isolated from ten patient serum samples
each from the benign control, early-stage PDAC, and late-stage PDAC groups to total 30
individual EV samples. Just as with complete serum, the levels of EV specific EPHA2
were higher in both cancer cohorts as compared to benign controls (Figure 4B.14).
However, the assessment of EPHA2 only on the EV surface facilitated a dramatic shift in
EPHA2 sensitivity and specificity as a PDAC diagnostic marker. Notably, the majority of
the EV samples from benign controls produced zero or negative (after blank subtraction)
O.D. values with only two samples achieving detection above the level of the blank. When
an O.D. cutoff was applied just above the highest benign control sample reading at 0.0036
to ensure 100% specificity, five out of the 20 (25%) PDAC EV samples were able to
correctly predict cancer status. (Of note, one of the O.D. values in the early stage cohort is
not shown on that graph because of a comparatively high reading relative to other samples
at 0.45).
4B.4 Discussion
Ever since the discovery that EVs are more than a simple mechanism to eliminate
intracellular waste and harbor functional molecules within their vesicular cargo, attempts
have been made to take advantage of them for a variety of purposes, including for use as
cancer-specific biomarkers 493. EVs hold myriad advantages for use as biomarkers
including being present in all biofluids, ease of collection, present at higher concentrations
in cancer patients, and mirroring their cell of origin. Recent studies have underscored

206
Figure 4B. 14 EPHA2 ELISA of patient seromic EVs
EPHA2 expression was increased in EVs isolated from both cancer cohorts as compared
to benign controls. Only two O.D. values in the benign control group achieved a level of
detection above blank. The median of each group is demarcated by the thick red line in the
center of each violin plot. Of note, one of the O.D. values in the early stage cohort is not
shown on that graph because of a comparatively high reading relative to other samples at
0.45.

207
Figure 4B.14

208
this potential of EVs to serve as non-invasive liquid biopsy-based biomarkers in the setting
of cancer 484. However, the majority of these studies to date have investigated the complete
EV contents for this purpose.
Specifically focusing on the EV surface hold many advantages making it an ideal
method for biomarker discovery. Identified targets are present on the external surface of
the EVs and thus, can be targeted for cancer-specific EV isolation and/or profiling, as
illustrated by previous studies. The preferred organ of metastasis can be predicted
predicated on what integrin proteins are present on the surface of cancerous EVs 284.
Conversely, specific EV surface molecules can impact the efficacy of therapeutic
modalities such as the case with PD-L1 487.
EVs possess great potential to serve as concurrent biomarkers with the currently
used clinical biomarker, CA19.9. Specifically for the screening of groups at high-risk for
developing PDAC, i.e. those with a strong family history, genetic syndrome, or a pancreatic
cystic lesion is primarily conducted via serial imaging and/or cystic fluid analysis
(discussed in Chapter 1 of this thesis). Notably, CA19.9 has limited accuracy and therefore
offers limited clinical advantage, especially for screening 492. Not all patients express the
appropriate fucosyltransferase enzyme required for CA19.9 synthesis 171 and this,
combined with the fact that many other disease processes cause increase expression of
CA19.9 494, 495, has relegated its use mostly as a monitoring marker for PDAC recurrence
after resection. Efforts have been made to increase the sensitivity and/or specificity of
CA19.9 in the diagnostic setting 489, 490. Unfortunately, to date, none have proven successful
enough to become integrated into clinical practice. Combination screening could increase
the diagnostic accuracy to a level amenable to high-risk population screening. This is quite

209
pertinent to this study since the low sensitivity precludes the use of the elucidated EV
surface marker, EPHA2, from being used as a single agent biomarker, yet may provide a
means of increasing the overall accuracy of CA19.9. For example, ruling out diseases other
than PDAC, which also cause an increase in CA19.9 expression. Thus, further investigation
into the concurrent assessment of EV surface EPHA2 and complete serum CA19.9 is
warranted.
4B.5 Conclusions and future directions
In this study, we built upon the previous finding that EV surface analysis via
surface-enhanced Raman spectroscopy is capable of discriminating between EVs isolated
from healthy and PDAC patient serum, although with limited accuracy (discussed in part
A of this chapter). This proof-of-concept study warranted further investigation into what
specific molecular species of the EV surface contribute to the SERS spectral shifts.
We began by first elucidating a pool of cancer-specific proteins via EV surface
shaving followed by LC-MS/MS analysis. Determination of the real-world significance of
each marker was conducted by expression profiling, gene correlations, ROC curve
assessment using data from TCGA as well as GSE27385 microarray datasets. This process
allowed for the reduction of 229 possible proteins down eight target proteins: cluster of
differentiation 151 (CD151), galectin-1 (LGALS1), cofilin (CFL1), tyrosine 3-
monooxygenase/tryptophan 5-monooxygenase activation protein zeta (YWHAZ),
extracellular matrix protein-1 (ECM1), ephrin A2 (EPHA2, integrin alpha 3 (ITGα3), and
heat-shock protein family B (small) member-1 (HSPB1). All eight proteins were validated
to be present in EVs via western blot, many of which were increased in EVs from cancer
cells compared to normal immortalized human epithelial cells (HPDE). Four of these eight,

210
EPHA2, ECM1, CD151, and HSPB1, were able to be visualized on the surface of EVs via
immunogold labeling and TEM imaging. TCGA expression and survival analysis of these
four protein genes were assessed leading to the selection of EPHA2 to be used for
subsequent experiments, due to the greatest difference in expression in cancer vs. normal
tissue as well as the most significant impact on survival. ELISA conducted on EVs from
PDAC cell lines and HPDE showed elevated expression of EPHA2 in PDAC EVs
compared to match lysates as well as HPDE EVs. Additionally, EPHA2 was found to be
elevated incomplete cancer patient serum compared to benign controls resulting in a
diagnostic sensitivity of 76% and specificity of 62%. Finally, EV specific EPHA2
expression isolated from patient serum samples proved capable of identifying 25% of
PDAC patients with 100% specificity.
Future studies will be undertaken in order to increase the diagnostic efficacy of EV
surface characterization. Firstly, the other three protein markers that were immunogold
validated to be on the surface of EVs: CD151, ECM1, and HSPB1 will be assessed in
patient serum samples to determine if they offer any additive benefit to EPHA2, especially
the low sensitivity (25%). Congruently, initial lectin array assessment identified four
lectins that bound far more CD18/HPAF EVs than EVs from HPDE (AAL, Con A, EEL,
and UEA-1) and one that preferentially bound with HPDE EVs (PNA) (Figure 4B.15).
Thus, providing new targets to be used in multiparametric profiling of the EV surface.
Finally, we have recently been able to analyze DNA isolated from EVs originating from
Panc1 pancreatic cancer cell line and HPDE via digital droplet polymerase chain reaction
(ddPCR), and detect PDAC associated mutation, KRAS G12D, in an accurate and
211
Figure 4B. 15 Preliminary lectin array of CD18/HPAF and HPDE EVs
Out of the 40 lectins analyzed as a part of the microarray, four were found to preferentially
bind EVs isolated from CD18/HPAF: AAL, Con A, EEL, and UEA-1, as determined by
relative fluorescence (red bars). Additionally, one lectin, PNA, bound HPDE EVs with
greater avidity (black bars). This is meant to serve as the preliminary investigation into
possible new surface markers to be used concomitantly with the elucidated protein markers
in a multiparametric analysis.
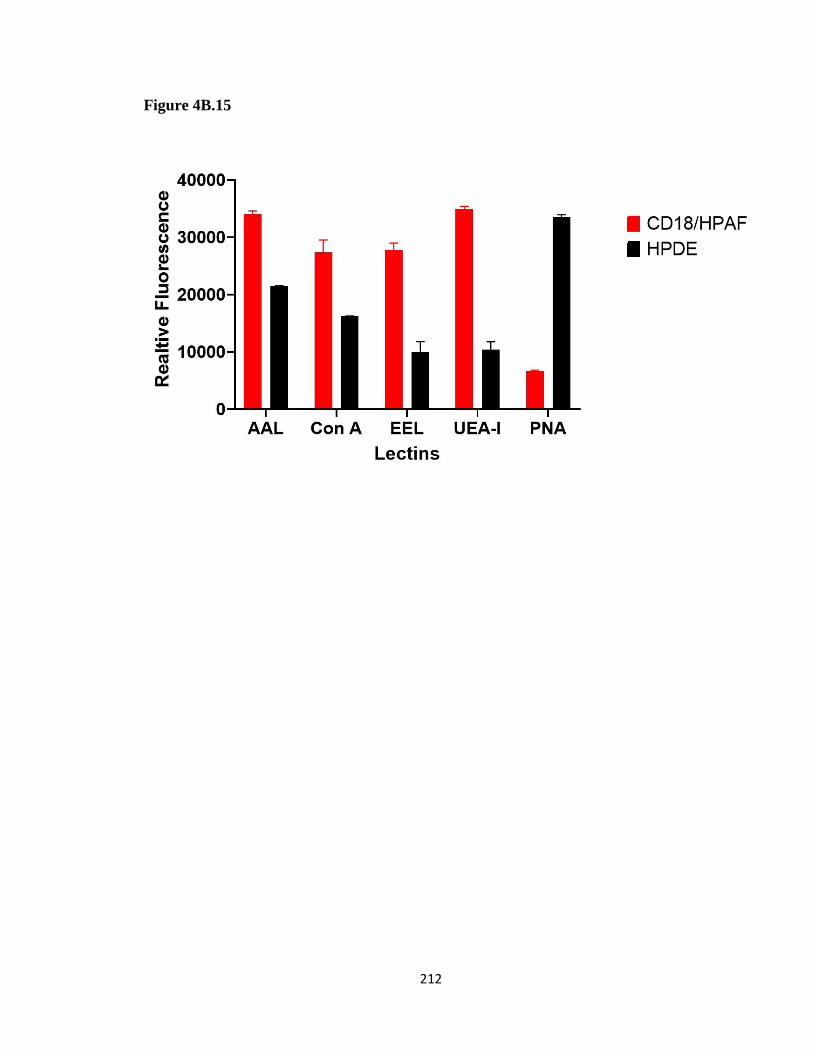
212
Figure 4B.15
213
Figure 4B. 16 Digital droplet PCR analysis of cell line EVs
The detected KRAS G12D mutation (blue boxes) and KRAS WT (brown boxes) are
presented in the graph as copy number/µl for each sample, which is enumerated above the
boxes in the graph. DNA isolated from Panc1 EVs and HPDE EVs was combined in the
following respective proportions: 1.0/0.0, .5/.5, .25/.75, .125/.875. and 0.0/1.0. As the
proportion of Panc1 EV DNA decreases the amount of KRAS G12D mutation detected
also decreases in a concentration-dependent manner. Importantly, no mutant KRAS is
detected in the sample containing only HPDE EV DNA, thus supporting assay specificity.

214
Figure 4B.16

215
concentration-dependent manner (Figure 4B.16). The detected copy number of the mutant
KRAS decreases as the percentage of Panc1 EV DNA comprising the sample decreases.
Future studies will combine this ddPCR technique with the identified EV surface proteins,
in an effort to isolate and identify PDAC specific EVs from patient serum samples.

216
Chapter 5: Radiation Potentiation via Ferroptosis
for the Improved Treatment of Pancreatic Ductal
Adenocarcinoma
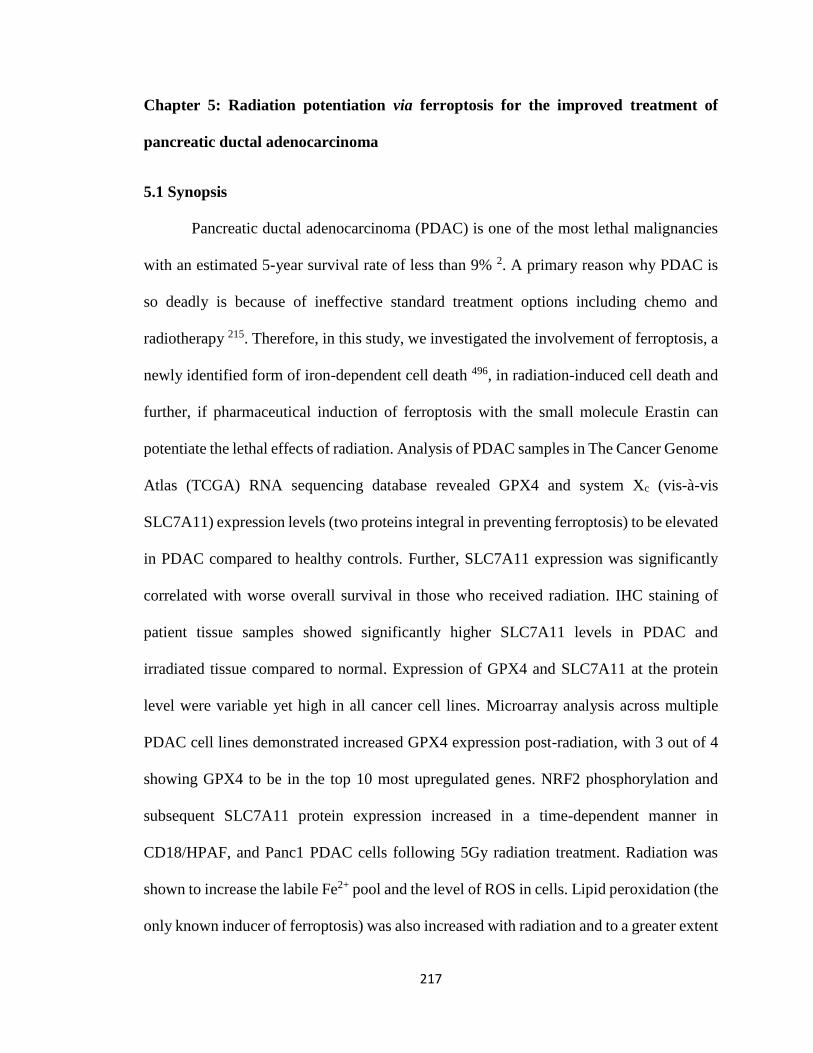
217
Chapter 5: Radiation potentiation via ferroptosis for the improved treatment of
pancreatic ductal adenocarcinoma
5.1 Synopsis
Pancreatic ductal adenocarcinoma (PDAC) is one of the most lethal malignancies
with an estimated 5-year survival rate of less than 9% 2. A primary reason why PDAC is
so deadly is because of ineffective standard treatment options including chemo and
radiotherapy 215. Therefore, in this study, we investigated the involvement of ferroptosis, a
newly identified form of iron-dependent cell death 496, in radiation-induced cell death and
further, if pharmaceutical induction of ferroptosis with the small molecule Erastin can
potentiate the lethal effects of radiation. Analysis of PDAC samples in The Cancer Genome
Atlas (TCGA) RNA sequencing database revealed GPX4 and system Xc (vis-à-vis
SLC7A11) expression levels (two proteins integral in preventing ferroptosis) to be elevated
in PDAC compared to healthy controls. Further, SLC7A11 expression was significantly
correlated with worse overall survival in those who received radiation. IHC staining of
patient tissue samples showed significantly higher SLC7A11 levels in PDAC and
irradiated tissue compared to normal. Expression of GPX4 and SLC7A11 at the protein
level were variable yet high in all cancer cell lines. Microarray analysis across multiple
PDAC cell lines demonstrated increased GPX4 expression post-radiation, with 3 out of 4
showing GPX4 to be in the top 10 most upregulated genes. NRF2 phosphorylation and
subsequent SLC7A11 protein expression increased in a time-dependent manner in
CD18/HPAF, and Panc1 PDAC cells following 5Gy radiation treatment. Radiation was
shown to increase the labile Fe2+ pool and the level of ROS in cells. Lipid peroxidation (the
only known inducer of ferroptosis) was also increased with radiation and to a greater extent

218
with combination treatment. Combination treatment synergistically reduced cell and
organoid viability, compared to RT alone. Finally, the combination of Erastin and radiation
significantly reduced the size of tumors in xenograft mouse models.
5.2 Background and rationale
Surgical resection is the most effective treatment technique for PDAC 497.
Unfortunately, the vast majority of pancreatic cancer cases are detected in later stages,
when resection is no longer a viable option 176. Congruently, current chemotherapeutic
options are either ineffective or extremely toxic and thus provide little added survival
benefit 215. Radiation therapy (RT) is primarily utilized in the neoadjuvant setting to shrink
borderline resectable and unresectable non-metastatic tumors to a size amenable to
resection 200, 201, with initial attempts recently being made to definitively treat those with
nonresectable disease via stereotactic body radiation (SBRT) 203. Unfortunately, many
pancreatic tumors remain refractory to radiation treatment 208 (for more information
regarding current PDAC therapies, see section 1.5 Therapeutic strategy, in Chapter 1 of
this thesis). The combination of these factors has initiated the search for new treatment
sensitizing agents to increase the effectiveness of current non-surgical treatments.
Ferroptosis is a recently discovered form of programmed cell death that requires
labile intracellular ferrous iron (Fe2+) 496, 498. An abundance of reactive oxygen species
(ROS) present within a cell, either endogenous or exogenous in origin, results in a lethal
buildup of peroxidated lipid species, specifically phosphatidylethanolamine (PE), inducing
ferroptosis 498. Glutathione peroxidase 4 (GPX4) converts lethal PE peroxides to nontoxic
lipid alcohols and this enzymatic activity of GPX4 is depended on the availability of
glutathione (GSH) 499, 500. One of the primary mechanisms of GSH synthesis requires the

219
import of extracellular cysteine into the cell via the cysteine-glutamate antiporter, System
Xc (a complex of SLC3A2 and SLC7A11 proteins) 501. Pharmacological inhibition of
SLC7A11 with the small molecule Erastin, prevents the adequate production of GSH, thus
inhibiting GPX4 enzymatic activity, which, in turn, causes the lethal lipid peroxides to
accumulate, culminating in ferroptosis induction 502 (Figure 5.1).
This method of ferroptotic induction has become an increasingly popular area of
study for use as a therapeutic adjuvant for a variety of cancer therapies including chemo
503 and radiation therapies 504, 505. One of the advantages of targeting SLC7A11 is a degree
of cancer specificity is offered by an increased level of ROS in the setting of cancer
compared to normal and the inherent reliance on a variety of antioxidative mechanisms
(including SLC7A11) 506-510. Moreover, SLC7A11 CRISPR knock out does not affect the
gestation or morphology of mice, thus implying systemic SLC7A11 blockade may be well
tolerated 511. Additionally, many cancers that have resistance to conventional cytotoxic
chemotherapeutics seem sensitive to ferroptotic induction 503, 512, 513.
Radiation therapy is an excellent candidate for potentiation with ferroptosis as one
of its primary mechanisms of inducing cell damage is mediated by the production of ROS
514. With the advent of hypo fractionated SBRT, highly conformational large doses of
radiation can be administered at a given time thereby producing higher levels of ROS at
once, specifically within the tumor. These two therapeutic modalities are ideally suited to
complement one another in their mechanisms of action where and increase in ROS
generation is provided by radiation and a diminished capability of eliminating the
associated lipid toxicity is provided by SLC7A11 inhibition. In accordance with this
background and rationale, we hypothesize that in the setting of radiation, system Xc

220
Figure 5. 1 Schematic of Erastin induced ferroptosis
Erastin induction of ferroptosis is mediated by the blockade of SLC7A11, a
component of the cystine-glutamate antiporter System Xc, thereby preventing glutathione
(GSH) synthesis. GSH is required as a substrate for glutathione peroxidase 4 (GPX4)
enzymatic conversion of toxic lipid hydro peroxides into non-toxic lipid alcohols. The
build-up of lipid hydro peroxides culminates in ferroptotic death. NRF2, the transcription
factor responsible for SLC7A11 and GPX4, is depicted. Cellular ferroptotic susceptibility
is also determined by the availability of free ferrous iron (Fe2+) and its ability to produce
ROS via Fenton chemistry. The majority of iron existing in the ferritin bound non-ferrous
form as depicted.

221
Figure 5.1

222
inhibition with Erastin will facilitate ROS mediated lipid peroxidation and subsequent
ferroptosis induction, thus increasing the lethal effect of radiation therapy in the setting
PDAC.
5.3 Results
5.3.1 GPX4 and SLC7A11 are differentially expressed in pancreas cancer
As mentioned above, it is known that SLC7A11 and GPX4 act in concert as the
primary mitigators of ferroptosis induction. As such, the expression levels of each protein
were initially assessed through the Gepia and MiPanda Portals which both combine The
Cancer Genome Atlas (TCGA) RNA sequencing data from patient tissue samples with the
cell line genetic data found in the GTEx database. When both pancreas cancer tissues and
cell line data are considered, GPX4 is present at far higher quantities as compared to
healthy samples. Figure 5.2A displays the percentage of samples that have GPX4
expression levels >100 and 200 TPM in both cancer and healthy tissues. The difference
between the percentage of samples with >100 TPM in cancer and healthy tissues can be
better visualized in Figure 5.2B. Notably, the pancreas is one of the top three organs in
terms of increased expression of GPX4 with 98% of cancer samples having a TPM >100
compared to only 8% of healthy samples. Congruently, the expression level of SLC7A11
in the combination TCGA and GTEx dataset is elevated in the setting of pancreas cancer
as compared to healthy samples (Figure 5.3).
Interestingly, the expression of GPX4 was not found to be significantly altered in
the setting of PDAC as compared to healthy tissue samples, nor did it have any significant
effect on survival, when only considering patient samples in TCGA (Figure 5.4A-B).

223
Figure 5. 2 GPX4 expression in pancreas cancer compared to normal pancreas and
relative to cancers of various origin
A. GPX4 expression is shown as transcripts per million (TPM) in cancer and normal tissues
among a wide array of different organ types. The percentage of samples assayed with
GPX4 expression >100 and >200 TPM are displayed as a heat map. Notably, the difference
in expression in pancreas cancer and normal pancreas is one of the highest in both
categories. B. Bar graph depiction of the difference between cancer and normal tissues with
GPX4 expression >100 TPM. The pancreas is the third highest out of all tissue types with
98% of cancer and only 6% of normal tissue (92% difference) achieving this expression
level. Notably, these data combine patient PDAC neuroendocrine samples (TCGA) and
PDAC cell line (GTEx) data.

224
Figure 5.2

225
Figure 5. 3 SLC7A11 expression in pancreas cancer compared to normal pancreas
and relative to cancers of various origin
The expression of SLC7A11 is shown as TPM. SLC7A11 is increased in cancer
compared to normal in a wide array of tissue types. Specifically, it is increased over two-
fold in pancreas cancer. Notably, these data combine patient PDAC neuroendocrine
samples (TCGA) and PDAC cell line (GTEx) data.

226
Figure 5.3

227
Conversely, SLC7A11 expression was indeed elevated in PDAC patients, yet also
with no effect on survival (Figure 5.4C-D). Of note, the TCGA only has RNA sequencing
data of four healthy pancreas tissue samples within the database, thus limiting its utility for
PDAC vs healthy comparisons when used in isolation. Further, the pancreas cancer cohort
is comprised of PDAC and pancreatic neuroendocrine tumor samples. The neuroendocrine
samples have not been taken out of the datasets in the MiPanda and Gepia Portals and have
been for our in house TCGA analysis to specifically discern the expression patterns in
PDAC.
5.3.2 SLC7A11 protein expression is increased in the majority of PDAC cell lines
compared to HPDE
The amount of GPX4 and SLC7A11 protein present in cell lines was next analyzed
via western blot. This was conducted in many different PDAC cell lines that covered a
wide mutational spectrum, differentiation statuses, as well as from primary and metastatic
origins including CD18/HPAF, MiaPaCa, Colo357, AsPC1, Panc1, Capan1, T3M4, and
BxPC3. Along with these, an immortalized human pancreatic epithelial cell lined, HPDE,
was also assessed. GPX4 was present in roughly equal quantities across the PDAC cell
lines as well as HPDE (Figure 5.5). Conversely, SLC7A11 expression was increased in
five out of the eight PDAC cell lines assessed: CD18/HPAF, MiaPaCa, Panc1, T3M4, and
BxPC3 (Figure 5.5). The increased expression of SLC7A11 in a majority of PDAC cell
lines suggests an increased reliance on the cysteine import facilitated by System Xc and
could prove to be an actionable target for the induction of ferroptosis.

228
Figure 5. 4 GPX4 and SLC7A11 expression and survival in the TCGA PDAC cohort
As mentioned prior, the previous figures showed data combining a wide variety of pancreas
cancer specimens. PDAC specific expression was assessed in the TCGA dataset and is
displayed as FPKM values. A. GPX4 expression in normal and tumor samples is not altered
and survival is not impacted. B. SLC7A11 expression is higher in tumor samples as
compared to normal but also does not have any correlation with overall survival. Of note,
the limitation of the TCGA dataset is the presence of only four normal samples for
comparison.

229
Figure 5.4

230
Figure 5. 5 GPX4 and SLC7A11 protein expression in PDAC cell lines
GPX4 and SCL7A11 protein expression were analyzed via western blot in CD18/HPAF,
MiaPaCa, Colo357, AsPC1, Panc1, Capan1, T3M4, and BxPC3 PDAC cell lines and one
immortalized normal human pancreatic ductal epithelium cell line, HPDE. There was no
significant difference observed in GPX4 expression between the PDAC cell lines and
HPDE. SLC7A11 protein level was increased in CD18/HPAF, MiaPaCa, Panc1, T3M4,
and BxPC3 cell lines (5 out of 8).

231
Figure 5.5

232
5.3.3 Most PDAC cell lines are more sensitive to Erastin than HPDE
Given these bioinformatics and protein data, we next sought to determine the
efficacy of ferroptotic induction via pharmacological system Xc inhibition. Prior to the
initiation of the in vitro experiments, the effect of SLC7A11 knockdown was queried in a
publicly available RNAi screen conducted on 398 diverse cancer cell lines put forth by the
Broad Institute called Project DRIVE 225. This compendium was designed to elucidate
dependencies and vulnerabilities associated with specific cancer types. Notably, five out
of the top 25 most sensitivity cancer cell lines to SLC7A11 KD were PDAC and are
highlighted by the red bars in Figure 5.6.
In vitro assessment of pharmaceutical inhibition of System Xc was conducted with
Erastin, a small molecule inhibitor of SLC7A11 known to induce ferroptosis. The lethality
of 0.312, 0.6125, 1.25, 2.5, 5, and 10 µM concentrations of Erastin in the eight PDAC cell
lines, as well as HPDE, was measured by MTT assay at 24 and 48-hour time points. A non-
linear fit of the MTT data allowed for the adjudication of the 48 hour IC50 values (Figure
5.7A). All but two of the PDAC cell lines (MiaPaCa and BxPC3) were more sensitive to
ferroptotic induction via Erastin than HPDE cells. The 24 and 48-hour non-linear fit graphs
are also presented for HPDE and the two cell lines that were used for the remainder of the
studies (Panc1 and CD18/HPAF) in Figure 5.7B. Of note, HPDE is unaffected by Erastin
treatment for 24 hours and the slope at 48 hours is not nearly a precipitous as the two PDAC
cell lines. These data together suggest that PDAC cells are more sensitive to Erastin
treatment that normal immortalized pancreatic epithelium.

233
Figure 5. 6 Project DRIVE analysis of RNAi SLC7A11 knockdown in PDAC cell
lines
SLC7A11 RNAi screening of 398 cell lines from different cancer types showed that PDAC
cell lines were 5 of the top 25 (including the 1st, 3rd, 8th, 20th, and 23rd) most susceptible
cell lines. It is displayed here as the Project Drive susceptibility score. The more negative
the score the more reliant upon SLC7A11 the cell line is. The PDAC cell lines are
highlighted in red.

234
Figure 5.6
-3.5
-3
-2.5
-2
-1.5
-1
-0.5
0
5 of top 25 most sensitive cell lines from PDAC primary tumors: Ranks 1, 3, 8, 20, 23
0
-0.5
-1.0
-1.5
-2.0
-2.5
-3.0
-3.5
Sen
siti
vity
Sco
reCancer Cell lines

235
Figure 5. 7 Erastin MTT survival curves in PDAC cell lines and HPDE
Cell survival with different µM concentrations of Erastin (10, 5, 2.5, 1.25, 0.625, and
0.3125) was determined by MTT assay at 24 and 48-hour time points. It is displayed here
as % viability relative to untreated control. A non-linear regression analysis was applied
and IC50 concentrations elucidated A. The 48-hour survival curves of all the PDAC cell
lines CD18/HPAF, MiaPaCa, Panc1, Colo357, T3M4, AsPC1, and BxPC3 along with the
listed IC50 concentrations. B. 24 and 48-hour survival curves for HPDE as well as the two
PDAC cell lines used in the remainder of the experiments, CD18/HPAF and Panc1. Of
note, the normal cell line HPDE was far more resistant to Erastin induced cell death with
no effect at 24 hours, even at 10 µM concentration and a far less steep slope at 48 hours
compared to the PDAC cell lines.
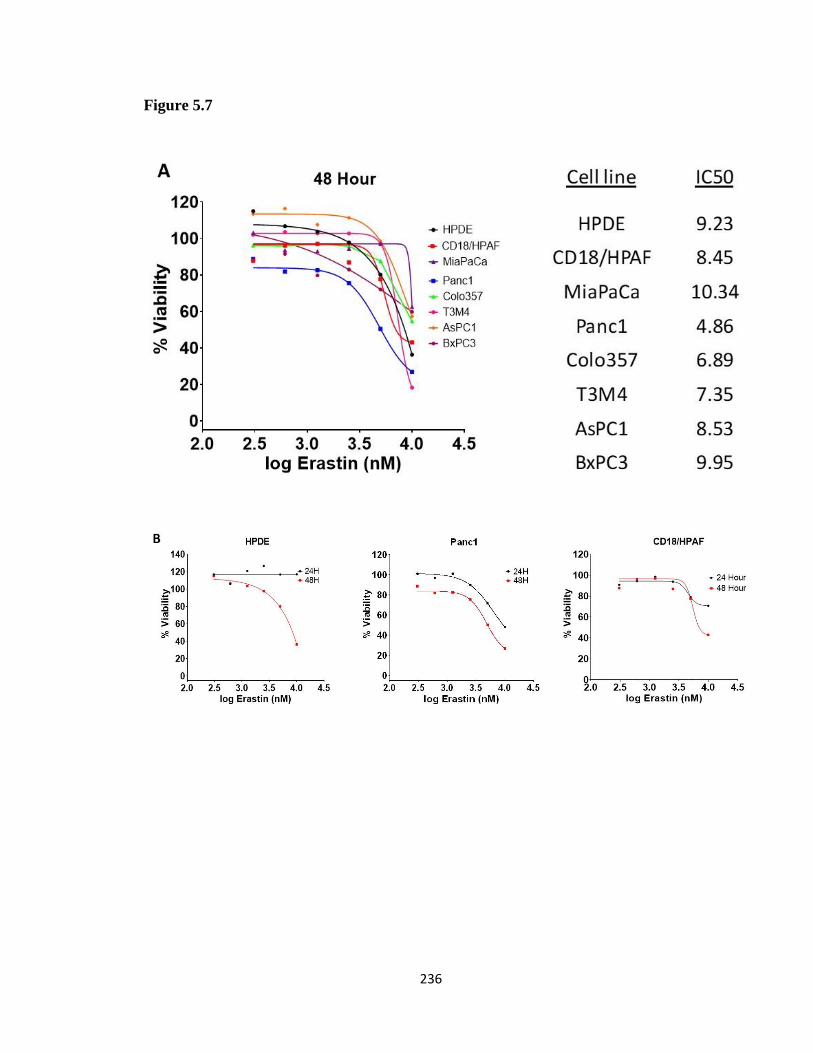
236
Figure 5.7

237
5.3.4 Erastin inhibits cellular migration
A scratch migration assay was conducted over the course of 72 hours on
CD18/HPAF cells in the presence of various Erastin concentrations (1, 5, and 10 µM) to
assess its functional ability to prevent cell migration. The area of the cruciform scratch was
evaluated on day one and at 24, 48, and 72-hour time points with Image J software. The
percent wound closure was calculated by dividing the measured area remaining at a given
time point by the initial scratch area. Indeed, the wound closure percentage was decreased
in a concentration-dependent manner at all three-time points (Figure 5.8).
5.3.5 Erastin treatment decreases intracellular GSH
The mechanism by which Erastin is said to induce ferroptosis is by preventing
cysteine import required for GSH synthesis 515. Thus, we next sought to verify that this was
true by testing total glutathione levels after 24-hour treatment with Erastin in CD18/HPAF
and Panc1 cancer cell lines. Treatment concentrations for each cell line were adjusted to
below the projected 24 hour IC20 (as determined by the previous MTT assays) to 1 µM for
Panc1 and 2 µM for CD18/HPAF (of note, these are the cell line-specific concentrations
that will be used for the remainder of the experiments). Indeed, Erastin effectively reduced
the total glutathione (GSH) concentrations to 61.7% of the untreated control in
CD18/HPAF cells and 26.6% in Panc1 cells (Figure 5.9). Interestingly, even at the higher
concentration, total GSH in CD18/HPAF was less effected by Erastin treatment, which
mirrors the respective sensitivities to Erastin induced cell death as determined by MTT.
These data suggest that CD18/HPAF may not have as much reliance upon SLC7A11 as
Panc1 for the production of GSH and could be supported by an alternative pathway, i.e.
transsulfuration.

238
Figure 5. 8 Erastin impact on CD18/HPAF migration
The ability of 1 µM, 5 µM, and 10 µM concentration of Erastin to reduce CD18/HPAF cell
migration was assessed via scratch assay with images taken at 24, 48, and 72 hours. It is
displayed here as the total percentage of wound closure at the given time. An impressive
reduction in cellular migration was noticed at the 10 µM concentration at all times
measured.

239
Figure 5.8

240
Figure 5. 9 Erastin depletion of glutathione
Panc1 was treated with 1 µM Erastin and CD18/HPAF with 2 µM Erastin for 24 hours at
which point the total amount of glutathione present was determined. Erastin concentrations
for each cell line were based on the IC20 values measured from the previous MTT
experiments. Erastin treatment caused a 70% reduction and 40% reduction in proportion to
the no treatment control in Panc1 and CD18/HPAF, respectively.

241
Figure 5.9

242
5.3.6 Radiation promotes GPX4, SLC7A11 expression and the phosphorylation of
NRF2 in vitro
Publicly available microarray data of four PDAC cell lines (Panc1, AsPC1,
MiaPaCa, and BxPC3) 6 hours after receiving a 2Gy dose of radiation was analyzed for
our genes of interest. While SLC7A11 was not present in the microarray platform, GPX4
was highly upregulated in the irradiated cells compared to the non-radiated controls
(Figure 5.10A). Specifically, GPX4 was the second most upregulated mRNA in both
Panc1 and AsPC1, and the tenth and 111th most in MiaPaCa and BxPC3, respectively.
Thus, suggesting an integral role of GPX4 in the response to radiation as well as the
possibility of radiation-induced ferroptosis. Many genes involved in the induction of
ferroptosis were down-regulated such as fatty acid-CoA ligase 4 (ACSL4/FACL4) 516,
voltage-dependent anion channels (VDAC) 1-3 517, and nuclear receptor coactivator 4
(NCOA4) (Figure 5.10A). Notably, NCOA4 is the known inducer of ferritinophagy
(specific autophagy of iron-bound ferritin that releases free Fe2+) thereby facilitating iron-
mediated lipid peroxidation and eventual ferroptosis 518. Concurrently, the iron
sequestration molecule heat shock protein family B (small) member 1 (HSPB1) was
upregulated (a known ferroptosis inhibitory molecule capable of binding free Fe2+ 519 as
was glutathione synthetase (GSS) in the setting of radiation. Of not, GSS and GPX4 are
transcribed by the transcription factor NRF2 503.
Assessment of GPX4 and SLC7A11 at the protein level was conducted on Panc1
and CD18/HPAF cell lines at 6, 12, 24, 48, and 72 hour time points following the
administration of 5Gy radiation. GPX4 expression was slightly increased in both cell lines
though at an earlier time point in the Panc1 cell line compared to CD18/HPAF (Figure

243
5.10B). A more impressive increase was found in the time-dependent expression of
SLC7A11 as well as the phosphorylation of NRF2 (the transcription factor responsible for
GPX4, GSS, and SLC7A11 transcription 520) in both cell lines (Figure 5.10B).
Phosphorylation of NRF2 has been shown to increase nuclear localization and promotes
transcription 521. Taken together, these data suggest the importance of the SLC7A11-GSH-
GPX4 axis in the response to radiation.
5.3.7 SLC7A11 is increased in PDAC and radiated patient tissues
The protein expression of GPX4 and SLC7A11 was next assessed via
immunohistochemistry (IHC) staining in 8 healthy, 21 PDAC, and 12 irradiated PDAC
patient tissue samples graciously provided by Dr. Chi Lin in the Department of Radiation
Oncology at the University of Nebraska Medical Center. Slides were graded by a certified
pathologist and H-scoring conducted as described in the methods chapter. GPX4
expression was not significantly different between the three cohorts (Figure 5.11A).
SLC7A11 was relatively unchanged between the healthy and PDAC samples but
significantly increased in the irradiated samples compared to both PDAC and healthy
controls (Figure 5.11B).
5.3.8 SLC7A11 gene expression is significantly correlated with survival in radiated
patients
Since SLC7A11 was increased so dramatically in the irradiated patient samples, we
next determined its correlation with survival using the radiation patient PDAC cohort
within the TCGA dataset. For those PDAC patients that underwent radiation treatment,
SLC7A11 was significantly correlated with worse survival outcomes (Log-Rank test p =
0.0344, Wilcoxon test p = 0.0478, Figure 5.12A). The median survival time for patients

244
Figure 5. 10 mRNA and protein analysis of PDAC cell lines after radiation
A. A publicly available microarray dataset of mRNA analysis from 4 PDAC cell lines
(Panc1, AsPC1, MiaPaCa, and BxPC3) exposed to 2Gy radiation and collected after 6
hours was used for this analysis. Radiation exposure caused an increase myriad molecules
involved in ferroptosis including GPX4 and glutathione synthetase (GSS) (notably, both
are transcription products of NRF2 transcription factor). Additionally, mRNA encoding
the iron liberating protein implicated in ferroptosis, NCOA4, was decreased while that for
HSPB1, an iron sequestration protein known to inhibit ferroptosis, was upregulated. B.
GPX4 and SLC7A11 expression in Panc1 and CD18/HPAF cell lysates collected from cells
at 6, 12, 24, 48, and 72 hours after 5Gy radiation exposure was measured via western blot.
While GPX4 showed a marginal increase in both cell lines, SLC7A11 was dramatically
increasing upon radiation exposure. Also, phosphorylation of NRF, a modification that has
been shown to increase nuclear translocation and facilitate transcription, was increased
after exposure to radiation. Of note, Along with GPX4 and GSS, NRF is responsible for
the transcription of SLC7A11.

245
Figure 5.10

246
Figure 5. 11 GPX4 and SLC7A11 protein expression in patient tissue samples
Immunohistochemical (IHC) analysis was conducted on 8 healthy, 21 PDAC, and 12
irradiated PDAC patient samples to assess the levels of GPX4 and SLC7A11. The tissue
level of each protein is presented as an H-score (for more on how H-scores were calculated
see Chapter 2). A. No significant difference in tissue expression of GPX4 was observed
between all three groups. B. SLC7A11 was significantly increased in irradiated samples
compared to healthy (p < 0.005) and non-irradiated PDAC (p < 0.005).

247
Figure 5.11
GPX4
SLC7A11

248
Figure 5. 12 SLC7A11 survival of radiated PDAC patients in TCGA
The PDAC patient RNA sequencing data in TCGA was revisited and the correlation
between SLC7A11 expression and survival was assessed within the patient cohort that
received radiation therapy. A. An impressive shift occurred from the survival analysis of
SLC7A11 in the complete PDAC population. Its expression became significantly
correlated with survival. A finding made all the more impressive by the fact that the total
patients who received radiation and were analyzed were 12 (6 high and 6 low expressers).
B. The previously presented SCL7A11 survival curve for the entire PDAC population
provided for reference.
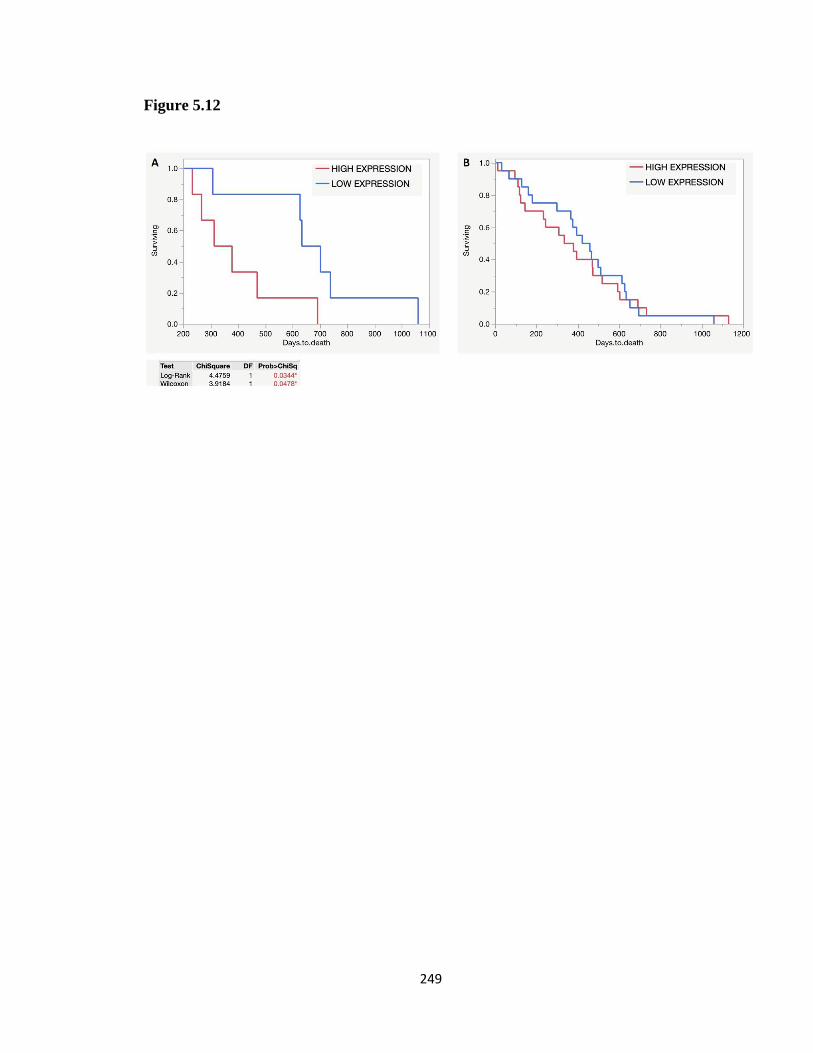
249
Figure 5.12
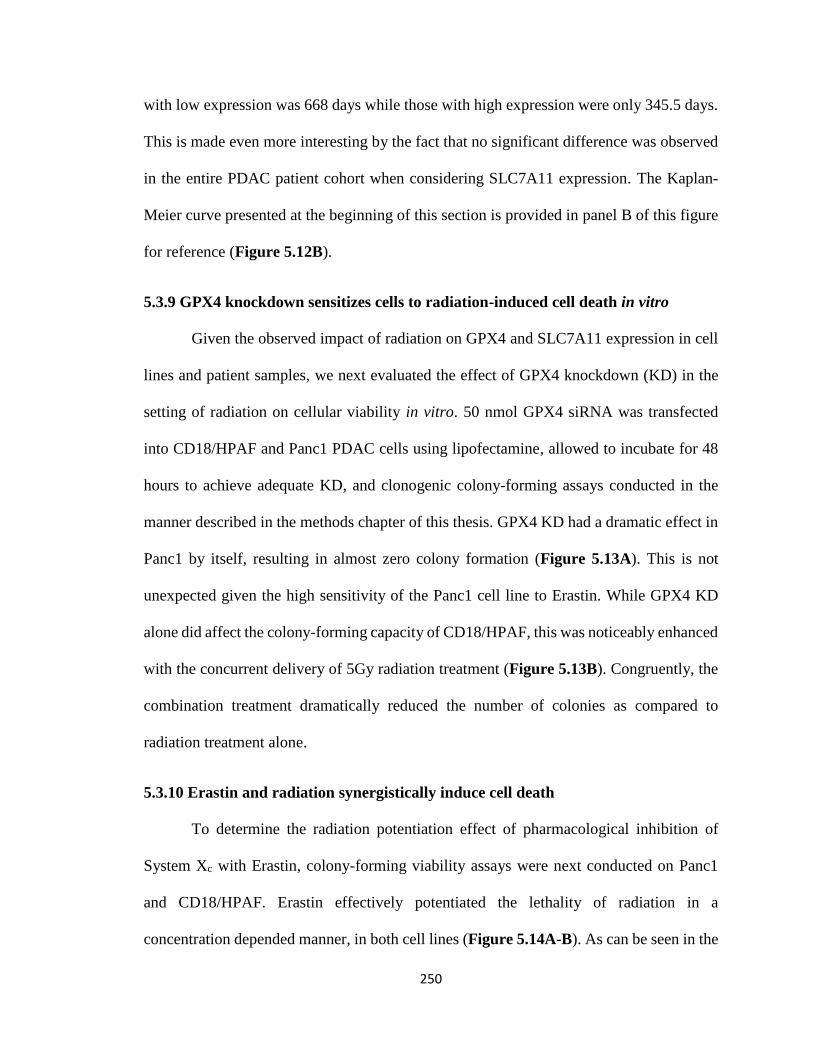
250
with low expression was 668 days while those with high expression were only 345.5 days.
This is made even more interesting by the fact that no significant difference was observed
in the entire PDAC patient cohort when considering SLC7A11 expression. The Kaplan-
Meier curve presented at the beginning of this section is provided in panel B of this figure
for reference (Figure 5.12B).
5.3.9 GPX4 knockdown sensitizes cells to radiation-induced cell death in vitro
Given the observed impact of radiation on GPX4 and SLC7A11 expression in cell
lines and patient samples, we next evaluated the effect of GPX4 knockdown (KD) in the
setting of radiation on cellular viability in vitro. 50 nmol GPX4 siRNA was transfected
into CD18/HPAF and Panc1 PDAC cells using lipofectamine, allowed to incubate for 48
hours to achieve adequate KD, and clonogenic colony-forming assays conducted in the
manner described in the methods chapter of this thesis. GPX4 KD had a dramatic effect in
Panc1 by itself, resulting in almost zero colony formation (Figure 5.13A). This is not
unexpected given the high sensitivity of the Panc1 cell line to Erastin. While GPX4 KD
alone did affect the colony-forming capacity of CD18/HPAF, this was noticeably enhanced
with the concurrent delivery of 5Gy radiation treatment (Figure 5.13B). Congruently, the
combination treatment dramatically reduced the number of colonies as compared to
radiation treatment alone.
5.3.10 Erastin and radiation synergistically induce cell death
To determine the radiation potentiation effect of pharmacological inhibition of
System Xc with Erastin, colony-forming viability assays were next conducted on Panc1
and CD18/HPAF. Erastin effectively potentiated the lethality of radiation in a
concentration depended manner, in both cell lines (Figure 5.14A-B). As can be seen in the

251
Figure 5. 13 Impact of GPX4 knockdown on CD18/HPAF and Panc1 survival in the
setting of radiation
Colonies are presented on the left side of the panel and how the effect of GPX4 knockdown
on the viability of cells with and without 5Gy radiation treatment. The quantification of
colony number is presented as a proportion of the untreated control and is displayed on the
right. A. Unfortunately, GPX4 knockdown in the Panc1 cell line proved too lethal to be
able to assess any impact in the setting of radiation. This is not unexpected and is in line
with our previous findings of Panc1 hypersensitivity to upstream GPX4 inhibition via
Erastin treatment B. For CD18/HPAF GPX4 KD was able to sensitize cells to radiation
treatment resulting in a greater proportion of cell death with the combination treatment.

252
Figure 5.13

253
graphical representation of the data, the highest concentration of Erastin tested, 2 µM, was
required for adequate radiation potentiation in CD18/HPAF cells but was overtly lethal
alone in Panc1 cells (this is directly in line with the previous MTT result for each cell line
and their respective IC20 concentrations, Figure 5.7). A direct comparison of the survival
of each cell line at 5Gy radiation is provided in Figure 5.15. In Panc1, 1 µM Erastin causes
a significant reduction in survival at 5Gy while 2 µM is required to reach significance in
CD18/HPAF. The difference in the respective radiation enhancement ratios (ER) for each
concentration of Erastin are also presented to show the relative inter-concentration and
individual cell efficacy, as determined by the Fertil linear quadratic method as described
in Chapter 2 of this thesis (Figure 5.14A-B).
The online software Combenefit utilizes three individual synergy models, BLISS,
Loewe, and HSA to determine if true synergism exists (and not merely additivity) between
two treatments. The BLISS model takes into account the effect of each treatment
independently and determines the level of synergism predicated on efficacy above the
product of the combination lethality, i.e. LC < LT1LT2; where Lc is the lethality of the
combination treatment, and LT1 and LT1 are the lethality of treatment 1 and treatment 2,
respectively. The Loewe model assumes linearity and is predicated on the IC50 values
while the HSA model has the loosest definition for synergism where any death above single
treatment is considered synergistic. Because of these reasons the BLISS model was chosen
for subsequent analysis. The interpretation of BLISS synergy scores can be assumed as
follows: < -10 is considered likely antagonism, 10 to 10 is considered likely additivity, and
>10 is considered likely synergism.

254
Figure 5. 14 Response of CD18/HPAF and Panc1 to combination radiation and
Erastin treatment
Colonies are presented on the left side of the panel and show the effect 0.0, 0.1, 0.5, 1.0,
and 2.0 µM Erastin at 0, 1, 3, 5, and 7Gy radiation. The resultant survival curves are
presented on the right as well as the associated radiation enhanced ratio (ER). Erastin
displayed the ability to potentiate radiation induces cell death in a concentration-dependent
manner in both cell lines A & B. Although, notable yet as expected, the 2 µM concentration
was too high by itself in Panc1 leading to almost complete cell death by itself.

255
Figure 5.14

256
Figure 5. 15 Direct comparison between CD18/HPAF and Panc1 response to Erastin
with 5Gy radiation treatment
Viability is presented as the proportional survival relative to untreated control. All
treatment provides a significant reduction in cell viability as compared to control in both
cell lines. However, 1 µM and 2 µM Erastin provide a significant increase in the level of
cell death at 5Gy above that of radiation alone in Panc1 while only 2 µM Erastin treatment
does so in CD18/HPAF.

257
Figure 5.15

258
Our survival data was utilized to determine if any additive and/or synergistic
lethality exist with combination Erastin and Radiation treatment, compared to either
treatment alone. Indeed, a high degree of synergism was found with combination treatment
in both CD18/HPAF and Panc1 cells, each attaining a BLISS score exceeding 40 (Figure
5.16A-B). The percent decrease in viability is presented in the subpanel i of each panel and
topographic representation of the BLISS scores as a function of treatment concentrations
are presented in subpanels ii and iii. These are presented as a matrix in subpanel iv where
one can see the actual numerical representation of the synergism present. Interestingly, a
comparison between the CD18/HPAF matrix in Figure 5.16Aiv and the Panc1 matrix in
Figure 5.16Biv brings to light the difference in the synergy pattern. Where the highest
level of synergy occurs in CD18/HPAF at 2 µM Erastin and 3Gy radiation (BLISS score
42), the most efficient synergy observed in Panc1 occurs at 500 nM Erastin and 1Gy
radiation. This is indicative of the relative sensitivities of each cell line to radiation as well
as Erastin. Of not, synergy is observed (BLISS scores above 10) across a wide array of
treatment combinations, though they are not as extreme.
5.3.11 Combination radiation and Erastin treatment-induced cell death is mitigated
with the addition of Ferrostatin-1
In an effort to determine if the cell death resulting from the combination treatment
is attributable to ferroptosis specifically, we repeated the colon forming assays (both cell
lines with 5Gy radiation, CD18/HPAF with 2 µM Erastin and Panc1 with 1 µM Erastin)
along with the addition of Ferrostatin-1 (Tocris), a lipophilic antioxidant that inhibits
ferroptosis, Necroastain-1 (Sigma), a compound that binds RIPK and inhibits necroptosis,
and Z-VAD-FMK (Tocris), a pan-caspase inhibitor and apoptosis inhibitor. The

259
Figure 5. 16 The lethal effects of radiation and Erastin combination are synergistic
Synergy scores predicated on the BLISS independence model were determined for both
cell lines as a part of the online Combenefit Software package. The analysis of Panc1 and
CD18/HPAF are presented in panels A and B, respectively. The subpanels are demarcated
as follows: i- color map predicated on the percentage of the surviving cells in any given
treatment condition, relative to the no treatment control. ii- color map of the BLISS synergy
scores associated with each treatment condition. iii- topographical map depicting the
percentage of cell death overlaid with the BLISS synergy score color map. iv- Matrix and
numerical representation of the BLISS synergy scores associated with each specific
treatment condition. The interpretation of BLISS synergy scores can be assumed as
follows: < -10 is considered likely antagonism, 10 to 10 is considered likely additivity, and
>10 is considered likely synergism.

260
Figure 5.16

261
proportional survival with the inhibitors, relative to each treatment condition (i.e. radiation,
Erastin, and radiation + Erastin) are shown in Figure 5.17. For CD18/HPAF, the lethality
of radiation and Erastin alone was not diminished by any of the inhibitors but cell death
produced by the combination treatment was partially rescued by the administration of
ferrostatin-1 (Figure 5.17A). Alternatively, for Panc1, a partial rescue of treatment-
induced cell death by ferrostatin-1 was observed in the radiation only and Erastin only
groups, with a significant increase in cell viability in the combination treatment group
(Figure 5.17B). The ability of ferrostatin-1 to abrogate cell death in both cell lines suggests
that ferroptosis is a contributor to the overall cell death under combination treatment
conditions.
5.3.12 Erastin potentiates radiation-induced cell death in patient-derived organoids
The next experimental evolution involved the transition from a cell monoculture to
a patient-derived organoid culture, in order to more closely recapitulate real-world PDAC.
Organoids derived from three separate PDAC patients were treated with 5Gy radiation, 5
µM Erastin, and a combination thereof and followed for 96 hours. Representative images
of organoids (from a single patient) under the four different treatment conditions are
provided in Figure 5.18A. While a noticeable increase in organoid size can be appreciated
in the no treatment and single treatment groups, the combination treatment produced
organoid shrinkage, increase opacity, and membrane dissolution which are common signs
of death. The viability in each treatment group was determined by measuring the associated
ATP levels with the CellTiterGlo 3D assay (Promega). The radiation and Erastin
treatments alone produce a slight decrease in organoid ATP levels but the combination
elicited a far more dramatic decrease that was near significant (p = 0.06, Figure 5.18B).

262
Figure 5. 17 Effect of combination treatment in the setting of apoptosis, necroptosis,
or ferroptosis inhibition
Colonies are presented on the left side of the panel and show the effects 5Gy radiation,
Erastin (1 µM for Panc1 and 2 µM for CD18/HPAF), and the combination treatment with
the addition of Ferrostatin-1 (Tocris), a lipophilic antioxidant that inhibits ferroptosis,
Necroastain-1 (Sigma), a compound that binds RIP1 and inhibits necroptosis, and Z-VAD-
FMK (Tocris), a pan-caspase inhibitor and apoptosis inhibitor. The quantification of colony
number is presented as a proportion of the treatment control (i.e. Radiation only, Erastin
only, or the combination) and is displayed on the right. A. CD18/HPAF shows rescue of
cell death with Ferrostatin-1 in combination treatment only B. Panc1 shows Ferrostatin-1
rescue of cell death in the single-agent treatment groups as well as in the combination arm.

263
Figure 5.17

264
Figure 5.18C shows the individual measurements taken for each of the three patient-
derived organoids to illustrate how the differences in response more closely resemble the
true disease as encountered in patients.
5.3.13 Erastin potentiates radiation treatment in vivo
An orthotopic murine model of PDAC was generated by implanting CD18/HPAF
cells modified with a luciferase vector into the pancreas of athymic nude mice. Mice were
randomized into four groups that either received, no treatment, radiation, Erastin, or
radiation + Erastin (the generation of the orthotopic model as well as the treatment schedule
is discussed at length in Chapter 2 of this thesis). The luciferase positivity allowed for the
in vivo visualization and monitoring of the implanted tumors using an IVIS imager via IP
injection of luciferin and fluorescence measurements as a surrogate for tumor size. The
combination of radiation and Erastin not only showed a reduction in tumor growth but
produced tumor shrinkage between the last two IVIS imaging studies conducted eight days
apart (Figure 5.19A). Since the tumor growth was merely slowed and not reversed in both
of the single treatment arms, the difference in relative fluorescence intensity (R.F.I.) of the
combination treatment group was the only on measurement significantly less than no
treatment control on day 26 post-implantation (p = 0.0317). Importantly, the actual tumor
size (as determined by weight after excision) was also significantly different between the
control and combination groups (p = 0.008, Figure 5.19B).
5.3.14 Radiation increases intracellular reactive oxygen species (ROS)
To verify the production of reactive oxygen species (ROS) at the radiation doses
being utilized in the majority of the experiments herein (5-7Gy), the ROS levels were
measured in each cell line after treatment with 5Gy of radiation via DCF-DA assay.

265
Figure 5. 18 Response of patient-derived organoids to combination treatment
A. Images of patient-derived organoids at 0 and 96 Hours after no treatment, 5Gy radiation,
5 µM Erastin, or a combination thereof. Noticeably organoids in the no treatment and
single-agent groups have increased in size while those in the combination group have
shrunk, increase in opacity, and experienced membrane dissolution. B. The relative
viability in each of the treatment conditions of a combination of three patient-derived
organoids as determined by the relative ATP level. The combination treatment has a near
significant reduction in viability with p = 0.06. C. Each of the three organoid experiments
presented singly.

266
Figure 5.18

267
Figure 5. 19 Effect of Erastin and radiation in an orthotopic PDAC murine model
A. In vivo IVIS measurements of tumor size collected at days 10, 18, and 26 post-
implantation. Presented as relative fluorescent intensity (R.F.I.). The difference in R.F.I.
on day 26 between no treatment control and combination groups is significant with p =
0.0317. B. Images of excised tumors from each group are presented on the left with the
quantification of their weights presented on the right side of the panel. Again, the only
group to be significantly reduced from no treatment controls was the combination with p =
0.008.

268
Figure 5.19

269
Radiation alone increases the production of ROS by 1.5 to 2 fold compared to untreated
controls (Figure 5.20). While the addition of Erastin interestingly did not increase the
overall ROS levels, the lipophilic antioxidant Ferrostatin-1 did reduce total ROS measured
(Figure 5.20).
5.3.15 Combination treatment causes lipid peroxidation in vitro
As mentioned early, the defining feature of ferroptosis is the requirement of a
buildup of ROS mediated lipid hydro peroxides. With the observed increase in ROS, we
next sought to determine the level of lipid peroxidation occurring in each treatment
condition via C11-BODIPY 581/591 assay, which has previously been used for the
elucidation of ferroptosis 231. This is a dye that intercalates with lipids and the fluorescence
changes predicated on the peroxidation state of the lipid: red if non-peroxidated and green
if peroxidated, thus the relative level of peroxidation can be determined by the red/green
ratio of the signal amplitudes. The lipid species in CD18/HPAF were resistant to
peroxidation by radiation or Erastin monotherapy however a significant increase was
observed when these were given in combination (Figure 5.21). On the other hand, Panc1,
which we have shown to be more sensitive to radiation and Erastin, experiences a high
level of lipid peroxidation with single-agent treatment as well as with the combination
treatment (Figure 5.22). Also, the amount of lipid peroxidation was reduced back to
normal levels in the setting of radiation when supplemented with Ferrostatin-1 (Figure
5.22).
5.3.16 Radiation increases intracellular free iron (Fe2+)
Given the requirement of free intracellular Fe2+ for the induction of ferroptosis, we
determined its level using a FeRhoNox Assay. Rapidly after (3 hours) the administration

270
Figure 5. 20 Radiation production of reactive oxygen species (ROS)
DCF-DA fluorescent probe was utilized to detect the level of ROS in cells in the various
treatment conditions. Representative images are provided on the left of each panel to allow
a comparison between the relative level of fluorescence between the radiated and untreated
controls. The quantification of ROS in each group is presented as a proportion of the total
fluorescence measured in the untreated controls. A. Radiation-induced the expression of
ROS nearly twofold that of untreated controls in Panc1 cells. B. Radiation-induced the
expression of ROS nearly twofold that of untreated controls in CD18/HPAF cells.

271
Figure 5.20
Panc1
CD18/HPAF

272
Figure 5. 21 Effect of combination therapy on lipid peroxidation in CD18/HPAF
cells
C11-BODIPY 581/591 dye analysis was used to determine the relative level of lipid
peroxidation in cells. This is a dye that intercalates with lipids and the fluorescence changes
predicated on the peroxidation state of the lipid: red if non-peroxidated and green if
peroxidated, thus the relative level of peroxidation can be determined by the red/green ratio
of the signal amplitudes. The lipid species in CD18/HPAF were resistant to peroxidation
by radiation or Erastin monotherapy however a significant increase was observed when
these were given in combination as can be observed in the provided images and graphical
representation of the fluorescence amplitude ratios.

273
Figure 5.21

274
Figure 5. 22 Effect of combination therapy on lipid Peroxidation in Panc1 cells
C11-BODIPY 581/591 dye analysis was used to determine the relative level of lipid
peroxidation in cells. This is a dye that intercalates with lipids and the fluorescence changes
predicated on the peroxidation state of the lipid: red if non-peroxidated and green if
peroxidated, thus the relative level of peroxidation can be determined by the red/green ratio
of the signal amplitudes. Panc1, which we have shown to be more sensitive to radiation
and Erastin, experiences a high level of lipid peroxidation with single-agent treatment as
well as with the combination treatment and this phenotype was rescued with the addition
of Ferrostatin-1 as can be observed in the provided images and graphical representation of
the fluorescence amplitude ratios.

275
Figure 5.22

276
of 5Gy radiation, the level of unbound Fe2+ increases by 20-30% from pretreatment levels
(Figure 5.23). Interestingly, this process was reversed in both cell lines and the amount of
free Fe2+ reduced back down to or below, pretreatment level. Along with this, the addition
of Erastin was shown to increase the free iron even further (Figure 5.23).
5.3.17 Lipid peroxidation can be measured in radiated PDAC patient serum samples
With the realization that ferroptosis contributes to the efficacy of radiation,
circulating lipid peroxide metabolites, namely, malondialdehyde (MDA), offer a potential
biomarker for the real-time monitoring of response to radiation therapy 522. To test this, we
analyzed malondialdehyde in 17 serum samples from patients that underwent radiation via
TBARS assay. We found that not only was the level of malondialdehyde elevated after
radiation treatment as compared to pretreatment (n = 8), but the addition of the radiation
sensitizing agent zoledronic acid (an FDPS inhibitor that affects the mevalonate pathway
523) showed comparatively higher levels (n = 9) (Figure 5.24A). In vitro C11-BODIPY
analysis of zoledronic acid treatment and radiation found an increase in lipid peroxidation
with the combination thus supporting the clinical sample results (Figure 5.24B). A likely
reason for this is that the mevalonate pathway is the primary mechanism for CoQ10
synthesis 524. Recently it was discovered that CoQ10 and its associated enzyme ferroptosis
suppressor protein 1 (FSP1) are integral for the detoxification of lipid peroxides and
ferroptosis inhibition 525. Thus, the inhibition of the mevalonate pathway by zoledronic
acid via FDPS, likely results in increased lipid peroxidation and a proclivity towards
ferroptosis.
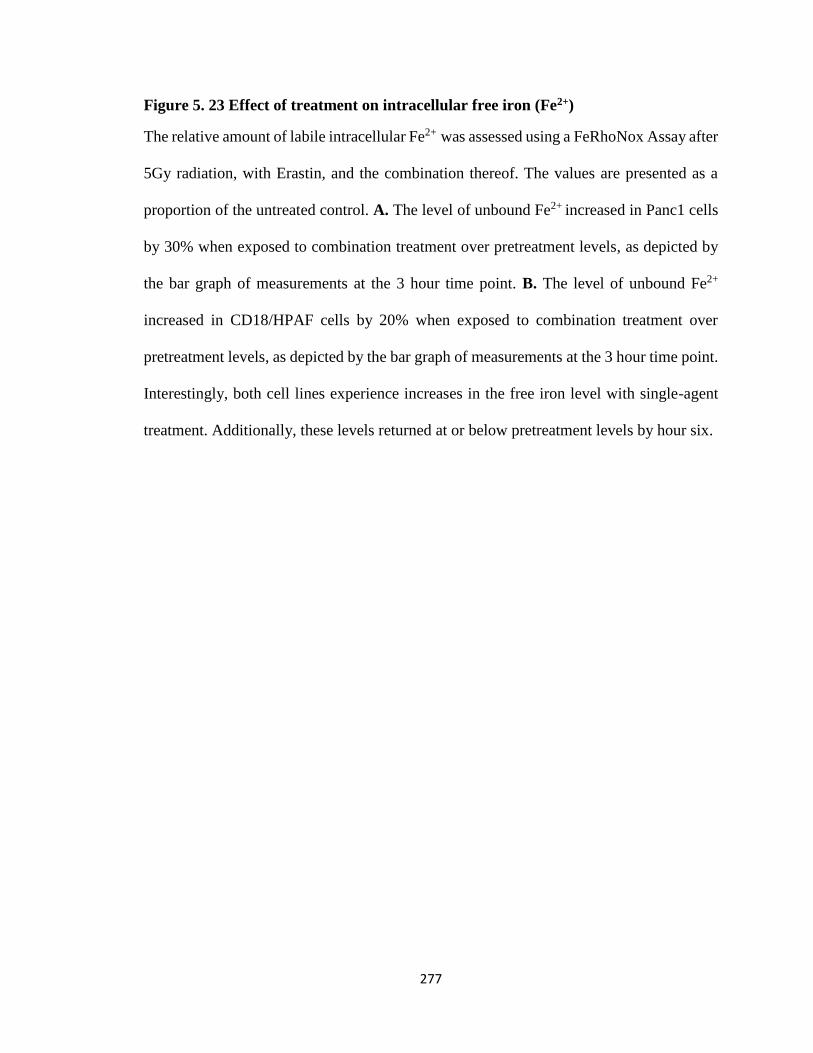
277
Figure 5. 23 Effect of treatment on intracellular free iron (Fe2+)
The relative amount of labile intracellular Fe2+ was assessed using a FeRhoNox Assay after
5Gy radiation, with Erastin, and the combination thereof. The values are presented as a
proportion of the untreated control. A. The level of unbound Fe2+ increased in Panc1 cells
by 30% when exposed to combination treatment over pretreatment levels, as depicted by
the bar graph of measurements at the 3 hour time point. B. The level of unbound Fe2+
increased in CD18/HPAF cells by 20% when exposed to combination treatment over
pretreatment levels, as depicted by the bar graph of measurements at the 3 hour time point.
Interestingly, both cell lines experience increases in the free iron level with single-agent
treatment. Additionally, these levels returned at or below pretreatment levels by hour six.

278
Figure 5.23
Panc1
CD18/HPAF

279
Figure 5. 24 Malondialdehyde (MDA) assessment in radiation patient samples
The level of Malondialdehyde in 17 serum samples from patients that underwent radiation
was assessed via TBARS assay. A. We found that not only was the level of
malondialdehyde elevated after radiation treatment as compared to pretreatment (n = 8),
but the addition of the radiation sensitizing agent zoledronic acid (an FDPS inhibitor that
affects the mevalonate pathway) showed comparatively higher levels (n = 9). This is
presented as the proportion of pretreatment levels. B. In vitro C11-BODIPY analysis of
zoledronic acid treatment and radiation found an increase in lipid peroxidation (decrease
in red/green ratio) with combination treatment in CD18/HPAF cells.

280
Figure 5.24

281
5.4 Discussion
A major challenge in PDAC treatment is how to increase the efficacy of currently used
therapeutic modalities to increase the survivorship of those diagnosed. Recent studies have
reported PDAC specific sensitivity to Erastin induced ferroptosis 526. Radiation therapy
classically mediates cell death via double-stranded DNA breaks leading to mitotic
catastrophe, however, studies have reported ferroptosis to be implicated in radiation-
induced cell death 504, 505, 527. By coupling these two treatment strategies together, we have
been able to increase the ability of radiation to induce cellular death in vitro and in vivo, in
this traditionally radiation-resistant cancer.
Herein we proposed a putative mechanism by which radiation and Erastin are inducing
ferroptosis; the combination of lipid peroxidation mediated by radiation-induced ROS
production and free ferrous iron (Fe2+) release, coupled with Erastin mediated depletion of
GSH. ROS is known to cause the disassociation of KEAP1 from NRF2, thereby preventing
its degradation. Also of note, radiation was found to increase the phosphorylation of NRF2
along with a concomitant increase in its transcription products GPX4, GSS, and SLC7A11.
Thus, Erastin blockade of SLC7A11 thwarts the cell’s attempt at protecting itself from
radiation leading to synergistic cell death. In other words, the Erastin synergism with
radiation may not necessarily be the direct and simple result of increased ROS, but takes
advantage of the increase in the ROS generated by radiation, coupled with GSH depletion
provided by Erastin, and the prevention of NRF2 transcription products (i.e. GPX4, GSS,
and SLC7A11) from actualizing their role in lipid deperoxidation. In so doing, combination
therapy tips the balance towards a level of lipid peroxidation that triggers

282
Figure 5. 25 Schematic of the proposed mechanism of Erastin potentiation of
radiation via ferroptosis
Radiation was found to increase ROS which causes KEAP1 to disassociated from NRF2
preventing its degradation. Along with this, radiation was shown to increase the
phosphorylation of NRF2 along with a concomitant increase in its transcription products
GPX4, GSS, and SLC7A11. SLC7A11 inhibition by Erastin nullifies any upregulated
produced by NRF2 nuclear localization. Thus, Erastin blockade of SLC7A11 thwarts the
cell’s attempt at protecting itself from radiation leading to synergistic cell death. Along
with this, radiation causes an increase in free Fe2+ and, in association with the concomitant
production of ROS, Erastin prevents the synthesis of GSH thereby inhibiting the enzymatic
conversion of lipid hydro peroxides to lipid alcohols by GPX4. In so doing, combination
therapy tips the balance towards a level of lipid peroxidation that triggers ferroptosis.

283
Figure 5.25

284
ferroptosis. A schematic representation of the overall mechanism is provided in Figure.
5.25.
5.5 Conclusions and future directions
Since the discovery of ferroptosis in 2012 496 its role has been investigated in the
setting of cancer and cancer treatments 508, 528. The potential of ferroptosis as a therapeutic
adjuvant has only just begun to be uncovered. Importantly, cancer cells seem to be far more
susceptible to induced ferroptosis via SLC7A11 inhibition compared to normal cells,
regardless of the organ of origin. A fact reiterated by the normal development of SLC7A11
knock out mice. The present study takes advantage of these observances and utilizes
ferroptotic induction via SLC7A11 inhibition to potentiate cell death caused by radiation
in the setting of PDAC. The significance of this lies in the elucidation of a novel
sensitization mechanism that can increase RT efficacy, thereby increasing the importance
of radiation in the PDAC treatment armamentarium.
While this study has provided valuable insight into the interplay between
ferroptosis and radiation, many questions are still left unanswered and many new questions
have arisen. Studies are planned to elucidate what kinases phosphorylation NRFs and
where this occurs within the molecule to further elucidate the mechanism by which
ferroptosis resistance arises with radiation. Further, given the recent insight that radiation
and immunotherapies work together to induce ferroptosis in cancer cells 529, we will also
repeat these experiments using a syngeneic immunocompetent mouse model to understand
the local and distant immune effects of this therapy. Finally, the bioavailability of Erastin
is very low and it is also not FDA approved. As such, we will investigate the utility of well-

285
tolerated FDA approved drugs known to block SLC7A11, such as Sulfasalazine and
Sorafenib, as easily translatable radiation potentiation drugs.

286
Chapter 6: General conclusions and future
directions

287
In this dissertation work, we sought to address the two primary causative challenges
related to the high lethality of PDAC: the lack of an accurate early detection biomarker and
the ineffectiveness of modern non-surgical therapeutic modalities. The first part of this
dissertation investigated the use of the extracellular vesicle (EV) surface to serve as a
PDAC biomarker. In the second part, we studied the implications of ferroptosis on radiation
mediated cell death and tested whether radiation could be potentiated via pharmacologic
ferroptotic induction. In this chapter, a summary and future directions for each of these
aspects are provided.
A. Extracellular vesicle surfaceome characterization for the early
detection of pancreatic ductal adenocarcinoma
The sole curative option for PDAC remains surgical resection. Unfortunately,
patients often have late-stage disease at the time of initial when the primary tumor can no
longer be resected or it has already metastasized. One of the reasons this is true is because
of the lack of clinically useful diagnostic markers. The current gold standard marker,
CA19.9, offers limited accuracy because it is also expressed in a variety of other diseases
and some patients do not have the necessary fucosyltransferase enzyme to produce it. Over
the past several decades there have been continuous efforts by our lab and many others to
discover a PDAC biomarker that is capable of detecting early-stage resectable disease.
However, the progress has been limited and a detection marker with the necessary
sensitivity and specificity has yet to be found. Recently, many studies have begun to
investigate the potential of extracellular vesicles (EVs) to serve as PDAC biomarkers.
All cell types and tissues in the human body produce and secrete EVs, 50-1000 nm
diameter sized membranous-organelles. EVs harbor many biologically active molecules

288
including proteins, RNA species, DNA, and lipids. Inherent in their mechanism of creation
is that the vesicular components mirror that of their cell of origin. These components are
able to alter recipient cell functionality through the delivery of their cargo 279, target cell
signaling initiation 280, and propagation of disease process 281. Elucidation of their functions
has prompted many investigations into their implications in cancer progression 282,
metastasis 283, 284, and drug resistance 285. Additionally, EVs are increased in the setting of
cancer and are present in all biofluids including saliva, serum/plasma, urine, and ascitic
fluid 473, 474. Due to these many attributes, EVs are considered to be attractive targets to be
used as cancer biomarkers.
Evaluation of the EV surface specifically holds several advantages for use as a
cancer-specific biomarker. Firstly, surface evaluations can be conducted via a variety of
label-free methods. Conversely, molecules present on the external surface are easily
accessible and can be utilized for affinity-based isolation methods or high-throughput
profiling techniques. EV surface biomarkers can also provide insight into their interaction
with the immune system thereby dictating therapy choice as well as predict metastatic
organ tropism. However, the majority of studies investigating EVs as potential biomarkers
have focused on the entire vesicular contents and have neglected to separate the
intravesicular and surface components. Towards this end, we have attempted to
characterize the EV surface with a variety of methods for use as early detection PDAC
biomarkers.
In the first part of this dissertation, we initially utilized a label-free technique for
EV surface characterization called surface-enhanced Raman spectroscopy (SERS) and
subsequent analysis by principal component discriminant function analysis (PC-DFA) to

289
identify PDAC EVs. Further attempts at identifying specific molecular contributors to
observed SERS spectral variation were made via LC-MS/MS proteomics followed by
bioinformatics and various surface profiling techniques. Our findings suggest a potential
role for EV surface characterization as a PDAC biomarker but the limited accuracy requires
further evaluation.
SERS holds many advantages for the profiling of EV surfaces in addition to being
label-free. Namely, it is non-destructive, requires very small sample volume, is highly
sensitive compared to traditional assays such as ELISA, and can produce a sample-specific
Raman signature. Previous studies have proven the ability of SERS to determine if EVs
originated from healthy or cancer cells. However, these experiments were only carried out
on EVs purified from in vitro cultures and were not applied to EVs isolated from patient
sera. We have been able to conduct a SERS based characterization on cell line EVs that
was able to be applied to EVs isolated from patient serum samples. Isolation of EVs from
two PDAC cell lines (CD18/HPAF and MiaPaCa) and an immortalized human pancreatic
ductal epithelial cell line (HPDE) were isolated via density gradient ultracentrifugation.
These EVs underwent multiparametric validation beginning with nanoparticle tracking
analysis (NTA) to assess the quantity and size distribution of isolated EVs. Transmission
electron microscopy (TEM) was used to visualize EVs with the characteristic cup shape
and verify no morphological changes occurred during isolation. Western blot analysis was
conducted to verify that the consensus EV markers, CD9 and CD63) were concentrated
compared to whole cell lysates. Finally, atomic force microscopy (AFM) showed EVs to
bind to the gold substrate and adequately distribute over the surface in a manner capable
of undergoing SERS analysis.

290
We next conducted SERS measurements at Raman shift ranges of 719-1800 cm-1
on 33, 31, and 35 separate EV samples purified from CD18/HPAF, MiaPaCa, and HPDE,
respectively. Variations in peaks (amplitude and Raman shift value) were noted both
between the control and EV populations and also between the EV population samples
themselves thus providing the foundation for differential characterization of the particles.
Notably, these spectral shifts were found to be highly reproducible thus allowing for PC-
DFA to discriminate differences across multiple measurements. The initial application of
principal component analysis (PCA) to 1004 peaks in the SERS spectra collected from the
cell line purified EVs efficiently reduced the total number of variables to 20 principal
components (PCs). These PCs accounted for 88.2% of the total spectral variance.
Specifically, principal component #1(PC #1) contained the most important data with 35.4%
of the total variance. The next two PC #2 and PC #3 represented 14.4% and 6.6% of the
total variance, respectively. The application of these three PCs was not able to isolated EVs
into distinct populations predicated on the cells of origin. Thus, the PCs were used as the
input independent variables for discriminant function analysis (DFA) to further separate
the populations based on spectral shift. PC-DFA proved capable of accurately clustering
SERS spectra from specific EV subpopulations. Thes formed discrete clusters and
separated from each other as a function of the PC-DFA classifiers. This lead to a prediction
sensitivity of 90.6% and a specificity of 97.1%.
Serum EVs were next isolated via ultracentrifugation from healthy, early PDAC
(stage I-IIB), and late PDAC (stage III-IV) patients. The EV concentrations were found to
be increased in the cancer patient serum as compared to healthy. Seromic EVs were
assessed by NTA, TEM, and AFM just as cell line purified EVs. The PC-DFA algorithm

291
trained from the cell line SERS spectra was applied to 60 spectra collected from 4 different
healthy patient serum EV isolations and 55 spectra collected from 4 different early PDAC
serum EV isolations. This proved capable of predicting patient cancer status with 66.7%
sensitivity and 67.3% specificity. This was a proof-of-concept study that displayed the
possibility of label-free characterization of EVs for PDAC detection.
However, the limited overall accuracy of the label-free SERS PC-DFA algorithm
required us to investigate the surface of EVs to discover specific molecular species that
contribute to the observes variance and could also be used as specific biomarkers. We
isolated EVs from four PDAC cell lines (CD18/HPAF, MiaPaCa, T3M4, and Capan1) and
HPDE. We elucidated a pool of cancer-specific proteins via EV surface-specific liquid
chromatography-tandem mass spectrometry (LC-MS/MS). Notably, Capan1 EVs were
excluded from further analysis as evidence of cellular contamination was found. To
determine the clinical significance of the identified markers we analyzed the gene
expression pattern, correlations, and receiver operator characteristic (ROC) curve for each
protein in the GSE27385 microarray datasets. This process allowed for the reduction of
229 possible proteins down eight target proteins: cluster of differentiation 151 (CD151),
galectin-1 (LGALS1), cofilin (CFL1), tyrosine 3-monooxygenase/tryptophan 5-
monooxygenase activation protein zeta (YWHAZ), extracellular matrix protein-1 (ECM1),
ephrin A2 (EPHA2, integrin alpha 3 (ITGα3), and heat-shock protein family B (small)
member-1 (HSPB1).
To validate the presence of these 8 targets, we analyzed EV isolates from each cell
line by western blot. Indeed, all were present and enriched in EV samples compared to
whole cell lysates and were increased in EVs from cancer cells compared to HPDE. Four

292
of these eight, EPHA2, ECM1, CD151, and HSPB1, were able to be visualized on the
surface of EVs via immunogold labeling and TEM imaging. This was set as a requirement
for subsequent analyses because this sufficiently proved the localization of each marker on
the external surface of the EVs. Of note, immunogold staining requires much individual
protocol standardization and because of this, immunogold was used to rule markers in and
not out. Those that failed to be stained required further study.
The gene expression for the four selected markers along with survival analysis was
conducted using data from TCGA. Among these four markers, EPHA2 was the most
differentially regulated in cancer compared to normal and was the most significantly
correlated with overall survival. To assess the ability of a high-throughput and sensitive
screening modality detect EV surface EPHA2, we next conducted an ELISA on cell line
EVs. Those from PDAC cell lines showed an elevated concentration of EPHA2 as
compared to HPDE. The ELISA analysis was extended to complete serum samples from
benign control patients, early PDAC, and late PDAC. EPHA2 was found to be elevated in
cancer patient serum compared to benign controls resulting in a diagnostic sensitivity of
76% and specificity of 62%. Finally, EV specific EPHA2 expression isolated from patient
serum samples proved capable of identifying 25% of PDAC patients with 100% specificity.
While these results are promising, the generally low sensitivity requires continued
evaluation of the EV surface.
Future directions
1. Development of a surface EV multimarker panel to be used in conjunction with
CA19.9

293
A single marker will never be sensitive nor specific enough to be capable of
identifying PDAC. The current accuracy provided by the SERS PC-DFA and EPHA2
analyses is too low to be clinically applicable. Therefore, we would like to continue our
study of the identified EV surface markers (beginning with ECM1, CD151, and HSPB1)
as well as investigate newly elucidated markers (glycans) to improve the sensitivity and
specificity of our assay. Along with this, the current gold standard, CA19.9, is also not
sufficient for the liquid biopsy-based detection of PDAC. Therefore, we would like to
ascertain if our multimarker panel may provide an additive benefit when supplemented
with CA19.9 assessment. The eventual aim would be the production of a multimarker panel
capable of detecting PDAC at an early stage.
2. Determine the functional implications of the EV surfaceome
Many studies have found that the EV surface directly interacts and affects its
surrounding environment. Further, interactions at the EV surface are capable of initiating
signaling cascades, promoting receptor-mediated endocytosis, and effecting the immune
milieu. Therefore, we would like to assess the functional implications associated with our
identified surface proteins. These include studies such as determining if these proteins
facilitate cellular uptake, initiate cancer-associated signaling pathways, impact local and
distant immune cells, and if any of these functions can be blocked.
B. Erastin potentiates radiation therapy via the induction of ferroptosis in the setting
of PDAC
Along with the inability to detect early-stage disease, another major reason why
PDAC is so lethal is because of the lack of effective treatment options. As mentioned in
section A of this chapter, the only curative therapeutic option is surgical resection of the

294
primary tumor. Most chemotherapy options provide little benefit or are extremely toxic
thus only can only be given to the fittest patients. Radiation therapy is traditionally reserved
for borderline resectable or locally advanced disease to try and shrink the tumor to a size
amenable to resection. The recent progress of stereotactic body radiation therapy (SBRT)
has improved response rates by administering highly conformational doses of radiation in
fewer fractions with less off-target toxicity. However, many PDAC patients still remain
refractory to radiation treatment. This has ignited the search for a potential means of
enhancing radiation therapy efficacy for the treatment of PDAC.
Ferroptosis is a recently discovered non-apoptotic form of cell death. It is caused
by the buildup of lipid hydro peroxides mediated by reactive oxygen species (ROS) and
free ferrous iron (Fe2+). Glutathione peroxidase 4 (GPX4) converts the toxic lipid hydro
peroxides to non-toxic lipid alcohols, using glutathione (GSH) as a substrate. GSH
synthesis requires cystine, which is transported into the cell via the cystine glutamate
antiporter System Xc. System Xc inhibition facilitated by the blockade of one of its
constituents, SLC7A11, is becoming a highly investigated area of study for use as a
therapeutic adjuvant with a variety of cancer therapies including chemo and radiation.
Many cancers that proved resistant to conventional cytotoxic therapies are susceptible to
ferroptotic induction. Importantly, cancer cells seem to have an increased reliance on
SLC7A11 expression compared to healthy cells, likely due to the higher levels of
endogenous ROS. Along with this, whole-body SLC7A11 knock out does not affect the
development of mice. Taken together, SLC7A11 may provide a cancer-selective means of
inducing ferroptosis. One of the primary mechanisms that radiation induces cellular

295
damage is with the production of ROS. Thus, radiation therapy seems well suited for
potentiation via ferroptosis induction.
These two therapeutic modalities are ideally suited to complement one another in
their mechanisms of action, where an increase in ROS generation is provided by radiation
and a diminished capability of eliminating the associated lipid toxicity is provided by
SLC7A11 inhibition. Thus, in the second part of this dissertation, we investigated the
involvement of ferroptosis, in radiation-induced cell death. Additionally, we tested if the
pharmaceutical induction of ferroptosis with the small molecule Erastin (SLC7A11
blockade) can potentiate the lethal effects of radiation.
To determine the clinical viability of ferroptosis in the setting of pancreas cancer,
we first analyzed the GPX4 and SLC7A11 expression in pancreas cancer samples in a
combination of TCGA and GTEx dataset. Both GPX4 and SLC7A11 were found to be
significantly upregulated in the setting of cancer compared to normal tissue as well as in
comparison to cancers of various origin. This analysis was conducted on patient data from
PDAC as well as neuroendocrine tumors in addition to cell line data. Since we are
specifically interested in PDAC, we surveyed only the PDAC cohort within the TCGA
dataset next. While GPX4 was not differentially expressed in PDAC compared to healthy
tissue, SLC7A11 was. However, neither had a significant impact on survival. The protein
expression of these two molecules was assessed via western blot in eight different PDAC
cell lines: CD18/HPAF, MiaPaCa, Colo357, AsPC1, Panc1, Capan1, T3M4, and BxPC3
as well as the immortalized normal human pancreatic ductal epithelial cell line HPDE.
Again, the expression of GPX4 was not observed to be different between PDAC cell lines
and HPDE but SLC7A11 expression was increased in the majority of PDAC cell lines.
296
Project DRIVE, a database designed to provide insight into cancer dependencies
based on RNAi screening, showed that 3 of the top 20 (including the top 2) cell lines most
sensitive to SLC7A11 knockdown were PDAC line. We tested this finding by
pharmaceutically inhibiting SLC7A11 via Erastin in all eight PDAC cell lines along with
HPDE and measuring the viability via MTT assay. PDAC cell lines were observed to be
more sensitive to SLC7A11 inhibition at 24 and 48 hours compared to HPDE. Of note, the
cell lines selected for additional experiments based on these data were CD18/HPAF and
Panc1. Additionally, Erastin treatment was able to inhibit the migration ability of
CD18/HPAF cells and also resulted in a significant decrease in total GSH in both
CD18/HPAF and Panc1 cell lines.
To determine the effects of radiation on genes important in ferroptosis, publicly
available microarray data conducted on samples from PDAC cells (Panc1, MiaPaCa,
AsPC1, and BxPC3) collected 6 hours after 2Gy radiation exposure was used. We found
that many NRF2 transcription products including GPX4 and GSS are upregulated along
with HSPB1, an iron sequestration protein known to inhibit ferroptosis. Concurrently,
NCOA4, a protein involved in the release of free Fe2+ via ferritinophagy, was
downregulated. Assessment at the protein level found GPX4 to be slightly increased in
both CD18/HPAF and Panc1 but SLC7A11 and phosphorylation of NRF2 were
dramatically increased in a time-dependent manner. Notably, NRF2 is also the transcription
factor responsible for SLC7A11 production. A significant increase in SLC7A11 expression
was also observed in irradiated patient PDAC tissue compared to non-radiated PDAC and
healthy patient tissues. Following this result, survival analysis was conducted only on
297
patients who received radiation in the TCGA PDAC cohort, and SLC7A11 expression was
significantly correlated with overall survival.
Next, the ability of GPX4 knockdown to potentiate radiation was assessed via
clonogenic survival assay. GPX4 KD was able to enhance the lethal effects of radiation in
CD18/HPAF but was not able to be assessed in Panc1 as the KD itself was lethal. This
result is directly in line with Panc1 sensitivity to Erastin as determined by the MTT
analysis. Congruently, SLC7A11 inhibition with Erastin was found to synergistically
enhance the effects of radiation, as determined by the BLISS independent synergy model
in vitro. The repetition of this experiment was conducted with the addition of Ferrostatin-
1, a lipophilic antioxidant that inhibits ferroptosis, Necroastain-1, a compound that binds
RIPK and inhibits necroptosis, and Z-VAD-FMK. This lead to the observation that cell
death caused by combination treatment was abrogated by the addition of ferrostatin-1,
which suggests that ferroptosis is at least a partial contributor to the overall lethality of the
combination treatment. Additionally, the combination of Erastin and radiation decreased
the viability of three individual patient-derived organoids. In vivo assessment was carried
out in an orthotopic xenograft mouse model of PDAC where tumor sizes were significantly
reduced with combination treatment compared to no-treatment controls (single-agent
treatment with radiation or Erastin alone was not significant).
To gain some mechanistic insight into how combination therapy is synergistically
inducing cell death, we assessed the levels of ROS, intracellular free ferrous iron, and lipid
peroxidation in untreated CD18/HPAF and Panc1 cells and those treated with radiation,
Erastin, or a combination thereof. The relative level of ROS increases immediately after
radiation administration (3 hours) compared to pre radiation levels and stays elevated for

298
at least 24 hours. On the other hand, free ferrous iron rises immediately after radiation (3
hours) and falls back to or below pre radiation levels by 6 hours. Finally, since lipid
peroxidation is the initiator of ferroptosis, we measured its level with C11-BODIPY
581/581 dye. This is a lipophilic dye that intercalates with lipids and fluoresces red when
interacting with a normal lipid and green when interacting with a peroxidated lipid. The
red/green ratio can be thus be utilized to determine the relative amount of peroxidation
between samples. Notably, Panc1 experiences a relative increase in lipid peroxidation in
both single-agent treatment groups as well as the dramatic increase in the combination
treatment group compared to no treatment control. For CD18/HPAF cells, an increase in
the level of lipid peroxidation was only observed in the combination group.
With these results we propose a putative mechanism by which radiation and Erastin
are inducing ferroptosis; the combination of lipid peroxidation mediated by radiation-
induced ROS production and free ferrous iron (Fe2+) release, coupled with Erastin mediated
depletion of GSH. Radiation was found to increase the phosphorylation of NRF2 (a factor
known to increase the nuclear localization and facilitate transcription) along with a
concomitant increase in its transcription products GPX4, GSS, and SLC7A11. Thus,
Erastin blockade of SLC7A11 thwarts the cell’s attempt at protecting itself from radiation
leading to synergistic cell death. In other words, the Erastin synergism with radiation may
not necessarily be the direct and simple result of increased ROS, but takes advantage of the
increase in the ROS generated by radiation, coupled with GSH depletion provided by
Erastin, and the prevention of NRF2 transcription products (i.e. GPX4, GSS, and
SLC7A11) from actualizing their role in lipid deperoxidation. In so doing, combination
therapy tips the balance towards a level of lipid peroxidation that triggers ferroptosis.

299
Future directions
1. Elucidating the role of NRF2 phosphorylation in ferroptosis resistance
While this study has provided valuable insight into the interplay between
ferroptosis and radiation, many questions are still left unanswered and many new questions
have arisen. Phosphorylation of NRF2 can be facilitated by many different kinases (GSK-
3β, AMPK, PKC, etc.). With this, the specific residue that is phosphorylated is integral to
determining if it promotes or prevents nuclear translocation, e.g. serine 550 specific
phosphorylation promotes translocation into the nucleus. Therefore, we hope to investigate
what kinase phosphorylates NRF2 and where this occurs in the setting of radiation
exposure. This could further be assessed in myriad other settings where ferroptosis may
occur to determine the mechanism of resistance
2. Investigate FDA approved SLC7A11 inhibitors for possible radiation potentiation
The bioavailability of Erastin is quite low and it also is not an FDA approved drug,
thus the translational utility of it is limited. With the success of Erastin at enhancing
radiation lethality, it warrants the investigation of alternative drugs that block SLC7A11 as
radiation potentiators. For example, Sulfasalazine (a commonly used anti-inflammatory)
and Sorafenib (a pan kinase inhibitor) have been shown to inhibit SLC7A11. Therefore,
we hope to assess the effectiveness of these compounds to be easily translatable radiation
enhancing drugs.
3. Increase the bioavailability and targeted delivery of Erastin via EV loading
Importantly, these two aspects of early detection and treatment enhancement
presented in this thesis merit union. A theranostic approach could be contrived whereby
300
PDAC specific EVs are isolated using one of our elucidated surface markers for diagnostic
and prognostic purposes. These EVs could then be loaded with Erastin to increase its
cellular uptake, bioavailability, and prevent degradation in circulation. The loaded EVs
could then be used as an autologous means of radiation potentiation and tested in vivo.
Conversely, we have observed that GPX4 is increased in EVs from Panc1 cells treated with
radiation compared to untreated controls (data not shown). This finding merits further
investigation into the role of EVs in ferroptosis resistance after radiation treatment.

301
Chapter 7: References

302
Chapter 7: References
1. Carmicheal J, Patel A, Dalal V, Atri P, Dhaliwal AS, Wittel UA, et al. Elevating
pancreatic cystic lesion stratification: Current and future pancreatic cancer biomarker(s).
Biochim Biophys Acta Rev Cancer. 2020;1873(1):188318.
2. Siegel RL, Miller KD, Jemal A. Cancer statistics, 2019. CA Cancer J Clin.
2019;69(1):7-34.
3. Rahib L, Smith BD, Aizenberg R, Rosenzweig AB, Fleshman JM, Matrisian LM.
Projecting cancer incidence and deaths to 2030: the unexpected burden of thyroid, liver,
and pancreas cancers in the United States. Cancer Res. 2014;74(11):2913-21.
4. Evans J, Chapple A, Salisbury H, Corrie P, Ziebland S. "It can't be very important
because it comes and goes"--patients' accounts of intermittent symptoms preceding a
pancreatic cancer diagnosis: a qualitative study. BMJ Open. 2014;4(2):e004215.
5. Lucenteforte E, La Vecchia C, Silverman D, Petersen GM, Bracci PM, Ji BT, et al.
Alcohol consumption and pancreatic cancer: a pooled analysis in the International
Pancreatic Cancer Case-Control Consortium (PanC4). Ann Oncol. 2012;23(2):374-82.
6. Bosetti C, Bravi F, Turati F, Edefonti V, Polesel J, Decarli A, et al. Nutrient-based
dietary patterns and pancreatic cancer risk. Ann Epidemiol. 2013;23(3):124-8.
7. Genkinger JM, Kitahara CM, Bernstein L, Berrington de Gonzalez A, Brotzman
M, Elena JW, et al. Central adiposity, obesity during early adulthood, and pancreatic cancer
mortality in a pooled analysis of cohort studies. Ann Oncol. 2015;26(11):2257-66.
8. Whiteman DC, Webb PM, Green AC, Neale RE, Fritschi L, Bain CJ, et al. Cancers
in Australia in 2010 attributable to modifiable factors: introduction and overview. Aust N
Z J Public Health. 2015;39(5):403-7.
9. Bosetti C, Lucenteforte E, Silverman DT, Petersen G, Bracci PM, Ji BT, et al.
Cigarette smoking and pancreatic cancer: an analysis from the International Pancreatic
Cancer Case-Control Consortium (Panc4). Ann Oncol. 2012;23(7):1880-8.
10. McGuigan A, Kelly P, Turkington RC, Jones C, Coleman HG, McCain RS.
Pancreatic cancer: A review of clinical diagnosis, epidemiology, treatment and outcomes.
World journal of gastroenterology : WJG. 2018;24(43):4846-61.
11. Patel R, Ede J, Collins J, Willens D. Pancreatic cancer presenting as new-onset
diabetes. Case Rep Oncol. 2014;7(1):171-4.
12. Canto MI, Harinck F, Hruban RH, Offerhaus GJ, Poley JW, Kamel I, et al.
International Cancer of the Pancreas Screening (CAPS) Consortium summit on the
management of patients with increased risk for familial pancreatic cancer. Gut.
2013;62(3):339-47.
13. Syngal S, Brand RE, Church JM, Giardiello FM, Hampel HL, Burt RW, et al. ACG
clinical guideline: Genetic testing and management of hereditary gastrointestinal cancer
syndromes. Am J Gastroenterol. 2015;110(2):223-62; quiz 63.
14. Chang MC, Wong JM, Chang YT. Screening and early detection of pancreatic
cancer in high risk population. World journal of gastroenterology : WJG. 2014;20(9):2358-
64.
15. Lynch HT, Brand RE, Deters CA, Shaw TG, Lynch JF. Hereditary pancreatic
cancer. Pancreatology. 2001;1(5):466-71.

303
16. Wang L, Brune KA, Visvanathan K, Laheru D, Herman J, Wolfgang C, et al.
Elevated cancer mortality in the relatives of patients with pancreatic cancer. Cancer
Epidemiol Biomarkers Prev. 2009;18(11):2829-34.
17. Klein AP, Brune KA, Petersen GM, Goggins M, Tersmette AC, Offerhaus GJ, et
al. Prospective risk of pancreatic cancer in familial pancreatic cancer kindreds. Cancer Res.
2004;64(7):2634-8.
18. McFaul CD, Greenhalf W, Earl J, Howes N, Neoptolemos JP, Kress R, et al.
Anticipation in familial pancreatic cancer. Gut. 2006;55(2):252-8.
19. Brune KA, Lau B, Palmisano E, Canto M, Goggins MG, Hruban RH, et al.
Importance of age of onset in pancreatic cancer kindreds. J Natl Cancer Inst.
2010;102(2):119-26.
20. Jones S, Hruban RH, Kamiyama M, Borges M, Zhang X, Parsons DW, et al.
Exomic sequencing identifies PALB2 as a pancreatic cancer susceptibility gene. Science.
2009;324(5924):217.
21. Zhen DB, Rabe KG, Gallinger S, Syngal S, Schwartz AG, Goggins MG, et al.
BRCA1, BRCA2, PALB2, and CDKN2A mutations in familial pancreatic cancer: a
PACGENE study. Genet Med. 2015;17(7):569-77.
22. Roberts NJ, Norris AL, Petersen GM, Bondy ML, Brand R, Gallinger S, et al.
Whole Genome Sequencing Defines the Genetic Heterogeneity of Familial Pancreatic
Cancer. Cancer Discov. 2016;6(2):166-75.
23. Lal G, Liu G, Schmocker B, Kaurah P, Ozcelik H, Narod SA, et al. Inherited
predisposition to pancreatic adenocarcinoma: role of family history and germ-line p16,
BRCA1, and BRCA2 mutations. Cancer Res. 2000;60(2):409-16.
24. Middlebrooks CD, Stacey ML, Li Q, Snyder C, Shaw TG, Richardson-Nelson T,
et al. Analysis of the CDKN2A Gene in FAMMM Syndrome Families Reveals Early Age
of Onset for Additional Syndromic Cancers. Cancer Res. 2019;79(11):2992-3000.
25. Caldas C, Hahn SA, da Costa LT, Redston MS, Schutte M, Seymour AB, et al.
Frequent somatic mutations and homozygous deletions of the p16 (MTS1) gene in
pancreatic adenocarcinoma. Nat Genet. 1994;8(1):27-32.
26. de Snoo FA, Bishop DT, Bergman W, van Leeuwen I, van der Drift C, van
Nieuwpoort FA, et al. Increased risk of cancer other than melanoma in CDKN2A founder
mutation (p16-Leiden)-positive melanoma families. Clin Cancer Res. 2008;14(21):7151-
7.
27. Bujanda L, Herreros-Villanueva M. Pancreatic Cancer in Lynch Syndrome
Patients. J Cancer. 2017;8(18):3667-74.
28. Ligtenberg MJ, Kuiper RP, Chan TL, Goossens M, Hebeda KM, Voorendt M, et
al. Heritable somatic methylation and inactivation of MSH2 in families with Lynch
syndrome due to deletion of the 3' exons of TACSTD1. Nat Genet. 2009;41(1):112-7.
29. Giardiello FM, Allen JI, Axilbund JE, Boland CR, Burke CA, Burt RW, et al.
Guidelines on genetic evaluation and management of Lynch syndrome: a consensus
statement by the US Multi-society Task Force on colorectal cancer. Am J Gastroenterol.
2014;109(8):1159-79.
30. Kastrinos F, Mukherjee B, Tayob N, Wang F, Sparr J, Raymond VM, et al. Risk of
pancreatic cancer in families with Lynch syndrome. JAMA. 2009;302(16):1790-5.

304
31. Gruber SB, Entius MM, Petersen GM, Laken SJ, Longo PA, Boyer R, et al.
Pathogenesis of adenocarcinoma in Peutz-Jeghers syndrome. Cancer Res.
1998;58(23):5267-70.
32. Giardiello FM, Brensinger JD, Tersmette AC, Goodman SN, Petersen GM, Booker
SV, et al. Very high risk of cancer in familial Peutz-Jeghers syndrome. Gastroenterology.
2000;119(6):1447-53.
33. van Lier MG, Wagner A, Mathus-Vliegen EM, Kuipers EJ, Steyerberg EW, van
Leerdam ME. High cancer risk in Peutz-Jeghers syndrome: a systematic review and
surveillance recommendations. Am J Gastroenterol. 2010;105(6):1258-64; author reply 65.
34. Raphael KL, Willingham FF. Hereditary pancreatitis: current perspectives. Clin
Exp Gastroenterol. 2016;9:197-207.
35. Rebours V, Boutron-Ruault MC, Schnee M, Ferec C, Le Marechal C, Hentic O, et
al. The natural history of hereditary pancreatitis: a national series. Gut. 2009;58(1):97-103.
36. Charnley RM. Hereditary pancreatitis. World journal of gastroenterology : WJG.
2003;9(1):1-4.
37. Howes N, Greenhalf W, Stocken DD, Neoptolemos JP. Cationic trypsinogen
mutations and pancreatitis. Gastroenterol Clin North Am. 2004;33(4):767-87.
38. DiMagno MJ, DiMagno EP. Chronic pancreatitis. Curr Opin Gastroenterol.
2005;21(5):544-54.
39. Pfutzer RH, Barmada MM, Brunskill AP, Finch R, Hart PS, Neoptolemos J, et al.
SPINK1/PSTI polymorphisms act as disease modifiers in familial and idiopathic chronic
pancreatitis. Gastroenterology. 2000;119(3):615-23.
40. Lowenfels AB, Maisonneuve P, DiMagno EP, Elitsur Y, Gates LK, Jr., Perrault J,
et al. Hereditary pancreatitis and the risk of pancreatic cancer. International Hereditary
Pancreatitis Study Group. J Natl Cancer Inst. 1997;89(6):442-6.
41. Yamada M, Satoh T, Monden T, Murakami M, Iriuchijima T, Wilber JF, et al.
Influences of hypothyroidism on TRH concentrations and preproTRH mRNA levels in rat
hypothalamus: a simple and reliable method to detect preproTRH mRNA level.
Neuroendocrinology. 1992;55(3):317-20.
42. Hruban RH, Takaori K, Klimstra DS, Adsay NV, Albores-Saavedra J, Biankin AV,
et al. An illustrated consensus on the classification of pancreatic intraepithelial neoplasia
and intraductal papillary mucinous neoplasms. Am J Surg Pathol. 2004;28(8):977-87.
43. Furukawa T, Fukushima N, Itoi T, Ohike N, Mitsuhashi T, Nakagohri T, et al. A
Consensus Study of the Grading and Typing of Intraductal Papillary Mucinous Neoplasms
of the Pancreas. Pancreas. 2019;48(4):480-7.
44. Zamboni G, Hirabayashi K, Castelli P, Lennon AM. Precancerous lesions of the
pancreas. Best Pract Res Clin Gastroenterol. 2013;27(2):299-322.
45. Hruban RH, Adsay NV, Albores-Saavedra J, Compton C, Garrett ES, Goodman
SN, et al. Pancreatic intraepithelial neoplasia: a new nomenclature and classification
system for pancreatic duct lesions. Am J Surg Pathol. 2001;25(5):579-86.
46. Riva G, Pea A, Pilati C, Fiadone G, Lawlor RT, Scarpa A, et al. Histo-molecular
oncogenesis of pancreatic cancer: From precancerous lesions to invasive ductal
adenocarcinoma. World J Gastrointest Oncol. 2018;10(10):317-27.
47. Noe M, Brosens LA. Pathology of Pancreatic Cancer Precursor Lesions. Surg
Pathol Clin. 2016;9(4):561-80.

305
48. Yokode M, Akita M, Fujikura K, Kim MJ, Morinaga Y, Yoshikawa S, et al. High-
grade PanIN presenting with localised stricture of the main pancreatic duct: A
clinicopathological and molecular study of 10 cases suggests a clue for the early detection
of pancreatic cancer. Histopathology. 2018;73(2):247-58.
49. Nagata K, Horinouchi M, Saitou M, Higashi M, Nomoto M, Goto M, et al. Mucin
expression profile in pancreatic cancer and the precursor lesions. J Hepatobiliary Pancreat
Surg. 2007;14(3):243-54.
50. Basturk O, Khayyata S, Klimstra DS, Hruban RH, Zamboni G, Coban I, et al.
Preferential expression of MUC6 in oncocytic and pancreatobiliary types of intraductal
papillary neoplasms highlights a pyloropancreatic pathway, distinct from the intestinal
pathway, in pancreatic carcinogenesis. Am J Surg Pathol. 2010;34(3):364-70.
51. Hruban RH, Goggins M, Parsons J, Kern SE. Progression model for pancreatic
cancer. Clin Cancer Res. 2000;6(8):2969-72.
52. Decker GA, Batheja MJ, Collins JM, Silva AC, Mekeel KL, Moss AA, et al. Risk
factors for pancreatic adenocarcinoma and prospects for screening. Gastroenterol Hepatol
(N Y). 2010;6(4):246-54.
53. Mukewar SS, Sharma A, Phillip N, Gupta R, Aryal-Khanal A, de Pretis N, et al.
Risk of Pancreatic Cancer in Patients With Pancreatic Cysts and Family History of
Pancreatic Cancer. Clin Gastroenterol Hepatol. 2018;16(7):1123-30 e1.
54. Esposito I, Konukiewitz B, Schlitter AM, Kloppel G. Pathology of pancreatic
ductal adenocarcinoma: facts, challenges and future developments. World journal of
gastroenterology : WJG. 2014;20(38):13833-41.
55. Chernyak V, Flusberg M, Haramati LB, Rozenblit AM, Bellin E. Incidental
pancreatic cystic lesions: is there a relationship with the development of pancreatic
adenocarcinoma and all-cause mortality? Radiology. 2015;274(1):161-9.
56. Ohno E, Hirooka Y, Kawashima H, Ishikawa T, Kanamori A, Ishikawa H, et al.
Natural history of pancreatic cystic lesions: A multicenter prospective observational study
for evaluating the risk of pancreatic cancer. J Gastroenterol Hepatol. 2018;33(1):320-8.
57. Kim JR, Jang JY, Kang MJ, Park T, Lee SY, Jung W, et al. Clinical implication of
serum carcinoembryonic antigen and carbohydrate antigen 19-9 for the prediction of
malignancy in intraductal papillary mucinous neoplasm of pancreas. J Hepatobiliary
Pancreat Sci. 2015;22(9):699-707.
58. de Jong K, Bruno MJ, Fockens P. Epidemiology, diagnosis, and management of
cystic lesions of the pancreas. Gastroenterol Res Pract. 2012;147465(10):11.
59. Brugge WR. Diagnosis and management of cystic lesions of the pancreas. J
Gastrointest Oncol. 2015;6(4):375-88.
60. Kimura W, Nagai H, Kuroda A, Muto T, Esaki Y. Analysis of small cystic lesions
of the pancreas. Int J Pancreatol. 1995;18(3):197-206.
61. Gardner TB, Glass LM, Smith KD, Ripple GH, Barth RJ, Klibansky DA, et al.
Pancreatic cyst prevalence and the risk of mucin-producing adenocarcinoma in US adults.
Am J Gastroenterol. 2013;108(10):1546-50.
62. Tanaka M, Fernandez-Del Castillo C, Kamisawa T, Jang JY, Levy P, Ohtsuka T,
et al. Revisions of international consensus Fukuoka guidelines for the management of
IPMN of the pancreas. Pancreatology. 2017;17(5):738-53.
63. Farrell JJ. Prevalence, Diagnosis and Management of Pancreatic Cystic Neoplasms:
Current Status and Future Directions. Gut Liver. 2015;9(5):571-89.
306
64. Capella C. SE, G. Pape K.I., Hruban R. H. Serous cystic neoplasms of the pancreas.
In: SR Hamilton ALA, editor. World Health Organization Classification of Tumors. Lyon,
France: IARC Press; 2000. p. 234-6.
65. Zamboni G KG, Hruban RH, Longnecker DS, Adler G. Mucinous cystic neoplasms
of the pancreas. In: SR Hamilton AL, editor. World Health Organization Classification of
Tumors. Lyon, France: IARC Press; 2000. p. 234-6.
66. Longnecker DS AG, Hruban RH. Intraductal papillarymucinous neoplasms of the
pancreas. . In: SR Hamilton AL, editor. World Health Organization Classification of
Tumors. Lyon, France: IARC Press; 2000. p. 237-41.
67. Compagno J, Oertel JE. Microcystic adenomas of the pancreas (glycogen-rich
cystadenomas): a clinicopathologic study of 34 cases. Am J Clin Pathol. 1978;69(3):289-
98.
68. Alpert LC, Truong LD, Bossart MI, Spjut HJ. Microcystic adenoma (serous
cystadenoma) of the pancreas. A study of 14 cases with immunohistochemical and
electron-microscopic correlation. Am J Surg Pathol. 1988;12(4):251-63.
69. Solcia E CC, Klöppel G: Tumors of the Pancreas. AFIP Atlas of Tumor Pathology,
3rd series, fasc 20. Washington, Armed Forces Institute of Pathology. Tumors of the
Pancreas. AFIP Atlas of Tumor Pathology. fascicle 20. Washington. D.C.: Armed Forces
Institutes of Pathology; 1997.
70. Egawa N, Maillet B, Schroder S, Mukai K, Kloppel G. Serous oligocystic and ill-
demarcated adenoma of the pancreas: a variant of serous cystic adenoma. Virchows Arch.
1994;424(1):13-7.
71. Charville GW, Kao CS. Serous Neoplasms of the Pancreas: A Comprehensive
Review. Arch Pathol Lab Med. 2018;142(9):1134-40.
72. Bogomoletz WV, Adnet JJ, Widgren S, Stavrou M, McLaughlin JE. Cystadenoma
of the pancreas: a histological, histochemical and ultrastructural study of seven cases.
Histopathology. 1980;4(3):309-20.
73. Brugge WR, Lewandrowski K, Lee-Lewandrowski E, Centeno BA, Szydlo T,
Regan S, et al. Diagnosis of pancreatic cystic neoplasms: a report of the cooperative
pancreatic cyst study. Gastroenterology. 2004;126(5):1330-6.
74. Al-Haddad M, Gill KR, Raimondo M, Woodward TA, Krishna M, Crook JE, et al.
Safety and efficacy of cytology brushings versus standard fine-needle aspiration in
evaluating cystic pancreatic lesions: a controlled study. Endoscopy. 2010;42(2):127-32.
75. Cizginer S, Turner BG, Bilge AR, Karaca C, Pitman MB, Brugge WR. Cyst fluid
carcinoembryonic antigen is an accurate diagnostic marker of pancreatic mucinous cysts.
Pancreas. 2011;40(7):1024-8.
76. Robinson SM, Scott J, Oppong KW, White SA. What to do for the incidental
pancreatic cystic lesion? Surgical Oncology. (0).
77. Jais B, Rebours V, Malleo G, Salvia R, Fontana M, Maggino L, et al. Serous cystic
neoplasm of the pancreas: a multinational study of 2622 patients under the auspices of the
International Association of Pancreatology and European Pancreatic Club (European Study
Group on Cystic Tumors of the Pancreas). Gut. 2016;65(2):305-12.
78. Yoshimi N, Sugie S, Tanaka T, Aijin W, Bunai Y, Tatematsu A, et al. A rare case
of serous cystadenocarcinoma of the pancreas. Cancer. 1992;69(10):2449-53.

307
79. Hruban RH PM, Klimstra DS. Tumors of the pancreas. Atlas of Tumor Pathology.
6 ed. Washington, D.C.: American Registry of Pathology and Armed Forces Institute of
Pathology; 2007.
80. Zamboni G, Scarpa A, Bogina G, Iacono C, Bassi C, Talamini G, et al. Mucinous
cystic tumors of the pancreas: clinicopathological features, prognosis, and relationship to
other mucinous cystic tumors. Am J Surg Pathol. 1999;23(4):410-22.
81. Sarr MG, Carpenter HA, Prabhakar LP, Orchard TF, Hughes S, van Heerden JA,
et al. Clinical and pathologic correlation of 84 mucinous cystic neoplasms of the pancreas:
can one reliably differentiate benign from malignant (or premalignant) neoplasms? Ann
Surg. 2000;231(2):205-12.
82. Yamada M, Kozuka S, Yamao K, Nakazawa S, Naitoh Y, Tsukamoto Y. Mucin-
producing tumor of the pancreas. Cancer. 1991;68(1):159-68.
83. Campbell F, Azadeh B. Cystic neoplasms of the exocrine pancreas. Histopathology.
2008;52(5):539-51.
84. Pittman ME, Rao R, Hruban RH. Classification, Morphology, Molecular
Pathogenesis, and Outcome of Premalignant Lesions of the Pancreas. Arch Pathol Lab
Med. 2017;141(12):1606-14.
85. Tanaka M, Chari S, Adsay V, Fernandez-del Castillo C, Falconi M, Shimizu M, et
al. International consensus guidelines for management of intraductal papillary mucinous
neoplasms and mucinous cystic neoplasms of the pancreas. Pancreatology. 2006;6(1-2):17-
32.
86. Reddy RP, Smyrk TC, Zapiach M, Levy MJ, Pearson RK, Clain JE, et al. Pancreatic
mucinous cystic neoplasm defined by ovarian stroma: demographics, clinical features, and
prevalence of cancer. Clin Gastroenterol Hepatol. 2004;2(11):1026-31.
87. Li T, Chen ZQ, Meng ZX, Hong JG, Zhi XT. Calcified Cystic Lesion of the
Pancreas. J Gastrointest Surg. 2016;20(6):1272-4.
88. Bosman FWHO, International Agency for Research on Cancer. WHO classification
of tumours of the digestive system. 4 ed. Bosman F, editor. Lyon, France: IARC Press;
2010.
89. Crippa S, Salvia R, Warshaw AL, Dominguez I, Bassi C, Falconi M, et al.
Mucinous cystic neoplasm of the pancreas is not an aggressive entity: lessons from 163
resected patients. Ann Surg. 2008;247(4):571-9.
90. Tanaka M. Intraductal Papillary Mucinous Neoplasm of the Pancreas as the Main
Focus for Early Detection of Pancreatic Adenocarcinoma. Pancreas. 2018;47(5):544-50.
91. Valsangkar NP, Morales-Oyarvide V, Thayer SP, Ferrone CR, Wargo JA,
Warshaw AL, et al. 851 resected cystic tumors of the pancreas: a 33-year experience at the
Massachusetts General Hospital. Surgery. 2012;152(3 Suppl 1):S4-12.
92. Morohoshi T, Held G, Kloppel G. Exocrine pancreatic tumours and their
histological classification. A study based on 167 autopsy and 97 surgical cases.
Histopathology. 1983;7(5):645-61.
93. Madura JA, Wiebke EA, Howard TJ, Cummings OW, Hull MT, Sherman S, et al.
Mucin-hypersecreting intraductal neoplasms of the pancreas: a precursor to cystic
pancreatic malignancies. Surgery. 1997;122(4):786-92; discussion 92-3.
94. Choi SH, Park SH, Kim KW, Lee JY, Lee SS. Progression of Unresected
Intraductal Papillary Mucinous Neoplasms of the Pancreas to Cancer: A Systematic
Review and Meta-analysis. Clin Gastroenterol Hepatol. 2017;15(10):1509-20 e4.
308
95. Stark A, Donahue TR, Reber HA, Hines OJ. Pancreatic Cyst Disease: A Review.
JAMA. 2016;315(17):1882-93.
96. Rosenblatt R, Dorfman V, Epelboym I, Poneros JM, Sethi A, Lightdale C, et al.
Demographic features and natural history of intermediate-risk multifocal versus unifocal
intraductal papillary mucinous neoplasms. Pancreas. 2015;44(3):478-83.
97. Monzen M, Shimizu K, Hatori T, Furukawa T, Shiratori K. Usefulness of cell block
cytology for preoperative grading and typing of intraductal papillary mucinous neoplasms.
Pancreatology. 2013;13(4):369-78.
98. Hisaka T, Horiuchi H, Uchida S, Ishikawa H, Kawahara R, Kawashima Y, et al.
Potential usefulness of mucin immunohistochemical staining of preoperative pancreatic
biopsy or juice cytology specimens in the determination of treatment strategies for
intraductal papillary mucinous neoplasm. Oncol Rep. 2013;30(5):2035-41.
99. Yoon WJ, Daglilar ES, Mino-Kenudson M, Morales-Oyarvide V, Pitman MB,
Brugge WR. Characterization of epithelial subtypes of intraductal papillary mucinous
neoplasm of the pancreas with endoscopic ultrasound and cyst fluid analysis. Endoscopy.
2014;46(12):1071-7.
100. Furukawa T, Hatori T, Fujita I, Yamamoto M, Kobayashi M, Ohike N, et al.
Prognostic relevance of morphological types of intraductal papillary mucinous neoplasms
of the pancreas. Gut. 2011;60(4):509-16.
101. Tanaka M, Fernández-del Castillo C, Adsay V, Chari S, Falconi M, Jang J-Y, et al.
International consensus guidelines 2012 for the management of IPMN and MCN of the
pancreas. Pancreatology. 2012;12(3):183-97.
102. Luttges J, Zamboni G, Longnecker D, Kloppel G. The immunohistochemical mucin
expression pattern distinguishes different types of intraductal papillary mucinous
neoplasms of the pancreas and determines their relationship to mucinous noncystic
carcinoma and ductal adenocarcinoma. Am J Surg Pathol. 2001;25(7):942-8.
103. Adsay NV, Merati K, Basturk O, Iacobuzio-Donahue C, Levi E, Cheng JD, et al.
Pathologically and biologically distinct types of epithelium in intraductal papillary
mucinous neoplasms: delineation of an "intestinal" pathway of carcinogenesis in the
pancreas. Am J Surg Pathol. 2004;28(7):839-48.
104. Adsay NV, Adair CF, Heffess CS, Klimstra DS. Intraductal oncocytic papillary
neoplasms of the pancreas. Am J Surg Pathol. 1996;20(8):980-94.
105. Law JK, Ahmed A, Singh VK, Akshintala VS, Olson MT, Raman SP, et al. A
systematic review of solid-pseudopapillary neoplasms: are these rare lesions? Pancreas.
2014;43(3):331-7.
106. Yu PF, Hu ZH, Wang XB, Guo JM, Cheng XD, Zhang YL, et al. Solid
pseudopapillary tumor of the pancreas: a review of 553 cases in Chinese literature. World
journal of gastroenterology : WJG. 2010;16(10):1209-14.
107. Salvia R, Malleo G, Marchegiani G, Pennacchio S, Paiella S, Paini M, et al.
Pancreatic resections for cystic neoplasms: from the surgeon's presumption to the
pathologist's reality. Surgery. 2012;152(3 Suppl 1):S135-42.
108. Borhani AA, Fasanella KE, Iranpour N, Zureikat AH, Singhi AD, Furlan A, et al.
Lymphoepithelial cyst of pancreas: spectrum of radiological findings with pathologic
correlation. Abdom Radiol (NY). 2017;42(3):877-83.
109. Arumugam P, Fletcher N, Kyriakides C, Mears L, Kocher HM. Lymphoepithelial
Cyst of the Pancreas. Case Rep Gastroenterol. 2016;10(1):181-92.

309
110. Moore PS, Missiaglia E, Antonello D, Zamo A, Zamboni G, Corleto V, et al. Role
of disease-causing genes in sporadic pancreatic endocrine tumors: MEN1 and VHL. Genes
Chromosomes Cancer. 2001;32(2):177-81.
111. Atiq M, Bhutani MS, Bektas M, Lee JE, Gong Y, Tamm EP, et al. EUS-FNA for
pancreatic neuroendocrine tumors: a tertiary cancer center experience. Dig Dis Sci.
2012;57(3):791-800.
112. Habashi S, Draganov PV. Pancreatic pseudocyst. World journal of
gastroenterology : WJG. 2009;15(1):38-47.
113. Braha J, Tenner S. Fluid Collections and Pseudocysts as a Complication of Acute
Pancreatitis. Gastrointest Endosc Clin N Am. 2018;28(2):123-30.
114. Kloppel G, Maillet B. Pseudocysts in chronic pancreatitis: a morphological analysis
of 57 resection specimens and 9 autopsy pancreata. Pancreas. 1991;6(3):266-74.
115. Ammann RW, Heitz PU, Kloppel G. Course of alcoholic chronic pancreatitis: a
prospective clinicomorphological long-term study. Gastroenterology. 1996;111(1):224-31.
116. Matsubayashi H, Iwai T, Matsui T, Wada T, Kawata N, Ito H, et al. Pancreatic
cystic lesions with atypical steroid response should be carefully managed in cases of
autoimmune pancreatitis. J Gastroenterol Hepatol. 2016;31(1):270-6.
117. Brugge WR. Diagnosis and management of relapsing pancreatitis associated with
cystic neoplasms of the pancreas. World journal of gastroenterology : WJG.
2008;14(7):1038-43.
118. Pezzilli R, Melzi d'Eril G, Barassi A. Can Serum Pancreatic Amylase and Lipase
Levels Be Used as Diagnostic Markers to Distinguish Between Patients With Mucinous
Cystic Lesions of the Pancreas, Chronic Pancreatitis, and Pancreatic Ductal
Adenocarcinoma? Pancreas. 2016;45(9):1272-5.
119. Crippa S, Fernandez-Del Castillo C, Salvia R, Finkelstein D, Bassi C, Dominguez
I, et al. Mucin-producing neoplasms of the pancreas: an analysis of distinguishing clinical
and epidemiologic characteristics. Clin Gastroenterol Hepatol. 2010;8(2):213-9.
120. Hedayat AA, Lisovsky M, Suriawinata AA, Longnecker DS. Association of IgG4
response and autoimmune pancreatitis with intraductal papillary-mucinous neoplasms.
Pancreatology. 2017;17(2):263-6.
121. Gomez D, Rahman SH, Won LF, Verbeke CS, McMahon MJ, Menon KV.
Characterization of malignant pancreatic cystic lesions in the background of chronic
pancreatitis. JOP. 2006;7(5):465-72.
122. Waddell N, Pajic M, Patch AM, Chang DK, Kassahn KS, Bailey P, et al. Whole
genomes redefine the mutational landscape of pancreatic cancer. Nature.
2015;518(7540):495-501.
123. Witkiewicz AK, McMillan EA, Balaji U, Baek G, Lin WC, Mansour J, et al.
Whole-exome sequencing of pancreatic cancer defines genetic diversity and therapeutic
targets. Nat Commun. 2015;6:6744.
124. Wu J, Jiao Y, Dal Molin M, Maitra A, de Wilde RF, Wood LD, et al. Whole-exome
sequencing of neoplastic cysts of the pancreas reveals recurrent mutations in components
of ubiquitin-dependent pathways. Proc Natl Acad Sci U S A. 2011;108(52):21188-93.
125. Wood LD, Yurgelun MB, Goggins MG. Genetics of Familial and Sporadic
Pancreatic Cancer. Gastroenterology. 2019;156(7):2041-55.
310
126. Hirai H, Okabe T, Anraku Y, Fujisawa M, Urabe A, Takaku F. Activation of the c-
K-ras oncogene in a human pancreas carcinoma. Biochem Biophys Res Commun.
1985;127(1):168-74.
127. Barton CM, Staddon SL, Hughes CM, Hall PA, O'Sullivan C, Kloppel G, et al.
Abnormalities of the p53 tumour suppressor gene in human pancreatic cancer. Br J Cancer.
1991;64(6):1076-82.
128. Hahn SA, Schutte M, Hoque AT, Moskaluk CA, da Costa LT, Rozenblum E, et al.
DPC4, a candidate tumor suppressor gene at human chromosome 18q21.1. Science.
1996;271(5247):350-3.
129. Gisselsson D, Jonson T, Petersen A, Strombeck B, Dal Cin P, Hoglund M, et al.
Telomere dysfunction triggers extensive DNA fragmentation and evolution of complex
chromosome abnormalities in human malignant tumors. Proc Natl Acad Sci U S A.
2001;98(22):12683-8.
130. Distler M, Aust D, Weitz J, Pilarsky C, Grutzmann R. Precursor lesions for sporadic
pancreatic cancer: PanIN, IPMN, and MCN. Biomed Res Int. 2014;2014:474905.
131. Campbell SL, Khosravi-Far R, Rossman KL, Clark GJ, Der CJ. Increasing
complexity of Ras signaling. Oncogene. 1998;17(11 Reviews):1395-413.
132. Hezel AF, Kimmelman AC, Stanger BZ, Bardeesy N, Depinho RA. Genetics and
biology of pancreatic ductal adenocarcinoma. Genes Dev. 2006;20(10):1218-49.
133. Lohr M, Kloppel G, Maisonneuve P, Lowenfels AB, Luttges J. Frequency of K-ras
mutations in pancreatic intraductal neoplasias associated with pancreatic ductal
adenocarcinoma and chronic pancreatitis: a meta-analysis. Neoplasia. 2005;7(1):17-23.
134. Shiroma N, Arihiro K, Oda M, Orita M. KRAS fluorescence in situ hybridisation
testing for the detection and diagnosis of pancreatic adenocarcinoma. J Clin Pathol. 2018.
135. Chen PY, Muzumdar MD, Dorans KJ, Robbins R, Bhutkar A, Del Rosario A, et al.
Adaptive and Reversible Resistance to Kras Inhibition in Pancreatic Cancer Cells. Cancer
Res. 2018;78(4):985-1002.
136. Almoguera C, Shibata D, Forrester K, Martin J, Arnheim N, Perucho M. Most
human carcinomas of the exocrine pancreas contain mutant c-K-ras genes. Cell.
1988;53(4):549-54.
137. Caldas C, Kern SE. K-ras mutation and pancreatic adenocarcinoma. Int J
Pancreatol. 1995;18(1):1-6.
138. Tan MC, Basturk O, Brannon AR, Bhanot U, Scott SN, Bouvier N, et al. GNAS
and KRAS Mutations Define Separate Progression Pathways in Intraductal Papillary
Mucinous Neoplasm-Associated Carcinoma. J Am Coll Surg. 2015;220(5):845-54.
139. Satoh K, Shimosegawa T, Moriizumi S, Koizumi M, Toyota T. K-ras mutation and
p53 protein accumulation in intraductal mucin-hypersecreting neoplasms of the pancreas.
Pancreas. 1996;12(4):362-8.
140. Maitra A, Kern SE, Hruban RH. Molecular pathogenesis of pancreatic cancer. Best
Pract Res Clin Gastroenterol. 2006;20(2):211-26.
141. Sato N, Mizumoto K, Nagai E, Tanaka M. Telomerase as a new target for
pancreatic cancer treatment. J Hepatobiliary Pancreat Surg. 2002;9(3):322-7.
142. Clark SJ. Action at a distance: epigenetic silencing of large chromosomal regions
in carcinogenesis. Hum Mol Genet. 2007;16 Spec No 1:R88-95.

311
143. House MG, Herman JG, Guo MZ, Hooker CM, Schulick RD, Lillemoe KD, et al.
Aberrant hypermethylation of tumor suppressor genes in pancreatic endocrine neoplasms.
Ann Surg. 2003;238(3):423-31; discussion 31-2.
144. Tan AC, Jimeno A, Lin SH, Wheelhouse J, Chan F, Solomon A, et al.
Characterizing DNA methylation patterns in pancreatic cancer genome. Mol Oncol.
2009;3(5-6):425-38.
145. Sato N, Fukushima N, Hruban RH, Goggins M. CpG island methylation profile of
pancreatic intraepithelial neoplasia. Mod Pathol. 2008;21(3):238-44.
146. Redston MS, Caldas C, Seymour AB, Hruban RH, da Costa L, Yeo CJ, et al. p53
mutations in pancreatic carcinoma and evidence of common involvement of
homocopolymer tracts in DNA microdeletions. Cancer Res. 1994;54(11):3025-33.
147. Kern SE. p53: tumor suppression through control of the cell cycle.
Gastroenterology. 1994;106(6):1708-11.
148. Schutte M, Hruban RH, Hedrick L, Cho KR, Nadasdy GM, Weinstein CL, et al.
DPC4 gene in various tumor types. Cancer Res. 1996;56(11):2527-30.
149. Boschman CR, Stryker S, Reddy JK, Rao MS. Expression of p53 protein in
precursor lesions and adenocarcinoma of human pancreas. Am J Pathol. 1994;145(6):1291-
5.
150. Zauber P, Marotta SP, Sabbath-Solitare M. GNAS gene mutation may be present
only transiently during colorectal tumorigenesis. Int J Mol Epidemiol Genet. 2016;7(1):24-
31.
151. Safran H, Steinhoff M, Mangray S, Rathore R, King TC, Chai L, et al.
Overexpression of the HER-2/neu oncogene in pancreatic adenocarcinoma. Am J Clin
Oncol. 2001;24(5):496-9.
152. Korc M, Chandrasekar B, Yamanaka Y, Friess H, Buchier M, Beger HG.
Overexpression of the epidermal growth factor receptor in human pancreatic cancer is
associated with concomitant increases in the levels of epidermal growth factor and
transforming growth factor alpha. J Clin Invest. 1992;90(4):1352-60.
153. Del Chiaro M, Segersvard R, Lohr M, Verbeke C. Early detection and prevention
of pancreatic cancer: is it really possible today? World journal of gastroenterology : WJG.
2014;20(34):12118-31.
154. Rulyak SJ, Brentnall TA. Inherited pancreatic cancer: surveillance and treatment
strategies for affected families. Pancreatology. 2001;1(5):477-85.
155. Costache MI, Costache CA, Dumitrescu CI, Tica AA, Popescu M, Baluta EA, et
al. Which is the Best Imaging Method in Pancreatic Adenocarcinoma Diagnosis and
Staging - CT, MRI or EUS? Curr Health Sci J. 2017;43(2):132-6.
156. Verna EC, Hwang C, Stevens PD, Rotterdam H, Stavropoulos SN, Sy CD, et al.
Pancreatic cancer screening in a prospective cohort of high-risk patients: a comprehensive
strategy of imaging and genetics. Clin Cancer Res. 2010;16(20):5028-37.
157. Vege SS, Ziring B, Jain R, Moayyedi P, Clinical Guidelines C, American
Gastroenterology A. American gastroenterological association institute guideline on the
diagnosis and management of asymptomatic neoplastic pancreatic cysts. Gastroenterology.
2015;148(4):819-22; quize12-3.
158. Dalal V, Carmicheal J, Dhaliwal A, Jain M, Kaur S, Batra SK. Radiomics in
stratification of pancreatic cystic lesions: Machine learning in action. Cancer Lett.
2020;469:228-37.

312
159. Kauhanen S, Rinta-Kiikka I, Kemppainen J, Gronroos J, Kajander S, Seppanen M,
et al. Accuracy of 18F-FDG PET/CT, Multidetector CT, and MR Imaging in the Diagnosis
of Pancreatic Cysts: A Prospective Single-Center Study. J Nucl Med. 2015;56(8):1163-8.
160. England CG, Hernandez R, Eddine SB, Cai W. Molecular Imaging of Pancreatic
Cancer with Antibodies. Mol Pharm. 2016;13(1):8-24.
161. van der Waaij LA, van Dullemen HM, Porte RJ. Cyst fluid analysis in the
differential diagnosis of pancreatic cystic lesions: a pooled analysis. Gastrointestinal
endoscopy. 2005;62(3):383-9.
162. Castellano-Megias VM, Andres CI, Lopez-Alonso G, Colina-Ruizdelgado F.
Pathological features and diagnosis of intraductal papillary mucinous neoplasm of the
pancreas. World J Gastrointest Oncol. 2014;6(9):311-24.
163. Suzuki R, Thosani N, Annangi S, Guha S, Bhutani MS. Diagnostic yield of EUS-
FNA-based cytology distinguishing malignant and benign IPMNs: a systematic review and
meta-analysis. Pancreatology. 2014;14(5):380-4.
164. Yoon WJ, Daglilar ES, Fernandez-del Castillo C, Mino-Kenudson M, Pitman MB,
Brugge WR. Peritoneal seeding in intraductal papillary mucinous neoplasm of the pancreas
patients who underwent endoscopic ultrasound-guided fine-needle aspiration: the PIPE
Study. Endoscopy. 2014;46(5):382-7.
165. Vilas-Boas F, Macedo G. Pancreatic Cystic Lesions: New Endoscopic Trends in
Diagnosis. J Clin Gastroenterol. 2018;52(1):13-9.
166. Zhao Q, Zhan T, Deng Z, Li Q, Liu Y, Yang S, et al. Glycan analysis of colorectal
cancer samples reveals stage-dependent changes in CEA glycosylation patterns. Clin
Proteomics. 2018;15:9.
167. Yoshikawa M, Morine Y, Ikemoto T, Imura S, Higashijima J, Iwahashi S, et al.
Elevated Preoperative Serum CEA Level Is Associated with Poor Prognosis in Patients
with Hepatocellular Carcinoma Through the Epithelial-Mesenchymal Transition.
Anticancer Res. 2017;37(3):1169-75.
168. Talar-Wojnarowska R, Pazurek M, Durko L, Degowska M, Rydzewska G,
Smigielski J, et al. Pancreatic cyst fluid analysis for differential diagnosis between benign
and malignant lesions. Oncol Lett. 2013;5(2):613-6.
169. Wang W, Zhang L, Chen L, Wei J, Sun Q, Xie Q, et al. Serum carcinoembryonic
antigen and carbohydrate antigen 19-9 for prediction of malignancy and invasiveness in
intraductal papillary mucinous neoplasms of the pancreas: A meta-analysis. Biomed Rep.
2015;3(1):43-50.
170. Fritz S, Hackert T, Hinz U, Hartwig W, Buchler MW, Werner J. Role of serum
carbohydrate antigen 19-9 and carcinoembryonic antigen in distinguishing between benign
and invasive intraductal papillary mucinous neoplasm of the pancreas. Br J Surg.
2011;98(1):104-10.
171. Corvelo TC, de Loiola Rdo S, Aguiar DC, de Matos Gde C, de Brito DC. The Lewis
histo-blood group system: molecular analysis of the 59T>G, 508G>A, and 1067T>A
polymorphisms in an Amazonian population. PLoS One. 2013;8(7):e69908.
172. Hao C, Zhang G, Zhang L. Serum CEA levels in 49 different types of cancer and
noncancer diseases. Prog Mol Biol Transl Sci. 2019;162:213-27.
173. Neoptolemos JP, Kleeff J, Michl P, Costello E, Greenhalf W, Palmer DH.
Therapeutic developments in pancreatic cancer: current and future perspectives. Nat Rev
Gastroenterol Hepatol. 2018.
313
174. Lynch SM, Vrieling A, Lubin JH, Kraft P, Mendelsohn JB, Hartge P, et al. Cigarette
smoking and pancreatic cancer: a pooled analysis from the pancreatic cancer cohort
consortium. Am J Epidemiol. 2009;170(4):403-13.
175. Kleeff J, Korc M, Apte M, La Vecchia C, Johnson CD, Biankin AV, et al.
Pancreatic cancer. Nat Rev Dis Primers. 2016;2:16022.
176. Vincent A, Herman J, Schulick R, Hruban RH, Goggins M. Pancreatic cancer.
Lancet. 2011;378(9791):607-20.
177. Khorana AA, Mangu PB, Berlin J, Engebretson A, Hong TS, Maitra A, et al.
Potentially Curable Pancreatic Cancer: American Society of Clinical Oncology Clinical
Practice Guideline Update. J Clin Oncol. 2017;35(20):2324-8.
178. Tempero MA. NCCN Guidelines Updates: Pancreatic Cancer. J Natl Compr Canc
Netw. 2019;17(5.5):603-5.
179. Kalser MH, Ellenberg SS. Pancreatic cancer. Adjuvant combined radiation and
chemotherapy following curative resection. Arch Surg. 1985;120(8):899-903.
180. Neoptolemos JP, Dunn JA, Stocken DD, Almond J, Link K, Beger H, et al.
Adjuvant chemoradiotherapy and chemotherapy in resectable pancreatic cancer: a
randomised controlled trial. Lancet. 2001;358(9293):1576-85.
181. Oettle H, Post S, Neuhaus P, Gellert K, Langrehr J, Ridwelski K, et al. Adjuvant
chemotherapy with gemcitabine vs observation in patients undergoing curative-intent
resection of pancreatic cancer: a randomized controlled trial. JAMA. 2007;297(3):267-77.
182. Neoptolemos JP, Palmer DH, Ghaneh P, Psarelli EE, Valle JW, Halloran CM, et
al. Comparison of adjuvant gemcitabine and capecitabine with gemcitabine monotherapy
in patients with resected pancreatic cancer (ESPAC-4): a multicentre, open-label,
randomised, phase 3 trial. Lancet. 2017;389(10073):1011-24.
183. Philip PA, Buyse ME, Alistar AT, Rocha Lima CM, Luther S, Pardee TS, et al. A
Phase III open-label trial to evaluate efficacy and safety of CPI-613 plus modified
FOLFIRINOX (mFFX) versus FOLFIRINOX (FFX) in patients with metastatic
adenocarcinoma of the pancreas. Future Oncol. 2019;15(28):3189-96.
184. Conroy T, Hammel P, Hebbar M, Ben Abdelghani M, Wei AC, Raoul JL, et al.
FOLFIRINOX or Gemcitabine as Adjuvant Therapy for Pancreatic Cancer. N Engl J Med.
2018;379(25):2395-406.
185. Ghosn M, Kourie HR, El Rassy E, Haddad FG, Hanna C, El Karak F, et al. Where
does chemotherapy stands in the treatment of ampullary carcinoma? A review of literature.
World J Gastrointest Oncol. 2016;8(10):745-50.
186. Zhan HX, Xu JW, Wu D, Wu ZY, Wang L, Hu SY, et al. Neoadjuvant therapy in
pancreatic cancer: a systematic review and meta-analysis of prospective studies. Cancer
Med. 2017;6(6):1201-19.
187. Tachezy M, Gebauer F, Petersen C, Arnold D, Trepel M, Wegscheider K, et al.
Sequential neoadjuvant chemoradiotherapy (CRT) followed by curative surgery vs.
primary surgery alone for resectable, non-metastasized pancreatic adenocarcinoma:
NEOPA- a randomized multicenter phase III study (NCT01900327, DRKS00003893,
ISRCTN82191749). BMC Cancer. 2014;14:411.
188. Versteijne E, van Eijck CH, Punt CJ, Suker M, Zwinderman AH, Dohmen MA, et
al. Preoperative radiochemotherapy versus immediate surgery for resectable and borderline
resectable pancreatic cancer (PREOPANC trial): study protocol for a multicentre
randomized controlled trial. Trials. 2016;17(1):127.

314
189. Varadhachary GR, Tamm EP, Abbruzzese JL, Xiong HQ, Crane CH, Wang H, et
al. Borderline resectable pancreatic cancer: definitions, management, and role of
preoperative therapy. Ann Surg Oncol. 2006;13(8):1035-46.
190. Sultana A, Smith CT, Cunningham D, Starling N, Neoptolemos JP, Ghaneh P.
Meta-analyses of chemotherapy for locally advanced and metastatic pancreatic cancer. J
Clin Oncol. 2007;25(18):2607-15.
191. Hurt CN, Falk S, Crosby T, McDonald A, Ray R, Joseph G, et al. Long-term results
and recurrence patterns from SCALOP: a phase II randomised trial of gemcitabine- or
capecitabine-based chemoradiation for locally advanced pancreatic cancer. Br J Cancer.
2017;116(10):1264-70.
192. Bockhorn M, Uzunoglu FG, Adham M, Imrie C, Milicevic M, Sandberg AA, et al.
Borderline resectable pancreatic cancer: a consensus statement by the International Study
Group of Pancreatic Surgery (ISGPS). Surgery. 2014;155(6):977-88.
193. Suker M, Beumer BR, Sadot E, Marthey L, Faris JE, Mellon EA, et al.
FOLFIRINOX for locally advanced pancreatic cancer: a systematic review and patient-
level meta-analysis. Lancet Oncol. 2016;17(6):801-10.
194. Hackert T, Sachsenmaier M, Hinz U, Schneider L, Michalski CW, Springfeld C, et
al. Locally Advanced Pancreatic Cancer: Neoadjuvant Therapy With Folfirinox Results in
Resectability in 60% of the Patients. Ann Surg. 2016;264(3):457-63.
195. Petrelli F, Coinu A, Borgonovo K, Cabiddu M, Ghilardi M, Lonati V, et al..
Pancreas. 2015;44(4):515-21.
196. Nitsche U, Wenzel P, Siveke JT, Braren R, Holzapfel K, Schlitter AM, et al.
Resectability After First-Line FOLFIRINOX in Initially Unresectable Locally Advanced
Pancreatic Cancer: A Single-Center Experience. Ann Surg Oncol. 2015;22 Suppl 3:S1212-
20.
197. Murphy JE, Wo JY, Ryan DP, Jiang W, Yeap BY, Drapek LC, et al. Total
Neoadjuvant Therapy With FOLFIRINOX Followed by Individualized
Chemoradiotherapy for Borderline Resectable Pancreatic Adenocarcinoma: A Phase 2
Clinical Trial. JAMA Oncol. 2018;4(7):963-9.
198. Russo S, Ammori J, Eads J, Dorth J. The role of neoadjuvant therapy in pancreatic
cancer: a review. Future Oncol. 2016;12(5):669-85.
199. Kim EJ, Ben-Josef E, Herman JM, Bekaii-Saab T, Dawson LA, Griffith KA, et al.
A multi-institutional phase 2 study of neoadjuvant gemcitabine and oxaliplatin with
radiation therapy in patients with pancreatic cancer. Cancer. 2013;119(15):2692-700.
200. Landry J, Catalano PJ, Staley C, Harris W, Hoffman J, Talamonti M, et al.
Randomized phase II study of gemcitabine plus radiotherapy versus gemcitabine, 5-
fluorouracil, and cisplatin followed by radiotherapy and 5-fluorouracil for patients with
locally advanced, potentially resectable pancreatic adenocarcinoma. J Surg Oncol.
2010;101(7):587-92.
201. Talamonti MS, Small W, Jr., Mulcahy MF, Wayne JD, Attaluri V, Colletti LM, et
al. A multi-institutional phase II trial of preoperative full-dose gemcitabine and concurrent
radiation for patients with potentially resectable pancreatic carcinoma. Ann Surg Oncol.
2006;13(2):150-8.
202. Turrini O, Viret F, Moureau-Zabotto L, Guiramand J, Moutardier V, Lelong B, et
al. Neoadjuvant 5 fluorouracil-cisplatin chemoradiation effect on survival in patients with

315
resectable pancreatic head adenocarcinoma: a ten-year single institution experience.
Oncology. 2009;76(6):413-9.
203. Ruarus A, Vroomen L, Puijk R, Scheffer H, Meijerink M. Locally Advanced
Pancreatic Cancer: A Review of Local Ablative Therapies. Cancers (Basel). 2018;10(1).
204. Jung J, Yoon SM, Park JH, Seo DW, Lee SS, Kim MH, et al. Stereotactic body
radiation therapy for locally advanced pancreatic cancer. PLoS One. 2019;14(4):e0214970.
205. Zhu X, Shi D, Li F, Ju X, Cao Y, Shen Y, et al. Prospective analysis of different
combined regimens of stereotactic body radiation therapy and chemotherapy for locally
advanced pancreatic cancer. Cancer Med. 2018.
206. Wu G, Baine MJ, Zhao N, Li S, Li X, Lin C. Lymphocyte-sparing effect of
stereotactic body radiation therapy compared to conventional fractionated radiation
therapy in patients with locally advanced pancreatic cancer. BMC Cancer. 2019;19(1):977.
207. Herman JM, Chang DT, Goodman KA, Dholakia AS, Raman SP, Hacker-Prietz A,
et al. Phase 2 multi-institutional trial evaluating gemcitabine and stereotactic body
radiotherapy for patients with locally advanced unresectable pancreatic adenocarcinoma.
Cancer. 2015;121(7):1128-37.
208. Baine MJ, Sleightholm R, Lin C. Incidence and Patterns of Locoregional Failure
After Stereotactic Body Radiation Therapy for Pancreatic Adenocarcinoma. Pract Radiat
Oncol. 2019;9(1):e29-e37.
209. Wagner M, Redaelli C, Lietz M, Seiler CA, Friess H, Buchler MW. Curative
resection is the single most important factor determining outcome in patients with
pancreatic adenocarcinoma. Br J Surg. 2004;91(5):586-94.
210. Patra KC, Bardeesy N, Mizukami Y. Diversity of Precursor Lesions For Pancreatic
Cancer: The Genetics and Biology of Intraductal Papillary Mucinous Neoplasm. Clin
Transl Gastroenterol. 2017;8(4):e86.
211. Poruk KE, Valero V, 3rd, He J, Ahuja N, Cameron JL, Weiss MJ, et al. Circulating
Epithelial Cells in Intraductal Papillary Mucinous Neoplasms and Cystic Pancreatic
Lesions. Pancreas. 2017;46(7):943-7.
212. Berger AW, Schwerdel D, Costa IG, Hackert T, Strobel O, Lam S, et al. Detection
of Hot-Spot Mutations in Circulating Cell-Free DNA From Patients With Intraductal
Papillary Mucinous Neoplasms of the Pancreas. Gastroenterology. 2016;151(2):267-70.
213. Melo SA, Luecke LB, Kahlert C, Fernandez AF, Gammon ST, Kaye J, et al.
Glypican-1 identifies cancer exosomes and detects early pancreatic cancer. Nature.
2015;523(7559):177-82.
214. Goto T, Fujiya M, Konishi H, Sasajima J, Fujibayashi S, Hayashi A, et al. An
elevated expression of serum exosomal microRNA-191, - 21, -451a of pancreatic neoplasm
is considered to be efficient diagnostic marker. BMC Cancer. 2018;18(1):116.
215. Hall BR, Cannon A, Atri P, Wichman CS, Smith LM, Ganti AK, et al. Advanced
pancreatic cancer: a meta-analysis of clinical trials over thirty years. Oncotarget.
2018;9(27):19396-405.
216. Prasanna A, Ahmed MM, Mohiuddin M, Coleman CN. Exploiting sensitization
windows of opportunity in hyper and hypo-fractionated radiation therapy. J Thorac Dis.
2014;6(4):287-302.
217. Greening DW, Xu R, Ji H, Tauro BJ, Simpson RJ. A protocol for exosome isolation
and characterization: evaluation of ultracentrifugation, density-gradient separation, and
immunoaffinity capture methods. Methods Mol Biol. 2015;1295:179-209.

316
218. Shlyakhtenko LS, Gall AA, Filonov A, Cerovac Z, Lushnikov A, Lyubchenko YL.
Silatrane-based surface chemistry for immobilization of DNA, protein-DNA complexes
and other biological materials. Ultramicroscopy. 2003;97(1-4):279-87.
219. Huang X, Irmak S, Lu YF, Pipinos I, Casale G, Subbiah J. Spontaneous and
coherent anti-Stokes Raman spectroscopy of human gastrocnemius muscle biopsies in CH-
stretching region for discrimination of peripheral artery disease. Biomed Opt Express.
2015;6(8):2766-77.
220. Ashburner M, Ball CA, Blake JA, Botstein D, Butler H, Cherry JM, et al. Gene
ontology: tool for the unification of biology. The Gene Ontology Consortium. Nat Genet.
2000;25(1):25-9.
221. Kaur S, Smith LM, Patel A, Menning M, Watley DC, Malik SS, et al. A
Combination of MUC5AC and CA19-9 Improves the Diagnosis of Pancreatic Cancer: A
Multicenter Study. Am J Gastroenterol. 2017;112(1):172-83.
222. Niknafs YS, Pandian B, Gajjar T, Gaudette Z, Wheelock K, Maz MP, et al.
MiPanda: A Resource for Analyzing and Visualizing Next-Generation Sequencing
Transcriptomics Data. Neoplasia. 2018;20(11):1144-9.
223. Tang Z, Li C, Kang B, Gao G, Li C, Zhang Z. GEPIA: a web server for cancer and
normal gene expression profiling and interactive analyses. Nucleic Acids Res.
2017;45(W1):W98-W102.
224. Chatr-Aryamontri A, Oughtred R, Boucher L, Rust J, Chang C, Kolas NK, et al.
The BioGRID interaction database: 2017 update. Nucleic Acids Res. 2017;45(D1):D369-
D79.
225. McDonald ER, 3rd, de Weck A, Schlabach MR, Billy E, Mavrakis KJ, Hoffman
GR, et al. Project DRIVE: A Compendium of Cancer Dependencies and Synthetic Lethal
Relationships Uncovered by Large-Scale, Deep RNAi Screening. Cell. 2017;170(3):577-
92 e10.
226. Fertil B, Dertinger H, Courdi A, Malaise EP. Mean inactivation dose: a useful
concept for intercomparison of human cell survival curves. Radiat Res. 1984;99(1):73-84.
227. Di Veroli GY, Fornari C, Wang D, Mollard S, Bramhall JL, Richards FM, et al.
Combenefit: an interactive platform for the analysis and visualization of drug
combinations. Bioinformatics. 2016;32(18):2866-8.
228. Berenbaum MC. What is synergy? Pharmacol Rev. 1989;41(2):93-141.
229. Yadav B, Wennerberg K, Aittokallio T, Tang J. Searching for Drug Synergy in
Complex Dose-Response Landscapes Using an Interaction Potency Model. Comput Struct
Biotechnol J. 2015;13:504-13.
230. Loewe S. The problem of synergism and antagonism of combined drugs.
Arzneimittelforschung. 1953;3(6):285-90.
231. Martinez AM, Kim A, Yang WS. Detection of Ferroptosis by BODIPY 581/591
C11. Methods Mol Biol. 2020;2108:125-30.
232. Fraga CG, Leibovitz BE, Tappel AL. Lipid peroxidation measured as thiobarbituric
acid-reactive substances in tissue slices: characterization and comparison with
homogenates and microsomes. Free Radic Biol Med. 1988;4(3):155-61.
233. Lasser C, Alikhani VS, Ekstrom K, Eldh M, Paredes PT, Bossios A, et al. Human
saliva, plasma and breast milk exosomes contain RNA: uptake by macrophages. J Transl
Med. 2011;9:9.

317
234. Hessvik NP, Llorente A. Current knowledge on exosome biogenesis and release.
Cell Mol Life Sci. 2018;75(2):193-208.
235. Tricarico C, Clancy J, D'Souza-Schorey C. Biology and biogenesis of shed
microvesicles. Small GTPases. 2017;8(4):220-32.
236. van Niel G, D'Angelo G, Raposo G. Shedding light on the cell biology of
extracellular vesicles. Nat Rev Mol Cell Biol. 2018;19(4):213-28.
237. Jeppesen DK, Fenix AM, Franklin JL, Higginbotham JN, Zhang Q, Zimmerman
LJ, et al. Reassessment of Exosome Composition. Cell. 2019;177(2):428-45 e18.
238. Zhang H, Freitas D, Kim HS, Fabijanic K, Li Z, Chen H, et al. Identification of
distinct nanoparticles and subsets of extracellular vesicles by asymmetric flow field-flow
fractionation. Nat Cell Biol. 2018;20(3):332-43.
239. Marzesco AM, Janich P, Wilsch-Brauninger M, Dubreuil V, Langenfeld K, Corbeil
D, et al. Release of extracellular membrane particles carrying the stem cell marker
prominin-1 (CD133) from neural progenitors and other epithelial cells. J Cell Sci.
2005;118(Pt 13):2849-58.
240. Hurley JH. ESCRTs are everywhere. EMBO J. 2015;34(19):2398-407.
241. Mathieu M, Martin-Jaular L, Lavieu G, Thery C. Specificities of secretion and
uptake of exosomes and other extracellular vesicles for cell-to-cell communication. Nat
Cell Biol. 2019;21(1):9-17.
242. Andreu Z, Yanez-Mo M. Tetraspanins in extracellular vesicle formation and
function. Front Immunol. 2014;5:442.
243. Perez-Hernandez D, Gutierrez-Vazquez C, Jorge I, Lopez-Martin S, Ursa A,
Sanchez-Madrid F, et al. The intracellular interactome of tetraspanin-enriched
microdomains reveals their function as sorting machineries toward exosomes. J Biol Chem.
2013;288(17):11649-61.
244. van Niel G, Charrin S, Simoes S, Romao M, Rochin L, Saftig P, et al. The
tetraspanin CD63 regulates ESCRT-independent and -dependent endosomal sorting during
melanogenesis. Dev Cell. 2011;21(4):708-21.
245. McAndrews KM, Kalluri R. Mechanisms associated with biogenesis of exosomes
in cancer. Mol Cancer. 2019;18(1):52.
246. Hsu C, Morohashi Y, Yoshimura S, Manrique-Hoyos N, Jung S, Lauterbach MA,
et al. Regulation of exosome secretion by Rab35 and its GTPase-activating proteins
TBC1D10A-C. J Cell Biol. 2010;189(2):223-32.
247. Ostrowski M, Carmo NB, Krumeich S, Fanget I, Raposo G, Savina A, et al. Rab27a
and Rab27b control different steps of the exosome secretion pathway. Nat Cell Biol.
2010;12(1):19-30; sup pp 1-13.
248. Savina A, Fader CM, Damiani MT, Colombo MI. Rab11 promotes docking and
fusion of multivesicular bodies in a calcium-dependent manner. Traffic. 2005;6(2):131-43.
249. Verweij FJ, Bebelman MP, Jimenez CR, Garcia-Vallejo JJ, Janssen H, Neefjes J,
et al. Quantifying exosome secretion from single cells reveals a modulatory role for GPCR
signaling. J Cell Biol. 2018;217(3):1129-42.
250. Trajkovic K, Hsu C, Chiantia S, Rajendran L, Wenzel D, Wieland F, et al. Ceramide
triggers budding of exosome vesicles into multivesicular endosomes. Science.
2008;319(5867):1244-7.

318
251. Wei H, Malcor JM, Harper MT. Lipid rafts are essential for release of
phosphatidylserine-exposing extracellular vesicles from platelets. Sci Rep.
2018;8(1):9987.
252. Skotland T, Sandvig K, Llorente A. Lipids in exosomes: Current knowledge and
the way forward. Prog Lipid Res. 2017;66:30-41.
253. Skotland T, Hessvik NP, Sandvig K, Llorente A. Exosomal lipid composition and
the role of ether lipids and phosphoinositides in exosome biology. J Lipid Res.
2019;60(1):9-18.
254. Record M, Silvente-Poirot S, Poirot M, Wakelam MJO. Extracellular vesicles:
lipids as key components of their biogenesis and functions. J Lipid Res. 2018;59(8):1316-
24.
255. Ghossoub R, Lembo F, Rubio A, Gaillard CB, Bouchet J, Vitale N, et al. Syntenin-
ALIX exosome biogenesis and budding into multivesicular bodies are controlled by ARF6
and PLD2. Nat Commun. 2014;5:3477.
256. Skocaj M, Yu Y, Grundner M, Resnik N, Bedina Zavec A, Leonardi A, et al.
Characterisation of plasmalemmal shedding of vesicles induced by the
cholesterol/sphingomyelin binding protein, ostreolysin A-mCherry. Biochim Biophys
Acta. 2016;1858(11):2882-93.
257. Colombo M, Raposo G, Thery C. Biogenesis, secretion, and intercellular
interactions of exosomes and other extracellular vesicles. Annu Rev Cell Dev Biol.
2014;30:255-89.
258. Pan BT, Teng K, Wu C, Adam M, Johnstone RM. Electron microscopic evidence
for externalization of the transferrin receptor in vesicular form in sheep reticulocytes. J Cell
Biol. 1985;101(3):942-8.
259. Lynch S, Santos SG, Campbell EC, Nimmo AM, Botting C, Prescott A, et al. Novel
MHC class I structures on exosomes. J Immunol. 2009;183(3):1884-91.
260. Raposo G, Nijman HW, Stoorvogel W, Liejendekker R, Harding CV, Melief CJ, et
al. B lymphocytes secrete antigen-presenting vesicles. J Exp Med. 1996;183(3):1161-72.
261. Valadi H, Ekstrom K, Bossios A, Sjostrand M, Lee JJ, Lotvall JO. Exosome-
mediated transfer of mRNAs and microRNAs is a novel mechanism of genetic exchange
between cells. Nat Cell Biol. 2007;9(6):654-9.
262. Skliar M, Chernyshev VS, Belnap DM, Sergey GV, Al-Hakami SM, Bernard PS,
et al. Membrane proteins significantly restrict exosome mobility. Biochem Biophys Res
Commun. 2018;501(4):1055-9.
263. Thakur BK, Zhang H, Becker A, Matei I, Huang Y, Costa-Silva B, et al. Double-
stranded DNA in exosomes: a novel biomarker in cancer detection. Cell Res.
2014;24(6):766-9.
264. Subra C, Laulagnier K, Perret B, Record M. Exosome lipidomics unravels lipid
sorting at the level of multivesicular bodies. Biochimie. 2007;89(2):205-12.
265. Baietti MF, Zhang Z, Mortier E, Melchior A, Degeest G, Geeraerts A, et al.
Syndecan-syntenin-ALIX regulates the biogenesis of exosomes. Nat Cell Biol.
2012;14(7):677-85.
266. Leca J, Martinez S, Lac S, Nigri J, Secq V, Rubis M, et al. Cancer-associated
fibroblast-derived annexin A6+ extracellular vesicles support pancreatic cancer
aggressiveness. J Clin Invest. 2016;126(11):4140-56.

319
267. Banfer S, Schneider D, Dewes J, Strauss MT, Freibert SA, Heimerl T, et al.
Molecular mechanism to recruit galectin-3 into multivesicular bodies for polarized
exosomal secretion. Proc Natl Acad Sci U S A. 2018;115(19):E4396-E405.
268. Kowal J, Arras G, Colombo M, Jouve M, Morath JP, Primdal-Bengtson B, et al.
Proteomic comparison defines novel markers to characterize heterogeneous populations of
extracellular vesicle subtypes. Proc Natl Acad Sci U S A. 2016;113(8):E968-77.
269. Figueroa JM, Skog J, Akers J, Li H, Komotar R, Jensen R, et al. Detection of wild-
type EGFR amplification and EGFRvIII mutation in CSF-derived extracellular vesicles of
glioblastoma patients. Neuro Oncol. 2017;19(11):1494-502.
270. Chen F, Chen J, Yang L, Liu J, Zhang X, Zhang Y, et al. Extracellular vesicle-
packaged HIF-1alpha-stabilizing lncRNA from tumour-associated macrophages regulates
aerobic glycolysis of breast cancer cells. Nat Cell Biol. 2019;21(4):498-510.
271. Ko J, Bhagwat N, Black T, Yee SS, Na YJ, Fisher S, et al. miRNA Profiling of
Magnetic Nanopore-Isolated Extracellular Vesicles for the Diagnosis of Pancreatic Cancer.
Cancer Res. 2018;78(13):3688-97.
272. Li Y, Zhao J, Yu S, Wang Z, He X, Su Y, et al. Extracellular Vesicles Long RNA
Sequencing Reveals Abundant mRNA, circRNA, and lncRNA in Human Blood as
Potential Biomarkers for Cancer Diagnosis. Clin Chem. 2019;65(6):798-808.
273. Kalluri R, LeBleu VS. Discovery of Double-Stranded Genomic DNA in Circulating
Exosomes. Cold Spring Harb Symp Quant Biol. 2016;81:275-80.
274. Torralba D, Baixauli F, Villarroya-Beltri C, Fernandez-Delgado I, Latorre-Pellicer
A, Acin-Perez R, et al. Priming of dendritic cells by DNA-containing extracellular vesicles
from activated T cells through antigen-driven contacts. Nat Commun. 2018;9(1):2658.
275. Kahlert C, Melo SA, Protopopov A, Tang J, Seth S, Koch M, et al. Identification
of double-stranded genomic DNA spanning all chromosomes with mutated KRAS and p53
DNA in the serum exosomes of patients with pancreatic cancer. J Biol Chem.
2014;289(7):3869-75.
276. Tkach M, Thery C. Communication by Extracellular Vesicles: Where We Are and
Where We Need to Go. Cell. 2016;164(6):1226-32.
277. Lai CP, Kim EY, Badr CE, Weissleder R, Mempel TR, Tannous BA, et al.
Visualization and tracking of tumour extracellular vesicle delivery and RNA translation
using multiplexed reporters. Nat Commun. 2015;6:7029.
278. Takahashi A, Okada R, Nagao K, Kawamata Y, Hanyu A, Yoshimoto S, et al.
Exosomes maintain cellular homeostasis by excreting harmful DNA from cells. Nat
Commun. 2017;8:15287.
279. Haraszti RA, Miller R, Dubuke ML, Rockwell HE, Coles AH, Sapp E, et al. Serum
Deprivation of Mesenchymal Stem Cells Improves Exosome Activity and Alters Lipid and
Protein Composition. iScience. 2019;16:230-41.
280. Svensson KJ, Kucharzewska P, Christianson HC, Skold S, Lofstedt T, Johansson
MC, et al. Hypoxia triggers a proangiogenic pathway involving cancer cell microvesicles
and PAR-2-mediated heparin-binding EGF signaling in endothelial cells. Proc Natl Acad
Sci U S A. 2011;108(32):13147-52.
281. Shah R, Patel T, Freedman JE. Circulating Extracellular Vesicles in Human
Disease. N Engl J Med. 2018;379(10):958-66.

320
282. Al-Nedawi K, Meehan B, Micallef J, Lhotak V, May L, Guha A, et al. Intercellular
transfer of the oncogenic receptor EGFRvIII by microvesicles derived from tumour cells.
Nat Cell Biol. 2008;10(5):619-24.
283. Keklikoglou I, Cianciaruso C, Guc E, Squadrito ML, Spring LM, Tazzyman S, et
al. Chemotherapy elicits pro-metastatic extracellular vesicles in breast cancer models. Nat
Cell Biol. 2019;21(2):190-202.
284. Wortzel I, Dror S, Kenific CM, Lyden D. Exosome-Mediated Metastasis:
Communication from a Distance. Dev Cell. 2019;49(3):347-60.
285. Zheng P, Chen L, Yuan X, Luo Q, Liu Y, Xie G, et al. Exosomal transfer of tumor-
associated macrophage-derived miR-21 confers cisplatin resistance in gastric cancer cells.
J Exp Clin Cancer Res. 2017;36(1):53.
286. Buzas EI, Toth EA, Sodar BW, Szabo-Taylor KE. Molecular interactions at the
surface of extracellular vesicles. Semin Immunopathol. 2018;40(5):453-64.
287. Li X, Wang Y, Wang Q, Liu Y, Bao W, Wu S. Exosomes in cancer: Small
transporters with big functions. Cancer Lett. 2018;435:55-65.
288. Bebelman MP, Smit MJ, Pegtel DM, Baglio SR. Biogenesis and function of
extracellular vesicles in cancer. Pharmacol Ther. 2018;188:1-11.
289. Thery C, Amigorena S, Raposo G, Clayton A. Isolation and characterization of
exosomes from cell culture supernatants and biological fluids. Curr Protoc Cell Biol.
2006;Chapter 3:Unit 3 22.
290. Konoshenko MY, Lekchnov EA, Vlassov AV, Laktionov PP. Isolation of
Extracellular Vesicles: General Methodologies and Latest Trends. Biomed Res Int.
2018;2018:8545347.
291. Salih M, Zietse R, Hoorn EJ. Urinary extracellular vesicles and the kidney:
biomarkers and beyond. Am J Physiol Renal Physiol. 2014;306(11):F1251-9.
292. Webber J, Clayton A. How pure are your vesicles? J Extracell Vesicles. 2013;2.
293. Onodi Z, Pelyhe C, Terezia Nagy C, Brenner GB, Almasi L, Kittel A, et al. Isolation
of High-Purity Extracellular Vesicles by the Combination of Iodixanol Density Gradient
Ultracentrifugation and Bind-Elute Chromatography From Blood Plasma. Front Physiol.
2018;9:1479.
294. Kosanovic M, Jankovic M. Isolation of urinary extracellular vesicles from Tamm-
Horsfall protein-depleted urine and their application in the development of a lectin-
exosome-binding assay. Biotechniques. 2014;57(3):143-9.
295. Monguio-Tortajada M, Galvez-Monton C, Bayes-Genis A, Roura S, Borras FE.
Extracellular vesicle isolation methods: rising impact of size-exclusion chromatography.
Cell Mol Life Sci. 2019;76(12):2369-82.
296. Nordin JZ, Lee Y, Vader P, Mager I, Johansson HJ, Heusermann W, et al.
Ultrafiltration with size-exclusion liquid chromatography for high yield isolation of
extracellular vesicles preserving intact biophysical and functional properties.
Nanomedicine. 2015;11(4):879-83.
297. Santana SM, Antonyak MA, Cerione RA, Kirby BJ. Microfluidic isolation of
cancer-cell-derived microvesicles from hetergeneous extracellular shed vesicle
populations. Biomed Microdevices. 2014;16(6):869-77.
298. Davies RT, Kim J, Jang SC, Choi EJ, Gho YS, Park J. Microfluidic filtration system
to isolate extracellular vesicles from blood. Lab Chip. 2012;12(24):5202-10.

321
299. Zhang H, Lyden D. Asymmetric-flow field-flow fractionation technology for
exomere and small extracellular vesicle separation and characterization. Nat Protoc.
2019;14(4):1027-53.
300. Oksvold MP, Neurauter A, Pedersen KW. Magnetic bead-based isolation of
exosomes. Methods Mol Biol. 2015;1218:465-81.
301. Balbi C, Bolis S, Vassalli G, Barile L. Flow Cytometric Analysis of Extracellular
Vesicles from Cell-conditioned Media. J Vis Exp. 2019(144).
302. Tauro BJ, Greening DW, Mathias RA, Ji H, Mathivanan S, Scott AM, et al.
Comparison of ultracentrifugation, density gradient separation, and immunoaffinity
capture methods for isolating human colon cancer cell line LIM1863-derived exosomes.
Methods. 2012;56(2):293-304.
303. Beekman P, Enciso-Martinez A, Rho HS, Pujari SP, Lenferink A, Zuilhof H, et al.
Immuno-capture of extracellular vesicles for individual multi-modal characterization using
AFM, SEM and Raman spectroscopy. Lab Chip. 2019;19(15):2526-36.
304. Ghosh A, Davey M, Chute IC, Griffiths SG, Lewis S, Chacko S, et al. Rapid
isolation of extracellular vesicles from cell culture and biological fluids using a synthetic
peptide with specific affinity for heat shock proteins. PLoS One. 2014;9(10):e110443.
305. Xu D, Esko JD. Demystifying heparan sulfate-protein interactions. Annu Rev
Biochem. 2014;83:129-57.
306. Atai NA, Balaj L, van Veen H, Breakefield XO, Jarzyna PA, Van Noorden CJ, et
al. Heparin blocks transfer of extracellular vesicles between donor and recipient cells. J
Neurooncol. 2013;115(3):343-51.
307. Manandhar S, Park J, Kothandan VK, Lee J, Alam F, Jee JP, et al. Properties of
Heparinoids Premixed with Tumor-Derived Extracellular Vesicles. Bioconjug Chem.
2018;29(11):3757-67.
308. Christianson HC, Svensson KJ, van Kuppevelt TH, Li JP, Belting M. Cancer cell
exosomes depend on cell-surface heparan sulfate proteoglycans for their internalization
and functional activity. Proc Natl Acad Sci U S A. 2013;110(43):17380-5.
309. Balaj L, Atai NA, Chen W, Mu D, Tannous BA, Breakefield XO, et al. Heparin
affinity purification of extracellular vesicles. Sci Rep. 2015;5:10266.
310. Wan Y, Cheng G, Liu X, Hao SJ, Nisic M, Zhu CD, et al. Rapid magnetic isolation
of extracellular vesicles via lipid-based nanoprobes. Nat Biomed Eng. 2017;1.
311. Wan Y, Maurer M, He HZ, Xia YQ, Hao SJ, Zhang WL, et al. Enrichment of
extracellular vesicles with lipid nanoprobe functionalized nanostructured silica. Lab Chip.
2019;19(14):2346-55.
312. Yokota S, Kuramochi H, Okubo K, Iwaya A, Tsuchiya S, Ichiki T. Extracellular
vesicles nanoarray technology: Immobilization of individual extracellular vesicles on
nanopatterned polyethylene glycol-lipid conjugate brushes. PLoS One.
2019;14(10):e0224091.
313. Denecker G, Dooms H, Van Loo G, Vercammen D, Grooten J, Fiers W, et al.
Phosphatidyl serine exposure during apoptosis precedes release of cytochrome c and
decrease in mitochondrial transmembrane potential. FEBS Lett. 2000;465(1):47-52.
314. Kang YT, Purcell E, Palacios-Rolston C, Lo TW, Ramnath N, Jolly S, et al.
Isolation and Profiling of Circulating Tumor-Associated Exosomes Using Extracellular
Vesicular Lipid-Protein Binding Affinity Based Microfluidic Device. Small.
2019;15(47):e1903600.

322
315. Shih CL, Chong KY, Hsu SC, Chien HJ, Ma CT, Chang JW, et al. Development of
a magnetic bead-based method for the collection of circulating extracellular vesicles. N
Biotechnol. 2016;33(1):116-22.
316. Nakai W, Yoshida T, Diez D, Miyatake Y, Nishibu T, Imawaka N, et al. A novel
affinity-based method for the isolation of highly purified extracellular vesicles. Sci Rep.
2016;6:33935.
317. Greening DW, Xu R, Gopal SK, Rai A, Simpson RJ. Proteomic insights into
extracellular vesicle biology - defining exosomes and shed microvesicles. Expert Rev
Proteomics. 2017;14(1):69-95.
318. Abramowicz A, Widlak P, Pietrowska M. Different Types of Cellular Stress Affect
the Proteome Composition of Small Extracellular Vesicles: A Mini Review. Proteomes.
2019;7(2).
319. Nyman TA, Lorey MB, Cypryk W, Matikainen S. Mass spectrometry-based
proteomic exploration of the human immune system: focus on the inflammasome, global
protein secretion, and T cells. Expert Rev Proteomics. 2017;14(5):395-407.
320. Bandu R, Oh JW, Kim KP. Mass spectrometry-based proteome profiling of
extracellular vesicles and their roles in cancer biology. Exp Mol Med. 2019;51(3):30.
321. Cvjetkovic A, Jang SC, Konecna B, Hoog JL, Sihlbom C, Lasser C, et al. Detailed
Analysis of Protein Topology of Extracellular Vesicles-Evidence of Unconventional
Membrane Protein Orientation. Sci Rep. 2016;6:36338.
322. Castillo J, Bernard V, San Lucas FA, Allenson K, Capello M, Kim DU, et al.
Surfaceome profiling enables isolation of cancer-specific exosomal cargo in liquid biopsies
from pancreatic cancer patients. Ann Oncol. 2018;29(1):223-9.
323. Hildonen S, Skarpen E, Halvorsen TG, Reubsaet L. Isolation and mass
spectrometry analysis of urinary extraexosomal proteins. Sci Rep. 2016;6:36331.
324. Zou G, Benktander JD, Gizaw ST, Gaunitz S, Novotny MV. Comprehensive
Analytical Approach toward Glycomic Characterization and Profiling in Urinary
Exosomes. Anal Chem. 2017;89(10):5364-72.
325. Bai H, Pan Y, Qi L, Liu L, Zhao X, Dong H, et al. Development a hydrazide-
functionalized thermosensitive polymer based homogeneous system for highly efficient N-
glycoprotein/glycopeptide enrichment from human plasma exosome. Talanta.
2018;186:513-20.
326. Llorente A, Skotland T, Sylvanne T, Kauhanen D, Rog T, Orlowski A, et al.
Molecular lipidomics of exosomes released by PC-3 prostate cancer cells. Biochim
Biophys Acta. 2013;1831(7):1302-9.
327. Brzozowski JS, Jankowski H, Bond DR, McCague SB, Munro BR, Predebon MJ,
et al. Lipidomic profiling of extracellular vesicles derived from prostate and prostate cancer
cell lines. Lipids Health Dis. 2018;17(1):211.
328. Haraszti RA, Didiot MC, Sapp E, Leszyk J, Shaffer SA, Rockwell HE, et al. High-
resolution proteomic and lipidomic analysis of exosomes and microvesicles from different
cell sources. J Extracell Vesicles. 2016;5:32570.
329. Skotland T, Ekroos K, Kauhanen D, Simolin H, Seierstad T, Berge V, et al.
Molecular lipid species in urinary exosomes as potential prostate cancer biomarkers. Eur J
Cancer. 2017;70:122-32.

323
330. Akagi T, Kato K, Kobayashi M, Kosaka N, Ochiya T, Ichiki T. On-chip
immunoelectrophoresis of extracellular vesicles released from human breast cancer cells.
PLoS One. 2015;10(4):e0123603.
331. Vaidyanathan R, Naghibosadat M, Rauf S, Korbie D, Carrascosa LG, Shiddiky MJ,
et al. Detecting exosomes specifically: a multiplexed device based on alternating current
electrohydrodynamic induced nanoshearing. Anal Chem. 2014;86(22):11125-32.
332. He M, Zeng Y. Microfluidic Exosome Analysis toward Liquid Biopsy for Cancer.
J Lab Autom. 2016;21(4):599-608.
333. Morales-Kastresana A, Jones JC. Flow Cytometric Analysis of Extracellular
Vesicles. Methods Mol Biol. 2017;1545:215-25.
334. Suarez H, Gamez-Valero A, Reyes R, Lopez-Martin S, Rodriguez MJ, Carrascosa
JL, et al. A bead-assisted flow cytometry method for the semi-quantitative analysis of
Extracellular Vesicles. Sci Rep. 2017;7(1):11271.
335. Wiklander OPB, Bostancioglu RB, Welsh JA, Zickler AM, Murke F, Corso G, et
al. Systematic Methodological Evaluation of a Multiplex Bead-Based Flow Cytometry
Assay for Detection of Extracellular Vesicle Surface Signatures. Front Immunol.
2018;9:1326.
336. Yoshioka Y, Kosaka N, Konishi Y, Ohta H, Okamoto H, Sonoda H, et al. Ultra-
sensitive liquid biopsy of circulating extracellular vesicles using ExoScreen. Nat Commun.
2014;5:3591.
337. Welsh JA, Holloway JA, Wilkinson JS, Englyst NA. Extracellular Vesicle Flow
Cytometry Analysis and Standardization. Front Cell Dev Biol. 2017;5:78.
338. Morales-Kastresana A, Telford B, Musich TA, McKinnon K, Clayborne C, Braig
Z, et al. Labeling Extracellular Vesicles for Nanoscale Flow Cytometry. Sci Rep.
2017;7(1):1878.
339. Groot Kormelink T, Arkesteijn GJ, Nauwelaers FA, van den Engh G, Nolte-'t Hoen
EN, Wauben MH. Prerequisites for the analysis and sorting of extracellular vesicle
subpopulations by high-resolution flow cytometry. Cytometry A. 2016;89(2):135-47.
340. Wang Y, Partridge A, Wu Y. In situ surface protein conjugation of small molecules
for SPR immunoassays. Anal Biochem. 2017;539:149-51.
341. Defaus S, Aviles M, Andreu D, Gutierrez-Gallego R. Lectin-Binding Specificity of
the Fertilization-Relevant Protein PDC-109 by Means of Surface Plasmon Resonance and
Carbohydrate REcognition Domain EXcision-Mass Spectrometry. Int J Mol Sci.
2018;19(4).
342. Zhou C, Zou H, Sun C, Ren D, Chen J, Li Y. Signal amplification strategies for
DNA-based surface plasmon resonance biosensors. Biosens Bioelectron. 2018;117:678-
89.
343. Liu C, Zeng X, An Z, Yang Y, Eisenbaum M, Gu X, et al. Sensitive Detection of
Exosomal Proteins via a Compact Surface Plasmon Resonance Biosensor for Cancer
Diagnosis. ACS Sens. 2018;3(8):1471-9.
344. Rupert DL, Lasser C, Eldh M, Block S, Zhdanov VP, Lotvall JO, et al.
Determination of exosome concentration in solution using surface plasmon resonance
spectroscopy. Anal Chem. 2014;86(12):5929-36.
345. Gool EL, Stojanovic I, Schasfoort RBM, Sturk A, van Leeuwen TG, Nieuwland R,
et al. Surface Plasmon Resonance is an Analytically Sensitive Method for Antigen
Profiling of Extracellular Vesicles. Clin Chem. 2017;63(10):1633-41.

324
346. Unser S, Bruzas I, He J, Sagle L. Localized Surface Plasmon Resonance
Biosensing: Current Challenges and Approaches. Sensors (Basel). 2015;15(7):15684-716.
347. Jiang Y, Shi M, Liu Y, Wan S, Cui C, Zhang L, et al. Aptamer/AuNP Biosensor
for Colorimetric Profiling of Exosomal Proteins. Angew Chem Int Ed Engl.
2017;56(39):11916-20.
348. Bellassai N, D'Agata R, Jungbluth V, Spoto G. Surface Plasmon Resonance for
Biomarker Detection: Advances in Non-invasive Cancer Diagnosis. Front Chem.
2019;7:570.
349. Thakur A, Qiu G, Ng SP, Guan J, Yue J, Lee Y, et al. Direct detection of two
different tumor-derived extracellular vesicles by SAM-AuNIs LSPR biosensor. Biosens
Bioelectron. 2017;94:400-7.
350. Wang Q, Zou L, Yang X, Liu X, Nie W, Zheng Y, et al. Direct quantification of
cancerous exosomes via surface plasmon resonance with dual gold nanoparticle-assisted
signal amplification. Biosens Bioelectron. 2019;135:129-36.
351. Wang Y, Irudayaraj J. Surface-enhanced Raman spectroscopy at single-molecule
scale and its implications in biology. Philos Trans R Soc Lond B Biol Sci.
2013;368(1611):20120026.
352. Wang Z, Zong S, Wu L, Zhu D, Cui Y. SERS-Activated Platforms for
Immunoassay: Probes, Encoding Methods, and Applications. Chem Rev.
2017;117(12):7910-63.
353. Carmicheal J, Hayashi C, Huang X, Liu L, Lu Y, Krasnoslobodtsev A, et al. Label-
free characterization of exosome via surface enhanced Raman spectroscopy for the early
detection of pancreatic cancer. Nanomedicine. 2019;16:88-96.
354. Stremersch S, Marro M, Pinchasik BE, Baatsen P, Hendrix A, De Smedt SC, et al.
Identification of Individual Exosome-Like Vesicles by Surface Enhanced Raman
Spectroscopy. Small. 2016;12(24):3292-301.
355. Fraire JC, Stremersch S, Bouckaert D, Monteyne T, De Beer T, Wuytens P, et al.
Improved Label-Free Identification of Individual Exosome-like Vesicles with Au@Ag
Nanoparticles as SERS Substrate. ACS Appl Mater Interfaces. 2019;11(43):39424-35.
356. Smolsky J, Kaur S, Hayashi C, Batra SK, Krasnoslobodtsev AV. Surface-Enhanced
Raman Scattering-Based Immunoassay Technologies for Detection of Disease
Biomarkers. Biosensors (Basel). 2017;7(1).
357. Kruglik SG, Royo F, Guigner JM, Palomo L, Seksek O, Turpin PY, et al. Raman
tweezers microspectroscopy of circa 100 nm extracellular vesicles. Nanoscale.
2019;11(4):1661-79.
358. Carney RP, Hazari S, Colquhoun M, Tran D, Hwang B, Mulligan MS, et al.
Multispectral Optical Tweezers for Biochemical Fingerprinting of CD9-Positive Exosome
Subpopulations. Anal Chem. 2017;89(10):5357-63.
359. Sandfeld-Paulsen B, Jakobsen KR, Baek R, Folkersen BH, Rasmussen TR,
Meldgaard P, et al. Exosomal Proteins as Diagnostic Biomarkers in Lung Cancer. J Thorac
Oncol. 2016;11(10):1701-10.
360. Jin D, Yang F, Zhang Y, Liu L, Zhou Y, Wang F, et al. ExoAPP: Exosome-
Oriented, Aptamer Nanoprobe-Enabled Surface Proteins Profiling and Detection. Anal
Chem. 2018;90(24):14402-11.

325
361. Liu C, Zhao J, Tian F, Chang J, Zhang W, Sun J. lambda-DNA- and Aptamer-
Mediated Sorting and Analysis of Extracellular Vesicles. J Am Chem Soc.
2019;141(9):3817-21.
362. Wu D, Yan J, Shen X, Sun Y, Thulin M, Cai Y, et al. Profiling surface proteins on
individual exosomes using a proximity barcoding assay. Nat Commun. 2019;10(1):3854.
363. Echevarria J, Royo F, Pazos R, Salazar L, Falcon-Perez JM, Reichardt NC.
Microarray-based identification of lectins for the purification of human urinary
extracellular vesicles directly from urine samples. Chembiochem. 2014;15(11):1621-6.
364. Feng Y, Guo Y, Li Y, Tao J, Ding L, Wu J, et al. Lectin-mediated in situ rolling
circle amplification on exosomes for probing cancer-related glycan pattern. Anal Chim
Acta. 2018;1039:108-15.
365. Lewis JM, Vyas AD, Qiu Y, Messer KS, White R, Heller MJ. Integrated Analysis
of Exosomal Protein Biomarkers on Alternating Current Electrokinetic Chips Enables
Rapid Detection of Pancreatic Cancer in Patient Blood. ACS Nano. 2018;12(4):3311-20.
366. Cavallaro S, Horak J, Haag P, Gupta D, Stiller C, Sahu SS, et al. Label-Free Surface
Protein Profiling of Extracellular Vesicles by an Electrokinetic Sensor. ACS Sens.
2019;4(5):1399-408.
367. Zhang H, Wang Z, Zhang Q, Wang F, Liu Y. Ti3C2 MXenes nanosheets catalyzed
highly efficient electrogenerated chemiluminescence biosensor for the detection of
exosomes. Biosens Bioelectron. 2019;124-125:184-90.
368. Liu C, Zhao J, Tian F, Cai L, Zhang W, Feng Q, et al. Low-cost thermophoretic
profiling of extracellular-vesicle surface proteins for the early detection and classification
of cancers. Nat Biomed Eng. 2019;3(3):183-93.
369. Kalluri R. The biology and function of exosomes in cancer. J Clin Invest.
2016;126(4):1208-15.
370. French KC, Antonyak MA, Cerione RA. Extracellular vesicle docking at the
cellular port: Extracellular vesicle binding and uptake. Semin Cell Dev Biol. 2017;67:48-
55.
371. Wang Q, Lu Q. Plasma membrane-derived extracellular microvesicles mediate
non-canonical intercellular NOTCH signaling. Nat Commun. 2017;8(1):709.
372. Tang X, Chang C, Guo J, Lincoln V, Liang C, Chen M, et al. Tumour-Secreted
Hsp90alpha on External Surface of Exosomes Mediates Tumour - Stromal Cell
Communication via Autocrine and Paracrine Mechanisms. Sci Rep. 2019;9(1):15108.
373. Menck K, Scharf C, Bleckmann A, Dyck L, Rost U, Wenzel D, et al. Tumor-
derived microvesicles mediate human breast cancer invasion through differentially
glycosylated EMMPRIN. J Mol Cell Biol. 2015;7(2):143-53.
374. Gabison EE, Hoang-Xuan T, Mauviel A, Menashi S. EMMPRIN/CD147, an MMP
modulator in cancer, development and tissue repair. Biochimie. 2005;87(3-4):361-8.
375. Elinav E, Nowarski R, Thaiss CA, Hu B, Jin C, Flavell RA. Inflammation-induced
cancer: crosstalk between tumours, immune cells and microorganisms. Nat Rev Cancer.
2013;13(11):759-71.
376. Hinshaw DC, Shevde LA. The Tumor Microenvironment Innately Modulates
Cancer Progression. Cancer Res. 2019;79(18):4557-66.
377. Yang X, Li Y, Zou L, Zhu Z. Role of Exosomes in Crosstalk Between Cancer-
Associated Fibroblasts and Cancer Cells. Front Oncol. 2019;9:356.

326
378. Han L, Lam EW, Sun Y. Extracellular vesicles in the tumor microenvironment: old
stories, but new tales. Mol Cancer. 2019;18(1):59.
379. Cerezo-Magana M, Bang-Rudenstam A, Belting M. The pleiotropic role of
proteoglycans in extracellular vesicle mediated communication in the tumor
microenvironment. Semin Cancer Biol. 2019.
380. Shelke GV, Yin Y, Jang SC, Lasser C, Wennmalm S, Hoffmann HJ, et al.
Endosomal signalling via exosome surface TGFbeta-1. J Extracell Vesicles.
2019;8(1):1650458.
381. Antonyak MA, Li B, Boroughs LK, Johnson JL, Druso JE, Bryant KL, et al. Cancer
cell-derived microvesicles induce transformation by transferring tissue transglutaminase
and fibronectin to recipient cells. Proc Natl Acad Sci U S A. 2011;108(12):4852-7.
382. Tang MKS, Yue PYK, Ip PP, Huang RL, Lai HC, Cheung ANY, et al. Soluble E-
cadherin promotes tumor angiogenesis and localizes to exosome surface. Nat Commun.
2018;9(1):2270.
383. Takasugi M, Okada R, Takahashi A, Virya Chen D, Watanabe S, Hara E. Small
extracellular vesicles secreted from senescent cells promote cancer cell proliferation
through EphA2. Nat Commun. 2017;8:15729.
384. Manini I, Ruaro ME, Sgarra R, Bartolini A, Caponnetto F, Ius T, et al. Semaphorin-
7A on Exosomes: A Promigratory Signal in the Glioma Microenvironment. Cancers
(Basel). 2019;11(6).
385. Chanda D, Otoupalova E, Hough KP, Locy ML, Bernard K, Deshane JS, et al.
Fibronectin on the Surface of Extracellular Vesicles Mediates Fibroblast Invasion. Am J
Respir Cell Mol Biol. 2019;60(3):279-88.
386. Shtam T, Naryzhny S, Samsonov R, Karasik D, Mizgirev I, Kopylov A, et al.
Plasma exosomes stimulate breast cancer metastasis through surface interactions and
activation of FAK signaling. Breast Cancer Res Treat. 2019;174(1):129-41.
387. Pickup MW, Mouw JK, Weaver VM. The extracellular matrix modulates the
hallmarks of cancer. EMBO Rep. 2014;15(12):1243-53.
388. Sanderson RD, Bandari SK, Vlodavsky I. Proteases and glycosidases on the surface
of exosomes: Newly discovered mechanisms for extracellular remodeling. Matrix Biol.
2019;75-76:160-9.
389. Harkonen K, Oikari S, Kyykallio H, Capra J, Hakkola S, Ketola K, et al. CD44s
Assembles Hyaluronan Coat on Filopodia and Extracellular Vesicles and Induces
Tumorigenicity of MKN74 Gastric Carcinoma Cells. Cells. 2019;8(3).
390. Yue S, Mu W, Erb U, Zoller M. The tetraspanins CD151 and Tspan8 are essential
exosome components for the crosstalk between cancer initiating cells and their
surrounding. Oncotarget. 2015;6(4):2366-84.
391. Bandari SK, Purushothaman A, Ramani VC, Brinkley GJ, Chandrashekar DS,
Varambally S, et al. Chemotherapy induces secretion of exosomes loaded with heparanase
that degrades extracellular matrix and impacts tumor and host cell behavior. Matrix Biol.
2018;65:104-18.
392. Costa-Silva B, Aiello NM, Ocean AJ, Singh S, Zhang H, Thakur BK, et al.
Pancreatic cancer exosomes initiate pre-metastatic niche formation in the liver. Nat Cell
Biol. 2015;17(6):816-26.
327
393. Hoshino A, Costa-Silva B, Shen TL, Rodrigues G, Hashimoto A, Tesic Mark M, et
al. Tumour exosome integrins determine organotropic metastasis. Nature.
2015;527(7578):329-35.
394. Zhao K, Wang Z, Hackert T, Pitzer C, Zoller M. Tspan8 and Tspan8/CD151
knockout mice unravel the contribution of tumor and host exosomes to tumor progression.
J Exp Clin Cancer Res. 2018;37(1):312.
395. Jimenez L, Yu H, McKenzie AJ, Franklin JL, Patton JG, Liu Q, et al. Quantitative
Proteomic Analysis of Small and Large Extracellular Vesicles (EVs) Reveals Enrichment
of Adhesion Proteins in Small EVs. J Proteome Res. 2019;18(3):947-59.
396. Karasu E, Eisenhardt SU, Harant J, Huber-Lang M. Extracellular Vesicles:
Packages Sent With Complement. Front Immunol. 2018;9:721.
397. Chaput N, Thery C. Exosomes: immune properties and potential clinical
implementations. Semin Immunopathol. 2011;33(5):419-40.
398. Sagini K, Costanzi E, Emiliani C, Buratta S, Urbanelli L. Extracellular Vesicles as
Conveyors of Membrane-Derived Bioactive Lipids in Immune System. Int J Mol Sci.
2018;19(4).
399. Park SJ, Kim JM, Kim J, Hur J, Park S, Kim K, et al. Molecular mechanisms of
biogenesis of apoptotic exosome-like vesicles and their roles as damage-associated
molecular patterns. Proc Natl Acad Sci U S A. 2018;115(50):E11721-E30.
400. Genschmer KR, Russell DW, Lal C, Szul T, Bratcher PE, Noerager BD, et al.
Activated PMN Exosomes: Pathogenic Entities Causing Matrix Destruction and Disease
in the Lung. Cell. 2019;176(1-2):113-26 e15.
401. Nair RR, Mazza D, Brambilla F, Gorzanelli A, Agresti A, Bianchi ME. LPS-
Challenged Macrophages Release Microvesicles Coated With Histones. Front Immunol.
2018;9:1463.
402. Chauhan S, Danielson S, Clements V, Edwards N, Ostrand-Rosenberg S, Fenselau
C. Surface Glycoproteins of Exosomes Shed by Myeloid-Derived Suppressor Cells
Contribute to Function. J Proteome Res. 2017;16(1):238-46.
403. Schaper F, van Spriel AB. Antitumor Immunity Is Controlled by Tetraspanin
Proteins. Front Immunol. 2018;9:1185.
404. Oksvold MP, Kullmann A, Forfang L, Kierulf B, Li M, Brech A, et al. Expression
of B-cell surface antigens in subpopulations of exosomes released from B-cell lymphoma
cells. Clin Ther. 2014;36(6):847-62 e1.
405. Chen G, Huang AC, Zhang W, Zhang G, Wu M, Xu W, et al. Exosomal PD-L1
contributes to immunosuppression and is associated with anti-PD-1 response. Nature.
2018;560(7718):382-6.
406. Ricklefs FL, Alayo Q, Krenzlin H, Mahmoud AB, Speranza MC, Nakashima H, et
al. Immune evasion mediated by PD-L1 on glioblastoma-derived extracellular vesicles. Sci
Adv. 2018;4(3):eaar2766.
407. Poggio M, Hu T, Pai CC, Chu B, Belair CD, Chang A, et al. Suppression of
Exosomal PD-L1 Induces Systemic Anti-tumor Immunity and Memory. Cell.
2019;177(2):414-27 e13.
408. Muller L, Simms P, Hong CS, Nishimura MI, Jackson EK, Watkins SC, et al.
Human tumor-derived exosomes (TEX) regulate Treg functions via cell surface signaling
rather than uptake mechanisms. Oncoimmunology. 2017;6(8):e1261243.

328
409. Siravegna G, Marsoni S, Siena S, Bardelli A. Integrating liquid biopsies into the
management of cancer. Nat Rev Clin Oncol. 2017;14(9):531-48.
410. Advancing Cancer Screening with Liquid Biopsies. Cancer Discov. 2018;8(3):256.
411. Osti D, Del Bene M, Rappa G, Santos M, Matafora V, Richichi C, et al. Clinical
Significance of Extracellular Vesicles in Plasma from Glioblastoma Patients. Clin Cancer
Res. 2019;25(1):266-76.
412. Lee J, McKinney KQ, Pavlopoulos AJ, Niu M, Kang JW, Oh JW, et al. Altered
Proteome of Extracellular Vesicles Derived from Bladder Cancer Patients Urine. Mol
Cells. 2018;41(3):179-87.
413. Wang X. Isolation of Extracellular Vesicles from Breast Milk. Methods Mol Biol.
2017;1660:351-3.
414. Vojtech L, Zhang M, Dave V, Levy C, Hughes SM, Wang R, et al. Extracellular
vesicles in human semen modulate antigen-presenting cell function and decrease
downstream antiviral T cell responses. PLoS One. 2019;14(10):e0223901.
415. Yokoi A, Yoshioka Y, Yamamoto Y, Ishikawa M, Ikeda SI, Kato T, et al.
Malignant extracellular vesicles carrying MMP1 mRNA facilitate peritoneal dissemination
in ovarian cancer. Nat Commun. 2017;8:14470.
416. Carnino JM, Lee H, Jin Y. Isolation and characterization of extracellular vesicles
from Broncho-alveolar lavage fluid: a review and comparison of different methods. Respir
Res. 2019;20(1):240.
417. Alvarez-Erviti L, Seow Y, Yin H, Betts C, Lakhal S, Wood MJ. Delivery of siRNA
to the mouse brain by systemic injection of targeted exosomes. Nat Biotechnol.
2011;29(4):341-5.
418. Vallabhajosyula P, Korutla L, Habertheuer A, Yu M, Rostami S, Yuan CX, et al.
Tissue-specific exosome biomarkers for noninvasively monitoring immunologic rejection
of transplanted tissue. J Clin Invest. 2017;127(4):1375-91.
419. Sandfeld-Paulsen B, Aggerholm-Pedersen N, Baek R, Jakobsen KR, Meldgaard P,
Folkersen BH, et al. Exosomal proteins as prognostic biomarkers in non-small cell lung
cancer. Mol Oncol. 2016;10(10):1595-602.
420. Belov L, Matic KJ, Hallal S, Best OG, Mulligan SP, Christopherson RI. Extensive
surface protein profiles of extracellular vesicles from cancer cells may provide diagnostic
signatures from blood samples. J Extracell Vesicles. 2016;5:25355.
421. Melo SA, Luecke LB, Kahlert C, Fernandez AF, Gammon ST, Kaye J, et al.
Glypican-1 identifies cancer exosomes and detects early pancreatic cancer. Nature.
2015;523(7559):177-82.
422. Indira Chandran V, Welinder C, Mansson AS, Offer S, Freyhult E, Pernemalm M,
et al. Ultrasensitive Immunoprofiling of Plasma Extracellular Vesicles Identifies
Syndecan-1 as a Potential Tool for Minimally Invasive Diagnosis of Glioma. Clin Cancer
Res. 2019;25(10):3115-27.
423. Xu R, Greening DW, Chen M, Rai A, Ji H, Takahashi N, et al. Surfaceome of
Exosomes Secreted from the Colorectal Cancer Cell Line SW480: Peripheral and Integral
Membrane Proteins Analyzed by Proteolysis and TX114. Proteomics.
2019;19(8):e1700453.
424. Logozzi M, De Milito A, Lugini L, Borghi M, Calabro L, Spada M, et al. High
levels of exosomes expressing CD63 and caveolin-1 in plasma of melanoma patients. PLoS
One. 2009;4(4):e5219.

329
425. Tian Y, Ma L, Gong M, Su G, Zhu S, Zhang W, et al. Protein Profiling and Sizing
of Extracellular Vesicles from Colorectal Cancer Patients via Flow Cytometry. ACS Nano.
2018;12(1):671-80.
426. Yang KS, Im H, Hong S, Pergolini I, Del Castillo AF, Wang R, et al.
Multiparametric plasma EV profiling facilitates diagnosis of pancreatic malignancy. Sci
Transl Med. 2017;9(391).
427. Liang K, Liu F, Fan J, Sun D, Liu C, Lyon CJ, et al. Nanoplasmonic Quantification
of Tumor-derived Extracellular Vesicles in Plasma Microsamples for Diagnosis and
Treatment Monitoring. Nat Biomed Eng. 2017;1.
428. Pinho SS, Reis CA. Glycosylation in cancer: mechanisms and clinical implications.
Nat Rev Cancer. 2015;15(9):540-55.
429. Drake RR. Glycosylation and cancer: moving glycomics to the forefront. Adv
Cancer Res. 2015;126:1-10.
430. Costa J. Glycoconjugates from extracellular vesicles: Structures, functions and
emerging potential as cancer biomarkers. Biochim Biophys Acta Rev Cancer.
2017;1868(1):157-66.
431. Sakaue T, Koga H, Iwamoto H, Nakamura T, Ikezono Y, Abe M, et al.
Glycosylation of ascites-derived exosomal CD133: a potential prognostic biomarker in
patients with advanced pancreatic cancer. Med Mol Morphol. 2019;52(4):198-208.
432. Surman M, Hoja-Lukowicz D, Szwed S, Drozdz A, Stepien E, Przybylo M. Human
melanoma-derived ectosomes are enriched with specific glycan epitopes. Life Sci.
2018;207:395-411.
433. Vermassen T, D'Herde K, Jacobus D, Van Praet C, Poelaert F, Lumen N, et al.
Release of urinary extracellular vesicles in prostate cancer is associated with altered urinary
N-glycosylation profile. J Clin Pathol. 2017;70(10):838-46.
434. Goldbloom R, Battista RN, Haggerty J. Periodic health examination, 1989 update:
1. Introduction [corrected]. CMAJ. 1989;141(3):205-7.
435. Shin H, Jeong H, Park J, Hong S, Choi Y. Correlation between Cancerous
Exosomes and Protein Markers Based on Surface-Enhanced Raman Spectroscopy (SERS)
and Principal Component Analysis (PCA). ACS Sens. 2018;3(12):2637-43.
436. Park J, Hwang M, Choi B, Jeong H, Jung JH, Kim HK, et al. Exosome
Classification by Pattern Analysis of Surface-Enhanced Raman Spectroscopy Data for
Lung Cancer Diagnosis. Anal Chem. 2017;89(12):6695-701.
437. Ferreira N, Marques A, Aguas H, Bandarenka H, Martins R, Bodo C, et al. Label-
Free Nanosensing Platform for Breast Cancer Exosome Profiling. ACS Sens.
2019;4(8):2073-83.
438. Lee W, Nanou A, Rikkert L, Coumans FAW, Otto C, Terstappen L, et al. Label-
Free Prostate Cancer Detection by Characterization of Extracellular Vesicles Using Raman
Spectroscopy. Anal Chem. 2018;90(19):11290-6.
439. Vader P, Mol EA, Pasterkamp G, Schiffelers RM. Extracellular vesicles for drug
delivery. Adv Drug Deliv Rev. 2016;106(Pt A):148-56.
440. Didiot MC, Haraszti RA, Aronin N, Khvorova A. Loading of Extracellular Vesicles
with Hydrophobically Modified siRNAs. Methods Mol Biol. 2018;1740:199-214.
441. S ELA, Mager I, Breakefield XO, Wood MJ. Extracellular vesicles: biology and
emerging therapeutic opportunities. Nat Rev Drug Discov. 2013;12(5):347-57.

330
442. Charoenviriyakul C, Takahashi Y, Morishita M, Nishikawa M, Takakura Y. Role
of Extracellular Vesicle Surface Proteins in the Pharmacokinetics of Extracellular Vesicles.
Mol Pharm. 2018;15(3):1073-80.
443. Rana S, Yue S, Stadel D, Zoller M. Toward tailored exosomes: the exosomal
tetraspanin web contributes to target cell selection. Int J Biochem Cell Biol.
2012;44(9):1574-84.
444. Stanisic A, Kries H. Adenylation Domains in Nonribosomal Peptide Engineering.
Chembiochem. 2019;20(11):1347-56.
445. Li Y, Gao Y, Gong C, Wang Z, Xia Q, Gu F, et al. A33 antibody-functionalized
exosomes for targeted delivery of doxorubicin against colorectal cancer. Nanomedicine.
2018;14(7):1973-85.
446. Kim MS, Haney MJ, Zhao Y, Mahajan V, Deygen I, Klyachko NL, et al.
Development of exosome-encapsulated paclitaxel to overcome MDR in cancer cells.
Nanomedicine. 2016;12(3):655-64.
447. Zhang YF, Shi JB, Li C. Small extracellular vesicle loading systems in cancer
therapy: Current status and the way forward. Cytotherapy. 2019;21(11):1122-36.
448. Kooijmans SAA, Schiffelers RM, Zarovni N, Vago R. Modulation of tissue tropism
and biological activity of exosomes and other extracellular vesicles: New nanotools for
cancer treatment. Pharmacol Res. 2016;111:487-500.
449. Si Y, Kim S, Zhang E, Tang Y, Jaskula-Sztul R, Markert JM, et al. Targeted
Exosomes for Drug Delivery: Biomanufacturing, Surface Tagging, and Validation.
Biotechnol J. 2020;15(1):e1900163.
450. Yerneni SS, Lathwal S, Shrestha P, Shirwan H, Matyjaszewski K, Weiss L, et al.
Rapid On-Demand Extracellular Vesicle Augmentation with Versatile Oligonucleotide
Tethers. ACS Nano. 2019;13(9):10555-65.
451. Suk JS, Xu Q, Kim N, Hanes J, Ensign LM. PEGylation as a strategy for improving
nanoparticle-based drug and gene delivery. Adv Drug Deliv Rev. 2016;99(Pt A):28-51.
452. Kooijmans SA, Aleza CG, Roffler SR, van Solinge WW, Vader P, Schiffelers RM.
Display of GPI-anchored anti-EGFR nanobodies on extracellular vesicles promotes tumour
cell targeting. J Extracell Vesicles. 2016;5:31053.
453. Zheng Z, Li Z, Xu C, Guo B, Guo P. Folate-displaying exosome mediated cytosolic
delivery of siRNA avoiding endosome trapping. J Control Release. 2019;311-312:43-9.
454. Tan A, De La Pena H, Seifalian AM. The application of exosomes as a nanoscale
cancer vaccine. Int J Nanomedicine. 2010;5:889-900.
455. Delcayre A, Estelles A, Sperinde J, Roulon T, Paz P, Aguilar B, et al. Exosome
Display technology: applications to the development of new diagnostics and therapeutics.
Blood Cells Mol Dis. 2005;35(2):158-68.
456. Hartman ZC, Wei J, Glass OK, Guo H, Lei G, Yang XY, et al. Increasing vaccine
potency through exosome antigen targeting. Vaccine. 2011;29(50):9361-7.
457. Horrevorts SK, Stolk DA, van de Ven R, Hulst M, van Het Hof B, Duinkerken S,
et al. Glycan-Modified Apoptotic Melanoma-Derived Extracellular Vesicles as Antigen
Source for Anti-Tumor Vaccination. Cancers (Basel). 2019;11(9).
458. Carney RP, Hazari S, Rojalin T, Knudson A, Gao T, Tang Y, et al. Targeting
Tumor-Associated Exosomes with Integrin-Binding Peptides. Adv Biosyst. 2017;1(5).
459. Cai Z, Yang F, Yu L, Yu Z, Jiang L, Wang Q, et al. Activated T cell exosomes
promote tumor invasion via Fas signaling pathway. J Immunol. 2012;188(12):5954-61.

331
460. Sohal DP, Mangu PB, Laheru D. Metastatic Pancreatic Cancer: American Society
of Clinical Oncology Clinical Practice Guideline Summary. J Oncol Pract. 2017;13(4):261-
4.
461. Chang JC, Kundranda M. Novel Diagnostic and Predictive Biomarkers in
Pancreatic Adenocarcinoma. Int J Mol Sci. 2017;18(3).
462. Kowal J, Tkach M, Thery C. Biogenesis and secretion of exosomes. Curr Opin Cell
Biol. 2014;29:116-25.
463. Chen Y, Pfeifer A. Brown Fat-Derived Exosomes: Small Vesicles with Big Impact.
Cell Metab. 2017;25(4):759-60.
464. Shrivastava S, Devhare P, Sujijantarat N, Steele R, Kwon YC, Ray R, et al.
Knockdown of Autophagy Inhibits Infectious Hepatitis C Virus Release by the Exosomal
Pathway. J Virol. 2016;90(3):1387-96.
465. Maybruck BT, Pfannenstiel LW, Diaz-Montero M, Gastman BR. Tumor-derived
exosomes induce CD8(+) T cell suppressors. J Immunother Cancer. 2017;5(1):65.
466. Liu Y, Cao X. Organotropic metastasis: role of tumor exosomes. Cell Res.
2016;26(2):149-50.
467. Soung YH, Nguyen T, Cao H, Lee J, Chung J. Emerging roles of exosomes in
cancer invasion and metastasis. BMB Rep. 2016;49(1):18-25.
468. Moravec R, Divi R, Verma M. Detecting circulating tumor material and digital
pathology imaging during pancreatic cancer progression. World J Gastrointest Oncol.
2017;9(6):235-50.
469. Jin H, Wu Y, Tan X. The role of pancreatic cancer-derived exosomes in cancer
progress and their potential application as biomarkers. Clin Transl Oncol. 2017;19(8):921-
30.
470. Madhavan B, Yue S, Galli U, Rana S, Gross W, Muller M, et al. Combined
evaluation of a panel of protein and miRNA serum-exosome biomarkers for pancreatic
cancer diagnosis increases sensitivity and specificity. Int J Cancer. 2015;136(11):2616-27.
471. Zhao K, Liang G, Sun X, Guan le L. Comparative miRNAome analysis revealed
different miRNA expression profiles in bovine sera and exosomes. BMC Genomics.
2016;17(1):630.
472. Huang X, Yuan T, Tschannen M, Sun Z, Jacob H, Du M, et al. Characterization of
human plasma-derived exosomal RNAs by deep sequencing. BMC Genomics.
2013;14:319.
473. Sun Y, Liu S, Qiao Z, Shang Z, Xia Z, Niu X, et al. Systematic comparison of
exosomal proteomes from human saliva and serum for the detection of lung cancer. Anal
Chim Acta. 2017;982:84-95.
474. Butz H, Nofech-Mozes R, Ding Q, Khella HWZ, Szabo PM, Jewett M, et al.
Exosomal MicroRNAs Are Diagnostic Biomarkers and Can Mediate Cell-Cell
Communication in Renal Cell Carcinoma. Eur Urol Focus. 2016;2(2):210-8.
475. Auner GW, Koya SK, Huang C, Broadbent B, Trexler M, Auner Z, et al.
Applications of Raman spectroscopy in cancer diagnosis. Cancer Metastasis Rev.
2018;37(4):691-717.
476. Carey PR, Heidari-Torkabadi H. New techniques in antibiotic discovery and
resistance: Raman spectroscopy. Ann N Y Acad Sci. 2015;1354:67-81.
477. Etchegoin PG, Le Ru EC. A perspective on single molecule SERS: current status
and future challenges. Phys Chem Chem Phys. 2008;10(40):6079-89.

332
478. Li L, Hutter T, Steiner U, Mahajan S. Single molecule SERS and detection of
biomolecules with a single gold nanoparticle on a mirror junction. Analyst.
2013;138(16):4574-8.
479. Lee C, Carney RP, Hazari S, Smith ZJ, Knudson A, Robertson CS, et al. 3D
plasmonic nanobowl platform for the study of exosomes in solution. Nanoscale.
2015;7(20):9290-7.
480. Noble JM, Roberts LM, Vidavsky N, Chiou AE, Fischbach C, Paszek MJ, et al.
Direct comparison of optical and electron microscopy methods for structural
characterization of extracellular vesicles. J Struct Biol. 2020:107474.
481. Singh SP, Deshmukh A, Chaturvedi P, Krishna CM. Raman spectroscopy in head
and neck cancers: toward oncological applications. J Cancer Res Ther. 2012;8 Suppl
1:S126-32.
482. Wang H, Wang X, Wang J, Fu W, Yao C. A SPR biosensor based on signal
amplification using antibody-QD conjugates for quantitative determination of multiple
tumor markers. Sci Rep. 2016;6:33140.
483. Arya SK, Zhurauski P, Jolly P, Batistuti MR, Mulato M, Estrela P. Capacitive
aptasensor based on interdigitated electrode for breast cancer detection in undiluted human
serum. Biosens Bioelectron. 2018;102:106-12.
484. Makler A, Asghar W. Exosomal biomarkers for cancer diagnosis and patient
monitoring. Expert Rev Mol Diagn. 2020.
485. Fan Y, Duan X, Zhao M, Wei X, Wu J, Chen W, et al. High-sensitive and multiplex
biosensing assay of NSCLC-derived exosomes via different recognition sites based on
SPRi array. Biosens Bioelectron. 2020;154:112066.
486. Cho S, Yang HC, Rhee WJ. Simultaneous multiplexed detection of exosomal
microRNAs and surface proteins for prostate cancer diagnosis. Biosens Bioelectron.
2019;146:111749.
487. Daassi D, Mahoney KM, Freeman GJ. The importance of exosomal PDL1 in
tumour immune evasion. Nat Rev Immunol. 2020.
488. Pace KR, Dutt R, Galileo DS. Exosomal L1CAM Stimulates Glioblastoma Cell
Motility, Proliferation, and Invasiveness. Int J Mol Sci. 2019;20(16).
489. Jahan R, Ganguly K, Smith LM, Atri P, Carmicheal J, Sheinin Y, et al. Trefoil
factor(s) and CA19.9: A promising panel for early detection of pancreatic cancer.
EBioMedicine. 2019;42:375-85.
490. Zhang J, Wang Y, Zhao T, Li Y, Tian L, Zhao J, et al. Evaluation of serum
MUC5AC in combination with CA19-9 for the diagnosis of pancreatic cancer. World J
Surg Oncol. 2020;18(1):31.
491. van Manen L, Groen JV, Putter H, Vahrmeijer AL, Swijnenburg RJ, Bonsing BA,
et al. Elevated CEA and CA19-9 serum levels independently predict advanced pancreatic
cancer at diagnosis. Biomarkers. 2020:1-8.
492. Ballehaninna UK, Chamberlain RS. The clinical utility of serum CA 19-9 in the
diagnosis, prognosis and management of pancreatic adenocarcinoma: An evidence based
appraisal. J Gastrointest Oncol. 2012;3(2):105-19.
493. Ozawa PMM, Vieira E, Lemos DS, Souza ILM, Zanata SM, Pankievicz VC, et al.
Identification of miRNAs Enriched in Extracellular Vesicles Derived from Serum Samples
of Breast Cancer Patients. Biomolecules. 2020;10(1).

333
494. Giron F, Alcantar D. Looks can be Deceiving: A Case Report on the Clinical Value
of CA 19-9 in Obstructive Jaundice. Cureus. 2020;12(1):e6637.
495. Kato S, Honda K. CA19-9 as a therapeutic target in pancreatitis. Ann Transl Med.
2019;7(Suppl 8):S318.
496. Dixon SJ, Lemberg KM, Lamprecht MR, Skouta R, Zaitsev EM, Gleason CE, et
al. Ferroptosis: an iron-dependent form of nonapoptotic cell death. Cell. 2012;149(5):1060-
72.
497. Neoptolemos JP, Kleeff J, Michl P, Costello E, Greenhalf W, Palmer DH.
Therapeutic developments in pancreatic cancer: current and future perspectives. Nat Rev
Gastroenterol Hepatol. 2018;15(6):333-48.
498. Stockwell BR, Friedmann Angeli JP, Bayir H, Bush AI, Conrad M, Dixon SJ, et al.
Ferroptosis: A Regulated Cell Death Nexus Linking Metabolism, Redox Biology, and
Disease. Cell. 2017;171(2):273-85.
499. Yang WS, SriRamaratnam R, Welsch ME, Shimada K, Skouta R, Viswanathan VS,
et al. Regulation of ferroptotic cancer cell death by GPX4. Cell. 2014;156(1-2):317-31.
500. Forcina GC, Dixon SJ. GPX4 at the Crossroads of Lipid Homeostasis and
Ferroptosis. Proteomics. 2019;19(18):e1800311.
501. Wang L, Liu Y, Du T, Yang H, Lei L, Guo M, et al. ATF3 promotes erastin-induced
ferroptosis by suppressing system Xc(). Cell Death Differ. 2020;27(2):662-75.
502. Hajdinak P, Czobor A, Szarka A. The potential role of acrolein in plant ferroptosis-
like cell death. PLoS One. 2019;14(12):e0227278.
503. Roh JL, Kim EH, Jang HJ, Park JY, Shin D. Induction of ferroptotic cell death for
overcoming cisplatin resistance of head and neck cancer. Cancer Lett. 2016;381(1):96-103.
504. Lei G, Zhang Y, Koppula P, Liu X, Zhang J, Lin SH, et al. The role of ferroptosis
in ionizing radiation-induced cell death and tumor suppression. Cell Res. 2020;30(2):146-
62.
505. Ye LF, Chaudhary KR, Zandkarimi F, Harken AD, Kinslow CJ, Upadhyayula PS,
et al. Radiation-Induced Lipid Peroxidation Triggers Ferroptosis and Synergizes with
Ferroptosis Inducers. ACS Chem Biol. 2020;15(2):469-84.
506. Yang H, Villani RM, Wang H, Simpson MJ, Roberts MS, Tang M, et al. The role
of cellular reactive oxygen species in cancer chemotherapy. J Exp Clin Cancer Res.
2018;37(1):266.
507. Malla JA, Umesh RM, Yousf S, Mane S, Sharma S, Lahiri M, et al. A Glutathione
Activatable Ion Channel Induces Apoptosis in Cancer Cells by Depleting Intracellular
Glutathione Levels. Angew Chem Int Ed Engl. 2020.
508. Yang H, Xiang S, Kazi A, Sebti SM. The GTPase KRAS suppresses the P53 tumor
suppressor by activating the NRF2-regulated antioxidant defense system in cancer cells. J
Biol Chem. 2020.
509. Hu K, Li K, Lv J, Feng J, Chen J, Wu H, et al. Suppression of the
SLC7A11/glutathione axis causes synthetic lethality in KRAS-mutant lung
adenocarcinoma. J Clin Invest. 2019.
510. Koppula P, Zhang Y, Zhuang L, Gan B. Amino acid transporter SLC7A11/xCT at
the crossroads of regulating redox homeostasis and nutrient dependency of cancer. Cancer
Commun (Lond). 2018;38(1):12.

334
511. Gu Y, Albuquerque CP, Braas D, Zhang W, Villa GR, Bi J, et al. mTORC2
Regulates Amino Acid Metabolism in Cancer by Phosphorylation of the Cystine-
Glutamate Antiporter xCT. Mol Cell. 2017;67(1):128-38 e7.
512. Hassannia B, Wiernicki B, Ingold I, Qu F, Van Herck S, Tyurina YY, et al. Nano-
targeted induction of dual ferroptotic mechanisms eradicates high-risk neuroblastoma. J
Clin Invest. 2018;128(8):3341-55.
513. Viswanathan VS, Ryan MJ, Dhruv HD, Gill S, Eichhoff OM, Seashore-Ludlow B,
et al. Dependency of a therapy-resistant state of cancer cells on a lipid peroxidase pathway.
Nature. 2017;547(7664):453-7.
514. Chatterjee A, Kosmacek EA, Oberley-Deegan RE. MnTE-2-PyP Treatment, or
NOX4 Inhibition, Protects against Radiation-Induced Damage in Mouse Primary Prostate
Fibroblasts by Inhibiting the TGF-Beta 1 Signaling Pathway. Radiat Res. 2017;187(3):367-
81.
515. Cao JY, Dixon SJ. Mechanisms of ferroptosis. Cell Mol Life Sci. 2016;73(11-
12):2195-209.
516. Cheng J, Fan YQ, Liu BH, Zhou H, Wang JM, Chen QX. ACSL4 suppresses
glioma cells proliferation via activating ferroptosis. Oncol Rep. 2020;43(1):147-58.
517. Yang Y, Luo M, Zhang K, Zhang J, Gao T, Connell DO, et al. Nedd4 ubiquitylates
VDAC2/3 to suppress erastin-induced ferroptosis in melanoma. Nat Commun.
2020;11(1):433.
518. Gao M, Monian P, Pan Q, Zhang W, Xiang J, Jiang X. Ferroptosis is an autophagic
cell death process. Cell Res. 2016;26(9):1021-32.
519. Sun X, Ou Z, Xie M, Kang R, Fan Y, Niu X, et al. HSPB1 as a novel regulator of
ferroptotic cancer cell death. Oncogene. 2015;34(45):5617-25.
520. Habib E, Linher-Melville K, Lin HX, Singh G. Expression of xCT and activity of
system xc(-) are regulated by NRF2 in human breast cancer cells in response to oxidative
stress. Redox Biol. 2015;5:33-42.
521. Joo MS, Kim WD, Lee KY, Kim JH, Koo JH, Kim SG. AMPK Facilitates Nuclear
Accumulation of Nrf2 by Phosphorylating at Serine 550. Mol Cell Biol. 2016;36(14):1931-
42.
522. Yoo MH, Gu X, Xu XM, Kim JY, Carlson BA, Patterson AD, et al. Delineating the
role of glutathione peroxidase 4 in protecting cells against lipid hydroperoxide damage and
in Alzheimer's disease. Antioxid Redox Signal. 2010;12(7):819-27.
523. Souchek JJ, Baine MJ, Lin C, Rachagani S, Gupta S, Kaur S, et al. Unbiased
analysis of pancreatic cancer radiation resistance reveals cholesterol biosynthesis as a novel
target for radiosensitisation. Br J Cancer. 2014;111(6):1139-49.
524. Lee SQ, Tan TS, Kawamukai M, Chen ES. Cellular factories for coenzyme Q10
production. Microb Cell Fact. 2017;16(1):39.
525. Bersuker K, Hendricks JM, Li Z, Magtanong L, Ford B, Tang PH, et al. The CoQ
oxidoreductase FSP1 acts parallel to GPX4 to inhibit ferroptosis. Nature.
2019;575(7784):688-92.
526. Chen G, Guo G, Zhou X, Chen H. Potential mechanism of ferroptosis in pancreatic
cancer. Oncol Lett. 2020;19(1):579-87.
527. Zhang X, Xing X, Liu H, Feng J, Tian M, Chang S, et al. Ionizing radiation induces
ferroptosis in granulocyte-macrophage hematopoietic progenitor cells of murine bone
marrow. Int J Radiat Biol. 2020:1-12.

335
528. Shi ZZ, Fan ZW, Chen YX, Xie XF, Jiang W, Wang WJ, et al. Ferroptosis in
Carcinoma: Regulatory Mechanisms and New Method for Cancer Therapy. Onco Targets
Ther. 2019;12:11291-304.
529. Lang X, Green MD, Wang W, Yu J, Choi JE, Jiang L, et al. Radiotherapy and
Immunotherapy Promote Tumoral Lipid Oxidation and Ferroptosis via Synergistic
Repression of SLC7A11. Cancer Discov. 2019;9(12):1673-85.

336
Publications
1. Ryckman JM, Baine M, Carmicheal J, Osayande F, Sleightholm R, Samson K,
Zheng D, Zhen W, Lin C, Zhang C. Correlation of dosimetric factors with the
development of symptomatic radiation pneumonitis in stereotactic body
radiotherapy. Radiation Oncology, 2020 Feb 13;15(1):33.
2. Carmicheal J*, Atri P*, Sharma S*, Sushil Kumar Ph.D., Ramakanth Chirravuri
Venkata Ph.D., Prakash Kulkarni Ph.D., Ravi Salgia M.D., Ph.D., Dario Ghersi
Ph.D., Sukhwinder KaurPh.D., Surinder K. Batra Ph.D. Presence and structure-
activity relationship of intrinsically disordered regions across mucins. FASEB
Journal, 2020 Feb;34(2):1939-1957. (*Equal contributions)
3. Carmicheal J, Asish Patel, Vipin Dalal, Pranita Atri, Amaninder S. Dhaliwal, Uwe
A. Wittel, Mokenge P. Malafa, Geoffrey Talmon, Benjamin J. Swanson, Shailender
Singh, Maneesh Jain, Sukhwinder Kaur, and Surinder K. Batra. Elevating
pancreatic cystic lesion stratification: Current and future pancreatic cancer
biomarker(s). Biochimica et Biophysica Acta (BBA) Reviews on Cancer, 2020
Jan;1873(1):188318.
4. Dalal V, Carmicheal J, Dhaliwal A, Jain M, Kaur S, Batra SK. Radiomics in
stratification of pancreatic cystic lesions: Machine learning in action. Cancer
Letters, 2020 Jan 28;469:228-237.
5. Jahan R, Ganguly K, Smith LM, Atri P, Carmicheal J, Sheinin Y, Rachagani S,
Natarajan G, Brand RE, Macha MA, Grandgenett PM, Kaur S, Batra SK. Trefoil
factor(s) and CA19.9: A promising panel for early detection of pancreatic cancer.
EBiomedicine, 2019 Apr;42:375-385.
6. Carmicheal J*, Hiyashi C*, Huang X*, Liu L, Yao Lu, Krosnoslobotstev A,
Lushnikov A, Patel A, Lu Y, Kaur S, Batra SK. Label free exosome
characterization via surface enhanced Raman spectroscopy for the early detection
of pancreatic cancer. Nanomedicine: Nanotechnology, Biology and Medicine,
2019 Feb;16:88-96. (*Equal contributions)
7. Verma I, Ganguly K, Sharma S, Carmicheal J, Kaur S, Batra SK, Bhasin MK.
Systems Biology Approach to Identify Novel Genomic Determinants for Pancreatic
Cancer Pathogenesis, Scientific Reports, 2019 Jan 15;9(1):123.
8. Carmicheal J, Kaur S, Batra SK, Ganti A. Hunting for transcription factors:
STAT3 decoy in non-small cell lung cancer. Translational Lung Cancer
Research, 2018 Sep;7(Suppl 3):S254-S257.

337
Articles near submission
1. Carmicheal J, Atri P, Seas A, Satyanarayana R, Seshacharyulu P, Souchek J,
Rauth S, Leon F, Prajapati D, Reid W, Talmon GA, Li S, Lin C, Ponnusamy MP,
Kaur S, Batra SK. Radiation potentiation via SLC7A11 inhibition induced
ferroptosis in pancreatic ductal adenocarcinoma. (Near submission)
2. Carmicheal J, Hiyashi C, Atri P, Kaur S, Batra SK. Extracellular vesicle
surfaceome characterization for the early detection of pancreatic ductal
adenocarcinoma. (Near submission)
3. Carmicheal J, Kaur S, Batra SK. Judging a vesicle by its cover: Investigations of
the extracellular vesicle surfaceome. (Near submission).
4. File N*, Carmicheal J*, Krosnoslobotstev A, Kshirsagar P, Junker W, Japp N,
Chakravarty S, Kaur S, Batra SK, Raman reporter molecule selection predicated
on inductive effect and Hammett constant. (*Equal contributions, Near
submission)
5. Lakshmanan I, Gupta R, Seshacharyulu P, Vengoji R, Rachagani S, Carmicheal J,
Jahan R, Atri P, Venkata Ramakanth C, Marimuthu S, Perumal N, Rauth S, Kaur
S, Smith LM, Lele SM, Ponnusamy MP, Ganti AK, Batra SK. ST6GalNAc-I alters
MUC5AC Sialylation to promote lung cancer liver metastasis. (Near submission)