Scale Metabolic Models in Pancreatic Ductal ...
45
I Utilization of Cancer-Specific Genome- Scale Metabolic Models in Pancreatic Ductal Adenocarcinomas for Biomarkers Discovery and Patient Stratification Master Degree Project in Systems Biology A2E 60 credits/ECTS Spring term 2019 Mohamed Al Shobky [email protected] Supervisor: Adil Mardinoglu, Professor of Systems Biology King’s College London, UK [email protected] Examiner: Andreas Tilevik, Senior Lecturer in Bioscience School of Bioscience, Skovde university [email protected]
-
Upload
khangminh22 -
Category
Documents
-
view
0 -
download
0
Transcript of Scale Metabolic Models in Pancreatic Ductal ...

I
Utilization of Cancer-Specific Genome-Scale Metabolic Models in Pancreatic Ductal Adenocarcinomas for Biomarkers Discovery and Patient Stratification
Master Degree Project in Systems Biology A2E 60 credits/ECTS Spring term 2019 Mohamed Al Shobky
Supervisor: Adil Mardinoglu,
Professor of Systems Biology
King’s College London, UK
Examiner: Andreas Tilevik,
Senior Lecturer in Bioscience School of Bioscience, Skovde university
II
Abstract Pancreatic Ductal Adenocarcinomas initiates in the exocrine part of the pancreatic tissue and
represents over 90% of all the pancreatic cancers. Pancreatic Ductal Adenocarcinomas are extremely
aggressive and are one of the most lethal malignant neoplasms. The five-year relative survival is
currently less than 8% of the patients. The main reason behind such a low survival rate is that most
of the cases are diagnosed at a very late stage. Although substantial advancement in pancreatic cancer
research has been done, there has not been any remarkable significance in the mortality to incidence
ratio. This is mainly a result of the scarce of early diagnostic characteristic symptoms and reliable
biomarkers besides the unresponsiveness to the treatments. In this study, transcriptomics and
proteomics data were used for the construction of a genome-scale metabolic model that was used in
the detection of altered metabolic pathways, genes and metabolites using gene set analysis and
reporter metabolites analysis. As a result, altered metabolic pathways in PDAC tumours were detected
including the lipid metabolism-related pathways as well as carbohydrate metabolism, in addition to
nucleotide metabolism, which are considered as potential candidates for diagnostic biomarkers.
Moreover, classification of the filtered DIRAC tightly regulated network genes, based on their
prognostic values from the pathology atlas, detected two groups of PDAC patients that have a
significantly different survival outcome. The differential expression analysis of the two groups showed
that six of the eight genes used in clustering were showing significantly altered expression, which
suggests their importance in PDAC patient stratification. As a conclusion, this study shows the valuable
outcome of the GEM reconstructions and other systems-level analyses for elucidating the underlying
altered metabolic mechanisms of PDAC. Such analyses results should provide more insights into the
biomarker discovery and developing of potential treatments.
III
Popular scientific abstract
Cancer is a collective term for a large group of diseases that target any organ in the body. A well-
known feature of cancer is its ability to create abnormal cells rapidly and grow outside their normal
boundaries, which can then invade adjacent body parts and spread to distant organs. These
abnormalities occur due to the interactions between the individual’s genetic factors and external
agents, including physical, chemical, and biological carcinogens. To give indications on cancer
hazardousness, it is the second leading cause of death worldwide, with an estimated 9.6 million deaths
in 2018, according to the world health organisation (WHO). Furthermore, the most common cancer
types include the lung, breast, colorectal, prostate, skin, and stomach cancers and the lung, colorectal,
stomach, liver and breast cancers are the most associated with cancer deaths. The cancer cell
metabolism was found to be reprogrammed in order to support their rapid proliferation. That is why
the metabolic rewiring, also referred to as metabolic alteration, is now considered as one of the cancer
hallmarks that initially included the traits of evading growth suppressors, activating invasion and
metastasis, limitless replicative potential, resisting cell death and sustained angiogenesis.
The pancreas is an organ located within the abdomen and is about 15.24 cm long, flat and oblong,
with an essential rule in digestion and blood sugar regulation. The pancreas as a gland has both
exocrine and endocrine functions. The exocrine activity is shown in the production of enzymes called
pancreatic juice that digest fats, proteins and carbohydrates in the intestine. Those digestive fluids
travel through the pancreatic duct to the bile duct that takes the fluids to the gallbladder and mixes
with bile acid to help in the digestion process. The endocrine activity is the represented in its secretion
to the insulin that decreases the concentration of blood glucose and glucagon raises the blood glucose
levels, and the combination of the two hormones maintain a normal level of blood sugar in the human
body. There are three primary diseases associated with the pancreas malfunction, and they are
pancreatitis, diabetes and pancreatic cancer. The pancreatic ductal adenocarcinoma is a highly lethal
cancer associated with a very poor survival rate as the five-year relative survival is currently less than
8% of the patients. The cytotoxic chemotherapies that are now being used in the treatment regimen,
unfortunately, are accompanied by significant side effects with a minimal therapeutic outcome. The
FDA approved drugs that are used rely on the DNA metabolism and DNA integrity as their primary
target, and for that reason, researchers thought of finding alternative metabolic targets that might
allow for a higher efficacy and tumour eradication rate. Pancreatic ductal adenocarcinomas are
capable of living in a harsh microenvironment with hypoxia and nutrient deprivation, which means
that they attain biochemical flexibility, allowing them to adapt in such conditions. For that reason, a
full understanding of the metabolic nature can ravel metabolic vulnerabilities that could be targeted
as biomarkers for diagnoses or prognosis and as a novel drug target for developing an effective
treatment. In this study, different systems biology methods including genome-scale metabolic
modelling, differential expression analysis, gene set enrichment analysis, survival analysis and more
were used to detect genetic and metabolic alterations specific to pancreatic cancer. The results
revealed that pancreatic tumours possess altered metabolism in the lipid metabolism, carbohydrate
metabolism as well as nucleotide metabolism pathways that can be targeted as potential candidates
of diagnostic biomarkers. In addition, the analysis managed to detect a list of 6 genes that have altered
expression between patient groups suggesting their importance in pancreatic patient stratification
which can help in determining the cancer stage and the subsequent adequate and effective treatment.

IV
List of abbreviation AADAC Arylacetamide deacetylase ALDH3A1 Aldehyde dehydrogenase 3 family member A1 CHI3L1 Chitinase-3-like protein 1 DEGs Differentially expressed genes DIRAC Differential Rank Conservation ENTPD8 Ectonucleoside Triphosphate diphosphohydrolase 8 FPKM Fragments Per Kilobase of transcript per Million mapped reads GDC Genomic Data Commons GEM Genome-scale metabolic model GFPT1 Glutamine--fructose-6-phosphate aminotransferase GSA Gene set analysis HK3 Hexokinase-3 HMR2 Human Metabolic Reaction database 2 HPA The Human Protein Atlas LDHA L-lactate dehydrogenase A chain MANSC 1 MANSC domain-containing protein 1 MOGAT2 Monoacylglycerol O-acyltransferase 2 MOGAT3 Monoacylglycerol O-acyltransferase 3 NAGK N-acetyl-D-glucosamine kinase PDAC Pancreatic Ductal Adenocarcinoma. PLA2G10 Phospholipase A2 Group IVF PLA2G4F phospholipase A2 group X TCGA The Cancer Genome Atlas tINIT Task‐driven Integrative Network Inference for Tissues

V
Table of contents
Abstract ..................................................................................................................................................................................... II
Popular scientific abstract ........................................................................................................................................................ III
List of abbreviation ................................................................................................................................................................... IV
Table of contents ....................................................................................................................................................................... V
Introduction ............................................................................................................................................................................... 1
Aim ........................................................................................................................................................................................ 4
Materials and Methods.............................................................................................................................................................. 6
2.1 DATA ............................................................................................................................................................................... 6
2.1.1 Proteomics .............................................................................................................................................................. 6
2.1.2 Transcriptomics ....................................................................................................................................................... 6
2.1.3 Generic human model, Human Metabolic Reaction database 2 (HMR2) ............................................................... 6
2.2 The RAVEN Toolbox ........................................................................................................................................................ 6
2.3 PDAC-specific GEM Reconstruction ................................................................................................................................ 6
2.4 The Differential Rank Conservation (DIRAC) analysis ...................................................................................................... 7
2.5 Unsupervised clustering .................................................................................................................................................. 7
2.6 Survival analysis .............................................................................................................................................................. 7
2.7 Differential Gene expression analysis and gene set analysis (GSA) ................................................................................ 8
2.8 Reporter metabolites ...................................................................................................................................................... 8
Results ....................................................................................................................................................................................... 9
3.1 Integrated proteomics and transcriptomics data for a refined protein abundance scores ............................................ 9
3.2 Reconstructed PDAC-specific GEM constitutes individual transcriptome and tissue-specific proteome data ............. 10
3.3 RNA-seq and Network-based analyses of PDAC metabolism ........................................................................................ 11
3.3 Implementation of DIRAC analysis and unsupervised clustering towards the stratification of PDAC patients ............. 16
Discussion ................................................................................................................................................................................ 18
Conclusion and Future perspectives ........................................................................................................................................ 21
Ethical aspects and impact of the research on society ........................................................................................................... 22
Acknowledgements ................................................................................................................................................................. 22
References ............................................................................................................................................................................... 23
Appendix .................................................................................................................................................................................. 29

Page | 1
Introduction
As the fundamental building unit of the human body, cells are capable of both extracting and providing
energy to carry out various vital processes and synthesising new organic materials that are essential
for performing activates such as movement, growth, development, and reproduction. Metabolism is
a crucial process for the utilisation of nutrients and preserving the balance between energy
consumption and production by a collection of a set of biochemical reactions which in turn are
maintaining the healthy living state of the cells and the body as a whole (Lazar and Birnbaum, 2012).
With the mutual impact between the metabolism and every other cellular process; there is a piece of
apparent evidence showing the fundamental role of the metabolic pathways collection that influences
every single cellular function and extends to whole-body level (McKnight, 2010). To this end, along
with a more profound medically-oriented research in metabolism, it became more evident that the
abnormal metabolic states considered as the primary cause or outcome of a myriad of human
disorders including diabetes, liver and renal disorders, and cancer (DeBerardinis and Thompson,
2012).
Cancer is a remarkably heterogeneous and sophisticated collection of diseases and considered as an
outstanding example of human disorder with hereditarily-derived pathological metabolic
perturbations (Greaves and Maley, 2012). Hanahan and Weinberg (Hanahan and Weinberg, 2000)
managed to set six major cancer hallmarks in an attempt to organise the cancer discrepancy in its
underlying biology that represents the physiological alteration in a cell which eventually drives the
growth and development of the malignancy. Those hallmarks are represented in the tumour ability to
generate its own growth signals, showing a noticeable reduction in its dependence on the exogenous
growth stimulation from the surrounding normal tissue microenvironment. Another acquired trait by
the tumour cells is the insensitivity to the antigrowth signals, which is mainly caused by the disruption
of the retinoblastoma protein (pRb) and its two relatives, p107 and p130 that release E2F transcription
factors that allow the cell proliferation. One more critical mechanism is the ability of the tumour cells
to evade apoptosis that has a very prominent influence on the expansion of the tumour cell population
that works side by side with its ability to increase the rate of cell proliferation by acquiring insensitivity
to the antigrowth signals. Independent from the cell-to-cell signalling disruption in favour of tumour
growth to be isolated from the surrounding environment, the deregulation of the intrinsic, cell-
autonomous program that operates independently from the cell-to-cell signalling pathways, are
crucial to ensure the uncontrolled expansion of the tumour growth. The availability of the oxygen and
nutrients by the blood vessels to the tumour cells is also crucial to keep the tumour expansion and
increase in size. For that particular reason, the tumour develops a sustained angiogenic ability that
guarantees a constant supply from oxygen and nutrients. The last hallmark they introduced was the
ability of the cancer cells to invade adjacent tissues and move to remote sites to start new colonies to
escape from the limited supplies in the primary tumours.
Later an updated review by the same authors (Hanahan and Weinberg, 2011) added to the list two
more emerging hallmarks based on observations from the significant advancement in cancer research
and that included the of energy metabolism reprogramming and evading immune destruction.
Metabolic reprogramming as a cancer hallmark has the capability to promote the malignant cell

Page | 2
proliferation, survival, and metastasis by altering metabolic pathways and mainly those related to
energy metabolism, aiming for maintaining the cell growth and division. That was first observed by
Warburg where cancer cells showed an abnormal behaviour from healthy cells in terms of energy
metabolism (Warburg, 1956, Warburg et al., 1927). In other words, within aerobic conditions, the
abnormal cells alter the metabolism of glucose where the energy metabolism is shifted mainly towards
glycolysis in what so-called “aerobic glycolysis” (Warburg, 1956, Warburg et al., 1927). While that was
such an outstanding discovery, but the idea of the total impairment of the oxidative phosphorylation
process in cancer cells respiration was controversial (Weinhouse, 1956). That was supported by
carrying out an isotope-tracing experiment that showed results of the ability of cancer cells to oxidise
oxygen and generate CO2 with the same rate as a normal cell. The only exception was during tumour
growth where the core cells of a tumour become hypoxic, and that would decrease the oxidative
phosphorylation rate in comparison to glycolysis (Weinhouse, 1951, Weinhouse, 1972).
Recently, the tumour associated metabolic rewiring was intensely reviewed and showed its profound
advantage to initiate the tumour growth and development as well as maintaining its survival. In
addition to that, it became more evident that this metabolic reprogramming could be a result of
genetic mutations or could even induce posttranscriptional modifications (DeBerardinis and Chandel,
2016, Cairns and Mak, 2016). In an attempt to organise these metabolic alterations, Pavlova and
Thompson managed to group them into six hallmarks (Pavlova and Thompson, 2016). The list included
the deregulation of the glucose and amino acids, increased nitrogen demand, the tumour utilisation
for the opportunistic modes of nutrient acquisition and the ability to interact with its surrounding
microenvironment metabolically. Moreover, the utilisation of the intermediates of the glycolysis\TCA
cycle for the biosynthesis and NADPH production and alterations in metabolite-driven gene regulation
that acts as active influencers on tumorigenesis were among those hallmarks (Pavlova and Thompson,
2016).
In general, pancreatic cancers can be divided into two subtypes as endocrine or exocrine tumours.
Pancreatic Ductal Adenocarcinomas (PDAC) initiates in the exocrine part of the pancreatic tissue and
represents over 90% of all the pancreatic cancers. The most typical non-invasive neoplastic precourse
to PDAC is pancreatic intraepithelial neoplasias (PanIN). Those lesions harbour genetic and epigenetic
alterations that are considered as primary drivers of the invasive adenocarcinoma of the pancreatic
tissue (Vincent et al., 2011). PDACs are extremely aggressive, and one of the most lethal malignant
neoplasms with five-year relative survival is currently less than 8% of the patients. The main reason
behind such a low survival rate is that most of the cases are diagnosed at a very late stage, where the
five-year rate of survival reaches 2% (Siegel et al., 2016). Based on GLOBOCAN 2012 worldwide
estimates, the pancreatic cancer was responsible for the death of 330391 patients per year,
accounting for 4.0% of all cancer deaths, and also 337872 per year estimated incidence which is
accounting for 2.4% of all new cancer cases (Ferlay et al., 2015). With the fact that the PDAC
considered the seventh most common cause of cancer mortality with an inferior prognosis, it is
predicted that this cancer-related mortality rate is going to even more increase reaching to be ranked
as second in the next decade if no actions will be taken against such deadly cancer (Rahib et al., 2014).
Although the substantial advancement in pancreatic cancer research there has not been any
remarkable significance in the mortality to incidence ratio. That is mainly a result of the scarce of early
diagnostic characteristic symptoms and reliable biomarkers besides the unresponsiveness to the

Page | 3
treatments due to the tumour heterogeneity, plasticity and the aggressive metastasis that presents in
more than 50% of the diagnosed patients (Adamska et al., 2017). Previously, several studies pointed
out the most prominent genetic features of the PDAC such as oncogenic activation of K-RAS that is a
standard feature in more than 90% of the patients and with the early onset mutation of that gene, it
is considered as a critical driver of PDAC initiation and progression (Lohr et al., 2005). Along with the
oncogenic activation, inactivating mutations of the tumour suppressor gene CDKN2A/2B are also
observed in more than 80% of the early stage lesions, while later stages of cancer exhibit inactivating
mutations and deletions of tumour suppressor genes most prominently include TP53and SMAD4
(Bardeesy and DePinho, 2002). Moreover, another feature that reflects the PDAC aggressiveness and
chemoresistance is the desmoplastic reactions induced by immune cells, stromal cells, neural cells and
extracellular matrix that forms the tumour mass bulk. Altogether, with the tumour hypo
vascularisation, the delivery of the needed oxygen and nutrients is diminished due to the vascular
network deficiency. In such hypoxic and acidic microenvironment in addition to the nutrient
deficiency, a direct impact on the drug delivery mechanisms is common, and more importantly, the
tumour microenvironment maintains its survival and growth by altering its metabolism (Sousa and
Kimmelman, 2014, Liang et al., 2016). The downstream events of metabolic reprogramming are
considered as prominent hallmarks of PDAC. Therefore tackling this aggressive cancer through
establishing a clear understanding regarding its metabolism has been a dominant challenge to the
scientific and medical communities (Perera and Bardeesy, 2015). Recent studies have shown the
crucial role of both glucose and glutamine metabolism in the progression of the PDAC tumours that
are regulated by the K-RAS oncogene to maintain the tumour growth (Le et al., 2010, Ying et al., 2012,
Son et al., 2013). Inducible oncogenic K-RAS mouse model of PDAC showed in addition to being a key
driver of PDAC initiation that it plays a central role in rewiring the tumour glucose metabolism by
stimulating the glucose uptake and drives glycolysis intermediates towards non-oxidative pentose
phosphate pathways (PPP) (Ying et al., 2012). Another study reported that the PDAC cells maintain
the tumour growth by relying on the distinct pathway of glutamine metabolism and that this
reprogramming is mediated by the oncogenic K-RAS (Son et al., 2013).
One of the fundamental purposes of the human systems biology studies is to accomplish an explicit
knowledge about human metabolism and its relation to various diseases. With the frequently arising
challenges regarding cancer diagnosis and treatment - mainly due to its complex pathogenic landscape
and cellular heterogeneity - the systems biology holistic view allowed for having a global
understanding of the disease mechanism and gain more insight towards biomarkers and drug target
discovery (Westerhoff and Palsson, 2004, Tian et al., 2012). Metabolic network reconstructions
became an essential tool for exploring the systems biology of metabolism and the generation of
genome-scale metabolic models (GEMs). These models along with the massive advancement in high-
throughput omics data production has significantly contributed to metabolism studying on a genome-
scale by providing a computational platform for integrating and analysing this data as well as
investigating more thoroughly into these networks by simulations (Thiele and Palsson, 2010, Bordbar
and Palsson, 2012, Fondi and Lio, 2015).
GEMs are a mathematical representation of the current knowledge of metabolism where biochemical
and physiological data on protein-encoding genes and their interactions with other bioactive
compounds and associated reactions are integrated. These metabolic reconstructions harbour a set
of annotated stoichiometric chemical reactions as well as enzymes associated with those reactions in
Page | 4
a particular cell or tissue (Mardinoglu and Nielsen, 2012, Mardinoglu et al., 2013, Mardinoglu and
Nielsen, 2015). In the past, two literature based GEMs of human metabolism were constructed, which
were built to be generic. The reconstruction based on an extensive evaluation of genomic and
bibliomic data, which are known as Recon1 (Duarte et al., 2007) and the Edinburg Human Metabolic
Network (EHMN) (Ma et al., 2007), which showed a great significance in revealing the gaps in
understanding the human metabolism. With the aim of extending the knowledge, included within
such reconstructions, these generic networks were integrated with the human metabolism-related
reactions in the Kyoto Encyclopaedia of Genes and Genomics (KEGG) (Kanehisa and Goto, 2000) for
the creation of the Human Metabolic Reaction (HMR) database (Agren et al., 2012). This was followed
by updating the contents of the HMR to HMR2 database (Mardinoglu et al., 2013) by integrating lipids
and lipoprotein metabolomics from the Reactome database (Croft et al., 2011) and a manually
constructed Hepatocytes GEM, HepatoNet 1 (Gille et al., 2010). Also, the lipid metabolism was more
extensively curated using the lipidomics Gateway (Sud et al., 2007) and HumanCyc database (Romero
et al., 2005). Those generic GEMs lack information related to the cell or disease-specific metabolic
states. For that reason, many algorithms have been published that can reconstruct a cell or disease-
specific GEM by reducing the generic ones using cell or diseases specific omics data (Schmidt et al.,
2013).
By the time the Genome-Scale Metabolic network was reconstructed, it was ready to be paired with
various constraint-based modelling approaches for its transformation to mathematical models for the
analysis of the cell or tissue-specific genotype-phenotype relationships. Concerning the current
network knowledge, the constraint-based modelling constrains its predications allowing for
phenotype simulations (Price et al., 2004). The constraint-based modelling, in contrast to the
traditional kinetic modelling techniques, does not need detailed information on kinetic constants or
the associated metabolites and enzyme. Instead, it counts on a set of constraints including
thermodynamic constraints, mass-balance constraints and enzyme capacity constraints that applied
for analysing Genome-scale metabolic models by transforming it into a mathematical model (Lewis et
al., 2012). For the purpose of genome-scale metabolism simulations, Flux Balance Analysis (FBA)
considered as the primary and most common method of the constraint-based modelling, allows for in
silico prediction of flux that is optimised to a defined set of objectives despite the need for
experimental measurements (Orth et al., 2010). Cancer-related applications of the reconstructed
GEMs includes networks comparison between healthy and diseased cells; physiological analysis
including essentiality and lethality analysis and growth simulation; integrative analysis of omics data,
in which the GEM is used as a scaffold for identifying reporter pathways and reporter metabolites
(Yizhak et al., 2015, Nilsson and Nielsen, 2017, Ghaffari et al., 2015).
Aim
With the high heterogeneity, aggressiveness and low survival rates of pancreatic adenocarcinomas;
early diagnosis along with appropriate personalised treatment protocols are crucial for tackling such
lethal tumours. For that reason, this project aims to integrate the pancreatic cancer-specific
proteomics and transcriptomics data with Genome-scale metabolic modelling in a systematic manner.
Moreover, the aim is to perform transcriptomic and network-based analyses, as illustrated in figure 1,
to discover potential biomarker candidates and stratify PDAC patients that eventually will be
significant for the diagnosis and development of effective treatment strategies.

Page | 5
Figure 1. Illustration of the workflow of the thesis project. TCGA mRNA-seq data and HPA proteomics data were integrated and introduced to the tINIT algorithm along with 57 metabolic tasks and HMR2 as a template model for the reconstruction of PDAC-specific GEM. For the diagnostic biomarkers discovery, differential expression (DE) analysis was performed, and the results were used to perform gene set analysis (GSA) and reporter metabolites analysis using the network topology of the reconstructed GEM. For the PDAC patients’ stratification, Differential Rank Conservation (DIRAC) analysis followed by consensus clustering analysis and survival analysis was performed. DE analysis was then performed between the two groups.
Page | 6
Materials and Methods
2.1 DATA
2.1.1 Proteomics
Staining profiles for proteins in pancreatic ductal adenocarcinomas tissue based on
immunohistochemistry using tissue microarrays were retrieved from the Human Protein Atlas (HPA)
version 16.1 (Uhlén et al., 2015) (http://www.proteinatlas.org). The proteomics data were used as the
bases for the Genome-scale metabolic model reconstruction.
2.1.2 Transcriptomics
The mRNA-Seq profiles and clinical metadata of 181 samples composed of 177 primary pancreatic
ductal adenocarcinomas and four matched tumour-adjacent normal tissues were used for the GEM
reconstruction and mRNA expression, DIRAC, clustering and survival analyses. The harmonised data
were retrieved from The Cancer Genome Atlas (TCGA) project within the Genomic Data Commons
(GDC) Data Portal Version 9.0 (https://portal.gdc.cancer.gov/) (Grossman et al., 2016), using the
TCGAbiolinks 2.5.7 R/Bioconductor package (Colaprico et al., 2016). The retrieved harmonised mRNA-
Seq gene expression was in the form of raw HT-Seq Read Counts data, and Fragments per Kilobase of
transcript per Million mapped reads (FPKM) data.
2.1.3 Generic human model, Human Metabolic Reaction database 2 (HMR2)
The reference human GEM HMR2 (Uhlen et al., 2017) is a genome-scale metabolic model that
represents the generic human cell. It contains 2892 genes associated with 7762 reactions 5566
metabolites. The generic GEM was used as the reference model for the tINIT algorithm during the
process of PDAC-specific GEM reconstruction.
2.2 The RAVEN Toolbox
RAVEN (Reconstruction, Analysis, and Visualization of Metabolic Networks) is a toolbox that runs
within MATLAB and presents a complete environment to perform GEMs reconstruction, with the
ability to analyse, simulate and visualise those reconstructed models. It is capable of integrating
different omics data for automated reconstruction of the GEMs. The reconstruction was followed by
an analysis of the networks and simulation results, also visualising the GEMs based on another
published network maps (Agren et al., 2013).
2.3 PDAC-specific GEM Reconstruction
A functional PDAC-specific GEM was reconstructed based on both proteomic and transcriptomic data,
using HMR2 as a reference model and a list of 57 predefined metabolic tasks (Agren et al., 2014) as an
input to the tINIT (Task‐driven Integrative Network Inference for Tissues) algorithm (Agren et al., 2014)
and Mosek solver version 8 within the RAVEN Toolbox Version 1.9 in MATLAB R2016b. Scoring for
evidence of a reaction to be occurring was based on HPA protein profiles integrated with mRNAseq
FPKM data. mRNA-seq data were filtered using the criterion of median expression value ≥1 FPKM to
be added to HPA protein abundance score file with the Level “Low”. Such reconstruction method was

Page | 7
performed in many projects; for example, one group integrated myocyte-specific RNA seq data with
proteomic data for the reconstruction of a comprehensive myocyte-specific GEM (Varemo et al.,
2015). The maximisation of biomass production was considered as an objective function for PDAC-
specific GEM to assess model feasibility. In brief, the tINIT algorithm is a developed version from the
older INIT (Agren et al., 2012) that allows for direct automated and semi-automated reconstruction of
functional GEMs based on proteomics and transcriptomics evidence and a novel task‐driven
reconstruction approach. The INIT algorithm was also used for generating a cell or cancer-specific
GEMs that were lacking the functionality to allow performing the simulations. On the other hand, tINIT
takes as an input, in addition to the integrated proteomics and transcriptomics evidence score and a
Generic model, a list of predefined metabolic tasks including biomass growth for cancer cells as an
additional metabolic task. These tasks should be performed by the reconstructed model to be
functional as they are applying constraints on the reconstruction functionality and representing
metabolic functions that are common in all cell types (Agren et al., 2014).
2.4 The Differential Rank Conservation (DIRAC) analysis
DIRAC is a network-based approach and was implemented within MATLAB for analysing gene order
within the pathways of the reconstructed model along with another gene sets. The central concept of
the algorithm is mainly based on the relative expression ranks of the participating genes. The results
should show a quantitative measurement of how pathway rankings differ both within and between
phenotypes (Eddy et al., 2010). Pathways of the reconstructed GEM, as well as KEGG pathways, were
used as gene set input to the algorithm with minimum genes set size was set to 3 and FPKMs were
filtered by removing genes that had a row median less than one.
2.5 Unsupervised clustering
To find hidden patterns in the transcriptomics data that could be used for the PDAC stratification,
unsupervised class discovery using the R/Bioconductor package "ConsensusClusterPlus" has proven
its efficacy in revealing those groups that share common biological characteristics (Wilkerson and
Hayes, 2010). First, the transcriptomics data in the form of FPKMs were filtered based on median
FPKM > one will be included. Then, the list of 152 unique genes from the four tightly regulated
pathways was further filtered based on their significance as prognostic genes from the pathology atlas
dataset of pancreatic cancer prognostic genes (Uhlen et al., 2017). The FPKMs were median centred,
and the following parameters were used: 80% item resampling (pItem), and 80% gene resampling
(pFeature), a maximum evaluated k of 12 and 1000 resampling, agglomerative hierarchical clustering
algorithm (clustering) upon 1- spearman correlation distances (distance) and ward.D2 as the linkage
method.
2.6 Survival analysis
Based on the clinical data from the TCGA of the two PDAC groups defined by the unsupervised
consensus clustering, the survival analysis was performed, and the log-rank test was calculated.
Kaplan-Meier curves were derived according to the survival of the patients, and the days occurred
until death after diagnosis. The Survival R package (Therneau and Lumley, 2018) was used for this
analysis.

Page | 8
2.7 Differential Gene expression analysis and gene set analysis (GSA)
The mRNA-seq raw count data were analysed for the detection of differentially expressed genes
(DEGs) and obtain a quantitative and statistical inference to the changes between the two conditions
as well as between the generated cancer subgroups from clustering. The R/Bioconductor package
DESeq2 version 1.18.1 (Love et al., 2014) was used for that purpose. Benjamini and Hochberg false
discovery rate (FDR) was conducted for multiple hypothesis correction. The FDR adjusted p-
value < 0.05 and Fold-change cut-off of >1 or <-1 was applied to determine up- and down-regulated
genes.
Gene set analysis using R/Bioconductor package “Piano” (Varemo et al., 2013), was performed to gain
a better understanding to the results of the differential expression analysis, and its underlying
biological processes. In this study, three gene set collections including the constructed PDAC specific
GEM, the Gene Ontology biological processes (BP) “GOTERM_BP_5” and KEGG metabolic pathways
(both were retrieved from MSigDB (Liberzon et al., 2015) were used. The statistical GSA method used
was: Reporter features, Theoretical null distribution as the Significance method, FDR as the Multiple
hypothesis correction method <0.05 and 1000 permutations to use for gene sampling
2.8 Reporter metabolites
By using the network topology of the reconstructed model, the reporter metabolite algorithm
impeded inside the RAVEN toolbox was employed to allow for identifying the network metabolites
that are significantly enriched based on its association with the gene expression changes. Those
metabolites can be then used for identifying central parts of the metabolic network that has significant
perturbation between the examined conditions (Patil and Nielsen, 2005). The network topology of the
reconstructed PDAC-specific GEM in addition to the log2 fold changes and p-values from the
differential expression analysis were imported to the reporter metabolites function in the RAVEN
toolbox and a p-value < 0.005 was determed as the significance level.

Page | 9
Results
3.1 Integrated proteomics and transcriptomics data for a refined protein abundance scores
The concept behind integrating both of the proteomics and transcriptomics data is to complement the
proteomics data and get a piece of refined and more robust information that could overcome the
heterogeneous nature of pancreatic cancer tumours. The protein level data serves as the main source
of protein evidence, while the mRNA expression profiles purpose is to fill in the gaps and reduce the
probability of having potential false negatives.
The retrieved PDAC proteomics data from the HPA project v16.1 was trimmed down to show the
protein abundance levels (high, medium, low or not detected) of 15297 protein-encoding genes that
are associated with the highest patients count. As a result, the data unveiled that 1566 (10.2%) genes
had high staining level, 1835 (12%) genes had low staining level, 5368 (35.1%) genes had medium
staining level, while 6528 (42.7%) genes were not detected on the protein level (Figure 2A).
The TCGA transcriptomics data for 177 PDAC patients and four matched tumour-adjacent normal
tissues in the form of FPKMs were filtered to comprise only protein-encoding genes, and that yielded
in total 19363 putative protein-coding genes. Based on various studies of the correlation between
transcriptome and proteome, the low abundance transcripts of the mRNA expression with median
FPKM values less than one was interpreted as not being translated to the corresponding proteins
(Fagerberg et al., 2014, Varemo et al., 2015). By applying a cut-off of median FPKM equal to or above
one as the protein detection level, a total of 12134 (62.7%) were identified as detected, while 7229 (
37.3%) of the putative protein-coding genes were not being translated to their corresponding protein
(Figure 2B).
Besides, comparing the two datasets revealed that a total of 6890 (49.2% of all protein-coding genes)
genes were consistently present in PDAC tumours at both the proteomic and transcriptomic levels
(Figure 2C). Moreover, a total of 5244 (37.4%) protein-coding genes were unique to the transcriptomic
data, while 1879 (13.4%) protein-coding genes were only present in the proteomics data (Figure 2C).
With that being concluded, the integrated data represented all the protein-coding genes (14013
genes) that are evaluated as present on the protein level in PDAC tumours. Based on this, 3557 genes
from the HPA data with non-detected protein abundance level but had an FPKM level more than or
equal to one were reassigned as detected with low level. In addition, 1687 genes were absent from
the HPA data and found to have an FPKM level more than or equal to one. These genes were also
added to the final updated protein abundance scores with the level defined as low.

Page | 10
Figure 2: Coverage of gene expression in transcriptomic and proteomic analysis of the PDAC data. (A) The pie chart shows the coverage of protein-coding genes in the Human Protein Atlas (HPA). (B) The pie chart shows the coverage of protein-coding genes in the TCGA FPKM data after applying the median cutoff FPKM <1. (C) All protein-coding genes that are evaluated as present in PDAC based on TCGA transcriptomics data (Red) and HPA proteomics data (Green), which were used during the reconstruction of the PDAC GEM. (D) The overall distribution of Genes in PDAC GEM are included in the model based on the high-quality proteome, transcriptome, as well as the connectivity.
3.2 Reconstructed PDAC-specific GEM constitutes individual transcriptome and tissue-specific proteome data
The high heterogeneity is a prominent trait of the pancreatic ductal adenocarcinoma tumours that
obstruct the process of detecting individual variations within the tumours and the global biological
differences between cancerous and non-cancerous pancreatic tissues. In this context, a population-
based PDAC-specific GEM was reconstructed that comprise the individual variations among the PDAC
Page | 11
tumours and can be further employed for analysing high throughput omics data and simulating the
metabolic differences between cancer and healthy patients.
The reconstruction process mainly relied on the updated protein abundance levels that were
generated from the integration of both the proteomics and transcriptomics data (Figure 2C) and used
to score the HMR2 reactions to be included in the reconstruction if at least one of its associated genes
was detected as present in PDAC tumours. The model functionality was determined based on the 57
metabolic tasks and the objective function (see methods), and as a result, 459 reactions associated
with 492 genes were essential for performing the introduced biological tasks. In addition, the final
gap-filling step added eleven reactions that allow the final model to perform the rest of the tasks. The
resulting PDAC- specific GEM is a functional model including 5750 reactions associated with 2242
genes and 4415 metabolites within eight different subcellular compartments. By inspecting the gene
content of the reconstructed model and its correlation with the introduced proteomics and
transcriptomics data, it showed that the majority of model gene content (1189 genes) were derived
from both of the –omics data, while a considerable number (846 genes) of genes were specific to the
transcriptomics data and only 169 genes were unique to the HPA proteomics data. In addition, a few
numbers of genes (38 genes) were found to be included in the model from the HMR2 database for
enhancing the model connectivity (Table Appendix .1). The source of evidence for the GEM gene
content is shown in Figure 2D.
3.3 RNA-seq and Network-based analyses of PDAC metabolism
In order to uncover the underlying biological differences between PDAC tumours and noncancerous
pancreatic tissues, transcriptomics data were analysed for the identification of the differentially
expressed genes (DEGs) using the DEseq 2 R package (Love et al., 2014). As a result, a total of 540
genes were found to be differentially expressed (FDR adj. p-value < 0.05) in primary tumours in
comparison to non-cancerous pancreatic tissue, of which 305 genes were upregulated, and 235 genes
were downregulated. A complete list of all the 540 genes that were differentially expressed is shown
in table Appendix 2.
The results of the differential expression analysis (more specifically the log-fold changes along with
the p-values) for the protein-coding genes were used to perform gene set analysis (GSA) for Gene
Ontology biological processes (BP) “GOTERM_BP_5”, KEGG metabolic pathways and the network
structure of the PDAC-specific GEM using the Piano R/Bioconductor package (Varemo et al., 2013).
The results for the GO biological processes gene set analysis showed that 584 biological processes
were associated with upregulated genes in PDAC while 379 were associated with downregulated
genes in PDAC. Among the significantly upregulated processes are mitotic cell cycle, cell cycle process,
cell division, DNA replication, DNA repair, DNA metabolic process, cellular respiration, cytoplasmic
translation and cell development. Also several metabolic processes including oxidative
phosphorylation, one carbon metabolic process, carbohydrate metabolic and biosynthetic processes,
amino acid metabolic processes including aspartate and glutamate metabolism, extensive lipid
metabolic and biosynthetic processes like arachidonic acid, fatty acid, fatty acid derivatives, steroids
and ether metabolic processes. Whereas immune-related biological processes, such as activation of
immune response, inflammatory response, alpha and beta T-cell activation and differentiation,
macrophage activation and cellular defence response, were associated with significantly
downregulated genes in PDAC.
Page | 12
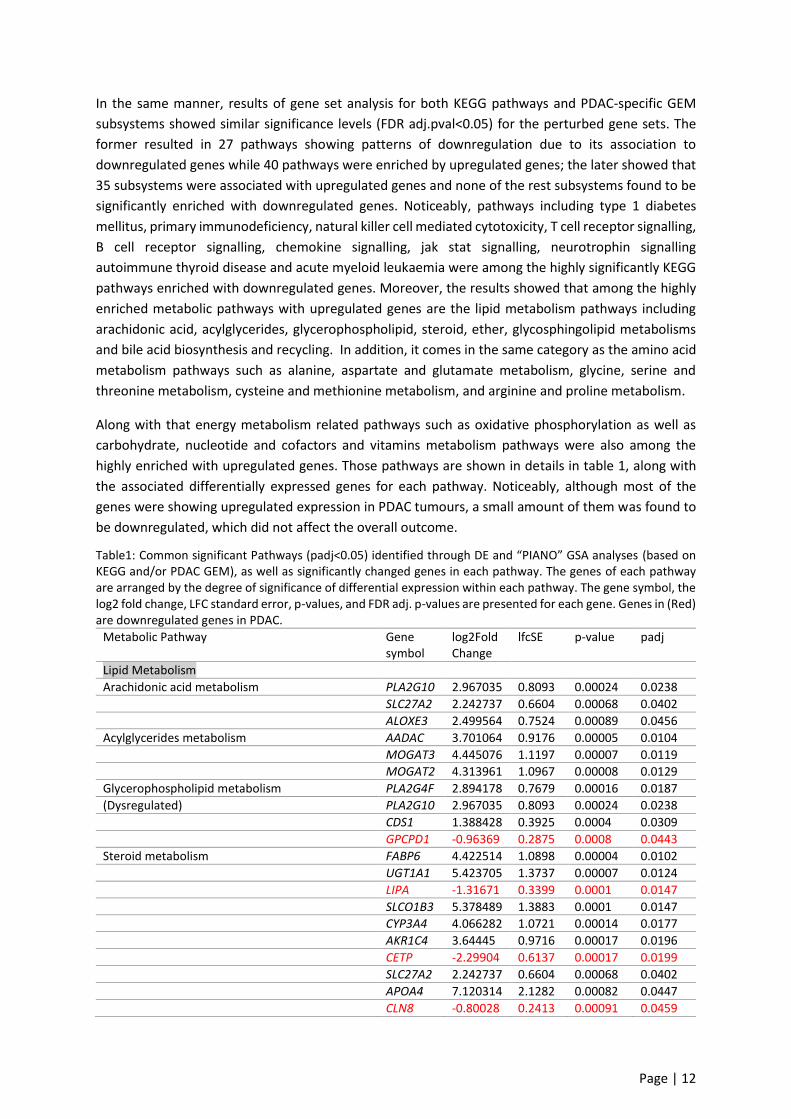
In the same manner, results of gene set analysis for both KEGG pathways and PDAC-specific GEM
subsystems showed similar significance levels (FDR adj.pval<0.05) for the perturbed gene sets. The
former resulted in 27 pathways showing patterns of downregulation due to its association to
downregulated genes while 40 pathways were enriched by upregulated genes; the later showed that
35 subsystems were associated with upregulated genes and none of the rest subsystems found to be
significantly enriched with downregulated genes. Noticeably, pathways including type 1 diabetes
mellitus, primary immunodeficiency, natural killer cell mediated cytotoxicity, T cell receptor signalling,
B cell receptor signalling, chemokine signalling, jak stat signalling, neurotrophin signalling
autoimmune thyroid disease and acute myeloid leukaemia were among the highly significantly KEGG
pathways enriched with downregulated genes. Moreover, the results showed that among the highly
enriched metabolic pathways with upregulated genes are the lipid metabolism pathways including
arachidonic acid, acylglycerides, glycerophospholipid, steroid, ether, glycosphingolipid metabolisms
and bile acid biosynthesis and recycling. In addition, it comes in the same category as the amino acid
metabolism pathways such as alanine, aspartate and glutamate metabolism, glycine, serine and
threonine metabolism, cysteine and methionine metabolism, and arginine and proline metabolism.
Along with that energy metabolism related pathways such as oxidative phosphorylation as well as
carbohydrate, nucleotide and cofactors and vitamins metabolism pathways were also among the
highly enriched with upregulated genes. Those pathways are shown in details in table 1, along with
the associated differentially expressed genes for each pathway. Noticeably, although most of the
genes were showing upregulated expression in PDAC tumours, a small amount of them was found to
be downregulated, which did not affect the overall outcome.
Table1: Common significant Pathways (padj<0.05) identified through DE and “PIANO” GSA analyses (based on KEGG and/or PDAC GEM), as well as significantly changed genes in each pathway. The genes of each pathway are arranged by the degree of significance of differential expression within each pathway. The gene symbol, the log2 fold change, LFC standard error, p-values, and FDR adj. p-values are presented for each gene. Genes in (Red) are downregulated genes in PDAC.
Metabolic Pathway Gene symbol
log2FoldChange
lfcSE p-value padj
Lipid Metabolism
Arachidonic acid metabolism PLA2G10 2.967035 0.8093 0.00024 0.0238 SLC27A2 2.242737 0.6604 0.00068 0.0402 ALOXE3 2.499564 0.7524 0.00089 0.0456
Acylglycerides metabolism AADAC 3.701064 0.9176 0.00005 0.0104 MOGAT3 4.445076 1.1197 0.00007 0.0119 MOGAT2 4.313961 1.0967 0.00008 0.0129
Glycerophospholipid metabolism PLA2G4F 2.894178 0.7679 0.00016 0.0187
(Dysregulated) PLA2G10 2.967035 0.8093 0.00024 0.0238 CDS1 1.388428 0.3925 0.0004 0.0309 GPCPD1 -0.96369 0.2875 0.0008 0.0443
Steroid metabolism FABP6 4.422514 1.0898 0.00004 0.0102 UGT1A1 5.423705 1.3737 0.00007 0.0124 LIPA -1.31671 0.3399 0.0001 0.0147 SLCO1B3 5.378489 1.3883 0.0001 0.0147 CYP3A4 4.066282 1.0721 0.00014 0.0177 AKR1C4 3.64445 0.9716 0.00017 0.0196 CETP -2.29904 0.6137 0.00017 0.0199 SLC27A2 2.242737 0.6604 0.00068 0.0402 APOA4 7.120314 2.1282 0.00082 0.0447 CLN8 -0.80028 0.2413 0.00091 0.0459

Page | 13
Bile acid biosynthesis and recycling SLCO1B3 5.378489 1.3883 0.0001 0.0147 CYP3A4 4.066282 1.0721 0.00014 0.0177 AKR1C4 3.64445 0.9716 0.00017 0.0196 SDR16C5 2.777176 0.8121 0.00062 0.0385 SLC27A2 2.242737 0.6604 0.00068 0.0402
Ehter lipid metabolism PLA2G4F 2.894178 0.7679 0.00016 0.0187 PLA2G10 2.967035 0.8093 0.00024 0.0238
Glycosphingolipid metabolism B3GNT3 2.636525 0.5695 0.000003 0.0023 ALG1L 3.187208 0.7907 0.00005 0.0104 FUT2 1.923234 0.5739 0.0008 0.0443 UGT8 1.594161 0.4832 0.00096 0.0478 ABO 2.275606 0.6935 0.00103 0.0492
Energy metabolism
Oxydative phosphorylation ENTPD8 3.229628 0.8303 0.0001 0.0143
Nitrogren metabolism CA9 3.593014 1.0369 0.00053 0.0355 CA13 1.457664 0.434 0.00078 0.0437
Carbohydrate metabolism
Glycolysis / gluconeogenesis ALDH3A1 3.900533 0.9499 0.00004 0.009 HK3 -2.33905 0.6521 0.000335 0.02827
Tricarboxylic acid cycle and glyoxylate/dicarboxylate metabolism
ALDH3A1 3.900533 0.9499 0.00004 0.009
Fructose and mannose metabolism HK3 -2.33905 0.6521 0.00033 0.0282
Ascorbate and aldarate metabolism UGT1A1 5.423705 1.3737 0.00007 0.0124
Nucleotide metabolism NQO1 2.306245 0.5791 0.00006 0.0117 ENTPD8 3.229628 0.8304 0.0001 0.0143 PDE2A -1.94998 0.5045 0.00011 0.0149 PDE7A -1.37634 0.4019 0.00061 0.0384
Amino acid metabolism
Alanine aspartate and glutamate metabolism GFPT1 1.028761 0.3017 0.00065 0.0391 IL4I1 -2.04549 0.6086 0.00077 0.0434
Glycine, serine and threonine metabolism CKMT1A 2.587723 0.6042 0.00001 0.0054 CKMT1B 2.533683 0.6274 0.00005 0.0103
Arginine and proline metabolism CKMT1A 2.587723 0.6042 0.00001 0.0054 CKMT1B 2.533683 0.6274 0.00005 0.0103
Histidine metabolism DDC 3.974158 0.8558 0.00003 0.0023 ALDH3A1 3.900533 0.9499 0.00004 0.009 ELOVL6 1.335621 0.4073 0.00104 0.0492
Tyrosine metabolism DDC 3.974158 0.8558 0.000003 0.0023 ALDH3A1 3.900533 0.9499 0.00004 0.009 IL4I1 -2.04549 0.6086 0.00077 0.0434
Amino sugar and nucleotide sugar metabolism
(dysregulation) NAGK -0.77096 0.1904 0.000051 0.01028
MANSC1 1.292456 0.3528 0.000249 0.02402
HK3 -2.33904 0.6521 0.000334 0.02826
CHI3L1 -2.62272 0.7549 0.000512 0.03467
GFPT1 1.028760 0.3017 0.000650 0.03919
Cofactors and vitamins metabolism
Porphyrin and chlorophyll metabolism HMOX1 -1.88894 0.4378 0.00001 0.0051 UGT1A1 5.423705 1.3737 0.00007 0.0124

Page | 14
Retinol metabolism AADAC 3.701064 0.9176 0.00005 0.0104 UGT1A1 5.423705 1.3737 0.00007 0.0124 CYP3A4 4.066282 1.0721 0.00014 0.0177 SDR16C5 2.777176 0.8121 0.00062 0.0385
Alternatively, the reporter metabolite algorithm (Patil and Nielsen, 2005) within the raven toolbox
was used to uncover the metabolic alterations accompanied by the PDAC tumours. The algorithm
benefits from the network topology provided by the reconstructed PDAC-specific GEM to recognise
metabolic hotspots (Reporter Metabolites) associated with upregulated or downregulated genes in
PDAC tumours. As a result, the algorithm detected 76 upregulated reporter metabolites and 35
downregulated reporter metabolites (P<0.005) regardless of their compartmentalisation.
Among the upregulated reporter metabolites were metabolites of the lipid metabolism such as
arachidonic acid and its products like 19(S)-HETE, 16(R)-HETE, which takes part in the arachidonic acid
metabolism. Also, the cytosolic acyl-CoA-LD-TG3 pool, fatty acid-LD-PC pool and fatty acid-LD-PE pool
metabolites of the acyl glyceride metabolism were associated with upregulated genes. In the ether
lipid metabolism, the O-1-alk-1-enyl-2-acyl-sn-glycero-3-phosphoethanolamine, 1-Organyl-2-lyso-sn-
glycero-3-phosphocholine and 1-(1-alkenyl)-sn-glycero-3-phosphoethanolamine metabolites also
demonstrated a significant association with upregulated genes. Reporter metabolites were also found
in the amino acid metabolism as mitochondrial creatine and creatine-phosphate were also associated
with upregulation of gene expression.
On the other hand, metabolites related to the carbohydrate metabolism showed association to gene
expression downregulation. As an example, metabolites of the glycolysis and gluconeogenesis, which
are beta D-glucose-6-phosphate and beta-D-glucose and metabolites of amino sugar and nucleotide
sugar metabolism, and N-acetylglucosamine and N-acetylglucosamine-6-phosphate, respectively.
Moreover, metabolites of the nucleotide metabolism showed different behaviour as the extracellular
metabolites like UMP, IDP, IMP and UDP demonstrated an association to upregulated genes, while the
metabolites like GMP, AMP,cyclic-AMP and cyclic-GMP showed their depletion in the nuclease and
golgi apparatus.

Page | 15
Figure 3: Reporter metabolites results. Reporter metabolites with its associated subsystems in PDAC GEM for PDAC tumours n= 177 compared to noncancerous pancreas samples n=4. P-values for each reporter metabolite were calculated for up- and downregulated genes (student's t-test p-val <0.005), and the negative logarithm of the p-values are represented.

Page | 16
3.3 Implementation of DIRAC analysis and unsupervised clustering towards the stratification of PDAC patients
In order to find tightly regulated parts of the metabolism in PDAC, the DIRAC was used to analyse the
normalised FPKM gene expression data using both of KEGG pathways and the PDAC-specific GEM
subsystems. The population-level analysis was applied to find the rank conservation index for each
network in the tumour phenotype which is a representative value for the degree of conservation in
the rankings of the genes of the network expression value that is averaged over the phenotype
samples. As a result, four pathways showed close levels of tight regulation in both of the used gene
sets and those were oxidative phosphorylation, Cysteine and methionine metabolism, Beta-alanine
metabolism and Riboflavin metabolism (table 2).
Table 2: Results from the DIRAC analysis. Four shared pathways between KEGG and PDAC GEM showed a close degree of tight regulation. The table shows the number of genes, gene pairs, average variance and the rank conservation index (mu_R) for each pathway across the used gene set collections.
KEGG metabolic pathways PDAC GEM subsystems
pathway name Num.
genes
Num.
pairs
Avg.
variance
mu_R Num.
genes
Num.
pairs
Avg.
variance
mu_R
Oxidative
phosphorylation
116 6670 2034.41 0.936 230 2633 1546.545 0.921
Cysteine and methionine
metabolism
34 561 567.229 0.933 30 435 346.143 0.916
Beta alanine metabolism 22 231 433.489 0.932 11 55 660.701 0.875
Riboflavin metabolism 16 120 192.022 0.942 8 28 376.250 0.899
By extracting the four tightly regulated pathway gene content out of KEGG gene sets, a list of 152
unique genes was generated. Using the information about prognostic genes of pancreatic cancer from
the pathology atlas of human cancer (Uhlen et al., 2017), the pathways genes were filtered based on
their prognostic capability and out of the 152 genes, 14 genes were prognostic. Furthermore, using
the top eight significantly prognostic genes in the consensus clustering of the 177 PDAC tumour
samples applying the parameters mentioned in material and methods was accompanied by the best
clustering consensus. The genes were: LDHA, ATP6VOD1, COX6B2, DNMT3A, UQCR11, ATP6VOA1,
ATP6VOB and MTMR2. The analysis revealed that the best clustering of samples is into two groups,
the first group (PDAC 1) consists of 88 patients and the second group (PDAC 2) consists of 89 patients
with clustering consensus values 0.8774 and 0.8452 respectively (Appendix figure 1).
Next, survival analysis was performed on the two groups of the clustering analysis using clinical data
of the 177 PDAC samples. The clinical data displayed information about the samples such as that the
vital status of the patients was 85 alive and 92 dead until the last time the clinical data has been taken,
and 21 samples were in the 1st stage, 146 in the 2nd stage, 3 in the 3rd stage, 4 in the 4th stage, while
3 were not reported. As a result, of the survival analysis, the p-value for the log-rank test between the
two clusters was significant (p-val<0.001). The PDAC 1 group showed a significantly longer median
survival time (913 days) in comparison to the PDAC 2 group (498 days) (figure 4A).

Page | 17
In order to gain more insight about the genetic alteration between the two cancer groups, differential
expression analysis was performed using raw count data of the two groups as an input to the DEseq 2
R package. As a result, the analysis revealed that 1461 genes were expressed differentially (FDR adj.
p-value < 0.05, log fold change cutoff > 1 or <-1). 330 of the DEGs were downregulated, and 1131 DEGs
were upregulated based on their log fold change. By comparing those DEGs to the list of the prognostic
genes from the pathology atlas, it was found that both data sets shared 139 genes. Finally, by looking
into the differentially expressed genes within the list of eight genes used in the consensus clustering,
six out of the eight were found to be DE, which included LDHA, ATP6VOD1, COX6B2, DNMT3A,
ATP6VOA1, and MTMR2 (figure 4B).
Figure 4: PDAC stratification analyses results. A) Overall survival analysis for the two PDAC groups resulted from the consensus clustering analysis. Kaplan-Meier plot showing the overall survival rate for patients of two cancer groups PDAC 1 (n=88) and PDAC 2 (N=89). The plot showed a significant difference in the median survival time (log-rank p-value=4.38e-05) (solid line) with 95% confidence intervals (dashed lines for upper and lower bounds). B) Box plots for the distribution of FPKM values of the 8 genes used in the clustering analysis between the two PDAC groups n=88 and 89, respectively. Statistical significance determined by Wilcoxon test followed by FDR adjustment. * p<0.05.

Page | 18
Discussion
Genome-scale metabolic models are a mathematical representation of the current knowledge of
metabolism where biochemical and physiological data on protein-encoding genes and their
interactions with other bioactive compounds and associated reactions are integrated. These
metabolic reconstructions were extensively used to study cancer metabolism and the underlying
genetic alterations (Mardinoglu et al., 2018). The Availability of GEMs and its integration with a high-
throughput omics data and methods of data analysis may enable increased understanding of the
altered metabolism in cancer. In addition, the implementation of differential expression analysis, gene
set analysis and differential rank conservation (DIRAC) analysis provides different information from
gene expression data that can complement each other.
In line with the observed acylglycerides metabolism enrichment associated to the upregulation of
Monoacylglycerol O-acyltransferase 2 and 3 (MOGAT2, MOGAT3) and Arylacetamide deacetylase
(AADAC) in the pathway analysis (table1), the reporter metabolite results (figure 3) showed a
significantly upregulated uptake of the cytosolic acyl-CoA-LD-TG3 pool and increased production of
fatty acid-LD-PC pool and fatty acid-LD-PE pool. These are metabolites of the acylglecrides subsystem
in the PDAC-specific reconstructed GEM. Both MOGAT2 and MOGAT3 genes are encoding for
enzymes that catalyse the terminal step of the synthesis of triacylglycerol by using fatty acyl-CoA
(cytosolic acyl-CoA-LD-TG3 pool) and diacylglycerol as substrates (Cheng et al., 2003, Brandt et al.,
2016), which explains the increased uptake behaviour of the metabolite acyl-CoA-LD-TG3 pool (figure
3) in PDAC tumours. Moreover, the upregulated AADAC gene that encodes for a triacylglycerol lipase,
an enzyme that catalyses the hydrolysis of the tri and diacylglycerols to increase the level of
intracellular fatty acids (Nourbakhsh et al., 2013), suggests the reason behind the increased
production levels of the fatty acid-LD-PC pool and fatty acid-LD-PE pool metabolites.
Another lipid metabolism-related pathway that was found to be associated with upregulated genes is
the ether lipid metabolism (table1). The phospholipase A2 group X, Phospholipase A2 Group IVF
(PLA2G4F, PLA2G10) are genes encoding for the enzyme phospholipase A2 that hydrolyse the
glycerophospholipids in the sn-2 position and produce free fatty acids and lysophospholipids
(Cupillard et al., 1997). Noticeably, this increase in the phospholipase A2 enzyme activity was clearly
showing its effect at the metabolite level in the form of highly upregulated reporter metabolites that
were associated with the ether lipid metabolism as shown in figure 3. Those reporter metabolites
were O-1-alk-1-enyl-2-acyl-sn-glycero-3-phosphoethanolamine and 1-(1-alkenyl)-sn-glycero-3-
phosphoethanolamine. These are the reactants that responded to the increased enzyme activity by
increasing their levels and that lead to an increase in the fatty acid-LD-TG2 pool and 1-Organyl-2-lyso-
sn-glycero-3-phosphocholine the products of the corresponding reactions. In a similar manner, the
upregulated PLA2G10 demonstrated its powerful ability in the releasing of the arachidonic acid from
the process of hydrolysing of phosphatidylcholine (Cupillard et al., 1997). That ability was shown by
its relative increase in level from the results of the reporter metabolites along with other substrates
of the metabolism of the arachidonic acid like 19(S)-HETE 16(R)-HETE were also found to be
upregulated (figure 3).
Some of the analysed pathways did not show a clear association to upregulated or down genes, and
those were considered as significantly dysregulated pathways within the gene set analysis. Amino
sugar and nucleotide sugar metabolism, a part of the carbohydrate metabolism pathway, is an

Page | 19
example of the dysregulated pathways (table1), where genes like MANSC domain-containing protein
1 and Glutamine--fructose-6-phosphate aminotransferase [isomerising] 1 (MANSC1, GFPT1) were
significantly upregulated. Contrarily, amino sugar and nucleotide sugar metabolism also had
significantly downregulated genes. Among those genes was the N-acetyl-D-glucosamine kinase
(NAGK) gene encoding the enzyme that degrades the N-acetylglucosamine to N-acetylglucosamine-6-
phosphate (Bergfeld et al., 2012). Another gene was the Hexokinase-3 (HK3) glucose-phosphorylating
isoenzyme that catalyses the phosphorylation of glucosamine to glucosamine-6-phosphate (Griffin et
al., 1991). Also Chitinase-3-like protein 1 (CHI3L1) that encodes the enzyme which catalyses the
hydrolysis of the β-1,4-N-acetyl-D-glucosamine linkages in chitin polymers and produces N-
acetylglucosamine (Flach et al., 1992). This dysregulation was translated at the metabolite level by the
decrease in the level of both N-acetylglucosamine and N-acetylglucosamine-6-phosphate in PDAC
during the amino sugar and nucleotide sugar metabolism as presented by the reporter metabolite
analysis (figure 3).
Glycolysis and Gluconeogenesis metabolism was one of the significantly altered pathways from the
gene set analysis in PDAC that takes a part of the carbohydrate metabolism, and it showed an overall
association to upregulated genes. Noticeably, only two genes were significantly differentially
expressed in PDAC tumours as a result of the DE analysis, and they showed opposite levels of
expression (table1). The first is aldehyde dehydrogenase 3 family member A1 (ALDH3A1), a gene that
encodes for the aldehyde dehydrogenase [NAD(P)+] enzyme that catalyses the conversion between
the acetate and acetaldehyde (Khanna et al., 2011), which was significantly upregulated in PDAC
tumours. While the second gene is the previously mentioned Hexokinase-3 (HK3) glucose-
phosphorylating isoenzyme and its role in this pathway is catalysing the phosphorylation of glucose to
glucose-6-phosphate (Griffin et al., 1991). This gene was significantly downregulated in PDAC
tumours. The significant downregulation of Hexokinase-3 can explain the appearance of both beta-D-
glucose-6-phosphate and beta-D-glucose as a downregulated reporter metabolite. Noticeably, the
upregulation of ALDH3A1 did not show a significant alteration on the metabolite level, which can
partially be explained by it being affecting a peripheral reaction in this pathway.
A previous study of the altered metabolism of PDAC investigated the gene-metabolite interactions by
utilising both transcriptomics and metabolomics to detect the tumour potential biomarkers and
altered metabolic pathways (An et al., 2018). The study revealed pyrimidine metabolism as the most
significant pathway and that Ectonucleoside Triphosphate diphosphohydrolase 8 (ENTPD8) is
differentially downregulated in PDAC. ENTPD8 encodes the enzyme that catalyses the hydrolysis of
gamma- and beta-phosphate residues of nucleotides, playing a central role in the concentration of
extracellular nucleotides (Knowles and Li, 2006). Interestingly, in terms of pyrimidine metabolism
significance and its association with ENTPD8, it matched the results of the GSA showed in our study.
However, it did not match in terms of downregulation of the ENTPD8 (table1) as the DE analysis result
here showed a significant upregulation of the gene. Notably, the survival analysis performed within
the human pathology atlas study (Uhlen et al., 2017) based on the ENTPD8 expression showed a trend
(not significant) towards that a shorter overall survival rate accompanies the increased gene
expression. Concluding that the pathology atlas results supports the idea of overexpression of ENTPD8
is a pancreatic cancer trait, as shown in our study. In addition, the altered expression of the ENTPD8
can partially explain the accumulation of metabolites of the nucleotide metabolism like extracellular
UMP, IDP, IMP and UDP and depletion in GMP, AMP,cyclic-AMP and cyclic-GMP in the nuclease and
Golgi apparatus, that was demonstrated in the reporter metabolite analysis (figure2).
Page | 20
In order to detect PDAC metabolic networks that have significant alterations which maintain the
cancer growth and spread, DIRAC analysis was performed. The algorithm can take into account the
combinatorial differences in the tumour gene expression, which might have a critical impact on
cellular behaviour. Briefly, for a specific gene set, the algorithm calculates the gene expression order
and build a rank template based on the average ordering in each phenotype. Subsequently, it
calculates the matching degree of each sample to the rank template that is termed the rank matching
score and averaging this score across all samples yields the rank conservation index that measures the
degree of entropy in a gene set. The network with low entropy is said to be tightly regulated while the
one with high entropy is said to be loosely regulated (Eddy et al., 2010).
This algorithm has been used in several studies in order to find an underlying metabolic alteration in
cancer. One study used the Dirac analysis and GEM reconstruction to find metabolic process required
for the Hepatocellular carcinoma cell proliferation and showed a tight regulation of the fatty acid
biosynthesis and deregulation of fatty acid oxidation (Bjornson et al., 2015). Another study applied
the algorithm to study the metabolic alteration that is accompanied by prostate cancer. That study
revealed significant metabolic alterations in the lipid metabolism including glycosphingolipid
biosynthesis, ether lipid metabolism and steroid biosynthesis and pointed out changes in the
metabolism of the pentose phosphate pathway as well as riboflavin metabolism (Turanli et al., 2019).
In this project, the Algorithm used the network construction of the reconstructed PDAC-specific GEM
in addition to the KEGG pathways and revealed the close results in the tight regulation of four
metabolic pathways namely, oxidative phosphorylation, Cysteine and methionine metabolism, Beta-
alanine metabolism and Riboflavin metabolism (table 2). Subsequently, the gene content of the four
pathways was extracted and filtered based on its prognostic effect. Such information was derived from
the results of the pathology atlas of the human cancer transcriptome, where the effect of the gene
expression in the patient's survival rates was provided (Uhlen et al., 2017).
To find hidden patterns in the transcriptomics data that could be used for the PDAC stratification, the
unsupervised class discovery has proven its efficacy in revealing PDAC groups that share common
biological characteristics. The analysis was performed based on the top eight prognostic genes in the
tightly regulated pathways as it detected two groups that showed genetic alterations between them
(appendix figure 1). Moreover, to assess the results of the clustering, a survival analysis was performed
using the clinical data for the 177 patients, which showed a significant difference in the survival
outcome between the two groups of PDAC patients where the group PDAC1 had a significantly longer
survival time compared to the PDAC2 group (figure 4A). Consequently, differential expression analysis
was performed to detect the underlying genetic differences between the two PDAC groups. The
analysis successfully detected 1461 genes that have possessed significantly altered expression with
1131 of them demonstrated an upregulated state while 330 were downregulated.
Interestingly, 139 of the differentially expressed genes between the PDAC groups were defined as
prognostic genes in the pathology atlas. In addition, six out of the eight genes used in the classification
process were differentially expressed, and they are LDHA, ATP6VOD1, COX6B2, DNMT3A, ATP6VOA1,
and MTMR2. The L-lactate dehydrogenase A chain (LDHA) is a gene that encodes an enzyme that
catalyses the reaction responsible for the production of the pyruvate and NADH from L-lactate and
NAD (Adams et al., 1973). A previous study demonstrated the overexpression of the LDHA in
pancreatic cancer and its ability to induce pancreatic cancer cell growth (Rong et al., 2013). In addition,
knocking down the LDHA in the pancreatic cancer cells significantly inhibited the cell growth revealing

Page | 21
the oncogenic trait of LDHA and its association with poor prognosis (Rong et al., 2013). That was in
parallel with the results introduced here where LDHA was significantly upregulated in the PDAC group
with the poor survival rate. Another recent study evaluated the expression of LDHA by
immunohistochemistry and correlated the results with clinicopathological characteristics and patient
survival. Also, LDHA expression was assessed in 10 human pancreatic cancer cells and detected the
significant overexpression of the gene and its association with the poor survival outcome (Mohammad
et al., 2016). Those genes could be the basis for a potential gene signature that could be used for
PDAC patients’ stratification.
Conclusion and Future perspectives
In conclusion, this study has shed light on the undeniable value of using GEMs in deciphering the
genetic and metabolic nature of cancer and overcome the heterogenic nature of some of the tumours.
Here, the integration of both the transcriptomics and proteomics data represented a great added
value as it allowed to include more information about PDAC and prevented potential false negatives
that could be included during the GEM reconstruction. This significant value of integration was shown
by the added 5244 genes from the TCGA data to the HPA data. The reconstructed PDAC specific GEM
showed its ability to define metabolic alterations that were found in PDAC and provided consistent
results with other gene sets like KEGG and GO biological processes during the GSA. The differentially
expressed genes and reporter metabolites associated with the altered metabolic pathways in PDAC
tumours including the lipid metabolism-related pathways (Ether lipid metabolism, Arachidonic acid
metabolism, Acylglycerides metabolism) as well as carbohydrate metabolism (Ascorbate and aldarate
metabolism, Glycolysis / Gluconeogenesis) in addition to Nucleotide metabolism are considered
potential candidates as diagnostic biomarkers. Classification of the filtered DIRAC tightly regulated
network genes based on their prognostic values from the pathology atlas managed to detect two
groups of PDAC patients. The detected groups had a significantly different survival outcome, and the
differential expression analysis showed that six of the eight genes used in clustering were showing
significantly altered expression and suggesting their high value in PDAC patient stratification. One
major wekanes of the study was the highly unbalanced data. For the future perspective, generating a
more sufficient and balanced data is greatly desirable and with the fact that GEM is a great platform
for data integration, starting to use more types of data is of great significance. Such data could be
metabolomics that can provide a new aspect to the investigation, but it comes with the limitation
that the prediction of the level of the metabolites intracellularly requires previous knowledge of
thermodynamics and kinetics which is not clearly defined (Yizhak et al., 2010). Lastly, the systems-
level analysis results allow for elucidating the undelaying altered metabolic mechanisms of PDAC that
could provide more insights for the biomarker discovery and developing potential treatments.

Page | 22
Ethical aspects and impact of the research on society
The systems biology discipline is considered as a rapidly growing and interdisciplinary field
(Westerhoff and Palsson, 2004). With the tremendous advances made by genomics and the massively
produced high-throughput data, the role of systems biology comes to light for integrating this massive
amount of data into a more comprehensive mathematical representation. Those mathematical
models have more holistic predictions of the biological process that occurs in the living organisms.
Due to the systems complex nature, the attempts to conceptualise the ethical, social and legal issues
raised by systems biology faced a considerable proportion of complications. For that fact and despite
its widespread practice, there has not been a concentration on the systems biology bioethical nor to
its potential social consequences. The reason for the systems biology field to be exempt from the
social and ethical considerations is mainly because of the vague nature of the questioned scientific
object compared to other disciplines such as genomics. As one of the most attractive features of the
systems biology approaches to the industry is the fact that it reduces experimental studies on living
organisms and compensates that by the utilisation of the computer simulations (O'Malley et al., 2007).
Such an attractive trait of the systems biology approach can be demonstrated in the in silico drug
testing that can allow for exhaustive knowledge of side-effects and beneficial impact of drug usage
before entering the clinical trial phase. Applying the systems biology approach plays a crucial rule in
the cost reduction of the drug development process, which makes it attractive to the pharmaceutical
companies. During the project, no ethical approval was needed. However, it is worth to notice that all
the used datasets during in silico analysis were retrieved from public repositories where informed
consents were obtained from patients who are involved in the research.
Acknowledgements
This work was financially supported by the Knut and Alice Wallenberg Foundation. I would like to
express my gratitude and appreciation to my supervisor Adil Mardinoglu for his support and
continuous guidance and to my colleagues Gholamreza Bidkhori, Muhammad Arif and Rui Benfeitas
for sharing their knowledge and insights with me. My deepest gratefulness, appreciation and love goes
to my family for supporting me by all manners throughout this journey. Thanks for believing in me.
Page | 23
References
Adams, M. J., Buehner, M., Chandrasekhar, K., Ford, G. C., Hackert, M. L., Liljas, A., Rossmann, M. G., Smiley, I. E., Allison, W. S., Everse, J., Kaplan, N. O. and Taylor, S. S. (1973) 'Structure-function relationships in lactate dehydrogenase', Proc Natl Acad Sci U S A, 70(7), pp. 1968-72.
Adamska, A., Domenichini, A. and Falasca, M. (2017) 'Pancreatic Ductal Adenocarcinoma: Current and Evolving Therapies', Int J Mol Sci, 18(7).
Agren, R., Bordel, S., Mardinoglu, A., Pornputtapong, N., Nookaew, I. and Nielsen, J. (2012) 'Reconstruction of genome-scale active metabolic networks for 69 human cell types and 16 cancer types using INIT', PLoS Comput Biol, 8(5), pp. e1002518.
Agren, R., Liu, L., Shoaie, S., Vongsangnak, W., Nookaew, I. and Nielsen, J. (2013) 'The RAVEN toolbox and its use for generating a genome-scale metabolic model for Penicillium chrysogenum', PLoS Comput Biol, 9(3), pp. e1002980.
Agren, R., Mardinoglu, A., Asplund, A., Kampf, C., Uhlen, M. and Nielsen, J. (2014) 'Identification of anticancer drugs for hepatocellular carcinoma through personalized genome-scale metabolic modeling', Mol Syst Biol, 10, pp. 721.
An, Y., Cai, H., Yang, Y., Zhang, Y., Liu, S., Wu, X., Duan, Y., Sun, D. and Chen, X. (2018) 'Identification of ENTPD8 and cytidine in pancreatic cancer by metabolomic and transcriptomic conjoint analysis', Cancer Sci, 109(9), pp. 2811-2821.
Bardeesy, N. and DePinho, R. A. (2002) 'Pancreatic cancer biology and genetics', Nat Rev Cancer, 2(12), pp. 897-909.
Bergfeld, A. K., Pearce, O. M., Diaz, S. L., Pham, T. and Varki, A. (2012) 'Metabolism of vertebrate amino sugars with N-glycolyl groups: elucidating the intracellular fate of the non-human sialic acid N-glycolylneuraminic acid', J Biol Chem, 287(34), pp. 28865-81.
Bjornson, E., Mukhopadhyay, B., Asplund, A., Pristovsek, N., Cinar, R., Romeo, S., Uhlen, M., Kunos, G., Nielsen, J. and Mardinoglu, A. (2015) 'Stratification of Hepatocellular Carcinoma Patients Based on Acetate Utilization', Cell Rep, 13(9), pp. 2014-26.
Bordbar, A. and Palsson, B. O. (2012) 'Using the reconstructed genome-scale human metabolic network to study physiology and pathology', J Intern Med, 271(2), pp. 131-41.
Brandt, C., McFie, P. J. and Stone, S. J. (2016) 'Biochemical characterization of human acyl coenzyme A: 2-monoacylglycerol acyltransferase-3 (MGAT3)', Biochem Biophys Res Commun, 475(3), pp. 264-70.
Cairns, R. A. and Mak, T. W. (2016) 'The current state of cancer metabolism FOREWORD', Nat Rev Cancer, 16(10), pp. 613-614.
Cheng, D., Nelson, T. C., Chen, J., Walker, S. G., Wardwell-Swanson, J., Meegalla, R., Taub, R., Billheimer, J. T., Ramaker, M. and Feder, J. N. (2003) 'Identification of acyl coenzyme A:monoacylglycerol acyltransferase 3, an intestinal specific enzyme implicated in dietary fat absorption', J Biol Chem, 278(16), pp. 13611-4.

Page | 24
Croft, D., O'Kelly, G., Wu, G., Haw, R., Gillespie, M., Matthews, L., Caudy, M., Garapati, P., Gopinath, G., Jassal, B., Jupe, S., Kalatskaya, I., Mahajan, S., May, B., Ndegwa, N., Schmidt, E., Shamovsky, V., Yung, C., Birney, E., Hermjakob, H., D'Eustachio, P. and Stein, L. (2011) 'Reactome: a database of reactions, pathways and biological processes', Nucleic Acids Res, 39(Database issue), pp. D691-7.
Cupillard, L., Koumanov, K., Mattei, M. G., Lazdunski, M. and Lambeau, G. (1997) 'Cloning, chromosomal mapping, and expression of a novel human secretory phospholipase A2', J Biol Chem, 272(25), pp. 15745-52.
DeBerardinis, R. J. and Chandel, N. S. (2016) 'Fundamentals of cancer metabolism', Sci Adv, 2(5), pp. e1600200.
DeBerardinis, R. J. and Thompson, C. B. (2012) 'Cellular metabolism and disease: what do metabolic outliers teach us?', Cell, 148(6), pp. 1132-44.
Duarte, N. C., Becker, S. A., Jamshidi, N., Thiele, I., Mo, M. L., Vo, T. D., Srivas, R. and Palsson, B. O. (2007) 'Global reconstruction of the human metabolic network based on genomic and bibliomic data', Proc Natl Acad Sci U S A, 104(6), pp. 1777-82.
Eddy, J. A., Hood, L., Price, N. D. and Geman, D. (2010) 'Identifying tightly regulated and variably expressed networks by Differential Rank Conservation (DIRAC)', PLoS Comput Biol, 6(5), pp. e1000792.
Fagerberg, L., Hallstrom, B. M., Oksvold, P., Kampf, C., Djureinovic, D., Odeberg, J., Habuka, M., Tahmasebpoor, S., Danielsson, A., Edlund, K., Asplund, A., Sjostedt, E., Lundberg, E., Szigyarto, C. A., Skogs, M., Takanen, J. O., Berling, H., Tegel, H., Mulder, J., Nilsson, P., Schwenk, J. M., Lindskog, C., Danielsson, F., Mardinoglu, A., Sivertsson, A., von Feilitzen, K., Forsberg, M., Zwahlen, M., Olsson, I., Navani, S., Huss, M., Nielsen, J., Ponten, F. and Uhlen, M. (2014) 'Analysis of the human tissue-specific expression by genome-wide integration of transcriptomics and antibody-based proteomics', Mol Cell Proteomics, 13(2), pp. 397-406.
Ferlay, J., Soerjomataram, I., Dikshit, R., Eser, S., Mathers, C., Rebelo, M., Parkin, D. M., Forman, D. and Bray, F. (2015) 'Cancer incidence and mortality worldwide: sources, methods and major patterns in GLOBOCAN 2012', Int J Cancer, 136(5), pp. E359-86.
Flach, J., Pilet, P. E. and Jolles, P. (1992) 'What's new in chitinase research?', Experientia, 48(8), pp. 701-16.
Fondi, M. and Lio, P. (2015) 'Genome-scale metabolic network reconstruction', Methods Mol Biol, 1231, pp. 233-56.
Ghaffari, P., Mardinoglu, A. and Nielsen, J. (2015) 'Cancer Metabolism: A Modeling Perspective', Front Physiol, 6, pp. 382.
Gille, C., Bolling, C., Hoppe, A., Bulik, S., Hoffmann, S., Hubner, K., Karlstadt, A., Ganeshan, R., Konig, M., Rother, K., Weidlich, M., Behre, J. and Holzhutter, H. G. (2010) 'HepatoNet1: a comprehensive metabolic reconstruction of the human hepatocyte for the analysis of liver physiology', Mol Syst Biol, 6, pp. 411.
Greaves, M. and Maley, C. C. (2012) 'Clonal evolution in cancer', Nature, 481(7381), pp. 306-13.
Griffin, L. D., Gelb, B. D., Wheeler, D. A., Davison, D., Adams, V. and McCabe, E. R. (1991) 'Mammalian hexokinase 1: evolutionary conservation and structure to function analysis', Genomics, 11(4), pp. 1014-24.

Page | 25
Grossman, R. L., Heath, A. P., Ferretti, V., Varmus, H. E., Lowy, D. R., Kibbe, W. A. and Staudt, L. M. (2016) 'Toward a Shared Vision for Cancer Genomic Data', N Engl J Med, 375(12), pp. 1109-12.
Hanahan, D. and Weinberg, R. A. (2000) 'The hallmarks of cancer', Cell, 100(1), pp. 57-70.
Hanahan, D. and Weinberg, R. A. (2011) 'Hallmarks of cancer: the next generation', Cell, 144(5), pp. 646-74.
Kanehisa, M. and Goto, S. (2000) 'KEGG: kyoto encyclopedia of genes and genomes', Nucleic Acids Res, 28(1), pp. 27-30.
Khanna, M., Chen, C. H., Kimble-Hill, A., Parajuli, B., Perez-Miller, S., Baskaran, S., Kim, J., Dria, K., Vasiliou, V., Mochly-Rosen, D. and Hurley, T. D. (2011) 'Discovery of a novel class of covalent inhibitor for aldehyde dehydrogenases', J Biol Chem, 286(50), pp. 43486-94.
Knowles, A. F. and Li, C. (2006) 'Molecular cloning and characterization of expressed human ecto-nucleoside triphosphate diphosphohydrolase 8 (E-NTPDase 8) and its soluble extracellular domain', Biochemistry, 45(23), pp. 7323-33.
Lazar, M. A. and Birnbaum, M. J. (2012) 'Physiology. De-meaning of metabolism', Science, 336(6089), pp. 1651-2.
Le, A., Cooper, C. R., Gouw, A. M., Dinavahi, R., Maitra, A., Deck, L. M., Royer, R. E., Vander Jagt, D. L., Semenza, G. L. and Dang, C. V. (2010) 'Inhibition of lactate dehydrogenase A induces oxidative stress and inhibits tumor progression', Proc Natl Acad Sci U S A, 107(5), pp. 2037-42.
Lewis, N. E., Nagarajan, H. and Palsson, B. O. (2012) 'Constraining the metabolic genotype-phenotype relationship using a phylogeny of in silico methods', Nat Rev Microbiol, 10(4), pp. 291-305.
Liang, C., Qin, Y., Zhang, B., Ji, S., Shi, S., Xu, W., Liu, J., Xiang, J., Liang, D., Hu, Q., Ni, Q., Xu, J. and Yu, X. (2016) 'Metabolic plasticity in heterogeneous pancreatic ductal adenocarcinoma', Biochim Biophys Acta, 1866(2), pp. 177-188.
Liberzon, A., Birger, C., Thorvaldsdottir, H., Ghandi, M., Mesirov, J. P. and Tamayo, P. (2015) 'The Molecular Signatures Database (MSigDB) hallmark gene set collection', Cell Syst, 1(6), pp. 417-425.
Lohr, M., Kloppel, G., Maisonneuve, P., Lowenfels, A. B. and Luttges, J. (2005) 'Frequency of K-ras mutations in pancreatic intraductal neoplasias associated with pancreatic ductal adenocarcinoma and chronic pancreatitis: a meta-analysis', Neoplasia, 7(1), pp. 17-23.
Love, M. I., Huber, W. and Anders, S. (2014) 'Moderated estimation of fold change and dispersion for RNA-seq data with DESeq2', Genome Biol, 15(12), pp. 550.
Ma, H., Sorokin, A., Mazein, A., Selkov, A., Selkov, E., Demin, O. and Goryanin, I. (2007) 'The Edinburgh human metabolic network reconstruction and its functional analysis', Mol Syst Biol, 3, pp. 135.
Mardinoglu, A., Boren, J., Smith, U., Uhlen, M. and Nielsen, J. (2018) 'Systems biology in hepatology: approaches and applications', Nat Rev Gastroenterol Hepatol, 15(6), pp. 365-377.
Mardinoglu, A., Gatto, F. and Nielsen, J. (2013) 'Genome-scale modeling of human metabolism - a systems biology approach', Biotechnol J, 8(9), pp. 985-96.
Mardinoglu, A. and Nielsen, J. (2012) 'Systems medicine and metabolic modelling', J Intern Med, 271(2), pp. 142-54.

Page | 26
Mardinoglu, A. and Nielsen, J. (2015) 'New paradigms for metabolic modeling of human cells', Curr Opin Biotechnol, 34, pp. 91-7.
McKnight, S. L. (2010) 'On getting there from here', Science, 330(6009), pp. 1338-9.
Mohammad, G. H., Olde Damink, S. W., Malago, M., Dhar, D. K. and Pereira, S. P. (2016) 'Pyruvate Kinase M2 and Lactate Dehydrogenase A Are Overexpressed in Pancreatic Cancer and Correlate with Poor Outcome', PLoS One, 11(3), pp. e0151635.
Nilsson, A. and Nielsen, J. (2017) 'Genome scale metabolic modeling of cancer', Metab Eng, 43(Pt B), pp. 103-112.
Nourbakhsh, M., Douglas, D. N., Pu, C. H., Lewis, J. T., Kawahara, T., Lisboa, L. F., Wei, E., Asthana, S., Quiroga, A. D., Law, L. M., Chen, C., Addison, W. R., Nelson, R., Houghton, M., Lehner, R. and Kneteman, N. M. (2013) 'Arylacetamide deacetylase: a novel host factor with important roles in the lipolysis of cellular triacylglycerol stores, VLDL assembly and HCV production', J Hepatol, 59(2), pp. 336-43.
O'Malley, M. A., Calvert, J. and Dupre, J. (2007) 'The study of socioethical issues in systems biology', Am J Bioeth, 7(4), pp. 67-78.
Orth, J. D., Thiele, I. and Palsson, B. O. (2010) 'What is flux balance analysis?', Nat Biotechnol, 28(3), pp. 245-8.
Patil, K. R. and Nielsen, J. (2005) 'Uncovering transcriptional regulation of metabolism by using metabolic network topology', Proc Natl Acad Sci U S A, 102(8), pp. 2685-9.
Pavlova, N. N. and Thompson, C. B. (2016) 'The Emerging Hallmarks of Cancer Metabolism', Cell Metab, 23(1), pp. 27-47.
Perera, R. M. and Bardeesy, N. (2015) 'Pancreatic Cancer Metabolism: Breaking It Down to Build It Back Up', Cancer Discov, 5(12), pp. 1247-61.
Price, N. D., Reed, J. L. and Palsson, B. O. (2004) 'Genome-scale models of microbial cells: evaluating the consequences of constraints', Nat Rev Microbiol, 2(11), pp. 886-97.
Rahib, L., Smith, B. D., Aizenberg, R., Rosenzweig, A. B., Fleshman, J. M. and Matrisian, L. M. (2014) 'Projecting cancer incidence and deaths to 2030: the unexpected burden of thyroid, liver, and pancreas cancers in the United States', Cancer Res, 74(11), pp. 2913-21.
Romero, P., Wagg, J., Green, M. L., Kaiser, D., Krummenacker, M. and Karp, P. D. (2005) 'Computational prediction of human metabolic pathways from the complete human genome', Genome Biol, 6(1), pp. R2.
Rong, Y., Wu, W., Ni, X., Kuang, T., Jin, D., Wang, D. and Lou, W. (2013) 'Lactate dehydrogenase A is overexpressed in pancreatic cancer and promotes the growth of pancreatic cancer cells', Tumour Biol, 34(3), pp. 1523-30.
Schmidt, B. J., Papin, J. A. and Musante, C. J. (2013) 'Mechanistic systems modeling to guide drug discovery and development', Drug Discov Today, 18(3-4), pp. 116-27.
Siegel, R. L., Miller, K. D. and Jemal, A. (2016) 'Cancer statistics, 2016', CA Cancer J Clin, 66(1), pp. 7-30.
Son, J., Lyssiotis, C. A., Ying, H., Wang, X., Hua, S., Ligorio, M., Perera, R. M., Ferrone, C. R., Mullarky, E., Shyh-Chang, N., Kang, Y., Fleming, J. B., Bardeesy, N., Asara, J. M., Haigis, M. C., DePinho,

Page | 27
R. A., Cantley, L. C. and Kimmelman, A. C. (2013) 'Glutamine supports pancreatic cancer growth through a KRAS-regulated metabolic pathway', Nature, 496(7443), pp. 101-5.
Sousa, C. M. and Kimmelman, A. C. (2014) 'The complex landscape of pancreatic cancer metabolism', Carcinogenesis, 35(7), pp. 1441-50.
Sud, M., Fahy, E., Cotter, D., Brown, A., Dennis, E. A., Glass, C. K., Merrill, A. H., Jr., Murphy, R. C., Raetz, C. R., Russell, D. W. and Subramaniam, S. (2007) 'LMSD: LIPID MAPS structure database', Nucleic Acids Res, 35(Database issue), pp. D527-32.
Therneau, T. M. and Lumley, T. (2018) 'Package ‘survival’'.
Thiele, I. and Palsson, B. O. (2010) 'A protocol for generating a high-quality genome-scale metabolic reconstruction', Nat Protoc, 5(1), pp. 93-121.
Tian, Q., Price, N. D. and Hood, L. (2012) 'Systems cancer medicine: towards realization of predictive, preventive, personalized and participatory (P4) medicine', J Intern Med, 271(2), pp. 111-21.
Turanli, B., Zhang, C., Kim, W., Benfeitas, R., Uhlen, M., Arga, K. Y. and Mardinoglu, A. (2019) 'Discovery of therapeutic agents for prostate cancer using genome-scale metabolic modeling and drug repositioning', EBioMedicine, 42, pp. 386-396.
Uhlén, M., Fagerberg, L., Hallström, B. M., Lindskog, C., Oksvold, P., Mardinoglu, A., Sivertsson, Å., Kampf, C., Sjöstedt, E., Asplund, A., Olsson, I., Edlund, K., Lundberg, E., Navani, S., Szigyarto, C. A.-K., Odeberg, J., Djureinovic, D., Takanen, J. O., Hober, S., Alm, T., Edqvist, P.-H., Berling, H., Tegel, H., Mulder, J., Rockberg, J., Nilsson, P., Schwenk, J. M., Hamsten, M., von Feilitzen, K., Forsberg, M., Persson, L., Johansson, F., Zwahlen, M., von Heijne, G., Nielsen, J. and Pontén, F. (2015) 'Tissue-based map of the human proteome', Science, 347.
Uhlen, M., Zhang, C., Lee, S., Sjostedt, E., Fagerberg, L., Bidkhori, G., Benfeitas, R., Arif, M., Liu, Z., Edfors, F., Sanli, K., von Feilitzen, K., Oksvold, P., Lundberg, E., Hober, S., Nilsson, P., Mattsson, J., Schwenk, J. M., Brunnstrom, H., Glimelius, B., Sjoblom, T., Edqvist, P. H., Djureinovic, D., Micke, P., Lindskog, C., Mardinoglu, A. and Ponten, F. (2017) 'A pathology atlas of the human cancer transcriptome', Science, 357(6352).
Varemo, L., Nielsen, J. and Nookaew, I. (2013) 'Enriching the gene set analysis of genome-wide data by incorporating directionality of gene expression and combining statistical hypotheses and methods', Nucleic Acids Res, 41(8), pp. 4378-91.
Varemo, L., Scheele, C., Broholm, C., Mardinoglu, A., Kampf, C., Asplund, A., Nookaew, I., Uhlen, M., Pedersen, B. K. and Nielsen, J. (2015) 'Proteome- and transcriptome-driven reconstruction of the human myocyte metabolic network and its use for identification of markers for diabetes', Cell Rep, 11(6), pp. 921-933.
Vincent, A., Herman, J., Schulick, R., Hruban, R. H. and Goggins, M. (2011) 'Pancreatic cancer', Lancet, 378(9791), pp. 607-20.
Warburg, O. (1956) 'On the origin of cancer cells', Science, 123(3191), pp. 309-14.
Warburg, O., Wind, F. and Negelein, E. (1927) 'The Metabolism of Tumors in the Body', J Gen Physiol, 8(6), pp. 519-30.
Weinhouse, S. (1951) 'Studies on the fate of isotopically labeled metabolites in the oxidative metabolism of tumors', Cancer Res, 11(8), pp. 585-91.

Page | 28
Weinhouse, S. (1956) 'On respiratory impairment in cancer cells', Science, 124(3215), pp. 267-9.
Weinhouse, S. (1972) 'Glycolysis, respiration, and anomalous gene expression in experimental hepatomas: G.H.A. Clowes memorial lecture', Cancer Res, 32(10), pp. 2007-16.
Westerhoff, H. V. and Palsson, B. O. (2004) 'The evolution of molecular biology into systems biology', Nat Biotechnol, 22(10), pp. 1249-52.
Wilkerson, M. D. and Hayes, D. N. (2010) 'ConsensusClusterPlus: a class discovery tool with confidence assessments and item tracking', Bioinformatics, 26(12), pp. 1572-3.
Ying, H., Kimmelman, A. C., Lyssiotis, C. A., Hua, S., Chu, G. C., Fletcher-Sananikone, E., Locasale, J. W., Son, J., Zhang, H., Coloff, J. L., Yan, H., Wang, W., Chen, S., Viale, A., Zheng, H., Paik, J. H., Lim, C., Guimaraes, A. R., Martin, E. S., Chang, J., Hezel, A. F., Perry, S. R., Hu, J., Gan, B., Xiao, Y., Asara, J. M., Weissleder, R., Wang, Y. A., Chin, L., Cantley, L. C. and DePinho, R. A. (2012) 'Oncogenic Kras maintains pancreatic tumors through regulation of anabolic glucose metabolism', Cell, 149(3), pp. 656-70.
Yizhak, K., Benyamini, T., Liebermeister, W., Ruppin, E. and Shlomi, T. (2010) 'Integrating quantitative proteomics and metabolomics with a genome-scale metabolic network model', Bioinformatics, 26(12), pp. i255-60.
Yizhak, K., Chaneton, B., Gottlieb, E. and Ruppin, E. (2015) 'Modeling cancer metabolism on a genome scale', Mol Syst Biol, 11(6), pp. 817.

Page | 29
Appendix
Table Appendix 1: the connectivity genes in the PDAC specific GEM. Details on the 38 genes incorporated to PDAC-specific GEM for enhancing the model connectivity. Each gene is shown in the context of its associated reaction and subsystem in the PDAC-specific GEM.
connectivity genes REACTION ID in HMR2
REACTION EQUATION SUBSYSTEM
ENSG00000185818 HMR_8626 acetyl-CoA[m] + aspartate[m] => CoA[m] + N-acetyl-L-aspartate[m]
Alanine, aspartate and glutamate metabolism
ENSG00000122787 HMR_2014 4-androstene-3,17-dione[c] + H+[c] + NADPH[c] => 5alpha-androstane-3,17-dione[c] + NADP+[c]
Androgen metabolism
ENSG00000172508 HMR_4606 4-aminobutyrate[c] + ATP[c] + histidine[c] => AMP[c] + homocarnosine[c] + PPi[c]
Arginine and proline metabolism
ENSG00000242110 HMR_3491 (2R)-pristanoyl-CoA[p] <=> (2S)-pristanoyl-CoA[p]
Beta oxidation of phytanic acid (peroxisomal)
ENSG00000105398 HMR_1729 chenodiol[c] + H+[c] + PAPS[c] => PAP[c] + sulfochenodeoxycholate[c]
Bile acid biosynthesis
ENSG00000146233 HMR_1737 24-hydroxycholesterol[c] + H+[c] + NADPH[c] + O2[c] => cholest-5-ene-3beta,7alpha,24(S)-triol[c] + H2O[c] + NADP+[c]
Bile acid biosynthesis
ENSG00000167910 HMR_1581 cholesterol[r] + H+[r] + NADPH[r] + O2[r] => 7alpha-hydroxycholesterol[r] + H2O[r] + NADP+[r]
Bile acid biosynthesis
ENSG00000180432 HMR_1590 7alpha-hydroxycholest-4-en-3-one[r] + H+[r] + NADH[r] + O2[r] => 7alpha,12alpha-dihydroxycholest-4-en-3-one[r] + H2O[r] + NAD+[r]
Bile acid biosynthesis
ENSG00000198610 HMR_1742 5beta-cholestan-7alpha,12alpha,24(S)-triol-3-one[c] + H+[c] + NADPH[c] => 5beta-cholestan-3alpha,7alpha,12alpha,24(S)-tetrol[c] + NADP+[c]
Bile acid biosynthesis
ENSG00000111700 HMR_1881 cholate[s] + HCO3-[c] + S-glutathionyl-2-4-dinitrobenzene[c] <=> cholate[c] + HCO3-[s] + S-glutathionyl-2-4-dinitrobenzene[s]
Bile acid recycling
ENSG00000160200 HMR_3879 homocysteine[c] + serine[c] => H2O[c] + L-cystathionine[c]
Cysteine and methionine metabolism
ENSG00000160868 HMR_2046 estradiol-17beta[c] + H+[c] + NADPH[c] + O2[c] => 4-hydroxy-17beta-estradiol[c] + H2O[c] + NADP+[c]
Estrogen metabolism
ENSG00000116882 HMR_7703 glycolate[c] + O2[c] => glyoxalate[c] + H2O2[c] Glycine, serine and threonine metabolism
ENSG00000124713 HMR_3901 glycine[c] + SAM[c] => SAH[c] + sarcosine[c] Glycine, serine and threonine metabolism
ENSG00000172482 HMR_4198 pyruvate[m] + serine[m] => alanine[m] + hydroxypyruvate[m]
Glycine, serine and threonine metabolism
ENSG00000172461 HMR_0893 GDP-L-fucose[c] + nLc8Cer[c] => G00084[c] + GDP[c]
Glycosphingolipid biosynthesis-lacto and neolacto series
ENSG00000256062 HMR_0867 IV2Fuc-Lc4Cer[c] + UDP-N-acetyl-D-galactosamine[c] => type I A glycolipid[c] + UDP[c]
Glycosphingolipid biosynthesis-lacto and neolacto series

Page | 30
ENSG00000184886 HMR_7187 6-(alpha-D-glucosaminyl)-1-phosphatidyl-1D-myo-inositol[r] + palmitoyl-CoA[r] => CoA[r] + glucosaminyl-acylphosphatidylinositol[r]
Glycosylphosphatidylinositol (GPI)-anchor biosynthesis
ENSG00000127080 HMR_6576 1D-myo-inositol-1,3,4,5,6-pentakisphosphate[c] + ATP[c] => ADP[c] + myo-inositol-hexakisphosphate[c]
Inositol phosphate metabolism
ENSG00000182621 HMR_8818 H2O[n] + phosphatidylinositol-4,5-bisphosphate[n] => 1,2-diacylglycerol-LD-TAG pool[n] + D-myo-inositol-1,4,5-trisphosphate[n]
Inositol phosphate metabolism
ENSG00000213316 HMR_1081 GSH[c] + leukotriene A4[c] => leukotriene C4[c]
Leukotriene metabolism
ENSG00000130649 HMR_7099 1,2-dibromoethane[c] + H+[c] + NADPH[c] + O2[c] => 2-bromoacetaldehyde[c] + H2O[c] + hydrobromic acid[c] + NADP+[c]
Metabolism of xenobiotics by cytochrome P450
ENSG00000140505 HMR_7018 aflatoxin B1[c] + H+[c] + NADPH[c] + O2[c] => aflatoxin M1[c] + H2O[c] + NADP+[c]
Metabolism of xenobiotics by cytochrome P450
ENSG00000198488 HMR_7174 Tn-antigen[g] + UDP-N-acetylglucosamine[g] => core 3[g] + UDP[g]
O-glycan metabolism
ENSG00000132330 HMR_7133 alanine[c] + pyridoxal-phosphate[c] + selenide[c] <=> pyridoxine-phosphate[c] + selenocysteine[c]
Other amino acid
ENSG00000077498 HMR_6874 O2[c] + tyrosine[c] => H2O[c] + L-dopaquinone[c]
Phenylalanine, tyrosine and tryptophan biosynthesis
ENSG00000117009 HMR_4220 H+[c] + kynurenine[c] + NADPH[c] + O2[c] => 3-hydroxy-L-kynurenine[c] + H2O[c] + NADP+[c]
Phenylalanine, tyrosine and tryptophan biosynthesis
ENSG00000121053 HMR_6813 dopaminochrome[c] + 2 H+[c] + H2O[c] <=> dopamine-O-quinone[c] + H2O2[c]
Phenylalanine, tyrosine and tryptophan biosynthesis
ENSG00000158104 HMR_6772 4-hydroxyphenylpyruvate[c] + O2[c] => CO2[c] + homogentisate[c]
Phenylalanine, tyrosine and tryptophan biosynthesis
ENSG00000129673 HMR_4546 acetyl-CoA[c] + serotonin[c] => CoA[c] + N-acetyl-serotonin[c]
Serotonin and melatonin biosynthesis
ENSG00000196433 HMR_4547 N-acetyl-serotonin[c] + SAM[c] => melatonin[c] + SAH[c]
Serotonin and melatonin biosynthesis
ENSG00000135454 HMR_8165 LacCer pool[g] + UDP-N-acetyl-D-galactosamine[g] => GA2[g] + UDP[g]
Sphingolipid metabolism
ENSG00000140459 HMR_7935 cholesterol[m] + H+[m] + NADPH[m] + 2 O2[m] => 2 H2O[m] + isocaproic-aldehyde[m] + NADP+[m] + pregnenolone[m]
Steroid metabolism
ENSG00000203859 HMR_7930 NAD+[c] + pregnenolone[c] => H+[c] + NADH[c] + progesterone[c]
Steroid metabolism
ENSG00000081800 HMR_7904 Na+[s] + selenate[s] => Na+[c] + selenate[c] Transport, extracellular ENSG00000084453 HMR_6060 GSH[c] + HCO3-[c] + lithocholate[s] <=>
GSH[s] + HCO3-[s] + lithocholate[c] Transport, extracellular
ENSG00000132677 HMR_4873 NH3[c] <=> NH3[s] Transport, extracellular ENSG00000134538 HMR_6107 bilirubin-monoglucuronoside[s] + GSH[c] +
HCO3-[c] <=> bilirubin-monoglucuronoside[c] + GSH[s] + HCO3-[s]
Transport, extracellular

Page | 31
Table Appendix 2: PDAC tumour vs matched normal tissues DE analysis results. The complete list of differentially expressed genes (FDR adj. p-value < 0.05, LFC cutoff >1or<-1) between PDAC tumours (n=177) and noncancerous Pancreas tissue(n=4) is provided. The significance level of differential expression sorts the genes: upregulated gene highlighted (green) and downregulated genes highlighted (red).
Ensembl gene id gene name baseMean log2FoldChange lfcSE stat pvalue padj
ENSG00000090402 SI 141.345332 23.78471401 2.11199 11.26176 2.03E-29 5.27E-25 ENSG00000110245 APOC3 67.62635 22.13061296 2.164321 10.2252 1.53E-24 1.99E-20 ENSG00000164816 DEFA5 21.4507779 20.90206495 3.111877 6.716867 1.86E-11 1.61E-07 ENSG00000204019 CT83 37.0038532 16.96919279 2.618592 6.480274 9.16E-11 5.95E-07 ENSG00000248115 AC023154.1 5.94421651 -4.485669972 0.703321 -6.37784 1.80E-10 8.75E-07 ENSG00000233024 AC126755.2 3.29691156 -3.270036661 0.514163 -6.35993 2.02E-10 8.75E-07 ENSG00000223668 EEF1A1P24 14.0243833 -3.025561254 0.511938 -5.91002 3.42E-09 1.27E-05 ENSG00000136011 STAB2 92.1522949 -4.670613423 0.81512 -5.72997 1.00E-08 3.26E-05 ENSG00000188375 H3F3C 14.7585402 -2.302268954 0.404053 -5.69794 1.21E-08 3.50E-05 ENSG00000232656 IDI2-AS1 5.44854512 -3.343407724 0.589465 -5.67194 1.41E-08 3.67E-05 ENSG00000167653 PSCA 10524.9959 6.527410466 1.171677 5.570999 2.53E-08 5.99E-05 ENSG00000150045 KLRF1 34.4699128 -2.977961453 0.549679 -5.41764 6.04E-08 0.000131 ENSG00000043355 ZIC2 62.6822428 7.784236227 1.485449 5.240324 1.60E-07 0.000321 ENSG00000156886 ITGAD 32.7992677 -3.786719143 0.740467 -5.11396 3.15E-07 0.000513 ENSG00000168356 SCN11A 23.3097779 -3.052050802 0.5941 -5.13726 2.79E-07 0.000513 ENSG00000279166 AC009951.1 3.1877019 -2.646569926 0.517525 -5.11389 3.16E-07 0.000513 ENSG00000272620 AFAP1-AS1 1796.26017 4.706809422 0.926917 5.077919 3.82E-07 0.000584 ENSG00000163283 ALPP 147.250515 7.61589268 1.508226 5.049569 4.43E-07 0.00064 ENSG00000237757 EEF1A1P30 5.71103293 -1.785992117 0.355126 -5.02918 4.93E-07 0.000674 ENSG00000144452 ABCA12 190.506458 3.968519508 0.790979 5.017222 5.24E-07 0.000681 ENSG00000137441 FGFBP2 23.3114674 -3.032674188 0.605756 -5.00643 5.54E-07 0.000686 ENSG00000166143 PPP1R14D 352.463377 4.076930371 0.817742 4.985595 6.18E-07 0.00073 ENSG00000130720 FIBCD1 479.081173 5.150278379 1.041302 4.946 7.58E-07 0.000856 ENSG00000134539 KLRD1 159.585863 -2.804644666 0.570519 -4.91595 8.84E-07 0.000957 ENSG00000274414 AL121772.1 67.7250691 3.290597025 0.679527 4.842483 1.28E-06 0.001334 ENSG00000262406 MMP12 987.051742 -3.947561842 0.819322 -4.81809 1.45E-06 0.001415 ENSG00000120907 ADRA1A 10.7737345 -3.499902786 0.731996 -4.78131 1.74E-06 0.001415 ENSG00000124664 SPDEF 1616.11804 4.002164654 0.834495 4.795913 1.62E-06 0.001415 ENSG00000179066 AC020907.1 42.4139843 4.695685884 0.980444 4.789345 1.67E-06 0.001415 ENSG00000117983 MUC5B 18483.8027 4.901324538 1.024129 4.785847 1.70E-06 0.001415 ENSG00000187908 DMBT1 12329.8325 5.254564648 1.091355 4.814717 1.47E-06 0.001415 ENSG00000114248 LRRC31 208.91411 5.315928562 1.107096 4.801687 1.57E-06 0.001415 ENSG00000143869 GDF7 120.850722 -3.154337737 0.662072 -4.76434 1.89E-06 0.001493 ENSG00000261123 AC009065.5 184.534128 3.130674935 0.665795 4.702162 2.57E-06 0.001968 ENSG00000173702 MUC13 10613.7685 3.661190535 0.785335 4.661949 3.13E-06 0.002262 ENSG00000166535 A2ML1 480.922337 6.337481049 1.358428 4.665304 3.08E-06 0.002262 ENSG00000226239 AL031658.1 7.84220364 -2.59639942 0.561347 -4.6253 3.74E-06 0.002372 ENSG00000179913 B3GNT3 5039.07448 2.636525103 0.569543 4.629192 3.67E-06 0.002372 ENSG00000089356 FXYD3 15639.807 3.025428617 0.653442 4.629988 3.66E-06 0.002372 ENSG00000132437 DDC 527.009795 3.974157781 0.85582 4.643682 3.42E-06 0.002372 ENSG00000198788 MUC2 880.374935 7.49819315 1.620295 4.627673 3.70E-06 0.002372 ENSG00000225411 CR786580.1 3.02109358 -3.015185976 0.65504 -4.60306 4.16E-06 0.002577 ENSG00000117472 TSPAN1 14204.5641 2.851790076 0.623609 4.573042 4.81E-06 0.00284 ENSG00000173557 C2orf70 189.943985 3.266425838 0.713643 4.577114 4.71E-06 0.00284 ENSG00000163286 ALPPL2 102.449133 6.426869896 1.411355 4.553687 5.27E-06 0.003046 ENSG00000161640 SIGLEC11 52.8677664 -3.1914933 0.701739 -4.54798 5.42E-06 0.003061 ENSG00000073861 TBX21 63.1456333 -2.817946451 0.624743 -4.51057 6.47E-06 0.003502 ENSG00000241560 ZBTB20-AS1 4.6488207 -2.426332827 0.537665 -4.51272 6.40E-06 0.003502 ENSG00000163687 DNASE1L3 110.211053 -3.810258276 0.851043 -4.47716 7.56E-06 0.003594 ENSG00000261644 AC007728.2 14.0494759 -2.593900382 0.581884 -4.45776 8.28E-06 0.003594 ENSG00000281103 TRG-AS1 74.2589396 -2.563085132 0.574825 -4.4589 8.24E-06 0.003594 ENSG00000168010 ATG16L2 1233.66923 -1.721209253 0.383635 -4.48658 7.24E-06 0.003594 ENSG00000104081 BMF 1397.96055 -1.517088945 0.33994 -4.46281 8.09E-06 0.003594 ENSG00000060140 STYK1 568.879499 2.698522371 0.605399 4.457431 8.29E-06 0.003594 ENSG00000151012 SLC7A11 870.646737 2.865690535 0.637561 4.494772 6.96E-06 0.003594 ENSG00000203697 CAPN8 6864.3862 3.594674858 0.803667 4.47284 7.72E-06 0.003594 ENSG00000134398 ERN2 4487.21877 3.795176065 0.843606 4.498756 6.84E-06 0.003594

Page | 32
ENSG00000224511 LINC00365 46.876301 3.821710493 0.852292 4.484037 7.32E-06 0.003594 ENSG00000137440 FGFBP1 573.583081 4.505188902 1.010685 4.457558 8.29E-06 0.003594 ENSG00000167656 LY6D 1834.48987 6.244928285 1.39536 4.475495 7.62E-06 0.003594 ENSG00000104974 LILRA1 54.9944618 -2.528761528 0.568462 -4.44843 8.65E-06 0.003687 ENSG00000242797 GLYCTK-AS1 7.52415936 -2.279388232 0.513846 -4.43594 9.17E-06 0.003788 ENSG00000180251 SLC9A4 229.528154 5.754514238 1.297337 4.435637 9.18E-06 0.003788 ENSG00000231483 AL365356.4 21.3270335 4.177177669 0.94678 4.411985 1.02E-05 0.004161 ENSG00000157368 IL34 327.991253 -1.946747665 0.441887 -4.40553 1.06E-05 0.004169 ENSG00000074211 PPP2R2C 723.361174 3.807549996 0.864387 4.404914 1.06E-05 0.004169 ENSG00000169247 SH3TC2 183.248237 2.643710736 0.601279 4.396812 1.10E-05 0.004263 ENSG00000143768 LEFTY2 20.0178496 -2.963590626 0.674639 -4.39285 1.12E-05 0.004277 ENSG00000267432 DNAH17-AS1 11.1359669 -3.414411644 0.78098 -4.37196 1.23E-05 0.004574 ENSG00000111679 PTPN6 3240.77592 -1.338651213 0.306148 -4.37256 1.23E-05 0.004574 ENSG00000135723 FHOD1 1494.18231 -1.086342508 0.24877 -4.36686 1.26E-05 0.004616 ENSG00000168229 PTGDR 44.4262708 -2.383962063 0.546389 -4.36312 1.28E-05 0.00463 ENSG00000242136 AC093904.2 10.2039418 5.882498465 1.349461 4.359147 1.31E-05 0.00465 ENSG00000172478 C2orf54 565.166382 3.01825455 0.693313 4.353379 1.34E-05 0.00471 ENSG00000264345 LINC01894 2.8886384 -3.545013692 0.816673 -4.3408 1.42E-05 0.004879 ENSG00000104369 JPH1 402.616228 2.517973309 0.580206 4.339789 1.43E-05 0.004879 ENSG00000259933 AC009065.2 202.471089 2.890996472 0.666656 4.336567 1.45E-05 0.004887 ENSG00000076356 PLXNA2 4102.81231 1.556734514 0.359902 4.325441 1.52E-05 0.00501 ENSG00000164237 CMBL 2526.50731 1.878494589 0.434107 4.327259 1.51E-05 0.00501 ENSG00000188993 LRRC66 435.363947 3.346997249 0.774853 4.319527 1.56E-05 0.005082 ENSG00000100292 HMOX1 1836.03229 -1.88894292 0.437854 -4.31409 1.60E-05 0.005144 ENSG00000279277 AC012020.1 12.5002665 -2.037484312 0.472844 -4.309 1.64E-05 0.0052 ENSG00000257207 AC112229.3 32.4988241 -2.168500068 0.503835 -4.30399 1.68E-05 0.005215 ENSG00000169684 CHRNA5 222.102281 2.465808472 0.57304 4.303028 1.68E-05 0.005215 ENSG00000165828 PRAP1 590.486487 4.852541776 1.130666 4.291757 1.77E-05 0.005359 ENSG00000249395 CASC9 97.3730375 7.032465879 1.637792 4.293871 1.76E-05 0.005359 ENSG00000223572 CKMT1A 315.261322 2.587722621 0.60429 4.282254 1.85E-05 0.005466 ENSG00000261857 MIA 704.146645 4.156903379 0.970401 4.283696 1.84E-05 0.005466 ENSG00000180745 CLRN3 580.425345 3.681416126 0.860236 4.279543 1.87E-05 0.005471 ENSG00000146094 DOK3 598.456549 -1.988011107 0.465352 -4.27206 1.94E-05 0.005595 ENSG00000129226 CD68 112.641419 -1.986556347 0.467929 -4.24542 2.18E-05 0.006166 ENSG00000158373 HIST1H2BD 736.99528 2.419690661 0.570662 4.240148 2.23E-05 0.006245 ENSG00000182957 SPATA13 2106.01316 -1.005060973 0.237963 -4.2236 2.40E-05 0.00665 ENSG00000117009 KMO 104.464246 -2.265222599 0.536702 -4.22064 2.44E-05 0.006667 ENSG00000146192 FGD2 763.792602 -2.099754908 0.497909 -4.21715 2.47E-05 0.006701 ENSG00000161798 AQP5 3625.03478 4.129864841 0.980887 4.210336 2.55E-05 0.006835 ENSG00000133328 HRASLS2 240.935462 3.811522641 0.906221 4.205953 2.60E-05 0.006869 ENSG00000168631 DPCR1 14579.8744 5.239457277 1.246129 4.204585 2.62E-05 0.006869 ENSG00000180818 HOXC10 232.605163 5.467228174 1.302695 4.196858 2.71E-05 0.007036 ENSG00000137251 TINAG 92.5880233 4.711004519 1.125603 4.185315 2.85E-05 0.007259 ENSG00000248290 TNXA 9.20758171 -3.054045862 0.737888 -4.1389 3.49E-05 0.007959 ENSG00000184293 CLECL1 44.4202899 -2.967861303 0.714907 -4.1514 3.30E-05 0.007959 ENSG00000181036 FCRL6 51.7559835 -2.673890175 0.645552 -4.14202 3.44E-05 0.007959 ENSG00000126838 PZP 11.5588575 -2.235180079 0.537826 -4.15595 3.24E-05 0.007959 ENSG00000187808 SOWAHD 67.7182908 -1.906217533 0.460451 -4.13989 3.47E-05 0.007959 ENSG00000228486 LINC01125 85.1103515 -1.645330136 0.396587 -4.14872 3.34E-05 0.007959 ENSG00000180596 HIST1H2BC 167.249934 2.667238876 0.641955 4.154866 3.25E-05 0.007959 ENSG00000128298 BAIAP2L2 2246.88028 2.876571362 0.693666 4.146909 3.37E-05 0.007959 ENSG00000265763 ZNF488 185.642332 3.114559985 0.752284 4.140141 3.47E-05 0.007959 ENSG00000103355 PRSS33 103.39512 4.879325984 1.174667 4.153793 3.27E-05 0.007959 ENSG00000259439 LINC01833 78.6434202 5.253640528 1.266911 4.146811 3.37E-05 0.007959 ENSG00000163295 ALPI 34.3053844 6.915729493 1.662547 4.159719 3.19E-05 0.007959 ENSG00000000938 FGR 895.758467 -2.092645908 0.508675 -4.11392 3.89E-05 0.008795 ENSG00000108602 ALDH3A1 849.53075 3.900533448 0.949919 4.106173 4.02E-05 0.009016 ENSG00000180644 PRF1 394.645047 -2.085147275 0.51024 -4.0866 4.38E-05 0.009727 ENSG00000182580 EPHB3 1856.08509 2.350324761 0.575458 4.084268 4.42E-05 0.009742 ENSG00000253988 AC079015.1 3.83641219 -2.873850335 0.704132 -4.08141 4.48E-05 0.00978 ENSG00000234750 AC012618.2 6.80765972 -2.101909178 0.515267 -4.07926 4.52E-05 0.009788 ENSG00000184678 HIST2H2BE 1456.46891 2.213924543 0.543791 4.071278 4.68E-05 0.010046 ENSG00000227467 LINC01537 16.4058457 -2.535227066 0.625173 -4.05524 5.01E-05 0.010284

Page | 33
ENSG00000237484 LINC01684 9.51490348 -2.523586183 0.622705 -4.05262 5.06E-05 0.010284 ENSG00000008516 MMP25 131.716028 -1.788640432 0.441092 -4.05503 5.01E-05 0.010284 ENSG00000103460 TOX3 1014.22833 2.262441731 0.558464 4.051184 5.10E-05 0.010284 ENSG00000088836 SLC4A11 962.689374 2.587780324 0.639074 4.049268 5.14E-05 0.010284 ENSG00000181378 CFAP65 86.7202328 3.457421405 0.852879 4.053825 5.04E-05 0.010284 ENSG00000170231 FABP6 139.661567 4.422513922 1.089825 4.058002 4.95E-05 0.010284 ENSG00000163586 FABP1 138.201088 6.136367016 1.512116 4.058132 4.95E-05 0.010284 ENSG00000203499 IQANK1 888.950174 2.2445397 0.554979 4.04437 5.25E-05 0.010286 ENSG00000278912 AC008870.5 61.3578295 3.928511162 0.9712 4.045008 5.23E-05 0.010286 ENSG00000244280 ECEL1P2 37.1443897 4.887715489 1.208731 4.043674 5.26E-05 0.010286 ENSG00000141232 TOB1 5280.88171 1.534596967 0.379854 4.039961 5.35E-05 0.010372 ENSG00000237289 CKMT1B 389.916197 2.533683314 0.627466 4.037964 5.39E-05 0.010384 ENSG00000172738 TMEM217 56.3864847 -1.976253521 0.490701 -4.02741 5.64E-05 0.010481 ENSG00000166947 EPB42 8.78417289 -1.810668913 0.449606 -4.02724 5.64E-05 0.010481 ENSG00000246228 CASC8 133.944913 3.179954207 0.789562 4.027489 5.64E-05 0.010481 ENSG00000189366 ALG1L 119.448401 3.187208212 0.790741 4.030662 5.56E-05 0.010481 ENSG00000114771 AADAC 508.738667 3.701064382 0.91767 4.033109 5.50E-05 0.010481 ENSG00000135750 KCNK1 3020.15427 2.072060576 0.514833 4.02472 5.70E-05 0.010518 ENSG00000269220 LINC00528 29.9174742 -2.42252816 0.60356 -4.01373 5.98E-05 0.010872 ENSG00000254759 NAP1L1P1 17.2225061 -1.183797899 0.294946 -4.01361 5.98E-05 0.010872 ENSG00000261583 AC012317.1 13.7603795 5.599952717 1.397923 4.00591 6.18E-05 0.011154 ENSG00000270919 AC108451.2 14.0480994 5.619606928 1.403791 4.003164 6.25E-05 0.011207 ENSG00000175311 ANKS4B 647.226072 3.145249216 0.787206 3.995458 6.46E-05 0.011498 ENSG00000179546 HTR1D 308.874858 2.738626995 0.686537 3.989048 6.63E-05 0.011654 ENSG00000101188 NTSR1 584.031283 4.577159136 1.147357 3.989308 6.63E-05 0.011654 ENSG00000126759 CFP 213.313811 -2.560393896 0.642266 -3.9865 6.71E-05 0.0117 ENSG00000255819 KLRC4-KLRK1 7.02125418 -2.790550781 0.701546 -3.97771 6.96E-05 0.011792 ENSG00000136379 ABHD17C 3747.00138 2.188561321 0.549924 3.979754 6.90E-05 0.011792 ENSG00000181019 NQO1 11060.3302 2.306244956 0.579129 3.982265 6.83E-05 0.011792 ENSG00000111291 GPRC5D 68.2054583 2.627424194 0.660687 3.976804 6.98E-05 0.011792 ENSG00000183128 CALHM3 195.957727 4.434633439 1.114364 3.97952 6.91E-05 0.011792 ENSG00000115648 MLPH 9572.45931 2.226595362 0.560419 3.973089 7.09E-05 0.011866 ENSG00000159263 SIM2 457.823733 2.662002348 0.670152 3.972237 7.12E-05 0.011866 ENSG00000106384 MOGAT3 75.7620167 4.445075748 1.119759 3.969673 7.20E-05 0.011918 ENSG00000178789 CD300LB 83.3587539 -2.196047586 0.554199 -3.96256 7.42E-05 0.012202 ENSG00000160606 TLCD1 464.689713 1.687093137 0.42601 3.960215 7.49E-05 0.012244 ENSG00000135218 CD36 1613.71898 -2.871027057 0.725603 -3.95675 7.60E-05 0.012256 ENSG00000138964 PARVG 988.403024 -2.115214485 0.53445 -3.95774 7.57E-05 0.012256 ENSG00000152689 RASGRP3 827.882121 -1.438525828 0.363676 -3.95552 7.64E-05 0.012256 ENSG00000166839 ANKDD1A 281.156119 -1.172978374 0.29694 -3.95021 7.81E-05 0.012454 ENSG00000241635 UGT1A1 53.5976523 5.423704953 1.373728 3.948165 7.88E-05 0.012485 ENSG00000272789 AC010976.2 25.9839271 -2.523698606 0.639455 -3.94664 7.93E-05 0.012488 ENSG00000158717 RNF166 968.791202 -1.19469148 0.30298 -3.94314 8.04E-05 0.012596 ENSG00000262319 AC007952.6 2.9663061 -3.562839822 0.907557 -3.92575 8.65E-05 0.012991 ENSG00000140955 ADAD2 10.7540728 -2.559485831 0.651925 -3.92604 8.64E-05 0.012991 ENSG00000105374 NKG7 306.654941 -2.259943845 0.575611 -3.92617 8.63E-05 0.012991 ENSG00000104972 LILRB1 349.601957 -2.181667745 0.554973 -3.93112 8.45E-05 0.012991 ENSG00000177202 SPACA4 59.561175 3.098283756 0.788384 3.929916 8.50E-05 0.012991 ENSG00000137860 SLC28A2 76.458182 4.296826661 1.093172 3.930603 8.47E-05 0.012991 ENSG00000166391 MOGAT2 171.942415 4.313960552 1.096754 3.933388 8.38E-05 0.012991 ENSG00000124102 PI3 1711.70421 3.703489245 0.944618 3.920622 8.83E-05 0.013121 ENSG00000007264 MATK 201.276974 -2.047253232 0.522636 -3.91717 8.96E-05 0.013235 ENSG00000178462 TUBAL3 22.8436988 4.520108337 1.156107 3.909766 9.24E-05 0.01357 ENSG00000109255 NMU 444.162353 3.541490933 0.906162 3.908231 9.30E-05 0.01358 ENSG00000161929 SCIMP 323.379616 -2.392541087 0.613742 -3.89829 9.69E-05 0.014071 ENSG00000121210 TMEM131L 1007.79122 -1.807849321 0.464275 -3.89392 9.86E-05 0.014169 ENSG00000163501 IHH 763.147275 3.587048893 0.920912 3.895104 9.82E-05 0.014169 ENSG00000133710 SPINK5 467.779739 3.178739845 0.817416 3.888765 0.000101 0.014314 ENSG00000188833 ENTPD8 574.064419 3.229628018 0.830397 3.889256 0.000101 0.014314 ENSG00000235505 AP002004.1 158.597697 -1.763899206 0.454571 -3.88036 0.000104 0.014501 ENSG00000115616 SLC9A2 478.314471 3.42637424 0.882873 3.880937 0.000104 0.014501 ENSG00000166869 CHP2 68.7835382 6.286909036 1.619219 3.88268 0.000103 0.014501 ENSG00000107798 LIPA 5077.46457 -1.316706992 0.339986 -3.87283 0.000108 0.014721

Page | 34
ENSG00000111700 SLCO1B3 102.19161 5.37848897 1.388354 3.874005 0.000107 0.014721 ENSG00000163219 ARHGAP25 799.566121 -2.006030531 0.518896 -3.86596 0.000111 0.014967 ENSG00000186642 PDE2A 562.661659 -1.949976116 0.504526 -3.86497 0.000111 0.014967 ENSG00000261104 AC093904.4 31.150678 4.002221082 1.03547 3.865124 0.000111 0.014967 ENSG00000179583 CIITA 1914.56773 -1.970386892 0.510214 -3.86188 0.000113 0.015037 ENSG00000178597 PSAPL1 256.359416 5.529507198 1.432027 3.861314 0.000113 0.015037 ENSG00000220412 AL356234.1 9.75702107 -2.658644326 0.689236 -3.85738 0.000115 0.015126 ENSG00000173868 PHOSPHO1 37.9924854 -1.944861098 0.504121 -3.85792 0.000114 0.015126 ENSG00000167851 CD300A 774.145799 -1.66217883 0.431324 -3.85367 0.000116 0.015279 ENSG00000174837 ADGRE1 54.0257489 -2.28133016 0.59573 -3.82947 0.000128 0.016643 ENSG00000158555 GDPD5 989.674316 -1.377526921 0.359659 -3.83009 0.000128 0.016643 ENSG00000179292 TMEM151A 204.131952 3.370204665 0.88046 3.827778 0.000129 0.016643 ENSG00000248996 AC145098.1 22.189718 -1.980254519 0.517914 -3.82352 0.000132 0.016768 ENSG00000196420 S100A5 36.5992671 2.331618709 0.609811 3.823509 0.000132 0.016768 ENSG00000204613 TRIM10 99.4383646 2.680715718 0.701435 3.821759 0.000133 0.016805 ENSG00000105523 FAM83E 2490.47547 2.561435547 0.67111 3.816712 0.000135 0.017069 ENSG00000151715 TMEM45B 2385.18774 2.388951024 0.626164 3.815219 0.000136 0.017089 ENSG00000227039 ITGB2-AS1 265.816891 -2.55213807 0.671081 -3.80302 0.000143 0.017352 ENSG00000251322 SHANK3 1451.96982 -1.397013076 0.367436 -3.80206 0.000143 0.017352 ENSG00000168453 HR 933.524147 2.178521822 0.572683 3.804064 0.000142 0.017352 ENSG00000183856 IQGAP3 1338.19046 2.293170701 0.602946 3.803276 0.000143 0.017352 ENSG00000119946 CNNM1 406.205496 2.4017631 0.630804 3.807462 0.00014 0.017352 ENSG00000166126 AMN 1506.80111 3.036079123 0.797926 3.804964 0.000142 0.017352 ENSG00000253293 HOXA10 235.560755 3.58902979 0.943715 3.803087 0.000143 0.017352 ENSG00000204614 TRIM40 14.3479982 5.657868956 1.486179 3.806989 0.000141 0.017352 ENSG00000138162 TACC2 2786.27533 1.429319912 0.376893 3.792381 0.000149 0.01773 ENSG00000280032 AP002800.1 70.9325281 3.008896263 0.793454 3.79215 0.000149 0.01773 ENSG00000189280 GJB5 390.588077 3.581476954 0.944304 3.792717 0.000149 0.01773 ENSG00000160868 CYP3A4 69.2575522 4.066281712 1.072147 3.792651 0.000149 0.01773 ENSG00000122223 CD244 60.2049644 -2.148700119 0.567173 -3.78844 0.000152 0.017754 ENSG00000107551 RASSF4 2509.705 -1.5389546 0.406121 -3.7894 0.000151 0.017754 ENSG00000108798 ABI3 748.426276 -1.500577419 0.395989 -3.78944 0.000151 0.017754 ENSG00000238057 ZEB2-AS1 11.8352676 -1.686583706 0.445569 -3.78524 0.000154 0.017808 ENSG00000196754 S100A2 3791.51385 4.433680375 1.171365 3.785054 0.000154 0.017808 ENSG00000215182 MUC5AC 20702.1678 4.51563206 1.193449 3.783682 0.000155 0.017808 ENSG00000242207 HOXB-AS4 23.6040924 4.994398215 1.320137 3.783242 0.000155 0.017808 ENSG00000028277 POU2F2 484.774945 -2.237780056 0.592397 -3.7775 0.000158 0.018143 ENSG00000168907 PLA2G4F 199.953157 2.894177583 0.767936 3.768774 0.000164 0.018707 ENSG00000115607 IL18RAP 76.716891 -2.17355608 0.57711 -3.76627 0.000166 0.018813 ENSG00000240143 AL023653.1 6.5464776 -2.616176823 0.695223 -3.76307 0.000168 0.018876 ENSG00000143850 PLEKHA6 5442.55153 1.492077514 0.396599 3.762186 0.000168 0.018876 ENSG00000106789 CORO2A 3161.04782 1.932277883 0.513464 3.763219 0.000168 0.018876 ENSG00000198610 AKR1C4 66.6444885 3.644450291 0.971663 3.750736 0.000176 0.019674 ENSG00000087237 CETP 106.642614 -2.299043225 0.613729 -3.74602 0.00018 0.019961 ENSG00000228952 LINC02041 51.6929628 2.846782166 0.760197 3.744797 0.000181 0.019974 ENSG00000267731 AC005332.5 20.2406114 -2.222643261 0.594425 -3.73915 0.000185 0.020086 ENSG00000197943 PLCG2 1561.49068 -1.646647617 0.440306 -3.73978 0.000184 0.020086 ENSG00000099812 MISP 7174.10653 2.258671087 0.604017 3.739414 0.000184 0.020086 ENSG00000104827 CGB3 19.4195724 6.815745029 1.822683 3.739403 0.000184 0.020086 ENSG00000230882 AC005077.4 145.831081 2.866146027 0.767893 3.732483 0.00019 0.020539 ENSG00000185332 TMEM105 119.025344 2.621034786 0.702851 3.729149 0.000192 0.020641 ENSG00000257588 AC025154.2 153.721227 3.256621143 0.873069 3.730085 0.000191 0.020641 ENSG00000100055 CYTH4 910.476704 -1.725355068 0.462975 -3.72667 0.000194 0.020759 ENSG00000122133 PAEP 123.192067 4.460033946 1.198623 3.720963 0.000198 0.021147 ENSG00000130812 ANGPTL6 33.0553968 -1.957941853 0.526572 -3.71828 0.000201 0.021286 ENSG00000221968 FADS3 1042.66125 -1.27303874 0.34274 -3.7143 0.000204 0.021448 ENSG00000238133 MAP3K20-AS1 196.234463 4.058350875 1.092453 3.714898 0.000203 0.021448 ENSG00000245694 CRNDE 355.863147 2.141504368 0.577303 3.709497 0.000208 0.021771 ENSG00000137101 CD72 478.580024 -2.227100881 0.601066 -3.70525 0.000211 0.021926 ENSG00000160182 TFF1 21199.7615 4.236032239 1.14336 3.704899 0.000211 0.021926 ENSG00000016490 CLCA1 314.325873 6.860356477 1.851819 3.704658 0.000212 0.021926 ENSG00000211829 TRDC 42.5110414 -2.204799525 0.595789 -3.70064 0.000215 0.022013 ENSG00000140968 IRF8 1923.85756 -2.091315754 0.565017 -3.70133 0.000214 0.022013

Page | 35
ENSG00000166959 MS4A8 919.335402 3.409001217 0.92071 3.70258 0.000213 0.022013 ENSG00000114346 ECT2 1674.01072 1.658690489 0.448534 3.698024 0.000217 0.022154 ENSG00000053747 LAMA3 12756.447 2.344485106 0.634856 3.692939 0.000222 0.022513 ENSG00000213809 KLRK1 24.6990727 -2.536704812 0.688397 -3.68495 0.000229 0.02304 ENSG00000251323 AP003086.1 6.79595243 -2.144046551 0.58213 -3.68311 0.00023 0.02304 ENSG00000157214 STEAP2 2242.97579 1.330181552 0.361109 3.683605 0.00023 0.02304 ENSG00000145681 HAPLN1 105.633947 3.47405567 0.942669 3.68534 0.000228 0.02304 ENSG00000211689 TRGC1 24.6578434 -2.483456459 0.675448 -3.67675 0.000236 0.023088 ENSG00000254760 AC008750.1 5.84544257 -2.23556026 0.607839 -3.67788 0.000235 0.023088 ENSG00000229029 CDCA4P1 3.91596056 -2.159983701 0.586948 -3.68003 0.000233 0.023088 ENSG00000093100 AC016026.1 7.54942003 -1.798142757 0.488805 -3.67865 0.000234 0.023088 ENSG00000065413 ANKRD44 825.679707 -1.718191211 0.467305 -3.67681 0.000236 0.023088 ENSG00000170545 SMAGP 1599.69568 1.642656196 0.446546 3.678582 0.000235 0.023088 ENSG00000235111 Z97192.3 5.82804264 -2.4653049 0.671544 -3.6711 0.000242 0.023517 ENSG00000234883 MIR155HG 71.9359182 -1.990005688 0.542433 -3.66867 0.000244 0.023653 ENSG00000069764 PLA2G10 258.545215 2.967034647 0.809345 3.665972 0.000246 0.023815 ENSG00000105609 LILRB5 228.381969 -2.456839915 0.671284 -3.65991 0.000252 0.024028 ENSG00000117245 KIF17 95.7717088 -1.770880703 0.483697 -3.66113 0.000251 0.024028 ENSG00000111261 MANSC1 2731.95269 1.292456118 0.352877 3.662625 0.00025 0.024028 ENSG00000103269 RHBDL1 180.753124 2.342191945 0.639928 3.660084 0.000252 0.024028 ENSG00000233532 LINC00460 104.377823 3.567854408 0.975143 3.6588 0.000253 0.024044 ENSG00000164236 ANKRD33B 200.60836 -1.99045327 0.544913 -3.65279 0.000259 0.024425 ENSG00000145416 1-Mar 623.538807 -1.737296058 0.475714 -3.65197 0.00026 0.024425 ENSG00000162545 CAMK2N1 7328.62319 1.429770029 0.391483 3.652193 0.00026 0.024425 ENSG00000173467 AGR3 1990.63261 2.997125171 0.821325 3.649133 0.000263 0.024608 ENSG00000064270 ATP2C2 1080.25131 2.229371635 0.611996 3.642789 0.00027 0.025132 ENSG00000142347 MYO1F 1444.00639 -1.63170336 0.448266 -3.64004 0.000273 0.025312 ENSG00000237928 NFIA-AS2 22.0255813 -2.398770222 0.659717 -3.63606 0.000277 0.025433 ENSG00000249661 TNRC18P1 4.18725364 -1.921707456 0.528412 -3.63676 0.000276 0.025433 ENSG00000218227 AC136632.1 60.5531005 -1.610799685 0.442809 -3.63768 0.000275 0.025433 ENSG00000144820 ADGRG7 148.449404 4.33104892 1.192787 3.631032 0.000282 0.025842 ENSG00000222057 RNU4-62P 4.79309956 -2.525394685 0.696161 -3.6276 0.000286 0.026096 ENSG00000243766 HOTTIP 94.9825193 5.119680533 1.411934 3.626006 0.000288 0.026166 ENSG00000160219 GAB3 315.115907 -1.625816119 0.448708 -3.62333 0.000291 0.026346 ENSG00000115507 OTX1 100.734909 2.153605643 0.595073 3.619063 0.000296 0.02641 ENSG00000267374 AC016205.1 30.1777681 2.624000386 0.725041 3.619106 0.000296 0.02641 ENSG00000249853 HS3ST5 37.2977677 3.554226385 0.981821 3.620034 0.000295 0.02641 ENSG00000205847 OR7E91P 27.932587 4.1027078 1.133898 3.618233 0.000297 0.02641 ENSG00000148826 NKX6-2 42.3895056 5.801032414 1.602475 3.620045 0.000295 0.02641 ENSG00000006555 TTC22 1404.44061 1.373650687 0.380085 3.614062 0.000301 0.026711 ENSG00000117650 NEK2 410.693844 1.995882467 0.552336 3.613531 0.000302 0.026711 ENSG00000265096 C1QTNF1-AS1 9.79585121 -2.544576493 0.704477 -3.61201 0.000304 0.026763 ENSG00000267040 AC027097.1 71.9409944 -1.252512361 0.346992 -3.60963 0.000307 0.026763 ENSG00000198088 NUP62CL 158.104496 1.654458523 0.458359 3.609527 0.000307 0.026763 ENSG00000251191 LINC00589 13.7964847 3.260893097 0.904915 3.603536 0.000314 0.027205 ENSG00000241359 SYNPR-AS1 30.5666196 2.969700335 0.824898 3.600082 0.000318 0.027477 ENSG00000086300 SNX10 942.393187 -1.526374137 0.424177 -3.59844 0.00032 0.027511 ENSG00000100994 PYGB 15693.8289 1.589512193 0.441772 3.59804 0.000321 0.027511 ENSG00000268849 SIGLEC22P 4.34410387 -2.101954661 0.585153 -3.59215 0.000328 0.02796 ENSG00000128408 RIBC2 72.1011124 2.154794991 0.599868 3.592114 0.000328 0.02796 ENSG00000160883 HK3 462.010269 -2.339047302 0.652157 -3.58663 0.000335 0.02827 ENSG00000005844 ITGAL 1163.40627 -2.324067813 0.648041 -3.5863 0.000335 0.02827 ENSG00000269072 AC063977.6 3.00095994 -2.127335015 0.593115 -3.58672 0.000335 0.02827 ENSG00000122986 HVCN1 434.20858 -1.79629802 0.501177 -3.58416 0.000338 0.02827 ENSG00000180539 C9orf139 42.0573063 -1.658490655 0.462575 -3.58534 0.000337 0.02827 ENSG00000231369 Z97353.1 5.40890258 -1.171981088 0.327066 -3.58332 0.000339 0.02827 ENSG00000261762 AC027228.2 67.5960408 2.145347178 0.598582 3.584052 0.000338 0.02827 ENSG00000185499 MUC1 40678.3358 2.479915109 0.692423 3.581501 0.000342 0.028377 ENSG00000139874 SSTR1 658.794366 3.057031881 0.854278 3.578498 0.000346 0.028613 ENSG00000165807 PPP1R36 239.727459 1.637226186 0.457872 3.575732 0.000349 0.028826 ENSG00000143776 CDC42BPA 5765.75353 1.047582612 0.293072 3.574492 0.000351 0.028871 ENSG00000279427 AC007490.1 48.2741352 2.283917265 0.639244 3.572841 0.000353 0.028962 ENSG00000112799 LY86 484.798192 -1.997894616 0.559503 -3.57084 0.000356 0.029002

Page | 36
ENSG00000019102 VSIG2 4328.11783 2.769978124 0.775557 3.571599 0.000355 0.029002 ENSG00000260963 AC026462.3 18.5531369 3.413162758 0.956229 3.569397 0.000358 0.02907 ENSG00000154016 GRAP 70.1939853 -1.856059422 0.520192 -3.56803 0.00036 0.029119 ENSG00000259485 LINC02253 83.8693851 5.022111851 1.407947 3.566976 0.000361 0.029119 ENSG00000204542 C6orf15 150.580101 5.206488048 1.459825 3.566514 0.000362 0.029119 ENSG00000276842 AC023510.2 16.4172516 -2.158218693 0.605476 -3.5645 0.000365 0.029253 ENSG00000231226 TRIM31-AS1 31.9513166 2.815247367 0.790254 3.56246 0.000367 0.029364 ENSG00000172927 MYEOV 2739.87359 3.018614097 0.847476 3.561889 0.000368 0.029364 ENSG00000184060 ADAP2 522.860817 -1.342962393 0.377123 -3.56107 0.000369 0.029366 ENSG00000124635 HIST1H2BJ 91.9278684 2.542480146 0.714302 3.55939 0.000372 0.029375 ENSG00000163993 S100P 13512.9992 3.352472117 0.941764 3.55978 0.000371 0.029375 ENSG00000086159 AQP6 81.5301899 3.265294811 0.917778 3.557825 0.000374 0.029461 ENSG00000175832 ETV4 1776.24751 2.09262378 0.588541 3.555614 0.000377 0.02962 ENSG00000256427 AC010175.1 3.83426563 -2.41774937 0.680519 -3.5528 0.000381 0.029667 ENSG00000115956 PLEK 1015.45659 -2.131543153 0.600011 -3.55251 0.000382 0.029667 ENSG00000007129 CEACAM21 96.0423827 -1.918287957 0.540173 -3.55125 0.000383 0.029667 ENSG00000205420 KRT6A 3655.21989 4.644209301 1.30688 3.553662 0.00038 0.029667 ENSG00000145384 FABP2 33.7798637 5.624974949 1.583741 3.551702 0.000383 0.029667 ENSG00000128815 WDFY4 966.285981 -2.525338894 0.712083 -3.54641 0.000391 0.030128 ENSG00000162482 AKR7A3 1441.65187 2.624013457 0.740322 3.544423 0.000393 0.030266 ENSG00000267416 AC025048.4 19.7540203 -1.496672144 0.423187 -3.53667 0.000405 0.030985 ENSG00000163624 CDS1 1939.79548 1.38842794 0.392574 3.536727 0.000405 0.030985 ENSG00000153898 MCOLN2 150.825575 -2.218975431 0.627846 -3.53427 0.000409 0.031026 ENSG00000105383 CD33 187.103393 -1.747780565 0.494543 -3.53413 0.000409 0.031026 ENSG00000280924 LINC00628 8.64740916 4.155756658 1.175934 3.534005 0.000409 0.031026 ENSG00000107099 DOCK8 1800.47676 -1.787006825 0.506011 -3.53156 0.000413 0.031061 ENSG00000149260 CAPN5 7187.72578 1.932250128 0.547163 3.531399 0.000413 0.031061 ENSG00000224259 LINC01133 1313.84521 3.048154554 0.862881 3.53253 0.000412 0.031061 ENSG00000183542 KLRC4 3.66722076 -2.853800395 0.8107 -3.52017 0.000431 0.031151 ENSG00000164935 DCSTAMP 76.9349434 -2.305810389 0.653953 -3.52596 0.000422 0.031151 ENSG00000134061 CD180 388.269146 -2.260347309 0.641463 -3.52374 0.000426 0.031151 ENSG00000122122 SASH3 1112.37723 -2.17034647 0.616128 -3.52256 0.000427 0.031151 ENSG00000010671 BTK 557.623883 -2.139347108 0.606751 -3.5259 0.000422 0.031151 ENSG00000269800 PLEKHA3P1 8.35815314 -1.887392014 0.53521 -3.52645 0.000421 0.031151 ENSG00000279377 AC003973.3 66.5666162 -1.878629367 0.533239 -3.52306 0.000427 0.031151 ENSG00000227954 TARID 22.9834313 -1.80695057 0.513067 -3.52186 0.000429 0.031151 ENSG00000258539 AC068896.1 10.8448929 -1.766195971 0.500716 -3.52734 0.00042 0.031151 ENSG00000152229 PSTPIP2 490.333228 -1.572451061 0.446153 -3.52446 0.000424 0.031151 ENSG00000137269 LRRC1 1549.43778 1.058690512 0.300754 3.520126 0.000431 0.031151 ENSG00000260328 AC104024.2 29.190294 2.580813988 0.733011 3.520839 0.00043 0.031151 ENSG00000258689 LINC01269 28.8130227 2.798282759 0.793611 3.526011 0.000422 0.031151 ENSG00000179674 ARL14 1565.0797 2.924576423 0.828994 3.527862 0.000419 0.031151 ENSG00000265206 AC004687.1 129.663471 -2.890536586 0.822073 -3.51616 0.000438 0.031369 ENSG00000101445 PPP1R16B 836.08883 -2.141533755 0.609069 -3.51608 0.000438 0.031369 ENSG00000172818 OVOL1 446.872613 2.599274827 0.739036 3.517117 0.000436 0.031369 ENSG00000096996 IL12RB1 261.507205 -1.723811224 0.490743 -3.51266 0.000444 0.031688 ENSG00000166897 ELFN2 440.353417 2.52042626 0.717868 3.510991 0.000446 0.0318 ENSG00000226491 FTOP1 16.4962072 -1.519760576 0.433042 -3.5095 0.000449 0.031892 ENSG00000140678 ITGAX 1782.07522 -1.728006175 0.492639 -3.50765 0.000452 0.032026 ENSG00000203711 C6orf99 28.4114148 2.013195467 0.574196 3.506114 0.000455 0.032124 ENSG00000106089 STX1A 1929.47905 1.822397882 0.52006 3.50421 0.000458 0.032267 ENSG00000179869 ABCA13 141.911351 2.744304422 0.783558 3.502362 0.000461 0.032327 ENSG00000232498 AL136987.1 8.59243124 5.638181162 1.609863 3.502274 0.000461 0.032327 ENSG00000011426 ANLN 1351.55435 2.125387502 0.60807 3.495299 0.000474 0.033006 ENSG00000171243 SOSTDC1 157.20821 3.616607123 1.034684 3.495373 0.000473 0.033006 ENSG00000238113 LINC01410 55.7018811 -1.762980991 0.504757 -3.49273 0.000478 0.033236 ENSG00000136542 GALNT5 2730.28746 2.61424653 0.748831 3.491102 0.000481 0.03335 ENSG00000230937 MIR205HG 133.28201 5.724753783 1.641961 3.486535 0.000489 0.033835 ENSG00000248714 AC091180.2 3.77702911 -1.9842435 0.569465 -3.4844 0.000493 0.033862 ENSG00000225342 AC079630.1 21.0603124 -1.786809467 0.512735 -3.48486 0.000492 0.033862 ENSG00000110031 LPXN 976.391637 -1.403507409 0.402821 -3.48419 0.000494 0.033862 ENSG00000162078 ZG16B 1809.99454 2.792551341 0.802257 3.480869 0.0005 0.034195 ENSG00000133048 CHI3L1 1788.12679 -2.622722653 0.754923 -3.47416 0.000512 0.034677

Page | 37
ENSG00000167083 GNGT2 90.2171681 -1.531135611 0.440725 -3.47413 0.000513 0.034677 ENSG00000056558 TRAF1 979.797135 -1.298258145 0.37364 -3.47463 0.000512 0.034677 ENSG00000206069 TMEM211 19.4043564 4.010392693 1.154222 3.474542 0.000512 0.034677 ENSG00000277268 AC243773.2 18.8516189 6.774176485 1.950183 3.47361 0.000514 0.034677 ENSG00000260220 CCDC187 92.6366246 2.568977494 0.740223 3.470544 0.000519 0.034984 ENSG00000107159 CA9 3657.86144 3.593013687 1.036911 3.465112 0.00053 0.035515 ENSG00000146054 TRIM7 548.249771 2.361475046 0.681639 3.464409 0.000531 0.035516 ENSG00000100027 YPEL1 112.011056 -1.132309297 0.326953 -3.46322 0.000534 0.035582 ENSG00000197465 GYPE 21.6416548 -1.833060604 0.530083 -3.45806 0.000544 0.036178 ENSG00000168078 PBK 242.662634 1.831933258 0.530096 3.455849 0.000549 0.036383 ENSG00000095539 SEMA4G 2041.34639 1.831754408 0.530694 3.451619 0.000557 0.036833 ENSG00000275216 AL161431.1 339.539485 5.123411063 1.484548 3.451158 0.000558 0.036833 ENSG00000240216 CPHL1P 62.7352668 3.837058837 1.112414 3.449308 0.000562 0.036965 ENSG00000005073 HOXA11 66.5872699 4.026565311 1.167518 3.448825 0.000563 0.036965 ENSG00000169442 CD52 1670.62611 -2.377883268 0.690063 -3.44589 0.000569 0.037262 ENSG00000171608 PIK3CD 1150.62236 -1.57255824 0.456485 -3.44493 0.000571 0.037262 ENSG00000110723 EXPH5 536.50137 1.374471606 0.399019 3.444628 0.000572 0.037262 ENSG00000272980 Z94721.2 7.08552298 -1.64182157 0.476852 -3.44304 0.000575 0.037294 ENSG00000227038 GTF2IP7 30.3363918 2.457746773 0.713784 3.443263 0.000575 0.037294 ENSG00000272468 AL021807.1 26.6338161 2.817153048 0.818406 3.442246 0.000577 0.037311 ENSG00000174791 RIN1 1223.55773 1.446239215 0.420386 3.440267 0.000581 0.037399 ENSG00000164379 FOXQ1 1811.25958 2.088594868 0.607 3.440847 0.00058 0.037399 ENSG00000148600 CDHR1 42.8642167 -2.522909862 0.733735 -3.43845 0.000585 0.037439 ENSG00000276231 PIK3R6 158.290422 -1.416779483 0.412011 -3.4387 0.000585 0.037439 ENSG00000104413 ESRP1 4052.89176 1.594523594 0.463798 3.437971 0.000586 0.037439 ENSG00000101842 VSIG1 3192.92748 3.667945324 1.067525 3.435932 0.000591 0.037566 ENSG00000260284 TPSP2 43.5413947 4.253233299 1.237943 3.435726 0.000591 0.037566 ENSG00000163508 EOMES 98.2139187 -2.557173361 0.745019 -3.43236 0.000598 0.037577 ENSG00000270164 LINC01480 78.7282138 -2.020813556 0.588309 -3.43495 0.000593 0.037577 ENSG00000236901 MIR600HG 216.963153 -1.973719164 0.574983 -3.43266 0.000598 0.037577 ENSG00000171346 KRT15 1068.12931 2.645786902 0.770737 3.4328 0.000597 0.037577 ENSG00000181631 P2RY13 196.280209 -2.175286076 0.634047 -3.4308 0.000602 0.037703 ENSG00000135773 CAPN9 956.134985 3.374028239 0.983872 3.429335 0.000605 0.037815 ENSG00000204839 MROH6 2045.6906 2.289057944 0.66786 3.427454 0.000609 0.037987 ENSG00000205268 PDE7A 1523.87065 -1.376342252 0.401999 -3.42374 0.000618 0.038417 ENSG00000280153 AC133065.6 301.581333 -1.828705583 0.534346 -3.42233 0.000621 0.038524 ENSG00000111701 APOBEC1 261.08098 3.793550387 1.108677 3.421691 0.000622 0.038524 ENSG00000186583 SPATC1 20.2885481 -2.123598157 0.620777 -3.42087 0.000624 0.038548 ENSG00000249464 LINC01091 110.525099 2.312993325 0.676279 3.420177 0.000626 0.038551 ENSG00000170786 SDR16C5 1804.87086 2.777175476 0.812143 3.419566 0.000627 0.038551 ENSG00000162543 UBXN10 887.463119 1.757017269 0.51396 3.41859 0.000629 0.038598 ENSG00000086288 NME8 19.7779347 -1.731870767 0.506973 -3.4161 0.000635 0.038704 ENSG00000077152 UBE2T 428.134058 1.448907614 0.424163 3.415919 0.000636 0.038704 ENSG00000105219 CNTD2 51.8228197 3.351568539 0.981081 3.4162 0.000635 0.038704 ENSG00000101213 PTK6 2631.09265 2.293328706 0.672086 3.412255 0.000644 0.039137 ENSG00000235897 TM4SF19-AS1 19.4526116 -1.509740978 0.442734 -3.41004 0.00065 0.039198 ENSG00000198380 GFPT1 6954.4109 1.028760516 0.301739 3.409441 0.000651 0.039198 ENSG00000187837 HIST1H1C 2357.36836 2.040153906 0.598399 3.409356 0.000651 0.039198 ENSG00000272068 AL365181.2 290.484515 2.994968151 0.878472 3.409294 0.000651 0.039198 ENSG00000094804 CDC6 524.934084 1.635121345 0.479719 3.408501 0.000653 0.039221 ENSG00000236876 TMSB4XP1 7.49150452 -1.544332506 0.453585 -3.40473 0.000662 0.039591 ENSG00000139800 ZIC5 24.8232584 5.642055655 1.657148 3.404679 0.000662 0.039591 ENSG00000134762 DSC3 272.116908 3.305473292 0.971099 3.403849 0.000664 0.039621 ENSG00000162460 TMEM82 27.109296 3.80449375 1.117948 3.403105 0.000666 0.039638 ENSG00000156453 PCDH1 8046.36279 1.396316069 0.41048 3.401667 0.00067 0.039756 ENSG00000101336 HCK 1184.77617 -1.648677488 0.485143 -3.39833 0.000678 0.040152 ENSG00000213075 RPL31P11 2.89894775 -2.261867782 0.66583 -3.39706 0.000681 0.040156 ENSG00000092607 TBX15 263.608113 2.84339012 0.836961 3.397281 0.000681 0.040156 ENSG00000140284 SLC27A2 286.429628 2.242737089 0.660433 3.395861 0.000684 0.040241 ENSG00000226690 AC013470.2 5.11591296 4.887289193 1.439637 3.394807 0.000687 0.040306 ENSG00000164078 MST1R 4222.16162 2.141018928 0.631679 3.389411 0.0007 0.041015 ENSG00000115523 GNLY 235.21983 -1.989780853 0.587353 -3.38771 0.000705 0.041141 ENSG00000198734 F5 3369.51719 2.716727701 0.802026 3.387332 0.000706 0.041141

Page | 38
ENSG00000261465 AC099518.4 8.34335748 2.310793512 0.682318 3.38668 0.000707 0.041147 ENSG00000136286 MYO1G 684.897616 -1.812430155 0.535723 -3.38315 0.000717 0.041587 ENSG00000270379 HEATR9 6.29980313 -2.2557178 0.667325 -3.38024 0.000724 0.041676 ENSG00000273062 AL449106.1 17.4847665 -1.482566816 0.438683 -3.37959 0.000726 0.041676 ENSG00000213371 NAP1L1P3 6.5326642 -1.142942388 0.33803 -3.38119 0.000722 0.041676 ENSG00000227155 AL161725.1 14.6959435 -1.929267643 0.571775 -3.37417 0.00074 0.042124 ENSG00000204991 SPIRE2 1472.63827 2.038583252 0.604171 3.374183 0.00074 0.042124 ENSG00000250271 AC068647.2 20.2602533 4.437077255 1.314612 3.375198 0.000738 0.042124 ENSG00000267369 AC015911.7 51.8147896 -1.99339354 0.591564 -3.3697 0.000753 0.042636 ENSG00000233217 MROH3P 181.340608 3.203930561 0.950998 3.369019 0.000754 0.042636 ENSG00000123329 ARHGAP9 752.735485 -1.952923108 0.579811 -3.36821 0.000757 0.042669 ENSG00000196405 EVL 3370.00816 -1.39247419 0.413597 -3.36674 0.000761 0.042804 ENSG00000186517 ARHGAP30 1723.35378 -1.686417305 0.501217 -3.36465 0.000766 0.043037 ENSG00000166866 MYO1A 969.27542 3.154725828 0.937998 3.363255 0.00077 0.043161 ENSG00000104951 IL4I1 476.060348 -2.045485466 0.608613 -3.3609 0.000777 0.043438 ENSG00000185015 CA13 602.209351 1.457663617 0.43403 3.35844 0.000784 0.043732 ENSG00000111860 CEP85L 352.931261 -1.186925963 0.354165 -3.35134 0.000804 0.044387 ENSG00000176920 FUT2 2311.36809 1.923233578 0.573965 3.350786 0.000806 0.044387 ENSG00000101447 FAM83D 567.529914 2.228968763 0.664965 3.352008 0.000802 0.044387 ENSG00000167755 KLK6 3327.73254 3.606747997 1.075468 3.353655 0.000798 0.044387 ENSG00000267287 AC068473.3 22.2718612 -1.864386109 0.556926 -3.34764 0.000815 0.044711 ENSG00000262714 AC007342.5 39.0626488 2.826037343 0.844198 3.347602 0.000815 0.044711 ENSG00000135898 GPR55 40.3375702 -2.187969992 0.654003 -3.3455 0.000821 0.044767 ENSG00000265743 AC138207.5 33.4137291 -1.407301856 0.420619 -3.34579 0.00082 0.044767 ENSG00000110244 APOA4 143.162102 7.120313761 2.128231 3.345649 0.000821 0.044767 ENSG00000196329 GIMAP5 102.192597 -2.113321656 0.632265 -3.34246 0.00083 0.045166 ENSG00000223813 AC007255.1 53.0321115 1.703069004 0.509621 3.341833 0.000832 0.045174 ENSG00000102445 RUBCNL 327.530553 -1.994262409 0.596977 -3.3406 0.000836 0.045186 ENSG00000189238 LINC00943 7.75412261 -2.133539798 0.639664 -3.33541 0.000852 0.04541 ENSG00000224968 LINC01645 3.78495247 -2.117496783 0.635166 -3.33377 0.000857 0.04541 ENSG00000015285 WAS 828.496173 -1.795871547 0.539328 -3.32983 0.000869 0.04541 ENSG00000268316 AC006272.1 3.37452835 -1.682204137 0.504445 -3.33476 0.000854 0.04541 ENSG00000274712 AC005332.7 105.52057 -1.41482331 0.424383 -3.33383 0.000857 0.04541 ENSG00000150867 PIP4K2A 2230.46659 -1.073039063 0.322276 -3.32957 0.00087 0.04541 ENSG00000121057 AKAP1 4055.5721 1.067282323 0.320318 3.33195 0.000862 0.04541 ENSG00000213853 EMP2 5096.33425 1.201370596 0.360498 3.332529 0.000861 0.04541 ENSG00000079385 CEACAM1 3865.42623 1.862364387 0.559141 3.330759 0.000866 0.04541 ENSG00000226330 AL606489.1 35.4696022 1.954036725 0.586574 3.331272 0.000865 0.04541 ENSG00000204335 SP5 110.59096 2.678422223 0.80419 3.330584 0.000867 0.04541 ENSG00000099834 CDHR5 2276.28768 2.788007228 0.837283 3.329828 0.000869 0.04541 ENSG00000132821 VSTM2L 3068.41807 2.79451631 0.838826 3.331461 0.000864 0.04541 ENSG00000188100 FAM25A 5.7150008 5.041744381 1.512714 3.332913 0.000859 0.04541 ENSG00000113303 BTNL8 510.491986 3.565838892 1.071601 3.327582 0.000876 0.045577 ENSG00000231324 AP000696.1 13.0911516 4.346753439 1.30634 3.32743 0.000877 0.045577 ENSG00000108691 CCL2 2088.27563 -2.181517025 0.656428 -3.32331 0.00089 0.045697 ENSG00000265798 AC138207.6 11.0862376 -1.501185233 0.451548 -3.32453 0.000886 0.045697 ENSG00000280194 AD000864.1 29.1940613 -1.341574148 0.403554 -3.32439 0.000886 0.045697 ENSG00000006611 USH1C 4288.41362 1.88569264 0.567791 3.321105 0.000897 0.045697 ENSG00000175318 GRAMD2A 193.738708 1.992512143 0.600041 3.320629 0.000898 0.045697 ENSG00000196890 HIST3H2BB 53.2317536 2.469743331 0.74257 3.325938 0.000881 0.045697 ENSG00000167644 C19orf33 5348.37311 2.474552482 0.74507 3.321235 0.000896 0.045697 ENSG00000179148 ALOXE3 43.9387698 2.499563568 0.752433 3.321974 0.000894 0.045697 ENSG00000239093 snoU13 8.27508527 3.15286829 0.949111 3.321917 0.000894 0.045697 ENSG00000166589 CDH16 38.544366 3.676392208 1.106207 3.323422 0.000889 0.045697 ENSG00000240476 LINC00973 28.7490385 4.595089068 1.383587 3.321141 0.000897 0.045697 ENSG00000185482 STAC3 235.958217 -1.133273021 0.341529 -3.31823 0.000906 0.045732 ENSG00000130762 ARHGEF16 3058.30489 1.598908313 0.481824 3.318447 0.000905 0.045732 ENSG00000124107 SLPI 9912.17224 2.257826666 0.680397 3.318396 0.000905 0.045732 ENSG00000198835 GJC2 383.563972 2.409049492 0.725689 3.31967 0.000901 0.045732 ENSG00000239961 LILRA4 60.2482752 -2.879821231 0.868023 -3.31768 0.000908 0.045734 ENSG00000153292 ADGRF1 1694.15126 2.633483328 0.793908 3.317113 0.00091 0.045739 ENSG00000188820 FAM26F 253.641079 -1.971132999 0.594603 -3.31504 0.000916 0.045902 ENSG00000138756 BMP2K 430.123567 -1.086720677 0.327972 -3.31346 0.000921 0.046073

Page | 39
ENSG00000188536 HBA2 395.707208 -3.233727938 0.977562 -3.30795 0.00094 0.046779 ENSG00000123338 NCKAP1L 1823.57083 -1.873957156 0.566445 -3.30828 0.000939 0.046779 ENSG00000204121 ECEL1P1 12.6716589 4.694755964 1.419386 3.307596 0.000941 0.046779 ENSG00000227191 TRGC2 57.3685509 -2.225207329 0.673197 -3.30543 0.000948 0.046962 ENSG00000160321 ZNF208 49.2295945 -1.646522093 0.498051 -3.30593 0.000947 0.046962 ENSG00000121957 GPSM2 523.540024 1.1487345 0.34838 3.297362 0.000976 0.047876 ENSG00000174607 UGT8 1391.54334 1.594161002 0.483201 3.299167 0.00097 0.047876 ENSG00000143375 CGN 7268.92387 1.629682745 0.494186 3.297708 0.000975 0.047876 ENSG00000258077 AC078923.1 9.80606574 3.827399055 1.16041 3.298317 0.000973 0.047876 ENSG00000253258 AC068228.2 4.3697963 4.652986634 1.411059 3.297514 0.000975 0.047876 ENSG00000242747 AC090515.1 5.3125842 -1.537223347 0.466485 -3.29533 0.000983 0.048042 ENSG00000224137 LINC01857 49.0407035 -2.945545281 0.894504 -3.29294 0.000991 0.048141 ENSG00000143119 CD53 2706.1744 -1.941983312 0.589773 -3.29276 0.000992 0.048141 ENSG00000234964 FABP5P7 5.35885771 -1.673443714 0.508398 -3.2916 0.000996 0.048141 ENSG00000254827 SLC22A18AS 194.9412 1.857643721 0.564162 3.292746 0.000992 0.048141 ENSG00000118194 TNNT2 156.511118 2.610094605 0.792839 3.292085 0.000994 0.048141 ENSG00000167964 RAB26 563.950396 2.640644534 0.802087 3.292219 0.000994 0.048141 ENSG00000244468 AC093001.1 6.64385339 5.263370047 1.602039 3.285419 0.001018 0.049119 ENSG00000213279 Z97192.2 11.0147348 -1.730672469 0.526887 -3.28471 0.001021 0.049151 ENSG00000188060 RAB42 207.751694 -1.640880658 0.499821 -3.28294 0.001027 0.049188 ENSG00000147676 MAL2 13324.195 1.685358114 0.513296 3.283405 0.001026 0.049188 ENSG00000161643 SIGLEC16 36.4030319 -1.878343972 0.572298 -3.28211 0.00103 0.049242 ENSG00000158517 NCF1 209.772933 -2.16561013 0.660109 -3.28069 0.001036 0.049276 ENSG00000135596 MICAL1 3059.99244 -1.042356466 0.317816 -3.27975 0.001039 0.049276 ENSG00000170522 ELOVL6 1152.05549 1.335620712 0.407348 3.27882 0.001042 0.049276 ENSG00000175164 ABO 1864.17373 2.275605964 0.693519 3.281245 0.001033 0.049276 ENSG00000123843 C4BPB 702.372719 2.664791673 0.812657 3.279111 0.001041 0.049276 ENSG00000254548 AC105219.2 13.0067685 3.79795819 1.158093 3.279494 0.00104 0.049276 ENSG00000126882 FAM78A 559.364829 -1.704631343 0.520172 -3.27706 0.001049 0.049406 ENSG00000154133 ROBO4 940.086206 -1.158837004 0.353603 -3.27723 0.001048 0.049406 ENSG00000164129 NPY5R 11.5031536 -2.963135483 0.905044 -3.27402 0.00106 0.049513 ENSG00000131042 LILRB2 428.874969 -1.763764462 0.538402 -3.27593 0.001053 0.049513 ENSG00000175866 BAIAP2 3044.25548 1.312594002 0.400797 3.274958 0.001057 0.049513 ENSG00000137460 FHDC1 898.829474 1.526157491 0.46616 3.273895 0.001061 0.049513 ENSG00000211974 AC245369.1 69.4594686 4.393470804 1.341719 3.274509 0.001058 0.049513 ENSG00000197872 FAM49A 812.24303 -1.478459649 0.45187 -3.27187 0.001068 0.049602 ENSG00000237523 LINC00857 237.760665 1.787683432 0.546285 3.27244 0.001066 0.049602 ENSG00000047597 XK 311.905072 2.043372237 0.624455 3.272251 0.001067 0.049602 ENSG00000121075 TBX4 11.9140423 3.653151567 1.116782 3.271141 0.001071 0.049641 ENSG00000170608 FOXA3 2175.86884 2.152692635 0.658565 3.268764 0.00108 0.049838 ENSG00000255545 AP004608.1 192.464306 3.039462611 0.929736 3.269167 0.001079 0.049838 ENSG00000280362 AC084759.3 24.5304416 4.038152044 1.23547 3.268515 0.001081 0.049838

Page | 40
Appendix figure 1: Result of consensus clustering analysis. Heatmap of the consensus matrix M (K) for K = 2 which is the optimal number of clusters, cluster 1 (n=88 patients) and cluster2 (n= 89 patients) with clustering consensus values 0.8774 and 0.8452, respectively. Consensus values range from 0 (never clustered together) to 1 (always clustered) marked by white to dark blue. FPKMs of the top eight significantly prognostic genes for the 177 PDAC tumour samples were used for the analysis applying the parameters mentioned in material and methods.